Seismic analysis of laterally loaded pile under influence of vertical loading using finite element...
15
Research Paper Seismic analysis of laterally loaded pile under influence of vertical loading using finite element method Kaustav Chatterjee a , Deepankar Choudhury a,⇑ , Harry G. Poulos b a Department of Civil Engineering, IIT Bombay, Powai, Mumbai 400 076, India b Coffey Geotechnics Pty. Ltd., Sydney, Australia article info Article history: Received 10 September 2014 Received in revised form 24 February 2015 Accepted 12 March 2015 Keywords: Finite element method Maximum horizontal acceleration Pseudo-static Pile Earthquake motions Ground response analysis Liquefaction abstract An efficient analytical approach using the finite element (FE) method, is proposed to calculate the bending moment and deflection response of a single pile under the combined influence of lateral and axial compressive loading during an earthquake, in both saturated and dry homogenous soil, and in a typical layered soil. Applying a pseudo-static method, seismic loads are calculated using the maximum horizontal acceleration (MHA) obtained from a seismic ground response analysis and a lateral load coefficient (a) for both liquefying and non-liquefying soils. It is observed that for a pile having l/d ratio 40 and embedded in dry dense sand, the normalized moment and displacement increase when the input motion becomes more severe, as expected. Further increasing of a from 0.1 to 0.3 leads to increase in the normalized moment and displacement from 0.033 to 0.042, and 0.009 to 0.035, respectively. The validity of the proposed FE based solution for estimating seismic response of pile is also assessed through dynamic centrifuge test results. Ó 2015 Elsevier Ltd. All rights reserved. 1. Introduction The behavior of piles under seismic loading is a complex soil– structure interaction phenomenon that can affect the integrity of pile-supported structures in earthquake-prone areas. Pile founda- tions may be significantly damaged during and immediately after the occurrence of an earthquake. As earthquake motions propagate through stiffer to softer near-surface soil layers, the motions tend to amplify and transfer, through the piles, to the superstructure. As a result, structural vibrations are set up in the superstructure which in turn impose inertial loadings on the pile cap and the piles. Piles can suffer significant lateral displacement and bending moment if the inertial load is of a large magnitude. Hence appro- priate geotechnical and structural design procedures for pile foun- dations are required in seismically active areas. During the past years, various boundary element, finite element and finite difference techniques, based on analytical approaches [1–15] and numerical approaches [16–18] have been used to obtain the displacement and bending response of single piles and pile groups in liquefied and non-liquefied soil, subjected to lateral loading, axial loading and dynamic loading or a combination of all. Although one-dimensional Winkler models have been developed for linear analysis [19–21] and non-linear analysis [22–24] of soil–pile interaction in non-liquefying soil, the ability to accurately predict pile behavior is considerably reduced when the soil around the pile starts liquefying. As a result pseudo-static approaches for seismic analyses of pile foundation have emerged which are relatively simple to imple- ment when compared to more complex dynamic analyses, and hence are preferred by design engineers. Pseudo-static analyses are used for calculating the maximum pile bending moment, shear force and deflection by performing a static load analysis for the pile and involve two main stages [12]: 1. A free field site response analysis is conducted for obtaining the maximum ground displacement and minimum effective verti- cal stress at various depths of the soil deposit. The maximum ground surface acceleration generated during the earthquake loading is also computed [12]. 2. A static load analyses is next implemented for the pile subjected to the maximum computed free field ground displacement pro- file along the pile and the static loading at the pile head. The inertial loading at the pile head is given by the product of the maximum ground surface acceleration and the cap-mass, http://dx.doi.org/10.1016/j.compgeo.2015.03.004 0266-352X/Ó 2015 Elsevier Ltd. All rights reserved. ⇑ Corresponding author. Tel.: +91 22 2576 7335 (O), +91 22 2576 8335 (R); fax: +91 22 2576 7302. E-mail addresses: [email protected] (K. Chatterjee), [email protected], [email protected] (D. Choudhury), [email protected] (H.G. Poulos). Computers and Geotechnics 67 (2015) 172–186 Contents lists available at ScienceDirect Computers and Geotechnics journal homepage: www.elsevier.com/locate/compgeo
Transcript of Seismic analysis of laterally loaded pile under influence of vertical loading using finite element...

Computers and Geotechnics 67 (2015) 172–186
Contents lists available at ScienceDirect
Computers and Geotechnics
journal homepage: www.elsevier .com/ locate/compgeo
Research Paper
Seismic analysis of laterally loaded pile under influence of verticalloading using finite element method
http://dx.doi.org/10.1016/j.compgeo.2015.03.0040266-352X/� 2015 Elsevier Ltd. All rights reserved.
⇑ Corresponding author. Tel.: +91 22 2576 7335 (O), +91 22 2576 8335 (R);fax: +91 22 2576 7302.
E-mail addresses: [email protected] (K. Chatterjee), [email protected],[email protected] (D. Choudhury), [email protected] (H.G. Poulos).
Kaustav Chatterjee a, Deepankar Choudhury a,⇑, Harry G. Poulos b
a Department of Civil Engineering, IIT Bombay, Powai, Mumbai 400 076, Indiab Coffey Geotechnics Pty. Ltd., Sydney, Australia
a r t i c l e i n f o
Article history:Received 10 September 2014Received in revised form 24 February 2015Accepted 12 March 2015
Keywords:Finite element methodMaximum horizontal accelerationPseudo-staticPileEarthquake motionsGround response analysisLiquefaction
a b s t r a c t
An efficient analytical approach using the finite element (FE) method, is proposed to calculate thebending moment and deflection response of a single pile under the combined influence of lateral andaxial compressive loading during an earthquake, in both saturated and dry homogenous soil, and in atypical layered soil. Applying a pseudo-static method, seismic loads are calculated using the maximumhorizontal acceleration (MHA) obtained from a seismic ground response analysis and a lateral loadcoefficient (a) for both liquefying and non-liquefying soils. It is observed that for a pile having l/d ratio40 and embedded in dry dense sand, the normalized moment and displacement increase when the inputmotion becomes more severe, as expected. Further increasing of a from 0.1 to 0.3 leads to increase in thenormalized moment and displacement from 0.033 to 0.042, and 0.009 to 0.035, respectively. The validityof the proposed FE based solution for estimating seismic response of pile is also assessed throughdynamic centrifuge test results.
� 2015 Elsevier Ltd. All rights reserved.
1. Introduction
The behavior of piles under seismic loading is a complex soil–structure interaction phenomenon that can affect the integrity ofpile-supported structures in earthquake-prone areas. Pile founda-tions may be significantly damaged during and immediately afterthe occurrence of an earthquake. As earthquake motions propagatethrough stiffer to softer near-surface soil layers, the motions tendto amplify and transfer, through the piles, to the superstructure.As a result, structural vibrations are set up in the superstructurewhich in turn impose inertial loadings on the pile cap and the piles.Piles can suffer significant lateral displacement and bendingmoment if the inertial load is of a large magnitude. Hence appro-priate geotechnical and structural design procedures for pile foun-dations are required in seismically active areas.
During the past years, various boundary element, finite elementand finite difference techniques, based on analytical approaches[1–15] and numerical approaches [16–18] have been used toobtain the displacement and bending response of single piles andpile groups in liquefied and non-liquefied soil, subjected to lateral
loading, axial loading and dynamic loading or a combination of all.Although one-dimensional Winkler models have been developedfor linear analysis [19–21] and non-linear analysis [22–24] ofsoil–pile interaction in non-liquefying soil, the ability to accuratelypredict pile behavior is considerably reduced when the soil aroundthe pile starts liquefying.
As a result pseudo-static approaches for seismic analyses of pilefoundation have emerged which are relatively simple to imple-ment when compared to more complex dynamic analyses, andhence are preferred by design engineers. Pseudo-static analysesare used for calculating the maximum pile bending moment, shearforce and deflection by performing a static load analysis for the pileand involve two main stages [12]:
1. A free field site response analysis is conducted for obtaining themaximum ground displacement and minimum effective verti-cal stress at various depths of the soil deposit. The maximumground surface acceleration generated during the earthquakeloading is also computed [12].
2. A static load analyses is next implemented for the pile subjectedto the maximum computed free field ground displacement pro-file along the pile and the static loading at the pile head. Theinertial loading at the pile head is given by the product of themaximum ground surface acceleration and the cap-mass,
K. Chatterjee et al. / Computers and Geotechnics 67 (2015) 172–186 173
where, for example, the cap-mass is calculated based on theultimate load carrying capacity of the piles in sand with a factorof safety of 2.5 [12].
Pseudo-static analyses of pile foundations have been previouslyimplemented by Abghari and Chai [25], Ishihara and Cubrinovski[26], Tabesh and Poulos [27], Liyanapathirana and Poulos [12],Cubrinovski et al. [28], Dash et al. [29] and Elahi et al. [30],amongst others.
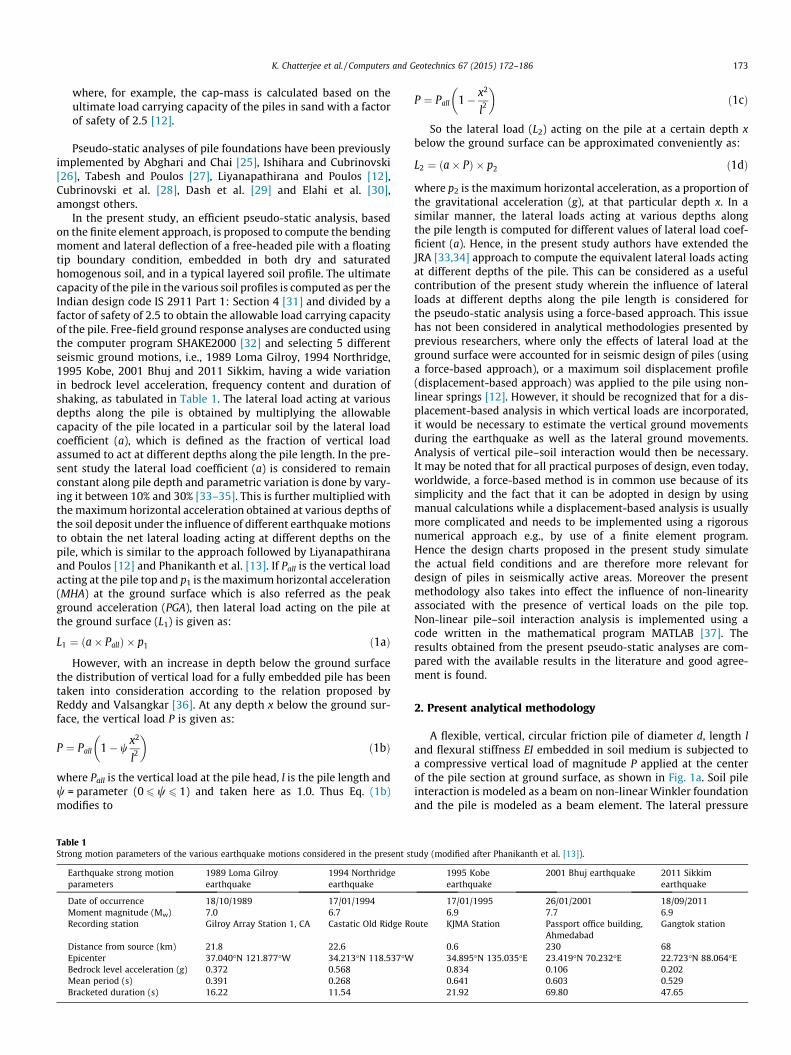
In the present study, an efficient pseudo-static analysis, basedon the finite element approach, is proposed to compute the bendingmoment and lateral deflection of a free-headed pile with a floatingtip boundary condition, embedded in both dry and saturatedhomogenous soil, and in a typical layered soil profile. The ultimatecapacity of the pile in the various soil profiles is computed as per theIndian design code IS 2911 Part 1: Section 4 [31] and divided by afactor of safety of 2.5 to obtain the allowable load carrying capacityof the pile. Free-field ground response analyses are conducted usingthe computer program SHAKE2000 [32] and selecting 5 differentseismic ground motions, i.e., 1989 Loma Gilroy, 1994 Northridge,1995 Kobe, 2001 Bhuj and 2011 Sikkim, having a wide variationin bedrock level acceleration, frequency content and duration ofshaking, as tabulated in Table 1. The lateral load acting at variousdepths along the pile is obtained by multiplying the allowablecapacity of the pile located in a particular soil by the lateral loadcoefficient (a), which is defined as the fraction of vertical loadassumed to act at different depths along the pile length. In the pre-sent study the lateral load coefficient (a) is considered to remainconstant along pile depth and parametric variation is done by vary-ing it between 10% and 30% [33–35]. This is further multiplied withthe maximum horizontal acceleration obtained at various depths ofthe soil deposit under the influence of different earthquake motionsto obtain the net lateral loading acting at different depths on thepile, which is similar to the approach followed by Liyanapathiranaand Poulos [12] and Phanikanth et al. [13]. If Pall is the vertical loadacting at the pile top and p1 is the maximum horizontal acceleration(MHA) at the ground surface which is also referred as the peakground acceleration (PGA), then lateral load acting on the pile atthe ground surface (L1) is given as:
L1 ¼ ða� PallÞ � p1 ð1aÞ
However, with an increase in depth below the ground surfacethe distribution of vertical load for a fully embedded pile has beentaken into consideration according to the relation proposed byReddy and Valsangkar [36]. At any depth x below the ground sur-face, the vertical load P is given as:
P ¼ Pall 1� wx2
l2
� �ð1bÞ
where Pall is the vertical load at the pile head, l is the pile length andw = parameter (0 6 w 6 1) and taken here as 1.0. Thus Eq. (1b)modifies to
Table 1Strong motion parameters of the various earthquake motions considered in the present st
Earthquake strong motionparameters
1989 Loma Gilroyearthquake
1994 Northridgeearthquake
Date of occurrence 18/10/1989 17/01/1994Moment magnitude (Mw) 7.0 6.7Recording station Gilroy Array Station 1, CA Castatic Old Ridge Ro
Distance from source (km) 21.8 22.6Epicenter 37.040�N 121.877�W 34.213�N 118.537�WBedrock level acceleration (g) 0.372 0.568Mean period (s) 0.391 0.268Bracketed duration (s) 16.22 11.54
P ¼ Pall 1� x2
l2
� �ð1cÞ
So the lateral load (L2) acting on the pile at a certain depth xbelow the ground surface can be approximated conveniently as:
L2 ¼ ða� PÞ � p2 ð1dÞ
where p2 is the maximum horizontal acceleration, as a proportion ofthe gravitational acceleration (g), at that particular depth x. In asimilar manner, the lateral loads acting at various depths alongthe pile length is computed for different values of lateral load coef-ficient (a). Hence, in the present study authors have extended theJRA [33,34] approach to compute the equivalent lateral loads actingat different depths of the pile. This can be considered as a usefulcontribution of the present study wherein the influence of lateralloads at different depths along the pile length is considered forthe pseudo-static analysis using a force-based approach. This issuehas not been considered in analytical methodologies presented byprevious researchers, where only the effects of lateral load at theground surface were accounted for in seismic design of piles (usinga force-based approach), or a maximum soil displacement profile(displacement-based approach) was applied to the pile using non-linear springs [12]. However, it should be recognized that for a dis-placement-based analysis in which vertical loads are incorporated,it would be necessary to estimate the vertical ground movementsduring the earthquake as well as the lateral ground movements.Analysis of vertical pile–soil interaction would then be necessary.It may be noted that for all practical purposes of design, even today,worldwide, a force-based method is in common use because of itssimplicity and the fact that it can be adopted in design by usingmanual calculations while a displacement-based analysis is usuallymore complicated and needs to be implemented using a rigorousnumerical approach e.g., by use of a finite element program.Hence the design charts proposed in the present study simulatethe actual field conditions and are therefore more relevant fordesign of piles in seismically active areas. Moreover the presentmethodology also takes into effect the influence of non-linearityassociated with the presence of vertical loads on the pile top.Non-linear pile–soil interaction analysis is implemented using acode written in the mathematical program MATLAB [37]. Theresults obtained from the present pseudo-static analyses are com-pared with the available results in the literature and good agree-ment is found.
2. Present analytical methodology
A flexible, vertical, circular friction pile of diameter d, length land flexural stiffness EI embedded in soil medium is subjected toa compressive vertical load of magnitude P applied at the centerof the pile section at ground surface, as shown in Fig. 1a. Soil pileinteraction is modeled as a beam on non-linear Winkler foundationand the pile is modeled as a beam element. The lateral pressure
udy (modified after Phanikanth et al. [13]).
1995 Kobeearthquake
2001 Bhuj earthquake 2011 Sikkimearthquake
17/01/1995 26/01/2001 18/09/20116.9 7.7 6.9
ute KJMA Station Passport office building,Ahmedabad
Gangtok station
0.6 230 6834.895�N 135.035�E 23.419�N 70.232�E 22.723�N 88.064�E0.834 0.106 0.2020.641 0.603 0.52921.92 69.80 47.65

h
1
2
dl
174 K. Chatterjee et al. / Computers and Geotechnics 67 (2015) 172–186
exerted by the soil on the pile is modeled using lateral non-linearsoil springs, the stiffness and strength of which is considerablyreduced for modeling of the pile in liquefied soil. The entire pileis divided into n number of equal pile elements, each of height has shown in Fig. 1b. The pile will experience lateral deflection,depending upon the magnitude and direction of the compressiveload. Hence in the present study a new methodology, based onelastic theory, has been proposed which accounts for the effect ofvertical compressive loading in obtaining the lateral pile deflectionand bending moment characteristics of a laterally loaded pileunder pseudo-static conditions. Lateral resistance developedagainst this compressive loading is evaluated using a non-linearsubgrade modulus which is assumed to be dependent on the depthbelow ground surface. The assumption made is that soil behaveslike a series of infinitely closed springs, and ordinary beam theoryhas been used for developing the required differential equation.Thus, this solution may be used for determining the behavior oflaterally loaded pile under the influence of vertical compressiveload, and under pseudo-static conditions.
2.1. Governing differential equation
A pile element of thickness Dx at a depth x below ground sur-face and subjected to a vertical compressive load P is considered.The free body diagram of a typical pile element is shown inFig. 2a. From the free body diagram and for maintaining equilib-rium conditions in vertical direction (i.e., RV = 0), horizontal direc-tion (i.e., RH = 0) and also moment equilibrium (i.e., RM = 0), thefollowing governing differential equation is obtained [38]:
Fig. 1a. Configuration of pile under vertical compressive load.
i
Fig. 1b. Discretisation of pile into various pile segments of height h.
EId4y
dx4 þ Pd2y
dx2 þ khy ¼ 0 ð2Þ
where kh = ghx, gh being the coefficient of horizontal subgrade reac-tion for a long strip having unit width and at a depth of unity belowground surface (unit in kN/m3) and y is the lateral deflection of thepile at depth x. Allowance is made for the reduction of kh withincreasing shear strain within the soil, as explained later in thepaper. The above Eq. (2) is the governing differential equation fora laterally loaded pile with simultaneously applied vertical com-pressive loading.
In the present study the following assumptions are made aboutthe soil reaction and distribution of axial load along the pile shaft.
1. For cohesionless soils, the coefficient of horizontal subgradereaction is assumed to vary linearly with depth and is repre-sented by the relation [39,40]:
kh ¼ ghx ð3Þ
2. In the case of cohesionless soils, skin friction varies with depthand the distribution of vertical load for a fully embedded pile, asproposed by Reddy and Valsangkar [36], has been considered inthe present analysis and as mentioned in Eqs. 1(b) and 1(c).
2.2. Numerical solution of governing differential equation
The last term of the governing differential equation, i.e., the soilreaction is a function of both depth (x) and lateral deflection (y) atthat depth. These types of differential equations are difficult tosolve by conventional mathematical methods and hence in the pre-sent analyses a finite element approach has been adopted for the

Fig. 2a. Free body diagram of a typical pile element.
Fig. 2b. Degrees of freedom of a typical pile element considered in the presentstudy.
K. Chatterjee et al. / Computers and Geotechnics 67 (2015) 172–186 175
solution. The entire pile is divided into n number of equal pile ele-ments, each of height h as already shown in Fig. 1b. The generalsolution of the governing differential equation, modified afterHetenyi [38], is given as:
yðxÞ ¼ c1ebxh þ c2e�bx
h� �
cos axhþ c3ebx
h þ c4e�bxh
� �sin a
xh
ð4Þ
where a ¼ h
ffiffiffiffiffiffiffiffiffiffiffiffiffiffiffiffiffiffiffiffiffiffiffiffiffiffiffiffiffiffiffiffikh
4EI
rþ P
4EI
s¼ h
ffiffiffiffiffiffiffiffiffiffiffiffiffiffiffiffiffiffik2 þ P
4EI
rð4aÞ
b ¼ h
ffiffiffiffiffiffiffiffiffiffiffiffiffiffiffiffiffiffiffiffiffiffiffiffiffiffiffiffiffiffiffiffikh
4EI
r� P
4EI
s¼ h
ffiffiffiffiffiffiffiffiffiffiffiffiffiffiffiffiffiffik2 � P
4EI
rð4bÞ
k2 ¼ffiffiffiffiffiffiffikh
4EI
rð4cÞ
kh ¼ ghx ð4dÞ
) yðxÞ ¼ c1ebxh cos a
xhþ c2e�bx
h cos axhþ c3ebx
h sinaxhþ c4e�bx
h sin axhð4eÞ
where c1, c2, c3 and c4 are the unknown integrating constants, themagnitudes of which are to be determined from the boundary con-ditions at both nodal points. A single pile element of height h andhaving two degrees of freedom at each nodal point (i.e., yi, hi andyi+1, hi+1), as shown in Fig. 2b, is considered. Eq. (4e) is differentiatedwith respect to x (to obtain y0(x)) and the boundary conditions (BC)
are applied at x = 0 and x = h. Firstly a unit displacement is given atx = 0 keeping moment equal to 0. At x = h both displacement andmoment are kept equal to 0. In the second case, unit rotation is givenat x = 0 keeping displacement equal to 0 while at x = h both displace-ment and moment is kept equal to 0. The third boundary conditionwhich is applied is at x = 0 both displacement and moment is keptequal to 0. However, at x = h a unit displacement is provided keepingmoment equal to 0. Finally at x = h, a unit rotation is applied keepingdisplacement equal to 0. At x = 0 both displacement and moment iskept equal to 0 for this condition. These boundary conditions aremathematically represented in Eqs. (5a)–(5d).

176 K. Chatterjee et al. / Computers and Geotechnics 67 (2015) 172–186
BC1 : At x ¼ 0; yð0Þ ¼ 1; y0ð0Þ ¼ 0; yðhÞ ¼ 0; y0ðhÞ ¼ 0 ð5aÞBC2 : At x ¼ 0; yð0Þ ¼ 0; y0ð0Þ ¼ 1; yðhÞ ¼ 0; y0ðhÞ ¼ 0 ð5bÞBC3 : At x ¼ h; yð0Þ ¼ 0; y0ð0Þ ¼ 0; yðhÞ ¼ 1; y0ðhÞ ¼ 0 ð5cÞBC4 : At x ¼ h; yð0Þ ¼ 0; y0ð0Þ ¼ 0; yðhÞ ¼ 0; y0ðhÞ ¼ 1 ð5dÞ
Sixteen sets of equations are obtained, which can be written inmatrix form as;
1 1 0 0bh �b
hah
ah
eb cosa e�b cosa eb sina e�b sinaeb
h ðbcosa�asinaÞ � e�b
h ðbcosaþasinaÞ eb
h ðbsinaþacosaÞ � e�b
h ðbsina�acosaÞ
26664
37775
�
c11 c12 c13 c14
c21 c22 c23 c24
c31 c32 c33 c34
c41 c42 c43 c44
26664
37775¼
1 0 0 00 1 0 00 0 1 00 0 0 1
26664
37775 ð6aÞ
ðorÞ ½A� � ½Ci;j� ¼ ½I�
) ½Ci;j� ¼ ½A��1½I� ð6bÞ
where [Ci,j] denotes the unknown ith integrating constant (c1, c2, c3
and c4) for the jth boundary conditions (BC1, BC2, BC3, BC4). The mag-nitudes of the various constants for different boundary conditions aredetermined from Eq. (6b). Further differentiating Eq. (4e) withrespect to x (to obtain y00(x) and y000ðxÞ) and substituting x = 0 and x = h,
y00ð0Þ¼ c1bh
� �2
� ah
� �2" #
þc2bh
� �2
� ah
� �2" #
þc32ab
h2
þc4 �
2ab
h2
¼ c1D1þc2D2þc3D3þc4D4
ð7Þ
y000ð0Þ¼ c1b3
h3�3a2b
h3
" #þ c2 �
b3
h3þ3a2b
h3
" #þc3
3ab2
h3 �a3
h3
" #þc4
3ab2
h3 �a3
h3
" #
¼ c1E1þ c2E2þ c3E3þc4E4
ð8Þ
y00ðhÞ ¼ c1b2
h2 eb cos a� 2ab
h2 eb sin a� a2
h2 eb cos a
" #
þ c2b2
h2 e�b cos aþ 2ab
h2 e�b sin a� a2
h2 e�b cos a
" #
þ c3b2
h2 eb sinaþ 2ab
h2 eb cos a� a2
h2 eb sin a
" #
þ c4b2
h2 e�b sin a� 2ab
h2 e�b cos a� a2
h2 e�b sin a
" #
¼ c1F1 þ c2F2 þ c3F3 þ c4F4 ð9Þ
y000ðhÞ¼ c1b3
h3 eb cosa�3ab2
h3 eb sina�3a2b
h3 eb cosaþa3
h3 eb sina
" #
þ c2 �b3
h3 e�b cosa�3ab2
h3 e�b sinaþ3a2b
h3 e�b cosaþa3
h3 e�b sina
" #
þ c3b3
h3 eb sinaþ3ab2
h3 eb cosa�3a2b
h3 eb sina�a3
h3 eb cosa
" #
þ c4 �b3
h3 e�b sinaþ3ab2
h3 e�b cosaþ3a2b
h3 e�b sina�a3
h3 e�b cosa
" #
¼ c1G1þ c2G2þ c3G3þ c4G4 ð10Þ
The element stiffness matrix of a particular pile element [k] isgenerated by applying the boundary conditions at the variousnodal points and the stiffness coefficients are calculated usingthe following equation:
k11 �k12 k13 �k14
k21 �k22 k23 �k24
�k31 k32 �k33 k34
�k41 k42 �k43 k44
26664
37775 ¼ EI �
E1 E2 E3 E4
D1 D2 D3 D4
G1 G2 G3 G4
F1 F2 F3 F4
26664
37775
�
c11 c12 c13 c14
c21 c22 c23 c24
c31 c32 c33 c34
c41 c42 c43 c44
26664
37775 ð11aÞ
½k� ¼ EI � ½T� � ½Ci;j�
) ½k� ¼ EI � ½T� � ½A��1½I� ð11bÞ
where EI denotes the flexural stiffness of the pile. In a similar man-ner, the stiffness matrices for each pile elements are evaluated.Thus, n numbers of element stiffness matrices are obtained whichare assembled together in a proper manner to give the global stiff-ness matrix [K] for the entire pile length, relating the forces and dis-placements of all the nodes of the pile. In this way the interactionbetween the springs along the pile depth has been taken intoaccount using the elemental and global stiffness matrix obtainedin the present study; this is non-symmetric in nature and of sizen � n, where n denotes the number of segments along the piledepth. In the present analysis, reduction of subgrade modulus withincreasing shear strain is accounted for, hence with successiveiterations the interactions between the springs are tracked, usingthe stiffness matrices. The displacement and rotation at the variouselement nodes of the entire pile are calculated as,
fLg ¼ ½K� � fDg ð12aÞ
) fDg ¼ ½K��1 � fLg ð12bÞ
where {D} is the unknown displacement vector and {L} is the exter-nally applied pseudo-static lateral load vector, which is obtainedfrom seismic equivalent linear ground response analyses conductedusing the SHAKE2000 [32] computer program. Five different seismicground motions, the 1989 Loma Gilroy, 1994 Northridge, 1995Kobe, 2001 Bhuj and 2011 Sikkim motions, having a wide variationin their strong motion parameters including maximum horizontalacceleration at bedrock level, frequency content, and bracketedduration (see Table 1), have been chosen to obtain the externallyapplied pseudo-static lateral load vector for the various soil types.The computed displacement and rotation of the individual pile ele-ments are then further utilized for determining the force andmoment of the corresponding pile elements using the load displace-ment relationship given as [41]:
Fi
Mi
Fiþ1
Miþ1
26664
37775 ¼
k11 k12 k13 k14
k21 k22 k23 k24
k31 k32 k33 k34
k41 k42 k43 k44
26664
37775�
yi
hi
yiþ1
hiþ1
26664
37775 ð13Þ
The entire procedure has been accomplished by writing a codeusing the mathematical tool MATLAB [37] to determine the deflec-tion and moment at various nodal points of the pile.
2.3. Validation of the present method
The present analytical methodology has been validated by com-paring our numerical analysis results with the field results ofKarasev et al. [42] and the numerical analysis results ofKarthigeyan et al. [43], using the 3-dimensional finite element pro-gram GEOFEM3D. A 3 m long and 600 mm diameter concrete testpile is installed in a soil stratum comprising of 6 m thick very stiffsandy loam underlain by 7 m thick sandy clay of lower stiffness.

0
30
60
90
120
0 5 10 15
Lat
eral
load
on
pile
(kN
)
Lateral deflection (mm)
Karasev et al. (1977)
Karthigeyan et al. (2006)
Present Study
0
2
4
6
8
10
-0.4 -0.2 0 0.2 0.4 0.6
Dep
th (m
)
Bending moment (MNm)
Abdoun et al. (1997)
Liyanapathirana and Poulos (2005b)
Present Study
(a)
(b)
Fig. 3. Comparison of the present study with (a) field results of Karasev et al. [42]and numerical analysis results of Karthigeyan et al. [43] and (b) centrifuge testresults of Abdoun et al. [44] and pseudo-static analyses results of Liyanapathiranaand Poulos [12].
K. Chatterjee et al. / Computers and Geotechnics 67 (2015) 172–186 177
The analysis is conducted by first subjecting the pile to a verticalload of 400 kN and then the horizontal loads are applied, varyingfrom 0 kN to 100 kN, with the vertical load being kept constant.The comparison between the present analytical results with theavailable solutions in the literature is shown in Fig. 3(a). It isobserved that the present results are in good agreement with thenumerical analysis and field test results of Karthigeyan et al. [43]and Karasev et al. [42], respectively. The marginal differences in pilehead displacement may be attributed to the soil stiffness propertieswhich are estimated approximately on the basis of the soildescriptions.
The pseudo-static methodology has been further validated withthe maximum bending moments developed in a pile used for acentrifuge test and carried out by Abdoun et al. [44] after the1995 Hyogoken-Nambu earthquake and with the pseudo-staticresults of Liyanapathirana and Poulos [12]. The centrifuge modelcomprised of 3 sand layers, with the middle liquefiable layer beinga 6 m thick Nevada sand layer and having a relative density of 40%.
Table 2aHomogenous soil properties considered in the present study for pseudo-static analysis (af
Soil type Properties
Modulus of elasticity [Es](MPa)
Poisson’s ratio[l]
Dry dense sand (DDS) 90 0.3Saturated dense sand (SDS) 78 0.35Dry medium sand (DMS) 65 0.34Saturated medium sand (SMS) 58 0.38Dry loose sand (DLS) 36 0.38Saturated loose sand (SLS) 31 0.40
This layer was underlain and overlain by two cemented pervioussand layers, each having a thickness of 2 m. The model was sub-jected to a sinusoidal wave having amplitude of 0.25g, frequencyof 2 Hz and duration of 20 s [17]. The present methodology wascompared with the centrifuge test results and it can be observedfrom Fig. 3(b) that the present magnitudes of bending momentmatch well with the centrifuge test and pseudo-static results ofAbdoun et al. [44] and Liyanapathirana and Poulos [12]. The minorvariation in results may be attributed to the differences in metho-dology of force based approach and displacement based approachfollowed by the present and previous authors, respectively.
3. Present study
3.1. Ground response analysis
Free field seismic equivalent linear ground response analysishas been conducted in the present study using the SHAKE2000[32] computer program. The earthquake motions in Table 1 havebeen chosen for the present analysis and they have been appliedat the base of the soil layer. Their response on the ground surface,while passing through the various soil strata, has been noted.Modulus reduction (G/Gmax) and damping ratio (n) curves, whichare functions of strain (c), and as proposed by Seed and Idriss[45] and Vucetic and Dobry [46] for sand and clay, respectively,are used in the present study, recalculated and regenerated basedon the given soil properties. Tables 2a and 2b give the properties ofthe homogenous soil and layered soil considered in the presentstudy, respectively. The coefficient of subgrade reaction (gh) forthe homogenous soil assumed in the present study is adopted fromTerzaghi [47] while the modulus of elasticity (Es), Poisson’s ratio(l) and unit weight (c) of the soil are taken from Poulos andDavis [48] and Bowles [49]. The influences of the soil type and pilediameter on the present study have also been accounted for interms of the pile stiffness factor (K) which is the ratio of Young’smodulus of elasticity of pile (Ep) to the Young’s modulus of elastic-ity of the particular soil (Es) multiplied by the area ratio (RA) of thepile, slenderness ratio (k) which is the ratio of length to diameter ofthe pile and pile flexibility factor (KR) [48].
K ¼ Ep
EsRA ð14aÞ
For a solid pile RA = 1, and Eq. (14a) modifies to:
K ¼ Ep
Esð14bÞ
k ¼ ld
ð15Þ
KR ¼Ep
Es� Ip
l4 ð16Þ
ter Terzaghi [47], Poulos and Davis [48], Bowles [49]).
Unit weight [c](kN/m3)
Pile stiffness factor[K]
Coefficient of subgrade reaction [gh](kN/m3)
18.4 278 20,00020 321 12,50016 385 770017 431 520014 694 260015 807 1500

Table 2bLayered soil properties considered in the present study for pseudo-static analysis.
Layerno.
Soil type Depthbelow GL(m)
SPT‘‘N’’value
Unitweight(kN/m3)
Eo
(MPa)ghn
(MN/m3)
1 Dark gray silty clay withorganic matters
1.3 3 17.6 2.1 7.79
2 Deep gray silty clay toclayey silt and organicmatters
7 3 15.6 2.1 7.79
3 Deep gray silty clay withdecomposed wood
10 5 16.7 3.5 12.99
4 Deep gray silty claywith organic matters
13 8 17.3 5.6 20.78
5 Deep gray silty clay 14.5 14 19.9 9.8 36.376 Brownish gray silty clay
with bluish gray patches17.5 17 20.4 11.9 44.16
7 Brownish gray clayeysilty sand to sandy siltwith mica
22 25 18.1 17.5 64.94
0
4
8
12
16
20
0 0.4 0.8 1.2 1.6
Dep
th b
elow
GL
(m)
MHA (g)
Saturated Loose Sand (SLS)Dry Loose Sand (DLS)Saturated Medium Sand (SMS)Dry Medium Sand (DMS)Saturated Dense Sand (SDS)Dry Dense Sand (DDS)Layered Soil (LS)
0
4
8
12
16
20
0 0.09 0.18 0.27 0.36 0.45
Dep
th b
elow
GL
(m)
MHA (g)
Saturated Loose Sand (SLS)Dry Loose Sand (DLS)Saturated Medium Sand (SMS)Dry Medium Sand (DMS)Saturated Dense Sand (SDS)Dry Dense Sand (DDS)Layered Soil (LS)
(a)
(b)
Fig. 4. Variation of maximum horizontal acceleration with depth for different soilprofiles when subjected to (a) 1995 Kobe and (b) 2001 Bhuj earthquake motions.
0
5
10
15
20
0 0.35 0.7 1.05 1.4 1.75
Dep
th b
elow
GL
(m)
MHA (g) / amax (g)
1989 Loma Gilroy motion1994 Northridge motion1995 Kobe motion2001 Bhuj motion2011 Sikkim motion
0
5
10
15
20
0 0.55 1.1 1.65 2.2
Dep
th b
elow
GL
(m)
MHA (g) / amax (g)
1989 Loma Gilroy motion1994 Northridge motion1995 Kobe motion2001 Bhuj motion2011 Sikkim motion
(a)
(b)
Fig. 5. Variation of amplification of maximum horizontal acceleration with depthfor (a) saturated dense sand and (b) saturated loose sand when subjected to variousearthquake motions.
178 K. Chatterjee et al. / Computers and Geotechnics 67 (2015) 172–186
The various soil strata had a thickness varying between 20 mand 25 m and were underlain by soft base rock having a shearwave velocity (Vs) lying between 360 m/s and 760 m/s [50]. It isobserved that for 1995 Kobe motion, which has a high accelerationat bedrock level earthquake (amax = 0.834g; amax being the maxi-mum horizontal acceleration of the earthquake at bedrock level),the maximum horizontal acceleration at the ground surface forlayered soil is 1.52g, resulting in an amplification of accelerationof only 1.8 times on the ground surface. The relatively smallamplification factor observed for 1995 Kobe motion when it passesthrough the layered soil is due to the trapping of seismic waveswhich results in contrasting impedance between the soil sedi-ments and underlying bed rocks and is influenced by the depthand stiffness of the various soil strata. Further, soil non-linearityand plasticity prevents the major increase in peak acceleration ofsuch a high acceleration level earthquake [51]. Hence the ampli-tude and frequency content of the seismic ground motions are con-siderably altered as they travel through the soil deposits. However,for earthquakes having a relatively low acceleration at bedrocklevel (such as the 2001 Bhuj motion, amax = 0.106g), the maximumhorizontal acceleration at the ground surface is amplified by 4.1times, although it has a lower bedrock level acceleration comparedto the 1995 Kobe motion. This is due to the higher bracketed dura-tion and frequency content of 2001 Bhuj motion resulting in a lar-ger number of load reversals when compared to the 1995 Kobemotion. The variation of maximum horizontal acceleration withdepth for the different soil profiles for the 1995 Kobe and 2001Bhuj seismic motions are shown in Fig. 4. Fig. 5 illustrates theamplification of various ground motions with depth for saturateddense sand (SDS) and saturated loose sand (SLS). It is observed thatwhen soil type changes from SDS to SLS, the amplification ofacceleration on the ground surface increases by 15%, 27%, 16%,27% and 22%, respectively for 1989 Loma Gilroy, 1994Northridge, 1995 Kobe, 2001 Bhuj and 2011 Sikkim earthquakemotions. This is due to the lower shear strength parameters andmodulus of subgrade reaction for saturated loose sand as com-pared to saturated dense sand. The variation of Fourier amplifica-tion ratio (FAR) with frequency for the 1995 Kobe and 2011Sikkim motions is illustrated in Fig. 6. It is observed that for the2011 Sikkim motion the FAR is 9.63 at 1.5 Hz for layered soil whilefor dry dense sand the FAR is 4.38 at 2.12 Hz. These frequencies,which correspond to the peak values of the Fourier amplificationresponse curves, are the fundamental frequency of the particularsoil deposit. Also the magnitude of the fundamental frequency isquite low which implies a longer period of vibration of the soil col-umn and the consequences may be detrimental to the tall
structures existing in those particular areas. Moreover the curveshave a broader spectrum containing a wide range of frequenciesand producing an irregular time history, which is a typical

0
2
4
6
0 5 10 15 20 25
Four
ier
Am
plifi
catio
n R
atio
Frequency (Hz)
Saturated Loose Sand (SLS)Dry Loose Sand (DLS)Saturated Medium Sand (SMS)Dry Medium Sand (DMS)Saturated Dense Sand (SDS)Dry Dense Sand (DDS)Layered Soil (LS)
0
2
4
6
8
10
0 5 10 15 20 25
Four
ier
Am
plifi
catio
n R
atio
Frequency (Hz)
Saturated Loose Sand (SLS)Dry Loose Sand (DLS)Saturated Medium Sand (SMS)Dry Medium Sand (DMS)Saturated Dense Sand (SDS)Dry Dense Sand (DDS)Layered Soil (LS)
(a)
(b)
Fig. 6. Variation of Fourier amplification ratio with frequency for the various soiltypes considered in the present study when subjected to (a) 1995 Kobe and (b)2011 Sikkim earthquake motions.
K. Chatterjee et al. / Computers and Geotechnics 67 (2015) 172–186 179
characteristic of these earthquake motions. The response curves forsaturated medium sand (SMS), dry medium sand (DMS), saturateddense sand (SDS) and dry dense sand (DDS) are illustrated in Fig. 7and are also compared with Indian standards IS 1893 Part 1 [52] forthe various input earthquake motions. 5% damping ratio wasassumed for generating the response spectra. It is observed forSMS that the maximum spectral acceleration is 1.7g at 0.82 s for1995 Kobe motion, while for Bhuj motion it is 0.36g at 0.52 s.
0
0.3
0.6
0.9
1.2
1.5
1.8
0 5 10
Spec
tral
Acc
eler
atio
n (g
)
Time Period (sec)
1989 Loma Gilroy motion1994 Northridge motion1995 Kobe motion2001 Bhuj motion2011 Sikkim motionIS 1893: Part 1 (2002)
0
0.46
0.92
1.38
1.84
2.3
0 5 10
Spec
tral
Acc
eler
atio
n (g
)
Time Period (sec)
1989 Loma Gilroy motion1994 Northridge motion1995 Kobe motion2001 Bhuj motion2011 Sikkim motionIS 1893: Part 1 (2002)
(a)
(c)
(b
(d
Fig. 7. Response spectrum curves for (a) saturated medium sand (SMS), (b) dry mediumvarious input earthquake motions at 5% damping ratio.
Similarly for SDS, the maximum and minimum spectral accelera-tions are 2.27g at 0.68 s and 0.31g at 0.37 s for 1995 Kobe and2001 Bhuj motions, respectively. This indicates that the 2001Bhuj motion and 1995 Kobe motion have considerable influenceon structures having short and long fundamental period, respec-tively. However, the limitations of using SHAKE2000 computerprogram here is that it conducts a seismic equivalent linear groundresponse analysis in the frequency domain (which uses secantshear modulus Gsec) and which depends upon the final shear strainlevel. Hence it tends to approximate the actual non-linear seismicground response. Further SHAKE2000 cannot be used for very deepsoil strata and actual deformations occurring in the soil are not cal-culated. In contrast, a non-linear ground response analysis uses thetangent shear modulus (Gtan) and it gives the actual slope of shearstress versus shear strain curve at any state of loading. Although anon-linear method should give more accurate values, it requires areliable constitutive model and the parameters describing such amodel are not well established in the literature. Hence, for practicalapplications, the use of SHAKE2000 program for implementingseismic equivalent linear ground response analysis in the presentstudy is considered to be justified.
3.2. Pseudo-static analysis of single pile
The analytical methodology based on the finite elementapproach and proposed in the present study has been used to ana-lyze the influence of vertical compressive loading on the lateralresponse of piles embedded in a typical layered soil and homoge-nous loose sand, medium sand and dense sand under both dryand submerged conditions. A 20 m long and 500 mm diameter freeheaded concrete pile of M25 grade concrete installed in a layeredsoil and in a homogenous soil, is considered. Parametric variationis done by varying the diameter of the pile as 500 mm, 600 mm,650 mm, 700 mm and 750 mm. The properties of the pile (assumedhere to remain elastic), as per IS 456 [53], are tabulated in Table 3while the properties of the homogenous soil and layered soil con-sidered in the present study are already tabulated in Tables 2a and2b, respectively. However, for the layered soil the coefficient ofhorizontal subgrade reaction (ghn in MN/m3) is a function of pile
0
0.3
0.6
0.9
1.2
1.5
1.8
0 5 10
Spec
tral
Acc
eler
atio
n (g
)
Time Period (sec)
1989 Loma Gilroy motion1994 Northridge motion1995 Kobe motion2001 Bhuj motion2011 Sikkim motionIS 1893: Part 1 (2002)
0
0.45
0.9
1.35
1.8
2.25
0 5 10
Spec
tral
Acc
eler
atio
n (g
)
Time Period (sec)
1989 Loma Gilroy motion1994 Northridge motion1995 Kobe motion2001 Bhuj motion2011 Sikkim motionIS 1893: Part 1 (2002)
)
)
sand (DMS), (c) saturated dense sand (SDS) and (d) dry dense sand (DDS) for the
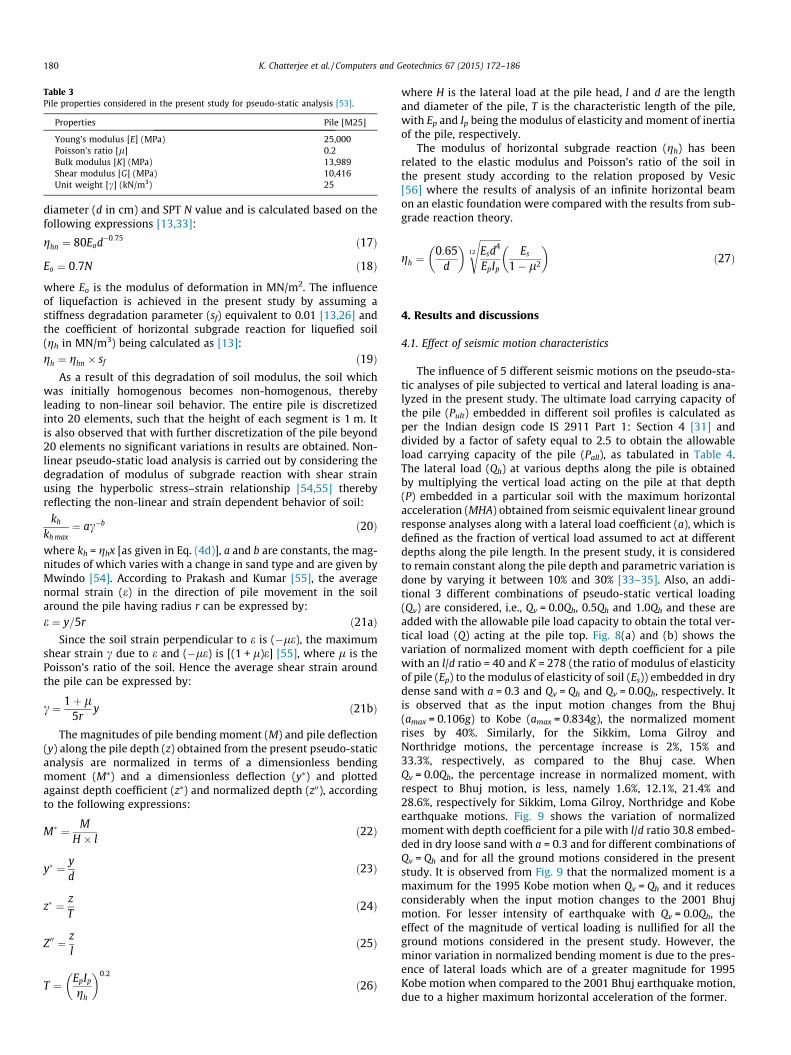
Table 3Pile properties considered in the present study for pseudo-static analysis [53].
Properties Pile [M25]
Young’s modulus [E] (MPa) 25,000Poisson’s ratio [l] 0.2Bulk modulus [K] (MPa) 13,989Shear modulus [G] (MPa) 10,416Unit weight [c] (kN/m3) 25
180 K. Chatterjee et al. / Computers and Geotechnics 67 (2015) 172–186
diameter (d in cm) and SPT N value and is calculated based on thefollowing expressions [13,33]:
ghn ¼ 80Eod�0:75 ð17Þ
Eo ¼ 0:7N ð18Þ
where Eo is the modulus of deformation in MN/m2. The influenceof liquefaction is achieved in the present study by assuming astiffness degradation parameter (sf) equivalent to 0.01 [13,26] andthe coefficient of horizontal subgrade reaction for liquefied soil(gh in MN/m3) being calculated as [13]:gh ¼ ghn � sf ð19Þ
As a result of this degradation of soil modulus, the soil whichwas initially homogenous becomes non-homogenous, therebyleading to non-linear soil behavior. The entire pile is discretizedinto 20 elements, such that the height of each segment is 1 m. Itis also observed that with further discretization of the pile beyond20 elements no significant variations in results are obtained. Non-linear pseudo-static load analysis is carried out by considering thedegradation of modulus of subgrade reaction with shear strainusing the hyperbolic stress–strain relationship [54,55] therebyreflecting the non-linear and strain dependent behavior of soil:
kh
kh max¼ ac�b ð20Þ
where kh = ghx [as given in Eq. (4d)], a and b are constants, the mag-nitudes of which varies with a change in sand type and are given byMwindo [54]. According to Prakash and Kumar [55], the averagenormal strain (e) in the direction of pile movement in the soilaround the pile having radius r can be expressed by:e ¼ y=5r ð21aÞ
Since the soil strain perpendicular to e is (�le), the maximumshear strain c due to e and (�le) is [(1 + l)e] [55], where l is thePoisson’s ratio of the soil. Hence the average shear strain aroundthe pile can be expressed by:
c ¼ 1þ l5r
y ð21bÞ
The magnitudes of pile bending moment (M) and pile deflection(y) along the pile depth (z) obtained from the present pseudo-staticanalysis are normalized in terms of a dimensionless bendingmoment (M⁄) and a dimensionless deflection (y⁄) and plottedagainst depth coefficient (z⁄) and normalized depth (z00), accordingto the following expressions:
M� ¼ MH � l
ð22Þ
y� ¼ yd
ð23Þ
z� ¼ zT
ð24Þ
Z00 ¼ zl
ð25Þ
T ¼ EpIp
gh
� �0:2
ð26Þ
where H is the lateral load at the pile head, l and d are the lengthand diameter of the pile, T is the characteristic length of the pile,with Ep and Ip being the modulus of elasticity and moment of inertiaof the pile, respectively.
The modulus of horizontal subgrade reaction (gh) has beenrelated to the elastic modulus and Poisson’s ratio of the soil inthe present study according to the relation proposed by Vesic[56] where the results of analysis of an infinite horizontal beamon an elastic foundation were compared with the results from sub-grade reaction theory.
gh ¼0:65
d
� � ffiffiffiffiffiffiffiffiffiEsd
4
EpIp
12
sEs
1� l2
� �ð27Þ
4. Results and discussions
4.1. Effect of seismic motion characteristics
The influence of 5 different seismic motions on the pseudo-sta-tic analyses of pile subjected to vertical and lateral loading is ana-lyzed in the present study. The ultimate load carrying capacity ofthe pile (Pult) embedded in different soil profiles is calculated asper the Indian design code IS 2911 Part 1: Section 4 [31] anddivided by a factor of safety equal to 2.5 to obtain the allowableload carrying capacity of the pile (Pall), as tabulated in Table 4.The lateral load (Qh) at various depths along the pile is obtainedby multiplying the vertical load acting on the pile at that depth(P) embedded in a particular soil with the maximum horizontalacceleration (MHA) obtained from seismic equivalent linear groundresponse analyses along with a lateral load coefficient (a), which isdefined as the fraction of vertical load assumed to act at differentdepths along the pile length. In the present study, it is consideredto remain constant along the pile depth and parametric variation isdone by varying it between 10% and 30% [33–35]. Also, an addi-tional 3 different combinations of pseudo-static vertical loading(Qv) are considered, i.e., Qv = 0.0Qh, 0.5Qh and 1.0Qh and these areadded with the allowable pile load capacity to obtain the total ver-tical load (Q) acting at the pile top. Fig. 8(a) and (b) shows thevariation of normalized moment with depth coefficient for a pilewith an l/d ratio = 40 and K = 278 (the ratio of modulus of elasticityof pile (Ep) to the modulus of elasticity of soil (Es)) embedded in drydense sand with a = 0.3 and Qv = Qh and Qv = 0.0Qh, respectively. Itis observed that as the input motion changes from the Bhuj(amax = 0.106g) to Kobe (amax = 0.834g), the normalized momentrises by 40%. Similarly, for the Sikkim, Loma Gilroy andNorthridge motions, the percentage increase is 2%, 15% and33.3%, respectively, as compared to the Bhuj case. WhenQv = 0.0Qh, the percentage increase in normalized moment, withrespect to Bhuj motion, is less, namely 1.6%, 12.1%, 21.4% and28.6%, respectively for Sikkim, Loma Gilroy, Northridge and Kobeearthquake motions. Fig. 9 shows the variation of normalizedmoment with depth coefficient for a pile with l/d ratio 30.8 embed-ded in dry loose sand with a = 0.3 and for different combinations ofQv = Qh and for all the ground motions considered in the presentstudy. It is observed from Fig. 9 that the normalized moment is amaximum for the 1995 Kobe motion when Qv = Qh and it reducesconsiderably when the input motion changes to the 2001 Bhujmotion. For lesser intensity of earthquake with Qv = 0.0Qh, theeffect of the magnitude of vertical loading is nullified for all theground motions considered in the present study. However, theminor variation in normalized bending moment is due to the pres-ence of lateral loads which are of a greater magnitude for 1995Kobe motion when compared to the 2001 Bhuj earthquake motion,due to a higher maximum horizontal acceleration of the former.

Table 4Allowable load carrying capacity of the single pile having different diameters (d) embedded in different soils considered in the present study.
Soil types Allowable load carrying capacity of single pile (kN)
d = 500 mm d = 600 mm d = 650 mm d = 700 mm d = 750 mm
Saturated dense sand (SDS) 1910 2484 2795 3122 3465Dry medium sand (DMS) 1502 1938 2173 2420 2677Saturated medium sand (SMS) 667 859 962 1071 1184Dry loose sand (DLS) 683 877 982 1091 1205Saturated loose sand (SLS) 254 326 365 405 448Layered soil (LS) 678 891 1007 1130 1259
0
2
4
6
8
10
12
14
16
-0.010 -0.005 0.000 0.005 0.010 0.015 0.020 0.025
Dep
th c
oeff
icie
nt (z
*)
Normalized moment (M*)
Qv=Qh; 1989 Loma Gilroy
Qv=Qh; 1994 Northridge
Qv=Qh; 1995 Kobe
Qv=Qh; 2001 Bhuj
Qv=Qh; 2011 Sikkim
0
2
4
6
8
10
12
14
16
-0.005 0.000 0.005 0.010 0.015 0.020
Dep
th c
oeff
icie
nt (z
*)
Normalized moment (M*)
Qv=0.0Qh; 1989 Loma Gilroy
Qv=0.0Qh; 1994 Northridge
Qv=0.0Qh; 1995 Kobe
Qv=0.0Qh; 2001 Bhuj
Qv=0.0Qh; 2011 Sikkim
l/d = 40; K = 278; a = 0.3; Qv = Qh
l/d = 40; K = 278; a = 0.3; Qv = 0.0Qh
(a)
(b)
Fig. 8. Variation of normalized moment (M⁄) with depth coefficient (z⁄) for a pilewith l/d ratio 40 embedded in dry dense sand and (a) Qv = Qh and (b) Qv = 0.0Qh.
0
2
4
6
8
10
12
-0.02 0.00 0.02 0.04 0.06
Dep
th c
oeff
icie
nt (z
*)
Normalized moment (M*)
Qv=0.0Qh; 1989 Loma GilroyQv=0.5Qh; 1989 Loma GilroyQv=Qh; 1989 Loma GilroyQv=0.0Qh; 1994 NorthridgeQv=0.5Qh; 1994 NorthridgeQv=Qh; 1994 NorthridgeQv=0.0Qh; 1995 KobeQv=0.5Qh; 1995 KobeQv=Qh; 1995 KobeQv=0.0Qh; 2001 BhujQv=0.5Qh; 2001 BhujQv=Qh; 2001 BhujQv=0.0Qh; 2011 SikkimQv=0.5Qh; 2011 SikkimQv=Qh; 2011 Sikkim
l/d = 30.8; K = 694; a = 0.3
Fig. 9. Variation of normalized moment (M⁄) with depth coefficient (z⁄) for a pilewith l/d ratio 30.8, a = 0.3 and embedded in dry loose sand for differentcombinations of Qv and Qh and subjected to various input ground motions.
0
2
4
6
8
10
12
0.00 0.05 0.10 0.15
Dep
th c
oeff
icie
nt (z
*)
Normalized displacement (y*)
Qv=Qh; 1989 Loma Gilroy
Qv=Qh; 1994 Northridge
Qv=Qh; 1995 Kobe
Qv=Qh; 2001 Bhuj
Qv=Qh; 2011 Sikkim
0
2
4
6
8
10
12
0.00 0.05 0.10 0.15
Dep
th c
oeff
icie
nt (z
*)
Normalized displacement (y*)
Qv=0.0Qh; 1989 Loma Gilroy
Qv=0.0Qh; 1994 Northridge
Qv=0.0Qh; 1995 Kobe
Qv=0.0Qh; 2001 Bhuj
Qv=0.0Qh; 2011 Sikkim
l/d = 40; K = 694; a = 0.3; Qv = Qh
l/d = 40; K = 694; a = 0.3; Qv = 0.0Qh
(a)
(b)
Fig. 10. Variation of normalized displacement (y⁄) with depth coefficient (z⁄) for apile with l/d ratio 40 embedded in dry loose sand and (a) Qv = Qh and (b) Qv = 0.0Qh.
K. Chatterjee et al. / Computers and Geotechnics 67 (2015) 172–186 181
4.2. Effect of vertical load
The variation of normalized displacement with depth coeffi-cient for a pile embedded in dry loose sand having l/d ratio 40,K = 694, a = 0.3 and Qv = Qh is shown in Fig. 10(a). It is observed thatthe normalized displacement at the pile head increases from 0.010to 0.0154, 0.03, 0.08 and 0.126, when the input motion changesfrom Bhuj to Sikkim, Loma Gilroy, Northridge and Kobe, respec-tively. Similarly, for Qv = 0.0Qh, the normalized displacementincreases from 0.0098 to 0.0152, 0.029, 0.077 and 0.123 for theabove mentioned motions, as shown in Fig. 10(b). Hence for dryloose sand, Qv has little effect on normalized displacement.
The influence of Qv with 3 different combinations of Qh on a pilehaving l/d ratio 26.7 embedded in saturated dense sand and sub-jected to the Kobe motion is illustrated in Fig. 11(a). It is observedthat the bending moment increases from 1710 kN m to 1850 kN m,and thus the normalized moment is increased by 10.2% when Qv
increases from 0.0Qh to 1.0Qh. Similarly for the Loma Gilroy seismicmotion, the percentage increase in normalized bending moment is7%, as shown in Fig. 11(b). In a similar manner the normalized dis-placement increases by 18% and 12% when Qv rises from 0.0Qh to1.0Qh under the influence of the Kobe and Loma Gilroy earthquake

0
2
4
6
8
10
12
-0.02 0.00 0.02 0.04
Dep
th c
oeff
icie
nt (z
*)
Normalized moment (M*)
Qv=0.0QhQv=0.5QhQv=Qh
0
2
4
6
8
10
12
-0.005 0.000 0.005 0.010 0.015 0.020
Dep
th c
oeff
icie
nt (z
*)
Normalized moment (M*)
Qv=0.0QhQv=0.5QhQv=Qh
l/d = 26.7; K = 321; a = 0.3
l/d = 26.7; K = 321; a = 0.3
(a)
(b)
Fig. 11. Variation of normalized moment (M⁄) with depth coefficient (z⁄) for a pilewith l/d ratio 26.7, a = 0.3 and embedded in saturated dense sand for differentcombinations of Qv and Qh and subjected to (a) 1995 Kobe and (b) 1989 Loma Gilroyinput ground motions.
0
2
4
6
8
10
12
0.00 0.02 0.04 0.06 0.08
Dep
th c
oeff
icie
nt (z
*)
Normalized displacement (y*)
Qv=0.0QhQv=0.5QhQv=Qh
0
2
4
6
8
10
12
0.00 0.01 0.02 0.03 0.04 0.05
Dep
th c
oeff
icie
nt (z
*)
Normalized displacement (y*)
Qv=0.0QhQv=0.5QhQv=Qh
l/d = 26.7; K = 321; a = 0.3
l/d = 26.7; K = 321; a = 0.3
(a)
(b)
Fig. 12. Variation of normalized displacement (y⁄) with depth coefficient (z⁄) for apile with l/d ratio 26.7, a = 0.3 and embedded in saturated dense sand for differentcombinations of Qv and Qh and subjected to (a) 1995 Kobe and (b) 1989 Loma Gilroyinput ground motions.
0
2
4
6
8
10
0.00 0.01 0.02 0.03 0.04
Dep
th c
oeff
icie
nt (z
*)
Normalized displacement (y*)
a=0.1a=0.2a=0.3
l/d = 28.6; K = 431; Qv = Qh
Fig. 13. Variation of normalized displacement (y⁄) with depth coefficient (z⁄) for apile with l/d ratio 28.6 and embedded in saturated medium sand for Qv = Qh andsubjected to 1995 Kobe earthquake motion with different values of lateral loadcoefficient.
182 K. Chatterjee et al. / Computers and Geotechnics 67 (2015) 172–186
motions, respectively, as shown in Fig. 12. Thus, for the saturateddense sand, the effect of Qv is greater than for the dry loose sand,but still relatively minor.
4.3. Effect of lateral load coefficient a
The effect of lateral load coefficient a on the normalized dis-placement and normalized moment is shown in Figs. 13 and 14.It is seen from Fig. 13 that the normalized displacement increasesfrom 0.009 to 0.035 when a changes from 0.1 to 0.3 for a pile withl/d ratio 28.6 embedded in saturated medium sand and subjectedto Kobe motion, while for Sikkim motion the increase is from0.001 to 0.007. Similarly from Fig. 14 it is seen the normalizedmoment increases from 0.033 to 0.042 and from 0.017 to 0.025when Kobe and Sikkim motions are chosen for the analyses,respectively, the value of a being changed from 0.1 to 0.3. Thisclearly shows that the input ground motion, the combination ofpseudo-static vertical and lateral load and lateral load coefficientmay have a significant influence on the bending and displacementresponse of piles embedded in different soil types.
4.4. Effect of l/d ratio and pile diameter
The influence of l/d ratio of the pile and the soil in which the pileis inserted is considered in the present study. Piles of constantlength l = 20 m, and diameter (d) 500 mm, 600 mm, 650 mm,700 mm and 750 mm with corresponding l/d ratios of 40, 33.3,30.8, 28.6 and 26.7 are considered, and their influence on thepseudo-static analyses of piles is studied. It is observed fromFig. 15(a) that as the diameter of the pile increases from 500 mmto 750 mm, the moment developed in the pile increases from106 kN m to 342 kN m and the normalized moment increases by72%, when exposed to the Northridge earthquake motion. The nor-malized displacement at the pile head reduces by about 24%, asshown in Fig. 15(b).
Fig. 16 shows the variation of normalized moment with pileflexibility ratio when subjected to different ground motions, forl/d ratios of 26.7 and 33.3. It is observed with an increase in l/dratio from 26.7 to 33.3, the normalized moment reduces from0.09 to 0.067 for Kobe motion while for Bhuj motion the reductionis from 0.06 to 0.04. Further, a rapid increase in moment is alsoobserved when the pile flexibility ratio (KR) increases above about5 � 10�5. This is because the pile flexibility ratio is a function of themoment of inertia, and hence diameter of the pile, and with anincrease in pile diameter, the bending moment in the pile isconsiderably increased. The variation of normalized moment withpile flexibility ratio, for different l/d ratios and when exposed to the

0
2
4
6
8
10
12
-0.01 0.00 0.01 0.02 0.03 0.04D
epth
coe
ffic
ient
(z*)
Normalized moment (M*)
a=0.1a=0.2a=0.3
l/d = 28.6; K = 431; Qv = Qh
Fig. 14. Variation of normalized moment (M⁄) with depth coefficient (z⁄) for a pilewith l/d ratio 28.6 and embedded in saturated medium sand for Qv = Qh andsubjected to 2011 Sikkim earthquake motion with different values of lateral loadcoefficient.
0
0.03
0.06
0.09
1 10
Nor
mal
ized
mom
ent (
M*)
Pile flexibility ratio (KR) [*10e-5]
1989 Loma Gilroy motion1994 Northridge motion1995 Kobe Motion2001 Bhuj motion2011 Sikkim motion
0
0.02
0.04
0.06
0.08
4 40
Nor
mal
ized
mom
ent (
M*)
Pile flexibility ratio (KR) [*10e-6]
1995 Kobe motion2001 Bhuj motion2011 Sikkim motion1994 Northridge motion1989 Loma Gilroy motion
l/d = 26.7; Qv = 0.0Qh; a= 0.3
l/d = 33.3; Qv = 0.0Qh; a = 0.3
(a)
(b)
K. Chatterjee et al. / Computers and Geotechnics 67 (2015) 172–186 183
Kobe and Bhuj motions, is illustrated in Fig. 17. It is observed thatas the soil type changes from saturated loose sand to layered soil,the moment developed in the pile, and hence the normalizedmoment, is considerably increased. It can therefore be concludedthat both the l/d ratio of the pile and the pile diameter can havea significant influence on the bending moment and displacementresponse of a pile when exposed to different ground motions.
Fig. 16. Variation of normalized moment (M⁄) with pile flexibility ratio (KR) for (a)l/d ratio = 26.7 and (b) l/d ratio = 33.3 when exposed to different input groundmotions with Qv = 0.0Qh and a = 0.3.
4.5. Effect of liquefaction
The influence of liquefaction on the bending response of pileshaving different diameters and l/d ratios, embedded in layered soiland subjected to the 1995 Kobe motion is illustrated in Fig. 18. Thewater table is assumed to be located at the ground surface andhence the critical condition for liquefaction to occur is simulated.It is observed that, for a pile having l/d ratio 40, the moment
0
0.2
0.4
0.6
0.8
1
-0.01 0.00 0.01 0.02 0.03
Nor
mal
ized
dep
th (z
")
Normalized moment (M*)
l/d=40l/d=33.3l/d=30.8l/d=28.6l/d=26.7
0
0.2
0.4
0.6
0.8
1
0.000 0.005 0.010 0.015 0.020
Nor
mal
ized
dep
th (z
")
Normalized displacement (y*)
l/d=40l/d=33.3l/d=30.8l/d=26.8l/d=26.7
K = 180; Qv = Qh; a = 0.3
K = 180; Qv = Qh; a = 0.3
(a)
(b)
Fig. 15. Variation of (a) normalized moment (M⁄) and (b) normalized displacement(y⁄) with normalized depth (z00) for a pile embedded in layered soil for different l/dratios with Qv = Qh, a = 0.3 and subjected to 1994 Northridge earthquake motion.
generated at the pile top under liquefaction conditions is185 kN m while under non-liquefied conditions the moment gen-erated is 38 kN m. As a result the normalized moment at the piletop amplifies by approximately 5 times when subjected to the1995 Kobe motion. Similarly, when the l/d ratio decreases to 26.7(i.e., the pile diameter increases to 750 mm), the moment inducedat the pile top increases from 143 kN m to 580 kN m under non-liquefied and liquefied soil conditions, respectively and hence amoment amplification factor of around 4 is observed. The signifi-cant rise in bending moment is observed in the case of liquefiedsoil due to a reduction in soil stiffness under saturated conditions.This has been accomplished in the present study by considering astiffness degradation parameter of 0.01 [26], as compared to nor-mal soil which is not susceptible to liquefaction. Hence, a con-siderable reduction in soil stiffness in liquefied soil induces ahigher magnitude of bending moment at the pile top, when com-pared to non-liquefied soil conditions. A similar variation of bend-ing moment for liquefied and non-liquefied soil is also observedwhen the 1989 Loma Gilroy, 1994 Northridge, 2001 Bhuj and2011 Sikkim seismic motions are used in the present analysis.However, the amplification factor of bending moment for the2001 Bhuj and 2011 Sikkim motions is found to be comparativelyhigher (7.8 and 7.5, respectively) when compared to the othermotions, owing to the higher frequency content and duration ofthese two motions.
4.6. Comparison of the present analytical methodology with theconventional JRA [33,34] approach
The analytical methodology proposed in the present study iscompared with the conventional JRA [33,34] approach to investi-gate the influence of lateral loads along pile depth on seismicanalysis of a vertically loaded pile. As JRA [33,34] procedure is validfor computing the lateral force only at the pile head according toEq. (1a), in the present study it has been extended to compute

0.01
0.02
0.03
0.04
0.05
0.06
0.07
0.08
0.09
1 10 100
Nor
mal
ized
mom
ent (
M*)
Pile flexibility ratio (KR) [*10e-6]
l/d=40l/d=33.3l/d=30.8l/d=28.6l/d=26.7
0.01
0.02
0.03
0.04
0.05
0.06
0.07
1 10 100
Nor
mal
ized
mom
ent (
M*)
Pile flexibility ratio (KR) [*10e-6]
l/d=40l/d=33.3l/d=30.8l/d=28.6l/d=26.7
Qv = 0.0Qh; a = 0.3
Qv = 0.0Qh; a = 0.3(a)
(b)
Fig. 17. Variation of normalized moment (M⁄) with pile flexibility ratio (KR) forvarious l/d ratios of the pile and exposed to (a) 1995 Kobe motion and (b) 2001 Bhujmotion with Qv = 0.0Qh and a = 0.3.
0
0.2
0.4
0.6
0.8
1
-0.01 0 0.01 0.02 0.03
Nor
mal
ized
dep
th (z
")
l/d=40l/d=33.3l/d=30.8l/d=28.6l/d=26.7
0
0.2
0.4
0.6
0.8
1
-0.002 0.000 0.002 0.004 0.006 0.008
Nor
mal
ized
dep
th (z
")
Normalized moment (M*)
l/d=40l/d=33.3l/d=30.8l/d=28.6l/d=26.7
K = 180; Qv = Qh; a = 0.3
K = 180; Qv = Qh; a = 0.3
Normalized moment (M*)(a)
(b)
Fig. 18. Variation of normalized moment (M⁄) with normalized depth (z00) for a pileembedded in (a) liquefied and (b) non-liquefied layered soil for different l/d ratioswith Qv = Qh, a = 0.3 and subjected to 1995 Kobe earthquake motion.
0
2
4
6
8
10
12
14
16
-0.005 0.000 0.005 0.010 0.015 0.020
Dep
th c
oeff
icie
nt (z
*)
Normalized moment (M*)
Present Analytical MethodologyJRA [1996, 2002] Method
0
2
4
6
8
10
12
14
16
0.00 0.03 0.06 0.09
Dep
th c
oeff
icie
nt (z
*)
Normalized displacement (y*)
Present Analytical MethodologyJRA [1996, 2002] Method
l/d = 40; K = 278; Qv = 0.0Qh; a = 0.3
l/d = 40; K = 278; Qv = 0.0Qh; a = 0.3
(a)
(b)
Fig. 19. Variation of (a) normalized moment (M⁄) and (b) normalized displacement(y⁄) with depth coefficient (z⁄) for a pile embedded in dry dense sand withQv = 0.0Qh, a = 0.3 and subjected to 1995 Kobe earthquake motion using the presentmethodology and conventional JRA [33,34] approach.
Table 5Comparison of maximum bending moment (kN m) and pile head displacement (mm)obtained in the present methodology with the conventional JRA [33,34] approach.
Present analyticalmethodology
Conventional JRA[33,34] approach
% Variation
Maximum bendingmoment (kN m)
554.5 438.4 21
Pile headdisplacement (mm)
41.1 31.7 23
184 K. Chatterjee et al. / Computers and Geotechnics 67 (2015) 172–186
the lateral force at different depths along the pile length accordingto Eqs. 1(c) and 1(d). The variation in results between the twomethodologies for a 20 m long and 500 mm diameter pile passing
through dry dense sand having l/d ratio 40, K = 278 and subjectedto 1995 Kobe motion with a = 0.3 and Qv = 0.0Qh is shown inFig. 19. It is observed that in the present methodology, the maxi-mum bending moment is 554.5 kN m while using the conventionalJRA [33,34] approach, the developed bending moment is438.4 kN m, thereby showing an increase of normalized bendingmoment (M⁄) of approximately 21%. Moreover, the normalizedmoment becomes almost zero for depth coefficient (z⁄) lyingbetween 9 and 15.5 in the conventional JRA [33,34] approach,while in the present methodology high values of normalizedmoment are observed for a similar range of depth coefficient,before it finally becomes zero at the pile tip. The variation in resultsmay be attributed to the influence of lateral force at various depthsalong the pile length which is considered in the present proposedmethodology. Similarly, it is also observed that the maximum dis-placement at the pile head is 41.1 mm and 31.7 mm using the pre-sent methodology and conventional JRA [33,34] approach,respectively. This indicates that the normalized displacement (y⁄)at the pile head increases by 23% when depth-wise variation of lat-eral force is taken into account in the present analytical methodol-ogy. The comparison of results between the two methodologies istabulated in Table 5.

K. Chatterjee et al. / Computers and Geotechnics 67 (2015) 172–186 185
5. Conclusions
In the present study, the effect of vertical compressive loadingon the lateral pile deflection and bending moment characteristicsof a laterally loaded pile under pseudo-static conditions is analyzedby a new force-based methodology employing the finite elementmethod. The effect of various parameters such as input groundmotions, l/d ratio of the pile, the soil in which the pile is embedded,the combination of pseudo-static vertical and lateral loads and thelateral load coefficient a, on the pseudo-static response of piles isstudied. The main conclusions derived from the present study areas follows:
1. The high peaks of the Fourier amplification ratio curves showthe significant influence of local soil sites in modifying theground response. Further, the amplification of accelerationdue to the 2001 Bhuj and 2011 Sikkim motion is found to becomparatively higher compared to the 1995 Kobe motion,although the latter had a higher acceleration at bedrock level.This is because of the higher frequency content and bracketedduration of the former two motions. Hence, as is now well-recognized, amplification of ground motions is considerablyaffected by the duration and frequency content of the inputseismic motions, and the maximum horizontal accelerationmay have a comparatively lower influence.
2. The response spectra indicate that while the 2001 Bhuj motionhas an influence over structures resting on soft soil sites with asmall period of vibration, the 1995 Kobe motion could signifi-cantly influence structures having a longer natural period.
3. The maximum horizontal acceleration generated at the groundsurface for dense sand is comparatively less compared to loosesand for a particular input motion, due to the former’s highershear strength parameters and modulus of subgrade reaction.Further, when the soil is saturated, its stiffness can be con-siderably reduced if liquefaction occurs, and hence a largermagnitude of lateral load may be generated from the seismicground response analysis. Hence the induced bending momentat the pile top is amplified by around 4 and 7.8 times when sub-jected to the 1995 Kobe and 2001 Bhuj seismic motions,respectively.
4. The normalized displacement and normalized bending momentis a maximum when Qv = 1.0Qh and the 1995 Kobe motion isselected as the input bedrock ground motion. This is due tothe higher intensity of Kobe motion (amax = 0.834g) comparedto the other seismic motions considered in the present study,giving rise to a maximum horizontal acceleration of 1.52g atthe ground surface for layered soil, which in turn produces ahigher magnitude of lateral load along the pile depth. The mag-nitude of vertical load acting at the pile head is considerablyincreased, thereby giving rise to a higher magnitude of displace-ment and moment.
5. With a reduction in l/d ratio of the pile, via an increase indiameter d, the normalized moment at the pile head isincreased while the normalized displacement is reduced. Thisis because as the diameter of the pile is increased, the allowableload carrying capacity of the pile also increases. As a result, thepile is capable of sustaining a higher bending moment.
6. The moment developed in the pile, and hence the normalizedmoment, is reduced when the soil type changes from a layeredsoil to a saturated loose sand, for the cases considered in thispaper. This is because the layered soil has a higher magnitudeof strength and stiffness parameters compared to the saturatedloose sand and hence is capable of generating higher magni-tudes of bending moment in the pile. However, in the case ofsaturated loose sand, due to the lower strength and stiffness
parameters, the maximum horizontal acceleration generatedat the ground surface is relatively high, which in turn leads toincreases in the lateral load but a reduction of the developedmoment in the pile.
7. With an increase in lateral load coefficient, the magnitude oflateral load acting at the top of the pile increases and hencehigher magnitudes of pile head displacement and pile bendingmoment are observed.
8. The present methodology considers the variation of lateral forceat various depths along the pile length and is observed to becritical since it generates higher magnitudes of both bendingmoment and pile head displacement, when compared to theconventional JRA [33,34] approach wherein only the lateralforce at the pile head is considered in analysis.
The proposed pseudo-static methodology may be used for eval-uating the behavior of a laterally loaded pile under the influence ofvertical compressive load. Moreover in the present study, the influ-ence of varying lateral pseudo-static loads at various depths alongthe pile length is considered using a force-based approach, an issuenot addressed by previous researchers. Thus, the analysis resultsfrom the present study should be of interest to practicing engineersfor the design of piles in seismically active areas, since the presentmethodology better simulates the actual field conditions of seis-micity than do existing pseudo-static methods.
References
[1] Poulos HG. Analysis of the settlement of pile groups. Geotechnique1968;18(4):449–71.
[2] Poulos HG. Behaviour of laterally loaded piles I – single piles. J Soil Mech FoundDiv ASCE 1971;97(SM5):711–31.
[3] Poulos HG. Behaviour of laterally loaded piles II – pile groups. J Soil MechFound Div ASCE 1971;97(SM5):733–51.
[4] Randolph MF, Wroth CP. Analysis of deformation of vertically loaded piles. JGeotech Eng Div ASCE 1978;104(12):1465–88.
[5] Randolph MF, Wroth CP. An analysis of the vertical deformation of pile groups.Geotechnique 1979;29(4):423–39.
[6] Randolph MF. The response of flexible piles to lateral loading. Geotechnique1981;31(2):247–59.
[7] Dobry R, O’Rourke MJ. Discussion on seismic response of end-bearing piles byR Flores-Berrones and RV Whitman. J Geotech Eng Div ASCE1983;109(5):778–81.
[8] Mylonakis G, Gazetas G. Settlement and additional internal forces of groupedpiles in layered soil. Geotechnique 1998;48(1):55–72.
[9] Nikolaou S, Mylonakis G, Gazetas G, Tazoh T. Kinematic pile bending duringearthquakes: analysis and field measurements. Geotechnique2001;51(5):425–40.
[10] Mylonakis G. Simplified model for seismic pile bending at soil layer interfaces.Soils Found 2001;41(4):47–58.
[11] Choudhury D. Seismic analysis of single end bearing pile. In: First internationalconference on geotechnical engineering for disaster mitigation andrehabilitation (GEDMR), Singapore; 2005. p. 275–80.
[12] Liyanapathirana DS, Poulos HG. Pseudo-static approach for seismic analysis ofpiles in liquefying soil. J Geotech Geoenviron Eng ASCE 2005;131:1480–7.
[13] Phanikanth VS, Choudhury D, Reddy GR. Behaviour of single pile in liquefieddeposits during earthquakes. Int J Geomech ASCE 2013;13(4):454–62.
[14] Hussien MN, Tobita T, Iai S, Karray M. On the influence of vertical loads on thelateral response of pile foundation. Comput Geotech 2014;55:392–403.
[15] Salgado R, Tehrani FS, Prezzi M. Analysis of laterally loaded pile groups inmultilayered elastic soil. Comput Geotech 2014;62:136–53.
[16] Maheshwari BK, Truman KZ, El Naggar MH, Gould PL. Three-dimensional finiteelement nonlinear dynamic analysis of pile groups for lateral transient andseismic excitations. Can Geotech J 2004;41:118–33.
[17] Liyanapathirana DS, Poulos HG. Seismic lateral response of piles in liquefyingsoil. J Geotech Geoenviron Eng ASCE 2005;131:1466–79.
[18] Knappett JA, Madabhushi SPG. Influence of axial load on lateral pile response inliquefiable soils. Part II: numerical modeling. Geotechnique 2009;59(7):583–92.
[19] Novak M. Dynamic stiffness and damping of piles. Can Geotech J1974;11:574–98.
[20] Dobry R, Vicente E, O’Rourke MJ, Rosset JM. Horizontal stiffness and dampingof single piles. J Geotech Eng Div ASCE 1982;108(3):439–59.
[21] Kavvadas M, Gazetas G. Kinematic seismic response and bending of free-headpiles in layered soils. Geotechnique 1993;43(2):207–22.
[22] Penzien J. Soil-pile foundation interaction in earthquake engineering. RLWiegeledn Englewood Cliffs, NJ: Prentice-Hall; 1970.
186 K. Chatterjee et al. / Computers and Geotechnics 67 (2015) 172–186
[23] El Naggar MH, Novak M. Non-linear analysis for dynamic lateral pile response.Soil Dyn Earthq Eng 1996;15(4):233–44.
[24] Tabesh A, Poulos HG. The effect of soil yielding on seismic response of singlepiles. Soils Found 2001;41(3):1–16.
[25] Abghari A, Chai J. Modeling of soil-pile-superstructure interaction for bridgefoundations. In: Turner JP, editor. Proceedings of performance of deepfoundations under seismic loading. New York: ASCE; 1995. p. 45–59.
[26] Ishihara K, Cubrinovski M. Performance of large-diameter piles subjected tolateral spreading of liquefied deposits. In: Thirteenth Southeast Asiangeotechnical conference, Taipei, Taiwan; 1998.
[27] Tabesh A, Poulos HG. Pseudostatic approach for seismic analysis of single piles.J Geotech Geoenviron Eng ASCE 2001;127(9):757–65.
[28] Cubrinovski M, Ishihara K, Poulos HG. Pseudo-static analysis of piles subjectedto lateral spreading. Bull NZ Soc Earthq Eng 2009;42(1):28–38.
[29] Dash SR, Bhattacharya S, Blakeborough A. Bending-buckling interactionas a failure mechanism of piles in liquefiable soils. Soil Dyn Earthq Eng2010;30(1–2):32–9.
[30] Elahi H, Moradi M, Poulos HG, Ghalandarzadeh A. Pseudostatic approach forseismic analysis of pile group. Comput Geotech 2010;37:25–39.
[31] IS 2911 Part 1 Section 4. Indian standard code of practice for design andconstruction of pile foundations. New Delhi: Bureau of Indian Standards; 1984.
[32] Ordonez GA. SHAKE2000: a computer program for the 1D analysis ofgeotechnical earthquake engineering problems. User’s manual. Washington,USA: GeoMotions LLC: Lacey; 2012.
[33] JRA. Part V. Specification for highway bridges: seismic design. Japanese RoadAssociation; 1996.
[34] JRA. Part V. Design specifications for highway bridges: seismicdesign. Japanese Road Association; 2002.
[35] Kawashima K, Unjoh S. Seismic design of highway bridges. J Jpn Assoc EarthqEng 2004;4(3):174–83.
[36] Reddy AS, Valsangkar AJ. Buckling of fully and partially embedded piles. J SoilMech Found Div ASCE 1970;96(SM6):1951–65.
[37] MATLAB. Programming, version 7.The Math Works Inc.; 2012.[38] Hetenyi M. Beams on elastic foundation: theory with applications in the fields
of civil and mechanical engineering. Ann Arbor: The University of MichiganPress; 1955 [4th reprint].
[39] Phanikanth VS, Choudhury D, Reddy GR. Response of single pile under lateralloads in cohesionless soil. Electron J Geotech Eng 2010;15(H):813–30.
[40] Phanikanth VS, Choudhury D, Reddy GR. Behavior of fixed head single pile incohesionless soil under lateral loads. Electron J Geotech Eng2010;15(M):1243–62.
[41] Reese LC, Isenhower WM, Wang ST. Analysis and design of shallow and deepfoundations. Wiley; 2006.
[42] Karasev OV, Talanov GP, Benda SF. Investigation of the work of single situ-castpiles under different load combinations. J Soil Mech Found Eng1977;14(3):173–7.
[43] Karthigeyan S, Ramakrishna VVGST, Rajagopal K. Influence of vertical load onthe lateral response of piles in sand. Comput Geotech 2006;33:121–31.
[44] Abdoun T, Dobry R, O’Rouke TD. Centrifuge and numerical modelling of soil-pile interaction during earthquake induced soil liquefaction and lateralspreading. In: Proceedings of observation and modelling in numericalanalysis and model tests in dynamic soil-structure interaction problems,sessions held in conjunction with Geo-Logan 97, Logan, Utah; 1997. p. 76–90.
[45] Seed HB, Idriss IM. Soil moduli and damping factors for dynamic responseanalyses. Rep. No. EERC-70/10. Berkeley, USA: Earthquake EngineeringResearch Center: University of California; 1970.
[46] Vucetic M, Dobry R. Effect of soil plasticity on cyclic response. J Geotech EngASCE 1991;117(1):89–107. 1991.
[47] Terzaghi K. Evaluation of coefficients of subgrade reaction. Geotechnique1955;4:297–326.
[48] Poulos HG, Davis EH. Pile foundation analysis and design. Wiley; 1980.[49] Bowles JE. Foundation analysis and design. 5th ed. McGraw-Hill Inc.; 1997.[50] NEHRP (National Earthquake Hazards Reduction Program). Recommended
provisions for seismic regulations for new buildings and other structures –Part 1: provisions. Prepared by the Building Seismic Safety Council for theFederal Emergency Management Agency (Report FEMA 450). Washington, DC;2003.
[51] Idriss IM. Response of soft soil sites during earthquakes. In: Proceedings of H.Bolton Seed memorial symposium. Berkeley: University of California; 1990.
[52] IS 1893 Part 1. Indian standard on criteria for earthquake resistant design ofstructures. General provisions and buildings. New Delhi: Bureau of IndianStandards; 2002.
[53] IS 456. Indian standard on plain and reinforced concrete-code of practice. NewDelhi: Bureau of Indian Standards; 2000.
[54] Mwindo JM. Strain dependent soil modulus of horizontal subgrade reaction.MS thesis. Rolla, MO: University of Missouri-Rolla; 1992.
[55] Prakash S, Kumar S. Nonlinear lateral pile deflection prediction in sands. JGeotech Eng 1996;122(2):130–8.
[56] Vesic AS. Bending of beam resting on isotropic elastic solid. J Eng Mech DivASCE 1961;87(EM2):35–53.