Seiche-forced resuspension events in a Mediterranean harbour
12
This article was published in an Elsevier journal. The attached copy is furnished to the author for non-commercial research and education use, including for instruction at the author’s institution, sharing with colleagues and providing to institution administration. Other uses, including reproduction and distribution, or selling or licensing copies, or posting to personal, institutional or third party websites are prohibited. In most cases authors are permitted to post their version of the article (e.g. in Word or Tex form) to their personal website or institutional repository. Authors requiring further information regarding Elsevier’s archiving and manuscript policies are encouraged to visit: http://www.elsevier.com/copyright
Transcript of Seiche-forced resuspension events in a Mediterranean harbour

This article was published in an Elsevier journal. The attached copyis furnished to the author for non-commercial research and
education use, including for instruction at the author’s institution,sharing with colleagues and providing to institution administration.
Other uses, including reproduction and distribution, or selling orlicensing copies, or posting to personal, institutional or third party
websites are prohibited.
In most cases authors are permitted to post their version of thearticle (e.g. in Word or Tex form) to their personal website orinstitutional repository. Authors requiring further information
regarding Elsevier’s archiving and manuscript policies areencouraged to visit:
http://www.elsevier.com/copyright

Author's personal copy
Continental Shelf Research 28 (2008) 505–515
Seiche-forced resuspension events in a Mediterranean harbour
A. Jordia,�, G. Basterretxeab, B. Casasb, S. Anglesc, E. Garcesc
aMarine Sciences Research Center, State University of New York, USAbIMEDEA (UIB-CSIC), Illes Balears, Spain
cInstitut de Ciencies del Mar (CMIMA-CSIC), Barcelona, Spain
Received 5 July 2007; received in revised form 29 August 2007; accepted 30 October 2007
Available online 17 November 2007
Abstract
The variability of suspended sediments in a Mediterranean harbour was studied using high-frequency moored instruments. Data
analysis revealed that the fundamental mode of oscillation or seiche is the main contribution to the sea level variability and currents. Yet
a direct relation between the seiche and suspended sediment was not clear. To study the sediment dynamics, a coupled hydrodynamic-
sediment one-dimensional vertical model for sand and non-cohesive mud was implemented. Results showed good agreement between
most of the observed and simulated resuspension events. Indeed, the vertical extension and the duration of these events were
satisfactorily simulated for mud class. Model simulations were used to determine the time delay between suspended sediment and
currents, which improved the correlation between the seiche and suspended sediment to some degree. Scarce events of sediment advection
from outside waters and fresh water discharges from land-based sources were identified. It is suggested that phytoplankton species
detected in the harbour were responsible for discrepancies between observations and simulations.
r 2007 Elsevier Ltd. All rights reserved.
Keywords: Sediment dynamics; Sea level; Seiches; Coastal currents; Modelling; Harbours; Mediterranean Sea
1. Introduction
A good understanding of sediment dynamics in coastalmarine ecosystems is a topic of key relevance for coastalmanagement. The transport and fate of sediments play amajor role in marine ecology, water quality and morpho-logical evolution of shallow areas. Suspended sedimentmay prevent sunlight penetration into the water affectingsubsurface biological habitat and primary production.Additionally, sediments discharged from the continent intothe marine environment tend to supply pollutants andorganic matter for the coastal marine system. These effectsare particularly intense in enclosed and semi-enclosedenvironments such as lakes, harbours and embaymentswhere advective water renewal is restricted.
Various hydrodynamic processes determine sedimentresuspension, transport and deposition into the marine
system. Waves and currents generated by high energyevents (i.e. storm) are often considered as a predominantdriving force for sediment resuspension (Ogston et al.,2000). River flooding and tidal currents are also majorprocesses driving sedimentation on river- and tide-domi-nated continental shelves, respectively (Ribbe and Hollo-way, 2001; Fan et al., 2004). The vertical sedimenttransport is controlled by sediment settling, verticaldiffusivity generated by the turbulence and vertical motionof the water particles. Conversely, the advection is the mainmechanism that transports horizontally suspended sedi-ment away from resuspension areas and other inputsources such as rivers (Wang and Pinardi, 2002).When considering resuspension in semi-enclosed bodies
of water such as estuaries or harbours, it is necessary toexamine the possible effects of other hydrodynamicprocesses. In particular, seiches have been proposed aspossible mechanisms for sediment reworking and transport(Pritchard and Hogg, 2003b), specially where tides are notnoteworthy. To our knowledge there are no previousstudies that demonstrate seiche-dominated sediment trans-port in harbours, although it has been observed in lakes
ARTICLE IN PRESS
www.elsevier.com/locate/csr
0278-4343/$ - see front matter r 2007 Elsevier Ltd. All rights reserved.
doi:10.1016/j.csr.2007.10.009
�Corresponding author.
E-mail addresses: [email protected] (A. Jordi),
[email protected] (G. Basterretxea), [email protected] (B. Casas),
[email protected] (S. Angles), [email protected] (E. Garces).

Author's personal copy
(Bloesch, 1995; Shteinman et al., 1997). Seiches are naturalmodes of oscillations at long periods in the range of one toseveral minutes. External factors such as strong winds orlong atmospheric waves can excite natural modes byresonance and cause intense currents and sedimentresuspension. Although all semi-enclosed basins experiencecertain degree of oscillatory movements, some harboursexperiment considerable seiches (e.g., Monserrat et al.,1991).
The objective of this study is to describe the seichingmotion as the principal mechanisms that contribute to thesediment resuspension and control the variability of thesuspended sediment particles within the water column in aMediterranean harbour (Arenys de Mar). In order toachieve this goal, we first determine the role of seiche in theharbour dynamics using time series of sedimentologicaland hydrodynamic parameters. Next, a sediment transportequation is incorporated into a one-dimensional verticalnumerical model based on Mellor–Yamada level 2turbulence closure scheme (Chen et al., 1988) to providemore insight into the physical processes that determineresuspension, transport and deposition of suspendedmatter.
2. Material and methods
2.1. Study site
Arenys de Mar is a small harbour located on coast ofCatalunya, in the northwestern Mediterranean Sea (Fig. 1).
It comprises a winding elongated basin of about 1200mlength and two small sub-basins, one near the entrance andanother near the northeastern corner. Averaged harbourdepth is 4m, reaching depths of up to 6m near theentrance. The harbour is protected from offshore seas andgeneral winds by straight sidewalls. Forcing by tides isalmost negligible in the Mediterranean, with a spring tidalrange of less than 0.25m (Tsimplis et al., 1995). Theharbour receives occasional fresh water discharges fromland-based sources in heavy-rain episodes.
2.2. Field observations
A bottom mounted ADCP and a SBE26 sea levelrecorder were deployed in Arenys de Mar harbour from29th October to 21th November 2005 at locations shown inFig. 1. Vertical profiles of current velocities and acousticsignals were measured at 0.5m depth intervals with thebottom mounted ADCP (1MHz Nortek Aquadopp) set tomeasure at 60 s intervals. Sea pressure data were obtainedevery 30 s with the SBE26 sea level recorder. The originalpressure time series was adjusted to sea level with atmo-spheric pressure obtained at a nearby station (scale factor1 cmmb�1).Suspended sediment concentration was derived from the
acoustic signal recorded by the ADCP. Once the signal wasconverted to decibels, sediment concentration was esti-mated using a random phase acoustic backscatter model asdescribed by Thorne and Hanes (2002)
10 logðcÞ ¼ Bþ K0, (1)
ARTICLE IN PRESS
2
68
12
13
17
21
23
24
25
26
ADCP
SBE26
0 100 200 m
5°W 0° 5°E 10°E 15°E
36°N
38°N
40°N
42°N
44°N
Arenys
de Mar
Mediterranean Sea
Fig. 1. Map of the Arenys de Mar harbour and location of instruments (ADCP & SBE26) and bottom granulometric samples.
A. Jordi et al. / Continental Shelf Research 28 (2008) 505–515506

Author's personal copy
where c the suspended sediment concentration (in10�3 kgm�3), B is the corrected signal or echo intensity(dB) and K0 an empirical constant (dB), which is usuallydetermined by calibration against water samples. In thiscase, a value of K0 ¼ 36 dB was selected, which are withinranges of those used by other researchers (e.g., Souza et al.,2004; Ferre et al., 2005).
During 28th October 2005 CTD profiles and sedimentsamples were obtained at 11 sites in order to obtaininformation about hydrology and sediment granulometry(see Fig. 1). Samples were washed, had the organic matterremoved and oven dried in the laboratory a few hours aftercore subsampling. Sediment grain-size was analysed using asettling tube (sand fraction) and a Sedigraph 5100 (mudfraction).
2.3. Model description
We used a coupled hydrodynamic-sediment one-dimen-sional vertical model in order to analyse the resuspensionevents and the variability of the suspended sediment withinthe water column. Horizontal advection is assumed to below for most of the time since harbours are characterizedby reduced advective exchanges. As we will see, this is asevere assumption for the seiche. However, we note thatthe contribution to sediment transport arising from theseiche may be negligible over the time scale of a seiche. Thegoverning equations are
qu
qt� fv ¼ �
1
rqp
qxþ
qqz
Km
qu
qz
� �, (2)
qv
qtþ fu ¼ �
1
rqp
qyþ
qqz
Km
qv
qz
� �, (3)
qT
qt¼
qqz
Kh
qT
qz
� �, (4)
qS
qt¼
qqz
Kh
qS
qz
� �, (5)
qci
qt¼
qqz
Kh
qci
qz
� �� ws;i
qci
qz, (6)
where t is time (s), x, y and z the space coordinates (m), u
and v the horizontal components of current velocityðms�1Þ, r the water density ðkgm�3Þ, T the temperature(1C), S the salinity (psu), ci the suspended sedimentconcentration ðkgm�3Þ for each sediment size class i, p
the pressure (Pa), f the Coriolis parameter (s�1), Km and Kh
the vertical eddy viscosity and diffusivity coefficientsðm2 s�1Þ, respectively, and ws;i the settling velocity ðms�1Þfor each sediment size class i. Both viscosity and diffusivitycoefficients are computed using the Mellor–Yamada level 2turbulence closure scheme, which allows coefficients to beas small as 10�5 m2 s�1. A detailed description of thehydrodynamic model was given by Chen et al. (1988).
Several assumptions were made to describe the sedimentdynamics. We first treated all sediment fractions as non-cohesive and the sediment mixture as a Newtonian fluid.Furthermore, we assumed that suspended sediment con-centrations were small and had no effects on the waterdensity (Wang and Pinardi, 2002). Finally, we only tookinto account suspended-load transport and the seabedprovided an indefinite source for the resuspended load.Eq. (6) is solved separately for each sediment size class.
Independent solvers are used for the handling of verticaldiffusion and vertical settling. The vertical diffusionscheme is similar to the equations for temperature andsalinity (Eqs. (4) and (5)) in the hydrodynamic model(Chen et al., 1988). Following Blaas et al. (2007), thevertical settling scheme includes a piece-wise parabolicmethod (Colella and Woodward, 1984) and a weightedessentially non-oscillatory scheme (Liu et al., 1994). Thesettling velocities for sediment particles are computedaccording to Stokes law
ws;i ¼gd2
i
18nrs
r� 1
� �, (7)
where di is the sediment grain diameter (m) for each size-class, n the molecular kinematic viscosity ðm2 s�1Þ and rs
the sediment grain density ð2650 kgm�3Þ.At the sea surface, sediment fluxes and point sources or
sinks are absent. At the sea bottom, the net sediment fluxðkgm�2 s�1Þ is the sum of the deposition flux (�wsci) andthe resuspension flux (Ri) at the seabed for each size class.The resuspension flux for each size class is computed usingthe formula
Ri ¼ R0f i
tb
tc
� 1
� �for tb4tc, (8)
where R0 is an empirical entrainment rate ðkgm�2 s�1Þ, f i
the volumetric fraction of sediment of class i, tb the bottomshear stress ðkgm�1 s�2Þ and tc the critical shear stressðkgm�1 s�2Þ. The entrainment rate may depend uponproperties such as sediment type, composition, density,and thickness (Ribbe and Holloway, 2001). Although thereis considerable uncertainty associated with the entrainmentrate, we selected a constant value of 10�4 kgm�2 s�1, whichranged between typical literature values (e.g., Clarke andElliott, 1998; Blaas et al., 2007; Stanev et al., 2007).The bottom shear stress is computed through the
relationship
tb ¼ rCdðu2 þ v2Þz¼za
, (9)
where
Cd ¼k
lnððH þ zaÞ=z0Þ. (10)
Cd is the drag coefficient, k the Von Karman constant, H
the total water depth (m), za the reference height above thebed (m), and z0 the bottom roughness (set to 10�2 m).
ARTICLE IN PRESSA. Jordi et al. / Continental Shelf Research 28 (2008) 505–515 507

Author's personal copy
The critical shear stress is determined using the Shieldsfunction
tc ¼ r0:1g rs � r
� �n
r
� �2=3. (11)
The resuspension flux (Ri) is zero for tb smaller than tc.
3. Results
3.1. Data analysis
The sea level spectral content was estimated using aHamming window of 16 384 points with half windowoverlapping (Fig. 2). The presented spectra were addition-ally smoothed so that the resulting spectra averages anumber of adjacent frequencies increasing with frequency(Emery and Thomson, 1997). Major peaks were observedat tidal frequencies (24 and 12 h) and at approximately12.8min. This latter period is fully consistent with thefundamental mode of oscillation (seiche) for the geometryof Arenys de Mar harbour (L ¼ 1200m, H ¼ 4m)computed following Gomis et al. (1993), who analyticallysolved the linearized long-wave equations in a non-rotatingocean considering a flat-bottom rectangular inlet of long-itude L and depth H to obtain the modes of sea leveloscillation (seiche).
To find out which is the major forcing (seiche or tide) forArenys de Mar harbour, we explored the possibility thatcurrents may have a comparable evolution with theseiching. The energy corresponding to the seiche wascomputed by integrating sea level spectra between 11 and15min (the seiche band) at 3 h intervals. Fig. 3 shows acomparison between the time evolution of sea level energy
at the seiching band, and measured current velocities andsuspended sediment concentrations by the ADCP. Cur-rents were generally barotropic and highly correlated to theseiching motion. Correlation coefficients between seichingenergy and currents were around 0.9 at all vertical levels,which suggests that seiching was the main forcing.As expected, suspended sediments were mostly concen-
trated at deeper levels, but episodical enhancementsreaching the shallowest levels were observed. Despite thatsome peaks appeared to be correlated with major seichingevents, some enhancements occurred with negligible seicheoscillations. Particularly the events on November 1st and9th were not correlated with high levels of energy at theseiche band. Correlation coefficients between seiche andobserved suspended sediments were up to 0.5 at deeperlevels and decreased linearly to very low values (o0:1) atupper levels. We did not expect high correlation valuesbetween sediment and seiche (or currents) because of thedelayed response of sediment suspension to changes in thevelocity. The processes of scour and settling lag to explainthe time-dependent response of sediment suspension toflow velocity have been discussed by different authors (e.g.van Straaten and Kuenen, 1958; Postma, 1961; Pritchardand Hogg, 2003a). The scour lag is caused by the finite timefor the current speed to erode sediment and mix it upward.The settling lag is measured by the finite time which it takessediment to settle out of suspension.The bottom sediments in the harbour are composed
predominantly of very poorly sorted slightly gravelly sandymud with a mean particle size of 25:5� 10�6 m (Table 1).Most samples present trimodal size distributions combin-ing fine sand, very fine sand and silt, although in somecases the larger modes are not well differentiated (notshown). Fine sediments (silt and clay fractions) average68% of the sediments and present higher values towardsthe inner part of the basins (St 23, 13 and 17). Sands aremost abundant at the entrance (St 21) and along the N–Saxis (St 2, 26, 24 and 25). Coarse materials, mainly gravel,always represent less that 1% of the sample. Particle sizedistribution shows that, in contrast with the lower sortingcoefficient of the nearby coastal sediments (St 21,s ¼ 3:8� 10�6 m), very poorly sorted sediments (s between5� 10�6 and 9� 10�6 m) are observed within the harbour.Lower values (s�5� 10�6 m) correspond to the samplingpoints along the N–S axis (St 2, 26, 24 and 25) whichsuggests an exposure to enhanced water motion beforesedimentation in this area.
3.2. Model simulations
The model was integrated over the period from 29thOctober to 21th November 2005 with a time step of 1 s. Avertical grid of 30 uniform levels was used to simulate thewater column at the ADCP location (Fig. 1) with a depthof 6m. We considered two sediment classes, one being mudand the other sand with grain sizes and volumetricfractions obtained from mean sampled values (Table 1).
ARTICLE IN PRESS
Fig. 2. Sea level spectral density at the SBE26 location. Periods of the
major peaks are indicated.
A. Jordi et al. / Continental Shelf Research 28 (2008) 505–515508
Author's personal copy
The initial profiles of temperature and salinity wereobtained from mean values of CTD measurements. Bothprofiles display a uniform distribution in the water columnaround 19:2 �C and 37.9 psu. The initial velocity fields andsuspended sediment concentration profiles for both classeswere set to zero.
The model was driven by sea level variation due toseiching motion (Zs). The sea level measured at SBE26 wasfiltered between 11 and 15min (the seiche band) in order to
obtain the sea level variation due to the seiche (Zs). Thevalues for each time step were obtained by interpolatingthe filtered time series data and were incorporated into themodel through the horizontal pressure gradient terms inEqs. (2) and (3). We assumed that the pressure gradientswere caused by a Kelvin barotropic wave, i.e.
�1
rqp
qx;qp
qy
� �¼
qZs
qt; f Zs
� �. (12)
ARTICLE IN PRESS
En
erg
y0
1
2
3
De
pth
(m
)
0
2
4
6 0
2
4
6
8
De
pth
(m
)
30 01 03 05 07 09 11 13 15 17 19
0
2
4
6 10-9
10-7
10-5
10-3
November 2005
Fig. 3. Time evolution of (a) spectral energy ðm2 sÞ at the seiching band (12.8min) at the SBE26 location computed at 3 h intervals, (b) 3 h averaged
currents ð10�2 m s�1Þ at the ADCP location, and (c) 3 h averaged suspended sediment concentration ðkgm�3Þ at the ADCP location. Horizontal black lines
represent the zone measured by the ADCP.
Table 1
Grain size (d) and volumetric fraction (f) of sediment classes and sorting coefficient (s) as sampled in 28th October 2005
Station Gravel Sand Fines s (10�6 m)
d (10�3 m) f (%) d (10�6 m) f (%) d (10�6 m) f (%)
2 42 0.2 147.6 45.2 17.3 54.6 5.1
6 42 0.6 177.6 26.3 14.0 73.0 6.3
8 42 0.8 202.7 27.6 10.2 71.7 8.6
12 – 0.0 178.3 46.1 13.6 53.9 6.1
13 42 0.4 161.3 13.0 10.0 86.6 5.8
17 42 0.5 114.0 16.9 13.7 82.6 5.8
21 – 0.0 114.7 55.5 21.6 44.5 3.8
23 42 0.3 280.6 25.5 10.0 74.2 9.1
24 42 0.4 133.8 36.7 17.1 63.0 5.4
25 42 0.6 128.6 37.5 18.0 61.9 5.4
26 – 0.0 125.1 18.3 14.9 81.7 5.5
Mean – 0.3 160.4 31.7 14.6 68.0 –
A. Jordi et al. / Continental Shelf Research 28 (2008) 505–515 509

Author's personal copy
Although points where sea level was measured (SBE26)and where the model was applied (ADCP) are not thesame, this is a reasonably approach since they are close andboth inside the harbour. The main effect of limiting theresonant response in a harbour is due to seaward radiationof energy from the harbour mouth (Liu et al., 2003). TheCoriolis acceleration was included in the model because itmay be important when considering long periods (i.e.tides), but it could be justifiably ignored in the case ofseiche periods which are much shorter than the localinertial period. Neither wind forcing nor flux of heat or saltwas considered.
The evolution of simulated currents and turbulence overtime is illustrated in Fig. 4. Current variability was highlycorrelated to seiching motion, in good agreement withobservations. Correlation coefficients between observedand simulated currents were greater than 0.9. During mostof the time the entire water column showed very weakvertical velocity gradients. Only deeper levels experiencedrelatively strong vertical gradients since currents almostvanished near the bottom due to friction. Eddy diffusivitywas also correlated to the seiche, but high levels ofturbulence were restricted to deeper levels, where verticalvelocity gradients were greater.
Fig. 5 shows time evolution of suspended sedimentconcentration for both simulated particle classes. Ingeneral resuspension occurred during events of enhancedseiching motion, although there were large differences inresuspension efficiency of the mud and sand fractions. Themud was easily resuspended by the currents reachingdepths of around 3m. During the major peak onNovember 14th and 15th, the suspended sediment arrivedup to 2m. In contrast, sand spent much shorter time insuspension because of its higher settling velocity. Sand
suspended concentrations were limited to the first meterabove bottom.It is interesting to compare the simulated suspended
sediment with observations. We centred on the simulatedmud concentration because sand did not reach themeasured levels by the ADCP. Most of the simulatedpeaks coincided in time and vertical extension withobserved peaks. Discrepancies appear on the duration ofthose peaks. Correlation coefficients between observed andsimulated sediment concentrations were about 0.77 atdeeper levels (below 3.5m).
3.3. Sensitivity analysis
The sediment resuspension and deposition can beaffected by various parameters. We examined the effectsof bottom friction and settling velocity. We focused thesensitivity analysis on the suspended mud concentrationsince sand is hardly resuspended.To analyse the effects of bottom friction, the bottom
roughness was increased to 5� 10�2 m and reduced to 5�10�3 m (Fig. 6). The time variability of mud sediment wassimilar to previous simulation for both cases. However, theeffect of increasing (decreasing) bottom friction was anincrease (decrease) of resuspension events with higher(lower) sediment concentrations. Correlation coefficientsbetween observed and simulated sediment concentrationswere at deeper levels around 0.69 for increased bottomroughness and 0.79 for the reduced case. The increase onthe correlation in the second case should be attributed toreduced duration of resuspension events, rather to thedecrease in the number of these events.Effects of bottom friction on suspended sediments can be
interpreted in terms of resuspension and turbulence. First,
ARTICLE IN PRESS
De
pth
(m
)
0
2
4
6 0
2
4
6
8
De
pth
(m
)
30 01 03 05 07 09 11 13 15 17 19
0
2
4
6 0
1
2
3
November 2005
Fig. 4. Time evolution of simulated 3 h averaged (a) currents ð10�2 m s�1Þ and (b) eddy diffusivity ð10�4 m2 s�1Þ. Horizontal black lines represent the zone
measured by the ADCP.
A. Jordi et al. / Continental Shelf Research 28 (2008) 505–515510

Author's personal copy
varying bottom roughness modifies near bottom currentsand drag coefficient, which play opposite effect on nearbottom stress and therefore on the resuspension flux. Inour simulations, the effect on drag coefficient dominated.Additionally, the bottom boundary layer also depends onbottom friction. The vertical extent of the bottomboundary layer was larger for an increased friction,enhancing vertical velocity gradients and turbulence inthat zone. In consequence, suspended sediment reachedupper levels than the case with reduced bottom roughness.
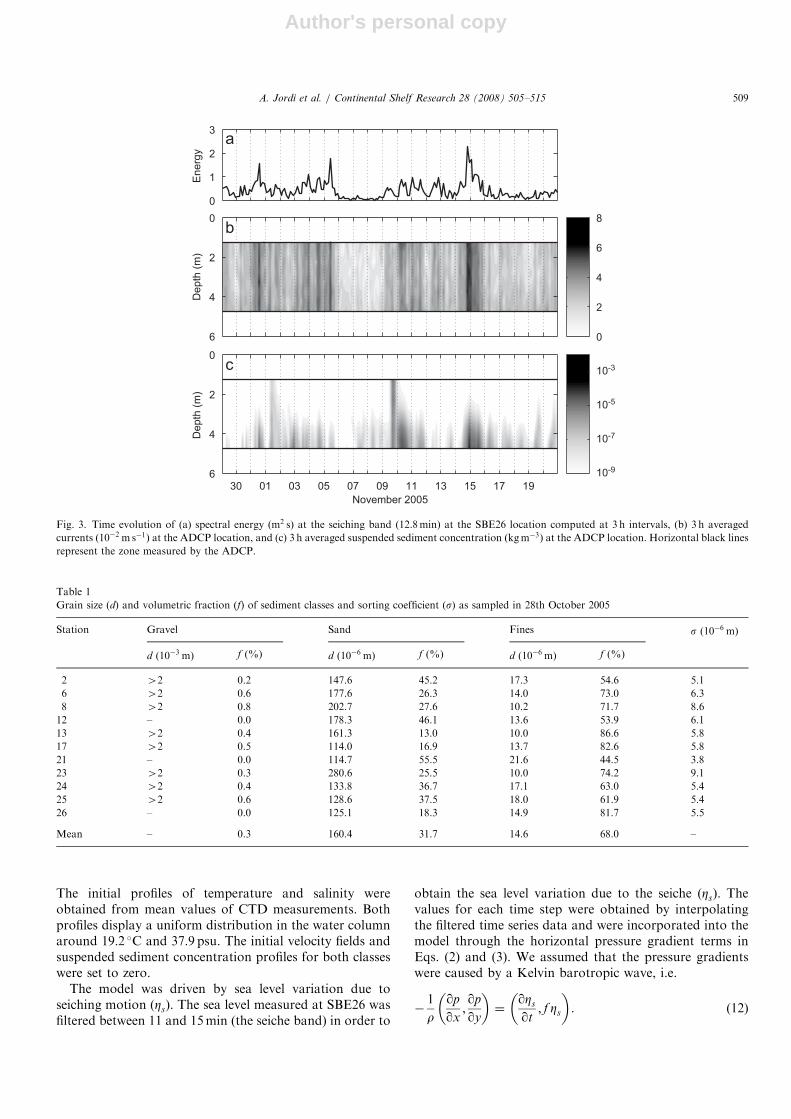
The settling velocity was determined using the Stokeslaw (Eq. (7)), however, higher sediment concentrationsmay form larger aggregates which in turn have largersettling velocities (Stanev et al., 2007). To evaluate thiseffect, as a first approximation the settling velocity wasdoubled and reduced by a half (Fig. 7). As expected, thesuspended mud concentration was higher and the durationof resuspension events was longer for reduced settlingvelocity, since the vertical velocity controls the time that asediment particle spends in the water column. At deeper
ARTICLE IN PRESS
De
pth
(m
)
0
2
4
6
November 2005
De
pth
(m
)
30 01 03 05 07 09 11 13 15 17 19
0
2
4
6 10-9
10-7
10-5
10-3
10-9
10-7
10-5
10-3
Fig. 6. Time evolution of simulated 3 h averaged suspended sediment concentration (kgm�3) for mud class varying the bottom roughness: (a) z0 ¼
5� 10�2 m and (b) z0 ¼ 5� 10�3 m. Horizontal black lines represent the zone measured by the ADCP.
De
pth
(m
)
0
2
4
6
November 2005
De
pth
(m
)
30 01 03 05 07 09 11 13 15 17 19
0
2
4
6 10-9
10-7
10-5
10-3
10-9
10-7
10-5
10-3
Fig. 5. Time evolution of simulated 3 h averaged suspended sediment concentration ðkgm�3Þ for (a) mud class and (b) sand class. Horizontal black lines
represent the zone measured by the ADCP.
A. Jordi et al. / Continental Shelf Research 28 (2008) 505–515 511
Author's personal copy
levels, correlation coefficient between observed and simu-lated sediments were up to 0.83 for doubled settlingvelocity and 0.61 for the reduced velocity. This indicatesthat the formulation of settling velocity should beimproved for future applications.
3.4. Response time
To understand the different behaviour of the sedimentclasses, as well as the poor correlation between theobserved velocities and concentrations, we explored thesediment response time. Fig. 8 shows a comparisonbetween current speed and suspended sediments duringthe major seiche event (November 14th). The association ofpeaks of current speed (above a threshold) and delayedpeaks of suspended sediments was apparent. For bothsimulated sediment classes, the resuspension took placerapidly and sediments were mixed throughout the watercolumn. However, muddy sediments did not immediatelyfall out of suspension after the current peak and suspensionalso depended on antecedent peaks. Mud took significantlylonger to settle than predicted using its settling velocity(�10�4 m s�1), indicating that the turbulence generated bythe seiche kept the sediment suspended long after thecurrent dropped below the threshold required to resuspendthe sediment. Conversely, sand fall out of suspensionalmost immediately after the current peak, suggesting thathigher turbulence levels are necessary to keep the sand insuspension.
Following Stansby and Awang (1998), we defined thesedimentary response time scale as the time for suspensionrate to become 99% of the deposition rate. Vertical profilesof response time scales for mud and sand illustrate that thetime scale increased with the elevation above the bottom
(Fig. 9). As expected, response time scales were muchlonger for fine sediment (mud) than for sand, especially farfrom the bottom. Moreover, a considerable variability wasobserved in response time scales probably due to turbu-lence produced by the seiche. It is also noteworthy tomention that response time scale was not sensitive tovariations of bottom roughness (not shown). In the case ofsettling velocity, the sensitivity of response time scale wasinversely proportional to changes in settling velocity formuddy sediments, whereas no dependency was observedfor coarse sediment. Stansby and Awang (1998) predictedthis behaviour for fine and coarse sediments solvinganalytically and numerically an idealised situation of abed of sediment in a steady current with initially clearwater.We return now to the problem of estimating correlation
between seiche and sediment. We expected that incorpor-ating the response time scale (obtained from the modellingresults) improved the correlation between observed seicheand suspended sediment concentrations. Although thecorrelation did not increase substantially at deeper level(4.75m), it was roughly constant (0.5) until a depth of3.5m (the depth reached by the simulated mud sediment).This result represents an improvement respect to thecorrelation computed without the delayed time. However,a correlation coefficient of 0.5 should indicate that a part ofthe observed suspended sediment concentrations were notcaused by the seiche activity.
4. Discussion and conclusion
In this study, we have described the seiche in Arenys deMar harbour as the principal mechanism that controls thesediment resuspension and the variability of the suspended
ARTICLE IN PRESS
De
pth
(m
)
0
2
4
6
November 2005
De
pth
(m
)
30 01 03 05 07 09 11 13 15 17 19
0
2
4
6 10-9
10-7
10-5
10-3
10-9
10-7
10-5
10-3
Fig. 7. Time evolution of simulated 3 h averaged suspended sediment concentration ðkgm�3Þ for mud class varying the settling velocities for sediment
particles: (a) double and (b) half. Horizontal black lines represent the zone measured by the ADCP.
A. Jordi et al. / Continental Shelf Research 28 (2008) 505–515512

Author's personal copy
sediment using both observations and model simulations.The agreement between observed and simulated currentsand their correlation with the seiche gave us confidence inthe model performance. However, there were somedifferences between the trend in observed and simulatedsuspended sediment concentrations. Some of these dis-crepancies might be explained with the sedimentaryresponse time and using an improved formulation ofsettling velocity. Other observed peaks of sediment were
not related to the seiche motion and, consequently, notreproduced by the model. The main point of discussion isfocussed on understanding these peaks.First, observed sediment concentrations displayed high
levels at the entire water column on November 1st and 9th,not reproduced by the numerical model. This suggests thatother processes which are not accounted for in the modelmay occur during these events. For example, the sharptemperature drop on November 1st measured by the
ARTICLE IN PRESS
Fig. 9. Vertical structure of mean response time scale for simulated mud and sand sediments. The thick solid line corresponds to the basic case, the thin
solid line to the half settling velocity and the dotted line to double settling velocity. The gray shaded area represents the variability of response time scale
for the basic case.
Cu
rre
nt
0
10
20
Mu
d
10-6
10-4
10-2
Sa
nd
19:15 19:30 19:45 20:00 20:15 20:30 20:4510-9
10-6
10-3
14th November 2005
Fig. 8. Time evolution of simulated currents ð10�2 m s�1Þ at 0.01m above the bottom, and suspended sediment concentrations ðkgm�3Þ for mud and sand
classes at 0.01, 0.03, 0.05, 0.07, 0.09, 1.10, 1.30 and 1.50m above the bottom (lines from top to bottom, respectively) for 14th November 2005 during 19:15
and 20:45. Vertical gray lines indicate the position of current peaks.
A. Jordi et al. / Continental Shelf Research 28 (2008) 505–515 513

Author's personal copy
ADCP (Fig. 10a) suggests intensification of the exchangewith offshore waters and, presumably, entrance of sedi-ment. During November 1st, an intense storm with wavesabove 3.5m of significant height was registered in the area(data from Puertos del Estado). Moreover, considering desediment characteristics in the nearby coast and the factthat sands are most abundant at the bottom sedimentssampled at the entrance and along the N–S axis, it is clearthat occasionally water and sediment entrances shouldexist. On the other hand, the increase of sediments at upperlevels on November 9th was not related to water cooling,but coincided with an episode of heavy rain, as shown inFig. 10b.
Second, there were other peaks generally with lowconcentrations not captured by the model simulationsand not correlated with the seiche. Since the sea levelspectrum showed a contribution of tides in the sea levelvariability, we hypothesized that tidal generated currentswere the responsible for those peaks. The model was forcedby tidally induced sea level variations. Currents were smalland no resuspension was simulated (not shown). Althoughthe model (one-dimensional) cannot produce non-linearand/or bathymetric effects on tidal dynamics that maygenerated stronger tidal currents, the high correlation(40:9) between observed and simulated currents (forced bythe seiche) demonstrates that these effects are notsignificant in Arenys de Mar. This agrees with otherobservational and numerical studies of resupension in theMediterranean coastal areas (e.g. Guillen et al., 2006; Puiget al., 2007; Wang et al., 2007). Therefore, we discardedtide as an effective mechanism for resuspension in Arenysde Mar harbour.
Another possibility is that observed suspended sedimentconcentration was affected by the presence of biologicalparticles. Indeed, blooms of phytoplankton species arerecurrent in Arenys de Mar harbour from the last decadeand are frequently detected year-round at low concentra-tions (Vila et al., 2005; Garces and Vila, 2007). Speciesabundance usually displays a typical diel cycle of verticallymigrating organisms with maximum abundance in the
afternoon. This behaviour would fit with our observations.Furthermore, the dominant species in the bloom isAlexandrium minutum, which has a spherical form with adiameter of 20mm, similar to the sediment detected in theharbour.On the other hand, A. minutum develops a dormant
resting stage in response to physical, chemical andbiological conditions. Resting cysts remain buried in thesediment and survive for several years (Garces et al., 2004).However, knowledge on vertical cyst fluxes and excystmentprocesses which allow further outbreaks of A. minutum isnot well understood. These cysts with smaller density thansediment grains would be resuspended easily by nearbottom currents. However, more observations arerequired to support cyst resuspension or biological activeparticles affecting measured suspended sediment concen-trations. Furthermore, the role of seiching in the harbourand the associated resuspension should be investigatedin relation with blooms of phytoplankton species in Arenysde Mar.In summary, study of time series data collected in Arenys
de Mar emphasizes the key role of the fundamental modeof oscillation or seiche on suspended sediment dynamics inthe harbour. A coupled hydrodynamic-sediment one-dimensional vertical model was found to adequatelyreproduce the main resuspension events caused by theseiche and to quantify the time delay of the suspendedsediment in relation to seiche. Moreover, the analysis of thedifferences between observed and simulated sedimentconcentrations suggests that other processes such as highoffshore seas or heavy-rain episodes contribute sporadi-cally to the suspended sediment variability.
Acknowledgements
This study was financed by the EU funded ResearchProject SEED (GOCE-CT-2005-003875). A. Jordi workwas sustained by a Postdoctoral grant and E. Garces by aRamon y Cajal contract, both from the Spanish Ministryof Science and Education.
ARTICLE IN PRESS
Fig. 10. Time evolution of (a) sea water temperature at the ADCP location and (b) daily accumulated rain at a nearby weather location.
A. Jordi et al. / Continental Shelf Research 28 (2008) 505–515514

Author's personal copy
References
Blaas, M., Dong, C.M., Marchesiello, P., McWilliams, J.C., Stolzenbach,
K.D., 2007. Sediment-transport modeling on southern Californian
shelves: a ROMS case study. Continental Shelf Research 27 (6),
832–853.
Bloesch, J., 1995. Mechanisms, measurement and importance of sediment
resuspension in lakes. Marine and Freshwater Research 46 (1),
295–304.
Chen, D., Horrigan, S.G., Wang, D.P., 1988. The late summer vertical
nutrient mixing in Long Island Sound. Journal of Marine Research 46
(4), 753–770.
Clarke, S., Elliott, A.J., 1998. Modelling suspended sediment concentra-
tions in the Firth of Forth. Estuarine Coastal and Shelf Science 47 (3),
235–250.
Colella, P., Woodward, P.R., 1984. The piecewise parabolic method
(PPM) for gas-dynamical simulations. Journal of Computational
Physics 54 (1), 174–201.
Emery, W.J., Thomson, R.E., 1997. Data Analysis Methods in Physical
Oceanography. Pergamon, New York, 634pp.
Fan, S.J., Swift, D.J.P., Traykovski, P., Bentley, S., Borgeld, J.C., Reed,
C.W., Niedoroda, A.W., 2004. River flooding, storm resuspension,
and event stratigraphy on the northern California shelf: observations
compared with simulations. Marine Geology 210 (1–4), 17–41.
Ferre, B., Guizien, K., de Madron, X.D., Palanques, A., Guillen, J.,
Gremare, A., 2005. Fine-grained sediment dynamics during a strong
storm event in the inner-shelf of the Gulf of Lion (NW Mediterra-
nean). Continental Shelf Research 25 (19–20), 2410–2427.
Garces, E., Bravo, I., Vila, M., Figueroa, R.I., Maso, M., Sampedro, N.,
2004. Relationship between vegetative cells and cyst production during
Alexandrium minutum bloom in Arenys de Mar harbour (NW
Mediterranean). Journal of Plankton Research 26 (6), 637–645.
Garces, E., Vila, M., Rene, A., Alonso-Saez, L., Angles, S., Luglie, A., Maso,
M., Gasol, J.M., 2007. Natural bacterioplankton assemblage composition
during blooms of Alexandrium spp. (dinophyceae) in NW Mediterranean
coastal waters. Aquatic Microbial Ecology 46 (1), 55–70.
Gomis, D., Monserrat, S., Tintore, J., 1993. Pressure-forced seiches of
large-amplitude in inlets of the Balearic Islands. Journal of Geophy-
sical Research—Oceans 98 (C8), 14437–14445.
Guillen, J., Bourrin, F., Palanques, A., de Madron, X.D., Puig, P.,
Buscail, R., 2006. Sediment dynamics during wet and dry storm events
on the Tet inner shelf (SW Gulf of Lions). Marine Geology 234 (1–4),
129–142.
Liu, P.L.F., Monserrat, S., Marcos, M., Rabinovich, A.B., 2003. Coupling
between two inlets: observation and modeling. Journal of Geophysical
Research 108 (C3).
Liu, X.D., Osher, S., Chan, T., 1994. Weighted essentially nonoscillatory
schemes. Journal of Computational Physics 115 (1), 200–212.
Monserrat, S., Ramis, C., Thorpe, A.J., 1991. Large-amplitude pressure
oscillations in the western Mediterranean. Geophysical Research
Letters 18 (2), 183–186.
Ogston, A.S., Cacchione, D.A., Sternberg, R.W., Kineke, G.C., 2000.
Observations of storm and river flood-driven sediment transport on
the northern California continental shelf. Continental Shelf Research
20 (16), 2141–2162.
Postma, H., 1961. Transport and accumulation of suspended matter in the
Dutch Wadden Sea. Netherlands Journal of Sea Research 1, 148–190.
Pritchard, D., Hogg, A.J., 2003a. Cross-shore sediment transport and the
equilibrium morphology of mudflats under tidal currents. Journal of
Geophysical Research—Oceans 108 (C10).
Pritchard, D., Hogg, A.J., 2003b. Suspended sediment transport under
seiches in circular and elliptical basins. Coastal Engineering 49 (1–2),
43–70.
Puig, P., Ogston, A.S., Guillen, J., Fain, A.M.V., Palanques, A., 2007.
Sediment transport processes from the topset to the foreset of a
crenulated clinoform (Adriatic Sea). Continental Shelf Research 27
(3–4), 452–474.
Ribbe, J., Holloway, P.E., 2001. A model of suspended sediment transport
by internal tides. Continental Shelf Research 21 (4), 395–422.
Shteinman, B., Eckert, W., Kaganowsky, S., Zohary, T., 1997. Seiche-
induced resuspension in lake kinneret: a fluorescent tracer experiment.
Water Air and Soil Pollution 99 (1–4), 123–131.
Souza, A.J., Alvarez, L.G., Dickey, T.D., 2004. Tidally induced
turbulence and suspended sediment. Geophysical Research Letters
31, L20309.
Stanev, E.V., Brink-Spalink, G., Wolff, J.O., 2007. Sediment dynamics in
tidally dominated environments controlled by transport and turbu-
lence: a case study for the east Frisian Wadden Sea. Journal of
Geophysical Research—Oceans 112, C04018.
Stansby, P.K., Awang, M.A.O., 1998. Response time analysis for
suspended sediment transport. Journal of Hydraulic Research 36 (3),
327–338.
Thorne, P.D., Hanes, D.M., 2002. A review of acoustic measurement of
small-scale sediment processes. Continental Shelf Research 22 (4),
603–632.
Tsimplis, M.N., Proctor, R., Flather, R.A., 1995. A 2-dimensional tidal
model for the Mediterranean Sea. Journal of Geophysical Research—
Oceans 100 (C8), 16223–16239.
van Straaten, L.M.J.U., Kuenen, P., 1958. Tidal action as a cause of clay
accumulation. Journal of Sedimentary Petrology 28, 406–413.
Vila, M., Giacobbe, M.G., Maso, M., Gangemi, E., Penna, A., Sampedro,
N., Azzaro, F., Camp, J., Galluzzi, L., 2005. A comparative study on
recurrent blooms of Alexandrium minutum in two Mediterranean
coastal areas. Harmful Algae 4 (4), 673–695.
Wang, X.H., Pinardi, N., 2002. Modeling the dynamics of sediment
transport and resuspension in the northern Adriatic Sea. Journal of
Geophysical Research—Oceans 107 (C12), 3225.
Wang, X.H., Pinardi, N., Malacic, V., 2007. Sediment transport and
resuspension due to combined motion of wave and current in the
northern Adriatic Sea during a Bora event in January 2001: a
numerical modelling study. Continental Shelf Research 27 (5),
613–633.
ARTICLE IN PRESSA. Jordi et al. / Continental Shelf Research 28 (2008) 505–515 515