Controls on sedimentary nitrogen isotopes along the Chile margin
Upload
independentCategory
view
4download
0
Proceedings of the Geologists’ Association 124 (2013) 484–502
Sedimentary evidence against a local ice-cap on the Shetland Isles at the LastGlacial Maximum
S.J. Carr a,*, J.F. Hiemstra b
a Centre for Micromorphology, School of Geography, Queen Mary University of London, Mile End Road, London E1 4NS, United Kingdomb Department of Geography, College of Science, Swansea University, Singleton Park, Swansea SA2 8PP, United Kingdom
A R T I C L E I N F O
Article history:
Received 28 June 2012
Received in revised form 24 October 2012
Accepted 31 October 2012
Available online 27 November 2012
Keywords:
Last Glacial Maximum
Sedimentology
Lithofacies analysis
A B S T R A C T
The Shetland Isles occupy a critical position equidistant to major ice-dispersal centres of the British-Irish
and Fennoscandian ice sheets during the last glaciation, and have long been the subject of controversy
regarding the timing, geometry and style of glaciation on the Shetland Isles. Previous reconstructions of
the last glaciation of Shetland, favour development of a local ice-cap, possibly subsequent to early
inundation by Fennoscandian ice. However, this model requires complex ice shed migrations and
dynamic changes to explain the evidence. Recent studies identify an extensive landform record of NW-
flowing ice extending across the region from the North Sea Basin, incompatible with evidence from striae
and erratic boulder transport studies. This paper presents glacigenic lithofacies descriptions and
structural (clast-fabric, shear-planes) analysis of seventeen sections from around the Shetland
archipelago. The sedimentary record of glaciation supports a model of inundation by ice from the
North Sea Basin, and includes no sediments representing multiple phases or dynamic local ice-cap
glaciation. A preliminary framework which integrates all previous datasets with the results of this study
proposes: (1) an early phase of local glaciation that was subsequently overwhelmed by extension of a
major ice stream flowing from the North Sea Basin at the LGM; and (2) absence of an extensive local ice-
cap formed over Shetland during deglaciation. This study concludes by identifying key areas that require
further investigation, most notably more detailed analysis of ice-flow indicators and sediments in the
eastern islands of Whalsay, Fetlar and Bressay, and further work to establish the temporal relationships
between glacially eroded bedrock and associated subglacial till emplacement.
� 2012 The Geologists’ Association. Published by Elsevier Ltd. All rights reserved.
Contents lists available at SciVerse ScienceDirect
Proceedings of the Geologists’ Association
jo ur n al ho m ep ag e: www .e ls evier . c om / lo cat e/p g eo la
1. Introduction
The extent, timing and dynamics of the last glaciation of theShetland Isles have been of considerable interest since the earliestspeculations of the glacial theory (Croll, 1870, 1875). Asunderstanding of the configuration of the NW European ice sheetshas increased (cf. Ehlers et al., 2011), it has become clear that theShetland Isles occupy a pivotal position for understandinginteractions between the British-Irish and Fennoscandian icesheets during the last glacial cycle (Sutherland, 1991). Further-more, the islands are located at a critical junction of the North Sea,Norwegian Sea and Atlantic Ocean, and are influenced byfluctuations in the Polar Front and North Atlantic Drift (Gordonet al., 1993), thus making Shetland climatically highly sensitive,especially to the major climatic re-organizations associated withthe onset and termination of the Last Glacial Maximum (LGM).
* Corresponding author.
E-mail address: [email protected] (S.J. Carr).
0016-7878/$ – see front matter � 2012 The Geologists’ Association. Published by Else
http://dx.doi.org/10.1016/j.pgeola.2012.10.006
During the last glacial cycle, the Shetland Isles occupied aposition approximately equidistant between major ice-dispersalareas of the Fennoscandian and British-Irish ice sheets, and therestill is controversy about whether the archipelago was inundatedby ‘Scandinavian’ ice, by ‘British’ ice, or perhaps ‘only’ experienceda local ice-cap glaciation (see Peach and Horne, 1879; Home, 1881;Chapelhow, 1965; Hoppe, 1974; Mykura, 1976; Flinn, 1978, 1983,1994; Ross et al., 1993; Ross, 1996). Many of the reconstructions ofglaciation on Shetland have been based on data obtained frommapping of striations, lineations and roches-moutonnees, andtransport of large erratic boulders (e.g. Finlay, 1926; Hoppe, 1974;Mykura, 1976; Flinn, 1977, 1992, 1994; Sutherland, 1991; Rosset al., 1993), while comparatively little attention has been paid tothe available sedimentological evidence (e.g. Ross, 1996), with thenotable exceptions of detailed descriptions of a few key sites suchas Sel Ayre and Fugla Ness (Chapelhow, 1965; Birnie et al., 1993;Hall et al., 2002).
The perceived lack of exposures through glacigenic sequences(cf. Mykura, 1976; Ross, 1996; also note the lack of glacigenicentries on the BRITICE map: Evans et al., 2005) is without questiona reason that the nature of the last glaciation on Shetland has yet to
vier Ltd. All rights reserved.

S.J. Carr, J.F. Hiemstra / Proceedings of the Geologists’ Association 124 (2013) 484–502 485
be resolved. Another reason may be that individual studies haveeither put too much weight on one type of evidence and/or haveignored conflicting lines of evidence (see discussions in e.g., Rosset al., 1993; Flinn, 2009). Ross et al. (1993, p. 9) ascribe thedifferences between reconstructions to ‘‘[...] lack of observations,
mis-interpretation of ice-directional indicators and complex changing
ice flow patterns through time’’. As such, despite several attempts(Mykura, 1976; Sutherland, 1991; Ross, 1996), it has thus farproven impossible to resolve different interpretations derivedfrom the published evidence.
This paper describes seventeen sediment exposures – distrib-uted across the archipelago (Fig. 1a) – and examines thesedimentary evidence of former glaciation of Shetland. Theseexposures were briefly noted by Hiemstra and Carr (2010) andpotentially provide critical new data informing the ongoing
Fig. 1. Location of sediment exposures across Shetland. Note that only data where clear
presented have been included. (a) Map of site locations superimposed on the NextMAP Di
sediment sections from Fugla Ness and Sel Ayre are identified by open stars. NEXTMap d
data reconstructed from small-scale erosional features and larger-scale geomorphology. (
bedrock geology map to indicate main geological units (Mykura, 1976; British Geologica
and modern sea-bed sediments mapped in the immediate offshore area around Shetla
controversy regarding the status and significance of Shetland asa possible ice-dispersal centre during the last glacial cycle. Whilethe presented data are chiefly sedimentological in nature, we areaware of the potential pitfall when it comes to interpretations of asingle type of data (see above), and therefore attempt a moreholistic approach to the reconstruction of the glaciation of Shetlandaccounting for previously published interpretations and ideas.
2. Previous research
Much of the controversy relating to the status and geometry ofthe last glaciation of Shetland stems from often contradictory linesof evidence on which reconstructions have been based (Fig. 1).Within most reported studies, there is a lack of primary datapresentation or precise location of key sites, which largely
and unambiguous location information for previously reported features has been
gital Terrain Map of the region, to provide topographic context. Previously published
igital surface model �Intermap Technologies. (b) Summary of ice-flow directional
c) Summary of reconstructed directions of boulder transport overlain on a simplified
l Survey, 1984; Johnson et al., 1993). There are only very thin patches of Quaternary
nd.

Fig. 1. (Continued )
S.J. Carr, J.F. Hiemstra / Proceedings of the Geologists’ Association 124 (2013) 484–502486
precludes any subsequent data validation of statements mention-ing boulder trains or patterns of striae.
Having noted ‘ice-worn’ rocks and glacigenic sediments on abrief visit to Shetland (Peach, 1865), Peach and Horne (1879)developed a regional model of glaciation by confluent Fennoscan-dian and British-Irish ice sheets, followed by retreat andsubsequent local glaciation by a restricted Shetland ice-cap andmountain glaciers. This early model was based on the mapping of�320 sets of striae across the archipelago, integrated withlithological analysis of till exposures and trends of erratic trains.Peach and Horne (1879) inferred ice flowing mainly from the NE(and from the SE), crossing the islands in a WSW to NW direction(Fig. 1b). Placed in the wider context, with evidence of NW flowingice over Orkney (Wilson et al., 1935) relating to a confluencebetween British and Fennoscandian ice sheets with a later local ice-cap glaciation, this model became the standard interpretation ofthe last glaciation of the Northern Isles (Sutherland, 1991; Rosset al., 1993) against which all subsequent data have beencompared. However, even at an early stage, the interpretations
of ice-flow direction made by Peach and Horne (1879) implyingFennoscandian ice incursion were vigorously criticised, withMilne-Home (1881a) for example suggesting that many of theirmapped striae in fact represented ice flowing into, rather than fromthe North Sea. However, as is clear from the ensuing debate (Milne-Home, 1881a,b; Peach and Horne, 1881a,b; Stewart, 1882), therewas considerable uncertainty and misunderstanding between thecontrasting viewpoints.
Significant revision to this reconstruction emerged from thebrief field notes of Robertson (1935) and the more extensive workof Hoppe (1974) and Flinn (1977, 1978, 1980, 1983, 1994), whocollectively recorded >1000 sets of striae and carried out further‘erratic’ mapping (see below). What is notable (Fig. 1b) is that thegeometry of these new striae are not dissimilar to those of Peachand Horne, but that the interpreted ice flow directions are verydifferent, reflecting in part the views of Milne-Home (1881a).Robertson (1935) first suggested the presence of a N–S ice divide ofa local Shetland ice-cap in the vicinity of the Weisdale andScalloway ridges of Mainland, and critically reported no evidence

Fig. 1. (Continued ).
S.J. Carr, J.F. Hiemstra / Proceedings of the Geologists’ Association 124 (2013) 484–502 487
supporting the incursion of ice from the North Sea Basin. WhilstHoppe (1974) suggested an ‘early’ W and SW flowing glacierincursion onto the eastern edge of Shetland on Bressay and theMainland near Yell Sound from the North Sea, both Hoppe (1974)and Flinn (1978) proposed that most evidence indicates a local icecap, with ice flowing ‘radially’ outwards from a linear ice divideapproximately following the spine of the archipelago. Flinn (1977),disregarding Hoppe’s (1974) suggestion of ‘early’ ice from the E,suggested that only the Dalsetter erratic (see below) provides anyevidence of W-flowing Fennoscandian glaciation of the region, butentertained the idea that this may be a remnant of a previousglaciation. As such, the idea of incursion by Fennoscandian iceduring the last glaciation was rejected, in favour of only local ice-cap glaciation.
Numerous studies have reported and attached significance tosummary data of the likely direction of travel of boulders acrossShetland (Fig. 1c). With the notable exception of the Dalsettererratic, these are not true far-travelled erratics, but reflect claststhat have crossed at least one local geological boundary. The early
work of Peach and Horne (1879) and observations by Stewart(1882) identified a generally W to NW transport of boulders acrossShetland, supporting their model of Fennoscandian glaciation(Fig. 1c). By contrast, Robertson (1935) described boulder trains ofdistinctive serpentine from small outcrops on Whalsay, indicatingNE transport. Mykura (1976), collating previous BGS reports withnew field observations, found considerable evidence of WNWtransport on Unst, as well as predominantly westward transport inthe far south of Mainland.
Support for a Scandinavian ice sheet over Shetland wasprovided by the identification of an erratic boulder of tongsbergiteat Dalsetter (HU 402161, Fig. 1c), considered to have originated inNorway (Finlay, 1926; Flinn, 1977, 1992). In addition, contrastingwith the work of Flinn (1977), Mykura (1976) also suggests thatthe northern half of Bressay was covered by ice extending from theNE (of Scandinavian origin) rather than the southwest (localorigin), due to an absence of metamorphic erratics of Mainlandprovenance. For the area of central Mainland, Mykura (1976)echoes Robertson (1935), who reports that west of the Scalloway

S.J. Carr, J.F. Hiemstra / Proceedings of the Geologists’ Association 124 (2013) 484–502488
Ridge – the main backbone of Shetland – erratic transport wasgenerally to the W or NW, while E of the ridge it seems to betowards the east. Crucially, no evidence of transport across theridge was found. Mykura (1976) could only explain this distribu-tion of boulders through a reconstruction of a small Shetland ice-cap confluent with a much larger Fennoscandian ice sheet on theEast Shetland platform. As such, lithological studies currentlyprovide an ambiguous record of former ice-flow directions duringthe last glaciation of Shetland.
Chapelhow (1965) reports sediment exposures near North Roe(NW Mainland), and Ross (1996) provides very brief descriptions ofnumerous lithofacies from across the archipelago, but otherwisethere are no published detailed studies of glacigenic sediments forthe majority of Shetland. The only detailed lithostratigraphic (andbiostratigraphic) investigations are reported by Hall et al. (1993a,b,2002) from two sites on the western coast of Mainland, from whicha combination of radiocarbon, luminescence and Uranium-seriesdating have established a chronological framework. At Fugla Ness(HU 312913, Fig. 1a), a section first described by Chapelhow (1965)preserves a lower diamicton suggested to be a till of probable MIS 6age, overlain by a peat of MIS 5e age, which in turn is overlain by abreccia suggested to be a periglacial slope deposit of MIS 5d age,and an upper diamicton interpreted to be a till of Late Devensian(MIS 2) age (Hall et al., 1993a, 2002). This upper till has a range ofclasts of local sandstone, but also comprises granites derived fromthe south and southwest, and has a strong clast-fabric indicatingice-flow towards the northwest. Elsewhere at the site, this till restson bedrock, which shows striae with a mean orientation of 2988(Hall et al., 2002). Further south, at Sel Ayre (HU 176540, Fig. 1a), asequence of sediments comprises a lower breccia of periglacialslope deposits, organic sands and gravels interpreted to be of MIS5c age, an upper breccia, proposed to indicate reversion to coldclimate conditions during MIS 5b, and finally a diamicton,interpreted as a till of MIS 2 age (Hall et al., 1993b, 2002). TheSel Ayre till comprises mainly local sandstone clasts, but has asignificant component of volcanic rock types derived from the east,and clast-fabric indicates ice-flow to the NW (Hall et al., 2002). Akey observation of this work is that there is lithostratigraphicevidence for only one phase of glaciation during the last glacialcycle, i.e. the sedimentary evidence does not reflect multiple phasesof glaciation.
Ross et al. (1993) and Ross (1996) have attempted to reconcilethe different models of the last glaciation of Shetland, with theaddition of further data on striae, erratic transport and somepreliminary lithofacies descriptions. Ross (1996) rejects the modelof confluence between British and Fennoscandian ice sheets –discounting the significance of the Dalsetter erratic – favouringinstead a local Shetland ice-cap extending onto both East and WestShetland continental shelves. In the west of Shetland, Ross (1996)reports evidence of W and NW flowing of ice during the lastglaciation, and proposes a topographically constrained deglacia-tion of the west, with considerable shifting and break-up ofindividual ice-dispersal centres. On Yell, Unst and Fetlar, Ross(1996) suggests transport of semi-pelitic gneiss to the NE on Fetlar,but W transport of meta-gabbro and sandstones nearby on thesouthern coast of Unst (Fig. 1c). To account for such variability inice-flow directions, Ross (1996) proposes a time-dependentschematic model in which a regional Shetland ice cap experiencesmajor ice shed migration during deglaciation, with complexpalimpsest ice-flow patterns reflecting temporal variation in ice-cap configuration. This is at odds with the lithostratigraphicframework proposed by Hall et al. (2002).
The most recent study of glaciation of Shetland by Golledgeet al. (2008) presents an evaluation of geomorphological mappingbased on the NEXTMap digital terrain model, with limited ground-truthing. Golledge et al. (2008) identify extensive areas of
ice-moulded topography (Fig. 1b), including 180 mega-scaleglacial lineations mapped adjacent to Bluemull Sound, stronglystreamlined terrain adjacent to Yell Sound, and more subtlystreamlined terrain in extensive areas across the archipelago. Allthese features are described as representing a consistent trendindicating ice-flow towards the WNW or NW, with localisedvariation in ice-flow in the north of Shetland. Golledge et al. (2008)suggest that the streamlining was contemporaneous, and isconsistent with a NW-flowing ice stream extending across themajority of Shetland. Golledge et al. (2008) also identify a series ofmoraine mounds and associated meltwater channels in Unstconsidered to represent a significant still-stand during ice-sheetretreat towards the SE; it is not clear whether these meltwaterchannels correspond to those reported earlier by Flinn (1983).Golledge et al. (2008) also identify a series of smaller morainemound complexes in central Mainland that are suggested torepresent restricted icefield and outlet glaciers formed during theYounger Dryas, which conforms well with the suggestion by Ross(1996) of a small glacier in the head of Burn of Mail. Golledge et al.’soverall model, which essentially returns to the idea of confluentBritish and Fennoscandian ice during the last glaciation of Shetlandwas vigorously criticised by Flinn (2009), noting that no attemptwas made to reconcile the large-scale geomorphology with theconflicting striae and boulder transport data presented by earlierresearchers (Fig. 1).
This review demonstrates that despite 150 years of study, thestatus of the last glaciation of Shetland is still unclear, such that it isnot even certain whether the region was influenced by only localice, only British-Irish and Fennoscandian ice sheets encroaching onthe region, or a combination of both models. The approach adoptedin this study assumes that developing a lithostratigraphy of the lastglaciation of Shetland can provide the necessary framework toreconcile the different, and – in some cases – apparentlyconflicting, strands of evidence. At the same time, it addressesthe conspicuous lack of sedimentological work undertaken so faron the last glaciation of Shetland.
3. Materials and methods
Sites were chosen after reconnaissance in the field, with the aimof selecting locations with a wide geographic spread across theislands. In total, seventeen sites (Fig. 1a) were selected, and locatedusing handheld GPS using the UK Ordnance Survey grid.
At each section, field description of sediments followed thelithofacies approach of Evans and Benn (2004) and Benn and Evans(2010) (see Table 1), with summary vertical profile descriptions, aswell as structural section sketches where appropriate. At suitableand accessible exposures, clast-fabric analysis was performed onthe A-axis of >30 clasts with an axial ratio of >1.5:1, with A-axislengths of 16–64 mm (cf. Carr and Goddard, 2007), primarily toestablish likely ice-flow directions, but also to examine possiblesignatures of glacigenic sedimentary processes using fabric shapediagrams where sufficient data was collected (cf. Benn, 2004).Clast-fabric data were plotted on equal-area (gaussian) stereonets,and summarised through eigenvector analysis (Mark, 1974; Evanset al., 2007). The geometry and configuration of identified shearsand other deformation structures were also recorded at each site,following the scheme of McClay (1987). For each identifiedlithofacies, the modal group of clast roundness was noted,although full clast morphological analysis is not reported in thisstudy. Many of the sections identified were located directlyoverlying bedrock, and any evidence of striations and otherpotential directional indicators (lee-side faces, shears propagatinginto the bedrock etc.) were recorded. Finally, at Sand Voe, a samplefor thin section micromorphology (cf. van der Meer and Menzies,2011) was collected using a standard Kubiena tin, and prepared

Table 1Summary lithofacies codes used in this study (after Benn and Evans, 2010).
Code Description
Diamictons Very poorly sorted admixture with wide range of grain sizes
Dmm Matrix-supported, massive
Dcm Clast-supported, massive
Dms Matrix-supported, stratified
–(s) Sheared
–(r) Evidence of re-sedimentation
Boulders Particles > 256 mm (b-axis)
BL Boulder lag or pavement
Gravels Particles of 8–256 mm
Gms Matrix-supported, massive
Gm Clast-supported, massive
Gmi Clast-supported, massive (imbricated)
Gh Horizontally bedded
Gd Deformed bedding
Granules Particles of 2–8 mm
GRmi Massive with isolated, imbricated clasts
Sands Particles of 0.063–2 mm
Sm Massive
Sh Very fine to very coarse and horizontally plane-bedded
Sp Medium to very coarse and planar cross-bedded
–(o) Rich in organic content
Silts and clays Particles of <0.063 mm
Fm(o) Massive (rich in organic content)
S.J. Carr, J.F. Hiemstra / Proceedings of the Geologists’ Association 124 (2013) 484–502 489
and described following the approach of Carr (2004) and Hiemstra(2006). Micromorphology was used here primarily to complementfield section-scale interpretations.
4. Results
The geomorphology of Shetland is influenced by the structure ofthe underlying bedrock, which has a strong north-south axis(Fig. 1a). The eastern side of the archipelago is dominated byDalradian and Moinian metamorphic and plutonic rocks (Fig. 1c),reflecting an extension of the Great Glen fault system on the
Fig. 2. Vertical profile logs of sections described from Yell and Unst. The concentration of
1. (a) Easter Loch, Uyea Sound. (b) Bay of Brough, Yell. (c) West Sandwick, Yell.
Scottish mainland (Mykura, 1976). This resulted in N–S trendingridges and valleys, reaching elevations of c. 300 m. The westernhalf of Shetland is more varied, comprising intrusive igneouscomplexes, associated metamorphic schists and gneisses, as wellas Old Red Sandstone (Mykura, 1976). The resulting topography ismore varied, with two main peninsulas, one centred on Ronas Hill(450 m), and the lower, but structurally complex Walls Peninsula.
Most sediment sections reported in this study are located on thewestern side of the archipelago, or on N–W facing coastalexposures locally in the lee of structural bedrock ridges. Typically,east- and south-facing coastlines are characterised by whalebacks,ice-scoured coastal platforms or cliffs, with very thin (<1 m) soil orsediment cover. Only at two locations (Brei Wick and Sandwick)were significant sediment sections found that faced south or east.
4.1. Unst and Yell
Three sections were identified and described from the mainnorthern islands in the Shetland archipelago. At Easter Loch, on theSE coast of Unst, a series of low (2 m) coastal sections on the shoreof Uyea Sound expose a diamicton overlying shear-deformedgreenschist bedrock (Figs. 1a and 2a). This is an area mapped byGolledge et al. (2008) to have ‘muted subglacial streamlining’(aligned approximately E–W at this location), and striae indicateice flow towards the northwest (Flinn, 1983). Rafts of greenschistpenetrate up into the diamicton, with the sense of thrust towardsthe NW. The overlying stiff diamicton has a fissile silty matrix, andcomprises predominantly local clasts up to cobble size. The fissilityhas a SE–NW orientation, and although not measured, clast-fabricappears strongly aligned parallel to this fissility. Dispersed, smallpods of sandy diamicton suggest sediment mixing.
At the Bay of Brough, Yell, a coastal section exposes up to 4 m ofdiamictons over schist bedrock (Fig. 2b). This location is within anarea interpreted by Golledge et al. (2008) of subglacial bedformsadjacent to Bluemull Sound (Fig. 1a). In places the bedrock ispolished and striated, with a mean orientation of 134–3148 (n = 7);
diamicton symbols indicates relative clast richness. Key to lithofacies codes in Table

Fig. 3. Ternary diagram representing fabric shape results from the current study,
with characteristic fabric shape envelopes for different sedimentary environments
(Benn, 1994; Benn and Evans, 1996; Evans and Hiemstra, 2005; Evans et al., 2007;
Hiemstra et al., 2009). Note that a combination of both mainly A–B plane and A axis
data is used to derive the envelopes from the studies noted, but that the data from
this study is entirely A axis data. Key: BV, Burra Voe; LM, Loch Murraster; RV, Ronas
Voe; N, The Nev; VV, Vidlin Voe; SVu/l, Sand Voe (upper/lower); BWu/l, Brae Wick
(upper/lower); B, The Bugg; SH, Sand of Hayes; SL, Stanevatstoe Loch; BB, Brough
Bay; S, Sandwick.
S.J. Carr, J.F. Hiemstra / Proceedings of the Geologists’ Association 124 (2013) 484–502490
in other places the schist bedrock is thrust into the overlyingdiamicton with a sense of thrust towards the NW. The overlyingfacies comprise a clast-supported diamicton dominated by angularclasts of local schist, grading upwards into an up to 2.5 m-thick,stiff, matrix-supported diamicton. This upper diamicton is olive-brown to grey, with a fissile sandy matrix apparently derived fromthe underlying bedrock. Sub-rounded and sub-angular clasts up tocobble size are common, and many are faceted and striated. Clastfabric data (Figs. 2b and 3 and Table 2) are almost uniformlydistributed with two indistinct modes at 2208 and 1608 and an S1eigenvalue of 0.493.
A roadside quarry on the A968 near West Sandwick on Yellpreserves diamicton and gravel lithofacies overlying gneissbedrock (Figs. 1a and 2c). This site is located within strongly
Table 2Summary structural measurements from the Shetland Isles. Eigenvector and eigenvalues
elongation indices are key components of fabric shape (Benn, 2004) presented in Fig.
indication is provided, with the main mode italicised.
Site V1 Multiple modes S1
Brae Wick (lower) 18/1418 – 0.71
Brae Wick (upper) 09/3128 10/3108 0.64
10/1408Brough Bay 18/2178 – 0.493
Burra Voe 19/3428 – 0.478
Loch Murraster 01/3038 – 0.492
Ronas Voe 07/017 – 0.54
Sand Voe (lower) 25/188 – 0.626
Sand Voe (upper) 15/166 10/1708 0.858
05/3408Sand of Hayes 11/044 0.609
Sandwick 10/005 – 0.449
Stanevatstoe Loch 07/219 15/2408 0.526
20/0408The Bugg 07/088 10/0908 0.62
10/2708The Nev 03/187 10/1808 0.553
05/0208Vidlin Voe 02/187 10/1908 0.621
20/0408
streamlined terrain identified by Golledge et al. (2008) andassociated with suggested channelling of ice NNW through YellSound. Overlying almost vertically foliated gneiss, a thin, stiffolive-grey matrix-supported diamicton, with cobble lags near thebase and at the top of the unit, is observed. Unlike other locations,there is no evidence of deformation or comminution of the bedrocksurface, nor are polishing or striae evident. The lower diamictonfacies displays fissility within the sandy matrix, which generallydips towards the east. The upper part of the section, overlying aprominent cobble lag, comprises a mixture of sands, gravels, peatand normally consolidated diamictons, many of which containorganic matter.
4.2. Northwest Mainland
This area of Shetland contains key sediment sections, notablythe multiple tills and peats at Fugla Ness (Hall et al., 2002), and tillsections near North Roe (Chapelhow, 1965). Four sections from thisarea were described in detail (Figs. 1a and 4). At Sand Voe (Figs. 4aand 5), a coastal section adjacent to the North Roe cemetery, brieflydescribed by Chapelhow (1965), is located within a belt of stronglystreamlined terrain (Golledge et al., 2008) aligned to the NNW. Thesection comprises an up to 3-m-thick lower light olive-grey stiffdiamicton, which corresponds to the ‘eastern grey clay’ ofChapelhow (1965) and that has a decreasing-upwards contentof mixed-lithology clasts. Some clasts are striated and faceted.Although mainly massive, the upper 50 cm of the lower diamictondisplays low-angle conjugate shears (Fig. 5a). These shears are alsodistinctive in thin section, and define augen-shaped lenses ofdiamictons and fine grained sorted sediments (Fig. 5b), with well-developed plasmic fabrics associated with both planar androtational shear (Fig. 5c). Evidently the upper part of this diamictonhas experienced significant simple shear subsequent to or duringdeposition. Clast fabrics in the lower diamicton (Table 2 and Figs. 3and 4a) show a well-defined cluster indicating southerly dips, withan S1 eigenvalue of 0.626. There is a sharp, undulating contact withan up to 1 m thick melange of poorly sorted coarse gravels anddiamictons, both in continuous beds and discontinuous augen-shaped lenses (Fig. 5a). This melange is capped by a thin,continuous but irregular bed of relatively well-sorted mediumsand, which is in turn overlain by an approximately 1 m thickupper diamicton, with a sharp, horizontal basal contact. The upperdiamicton at Sand Voe is massive and matrix-supported, pale olive
are given for the clast fabric data collected, and mean vector given. The isotropy and
3. Where there are clear multiple modes of clast fabric within a sample, a visual
S2 S3 Isotropy S3/S1 Elongation 1 � (S2/S1)
0.175 0.115 0.162 0.754
0.225 0.135 0.211 0.648
0.333 0.173 0.351 0.325
0.37 0.153 0.32 0.226
0.366 0.142 0.289 0.256
0.354 0.105 0.194 0.344
0.244 0.130 0.208 0.61
0.09 0.053 0.062 0.895
0.239 0.152 0.249 0.608
0.314 0.236 0.526 0.301
0.261 0.213 0.405 0.595
0.224 0.156 0.252 0.639
0.343 0.104 0.189 0.38
0.253 0.126 0.203 0.593

Fig. 4. Vertical profile logs of sections described in the NW Mainland. The concentration of diamicton symbols indicates relative clast richness. Key to lithofacies codes in Table
1. (a) Sand Voe; (b) Burra Voe; (c) Ronas Voe; (d) Brae Wick.
S.J. Carr, J.F. Hiemstra / Proceedings of the Geologists’ Association 124 (2013) 484–502 491
to pale yellow, stiff, clast-rich (mixed lithologies) with many clastsadorned with striae. Clasts are up to cobble and boulder size, andare generally sub-rounded. Clast fabrics (Table 2 and Figs. 3 and 4a)show very strong unimodal clustering at 1668 (S1 eigenvalue0.858). The top part of this diamicton has been modified bypedogenesis, and subsequently buried by a horizontally stratifiedto massive fine- to medium-sand, containing organic matter, inwhich the modern soil is developed.
On the northern side of Burra Voe, a coastal section identifiesdiamictons overlying deformed meta-gneiss/schist bedrock(Figs. 1a and 4b). This bedrock has a near-vertical foliatedstructure which has been overturned at its upper surface towardsthe NW. Thrust planes, defining and delineating rafts of deformed
bedrock, show easterly dips. The top of the bedrock is crushed, andgrades into a clast-supported massive diamicton which iscomposed entirely of the local bedrock, and is up to 50 cm inthickness. There is a sharp, undulating contact between thediamictons, occasionally with pods of massive gravels at thiscontact. The upper diamicton is massive and matrix-supported,although the lithofacies is clast-rich, and locally becomes almostclast-supported. There is a mix of local and exotic lithologies, withthe lower part of the lithofacies dominated by local, angular clasts,typically with steep dips and apparently inherited from theunderlying bedrock, and the upper part having more sub-roundedlocal and exotic lithologies with shallower dips. Many of theseclasts are striated. Clast fabrics (Figs. 3 and 4b and Table 2) describe

Fig. 5. (a) Section at Sand Voe, NW Mainland, showing the two main diamicton units
separated by a melange of sands, gravels and diamictons. Note the location of the
thin section sample, (b) annotated thin section from the contact between the lower
Dmm and melange, Sand Voe: at both macroscopic and microscopic scales it is
evident that extensive reworking of the upper surface of the lower diamict has
occurred after initial deposition, probably during emplacement of the upper
S.J. Carr, J.F. Hiemstra / Proceedings of the Geologists’ Association 124 (2013) 484–502492
a weak (S1 = 0.478) girdle fabric orientated towards the NW;however, the position of sampling may have resulted in inheri-tance of fabric properties from the underlying bedrock (cf. Phillipsand Auton, 2008).
Along the south shore of Ronas Voe, numerous small andshallow coastal and road-cut sections reveal diamictonsoverlying deformed bedrock (Figs. 1a and 4c). The local RonasHill granite is comminuted and sheared with a sense of shearfrom the SE, overlain by a red, clast-supported massivediamicton which reflects further comminution of the bedrock.There is an irregular, sharp contact with the overlying clast-rich,massive, matrix-supported diamicton. This diamicton is olivegrey, and contains a mixture of lithologies, dominated by localgranites and granophyres, but with exotic lithologies includingschists and other metamorphic rocks found to the east. Clast-fabric analysis (Figs. 3 and 4c and Table 2) identifies a weak(S1 = 0.540) girdle oriented predominantly just east of north,parallel to the local valley slope, suggesting that this sedimentmay have been reworked through local mass-movement. This issupported by weathered clasts and clay skins observed aroundmany clasts during fabric measurement. A melange of gravelsand diamictons caps the sections, and probably reflects valley-side slope movement.
The bay of Brae Wick, Esha Ness (Fig. 1a), reveals up to 8 m thicksections of sediment exposures, in an area of subtly streamlinedtopography suggesting ice flow towards the WNW (Golledge et al.,2008); this is in agreement with mapped striae suggesting a NWice-flow direction (Flinn, 1983). The thickest sediment sectionshost an Arctic Tern colony, making field observation and samplingproblematic. At the western end of the bay, a 3.5 m exposureresting on local sandstone bedrock was described (Fig. 4d). Theupper, undulating surface of the sandstone bedrock is fractured,and overlain by up to 1 m of clast-supported massive diamicton,composed entirely of very-angular and angular fractured sand-stone clasts. Distinct conjugate shears define lenses and augenforms throughout this lithofacies. There is a sharp, inclined contactwith the overlying facies, which comprises a stiff olive-brownclast-poor matrix-supported massive diamicton up to 50 cm thick.Clasts are mainly sub-rounded, of pebble to cobble size, of mixedlithologies, and many possess striations. Clast fabrics (Figs. 3 and4d and Table 2) show a strong cluster (S1 = 0.710), with clastsdipping towards 1418. A cobble and boulder layer marks thecontact with the overlying brown, matrix-supported, massivediamicton that is up to 1 m thick. By contrast with the underlyinglithofacies, this diamicton is more clast-rich, but dominated bysub-rounded granules to pebbles of mixed, often non-locallithologies. Clast fabrics (Figs. 3 and 4d and Table 2) are slightlyweaker (S1 = 0.64) than those of the lower diamicton, and show abimodal distribution with clusters at 1508 and 3128. A sharp,inclined upper contact defines the boundary with a clast-rich,matrix-supported massive diamicton, containing small lenses ofgravel. A network of conjugate shears can be traced throughoutthis unit that defines numerous augen forms (Fig. 6a), oftenforming around distinctive core-stones, some of which have beenfractured (Fig. 6b). Overlying the diamicton lithofacies at BraeWick is an organic-rich fine sand, horizontally bedded and massivefine sands, capped with the modern soil.
diamicton, suggesting two distinct phases of glaciation at this site, (c)
photomicrograph of augen shaped diamicton intraclast, location shown in (b)
(cross-polarised light, horizontal field of view 5.3 mm: location illustrated in (b)).
Note the very strong plasmic fabric development both within (skelsepic plasmic
fabric indicative of rotational deformation) and on the contact of the augen shaped
diamicton intraclast (masepic and unistrial plasmic fabric indicative of pervasive
and discrete planar shear respectively) indicating that the intraclast has been
formed through shearing.

Fig. 6. (a) Augen feature with a distinctive core-stone, Brae Wick, NW Mainland. The augen form is defined by lines of clasts and fissility in the matrix c: fractured basic igneous
clast forming a core of an augen feature, Brae Wick, NW Mainland.
S.J. Carr, J.F. Hiemstra / Proceedings of the Geologists’ Association 124 (2013) 484–502 493
4.3. Walls Peninsula
Arguably the best exposures of Quaternary sediments onShetland are located around the Walls Peninsula on the west ofMainland. In addition to the sequence at Sel Ayre (Hall et al., 1993,2002), four new sites have been described (Figs. 1a and 7). At theCrook, near Sandness, up to 9 m of deformed bedrock and twooverlying diamictons are exposed (Fig. 7a). The sandstone bedrockand the overlying clast-supported diamicton facies dominate thesection, with shears originating in the bedrock propagating into thelower diamicton, with a consistent sense of shear from SE–NW. Thelower diamicton comprises angular and sub-angular sandstoneclasts, and appears to be the product of comminution and sheardeformation of the underlying bedrock. A sharp, inclined contactexists between the lower and upper diamictons at the site. Theupper diamicton is olive-brown, matrix-supported and massive,and has distinct inclined cobble layers and shears throughout,although it was not possible to access the sediment closely tomeasure these due to the presence of nesting Arctic Terns.
A roadside quarry at Stanevatstoe Loch exposes up to 2.5 m of adark yellow-brown sandy matrix-supported, but clast-rich massivediamicton, with occasional pods of clast-supported diamicton(Figs. 1a and 7b). Clasts are sub-angular to sub-rounded, up toboulder size, comprising local sandstones and metamorphics, some(�5%) with striae. Numerous sandstone clasts display in situfracturing, with some evidence of subsequent dislocation offragments due to shearing. A Clast-fabric (Figs. 3 and 7b and Table2) displays relatively weak (S1 = 0.526) clustering to the south-southwest. Overlying this facies, with a sharp, but conformablecontact, up to 60 cm of stratified orange-brown gravels are present.The upper 30 cm of this facies displays involuted structures, perhapsindicative of cryoturbation. A thin peat soil caps the section.
An exposure behind the roads depot adjacent to Loch Murrasterpreserves up to 8 m of olive grey stiff matrix-supported diamicton,with a fissile structure caused by SE-dipping shears (Fig. 7c). Bycomparison with other sites on the Walls Peninsula, this diamictonis clast-poor, but those present are often striated, and comprise arange of lithologies including limestone and granite, which are
only found to the east (Fig. 1c), as well as local sandstones, schistand gneiss. Clast fabric distribution (Figs. 3 and 7c and Table 2)presents a weak (S1 = 0.492) girdle, although it was noted duringdata collection that coarser clasts (32–64 mm) dipped preferen-tially towards SE, and that rod-shaped clasts tended to dip to theW, implying a more complex fabric signature than the data wouldsuggest (cf. Carr and Rose, 2003; Carr and Goddard, 2007).
Perhaps the most dramatic new section is that exposed in coastalbluffs at The Nev, immediately below the A971 west of Tresta(Figs. 1a and 7d). The base of the section comprises deformed andfractured sandstone/greywacke bedrock, in which augen-shapedrafts of competent bedrock are bounded by shears within morefriable parts of the bedrock. A discrete shear zone dipping SE can betraced across much of the section, from which a series ofanastomosing and sigmoidal shears propagate (Fig. 8a). The topsurface of the bedrock is truncated, forming an undulatingdecollement surface from which listric reverse faults propagateinto the overlying diamicton with a range of orientations (Fig. 8b).The overlying sediment facies comprise 2–4 m of two olive brownmatrix-supported stiff diamictons, both relatively rich in predomi-nantly sub-angular to sub-rounded clasts, many of which are facetedand striated. The matrix of both units consists of medium sand. Bothdiamictons are generally massive in nature, although isolated shearsare found (Figs. 6d and 8), as is a raft of yellowish brown clast-richpebble diamicton and smaller lenses of gravel, inclined at a similarangle to the dip of shears in the surrounding diamicton. Clast fabricsfrom the upper diamicton (Figs. 3 and 7d and Table 2) indicate amoderate strength (S1 = 0.620) girdle/cluster centred at 1878.Capping the sequence, an apparently normally consolidated,clast-rich but matrix-supported diamicton comprising angular tovery-angular clasts merges with the modern soil.
4.4. East Mainland and Whalsay
Few exposures have been reported from the eastern side of theShetland archipelago. There is, however, a detailed record of striae(Peach and Horne, 1879; Hoppe, 1974; Flinn, 1978, 1980, 1983)with conflicting inferred ice flow directions (Fig. 1b). Mykura

Fig. 7. Vertical profile logs of sections described from the Walls Peninsular. The concentration of diamicton symbols indicates relative clast richness. Key to lithofacies codes in
Table 1. (a) The Crook, Sandness; (b) Stanevatstoe Loch; (c) Loch Murraster; and (d) The Nev.
S.J. Carr, J.F. Hiemstra / Proceedings of the Geologists’ Association 124 (2013) 484–502494
(1976) also reports that transport of erratics on Whalsay, includingdistinctive boulder trains of serpentine (serpentinite), suggest iceflowing to the east or north-east (Fig. 1c). As such, this area iscritical for testing the local ice cap and ice sheet models, as ice-flowdirections from the different models should contrast significantly.
Two sections were described on Whalsay, and one at the head ofVidlin Voe on Mainland. At The Bugg, near Challister on the NWcoast of Whalsay, numerous low exposures overlie an irregulargneiss/schist bedrock surface (Figs. 1a and 9a). The bedrock surfaceis typically comminuted, and grades into a clast-supporteddiamicton in the lee of bedrock steps (Fig. 10), which are suggested
here to be buried lee-side faces indicating ice-flow towards N orNW. This diamicton comprises angular to very angular clasts ofgneiss and schist, although clasts become more sub-angulartowards the top of the facies. This deposit contains shears inclinedto the NNW, some of which propagate into the overlying facies,dragging wedges of the lower diamicton into the upper, withdetachment and formation of intraclasts (Fig. 10). The dominantfacies at The Bugg is a reddish-brown, clast-rich, massive, matrix-supported diamicton, comprising gravel-sized angular and sub-angular clasts of mainly local origin, with an exotic component ofgranites and spilite. This exotic component is significant, as the

Fig. 8. Sections at The Nev, Walls Peninsula. (a) Photograph of deformed bedrock; note the distinct shears within the sandstone/greywacke bedrock, which has been
disaggregated into augen-shaped blocks. Clear and annotated images provided for clarity. (b) Site sketch of the geometry and relationships between lithofacies at The Nev.
There is a distinct decollement along the contact between the deformed bedrock and the overlying sediments.
S.J. Carr, J.F. Hiemstra / Proceedings of the Geologists’ Association 124 (2013) 484–502 495
closest known outcrops of both lithologies are on the small islands(‘skerries’) to the SE, or the larger Out Skerries NE of Whalsay(Fig. 1c). Clast-fabric analysis of the upper diamicton (Figs. 3 and 9aand Table 2) identifies a strong E–W component, with eigenvectoranalysis suggesting moderate clustering (S1 = 0.620).
At Sandwick, in the SW of Whalsay, diamictons overlie schistbedrock (Figs. 1a and 9b). The bedrock has an irregular andhighly fractured surface, and a distinctive splay-and-mergeshear structure extends from the bedrock into the overlyingsediments (Fig. 11) with a sense of shear from the S or SE.Overlying this, a clast-supported diamicton is found in depres-sions within the bedrock surface, comprising angular to very-angular clasts of up to cobble size, with clasts apparently
Fig. 9. Vertical profile logs of sections from the east of Shetland and Whalsay island. The co
codes in Table 1. (a) The Bugg, Whalsay. (b) Sandwick, Whalsay. (c) Vidlin Voe, Mainla
derived by comminution of the underlying bedrock. A sharp,irregular contact exists between this and a stiff, brown, clast-rich, matrix-supported diamicton. This facies comprises bothlocal and farther-travelled lithologies, and is dominated by sub-angular pebbles, with common in situ fractured and sheared outclasts. Clast-fabric analysis (Figs. 3 and 9b and Table 2) shows arather isotropic signature (S1 = 0.449). A cobble lag at the top ofthis diamicton extends across the whole section, and is overlainby up to 1.5 m of two diamicton units that are texturally similarto the underlying facies, but are apparently normally consoli-dated and heavily involuted. Numerous small vesicles presentwithin the matrix of both units seem to indicate dewatering andre-mobilisation of sediment.
ncentration of diamicton symbols indicates relative clast richness. Key to lithofacies
nd.

Fig. 10. Geometry of sediment facies and relationship to bedrock at the Bugg,
Whalsay. (a) Photograph of a typical exposure, showing the often graded contact
between the gneiss bedrock and the overlying clast-supported diamicton, which is
typically only preserved in isolated patches in the lee of bedrock steps. (b) Field
sketch of overall geometry of units. The orientation of the buried lee-side faces
differs considerably from the bedrock structure, suggesting they are true glacial
erosional forms rather than structural remnants.
S.J. Carr, J.F. Hiemstra / Proceedings of the Geologists’ Association 124 (2013) 484–502496
A section on the eastern side of Vidlin Voe exposes up to 4 m ofsediment, with no visible contact with local bedrock (Figs. 1a and9c). The bulk of the exposure is a stiff, light olive-brown to greymatrix-supported diamicton, with mainly sub-rounded clastscomprising a range of lithologies. The medium sand matrixdisplays fissility dipping towards the SE, and clast fabric (Figs. 3and 9c and Table 2) has a shallow dipping N–S component, with aprincipal eigenvector azimuth at 1878. An irregular, sharp,
Fig. 11. Photograph of splay-and-merge shear structure fracturing the local bedrock
and propagating into the overlying clast supported diamicton.
continuous contact separates this diamicton from the overlyingreddish-brown, normally consolidated, massive, clast-supporteddiamicton, containing mainly angular clasts of local schist andgneiss lithologies. The bottom parts of this unit fine upwards into amatrix-supported diamicton, which in turn grades into a clast-poor fine sandy diamicton in which the modern soil is developed.
4.5. South Mainland
The southern mainland of Shetland is dominated by sea cliffs onboth east and west coasts, and as such, only three small exposureswere identified. A tongsbergite boulder at Dalsetter (Fig. 1c) haslong been proposed as the only reliable evidence of encroachmentof Fennoscandian ice over Shetland (e.g. Finlay, 1926; Flinn, 1992),although the in situ nature of the boulder has frequently beenquestioned due to its position at the base of a field boundary wall.Although the Lateglacial and postglacial relative sea level history ispoorly known for Shetland, evidence of high relative sea levelstands from NW Scotland (Shennan et al., 2005) mean that it ispossible that, at 38 m OD, the Dalsetter erratic may be located closeto the local marine limit on Shetland, and therefore a glacimarineorigin for the boulder cannot be rejected. However, Mykura (1976,p. 107) also suggests ‘‘east to west transport of erratics’’ across thearea which would be consistent with ice flowing onto Shetlandfrom the North Sea. As such, this is a key region for testing theevidence of glaciers extending on to the islands from the North SeaBasin.
At the northern end of Brei Wick, Lerwick, up to 6 m ofsediments overlying abraded and polished sandstone bedrock areexposed (Figs. 1a, 12a and 13); 300 m south-west of the exposure,striated bedrock was observed, trending 150–3308 (n = 10). Stoss-and-lee forms suggest ice-flow towards the NW. The base of thesequence at Brei Wick comprises an olive-brown, clast-poor,apparently sheared, matrix-supported diamicton. Clasts of up tocobble size range from angular to sub-rounded, and many arestriated, whilst the matrix is of medium sand. Shears observedthroughout this facies dip towards the SE. There is a clear butdiffuse boundary with the overlying unit, which is a stiff grey-bluematrix-supported diamicton with a silty–clay matrix displayingfewer shears than the underlying unit, although those seen also diptowards the SE. Clasts are sub-angular to sub-rounded, withfrequent striations. A sharp upper contact is marked by a thin,inclined sub-angular to angular cobble and pebble bed, occasion-ally suggesting imbrication (towards North), extending across theexposure. Overlying this is a stiff reddish-brown, clast-rich,matrix-supported diamicton, with much coarser striated cobblesand boulders set in a sandy matrix.
At Quendale Bay, near Sumburgh Head (Fig. 1a), exposures upto 3 m in height rest on sandstone cliffs. Limited access to theexposures precludes detailed investigation, but the sequencecomprises a clast-supported diamicton with angular sandstoneclasts, overlain by a brown clast-rich albeit matrix-supporteddiamicton, with a sandy matrix and sub-angular clasts of mixedlithologies (Fig. 12b). The sequence is capped by 0.5 m of finesand, which develops into a modern coastal dune sequence seenwithin the main part of the bay. Closer investigation of a similarbut smaller exposure is possible nearby at Sand of Hayes(Figs. 1a and 12c). Here, comminuted sandstone bedrock isoverlain by up to 0.5 m of clast-supported diamicton, compris-ing angular and very-angular sandstone clasts. Clast fabric wasnot measured in this unit, but a preferred orientation W of N isvisually apparent. A boulder layer marks the contact with theoverlying unit, which is a stiff yellowish-brown matrix-supported diamicton. Clasts comprise granites and sandstone,and are generally sub-rounded, or (sub)angular, many display-ing striations and faceting. The diamicton preserves shear

Fig. 12. Vertical profile logs of sections described from the south Mainland of Shetland. The concentration of diamicton symbols indicates relative clast richness. Key to
lithofacies codes in Table 1. (a) Quendale Bay. (b) Sand of Hayes and (c) Brei Wick.
S.J. Carr, J.F. Hiemstra / Proceedings of the Geologists’ Association 124 (2013) 484–502 497
structures throughout the unit, dipping towards the SE. Clast-fabric indicates a SW-NE trend, confirmed by eigenvectoranalysis in the form of a moderate strength (S1 = 0.609) cluster(Fig. 3). Evidence for syn-depositional sediment re-working is
Fig. 13. Photograph of the sediment sequence at Brei Wick, Lerwick. Note the distinctive
Although not studied in detail within this research, as with Sand Voe, this section prese
recent glaciation of Shetland.
supported by sand and gravel intraclasts throughout this unit.This diamicton is capped by a boulder layer, in turn overlain by ahighly sorted fine sand within which the modern soil hasdeveloped.
matrix-supported diamicton facies separated by a unit of partly imbricated gravels.
nts the only sedimentary evidence for potentially more than one phase of the most

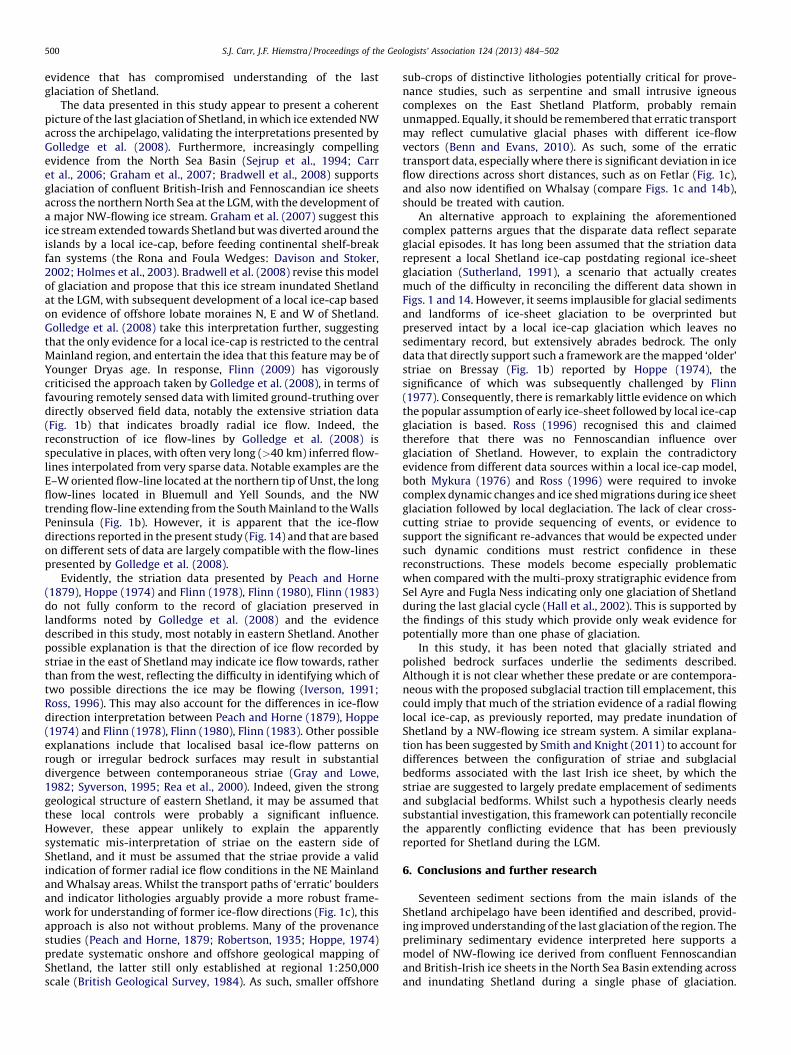
Fig. 14. Summary of directional evidence (shears, striations, till fabrics, indicator lithologies) for former ice-flow directions observed in the present study. (a) Stereoplot
summarising directional data obtained from clast-fabrics and measurements of shear planes, lee-side faces and striations reported in this study. Note the dominance of
indicators for ice-flow towards the NW. Only fabrics with distinctive modes and S1 eigenvalues > 0.500 have been represented. (b) Suggested ice-flow directions based on the
data described in this study; precise locations of some arrows have been shifted slightly to accommodate multiple directional indicators at the same site.
S.J. Carr, J.F. Hiemstra / Proceedings of the Geologists’ Association 124 (2013) 484–502498
5. Discussion
5.1. Sedimentology and lithostratigraphy
Despite the wide geographic spread of sites across the Shetlandarchipelago, there is considerable consistency between thedescribed sediments as presented above. These sediments canbeen grouped and classified into lithofacies associations (LFAs),reflecting units that could be classified as potentially mappableformations (Evans and Benn, 2004). From these a basic lithostrati-graphic framework and model of the nature and dynamics ofglaciation can be derived.
5.1.1. Lithofacies association 1: subglacial traction till overlying
abraded or deformed bedrock and glacitectonite
LFA1 is recorded at least partially at all sites, comprising theabraded or shear-deformed upper surface of local bedrock (whenvisible) overlain by a clast-supported diamicton facies, in turnoverlain by a matrix-supported diamicton facies.
Exposed bedrock surfaces frequently display striae and othersmall-scale erosional features such as lee-side faces, or larger-scaleevidence of deformation through thrusting and lateral shear to
produce thrust wedges and rafts. Commonly, the transition zonebetween the bedrock and the overlying sediments comprises aclast-rich diamicton composed of angular to very-angular commi-nuted local bedrock, and frequently displays a continuation ofshear structures that are rooted in the underlying bedrock.Measurement of shear and thrust planes indicate a consistentpattern of shear towards the northwest (Fig. 14). Typically thesedeformations reflect a lateral compressive stress field (McCarrolland Rijsdijk, 2003).
The dominant lithofacies within LFA1 is a stiff, matrix-supporteddiamicton comprising sub-angular to sub-rounded clasts of localand non-local lithologies, often displaying striae and faceting.Where it has been possible to identify non-local lithologies with aspecific provenance (The Bugg, Ronas Voe, Loch Murraster), thesereflect transport from the E or SE. Sometimes (e.g. The Crook, EasterLoch, Brough Bay), this lithofacies displays shear structuresindicating shear from the SE, and occasional clast pavements orboulder layers (e.g. Sand of Hayes, Brae Wick, West Sandwick). Theonly exception to this configuration is found at The Bugg, whereshears within both the clast- and matrix-supported diamictons diptowards the NNW. However, as Fig. 10 illustrates, the geometry andsense of shear indicate extensional deformation in the lee of the

S.J. Carr, J.F. Hiemstra / Proceedings of the Geologists’ Association 124 (2013) 484–502 499
bedrock steps that characterise the site and thus indicate shear fromthe SE. Clast-fabric data from this lithofacies is variable, but tendstowards clustered fabrics typical of the subglacial till or lodged clastenvelopes in terms of fabric shape (Fig. 3), although there aresignificant deviations from this pattern, discussed below.
The lithofacies sequence of LFA1 is interpreted to represent avertical grading from Type B to Type A bedrock glacitectonites andthen into a subglacial traction till, following the scheme of Evanset al. (2006) and Hiemstra et al. (2007). The sediments haveundergone active transport as a subglacial sediment layer,resulting in significant comminution, abrasion (striation andfaceting) in a high stress, generally uni-directional shear zone.The deformation structures evident within LFA1 are compatiblewith a progressive shift from proglacial compression to subglacialextension through simple shear (Hart and Boulton, 1991; McCar-roll and Rijsdijk, 2003). In this instance it is suggested that theclast-supported diamicton and deformed bedrock represents anon-dilatant layer of local substrate material undergoing solid-state deformation (comminution), whilst the overlying matrix-supported diamicton indicates more fluid deformation withsignificant sediment mixing and incorporation of non-localsediment components.
5.1.2. Lithofacies association 2: periglacially and paraglacially
modified sediments
LFA2 is recorded at many sites, overlying LFA1 typically as aclast-rich matrix-supported diamicton comprising mainly angularclasts, or as a melange of diamictons and gravels, although it wasnot studied in detail at any site. These sediments are sometimescontorted and contain involutions (Stanevatstoe Loch, Sandwick),and structures are aligned parallel to local topographic slope(Ronas Voe), strongly implying a gravitational flow origin. Thesesediments are normally consolidated, and sometimes alsoincorporate organic matter (West Sandwick, Vidlin Voe). Thereis typically a sharp contact between LFA1 and LFA2, sometimesmarked by prominent boulder or cobble layers (Sandwick, VidlinVoe), indicating a break in deposition, or truncation of LFA1 duringthe emplacement of LFA2. These sediment facies indicate partialreworking of LFA1 under conditions of mechanical weathering,including frost-shattering of clasts, with a strong and consistentsignature of downslope direction of transport consistent. LFA2 istentatively interpreted as representing paraglacial modification ofLFA1, with some downslope transport, although further analysis isrequired to add detail to this preliminary interpretation.
5.1.3. Lithostratigraphy and ice-flow directional indicators
Based on the data described here, a simple lithostratigraphydescribing the last glaciation of Shetland can be derived. It isimmediately evident that the majority of the sedimentologicalevidence supports just one ice flow phase, recorded by LFA1,followed by ice-free conditions (cold climate?) under whichperiglacial/paraglacial modification of the landscape occurred,recorded in LFA2. This simple sediment succession is supported bya deformation history that points to one phase of sedimentdeformation, rather than complex overprinting of polyphasedeformation styles more indicative of changing styles anddynamics of glaciation (Phillips et al., 2011).
Only at Sand Voe and Brei Wick (see Fig. 1), does thelithostratigraphic evidence support two separate phases ofglaciation. At both locations, two stiff diamictons containingstriated and faceted clasts (interpreted as subglacial traction tills)are separated by gravels and gravelly diamictons. At bothsites ‘upper’ and ‘lower’ diamictons display different texturalproperties, most notably matrix texture and colour, as well asdifferent clast densities, and as such are interpreted to reflectseparate events, but, it is argued here, not from different glaciations
(cf. Hall et al., 1993a, 2002). The upper and lower diamictons at BreiWick are separated by a 50 cm thick partly imbricated gravel andpebble unit (Fig. 12c), which appears to represent a glacifluvialdeposit. However, further analysis of this section is required tovalidate this preliminary interpretation. At Sand Voe more detailedinvestigation of the sequence (Figs. 4a and 5) is possible. Clast-fabric and orientation of shear planes (Fig. 4a) in both diamictonsare similar, indicating ice-flow to the N, seemingly channelledalong the axis of the valley during both phases of glaciation. Themelange of poorly sorted sands, gravels and pods of gravellydiamictons, with occasional weak imbrication is characteristic ofproximal glacifluvial and ice-marginal sediment-flow deposits,implying ice-free conditions at this location at this time. However,it is clear that this melange and the top surface of the lowerdiamicton have been subsequently tectonised, most likely duringthe emplacement of the upper diamicton, resulting in inclinedunits and augen forms, and conjugate shear sets penetrating intothe lower diamicton. Although laterally continuous across thesection described (40 m), and visible in other smaller sections atthe site, it is not clear whether this relatively thin melange is acontinuous stratigraphic unit, or if it represents sediment that hasbeen rafted into a single subglacial till body. Therefore, while thesection at Sand Voe provides the best evidence for ice retreat andre-advance during the last glaciation on Shetland, the restrictedscale and lack of similar evidence elsewhere (for example at BurraVoe, �1 km away) implies this was a very local ice-marginfluctuation and probably of limited stratigraphic significance.
Clast-fabric data have been collected in this study primarily toinfer former ice-flow directions within LFA1, but also to getindications of possible till-forming processes. It is apparent thatthere are significant variations in till-fabric shape (Fig. 3), some ofwhich (Sandwick, Ronas Voe, Stanevatstoe Loch) may reflect post-depositional paraglacial and periglacial modification. Also, asnoted at Loch Murraster, individual clast-fabric components seemto vary as a consequence of size and shape, indicating a morecomplex interaction between ice-flow direction and fabricdevelopment (cf., Bennett et al., 1999; Carr and Rose, 2003; Carrand Goddard, 2007). However, when all directional data obtainedwithin this study are compiled (Fig. 14), there is a distinctivepreferred SE-NW trend in the data, irrespective of site location.Finally, the overall distribution of sediments reported within thisstudy favours preservation of sediment sequences on W and Nfacing coastlines, whereas sites facing E and S tend to compriseabraded bedrock and a generally thin sediment cover. As such, it issuggested that the Shetland archipelago as a whole reflects a large-scale ‘crag-and-tail’ form, with net sediment erosion on the stoss (Eand SE) side and net sediment accumulation on the lee (W and NW)side, thus indicating NW sediment transport. It is perhapssurprising in this context that none of the recorded sites preservesevidence of reworking and incorporation of marine sediments (e.g.significant clay content, presence of marine microfossils) from theNorth Sea Basin into the matrix-supported till facies of LFA1,echoing the observations of Sutherland (1991) and Ross et al.(1993). Further work is required to explain this unexpectedfinding.
5.2. Wider implications
Existing reconstructions of the last glaciation of Shetland areconstrained mainly by mapped striae (Hoppe, 1974; Mykura,1976; Flinn, 1978), interpretation of high-resolution digital terraindata (Golledge et al., 2008; Fig. 1b), and ‘erratic’ provenance studies(Peach and Horne, 1879; Robertson, 1935; Mykura, 1976; Fig. 1c).The new data presented in this study must be explicitly placed inthis wider context, and thus address the valid criticisms made byFlinn (2009) about the selective use of previously published
S.J. Carr, J.F. Hiemstra / Proceedings of the Geologists’ Association 124 (2013) 484–502500
evidence that has compromised understanding of the lastglaciation of Shetland.
The data presented in this study appear to present a coherentpicture of the last glaciation of Shetland, in which ice extended NWacross the archipelago, validating the interpretations presented byGolledge et al. (2008). Furthermore, increasingly compellingevidence from the North Sea Basin (Sejrup et al., 1994; Carret al., 2006; Graham et al., 2007; Bradwell et al., 2008) supportsglaciation of confluent British-Irish and Fennoscandian ice sheetsacross the northern North Sea at the LGM, with the development ofa major NW-flowing ice stream. Graham et al. (2007) suggest thisice stream extended towards Shetland but was diverted around theislands by a local ice-cap, before feeding continental shelf-breakfan systems (the Rona and Foula Wedges: Davison and Stoker,2002; Holmes et al., 2003). Bradwell et al. (2008) revise this modelof glaciation and propose that this ice stream inundated Shetlandat the LGM, with subsequent development of a local ice-cap basedon evidence of offshore lobate moraines N, E and W of Shetland.Golledge et al. (2008) take this interpretation further, suggestingthat the only evidence for a local ice-cap is restricted to the centralMainland region, and entertain the idea that this feature may be ofYounger Dryas age. In response, Flinn (2009) has vigorouslycriticised the approach taken by Golledge et al. (2008), in terms offavouring remotely sensed data with limited ground-truthing overdirectly observed field data, notably the extensive striation data(Fig. 1b) that indicates broadly radial ice flow. Indeed, thereconstruction of ice flow-lines by Golledge et al. (2008) isspeculative in places, with often very long (>40 km) inferred flow-lines interpolated from very sparse data. Notable examples are theE–W oriented flow-line located at the northern tip of Unst, the longflow-lines located in Bluemull and Yell Sounds, and the NWtrending flow-line extending from the South Mainland to the WallsPeninsula (Fig. 1b). However, it is apparent that the ice-flowdirections reported in the present study (Fig. 14) and that are basedon different sets of data are largely compatible with the flow-linespresented by Golledge et al. (2008).
Evidently, the striation data presented by Peach and Horne(1879), Hoppe (1974) and Flinn (1978), Flinn (1980), Flinn (1983)do not fully conform to the record of glaciation preserved inlandforms noted by Golledge et al. (2008) and the evidencedescribed in this study, most notably in eastern Shetland. Anotherpossible explanation is that the direction of ice flow recorded bystriae in the east of Shetland may indicate ice flow towards, ratherthan from the west, reflecting the difficulty in identifying which oftwo possible directions the ice may be flowing (Iverson, 1991;Ross, 1996). This may also account for the differences in ice-flowdirection interpretation between Peach and Horne (1879), Hoppe(1974) and Flinn (1978), Flinn (1980), Flinn (1983). Other possibleexplanations include that localised basal ice-flow patterns onrough or irregular bedrock surfaces may result in substantialdivergence between contemporaneous striae (Gray and Lowe,1982; Syverson, 1995; Rea et al., 2000). Indeed, given the stronggeological structure of eastern Shetland, it may be assumed thatthese local controls were probably a significant influence.However, these appear unlikely to explain the apparentlysystematic mis-interpretation of striae on the eastern side ofShetland, and it must be assumed that the striae provide a validindication of former radial ice flow conditions in the NE Mainlandand Whalsay areas. Whilst the transport paths of ‘erratic’ bouldersand indicator lithologies arguably provide a more robust frame-work for understanding of former ice-flow directions (Fig. 1c), thisapproach is also not without problems. Many of the provenancestudies (Peach and Horne, 1879; Robertson, 1935; Hoppe, 1974)predate systematic onshore and offshore geological mapping ofShetland, the latter still only established at regional 1:250,000scale (British Geological Survey, 1984). As such, smaller offshore
sub-crops of distinctive lithologies potentially critical for prove-nance studies, such as serpentine and small intrusive igneouscomplexes on the East Shetland Platform, probably remainunmapped. Equally, it should be remembered that erratic transportmay reflect cumulative glacial phases with different ice-flowvectors (Benn and Evans, 2010). As such, some of the erratictransport data, especially where there is significant deviation in iceflow directions across short distances, such as on Fetlar (Fig. 1c),and also now identified on Whalsay (compare Figs. 1c and 14b),should be treated with caution.
An alternative approach to explaining the aforementionedcomplex patterns argues that the disparate data reflect separateglacial episodes. It has long been assumed that the striation datarepresent a local Shetland ice-cap postdating regional ice-sheetglaciation (Sutherland, 1991), a scenario that actually createsmuch of the difficulty in reconciling the different data shown inFigs. 1 and 14. However, it seems implausible for glacial sedimentsand landforms of ice-sheet glaciation to be overprinted butpreserved intact by a local ice-cap glaciation which leaves nosedimentary record, but extensively abrades bedrock. The onlydata that directly support such a framework are the mapped ‘older’striae on Bressay (Fig. 1b) reported by Hoppe (1974), thesignificance of which was subsequently challenged by Flinn(1977). Consequently, there is remarkably little evidence on whichthe popular assumption of early ice-sheet followed by local ice-capglaciation is based. Ross (1996) recognised this and claimedtherefore that there was no Fennoscandian influence overglaciation of Shetland. However, to explain the contradictoryevidence from different data sources within a local ice-cap model,both Mykura (1976) and Ross (1996) were required to invokecomplex dynamic changes and ice shed migrations during ice sheetglaciation followed by local deglaciation. The lack of clear cross-cutting striae to provide sequencing of events, or evidence tosupport the significant re-advances that would be expected undersuch dynamic conditions must restrict confidence in thesereconstructions. These models become especially problematicwhen compared with the multi-proxy stratigraphic evidence fromSel Ayre and Fugla Ness indicating only one glaciation of Shetlandduring the last glacial cycle (Hall et al., 2002). This is supported bythe findings of this study which provide only weak evidence forpotentially more than one phase of glaciation.
In this study, it has been noted that glacially striated andpolished bedrock surfaces underlie the sediments described.Although it is not clear whether these predate or are contempora-neous with the proposed subglacial traction till emplacement, thiscould imply that much of the striation evidence of a radial flowinglocal ice-cap, as previously reported, may predate inundation ofShetland by a NW-flowing ice stream system. A similar explana-tion has been suggested by Smith and Knight (2011) to account fordifferences between the configuration of striae and subglacialbedforms associated with the last Irish ice sheet, by which thestriae are suggested to largely predate emplacement of sedimentsand subglacial bedforms. Whilst such a hypothesis clearly needssubstantial investigation, this framework can potentially reconcilethe apparently conflicting evidence that has been previouslyreported for Shetland during the LGM.
6. Conclusions and further research
Seventeen sediment sections from the main islands of theShetland archipelago have been identified and described, provid-ing improved understanding of the last glaciation of the region. Thepreliminary sedimentary evidence interpreted here supports amodel of NW-flowing ice derived from confluent Fennoscandianand British-Irish ice sheets in the North Sea Basin extending acrossand inundating Shetland during a single phase of glaciation.

S.J. Carr, J.F. Hiemstra / Proceedings of the Geologists’ Association 124 (2013) 484–502 501
Critically, this study has not found any sedimentary evidence tosupport the traditional model of a local Shetland ice-cap, either ator subsequent to the LGM. Instead, this study tentatively suggeststhat the previously published evidence for radial ice-flow of a localice-cap may in fact directly predate the LGM. This potentiallymarks a substantial change in the Late Quaternary glacialstratigraphy of Shetland, enables reconciliation between seeming-ly contradictory evidence, and integrates the region moreeffectively within the wider model of the last glacial cycle inNW Europe.
We emphasise that this study does not yet provide a definitiveanswer to the long-standing controversy regarding the lastglaciation of Shetland: there are still areas of considerableuncertainty to be resolved. As such, we conclude this study withfour recommendations for targeted future research that may yielda final, definitive reconstruction that incorporates all the publisheddata in a coherent model of the last glaciation of Shetland:
� The eastern islands of Bressay, Whalsay and Fetlar clearly are apriority for further research: as these seem critical for fullyevaluating the radial versus linear ice flow models discussed inthis paper. All these islands demonstrate considerable small-scale variability in suggested ice-flow directions.� There is a clear need to establish the stratigraphic relationship
between striae and other small-scale erosional features atindividual sites, as well as their relationship to the lithofaciesdescribed in this study. In this way, a more detailed picture of theevolution of the glaciation of Shetland may be developed.� Numerous sites preserving extensive structural evidence of
glacitectonic deformation offer excellent potential for detailedinvestigation of the ice flow dynamics during the last glaciation.Whilst a relatively simple deformation chronology has beensuggested in this study, sites such as The Nev offer considerableopportunity to examine the nature of glacitectonic deformationof bedrock in considerably more detail.� Key sites, most notably those on the south and east of Shetland,
need to be investigated further for evidence of recycling ofprimary (glaci)marine deposits. In the proposed scenario ofconfluent British-Irish and Fennoscandian ice overriding Shet-land from the E or SE, one would normally expect there to be amarine signal in the locally exposed LFA1.
Acknowledgements
This project was supported by a QRA Quaternary Research Fundaward to JFH. The authors would like to thank Adrian Hall for usefuldiscussions and an excellent dinner, and Derek Flinn for informa-tion about the past mapping of striations. Leonardo da Vinciprovided welcome inspiration for the ideas presented in this paper,as did the River Usk at Newport. We would like to thank DaveEvans and Adrian Hall for very useful reviews, although we stresshere that the views recorded in this paper are our own. Thanks toAdrian Palmer for the production of the thin section from Sand Voe.The assistance Clare Boston and Heather Channon is gratefullyacknowledged for the preparation of the NextMap DEM in Fig. 1a.
References
Benn, D.I., 1994. Fabric shape and the interpretation of sedimentary fabric data.Journal of Sedimentary Research A64, 910–915.
Benn, D.I., 2004. Macrofabric. In: Evans, D.J.A., Benn, D.I. (Eds.), A Practical Guide tothe Study of Glacial Sediments. Arnold, London, pp. 93–114.
Benn, D.I., Evans, D.J.A., 1996. The interpretation and classification of subglacially-deformed materials. Quaternary Science Reviews 15, 23–52.
Benn, D.I., Evans, D.J.A., 2010. Glaciers and Glaciation, 2nd ed. Hodder Education,London, 802 pp.
Bennett, M.R., Waller, R.I., Glasser, N.F., Hambrey, M.J., Huddart, D., 1999. Glacigenicclast fabrics: genetic fingerprint or wishful thinking? Journal of QuaternaryScience 14, 125–135.
Birnie, J.F., Gordon, J.E., Bennett, K.J., Hall, A.M., 1993. The Quaternary of Shetland:Field Guide. Quaternary Research Association, Cambridge, 140 pp.
Bradwell, T., Stoker, M.S., Golledge, N.R., Wilson, C.K., Merritt, J.W., Long, D., Everest,J.D., Hestvik, O.B., Stevenson, A.G., Hubbard, A.L., Finlayson, A.G., Mathers, H.E.,2008. The northern sector of the last British Ice Sheet: Maximum extent anddemise. Earth Science Reviews 88, 207–226.
British Geological Survey, 1984. 1:250,000 Solid Geology: Shetland. British Geolog-ical Survey, London.
Carr, S., 2004. Micro-scale features and structures. In: Evans, D.J.A., Benn, D.I. (Eds.),A Practical Guide to the Study of Glacial Sediments. Hodder Arnold, London, pp.115–144.
Carr, S., Goddard, M., 2007. Role of particle size in till-fabric characteristics:systematic variation in till fabric from Vestari-Hagafellsjokull, Iceland. Boreas36, 371–385.
Carr, S., Rose, J., 2003. Till fabric patterns and significance: particle response tosubglacial stress. Quaternary Science Reviews 22, 1415–1426.
Carr, S.J., Holmes, R., van der Meer, J.J.M., Rose, J., 2006. The Last Glacial Maximum inthe North Sea Basin: micromorphological evidence of extensive glaciation.Journal of Quaternary Science 21, 131–153.
Chapelhow, R., 1965. On glaciation in North Roe, Shetland. Geographical Journal131, 60–70.
Croll, J., 1870. VI—The Boulder-clay of Caithness a Product of Land-ice. GeologicalMagazine 7, 271–278.
Croll, J., 1875. Climate and Time in Their Geological Relations: A Theory of SecularChanges of the Earth’s Climate. Daldy, Isbister & Company, London, 577 pp.
Davison, S., Stoker, M.S., 2002. Late Pleistocene glacially-influenced deep-marinesedimentation off NW Britain: implications for the rock record. Special Publi-cation Geological Society of London 203, 129–148.
Ehlers, J., Gibbard, P.L., Hughes, P.D. (Eds.), 2011. Quaternary Glaciations – Extent andChronology; a closer look. Developments in Quaternary Science 15, 1108 pp.
Evans, D.J.A., Benn, D.I., 2004. Facies description and the logging of sedimentaryexposures. In: Evans, D.J.A., Benn, D.I. (Eds.), A Practical Guide to the Study ofGlacial Sediments. Hodder Arnold, London, pp. 11–51.
Evans, D.J.A., Hiemstra, J.F., 2005. Till deposition by glacier submarginal, incremen-tal thickening. Earth Surface Processes and Landforms 30, 1633–1662.
Evans, D., Clark, C., Mitchell, W., 2005. The last British Ice Sheet: a review of theevidence utilised in the compilation of the Glacial Map of Britain. Earth ScienceReviews 70, 253–312.
Evans, D.J.A., Phillips, E.R., Hiemstra, J.F., Auton, C.A., 2006. Subglacial till: Forma-tion, sedimentary characteristics and classification. Earth Science Reviews 78,115–176.
Evans, D., Hiemstra, J., O’Cofaigh, C., 2007. An assessment of clast macrofabrics inglacigenic sediments based on A/B plane data. Geografiska Annaler Series A(Physical Geography) 89, 103–120.
Finlay, T.M., 1926. Exhibition: a tongsbergite boulder from the boulder clay ofShetland. Transactions of the Edinburgh Geological Society 12, 180.
Flinn, D., 1977. The erosion history of Shetland; a review. Proceedings of theGeologists’ Association 88, 129–146.
Flinn, D., 1978. The most recent glaciation of the Orkney-Shetland Channel andadjacent areas. Scottish Journal of Geology 14, 109–123.
Flinn, D., 1980. Geological history. In: Berry, R.J., Johnston, J.L. (Eds.), The NaturalHistory of Shetland. Collins, London, pp. 31–59.
Flinn, D., 1983. Glacial meltwater channels in the northern isles of Shetland.Scottish Journal of Geology 19, 311.
Flinn, D., 1992. A note on the Dalsetter erratic, Dunrossness, Shetland. The ShetlandNaturalist 1, 29–36.
Flinn, D., 1994. The Geology of Yell and Some Neighbouring Islands in Shetland.HMSO, London.
Flinn, D., 2009. The omission of conflicting evidence from the paper by Golledgeet al. (2008). Geografiska Annaler Series A (Physical Geography) 91, 253–265.
Golledge, N., Finlayson, A., Bradwell, T., Everest, J., 2008. The last glaciation ofShetland, North Atlantic. Geografiska Annaler Series A (Physical Geography) 90,37–53.
Gordon, J.E., Hall, A.M., Ross, H.M., 1993. Introduction to the quaternary of Shetland.In: Birnie, J.F., Gordon, J.E., Bennett, K.J., Hall, A.M. (Eds.), The Quaternary ofShetland: Field Guide. Quaternary Research Association, Cambridge, pp. 6–8.
Graham, A.G.C., Lonergan, L., Stoker, M.S., 2007. Evidence for Late Pleistocene icestream activity in the Witch Ground Basin, central North Sea, from seismicreflection data. Quaternary Science Reviews 26, 627–643.
Gray, J.M., Lowe, J.J.L., 1982. Problems in the interpretation of small-scale erosionalforms on glaciated bedrock surfaces; examples from Snowdonia, North Wales.Proceedings of the Geologists’ Association 93, 403–414.
Hall, A.M., Whittington, G., Gordon, J.E., 1993a. Interglacial peat at Fugla Ness,Shetland. In: Birnie, J.F., Gordon, J.E., Bennett, K.J., Hall, A.M. (Eds.), The Quater-nary of Shetland: Field Guide. Quaternary Research Association, Cambridge, pp.62–76.
Hall, A.M., Gordon, J.E., Whittington, G., 1993b. Early Devensian interstadial peat atSel Ayre. In: Birnie, J.F., Gordon, J.E., Bennett, K.J., Hall, A.M. (Eds.), The Quater-nary of Shetland: Field Guide. Quaternary Research Association, Cambridge, pp.104–118.
Hall, A.M., Gordon, J.E., Whittington, G., Duller, G.A.T., Heijnis, H., 2002. Sedimen-tology, palaeoecology and geochronology of Marine Isotope Stage 5 deposits onthe Shetland Islands, Scotland. Journal of Quaternary Science 17, 51–67.
Hart, J.K., Boulton, G.S., 1991. The inter-relation of glaciotectonic and glaciodeposi-tional processes within the glacial environment. Quaternary Science Reviews10, 335–350.

S.J. Carr, J.F. Hiemstra / Proceedings of the Geologists’ Association 124 (2013) 484–502502
Hiemstra, J.F., 2006. Micromorphology of glacial sediments. In: Elias, S.A. (Ed.),Encyclopedia of Quaternary Science. Elsevier, Amsterdam, pp. 945–954.
Hiemstra, J.F., Carr, S.J., 2010. Ice in late quaternary Shetland: British, Scandinavianor local produce? Quaternary Newsletter 120, 25–30.
Hiemstra, J.F., Evans, D.J.A., O Cofaigh, C., 2007. The role of glaciotectonic rafting andcomminution in the production of subglacial tills: examples from southwestIreland and Antarctica. Boreas 36, 386–399.
Hiemstra, J.F., Rijsdijk, K.F., Shakesby, R.A., McCarroll, D., 2009. ReinterpretingRotherslade, Gower Peninsula: implications for Last Glacial ice limits andQuaternary stratigraphy of the British Isles. Journal of Quaternary Science24, 399–410.
Holmes, R., Bulat, J., Hamilton, I., Long, D., 2003. Morphology of an ice-sheet limitand constructional glacially fed slope front, Faeroe-Shetland margin. In: Mie-nert, J. (Ed.), European Margin Sediment Dynamics: Side-Scan Sonar andSeismic Images. Springer-Verlag, Berlin, pp. 149–151.
Home, D.M., 1881. On the glaciation of Shetland. Geological Magazine 8, 1–7.Hoppe, G., 1974. The glacial history of the Shetland Islands. Institute of British
Geographers, Special Publication 7, 197–210.Iverson, N.R., 1991. Morphology of glacial striae: implications for abrasion of glacier
beds and fault surfaces. Geological Society of America Bulletin 103, 1308–1316.Johnson, H., Richards, P.C., Long, D., Graham, C.C., 1993. United Kingdom offshore
regional report: the geology of the northern North Sea. HMSO (for the BritishGeological Survey), London, 110 pp.
Mark, D.M., 1974. On the interpretation of till fabrics. Geology 2, 101–104.McCarroll, D., Rijsdijk, K.F., 2003. Deformation styles as a key for interpreting glacial
depositional environments. Journal of Quaternary Science 18, 473–489.McClay, K., 1987. The mapping of geological structures. In: Geological Society of
London Handbook, Wiley, Chichester, 161 pp.Milne-Home, D., 1881a. On the glaciation of the Shetlands: comment on Peach &
Horne (1881a). Geological Magazine 8, 205–212.Milne-Home, D., 1881b. The glaciation of the Shetlands: further comment on Peach
& Horne (1881b). Geological Magazine 8, 449–454.Mykura, W., 1976. British Regional Geology: Orkney and Shetland. HMSO, Edin-
burgh, 149 pp.Peach, C.W., 1865. On traces of glacial drift in the Shetland Islands. Geological
Magazine 2, 341–343.Peach, B.N., Horne, J., 1879. The glaciation of the Shetland Isles. Quarterly Journal of
the Geological Society 35, 778–811.Peach, B.N., Horne, J., 1881a. The glaciation of the Shetland Isles: reply to Milne-
Home. Geological Magazine 8, 65–69.
Peach, B.N., Horne, J., 1881b. The glaciation of the Shetland Isles: further reply toMilne-Home. Geological Magazine 8, 364–372.
Phillips, E.R., Auton, C., 2008. Microtectural analysis of a glacially ‘deformed’bedrock: implications for the inheritance of preferred clast orientations indiamictons. Journal of Quaternary Science 23, 229–240.
Phillips, E., van der Meer, J.J.M., Ferguson, A., 2011. A new ‘microstructural mapping’methodology for the identification, analysis and interpretation of polyphasedeformation within subglacial sediments. Quaternary Science Reviews 30,2570–2596.
Rea, B.R., Evans, D.J.A., Dixon, T.S., Whalley, W.B., 2000. Contemporaneous, localized,basal ice-flow variations: implications for bedrock erosion and the origin of p-forms. Journal of Glaciology 46, 470–476.
Robertson, T., 1935. The Glaciation of Aithisting, South Nesting, Whalsay and theOut Skerries. Geological Survey Records (Unpublished) LSA 168, 1–5.
Ross, H., 1996. The Last Glaciation of Shetland. Unpublished PhD, University of St.Andrews.
Ross, H., Hall, A.M., Gordon, J.E., 1993. Patterns of ice flow on Shetland. In: Birnie,J.F., Gordon, J.E., Bennett, K.J., Hall, A.M. (Eds.), The Quaternary of Shetland:Field Guide. Quaternary Research Association, Cambridge, pp. 9–14.
Sejrup, H.P., Haflidason, H., Aarseth, I., King, E., Forsberg, C.F., Long, D., Rokoengen,K., 1994. Late Weichselian glaciation history of the northern North Sea. Boreas23, 1–13.
Shennan, I., Hamilton, S., Hillier, C., Woodroffe, S., 2005. A 16000-year record ofnear-field relative sea-level changes, northwest Scotland, United Kingdom.Quaternary International 133–134, 95–106.
Smith, M.J., Knight, J., 2011. Palaeoglaciology of the last Irish ice sheet reconstructedfrom striae evidence. Quaternary Science Reviews 30, 147–160.
Stewart, T., 1882. The glaciation of the Shetland Islands. Geological Magazine 9,133–134.
Sutherland, D.G., 1991. The glaciation of the Shetland and Orkney Islands. In: Ehlers,J., Gibbard, P., Rose, J. (Eds.), Glacial Deposits of Britain and Ireland. Balkema,Rotterdam, pp. 121–128.
Syverson, K.M., 1995. The Ability of Ice-flow Indicators to Record Complex,Historic Deglaciation Events, vol. 24. Boreas, Burroughs Glacier, Alaska, pp.232–244.
van der Meer, J.J.M., Menzies, J., 2011. The micromorphology of unconsolidatedsediments. Sedimentary Geology 238, 213–232.
Wilson, G.V., Edwards, W., Knox, J., Jones, R.C.B., Stephens, J.V., 1935. The Geology ofthe Orkneys. Memoirs of the Geological Survey of Scotland, HMSO, Edinburgh,205 pp.
Copyright © 2022 FDOKUMEN