Seabed Mapping: A Brief History from Meaningful Words - MDPI
Upload
independentCategory
view
2download
0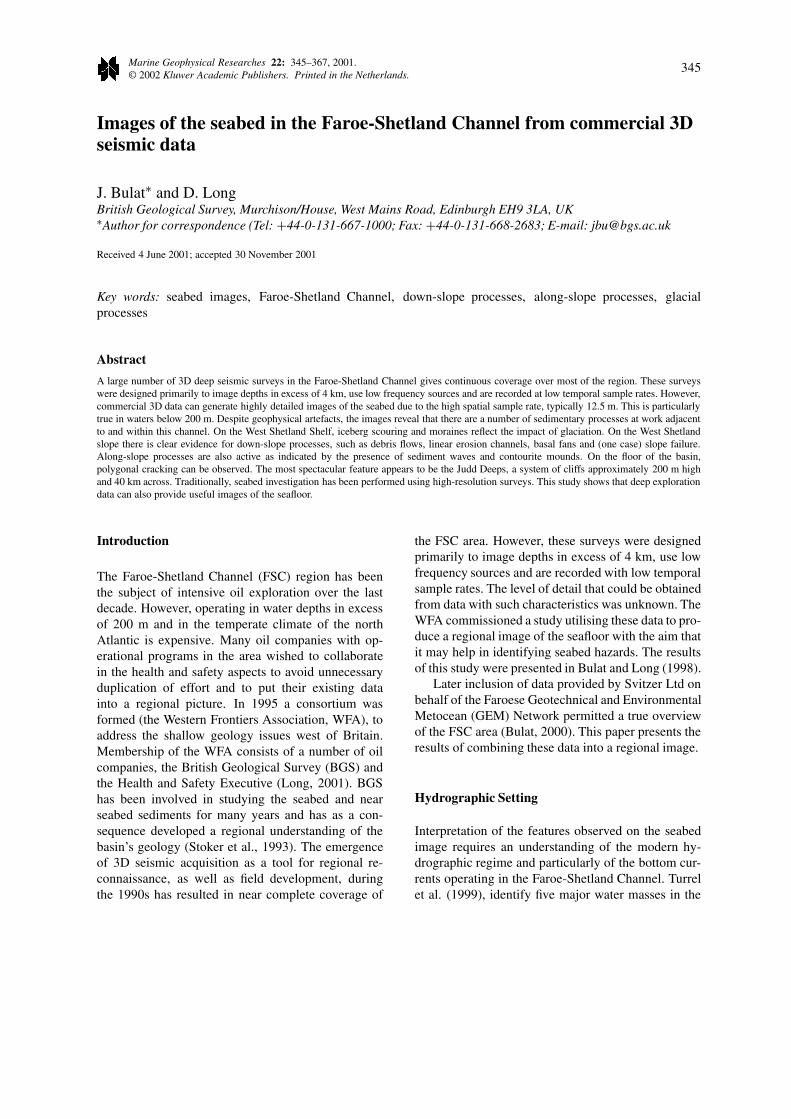
Marine Geophysical Researches 22: 345–367, 2001.© 2002 Kluwer Academic Publishers. Printed in the Netherlands.
345
Images of the seabed in the Faroe-Shetland Channel from commercial 3Dseismic data
J. Bulat∗ and D. LongBritish Geological Survey, Murchison/House, West Mains Road, Edinburgh EH9 3LA, UK∗Author for correspondence (Tel: +44-0-131-667-1000; Fax: +44-0-131-668-2683; E-mail: [email protected]
Received 4 June 2001; accepted 30 November 2001
Key words: seabed images, Faroe-Shetland Channel, down-slope processes, along-slope processes, glacialprocesses
Abstract
A large number of 3D deep seismic surveys in the Faroe-Shetland Channel gives continuous coverage over most of the region. These surveyswere designed primarily to image depths in excess of 4 km, use low frequency sources and are recorded at low temporal sample rates. However,commercial 3D data can generate highly detailed images of the seabed due to the high spatial sample rate, typically 12.5 m. This is particularlytrue in waters below 200 m. Despite geophysical artefacts, the images reveal that there are a number of sedimentary processes at work adjacentto and within this channel. On the West Shetland Shelf, iceberg scouring and moraines reflect the impact of glaciation. On the West Shetlandslope there is clear evidence for down-slope processes, such as debris flows, linear erosion channels, basal fans and (one case) slope failure.Along-slope processes are also active as indicated by the presence of sediment waves and contourite mounds. On the floor of the basin,polygonal cracking can be observed. The most spectacular feature appears to be the Judd Deeps, a system of cliffs approximately 200 m highand 40 km across. Traditionally, seabed investigation has been performed using high-resolution surveys. This study shows that deep explorationdata can also provide useful images of the seafloor.
Introduction
The Faroe-Shetland Channel (FSC) region has beenthe subject of intensive oil exploration over the lastdecade. However, operating in water depths in excessof 200 m and in the temperate climate of the northAtlantic is expensive. Many oil companies with op-erational programs in the area wished to collaboratein the health and safety aspects to avoid unnecessaryduplication of effort and to put their existing datainto a regional picture. In 1995 a consortium wasformed (the Western Frontiers Association, WFA), toaddress the shallow geology issues west of Britain.Membership of the WFA consists of a number of oilcompanies, the British Geological Survey (BGS) andthe Health and Safety Executive (Long, 2001). BGShas been involved in studying the seabed and nearseabed sediments for many years and has as a con-sequence developed a regional understanding of thebasin’s geology (Stoker et al., 1993). The emergenceof 3D seismic acquisition as a tool for regional re-connaissance, as well as field development, duringthe 1990s has resulted in near complete coverage of
the FSC area. However, these surveys were designedprimarily to image depths in excess of 4 km, use lowfrequency sources and are recorded with low temporalsample rates. The level of detail that could be obtainedfrom data with such characteristics was unknown. TheWFA commissioned a study utilising these data to pro-duce a regional image of the seafloor with the aim thatit may help in identifying seabed hazards. The resultsof this study were presented in Bulat and Long (1998).
Later inclusion of data provided by Svitzer Ltd onbehalf of the Faroese Geotechnical and EnvironmentalMetocean (GEM) Network permitted a true overviewof the FSC area (Bulat, 2000). This paper presents theresults of combining these data into a regional image.
Hydrographic Setting
Interpretation of the features observed on the seabedimage requires an understanding of the modern hy-drographic regime and particularly of the bottom cur-rents operating in the Faroe-Shetland Channel. Turrelet al. (1999), identify five major water masses in the

346
Faroe-Shetland Channel defined by differences in tem-perature, salinity and provenance. These are NorthAtlantic Water (NAW), Modified North Atlantic Water(MNAW), Arctic Intermediate/North Icelandic Water(AI/NIW), Norwegian Sea Arctic Intermediate Water(NSAIW) and Faroe Shetland Channel Bottom Water(FSCBW). For the purposes of this paper this clas-sification has been simplified into two groups basedon transport direction and water depth, which we willrefer to as surface water and bottom water. The sur-face water (Turrel et al.’s NAW, MNAW and AI/NIW)are essentially warmer, higher salinity water massesassociated with the Gulf Stream and have a transportdirection from the southwest to the northeast, witha base at approximately 600 m below sea-level. Thebottom water (Turrel et al.’s NSAIW and FSCBW)are the cold, low salinity, water masses flowing fromthe northeast to the southwest in the Faroe-ShetlandChannel. Earlier work by Dooley and Meincke (1981),placed the transition between surface to bottom cur-rents at about 500 m. However, the boundary zonebetween these two water types is a complex mix ofwaters and will vary seasonally and over time. Thework of Rasmussen et al. (1996), suggests that thepresent day hydrographic regime has existed con-tinuously since 14 ka and was in operation duringinterstadial periods extending back to at least 87 ka,(the limit of their data set) with convection shutdownsduring periods of glaciation.
The shape of the Faroe-Shetland Channel and theorientation of the Wyville-Thomson Ridge have a pro-found effect on the strength of present-day bottomcurrents, in firstly funnelling these waters togetherand then deflecting most of the water mass throughninety degrees into the Faroe Bank Channel. Stokeret al. (1998) emphasised the importance of bottomcurrents in moulding the seafloor sediments in theFSC. The basin floor sediments were recognised aspredominantly sheeted drifts maintained by the strongbottom currents. Estimates of the modern bottom wa-ter velocity vary. Stoker et al. (1998) give bottomcurrent estimates of between 13–22 cm s−1 with apeak velocity of 33 cm s−1. Masson (2001) cites atypical velocity of 10–20 cm s−1 with a peak veloc-ity of 60 cm s−1. All sources indicate that the bottomcurrents are slower than the surface currents and thatthe peak velocity can significantly exceed the typical.Masson (2001) states that the mean velocity of thesurface water is 30–60 cm s−1, with peak a velocityof 75 cm s−1.
Methods
Seismic data sets
The present seabed image was constructed in twophases. In the initial study (Bulat and Long, 1998),the seabed pick was provided as horizon files exportedas ASCII files by the exploration departments of theWFA member companies. In this initial phase thesedata frequently contained only location and two-waytime information. Individual data sets were then grid-ded at 100 m inter-node intervals for use in imaging.A difficulty with this approach was that the full resolu-tion of the data was not utilised. Also, it was difficultto ensure consistent data quality, as the horizons werepicked by different individuals on data sets of differ-ing resolution that were loaded for interpreting deepstructure rather than for imaging the seabed.
In the second phase (Bulat, 2000), all data waseither picked in-house using Landmark Graphics Cor-poration’s SeisWorks 3D programs, or the data wasprovided as ASCII files containing line and cross-line information in addition to location and two-waytime. All the data in the Faroese sector was pro-vided as ASCII horizon files and had been consistentlypicked by Svitzer Ltd for GEM. The extra informa-tion allowed the creation of SeisWorks 3D projects forthese data; the horizons could be reconstructed fromthe ASCII files supplied and horizon grids were con-structed at the full resolution of the data, often 12.5 m.Figure 1 shows the distribution of the two phases ofthe work.
Imaging
Final visualisation and imaging for this projectwas performed using Earth Resource Mapping Ltd’sERMapper product. The above data grids were im-ported into ERMapper, depth converted assuming avelocity of 1,500 m/s and a mosaic grid generated at12.5 m spacing. This mosaic was then spliced intoa regional bathymetry grid generated from the 1997General Bathymetric Chart of the Oceans (GEBCO-97) to provide a regional setting. The GEBCO 97compilation is a set of 100 m bathymetry contoursfor the whole world published in digital form (BODC,1997). The grid from these was generated using asimple Laplacian interpolation rather than the moreconventional minimum tension surface. This approachprevents artefacts being generated at the shelf breakand gives a clearly identifiable and smooth texture be-tween the contour lines, that contrasts well with the 3D
347
Figure 1. Map of the Faroe-Shetland region, showing main geographical elements, water depths (GEBCO 97) and the image mosaic resolution.Quadrant numbers for the UK and Faroese sectors are shown.
348
Fig
ure
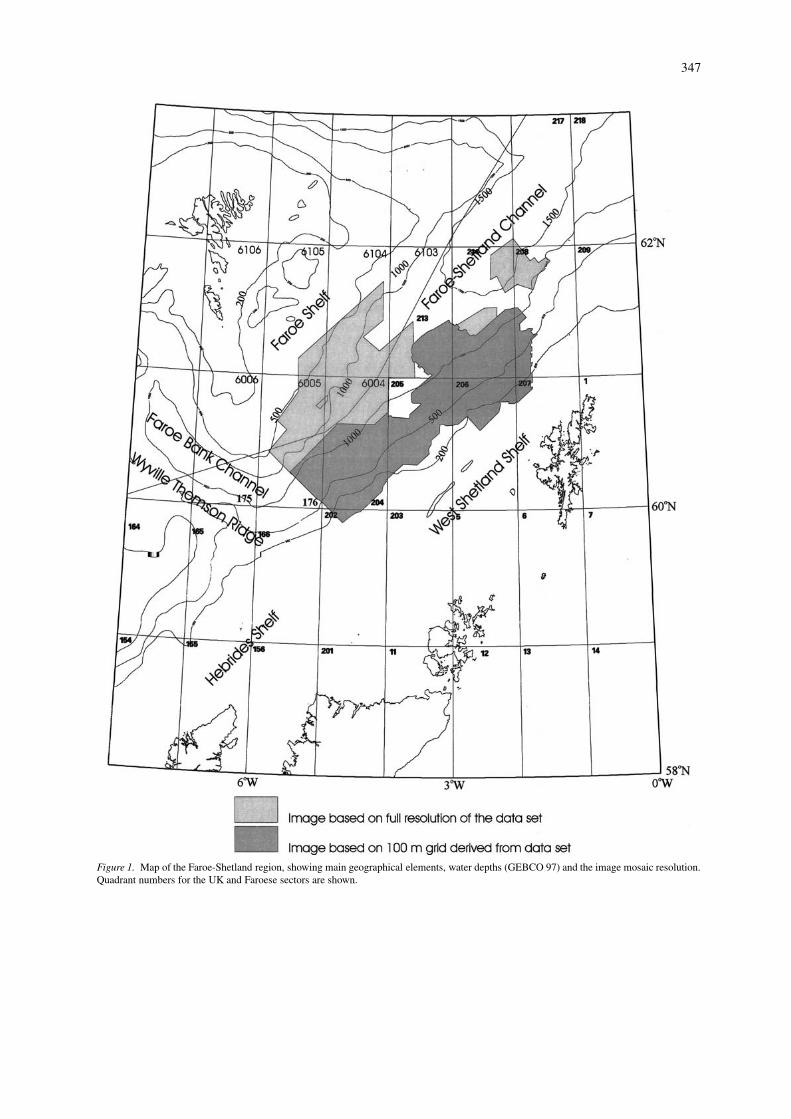
2.Se
abed
imag
ege
nera
ted
inE
RM
appe
rus
ing
‘shi
ny’
algo
rith
man
dill
umin
ated
from
the
nort
heas
t.T
heIm
age
isco
mpo
sed
of3D
seis
mic
data
sets
that
have
been
dept
hco
nver
ted
assu
min
ga
wat
erve
loci
tyof
1,50
0m
/sse
twith
ina
regi
onal
bath
ymet
ric
grid
deri
ved
from
the
GE
BC
O-9
7co
mpi
latio
n.Su
peri
mpo
sed
upon
the
imag
ear
eth
elo
catio
nsfo
rth
ede
taile
dim
age
pane
ls(A
–H)
pres
ente
din
this
pape
r.

349
Fig
ure
3.D
etai
led
Imag
ePa
nel
A.I
llum
inat
ion
from
sout
hwes
t.B
athy
met
ric
cont
ours
supe
rim
pose
don
base
imag
ear
ees
timat
esde
rive
dfr
omth
e3D
seis
mic
.N
ote
the
inte
rfer
ence
patte
rnbe
twee
nth
ese
dim
entw
aves
and
cont
ouri
tem
ound
sat
the
base
ofth
esl
ope.
The
mai
nda
taar
tefa
cts
are
indi
cate
d.
350
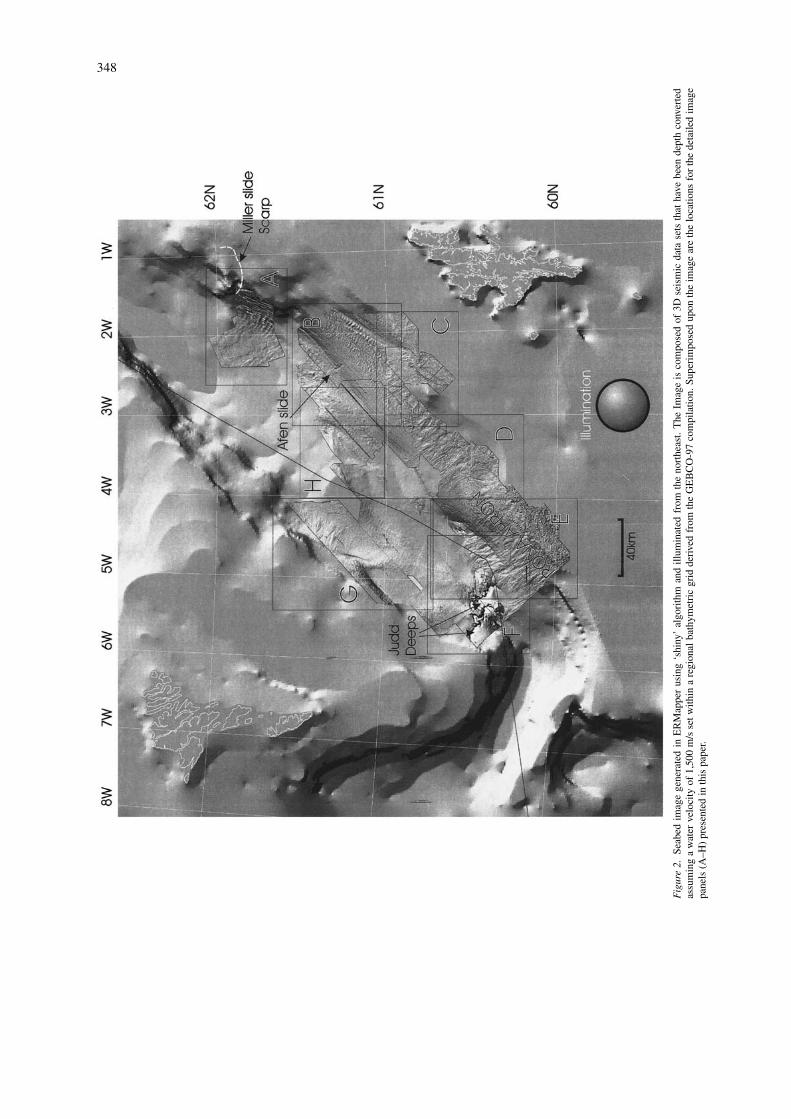
Figure 4. Profile AA′. BGS single channel analogue sparker record 84/05-10 fixes 17–25. The location of this profile is shown on Figure 3.The high-resolution sparker record confirms the presence of mound and moat structures on the slope. These features correlate well with thoseobserved on the seabed image.
seismic data sets. This final grid was then used to pro-duce the relief images seen in Figure 2 and the detailedpanels A–H. The relief images were generated usingERMapper’s ‘shiny’ algorithm. Conventional shadedrelief images, typically, are pseudo-relief images inthat they only show the shadows in the surface. The‘shiny’ relief treats the surface as a shiny surface thatgives reflected highlights as well as shadow zones. Thepresence of highlights as well as shadow is particularlyeffective in bringing out subtle topography.
Artefacts
There are a number of geophysical artefacts in theseabed image, which need to be considered duringinterpretation. These artefacts are commonly due tosurvey boundaries, survey footprint, event pickingproblems and problems in data manipulation.
The most obvious artefacts are generated by sur-vey boundaries. Depth is calculated from observedtwo-way time and water velocity, so minor errors ineither parameter will cause errors in depth estimates.Bulk time shifts between adjacent and overlapping3D data are commonly observed. They arise due toslight differences in acquisition and processing be-tween surveys. As the primary focus of the seabed
image was to image topographic features rather thanto calculate bathymetry, no attempt has been madeto correct for bulk time shifts between surveys. Theassumption of 1,500 m/s as the velocity of the wa-ter column is only approximately true. In practice,water velocity varies spatially and temporally withthe mean temperature and salinity of the water col-umn. These in turn are a function of the complexhydrographic regime within the Faroe-Shetland Chan-nel (Turrel et al., 1999). A less obvious artefact is thepresence of internal boundaries within surveys. Thesecan arise where the survey is a composite of differ-ent surveys or acquisition phases that have either beeninterpreted together or processed together as one.
Marfurt et al. (1998) defined survey footprint asnoise that correlates with the survey acquisition geom-etry and describes some of the causes of this phe-nomenon. In the seabed images survey footprint isobserved as minor time shifts between adjacent linesgiving rise to a corrugated effect. Most of the surveysin the Faroe-Shetland Channel were acquired with anortheast – southwest line orientation. Consequently,linear noise with this orientation is observed on mostof the image. The visual impact of survey footprint hasbeen attenuated by judicious choice of illuminationdirection, i.e., from either the Southwest or the North-

351
Fig
ure
5.D
etai
led
Imag
ePa
nelB
.Illu
min
atio
nfr
omno
rthe
ast.
Am
ajor
sedi
men
twav
efie
ldis
imag
edbe
twee
n20
0m
and
600
mw
ater
dept
h,w
ithan
appr
oxim
atel
yE
NE
–WSW
tren
d,as
isth
ete
rmin
atio
nof
cont
ouri
tem
ound
sin
the
nort
heas
tpar
tof
the
imag
e.O
fpa
rtic
ular
note
isth
eA
fen
slid
e,th
eon
lykn
own
slid
ein
this
regi
on.

352
Figure 6. Profile BB′. BGS single channel analogue sparker record 84/05–28 (fixes 83–88). Location of this profile is shown on Figure 5. Theline traverses the Afen slide’s debris fan. Features seen on the profile correlate well with the detail seen in the seabed image.
east to prevent the generation of shadows by surveyfootprint (see Figures 3, 5, 7, 9, 11, 14, 17 and 18).
Creation of seismic horizons usually involves man-ually picking an event, either a peak or a trough, inthe data as seed points. These points are then propa-gated throughout the volume using automatic trackingsoftware into adjacent traces. All 3D seismic data isacquired and processed digitally, commonly at tempo-ral sample rates of 4 ms. The propagation of the hori-zon from trace to trace requires the automatic trackingsoftware to reconstruct the seismic signal shape from aset of adjacent samples so that the position of the peakor trough in time can be accurately estimated. Withoutthis reconstruction, the output horizon is forced to usethe nearest sample point, giving rise to 4 ms (approx-imately 3 m) steps in the horizon rather than providethe subtle transitions needed to image the fine detail.There are circumstances where the tracking softwarecannot reconstruct the seismic signal shape, such aswhen amplitudes have been truncated or clipped. Visu-ally, the effect of snapping to the nearest sample pointon the image is to produce a stepped terrace effect thatslavishly follows the two-way time or depth contours.Such terracing is observed in parts of the seabed imageand destroys visual continuity.
Where the initial seed points have been poorlyidentified, or where the signal to noise ratio in theseismic data is low, the resultant automatically pickedhorizon will also be noisy. Other artefacts can be gen-erated by seismic migration in areas of data gaps.The resultant migration smiles generate false pinna-cles. Where data problems are suspected, these willbe indicated in the discussion of the detailed imagepanels.
Results
Image overview
The seabed shaded relief image is shown in Figure 2and is illuminated from the northeast. The illuminationdirection of all the shaded relief images in this paperis indicated with the representation of a spot-lit metal-lic sphere. Much of the 3D data covers the slope anddeep-water basin plain, with only a limited coverageof the West Shetland Shelf. To date, there are still sig-nificant gaps in the coverage of the slope and channelfloor areas, also some data sets require further workto reduce artefacts and improve image quality. Thus
353
Fig
ure
7.D
etai
led
Imag
ePa
nel
C.
Illu
min
atio
nfr
omno
rthe
ast.
Gla
cial
mor
aine
sar
ecl
earl
yim
aged
inw
ater
dept
hsle
ssth
an20
0m
.T
heda
tain
the
sout
h,w
asac
quir
edw
itha
nort
hwes
t–so
uthe
ast
orie
ntat
ion,
asca
nbe
seen
inth
edi
ffer
ent
orie
ntat
ion
ofth
esu
rvey
foot
prin
tin
this
regi
on.

354
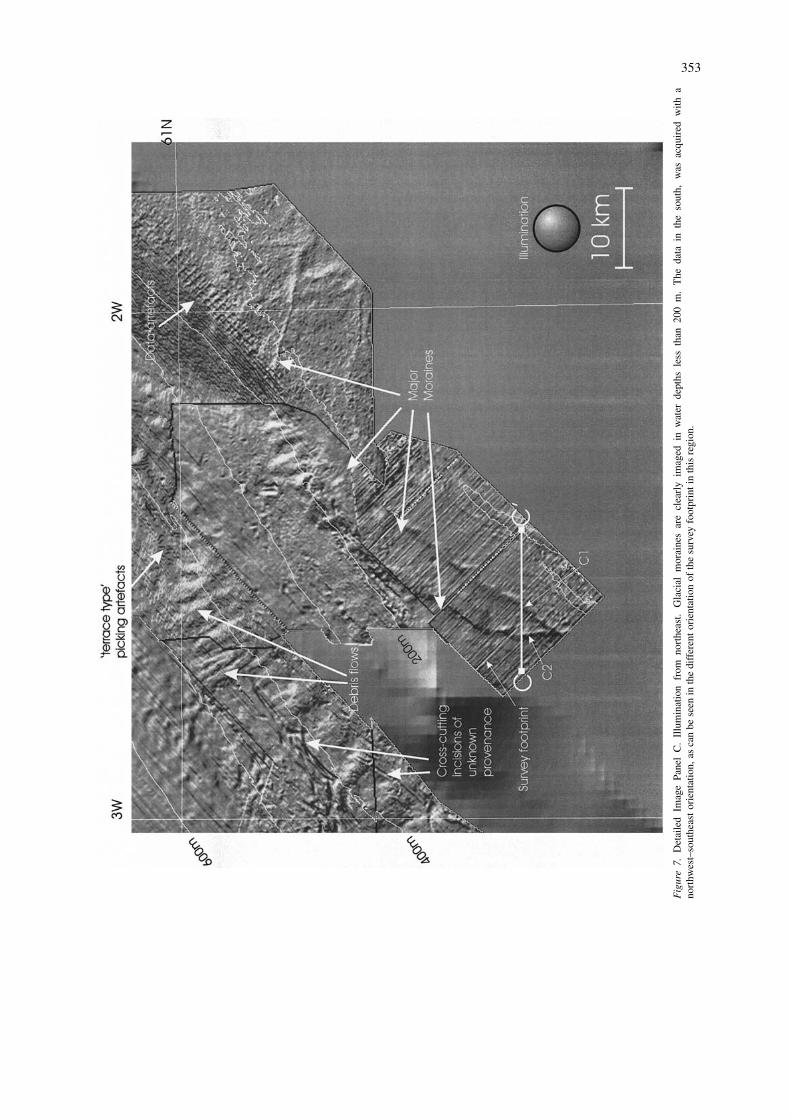
Figure 8. Profile CC′. BGS single channel analogue sparker record 79/14–23 fixes 10–20. Location of this profile is shown on Figure 7 (PanelC). Features C1 and C2 correlate perfectly with the features interpreted as major moraines.
the images presented here are of an interim nature.Despite this, the image coverage is extensive enoughand is of sufficient quality to produce initial interpre-tations. These are presented in the following sections,which describe the evidence for a variety of downslopeand alongslope processes.
Detailed panels
For convenience, the seabed image has been split intoeight image panels, their location are shown in Fig-ure 2. On each panel major artefacts are identified,seabed topographic features identified and the esti-mated bathymetry contours are superimposed. TheBGS has been acquiring high-resolution analogueseismic profiles to the west of Britain since the 1970sand where appropriate, sections of relevant BGS pro-files are included for calibration of the seabed image.
Panel A. Figure 3 shows a detailed seabed imageon the junction of UK quadrants 214 and 208. Theimage differs from all the other images presented inthis paper by having an illumination direction fromthe southeast rather than from the northwest. This wasrequired to prevent the slope from being in shade.
Of particular interest is an extensive network ofelongate mounds that run sub-parallel to the strike ofthe slope between the 900 m and 1,400 m isobaths.This network is restricted to the slope area but appears
to cover it completely. The mounds are approximatelyone kilometre in width and at least 10 km in length.Some mounds may in fact be considerably longer assimilar features are seen in Panel B, which impliesthat the data gap between these areas may also becovered by these features. If this supposition is ver-ified the network would cover an area approximately60 km in length and between 5 km and 15 km in width,narrowing southwards.
The location of sparker profile AA′ is indicatedon Figure 3 and the profile in Figure 4. The sparkerprofile clearly shows the presence of asymmetricalmounds on the slope at the seabed and reveals a com-plex slightly irregular internal geometry suggestingan overall up-slope migration of the mounds withtime. Unlike typical contourite drifts described inStoker et al. (1998) in the Rockall Trough there is noclear erosional base. The area of contourite moundsobserved in the seabed image broadly correspondswith the ‘zone of sediment disturbance’ identifiedin regional studies conducted by the BGS (Steven-son, 1991b). In Stevenson’s (1991b) interpretationthe ‘zone of sediment disturbance’ is a Neogene-Quaternary sequence that has been disrupted by slid-ing events followed by localised bottom-current con-trolled sediment build-up. Sliding events are known inthis area. The largest of these being the Miller slide,which lies immediately to the northeast of the area
355
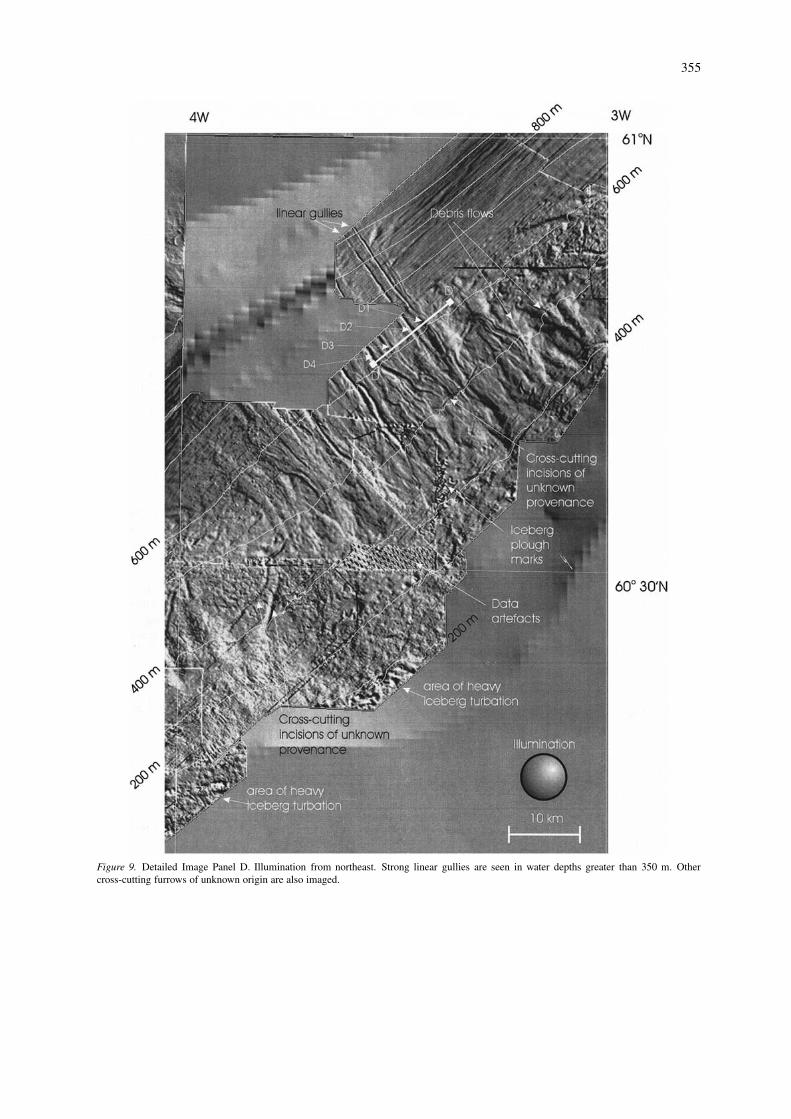
Figure 9. Detailed Image Panel D. Illumination from northeast. Strong linear gullies are seen in water depths greater than 350 m. Othercross-cutting furrows of unknown origin are also imaged.
356
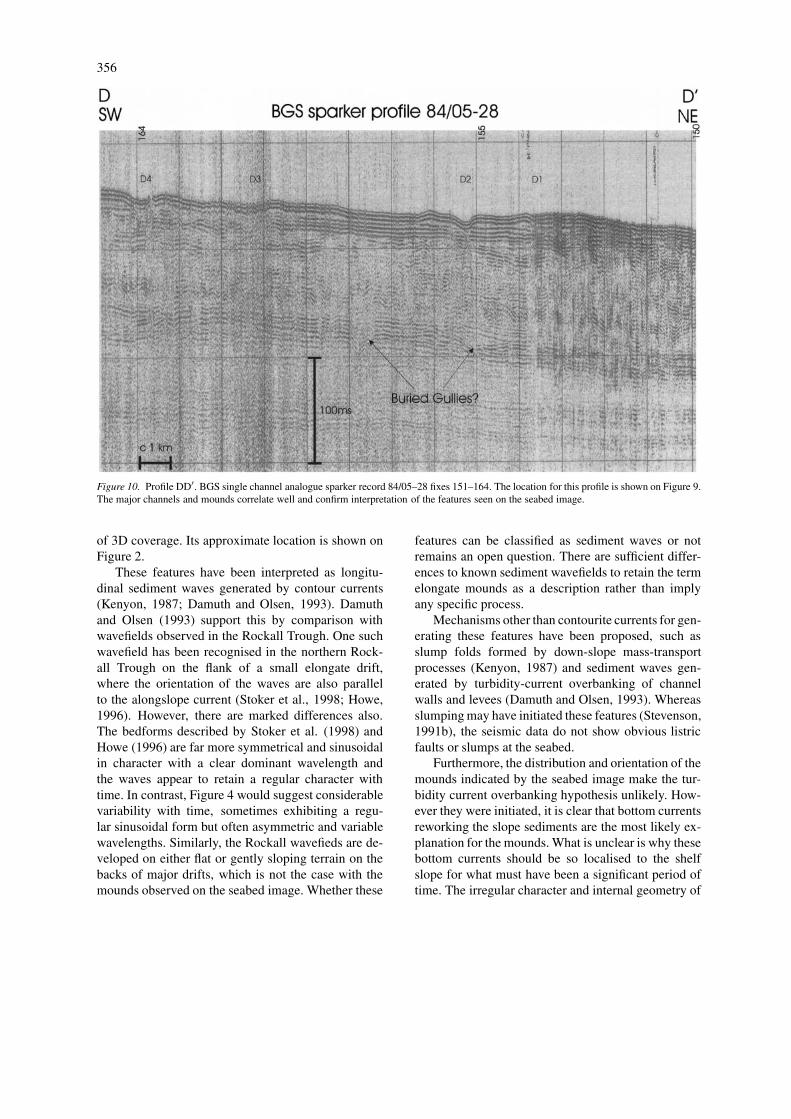
Figure 10. Profile DD′. BGS single channel analogue sparker record 84/05–28 fixes 151–164. The location for this profile is shown on Figure 9.The major channels and mounds correlate well and confirm interpretation of the features seen on the seabed image.
of 3D coverage. Its approximate location is shown onFigure 2.
These features have been interpreted as longitu-dinal sediment waves generated by contour currents(Kenyon, 1987; Damuth and Olsen, 1993). Damuthand Olsen (1993) support this by comparison withwavefields observed in the Rockall Trough. One suchwavefield has been recognised in the northern Rock-all Trough on the flank of a small elongate drift,where the orientation of the waves are also parallelto the alongslope current (Stoker et al., 1998; Howe,1996). However, there are marked differences also.The bedforms described by Stoker et al. (1998) andHowe (1996) are far more symmetrical and sinusoidalin character with a clear dominant wavelength andthe waves appear to retain a regular character withtime. In contrast, Figure 4 would suggest considerablevariability with time, sometimes exhibiting a regu-lar sinusoidal form but often asymmetric and variablewavelengths. Similarly, the Rockall wavefieds are de-veloped on either flat or gently sloping terrain on thebacks of major drifts, which is not the case with themounds observed on the seabed image. Whether these
features can be classified as sediment waves or notremains an open question. There are sufficient differ-ences to known sediment wavefields to retain the termelongate mounds as a description rather than implyany specific process.
Mechanisms other than contourite currents for gen-erating these features have been proposed, such asslump folds formed by down-slope mass-transportprocesses (Kenyon, 1987) and sediment waves gen-erated by turbidity-current overbanking of channelwalls and levees (Damuth and Olsen, 1993). Whereasslumping may have initiated these features (Stevenson,1991b), the seismic data do not show obvious listricfaults or slumps at the seabed.
Furthermore, the distribution and orientation of themounds indicated by the seabed image make the tur-bidity current overbanking hypothesis unlikely. How-ever they were initiated, it is clear that bottom currentsreworking the slope sediments are the most likely ex-planation for the mounds. What is unclear is why thesebottom currents should be so localised to the shelfslope for what must have been a significant period oftime. The irregular character and internal geometry of
357
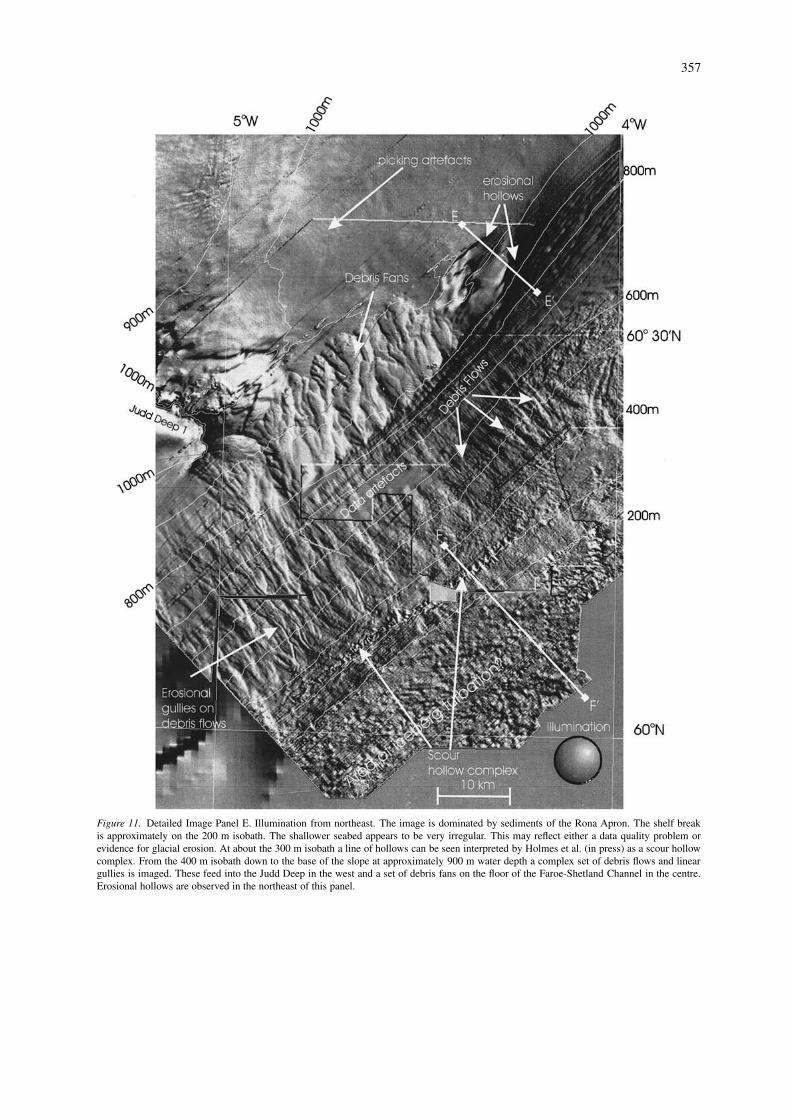
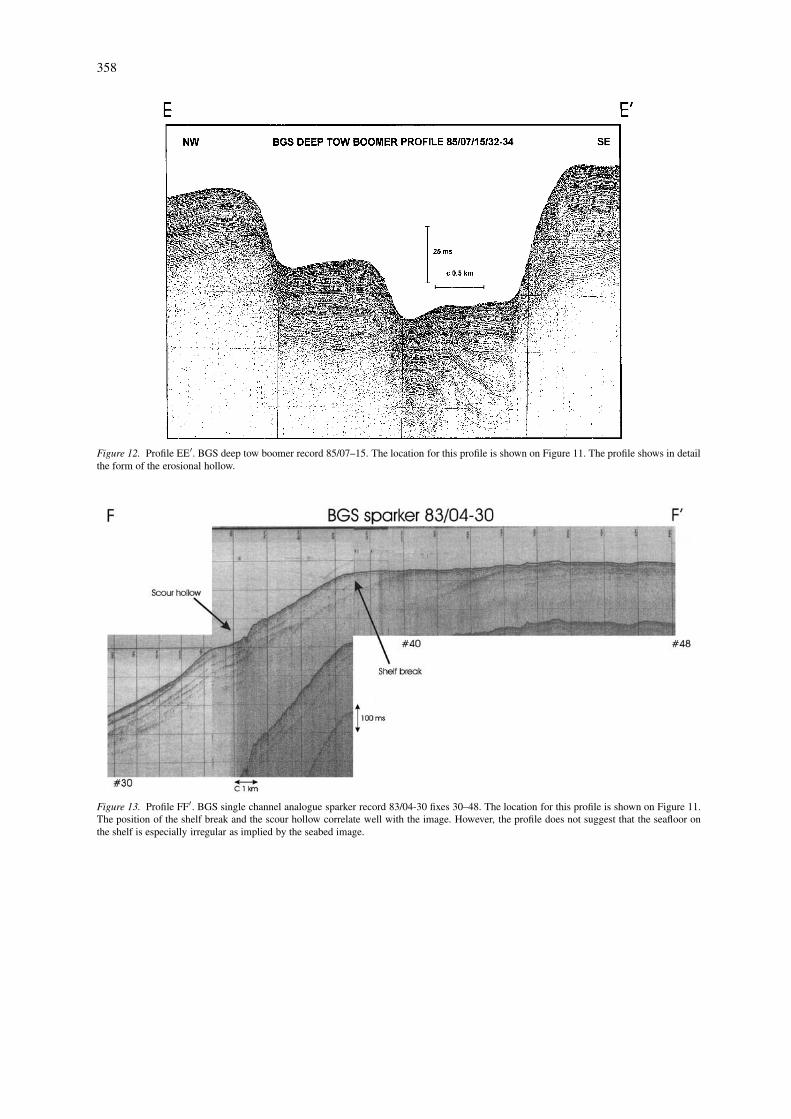
Figure 11. Detailed Image Panel E. Illumination from northeast. The image is dominated by sediments of the Rona Apron. The shelf breakis approximately on the 200 m isobath. The shallower seabed appears to be very irregular. This may reflect either a data quality problem orevidence for glacial erosion. At about the 300 m isobath a line of hollows can be seen interpreted by Holmes et al. (in press) as a scour hollowcomplex. From the 400 m isobath down to the base of the slope at approximately 900 m water depth a complex set of debris flows and lineargullies is imaged. These feed into the Judd Deep in the west and a set of debris fans on the floor of the Faroe-Shetland Channel in the centre.Erosional hollows are observed in the northeast of this panel.
358
Figure 12. Profile EE′. BGS deep tow boomer record 85/07–15. The location for this profile is shown on Figure 11. The profile shows in detailthe form of the erosional hollow.
Figure 13. Profile FF′. BGS single channel analogue sparker record 83/04-30 fixes 30–48. The location for this profile is shown on Figure 11.The position of the shelf break and the scour hollow correlate well with the image. However, the profile does not suggest that the seafloor onthe shelf is especially irregular as implied by the seabed image.
359
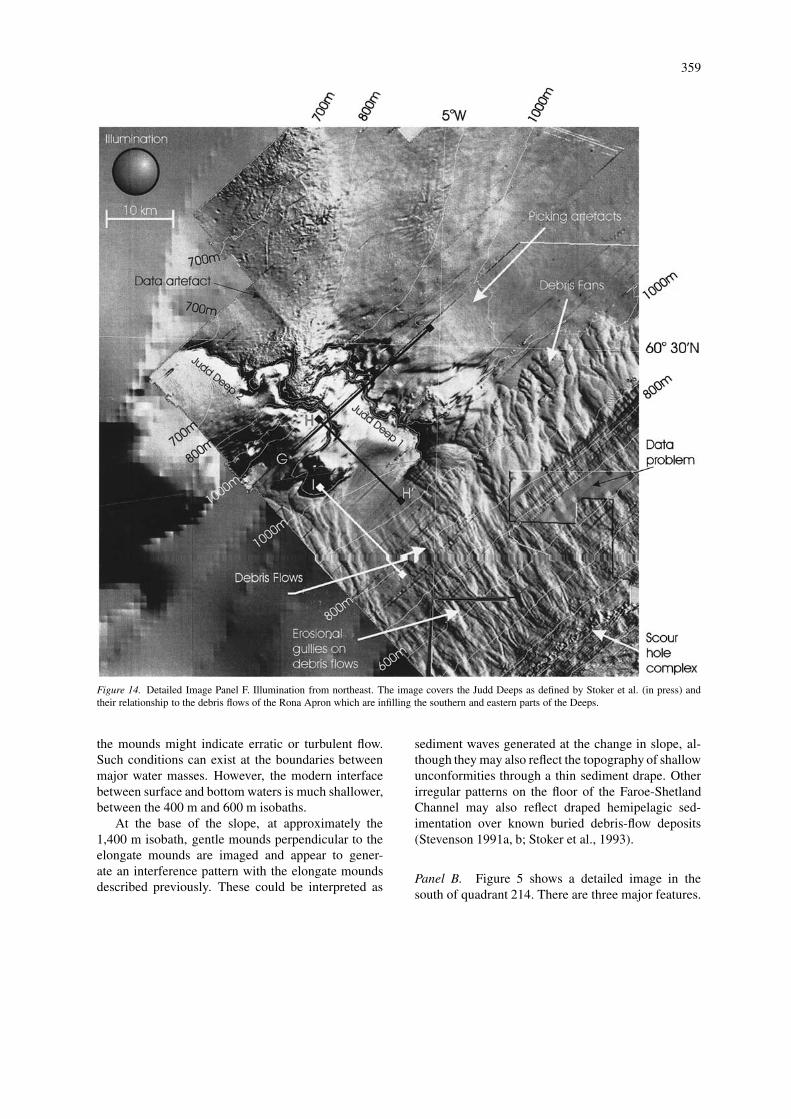
Figure 14. Detailed Image Panel F. Illumination from northeast. The image covers the Judd Deeps as defined by Stoker et al. (in press) andtheir relationship to the debris flows of the Rona Apron which are infilling the southern and eastern parts of the Deeps.
the mounds might indicate erratic or turbulent flow.Such conditions can exist at the boundaries betweenmajor water masses. However, the modern interfacebetween surface and bottom waters is much shallower,between the 400 m and 600 m isobaths.
At the base of the slope, at approximately the1,400 m isobath, gentle mounds perpendicular to theelongate mounds are imaged and appear to gener-ate an interference pattern with the elongate moundsdescribed previously. These could be interpreted as
sediment waves generated at the change in slope, al-though they may also reflect the topography of shallowunconformities through a thin sediment drape. Otherirregular patterns on the floor of the Faroe-ShetlandChannel may also reflect draped hemipelagic sed-imentation over known buried debris-flow deposits(Stevenson 1991a, b; Stoker et al., 1993).
Panel B. Figure 5 shows a detailed image in thesouth of quadrant 214. There are three major features.
360
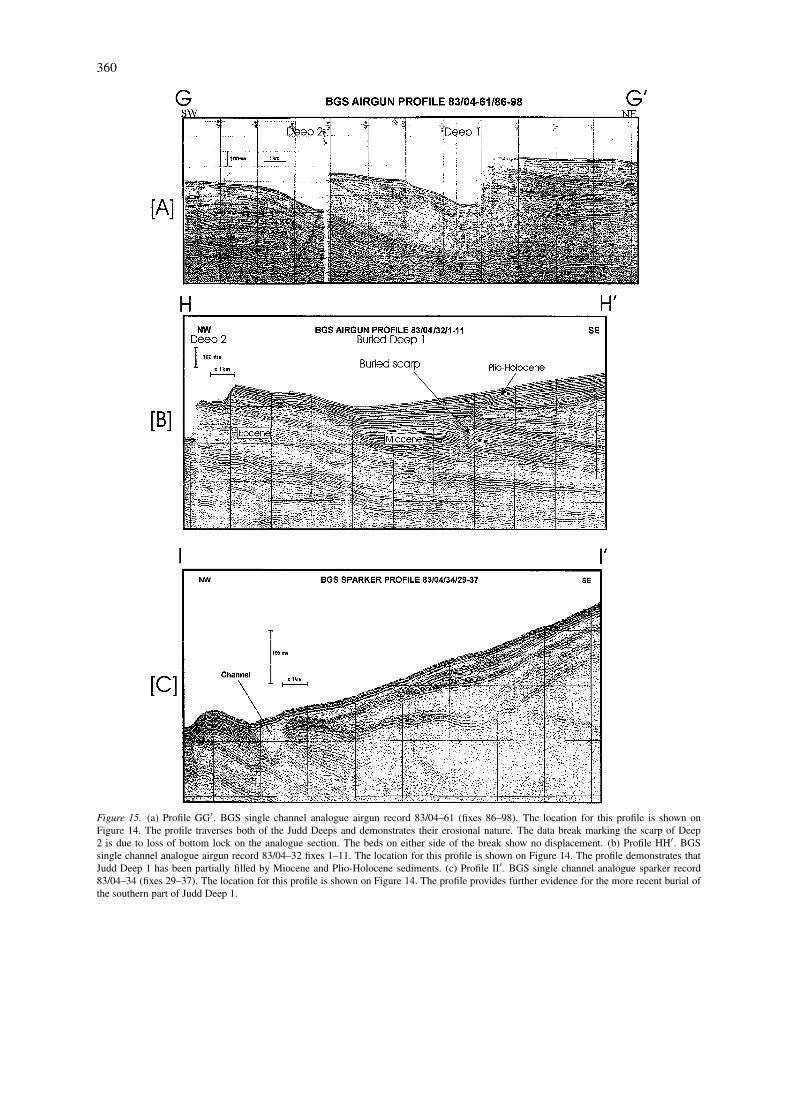
Figure 15. (a) Profile GG′. BGS single channel analogue airgun record 83/04–61 (fixes 86–98). The location for this profile is shown onFigure 14. The profile traverses both of the Judd Deeps and demonstrates their erosional nature. The data break marking the scarp of Deep2 is due to loss of bottom lock on the analogue section. The beds on either side of the break show no displacement. (b) Profile HH′. BGSsingle channel analogue airgun record 83/04–32 fixes 1–11. The location for this profile is shown on Figure 14. The profile demonstrates thatJudd Deep 1 has been partially filled by Miocene and Plio-Holocene sediments. (c) Profile II′. BGS single channel analogue sparker record83/04–34 (fixes 29–37). The location for this profile is shown on Figure 14. The profile provides further evidence for the more recent burial ofthe southern part of Judd Deep 1.

361
Figure 16. A full colour 3D perspective view of the Judd Deeps viewed from southeast. Red indicates shallow bathymetry, blue shows deeperbathymetry. Vertical exaggeration 5,000%. Illuminated from the northeast. Note the smooth texture of the seafloor in the Deeps.
Firstly, elongate contourite mounds are seen in thenortheast of the image. They are presumed to mark thesouthernmost extent of the contourite mounds shownin panel A. The second notable feature is the Afenslide; this is the only known submarine slide on theWest Shetland Slope and is thought to have failed ini-tially before 5,500 years B.P. (Holmes et al., 1999).Profile BB’ is a sparker profile across the feature (Fig-ure 6), reproduced from Long and Gillespie (1997). Itis of interest to note that the height of the debris flow
above the surrounding FSC seabed is no more than10 ms (7.5 m) at this point, yet it is sharply definedon the seabed image. The third major feature seenon Figure 5 is the development of a major sedimentwave field between the 200 m and 600 m isobaths. TheWNW–ESE trending waves are partially degraded byterracing artefacts but appear to have a wavelength ofapproximately 2 km. In this region the sediment wavesdie out at the transition depth from surface to bottomwater at approximately 600 m. The lower levels of the

362
Figure 17. Detailed Image Panel G. Illumination from northeast. The image covers part of the Faroese slope and floor of the Faroe-ShetlandChannel. A debris fan system prograding over a seafloor dominated by polygonal cracking is imaged, whilst an elongate contourite mound isdeveloped against a north–south structural high to the west of the debris fan. The inset shows a detailed contour map at 10 m intervals over thecontourite mound superimposed on the seabed image.

363
Fig
ure
18.
Det
aile
dIm
age
Pane
lH
.Illu
min
atio
nfr
omno
rthe
ast.
The
imag
eco
vers
the
floor
ofth
eFa
roe-
Shet
land
Cha
nnel
inU
Kqu
adra
nts
213
and
the
east
of21
4.W
ithth
eex
cept
ion
ofa
wea
ksc
arp
fron
t,th
eflo
orof
the
Faro
e-Sh
etla
ndC
hann
elap
pear
sto
befe
atur
eles
sw
ithso
me
mou
ndin
gin
the
east
.T
hem
ound
ing
isa
drap
ere
flect
ing
deep
erto
pogr
aphy
.Pi
ckin
gar
tefa
cts
degr
ade
the
imag
equ
ality
inth
eea
st,w
hile
mig
ratio
nar
tefa
cts
over
data
gaps
are
obse
rved
astig
htpi
nnac
les.
364
surface water are subjected to irregular internal waves(van Raaphorst et al., 2001) which may impede orprevent the development of sedimentary bedforms.
Panel C. Figure 7 shows a detailed image coveringUK quadrant 206. Some of the surveys in the southernpart of the image area were acquired with a NW–SEorientation, consequently the survey footprint in theseareas are enhanced by the northeastern illuminationdirection. Despite this, major lineaments are readilyobserved in waters less than 200 m deep. These arehere interpreted as major glacial moraines markingsignificant standstills of the ice front during the lastglaciation. Profile CC′ (Figure 8) is a BGS sparkerprofile across two of the major moraines marked C1and C2 on both Figures 7 and 8. The elevation of thefeatures above the seafloor is of the order of 10 msat this point. The minor lineaments that are sub-parallel to these moraines are due to seabed featuresof even lower elevation and may represent annual re-treat moraines. In waters greater than 350 m the imageshows the development of debris flows. There are alsocurious gullies that are sub-parallel to the strike ofthe slope indicated as cross-cutting incisions of un-known provenance on Figure 7. These may also beiceberg plough marks but if so, represent late stagevery deep-draft bergs. (Belderson et al., 1973).
Panel D. Figure 9 shows a detailed image coveringUK quadrant 205. The most obvious features are thecomplex debris flow lobes, linear gullies and associ-ated levees developed north of 60◦30′. These gullieshave been previously documented in Kenyon (1987).Profile DD′ (Figure 10) is a sparker profile traversingsome of these linear gullies which have been labelledD1, D2, D3 & D4 on both Figures 9 and 10. GullyD2 is approximately 300 m wide and 4.5 m (6 ms)deep. The sparker profile clearly shows the gullies andtheir associated levees and demonstrates, yet again,a high correspondence between features seen in boththe seabed and high-resolution seismic data. As inpanel C a number of incisions of unknown origin runsub-parallel to the strike of the slope. However, theircrosscutting character suggests that they were formedvery late, after the surface debris flows had ceased tobe active. They are at the lower depth range of reportediceberg ploughmarks (Masson, 2001).
Panel E. Figure 11 shows a detailed image coveringthe southern half of UK quadrant 204. This regionof the seabed image is described and interpreted in
Holmes et al. (in press). The deep-water areas between900 m–1,000 m in the north are generally featurelessand well scoured. Further south, the debris fans andchannels of the Rona Apron can be seen at depthsranging from the shelf break at 200 m down to justover 900 m. This major feature is one of severalPliocene-Quaternary depocentres on the deep-waterAtlantic margin of northwest Britain (Stoker, 1995)and has been interpreted as a constructional slope frontor apron fed from an ice sheet extending beyond theshelf break (Holmes et al., in press). The other fea-tures shown are the eastern half of the Judd Deeps anda scoured hollow complex in the vicinity of profileEE′ (Figure 12), reproduced from Long and Gille-spie (1997). The presence of this feature and the JuddDeeps attests to the strong bottom currents that createdand maintain them today, despite the input of largevolumes of debris from the Rona apron. It is suggestedthat the smooth surface of the distal fans of the RonaApron in this area (Figure 11, middle) may be due toreworking by bottom currents.
At about the 300 m isobath a line of hollows hasbeen imaged. These features have been called a scourhole complex and attributed to vertical spouts of wa-ter descending through an ice-sheet by Holmes et al.(in press). If this hypothesis is correct, the scour holecomplex may represent the former limit to late Pleis-tocene ice sheet. However, other interpretations arepossible such as iceberg scour holes (Masson et al.,1997) or mass-failure of the upper slope with theroughness of the sea bed accentuated by the strongnorthward-flowing slope current (M. S. Stoker, 2001,pers. communication). Profile FF′ (Figure 13) is asparker line that traverses one of the hollows and theshelf break as well as the shelf. The scour hollow andshelf break, are clearly observed on the profile. Inthis part of the image, the shelf area shallower than200 m, does not reveal any clear pattern. It is as yetunclear if this represents a data problem or reflectsthe true nature of the seabed in this region. Figure 13doesn’t appear to indicate a markedly more irregularseabed on the shelf than on the slope, although thisarea could be expected to have suffered severe icebergturbation which would give rise to a very complexseabed topography.
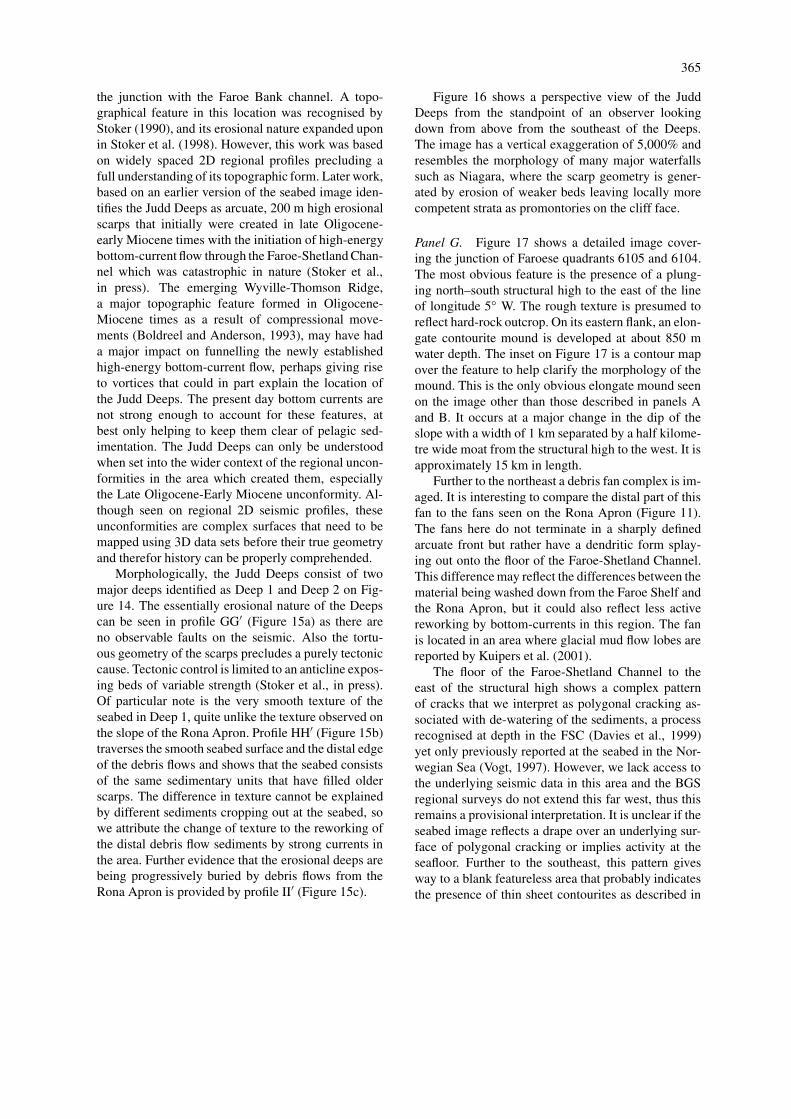
Panel F. Figure 14 shows a detailed image cover-ing the junction of Faroese quadrant 6005 and UKquadrant 176. The most spectacular features on theseabed image are the Judd Deeps that lie at the nar-rowest part of the Faroe-Shetland Channel just before
365
the junction with the Faroe Bank channel. A topo-graphical feature in this location was recognised byStoker (1990), and its erosional nature expanded uponin Stoker et al. (1998). However, this work was basedon widely spaced 2D regional profiles precluding afull understanding of its topographic form. Later work,based on an earlier version of the seabed image iden-tifies the Judd Deeps as arcuate, 200 m high erosionalscarps that initially were created in late Oligocene-early Miocene times with the initiation of high-energybottom-current flow through the Faroe-Shetland Chan-nel which was catastrophic in nature (Stoker et al.,in press). The emerging Wyville-Thomson Ridge,a major topographic feature formed in Oligocene-Miocene times as a result of compressional move-ments (Boldreel and Anderson, 1993), may have hada major impact on funnelling the newly establishedhigh-energy bottom-current flow, perhaps giving riseto vortices that could in part explain the location ofthe Judd Deeps. The present day bottom currents arenot strong enough to account for these features, atbest only helping to keep them clear of pelagic sed-imentation. The Judd Deeps can only be understoodwhen set into the wider context of the regional uncon-formities in the area which created them, especiallythe Late Oligocene-Early Miocene unconformity. Al-though seen on regional 2D seismic profiles, theseunconformities are complex surfaces that need to bemapped using 3D data sets before their true geometryand therefor history can be properly comprehended.
Morphologically, the Judd Deeps consist of twomajor deeps identified as Deep 1 and Deep 2 on Fig-ure 14. The essentially erosional nature of the Deepscan be seen in profile GG′ (Figure 15a) as there areno observable faults on the seismic. Also the tortu-ous geometry of the scarps precludes a purely tectoniccause. Tectonic control is limited to an anticline expos-ing beds of variable strength (Stoker et al., in press).Of particular note is the very smooth texture of theseabed in Deep 1, quite unlike the texture observed onthe slope of the Rona Apron. Profile HH′ (Figure 15b)traverses the smooth seabed surface and the distal edgeof the debris flows and shows that the seabed consistsof the same sedimentary units that have filled olderscarps. The difference in texture cannot be explainedby different sediments cropping out at the seabed, sowe attribute the change of texture to the reworking ofthe distal debris flow sediments by strong currents inthe area. Further evidence that the erosional deeps arebeing progressively buried by debris flows from theRona Apron is provided by profile II′ (Figure 15c).
Figure 16 shows a perspective view of the JuddDeeps from the standpoint of an observer lookingdown from above from the southeast of the Deeps.The image has a vertical exaggeration of 5,000% andresembles the morphology of many major waterfallssuch as Niagara, where the scarp geometry is gener-ated by erosion of weaker beds leaving locally morecompetent strata as promontories on the cliff face.
Panel G. Figure 17 shows a detailed image cover-ing the junction of Faroese quadrants 6105 and 6104.The most obvious feature is the presence of a plung-ing north–south structural high to the east of the lineof longitude 5◦ W. The rough texture is presumed toreflect hard-rock outcrop. On its eastern flank, an elon-gate contourite mound is developed at about 850 mwater depth. The inset on Figure 17 is a contour mapover the feature to help clarify the morphology of themound. This is the only obvious elongate mound seenon the image other than those described in panels Aand B. It occurs at a major change in the dip of theslope with a width of 1 km separated by a half kilome-tre wide moat from the structural high to the west. It isapproximately 15 km in length.
Further to the northeast a debris fan complex is im-aged. It is interesting to compare the distal part of thisfan to the fans seen on the Rona Apron (Figure 11).The fans here do not terminate in a sharply definedarcuate front but rather have a dendritic form splay-ing out onto the floor of the Faroe-Shetland Channel.This difference may reflect the differences between thematerial being washed down from the Faroe Shelf andthe Rona Apron, but it could also reflect less activereworking by bottom-currents in this region. The fanis located in an area where glacial mud flow lobes arereported by Kuipers et al. (2001).
The floor of the Faroe-Shetland Channel to theeast of the structural high shows a complex patternof cracks that we interpret as polygonal cracking as-sociated with de-watering of the sediments, a processrecognised at depth in the FSC (Davies et al., 1999)yet only previously reported at the seabed in the Nor-wegian Sea (Vogt, 1997). However, we lack access tothe underlying seismic data in this area and the BGSregional surveys do not extend this far west, thus thisremains a provisional interpretation. It is unclear if theseabed image reflects a drape over an underlying sur-face of polygonal cracking or implies activity at theseafloor. Further to the southeast, this pattern givesway to a blank featureless area that probably indicatesthe presence of thin sheet contourites as described in

366
Stoker et al. (1998). In the very southeastern corner ofthe panel a curious circular hollow is imaged. We ten-tatively interpret this feature as another bottom-currenterosional hollow, comparable with the hole seen onFigure 11.
Panel H. Figure 18 is the final panel in this set inFaroese quadrant 6103 and UK quadrant 213. Withthe exception of a weak scarp front on the northernlimit of the image, the seabed is essentially featurelessin the western half of the panel with irregular moundsappearing more frequently as we proceed eastwardsand into shallower waters. We interpret these moundsas reflecting a sediment drape over the underlying LateOligocene Early Miocene unconformity. This uncon-formity has a pronounced topography dominated bypolygonal and general tectonic faulting. Regrettablythe strong picking artefacts on the eastern half of theimage obscures most of the detail, so that it is diffi-cult to draw more conclusions from this image panel.Numerous tight circular features are observed to thesouthwest of the picking artefacts which at first sightcould be interpreted as hollows or pinnacles. Exami-nation of the underlying 3D seismic in the area revealsthat these are geophysical artefacts generated by mi-gration smiles at the edges of small data gaps at thelevel of the seabed. The origin of the weak scarp frontis unknown at present but may reflect deeper structure.
Conclusions
This work clearly demonstrates that 3D commercialseismic data can provide surprisingly detailed imagesof the seafloor in water depths greater than 200 m.The combination of several data sets allows regionalinterpretations of seabed features and processes. Ex-amination of single data sets in isolation is unlikelyto be as effective without an overview of the regionalsetting.
There is good agreement between features ob-served on BGS high-resolution seismic profiles andthe seabed image. Features with a vertical amplitudeof 10 ms (7.5 m) or greater are always imaged, andwhere noise levels permit, even features of half thisamplitude can be detected on the seabed image.
The seabed image of the Faroe-Shetland Chan-nel provides ample evidence for the operation of anumber of sedimentary processes in this area. Onthe West Shetland Shelf, the presence of moraines,scour hollows and iceberg plough-marks attests to the
work of glacial processes. On the slope, debris flowsare observed and there is one example of slope fail-ure. In addition to these down-slope processes, thestrong surface and bottom currents have given rise tothe development of sediment-wave fields and elongatecontourite mounds on the slope, to sheeted contouriteson the floor of the Faroe-Shetland Channel, as well asto active erosion of the seabed. More subtly, there isevidence that these currents may also be at work mod-ifying the deep-water fans and reworking debris-flowdeposits on the Rona Apron. Finally, there is also ev-idence for fluid escape processes manifest in the formof polygonal fractures.
This paper presents an interim version of theseabed image. We aim to improve coverage with newdata and to improve on the quality of existing data byexamination of the underlying seismic volumes, wherepossible, so that we may minimise data artefacts.There is also a need to do more detailed interpreta-tion of the image, integrating it more fully with theavailable high-resolution seismic data in the area.
Acknowledgements
This paper is published with the permission of the Ex-ecutive Director, British Geological Survey (NERC).We also wish to thank the industry members of theWestern Frontier Association, (Agip, Amerada Hess,BP, Conoco, Enterprise, ExxonMobil, Norsk Hydro,Shell, Statoil, Texaco, TotalFinaElf) and the membersof former GEM consortium (Agip, Amerada Hess,Anadarko, BP, Conoco, DONG, Enterprise, Exxon-Mobil, Marathon, Murphy Eastern, Norsk Hydro,Phillips, Statoil, Texaco, TotalFinaElf and Vema Oil &Gas) for their collaboration in providing data sets. Wewish to thank PGS Ltd., Veritas DGC Ltd. and Geco-Prakla for permission to use the seabed interpretationfrom their speculative 3D data in the preparation ofthis paper. Thanks are also due to Dr Martyn Stokerfor his detailed comments and suggestions.
References
Belderson, R. H., Kenyon, N. H. and Wilson, J. B., 1973, IcebergPloughmarks in the Northeast Atlantic. Palaeogeogr., Palaeocli-matol. Palaeoecol. 13, 215–224.
BODC, 1997, The GEBCO Digital Atlas published by the BritishOceanographic Data centre on behalf of IOC and IHO, 1997.
Boldreel, L. O. and Anderson, M. S., 1993, Late Paleocene toMiocene compression in the Faeroe-Rockall area. in: Parker, J.R. (ed.), Petroleum Geology of Northwest Europe: Proceedings
367
of the 4th Conference. Published by The Geological Society,London, pp. 1025–1034.
Bulat, J. and Long, D., 1998, Creation of seabed feature mapsfrom 3D seismic horizon data sets. British Geological SurveyTechnical Report WB/98/38C.
Bulat, J., 2000, Compilation of seabed image maps of the Faroe-Shetland Channel using WFA and GEM data sets. British Geo-logical Survey Technical Report CR/00/41.
Damuth, J. E. and Olsen H. C., 1993, Preliminary observationsof Neogene-Quaternary depositional processes in the Faeroe-Shetland Channel revealed by high-resolution seismic faciesanalysis. in: Parker, J. R. (ed.), Petroleum Geology of NorthwestEurope: Proceedings of the 4th Conference. Published by TheGeological Society, London, pp. 1035–1045.
Davies, R., Cartwright, J. and Rana, J., 1999, Giant hummocksin deep-water marine sediments; evidence for large-scale dif-ferential compaction and density inversion during early burial.Geology 27 907–910.
Dooley, H. D. and Meincke, J., 1981, Circulation and water massesin the Faeroes Channels during overflow ′73. Dtsch. Hydrogr. Z.34, 4–54.
Graham, C. C., 1990, Judd 60◦ N 06◦ W Seabed sediments1:250,000 map sheet. British Geological Survey. HMSO for theBritish Geological Survey, London.
Holmes, R., Masson, D. G. and Sankey, M., 1999, Geometry andtiming of the AFEN submarine landslide west of Shetland. inAbstracts north-east Atlantic Slope processes: Multi-disciplinaryapproaches. Southampton Oceanography Centre, Southampton,p. 42.
Holmes, R., Bulat, J., Hamilton, I., and Long, D., in press, Morphol-ogy of an ice-sheet limit and constructional glacially-fed slopefront, Faroe-Shetland Channel. in European Continental Mar-gin Sedimentary Processes: An Atlas Of Side-Scan Sonar AndSeismic Images.
Howe, J. A., 1996, Turbidite and contourite sediment waves in thenorthern Rockall Trough, North Atlantic Ocean. Sedimentology43: 219–234.
Kenyon, N. H., 1987, Mass-wasting features on the continentalslope of Northwest Europe. Mar. Geol. 74, 57–77.
Kuipers, A., Nielsen, T., Akhmetzhanov, A., de Haas, H., Kenyon,N. H., and van Weering, T. C. E., 2001, Late Quaternary slopeinstability on the Faroe margin: mass flow features and timing ofevents. Geo-Marine Lett. 20, 149–159.
Long, D. and Gillespie, E. J., 1997, Seabed and near-seabedgeohazards on the shelf and slope west of Shetland. BritishGeological Survey Technical Report WB/97/19C.
Long, D., 2001, The Western Frontiers Association – Evaluatingseabed conditions west of the UK. Continental Shelf Res. 21,811–824.
Masson, D. G., Bett, B. J. and Birch, K. G., 1997, Atlantic marginenvironmental survey. Sea Technol. 38, 52–59.
Masson, D. G., 2001, Sedimentary processes shaping the easternslope of the Faeroe-Shetland Channel. Continental Shelf Res.,21, 825–857.
Marfurt, K. J., Scheet, R. M., Sharp, J. A., Harper, M. G., 1998,Suppression of the acquisition footprint for seismic sequenceattribute mapping. Geophysics 62 (6), 1774–1778.
Rasmussen, T. L., van Weering, T. C. E., and Labeyrie, L., 1996,High resolution stratigraphy of the Faeroe-Shetland Channel andits relation to North Atlantic paleoceanography: The last 87 kyr.Mar. Geol., 131, 75–88.
Stevenson, A. G., 1991a, Flett 61◦ N 02◦ W Quaternary Geology1:250,000 map sheet. British Geological Survey. HMSO for theBritish Geological Survey, London.
Stevenson, A. G., 1991b, Miller 61◦ N 04◦ W Quaternary Geology1:250,000 map sheet. British Geological Survey. HMSO for theBritish Geological Survey, London.
Stoker, M. S., 1990, Judd 60◦ N 06◦ W Quaternary Geology1:250,000 map sheet. British Geological Survey. HMSO for theBritish Geological Survey, London.
Stoker, M. S., Hitchen, K., and Graham, C. C., 1993, United King-dom offshore regional report: The geology of the Hebrides andWest Shetland shelves, and adjacent deep-water areas. HMSOfor the British Geological Survey, London.
Stoker, M. S., 1995, The influence of glacigenic sedimentationon slope-apron development on the continental margin off NWBritain. in Scrutton, R. A., Stoker, M. S., Shimmield, G. B. andTudhope, A. W. (eds.), The Tectonics, Sedimentation and Palaeo-ceanography of the North Atlantic Region. Geol. Soc. London,Spec. Publ. 90, 159–177.
Stoker, M. S., Ackhurst, M. C. Howe, J. A. and Stow, D. A. V.,1998, Sediment drifts and contourites on the continental marginoff northwest Britain. Sed. Geol. 115, 33–51.
Stoker, M. S., Long, D. and Bulat, J., in press, A record ofmid-Cainozoic catastrophic deep-water erosion in the Faroe-Shetland Channel. in European Continental Margin SedimentaryProcesses: An Atlas Of Side-Scan Sonar And Seismic Images.
Turrel, W. R., Slesser, G., Adams, R. D., Paynes, R., and Gillibrand,P. A., 1999, Decadal variability in the composition of FaroeShetland Channel bottom water. Deep-Sea Res. 46, 1–25.
van Raaphorst, W., Malschaert, H., van Haren, H., Boer, W., andBrummer, G.-J., 2001, Cross-slope zonation of erosion and de-position in the Faeroe-Shetland Channel, North Atlantic Ocean.Deep Sea Res. 48 567–591.
Vogt, P. R., 1997, Hummock fields in the Norway Basin and EasternIceland Plateau: Rayleigh-Taylor instabilities? Geology 25, 531–534.
Copyright © 2022 FDOKUMEN