Sediment transfer and the hydrological cycle of Himalayan rivers in Nepal
9
Hydrology, environment Sediment transfer and the hydrological cycle of Himalayan rivers in Nepal Transfert de se ´diments et cycle hydrologique des rivie `res himalayennes au Ne ´pal Christoff Andermann a,b,1 , Ste ´ phane Bonnet c, *, Alain Crave a , Philippe Davy a , Laurent Longuevergne a , Richard Gloaguen b a Geosciences Rennes, Universite ´ de Rennes 1, CNRS/INSU, UMR 6118, Campus de Beaulieu, 35042 Rennes, France b Remote Sensing Group, Geology Institute, TU Bergakademie Freiberg, B.-von-Cotta-Str. 2, 09599 Freiberg, Germany c Ge ´osciences Environnement Toulouse (GET), Observatoire Midi-Pyre ´ne ´es, Universite ´ de Toulouse, CNRS, IRD, 14, avenue Edouard-Belin, 31400 Toulouse, France 1. Introduction In order to better understand the interactions between climate, erosion and tectonics (e.g. Bonnet, 2009; Whipple, 2009) and more generally, the dynamics of mass transfers C. R. Geoscience 344 (2012) 627–635 A R T I C L E I N F O Article history: Received 12 July 2012 Accepted after revision 17 October 2012 Available online 20 November 2012 Written on invitation of the Editorial Board Keywords: Geomorphology Hydrology Groundwater Monsoon Sediment Himalayas Nepal Mots cle ´s : Ge ´ omorphologie Hydrologie Eau souterraine Mousson Se ´ diment Himalaya Ne ´ pal A B S T R A C T We present an analysis of daily water discharge and suspended sediment concentration measurements for the three main drainage basins in Nepal, on the basis of recent published papers. We first show how precipitation-discharge data can be used to highlight the impact of groundwater storage on the annual hydrological cycle of Himalayan rivers. Then, we show how the concentration of suspended sediment in rivers varies at the year scale depending on the river discharge cycle, as well as how the release of groundwater impacts the concentration of materials in rivers. Finally, we propose a new conceptual model for the mobilization and transportation of material within the monsoonal discharge cycle in the central Himalayas. ß 2012 Published by Elsevier Masson SAS on behalf of Acade ´ mie des sciences. R E ´ S U M E ´ Nous pre ´ sentons l’analyse des chroniques journalie ` res de de ´ but et de flux de se ´ diments en suspension pour les trois principaux fleuves du Ne ´ pal, sur la base de diffe ´ rents travaux publie ´s re ´ cemment. Nous montrons dans un premier temps que les relations entre pre ´ cipitation et de ´ bit permettent de mettre en e ´ vidence un impact majeur des aquife ` res sur le cycle hydrologique annuel des fleuves himalayens. Dans un deuxie ` me temps, nous montrons comment la concentration des se ´ diments en suspension de ces fleuves varie a ` l’e ´ chelle annuelle en relation avec le cycle hydrologique, ainsi que l’impact du de ´ stockage des aquife ` res sur les concentrations mesure ´ es. Sur la base de ces donne ´ es, nous proposons finalement un nouveau mode ` le conceptuel de mobilisation et de transport de matie ` re en relation avec le cycle annuel de mousson qui caracte ´ rise l’Himalaya central. ß 2012 Publie ´ par Elsevier Masson SAS pour l’Acade ´ mie des sciences. * Corresponding author. E-mail address: [email protected] (S. Bonnet). 1 Present address: University of Potsdam/Institute of Earth and Environmental Science. Contents lists available at SciVerse ScienceDirect Comptes Rendus Geoscience ww w.s cien c edir ec t.c om 1631-0713/$ – see front matter ß 2012 Published by Elsevier Masson SAS on behalf of Acade ´ mie des sciences. http://dx.doi.org/10.1016/j.crte.2012.10.009
-
Upload
univ-rennes1 -
Category
Documents
-
view
0 -
download
0
Transcript of Sediment transfer and the hydrological cycle of Himalayan rivers in Nepal
Hy
Se
Tr
ChLaa Geb Remc Geo
C. R. Geoscience 344 (2012) 627–635
A R
Artic
Rece
Acce
Avai
Wri
Edit
Keyw
Geo
Hyd
Grou
Mon
Sedi
Him
Nep
Mot
Geo
Hyd
Eau
Mou
Sedi
Him
Nep
*
1
Env
163
http
drology, environment
diment transfer and the hydrological cycle of Himalayan rivers in Nepal
ansfert de sediments et cycle hydrologique des rivieres himalayennes au Nepal
ristoff Andermann a,b,1, Stephane Bonnet c,*, Alain Crave a, Philippe Davy a,urent Longuevergne a, Richard Gloaguen b
osciences Rennes, Universite de Rennes 1, CNRS/INSU, UMR 6118, Campus de Beaulieu, 35042 Rennes, France
ote Sensing Group, Geology Institute, TU Bergakademie Freiberg, B.-von-Cotta-Str. 2, 09599 Freiberg, Germany
sciences Environnement Toulouse (GET), Observatoire Midi-Pyrenees, Universite de Toulouse, CNRS, IRD, 14, avenue Edouard-Belin, 31400 Toulouse, France
1. Introduction
In order to better understand the interactions betweenclimate, erosion and tectonics (e.g. Bonnet, 2009; Whipple,2009) and more generally, the dynamics of mass transfers
T I C L E I N F O
le history:
ived 12 July 2012
pted after revision 17 October 2012
lable online 20 November 2012
tten on invitation of the
orial Board
ords:
morphology
rology
ndwater
soon
ment
alayas
al
s cles :
morphologie
rologie
souterraine
sson
ment
alaya
al
A B S T R A C T
We present an analysis of daily water discharge and suspended sediment concentration
measurements for the three main drainage basins in Nepal, on the basis of recent
published papers. We first show how precipitation-discharge data can be used to highlight
the impact of groundwater storage on the annual hydrological cycle of Himalayan rivers.
Then, we show how the concentration of suspended sediment in rivers varies at the year
scale depending on the river discharge cycle, as well as how the release of groundwater
impacts the concentration of materials in rivers. Finally, we propose a new conceptual
model for the mobilization and transportation of material within the monsoonal discharge
cycle in the central Himalayas.
� 2012 Published by Elsevier Masson SAS on behalf of Academie des sciences.
R E S U M E
Nous presentons l’analyse des chroniques journalieres de debut et de flux de sediments en
suspension pour les trois principaux fleuves du Nepal, sur la base de differents travaux
publies recemment. Nous montrons dans un premier temps que les relations entre
precipitation et debit permettent de mettre en evidence un impact majeur des aquiferes
sur le cycle hydrologique annuel des fleuves himalayens. Dans un deuxieme temps, nous
montrons comment la concentration des sediments en suspension de ces fleuves varie a
l’echelle annuelle en relation avec le cycle hydrologique, ainsi que l’impact du destockage
des aquiferes sur les concentrations mesurees. Sur la base de ces donnees, nous proposons
finalement un nouveau modele conceptuel de mobilisation et de transport de matiere en
relation avec le cycle annuel de mousson qui caracterise l’Himalaya central.
� 2012 Publie par Elsevier Masson SAS pour l’Academie des sciences.
Corresponding author.
E-mail address: [email protected] (S. Bonnet).
Present address: University of Potsdam/Institute of Earth and
ironmental Science.
Contents lists available at SciVerse ScienceDirect
Comptes Rendus Geoscience
ww w.s c ien c edi r ec t . c om
1-0713/$ – see front matter � 2012 Published by Elsevier Masson SAS on behalf of Academie des sciences.
://dx.doi.org/10.1016/j.crte.2012.10.009
C. Andermann et al. / C. R. Geoscience 344 (2012) 627–635628
at the Earth’s surface, it is important to understand theerosion rates and patterns in mountain belts as well astheir climatic controls. Among the existing methods formeasuring erosion rates, the measurement of sedimentloads in rivers may be the most straightforward solutionfor estimating erosion. In fact, sediment loads have beenstudied for this purpose and to constrain how erosion ratesvary according to their potential controlling factors (e.g.Ahnert, 1970; Dadson et al., 2003; Milliman and Syvitski,1992; Pinet and Souriau, 1988; Summerfield and Hulton,1994; Wolman and Miller, 1960). However, the interpre-tation of sediment load measurements is not straightfor-ward for several reasons. First of all, numerous studieshave documented discrepancies between short-termerosion rates derived from suspended sediment data andmillennial- to geological-scale ones (e.g. Dadson et al.,2003; Kirchner et al., 2001; Meyer et al., 2010; Schalleret al., 2001). Several reasons for this are usually given,including the quality of the suspended sediment recorditself (e.g. sampling frequency and length of recordcompared to the timescale for the occurrence of events),the impact of internal storage within drainage basins, theeffect of anthropogenic influences, etc. Second, the use ofsediment load measurements to derive erosion rates needsto account for the sediment transfer mechanisms fromhillslopes to the rivers, as well as within the riversthemselves (e.g. Benda and Dunne, 1997). Fuller et al.(2003) demonstrated that the interpretation of thesuspended sediment record in Taiwan must at leastdistinguish between the transport-limited conditions(sediments are available and variations in the sedimentflux depends only on the transport capacity of the river)and the supply-limited conditions (variations in thesediment flux depend on the supply of sediments to theriver from the hillslopes).
In this article, we analyze daily water discharge andsediment flux measurements covering a period of severalyears for the three main drainage basins in Nepal, on thebasis of results obtained by Andermann et al. (2011, 2012a,2012b). We first show how precipitation-discharge datacan be used to highlight the impact of groundwater storageon the annual hydrological cycle of Himalayan rivers. Then,we show how the concentration of suspended sediment inrivers varies at the year scale depending on the riverdischarge cycle, as well as how the release of groundwaterimpacts the concentration of materials in rivers. Finally, wepropose a new conceptual model for the mobilization andtransportation of material within the monsoonal dischargecycle in the central Himalayas.
2. Setting and data
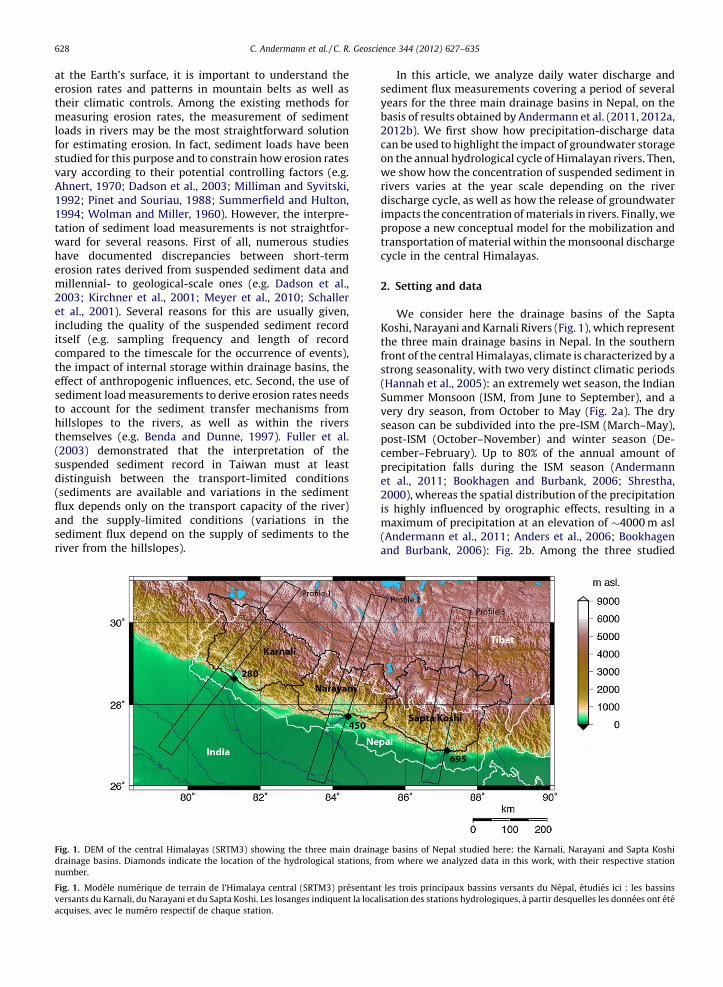
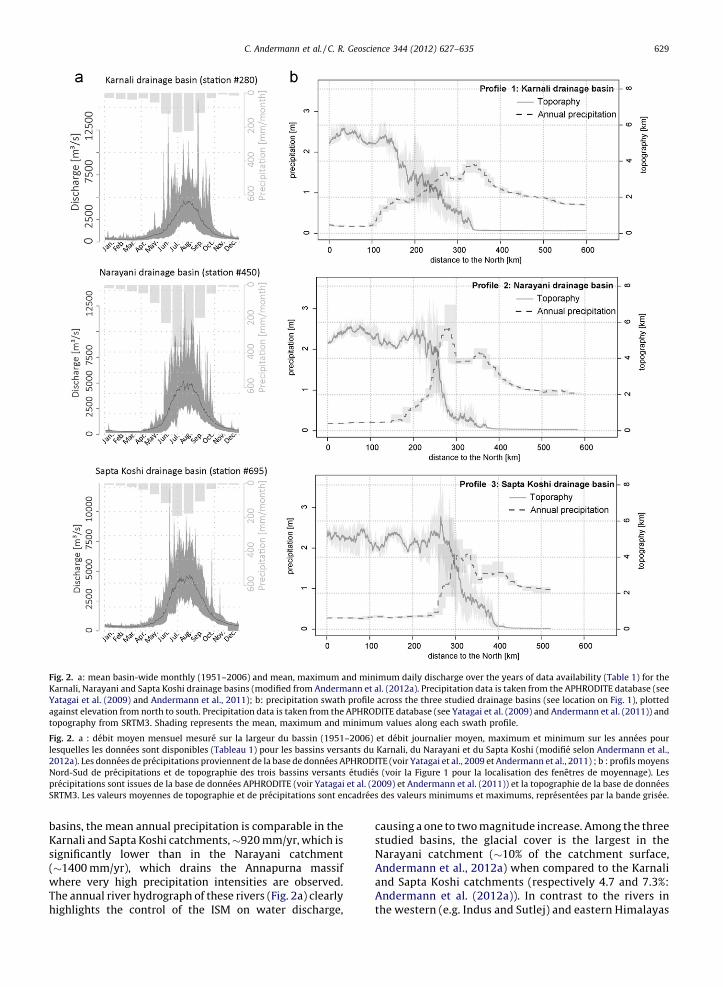
We consider here the drainage basins of the SaptaKoshi, Narayani and Karnali Rivers (Fig. 1), which representthe three main drainage basins in Nepal. In the southernfront of the central Himalayas, climate is characterized by astrong seasonality, with two very distinct climatic periods(Hannah et al., 2005): an extremely wet season, the IndianSummer Monsoon (ISM, from June to September), and avery dry season, from October to May (Fig. 2a). The dryseason can be subdivided into the pre-ISM (March–May),post-ISM (October–November) and winter season (De-cember–February). Up to 80% of the annual amount ofprecipitation falls during the ISM season (Andermannet al., 2011; Bookhagen and Burbank, 2006; Shrestha,2000), whereas the spatial distribution of the precipitationis highly influenced by orographic effects, resulting in amaximum of precipitation at an elevation of �4000 m asl(Andermann et al., 2011; Anders et al., 2006; Bookhagenand Burbank, 2006): Fig. 2b. Among the three studied
Fig. 1. DEM of the central Himalayas (SRTM3) showing the three main drainage basins of Nepal studied here: the Karnali, Narayani and Sapta Koshi
drainage basins. Diamonds indicate the location of the hydrological stations, from where we analyzed data in this work, with their respective station
number.
Fig. 1. Modele numerique de terrain de l’Himalaya central (SRTM3) presentant les trois principaux bassins versants du Nepal, etudies ici : les bassins
versants du Karnali, du Narayani et du Sapta Koshi. Les losanges indiquent la localisation des stations hydrologiques, a partir desquelles les donnees ont ete
acquises, avec le numero respectif de chaque station.
basKarsign(�1whThehig
Fig.
Karn
Yata
agai
topo
Fig.
lesq
201
Nor
prec
SRT
C. Andermann et al. / C. R. Geoscience 344 (2012) 627–635 629
ins, the mean annual precipitation is comparable in thenali and Sapta Koshi catchments, �920 mm/yr, which isificantly lower than in the Narayani catchment400 mm/yr), which drains the Annapurna massif
ere very high precipitation intensities are observed. annual river hydrograph of these rivers (Fig. 2a) clearlyhlights the control of the ISM on water discharge,
causing a one to two magnitude increase. Among the threestudied basins, the glacial cover is the largest in theNarayani catchment (�10% of the catchment surface,Andermann et al., 2012a) when compared to the Karnaliand Sapta Koshi catchments (respectively 4.7 and 7.3%:Andermann et al. (2012a)). In contrast to the rivers inthe western (e.g. Indus and Sutlej) and eastern Himalayas
2. a: mean basin-wide monthly (1951–2006) and mean, maximum and minimum daily discharge over the years of data availability (Table 1) for the
ali, Narayani and Sapta Koshi drainage basins (modified from Andermann et al. (2012a). Precipitation data is taken from the APHRODITE database (see
gai et al. (2009) and Andermann et al., 2011); b: precipitation swath profile across the three studied drainage basins (see location on Fig. 1), plotted
nst elevation from north to south. Precipitation data is taken from the APHRODITE database (see Yatagai et al. (2009) and Andermann et al. (2011)) and
graphy from SRTM3. Shading represents the mean, maximum and minimum values along each swath profile.
2. a : debit moyen mensuel mesure sur la largeur du bassin (1951–2006) et debit journalier moyen, maximum et minimum sur les annees pour
uelles les donnees sont disponibles (Tableau 1) pour les bassins versants du Karnali, du Narayani et du Sapta Koshi (modifie selon Andermann et al.,
2a). Les donnees de precipitations proviennent de la base de donnees APHRODITE (voir Yatagai et al., 2009 et Andermann et al., 2011) ; b : profils moyens
d-Sud de precipitations et de topographie des trois bassins versants etudies (voir la Figure 1 pour la localisation des fenetres de moyennage). Les
ipitations sont issues de la base de donnees APHRODITE (voir Yatagai et al. (2009) et Andermann et al. (2011)) et la topographie de la base de donnees
M3. Les valeurs moyennes de topographie et de precipitations sont encadrees des valeurs minimums et maximums, representees par la bande grisee.
C. Andermann et al. / C. R. Geoscience 344 (2012) 627–635630
(e.g. Tsangpo-Brahmaputra), the contribution of snow andglacier melt runoff to the hydrological cycle is minor in thecentral Himalayas (Andermann et al., 2012a; Bookhagenand Burbank, 2010).
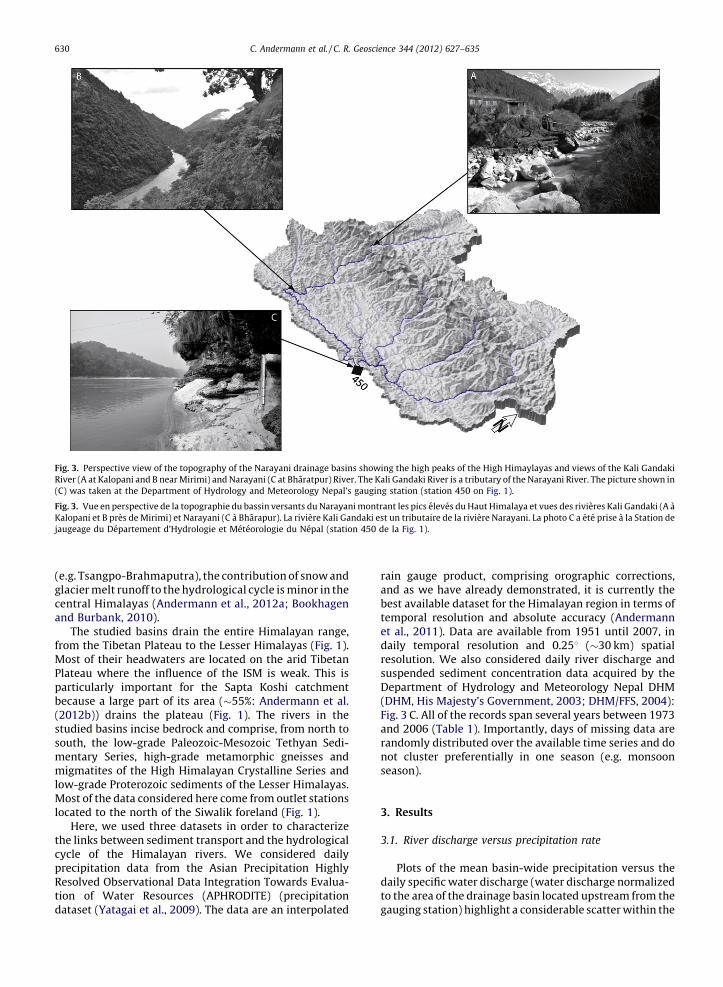
The studied basins drain the entire Himalayan range,from the Tibetan Plateau to the Lesser Himalayas (Fig. 1).Most of their headwaters are located on the arid TibetanPlateau where the influence of the ISM is weak. This isparticularly important for the Sapta Koshi catchmentbecause a large part of its area (�55%: Andermann et al.(2012b)) drains the plateau (Fig. 1). The rivers in thestudied basins incise bedrock and comprise, from north tosouth, the low-grade Paleozoic-Mesozoic Tethyan Sedi-mentary Series, high-grade metamorphic gneisses andmigmatites of the High Himalayan Crystalline Series andlow-grade Proterozoic sediments of the Lesser Himalayas.Most of the data considered here come from outlet stationslocated to the north of the Siwalik foreland (Fig. 1).
Here, we used three datasets in order to characterizethe links between sediment transport and the hydrologicalcycle of the Himalayan rivers. We considered dailyprecipitation data from the Asian Precipitation HighlyResolved Observational Data Integration Towards Evalua-tion of Water Resources (APHRODITE) (precipitationdataset (Yatagai et al., 2009). The data are an interpolated
rain gauge product, comprising orographic corrections,and as we have already demonstrated, it is currently thebest available dataset for the Himalayan region in terms oftemporal resolution and absolute accuracy (Andermannet al., 2011). Data are available from 1951 until 2007, indaily temporal resolution and 0.258 (�30 km) spatialresolution. We also considered daily river discharge andsuspended sediment concentration data acquired by theDepartment of Hydrology and Meteorology Nepal DHM(DHM, His Majesty’s Government, 2003; DHM/FFS, 2004):Fig. 3 C. All of the records span several years between 1973and 2006 (Table 1). Importantly, days of missing data arerandomly distributed over the available time series and donot cluster preferentially in one season (e.g. monsoonseason).
3. Results
3.1. River discharge versus precipitation rate
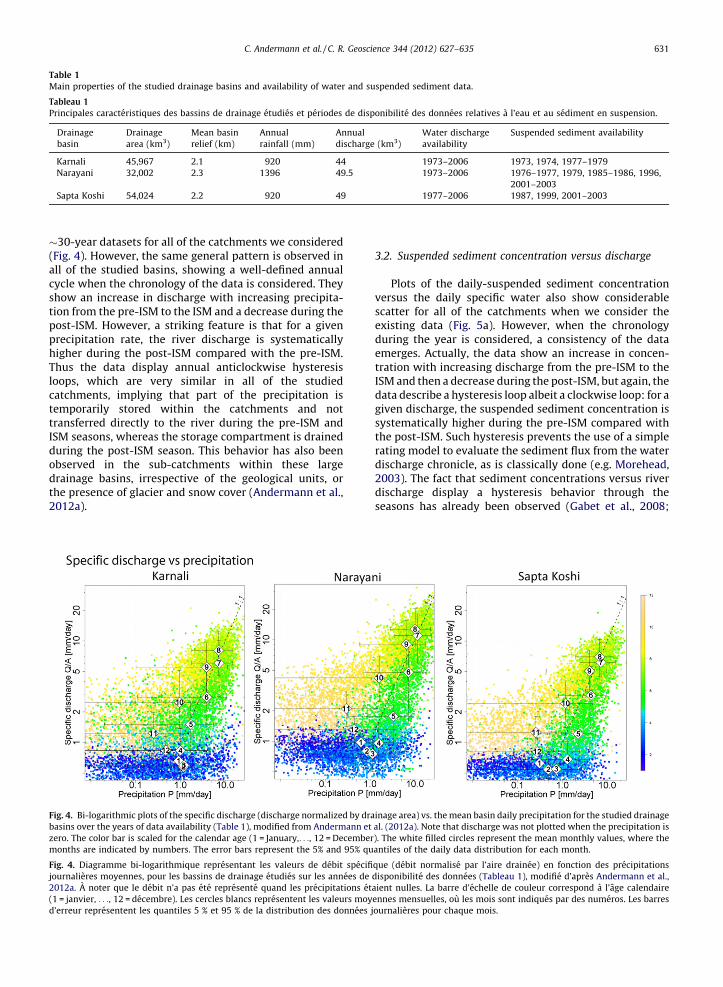
Plots of the mean basin-wide precipitation versus thedaily specific water discharge (water discharge normalizedto the area of the drainage basin located upstream from thegauging station) highlight a considerable scatter within the
Fig. 3. Perspective view of the topography of the Narayani drainage basins showing the high peaks of the High Himaylayas and views of the Kali Gandaki
River (A at Kalopani and B near Mirimi) and Narayani (C at Bharatpur) River. The Kali Gandaki River is a tributary of the Narayani River. The picture shown in
(C) was taken at the Department of Hydrology and Meteorology Nepal’s gauging station (station 450 on Fig. 1).
Fig. 3. Vue en perspective de la topographie du bassin versants du Narayani montrant les pics eleves du Haut Himalaya et vues des rivieres Kali Gandaki (A a
Kalopani et B pres de Mirimi) et Narayani (C a Bharapur). La riviere Kali Gandaki est un tributaire de la riviere Narayani. La photo C a ete prise a la Station de
jaugeage du Departement d’Hydrologie et Meteorologie du Nepal (station 450 de la Fig. 1).
�3(Figall
cycshotionposprehigThuloocattemtranISMdurobsdrathe201
Tab
Mai
Tabl
Prin
Dr
ba
Ka
Na
Sa
Fig.
basi
zero
mon
Fig.
jour
201
(1 =
d’er
C. Andermann et al. / C. R. Geoscience 344 (2012) 627–635 631
0-year datasets for all of the catchments we considered. 4). However, the same general pattern is observed inof the studied basins, showing a well-defined annualle when the chronology of the data is considered. Theyw an increase in discharge with increasing precipita-
from the pre-ISM to the ISM and a decrease during thet-ISM. However, a striking feature is that for a givencipitation rate, the river discharge is systematicallyher during the post-ISM compared with the pre-ISM.s the data display annual anticlockwise hysteresis
ps, which are very similar in all of the studiedchments, implying that part of the precipitation isporarily stored within the catchments and notsferred directly to the river during the pre-ISM and
seasons, whereas the storage compartment is draineding the post-ISM season. This behavior has also beenerved in the sub-catchments within these largeinage basins, irrespective of the geological units, or
presence of glacier and snow cover (Andermann et al.,2a).
3.2. Suspended sediment concentration versus discharge
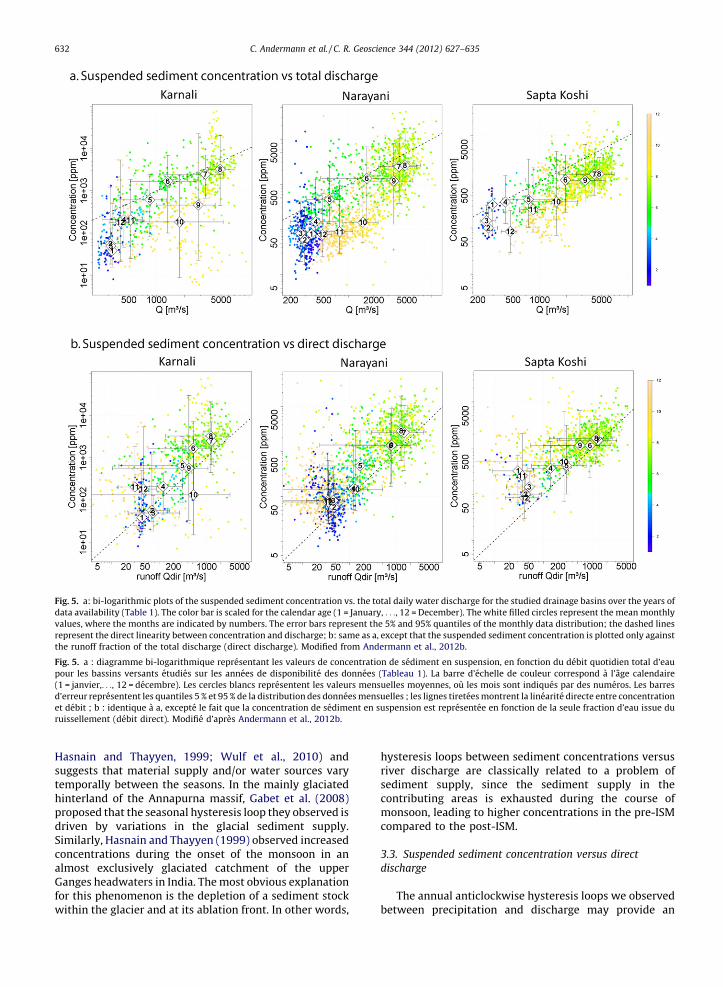
Plots of the daily-suspended sediment concentrationversus the daily specific water also show considerablescatter for all of the catchments when we consider theexisting data (Fig. 5a). However, when the chronologyduring the year is considered, a consistency of the dataemerges. Actually, the data show an increase in concen-tration with increasing discharge from the pre-ISM to theISM and then a decrease during the post-ISM, but again, thedata describe a hysteresis loop albeit a clockwise loop: for agiven discharge, the suspended sediment concentration issystematically higher during the pre-ISM compared withthe post-ISM. Such hysteresis prevents the use of a simplerating model to evaluate the sediment flux from the waterdischarge chronicle, as is classically done (e.g. Morehead,2003). The fact that sediment concentrations versus riverdischarge display a hysteresis behavior through theseasons has already been observed (Gabet et al., 2008;
le 1
n properties of the studied drainage basins and availability of water and suspended sediment data.
eau 1
cipales caracteristiques des bassins de drainage etudies et periodes de disponibilite des donnees relatives a l’eau et au sediment en suspension.
ainage
sin
Drainage
area (km3)
Mean basin
relief (km)
Annual
rainfall (mm)
Annual
discharge (km3)
Water discharge
availability
Suspended sediment availability
rnali 45,967 2.1 920 44 1973–2006 1973, 1974, 1977–1979
rayani 32,002 2.3 1396 49.5 1973–2006 1976–1977, 1979, 1985–1986, 1996,
2001–2003
pta Koshi 54,024 2.2 920 49 1977–2006 1987, 1999, 2001–2003
4. Bi-logarithmic plots of the specific discharge (discharge normalized by drainage area) vs. the mean basin daily precipitation for the studied drainage
ns over the years of data availability (Table 1), modified from Andermann et al. (2012a). Note that discharge was not plotted when the precipitation is
. The color bar is scaled for the calendar age (1 = January,. . ., 12 = December). The white filled circles represent the mean monthly values, where the
ths are indicated by numbers. The error bars represent the 5% and 95% quantiles of the daily data distribution for each month.
4. Diagramme bi-logarithmique representant les valeurs de debit specifique (debit normalise par l’aire drainee) en fonction des precipitations
nalieres moyennes, pour les bassins de drainage etudies sur les annees de disponibilite des donnees (Tableau 1), modifie d’apres Andermann et al.,
2a. A noter que le debit n’a pas ete represente quand les precipitations etaient nulles. La barre d’echelle de couleur correspond a l’age calendaire
janvier, . . ., 12 = decembre). Les cercles blancs representent les valeurs moyennes mensuelles, ou les mois sont indiques par des numeros. Les barres
reur representent les quantiles 5 % et 95 % de la distribution des donnees journalieres pour chaque mois.
C. Andermann et al. / C. R. Geoscience 344 (2012) 627–635632
Hasnain and Thayyen, 1999; Wulf et al., 2010) andsuggests that material supply and/or water sources varytemporally between the seasons. In the mainly glaciatedhinterland of the Annapurna massif, Gabet et al. (2008)proposed that the seasonal hysteresis loop they observed isdriven by variations in the glacial sediment supply.Similarly, Hasnain and Thayyen (1999) observed increasedconcentrations during the onset of the monsoon in analmost exclusively glaciated catchment of the upperGanges headwaters in India. The most obvious explanationfor this phenomenon is the depletion of a sediment stockwithin the glacier and at its ablation front. In other words,
hysteresis loops between sediment concentrations versusriver discharge are classically related to a problem ofsediment supply, since the sediment supply in thecontributing areas is exhausted during the course ofmonsoon, leading to higher concentrations in the pre-ISMcompared to the post-ISM.
3.3. Suspended sediment concentration versus direct
discharge
The annual anticlockwise hysteresis loops we observedbetween precipitation and discharge may provide an
Fig. 5. a: bi-logarithmic plots of the suspended sediment concentration vs. the total daily water discharge for the studied drainage basins over the years of
data availability (Table 1). The color bar is scaled for the calendar age (1 = January, . . ., 12 = December). The white filled circles represent the mean monthly
values, where the months are indicated by numbers. The error bars represent the 5% and 95% quantiles of the monthly data distribution; the dashed lines
represent the direct linearity between concentration and discharge; b: same as a, except that the suspended sediment concentration is plotted only against
the runoff fraction of the total discharge (direct discharge). Modified from Andermann et al., 2012b.
Fig. 5. a : diagramme bi-logarithmique representant les valeurs de concentration de sediment en suspension, en fonction du debit quotidien total d’eau
pour les bassins versants etudies sur les annees de disponibilite des donnees (Tableau 1). La barre d’echelle de couleur correspond a l’age calendaire
(1 = janvier,. . ., 12 = decembre). Les cercles blancs representent les valeurs mensuelles moyennes, ou les mois sont indiques par des numeros. Les barres
d’erreur representent les quantiles 5 % et 95 % de la distribution des donnees mensuelles ; les lignes tiretees montrent la linearite directe entre concentration
et debit ; b : identique a a, excepte le fait que la concentration de sediment en suspension est representee en fonction de la seule fraction d’eau issue du
ruissellement (debit direct). Modifie d’apres Andermann et al., 2012b.
altebetActcomseddiffa c201freqcomreferivereshydappLimet athediscbetlondirewinis lare
4. I
4.1.
gro
twepredursnoISMet
canmehysmaungnotevadurandobsconevaberreaestihydthisConteregrodurAnd
C. Andermann et al. / C. R. Geoscience 344 (2012) 627–635 633
rnative clue to interpret the observed hysteresis loopsween sediment concentrations versus river discharge.ually, the storage and release of water in a storagepartment could control the concentration of the
iment stock transported within the rivers because oferential dilution. To test this hypothesis, we performedlassic hydrograph separation analysis (see Lim et al.,0) in order to separate river discharge into a low-uency baseflow component and a high-frequencyponent. This high-frequency component, hereafterrred to as direct runoff, corresponds to the fraction ofr discharge characterized by a short transfer time,
ulting in a short response (< 1 day) of the dischargerograph following a rainfall event. For this purpose, welied the generic digital filtering method proposed by et al. (2010) to the discharge datasets (see Andermannl. (2012b) for details). For all of the studied catchments,
plot of the sediment concentration versus the directharge reveals a linear relationship with a slope of one
ween the two variables, and a hysteresis effect is noger observed (Fig. 5b). These data illustrate that thect discharge is at a minimum during the post-ISM andter seasons, as the suspended sediment concentration
ow, whereas high direct discharge and concentration observed during the pre-ISM and ISM seasons.
nterpretation and discussion
Transfer of precipitation into river discharge: influence of
undwater storage and release
The anticlockwise hysteresis loops we observed be-en discharge and precipitation imply that part of thecipitation water is temporarily stored in a reservoiring its course into rivers. In the studied area, glacier andw melt runoff principally occur during the pre-ISM and
seasons (Bookhagen and Burbank, 2010; Immerzeelal., 2009), therefore the storage of water in glaciersnot explain the observations. In fact, the effect oflting glaciers and snow would drive a clockwiseteresis, not an anticlockwise one. Moreover, Ander-nn et al. (2012a) also observed such hysteresis inlaciated catchments, demonstrating that the glacier is
the main driver of this phenomenon. Conversely,potranspiration in the Himalayas reaches a maximuming the pre-ISM, between April and May (e.g. Lambert
Chitrakar, 1989), which could qualitatively explain theerved hysteresis loops when only the timing issidered. However, because the magnitude of thepotranspiration rapidly decreases with elevation (Lam-t and Chitrakar, 1989) and because of the high elevationched by the studied catchments (Fig. 2b), this ismated to account for less than 10% of the overallrological budget (Bookhagen and Burbank, 2010) so
effect alone is not able to drive the observed hysteresis.sequently, the main mechanism explaining the hys-sis effect is probably a transient storage of water in a
undwater unit during the rising ISM and its releaseing the post-ISM season (Andermann et al., 2012a).ermann et al. (2012a) discussed the nature of this
groundwater unit by modeling the data using a conceptualhydrological model. By solving the water balance at thecatchment scale, they attempted to discriminate the timeresponse distribution in the discharge data and to relate itto the storage compartments through modeling. Theirmodel simulated the catchment response to precipitationand incorporated three main components: a snow module,a rain-to-discharge flow related to quick runoff processes,and a slow-flow component representing groundwatercontribution while the model was forced by precipitation,temperature and potential evapotransipration (see Ander-mann et al. (2012a) for details). In all of the catchmentsthey studied, including the three catchments discussedhere, they very confidently reproduced all of the hysteresisloops through significant water storage within the slow-flow reservoir, with a long characteristic response-time ofabout 45 days. Using this type of a long response-time andbaseflow recession analysis, they demonstrated thesignificant contribution of a hard-rock aquifer to riverdischarge. They also demonstrated that the annual volumeof water flowing through this groundwater system is verylarge, representing �2/3 of the annual river discharge. Inthe Himalayas, the major increase in precipitation duringthe ISM is consequently responsible for the recharge ofbasement aquifers, which are refilled during the ISM andthen purged in the post-ISM, leading to the observedannual hysteresis effect (Fig. 4).
4.2. Post-ISM dilution of suspended sediment concentrations
by groundwater release
The direct dependency of sediment concentration ondirect discharge (Fig. 5b) demonstrates that the suspendedsediment concentration is not dependent on the amount ofwater in the rivers but depends on the amount of waterdraining the near surface into the rivers, characterized by ashort residence time. It implies that the suspendedsediment concentration depends on the supply of materialfrom the hillslopes and that the observed hysteresis loopsbetween the concentrations and total river discharge is notthe result of differences in the availability of sedimentsupply from there, between the pre- and post-ISM seasons,as has been classically proposed (Gabet et al., 2008;Hasnain and Thayyen, 1999; Wulf et al., 2010). Conse-quently, hillslopes as a contributing sediment source are ina transport-limited state: sediments are always availablefor transportation and variations in the sediment flux onlydepend on variations in the transport capacity. Anothermain finding is that groundwater release during the fallinglimb of the ISM appears to be the main driver of theobserved hysteresis loops between the concentrations andtotal river discharge (Fig. 5a), which consequently appearsas a dilution effect (Andermann et al., 2012b).
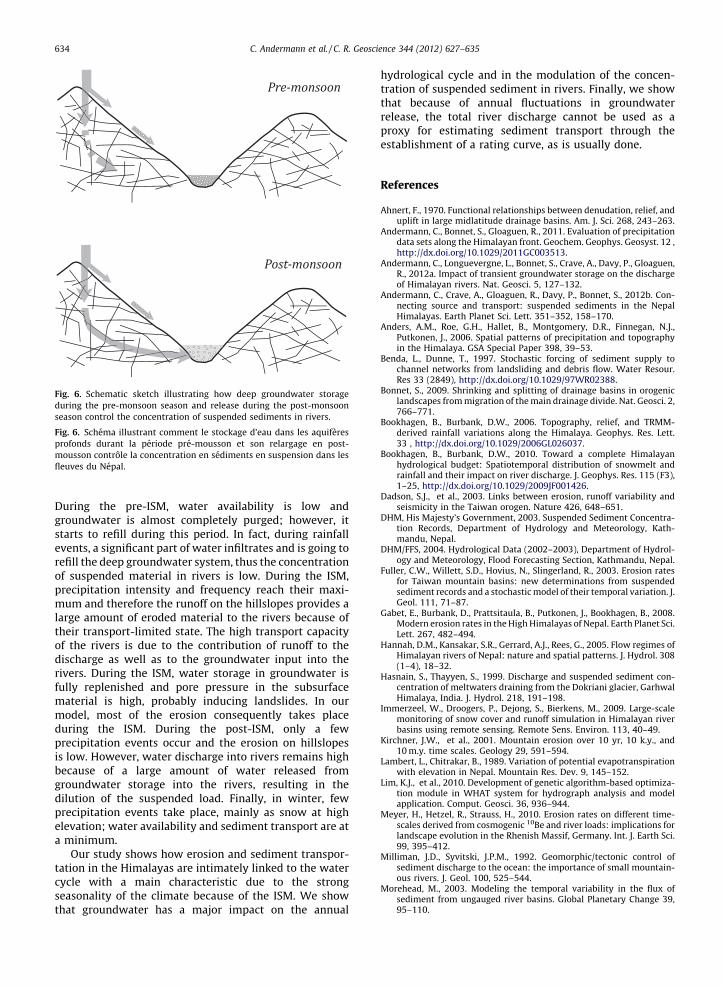
5. Conclusion: annual Himalayan hydro-sedimentarycycle
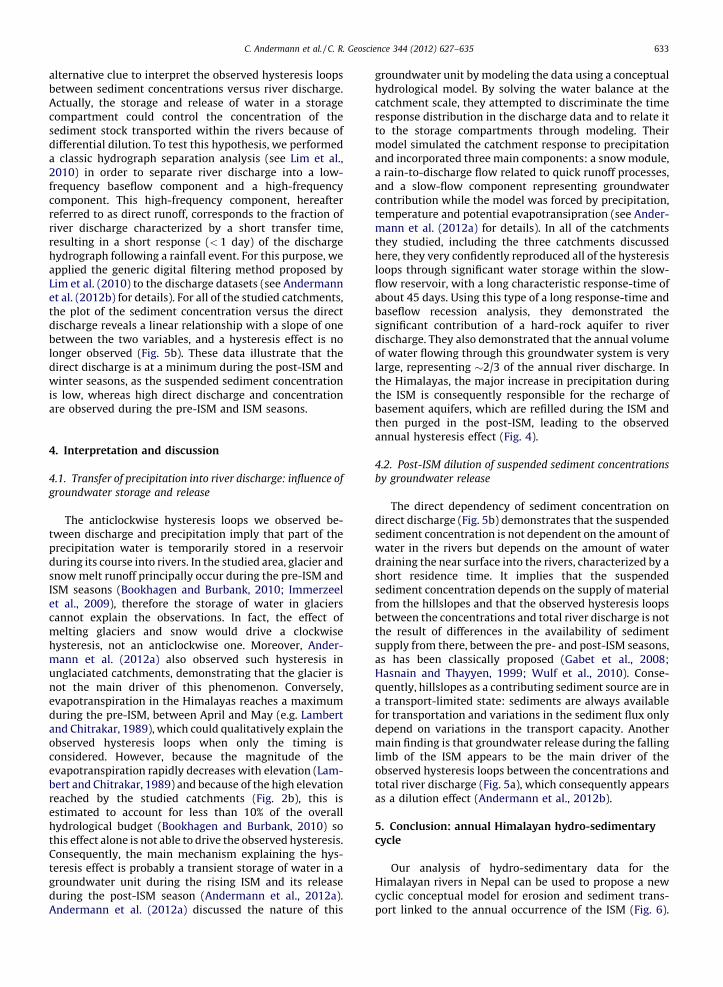
Our analysis of hydro-sedimentary data for theHimalayan rivers in Nepal can be used to propose a newcyclic conceptual model for erosion and sediment trans-port linked to the annual occurrence of the ISM (Fig. 6).
C. Andermann et al. / C. R. Geoscience 344 (2012) 627–635634
During the pre-ISM, water availability is low andgroundwater is almost completely purged; however, itstarts to refill during this period. In fact, during rainfallevents, a significant part of water infiltrates and is going torefill the deep groundwater system, thus the concentrationof suspended material in rivers is low. During the ISM,precipitation intensity and frequency reach their maxi-mum and therefore the runoff on the hillslopes provides alarge amount of eroded material to the rivers because oftheir transport-limited state. The high transport capacityof the rivers is due to the contribution of runoff to thedischarge as well as to the groundwater input into therivers. During the ISM, water storage in groundwater isfully replenished and pore pressure in the subsurfacematerial is high, probably inducing landslides. In ourmodel, most of the erosion consequently takes placeduring the ISM. During the post-ISM, only a fewprecipitation events occur and the erosion on hillslopesis low. However, water discharge into rivers remains highbecause of a large amount of water released fromgroundwater storage into the rivers, resulting in thedilution of the suspended load. Finally, in winter, fewprecipitation events take place, mainly as snow at highelevation; water availability and sediment transport are ata minimum.
Our study shows how erosion and sediment transpor-tation in the Himalayas are intimately linked to the watercycle with a main characteristic due to the strongseasonality of the climate because of the ISM. We showthat groundwater has a major impact on the annual
hydrological cycle and in the modulation of the concen-tration of suspended sediment in rivers. Finally, we showthat because of annual fluctuations in groundwaterrelease, the total river discharge cannot be used as aproxy for estimating sediment transport through theestablishment of a rating curve, as is usually done.
References
Ahnert, F., 1970. Functional relationships between denudation, relief, anduplift in large midlatitude drainage basins. Am. J. Sci. 268, 243–263.
Andermann, C., Bonnet, S., Gloaguen, R., 2011. Evaluation of precipitationdata sets along the Himalayan front. Geochem. Geophys. Geosyst. 12 ,http://dx.doi.org/10.1029/2011GC003513.
Andermann, C., Longuevergne, L., Bonnet, S., Crave, A., Davy, P., Gloaguen,R., 2012a. Impact of transient groundwater storage on the dischargeof Himalayan rivers. Nat. Geosci. 5, 127–132.
Andermann, C., Crave, A., Gloaguen, R., Davy, P., Bonnet, S., 2012b. Con-necting source and transport: suspended sediments in the NepalHimalayas. Earth Planet Sci. Lett. 351–352, 158–170.
Anders, A.M., Roe, G.H., Hallet, B., Montgomery, D.R., Finnegan, N.J.,Putkonen, J., 2006. Spatial patterns of precipitation and topographyin the Himalaya. GSA Special Paper 398, 39–53.
Benda, L., Dunne, T., 1997. Stochastic forcing of sediment supply tochannel networks from landsliding and debris flow. Water Resour.Res 33 (2849), http://dx.doi.org/10.1029/97WR02388.
Bonnet, S., 2009. Shrinking and splitting of drainage basins in orogeniclandscapes from migration of the main drainage divide. Nat. Geosci. 2,766–771.
Bookhagen, B., Burbank, D.W., 2006. Topography, relief, and TRMM-derived rainfall variations along the Himalaya. Geophys. Res. Lett.33 , http://dx.doi.org/10.1029/2006GL026037.
Bookhagen, B., Burbank, D.W., 2010. Toward a complete Himalayanhydrological budget: Spatiotemporal distribution of snowmelt andrainfall and their impact on river discharge. J. Geophys. Res. 115 (F3),1–25, http://dx.doi.org/10.1029/2009JF001426.
Dadson, S.J., et al., 2003. Links between erosion, runoff variability andseismicity in the Taiwan orogen. Nature 426, 648–651.
DHM, His Majesty’s Government, 2003. Suspended Sediment Concentra-tion Records, Department of Hydrology and Meteorology, Kath-mandu, Nepal.
DHM/FFS, 2004. Hydrological Data (2002–2003), Department of Hydrol-ogy and Meteorology, Flood Forecasting Section, Kathmandu, Nepal.
Fuller, C.W., Willett, S.D., Hovius, N., Slingerland, R., 2003. Erosion ratesfor Taiwan mountain basins: new determinations from suspendedsediment records and a stochastic model of their temporal variation. J.Geol. 111, 71–87.
Gabet, E., Burbank, D., Prattsitaula, B., Putkonen, J., Bookhagen, B., 2008.Modern erosion rates in the High Himalayas of Nepal. Earth Planet Sci.Lett. 267, 482–494.
Hannah, D.M., Kansakar, S.R., Gerrard, A.J., Rees, G., 2005. Flow regimes ofHimalayan rivers of Nepal: nature and spatial patterns. J. Hydrol. 308(1–4), 18–32.
Hasnain, S., Thayyen, S., 1999. Discharge and suspended sediment con-centration of meltwaters draining from the Dokriani glacier, GarhwalHimalaya, India. J. Hydrol. 218, 191–198.
Immerzeel, W., Droogers, P., Dejong, S., Bierkens, M., 2009. Large-scalemonitoring of snow cover and runoff simulation in Himalayan riverbasins using remote sensing. Remote Sens. Environ. 113, 40–49.
Kirchner, J.W., et al., 2001. Mountain erosion over 10 yr, 10 k.y., and10 m.y. time scales. Geology 29, 591–594.
Lambert, L., Chitrakar, B., 1989. Variation of potential evapotranspirationwith elevation in Nepal. Mountain Res. Dev. 9, 145–152.
Lim, K.J., et al., 2010. Development of genetic algorithm-based optimiza-tion module in WHAT system for hydrograph analysis and modelapplication. Comput. Geosci. 36, 936–944.
Meyer, H., Hetzel, R., Strauss, H., 2010. Erosion rates on different time-scales derived from cosmogenic 10Be and river loads: implications forlandscape evolution in the Rhenish Massif, Germany. Int. J. Earth Sci.99, 395–412.
Milliman, J.D., Syvitski, J.P.M., 1992. Geomorphic/tectonic control ofsediment discharge to the ocean: the importance of small mountain-ous rivers. J. Geol. 100, 525–544.
Morehead, M., 2003. Modeling the temporal variability in the flux ofsediment from ungauged river basins. Global Planetary Change 39,95–110.
Pre-monsoon
Post-monsoon
Fig. 6. Schematic sketch illustrating how deep groundwater storage
during the pre-monsoon season and release during the post-monsoon
season control the concentration of suspended sediments in rivers.
Fig. 6. Schema illustrant comment le stockage d’eau dans les aquiferes
profonds durant la periode pre-mousson et son relargage en post-
mousson controle la concentration en sediments en suspension dans les
fleuves du Nepal.

Pine
Scha
Shre
Sum
C. Andermann et al. / C. R. Geoscience 344 (2012) 627–635 635
t, P., Souriau, X., 1988. Continental erosion and large-scale relief.Tectonics 563 doi:10.1029C007i003p00563.ller, M., von Blanckenburg, F., Hovius, N., Kubik, P.W., 2001. Large-
scale erosion rates from in situ-produced cosmogenic nuclides inEuropean river sediments. Earth Planet Sci. Lett. 188, 441–458.stha, M.L., 2000. Interannual variation of summer monsoon rainfallover Nepal and its relation to Southern Oscillation Index. Meteorol.Atmos. Phys. 75, 21–28.merfield, M.A., Hulton, N.J., 1994. Natural controls of fluvial denuda-tion rates in major world drainage basins. J. Geophys. Res. 99, 13871–13883.
Whipple, K.X., 2009. The influence opf climate on the tectonic evolution ofmountain belts. Nat. Geosci. 2, 97–104.
Wolman, M.G., Miller, J.P., 1960. Magnitude and frequency of forces ingeomorphic processes. J. Geol. 68, 54–74.
Wulf, H., Bookhagen, B., Scherler, D., 2010. Seasonal precipitation gradi-ents and their impact on fluvial sediment flux in the NorthwestHimalaya. Geomorphology 118, 13–21.
Yatagai, A., et al., 2009. A 44-year daily-gridded precipitation dataset forAsia based on a dense network of rain gauges. SOLA 5, 137–140,http://dx.doi.org/10.2151/sola2009035.