Impact assessment of climate change on the hydrological response of a snow and glacier melt runoff...
35
Impact assessment of climate change on the hydrological response of a snow and glacier melt runoff dominated Himalayan river Pratap Singh, Naresh Kumar National Institute of Hydrology, Roorkee (U.P.), 247 667, India Received 25 August 1995; revised 17 April 1996; accepted 23 April 1996 Abstract The effect of climate change on snow water equivalent, snowmelt runoff, glacier melt runoff and total streamflow and their distribution is examined for the Spiti river. This is a high altitude Hima- layan river located in the western Himalayan region. The total streamflow of this river has a sig- nificant contribution from snow and glacier melt runoff. Plausible hypothetical scenarios of temperature and precipitation changes based on the simulation of climate change over the Indian subcontinent by the Hamburg climate model are adopted in the present study. The UBC watershed model was used to simulate the hydrological response of the basin under changed climatic scenarios. The adopted changes in temperature and precipitation covered a range from 1 to 38C and from -10 to + 10%, respectively. Snow water equivalent reduces with an increase in air temperature. However, no significant change is found in the snow water equivalent of the Spiti basin by the projected increase in air temperature (T + 1 to T + 38C). An increase of 28C in air temperature reduced annual snow water equivalent in the range of 1 to 7%. Changes in precipitation caused proportional changes in snow water equivalent. It is found that annual snowmelt runoff, glacier melt runoff and total streamflow increase linearly with changes in temperature (1–38C), but the most prominent effect of increase in temperature has been noticed on glacier melt runoff for this high altitude basin. For example, an increase of 28C in air temperature has enhanced annual snowmelt runoff, glacier melt runoff and total streamflow in the range of 4–18%, 33–38% and 6–12% respectively. The effect of change in precipitation (P-10 to P+ 10%) suggests a linear increase in snowmelt runoff and total streamflow, while, in general, glacier melt runoff is inversely related to changes in precipitation. Snowmelt runoff is found more sensitive than glacier melt runoff to changes in precipitation (P-10 to P+ 10%). Under a warmer climate scenario, snowmelt runoff and glacier melt runoff cause an earlier response of total streamflow and a change in flow distribution. The seasonal analysis of total stream- flow indicates that an increase in air temperature produces an increase in the pre-monsoon season followed by an increase in the monsoon season. Implications of such seasonal changes are also briefly discussed. q 1997 Elsevier Science B.V. 0022-1694/97/$17.00 q 1997– Elsevier Science B.V. All rights reserved PII S0022-1694(96)03142-3 Journal of Hydrology 193 (1997) 316–350
-
Upload
independent -
Category
Documents
-
view
1 -
download
0
Transcript of Impact assessment of climate change on the hydrological response of a snow and glacier melt runoff...

Impact assessment of climate change on the hydrologicalresponse of a snow and glacier melt runoff dominated
Himalayan river
Pratap Singh, Naresh Kumar
National Institute of Hydrology, Roorkee (U.P.), 247 667, India
Received 25 August 1995; revised 17 April 1996; accepted 23 April 1996
Abstract
The effect of climate change on snow water equivalent, snowmelt runoff, glacier melt runoff andtotal streamflow and their distribution is examined for the Spiti river. This is a high altitude Hima-layan river located in the western Himalayan region. The total streamflow of this river has a sig-nificant contribution from snow and glacier melt runoff. Plausible hypothetical scenarios oftemperature and precipitation changes based on the simulation of climate change over the Indiansubcontinent by the Hamburg climate model are adopted in the present study. The UBC watershedmodel was used to simulate the hydrological response of the basin under changed climatic scenarios.The adopted changes in temperature and precipitation covered a range from 1 to 38C and from−10 to+10%, respectively.
Snow water equivalent reduces with an increase in air temperature. However, no significantchange is found in the snow water equivalent of the Spiti basin by the projected increase in airtemperature (T + 1 to T + 38C). An increase of 28C in air temperature reduced annual snow waterequivalent in the range of 1 to 7%. Changes in precipitation caused proportional changes in snowwater equivalent. It is found that annual snowmelt runoff, glacier melt runoff and total streamflowincrease linearly with changes in temperature (1–38C), but the most prominent effect of increase intemperature has been noticed on glacier melt runoff for this high altitude basin. For example, anincrease of 28C in air temperature has enhanced annual snowmelt runoff, glacier melt runoff and totalstreamflow in the range of 4–18%, 33–38% and 6–12% respectively. The effect of change inprecipitation (P−10 toP+10%) suggests a linear increase in snowmelt runoff and total streamflow,while, in general, glacier melt runoff is inversely related to changes in precipitation. Snowmeltrunoff is found more sensitive than glacier melt runoff to changes in precipitation (P−10 toP+10%). Under a warmer climate scenario, snowmelt runoff and glacier melt runoff cause an earlierresponse of total streamflow and a change in flow distribution. The seasonal analysis of total stream-flow indicates that an increase in air temperature produces an increase in the pre-monsoon seasonfollowed by an increase in the monsoon season. Implications of such seasonal changes are alsobriefly discussed.q 1997 Elsevier Science B.V.
0022-1694/97/$17.00q 1997– Elsevier Science B.V. All rights reservedPII S0022-1694(96)03142-3
Journal of Hydrology 193 (1997) 316–350

1. Introduction
The atmospheric concentration of CO2 and other trace gases has increased substantiallyover the last century and double concentration of CO2 is expected by the middle or latterpart of next century if no control measures are adopted (NAS, 1979; Pearman, 1980). Thissteady increase in the concentration of greenhouse gases has resulted in global warming.The global mean surface air temperature has increased by 0.3 to 0.68C over the past 100years (Jones et al., 1990). Further, the average global surface temperature will rise by 0.2to 0.58C per decade during the next few decades if human activities which cause green-house gas emissions continue unabated (IPCC, 1990). The striking feature, however, isthat inter-annual variability of global temperature is much larger than the trend. Under thedouble CO2 concentration scenario, precipitation may increase or decrease by as much as15% (IPCC, 1990).
Several studies of climate variability on both short and long time scales have beencarried out to establish climate changes over India (Jagannathan and Parthasarathy,1972; Hingane et al., 1985; Sarker and Thapliyal, 1988; Thapliyal and Kulshreshtha,1991). It is observed that a warming of the Indian subcontinent by 0.48C has takenplace over the period 1901–1982 (Hingane et al., 1985). This warming is broadly con-sistent with the observed global warming over the last century. Thapliyal and Kulshreshtha(1991) examined the trend of annual rainfall over India and reported that the five-yearrunning mean has fluctuated from normal rainfall within6 one standard deviation. Basedupon the results from high resolution general circulation models (GCMs), the IPCC (1990)reports for the Indian subcontinent state that by 2030, on ‘business-as-usual’ scenarios (iffew or no steps are taken to limit greenhouse gas emissions), the warming will vary from 1to 28C throughout the year. Precipitation will change little in winter and will generallyincrease throughout the region by 5 to 15% in summer. Lal et al. (1992) studied the impactof increasing greenhouse gas concentrations on the climate of the Indian subcontinent andits variability by analysing the GCM output data of the Hamburg global coupled atmo-sphere–ocean circulation model. The model results obtained from the greenhouse warm-ing experiment suggested an increase of more than 28C over the monsoon region in thenext 100 years. The mean annual increase in surface runoff over the Indian subcontinentsimulated by the model for the year 2080 is estimated to be about 25% (Lal and Chander,1993).
The warming of the Earth–atmosphere system is likely to change temperature andprecipitation, which may affect the quantity and quality of the freshwater resources.One of the most important impacts to society of future climatic changes is expected onregional water availability, specifically the timing of its magnitude and surface runoff andsoil moisture fluctuations (Gleick, 1986; WMO, 1987). Existing global models suggestthat climatic changes will have dramatic impacts on water resources, leading to majoralterations of regional water systems. For example, a study based on GCM indicated thatstreamflow from the rivers in the western USA will be reduced by 40 to 75% (NRC, 1983).Rind and Lebedeff (1984) used a GCM to assess the effect of doubling CO2 on hydro-logical variables, and concluded that precipitation would increase by about 11% andevaporation would increase proportionally, while snowpack would decrease by 20%due to higher temperatures. Because quantitative estimates of the effects of climate change
317P. Singh, N. Kumar/Journal of Hydrology 193 (1997) 316–350

on the hydrology of different regions are essential for the understanding, planning andmanagement of future water resources systems, the problems of global warming and itsimpact on water resources have received considerable attention in recent years. There havebeen several co-ordinated efforts by the World Meteorological Organisation (WMO),Inter-governmental Panel on Climate Change (IPCC), United Nations EnvironmentalProgramme (UNEP) and International Council of Scientific Union (ICSU) to bringtogether experts involved in projects concerned with climate variability and change,their impact on hydrology and water resources, and to identify the problems in thisarea. Further, WMO et al. (1991) suggested that the possible effects of climate changein the design and management of water resources systems should also be examined.
The vulnerability of the Indian subcontinent to the impact of changing climate is of vitalimportance because the major impact of climate change in this continent would be on thehydrology, affecting water resources and agricultural economy. However, very little workhas been carried out in India on the impact of climate change on hydrology (Divya andMehrotra, 1995). The major river systems of the Indian subcontinent, namely Brahama-putra, Ganga and Indus which originate in the Himalayas, are expected to be more vulner-able to climate change because of the substantial contribution from snow and glaciers intothese river systems. A review of the possible impact of climatic changes on various aspectsof the hydrological cycle has shown that little emphasis has been placed on studying thehydrological response of a Himalayan river. In the present study attempts are made toinvestigate the effect of climatic change on the snow water equivalent, snowmelt runoff,glacier melt runoff, total streamflow and their distribution for a high altitude Himalayanriver (Spiti) which forms a part of the Indus river system.
2. Basin characteristics and hydrological response
The hydrological response of a catchment depends on the sources of runoff, climaticconditions and physical characteristics of the catchment. For example, streamflow dis-tribution of a basin experiencing only rainfall will be different from a basin havingcontribution from rainfall, snowfall and glaciers. Further, for basins in which temperatureand precipitation characteristics are such that snowfall occurring during the precedingwinter is completely melted away during the following spring and summer months, therewill be a different response to runoff distribution. On the other hand, basins where totalaccumulated snow is not melted and high snow fields and glaciers are formed (as in thepresent study basin) produce a different type of streamflow pattern. In such a complexbasin, melting of snow starts first and glacier melt takes over when snowmelt contributiondiminishes. Cayan and Riddle (1993) have also emphasized that the effect of climatechange on the hydrological response of the lower-elevation watershed will be differentthan for the high-elevation watershed because of the difference in their runoff distributionand original climatic regime. Recently, Chiew et al. (1995) reported that the responses ofbasins located in different regions are not similar under changed climatic scenarios.Several authors have evaluated the influence of climatic changes on the basins whichhave input from different sources and in which, consequently, the impact of climaticchanges is also different. Some studies have been carried out for snowbound basins
318 P. Singh, N. Kumar/Journal of Hydrology 193 (1997) 316–350

also, but again the present study basin has glaciers located in the high-altitude Himalayanregion. This characteristic of the basin has allowed various aspects of the hydrologicalresponse to be studied, but at the same time this may limit comparison of our results withthose of other basins. However, wherever possible, we have compared our results with thereported studies.
3. Climate change scenarios
Recent advances in the ability of the global coupled atmosphere–ocean GCMs toreplicate the observed atmospheric behaviour on a wide range of space and time scalesare quite encouraging. The models treating the coupled ocean–atmosphere system in aninteractive mode are able to provide projections of the possible perturbations in the keyclimatic elements in time scales of up to 100 years for future greenhouse gas emissionscenarios (Cubasch et al., 1992). IPCC (1990, 1992) and several investigators (McCabeand Ayers, 1989; Nemec, 1989) recommend the construction of hypothetical scenarios tostudy characteristics of runoff responses to climate change for particular areas. Most of theregional scale climate impact investigations related to global warming have relied on theoutput of GCMs in order to adopt scenarios for future climatic change.
The coupled ocean–atmosphere climate model — European Community HAMburgmodel (ECHAM)+ Large Scale Geostrophic ocean model (LSG) — has demonstratedgood simulation of the characteristic features of the Asian summer monsoon as well as itsbroad circulation features over the Indian subcontinent (Lal et al., 1992). Recently, forestimating changes in annual surface runoff over the Indian subcontinent, the output of theECHAM3 (horizontal resolution,300 km × 300 km) was used by Lal and Chander(1993). Moreover, possible changes in the key climatological variables for a 100-yearperiod over the north-west margins of the Indian subcontinent have been examined, usingthis model, with the objective of assessing the potential climate change over the Thardesert, of which a large part lies in north-west India (Lal and Bhaskaran, 1993). Simulatedchanges in temperature and precipitation by the Hamburg climate model over the Indiansubcontinent under a ‘business-as-usual’ scenario over a long time period (,100 years inthe future) are shown in Fig. 1(a) and 1(b). We have adopted this scenario with a limit tochanges in the approximate range provided in these figures. However, the lesser variationsare likely to occur when a period less than 100 years is considered. Analysis was madeusing a range of variation in temperature and precipitation, thus providing results for alower order of changes also.
The effect of temperature on the hydrological response of the basin has been studiedindependently and in combination with precipitation. The changes in temperature wereapplied as absolute amounts, whereas changes in precipitation were considered as percen-tage differences. Since much greater uncertainty surrounds the estimates of changes inregional precipitation, both increases and decreases in average annual precipitation aremodelled in this study. The adopted changes in temperature and precipitation covered arange from 1 to 38C and−10 to +10%, respectively. The values chosen for hypotheticalscenarios typically reflect good estimates of changes in important climatic variables (Lalet al., 1992). Both temperature and precipitation data were uniformly varied by the
319P. Singh, N. Kumar/Journal of Hydrology 193 (1997) 316–350

projected amount of changes over the simulation period. In reality, changes in temperatureand precipitation are likely to vary throughout the year, and such changes may also alterseasonal temperature patterns and consequently the distribution and frequency of preci-pitation events. These aspects are not considered in this study simply because of non-availability of reliable information of distribution of these changes.
4. Applications of hydrological models to study the hydrological response of a basinunder changed climatic scenarios
The studies carried out to demonstrate the impacts of climate changes on variouscomponents of the hydrologic cycle may be classified broadly into two categories: (i)studies using GCMs to predict the impact of climate change scenarios (US Department of
Fig. 1. (a) Spatial distribution of changes in annual temperature (8C) for the Indian subcontinent as simulated bythe Hamburg coupled climate model under a ‘business-as-usual’ scenario (Lal et al., 1992). (b) Spatial distribu-tion of changes in annual rainfall (mm/day) for the Indian subcontinent as simulated by the Hamburg coupledclimate model under a ‘business-as-usual’ scenario. Hatched area represents the significant changes at 90% level(Lal et al., 1992).
320 P. Singh, N. Kumar/Journal of Hydrology 193 (1997) 316–350

Energy, 1980; Gleick, 1987a; Cohen, 1986; IPCC, 1990; Sausen et al., 1994; McCabe,1994; Loaiciga et al., 1996); and (ii) studies using hydrological models with assumedhypothetical climatic inputs (Nemec and Schaake, 1982; Nemec, 1989; McCabe andAyers, 1989; Sanderson and Smith, 1990; Thomsen, 1990; Rango, 1992; Cayan andRiddle, 1993; Burn, 1994; Rango and Martinec, 1994; Chiew et al., 1995). While theGCM models are invaluable tools for identifying climatic sensitivities and changes inglobal climate characteristics, the grid system is too large to assess the impact on majorhydrological parameters on regional scales. A single grid may encompass hundreds ofsquare kilometres, including mountainous and desert terrain, oceans and land areas.Despite recent improvements in modelling the climate dynamics with complex andlarge scale models, we are still seriously limited in evaluating regional details of climaticchanges or details of the effects of such changes on hydrologic processes and wateravailability. Loaiciga et al. (1996) have presented a detailed review on the interactionof GCMs and the hydrological cycle. Until current GCMs improve both their spatialresolution and their hydrologic parametrization, information on hydrologic effects ofglobal climatic changes can best be obtained using regional hydrological models.
The advantages of using hydrological models for assessing the impacts of climaticchange have been discussed by several investigators. Such models are considered suitablefor assessing the regional hydrologic consequences of changes in temperature and pre-cipitation and other climatic variables. The ability of hydrologic models to incorporateprojected variations in climatic variables, snowfall and snowmelt algorithms, groundwater fluctuations and soil moisture characteristics makes them especially attractive forwater resources studies of climatic changes. Moreover, such models can be combined withplausible hypothetical climate change scenarios to generate information on waterresources implications of future climatic changes (Gleick, 1986). Various hydrologicmodels have been used to study the impacts of climate change scenarios, depending onthe purpose of study and model availability. Gleick (1987a) used a water balance model toestimate the impact of climate on monthly water availability. Detailed studies using adeterministic model in mountain basins (National Weather Service River ForecastingSystem (NWSRFS) model) have been carried out (Lettenmaier and Gan, 1990; Cooley,1990; Nash and Gleick, 1991; Panagoulia, 1991). Rango (1992) used the Snow MeltRunoff (SRM) model for the Rio Grande and Kings river basins to study the changes insnowmelt runoff under warmer climate scenarios. Recently, Rango and Martinec (1994)examined the influence of changes in temperature and precipitation on snow cover, usingSRM, and their results are discussed below.
It is worth mentioning that, for water resources systems dominated by snow and glaciermelt runoff, vulnerability to changes in global climatic conditions can be better understoodusing the conceptual hydrological models which have algorithms to develop and depletesnowpack using meteorological data. This is especially true with respect to changes insnowfall and snowmelt, because climate changes will also affect the magnitude and dis-tribution of the snowfall occurring during the preceding winters. The models with only asnowmelt runoff simulation approach, but without the ability to accumulate the snowpack,may not be suitable for assessing the effect on both snow water equivalent and snowmeltrunoff. For example, Yeh et al. (1983) found that sudden removal of the snow cover on 15March would bring about a significant reduction of zonal mean soil moisture for the
321P. Singh, N. Kumar/Journal of Hydrology 193 (1997) 316–350

following spring and summer seasons. They did not, however, model the effects ofchanges in climate on the development of the snowpack. Similarly, Rango (1989,Rango, 1992) modelled the changes in snowmelt runoff caused by temperature increaseduring the snowmelt period without considering the effect of climate change on snowwater equivalent over the basin. Their results indicated that the warmer temperatureproduced an earlier hydrograph peak, but with essentially the same seasonal volumesince they started with the same snowpack. Rango and Martinec (1994) reported thatchanged temperatures of+28C and +48C both had a much more important effect onsnow cover than doubling the precipitation occurring during the snowmelt period.Cayan and Riddle (1993) examined the influence of climate parameters on seasonalstreamflow in watersheds over a range of elevations, and found that the temperaturesensitivity of seasonal streamflow is greater in spring and early summer. It was reportedthat the effect of temperature on runoff in early summer is partially counteracted by theopposite effect in early spring, but perhaps not totally.
In this study, the University of British Columbia (UBC) watershed model has been usedto assess the impact of global warming by modelling hydrological processes including soilmoisture, snowmelt, glacier melt, rainfall runoff, ground water, evaporation etc. Thismodel is designed primarily for mountainous watersheds and uses daily maximum andminimum temperatures and precipitation as inputs. The model has the ability to continu-ously monitor the hydrologic state of the catchment over extended periods of time. One ofthe important features of the model is that it develops and depletes the snowpack in thebasin using meteorological data. The availability of algorithms in the model for computingcontributions from snowmelt runoff and glacier melt runoff has enabled us to study theinfluence of climatic changes on various components of the streamflow and snow waterequivalent. This model is used operationally for long-term and short-term forecasting inthe Columbia, Peace and Fraser river systems in Canada and for streamflow simulations ofseveral Himalayan rivers (Quick and Singh, 1992; Singh and Quick, 1993). It is notpossible to discuss the model in detail here. Detailed information on this model is givenby Quick and Pipes (1977).
5. Physical and hydrological characteristics of the Spiti basin and simulation ofstreamflow
The Spiti river is a major tributary of the Satluj river which forms an important part ofthe Indus river system. This basin has an area of 10 071 km2 with an elevation range from2900 to over 7000 m. However, little of the basin lies above 6000 m. This basin lies in thegreater Himalayan range. Permanent snow fields and glaciers exist at higher altitudes inthe basin. About 2.5% of the basin is covered by glaciers (Quick and Singh, 1992). Thewater from this river is used mainly for irrigation and hydropower generation. The locationof the study basin is shown in Fig. 2(a).
The westerly weather disturbances deposit nearly all the precipitation during the wintermonths (October–March) and most of the precipitation falls in the form of snow in thisseason. The monsoon rains have little influence in the greater Himalayan range in whichthis basin is located, as compared with the outer and middle Himalayan ranges (Singh et al.,
322 P. Singh, N. Kumar/Journal of Hydrology 193 (1997) 316–350

1995a). The time and magnitude of snow and glacier melt runoff depends on the snowpackwater equivalent accumulated in the preceding winter season and on the prevailingclimatic conditions over the basin. In general, the maximum snow cover area exists inMarch when most of the snowfall has occurred and melting has not started. As the summerseason advances, depletion of the snow cover area takes place and temperatures follow an
Fig. 2. (a) Location map of the Spiti basin. (b) Observed mean daily air temperature at Kaza (3639 m) in the Spitibasin.
323P. Singh, N. Kumar/Journal of Hydrology 193 (1997) 316–350

increasing trend. Maximum snow melt runoff is observed in the month of June/July.Glaciers are exposed after the melting of seasonal snow cover and, generally, meltingof glaciers starts in late June/July, depending on the amount of seasonal snow, and extendsuntil September. The importance of snow and glacier melt runoff in Himalayan rivers hasbeen discussed by Singh et al. (1995b) and Singh and Kumar (1996).
Daily temperature and precipitation data of Kaza (3639 m) were used to simulatethe streamflow observed at the outlet of the basin. The observed mean daily tempera-tures at Kaza are shown in Fig. 2(b). The streamflow simulation was made for threeyears (1987–1990) on a daily basis, and the coefficient of efficiencyr 2 (Nash andSutcliffe, 1970) between observed and calculated runoff was computed to be 0.90,0.76 and 0.91 for 1987/88, 1988/89 and 1989/90 respectively. A monthly simulation isshown in Fig. 3. To assess the impact of projected climate change, temperature andprecipitation data were modified accordingly and the model was run continuously for athree-year simulation period without changing the model parameters. In fact, themodel parameters will also be influenced under changed climatic scenarios and sucheffects should be considered in the study (Becker and Serban, 1990). However,actual changes in parameters under warmer climatic scenarios are not yet well understood(IPCC, 1990; Chiew et al., 1995). This insufficient knowledge has led us to use the sameparameters under normal and changed climatic scenarios in this study. The effect ofchanges in the model parameters may have a significant effect on the results. Moreresearch is to be done to understand the model parameter changes under changed climatic
Fig. 3. Observed and simulated monthly streamflow of the Spiti river using the UBC watershed model.
324 P. Singh, N. Kumar/Journal of Hydrology 193 (1997) 316–350

scenarios and to study the influences of such changes on the hydrological response of thebasins.
6. Effect of climate change on the hydrological response of the Spiti river
6.1. Snow water equivalent
6.1.1. Temperature scenariosThe changes in monthly and annual snow water equivalent (SWE) of the Spiti basin,
with projected increase in air temperature (1–38C) for 1987/88, 1988/89 and 1989/90, areshown in Fig. 4(a) and (b), respectively. The increase in temperature has slightly reducedthe amount of annual snow water equivalent falling in the winter period, because in aparticular period, if air temperature is nearer to the critical or threshold temperature(usually 28C), SWE is significantly reduced because the form of precipitation changesto rain. Therefore, in such cases, a minor increase in temperature can reduce the SWEsignificantly because precipitation falls as rain. On the other hand, when air temperaturesare already very warm or cold, moderate changes in temperature will not change theamounts of rain or snow. In the present study basin air temperatures are far below thecritical threshold temperature in the winter period (Fig. 2(b)) and projected global warm-ing changes in temperature cannot affect snow accumulation very much. Air temperaturesin the starting and ending months of the winter season are closer to the critical temperatureand therefore an increase in the air temperature in these months reduces snowfall. Fig. 4(a)also shows that the build-up time of the snowpack is not influenced significantly by theprojected increase in air temperature, because it is a very high altitude basin. Vehvilainenand Lohvansuu (1991) found that the snow accumulation period is greatly reduced inFinland due to an increase in temperature by about 5–68C, but in our case the projectedincrease in temperature is lower than the one they adopted.
Fig. 4(c) shows the distribution of SWE in the basin with an increase in temperature. Itcan be seen that an increase in temperature up to 38C did not melt the whole accumulatedsnow in the basin; i.e., snow remains in the basin after the melt period under both normaland warmer climatic scenarios. However, the magnitude of the snow remaining in thebasin decreases as the temperature increases. There is therefore an effect on the snowstorage characteristics of the basin, which influences the snowmelt runoff.
Details of simulated annual SWE under different temperature scenarios are summarizedin Tables 1–2. Annual SWE is reduced by 1–7% for an increase in air temperature of 28Cfor the years studied. The reduction in annual SWE for 1987/88 is slightly higher becauseof the occurrence of sizeable snowfall in the months of September and October. There isno snowfall in these months for the other years. As discussed above, in these months the airtemperature is closer to the critical temperature so that rainfall is an increased proportionof the total precipitation, which results in a reduction of SWE. Similarly, Lettenmaier andGan (1990) reported a marked reduction in SWE under a 2× CO2 scenario.
6.1.2. Temperature and precipitation scenariosThe possible impact of precipitation scenarios on monthly and annual SWE is presented
325P. Singh, N. Kumar/Journal of Hydrology 193 (1997) 316–350

in Fig. 5(a) and (b) respectively. These results suggest that changes in SWE areproportional to changes in precipitation. It can also be seen from Table 3 that, forall the projected temperature scenarios, the variation in annual SWE due to a specificchange in precipitation is found to be of the same order. Table 4 shows the variationin annual SWE under various temperature and precipitation scenarios with respectto the original simulations. It can be observed from Table 4 that, out of the scenariosstudied, the maximum reduction (13–18%) in annual SWE is produced under aT + 38C,P−10% scenario.
Fig. 4. (a) Effect of increase in temperature on monthly snow water equivalent. (b) Effect of increase intemperature on annual snow water equivalent. (c) Effect of increase in temperature on distribution of snowwater equivalent in the basin.
326 P. Singh, N. Kumar/Journal of Hydrology 193 (1997) 316–350

Fig
.4.
Con
tinue
d.
327P. Singh, N. Kumar/Journal of Hydrology 193 (1997) 316–350

Tab
le1
Effe
ctof
incr
ease
inte
mpe
ratu
reon
annu
alsn
oww
ater
equi
vale
nt,s
now
mel
trun
off,
glac
ier
mel
trun
offa
ndto
tals
trea
mflo
w.A
llch
ange
sin
tem
pera
ture
are
in8C
.RS
indi
cate
sre
fere
nce
scen
ario
Yea
rS
cena
rioS
now
wat
ereq
uiv.
(mm
)C
hang
e(%
)S
now
mel
tru
noff(
cum
.d)
Cha
nge(
%)
Gla
cier
mel
tru
noff(
cum
.d)
Cha
nge(
%)
Tot
alst
ream
flow
(cum
.d)
Cha
nge(
%)
1987
/88
T+0
RS
564
–17
504
–9
072
–58
808
–T+
154
5−3
.418
513
5.8
1068
117
.762
212
5.8
T+2
528
−6.4
1991
413
.812
490
37.7
6568
111
.7T+
351
2−9
.221
414
22.3
1433
858
.069
518
18.2
1988
/89
T+0
RS
343
–21
014
–10
451
–61
171
–T+
134
2−0
.321
426
2.0
1210
215
.863
141
3.2
T+2
335
−2.3
2182
23.
813
873
32.7
6464
55.
7T+
332
6−5
.023
051
9.7
1564
049
.667
516
10.4
1989
/90
T+0
RS
398
–17
784
–9
598
–56
649
–T+
139
7−0
.319
389
9.0
1128
317
.659
451
4.9
T+2
394
−1.0
2102
218
.213
029
35.7
6225
79.
9T+
338
8−2
.522
733
27.8
1490
355
.365
791
16.1
328 P. Singh, N. Kumar/Journal of Hydrology 193 (1997) 316–350

6.2. Snowmelt runoff
6.2.1. Temperature scenariosThe simulated daily snowmelt runoff under aT + 28C temperature scenario is shown in
Fig. 6(a). As expected, an early response for snowmelt runoff is noticed under the warmerclimate, along with a change in distribution. In the water year 1987/88 the originaltemperatures were warmer in the spring months and produced a significant increase inmelt runoff under the warmer climate scenario, and this has reduced peak runoff signifi-cantly in June 1988 because significant melting from the basin occurred during the springmonths. Examination of the simulation results for the year 1988/89 shows that the peakrunoff is not reduced but slightly increased, because significant melting could not occur inthe spring months because of lower temperatures during this time. Again, in 1989/90,substantial melting occurred in May under the warmer climate and resulted in a shift ofpeak runoff. Therefore, the melting pattern in the spring months also controls the snow-melt runoff distribution. Such effects have also been noticed by Cayan and Riddle (1993),who have also reported that the temperature effect on runoff in early summer is partiallycounteracted by the opposite effect in early spring.
Fig. 6(b) illustrates that, for all the years, snowmelt runoff increased linearly withincrease in temperature. However, the magnitude of the changes in snow melt runofffor a particular year depends on the snow water equivalent storage and the climaticconditions over the basin in that year. Based on three years’ projected climatic simula-tions, a temperature increase from 1 to 38C increased snowmelt runoff from 2 to 28%. Fora 28C increase in temperature this range was found to be from 4 to 18% (Table 1). These
Table 2
Effect of increase in temperature on annual snow water equivalent and snowmelt runoff. All changes in tem-perature are in8C. RS indicates reference scenario
Year Scenario Snow waterequiv.(mm)
Change(%) Snow meltrunoff(cum.d)
Change(%)
1987/88 T+0 RS 564 – 17 504 –T+1 545 −3.4 18 513 5.8T+2 528 −6.4 19 914 13.8T+3 512 −9.2 21 414 22.3T+4 480 −14.9 23 259 32.8T+5 463 −17.9 24 667 40.9
1988/89 T+0 RS 343 – 21 014 –T+1 342 −0.3 21 426 2.0T+2 335 −2.3 21 822 3.8T+3 326 −5.0 23 051 9.7T+4 314 −8.5 21 797 3.7T+5 295 −14.0 19 021 −9.4
1989/90 T+0 RS 398 – 17 784 –T+1 397 −0.3 19 389 9.0T+2 394 −1.0 21 022 18.2T+3 388 −2.5 22 733 27.8T+4 381 −4.3 21 007 18.1T+5 370 −7.0 20 973 17.9
329P. Singh, N. Kumar/Journal of Hydrology 193 (1997) 316–350

results indicate that the reduced build-up of snow under the warmer climate will notalways decrease the annual snow melt runoff for all snowbound basins. If snow availablein the basin does not melt completely under normal and warmer climate scenarios(Fig. 4(c)), then the reduced snow water equivalent (SWE) will not decrease but increasethe annual snowmelt runoff. However, in another situation, when the snow accumulated inthe basin is melted in total, then the reduced SWE will decrease the annual snowmeltrunoff. Such results have not been reported before; therefore, in order to test this concept,snowmelt runoff and SWE were computed for higher temperature scenarios (T + 48C,T + 58C). It can be seen that annual snowmelt runoff starts decreasing for bothT + 48C andT + 58C temperature scenarios (Table 2).
Fig. 5. (a) Effect of changes in precipitation on monthly SWE over aT + 28C scenario. (b) Effect of changes inprecipitation on annual SWE over aT + 28C scenario.
330 P. Singh, N. Kumar/Journal of Hydrology 193 (1997) 316–350

Table 3
Effect of precipitation variation on annual snow water equivalent, snowmelt runoff, glacier melt runoff and totalstreamflow over various temperature scenarios for 1987/88, 1988/89 and 1989/90. The changes in temperatureand precipitation are in8C and percent, respectively. RS indicates reference scenario for this table
Year Scenario Snowwaterequiv.(mm)
Change(%)
Snowmeltrunoff(cum.d)
Change(%)
Glaciermeltrunoff(cum.d)
Change(%)
Totalstreamflow(cum.d)
Change(%)
1987/88 T+1, P+0 RS 545 – 18 513 – 10 681 – 62 212 –T+1, P−10 490 −10.1 16 235 −12.3 11 198 4.8 58 829 −5.4T+1, P−5 518 −4.9 17 339 −6.3 10 938 2.4 60 498 −2.8T+1, P+5 572 5.0 19 757 6.7 10 467 −2.0 63 941 2.8T+1, P+10 600 10.1 21 040 13.6 10 283 −3.7 65 768 5.7T+2, P+0 RS 528 – 19 914 – 12 490 – 65 681 –T+2, P−10 475 −10.0 17 629 −11.5 12 989 4.0 62 249 −5.2T+2, P−5 501 −5.1 18 766 −5.8 12 742 2.0 63 948 −2.6T+2, P+5 554 4.9 21 089 5.9 12 256 −1.9 67 325 2.6T+2, P+10 580 9.8 22 297 11.9 12 053 −3.5 69 192 5.4T+3, P+0 RS 512 – 21 414 – 14 338 – 69 518 –T+3, P−10 460 −10.2 19 168 −10.5 14 836 3.5 66 109 −4.9T+3, P−5 486 −5.1 20 249 −5.4 14 599 1.8 67 805 −2.5T+3, P+5 537 4.9 22 547 5.3 14 117 −1.5 71 245 2.5T+3, P+10 563 10.0 23 740 10.9 13 928 −2.9 73 087 5.1
1988/89 T+1, P+0 RS 342 – 21 426 – 12 102 – 63 141 –T+1, P−10 307 −10.2 18 973 −11.5 12 333 1.9 58 925 −6.7T+1, P−5 324 −5.3 20 324 −5.1 12 267 1.4 61 177 −3.1T+1, P+5 358 4.7 22 537 5.2 11 953 −1.2 64 935 2.8T+1, P+10 375 9.6 23 690 10.6 11 810 −2.4 66 815 5.8T+2, P+0 RS 335 – 21 822 – 13 873 – 64 645 –T+2, P−10 301 −10.1 19 767 −9.4 14 185 2.3 61 069 −5.5T+2, P−5 318 −5.1 20 751 −4.9 14 032 1.2 62 854 −2.8T+2, P+5 351 4.8 22 818 4.6 13 732 −1.0 66 379 2.7T+2, P+10 369 10.0 23 854 9.3 13 599 −2.0 68 221 5.5T+3, P+0 RS 326 – 23 051 – 15 640 – 67 516 –T+3, P−10 294 −9.8 21 079 −8.6 15 950 2.0 64 126 −5.0T+3, P−5 309 −5.2 22 025 −4.5 15 796 1.0 65 812 −2.5T+3, P+5 342 4.9 24 031 4.3 15 490 −0.9 69 150 2.4T+3, P+10 359 10.1 25 081 8.8 15 346 −1.9 70 836 4.9
1989/90 T+1, P+0 RS 397 – 19 389 – 11 283 – 59 451 –T+1, P−10 356 −10.3 17 312 −10.7 11 644 3.2 55 661 −6.4T+1, P−5 376 −5.3 18 214 −5.7 11 470 1.7 57 307 −3.6T+1, P+5 416 4.8 20 601 6.3 11 977 6.2 62 589 5.3T+1, P+10 436 9.8 21 612 11.5 11 809 4.7 64 527 8.5T+2, P+0 RS 394 – 21 022 – 13 029 – 62 257 –T+2, P−10 353 −10.4 18 862 −10.3 13 411 2.9 58 585 −5.9T+2, P−5 372 −5.6 19 878 −5.4 13 225 1.5 60 166 −3.4T+2, P+5 412 4.6 22 259 5.9 13 731 5.4 65 325 4.9T+2, P+10 432 9.6 23 341 11.0 13 554 4.0 67 214 7.9T+3, P+0 RS 388 – 22 733 – 14 903 – 65 791 –T+3, P−10 348 −10.3 18 197 −19.9 15 276 2.5 59 578 −9.4T+3, P−5 367 −5.4 20 466 −9.9 15 094 1.3 62 627 −4.8T+3, P+5 406 4.6 24 007 5.6 15 583 4.6 68 785 4.6T+3, P+10 425 9.8 25 130 10.5 15 415 3.4 70 439 7.1
331P. Singh, N. Kumar/Journal of Hydrology 193 (1997) 316–350

Fig. 4(c) shows that SWE in the basin decreases under all the warmer climatic scenariosbecause a higher increase in temperature builds up less snow in the basin. The importantpoint to be noted is that an increase in temperature up to 38C does not melt the entireaccumulated snow cover in the basin; i.e., snow remains in the basin after the melt periodunder both normal and warmer climate scenarios. However, the quality of this remainingsnow in the basin decreases as the temperature increases, but an increase up to 38C has notdepleted it completely for any year (1987/88, 1988/89 or 1989/90) and snow is alwaysavailable for melting under warmer scenarios (T+1 to T+38C) throughout the melt period.Therefore, a higher melt rate under the warmer climate (T+1 to T+38C) and a broadenedmelt period would increase the annual snow melt runoff. But, for higher temperaturescenarios (T+4, T+58C) snow storage in the basin approaches nil, and therefore the annualsnow melt runoff decreases for this temperature range.
6.2.2. Temperature and precipitation scenariosThe impact of precipitation changes overT + 28C on daily snow melt runoff is shown in
Fig. 7(a). No changes are observed in the snowmelt period or the timing of peak snow meltrunoff, but the magnitude of peak runoff is higher under the higher precipitation scenarioand vice versa. It is evident from Fig. 7(b) that, for all the years, annual snowmelt runoffincreases linearly with changes in precipitation. Changes in precipitation by−10 and+10% vary the annual snowmelt runoff over theT + 28C scenario by−11.5 and 11.9,−9.4 and 9.3%,−10.3 and 11.0% respectively for 1987/88, 1988/89, 1989/90. Combinedtemperature and precipitation scenarios influence both snow water equivalent and meltingconditions over the basin. In the warmer conditions snow cover will deplete faster ifprecipitation is not changed. In the case where both temperature and precipitation increase,the temperature will cause a faster melt but precipitation will enhance the snowpack. Fig.7(b) illustrates that higher snowmelt runoff is observed with a higher amount of precipita-tion, because the increase in precipitation provides a higher snow water equivalent and, inaddition, snow is stored in the catchment at high altitudes and melts in the followingsnowmelt season or later as snowmelt runoff. Consequently, it causes an increase in annualsnowmelt runoff (Table 1). Results for changes in annual snowmelt runoff correspondingto various temperature and precipitation scenarios are given in Tables 3 and 4.The maximum increase (19 to 41%) in annual snowmelt runoff has occurred under aT + 38C, P + 10% scenario.
6.3. Glacier melt runoff
6.3.1. Temperature scenariosThe study basin includes glaciers. However, the magnitude of glacier contribution to the
total flow is much less than that of snowmelt runoff. Normally their major contribution tothe streamflow occurs in the months of July and August after the snow cover on the glacierhas melted. The effect of aT + 28C temperature scenario on daily glacier melt runoff isshown in Fig. 8(a). As expected, the contribution from the glacier starts earlier under thewarmer climate. There is systematic increase in the glacier melt runoff with increase intemperature, which is expected because the total glaciated area does not change signifi-cantly with time and therefore it produces higher runoff under a warmer climate. In
332 P. Singh, N. Kumar/Journal of Hydrology 193 (1997) 316–350

Fig
.6.
(a)
Effe
ctof
incr
ease
inte
mpe
ratu
reon
daily
snow
mel
tru
noff.
(b)
Effe
ctof
incr
ease
inte
mpe
ratu
reon
annu
alsn
owm
elt
runo
ff.
333P. Singh, N. Kumar/Journal of Hydrology 193 (1997) 316–350
contrast, for snowmelt runoff, as the snowline moves up, the lower part of the basinbecomes snowfree and no contribution is obtained from the bare area in terms of snowmelt runoff.
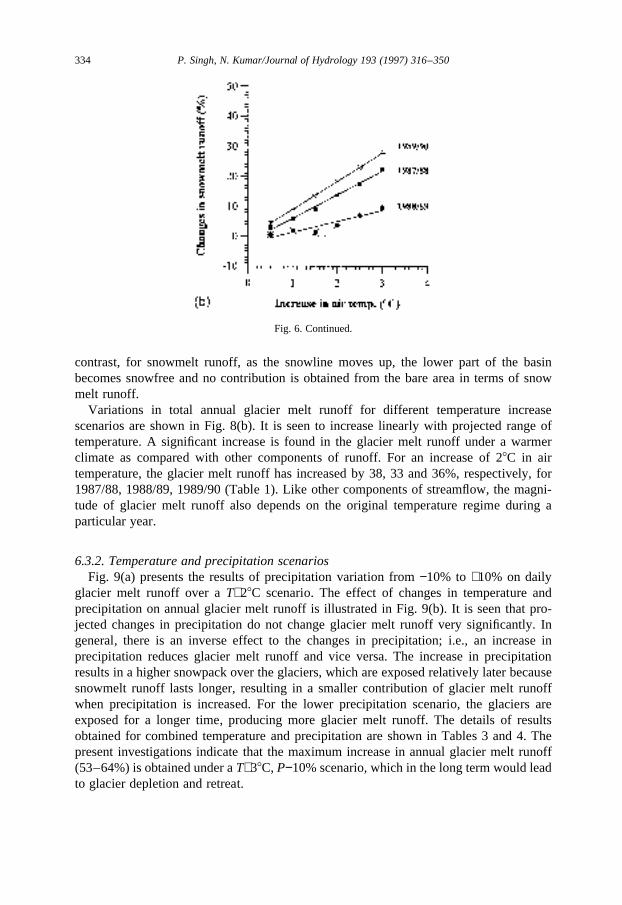
Variations in total annual glacier melt runoff for different temperature increasescenarios are shown in Fig. 8(b). It is seen to increase linearly with projected range oftemperature. A significant increase is found in the glacier melt runoff under a warmerclimate as compared with other components of runoff. For an increase of 28C in airtemperature, the glacier melt runoff has increased by 38, 33 and 36%, respectively, for1987/88, 1988/89, 1989/90 (Table 1). Like other components of streamflow, the magni-tude of glacier melt runoff also depends on the original temperature regime during aparticular year.
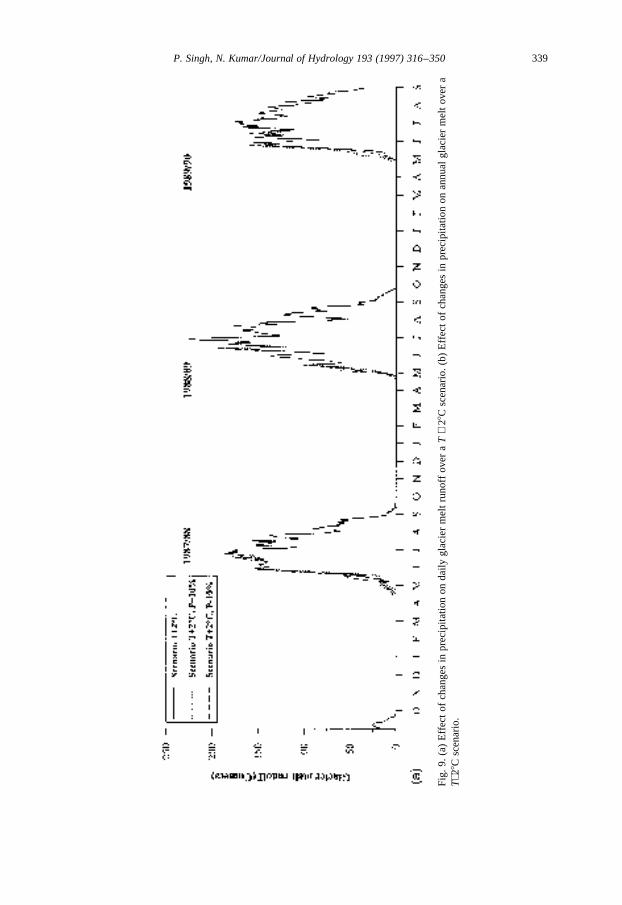
6.3.2. Temperature and precipitation scenariosFig. 9(a) presents the results of precipitation variation from−10% to +10% on daily
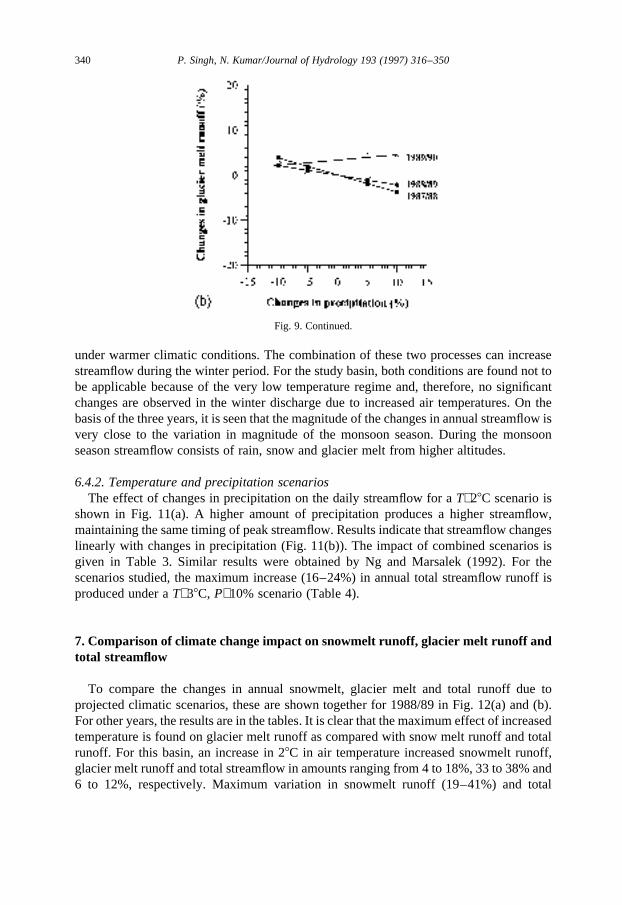
glacier melt runoff over aT+28C scenario. The effect of changes in temperature andprecipitation on annual glacier melt runoff is illustrated in Fig. 9(b). It is seen that pro-jected changes in precipitation do not change glacier melt runoff very significantly. Ingeneral, there is an inverse effect to the changes in precipitation; i.e., an increase inprecipitation reduces glacier melt runoff and vice versa. The increase in precipitationresults in a higher snowpack over the glaciers, which are exposed relatively later becausesnowmelt runoff lasts longer, resulting in a smaller contribution of glacier melt runoffwhen precipitation is increased. For the lower precipitation scenario, the glaciers areexposed for a longer time, producing more glacier melt runoff. The details of resultsobtained for combined temperature and precipitation are shown in Tables 3 and 4. Thepresent investigations indicate that the maximum increase in annual glacier melt runoff(53–64%) is obtained under aT+38C, P−10% scenario, which in the long term would leadto glacier depletion and retreat.
Fig. 6. Continued.
334 P. Singh, N. Kumar/Journal of Hydrology 193 (1997) 316–350

Fig
.7.(
a)E
ffect
ofch
ange
sin
prec
ipita
tion
onda
ilysn
owm
eltr
unof
fove
ra
T+
28C
scen
ario
.(b)
Effe
ctof
chan
ges
inpr
ecip
itatio
non
annu
alsn
owm
eltr
unof
fove
ra
T+28
Csc
enar
io.
335P. Singh, N. Kumar/Journal of Hydrology 193 (1997) 316–350

In addition to the climatic conditions in a current year over a glacier, melting of theglacier is also governed by the accumulation and ablation patterns of the snowpack ofprevious years. If some snow is left in a preceding year covering the glacier, it is added tothe snowpack built up in the current year and even years before, so that the period ofexposure of the glaciers, and their contributions, are influenced by the status of thesnowpack left in preceding years. Changes in glacier melt runoff for 1989/90 for projectedtemperature and precipitation scenarios are well supported by this concept. For example,both 1988/89 and 1989/90 experienced less precipitation in comparison to 1987/88. Inaddition, changes in precipitation are considered as an absolute percentage of precipita-tion. For a low precipitation year, the change in precipitation by a specific projectedpercentage will be less than the change in a high precipitation year due to the sameprojected percentage. For example, in the low precipitation year of 1989/90 not even anincrease in precipitation could decrease the glacier melt runoff because the glaciers wereexposed earlier.
6.4. Total streamflow
6.4.1. Temperature scenariosAs discussed above, snow and glacier contribution forms a major part of the total runoff
in this basin, and therefore changes in the snow and glacier melt runoff due to variousclimatic scenarios are reflected in the changes of total streamflow. For a basin havingprecipitation storage characteristics, an increase in total streamflow is expected under awarmer climate because runoff from both snow and glaciers is accelerated. Changes indaily streamflow distribution for a temperature increase of 28C are illustrated in Fig. 10(a).In general, the timing of peak streamflow is not affected; however, there is a change in themagnitude of peak streamflow, depending upon the spring melting condition. Fig. 10(a)also indicates that no significant change in the winter streamflow could be produced for
Fig. 7. Continued.
336 P. Singh, N. Kumar/Journal of Hydrology 193 (1997) 316–350

Fig
.8.
(a)
Effe
ctof
incr
ease
inte
mpe
ratu
reon
daily
glac
ier
mel
tru
noff.
(b)
Effe
ctof
incr
ease
inte
mpe
ratu
reon
annu
algl
acie
rm
elt
runo
ff.
337P. Singh, N. Kumar/Journal of Hydrology 193 (1997) 316–350

this watershed by theT + 28C temperature scenario, whereas several authors have sug-gested that winter discharge would increase when temperature is increased. This is dis-cussed in the next section. Like annual snow and glacier melt runoff, annual totalstreamflow runoff also varies linearly with increase in temperature (Fig. 10(b)). For atemperature increase of 28C, the variation in annual streamflow is computed to be 12, 6and 10% respectively for 1987/88, 1988/89, 1989/90. Changes in total annual streamflowfor other temperature scenarios are given in Table 1.
To understand the seasonal variation in total streamflow, a seasonal analysis was carriedout. For this purpose a year was divided into four seasons, namely snowmelt season or pre-monsoon season (April–June), monsoon season (July–September), post-monsoon season(October–December) and winter season (January–March). Relative changes in each sea-son with increase in temperature for the year 1988/89 are depicted in Fig. 10(c), and detailsfor other years are given in Table 5. Changes in the streamflow for all the seasons arelinearly related to the increase in temperature. The maximum increase in streamflowrunoff is computed to be in the pre-monsoon season followed by the monsoon season.Cayan and Riddle (1993) also reported that temperature sensitivity seems to be confined tospring and early summer. A larger increase in the pre-monsoon season is possible becauseof the higher amount of snowmelt runoff due to the warmer climate. It should be men-tioned that higher flows in the pre-monsoon season may benefit the country becausedemand for water, both for hydropower and for agriculture, is very high during this season.Further, higher variation in the streamflow during the monsoon season may occur becauseof snowmelt runoff from the high snowfields, with glacier melt runoff contributing alongwith rain. Post-monsoon and winter flows are not affected significantly. However, somestudies indicate an increase in winter discharge due to a warmer environment caused byincreased temperatures (Gleick, 1987b; Bultot et al., 1988; McCabe and Ayers, 1989;Cooley, 1990). It is understood that an increase in winter discharge is possible eitherbecause part of the precipitation may fall as rain or because some snowpack may melt
Fig. 8. Continued.
338 P. Singh, N. Kumar/Journal of Hydrology 193 (1997) 316–350
Fig
.9.
(a)
Effe
ctof
chan
ges
inpr
ecip
itatio
non
daily
glac
ier
mel
tru
noff
over
aT
+28
Csc
enar
io.
(b)
Effe
ctof
chan
ges
inpr
ecip
itatio
non
annu
algl
acie
rm
elt
over
aT+
28C
scen
ario
.
339P. Singh, N. Kumar/Journal of Hydrology 193 (1997) 316–350
under warmer climatic conditions. The combination of these two processes can increasestreamflow during the winter period. For the study basin, both conditions are found not tobe applicable because of the very low temperature regime and, therefore, no significantchanges are observed in the winter discharge due to increased air temperatures. On thebasis of the three years, it is seen that the magnitude of the changes in annual streamflow isvery close to the variation in magnitude of the monsoon season. During the monsoonseason streamflow consists of rain, snow and glacier melt from higher altitudes.
6.4.2. Temperature and precipitation scenariosThe effect of changes in precipitation on the daily streamflow for aT+28C scenario is
shown in Fig. 11(a). A higher amount of precipitation produces a higher streamflow,maintaining the same timing of peak streamflow. Results indicate that streamflow changeslinearly with changes in precipitation (Fig. 11(b)). The impact of combined scenarios isgiven in Table 3. Similar results were obtained by Ng and Marsalek (1992). For thescenarios studied, the maximum increase (16–24%) in annual total streamflow runoff isproduced under aT+38C, P+10% scenario (Table 4).
7. Comparison of climate change impact on snowmelt runoff, glacier melt runoff andtotal streamflow
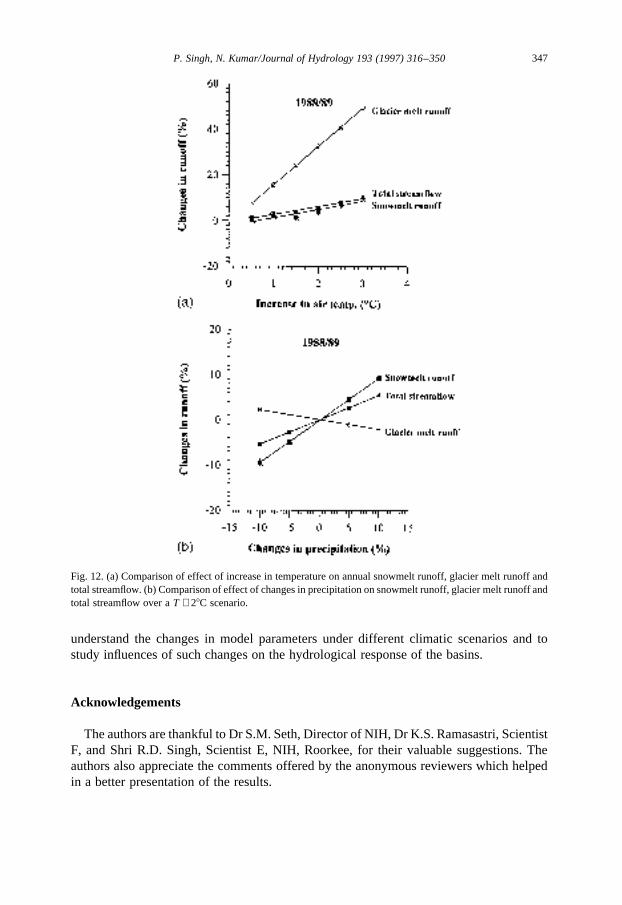
To compare the changes in annual snowmelt, glacier melt and total runoff due toprojected climatic scenarios, these are shown together for 1988/89 in Fig. 12(a) and (b).For other years, the results are in the tables. It is clear that the maximum effect of increasedtemperature is found on glacier melt runoff as compared with snow melt runoff and totalrunoff. For this basin, an increase in 28C in air temperature increased snowmelt runoff,glacier melt runoff and total streamflow in amounts ranging from 4 to 18%, 33 to 38% and6 to 12%, respectively. Maximum variation in snowmelt runoff (19–41%) and total
Fig. 9. Continued.
340 P. Singh, N. Kumar/Journal of Hydrology 193 (1997) 316–350

Fig
.10
.(a
)E
ffect
ofin
crea
sein
tem
pera
ture
onda
ilyto
tal
stre
amflo
w.
(b)
Effe
ctof
incr
ease
inte
mpe
ratu
reon
annu
alto
tal
stre
amflo
w.
(c)
Effe
ctof
incr
ease
inte
mpe
ratu
reon
seas
onal
stre
amflo
w.
341P. Singh, N. Kumar/Journal of Hydrology 193 (1997) 316–350

streamflow (16–24%) is found when both temperature and precipitation are high (T + 38CandP + 10%), whereas maximum variation in glacier melt runoff (53–64%) is obtainedwhen temperature is high but precipitation is low (T + 38C andP − 10%). Changes in snowand glacier melt runoff are also reflected in changes in total streamflow. For example, in1988/89, the variation in snowmelt runoff is relatively lower, which results in less varia-tion in total streamflow in that year. Further, it is seen that snowmelt runoff is moresensitive than glacier melt runoff to the projected changes in precipitation, and that thesensitivity of total streamflow lies between these two (Fig. 12(b)).
A long-term effect of temperature and precipitation changes on the physical character-istics of the glacier can be addressed on the basis of these results. An increase in airtemperature for a longer time will reduce the size of glaciers due to their higher meltingrate. Similar effects are expected under the scenarios of less precipitation. The glaciers
Fig. 10. Continued.
342 P. Singh, N. Kumar/Journal of Hydrology 193 (1997) 316–350

Table 4
Variation in annual SWE, snowmelt runoff, glacier melt runoff and total streamflow under various temperatureand precipitation scenarios with respect to simulation obtained using original temperature and precipitation datafor 1987/88-1989/90. Changes in temperature and precipitation are in8C and percent, respectvely. RS indicatesreference scenario
Year Scenario Snowwaterequiv.(mm)
Change(%)
Snowmeltrunoff(cum.d)
Change(%)
Glacier meltrunoff(cum.d)
Change(%)
Total streamflow(cum.d)
Change(%)
1987/88 T + 0, P + 0 RS 564 – 17 504 – 9 072 – 58 808 –
T + 1, P − 10 490 − 13.1 16 235 − 7.2 11 198 23.4 58 829 0.04
T + 1, P − 5 518 − 8.2 17 339 − 0.9 10 938 20.6 60 498 2.8
T + 1, P + 0 545 − 3.4 18 513 5.8 10 681 17.7 62 212 5.8
T + 1, P + 5 572 1.4 19 757 12.8 10 467 15.4 63 941 8.7
T + 1, P + 10 600 6.4 21 040 20.2 10 283 13.4 65 768 11.8
T + 2, P − 10 475 − 15.8 17 629 0.7 12 989 43.2 62 249 5.9
T + 2, P − 5 501 − 11.2 18 766 7.2 12 742 40.5 63 948 8.7
T + 2, P + 0 528 − 6.4 19 914 13.8 12 490 37.7 65 681 11.7
T + 2, P + 5 554 − 1.8 21 089 20.5 12 256 35.1 67 375 14.6
T + 2, P + 10 580 2.8 22 297 27.4 12 053 32.9 69 192 17.7
T + 3, P − 10 460 − 18.4 19 168 9.5 14 836 63.5 66 109 12.4
T + 3, P − 5 486 − 13.8 20 249 15.7 14 599 60.9 67 805 15.3
T + 3, P + 0 512 − 9.2 21 414 22.3 14 338 58.0 69 518 18.2
T + 3, P + 5 537 − 4.8 22 547 28.8 14 117 55.6 71 245 21.2
T + 3, P + 10 563 − 0.17 23 740 35.6 13 928 53.5 73 087 24.3
1988/89 T + 0, P + 0 RS 343 – 21 014 – 10 451 – 61 171 –
T + 1, P − 10 307 − 10.5 18 973 − 9.7 12 333 18.0 58 925 − 3.7
T + 1, P − 5 324 − 5.5 20 324 − 3.3 12 267 17.4 61 177 0.01
T + 1, P + 0 342 − 0.3 21 426 2.0 12 102 15.8 63 141 3.2
T + 1, P + 5 358 4.4 22 537 7.3 11 953 14.4 64 935 6.2
T + 1, P + 10 376 9.6 23 690 12.7 11 810 13.0 66 815 9.2
T + 2, P − 10 301 − 12.2 19 767 − 5.9 14 185 35.7 61 069 − 0.2
T + 2, P − 5 318 − 7.3 20 751 − 1.3 14 032 34.3 62 854 2.86
T + 2, P + 0 335 − 2.3 21 822 3.8 13 873 32.7 64 645 5.7
T + 2, P + 5 351 2.3 22 818 8.6 13 732 31.4 66 379 8.5
T + 2, P + 10 369 7.6 23 854 13.5 13 599 30.1 68 221 11.5
T + 3, P − 10 294 − 14.3 21 079 0.3 15 950 52.6 64 126 4.8
T + 3, P − 5 309 − 9.9 22 025 4.8 15 796 51.1 65 812 7.6
T + 3, P + 0 326 − 5.0 23 051 9.7 15 640 49.6 67 516 10.4
T + 3, P + 5 342 − 0.3 24 031 14.4 15 490 48.2 69 150 13.0
T + 3, P + 10 359 4.6 25 081 19.4 15 346 46.8 70 836 15.8
1989/90 T + 0, P + 0 RS 398 – 17 784 – 9 598 – 56 649 –
T + 1, P − 10 356 − 10.6 17 312 − 2.7 11 644 21.3 55 661 − 1.7
T + 1, P − 5 376 − 5.5 18 284 2.8 11 470 19.5 57 307 1.2
T + 1, P + 0 397 − 0.3 19 389 9.0 11 283 17.6 59 451 4.9
T + 1, P + 5 416 4.5 20 601 15.8 11 977 24.8 62 589 10.5
T + 1, P + 10 436 9.5 21 612 21.5 11 809 23.0 64 527 13.9
T + 2, P − 10 353 − 11.3 18 862 6.1 13 411 39.7 58 585 3.4
T + 2, P − 5 372 − 6.5 19 878 11.8 13 225 37.8 60 166 6.2
T + 2, P + 0 394 − 1.0 21 022 18.2 13 029 35.7 62 257 9.9
T + 2, P + 5 412 3.5 22 259 25.2 13 731 43.1 65 325 15.3
T + 2, P + 10 432 8.5 23 341 31.2 13 554 41.2 67 214 18.7
T + 3, P − 10 348 − 12.6 18 197 2.3 15 276 59.2 59 578 5.2
T + 3, P − 5 367 − 7.7 20 466 15.1 15 094 57.3 62 627 10.6
T + 3, P + 0 388 − 2.5 22 733 27.8 14 903 55.3 65 791 16.1
T + 3, P + 5 406 2.2 24 007 35.0 15 583 62.4 68 785 21.4
T + 3, P + 10 426 7.0 25 130 41.3 15 415 60.6 70 439 24.3
343P. Singh, N. Kumar/Journal of Hydrology 193 (1997) 316–350

will retreat because of their faster depletion under these conditions. Moreover, a combina-tion of these two scenarios, increase in temperature and decrease in precipitation, for alonger time will have the compound effect of reducing them in size. On the other hand, theglaciers may grow in size and chances of their advancement will be higher if precipitationincreases and temperature does not change.
8. Conclusions
The basic objective of this study is to provide the estimates of the impacts of variousclimate scenarios on the hydrological response of the high altitude Spiti river in theHimalayas. The climatic scenarios were constructed on the basis of simulations of theHamburg coupled atmosphere–ocean climate model for the study region. The influence ofthese scenarios on the snow water equivalent, snowmelt runoff, glacier melt runoff, totalstreamflow and their distribution have been studied. The adopted changes in temperatureand precipitation ranged from 1 to 38C and from−10 to+10%, respectively. The followingconclusions are drawn from this study:
1. Snow water equivalent over the study basin reduces with an increase in air tempera-ture (T + 1, T + 2, T + 38C; P + 0%). However, no significant reduction in annual SWE isobserved for these projected increases in air temperature for this basin. It seems that thehigh altitude and low temperature regime of the basin limits reduction in SWE. Anincrease of 28C in air temperature reduces annual SWE in the range of 1 to 7% (T +28C, P + 0%). The changes in SWE are found to be proportional to the changes inprecipitation. Maximum reduction in annual SWE (13–18%) is found under aT + 38C,P − 10% scenario.
2. Under warmer climate scenarios (T + 1, T + 2, T + 38C; P + 0%), snowmelt runoff,glacier melt runoff and total streamflow produce an early response along with a change in
Table 5
Effect of increase in temperature on seasonal and annual total streamflow. All changes in temperature are in8C.RS indicates reference scenario
Year Scenario Oct.–Dec. Jan.–Mar. Apr.–Jun. Jul.–Sep. Annual
Flow(cum.d)
Change(%)
Flow(cum.d)
Change(%)
Flow(cum.d)
Change(%)
Flow(cum.d)
Change(%)
Flow(cum.d)
Change(%)
1987/88T+0 RS 5501 – 3353 – 21 907 – 28 047 – 58 808 –T+1 5536 0.6 3354 0.03 23 832 8.8 29 491 5.1 62 212 5.8T+2 5572 1.3 3355 0.06 25 912 18.3 30 842 9.9 65 681 11.7T+3 5608 2.0 3356 0.09 27 699 26.4 32 856 17.1 69 518 18.2
1988/89T+0 RS 6559 – 3030 – 22 095 – 29 486 – 61 171 –T+1 6639 1.2 3047 0.6 23 377 5.8 30 079 2.0 63 141 3.2T+2 6717 2.4 3044 0.5 23 913 8.2 30 972 5.0 64 645 5.7T+3 6821 3.9 3051 0.7 25 041 13.3 32 604 10.6 67 516 10.4
1989/90T+0 RS 6340 – 2624 – 19 416 – 28 239 – 56 649 –T+1 6283 −0.9 2600 −2.1 21 062 8.5 29 506 4.5 59 451 5.1T+2 6109 −3.6 2489 −6.2 22 444 15.6 31 215 10.5 62 257 9.9T+3 6165 −2.8 2473 −6.8 24 047 23.9 33 106 17.2 65 791 16.1
344 P. Singh, N. Kumar/Journal of Hydrology 193 (1997) 316–350

Fig
.11.
(a)E
ffect
ofch
ange
sin
prec
ipita
tion
onda
ilyto
tals
trea
mflo
wov
era
T+
28C
scen
ario
.(b)
Effe
ctof
chan
ges
inpr
ecip
itatio
non
annu
alst
ream
flow
over
aT
+28
Csc
enar
io.
345P. Singh, N. Kumar/Journal of Hydrology 193 (1997) 316–350

their runoff distribution. All these hydrological components linearly increase with anincrease in temperature from 1 to 38C. The most prominent effect of temperature increaseis seen on glacier melt runoff as compared to snowmelt runoff and total streamflow. Anincrease of 28C in air temperature increases annual snowmelt runoff, glacier melt runoffand total streamflow in amounts ranging from 4 to 18%, 33 to 38% and 6 to 12%,respectively. The maximum increases in snowmelt runoff (19–41%), glacier melt runoff(53–64%) and total streamflow (16–24%) are observed under (T+ 38C,P+ 10%), (T+ 38C,P − 10%), (T + 38C, P + 10%) scenarios, respectively.
3. Snowmelt runoff and total streamflow increase linearly with changes in precipitation,but glacier melt runoff is inversely related to changes in precipitation (T + 1,T + 2,T + 38C;P − 10 toP + 10%). It is found that snowmelt runoff is more sensitive than glacier meltrunoff to changes in precipitation. A general long-term effect of temperature and preci-pitation changes on the glaciers can be addressed on the basis of the present results. Anincrease in air temperature or decrease in precipitation for a long time will reduce the sizeof glaciers due to higher melt runoff from them. They may retreat because of their fasterdepletion under a warmer climate. The study suggests that a combination of increasedtemperature and decreased precipitation will have a compound effect in reducing theirsize. However, under higher precipitation scenarios the glaciers will grow in size, resultingin higher probability of their advancement.
4. The seasonal analysis of total streamflow indicates that increases in temperature (T+1,T + 2, T + 38C; P + 0%) produce a large increase in the pre-monsoon season streamflowfollowed by an increase in the monsoon season. Post-monsoon and winter streamflow arenot affected significantly by increased temperature. No significant changes in the winterstreamflow are found for this river.
5. Similar studies should be carried out on basins located in different geographic andclimatic regions to investigate potential impacts of projected climate warming onhydrology and water resources in India. Moreover, further investigations are needed to
Fig. 11. Continued.
346 P. Singh, N. Kumar/Journal of Hydrology 193 (1997) 316–350
understand the changes in model parameters under different climatic scenarios and tostudy influences of such changes on the hydrological response of the basins.
Acknowledgements
The authors are thankful to Dr S.M. Seth, Director of NIH, Dr K.S. Ramasastri, ScientistF, and Shri R.D. Singh, Scientist E, NIH, Roorkee, for their valuable suggestions. Theauthors also appreciate the comments offered by the anonymous reviewers which helpedin a better presentation of the results.
Fig. 12. (a) Comparison of effect of increase in temperature on annual snowmelt runoff, glacier melt runoff andtotal streamflow. (b) Comparison of effect of changes in precipitation on snowmelt runoff, glacier melt runoff andtotal streamflow over aT + 28C scenario.
347P. Singh, N. Kumar/Journal of Hydrology 193 (1997) 316–350
References
Becker, A. and Serban, P., 1990. Hydrological models for water resources system design and operation. In:Operational Hydrology, WMO Report No. 34, 80 pp.
Bultot, F., Coppens, A., Dupriez, G.L., Gellens, D. and Meulenberghs, F., 1988. Repercussions of a CO2
doubling on the water cycle and on the water balance — a case study for Belgium. Journal of Hydrology,99: 319–347.
Burn, D.H., 1994. Hydrologic effects of climate change in west-central Canada. Journal of Hydrology, 160: 53–70.
Cayan, D.R. and Riddle, L.G., 1993. The influence of temperature and precipitation on seasonal streamflow inCalifornia. Water Resources Research, 29: 1127–1140.
Chiew, F.H.S., Whetton, P.H., McMahon, T.A. and Pittock, A.B., 1995. Simulation of the impacts of climatechange on runoff and soil moisture in Australian catchemts. Journal of Hydrology, 167: 121–147.
Cohen, S.J., 1986. Impact of CO2 induced climatic change on water resources in the Great Lakes basin. ClimaticChange, 8: 135–153.
Cooley, K.R., 1990. Effects of CO2-induced climatic changes on snowpack and streamflow. HydrologicalSciences Journal, 35: 511–522.
Cubasch, U., Hasselmann, K., Hock, H., Maier-Reimer, E., Mikolajewicz, U., Santer, B.D. and Sausen, R., 1992.Time dependent greenhouse warming computations with a coupled ocean–atmosphere model. ClimateDynamics, 8: 55–89.
Divya and Mehrotra, R., 1995. Climate change and hydrology with emphasis on the Indian subcontinent.Hydrological Sciences Journal, 40: 231–242.
Gleick, P.H., 1986. Methods for evaluating the regional hydrological impacts of global climatic change. Journalof Hydrology, 88: 97–116.
Gleick, P.H., 1987a. Regional hydrological consequences of increases in atmospheric CO2 and other trace gases.Climate Change, 10: 137–161.
Gleick, P.H., 1987b. The development and testing of a water balance model for climatic impact assessment:Modelling the Sacramento basin. Water Resources Research, 23: 1049–1061.
Hingane, L.S., Rup Kumar, K. and Ramanamurthy, B.V., 1985. Long term needs of surface air temperature inIndia. Journal of Climatology, 5: 521–528.
IPCC, 1990. Climate change — The IPCC Scientific Assessment, ed. J.T. Houghten, G.J. Jenkins and J.J.Ephraums. Cambridge University Press, Cambridge, UK.
IPCC, 1992. Climate Change 1992 — the supplementary report to the IPCC Scientific Assessment, ed. J.T.Houghten, B.A. Callander and S.K. Varney. Cambridge University Press, Cambridge, UK, 200 pp.
Jagannathan, P. and Parthasarathy, B., 1972. Fluctuations in the seasonal oscillation of the temperature in India.Indian Journal of Meteorology and Geophysics, 23: 15.
Jones, P.D., Groisman, P. Ya., Coughlan, M., Plummer, N., Wang, W.C. and Karl, T.R., 1990. Assessment ofurbanisation effect in time series of surface air temperature over land. Nature, 347: 169–172.
Lal, M. and Bhaskaran, B., 1993. Impact of greenhouse warming on the climate of north-west India as inferredfrom a coupled atmosphere–ocean climate model. Journal of Arid Environment, 25: 27–37.
Lal, M. and Chander, S., 1993. Potential impacts of greenhouse warming on the water resources of the Indiansubcontinent. JEH, 1: 3–13.
Lal, M., Cubasch, U. and Santer, B.D., 1992. Potential changes in monsoon climate associated with globalwarming as inferred from coupled ocean–atmosphere general circulation model. CAS/JSC Working GroupReport No.17, WMO/TD 467: 66–99.
Lettenmaier, D.P. and Gan, 1990. Hydrologic sensitivities of the Sacramento–San Joaquin river basin, California,to global warming. Water Resources Research, 26: 69–86.
Loaiciga, H.A., Valdes, J.B., Vogel, R., Garvery, J. and Schwarz, H., 1996. Global warming and the hydrologicalcycle. Journal of Hydrology, 174: 83–127.
McCabe, G.J., Jr, 1994. Relationship between atmospheric circulation and snowpack in the Gunnison river basin,Colorado. Journal of Hydrology, 157: 157–176.
McCabe, G.J., Jr, and Ayers, M., 1989. Hydrologic effect of climate change in the Delaware river basin. WaterResources Bulletin, 25: 1231–1242.
348 P. Singh, N. Kumar/Journal of Hydrology 193 (1997) 316–350
NAS, 1979. Carbon Dioxide and Climate: A Scientific Assessment. National Academy of Sciences, NationalAcademic Press, Washington, DC, USA.
Nash, L.L. and Gleick, P.H., 1991. Sensitivity of streamflow in the Colorodo basin to climatic changes. Journal ofHydrology, 125: 221–241.
Nash, J.E., and Sutcliffe, J.V., 1970. River forecasting through conceptual models, 1. A discussion of principles.Journal of Hydrology, 10: 282–290.
Nemec, J., 1989. Implications of changing atmosphere on water resources. Proceedings of the WMO Conference,June 27–30, Toronto, Canada, WMO-710, pp. 211–223.
Nemec, J. and Schaake, J., 1982. Sensitivity of water resource systems to climate variation. HydrologicalSciences Journal, 27: 327–343.
Ng, H.Y.F. and Marsalek, J. 1992. Sensitivity of streamflow simulation to changes in climatic inputs. NordicHydrology, 23: 257–272.
NRC, 1983. Changing Climate. Carbon Dioxide Assessment Committee, National Research Council (US),National Academy Press, Washington, DC, USA.
Panagoulia, D., 1991. Hydrological response of a medium sized mountainous catchment to climate changes.Hydrological Sciences Journal, 26: 525–547.
Pearman, G.I., 1980. The global carbon cycle and increased levels of atmospheric carbon dioxide. In: G.I.Pearman (Editor), Carbon Dioxide and Climate: Australian Research. Australian Academy of Science,Canberra, A.C.T., pp. 11–20.
Quick, M.C. and Pipes, A., 1977. UBC watershed model. Hydrological Sciences Bulletin, 22: 153–161.Quick, M.C. and Singh, P., 1992. Watershed modelling in the Himalayan region. International Symposium on
Hydrology of Mountainous Areas, 28–20 May, 1992, Shimla, India, pp. 201–230.Rango, A., 1989. Evolution of a research oriented snowmelt-runoff model into an operational forecasting tool.
Western Snow Conference 1989, Fort Collins, Colorado.Rango, A., 1992. Worldwide testing of the snowmelt runoff model with applications for predicting the effects of
climate change. Nordic Hydrology, 23: 155–172.Rango, A. and Martinec, J., 1994. Areal extent of seasonal snow cover in a changed climate. Nordic Hydrology,
25: 233–246.Rind, D. and Lebedeff, S., 1984. Potential climatic impacts of increasing atmospheric CO2 with emphasis on
water availability and hydrology in the United States. Report EPA 230-04-006, 96. Environmental ProtectionAgency, Washington, DC, USA.
Sanderson, M. and Smith, J., 1990. Climate change and water in the Grand river, Ontario. Proceedings of the 43rdAnnual Conference of the Canadian Water Resources Association, May 16–18, Pentiction, British Columbia,pp. 243–261.
Sarker, R.P. and Thapliyal, V., 1988. Climate change and variability. Mausam, 39: 127–138.Sausen, R., Schubert, S. and Du¨menil, L., 1994. A model of river runoff for use in coupled atmosphere–ocean
model. Journal of Hydrology, 155: 337–352.Singh, P. and Kumar, N., 1996. Determination of snowmelt factor in the Himalayan region. Hydrological
Sciences Journal, 41: 301–310.Singh, P. and Quick, M.C., 1993. Streamflow simulation of Satluj river in the western Himalayas. Snow and
Glacier Hydrology, IAHS Publication No. 218: 261–271.Singh, P., Ramasastri, K.S. and Kumar, N., 1995a. Topographical influence on precipitation distribution in the
different ranges of western Himalayas. Nordic Hydrology, 26: 259–284.Singh, P., Ramasastri, K.S., Singh, U.K., Gergen, J.T.G. and Dobhal, D.P., 1995b. Hydrological characteristics of
the Dokriani glacier in the Garhwal Himalayas. Hydrological Sciences Journal, 40: 243–257.Thapliyal, V. and Kulshreshtha, S.M., 1991. Climate changes and trends over India. Mausam, 42:
333–338.Thomsen, R., 1990. Effect of climate variability and change in ground water in Europe. Nordic Hydrology, 21:
185–194.US Department of Energy, 1980. Carbon dioxide effects research and assessment program, Part 1: Global carbon
cycle and climate effects of increasing carbon dioxide. DOE/EV-0094, UC-11, 99 pp.Vehvilainen, B. and Lohvansuu, J., 1991. The effect of climate change on discharges and snow cover in Finland.
Hydrological Sciences Journal, 36: 109–121.
349P. Singh, N. Kumar/Journal of Hydrology 193 (1997) 316–350

WMO, 1987. Water resources and climate change. Sensitivity of water resources systems to climate change.WMO/TP No. 247, p. 26.
WMO, UNEP, UNESCO, IOC, FAO and ICSW, 1991. Climate Change: Science, Impacts and Policy. Proceed-ings of the Second World Climate Conference (October 1990), ed. J. Ja¨ger and H.L. Ferguson, CambridgeUniversity Press, Cambridge, UK, 578 pp.
Yeh, T.C., Wetherald, R.T. and Manabe, S., 1983. A model study of the short-term climatic and hydrologiceffects of sudden snow cover removal. Monthly Weather Review, 111: 1013–1024.
350 P. Singh, N. Kumar/Journal of Hydrology 193 (1997) 316–350