SECONDARY WAVES IN COASTAL ZONE: PHYSICAL MECHANISMS OF FORMATION AND POSSIBLE APPLICATION FOR...
14
1 SECONDARY WAVES IN COASTAL ZONE: PHYSICAL MECHANISMS OF FORMATION AND POSSIBLE APPLICATION FOR COASTAL PROTECTION Sergey Kuznetsov 1 and Yana Saprykina 1 The formation of secondary wave in a coastal zone was investigated on the base of field, laboratory and numerical experiments. It was found that formation of secondary waves is essentially part of weakly nonlinear-dispersive wave transformation and determined by a periodic exchange of energy between the first and second harmonics. The formation of secondary waves depends on a stage of wave transformation and defined by amplitude of secondary harmonic and by phase shift between first and second harmonics. On the base of numerical modeling and laboratory experiments an idea of combination of underwater structures with floating breakwater is investigated. Waves propagating above submerged bar generate secondary waves that decrease the mean period of waves. Each additional bar reinforces and stabilizes this effect. Behind the bars the floating breakwater can be applied, because it suppresses successfully only short waves. Advantages and disadvantages of this idea are discussed. Keywords: nonlinear- dispersive waves, secondary waves, floating breakwater, underwater bar INTRODUCTION The waves formed as separate peaks on a surface of an initial wave are named a secondary waves. They can be formed in a coastal zone at propagation of long waves above submerged bar, reefs, trenches, breakwaters and other underwater structures changing the water depth abruptly. Some example of secondary wave is on Fig.1. Figure 1. Examples of secondary waves, field experiment “Shkorpilivtsy 2007”, Black Sea. Photo by Yana Saprykina. The main physical mechanism of formation of such secondary waves is described in detail by many researchers: the amplification of bound harmonics during shoaling process and their release in the deeper region as secondary waves due to increasing of dispersion ( for example, Beji and Battjes, 1993; Masselink, 1998). Primary waves are decomposed generating secondary waves because the various frequency components have different celerity. An example of records of such waves before bar and after bar and its wavelet transform representing frequency content of waves are shown on Fig.2. It 1 P.P. Shirshov Institute of Oceanology of Russian Academy of Sciences, Nakhimovskii prospect, 36, Moscow, 117997, Russia.
-
Upload
independent -
Category
Documents
-
view
1 -
download
0
Transcript of SECONDARY WAVES IN COASTAL ZONE: PHYSICAL MECHANISMS OF FORMATION AND POSSIBLE APPLICATION FOR...

1
SECONDARY WAVES IN COASTAL ZONE: PHYSICAL MECHANISMS OF FORMATION AND POSSIBLE APPLICATION FOR COASTAL PROTECTION
Sergey Kuznetsov1 and Yana Saprykina1
The formation of secondary wave in a coastal zone was investigated on the base of field, laboratory and numerical experiments. It was found that formation of secondary waves is essentially part of weakly nonlinear-dispersive wave transformation and determined by a periodic exchange of energy between the first and second harmonics. The formation of secondary waves depends on a stage of wave transformation and defined by amplitude of secondary harmonic and by phase shift between first and second harmonics. On the base of numerical modeling and laboratory experiments an idea of combination of underwater structures with floating breakwater is investigated. Waves propagating above submerged bar generate secondary waves that decrease the mean period of waves. Each additional bar reinforces and stabilizes this effect. Behind the bars the floating breakwater can be applied, because it suppresses successfully only short waves. Advantages and disadvantages of this idea are discussed.
Keywords: nonlinear- dispersive waves, secondary waves, floating breakwater, underwater bar
INTRODUCTION The waves formed as separate peaks on a surface of an initial wave are named a secondary waves.
They can be formed in a coastal zone at propagation of long waves above submerged bar, reefs, trenches, breakwaters and other underwater structures changing the water depth abruptly. Some example of secondary wave is on Fig.1.
Figure 1. Examples of secondary waves, field experiment “Shkorpilivtsy 2007”, Black Sea. Photo by Yana Saprykina.
The main physical mechanism of formation of such secondary waves is described in detail by
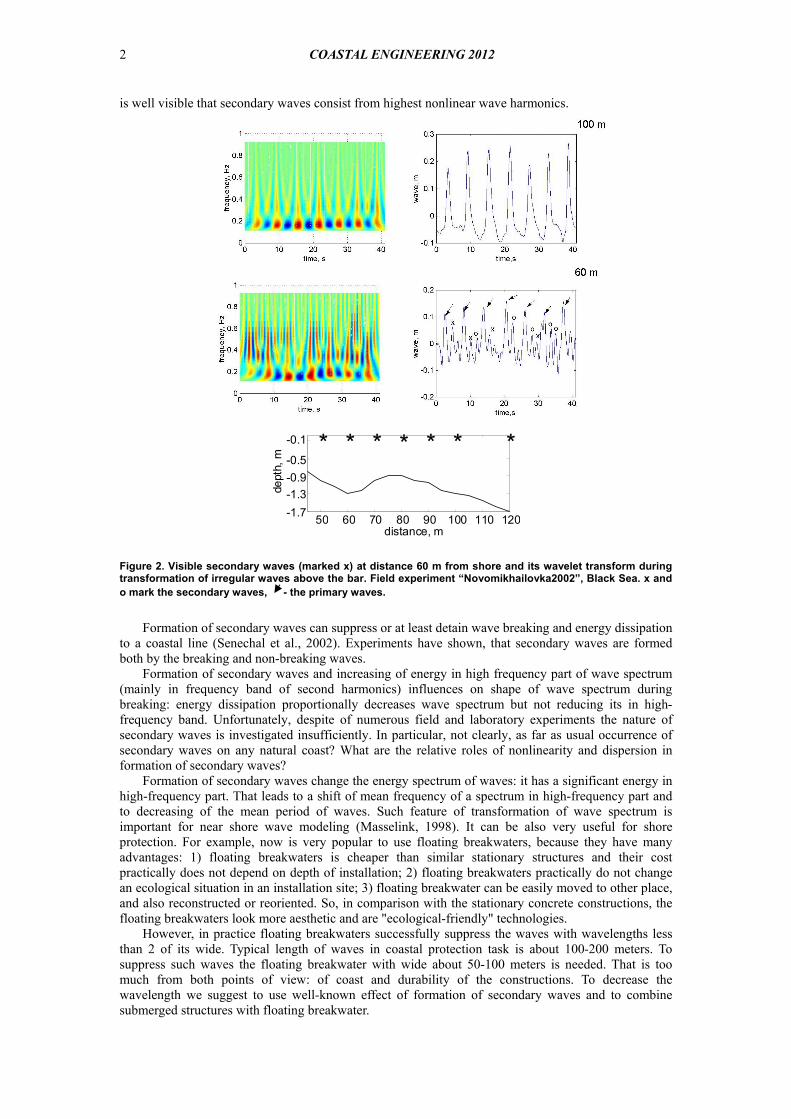
many researchers: the amplification of bound harmonics during shoaling process and their release in the deeper region as secondary waves due to increasing of dispersion ( for example, Beji and Battjes, 1993; Masselink, 1998). Primary waves are decomposed generating secondary waves because the various frequency components have different celerity. An example of records of such waves before bar and after bar and its wavelet transform representing frequency content of waves are shown on Fig.2. It
1P.P. Shirshov Institute of Oceanology of Russian Academy of Sciences, Nakhimovskii prospect, 36, Moscow,
117997, Russia.
2 COASTAL ENGINEERING 2012
is well visible that secondary waves consist from highest nonlinear wave harmonics.
Figure 2. Visible secondary waves (marked x) at distance 60 m from shore and its wavelet transform during transformation of irregular waves above the bar. Field experiment “Novomikhailovka2002”, Black Sea. x and o mark the secondary waves, - the primary waves.
Formation of secondary waves can suppress or at least detain wave breaking and energy dissipation
to a coastal line (Senechal et al., 2002). Experiments have shown, that secondary waves are formed both by the breaking and non-breaking waves.
Formation of secondary waves and increasing of energy in high frequency part of wave spectrum (mainly in frequency band of second harmonics) influences on shape of wave spectrum during breaking: energy dissipation proportionally decreases wave spectrum but not reducing its in high-frequency band. Unfortunately, despite of numerous field and laboratory experiments the nature of secondary waves is investigated insufficiently. In particular, not clearly, as far as usual occurrence of secondary waves on any natural coast? What are the relative roles of nonlinearity and dispersion in formation of secondary waves?
Formation of secondary waves change the energy spectrum of waves: it has a significant energy in high-frequency part. That leads to a shift of mean frequency of a spectrum in high-frequency part and to decreasing of the mean period of waves. Such feature of transformation of wave spectrum is important for near shore wave modeling (Masselink, 1998). It can be also very useful for shore protection. For example, now is very popular to use floating breakwaters, because they have many advantages: 1) floating breakwaters is cheaper than similar stationary structures and their cost practically does not depend on depth of installation; 2) floating breakwaters practically do not change an ecological situation in an installation site; 3) floating breakwater can be easily moved to other place, and also reconstructed or reoriented. So, in comparison with the stationary concrete constructions, the floating breakwaters look more aesthetic and are "ecological-friendly" technologies.
However, in practice floating breakwaters successfully suppress the waves with wavelengths less than 2 of its wide. Typical length of waves in coastal protection task is about 100-200 meters. To suppress such waves the floating breakwater with wide about 50-100 meters is needed. That is too much from both points of view: of coast and durability of the constructions. To decrease the wavelength we suggest to use well-known effect of formation of secondary waves and to combine submerged structures with floating breakwater.
50 60 70 80 90 100 110 120 -1.7 -1.3 -0.9 -0.5
-0.1
distance, m
dept
h, m
* * * * * * *
COASTAL ENGINEERING 2012 3
So the purposes of this work - detailed studying of mechanisms and conditions of formation of secondary waves on the base of the data of numerical, field and laboratory experiments and experimental testing an idea of possible combinations of submerged structures with permeable floating breakwater for reducing wave impact on a shore.
LABORATORY AND MODELING EXPERIMENTS The laboratory experiments were performed in wave flume of Scientific Research center « Sea
coasts» (Sochi, Russia). The length of flume was 23 m, width – 0.6 m, height – 1.0 m. The transformation of pseudo monochromatic waves above the various bottom profiles with bar was studied. Free surface elevation was registered by capacity wire gauges at sampling frequency 200 Hz. Duration of records was 120 s.
For the numerical modeling of wave transformation the Boussinesq-type equations with improved dispersion characteristics in frequency domain and MIKE21 BW model in time domain were applied. (Madsen, Sorensen, 1993, Eldeberky, Battjes, 1996, Kirby, Kaihatu, 1996).
Additionally, to investigate the dynamics of secondary waves the evolutions of phase shift between first and second harmonics and celerity of harmonics were calculated. Phase shift or a phase difference between first and second harmonics was defined as biphase:
2φ1 –φ2
where φ1, φ2 – phase of complex amplitudes of first and second harmonics of wave, respectively. Complex amplitudes were defined from Fourier transform of wave records.
“Visible” celerity of waves of first and second harmonics from the mutual spectral analysis of waves of corresponding frequency bands in the neighboring points of measurement has been accounted. The spectra of “visible” celerity for wave of the first and second nonlinear harmonics are calculated as:
ppp ff
lfc 2/)(
)(0
where l =l2-l1– distance between neighboring gauges 1 и 2, 0 – time shift between the wave records, corresponding to a maximum of mutual correlation function, - phase shift (phase spectrum):
)])()(Re[/)]()((Im[)( *
2,1,*
2,1, ppppppppp fAfAfAfAarctgf
where )(, pip fA - Fourier amplitudes of wave harmonics at neighboring gauges 1 и 2, p – rank of harmonics, * - complex conjugate.
PHYSICAL MECHANISM OF FORMATION OF SECONDARY WAVES
Formation of secondary waves during transformation of monochromatic waves First consider simple example of formation of secondary waves. Typical example of wave
transformation over constant depth without breaking is shown on Fig. 3. It is well visible, that formation of secondary waves during wave transformation is connected with
exchange of energy between the first and second harmonic. Really, if consider wave records as shown in Figure 3d on distance of 10 m after the beginning of wave transformation, the back front of a primary wave starts to be deformed, that is connected with nonlinear increasing of amplitude of the second harmonic (Figure 3a) and a peak of a secondary wave appears at distance of 25 m.
It is easy to calculate from analysis of bend point of functions, that the secondary wave can be visible if a2 0.25a1 , where a1 and a2 are amplitudes of first and second harmonics. It becomes most distinct visible peak of a secondary wave when the amplitude of the second harmonic is a maximum (Figure 3a, distance 40 m).
At initial stage of wave transformation (up to 20 m) second harmonic and first harmonic are phase locked: biphase is near -/2. So is possible to say that nonlinear processes prevails dispersion processes and “hold” second harmonic near primary. At this time celerity of second harmonic is near celerity of primary (or excess, for example, at distance from 70 m, when next period of wave transformation began). That corresponds to “anomaly dispersion effect” caused by strong nonlinearity. Later, at distances from 25 up to 70 m, influence of dispersion processes increase relatively the nonlinearity, and detaching of the secondary wave consisting from second harmonic from primary one occurs. It is confirmed by fast increasing of phase shift between harmonics up to +/2. Visually it is shown as

4 COASTAL ENGINEERING 2012
increasing of distance between peaks of secondary and primary waves.
a
d
b
c
Figure 3. Changes of amplitudes (a), biphase (b) and visible celerity of 1 and 2 harmonics at transformation of monochromatic waves (d) above a horizontal bottom 0.7 m: amplitudes 6 cm, frequency 0.2 Hz.
Increasing of distance leads to moving of additional peak of a secondary wave on a forward front
of next wave and to its gradual disappearance because of reduction of amplitude of the second harmonic due to backward energy transfer (distance from 60 up to 75 m) (Fig. 3d). Visible celerity of second harmonic at that time is less than first, i.e. second harmonic lags behind of first. It lags behind while its amplitude does not become very small and first harmonic increases again to initial value. At this stage of wave transformation first and second harmonics are again almost phase locked (phase shift is small, Fig. 3b).
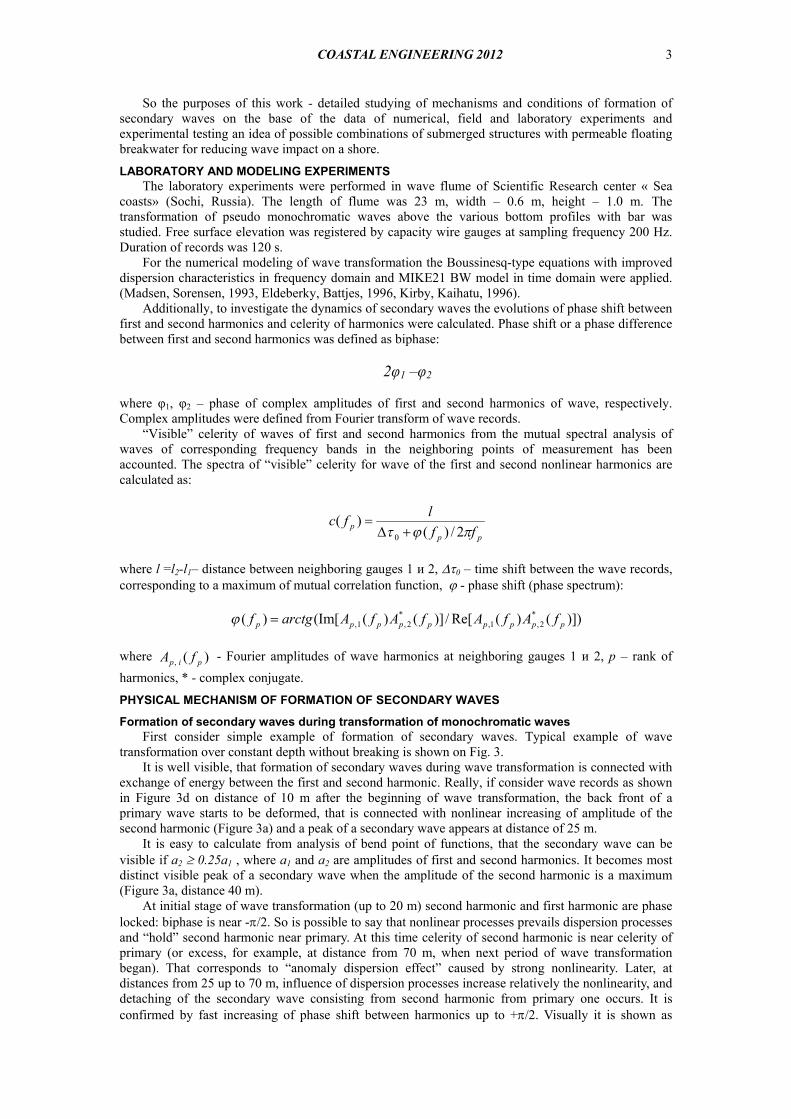
The same features are revealed in waves transforming on middle sloping bottom. But periods of near resonant interactions will be change and differ from periods of transformation above constant depth due to decreasing depth (Fig. 4). Secondary waves have arisen on the end of slope (Fig. 4 c, 5 gauge).
COASTAL ENGINEERING 2012 5
4 6 8 10 12 14 16 18 0 0.01 0.02 0.03 0.04 0.05 0.06 0.07 0.08
distance, m
ampl
itude
s, m
a
0 5 10 15 20 25 -0.2 0
0.2
0 5 10 15 20 25 -0.2 0
0.2
0 5 10 15 20 25 -0.2 0
0.2
0 5 10 15 20 25 -0.2 0
0.2
wav
es, m
0 5 10 15 20 25 -0.2 0
0.2
0 5 10 15 20 25 -0.2 0
0.2
0 5 10 15 20 25 -0.2 0
0.2
0 5 10 15 20 25 -0.2 0
0.2
time, s
d
4 6 8 10 12 14 16 18 -0.8 -0.6 -0.4 -0.2
0 0.2 0.4 0.6 0.8
1
distance, m
phas
e, ra
d
b
4 6 8 10 12 14 16 18 0 0.5
1 1.5
2 2.5
3
distance, m
cele
rity,
m/s
c
Figure 4. Evolution of amplitude (a), phase shift between first and second harmonics (b), visible celerity of first and second harmonics (c) and waves (d, from up to down) over sloping bottom (blue line in (c)). Bold line – first harmonic, thin line – second harmonic, green asterisks – position of wave gauges.
So, formation of secondary waves is essentially part of weakly nonlinear - dispersive
transformation of waves. Amplitude of secondary waves is defined by amplitude of second harmonic. More visible secondary waves are formed during of “weakness” of nonlinearity and intensification of dispersion; this process is periodical due to near-resonant interactions and phase shift between first and second harmonics is very important.
Dependence formation of secondary waves from run of wave As was already pointed in introduction, the appearance of secondary waves behind the underwater
bar due to increasing of dispersion at increasing of depth is observed often and described in detail. Nevertheless, it is still unknown must the secondary waves always arise in this case or not?
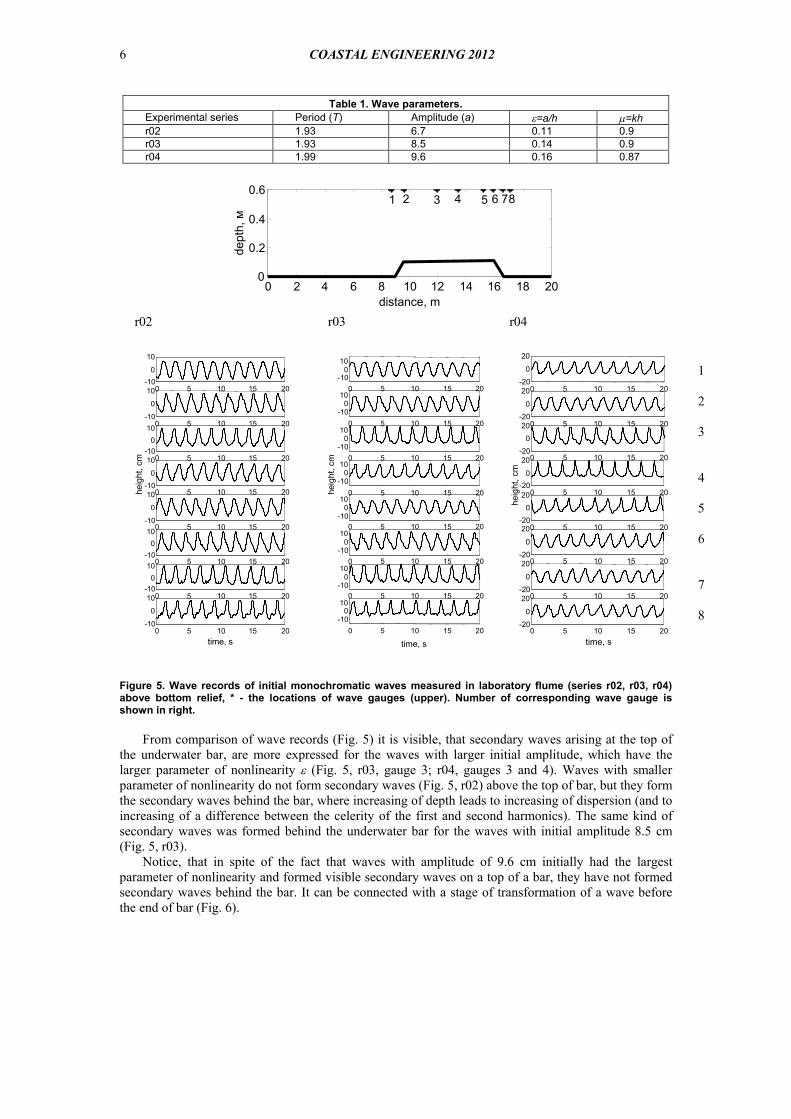
Let consider the formation of secondary waves in the laboratory flume using three experimental series of transformation of monochromatic waves with similar periods (close to 1.9 s) but different amplitudes. Waves propagate initially above the horizontal bottom at depth 0.6 m and then above the underwater trapezoidal bar. The scheme of a bottom relief and position of wave gauges are shown on Fig. 5. The initial parameters of investigated waves are in Table 1.
6 COASTAL ENGINEERING 2012
Table 1. Wave parameters. Experimental series Period (T) Amplitude (a) =a/h =kh r02 1.93 6.7 0.11 0.9 r03 1.93 8.5 0.14 0.9 r04 1.99 9.6 0.16 0.87
0 2 4 6 8 10 12 14 16 18 20 0
0.2
0.4
0.6
distance, m
dept
h, м
1 2 3 4 5 6 7 8
r02 r03 r04
0 5 10 15 20 -10 0
10
time, s
0 5 10 15 20 -10 0
10 0 5 10 15 20 -10 0
10 0 5 10 15 20 -10 0
10 0 5 10 15 20 -10 0
10
heig
ht, c
m
0 5 10 15 20 -10 0
10 0 5 10 15 20 -10 0
10 0 5 10 15 20 -10 0
10
0 5 10 15 20 -10 0 10 0 5 10 15 20 -10 0 10 0 5 10 15 20 -10 0 10 0 5 10 15 20 -10 0 10 0 5 10 15 20 -10 0 10 0 5 10 15 20 -10 0 10 0 5 10 15 20 -10 0 10 0 5 10 15 20 -10 0 10
time, s
heig
ht, c
m
0 5 10 15 20 -20 0
20 0 5 10 15 20 -20 0
20 0 5 10 15 20 -20 0
20 0 5 10 15 20 -20 0
20 0 5 10 15 20 -20 0
20 0 5 10 15 20 -20 0
20 0 5 10 15 20 -20 0
20 0 5 10 15 20 -20 0
20
heig
ht, c
m
time, s
1 2 3 4 5 6 7 8
Figure 5. Wave records of initial monochromatic waves measured in laboratory flume (series r02, r03, r04) above bottom relief, * - the locations of wave gauges (upper). Number of corresponding wave gauge is shown in right.
From comparison of wave records (Fig. 5) it is visible, that secondary waves arising at the top of
the underwater bar, are more expressed for the waves with larger initial amplitude, which have the larger parameter of nonlinearity (Fig. 5, r03, gauge 3; r04, gauges 3 and 4). Waves with smaller parameter of nonlinearity do not form secondary waves (Fig. 5, r02) above the top of bar, but they form the secondary waves behind the bar, where increasing of depth leads to increasing of dispersion (and to increasing of a difference between the celerity of the first and second harmonics). The same kind of secondary waves was formed behind the underwater bar for the waves with initial amplitude 8.5 cm (Fig. 5, r03).
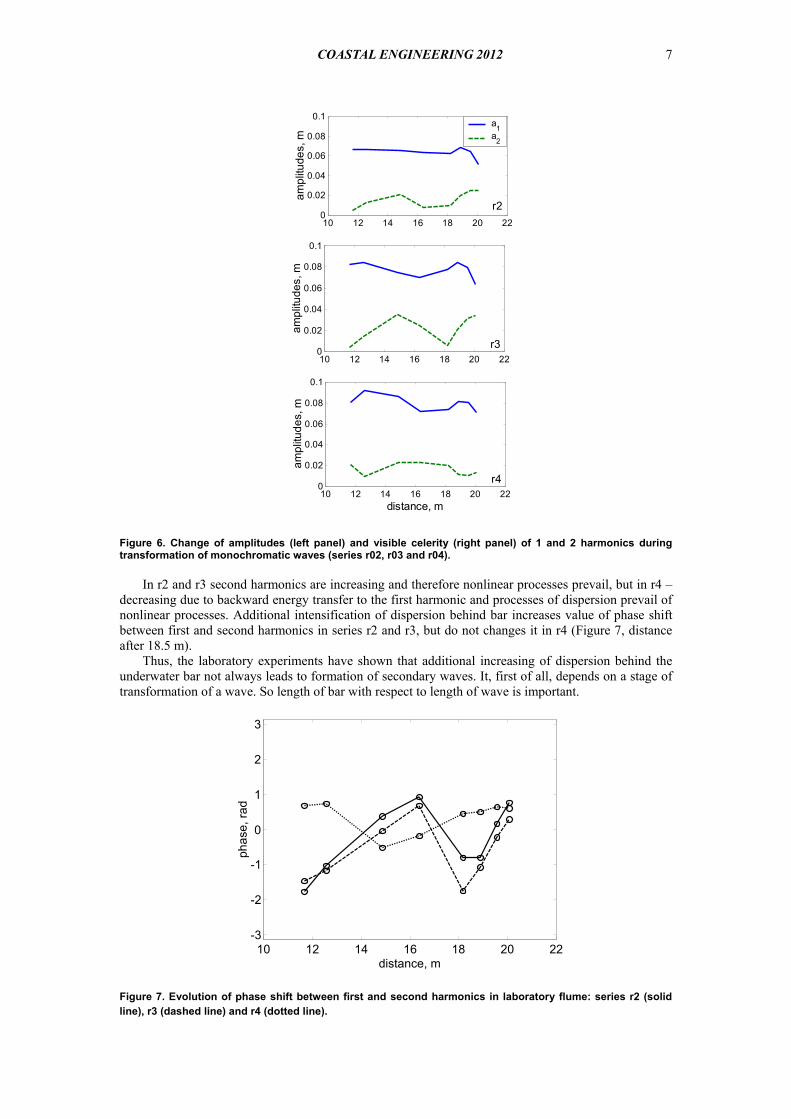
Notice, that in spite of the fact that waves with amplitude of 9.6 cm initially had the largest parameter of nonlinearity and formed visible secondary waves on a top of a bar, they have not formed secondary waves behind the bar. It can be connected with a stage of transformation of a wave before the end of bar (Fig. 6).
COASTAL ENGINEERING 2012 7
10 12 14 16 18 20 220
0.02
0.04
0.06
0.08
0.1
ampl
itude
s, m
a1a2
10 12 14 16 18 20 220
0.02
0.04
0.06
0.08
0.1
ampl
itude
s, m
10 12 14 16 18 20 220
0.02
0.04
0.06
0.08
0.1
ampl
itude
s, m
distance, m
r2
r3
r4
Figure 6. Change of amplitudes (left panel) and visible celerity (right panel) of 1 and 2 harmonics during transformation of monochromatic waves (series r02, r03 and r04).
In r2 and r3 second harmonics are increasing and therefore nonlinear processes prevail, but in r4 – decreasing due to backward energy transfer to the first harmonic and processes of dispersion prevail of nonlinear processes. Additional intensification of dispersion behind bar increases value of phase shift between first and second harmonics in series r2 and r3, but do not changes it in r4 (Figure 7, distance after 18.5 m).
Thus, the laboratory experiments have shown that additional increasing of dispersion behind the underwater bar not always leads to formation of secondary waves. It, first of all, depends on a stage of transformation of a wave. So length of bar with respect to length of wave is important.
10 12 14 16 18 20 22 -3
-2
-1
0
1
2
3
distance, m
phas
e, ra
d
Figure 7. Evolution of phase shift between first and second harmonics in laboratory flume: series r2 (solid line), r3 (dashed line) and r4 (dotted line).

8 COASTAL ENGINEERING 2012
So, it was revealed that formation of secondary waves is essential part of transformation of weakly nonlinear dispersive waves in coastal zone. Energy transfer in these waves is due to near resonant nonlinear triad interactions. 1. The basic mechanism of formation of secondary waves is nonlinear-dispersive and is determined
by a periodic exchange of energy between the first and second harmonics. It has two stages of secondary wave formation: nonlinear increasing of the second harmonic in a trough of an initial wave and its dispersive lags against the first harmonics due to dispersion.
2. The amplitude of secondary waves is defined of amplitude of second harmonic. More visible secondary waves are formed during of “weakness” of nonlinearity and “forcing” of dispersion, this process is periodical due to near-resonant interactions.
3. The formation of secondary waves depends on a stage of wave transformation defined by length of wave run at shallow water conditions. Therefore the increasing of a dispersion caused by peculiarities of a bottom relief (underwater bars, trenches, etc.), not always leads to formation of visible secondary waves.
COMBINATION OF UNDERWATER STRUCTURES WITH FLOATING BREAKWATER
Numerical modeling First, we will perform numerical modeling transformation of irregular waves over systems of bars
to account possibility decompose initial waves on primary and secondary with essential part of wave energy in secondary waves.
The model tests were performed with initially JONSWAP spectra waves propagated above submerged bars. It was revealed that for stability of decreasing of mean wave period one bar is not enough. The best results are achieved when there is a combination from two bars (Fig. 8).
Figure 8. Change of main frequency during wave transformation above one (solid line) and two bars (dotted line). JONSWAP spectrum, Hs=1m, Tp=7 s, γ=6, and bottom relief.
Fig.8 shows the mean frequency of waves increase from 0.14 Hz to 0,24 Hz after the wave passage over one bottom bar and up to 0.3 Hz behind the second bar. The best results (maximum of mean waves frequency) are achieved when there for combination of two solid (Figure 2). The second bar stabilizes the effect of secondary waves formation, preventing backward energy transfer from higher harmonics to the first harmonic and additionally decrease the mean wave period.
The energy of the first harmonic is transferred to the second and the third ones, generating after the bars the “secondary” waves composed mainly of the higher harmonics.
The modeling revealed that both high porosity of the bars and strong wave breaking between the bars reduce the effect of mean wave period decrease. In this case, the higher harmonics dissipate faster than the main one and therefore the fall of the secondary waves height is more than that of the primary one. The effect of porosity on mean wave frequency fmean and on higher harmonics generation over the shelf are shown in Fig. 9, where a1, a2 and a3 are the first, second and third harmonics amplitudes, calculated by numerical integrating of amplitude spectrum in corresponding frequency bands. . Solid lines show amplitudes for solid bottom, dashed lines – for rubble bottom (0.2 m diameter), doted lines – for tetrapods covered bottom (0.7 meter linear scale).

COASTAL ENGINEERING 2012 9
Figure 9. The effect of porosity on higher harmonic generation over the submerged shelf. Harmonics amplitudes (upper), significant wave height (middle) and sea bed profile (lower).
Second bar stabilize the effect of formation of secondary waves, preventing the backward energy transfer from higher harmonics to the main one (first harmonic) and additionally decrease the mean wave period. The energy of first harmonic is transferred to second and third harmonics, forming after the bars “secondary” waves, consisting mainly from this higher harmonics.
The modeling tests have shown that high porosity of bars and strong wave breaking between bars reduce effect of decreasing of mean wave period, because in this case highest harmonics of waves dissipate faster and cannot generate secondary waves after bars.
So, a numerical modelling of waves with JONSWAP spectrum testified possibility in principle of essential decreasing of mean wave period by underwater bar. It also revealed that a) the prehistory of wave transformation before a bar is not so important as well as over a forward slope of a bar; b) the mean wave period decreases with initial significant wave height; c) optimal bar length is a half of initial wavelength, found by the spectral maximum frequency in top of bar; d) the backward slope of a bar should be abrupt for generation of the most intensive secondary waves; e) optimal distance between the bars is a wavelength, found by the spectral maximum frequency in top of bar.
Experimental transformation of waves above two submerged bars For physical modeling two underwater bars from models 1:10 of tetrapods were constructed. The
sizes of first bar were 0.8x0.6x0.2 m and 0.6x0.6x0.2 m. The distance between bars was 1.05 m. Setup of experiment is shown on Fig. 10.
Depth of water in experiment was 0.35 m. In modeling scale 1:10 it corresponds to 3.5 m. Scales of wave periods can be recalculated in real scales as Tmod√10=Treal.
During the experiment 12 series of initial pseudo-monochromatic waves were tested: 0.9≤ T ≤1.55 s, 11≤ Hs ≤25.5 cm.
10 COASTAL ENGINEERING 2012
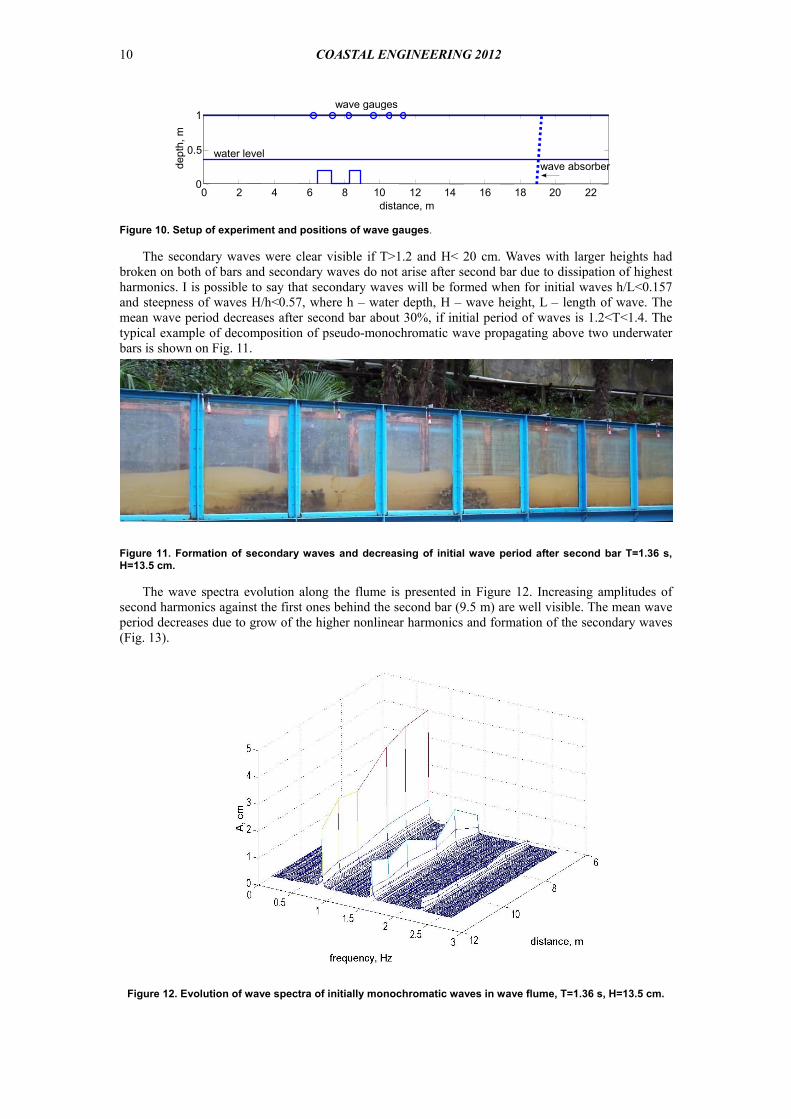
Figure 10. Setup of experiment and positions of wave gauges.
The secondary waves were clear visible if T>1.2 and H< 20 cm. Waves with larger heights had broken on both of bars and secondary waves do not arise after second bar due to dissipation of highest harmonics. I is possible to say that secondary waves will be formed when for initial waves h/L<0.157 and steepness of waves H/h<0.57, where h – water depth, H – wave height, L – length of wave. The mean wave period decreases after second bar about 30%, if initial period of waves is 1.2<T<1.4. The typical example of decomposition of pseudo-monochromatic wave propagating above two underwater bars is shown on Fig. 11.
Figure 11. Formation of secondary waves and decreasing of initial wave period after second bar T=1.36 s, H=13.5 cm.
The wave spectra evolution along the flume is presented in Figure 12. Increasing amplitudes of second harmonics against the first ones behind the second bar (9.5 m) are well visible. The mean wave period decreases due to grow of the higher nonlinear harmonics and formation of the secondary waves (Fig. 13).
Figure 12. Evolution of wave spectra of initially monochromatic waves in wave flume, T=1.36 s, H=13.5 cm.
0 2 4 6 8 10 12 14 16 18 20 22 0
0.5
1
distance, m
dept
h, m
water level
wave gauges
wave absorber
COASTAL ENGINEERING 2012 11
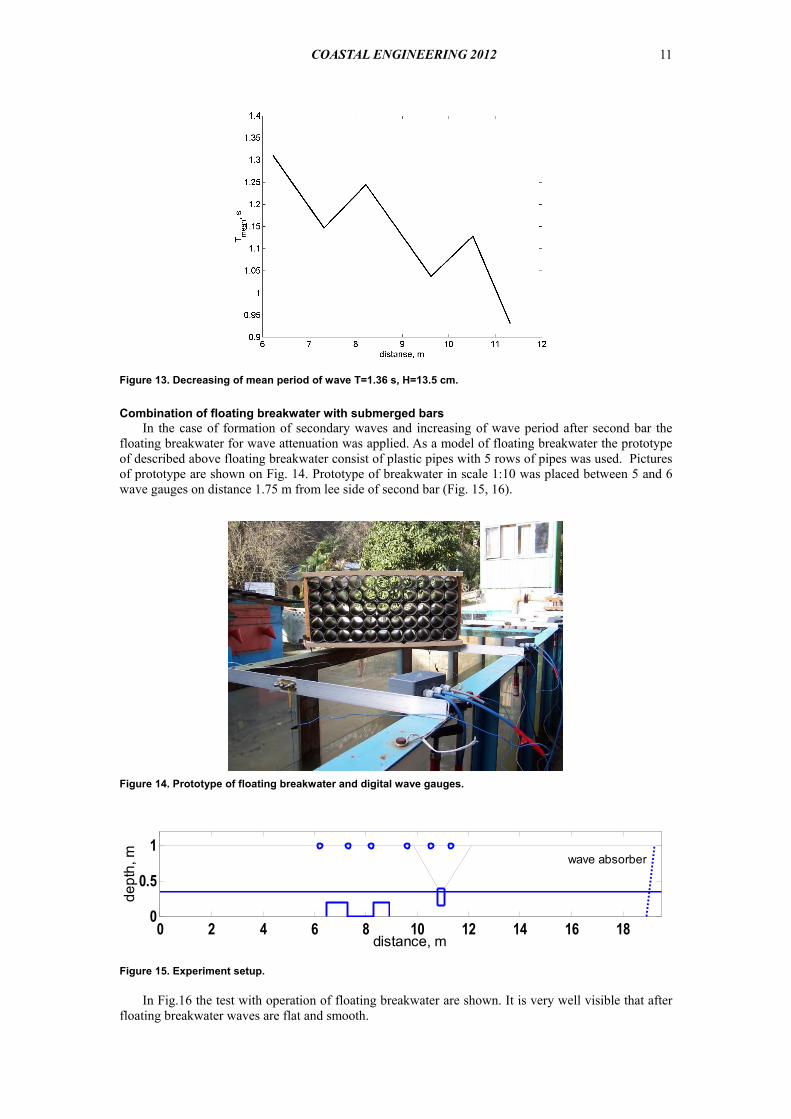
Figure 13. Decreasing of mean period of wave T=1.36 s, H=13.5 cm.
Combination of floating breakwater with submerged bars In the case of formation of secondary waves and increasing of wave period after second bar the
floating breakwater for wave attenuation was applied. As a model of floating breakwater the prototype of described above floating breakwater consist of plastic pipes with 5 rows of pipes was used. Pictures of prototype are shown on Fig. 14. Prototype of breakwater in scale 1:10 was placed between 5 and 6 wave gauges on distance 1.75 m from lee side of second bar (Fig. 15, 16).
Figure 14. Prototype of floating breakwater and digital wave gauges.
Figure 15. Experiment setup.
In Fig.16 the test with operation of floating breakwater are shown. It is very well visible that after floating breakwater waves are flat and smooth.
0 2 4 6 8 10 12 14 16 180
0.5
1
distance, m
dept
h, m wave absorber
12 COASTAL ENGINEERING 2012
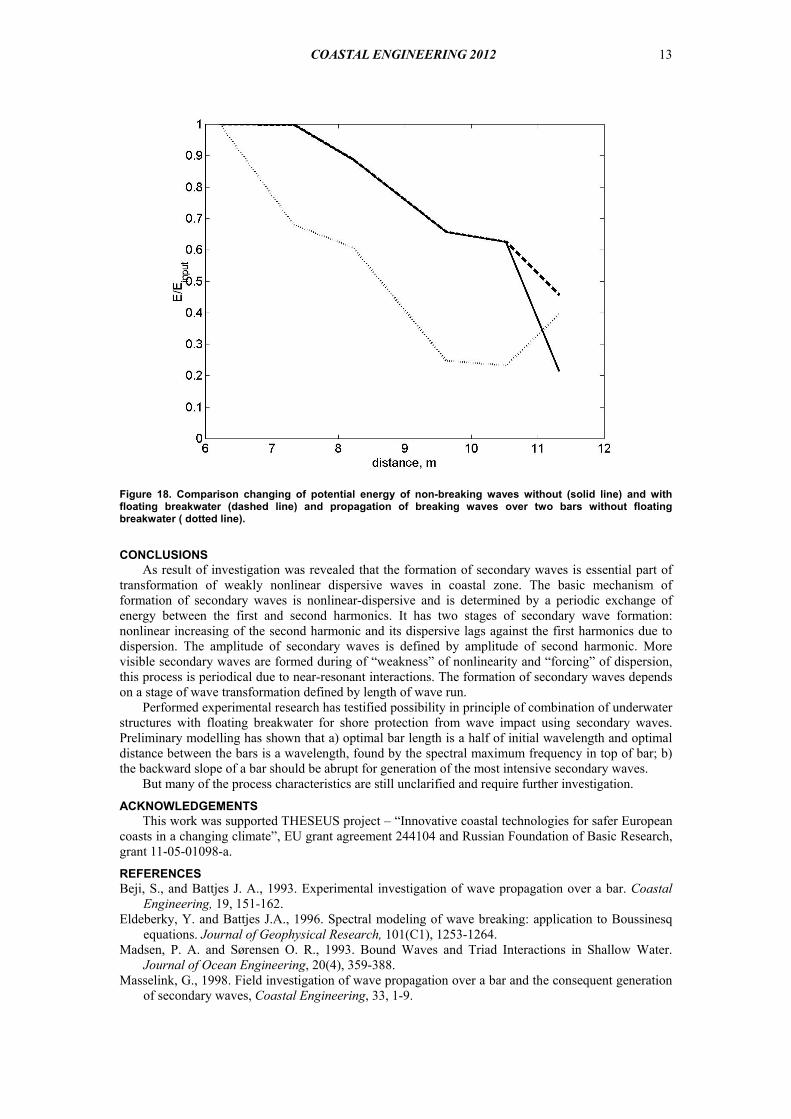
A comparison of wave spectra registered by the last gauge in the tests with and without floating breakwater, enables to say that the floating breakwater suppresses not only short waves energy (the secondary waves with higher harmonics) but energy of the main harmonic as well (Fig. 17).
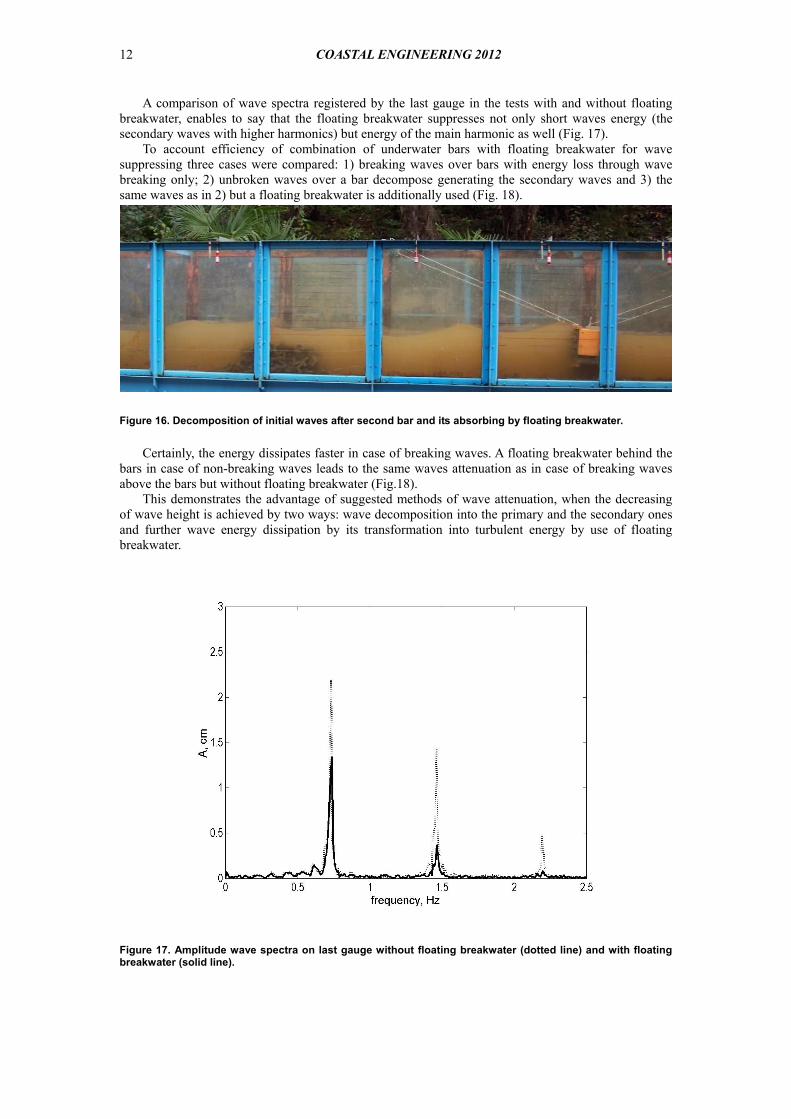
To account efficiency of combination of underwater bars with floating breakwater for wave suppressing three cases were compared: 1) breaking waves over bars with energy loss through wave breaking only; 2) unbroken waves over a bar decompose generating the secondary waves and 3) the same waves as in 2) but a floating breakwater is additionally used (Fig. 18).
Figure 16. Decomposition of initial waves after second bar and its absorbing by floating breakwater.
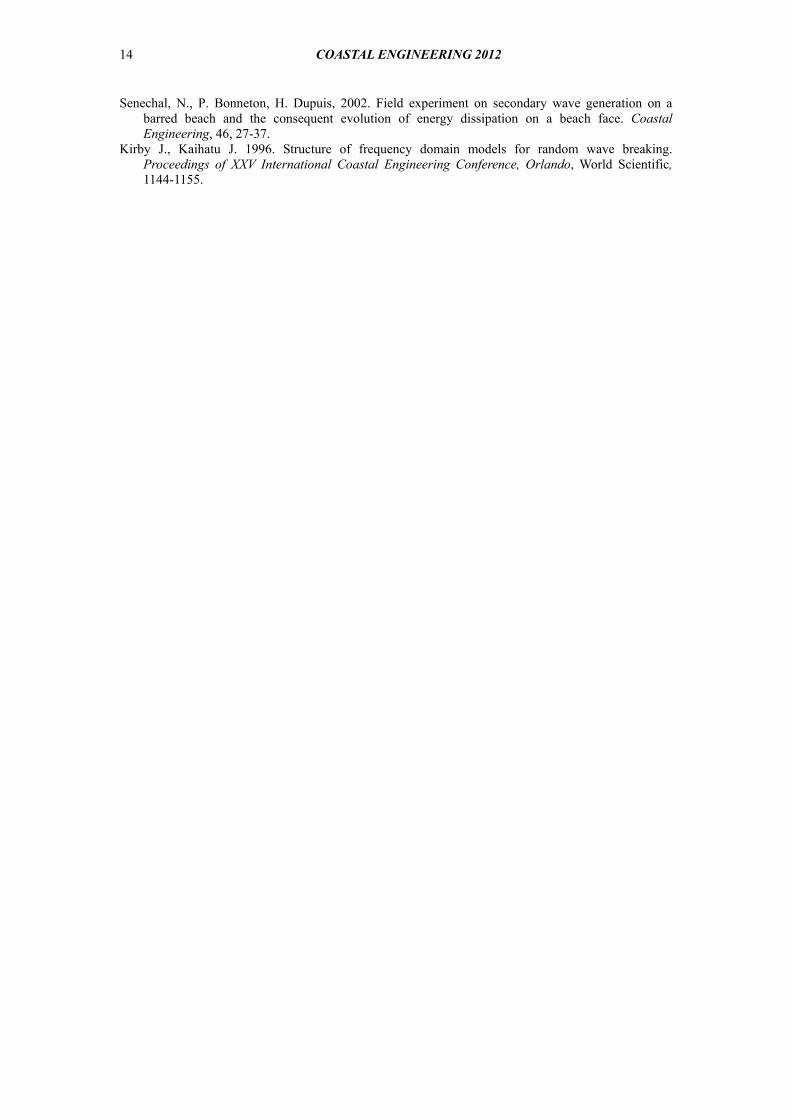
Certainly, the energy dissipates faster in case of breaking waves. A floating breakwater behind the bars in case of non-breaking waves leads to the same waves attenuation as in case of breaking waves above the bars but without floating breakwater (Fig.18).
This demonstrates the advantage of suggested methods of wave attenuation, when the decreasing of wave height is achieved by two ways: wave decomposition into the primary and the secondary ones and further wave energy dissipation by its transformation into turbulent energy by use of floating breakwater. Figure 17. Amplitude wave spectra on last gauge without floating breakwater (dotted line) and with floating breakwater (solid line).
COASTAL ENGINEERING 2012 13
Figure 18. Comparison changing of potential energy of non-breaking waves without (solid line) and with floating breakwater (dashed line) and propagation of breaking waves over two bars without floating breakwater ( dotted line).
CONCLUSIONS
As result of investigation was revealed that the formation of secondary waves is essential part of transformation of weakly nonlinear dispersive waves in coastal zone. The basic mechanism of formation of secondary waves is nonlinear-dispersive and is determined by a periodic exchange of energy between the first and second harmonics. It has two stages of secondary wave formation: nonlinear increasing of the second harmonic and its dispersive lags against the first harmonics due to dispersion. The amplitude of secondary waves is defined by amplitude of second harmonic. More visible secondary waves are formed during of “weakness” of nonlinearity and “forcing” of dispersion, this process is periodical due to near-resonant interactions. The formation of secondary waves depends on a stage of wave transformation defined by length of wave run.
Performed experimental research has testified possibility in principle of combination of underwater structures with floating breakwater for shore protection from wave impact using secondary waves. Preliminary modelling has shown that a) optimal bar length is a half of initial wavelength and optimal distance between the bars is a wavelength, found by the spectral maximum frequency in top of bar; b) the backward slope of a bar should be abrupt for generation of the most intensive secondary waves.
But many of the process characteristics are still unclarified and require further investigation.
ACKNOWLEDGEMENTS This work was supported THESEUS project – “Innovative coastal technologies for safer European
coasts in a changing climate”, EU grant agreement 244104 and Russian Foundation of Basic Research, grant 11-05-01098-а. REFERENCES Beji, S., and Battjes J. A., 1993. Experimental investigation of wave propagation over a bar. Coastal
Engineering, 19, 151-162. Eldeberky, Y. and Battjes J.A., 1996. Spectral modeling of wave breaking: application to Boussinesq
equations. Journal of Geophysical Research, 101(C1), 1253-1264. Madsen, P. A. and Sørensen O. R., 1993. Bound Waves and Triad Interactions in Shallow Water.
Journal of Ocean Engineering, 20(4), 359-388. Masselink, G., 1998. Field investigation of wave propagation over a bar and the consequent generation
of secondary waves, Coastal Engineering, 33, 1-9.
14 COASTAL ENGINEERING 2012
Senechal, N., P. Bonneton, H. Dupuis, 2002. Field experiment on secondary wave generation on a barred beach and the consequent evolution of energy dissipation on a beach face. Coastal Engineering, 46, 27-37.
Kirby J., Kaihatu J. 1996. Structure of frequency domain models for random wave breaking. Proceedings of XXV International Coastal Engineering Conference, Orlando, World Scientific, 1144-1155.


![4.1.1] plane waves](https://static.fdokumen.com/doc/165x107/6322513728c445989105b845/411-plane-waves.jpg)


