Análise filogenética de Questidae e Clitellata: o problema da parafilia de "Polychaeta
SECONDARY PRODUCTION OF CAPITELLA SP. 99
Secondary production of Capitella sp. (Polychaeta: Capitellidae) inhabiting
different organically enriched environments*
DANIEL MARTIN1,2 and ANTOINE GRÉMARE2
1Present address: Centre d’Estudis Avançats de Blanes, CSIC, Camí de Santa Bàrbara, s/n., E-17300 Blanes, (Girona), Spain.2Laboratoire Arago, Observatoire Océanologique de Banyuls,
Université Pierre et Marie Curie (Paris VI), URA CNRS n°117, F-66650 Banyuls-sur-Mer, France.
SUMMARY: Three populations of Capitella sp. submitted to three different environmental conditions were monitoredduring one year in Alfacs Bay (Ebro Delta, NW Mediterranean) to estimate their respective contributions to the secon-dary production. Yearly secondary production of Capitella sp. at the three sites under study were 0.83 gDW. m-2. y-1 forthe disturbed sand site, 3.74 gDW. m-2. y-1 for the typical silt site, and 36.9 gDW. m-2. y-1 for the disturbed silt site. Thecorresponding P/B ratios were of 4.09 y-1, 3.66 y-1 and 5.71 y-1, respectively. At the two silty sites, Capitella sp. pre-sents: (1) a marked seasonal variability, and (2) high production rates and P/B ratios, which are two characteristics ofopportunists. At the disturbed sand site its seasonal pattern is much more stable, and its production much lower (alt-hough P/B ratios are still high). The “within site” seasonal differences found between the three populations probably didnot result from temporal changes in food quantity nor quality. Nevertheless, differences in protein concentrations maycontribute to explain differences in maximal densities and biomasses observed among sites. Our results confirm thatCapitella sp. shows a great plasticity relative to environment.
Key words: Density, biomass, secondary production, Capitella sp., Polychaeta, NW Mediterranean Sea.
RESUMEN: PRODUCCIÓN SECUNDARIA DE CAPITELLA SP. (POLYCHAETA, CAPITELLIDAE) EN HABITATS CON NIVELES DEENRIQUECIMIENTO ORGÁNICO DIFERENTES. – Tres poblaciones del poliqueto Capitella sp. (Capitellidae), sometidas a dife-rentes condiciones ambientales, se han monitorizado durante un año en la Bahía de Els Alfacs (Delta del Ebro,Mediterráneo noroccidental) con el fin de estimar sus resprectivas contribuciones a la producción secundaria del siste-ma. La producción secundaria anual de Capitella sp. en las tres localidades estudiadas fue: 0.83 g Peso Seco m-2 año-1
en la zona de arenas perturvadas, 3.74 g Peso Seco m-2 año-1 en la zona de fangos típicos, y 36.9 g Peso Seco m-2 año-1
en la zona de fangos perturbados. Los cocientes P/B correspondientes fueron: 4.09 año-1, 3.66 año-1, y 5.71 año-1 res-pectivamente. En las dos localidades fangosas, Capitella sp. presenta: (1) una marcada variabilidad estacional, y (2) ele-vadas tasas de producción y cocientes P/B, ambas características propias de especies oportunistas. En la localidad dearenas perturbadas, el patrón estacional es mucho más estable y la producción mucho menor, si bien el cociente P/Bsigue siendo elevado. Los resultados obtenidos sugieren que, probablemente, las diferencias en el tiempo para cada loca-lidad no son el resultado de cambios temporales ni en la cantidad ni en la calidad del alimento disponible. Sin embar-go, diferencias en la concentración de proteínas contribuyen a explicar las diferencias, tanto en biomasa como en den-sidades máximas, observadas entre localidades. Dichos resultados confirman la gran plasticidad de Capitella sp. comorespuesta a las condiciones ambientales.
Palabras clave: Densidad, biomasa, producción secundaria, Capitella sp., Polychaeta, Mediterráneo noroccidental.
SCI. MAR., 61(2): 99-109 SCIENTIA MARINA 1997
*Received April 12, 1996. Accepted September 2, 1996.

INTRODUCTION
There is a general pattern of distribution of bent-hic macrofauna along organic and stress gradients(Pearson and Rosenberg, 1978). High density andlow biodiversity assemblages are usually associatedwith the most organically enriched and disturbedsediments (Pearson and Rosenberg, 1978). Benthicinvertebrates that typically inhabit those habitats aresmall, thread-like, short-lived, continuously repro-ducing surface deposit-feeders, which have been tra-ditionally defined as opportunists (Grassle andGrassle, 1974).
The polychaete Capitella capitata, whichactually consists of numerous sibling species(Grassle and Grassle, 1976), occurs in disturbed orpolluted areas throughout the world. Life-historiesof the members of this complex have been extensi-vely studied (Eckelbarger and Grassle, 1983,1987a, b; Holbrook and Grassle, 1984; Petraitis,1985a, b; Grassle et al., 1987; Marsh et al., 1990).Temporal and spatial distribution patterns ofCapitella sp. populations have been widely docu-mented as well, because these species are amongthe most important deposit-feeders in organicallypolluted environments (Rosenberg, 1972, 1976;Grassle and Grassle, 1974; Pearson and Rosenberg,1978; Tsutsumi, 1987, 1990). Population and indi-vidual responses to food availability have also beenwidely investigated under controlled laboratoryconditions. The effects of food quantity and qualityon individual growth have been assessed by Tenore(1977, 1981, 1983). The effects of ration and foodtype on reproduction have been considered byGrémare et al. (1988, 1989a), Qian and Chia (1991,1992), and Grémare (1994). The effect of foodquantity on the responses of experimental popula-tions has also been assessed by Chesney and Tenore(1985), by Marsh et al. 1989, and by Grémare et al.(1989b).
Curiously, secondary production of speciesbelonging to the Capitella sp. complex have beenlargely neglected, even though laboratory experi-ments revealed the high production potential ofsome of these sibling species (Chesney, 1985). Forexample, there have been only two attempts to esti-mate secondary production of field populations ofCapitella sp. (Oyenekan, 1983; Sprung, 1994). Thisis probably because opportunists have traditionallybeen considered as transient components of thecommunity, with their contribution to the energyflows being subsequently underrated (Chesney,1985).
The aim of the present study was thus to investi-gate the contribution to the secondary production ofseveral field populations of a species of theCapitella sp. complex submitted to different envi-ronmental conditions. The studied sites were locatedin Alfacs Bay, a semi-enclosed shallow water area ofthe north-western Mediterranean Sea. We will referto the studied species as Capitella sp. due to theabsence of specific analyses (electrophoresis or kar-yotypes) required to clarify its position within theCapitella complex.
STUDY AREA
Alfacs Bay is a semi-enclosed, shallow-waterarea located in the Ebro Delta (NE coast of theIberian Peninsula, NW Mediterranean). It is mainlycharacterized by a marine hydrographical regime,but is also influenced by fresh-water inputs occu-rring during spring and summer (Palacín et al.,1991). In the absence of strong winds, exchange bet-ween the bay and the open sea either follows a perio-dicity of ca 10 days or has a typical estuarine circu-lation with a volume exchange of 5-15 x 106 m-3
day-1 (Camp et al., 1991). Based on biogeochemicalparameters, Alfacs Bay has been divided into 3zones namely, “silt”, “central”, and “sand” (Palacínet al., 1991). Capitella sp. mainly inhabits the siltyzone but can also be found living in some areas ofthe sandy zone.
Populations of Capitella sp. were monitored attwo sites in the silty zone and one site in the sandyzone (Fig. 1). Some of the main characteristics ofthese three sites are presented in Table 1. Organiccontents and Redox potentials suggested that thetwo silty sites were subjected to different levels ofdisturbance. Thus, these stations are referred to as“typical silt” and “disturbed silt”. In the sandy zone,Capitella sp. populations were restricted to the hig-her level of the beach where macrophytobenthicdetritus often accumulates (Pérez, 1989; Duarte andSand-Jensen, 1990). Thus, this station will be refe-rred to as “disturbed sand”.
In Alfacs Bay, the organic inputs reaching theshallow coastal shelfs (0.6 m of average depth) weredue to phytoplankton, microphytobenthos, macro-phytes and terrestrial runoff (Camp et al., 1991).Neither phytoplankton nor microphytobenthos pro-duction showed an apparent seasonality, and yearlyaverage values at the shelfs of the Bay were 273 mgC m-2 day-1 and 96 mg C m-2 day-1, respectively(Delgado, 1987, 1989; Camp et al., 1991). Organic
100 D. MARTIN and A. GRÉMARE
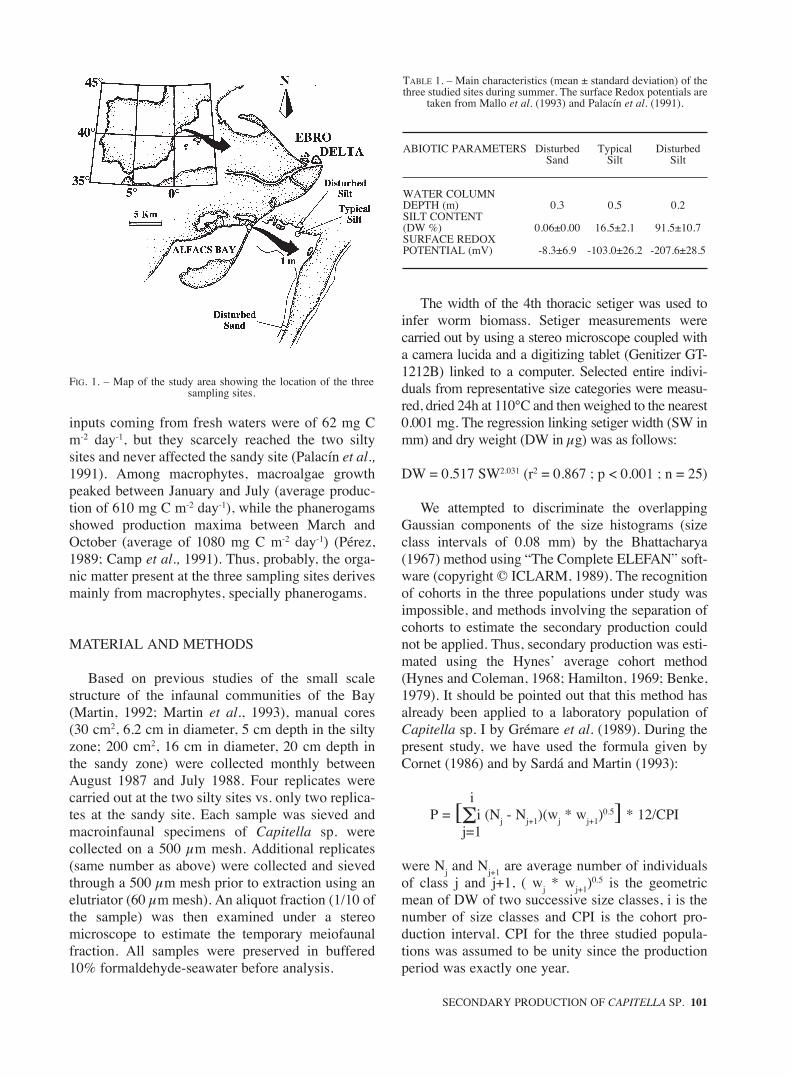
inputs coming from fresh waters were of 62 mg Cm-2 day-1, but they scarcely reached the two siltysites and never affected the sandy site (Palacín et al.,1991). Among macrophytes, macroalgae growthpeaked between January and July (average produc-tion of 610 mg C m-2 day-1), while the phanerogamsshowed production maxima between March andOctober (average of 1080 mg C m-2 day-1) (Pérez,1989; Camp et al., 1991). Thus, probably, the orga-nic matter present at the three sampling sites derivesmainly from macrophytes, specially phanerogams.
MATERIAL AND METHODS
Based on previous studies of the small scalestructure of the infaunal communities of the Bay(Martin, 1992; Martin et al., 1993), manual cores(30 cm2, 6.2 cm in diameter, 5 cm depth in the siltyzone; 200 cm2, 16 cm in diameter, 20 cm depth inthe sandy zone) were collected monthly betweenAugust 1987 and July 1988. Four replicates werecarried out at the two silty sites vs. only two replica-tes at the sandy site. Each sample was sieved andmacroinfaunal specimens of Capitella sp. werecollected on a 500 µm mesh. Additional replicates(same number as above) were collected and sievedthrough a 500 µm mesh prior to extraction using anelutriator (60 µm mesh). An aliquot fraction (1/10 ofthe sample) was then examined under a stereomicroscope to estimate the temporary meiofaunalfraction. All samples were preserved in buffered10% formaldehyde-seawater before analysis.
The width of the 4th thoracic setiger was used toinfer worm biomass. Setiger measurements werecarried out by using a stereo microscope coupled witha camera lucida and a digitizing tablet (Genitizer GT-1212B) linked to a computer. Selected entire indivi-duals from representative size categories were measu-red, dried 24h at 110°C and then weighed to the nearest0.001 mg. The regression linking setiger width (SW inmm) and dry weight (DW in µg) was as follows:
DW = 0.517 SW2.031 (r2 = 0.867 ; p < 0.001 ; n = 25)
We attempted to discriminate the overlappingGaussian components of the size histograms (sizeclass intervals of 0.08 mm) by the Bhattacharya(1967) method using “The Complete ELEFAN” soft-ware (copyright © ICLARM, 1989). The recognitionof cohorts in the three populations under study wasimpossible, and methods involving the separation ofcohorts to estimate the secondary production couldnot be applied. Thus, secondary production was esti-mated using the Hynes’ average cohort method(Hynes and Coleman, 1968; Hamilton, 1969; Benke,1979). It should be pointed out that this method hasalready been applied to a laboratory population ofCapitella sp. I by Grémare et al. (1989). During thepresent study, we have used the formula given byCornet (1986) and by Sardá and Martin (1993):
iP = [Σi (Nj - Nj+1)(wj * wj+1)
0.5] * 12/CPIj=1
were Nj and Nj+1 are average number of individualsof class j and j+1, ( wj * wj+1)
0.5 is the geometricmean of DW of two successive size classes, i is thenumber of size classes and CPI is the cohort pro-duction interval. CPI for the three studied popula-tions was assumed to be unity since the productionperiod was exactly one year.
SECONDARY PRODUCTION OF CAPITELLA SP. 101
TABLE 1. – Main characteristics (mean ± standard deviation) of thethree studied sites during summer. The surface Redox potentials are
taken from Mallo et al. (1993) and Palacín et al. (1991).
ABIOTIC PARAMETERS Disturbed Typical DisturbedSand Silt Silt
WATER COLUMNDEPTH (m) 0.3 0.5 0.2SILT CONTENT(DW %) 0.06±0.00 16.5±2.1 91.5±10.7SURFACE REDOXPOTENTIAL (mV) -8.3±6.9 -103.0±26.2 -207.6±28.5
FIG. 1. – Map of the study area showing the location of the threesampling sites.

Protein content of the sediment were estimatedon the basis of the organic matter content of the sedi-ment (as differences between 105°C, 24 h dried and450°C, 1 h burned sediment), by means of themonthly protein-organic matter ratios provided byMallo et al. (1993).
Statistical analyses were performed on log-trans-formed data using the SYSTAT software (copyright(c) SYSTAT Inc., 1990). Two-way ANOVAs wereused to assess the effect of sites and sampling dateson the monitored parameters. Student-Newmann-Keuls multiple comparisons test was used to assessdifferences between groups.
RESULTS
Protein content of sediments
Changes in protein content of the sediment (%based on DW) at the three studied sites are presen-ted in Fig. 2. A two-way ANOVA showed that pro-tein content were: (1) significantly affected by site(p=0.001), and (2) not significantly affected by sam-pling date (p=0.123). There was no significant inte-raction between these two factors (p=0.855). At thedisturbed silt site, protein content ranged from 6.19(July) to 14.80% (February). At the typical silt site,protein content ranged from 1.02 (April) to 2.89%(September). At the disturbed sand site, protein con-tent ranged from 0.07 (April) to 0.38% (February).Thus, the spatial variability of protein content con-firmed the marked environmental differences of thethree sites under study.
Size structure
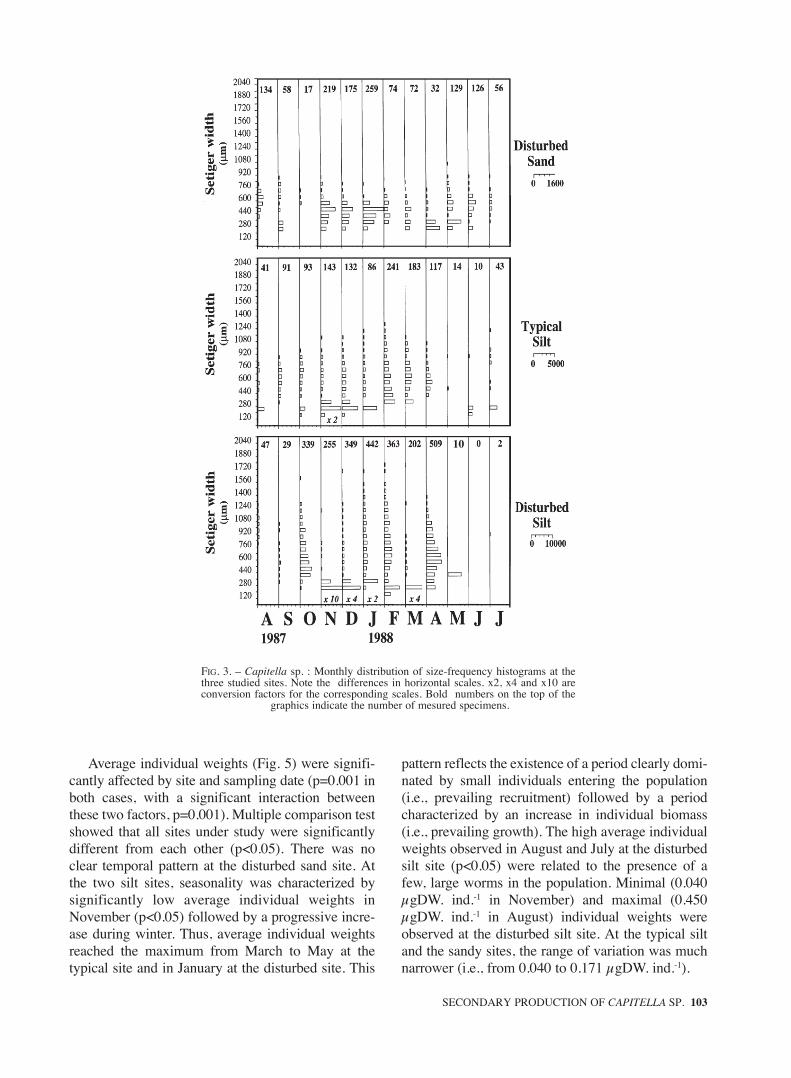
Temporal changes in the structure of the studiedpopulations are presented in Fig. 3. Both small andlarge worms were found simultaneously in mostsamples. Thus, at the three studied sites, Capitellasp. showed a polymodal distribution throughoutmost of the year. Such a distribution is characteristicof species with several reproductive periods (or con-tinuous reproduction) per year. Moreover, it shouldbe pointed out that small worms seemed to constitu-te the most important component of the populations.Over the winter months (November to February), anage class of smallest individuals (i.e., probablyrecruits) was present in all three studied sites wit-hout a regular advancement in size each month.
Biomass and abundance
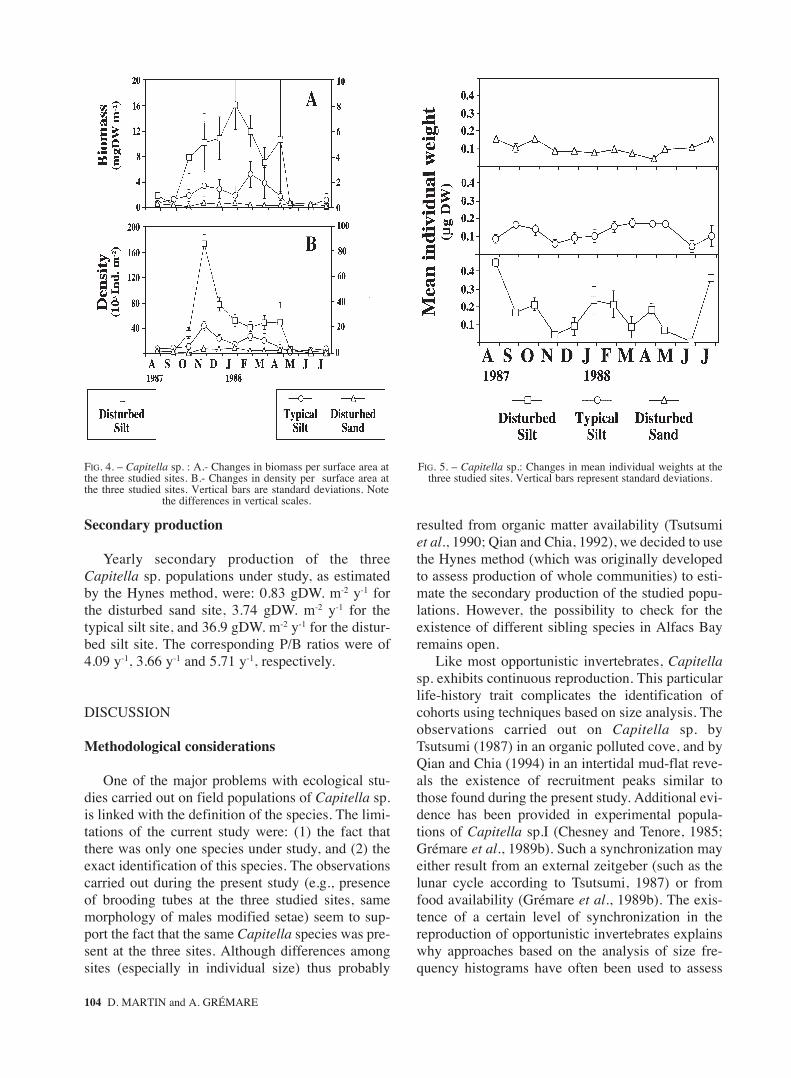
At the disturbed silt site, biomass of Capitella sp.per unit of surface area ranged from 0 (June) to16.069 gDW. m-2 (January) (Fig. 4A). At the typicalsilt site, biomass ranged from 0.109 (May) to 2.593gDW. m-2 (February). At the disturbed sand site, bio-masses ranged from 0.033 (October) to 0.346 gDW.m-2 (January). Biomass of Capitella sp. was signifi-cantly affected by site and sampling date (p=0.001in both cases; with a significant interaction betweenthese two factors, p=0.001). Multiple comparisontests showed that biomass did not significantly differamong sites during the warmest period (i.e., Augustto October and March to July) (p>0.05). On the con-trary, during the coldest period (i.e., November toFebruary), biomass was always highest at the distur-bed silt site, intermediary at the typical silt site andlowest at the disturbed sand site (p<0.05).
At the disturbed silt site, densities of Capitellasp. ranged from 0 (June) to 172450 ind. m-2
(November) (Fig. 4B). At the typical silt site, den-sities ranged from 583 (May) to 21325 ind. m-2
(November). At the disturbed sand site, densitiesranged from 213 (October) to 4238 ind. m-2
(January). Densities of Capitella sp. were signifi-cantly affected by site and sampling date (p=0.001in both cases; with a significant interaction betwe-en these two factors, p=0.001). Temporal changesin density were similar to those of biomass since:(1) densities were minimal during the warmestperiod, and (2) highest densities were usuallyobserved at the disturbed silt site. However, at thissite, there was a time lag of about three months bet-ween biomass and density maxima (November vs.January).
102 D. MARTIN and A. GRÉMARE
FIG. 2. – Changes in sediment protein contents at the three studied sites. Vertical bars represent standard deviations.
Average individual weights (Fig. 5) were signifi-cantly affected by site and sampling date (p=0.001 inboth cases, with a significant interaction betweenthese two factors, p=0.001). Multiple comparison testshowed that all sites under study were significantlydifferent from each other (p<0.05). There was noclear temporal pattern at the disturbed sand site. Atthe two silt sites, seasonality was characterized bysignificantly low average individual weights inNovember (p<0.05) followed by a progressive incre-ase during winter. Thus, average individual weightsreached the maximum from March to May at thetypical site and in January at the disturbed site. This
pattern reflects the existence of a period clearly domi-nated by small individuals entering the population(i.e., prevailing recruitment) followed by a periodcharacterized by an increase in individual biomass(i.e., prevailing growth). The high average individualweights observed in August and July at the disturbedsilt site (p<0.05) were related to the presence of afew, large worms in the population. Minimal (0.040µgDW. ind.-1 in November) and maximal (0.450µgDW. ind.-1 in August) individual weights wereobserved at the disturbed silt site. At the typical siltand the sandy sites, the range of variation was muchnarrower (i.e., from 0.040 to 0.171 µgDW. ind.-1).
SECONDARY PRODUCTION OF CAPITELLA SP. 103
FIG. 3. – Capitella sp. : Monthly distribution of size-frequency histograms at thethree studied sites. Note the differences in horizontal scales. x2, x4 and x10 areconversion factors for the corresponding scales. Bold numbers on the top of the
graphics indicate the number of mesured specimens.
10
Secondary production
Yearly secondary production of the threeCapitella sp. populations under study, as estimatedby the Hynes method, were: 0.83 gDW. m-2 y-1 forthe disturbed sand site, 3.74 gDW. m-2 y-1 for thetypical silt site, and 36.9 gDW. m-2 y-1 for the distur-bed silt site. The corresponding P/B ratios were of4.09 y-1, 3.66 y-1 and 5.71 y-1, respectively.
DISCUSSION
Methodological considerations
One of the major problems with ecological stu-dies carried out on field populations of Capitella sp.is linked with the definition of the species. The limi-tations of the current study were: (1) the fact thatthere was only one species under study, and (2) theexact identification of this species. The observationscarried out during the present study (e.g., presenceof brooding tubes at the three studied sites, samemorphology of males modified setae) seem to sup-port the fact that the same Capitella species was pre-sent at the three sites. Although differences amongsites (especially in individual size) thus probably
resulted from organic matter availability (Tsutsumiet al., 1990; Qian and Chia, 1992), we decided to usethe Hynes method (which was originally developedto assess production of whole communities) to esti-mate the secondary production of the studied popu-lations. However, the possibility to check for theexistence of different sibling species in Alfacs Bayremains open.
Like most opportunistic invertebrates, Capitellasp. exhibits continuous reproduction. This particularlife-history trait complicates the identification ofcohorts using techniques based on size analysis. Theobservations carried out on Capitella sp. byTsutsumi (1987) in an organic polluted cove, and byQian and Chia (1994) in an intertidal mud-flat reve-als the existence of recruitment peaks similar tothose found during the present study. Additional evi-dence has been provided in experimental popula-tions of Capitella sp.I (Chesney and Tenore, 1985;Grémare et al., 1989b). Such a synchronization mayeither result from an external zeitgeber (such as thelunar cycle according to Tsutsumi, 1987) or fromfood availability (Grémare et al., 1989b). The exis-tence of a certain level of synchronization in thereproduction of opportunistic invertebrates explainswhy approaches based on the analysis of size fre-quency histograms have often been used to assess
104 D. MARTIN and A. GRÉMARE
FIG. 5. – Capitella sp.: Changes in mean individual weights at the three studied sites. Vertical bars represent standard deviations.
FIG. 4. – Capitella sp. : A.- Changes in biomass per surface area atthe three studied sites. B.- Changes in density per surface area atthe three studied sites. Vertical bars are standard deviations. Note
the differences in vertical scales.
the dynamics of such populations (Warren, 1976;Carrasco and Arcos, 1980; Oyenekan, 1983;Tsutsumi, 1987; Sardá and Martin, 1993).Nevertheless, during the present study, such appa-rent synchronization was not sufficient to allow forthe identification and the study of cohorts of theCapitella sp. populations in Alfacs Bay. This findingled us to use a method not based on cohort recogni-tion (i.e., the Hynes method) to estimate secondaryproduction.
Another characteristic of opportunistic inverte-brates is their ability to show high growth rates(Tenore, 1983; Tenore and Chesney, 1985; Marshand Tenore, 1990). This particular trait may be ofimportance when determining sampling periodicity,since this parameter has a direct effect on the confi-dence interval of production estimates (Morin et al.,1987). During the present study, samples were takenmonthly. The same periodicity has already been usedby Warren (1976), Tsutsumi and Kikuchi (1984) andby Qian and Chia (1994) to assess dynamics of fieldpopulations of Capitella sp. It is superior to theperiodicity (bimonthly sampling) used by eitherOyenekan (1983) or Sprung (1994) to determine theonly available production estimates of field popula-tions of Capitella sp. before the present study. Theexisting literature concerning the generation time ofCapitella sp. mention values ranging from 1.5(Tsutsumi, 1987, from 12.9 to 24.9°C) to 3.5 months(Qian and Chia, 1994, <16°C) depending on tempe-rature. At the three sites, worm biomass was maxi-mal between October and April. Field temperaturesduring this period are always less than 20°C (Sardáand Martin, 1993). Moreover, species of theCapitella complex are generally polytelic, whichimplies that their life spans are longer than only onegeneration time. We thus assume that the samplinginterval used during the present study is (1) muchshorter than the duration of one life cycle ofCapitella sp. in Alfacs Bay, and (2) longer enough toassume that most individuals grew from a given sizeclass to the immediately superior from month tomonth.
Availability of organic matter
Opportunistic species such as Capitella sp., havebeen often associated with areas enriched in organicmatter (Grassle and Grassle, 1974; Pearson andRosenberg, 1978). The effect of food availability onthe population dynamics of benthic deposit-feedersmay be either related with quantity or quality ofavailable food (Phillips, 1984; Grémare et al., 1988;
Marsh and Tenore, 1990; Grémare, 1994). In AlfacsBay, sediment protein concentrations significantlydiffered among sites, but did not vary seasonallywithin sites. Thus, at each site, the seasonal patternof Capitella sp. biomass probably did not resultfrom a food quantity effect. At the studied sites,organic matter mainly derives from decaying vege-tation. About 80% of the average mg of carbon pro-duced per m-2 per day comes from macrophytes. Thedegradation of this type of material is rather long(Buchbaum et al., 1991), with 65% of the initial bio-mass still remaining after 100 days in Alfacs Bay(Pérez, 1989). The maximum amount of dead leaves(30 g C m-2) decomposing at a rate of 0.1 g C m-2
day-1 occurs in autumn (Pérez, 1989). Phytoplanktondynamics in the Bay typically lack marked seasona-lity, and maximum production tends to occur nearthe openings of the outlet channels from wherecurrents usually run out of the shelfs (and even outof the Bay) (Delgado, 1987, 1989; Camp et al.,1991). Thus, an effect of food quality on biomassseasonal pattern (i.e., due to the sedimentation ofphytoplanktonic blooms such as in Marsh andTenore, 1990) is also unlikely to occur. However, thecoincidence of maximum accumulation rates ofdecaying vegetation starting at the beginning ofautumn (Pérez, 1989) and the increasing total bio-mass linked to very low mean individual weights(i.e., peak of small worms entering the populations)in November could be interpreted tentatively as theorigin of the apparent synchronization observed inAlfacs Bay.
Nevertheless, differences in protein concentra-tion among sites may contribute to explain theobserved pattern in maximal biomass. Food availa-bility controls Capitella sp. population biomass inlaboratory cultures (Tenore and Chesney, 1985;Grémare et al., 1988, 1989a; Qian and Chia, 1992).In optimal conditions, Capitella sp. grows fasterand produces more offspring because its generationtime is shorter and its fecundity is higher (Grémareet al., 1988; Qian and Chia, 1992). During the pre-sent study, the highest biomass occurred at the dis-turbed silt site which also had the highest sedimentprotein content. This was probably due to differen-ces in food availability. Moreover, Capitella sp. canmaintain its populations by producing a few offs-pring of good quality when confronted with limitedfood resources (Qian and Chia, 1993). Thus, thelower (but less fluctuating) biomass featured byCapitella sp. at the disturbed sand site could berelated to limited food supply (protein contentsalways lower than 1%).
SECONDARY PRODUCTION OF CAPITELLA SP. 105
106 D. MARTIN and A. GRÉMARE
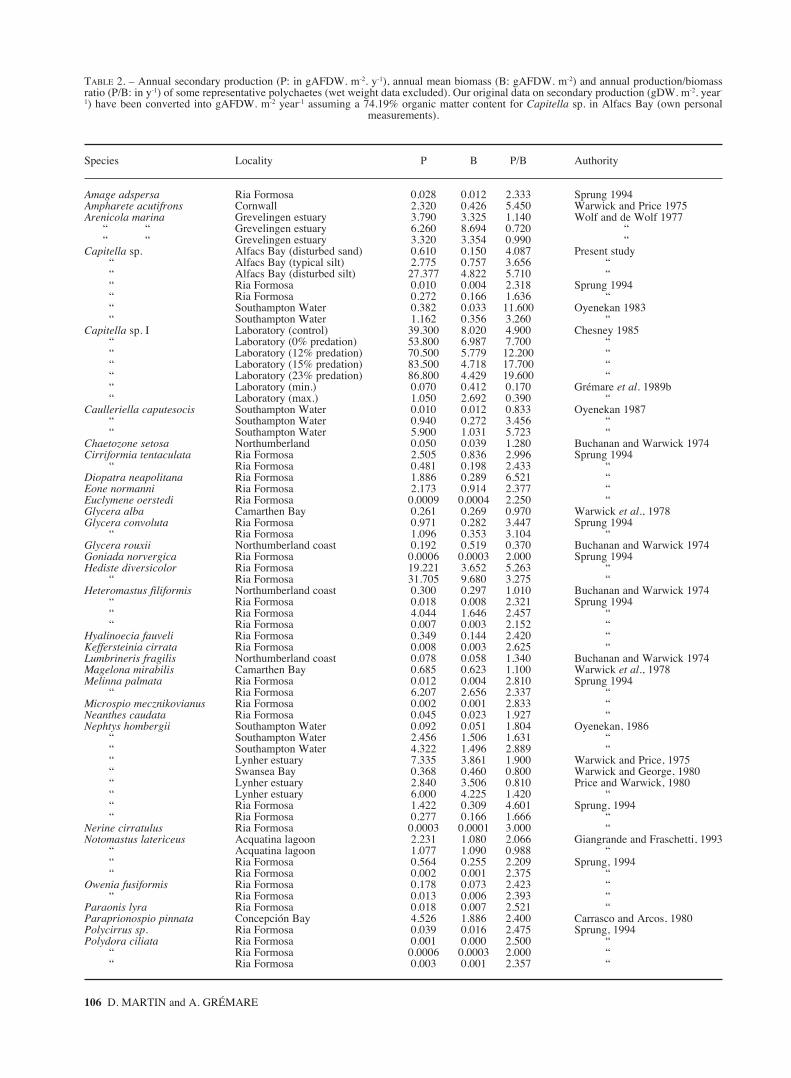
TABLE 2. – Annual secondary production (P: in gAFDW. m-2. y-1), annual mean biomass (B: gAFDW. m-2) and annual production/biomassratio (P/B: in y-1) of some representative polychaetes (wet weight data excluded). Our original data on secondary production (gDW. m-2. year-
1) have been converted into gAFDW. m-2 year-1 assuming a 74.19% organic matter content for Capitella sp. in Alfacs Bay (own personal measurements).
Species Locality P B P/B Authority
Amage adspersa Ria Formosa 0.028 0.012 2.333 Sprung 1994Ampharete acutifrons Cornwall 2.320 0.426 5.450 Warwick and Price 1975Arenicola marina Grevelingen estuary 3.790 3.325 1.140 Wolf and de Wolf 1977
“ “ Grevelingen estuary 6.260 8.694 0.720 ““ “ Grevelingen estuary 3.320 3.354 0.990 “
Capitella sp. Alfacs Bay (disturbed sand) 0.610 0.150 4.087 Present study“ Alfacs Bay (typical silt) 2.775 0.757 3.656 ““ Alfacs Bay (disturbed silt) 27.377 4.822 5.710 ““ Ria Formosa 0.010 0.004 2.318 Sprung 1994“ Ria Formosa 0.272 0.166 1.636 ““ Southampton Water 0.382 0.033 11.600 Oyenekan 1983“ Southampton Water 1.162 0.356 3.260 “
Capitella sp. I Laboratory (control) 39.300 8.020 4.900 Chesney 1985“ Laboratory (0% predation) 53.800 6.987 7.700 ““ Laboratory (12% predation) 70.500 5.779 12.200 ““ Laboratory (15% predation) 83.500 4.718 17.700 ““ Laboratory (23% predation) 86.800 4.429 19.600 ““ Laboratory (min.) 0.070 0.412 0.170 Grémare et al. 1989b“ Laboratory (max.) 1.050 2.692 0.390 “
Caulleriella caputesocis Southampton Water 0.010 0.012 0.833 Oyenekan 1987“ Southampton Water 0.940 0.272 3.456 ““ Southampton Water 5.900 1.031 5.723 “
Chaetozone setosa Northumberland 0.050 0.039 1.280 Buchanan and Warwick 1974Cirriformia tentaculata Ria Formosa 2.505 0.836 2.996 Sprung 1994
“ Ria Formosa 0.481 0.198 2.433 “Diopatra neapolitana Ria Formosa 1.886 0.289 6.521 “Eone normanni Ria Formosa 2.173 0.914 2.377 “Euclymene oerstedi Ria Formosa 0.0009 0.0004 2.250 “Glycera alba Camarthen Bay 0.261 0.269 0.970 Warwick et al., 1978Glycera convoluta Ria Formosa 0.971 0.282 3.447 Sprung 1994
“ Ria Formosa 1.096 0.353 3.104 “Glycera rouxii Northumberland coast 0.192 0.519 0.370 Buchanan and Warwick 1974Goniada norvergica Ria Formosa 0.0006 0.0003 2.000 Sprung 1994Hediste diversicolor Ria Formosa 19.221 3.652 5.263 “
“ Ria Formosa 31.705 9.680 3.275 “Heteromastus filiformis Northumberland coast 0.300 0.297 1.010 Buchanan and Warwick 1974
“ Ria Formosa 0.018 0.008 2.321 Sprung 1994“ Ria Formosa 4.044 1.646 2.457 ““ Ria Formosa 0.007 0.003 2.152 “
Hyalinoecia fauveli Ria Formosa 0.349 0.144 2.420 “Keffersteinia cirrata Ria Formosa 0.008 0.003 2.625 “Lumbrineris fragilis Northumberland coast 0.078 0.058 1.340 Buchanan and Warwick 1974Magelona mirabilis Camarthen Bay 0.685 0.623 1.100 Warwick et al., 1978Melinna palmata Ria Formosa 0.012 0.004 2.810 Sprung 1994
“ Ria Formosa 6.207 2.656 2.337 “Microspio mecznikovianus Ria Formosa 0.002 0.001 2.833 “Neanthes caudata Ria Formosa 0.045 0.023 1.927 “Nephtys hombergii Southampton Water 0.092 0.051 1.804 Oyenekan, 1986
“ Southampton Water 2.456 1.506 1.631 ““ Southampton Water 4.322 1.496 2.889 ““ Lynher estuary 7.335 3.861 1.900 Warwick and Price, 1975“ Swansea Bay 0.368 0.460 0.800 Warwick and George, 1980“ Lynher estuary 2.840 3.506 0.810 Price and Warwick, 1980“ Lynher estuary 6.000 4.225 1.420 ““ Ria Formosa 1.422 0.309 4.601 Sprung, 1994“ Ria Formosa 0.277 0.166 1.666 “
Nerine cirratulus Ria Formosa 0.0003 0.0001 3.000 “Notomastus latericeus Acquatina lagoon 2.231 1.080 2.066 Giangrande and Fraschetti, 1993
“ Acquatina lagoon 1.077 1.090 0.988 ““ Ria Formosa 0.564 0.255 2.209 Sprung, 1994“ Ria Formosa 0.002 0.001 2.375 “
Owenia fusiformis Ria Formosa 0.178 0.073 2.423 ““ Ria Formosa 0.013 0.006 2.393 “
Paraonis lyra Ria Formosa 0.018 0.007 2.521 “Paraprionospio pinnata Concepción Bay 4.526 1.886 2.400 Carrasco and Arcos, 1980Polycirrus sp. Ria Formosa 0.039 0.016 2.475 Sprung, 1994Polydora ciliata Ria Formosa 0.001 0.000 2.500 “
“ Ria Formosa 0.0006 0.0003 2.000 ““ Ria Formosa 0.003 0.001 2.357 “
SECONDARY PRODUCTION OF CAPITELLA SP. 107
TABLE 2. – (Cont.)
Species Locality P B P/B Authority
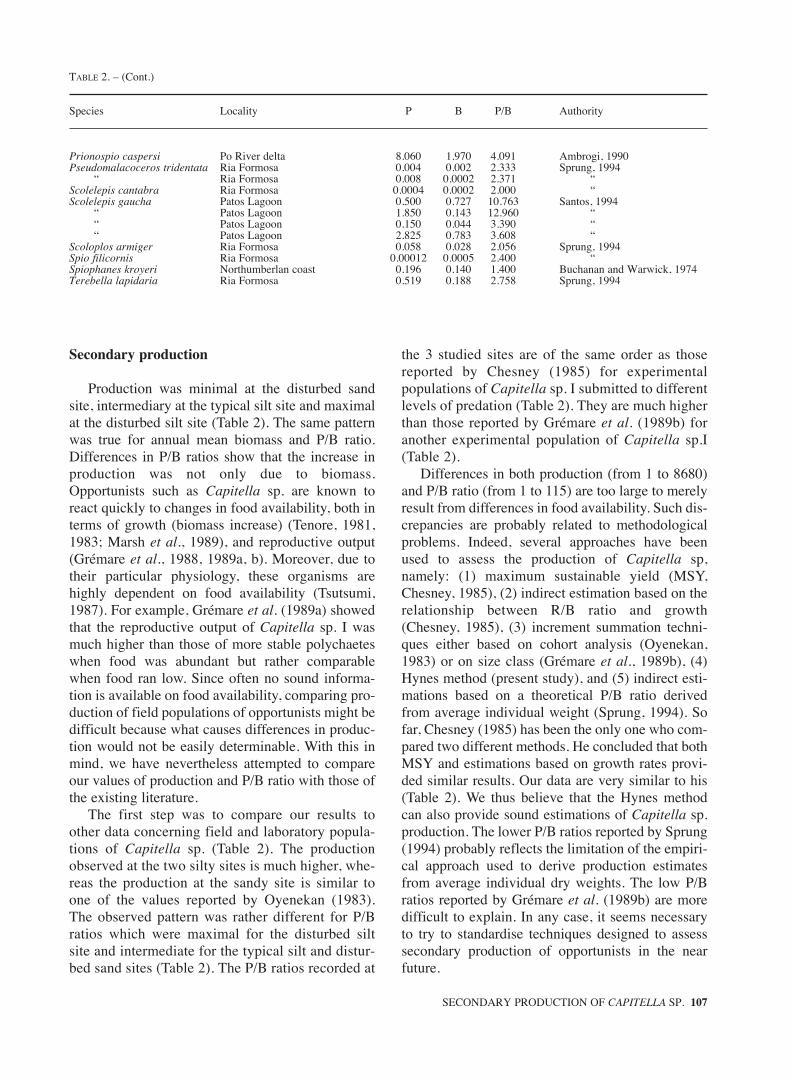
Prionospio caspersi Po River delta 8.060 1.970 4.091 Ambrogi, 1990Pseudomalacoceros tridentata Ria Formosa 0.004 0.002 2.333 Sprung, 1994
“ Ria Formosa 0.008 0.0002 2.371 “Scolelepis cantabra Ria Formosa 0.0004 0.0002 2.000 “Scolelepis gaucha Patos Lagoon 0.500 0.727 10.763 Santos, 1994
“ Patos Lagoon 1.850 0.143 12.960 ““ Patos Lagoon 0.150 0.044 3.390 ““ Patos Lagoon 2.825 0.783 3.608 “
Scoloplos armiger Ria Formosa 0.058 0.028 2.056 Sprung, 1994Spio filicornis Ria Formosa 0.00012 0.0005 2.400 “Spiophanes kroyeri Northumberlan coast 0.196 0.140 1.400 Buchanan and Warwick, 1974Terebella lapidaria Ria Formosa 0.519 0.188 2.758 Sprung, 1994
Secondary production
Production was minimal at the disturbed sandsite, intermediary at the typical silt site and maximalat the disturbed silt site (Table 2). The same patternwas true for annual mean biomass and P/B ratio.Differences in P/B ratios show that the increase inproduction was not only due to biomass.Opportunists such as Capitella sp. are known toreact quickly to changes in food availability, both interms of growth (biomass increase) (Tenore, 1981,1983; Marsh et al., 1989), and reproductive output(Grémare et al., 1988, 1989a, b). Moreover, due totheir particular physiology, these organisms arehighly dependent on food availability (Tsutsumi,1987). For example, Grémare et al. (1989a) showedthat the reproductive output of Capitella sp. I wasmuch higher than those of more stable polychaeteswhen food was abundant but rather comparablewhen food ran low. Since often no sound informa-tion is available on food availability, comparing pro-duction of field populations of opportunists might bedifficult because what causes differences in produc-tion would not be easily determinable. With this inmind, we have nevertheless attempted to compareour values of production and P/B ratio with those ofthe existing literature.
The first step was to compare our results toother data concerning field and laboratory popula-tions of Capitella sp. (Table 2). The productionobserved at the two silty sites is much higher, whe-reas the production at the sandy site is similar toone of the values reported by Oyenekan (1983).The observed pattern was rather different for P/Bratios which were maximal for the disturbed siltsite and intermediate for the typical silt and distur-bed sand sites (Table 2). The P/B ratios recorded at
the 3 studied sites are of the same order as thosereported by Chesney (1985) for experimentalpopulations of Capitella sp. I submitted to differentlevels of predation (Table 2). They are much higherthan those reported by Grémare et al. (1989b) foranother experimental population of Capitella sp.I(Table 2).
Differences in both production (from 1 to 8680)and P/B ratio (from 1 to 115) are too large to merelyresult from differences in food availability. Such dis-crepancies are probably related to methodologicalproblems. Indeed, several approaches have beenused to assess the production of Capitella sp,namely: (1) maximum sustainable yield (MSY,Chesney, 1985), (2) indirect estimation based on therelationship between R/B ratio and growth(Chesney, 1985), (3) increment summation techni-ques either based on cohort analysis (Oyenekan,1983) or on size class (Grémare et al., 1989b), (4)Hynes method (present study), and (5) indirect esti-mations based on a theoretical P/B ratio derivedfrom average individual weight (Sprung, 1994). Sofar, Chesney (1985) has been the only one who com-pared two different methods. He concluded that bothMSY and estimations based on growth rates provi-ded similar results. Our data are very similar to his(Table 2). We thus believe that the Hynes methodcan also provide sound estimations of Capitella sp.production. The lower P/B ratios reported by Sprung(1994) probably reflects the limitation of the empiri-cal approach used to derive production estimatesfrom average individual dry weights. The low P/Bratios reported by Grémare et al. (1989b) are moredifficult to explain. In any case, it seems necessaryto try to standardise techniques designed to assesssecondary production of opportunists in the nearfuture.
The second step was to compare our results withavailable data concerning other polychaetes (Table2). Except for that of Hediste diversicolor (Sprung,1994), the production recorded at the disturbed siltsite is the highest recorded for polychaetes in natu-ral conditions (Table 2). At the typical silt and dis-turbed sand sites, the recorded productions are inclu-ded in the range reported for other polychaete popu-lations. The P/B ratios at the three sites are amongthe highest values recorded for polychaetes. Onlythe P/B ratios of Scolelepis gaucha (Santos, 1994),Diopatra neapolitana (Sprung, 1994) andCaulleriella caputesocis (Oyenekan, 1987) are hig-her than that of Capitella sp. at the disturbed silt site(Table 2). It is not surprising to obtain high P/Bratios for opportunists since these organisms featurevery high growth rates and reproductive outputswhen food is abundant (Grémare et al., 1988, 1989a;Marsh et al., 1990).
In summary, at the two silty sites, Capitella sp.presents: (1) a marked seasonal variability, and (2)high production rates and P/B ratios, which are twocharacteristics of opportunists. At the disturbed sandsite, however, its seasonal pattern is much more sta-ble, and its production much lower (although P/Bratios are still high). Thus, as postulated by Qian andChia (1994), our results confirm that Capitella sp.shows a great plasticity relative to environment.
ACKNOWLEDGEMENTS
We would like to thank M.D. Rosell, M.Maldonado, E. Ballesteros, M.J. Uriz, and M. Bhaudfor supporting our explanations on Capitella’s life,subsequently giving meaningful comments. C.Palacín and M. Becerro helped with field work andstatistics, respectively. K. Foreman wrote the digiti-zing program and V.M. Hernández adapted it to theGenitizer tablet. We are indebted to J.M. Gili and R.Sardá, co-directors of the Ph.D. thesis of D. Martin.D.J. Byrne corrected the English. This work waspartly supported by CICYT grants (AC 16/84,MAR91-0503, and AMB94-0746). D. Martin wassupported by a fellowship from the MEC of Spain(ref. number fr93-46037786) and a research contractfrom the CSIC of Spain.
REFERENCES
Ambrogi, R. – 1990. Secondary production of Prionospio caspersi(Annelida: Polychaeta: Spionidae). Mar. Biol., 104: 437-442.
Benke, A.C. – 1979. A modification of the Hynes method for esti-
mating secondary production with particular significance formultivoltine populations. Limnol. Oceanogr., 24: 168-171.
Bhattacharya, C.G. – 1967. A simple method of resolution of a dis-tribution into Gaussian components. Biometrics, 23: 115-135.
Buchanan, J.B. and R.M. Warwick. – 1974. An estimate of benthicmacrofaunal production in the offshore mud of theNorthumberland coast. J. Mar. Biol. Ass. U.K., 54: 197-222.
Buchsbaum, R., I. Valiela, T. Swan, M. Dzierzeski and S. Allen. –1991. Available and refractory nitrogen in detritus of coastalvascular plants and macroalgae. Mar. Ecol. Prog. Ser., 72: 131-143.
Camp, J., J. Romero, M. Pérez, M. Vidal, M. Delgado and A.Martínez. – 1991. Production-consumption budget in an estua-rine bay: How anoxia is prevented in a forced system. Oecol.Aquat., 10: 145-152.
Carrasco, F.V. and D.R. Arcos. – 1980. Estimación de la produc-ción secundaria de Paraprionospio pinnata (Spionidae:Polychaeta) frente a Bahía de Concepción, Chile. Bolm. Inst.Oceanogr., Sao Paulo, 29: 79-82.
Chesney Jr., E.J. – 1985. Laboratory studies of the effect of preda-tion on production and the production: biomass ratio of theopportunistic polychaete Capitella capitata (Type I). Mar.Biol., 87: 307-312.
Chesney Jr., E.J. and K.R. Tenore. – 1985. Oscillations of labora-tory populations of the polychaete Capitella capitata (Type I):their cause and implications for natural populations. Mar. Ecol.Prog. Ser., 20: 289-296.
Cornet, M. – 1986. Estimation de la production annuelle des popu-lations d’Abra alba (Mollusque Bivalve) du plateau continentalSud-Gascogne. Oceanol. Acta, 9: 323-332.
Delgado, M. – 1987 Fitoplancton de las bahías del Delta del Ebro.Inv. Pesqueras, 51: 517-548.
Delgado, M. – 1989. Abundance and distribution of microphyto-benthos in the Bays of Ebro Delta (Spain). Est. Coast. ShelfSci., 29: 183-194.
Duarte, C.M. and K. Sand-Jensen. – 1990. Seagrass colonization:patch function and patch growth in Cymodocea nodosa. Mar.Ecol. Prog. Ser., 65: 193-200.
Eckelbarger, K.J. and J.P. Grassle. – 1983. Ultrastructural diferen-ces in the eggs and ovarian follicle cells of Capitella(Polychaeta) sibling species. Biol. Bull. mar. biol. Lab., WoodsHole, 165: 379-393.
Eckelbarger, K.J. and J.P. Grassle. – 1987a. Interspecific variationin genital spine, sperm, larval morphology in six sibling speciesof Capitella. Bull. Biol. Soc. Wash., 7: 62-76.
Eckelbarger, K.J. and J.P. Grassle. – 1987a. Spermatogenesis,sperm storage and comparative sperm morphology in nine spe-cies of Capitella, Capitomastus and Capitellides (Polychaeta:Capitellidae). Mar. Biol., 95: 415-429.
Giangrande, A. and S. Fraschetti. – 1993. Life cycle, growth andsecondary production in a brackish-water population of thepolychaete Notomastus latericius (Capitellidae) in theMediterranean Sea. P.S.Z.N. I: Mar. Ecol., 14: 313-327.
Grassle, J.F. and J.P. Grassle. – 1974. Opportunistic life historiesand genetic systems in marine benthic polychaetes. J. Mar.Res., 32: 253-284.
Grassle, J.P., C.E. Gelfman and S.W. Mills. – 1987. Karyotypes ofCapitella sibling species and of several species in the relatedgenera Capitellides and Capitomastus (Polychaeta). Bull. Biol.Soc. Wash., 7: 77-88.
Grassle, J.P. and J.F. Grassle. – 1976. Sibling species in the marinepollution indicator Capitella (Polychaeta). Science, 192: 567-569.
Grémare, A. – 1994. What describes fecundity of Capitella sp.I bet-ter: macro- or micronutrient availability? Mar. Biol., 119: 367-374.
Grémare, A., A.G. Marsh and K.R. Tenore. – 1988. Short-termreproductive responses of Capitella sp.I (Annelida: Polychaeta)fed on different diets. J. Exp. Mar. Biol. Ecol., 123: 147-162.
Grémare, A., A.G. Marsh and K.R. Tenore. – 1989a. Fecundity andenergy partitioning in Capitella capitata type I (Annelida:Polychaeta). Mar. Biol., 100: 365-371.
Grémare, A., A.G. Marsh and K.R. Tenore. – 1989b. Secondaryproduction and reproduction of Capitella capitata type I(Annelida: Polychaeta) during a population cycle. Mar. Ecol.Prog. Ser., 51: 99-105.
Hamilton, A.L. – 1969. On estimating annual production. Limnol.Oceanogr., 14: 771-782.
Holbrook, M.J.L. and J.P. Grassle. – 1984. The effects of low den-sity on the development of simultaneous hermaphroditism in
108 D. MARTIN and A. GRÉMARE
SECONDARY PRODUCTION OF CAPITELLA SP. 109
male Capitella sp.I (Polychaeta). Biol. Bull. mar. biol. Lab.,Woods Hole, 166: 103-109.
Hynes, H.B.N. and M.J. Coleman. – 1968. A simple method forassessing the annual production of stream benthos. Limnol.Oceanogr., 13: 569-573.
Mallo, S., F. Vallespinós, S. Ferrer and D. Vaqué. – 1993. Microbialactivities in estuarine sediments (Ebro Delta, Spain) influencedby organic matter influx. Sci. Mar., 57: 31.
Marsh, A.G., A. Grémare and K.R. Tenore. – 1989. Food type andfood ration effects on growth of juvenile of Capitella sp.I(Annelida: Polychaeta): Macro- vs. micr-nutrients. Mar. Biol.,102: 519-527.
Marsh, A.G., H.R. Harvey, A. Grémare and K.R. Tenore. – 1990.Dietary effect on oocyte yolk-composition in Capitella sp.I(Annelida: Polychaeta): fatty acids and sterols. Mar. Biol., 106:369-374.
Marsh, A.G. and K.R. Tenore. – 1990. The role of nutrition in regu-lating the population dynamics of opportunistic, surface depositfeeders in a mesohaline community. Limnol. Oceanogr., 35:710-724.
Martin, D. – 1992 Macroinfauna de una bahía Mediterránea.Estudio de los niveles de organización de las poblaciones deAnélidos Poliquetos. Col.lecció de Tesis Doctorals Microfitxa-des, 1662: 1-456.
Martin, D., E. Ballesteros, J.M. Gili and C. Palacín. – 1993. Small-scale structure of infaunal polychaete communities in an estua-rine environment: Methodological approach. Est. Coast. ShelfSci., 36: 47-58.
Morin, A., T. Mousseau and D. Roff. – 1987. Accuracy and preci-sion of secondary production estimates. Limnol. Oceanogr., 32:1342-1352.
Oyenekan, J.A. – 1983. Production and population dynamics ofCapitella capitata. Arch. Hydrobiol., 98: 115-126.
Oyenekan, J.A. – 1986. Population dynamics and secondary pro-duction in an estuarine population of Nephtys hombergii(Polychaeta: Nephtydae). Mar. Biol., 93: 217-223.
Oyenekan, J.A. – 1987. Population dynamics and secondary pro-duction in an estuarine population of Caulleriella caputesocis(Polychaeta: Cirratulidae). Mar. Biol., 95: 267-273.
Palacín, C., D. Martin and J.M. Gili. – 1991. Features of benthicinfauna in a Mediterranean shallow-water bay. Mar. Biol., 110:315-321.
Pearson, T.H. and R. Rosenberg. – 1978. Macrobenthic succesion inrelation to organic enrichment and polution in marine environ-ment. Oceanogr. Mar. Biol. Ann. Rev., 16: 229-311.
Pérez, M. – 1989. Fanerógamas marinas en sistemas estuáricos:Producción, factores limitantes y algunos aspectos del ciclo denutrientes. Doctoral Thesis, Universidad de Barcelona, 200 pp.
Petraitis, P.S. – 1985a. Females inhibits males propensity to deve-lop into simultaneous hermaphrodites in Capitella sp. I(Polychaeta). Biol. Bull. mar. biol. Lab., Woods Hole, 168: 395-402.
Petraitis, P.S. – 1985b. Digametic sex determination in the marinepolychaete Capitella capitata (species type I). Heredity, 55:151-156.
Phillips, N.W. – 1984. Role of different microbes and substrates aspotential suppliers of specific essential nutrients to marinedetritivores. Bull. Mar. Sci., 35: 283-298.
Price, R. and R.M. Warwick. – 1980. Temporal variations in annualproduction and biomass in estuarine populations of two poly-chaetes, Nephtys hombergii and Ampharete acutifrons. J. Mar.Biol. Ass. U.K., 60: 481-487.
Qian, P.Y. and F.S. Chia.- 1991. Fecundity and egg size ofCapitella sp. were mediated by diet. J. Exp. Mar. Biol. Ecol.,148: 11-25.
Qian, P.Y. and F.S. Chia. – 1992. Effects of diet type on the demo-graphics of Capitella sp. (Annelida: Polychaeta): lecithotrophicdevelopment vs. planktotrophic development. J. Exp. Mar.Biol. Ecol., 157: 159-179.
Qian, P.Y. and F.S. Chia. – 1993. Larval development as influencedby food limitation in two polychaetes: Capitella sp. andPolydora ligni Webster. J. Exp. Mar. Biol. Ecol., 166: 93-105.
Qian, P.Y. and F.S. Chia. – 1994. In situ measurement of recruit-ment, mortality, growth, and fecundity of Capitella sp.(Annelida: Polychaeta). Mar. Ecol. Prog. Ser., 111: 53-62.
Rosenberg, R. – 1972. Benthic faunal recovery in a Swedish fjordfollowing the closure of a sulphite pulp mill. Oikos, 23: 92-108.
Rosenberg, R. – 1976. Benthic faunal dynamics during successionfollowing pollution abatement in a Swedish estuary. Oikos, 27:414-427.
Santos P.J.P. – 1994. Population dynamics and production ofScolelepis gaucha (Polychaeta: Spionidae) on the sandy bea-ches of Southern Brazil. Mar. Ecol. Prog. Ser., 110: 159-165.
Sardá, R. and D. Martin. – 1993. Populations of Streblospio(Polychaeta, Spionidae) in temperate zones: demography andproduction. J. Mar. Biol. Ass. U.K., 73: 769-784.
Sprung, M. – 1994. Macrobenthic secondary production in the inter-tidal zone of the Ria Formosa - a lagoon in the SouthernPortugal. Est. Coast. Shelf Sci., 38: 539-558.
Tenore, K.R. – 1977. Growth of Capitella capitata cultured onvarious levels of detritus derived from different sources.Limnol. Oceanogr., 22: 936-941.
Tenore, K.R. – 1981. Organic Nitrogen and caloric content of detri-tus. I. Utilization by the deposit-feeding Polychaete, Capitellacapitata. Est. Coast. Shelf Sci., 12: 39-47.
Tenore, K.R. – 1983. Organic Nitrogen and caloric content of detri-tus. III. Effect on growth of a deposit-feeding polychae-te,Capitella capitata. Est. Coast. Shelf Sci., 17: 733-742.
Tenore, K.R. and E.J. Chesney Jr. – 1985. The effects of interactionof rate of food supply and population density on the bioenerge-tics of the opportunistic polychaete, Capitella capitata (type I).Limnol. Oceanogr., 30: 1188-1195.
Tsutsumi, H. – 1987. Population dinamics of Capitella capitata(Polychaeta: Capitellidae) in an organically polluted cove. Mar.Ecol. Prog. Ser., 36: 139-149.
Tsutsumi, H. – 1990. Population persistence of Capitella sp.(Polychaeta; Capitellidae) on a mud flat subject to environmen-tal disturbance by organic enrichment. Mar. Ecol. Prog. Ser.,63: 147-156.
Tsutsumi, H., S. Fukunaga, N. Fujita and M. Sumida. – 1990.Relationship between growth of Capitella sp. and organicenrichment of the sediment. Mar. Ecol. Prog. Ser., 63: 157-162.
Tsutsumi, H. and T. Kikuchi. – 1984. Study of the life history ofCapitella capitata (Polychaeta: Capitellidae) in Amakusa,South Japan, including a comparison with other geographicalregions. Mar. Biol., 80: 315-321.
Warren, L.M. – 1976. A population study of the polychaeteCapitella capitata at Plymouth. Mar. Biol., 180: 209-216.
Warwick, R.M. and C.L. George. – 1980. Annual macrofauna pro-duction in an Abra community. In: M.B. Collins (ed.):Problems of an industrialized embayment. A case study ofSwansea Bay, p. 517-538. Pergamon Press, Oxford.
Warwick, R.M., C.L. George and J.R. Davis. – 1978. Annualmacrofauna production in a Venus community. Est. Coast. Mar.Sci., 7: 215-241.
Warwick, R.M. and R. Price. – 1975. Macrofauna production in anestuarine mud-flat. J. Mar. Biol. Ass. U.K., 55: 1-18.
Wolf, W.J. and L. de Wolf. – 1977. Biomass and production of zoo-benthos in Grevelingen estuary, The Netherlands. Est. Coast.Mar. Sci., 5: 1-25.
Zajac, R.N. and R.B. Whitlatch. – 1985. A hierarchical approach tomodelling soft-bottom successional dynamics. In: Proceedingsof the 19th European Marine Biological Symposium, p. 265-275. Cambridge Univ. Press, Cambridge.
Scient. ed.: T. Kikuchi
Copyright © 2022 FDOKUMEN