Second Tashkent Province Water Supply Development Project
165
Second Tashkent Province Water Supply Development Project (RRP UZB 51240) Supplementary Document Project Technical Analysis __________________________________________________________________________ Document stage: Final Project number: 51240-001 June 2018 Second Tashkent Province Water Supply Development Project
-
Upload
khangminh22 -
Category
Documents
-
view
2 -
download
0
Transcript of Second Tashkent Province Water Supply Development Project

Second Tashkent Province Water Supply Development Project (RRP UZB 51240) Supplementary Document
Project Technical Analysis __________________________________________________________________________
Document stage: Final Project number: 51240-001 June 2018
Second Tashkent Province Water Supply Development Project


Abbreviations
ADB Asian Development Bank ADF Asian Development Fund asl Above sea level CI Cast Iron CSA Communal Services Agency of Uzbekistan CPS Country’s Partnership Strategy DCM Decree of the Cabinet of Ministers DI Ductile Iron DMA District Metering Area EA Executing Agency FMA Financial Management Assessment FS Feasibility Study GOU Government of Uzbekistan HDPE High Density Polyethylene ICB International Competitive Bidding lpcd Liters per Capita and per Day MOH Ministry of Health MHCS Ministry of Housing and Communal Services NAPM National Agency of Project Management NCB National Competitive Bidding ND Nominal Diameter NRW Non Revenue Water OCC Operational Control Center O&M Operation and Maintenence PCU Project Coordination Unit PLC Programmable Logic Controller PE Polyethylene PSA Poverty and Social Assessment PMU Project management Unit PPTA Project Preparatory Technical Assistance QBS Quality Based Selection QCBS Quality- And Cost Based Selection RRP Report And Recommendation Of The President To The Board SBD Standard Bidding Documents SCADA Supervisory Control and Data Acquisition SES Sanitary and Epidemiological services STPWSDP Second Tashkent Province Water Supply Development Project TDS Total Dissolved Solids TOR Terms of Reference TPS Tashkent Provincial Suvokova UZS Uzbekistan Sum WDC Water distribution center WSS Water Supply and Sanitation WTP Water Treatment Plant

Contents
1 INTRODUCTION ....................................................................................... 1 1.1 Rationale ................................................................................................................. 1 1.2 Scope ...................................................................................................................... 2 1.3 Brief History ............................................................................................................. 2 1.4 Compatibility with National Strategy in the Water Supply Sector .............................. 3 1.5 Undertakings and Staff ............................................................................................ 3
2 OPERATIONAL STATUS AND ASSESSMENT OF THE TASHKENT PROVINCIAL “SUVOKOVA” .................................................................... 4
2.1 Territorial and Administrative Settings ...................................................................... 4 2.2 WSS Sector Governance ......................................................................................... 4 2.3 Ministry of Housing and Communal Services (MHCS) ............................................. 5 2.4 Communal Services Agency (CSA) ......................................................................... 7 2.5 The State Inspectorate for Control on Usage of Drinking Water under the Cabinet
of Ministers .............................................................................................................. 7 2.6 The Bureau of Enforcements under the General Prosecutor's Office ....................... 8 2.7 The National Agency for Project Management under the President of the Republic
of Uzbekistan ........................................................................................................... 9 2.8 The State Committee on Investments .....................................................................10 2.9 Other Governing Bodies .........................................................................................10 2.10 Tashkent Provincial Suvokova (TPS), Management and Staffing ...........................10
3 THE PROJECT AREA AND POPULATION ........................................... 12 3.1 The Project Area .....................................................................................................12 3.2 Population Projections and Water Demand ............................................................16
4 GROUNDWATER OCCURRENCE IN THE PROJECT AREA ............... 17 4.1 Groundwater Survey ...............................................................................................17 4.2 Climatological Data .................................................................................................17 4.3 General Hydrogeological Features of the Project Area ...........................................17 4.3.1 Aquifer Identification ...............................................................................................17 4.3.2 Previous Investigations ...........................................................................................18 4.4 Wellfield VU-1 .........................................................................................................18 4.4.1 Summary of Information from Previous Investigations ............................................18 4.4.2 Re-Assessment of the Long-Term Yield of the VU-1 Wellfield ................................19
5 ASSESSMENT OF THE EXISTING WATER SUPPLY INFRASTRUCTURE SERVICES WITHIN THE PROJECT AREA .......... 21
5.1 Brief Assessment of Overall Water Supply in Yangiyul and Chinaz ........................21 5.1.1 Sources of Water Supply ........................................................................................21 5.1.2 Yangiyul District ......................................................................................................21 5.1.3 Chinaz District ........................................................................................................23 5.1.4 The Existing VU-1 to Chinaz Transmission Main ....................................................24 5.1.5 The Distribution System ..........................................................................................25 5.2 Water Service and Consumption ............................................................................25 5.2.1 Service Coverage ...................................................................................................25 5.2.2 Water Production Based on Sales ..........................................................................28 5.2.3 Water Consumption ................................................................................................28 5.2.4 Level of Service ......................................................................................................30 5.2.5 Quality of Water Supply ..........................................................................................31 5.2.6 Waterborne Disease-Related Data .........................................................................37 5.2.7 Water Tariffs ...........................................................................................................39 5.3 Overall Assessment for the Project Area ................................................................40

6 TECHNICAL ASSESSMENT OF WASTEWATER IN TASHKENT PROVINCE ........................................................................................... ...42
6.1 General Overview ...................................................................................................42 6.2 Institutional Overview of Wastewater Services ........................................................44 6.3 Overview of Physical Wastewater Infrastructure in Tashkent Province ...................45 6.4 Overview of Wastewater in the 6 Major Cities of Tashkent Province .......................49 6.4.1 Angren City .............................................................................................................49 6.4.2 Akhangaran City .....................................................................................................51 6.4.3 Chirchik City ...........................................................................................................52 6.4.4 Almalik City .............................................................................................................54 6.4.5 Bekabad City ..........................................................................................................56 6.4.6 Yangiyul City ...........................................................................................................57 6.5 Review of Wastewater in the 14 Districts of Tashkent Province ..............................59 6.5.1 Bustonlik District .....................................................................................................59 6.5.2 Akhangaron District ................................................................................................59 6.5.3 Parkent District .......................................................................................................59 6.5.4 Piskent District ........................................................................................................59 6.5.5 Tashkent District .....................................................................................................59 6.5.6 Zangiota District ......................................................................................................60 6.5.7 Kibray District .........................................................................................................60 6.5.8 Kuyichirchik District .................................................................................................60 6.5.9 Urtachirchik District .................................................................................................60 6.5.10 Yukorichirchik District .............................................................................................60 6.5.11 Chinaz District ........................................................................................................60 6.5.12 Yangiyul District ......................................................................................................60 6.5.13 Buka District ...........................................................................................................60 6.6 General Characteristics of Wastewater in Tashkent Province .................................61 6.6.1 Toxicants ................................................................................................................61 6.6.2 Pesticides ...............................................................................................................61 6.6.3 Bio-Stimulants ........................................................................................................61 6.6.4 Oxygen-Consuming Substances .............................................................................61 6.6.5 Bacteriological Contaminants .................................................................................62 6.7 Review of Wastewater Management within the Project Area ..................................63 6.8 Evaluation of Wastewater Collection and Treatment Options ..................................67 6.9 Proposed Wastewater Management Options for Project Area ................................69 6.9.1 Centralized Wastewater ..........................................................................................69 6.9.2 Decentralized Wastewater ......................................................................................69 6.10 Proposed Onsite HH Septic Tank Systems for the Project ......................................71 6.11 Overall Assessment ................................................................................................73 6.12 Overall Recommendations ......................................................................................74
7 PROJECT DEVELOPMENT .................................................................... 75 7.1 Assumptions, Goals and Methodology ....................................................................75 7.1.1 Project Targeted Settlements .................................................................................75 7.1.2 Population Projections and Water Demand ............................................................77 7.1.3 Methodological Approach .......................................................................................78 7.1.4 Construction Materials and Equipment ...................................................................79 7.2 Evaluation of Water Supply Development Options ..................................................80 7.2.1 Evaluation Criteria ..................................................................................................82 7.2.2 Option Evaluation ...................................................................................................82 7.2.3 Economic Factors Evaluation .................................................................................82 7.3 Non-Economic Factors Evaluation ..........................................................................83 7.4 Selected Option ......................................................................................................84 7.5 Project Development ..............................................................................................84 7.6 Other Physical Components to the Project .............................................................85 7.6.1 Administrative Buildings and Warehouse ................................................................85 7.6.2 Water Quality laboratories ......................................................................................87

7.6.3 Operation Control System .......................................................................................87
8 SYSTEM COST ESTIMATES .................................................................. 89
Appendixes ......................................................................................................... 90
Appendix 1. Existing coverage with water supply of the settlements included in Phase 2 of the Project ......................................................................................................... 91
Appendix 2. Project Areas Water Supply Information ...................................................... 94
Appendix 3. Assessment of the Water Distribution Centres and Pumping Stations ....... 105
Appendix 4. Age and Material of Water Pipes per District .............................................. 118
Appendix 5. Water Networks Condition Information ....................................................... 119
Appendix 6. Infectious Disease Data ............................................................................. 123
Appendix 7. Analysis of Groundwater from Major Wellfields .......................................... 124
Appendix 8. Population Projections ............................................................................... 134
Appendix 9. Distribution Systems Development – Required Works ............................... 139
Appendix 10. Settlements to be Covered by Project Water Supply Facilities ................. 146
Appendix 11. Groundwater Development at the Wellfield VU-1 ..................................... 150
Appendix 12. Water Supply Development Schemes of Project Areas ............................ 153
Appendix 13. Detailed Quantities Information ................................................................ 159

1 INTRODUCTION
1.1 Rationale
1. The government of the Republic of Uzbekistan has requested the Asian Development Bank (ADB) to provide support by lending for the proposed Phase 2 of the Second Tashkent Province Water Supply and Sanitation Development Project (STPWSDP) to address the water supply shortage, water quality, operational maintenance issues, and poor sanitation conditions in Yangiyul and Chinaz districts of Tashkent Province.
2. Uzbekistan is one of Central Asia’s fastest growing economies. The nation’s key economic driver is Tashkent Province, the nation’s largest urban agglomeration and most economically advanced region. Together with Tashkent City, the nation’s capital, the province generates almost 30% of the nation’s total gross domestic product. The province is experiencing rapid urban growth, notably along its southwestern urban corridor. However its potential is being constrained by a pervasive shortage of urban services, particularly in water supply and sanitation.
3. Currently, many of the province’s consumers endure irregular, intermittent, and poor-quality water supply. Much of the province’s water supply infrastructure has deteriorated significantly, resulting in unreliable services, high water losses, and heightened pollution risks. In many districts, households and businesses are hampered by frequent water supply interruptions, forcing them to use alternative water supply sources.
4. Historically, the WSS sector has endured fragmented and dysfunctional regulatory and institutional frameworks, limited sector planning capabilities, weak coordination and oversight, and unclear and ineffective regulatory compliance mechanisms. WSS service delivery institutions have historically performed poorly. Funding constraints have also been acute, exacerbated by low tariff levels and tariff collection efficiencies, limited public funding, and a virtually absent private sector. Significant inequalities also exist in WSS service provision, particularly between urban and rural areas, and stakeholder involvement in the sector has been limited.
5. In general, about 80% of project population currently have no access to piped water supply. Of the remaining 20% population, about 51% rely on trucked water; 19% on piped water but at less than 3 hours per day; and about 30% on alternative unsafe water sources.
6. According to the project survey, about 17% of the households use unsafe groundwater out of boreholes located not far from pit latrines from which excrements infiltrate into groundwater. More than 50% of the households in the highland areas in Yangiyul districts have no water for bathing and personal hygiene during the cold weather season.
7. The lack of safe water supply leads to a rise in water borne diseases illness in the Project area. According to the data of the Ministry of Health of the Republic of Uzbekistan water-related diseases are the most common type of infectious diseases in project area. Dysentery, viral hepatitis and acute intestinal disease account for more than half of the incidence rates of the various infectious diseases. A high incidence of hepatitis A (more than 204cases) was reported in Yangiyul District among children under 14 years. Children under 14 years and women are most vulnerable to all waterborne diseases. The women in two project districts suffered from infectious diseases (nearly 50% of registered cases among adult population). Between 2016 and 2017 acute intestinal infections among children under 14 years of age increased from 253 per 1000 population to 364 per 1000 population in Yangiyul district, and from 82 per 1000 population to 93 per 1000 population in Chinaz district.
8. The limited possibility to observe elementary sanitary requirements due to lack of water (i.e. there is not enough water for proper hand and dish washing).

2
1.2 Scope
9. The Project aims to provide safe and continuous water supply to a large part of the population living within the districts Kibray, and Zangiota (under Phase 1) and Yangiyul and Chinaz (under Phase 2) in the Tashkent Province. PPTA efforts for Phase 1 were conducted from June 2015 to July 2016. For Phase 2 the PPTA activities are scheduled for the period from November 2017 to July 2018.
1.3 Brief History
10. An interregional water distribution system was commissioned in 1978 whose main component are: (i) one water treatment plant (WTP), hereinafter referred to as the existing WTP, which treats raw water from the Boz Suv Irrigation canal in Kadirya, East of Tashkent City, and (ii) one 800 to 1000 mm transmission main designed to provide water supply to urban and rural population within Zangiota, Kibray, Yangiyul, and Chinaz districts.
11. Due to infrastructure ageing and insufficient maintenance, the system has progressively deteriorated. Only a few segments of the regional transmission main are still operational. Several water distribution centers (WDCs) have also deteriorated to a situation of being beyond repair. Due to prolonged periods out of service, significant parts of the secondary and village distribution networks have become went progressively obsolete. The regional Kadirya WTP is still functioning but the treatment process is failing and has become obsolete under many aspects.
12. Additional sources of water were developed to substitute the failure to convey water supply to remote settlements via the transmission main. Some small to large wellfields were developed along the water bearing alluvial deposits of the Chirchik River floodplain. Single wells were developed for supply of settlements too distant from Chirchik River, particularly in the districts of Yangiyul and Chinaz, in spite of the relatively elevated content of dissolved solids of the groundwater in several of such villages. Unconventional, often unsafe sources of water supply are being used by inhabitants of settlements within the territory of the four Districts included in the Project.
13. A study “Reconstruction of water intake facilities for water supply of rural areas of Chinaz, Zangiota districts and part of Yangiyul district and reconstruction of sewerage systems of Kibray and Zangiota districts of Tashkent province” was carried out in 2006 by Suvoqava-Xizmat and subsequently revised in 2009 “Reconstruction of water intake facilities VU-1 and VU-3 for rural water supply of Chinaz, Zangiota, Tashkent districts and part of Yangiyul districts of Tashkent province”.
14. A study on rehabilitation of WSS in the 4 districts (Kibray, Zangiata, Chinaz and Yangiyul) was carried out by the national consulting company “Suvokova-Xizmat” and revised in 2009 under the Chinese government initiative. However, due to lack of funding this study was suspended.
15. At the request of the Government of Uzbekistan, in 2015 under ADB TA-8227 Second Water Supply and Sanitation Investment Program the Feasibility study for the rehabilitation of WSS in the 4 districts (Kibray, Zangiata, Chinaz and Yangiyul) was developed by ADB PPTA consultants. The program was recommended for implementation in two phases (Phase-1: Water Supply Development for Kibray and Zangiata districts, and Phase-2: Water Supply Development for Yangiyul and Chinaz districts).
16. For the Phase-1 the ADB has signed with Uzbekistan Government a loan agreement in the amount of US$120.9 million. The Phase-1 covers the construction of new WTP with capacity of 105,000m3/day, water mains, pumping stations, distribution lines and other water supply facilities for these first two districts. This project has already started and being implemented.
17. Specifically, under the Phase 1, the following proposed physical components are to be implemented:
- construction of Water Treatment Plant ‘Kadirya” with capacity 100 000 m3/day;

3
- construction of transmission main 58.3 km, Dia 300 to 1,000 mm transmission main from the new Kadirya WTP to WDC VU-3;
- construction of 27.18 km, Dia 110 to mm, feeder distribution mains to water distribution centers;
- construction and reconstruction of distribution networks, total 337.77 km, Dia 76 to 350 mm;
- construction of 8 new WDCs;
- rehabilitation of 9 WDCs;
- installation of 49,256 private consumer water connections with water meters.
1.4 Compatibility with National Strategy in the Water Supply Sector
18. The Project aims to provide 24-hour water supplies with 100% household water connections in order to improve hygiene, living conditions and health among the beneficiary residents of the two districts.
19. The Project is in line with:
(i) Priorities set by both ADB and the GOU, namely with the Development Strategy, Road Map and Investment Program for the Water Supply and Sanitation Sector of the Republic of Uzbekistan until 2020;
(ii) Decree of the President of the Republic of Uzbekistan dated 6 March 2015 # PP-2313 "About the program of development and modernization of engineering communications and road infrastructure for the years 2015-2019", which includes the “Reconstruction of water intake facilities for drinking water supply of Chinaz, Zangiota, Tashkent districts and part of Yangiyul district” in the list of priority infrastructure projects;
(iii) Instruction of the President of Uzbekistan No. P-4647 dated 18 May 2016. “About measures on further extension of financial cooperation with the Asian Development Bank and other international financial institutions”, and related Action Plan which includes “Reconstruction and construction of water supply and sewerage systems of cities and districts of Tashkent province”;
(iv) the Decree of the President of Uzbekistan No.2910 dated 20.04.2017 “About drinking water supply and sewerage systems comprehensive development and modernization program during the period of 2017 – 2021;
(v) the Asian Development Bank’s (ADB) Country Operations Business Plan (COBP), 2017-2019 for Uzbekistan, and more recent government initiatives in the sector.
1.5 Undertakings and Staff
20. A team of international and national consultants was set up for the preparation of the feasibility study, under direct supervision of the ADB Project team. A number of supporting team members and surveyors were engaged to provide support to specialists to carry out field surveys, inventories and drawings. The PPTA team was mobilized on November 1, 2017 to undertake the study.

4
2 OPERATIONAL STATUS AND ASSESSMENT OF THE TASHKENT PROVINCIAL “SUVOKOVA”
2.1 Territorial and Administrative Settings
21. Uzbekistan is divided into fourteen administrative units (collectively, “provinces”):
• Republic of Karakalpakstan;
• Tashkent city;
• 12 viloyats (oblasts).
22. These provinces are further divided into districts (tumans or rayons) and cities of republican, provincial or district significance, depending on their size and importance. Each of administrative units is headed by a municipal authority (khokimiyat), which comprises of a mayor (khokim), municipal council (kenghash) of elected deputies, and the apparatus. Thus, there is a khokim of a province, which is appointed by the President of Uzbekistan and endorsed by the municipal council of the province; and a khokim of a city and/or district, which is appointed by the provincial khokim and endorsed by the municipal council of the city and/or district. The next level of administrative organization, below district and town levels, would be Village Conglomerations and Mahallas. These are semi-formal self-governing institutions typically run by elected “elders”.
23. Khokimiyat apparatus has a matrix organizational structure, with khokimiyat’s functional units being simultaneously a part of a corresponding national ministry. Thus, the Department on Finance of a Khokimiyat is simultaneously a territorial unit of the Ministry of Finance. The same is the case with the Ministry of Health, Ministry of Economy and other ministries. Such dual reporting arrangement embedded into the organizational structure of khokimiyats requires extensive inter-institutional cooperation in decision making, with continual involvement of central government institutions. Respectively, decision-making tends to be relatively centralized, with prevalence in top to down approach in reformation and development.
2.2 WSS Sector Governance
24. The Water Supply and Sanitation (WSS) services are considered to be a part of communal services, which historically had been governed primarily by municipal authorities. With the recent creation of the Ministry of Housing and Communal Services in 2017, the primary sector governance responsibility has been shifting to the central government, in particular, the ministry and its provincial departments.
25. Provincial khokimiyats are still responsible for the WSS sector of the province and report to the central government. The city/district/town level khokimiyats are responsible for the WSS sector within their domain and report to the provincial khokimiyats.
26. According to the Decree No. 355 dated 29 July 1992 “On the Order on Allocation of State Property of the Republic of Uzbekistan on the Republican Property and the Property of Administrative-Territorial Establishments”, the WSS sector assets belong to municipal authorities, although it is not clear if they belong to the provincial or district/town level khokimiyats.
27. On October 30, 2015, the Cabinet of Ministers of Uzbekistan has adopted the Decree No. 306 (DCM 306), consolidating the 131 WSS utilities of the country into 18 enterprises with standardized organizational structure. The decree further introduced a broad set of reforms in the sector, including:
a) stock taking of regulatory documents and development of the Program on improvement of the regulatory framework of the WSS;
b) development of the Concept on Comprehensive Development and Modernization of WSS systems of Uzbekistan till 2035;
c) adoption of modern methods of utilities’ management by introducing Public Service Contracts for clear delineation of responsibilities between local state authorities and the utilities;
d) adoption of Key Performance Indicators for monitoring performance of the utilities;

5
e) formulation of the uniform set of requirements to customer databases and billing systems to be used in customer stock taking;
f) installing modern meters at production sites, distribution hubs, and customer connections;
g) introduction of annual trainings for key management personnel of the utilities;
h) adoption by the utilities of Geographic Information Systems (GIS) “Asset Management”;
i) universal adoption at the utilities of billing system software;
j) creation of appropriate information sources (Internet sites) for public accountability and customer grievances;
k) adoption of Information Technology (IT) based solutions for Water Balance reporting;
l) broad information campaign with regular reporting in mass media and Internet on content and purpose of reforms in the WSS sector.
28. Not all of the reforms of the Decree of the Cabinet of Ministers DCM 306 were completed by target dates. Nevertheless, the reform agenda and momentum for change are still strong and dynamic. Most importantly, the DCM 306 resulted in consolidated institutional settings within the WSS sector, based on prescribed organizational structures.
29. The DCM 306 was followed by regulations overhauling the sector governance by creating in April 2017 a number of new institutions with extensive operational mandate:
• the Ministry of Housing and Communal Services (MHCS);
• the State Inspectorate for Control on Usage of Drinking Water under the Cabinet of Ministers;
• the Bureau of Enforcements under the General Prosecutor's Office;
• the National Agency for Project Management;
• the State Committee on Investments.
30. In practical terms, the DCM 306 resulted in institutional overhaul of the water utilities, and the decrees of April 2017 in institutional overhaul of the WSS sector governance.
2.3 Ministry of Housing and Communal Services (MHCS)
31. The MHCS has been instituted by the Decrees of the President of the Republic of Uzbekistan UP-5017 and PP-2900 dated 18 April 2017. The Ministry’s structure includes:
a. The MHCS of the Republic of Karakalpakstan, Departments on Housing and Communal Services at provinces and Tashkent City, with branch offices at district and city levels;
b. Communkhizmat Agency (CSA), formerly known as Uzbekistan Communkhizmat Agency (UCSA), which used to be the main agent of the government in overseeing the WSS sector and handling projects with International Financial Institutions (IFIs), prior to creation of the MHCS;
c. The Inspection on Control in Exploitation of Multi-storey Buildings;
d. State Owned Enterprises:
e. Engineering Company on Construction of Multi-storey Buildings and Heating Facilities;
f. Engineering Company on Construction of Water Supply and Sanitation Facilities;
g. Engineering Design Institute “Uzbekkommunalloyikhakurilish”;
h. Training and Methodology Centre “Kommunalukuv”;
i. Department for Management of the Inter-Regional Water Main Chimgan - Charvak Recreation Zone at Tashkent Province;
j. Department for Management of Inter-Regional Water Main “Damkhodja”;

6
k. Research and Design Institute Joint Stock Company “TashuyjohLITI”.
32. The Ministry has the broad mandate, including:
a. Implementing uniform state policy and inter-regional coordination in sphere of housing and communal services;
b. Implementation of state programs on construction of affordable housing and facilities for water supply, sanitation, and heating services;
c. Monitoring technical conditions of multistory buildings, including undertaking capital and current repairs;
d. Coordination of activities of Household Owners Associations, including control and oversight of technical compliance with applicable norms and standards;
e. Design and implementation of programs on development, modernization and reconstruction of water supply, sanitation and heating infrastructure;
f. Introduction into housing and communal services energy saving technologies and equipment, including installing modern metering devices;
g. Proposing improvements in the regulatory framework of housing and communal services, including adoption of modern international best practices;
h. Formulating, together with the Ministry of Finance, a tariff setting policy for water supply, sanitation and heating services;
i. Implementing series of measures on strengthening economic sustainability of utilities;
j. Proposing improvements in preparation of cadres, capacity building and enhancement measures, adoption of modern Information and Communication Technologies, etc.
33. The MHCS is a recently established institution with the broad mandate and vast geographic span of operations. Respectively, the ministry is currently going through important institutional progressions, including staffing key positions and designing operational systems. The organizational structure of the ministry is presented below.
Figure 2.1. Organizational Structure of the Ministry of Housing and Communal Services of the Republic of Uzbekistan

7
2.4 Communal Services Agency (CSA)
34. The CSA is particularly important because of its preceding dominant role in the WSS sector as the UCSA1, which was the main think tank and technical regulator of the sector. As an institution with history and traditional mandates, the CSA is a critically important part of the MHSC, aiding with sector reforms and smoothening transitional hurdles.
35. According to the Decree of the Cabinet of Ministers No. 340 dated 2 June 2017 the CSA is the special designate entity for development and implementation of investment projects with participation of the IFIs and donor organizations in housing and communal services. The CSA has extensive experience in designing and implementing projects with the IFIs and international donor organizations. It is still the focal point for investment programs supported by the IFIs and other international institutions. The organizational structure of the CSA is presented below.
Figure 2.2. Organizational Structure of the Communal Services Agency
2.5 The State Inspectorate for Control on Usage of Drinking Water under the Cabinet of Ministers
36. The Presidential Decree UP-5018 dated 18 April 2017 established the State Inspectorate for Control on Usage of Drinking Water under the Cabinet of Ministers (“Uzdavinspekstsiya”). The inspectorate is the leading institution for strengthening control environment within the sector. It has branch offices across the country. The main objectives of the inspectorate are:
a. Ensuring compliance with applicable regulations, norms and standards in water supply and sanitation;
b. Conducting technical audits of the WSS infrastructure towards improving technological processes and energy efficiency;
c. Ensuring compliance with technical specifications and conditions for WSS network connections, and prevention of unauthorized connections;
d. Monitoring conditions and usage of the WSS infrastructure, including efficacy of preventive measures and compliance with norms on water losses;
e. Conditions and usage of ground water wells.
1 The state agency UCSA was established in 2000 by the Presidential Decree No. 2791 dated 19 December 2000. The UCSA organizational structure and functions were approved by Resolution of the Cabinet of Ministers (RCM) No. 493 dated 21 December 2000. Subsequently, the organizational structure was revised by the Decree of the President No. 445 dated 17 August 2006.

8
2.6 The Bureau of Enforcements under the General Prosecutor's Office
37. Inadequate financial position and performance of natural monopolies had been subject to the government’s intensive scrutiny for a number of years. After numerous unsuccessful attempts to improve fiscal discipline and commercial performance by institutional reforms and changes in management at the utilities’ level, the government decided to establish the central collection agency with extraordinary powers.
38. The Presidential Decree No. UP-5059 “On Further Measures for Strengthening Payment Discipline in Supply and Consumption of Electric Power and Natural Gas, and On Fundamental Reform of Collection Administration” issued on 29 May 2017 stipulated creation of the Bureau of Enforcements under the General Prosecutor's Office (the Bureau). Pursuant to the Clause 42 of the Decree No. UP-5059 the Bureau was tasked with the following rights and responsibilities:
• Inspection of completeness and correctness of accounting for supply, consumption and timely payment for services, without the need to coordinate such inspections with the Republican Council on Coordination of Activities of All Controlling Bodies3;
• Issuance of mandatory collection orders4 on bank accounts of delinquent customers, who are legal entities or private entrepreneurs;
• Issuance of mandatory orders to employers to withhold from employees’ salaries up to two monthly minimum wages towards payments for communal services incurred by an employee;
• Charging customers’ plastic cards up to two monthly minimum wages per months for the rendered services;
• Demanding from ministries, agencies, other organizations, and citizens information, required for control and monitoring of energy consumption, as well as completeness and timeliness of payments;
• Issuing to physical and legal entities mandatory orders for settlements of debts;
• Applying financial sanctions to legal entities for violations of rules of service;
• Issuing orders to ministries, agencies, and other organizations, including self-governing associations, to eliminate reasons and/or conditions enabling violations in supply and consumption of communal services, as well as to sanction public influence on delinquent customers;
• Disconnecting customers from service networks in cases of delinquency, non-compliance with mandatory orders, theft, and illegal connections;
• Reconnecting previously disconnected customers upon elimination of non-compliances;
• Applying administrative sanctions to persons responsible for violation of rules of service;
• Monitoring metering, controlling and accounting devices and systems.
39. The Presidential Decree No. PP-3016 issued on 30 May 2017 “On Organization of Activity of the Bureau Enforcements under the General Prosecutor's Office of the Republic of Uzbekistan” stipulated that the Bureau is the independent law enforcement agency under auspices of the General Prosecutor’s Office. The head of the Bureau is appointed by the President of Uzbekistan. The decree further expanded mandate of the Bureau to include:
• Undertaking search and surveillance activities;
• Monitoring accounting of customers, consumptions, billings, and payments;
• Applying sanctions to public officers, who are not ensuring timely and proper implementation of projects and programs on adoption of modern automated systems of control and accounting;
• Regular meter readings;
2 Subsequently, the Presidential Decree No. UP-5241 dated 16 October 2017 made this clause applicable to water and wastewater services as well 3 Practically all other government auditors, including tax inspectors, are required to coordinate their inspection with this Committee. 4 Such collection orders are mandatory for executing by all commercial banks of the country

9
• Applying sanctions to public officers violating rules of service, billing and collection;
• Analyzing and summarizing prevailing practices in billings and collections;
• Issuing mandatory orders to government institutions and other organizations, public officials and ordinary citizens;
• Entering facilities of debtors, including residential housing, offices and storage facilities, with application of force, if necessary, and with the right to unseal vaults and storages, in presence of attending witnesses;
• Entering facilities not belonging to debtors in case of availability of either a documentary evidence linking the debtor to the facilities or the court order;
• Arrest, seizure, custody, valuation and sale of property and monetary funds of debtors;
• Summoning persons of interest;
• Charging fees, penalties and expenses relating to collection of debts;
• Publishing wanted lists;
• Imposing temporary bans for travels abroad.
40. The Bureau’s mandate was further expanded by the Presidential Decree No. UP-5241 issued on 16 November 2017 “On Measures of Cardinal Reformation of Payment Discipline in Water Supply and Sanitation Services”, to include:
• Exposing and preventing illegal connections and usage of services;
• Ensuring full and timely payments for rendered services;
• Monitoring implementation of management information systems for billing.
41. The Decree UP-5241 required utilities by the middle of January 2018 to lay off their collection officers, with transfer of collection functions to the Bureau. Respectively, the Bureau became the sole institution entrusted with billing and collection for all communal services, making it de factor the centralized collection agency. The reform is still at a relatively early stage, and many procedures and instructions required for effective operations have not yet been established. As of 23 April 2018, the Bureau was transferring all collected funds to the Tashkent Province Suvokova’s (TPS) account without deducting any collection fees. By law the Bureau is eligible to withhold collection fees, but the detailed instruction and calculation to this respect has not been published yet. It is expected that the collection fees would be around 10% of collections, which typically was a commission paid by utilities to their collection officers.
2.7 The National Agency for Project Management under the President of the Republic of Uzbekistan
42. The National Agency for Project Management under the President of the Republic of Uzbekistan (the NAPM) had been instituted by the Decrees of the President No. UP-5120 “On Measures for Implementation of Systems of Project Management in the Republic of Uzbekistan” dated 24 July 2017 and the Decree of the President No. PP-3150 “About Organization of Activities of the National Agency for Project Management under the President of the Republic of Uzbekistan” dated 27 July 2017. The NAPM has extraordinary broad and powerful mandate. Its orders are mandatory to all state bodies, commercial entities, and citizens of the country. The NAPM mandate includes:
• Monitoring and control of design and implementation of investment projects and programs;
• Organizing and coordinating work of state institutions and other organizations, as well as expert groups on matters of improving project management, government procurement, and investment climate in the country;
• Approving investment programs on annual basis;
• Facilitation of timely and appropriate implementation of the government projects, including those with IFIs and donor financing;
• Analysis of grievances redress systems on matters of government procurement and projects implementation;
• Coordination, control and methodical oversight of government procurement processes;

10
• Forming the list of sanctioned vendors/suppliers;
• Evaluation and registration of import contracts;
• Evaluation of project documents, technical specifications, terms of references, and bidding documents;
• Control over efficient use of the government funds;
• Evaluates performance of management and officers of project implementation groups;
• Critical analysis of practices and legislation on collisions, corruption, and redundancies;
• Inspection of government institutions and other organizations on matters of government programs and investment projects.
43. The NAPM reports monthly to the President of Uzbekistan on:
• Deficiencies and losses identified in implementation of investment projects and adopted remedy measures;
• Specific measures on improving investment climate by enhancing national legislation;
• Identified facts of inappropriate or inefficient usage of privileges and preferences provided within investment programs;
• Results of work on prevention of excessive pricing within the government’s procurement.
44. Within the WSS sector the NAPM plays pivotal role in design and implementation of all investment project. Furthermore, starting from early 2018 the NAPM officers assumed controlling oversight over bank accounts of provincial water utilities. The water utilities are allowed to disburse only amounts approved by the NAPM officers within monthly budget limitations or on an ad hoc basis, in case of urgent non-routine transactions.
2.8 The State Committee on Investments
45. The State Committee on Investments (the SCI) of the Republic of Uzbekistan was instituted by the Decree of the President of Uzbekistan No. UP-4996 dated 31 March 2017 “On Establishing the State Committee of the Republic of Uzbekistan on Investments”, the Decree of the President of Uzbekistan No. PP-2868 dated 4 April 2017 “On Measures of Organizing Activities of the State Committee of the Republic of Uzbekistan on Investments”, and the Decree of the Cabinet of Ministers of Uzbekistan No. 415 dated 23 June 2017 “On Establishing the Bylaw of the State Committee of the Republic of Uzbekistan on Investments”. The SCI reports to the Cabinet of Ministers, has provincial branches.
46. The SCI’s primary mandate is coordinating and formulating a uniform investment policy of the country, as well as overseeing investment programs and projects. Respectively, the SCI has a pivotal role in managing investment activities of the utilities, liaising with the IFIs in formulation and implementation of investment projects, staffing and supervising project implementation units, participating in key capacity in tender committees, and in other investment related activities. In this respect, the SCI’s activities are closely intertwined with the NAPM activities in overseeing the WSS sector modernization efforts.
2.9 Other Governing Bodies
47. The WSS sector is subject to routine oversight by various ministries, including the Ministry of Health overseeing drinking water quality, the State Committee on Ecology and Environmental Protection overseeing emissions and pollutants, the State Committee for Assistance to Privatized Enterprises and Development of Competing conducting oversight over natural monopolies and other state bodies.
2.10 Tashkent Provincial Suvokova (TPS), Management and Staffing
48. Tashkent Provincial Water Utility “Suvokova” (TPS) was transformed into a State Unitary Enterprise on 1 January 2016 under the Decree of Cabinet of Ministers (DCM) No 306 that provides for the consolidation of district and city water utilities into a provincial utility “Suvokova”. The former district water utilities of Kibray, Zangiota, Yangiyul and Chinaz,

11
formerly registered as Joint Stock Companies, are now absorbed as “branches” of the TPS and their assets and liabilities are combined into TPS.
49. The organizational structure of the provincial Suvokovas is also regulated by the DCM 306. TPS has a total staff of 70 at the head office, made up of 40 management and administrative staff and 30 engineering and technical staff overlooking at operation and maintenance (O&M). In addition, TPS employs 15 additional supporting staff.
Figure 2.3. TPS Organizational Chart
50. District and city level branches vary significantly in size and capacity, depending on serviced territory and population base. The DCM 306 contains prescribed organizational structures for district and city level utilities. The project’s impact area involves the following branches of TPS:
• Yangiyul District Branch (YDB), servicing most of the Yangiyul district.
• Zangiota District Branch (ZDB), servicing Zangiota district and parts of Yangiyul district serviced by the water main fed by VU1 intake.
• Chinoz District Branch (CDB).
51. Demarcation of service zones between YDB and ZDB in Yangiyul district is not fixed on a map, creating ambiguities in terms of service mandate in some settlements.
Director (1)
Deputy Director -Chief Engineer (1)
Production -Ttechnical Department (2 managers and
engeneer-technicians*)
Chief Powerman's Department (1 manager and engeers-
technicians*)
Chief Mechanic's Department (1 manager and engineers-
technicians*)
Central Laboratory (1 manager and engeneers-technics*)
Safety and Labour Protection Department (1 manager and
engeneers-technicians*)
Metrology Department (1 manager and engi
neers-technicians*)Deputy Director for
Operation of Networks and Facilities (1)
Capital Construction and Repairs Department (1
manager and engeneers-technicians*)
Water Supply and Sewerage Facilities Operation
Department (1 manager and engeeners-technicians*)
Central Dispatching Service Department (1 manager and
engeneers-technicians*)
Department for development and monitoring of WSS development
programs, implementation of investment projects and improve efficiency of WSS enterprises (2
managers and engeneers-technicians*)
City and district branches
Deputy Director for Economic Affairs (1)
Financial-Economic Department (3
managing personnel)
Accounting Department (3
managing personnel)
Logistics Department (1 manager and
engeneers-technicians*)
Central Customer Service (1 manager
and engeneers-technicians*)
IT Department (including automated system of customer accounting and asset management) ( 1 manager and
engeneers-technicians*)
Human Resources (2 managing personnel)
Legal Advisor (1)
Special Operations and Civil Protection
Officer (1)
Chancellery (1 manager and
engeneers-technicians*)

12
3 THE PROJECT AREA AND POPULATION
3.1 The Project Area
52. The Project area and settlements are shown in Figure 3.1 below.
p0;
Figure 3.1 Layout of the Existing Regional Water Distribution System for Area Under STPWSDP Phase 1 and Phase 2
53. Phase 2 covers a large part of Yangiyul district, most of Chinaz district and five settlements of Zangiota district which will target 79 settlements along the alignment of the trunk mains where water supply service is currently unavailable. The target population under Phase 2 is about 220,000 residents.
Table 3.1 List of Settlements under Phase 2
№ Yangiyul District Water Supply
System Population Households
1 Umid urbanized village 2 500 450 2 Dustlik 2 245 314 3 Galaba 3 395 611 4 Yangiobod 607 111 5 Markaz 2 996 549 6 Shuralisoy 2 011 369 7 Yangiyul (Ohunboboev) 1 985 279 8 Hakikat 3 015 424 9 Iftihor (Bobur) 2 385 342
10 Marifat 391 56 11 Vatan 2 263 325 12 Mirishkor 2 390 429
Division between Phase 1 & 2
Phase 1 area
Pha
se 2
are
a

13
13 Halkobod 4 355 782 14 Olmazor (A.Ikramov) 3 880 696 15 Nihol (Navoi) 2 669 479 16 Nurobod 1 985 353 17 Keskan 3 845 685 18 Registon (Dangir) 3 260 580 19 Turkiz 393 70 20 Kaksha 380 68 21 Kushtepa 2 799 513 22 Changtepa 3 160 580 23 Honkurgon 4 617 814 24 Kengkechik 2 392 421 25 Mustakillik 2 220 400 26 Tuyabugiz 2 610 470 27 Yuksalish (Inogomov) 3 023 544 28 Uzbekiston 3 018 543 29 Said Ota 2 140 385 30 Mirzaboboev 2 011 354 31 Galaba 287 51 32 Kanalbuyi 182 31 33 Yangi Mahalla 513 88 34 Chamanzor 2 610 510 35 Koratepa 3 246 610 36 Urtaovul 19 399 3 493 37 Bogzor 3 066 552 38 Ankhor 5 325 959 39 Chinor 2 393 429 40 Dehkonobod 1 655 297 41 Madainyat (Botir) 2 065 371 SUBTOTAL 115 681 20 361
№ Chinaz District Water Supply
System Population Households
1 Chinoz city 27 526 4 451 2 Birlik urbanized village 2 900
476 3 Amir Temur urbanized village 5 104
975 4 Kir urbanized village 2 750
410 5 Uzbekiston 2 814
430
6 Galaba 524
80 7 Ittifok 436
67
8 Dustlik 372
57 9 Kanalobod 1 287
197
10 S.Rakhimov 911
146 11 Sutbulok 1 919
315
12 Hudayberganov (Tong Yulduzi) 1 704
280 13 Gayrat 3 385
542 14 Abzalobod 2 905
555 15 Olmos 2 012
384 16 Mevazor 1 924
368 17 Ohunboboev 2950
564 18 Archazor 475
91 19 Tillaobod 1 640
313 20 Safarobod 1 009
193 21 Uchkun 1 600
271 22 Madaniyat 2 570
435 23 Norkuziev 1 104
127

14
24 Yangiobod 3 223
372 25 Kahramon 2 800
448 26 Islomobod 3 215
546 27 Birlik 1 602
272 28 Kutarma 2 623
446 29 Kerdara 900 153 30 Guliston 2 391
406 31 Ochamayli 2 069
308 32 Yollama 2 378
354 33 Dehkonobod 2 976
444 34 Erkin 1 700
253 35 Chinmasjid 2 925
436 36 S.Ayniy 1 650
264 37 Uzumzor 1 815
300 38 Samarkand 2 676
453
SUBTOTAL 104 764 17 182 GRAND TOTAL 220 445 37 543
54. Locations of settlements under Phase 2 are shown in the below Figure 3.2.

15
Figure 3.2. Location of Settlements under Phase 2

16
3.2 Population Projections and Water Demand
55. Present and projected population data are provided by the Institute of Forecasting and Macroeconomic Research under the Cabinet of Ministers of the Republic of Uzbekistan. Average per capita water consumption (lcd) considered for the projections are:
• 150 lcd in the urbanized rural centers;
• 120 lcd in rural settlements.
56. Projections of population and water demand at the horizon 2043 summarized in Table 3.2 have been calculated for each single makhalla, village or rural town individually. The settlements have then been categorized according to water supply systems each of which is commanded by a water distribution centers (WDC).
Table 3.2 Beneficiary Population Projections (Phase 2)
Year Yangiyul District
Chinaz District
Zangiota District
Total
District Population5 2018 256,920 125,653 363,091 745,664 2045 314,641 143,679 461,058 919,378
Beneficiaries population 2018 106,502 104,764 9179 220,445 2023 113,345 110,999 9876 234,320 2045 135,714 121,775 10,492 267,981
57. The consolidated water demand at the horizon 2045 including Suvokova’s process water and other own needs is estimated at an average of 48,000 m3/d with a maximum day demand reaching 60,000 m3/d.
5 Source: Institute of Forecasting and Macroeconomic Research
17
4 GROUNDWATER OCCURRENCE IN THE PROJECT AREA
4.1 Groundwater Survey
58. Under the previous TA a groundwater survey has been conducted in the project area by a certified hydrogeologist from early April to end May 2016 and additional assessment was conducted in March 2018.
59. The scope of the survey was to review existing data and to obtain updated information on occurrence, quality and availability of groundwater resources within the territory encompassed by the project.
60. During the survey all existing groundwater production wells used for water supply in large wellfields as well as single units for the supply of individual settlements have been inspected. Groundwater samples have been collected and analysed. Non-operational wells have been inspected by means of down to-the-hole cameras in order to ascertain the practicability of restoring the abandoned wells as production units.
61. A full report summarizing the results of the hydrogeological surveys is provided as Annex 3 to the main report.
4.2 Climatological Data
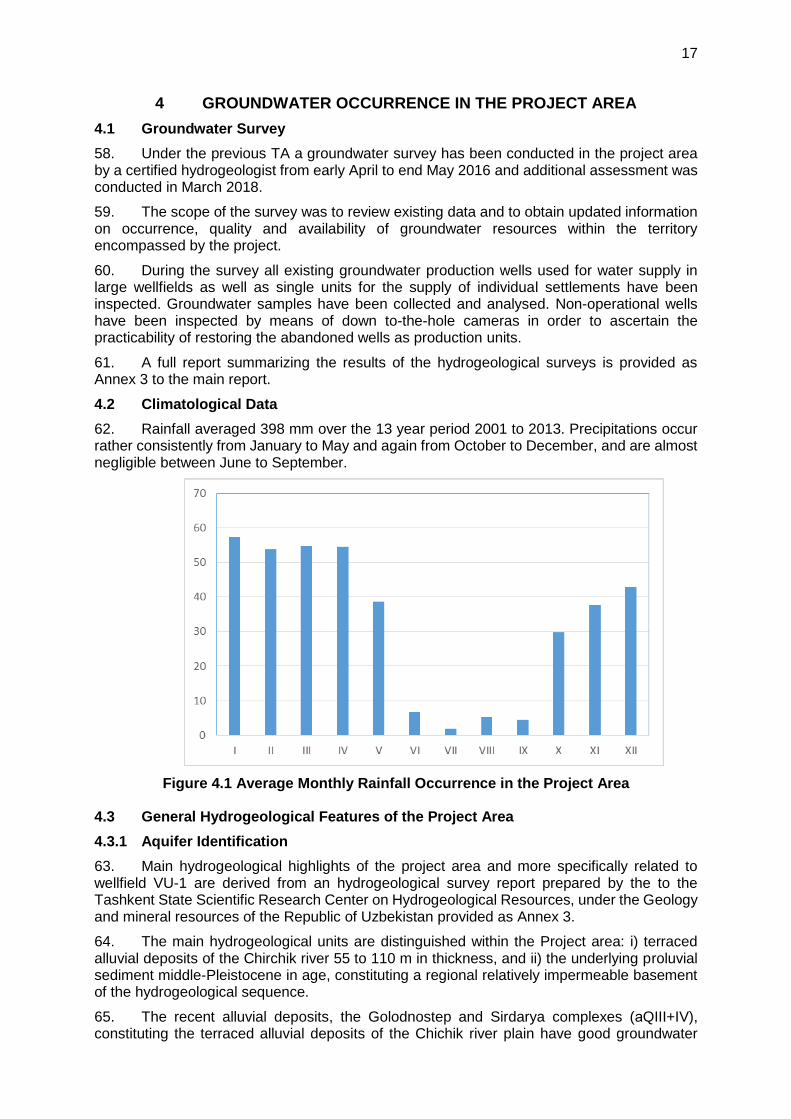
62. Rainfall averaged 398 mm over the 13 year period 2001 to 2013. Precipitations occur rather consistently from January to May and again from October to December, and are almost negligible between June to September.
Figure 4.1 Average Monthly Rainfall Occurrence in the Project Area
4.3 General Hydrogeological Features of the Project Area
4.3.1 Aquifer Identification
63. Main hydrogeological highlights of the project area and more specifically related to wellfield VU-1 are derived from an hydrogeological survey report prepared by the to the Tashkent State Scientific Research Center on Hydrogeological Resources, under the Geology and mineral resources of the Republic of Uzbekistan provided as Annex 3.
64. The main hydrogeological units are distinguished within the Project area: i) terraced alluvial deposits of the Chirchik river 55 to 110 m in thickness, and ii) the underlying proluvial sediment middle-Pleistocene in age, constituting a regional relatively impermeable basement of the hydrogeological sequence.
65. The recent alluvial deposits, the Golodnostep and Sirdarya complexes (аQIII+IV), constituting the terraced alluvial deposits of the Chichik river plain have good groundwater

18
bearing properties, characterized by excellent filtration coefficient (permeability) ranging 12.2 to 105.5 m/s in the upper parts. The productivity of the wells reaches rather significant 40 to 60 l/s and more with drawdowns of 6 to10 m. The static groundwater depth level is about 3 m. Seasonal fluctuation of the groundwater level remain included between 1 to 3 m with the lowest levels reached from December to April and the highest in the period July to September.
66. Recharge of the alluvial aquifer occurs mainly by infiltration of the Chirchik River in the upper reaches of the alluvial plain. Some recharge also occurs by downwards percolation from irrigation canals and irrigated fields. The groundwater flows sub-parallel to the Chirchik river course with a hydraulic between 0.001 and 0.003.
4.3.2 Previous Investigations
67. Hydrogeological investigations of the Chirchik River carried out in 1972-19736 proved a potential in terms of renewable recharge of 1.86 m3/s under category B+C1. Based on further investigations in 1973-747 the protocol of the State Committee of Reserves of the Soviet Union № 7305 dated 13.12.1974 endorsed the groundwater reserves available from the alluvial deposits estimated at 110,200 m3/day and approved the construction of 23 production wells on the right bank of Chirchik river Northeast of Yangiyul city. Revised calculations confirmed an average monthly recharge from the Chirchik river equivalent to 1,4 m3/s (120,000 m3/day). Details of the 27 Wells are provided in Annex 3 to the main report.
68. Later, in 2005-2007, evaluation works were carried out within Chirchik deposit on operating site of Gulbakhor for supply water of Gulbakhor village of Tashkent province.
69. As a result of these works, the protocol of the State Reserve Committee of Uzbekistan № 297 dated 29.06.2007 approved operational reserves of fresh waters at upper – middle quaternary depositions of Gulabkhor site of Chirchik deposit for water supply of Gulbakhor city according to categories В+С1 in the amount of 10 500 м3/day.
4.4 Wellfield VU-1
4.4.1 Summary of Information from Previous Investigations
70. The wellfield has been operating since the year 1984 and consists of 27 wells. It is located on left bank of Chirchik River within the lower alluvial terraces above the flood plain. The wellfield includes an alignment of wells parallel to the Chirchik river course over a length of 3,5 km. Distance between wells varies from 100 to 350 m.
71. Depth of wells is between 56 to 65 m. Wells exploit groundwater taking place within undifferentiated alluvial deposits of a recent sequence of upper-quaternary essentially gravelly deposits. In places, conglomerate layers confine locally the aquifer down to depths up to about 60 m.
72. During the development of the wellfield between 1981 and 1983, pumping tests were carried out in 6 test wells producing a yield of 66,700 m3/d (772 l/s). Based on these results the potential of the wellfield was estimated at 141,700 m3/d. As the construction of production wells progressed, the tested capacity of the first 17 wells was of 69,100 m3/d (800 l/s) and when 22 wells were completed the production capacity augmented to 86,400 m3/d (1,000 l/s).
73. In 2014, 8 to10 production wells are operated on a permanent base (Table 4.1). The average of a series of flow measurements conducted during a survey from January to December 2014 is 29,736 m3/d.
6 Nagevich P.P., Ten V.V., Kamalitdinov R.U (1972). Preliminary survey of ground waters on Zangiata (Yangiyul) part of Chirchik river valley for water supply Yangiyul city» 7 Klimova L.V., Nagevich P.P., Podrugin A.F. (1974). Detailed Survey of Yangiyul Report II- Yangiyul GGP

19
Table 4.1. Flow Measurements of Production Wells in Wellfield VU-1
Well number Date m3/hr l/s m3/d
18э, 19э, 20э, 21э, 22э, 24э, 25э, 26э 15.01.2014 1,588 441 38,112
18э, 19э, 20э, 21э, 22э, 24э, 26э 04.02.2014 1,400 389 33,600
18э, 19э, 20э, 21э, 22э, 24э, 26э 16.02.2014 1,385 384 33,240 18э, 19э, 20э, 21э, 22э, 24э, 26э 25.02.2014 1,382 384 33,168 18э, 19э, 20э, 21э, 22э, 24э, 26э 20.03.2014 1,404 390 33,696 15э,18э, 19э, 20э, 21э, 22э, 24э, 25э, 26э 15.04.2014 1,535 426 36,840 14э, 21э, 22э, 24э, 26э 01.05.2014 969 269 23,256 14э, 21э, 22э, 25э, 26э 19.05.2014 1,039 288 24,936 14э, 21э, 22э, 25э, 26э 02.06.2014 1,063 295 25,512 14э, 21э, 22э, 25э, 26э 30.06.2014 1,112 308 26,688 14э, 21э, 22э, 25э, 26э 10.07.2014 1,132 314 27,168 14э, 21э, 22э, 25э, 26э 10.08.2014 1,076 299 25,824 14э, 21э, 22э, 25э, 26э 29.08.2014 1,133 314 27,192 14э, 21э, 22э, 25э, 26э 24.09.2014 1,146 318 27,504 19э, 20э, 21э, 24э, 26э 11.11.2014 1,120 311 26,880 19э, 20э, 21э, 24э, 26э 17.11.2014 1,201 334 28,824 19э, 20э, 21э, 22э, 24э, 26э 05.12.2014 1,378 383 33,072
Source: Hydrogeological Survey.
74. At the same occasion the dry residue tested as representative of total dissolved solids in the groundwater was in the range 0.37 to 0.6 g/l with maximum of 0.7 g/l.
75. The immediate sanitary protection perimeter (Zone I) of VU-1 has been established according to the requirements of КМК 2.04.02.97. The distribution equipment includes two 2,000 m3 concrete and two 2,000 m3 steel reservoirs and a 2nd lift pumping station composed of 3 centrifugal pumps 320/90/75 kW and 3 units 1250/65/320 kW and chlorination plant. From the second lift pumping station groundwater is boosted to WDC VU-3 via the existing 14.7 km, 1,000 mm transmission main.
76. From pumping tests carried out during the commissioning phase in 22 out of 29 wells completed, the yield of the wells was comprised between 45 to 68 l/s with most wells exceeding a capacity of 50 l/s.
77. Long term monitoring of the groundwater level indicates seasonal fluctuations between 0.54 to 2.1 m, the highest changes in level being observed in of influence by the pumping wells.
78. Tests of conducted during a monitoring period after construction show that the mineralization of the groundwater in some production was in the range of 0,39 to 0,47 thus indicating that no deterioration of the dissolved mineral content in the ground water can be expected for the long range.
4.4.2 Re-Assessment of the Long-Term Yield of the VU-1 Wellfield
79. Additional hydrogeological investigations were carried out between 2011 and 2015 by the reorganized II-Niyazbash Survey with the purpose to carry out a re-assessment of the groundwater reserves in the quaternary depositions of Niyazbash – Chirchik quaternary sediments in view of updating estimations of economically exploitable grounwater for the supply of Yangiyul and Kuyichirchik districts, due to expiration of date of concession of abstraction of groundwater from the groundwater intake facility VU-1.
80. The investigations confirmed that the alluvial aquifer is mainly recharged from the chirchik River, which is regulated by the Charwak dam and reservoir and a cascade of smaller barrages downstream to the main dam. During the survey eight production wells were found in good working conditions (Table 4.2). The operational discharge of all wells was in the range 50 to 62.2 l/s.

20
Table 4.2. Confirmed Yield of Some Wells in Wellfield VU-1 (2011-2015)
Well No. m3/day l/sec
18э 4,704 54.4 19э 4,920 56.9 20э 4,320 50 21э 3,936 45.5 22э 5,136 59.4 24э 5,376 62.2 25э 5,280 61.4 26э 4,440 51.4
81. Based on single and multiple pumping tests in the existing wells the surveyor report8 assessed at 117,820 m3/d the available groundwater reserves which can be mobilized annually from the wellfield VU-1, with additional reserves estimated at up to 25,900 m3/d.
8 Provided as Annex 3 to the main report.

21
5 ASSESSMENT OF THE EXISTING WATER SUPPLY INFRASTRUCTURE SERVICES WITHIN THE PROJECT AREA
5.1 Brief Assessment of Overall Water Supply in Yangiyul and Chinaz
5.1.1 Sources of Water Supply
82. The failure of the first transmission main to convey water supply to the most distant distribution areas in Yangiyul and Chinaz has obliged planners to revert to alternative solutions and develop supplementary water resources from wellfields such as: VU-1, and others. Settlements located significantly away also from these alternative sources had to remedy with local wells often producing groundwater with relatively high dissolved solids content. In broad terms residents in large part of Yangiyul and Chinaz rely on the following water sources:
i. Groundwater from main wellfields: VU-1; ii. Small local groundwater wellfields and single wells; iii. Other, such as: tankered water, irrigation canals, private wells.
83. More specific information on the diversity of sources of water utilized by local inhabitants for domestic needs is provided further under Annex 4 to main report.
84. Practically all operational pumping facilities need substantial rehabilitation and replacements. Buildings and other types of pump station shelters are in poor conditions. Many chlorination facilities are out of order; chlorination is practiced manually, which exposes operators to serious risks.
Table 5.1. Pumping Facilities Data
Off-take WDC System Source of water Commissioned Status
Yangiyul district 2nd lift VU-1 From VU-1 1982 Operational. Poor condition WDC Chinor From VU-1 1984 Operational. Poor condition WDC Boz Suv From VU-1 Obsolete WDC Khalkhabad From VU-1 Before 1983 Operational. Poor condition
Chinaz district WDC Eshonabad Obsolete WDC Sutbulak 1984 Obsolete WDC Madaniyat Local well 1985 Not operated. Poor conditions WDC Yangiyabad No Water 1985 Obsolete WDC Kutarma Obsolete WDC Yallama Local well 1984 Works - 1 well. Poor conditions WDC Chinaz At Wellfield 1962 In activity. Poor consitions
5.1.2 Yangiyul District
85. The Project area covers 45% of the population of Yangiyul district where there are some or no current coverage. The following review presents the existing water supply systems of Yangiyul district but outside the project area
86. Yangiyul Suvokova, now transformed into a TPS district branch was constituted on 27 April 2007. In 2013 the Suvokova had a total number of 20,986 customers of which 15,537 in the Yangiyul city and 5,449 in extra urban areas. Within the areas serviced by the Yangiyul Suvokova, 60.6% of the population were connected to a centralized water supply. 13.4% of the remaining population used alternative sources of water supply, generally from shallow wells and surface watercourses. 26% of the population relies for its supply on water imported from outside the District.

22
Figure 5.1. Existing Water Supply System in Yangiyul District
87. Yangiyul town and other settlements within the district rely for their water supply exclusively on groundwater from the following wellfields:
• wellfield VU-1 as described above;
• Central Yangiyul wellfield;
• Niyozbosh Wellfield and pumping station;
• Gulbachor wellfield and pumping;
• Nov wellfield & pumping station, and
• number of wells scattered within the rayon for the supply of villages or makhalla.
88. Part of the groundwater developed from the wellfield VU-1 is boosted via WDC VU-3 via the existing regional transmission main, thus supplying settlements in Yangiyul via the existing WDCs Boz Suv and Khalkabad down to the village Bobur in Yangiyul district.
89. The Niyozbosh wellfield was commissioned in 1968 and had a design capacity of 60,500 m3/d produced by 13, 90 m deep production wells. In 2013 there were 11 functioning wells and the production is reduced to some 21,700 m3/d. The remaining components of the pumping station are:
• one 2,000 m3 and one 3,000 m3 reservoirs;
• a 2nd lift pumping station with two, 320-90 pumps;
• a DN 1000 mm, 6.5 km feeder pipe to Yangiyul.
90. The wellfield and pumping equipment needs substantial rehabilitation works.
91. The Gulbahor wellfield was commissioned in 1976 and consisted of 7 production wells with a design capacity of 18,400 m3/d. Currently 5 wells are functioning and the production capacity is reduced to 6,900 m3/d. The remaining equipment is constituted by:
• 4 km DN 500 feeder pipe;
• chlorination unit.

23
92. Substantial works for the rehabilitation of both structural and electromechanical components of the wellfield and the pumping equipment.
93. The Central wellfield was commissioned in 1958 with 6 production wells of which 4 are currently in operating conditions. The design production capacity was 19,200 m3/d is now reduced to 4,600 m3/d. There is a chlorination equipment. Substantial rehabilitation works are needed in this wellfield, with particular concern to the electromechanical equipment, including replacement of the submersible pumps.
94. The Nou wellfield was commissioned in 1960. There are five, 60 m deep production wells, one 500 m3 reservoir and one II lift pumping station with two, 500-90 pumps. Significant rehabilitation works including replacement of submersible and II lift pumps, reconstruction of a 500 m3 reservoir, replacement of electric system and control are needed.
95. Note: The wellfields described above produce groundwater for the supply of Yangiyul and surrounding settlements which are not included under the STPWSDP.
96. In the project area within the Yangiyul district there are some 20 other groundwater production units, often constituted by a single well. It is estimated that 70% of the pumping equipment needs to be replaced.
5.1.3 Chinaz District
97. The Project area covers 83% the population of Chinaz where there are some or no current coverage. The following review presents the existing water supply systems of Yangiyul district but outside the project area
98. The TPS Chinaz branch was established on 5 April 2006. In 2014 it had a total number of 6,832 customers of which 4,220 within the city of Chinaz and 2,612 customers in extra-urban settlements.
99. The main distribution system in Chinaz district was constructed in the 1970’s and 1980’s. It consists of 304.5 km of distribution pipework of which at least 50% need to be replaced. The 19.5 km of existing regional transmission main within the district are obsolete and need full replacement.
Figure 5.2. Existing Water Supply System in Chinaz District
100. The main sources of water supply for the settlements within the Chinaz District consist of the following main components:

24
• a groundwater wellfield “Olmazor” commissioned in 1977 with 5 production wells of which 2 in operation an producing 3,500 m3/d; there is also a 2nd stage pump station equipped with 3 pumps which was initially boosting water up to settlements in the North of the district via a 400 mm feeder line and the WDC Eshonabad and Sutbulak, now abandoned; there is no chlorination equipment; at the present stage the water from the wellfield is boosted alternatively up to Sutchilar, via the existing DN 400 main and to Dustlik center;
• a groundwater well field Chinaz, South of Chinaz city, commissioned in 1962 with 5 production wells but only 3 in service, which is the main source of water supply to the Chinaz district center;
• a groundwater wellfield in Yangi Chinaz commissioned in 1977 with two 180 m deep production wells having a reported capacity of 860 m3/d, also supplying Chinaz center;
• a number of other small wellfields particularly in the eastern part of the Rayon area.
101. At the present stage:
• the terminal branches of the regional transmission main have been out of service for more than 20 years and it may be reasonably assumed that at this stage their conditions might be seriously deteriorated and probably, beyond repairs;
• the 400 mm distribution main from the Boz Suv dispatching center is also not operational since many years;
• three wells are being operated at the Dustlik wellfield on an average 5 hours daily for the alternate service of three centers: Sutchilar, PGT Almazar and PGT Dustlik.
102. It is reported that the groundwater from wellfields Chinaz and Yangi Chinaz is characterized by relatively high dissolved solid content. It is similarly reported that other wells produce groundwater characterized by high dissolved mineral content.
5.1.4 The Existing VU-1 to Chinaz Transmission Main
103. The transmission main was commissioned in 1984. It has a total length of 65 km from the wellfield VU-1 to the endpoint at Yallama, in the Chinaz district.
104. At the present stage only segments of the original transmission main is still in operation over a cumulated length of 27 km. There are no flowmeters along the segments of transmission main maintained in operation nor at any of the off takes and local dispatching pumping stations.
105. One first 16.9 km Dian 1000 mm segment conveys water of the wellfield VU-1 from WDC VU-3 up to Tukimachi in Zangiota.
106. A fourth 10.1 km, Dia 1000 mm segment of main conveys water of wellfield VU-1 from WDC VU-3 to Bobur in Yangiyul.
107. The remaining 33.8 Km of the existing main from Bobur to Yallama in Chinaz district is obsolete.

25
Figure 5.3. Schematic Display Showing the Functioning of the Existing Regional Transmission Main
5.1.5 The Distribution System
108. Distribution to settlements was, and still partly is, is secured by a system of primary and secondary distribution pipework fed from the WDCs or directly from the transmission main. The majority of the villages within the project area and which are potentially being included in the Project has an internal water distribution system.
109. Within the project area there are several thousand km of distribution pipe network, mostly in poor conditions. The asset inventory at the provincial Suvokova and at the district branches is generally incomplete and barely computerized. Some information on water pipework was obtained from the provincial Suvokova branches. The records, summarized in Annex 3, are rather incomplete but can provide an image of material and age of the pipeworks.
110. Most of the pipelines were laid down in the years 1968 to 1978. The percentage of pipelines older than 30 years is 85% in Chinaz and 66.2% in Yangiyul (Table 5.2). The majority of the pipework in of ductile Iron (70.7%). Installation of Polyethylene (PE) pipes has begun in 2006 but most of the PE pipes has been installed in very recent years. It is noticed that there is still 1.4% of pipework in asbestos cement (AC), while the share of the cast iron (CI) pipes is 7% of the reviewed pipework.
Table 5.2. Age and Material of Water Pipelines in the Project Area
Service Years Cast Iron (CI) Ductile Iron
(DI) Asbestos
Cement (AC) Polyethylene
(PE) Totals
Total 16.0 160.5 3.2 47.4 227.1
<30 years 0% 0 47.4 47.4 <30 years % 0% 0% 0% 100% 21%
30-40 years 2.7 34.4 3.2 0 40.3 30-40 years % 17% 21% 100% 0% 18%
>40 year (km) 13.3 126.1 0 139.4 >40 year (%) 83% 79% 0% 0% 61%
5.2 Water Service and Consumption
5.2.1 Service Coverage
111. Based on interviews and reports from TPS and district Branches, piped service under TPS varies from 48% in Chinaz to 64.6% in Yangiyul district.

26
Table 5.3. Water Supply Service Coverage per District
District Service
coverage % Residential
metered % commercial
/budget
Yangiyul 64.6 10% 100% Chinaz 48% 10% 100%
Source: FMA
Table 5.4. Main Sources of Water Supply for the Settlements
Settlements Population
01.01.18
Water Supply
Network
Ground Water Well
Other source (specify)
Yangiyul District
Umid 2,500 yes no tankered water Dustlik 2,245 yes no tankered water Galaba 3,682 yes no supply from trunk main Yangi Makhalla 513 yes no supply from trunk main Markaz 2,996 no no tankered water Shuralisoy 2,011 yes yes tankered water Okhunboboev 1,985 no no tankered water Hakikat 3,015 yes yes tankered water Bobur 2,385 yes no supply from trunk main Marifat 391 no no supply from trunk main Kanalbuyi 182 yes no supply from trunk main Vatan 2,263 yes no supply from trunk main Mirishkor 2,390 yes no supply from trunk main Khalkobod 4,355 yes no supply from trunk main Olmazor 3,880 yes no supply from trunk main Nihol 2,669 yes no supply from trunk main Nurobod 1,985 yes no supply from trunk main Keskan 3,845 yes no supply from trunk main Registonr 3,260 yes no supply from trunk main Turkis 393 yes no supply from trunk main Kaksha 380 yes no supply from trunk main Yangiobod 607 no no tankered water Kushtepa 2,799 yes no from vu-1 Changtepa 3,160 yes no from vu-1 Khonkurgon 4,617 yes no from vu-1 Kengkechik 2,392 yes no from vu-1 Mustakillik 2,220 yes no from vu-1 Tuyabugiz 2,610 yes no from vu-1 Yuksalish 3,023 yes no from vu-1 Uzbekiston 3,018 yes no from vu-1 Galaba 287 yes no from vu-1 Said Ota 2,140 no no
Mirzaboboev 2,011 yes yes tankered Chamanzor 2 610 yes no from vu-1 Koratepa 3 246 yes no from vu-1 Urtaovul 19 399 yes no from vu-1 Bogzor 3 066 yes no from vu-1 Ankhor 5 325 yes no from vu-1 Chinor 2 393 yes no from vu-1 Dehkonobod 1 655 yes no from vu-1 Madainyat (Botir) 2 065 yes no from vu-1
Subtotal Yangiyul 115,681 Chinaz District
Chinoz city 27,526 yes yes chinaz wellfield Birlik urbanized village 2,900 yes yes
A.Temur urbanized village 5,104 yes yes
Kir urbanized village 2,750 yes no

27
Settlements Population
01.01.18
Water Supply
Network
Ground Water Well
Other source (specify)
Uzbekiston urbanized village
2,814 yes no tankered water
Galaba 524 yes no tankered water Ittifok 436 yes no tankered water Dustlik 372 yes no tankered water Kanalobod 1287 yes no tankered water S.Rakhimov 911 yes no tankered water Sutbulok 1,919 yes no tankered water A.Khudoybergenov 1, 704 yes no tankered water Gayrat 3,385 no no tankered water Abzalobod 2,905 no no tankered water Olmos 2,012 no no tankered water Mevazor 1,924 yes yes tankered water Okhunboboev 2,950 no no tankered water Arhcazor 475 no no tankered water Tillaobod 1,640 yes yes
Safarobod 1009 yes no
Uchkun 1,600 no no tankered water Madaniyat 2,570 yes yes tankered water Norkuzieva 1,104 no no tankered water Yangiobod 3,223 yes yes tankered water Kakhramon 2,800 no no tankered water Islomobod 3,215 no no tankered water Birlik/ 1,602 no no tankered water Kutarma 2,623 yes no tankered water Kerdara 900 yes yes tankered water Guliston 2,391 yes no supply from chinaz city Ochamayli 2,069 yes yes Yollama 2,378 yes yes Dehkonobod 2,976 yes yes Erkin 1,700 yes yes Chinmasjid 2,925 yes yes S.Ayniy 1,650 no no tankered water Uzumzor 1,815 yes yes tankered water Samarkand 2,676 yes yes tankered water
Subtotal Chinaz 104,764
112. Within the two districts there are 32,703 registered water customers, of which 31,389 domestic, 110 budget organizations and 1,204 commercial or other type of enterprises. It is noted that sewerage service coverage is rather limited in Chinaz.
Table 5.5. Water and Sewerage Customers of TPS in the Project Districts
Customers Drinking
Water Sewerage
Yangiyul district «Suvokova»
Households 26,557 11,489
Budget organizations 86 45
Other enterprises and organizations 882 369
Subtotal Yangiyul 27,525 11,903
Chinoz district «Suvokova»
Households 4,832 -
Budget organizations 24 -
Other enterprises and organizations 322 -
Subtotal Chinaz 5,178 -
Total households 31,389 11,489
Total budget organizations 120 45
Total other enterprises and organizations 1,204 369
Source: Tashkent Province Suvokova (01.01.2018)

28
113. From the project social economic survey (400 HH): 47% of households (HH) surveyed in the Project area have access to a service of piped water supply (44% in rural settlements, 71%-in urban settlements). However, the service is irregular and on a schedule basis. Therefore, practically all households have to rely, from time to time, on alternative sources of water for drinking and domestic purposes, mostly from water vendors (36%), from standpipes (26%), hand-pumped wells 23%) and bottled water (48%), . Access to piped water is very limited in the Yangiyul and in Chinaz districts, where most of the people rely on alternative sources of water for their supply. 26% of people interviewed in Yangiyul derive their potable water from hand-pumped boreholes. In the surveyed area of Chinaz district almost 48% of households have to use water from local water bodies as the main source of water for drinking and cooking. On the other hand it is to be noted that the quality of the delivered water is affected by the condition of reservoirs and cisterns; these latter are in cases rusty or dirty, and often poorly maintained or cleaned.
114. In most households (54%) in the project area the responsibility of carrying water lies with women and children. This share increases in poor households. Based on a regular working day of 8 hours, the average labor input of the households on carrying water is 2.75 person days a month: 3.12 person days in Yangiyul district and 2,6person day in Chinaz district, Water production based on sales
115. From sales of water and wastewater reports relative to 2015 in Table 5.6. Non accounted (or non-revenue) water as high as 35% to 39% indicate that there is significant ground for improving water distribution performance in the service areas under Yangiyul and Zangiota district Suvokova branches.
5.2.2 Water Production Based on Sales
116. From sales of water and wastewater reports relative to 2015 in Table 5.6. Non accounted (or non-revenue) water as high as 35% to 39% indicate that there is significant ground for improving water distribution performance in the service areas under Yangiyul and Zangiota district Suvokova branches.
Table 5.6. Water and Wastewater Production Based on Sales, 2017 in m3
Category
Yangiyul Zangiota
Water supply
Waste-water
Water supply
Waste-water
Production 9,720,600 6,787,900
Water supplied to the network 9,720,600 6,787,900
Water Losses 3,402,200 2,643,900
Water losses in % of water supplied 35.0% 39.0%
Consumption
Domestic metered 577,600 223,000
Domestic non metered 5,149,100 2,858,000
Institutional buildings - Budget organizations
378,600 192,800 546,000 200,000 Enterprises 213,100 1,269,900 517,000 60,000 Total Domestic 5,726,700 991,300 3,081,000 180,000
Total 6,318,400 2,454,000 4,144,000 440,000 Wastewater collection efficiency 38.8% 10.6%
Source: TPS annual financial report – 2017
5.2.3 Water Consumption
117. Reportedly 100% of commercial and budget customers are metered while metering of residential connections is limited to 10 to 15%. In the absence of records on effective water use of metered consumers estimates of per capita consumption of water have been carried out on the basis of data on water production deducted on pump characteristics and operation duration and from VU-1 in Section 4 hereafter, and considering the current population living within the areas supplied from the mentioned headworks.
118. In the settlements included in service area served from VU-1 the average use of water is estimated at 149 litres per capita and per day (lcd).

29
Table 5.7. Estimated Domestic Water Consumption Based on Headworks Production
Service Area
Average Production in 2017 from VU-1 29,736 m3
Settlements Population
Yangiyul district 33 73,560
Chinaz district 38 92,556
Overall consumption (lcd) 149
119. Actually, in the absence of significant water metering coverage, district Suvokovas are obliged to assume water consumptions adjusted in order to meet budget requirements. Daily consumptions per capita most frequently applied by the TPS provincial branches are resumed in Table 5.8.
Table 5.8. Per Capita Water Consumption in lcd Applied According to Norms
District Min Max Most
frequent Average
Chinaz 50 250 100-150 130 Yangiyul 50 200 150-200 158
Source: TPS district branch reports
120. From the socio-economic and ability-to-pay survey, the overall average water consumption estimated out of the survey data is 13,3 liters per capita and per day. This is 8 to 10 times less than the “normed” per capita consumptions adopted by the suvokovas to establish annual water tariffs. Reportedly piped water is used by 36% of the households to water their garden, and by 64% for their cattle.
Table 5.9. Daily Consumption of Water for Drinking and Domestic Purposes, by Water Source Type
Average consumption per capita a day, liters
Households using the water
source, %
Total Poor Non-poor Yangiyul Chinaz
Water pipeline at home or in the yard
23% 13,3 8,3 15,0 13,3 13,3
Hand-pumped borehole at home or in yard
25,0 20,0 26,7 20,0 28,3 20,0
Water vendors 36% 1,5 2,2 1,5 1,2 1,7
Bottled water and private purification points
48% 2,1 0,4 0,6 0,7 3,1
Source: Household survey, 2018
121. Comparing data form Tables 5.7 and 5.8 with these in Table 5.9 there are strong evidences that, in spite of a scheduled, irregular service of water supply there is over production of drinking water in comparison with effective use of water, particularly in rural areas. Productions are 10 to 20 folds effective water consumptions which are however very low to extremely low. Excess production is either: i) lost as physical losses through failing pipeworks most of which have exceeded their useful live, or ii) misused for watering private gardens and crops in summer time.
122. In terms of consumption composition, piped water makes up 47% of overall household water consumption; another 36% of the amount of water consumed by the households is delivered by water vendors. The water consumption breakdown by water source types reveals limited access of households to centralized piped water in Chinaz district, at 41% of overall water consumption, and in Yangiyul district at 55%. As for Yangiyul district, a fifth (26%) of water the population used is hand-pumped from shallow boreholes.

30
Table 5.10. Weighted Average Structure of Consumption of Water for Drinking and Domestic Purposes, by Water Source Type
in % households Households
using the water source, %
Poor Non-poor Yangiyul Chinaz
Water pipeline at home or in the yard
47% 40% 48% 55% 41%
Hand-pumped borehole at home or in yard
17% 27% 15% 26% 11%
Water vendor 36% 33% 36% 18% 48%
Open sources 0% 0% 0% 1% 0%
Bottled water and private purification points
0% 0% 0% 0% 0%
5.2.4 Level of Service
123. A project limited social economic survey was conducted during the month of January 2018. Feedback and responses from participants of the 400 households randomly selected from the total 37,500 household in the project 79 settlements (about 10 households from each) were analyzed in the following sections. Although the results from the project survey provided with reasonable baseline indicative data for social economic analyses it may not accurately reflecting the existing physical network coverage as compared to that of actual engineering records of the water supply systems in the surveyed areas. In addition, the results (limited to 400 households) were unevenly distributed as the population varies significantly between settlements, from as low as less than 40 HH to more than 4,000 HH. Therefore, there may be some discrepancies between social economic survey results and technical engineering records with respects to the current physical conditions of the existing water supply coverage in the project area.
124. Based on the PSA report, 50% of the surveyed households reported having water in the pipe for at least a few hours a day within a week preceding the survey. Daily regularity of piped water supply is more a privilege of households in towns and urban type villages: on average, water was in the pipe 5 days a week there. Typically, however, in a day with water supply the service was estimated to last 11 hours, nearly 50% of time; the daily duration of supply in separate dwellings and is 6.6 hours in multi-storey apartments. Only 18% of interviewees affirmed having had continuous water supply during the week before the survey.
Table 5.11. Indicators of Water Supply Service Level
Indicator
Water was not supplied within a week before the
survey, %
Water was supplied everyday
within a week before the survey,
%
The average number of days a week when water
was supplied
Total 5,1% 50,5% 5
Private detached house 5,5% 50,3% 5
Apartment 0,0% 66,7% 6
Yangiyul district 3,2% 14,1% 4
Chinaz district 6,7% 32,6% 6
Urban 8,6% 85,7% 7
Rural 4,3% 42,9% 5

31
Table 5.12. Regularity of Piped Water Supply in Hours % Households Able to Assess Water Supply Regularity
The average number of
hours a day when the water was supplied
The water was supplied under 6 hours
a day throughout a
week, %
The water was supplied over 6
hours a day throughout a
week, %
The water was supplied
constantly throughout a
week, %
Total 11 60% 22% 18%
Private detached house 11 60% 22% 18%
Apartment 11 67% 0% 33%
Yangiyul district 12 63% 24% 13%
Chinaz district 11 57% 20% 23%
Urban 16 40% 3% 57%
Rural 11 64% 26% 10% Source: Household survey, 2018.
125. Breakdowns are very frequent. Sometimes locals have to wait for 5-6 days before repairs are completed. In such cases it is necessary to organize water delivery for the population. 60% of the surveyed households reported having water in the pipe for less than 6 hours within a week before the survey commenced Moreover, water pressure is generally very low. Preventive information of service cut-off is very scarce.
126. Nevertheless, grievances are not frequent, while response to reports of failure is extremely limited. Nearly 10% of the respondents officially submitted the complaints to Suvokova.
127. As a result, 94% of households make up reserves with piped water. 4% of the households store water in glass jars, bottles; 33% - in buckets, pots, canisters; 48% - in barrels; 6% - in Iron or plastic tanks; 2% - in concrete reservoirs. The average stock is about 200 liters, i.e. 20 buckets of water. The average cost of all water tanks per HH is UZS 0.1 million. 2% of the surveyed households have a khauze of concrete reservoirs from 3-5 m³ (all are closed with lids or hatches) the cost of these water tanks depend on its volume, which average range from UZS 1 million up to UZS 2 million in current prices
5.2.5 Quality of Water Supply
128. Surface water. According to data of Uzhydromet the surface flow of water was monitored during the whole year (Table 5.13) at the Gazalkent and Chinaz stations. The Gazalkent water monitoring station is located above Tashkent city (before project site) and Chinaz station just below Chinaz city. Maximum flow volumes were recorded during October – March period and minimal volumes were recorded during May – July (sometimes August).
Table 5.13 Average Monthly Flow of Chirchik River at Gazalkent and Chinaz Stations
Years Months
Average annual
I II III IV V VI VII VIII IX X XI XII
Chirchik river – Gazalkent station
2011 215 163 179 71 157 159 224 251 103 101 128 126 156
2012 175 106 107 82 173 233 269 242 107 96 80 92 147
2013 130 178 188 193 286 358 323 251 174 125 114 146 205
2014 130 147 118 134 328 513 396 276 182 150 147 140 221
2015 174 168 150 191 356 459 349 278 170 163 171 182 234
2016 197 132 169 158 366 552 425 304 180 178 183 147 249
2017 188 178 156 335 586 704 497 298 190 172 186 155 304
Chirchik river – Chinaz station
2011 98,6 90,7 126 48,3 9,72 12,5 12,5 21,5 42,6 45,8 119 164 65,9
2012 135 125 82 48,4 60,1 28,4 87,5 21,2 41,8 49,4 62,0 103 91,6
2013 85,2 55,0 59,4 32,9 13,0 73,3 14,6 11,5 28,2 37,4 44,9 92,8 45,7
2014 81.4 147 101 51.1 49.5 136 55.3 21.0 48.1 58.7 68.0 95.0 76
2015 69.0 93.8 90.0 41.4 76.2 101 13.3 20.3 37.9 69.2 146 130 74

32
Years Months
Average annual
I II III IV V VI VII VIII IX X XI XII
Chirchik river – Gazalkent station
2016 111 78.5 39.5 50.1 183 281 94.9 60.0 37.0 67.3 60.6 104 97
2017 130 174 63.5 299 391 509 181 19.9 44.6 57.3 50 86.3 167
Source: Uzhydromet, 2018
129. Total mineralization of water in the Chirchik river during the period of observations varied in the range 0.4-0.6 g/l, total hardness - 5,7-9,0 meq/l. The maximum values recorded in May and lowest in July. In most samples, values of salinity and hardness in the samples are respectively 0.5 g/l and 5.2 meq/l, pH -7-8. Water includes hydrocarbonate-sulphate sodium-calcium-magnesium (or magnesium-calcium).
130. Analysis showed that water quality in water course close to WDC “Kutarma” exceeds norms. For the WDCs “Uzumzor” and “Yangiobod” water quality complies with standards.
Table 5.14. Water Quality in Water Courses Near to Construction Sites
Component
Yangiyul district
Chinaz district Standards
Uzumzor Yangiobod Kutarma
Suspended matter, mg/l
31 56 15 shall not be increased by more than 75 mg/l
pH 7.66 7,65 8.05 6,5-8,5
BOD5 3.04 0.99 3 3
COD mg/l 4.98 6.23 12.5 15
Hardness mgecv/l 6.9 7.8 18.5 3-7
Dry residual, mg/l 455 700 1505 1000
Cl- 17.4 28.5 33.6 350
SO2-4 209 326 839 500
NH4+ 0.31 0.61 0.47 2
NO-2 0.019 0.036 0.017 3,3
NO3- 0.91 1.31 2.17 45
Oil products n/a n/a n/a 0,3
Source: PPTA’s consultant, Baseline survey, February 2018
131. Ground water. According to hydrogeological zoning the project a completely belongs to the Near Tashkent Artesian Basin. Explored sites are considered as part of deposit of drinking water source of current Chirchik river valley. The Chirchik deposit of ground waters is developed within the lower I-II terrace of the river as well as III above the flood plain terrace. Ground waters are confined to the alluvial gravel of quaternary age.
132. The main source of supply of ground waters of the aquifer is areal infiltration of irrigation waters from irrigated lands and groundwater inflow from the upper sections of the Chirchik. Ground waters are fresh. Mineralization level is mainly up to 0,6 g/l; total hardness up to 7,0 meq/L. Type: mostly sulphate-bicarbonate-calcium-magnesium.
133. Due to frequent change of the section by gravels conglomerates, more rarely by loam the aquifer contains sub-confined groundwaters, piezometric level of which is determined on the level of 1,2-4,7 m below the surface.
134. Analysis of main indicators of quality have been carried out in samples of groundwater collected from major wellfields as a part of the hydrogeological investigations carried out during May 2016 under this Feasibility Study. Detailed results are provided in Annex 3 to the main report. Main data are summarized in Table 5.15.
135. The water samples were collected by specialized operators at the water collectors, before chlorination. For wellfields with more than one well in operation the water sample was sampled at the collector main.

33
136. In general terms there are no specific action or anion concentrations in excess. However it is noticed that the dry residue, commonly referred to as an indicator of total dissolved solids in water, is b\very high, exceeding 2 grams per liter, in wells in the Almazor wellfield. Dry residue content is also high in the sampled well in Chinaz wellfield, thus confirming the reports of local consumers about the excess dissolved salt content of drinking water from this wellfield. Excess dissolved solids content was also detected in groundwater from wellfields Ittifok and Maktab.

34
Table 5.15 Water Quality Indicators of Groundwater from Main Wellfields
District Wellfield Date Date of pH Dry residue HCO3 Cl SO4 NO3 Ca Mg Na K NH4
Sampling Analysis mg/l mg/l mg/l mg/l mg/l mg/l mg/l mg/l mg/l mg/l
Yangiyul Gulbakhor 7.3 384 293 25 62 10 70 27 28 2 0.2 Yangiyul Gulbakhor 5/12/2016 5/16/2016 7 392 287 25 66 12 78 23 25 0.2 Yangiyul Nov (test I) 5/12/2016 5/16/2016 6.8 574 342 23 156 27 80 52 37 2 0.2 Yangiyul Nov (test II) 7.1 568 345 21 156 27 80 52 37 2 0.2 Yangiyul Niyozbosh (test I) 7.2 334 244 21 58 10 72 18 19 2 0.1 Yangiyul Niyozbosh (test II) 7.1 328 244 19 57 10 70 18 20 1 0.1 Yangiyul Centranlny 1 5/16/2016 5/19/2016 6.9 412 354 35 149 6 98 43 35 2 0.2 Yangiyul Centranlny 2 5/16/2016 5/19/2016 7.1 566 354 35 150 6 96 44 36 2 0.2 Yangiyul Sokhibkor 5/16/2016 5/19/2016 7.2 410 256 14 118 3 98 19 13 2 0.1 Yangiyul Uzbekistan station 5/18/2016 5/19/2016 7.2 444 293 14 120 10 78 35 23 2 <0.1 Yangiyul 55 passing place 5/23/2016 5/25/2016 7.6 214 140 7 52 3 18 10 44 1 <0.1 Chinaz Chinoz, well-4 7.4 1650 250 160 844 18 200 152 90 3 <01 Chinaz Chinoz, Well 7 5/12/2016 5/16/2016 7.1 962 281 106 392 12 126 91 66 2 0.2 Chinaz Almazar (test I) 5/12/2016 5/16/2016 6.8 2474 171 97 1527 18 270 194 186 3 <01 Chinaz Almazar (test II) 6.8 2512 171 89 1531 18 310 188 193 3 <01 Chinaz Yangi Chinoz 7.4 844 342 46 332 6 86 57 111 3 <01 Chinaz Pakhta 5/12/2016 5/16/2016 7.6 280 146 14 87 3 32 15 42 1 <01 Chinaz Amir Timur 5/18/2016 5/19/2016 7.8 224 146 11 53 12 11 53 1 <0.1 Chinaz Yallama 5/18/2016 5/19/2016 7 612 366 39 167 3 66 46 80 2 0.2 Chinaz Chinmasjid 5/20/2016 5/23/2016 6.7 550 305 28 177 2 58 40 75 2 <0.1 Kuyi Chirchik VU-1 5/16/2016 5/19/2016 6.8 416 311 21 88 86 27 22 2 0.2 Kuyi Chirchik VU-2 5/16/2016 5/19/2016 6.9 412 311 23 81 90 23 23 2 0.2

35
137. The map representing the zonation of dry residue in groundwater displayed in Figure 5.4 has been established on the basis of analysis carried out during the hydrogeological survey. It is seen that dissolved mineralization in groundwater increases significantly progressing eastward, away from the Chirchik Rife floodplain where, the groundwater circulating in the alluvial aquifer is characterized by dry residue concentration between 300 and 500 mg/l. Groundwater with dry residue content in the similar range is identified also in an area included between Amir Timur, Pakhta and 55 Passing Place. Nevertheless, the aquifer in is area is characterized by low hydraulic coefficient (permeability); this means that wells drilled in this area would yield relatively smaller amount of water with higher drawdowns, thus requiring relatively higher operation costs per unit volume of water produced.
138. Analysis of heavy metals have been carried out in a groundwater sample take from the collector main at the wellfield VU-1. Results displayed in Table 5.16 indicates that the groundwater from VU-1 does not represent a threat for human health and can to be used as source for drinking water.
Table 5.16. Heavy Metals in Groundwater from Wellfield VU-1
Element Concentration (mg/l) Max perm. Concentration (mg/l)
Uranium 0,0052
Thorium 0,000011
Hg 0,000000021 0,00050,1 Al 0,0018 0,2 As 0,0011 0,05 Be 0,000015 0,0002 Mo 0,0019 0,25 Mn 0,0099 0,1 Pb 0,000014 0,03 Ni 0,0016 0,1 Se 0,00061 0,01 Cu 0,00025 1,0 Zn 0,0017 3,0 Cd 0,00002 0,001 Sr 0,52 7,0
Source: State Organization «GIDROINGEO Institute. Order № 96 (2016)

36
Figure 5.4. Zonation of Total Solid Levels in Groundwater

37
5.2.6 Waterborne Disease-Related Data
139. Records of diseases typically related to insufficient water supply and sanitation over the period 2006 to 2015 from the Sanitary and Epidemiological Services (SES) of the Ministry of Health (MOH) are displayed in Annex 3. The time-dependent graphics in Figures 5.5 to 5.7 reveal some increasing trends of some indicators, the acute intestinal disease in particular, however not systematically in all districts.
Figure 5.5. Trends of Acute Intestinal Disease (cases/100,000)
Figure 5.6. Trends of Viral Hepatitis (cases/100,000)
0
100
200
300
400
500
600
700
800
2005 2006 2007 2008 2009 2010 2011 2012 2013 2014 2015 2016
Viral hepatitis type A/Вирусный гепатит А
Kibray Zangiyota Yangiyul Chinaz

38
Figure 5.7. Trends of Tuberculosis (cases/100,000)
140. Based on the Project social-economic survey (400 households), 75% of the surveyed households of the Project quality of piped water is acceptable. However, in 77% of households boiled water, 32% settled the water, while 1% of households filtered water through filters and chemicals.
141. Most participants reported that water from boreholes is unsuitable for watering garden and cattle as it is if bad quality. As far as the water from the vendors is concerned, it is too costly to be used for any other purposes besides drinking.
Table 5.17. Level of Satisfaction of Households with Quality of Piped Water
Districts Unsafe water Safe water
Yangiyul 38% 62%
Chinaz 16% 84%
Average in all districts: 25% 75% Source: Household survey, 2018.
Table 5.18. Households Perception on Tap Water Quality (%)
% Households Using Piped Water
Districts Saline, hard Dirty, opaque,
rusty
Algae, microorganisms,
larvae
Yangiyul 52 39 9
Urban 0 0 0
Rural 52 39 9
Chinaz 48 34 18
Urban 30 45 25
Rural 67 22 11
On average in all districts
50 38 12
Urban HHs 30 45 25
Rural HHs 55 35 10 Source: Household survey, 2018.
142. Regarding piped water supply; only 25% of the respondents believe that tap water is unsafe; the rest 81% say they drink tap water without any previous treatment. For a great many families the drinking of raw water is a norm. Children are at highest risk as they drink water from all possible water sources without any treatment beforehand
143. Irregularity of water supply along with the poor quality of water meeting very few sanitary standards lead to a rise in diseases incidence. 17% of the surveyed households use water out of boreholes located not far from pit latrines from which leachates from excrements
0
20
40
60
80
100
120
140
160
180
200
2005 2006 2007 2008 2009 2010 2011 2012 2013 2014 2015 2016
Tuberculosis/Туберкулез
Kibray Zangiyota Yangiyul Chinaz

39
infiltrate into groundwater. 4% of households said that in the past year there were a few cases of diarhea among adults and children: not rarely did diarrhea hit several members of a household. Residents of multi-apartment buildings where functional water pipe networks provide people with extremely irregular water supply were found to be the most exposed to risk of intestinal disease. Poor households are also at a greater risk of having transmissible intestinal diseases than the non-poor ones.
144. It is important to recommend to consider women as the most interested and active target groups under training and information dissemination programs.
5.2.7 Water Tariffs
145. Traditionally, water tariffs are subject to periodic review (usually twice yearly) and are adjusted according to changes in operating costs and allowing for asset amortisation and an acceptable profit. All tariffs for water supply and sanitation services are required to be approved by the Provincial Department of Finance and agreed with the Ministry of Finance (MoF).
146. The DCM 306 of 30 October 20159, instructs a “Phased introduction of common tariffs for services of water supply and sanitation in the region, under the context of constituting a single "Suvokova" in each Province”.
147. In Tashkent Province, domestic (household) tariffs are charged on a fixed and variable basis, depending on whether a household has voluntarily elected to install a meter or not. Fixed tariffs, applied to households without meters, range from UZ$ 2,100/capita/month to UZ$ 9,440/capita/month depending on whether wastewater services are also provided, and whether households have bathtubs10. Variable tariffs for households are currently set at UZ$ 350/m3 for water supply and UZ$ 240/m3 for wastewater services, and charged on a consumption basis. Currently, throughout the province it is reported that about 55 percent of households have fixed tariffs and 45 percent variable. Although lifeline tariffs are not provided, certain disadvantaged groups are reportedly assisted with additional pension support towards water supply and wastewater provision11. Commercial tariffs are set at the higher rates of UZS 1,000/m3 for water supply and UZS 550/m3 for wastewater services, although a wastewater concessionary rate of UZS 440/m3 is applied to social institutions, including hospitals.
148. Table 5.19 summarizes tariffs for various consumers in the four districts included in the project, both prior to and following the recent tariff increases and a harmonised rate for Tashkent province (1-Jan-2016). Tariffs have increased for all customers.
Table 5.19. Tariffs for WSS Applied by TPS in the Project Area (Phase 1 & 2)
District Service
01/08/2017 Effective 1/02/2018 % increase
Do
mes
-tic
Social
Institut-
ions
Com
merc
ial
Dome
s-tic
Social
Institut
ions
Com
merci
al
Dom
es-
tic
Social
Institut
ions
Com
merc
ial
Kibray,
Yangiyul,
Zangiota,
Chinaz
Water 410 1250 1250 430 1500 1500 5% 17% 17%
Sewage 295 540 540 310 570 720 5% 5% 25%
149. The following is from the risk analysis in the FMA
150. Current tariffs are not sufficient to cover operations, maintenance, and capital expenditures at the sector level. This affects the effectiveness, efficiency, and sustainability of the delivery of WSS services and TPS capacity for repayment of the ADB loan.
9. Decree of the cabinet of ministers of the Republic of Uzbekistan No.306, 30 October 2015 about measures on implementation of main directions of development of WSS enterprises and entrusts the Ministry of Finances, the State Committee for privatization, demonopolization and development of competition, UCSA, Council of Ministers of Karakalpakstan, and provincial hokimiyats «Suvokova» with responsibility for implementation 10. Domestic tariffs include the following three price bands: (i) UZ$ 2,100/capita/month for water supply (only), (ii) UZ$ 7,800/capita/month for water supply and wastewater services, and (iii) UZ$ 9,440/capita/month for water supply and wastewater services, and where a household has a bathtub. 11. These groups include Afghan war survivors and survivors from the Chernobyl disaster.

40
151. Sector tariff policies need rationalization for improved cost recovery. Current tariffs are not sufficient to cover operations, maintenance, and capital expenditures at the sector level. This affects the effectiveness, efficiency, and sustainability of the delivery of services in the three sectors.
152. From the social household survey-PSA report. Based on estimates in the PSA made taking into account direct expenses incurred for by householders for obtaining drinking water from different sources as well as incidental expenses such as for constructions of reservoirs, repairs etc, each household spend some UZS 57,000 (UZS 10,000 / person) per month for water supply. A noticeable 100% of people spends money for water supply. The household water-related expenses including those for water disinfection and reservoirs for households were estimated at 3% of the overall average household expenditure (4% for poor, and 3% for non-poor households) which remains below the classic threshold of 4% indicated by the World Bank and still accepted as a level of reference for household affordability for water supply. In the water spending composition pattern, piped water accounts for 55% on average, 41% for trucked water, 61% for bottled water and 41% for water from standpipe.
5.3 Overall Assessment for the Project Area
153. The existing section of regional water supply trunk mains from Groundwater Wellfield VU-1 to Chinaz city center is only functional from GW VU-1 to WT Yangiobod (about 27km) but required rehabilitation while the segment from WT Yangiobod to Chinaz city center (about 38 km) has been obsolete for the last 25 years. Other works associated with trunk mains including pressure towers, WDCs, reservoirs, distribution mains and network, due to such prolonged nonoperational and nonattendance of maintenance period, also became obsolete and required total reconstruction.
154. In general, more than 80% of project 220,000 population currently have no access to piped water supply and must rely on unsafe water sources such as open drain ditches, shallow wells, ponds, and irrigational canals. The remaining 20% of the project population receive irregular water services such as, 51% rely on trucked water; 19% on piped water but at less than 3 hours per day; and about 30% on alternative water sources.
155. According to the project survey, about 17% of the households use unsafe groundwater out of shallow wells or boreholes located not far from pit latrines from which excrements infiltrate into groundwater. More than 50% of the households in the project area in Yangiyul reported to have no water for bathing and personal hygiene during the cold weather season.
156. The lack of safe water supply leads to a rise in water borne diseases illness in the project area. According to the data of the Ministry of Health of the Republic of Uzbekistan water-related diseases are the most common type of infectious diseases in project area. Dysentery, viral hepatitis and acute intestinal disease account for more than half of the incidence rates of the various infectious diseases. A high incidence of hepatitis A (more than 204 cases) was reported in Yangiyul district among children under 14 years. Children under 14 years and women are most vulnerable to all waterborne diseases. Women in the project area often suffered from infectious diseases (nearly 50% of registered cases among adult population). Between 2016 and 2017 acute intestinal infections among children under 14 years of age increased from 253 per 1000 population to 364 per 1000 population in Yangiyul district, and from 82 per 1000 population to 93 per 1000 population in Chinaz district.
157. Key elements of the water supply system under the project area in Yangiyul and Chinaz districts required rehabilitation and new development are:
• New well pumps at Groundwater Wellfield VU-1 for additional capacity;
• New transmission trunk mains connecting from Groundwater Wellfield VU-1 to Chinaz city center;
• New and rehabilitated water service mains connecting from trunk mains to Water Distribution Centers (WDC) in the project 79 settlements;
• New water distribution network connecting from WDCs to 37,500 households; and

41
• Other new or rehabilitated associated works such as, pressure towers, reservoirs, administrative buildings, warehouse, laboratories, water meters, and household wastewater systems.
158. Key elements in institutional capacity strengthening for water supply service improvements are:
• Tariff billing and collection of payments (i.e. utility does not issue paper bills, nor has other channels for conveying billing information to customers);
• Public accountability and grievances systems (i.e. there are no public reporting arrangements.);
• Performance management system (i.e. there are no formal service zones established for each branch utility and/or for each of the networks.);
• Management Information Systems (MIS) (i.e. the basic Information and Communication Technologies (ICT) appear to be in place, although in a rather simple and underdeveloped format.);
• Asset management (i.e. there is no comprehensive schedule of O&M activities for preventive maintenance and service.);
• Operation and Maintenance Training (i.e. there are no O&M training center or plans for training public work operators); and
• Geographical Information System (GIS) with Supervisory control and Data Acquisition (SCADA) for controlling, analyzing and planning distribution networks (i.e. there is none existed.)

42
6 TECHNICAL ASSESSMENT OF WASTEWATER IN TASHKENT PROVINCE
6.1 General Overview
159. Tashkent Province, established in 1938, spans over 15,600 km2 of land with about 2,816,000 population is one of the largest and most developed industrial provinces in Uzbekistan. It is located in northeastern part of country, between the Tian Shan Mountain Ranges. There are 14 districts in the province - Akkurgan, Akhangaran, Bustonlik, Buka, Zangiota, Kibray, Kuyichirchik, Parkent, Piskent, Tashkent, Urtachirchik, Chinoz, Yukorichirchik, and Yangiyul; 6 cities – Angren, Olmalik, Bekabod, Chirchik, Akhangaran, and Yangiyul; and the rural area with 97 semi-urban town settlements and 885 villages.
Figure 6.1. Areas of Tashkent Province With the Need for Sewerage System Development
160. The province is located in a seismically active zone of northeastern part of Uzbekistan. There were very strong earthquakes in Tashkent in 1868 and 1966. The northern and northeastern part of the province is occupied by the Chatkol mountain ranges - Kurama,

43
Pskent, and Ugam peaks. The highest points of the province are the Adelunga summit (4301 m) and Beshtor peak (4229 m) of the Pskem ranges. The substantial parts of the province in the south and southwest are foothill flatlands (400-600 m above sea level).
161. The climate is land-lock continental. The winter is cold and the summer is hot and dry. The period from April to May is warm. The average temperature in July is 27C and in January the temperature falls to -1C. In July and August there might be sharp fluctuations of temperature reaching 43C.
162. The Sirdarya is the main river. There are two tributaries - Chirchik and Akhangaran - joining the river. Akhangaran is a relatively calm river in summer, but it is unpredictable in spring with river bank erosion and flooding. Both of these rivers start in the foothills of the western Tian Shan Mountains.
163. Agriculture in Tashkent Province is well developed and includes cotton, wheat, grapes, potatoes and grain cultivation, rice and fruits, horticulture, poultry and cattle farming, and silkworm breeding.
164. Livestock farming is well developed in the mountains, half desert and desert areas of the province. The valleys are planted with oaks, wild grapes, pistachios, and peanut trees.
165. The total length of the railroad network is 354,2 km. Automobile roads are 6,600 km long with about 5,900 km of asphalt paved.
166. With convenient location on the crossroads of trade routes, ideal climate and high concentration of population has made the Tashkent Province as one of the main industrial centers of the country. The province has the most developed industry in the country. Industry in Tashkent Province includes metallurgy, machinery, power production, chemical, textile, and food industries. All of the heavy metallurgy industry and a major part of the non-ferrous metallurgy enterprises are located here. Machinery, chemical, food and construction material industries are well developed, the Bekobod metallurgical plant, the Olmalyk mining and smelting plant, the Chirchik chemical plant, and the Yangiyul biochemical plant, Yangiyul oil refinery plant are some of leading industries in the province.
167. The province is very rich in natural resources. There are large deposits of coal, molybdenum, zinc, gold, silver, copper and other rare metals. Large deposits of mineral and thermal water are also found in the province.
168. Most of the cities of Tashkent province have encircled the capital of the country, Tashkent City. One of such major cities is Chirchik. It is located 32 km away from Tashkent to the northeast. It is one of major centers of chemical, machinery and electricity industry of Uzbekistan.
169. The city of Yangiyul, about 30 km to the southwest of Tashkent City, is a city with advanced agriculture. Uzbekistan 's largest candy factory is located in this city. A winery, oil and canning factories are among the leading industries in the city. The cities of Angren, Olmalyk, and Akhangaran are located to the east of Tashkent City, in the valley of Akhangaran. Those are typical industrial cities built next to coal deposits, non-ferrous metals, and construction materials.
170. The Tashkent province has a well-developed cultural and educational network. There are specialized research institutes such as the Scientific Research Institute for Gardening, Winery, and Cotton Selection, the Seed Developing Institute, the Central Asian Scientific Research Institute of the Silkworm Breeding, etc.
171. There are about 250 state enterprises, 45 joint ventures and 2,632 small and 328 cooperative enterprises operating in the province.
172. There are 894 general schools, gymnasiums, lyceum, specialized musical, and sporting schools. More than 800 mass libraries, 3 theaters, 10 clubs, 212 movie theaters, and 6 museums operate in the province. Also, there are 141 healthcare establishments and sanatoriums, as well as 8 rest homes.

44
6.2 Institutional Overview of Wastewater Services
173. Tashkent Province Suvokova (TPS) is responsible for 14 districts and 6 cities of provincial subordination, which report to the provincial authorities in the same way as districts. There are additional 10 towns in the province, which are part of the districts. All cities and towns have wastewater infrastructure, which for the most part is old, dilapidated, marginally operational, and covers only part of cities/towns.
174. The six cities of provincial importance have relatively larger sewage networks and facilities, which are summarized in the table below. The cities’ sewage infrastructures are aged and in urgent need for upgrade, modernization and expansion, with the coverage ratio from 48% in Yangiyul to 80% in Chirchik.
Table 6.1. Overview of the Urban Wastewater Infrastructure
Angren Akhangaran Chirchik Olmalyk Bekabad Yangiyul
Coverage (%) 33% 52% 76% 51% 50% 30%
Year built 1950 1959 1960 1984 1963 1972
Network length 221 km 78.9 km 221 km 131.3 km 35.6 km 61 km
175. The overall wastewater service coverage in the province is about 16%, including urban and rural sewage network as outlined below.
Table 6.2. Overview of Wastewater Infrastructure
In the Province With Centralized Sewage
Cities and towns 16 16
Town type villages 97 13
Villages 885 22
176. Wastewater services are handled in conjunction with water supply services, with virtually no division in functional units between water supply and wastewater services. Designate wastewater facilities, such as treatment plans and pumping stations have dedicated personnel. Furthermore, cities and districts with substantial wastewater operations have a single officer dedicated to wastewater operations. Management, accounting, billing and collection, investments, operations and maintenance, and other functional units of TPS and its branches at district and city levels have water supply and wastewater services managed concurrently. Even repair and maintenance crews for water supply and wastewater services are common.
177. TPS has 5 laboratories in the cities, which monitor quality of wastewater effluents. TPS laboratories conduct measurements on the daily base. Laboratories are not fully staffed, number of staff in the laboratories changes from 3 to 6 which is not efficient to implement proper work.
178. The Resolution of Cabinet Ministries of Uzbekistan #11 dated from 2010 (with amendments from 2017) states that laboratories of water supply and sewage enterprises have to implement monitoring of water discharged from industries and commercial entities. However, TPS can not implement monitoring of discharges in the points of where discharges from enterprises inflow into the sewage network due to lack of funds.
179. Primarily, wastewater operations are monitored by the State Sanitary and Epidemic Control Centers under the Ministry of Health and by the State Committee on Ecology and Environmental Protection (SCEEP). The SCEEP is implementing monitoring of water quality in the points of inflow into the sewage network in accordance with their own monitoring program. The committee also monitors water quality discharged from the waste water treatment plants. From time to time TPS is sanctioned by such SCEEP for non-compliances with regulatory norms and requirements relating to wastewater discharges.
180. Billing and collection for wastewater services is done based on drinking water supply volumes, either based on metered volumes or legally prescribed norms of consumption. Pursuant to the Presidential Decree No. UP-5059 “On Further Measures for Strengthening

45
Payment Discipline in Supply and Consumption of Electric Power and Natural Gas, and On Fundamental Reform of Collection Administration” dated 29 May 2017, the newly created Bureau of Enforcements under the General Prosecutor's Office is responsible for billing and collection for water supply and wastewater services.
181. In general, wastewater operations are somewhat neglected, with most of the managerial attention assigned to improving drinking water supply systems. Respectively, the institutional settings of wastewater operations are rudimentary and well short of operational requirements to be functional.
182. Similarly, TPS investment agenda is primarily focused on drinking water supply, although the new project on improving wastewater infrastructure in the six cities is currently under preparation. There seem to be no specific plans for improving rural water supply operations, despite the recent directive of the President of Uzbekistan to upgrade rural infrastructure on a priority basis. Enhanced dialogue on wastewater infrastructure and development prospects would be warranted. Specifically, it would be recommended:
(a) To strengthen institutional settings of wastewater operations by establishing a designate department at the provincial and district/city levels;
(b) To formulate optimal technical solution for rural wastewater operations, possibly involving public-private partnership arrangements;
(c) To intensify considerations for investment projects into upgrade and expansion of the urban wastewater infrastructure in the six cities of the province.
6.3 Overview of Physical Wastewater Infrastructure in Tashkent Province
183. Currently in Tashkent Province only major cities and urban centers have centralized wastewater collection systems and treatment facilities. Specifically, with the total population of 2,816,000 only about 586,000 are on sewers, about 14 % coverage, while the rest rely on HH decentralized systems, i.e. earth pits, pit latrines, or earth ditches. The total daily wastewater flow is estimated at 1.2 million m3/day which includes about 600 thousand m3/day of municipal domestic sewage. Table 6.3 below presents a summary of existing wastewater infrastructure in the province.

46
Table 6.3 Summary of Existing Wastewater Infrastructure in Tashkent Province
# Settlements
Population of cities and rural settlements
with sewerage system
Co
ve
rag
e, %
Design capacity
of treatment facilities,
1000 m3/day
Type of treatment facilities
Actually treated waste
waters, 1000
m3/day
Length of sewerage collectors
and networks
Including, km
total
connected to sewe-rage sys-
tem
collec-tors
need recons-truction
% Net-
works
need recons-truction
%
Total Tashkent province: 2816404 385788 13.7 448.6 254.4 1138 367 138 38 771 241 31
1 Angren city 178637 58868 33 118 0 46.2 258.2 56.8 0.0 0.0 201.3 33.0 16.4
2 Olmalik city 126526 63977 50.6 110 Aeration station
90 131.3 43.8 12.9 29.5 87.5 65.0 74.3
3 Bekabod city 91863 46033 50.1 60 Mechanical and biologic
19 36.9 23.6 16.6 70.3 13.3 10.0 74.8
4 Chirchik city 126502 96086 76 80 biological 75 221.4 51.2 10.3 20.0 170.2 37.2 21.9
5 Akhangaron city 39287 20638 52.5 0 0 0 78.9 44.0 7.2 16.4 34.9 10.5 30.1
6 Yangiyul city 60971 18210 29.9 76 biological 19 47.6 9.4 8.6 91.0 38.2 10.5 27.5
7 Nurafshon city 34277 1631 4.8 6 biological 3.2 11.3 10.3 4.6 44.7 1.0 0.3 30.0
8 Buka district 120097 0 0.0 0.0
9 Bustonlik dirstrict 163167 18300 11.2 0 0 0 71.1 48.4 42.2 87.3 22.7 12.6 55.5
10 Okhangaron district 91252 2150 2.4 0.6 biological 0.3 16.6 5.2 4.1 78.0 11.4 7.0 61.6
11 Okkurgon district 96883 0 0.0 0.0
12 Parkent district 147883 2970 2.1 0 0 0 19.9 16.0 6.1 37.9 3.9 2.7 67.9
13 Piskent district 96960 512 0.5 2 biological 0.5 4.5 3.0 3.0 100.0 1.5 1.5 100.0
14 Toshkent district 172933 9263 5.4 0 0 0 18.7 4.6 1.4 1.3 14.2 4.0 28.5
15 Zangiota district 212957 12789 6.0 0 0 0 50.8 13.6 2.8 0.8 37.2 10.9 29.3
16 Kibray district 213055 33510 15.6 0 0 0 121.2 2.4 0.8 90.0 118.7 33.4 28.1
17 Kuyichirchik district 103040 0.0 0.0
18 Urtachirchik district 138700 2425 1.7 6 biological 1.2 8.9 6.6 3.6 40.4 2.3 2.3 100.0
19 Yukorichirchik district 130728 1853 1.4 27.3 14.0 4.2 0.3 13.3 0.0 0.0
20 Chinoz district 127957 0.0 0.0
21 Yangiyul district 192029 5494 2.9 32.5 14.0 10.0 27.6 18.5 0.0

47
184. TPS provides services on waste water collection and discharge to the subscribers (families) and entities. Number of subscribers and entities within Tashkent province is provided in below table.
Table 6.4. Sewerage Customer Information in Tashkent Province
Name of city and district name
Number of people and subscribers connected to
waste water treatment system Legal Entities
People Number of customers
1 Angren city 58868 27224 850
2 Almalik city 63977 24921 709
3 Bekobod city 46033 13967 342
4 Chirchik city 96086 35217 1007
5 Nurafshon city 1631 452 6
6 Bekobod district 0 0 0
7 Akkurgan district 0 0 0
8 Akhangaran district 22788 9371 152
9 Bustonlik district 18300 7700 144
10 Buka district 0 0 0
11 Kibray district 9367 2981 88
12 Zangiota district 6129 1948 37
13 Parkent district 2970 606 29
14 Pskent district 0 0 0
15 Chinaz district 0 0 0
16 Quyichirchik district 0 0 0
17 Ortachirchik district 1631 687 4
18 Yukorichirchik district 3492 812 19
19 Yangiyul district 23713 10896 562
Total Tashkent Province 354,985 136,782 3,949
Source: Tashkent Province Suvokova (2017)
185. Tashkent Province Suvokova (TPS) provides water to 136,782 households and 3,949 entities. The total volume of drinking water supplied by TPS in 2017 was 8,022,196,6.7 m3. From them 62,697,225.5 m3 was supplied to population, 5,113,557.8 m3 to budget organization (hospitals, universities, school, government agencies and etc.) and 1,241,118,3.4 m3 to private sector and industries.
186. In the same TPS received 5,559,448,1.9 m3 total from all sectors. From them 25,408,559.4 m3 were effluents from population, 4,346.893.7 m3 from budget organization and 2,583,902,8.7 m3 – from others.
187. As shown in the Table 6.5, in some cases amount of sewage exceeds amount of supplied drinking water. It happens, when entities use own ground water wells and do not conclude agreement on water supply with TPS, but they agreement on disposal sewage.
Table 6.5. Volume of Drinking Water Supplied by TPS and Sewage Received
Name of branch
Type of water consumer/sewage
disposal
Drinking water supply, m3/day
Sewage, m3/day
Angren Suvokova
Population 6998784.0 3877254.0 Budget Organizations 444253.0 546987.0 Others 935404.0 2466980.0 Total 8378441.0 6891221.0

48
Name of branch
Type of water consumer/sewage
disposal
Drinking water supply, m3/day
Sewage, m3/day
Bekobod city Suvokova
Population 4714082.6 2613109.6 Budget Organizations 232725.6 334908.7 Others 496672.0 3370088.7 Total 5443480.2 6318107.0
Almalik Suvokova
Population 5953481.0 4157777.0 Budget Organizations 1191614.0 1033439.0 Others 4990445.0 6877580.0 Total 12135540.0 12068796.0
Chirchik Suvokova
Population 8683178.0 7741140.0 Budget Organizations 1586530.0 1466744.0 Others 2835719.0 6935260.0 Total 13105427.0 16143144.0
Ahanganran Suvokova
Population 3947660.0 1487399.0 Budget Organizations 207170.0 296813.0 Others 153016.0 2131336.0 Total 4307846.0 3915548.0
Akkurgan Suvokova
Population 599024.0 0.0 Budget Organizations 27767.0 0.0 Others 24314.0 0.0 Total 651105.0 0.0
Bekobod distrcit Suvokova
Population 593589.4 0.0 Budget Organizations 78900.5 0.0 Others 74627.4 0.0 Total 747117.3 0.0
Buka distrcit Suvokova
Population 776602.0 0.0 Budget Organizations 46071.0 0.0 Others 40527.0 0.0 Total 863200.0 0.0
Bostanlik Suvokova
Population 3184234.0 1001375.0 Budget Organizations 220437.0 211851.0 Others 1100932.0 816488.0 Total 4505603.0 2029714.0
Parkent Suvokova
Population 3287062.0 126148.0 Budget Organizations 39963.0 26410.0 Others 27993.0 45082.0 Total 3355018.0 197640.0
Pskent Suvokova
Population 1164193.2 0.0 Budget Organizations 100036.0 0.0 Others 39036.0 0.0 Total 1303265.2 0.0
Zangiota Suvokova
Population 1890855.5 291695.0 Budget Organizations 111010.1 104316.8 Others 172327.4 449169.0 Total 2174193.0 845180.8
Chinaz Suvokova
Population 1403015.0 0.0 Budget Organizations 53365.0 0.0 Others 40533.0 0.0 Total 1496913.0 0.0
Upper Chirchik Suvokova
Population 2140109.6 9957.3 Budget Organizations 36022.0 32125.0 Others 32180.0 40004.0 Total 2208311.6 82086.3 Population 1228237.7 339208.8

49
Name of branch
Type of water consumer/sewage
disposal
Drinking water supply, m3/day
Sewage, m3/day
Middle Chirchik Suvokova
Budget Organizations 25326.4 2362.9 Others 10487.6 0.0 Total 1264051.8 341571.7
Kibray Suokova
Population 7237919.0 1520831.0 Budget Organizations 305968.0 66183.0 Others 730246.0 123885.0 Total 8274133.0 1710899.0
Down Chirchik Suvokova
Population 511658.0 0.0 Budget Organizations 11412.0 0.0 Others 8986.0 0.0 Total 532056.0 0.0
Krasnogorsk Suvokova
Population 638743.0 111612.5 Budget Organizations 85535.0 77927.0 Others 76039.0 54102.0 Total 800317.0 243641.5
Yangiyul Suvokova
Population 7744797.4 2255884.5 Budget Organizations 326653.0 174237.0 Others 738097.0 2651072.0 Total 8809547.4 5081193.5
Total 8,022,196,6.7 5,559,448,1.9
Population 62,697,225.5 25,408,559.4
Budget Organizations 5,113,557.8 4,346.893.7
Others 1,241,118,3.4 2,583,902,8.7
6.4 Overview of Wastewater in the 6 Major Cities of Tashkent Province
6.4.1 Angren City
188. The city of Angren is located 114 km south of Tashkent and connected to it by a highway and a railway. Administratively, the city is located in Tashkent province and considered as the center of the province.
189. Angren, with a population of 179,000, is a developed industrial and cultural center.
190. The population of the city is employed mostly in coal mining industry.
191. Sewerage system of Angren receives wastewater from population, municipal facilities, public organizations as well as industrial and domestic wastewater of industrial enterprises.
192. Currently, centralized sewerage system of the city covers only condominium complexes of 2 floors and up. Individual houses of the city are not connected to sewerage system and rely on pit latrines or earth pits. The coverage level of the city with centralized sewerage services is 33%.

50
Figure 6.2. Sewerage System of Angren City
193. The existing sewerage system is incomplete-separate system which removes domestic wastewater from population and industrial enterprises. Rainwater and conditionally clean industrial wastewater are not received into the system.
194. Construction and operation of the city sewerage system started in 1950. Currently, total length of sewerage networks and collectors is 258 km.
195. Wastewater from residential buildings, municipal facilities and industrial enterprises are drained to existing collectors by gravity network system and collectors which transport wastewater to treatment facilities.
196. Three industrial areas exist in Angren city: Western, Central and Eastern. Some industrial enterprises discharge wastewater into existing urban sewerage networks. Some industrial enterprises (cardboard factory, oil depot) discharge preliminary treated wastewater into the city sewerage system.
197. Collected wastewaters are treated at the wastewater treatment plant of Angren city. Designed capacity of the treatment facility is 113 thousand m3/day. The treatment facility includes a full range of mechanical cleaning (screens, sand traps, primary sedimentation tanks), biological treatment (aeration tanks, secondary sedimentation tanks) followed by post-treatment at bio-ponds. Treated wastewater effluent is discharged in to Akhangaran river. Currently, the treatment facility needs reconstruction and replacement of equipment.
198. Another wastewater treatment plant of the village Chigirik was commissioned in 1976 with capacity of 3 thousand m3/day which currently requires reconstruction.
199. Wastewater treatment plant of the village Krasnogorsk was commissioned in 1976 with capacity of 5.0 thousand m3/day which currently requires reconstruction and replacement of equipment.

51
Figure 6.3. Layout of Waste Water Treatment Plant of Agnren City
6.4.2 Akhangaran City
200. Akhangaran city, with a population of 40,000, is located in Akhangaran river valley, on the right bank of the river. Akhangaran is an industrial city with a large railway hub. The city is mostly occupied by multi-storey buildings.
201. Akhangaran city has a centralized water supply system. The water supply system is necessary to ensure the drinking needs of population, schools and kindergartens, commercial and sports complexes, hospitals and food facilities as well as industrial enterprises located in the city.
202. The existing sewerage system is incomplete-separate system which removes domestic wastewater from population and industrial enterprises. Rainwater and conditionally clean industrial wastewater are not received into the system. Rainwater is discharged into irrigation system.
203. Construction and operation of the city sewerage system started in 1959. Currently, total length of the city sewerage networks and collectors is 78.9 km. Number of population covered by sewerage system is 20,046 (52.5 %). Thus, part of the city population uses pit latrines or earth pits.

52
Figure 6.4. Sewerage Systems Development Scheme of Akhangaran City
204. Major collectors and networks include Nurabad collector (d=800-1250 mm) passing along the river Akhangaran; collector from Cement plant (d=400-500 mm) along Navoi street; two sewerage networks (d=200 mm and 250 mm) at Halmuhamedov street; and sewerage network (d=200 mm) at Dobrolyubova street.
205. All existing multi-storey buildings are connected to the sewerage systems. Some but not all individual homes are connected to sewers.
206. Domestic-fecal sewage from population, public institutions, industrial effluents, industrial enterprises are received in to the sewerage system of the city.
207. Wastewater from houses, buildings, municipal and industrial facilities are drained to the Nurabad-Almalik gravity collector (d=800-1250 mm) which transports wastewater to treatment facility of Almalik city.
208. Collected wastewater is treated at wastewater treatment plant of Almalik city. Treatment facilities include a full range of mechanical and biological treatment. The treated effluent is discharged to Akhangaran river.
6.4.3 Chirchik City
209. Chirchik city, with a population of 152,000, is located is located at the crossing of Kibray, Bostanlik and Yukori-Chirchik district, about 32 km to the northeast from Tashkent, the capital of Uzbekistan.
210. Chirchik city ranks fourth place in the Tashkent province by its industrial development with main industries such as chemical, metallurgy, engineering and energy industries. In addition, further development of small and medium-size businesses is planned.
211. Construction and operation of the city sewerage system started in 1960. Currently, total length of sewerage networks and collectors is 221 km.

53
212. Sewerage system of Chirchik receives sewage from population, municipal facilities, public organizations as well as industrial and domestic waste waters of industrial enterprises.
213. Currently, centralized sewerage system of the city covers only condominium complexes of 2 floors and up. Individual houses of the city are not connected to sewerage system and rely on pit latrines or earth pits. Coverage level of population by the centralized water supply system is 100% and the sewerage system is 76%.
214. Currently, sewerage system of the city receives about 76 thousand m3/day of wastewater.
Figure 6.5. Chirchik City Sewerage Systems Development Layout
215. About 24% of population of the Chirchik city which is not connected to the sewerage network uses pit latrines and earth pits. The situation is complicated by high level of groundwaters which are polluted by infiltration from pit latrines and earth pits. Insufficient development of centralized sewerage system hinders development of industrial potential of the city, creates inconvenience for population and leads to environmental pollution. A major part of existing sewerage system of the city is in disrepair condition which creates potential environmental pollution issues. Main cause of such condition is expired service life of sewer pipes.
216. The existing sewerage system of the city is incomplete-separate system which removes waste water from population and industrial enterprises. Rainwater and conditionally clean industrial wastewater are not received into the system but discharged to irrigational systems.
217. Collected wastewater from houses, buildings. municipal facilities and industrial enterprises are drained to the existing main collector system by gravity networks and collectors which transport waste waters to treatment facility.

54
218. Industrial enterprises of the city discharge wastewater into existing urban networks. Some industrial enterprises (Maxam – Chirchik, UzKTZhM, CHTZ) have their local treatment facilities for pre-treatment.
219. Wastewater from neighboring region is also treated at wastewater treatment plant of Chirchik city. According to information Suvsoz water supply company of Chirchik city, the designed capacity of the treatment facility is 80 thousand m3/day. Actual flow of wastewaters is about 75 thousand of waste water.
220. The treatment facility includes a full range of mechanical cleaning (screens, sand traps, primary sedimentation tanks), biological treatment (aeration tanks, secondary sedimentation tanks) followed by post-treatment at bio-ponds. Treated wastewater effluent is discharged into the Chirchik river. Currently, the treatment facility needs reconstruction and replacement of equipment.
Figure 6.6. Chirchik Regional Sewerage Systems Layout
6.4.4 Almalik City
221. Almalik city, with a population of 127,000, is located in south-eastern part of Tashkent province on the left bank of Angren river. Almalik is the largest industrial center of Uzbekistan. Akhangaran city is located on the other side of the river which is combined with Almalik in to one city.
222. Almalik currently has a centralized sewerage system. Existing sewerage system of the city is incomplete-separate system which removes wastewater from population and industrial enterprises to the wastewater treatment facility (aeration station) located outside of the city. Rainwater and conditionally clean industrial water are not received into the sewerage system but discharged into irrigational system.

55
223. Construction and operation of the sewerage system in Almalik city started in 1950. Currently, total length of sewerage networks and collectors is 131.3 km.
Figure 6.7. Existing Sewerage Systems of Almalik City and Development Plan
224. The drainage of the city has a pronounced slope. All urban sewerage networks are by gravity. All existing multi-storey buildings are connected to the sewerage systems. Some but not all individual households are connected to sewers.
225. The existing WWTP is located on the western border of the city, on the territory of the farm enterprise “Kirgizobod” of Piskent district of Tashkent province. Aeration station has a complete complex system of biological treatment and post-treatment. The designed capacity of the station is 110 thnd. m3/day. The station covers an area of 32 hectares. The territory of the WWTP is fenced, greened and landscaped. Wastewater of Almalik, Akhangaran and Nurabad cities are treated at this treatment plant.
226. According to recent information obtained from local «Suvokova» water supply company actual collected wastewater is 13861 thousand m3/year (37,98 thousand m3/day) including from Akhangaran city – Nurabad city of 1 199,65 thousand m3/year (3,29 thousand m3/day). The aeration facility complex includes: screens building, sand trap, primary and secondary sedimentation tanks, aeration tanks, aerobic stabilizer, sludge beds, chlorination, air blowing station, boiling room, chemical and bacteriological laboratory. Additional biological treatment facility are natural biological ponds. Treated wastewater effluent is discharged into Tanachi-Buka channel located about 0,9 km from the aeration station which flows to irrigation channel Gendjikent.
227. Treatment facilities have been operating since 1984. The existing area of treatment facility is 42 hectares. Design capacity of the treatment facility is 100 thousand m3/day but not functional. Mechanical and complete biological wastewater treatment facilities, wastewater disinfection facilities, auxiliary buildings and facilities are located on the site of treatment facility. Currently, the facility cannot treat wastewater properly. Reconstruction and repair of treatment

56
facilities were not carried out due to lack of funds. All equipment is out of order. Biological treatment facilities are used for mechanical treatment. Facilities for sludge treatment are not working. Wastewater effluent discharged into the channel Tanachi-Buka is without disinfection after treatment.
228. Wastewater treatment facility of Almalik city is in extremely poor condition. Reconstruction of all buildings 56and facilities are required.
6.4.5 Bekabad City
229. The Bekabad city, with a population of 92,000, is located both banks of Sirdarya river – the main waterway of the district, in the southern part of Tashkent province, some 120 km from Tashkent city and on the border with Tajikistan which runs along the eastern and southern part of the city.
230. Construction and operation of the sewerage system of the city started in 1963. Currently, total length of sewerage networks and collectors is 36.9 km.
231. Sewerage system of Chirchik receives sewage from population, municipal facilities, public organizations as well as industrial and domestic waste waters of industrial enterprises.
232. Currently, centralized sewerage system of the city covers only condominium complexes of 2 floors and up. Individual houses of the city are not connected to sewerage system and rely on pit latrines or earth pits. According to local ‘Suvokova” company the coverage of the city with centralized sewerage services is 50%.
233. The existing sewerage system of the city is incomplete-separate system which removes waste water from population and industrial enterprises. Rainwater and conditionally clean industrial wastewater are not received into the system but discharged to irrigational system.
Figure 6.8. Sewerage Systems of Bekabad City

57
234. Collected wastewater is conveyed to gravity and pressure-gravity sewerage networks connected to the main influent pumping station located at the site of the wastewater treatment plant.
235. The main gravity collector of the city (d=800-1000 mm) passes through S. Rakhimov street to the main pumping station. There are four sewerage pumping stations in the city.
236. In 1964, land plots of 10 hectares and 9 hectares on the territories of the collective farm “Dalverzin” -2 and the collective farm “Communism” were allocated for construction of urban sewage treatment plants.
237. A biological wastewater treatment facility was built and commissioned in 1973. The daily design capacity of treatment facility in the first year of operation was 15.2 thousand m3. In 1974, the capacity of existing treatment facility was recalculated. In 1984, design and estimate documentation was developed for expansion and reconstruction of existing municipal sewerage treatment facility to increase the capacity up to 60 thousand m3/day. In 1987, the biological treatment facility was reconstructed and upgraded with new capacity of 60 thousand m3/day. Disinfection method is liquid chlorine with chlorine contact in contact reservoirs. Treated wastewater effluent is discharged into Sirdarya river.
238. The technical condition of the existing sewerage treatment facility is satisfactory. The volume of wastewater received at the treatment facility currently averages 19 thousand m3/day.
6.4.6 Yangiyul City
239. Yangiyul city is the administrative center of Yangiyul district, located in south-western part of Tashkent province, about 30 km from Tashkent, the capital of Uzbekistan, and is connected with the highways M-39 and M-34, high-speed railway “Tashkent-Samarkand”.
240. Yangiyul city currently has centralized sewerage system. Construction and operation of sewerage systems in Yangiyul district started since 1964. Total length of sewerage networks and collectors is 47.6 km. The percentage of the population coverage by sewerage system is 30%.
241. All existing multi-storey buildings are connected to the sewerage systems. Some but not all individual homes are connected to sewers. The non-coverage population has to rely on pit latrines or earth pits.
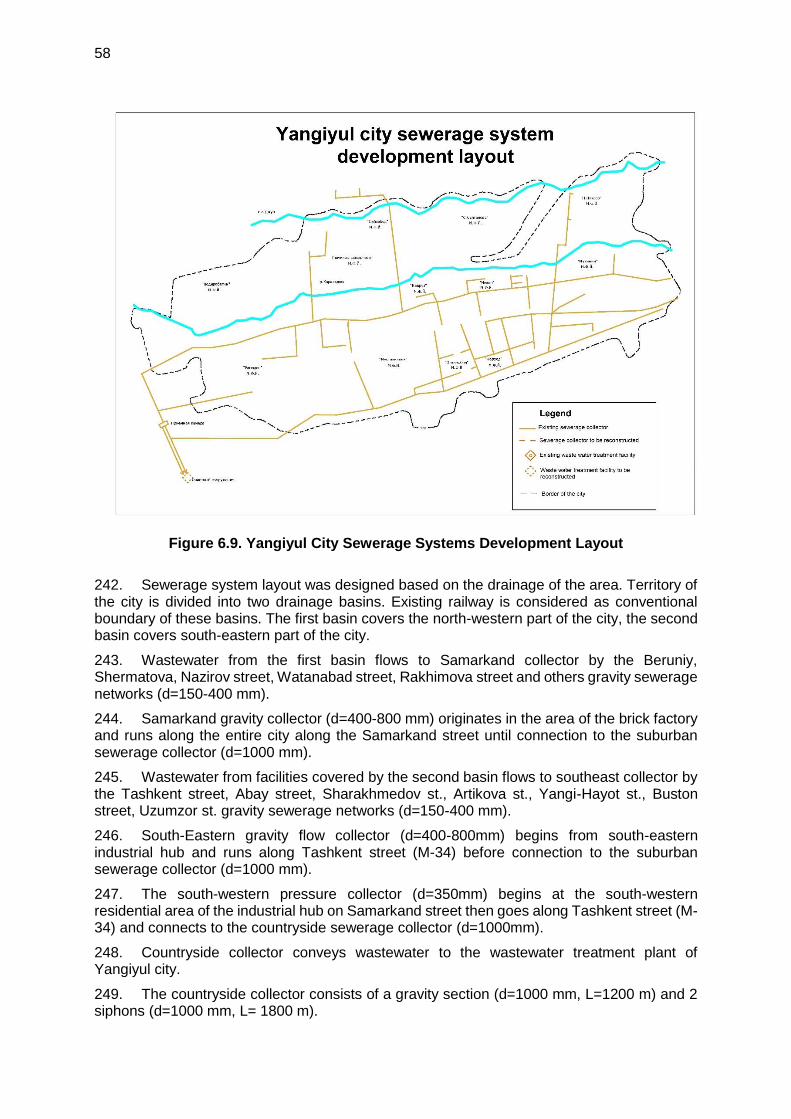
58
Figure 6.9. Yangiyul City Sewerage Systems Development Layout
242. Sewerage system layout was designed based on the drainage of the area. Territory of the city is divided into two drainage basins. Existing railway is considered as conventional boundary of these basins. The first basin covers the north-western part of the city, the second basin covers south-eastern part of the city.
243. Wastewater from the first basin flows to Samarkand collector by the Beruniy, Shermatova, Nazirov street, Watanabad street, Rakhimova street and others gravity sewerage networks (d=150-400 mm).
244. Samarkand gravity collector (d=400-800 mm) originates in the area of the brick factory and runs along the entire city along the Samarkand street until connection to the suburban sewerage collector (d=1000 mm).
245. Wastewater from facilities covered by the second basin flows to southeast collector by the Tashkent street, Abay street, Sharakhmedov st., Artikova st., Yangi-Hayot st., Buston street, Uzumzor st. gravity sewerage networks (d=150-400 mm).
246. South-Eastern gravity flow collector (d=400-800mm) begins from south-eastern industrial hub and runs along Tashkent street (M-34) before connection to the suburban sewerage collector (d=1000 mm).
247. The south-western pressure collector (d=350mm) begins at the south-western residential area of the industrial hub on Samarkand street then goes along Tashkent street (M-34) and connects to the countryside sewerage collector (d=1000mm).
248. Countryside collector conveys wastewater to the wastewater treatment plant of Yangiyul city.
249. The countryside collector consists of a gravity section (d=1000 mm, L=1200 m) and 2 siphons (d=1000 mm, L= 1800 m).

59
250. The wastewater treatment plant of Yangiyul city is located on the territory of the rural settlement “Yangi-Hayat». Area of the facility is 35 hectares. The treatment facility including full complex of mechanical and biological treatment was built in 1972 with a design capacity of 76 thousand m3/day.
251. Treated wastewater effluent is discharged into Kultugay collector by emergency channel. Treated wastewater effluent is disinfected primarily with chlorine lime.
252. This wastewater treatment facility has not been functioning since more than 10 years. It requires major rehabilitation or reconstruction.
6.5 Review of Wastewater in the 14 Districts of Tashkent Province
253. Town sewers only exist in urban centers of the 14 districts of Tashkent Province. Coverage is as low as zero in Buka district to about 16.3% in Bustonlik district. Most of existing sewers are old and required rehabilitation and upgrading.
6.5.1 Bustonlik District
254. Bustonlik district has a total population of 163,000. Only the district urban centers currently have centralized wastewater collection systems. The total length of existing sewage collectors and network is 71.1 km. There is no treatment facility. About 27,000 residents in urban centers are connected to town sewers while the rest of the population living in villages outside of urban centers rely on HH decentralized systems, i.e. earth pits, pit latrines, or earth ditches.
6.5.2 Akhangaron District
255. Akhangaron district has a total population of 91,000. Only the district urban centers currently have centralized wastewater collection systems. The total length of existing sewage collectors and network is 16.6 km. There is a biological wastewater treatment facility of 600m3/day capacity. About 2,150 residents in urban centers are connected to town sewers while the rest of the population living in villages outside of urban centers rely on HH decentralized systems, i.e. earth pits, pit latrines, or earth ditches.
6.5.3 Parkent District
256. Parkent district has a total population of 148,000. Only the district urban centers currently have centralized wastewater collection systems. The total length of existing sewage collectors and network is 19.9 km. There is no treatment facility. About 3,200 residents in urban centers are connected to town sewers while the rest of the population living in villages outside of urban centers rely on HH decentralized systems, i.e. earth pits, pit latrines, or earth ditches.
6.5.4 Piskent District
257. Piskent district has a total population of 97,000. Only the district urban centers currently have centralized wastewater collection systems. The total length of existing sewage collectors and network is 4.5 km. There is a biological wastewater treatment facility of 2,000m3/day capacity. Only 512 residents in urban centers are connected to town sewers while the rest of the population living in villages outside of urban centers rely on HH decentralized systems, i.e. earth pits, pit latrines, or earth ditches.
6.5.5 Tashkent District
258. Tashkent district has a total population of 173,000. Only the district urban centers currently have centralized wastewater collection systems. The total length of existing sewage collectors and network is 18.7 km. There is no treatment facility. About 9,300 residents in urban centers are connected to town sewers while the rest of the population living in villages outside of urban centers rely on HH decentralized systems, i.e. earth pits, pit latrines, or earth ditches.

60
6.5.6 Zangiota District
259. Zangiota district has a total population of 213,000. Only the district urban centers currently have centralized wastewater collection systems. The total length of existing sewage collectors and network is 50.8 km. There is no treatment facility. About 12,800 residents of urban centers are connected to town sewers while the rest of the population living in villages outside of urban centers rely on HH decentralized systems, i.e. earth pits, pit latrines, or earth ditches.
6.5.7 Kibray District
260. Kibray district has a total population of 213,000. Only the district urban centers currently have centralized wastewater collection systems. The total length of existing sewage collectors and network is 121.2 km. There is no treatment facility. About 33,500 residents of urban centers are connected to town sewers while the rest of the population living in villages outside of urban centers rely on HH decentralized systems, i.e. earth pits, pit latrines, or earth ditches.
6.5.8 Kuyichirchik District
261. Kuyichirchik district has a total population of 103,000. There are no existing sewage collectors, network and treatment facility. The entire population have to rely on HH decentralized systems, i.e. earth pits, pit latrines, or earth ditches.
6.5.9 Urtachirchik District
262. Urtachirchik district has a total population of 139,000. Only the district urban centers currently have centralized wastewater collection systems. The total length of existing sewage collectors and network is 8.9 km. There is a biological wastewater treatment facility of 6,000m3/day capacity. Only about 2,425 residents of urban centers are connected to town sewers while the rest of the population living in villages outside of urban centers rely on HH decentralized systems, i.e. earth pits, pit latrines, or earth ditches.
6.5.10 Yukorichirchik District
263. Yukorichirchik district has a total population of 131,000. Only the district urban centers currently have centralized wastewater collection systems. The total length of existing sewage collectors and network is 27.3 km. There is no treatment facility. Only about 1,900 residents of urban centers are connected to town sewers while the rest of the population living in villages outside of urban centers rely on HH decentralized systems, i.e. earth pits, pit latrines, or earth ditches.
6.5.11 Chinaz District
264. Chinaz district has a total population of 128,000. There are no existing sewage collectors, network and treatment facility. The entire population have to rely on HH decentralized systems, i.e. earth pits, pit latrines, or earth ditches. Only the district urban center currently has centralized wastewater collection systems. District center Chinaz has a total population of 27,000. The total length of existing sewage collectors and network is 3.6 km. There is no existing wastewater treatment facility in Chinaz. About 4,600 residents in urban center are connected to town sewers.
6.5.12 Yangiyul District
265. Yangiyul district has a total population of 192,000. Only the district urban centers currently have centralized wastewater collection systems. The total length of existing sewage collectors and network is 32.5 km. There is a biological wastewater treatment facility of 76,000m3/day capacity. About 16,500 residents in urban centers are connected to town sewers while the rest of the population living in villages outside of urban centers rely on HH decentralized systems, i.e. earth pits, pit latrines, or earth ditches.
6.5.13 Buka District
266. Buka district has a total population of 120,000. There are no existing sewage collectors, network and treatment facility. The entire population have to rely on HH decentralized

61
systems, i.e. earth pits, pit latrines, or earth ditches. Information about design and actual capacity of waste water treatment plants in Tashkent province and their effectiveness is presented in below table
6.6 General Characteristics of Wastewater in Tashkent Province
267. The five main characteristics of wastewater in Tashkent province are (1) toxicants, (2) pesticides, (3) bio-stimulants, (4) oxygen-consuming substances, and (5) bacteriological contaminants. Most the levels are found from average to high that without proper collections and treatments wastewater in the province is becoming a potential threat to the environment and public health.
6.6.1 Toxicants
268. Almost all municipal domestic sewage and industrial wastewater is to some degree toxic to surface water environment and aquatic life. Industrial wastewater in the province, especially in the metal and mining industries, is relatively toxicity at some low levels of heavy metals, substances such as phenols. Currently most of the industries must primarily treated their wastewater onsite before discharging into the urban sewerage systems.
6.6.2 Pesticides
269. Pesticides include a wide spectrum of toxic chemical substances used in the control of plant and animal pests. Insecticides, herbicides, fungicides, fumigants, and other types of biocides commonly are referred to as pesticides. Pesticides usually are classified as either chlorinated hydrocarbons, or phosphorothioates, depending upon the basic chemical composition. Both types of pesticides are complex organic molecules. The chlorinated hydrocarbons contain molecules of carbon, hydrogen, and chlorine atoms, while the phosphorothioates contain molecules of carbon, hydrogen, and phosphorus atoms (other types of atoms may be included in the molecule as well). Most pesticides, particularly the chlorinated hydrocarbons, are long-lived substances with a tendency for accumulation in bottom muds and progressive concentration in the biological food chain of aquatic organisms.
270. The major source of pesticides in the province usually is considered to be agricultural wastewater. Wastewater from municipal and industrial sources and runoff from urban areas also carries some traces of pesticides.
6.6.3 Bio-Stimulants
271. Bio-stimulants, or aquatic plant nutrients, commonly cause excessive algae growth in surface water bodies and rivers in the province. Compounds of nitrogen and phosphorus are aquatic plant nutrients.
272. Principal sources of plant nutrients are municipal and industrial wastewater discharges. Rain water runoff from urban, suburban, and rural areas also contributes significant amounts of nitrogen and phosphorus.
6.6.4 Oxygen-Consuming Substances
273. Large concentrations of unoxidized nitrogen (organic nitrogen and ammonia) in wastewater can represent a significant part of the total oxygen-consuming material present in the province municipal domestic sewage and industrial wastewater. Organic, oxygen-consuming substances are present in all municipal wastewater and, usually, in lesser concentrations, in industrial and agricultural wastewater and storm-water runoff.
274. Municipal and industrial wastewater having a high oxygen demand can cause dissolved-oxygen depression in receiving water. Zero or low dissolved oxygen levels, or large daily fluctuations in these levels can lead to many adverse effects including death of aquatic organisms, drastic changes in the types and numbers of indigenous aquatic organisms, obnoxious odors, and other nuisance conditions.

62
6.6.5 Bacteriological Contaminants
275. Disease-causing micro-organisms (pathogens) are potentially present in municipal wastewater and to a lesser extent in industrial and agricultural wastewater and storm-water runoff. Effluent from septic tanks, waste discharges from watercraft, and drainage from sanitary landfills also have relatively high potential for containing pathogens. The overall wastewater system coverage is only about 16% for the province. Thus, the majority of the population is still relying on pit latrines or earth pits which are principal source of pathogens. This is a serious threat to public health and hygiene.
276. Monitoring of water quality in the Chirchik river is being implemented by Uzhydromet in the monitoring posts located above Kibray district and after Chinaz district. The results of monitoring in two posts on the Chirchik river – Gazalkent (before Kibray district) and in Chinaz (after Chinaz district) showed deterioration of water quality on almost all indicators.
277. Specialised analytical laboratory under the State Committee on Ecology and Environmental Protection conducts monitoring of water quality in the point where enterprises including waste water treatment plants discharge effluents into the water bodies. The results of monitoring of water quality also shows exceeding maximum admissible concentration of pollutants into the river below WTTP.
278. For examples based on conducted analysis exceeding of admissible concentration from Angren WWTP was observed for phosphate in 11.5 times, nitrogen ammonia – 4.49 times, solid suspended – 1.78 times and etc.
279. For Bekabad WTTP the exceeding was as following: for nitrates – 1.8 times, for iron – 5.67 times, fluorides – 1.38 times.
280. For Yangiyul WTTP exceeding were for nitrogen ammonia in 10.2 times, COD – 1.5 times, solid suspended – 1.7 times.
Figure 6.10. Chirchik River Water Quality Comparison in Gazalkent and Chinaz Cities
7.1 7.5 6.75
23.3
45.436.5
0
20
40
60
2014 2015 2016
Suspended matter, mg/l
Gazalkent Chinaz
0
5
10
2014 2015 2016
Hardness, mg.ecq/l
Gazalkent Chinaz
201.2 191 165
648.6 603.6 647
0
500
1000
2014 2015 2016
Mineralization, mg/l
Gazalkent Chinaz
4.02 3.6 3.3
10.4 10.1712
0
5
10
15
2014 2015 2016
COD
Gazalkent Chinaz

63
6.7 Review of Wastewater Management within the Project Area
281. The Phase 2 Project covers 2 urban centers, 4 towns and 73 rural settlements in the districts of Yangiyul and Chinaz. The project settlements can be categorized into two groups, the urban and the rural. Domestic wastewater is managed differently for urban and rural with centralized and decentralized wastewater collection and treatment options.
282. Domestic wastewater is derived from bathrooms, kitchens, laundries and toilets. It includes human waste (containing pathogens), paper, soap, detergent residues and food scraps suspended in around 150 liters of wastewater generated daily for each person in a typical household in the project area. Urban wastewater is defined as the mixture of domestic and industrial wastewater and sewer infiltration water; whereas, rural HH wastewater is mostly domestic.
283. Urban centers in the project area currently have small-scale centralized wastewater collection systems (sewers) with primary treatment facilities (screenings and facultative lagoons). Due to frequent water supply shortage most of the existing systems are either under utilized or in poor O&M conditions.
284. Rural settlements currently have no centralized sewers and rely mostly on decentralized onsite HH wastewater disposal systems. About 95% of HH in rural settlements dispose of domestic wastewater using onsite systems, i.e. pit latrines, septic tanks, or other similar soil absorption methods.
285. The most common onsite HH wastewater disposal systems in the project rural area are simple earth pits, open ditches, and pit latrines.
0.030.01 0.015
0.03
0.11
0.046
0
0.05
0.1
0.15
2014 2015 2016
NH4 +
Gazalkent Chinaz
0.001 0.002 0.002
0.026
0.01
0.064
0
0.02
0.04
0.06
0.08
2014 2015 2016
NO2-
Gazalkent Chinaz
0.45 0.41
0.74
1.1
1.381.544
0
0.2
0.4
0.6
0.8
1
1.2
1.4
1.6
1.8
2014 2015 2016
NO3 -
Gazalkent Chinaz

64
286. Based on the social household survey, only 3.8% of the surveyed households, mostly residents of multi-apartment buildings, are connected to sewerage systems.
Table 6.6. Toilets in the Surveyed Households (by dwelling type) in % of Households
District Pit
latrines Waterproof
pit
To the yard, street
Local sewerage system
Central sewage system
Total in districts 86% 4% 7% 2% 1%
Urban 83% 2% 2% 7% 5%
Rural 86% 4% 8% 1% 0%
Yangiyul 87% 5% 5% 2% 1%
Urban 0% 0% 0% 0% 0%
Rural 87% 2% 5% 2% 1%
Chinaz 85% 3% 9% 2% 1%
Urban 84% 2% 2% 7% 5%
Rural 86% 3% 10% 1% 0% Source: Household survey, 2018
287. The overwhelming majority of the surveyed households use pit latrines. Only 4% of the toilets have waterproof pits. It is Chinaz district (93,5%) where such an unsafe type of toilets prevails Moreover, a number of households use water from shallow water boreholes which can be infiltrated with the waste water from the toilets, which creates a serious threat of the increased incidence of infectious and parasitic diseases.
Table 6.7. Toilets in the Surveyed Households, by Districts (% of households)
A flush toilet connected to a
functioning centralized sewerage
A flush toilet connected to
a local functioning sewerage
A concrete pit latrine in the
yard
A non-concrete pit latrine in the yard
The Project area 0,8% 1,4% 5,5% 92,3%
Yangiyul district (all rural)
0,6% 1,2% 7,6% 90,6%
Chinaz district 0,9% 1,7% 3,9% 93,5%
Urban 4,8% 7,1% 0,0% 88,1%
Rural 0% 0% 4,8% 94,7%
Source: Household survey, 2018

65
Figure 6.11. Existing Local Sewerage System for Multi Apartment Residential and Public Buildings
288. Table 6.8 below presents the existing type of wastewater systems in the 79 project settlements
Table 6.8. Existing Wastewater Disposal Systems
№ Yangiyul District Population Households Town Sewer
(Yes/No)
Earth Pits &
Pit Latrins
(Yes/No)
HH Septic Tank
(Yes/No)
1 Umid urban center 2 500 450 Yes Yes No
2 Dustlik 2 245 314 No Yes No
3 Galaba 3 395 611 No Yes No
4 Yangiobod 607 111 No Yes No
5 Markaz 2 996 549 No Yes No
6 Shuralisoy 2 011 369 No Yes No
7 Yangiyul (Ohunboboev)
1 985 279 No Yes No
8 Hakikat 3 015 424 No Yes No
9 Iftihor (Bobur) 2 385 342 No Yes No
10 Marifat 391 56 No Yes No
11 Vatan 2 263 325 No Yes No
12 Mirishkor 2 390 429 No Yes No
13 Halkobod 4 355 782 No Yes No
14 Olmazor (A.Ikramov) 3 880 696 No Yes No
15 Nihol (Navoi) 2 669 479 No Yes No
16 Nurobod 1 985 353 No Yes No
17 Keskan 3 845 685 No Yes No
18 Registon (Dangir) 3 260 580 No Yes No
19 Turkiz 393 70 No Yes No
20 Kaksha 380 68 No Yes No
21 Kushtepa 2 799 513 No Yes No
22 Changtepa 3 160 580 No Yes No

66
23 Honkurgon 4 617 814 No Yes No
24 Kengkechik 2 392 421 No Yes No
25 Mustakillik 2 220 400 No Yes No
26 Tuyabugiz 2 610 470 No Yes No
27 Yuksalish (Inogomov) 3 023 544 No Yes No
28 Uzbekiston 3 018 543 No Yes No
29 Said Ota 2 140 385 No Yes No
30 Mirzaboboev 2 011 354 No Yes No
31 Galaba 287 51 No Yes No
32 Kanalbuyi 182 31 No Yes No
33 Yangi Mahalla 513 88 No Yes No
34 Chamanzor 2 610 510 No Yes No
35 Koratepa 3 246 610 No Yes No
36 Urtaovul urban center 19 399 3 493 Yes No No
37 Bogzor 3 066 552 No Yes No
38 Ankhor 5 325 959 No Yes No
39 Chinor 2 393 429 No Yes No
40 Dehkonobod 1 655 297 No Yes No
41 Madainyat (Botir) 2 065 371 No Yes No
№ Chinaz District Population Households Town Sewer
(Yes/No)
Earth Pits &
Pit Latrins
(Yes/No)
HH Septic Tank
Systems (Yes/No)
1 Chinaz urban center 27 526 4 451 Yes
No No
2 Birlik urban center 2 900
476 Yes No No
3 Amir Temur urban center
5 104
975 Yes No No
4 Kir urban center 2 750
410 Yes No No
5 Uzbekiston 2 814
430 No Yes No
6 Galaba 524
80 No Yes No
7 Ittifok 436
67 No Yes No
8 Dustlik 372
57 No Yes No
9 Kanalobod 1 287
197 No Yes No
10 S.Rakhimov 911
146 No Yes No
11 Sutbulok 1 919
315 No Yes No
12 Hudayberganov (Tong Yulduzi)
1 704
280 No Yes No
13 Gayrat 3 385
542 No Yes No
14 Abzalobod 2 905
555 No Yes No
15 Olmos 2 012
384 No Yes No
16 Mevazor 1 924
368 No Yes No
17 Ohunboboev 2950
564 No Yes No
18 Archazor 475
91 No Yes No
19 Tillaobod 1 640
313 No Yes No
20 Safarobod 1 009
193 No Yes No
21 Uchkun 1 600
271 No Yes No
22 Madaniyat 2 570
435 No Yes No
23 Norkuziev 1 104
127 No Yes No
24 Yangiobod 3 223
372 No Yes No
25 Kahramon 2 800
448 No Yes No
26 Islomobod 3 215
546 No Yes No
27 Birlik 1 602
272 No Yes No
28 Kutarma 2 623
446 No Yes No
29 Kerdara 900 153 No Yes No
30 Guliston 2 391
406 No Yes No
31 Ochamayli 2 069
308 No Yes No

67
32 Yollama 2 378
354 No Yes No
33 Dehkonobod 2 976
444 No Yes No
34 Erkin 1 700
253 No Yes No
35 Chinmasjid 2 925
436 No Yes No
36 S.Ayniy 1 650
264 No Yes No
37 Uzumzor 1 815
300 No Yes No
38 Samarkand 2 676
453 No Yes No
6.8 Evaluation of Wastewater Collection and Treatment Options
289. When it comes to wastewater treatment and disposals, normally only two options are considered, (1) centralized wastewater systems (i.e., town sewers with treatment facilities) and (2) decentralized onsite systems (i.e., conventional onsite HH septic systems). Centralized wastewater systems, consisting of collection network and centralized treatment plants, were developed in the modern days while onsite HH systems have been used for centuries, evolving from simple earth pits to cesspools to septic tanks.
290. Urban and suburban areas with high population densities would probably be better served by centralized wastewater systems but construction of the sewers and centralized treatment facilities requires substantially high capital investments and length of time. It also requires adequate utility management, O&M capacity and financial budgets.
291. For urban setting the preferred treatment option is usually the development of a centralized wastewater collection and treatment system (primary, secondary, or advanced). However, it may not the right choice for rural setting. Small communities in rural settlements often cannot afford these expensive facilities and sustain adequate O&M, and their populations are relatively low and spread out to make centralized treatment a feasible option.
292. For rural settlements, decentralized onsite HH wastewater system is often the best option for wastewater management. Normally an onsite HH system consists of a conventional septic tank and a leaching field for earth absorption of septic tank effluent. This appears to be least cost and most practical solution for rural communities.
Table 6.9. Comparison of Advantages and Disadvantages
Advantages
Aspect Centralized Decentralized
Technical Preferred option for urban cities and highly populated town centers.
Different levels of treatment can be achieved in stages, from primary to secondary to advanced tertiary to water reuse.
Consistent treated wastewater effluent quality can be achieved by centralized management.
Most cost-effective and practical option for rural sparsely populated settlements.
Fixed level of treatment at post-secondary (earth pits) and low degree of secondary (septic tanks).
Environmental Lower risk of groundwater contamination
Lower risk of bad odor and pathogens at wastewater disposal sources
Lower risk of soil contamination
Lower risk of surface water bodies contamination.
Lower levels of CO2 emission

68
Advantages
Aspect Centralized Decentralized
Social Promote tourism and local business development (sewer connections)
Improve health and sanitation
Promote tourism and local business development (flushed toilets with septic tanks)
Improve health and sanitation
Land and Resettlement
No short-term and long-term impacts on land acquisition and resettlement
Can be upgraded any time without land acquisition and resettlement issues.
Institutional O&M management can be centralized.
Public and private O&M capacity can be integrated.
Capacity building and training can be done for wastewater management.
No need O&M capacity.
Public and private septic tank services can be used.
Awareness campaigns within the communities for proper wastewater disposal can be done.
Financial Capital investment can be recovered from tariffs.
HH septic tank system installation cost is low and affordable (least cost solution).
Does not require significant initial capital for sewer lines and treatment plants construction.
No operation cost; low and affordable maintenance costs.
Disadvantages
Aspect Centralized Decentralized
Technical High risk of inflow/infiltration in sewerage networks.
Treatment facilities require professional/skilled personnel.
No water reuse can be achieved.
Treated effluent quality varies and depends on proper maintenance of HH system by individuals (home owners).
Environmental May cause groundwater contamination if sewer pipes break or leak into the ground.
May have risk of water body contamination if treatment facilities failed to operate.
Lower risk of bad odor if treatment facilities failed to operate.
Temporary negative environmental impacts during construction.
May cause groundwater contamination if HH system didn’t work or poorly maintained.
May have some risk of bad odor and pathogen is if HH system didn’t work or poorly maintained.

69
Advantages
Aspect Centralized Decentralized
Social Temporary impacts to tourism and business during construction (traffic interruption, unattractive worksites in the centers, etc.)
Low-income HH may be impacted for paying higher tariffs.
Low-income HH may be impacted for costs of installation and maintenance.
Land and Resettlement
Major short-term and long-term impacts on land acquisition and resettlement.
Institutional Legislation for wastewater discharge permits, wastewater tariffs, and regulations.
Must have regulations to enforce HH wastewater disposal compliance.
Must promote septic tank maintenance service business.
Financial Requires substantial initial capitals and time for construction of sewer pipes, pumping stations, treatment facilities, and discharge outfalls.
Requires significant budget for adequate O&M efforts.
May cause some insignificant financial burdens to low-income HH for the costs of installation and maintenance of septic tanks.
6.9 Proposed Wastewater Management Options for Project Area
6.9.1 Centralized Wastewater
293. Centralized wastewater collection and treatment systems will be developed for 6 urban centers under Phase 3 of the Project. These 6 urban centers namely, Umid urban center, Urtaovul urban center, Chinaz urban center, Birlik urban center, Amir Temur urban center, and Kir urban center, will include 61,000 population in about 10,500 households. Centralized system will consist of 85 km of sewage collection network and 6 treatment facilities (screenings, primary and biological treatment processes). Table 6.10 summaries developments for these 6 urban centers.
Table 6.10. Wastewater Infrastructure Development for Urban Centers within the
Project Area
№ Yangiyul District Population Households Centralized Sewer (km)
Treatment Facility
Capacity (m3/day)
1 Umid urban center 2,500 450 9.2 Biological 500
2 Urtaovul urban center 19,399 3,632 8.5 Biological 3,200
№ Chinaz District Water
Supply System Population Households
Centralized Sewer (km)
Treatment Facility
Capacity (m3/day)
1 Chinaz urban center 27,526 4,451 39.5 Biological 5000
2 Birlik urban center 2,900 476 14.1 Biological 600
3 Amir Temur urban center 5,104
975 6.1 Biological 1000
4 Kir urban center 2,750 410 6.1 Biological 500
6.9.2 Decentralized Wastewater
294. Decentralized onsite HH wastewater disposal system (septic tanks) will be developed for 80 rural settlements of the project. Under the Phase 2, about 25,000 residents of 4,000

70
households in 11 prioritized rural settlements will be installed with septic tank systems. These settlements are in the low elevation areas with high groundwater table. The remaining 69 rural settlements will be covered under Phase 3 of the Project.
295. Proposed wastewater management development for rural settlements under Phase 2 is summarized in Table 6.11 below.
Table 6.11. Wastewater Infrastructure Development for Rural Settlements under Phase 2
№ Yangiyul District Population Households HH
Wastewater System
Quantity
Size of Septic
Tank (m3)
1 Hakikat 3,015 424 Septic Tanks
424 2
2 Said Ota 2,140 385 Septic Tanks
385 2
№ Chinaz District Population Households HH
Wastewater System
Quantity
Size of Septic
Tank (m3)
1 Abzalobod 2,905 555 Septic Tanks
555 2
2 Archazor 475 91 Septic Tanks
91 2
3 Tillaobod 1,640 313 Septic Tanks
313 2
4 Guliston 2,391 406 Septic Tanks
406 2
5 Ochamayli 2,069 308 Septic Tanks
308 2
6 Yollama 2,378 354 Septic Tanks
354 2
7 Dehkonobod 2,976 444 Septic Tanks
444 2
8 Erkin 1,700 253 Septic Tanks
253 2
9 Chinmasjid 2,925 436 Septic Tanks
436 2
296. About 136,000 residents in 23,500 households living in the remaining 69 rural settlements will be provided HH septic tank systems under Phase 3 of the Project. Proposed wastewater management development for rural settlements under Phase 3 is summarized in Table 6.12 below.
Table 6.12. Wastewater Infrastructure Development for Rural Settlements under Phase 3
№ Yangiyul District Population Households HH
Wastewater System
Quantity
Size of Septic
Tank (m3)
1 Dustlik 2245 314 Septic Tanks
314 2 2 Galaba 3395 611 Septic
Tanks 611 2
3 Yangiobod 607 111 Septic Tanks
111 2 4 Markaz 2996 549 Septic
Tanks 549 2
5 Shuralisoy 2011 369 Septic Tanks
369 2 6 Yangiyul
(Ohunboboev) 1985 279 Septic
Tanks 279 2
7 Iftihor (Bobur) 2385 342 Septic Tanks
342 2 8 Marifat 391 56 Septic
Tanks 56 2
9 Vatan 2263 325 Septic Tanks
325 2 10 Mirishkor 2390 429 Septic
Tanks 429 2
11 Halkobod 4355 782 Septic Tanks
782 2 12 Olmazor
(A.Ikramov) 3880 696 Septic
Tanks 696 2
13 Nihol (Navoi) 2669 479 Septic Tanks
479 2 14 Nurobod 1985 353 Septic
Tanks 353 2
15 Keskan 3845 685 Septic Tanks
685 2 16 Registon (Dangir) 3260 580 Septic
Tanks 580 2
17 Turkiz 393 70 Septic Tanks
70 2 18 Kaksha 380 68 Septic
Tanks 68 2
19 Kushtepa 2799 513 Septic Tanks
513 2 20 Changtepa 3160 580 Septic
Tanks 580 2
21 Honkurgon 4617 814 Septic Tanks
814 2 22 Kengkechik 2392 421 Septic
Tanks 421 2

71
23 Mustakillik 2220 400 Septic Tanks
400 2 24 Tuyabugiz 2610 470 Septic
Tanks 470 2
25 Yuksalish (Inogomov)
3023 544 Septic Tanks
544 2 26 Uzbekiston 3018 543 Septic
Tanks 543 2
27 Mirzaboboev 2011 354 Septic Tanks
354 2 28 Galaba 287 51 Septic
Tanks 51 2
29 Kanalbuyi 182 31 Septic Tanks
31 2 30 Yangi Mahalla 513 88 Septic
Tanks 88 2
31 Chamanzor 2610 510 Septic Tanks
510 2 32 Koratepa 3246 610 Septic
Tanks 610 2
33 Bogzor 3066 574 Septic Tanks
574 2 34 Ankhor 5325 997 Septic
Tanks 997 2
35 Chinor 2393 448 Septic Tanks
448 2 36 Dehkonobod 1655 310 Septic
Tanks 310 2
37 Madainyat (Botir) 2065 387 Septic Tanks
387 2
№ Chinaz District Population Households
HH Wastewater
System Quantity
Size of Septic
Tank (m3)
1 Uzbekiston 2814
430 Septic Tanks
430 2 2 Galaba 524
80 Septic
Tanks 80 2
3 Ittifok 436
67 Septic Tanks
67 2 4 Dustlik 372
57 Septic
Tanks 57 2
5 Kanalobod 1287
197 Septic Tanks
197 2 6 S.Rakhimov 911
146 Septic
Tanks 146 2
7 Sutbulok 1919
315 Septic Tanks
315 2 8 Hudayberganov
(Tong Yulduzi) 1704
280 Septic
Tanks 280 2
9 Gayrat 3385
542 Septic Tanks
542 2 10 Olmos 2012
384 Septic
Tanks 384 2
11 Mevazor 1924
368 Septic Tanks
368 2 12 Ohunboboev 2950
564 Septic
Tanks 564 2
13 Safarobod 1009
193 Septic Tanks
193 2 14 Uchkun 1600
271 Septic
Tanks 271 2
15 Madaniyat 2570
435 Septic Tanks
435 2 16 Norkuziev 1104
127 Septic
Tanks 127 2
17 Yangiobod 3223
372 Septic Tanks
372 2 18 Kahramon 2800
448 Septic
Tanks 448 2
19 Islomobod 3215
546 Septic Tanks
546 2 20 Birlik 1602
272 Septic
Tanks 272 2
21 Kutarma 2623
446 Septic Tanks
446 2 29 Kerdara 900 153 Septic
Tanks 153 2
30 S.Ayniy 1650
264 Septic Tanks
264 2 31 Uzumzor 1815
300 Septic
Tanks 300 2
32 Samarkand 2676
453 Septic Tanks
453 2
6.10 Proposed Onsite HH Septic Tank Systems for the Project
297. Prefabricated PE septic tanks will be used for the project rural population. The onsite HH septic tank system consists of a PE septic tank and an effluent discharge perforated PVC pipe for ground adsorption.
298. Usually, the installation of a septic tank shall include a soil absorption field (also known as leaching field). Trenches in the soil absorption system are dug wide enough to accommodate open- jointed drain, typically of a gravel or coarse aggregate under and around the perforated pipe(s) that discharge the tank effluent. The purposes of the aggregate were to provide a porous media through which the septic tank effluent could flow and be absorbed into the ground without plugging the perforated pipe(s).
299. Normally the HH system and its associated connections are to be constructed by homeowners themselves or by local entrepreneurs in accordance with local requirements. Under this project, the septic tank and effluent pipe(s) will be installed by the contractor hired by the project. The onsite HH septic tank systems must be periodically inspected and maintained in order to treat domestic wastewater properly and to protect the environment and

72
human health. The periodic maintenance service of the onsite HH septic tank systems can be done individually by home owners themselves or by public utility or by a private entity under PPP contract arrangements.
300. A typical 2.0 m3 prefabricated PE septic tanks available for commercial procurements are shown below. Costs per unit (2.0m3) vary from US$80 to $100 per unit (excluding installation costs). A single unit of a 2.0m3 septic tank system can accommodate wastewater treatment for a household of up to 12 persons.
Figure 6.12. Prefabricated PE Septic Tank Specifications
301. The below Table 6.13 summarizes treatment capabilities and efficiencies of onsite HH septic tank systems.
Table 6.13. Summary of Septic Tank Treatment Efficiencies
Parameter Effluent Concentration Percent Reduction
T. Phosphate (mg/L) 20 to 25 15 to 20%
COD (mg/L) 200 to 327 60 to 70%
BOD 5 (mg/L) 120 to 140 40 to 50%
Suspended Solids (mg/L) 39 to 155 40 to 80%
T. Nitrogen (mg/L) 36 to 45 0 to 50%
Oil and Grease (mg/L) 20 to 25 70 to 80%
Source: US EPA, Design Manual: Onsite Wastewater Treatment and Disposal Systems, October 1980

73
Figure 6.13. Typical Design Layout of an Onsite HH Septic Tank System for Rural Areas
302. A typical design layout of an onsite HH septic tank system for rural areas is illustrated in the figure shown below.
6.11 Overall Assessment
303. In general, only major cities and urban centers in Tashkent Province have centralized wastewater collection systems (town sewers), some with and some without treatment facilities. About 56% of the existing infrastructure need repairs, reconstruction, or upgrading. Rural settlements have no wastewater infrastructure. The majority of the population (84%) rely on HH decentralized systems, i.e. earth pits, pit latrines, or earth ditches.
304. The total daily municipal domestic wastewater volume is estimated at 600,000 m3 generated from a population of 2,816,000 residents.
305. Records on infectious disease over the 10-yer period 2006 – 2015 were obtained from the Sanitary Epidemiological services (SES) of the Ministry of Health indicate some increasing trends of viral hepathitis, tuberculosis and acute intestinal disease in Zangiota and Chinaz. Trend of Uro-genital system disease, which is also an indicator of kidney disease indicate unambiguous increasing trend. The incidence of this disease is comparatively high in Chinaz.

74
306. Despite significant commitments the Government has undertaken in the past to overcome barriers in developing a sustainable WSS sector and to improve performance, the sector constraints remain characterized by several major issues, such as: (i) inadequate planning; (ii) inappropriate design standards; (iii) weak corporate capacity; (iv) infrastructure gaps; (v) limited financial resources; and (vi) operational problems.
307. The most urgent problems concerning wastewater are:
• dilapidated networks, often beyond repairs;
• need for construction of sewage treatment facilities or renovation of existing facilities aimed at improvement of cleaning in order to prevent discharge of untreated sewage into water bodies that are sources of drinking water;
• need to introduce new environmentally friendly methods of water treatment directly in water bodies;
• lack of local production capacity, skilled production workers in the field of maintenance and modernization of wastewater systems; and
• difficulty attracting and retaining skilled staff in the WSS sector.
308. Currently, investment planning for wastewater infrastructure in Tashkent during period of 2019 to 2029 is ongoing and can be summarized in Table 6.14 below
Table 6.14. Investment Planning for Wastewater Infrastructure in Tashkent Province, Period 2019 -2022
№ Settlement
Cap
ac
ity o
f th
e p
roje
ct,
thn
d.m
3/d
ay
, k
m
Pro
jec
t a
mo
un
t, m
ln.
US
D.
inc
lud
ing
lo
an
fu
nd
s t
o
be
in
ve
ste
d, m
ln U
SD
.
Inv
es
tor
Imp
lem
en
tati
on
pe
rio
d
Fe
as
ibil
ity
Stu
dy
re
po
rts
av
ail
ab
le o
r n
ot
Outcomes
Before project After project
Nu
mb
er
of
po
pu
lati
on
Po
pu
lati
on
co
ve
red
wit
h
se
we
rag
e
se
rvic
es
Co
ve
rag
e, %
Nu
mb
er
of
po
pu
lati
on
Po
pu
lati
on
co
ve
red
wit
h
se
we
rag
e
se
rvic
es
Co
ve
rag
e, %
Total Tashkent province:
160 92.19 54.64 19.38 2019 0 528477 251014 47.5 529114 480084 90.7
1 Angren city 100 18.17 0 0 2019-2021
0 178637
58059 33 178637 169607 94.9
2 Almalik city 0 0 0 0 0 0 0 0 0 0 0 0
3 Bekabad city 60 14.64
14.64 2019 91863 46033 64 92500 92500 100
4 Chirchik city 19.38
0 19.38
0 257977
146922 57 257977 217977 84.5
5 Akhangaron city 0 0 0 0 0 0 0 0 0 0 0 0
6 Yangiyul city 0 40 40 ADB 2019-2022
0 0 0 0 0 0 0
6.12 Overall Recommendations
309. Under Phase 2 Project, about 4,000 HH septic tank systems will be installed in 11 rural settlements serving a total population of 25,000 people.
310. The Uzbekistan Government is currently planning for the Phase 3 Project. It is recommended that 6 urban centers of Yangiyul and Chinaz namely, Umid urban center, Urtaovul urban center, Chinaz urban center, Birlik urban center, Amir Temur urban center, and Kir urban center, will have centralized wastewater systems constructed which consist of 85 km of sewage collection network and 6 wastewater treatment facilities, serving about 61,000 people. About 136,000 residents living in the 69 rural settlements of Yangiyul and Chinaz will be provided with HH septic tank systems. The Phase 3 will also provide sewer connectivity or septic tank systems to all schools and kindergartens in the 4 Project districts as a whole.

75
7 PROJECT DEVELOPMENT
7.1 Assumptions, Goals and Methodology
7.1.1 Project Targeted Settlements
311. The final plan includes 79 settlements along the corridor of the water supply trunk mains connecting Yangiyul (from VU-1) to WDC Chinaz serving a population of 220,445 residents as shown in Table 7.1.
Table 7.1. List of Settlements under Phase 2
№ Yangiyul District Water Supply
System Population Households
1 Umid urbanized village 2 500 450
2 Dustlik 2 245 314
3 Galaba 3 395 611
4 Yangiobod 607 111
5 Markaz 2 996 549
6 Shuralisoy 2 011 369
7 Yangiyul (Ohunboboev) 1 985 279
8 Hakikat 3 015 424
9 Iftihor (Bobur) 2 385 342
10 Marifat 391 56
11 Vatan 2 263 325
12 Mirishkor 2 390 429
13 Halkobod 4 355 782
14 Olmazor (A.Ikramov) 3 880 696
15 Nihol (Navoi) 2 669 479
16 Nurobod 1 985 353
17 Keskan 3 845 685
18 Registon (Dangir) 3 260 580
19 Turkiz 393 70
20 Kaksha 380 68
21 Kushtepa 2 799 513
22 Changtepa 3 160 580
23 Honkurgon 4 617 814
24 Kengkechik 2 392 421
25 Mustakillik 2 220 400
26 Tuyabugiz 2 610 470
27 Yuksalish (Inogomov) 3 023 544
28 Uzbekiston 3 018 543
29 Said Ota 2 140 385
30 Mirzaboboev 2 011 354
31 Galaba 287 51
32 Kanalbuyi 182 31
33 Yangi Mahalla 513 88
34 Chamanzor 2 610 510
35 Koratepa 3 246 610
36 Urtaovul 19 399 3 493
37 Bogzor 3 066 552
38 Ankhor 5 325 959
39 Chinor 2 393 429
40 Dehkonobod 1 655 297
41 Madainyat (Botir) 2 065 371
SUBTOTAL 115 681 20 361

76
№ CHINAZ DISTRICT WATER SUPPLY
SYSTEM POPULATION HOUSEHOLDS
1 Chinoz city 27 526 4 451
2 Birlik urbanized village 2 900
476
3 Amir Temur urbanized village 5 104
975
4 Kir urbanized village 2 750
410
5 Uzbekiston 2 814
430
6 Galaba 524
80
7 Ittifok 436
67
8 Dustlik 372
57
9 Kanalobod 1 287
197
10 S.Rakhimov 911
146
11 Sutbulok 1 919
315
12 Hudayberganov (Tong Yulduzi) 1 704
280
13 Gayrat 3 385
542
14 Abzalobod 2 905
555
15 Olmos 2 012
384
16 Mevazor 1 924
368
17 Ohunboboev 2950
564
18 Archazor 475
91
19 Tillaobod 1 640
313
20 Safarobod 1 009
193
21 Uchkun 1 600
271
22 Madaniyat 2 570
435
23 Norkuziev 1 104
127
24 Yangiobod 3 223
372
25 Kahramon 2 800
448
26 Islomobod 3 215
546
27 Birlik 1 602
272
28 Kutarma 2 623
446
29 Kerdara 900 153
30 Guliston 2 391
406
31 Ochamayli 2 069
308
32 Yollama 2 378
354
33 Dehkonobod 2 976
444
34 Erkin 1 700
253
35 Chinmasjid 2 925
436
36 S. Ayniy 1 650
264
37 Uzumzor 1 815
300
38 Samarkand 2 676
453
SUBTOTAL 104 764 17 182
GRAND TOTAL 220 445 37 543

77
7.1.2 Population Projections and Water Demand
312. Present and projected population data up to 2043 are provided by the Institute of Forecasting and Macroeconomic Research under the Cabinet of Ministers of the republic of Uzbekistan. Average per capita water consumption (lcd) considered for the projections are:
• 150 lcd in the urbanized rural centers;
• 120 lcd in rural settlements.
313. Projections of population and water demand at the horizon 2045 summarized in Table 7.2 have been calculated for each single makhalla, village or rural town individually. The settlements have then been categorized according to water supply systems each of which is commanded by a Water distribution centers (WDC).
Table 7.2 Beneficiary Population Projections (Phase 2)
Year Yangiyul District
Chinaz District
Total
District Population12 2018 256,920 125,653 382573 2045 314,641 143,679 457685
Beneficiaries population 2018 115,681 104,764 220,445 2023 123,221 110,999 234,320 2045 146,206 121,775 267,981
314. The consolidated water demand at the horizon 2045 including Suvokova’s process water and other own needs is estimated at an average of 48,000 m3/d with a maximum day demand reaching 60,000 m3/d.
12 Source: Institute of Forecasting and Macroeconomic Research

78
7.1.3 Methodological Approach
315. All settlements will be supplied by off-takes from water transmission mains. Existing WDC are being rehabilitated. Wellfield VU-1 has been optimised in order to cover a maximum of the population requiring water service within the Project Area (Table 7.3). Among these, 12 are new units. The remaining ones are being rehabilitated, and in many cases completely reconstructed.
Table 7.3. Required Pumping Stations Mains, New and Rehabilitated Units
District / WDC System Plan Reservoir
rehabilitation (m3)
New reservoir (m3)
Yangiyul 2nd lift VU-1 Rehabilitation 1 x 2000 1 x 2000 WDC Chinor Rehabilitation 1 x 1000 WDC Bobur New 2 x 300 WDC Shuralisay New 2 x 300 WDC Okhunbabaev New 2 x 300 WDC Boz Suv New 2 x 500 Water Tower Galaba New 50 Water Tower Kanalbuyi New 50 Water Tower Yangiobod New 50 Water Tower Dustlik New 50 WDC Khalkhabad Rehabilitation 2 x 500 1 x500 WDC 9 Nurabad New 2 x 600 WDC VU3 Rehabilitation 2 x 2000
Chinaz WDC Eshonabad Rehabilitation 2 x 300 WDC Sutbulak Rehabilitation 2 x 1000
WDC Madaniyat Rehabilitation 2 x 500
WDC Gayrat New 2 x 500 WDC Yangiabad Rehabilitation 2 x 500
WDC Kutarma Rehabilitation 2 x 700 WDC Yallama Rehabilitation 2 x 500 1 x 500 Water Tower Uzumzor New 50 WDC Amir Timur New 2 x 1200 WDC Chinaz Rehabilitation 2 x 1700
316. For each service area commanded from a WDC, drawings of the existing network system have been established. Based on these, and on a collaborative approach with the technical services of the district branches of TPS.
317. Layouts of the extended and rehabilitated water supply systems have been prepared taking into account: i) the projected water demand of all settlements at the Project Horizon 2043; ii) needs for the extension of the supply to areas not yet served; ii) need for replacement of obsolete pipeworks based on indications of Suvokovas’ technical personnel and other components of the systems such as disinfection systems, reservoirs and electromechanical equipment; ii) inappropriate diameter of the existing pipes.
318. Diameters of pipeworks, dimension of reservoirs and capacity of pumping stations have been optimized for each water supply system commanded from each single WDC, taking into account the maximum day water demand. Subsequently, the number of pump units needed in each pumping stations new or being rehabilitated has been estimated.
319. Under the FS, a review of the groundwater occurrence within the project areas has also been carried out with the purpose to: i) make a synthesis of present status of exploitation of groundwater resources, ii) assess quality of groundwater, and iii) review potentials for additional development groundwater in the long term. The inputs from the hydrogeological

79
assessment were meant to be used for the development of alternative water supply schemes making use of groundwater as one of the potential resources of water.
320. A 100% household service is planned to be achieved at the Project horizon.
7.1.4 Construction Materials and Equipment
321. High Density Polyethylene Pipe (HDPE) is a thermoplastic pipe made from material that can be melted and reformed. It is rugged, flexible, durable, climate change resilient and has been successfully used in water supply piping applications for over 50 years. With the outstanding proven physical and performance records of HDPE pipe, it is highly recommended for the project proposed distribution network for pipes with diameters from 200mm and smaller. It is emphasized to use high density polyethylene (HDPE) pipes with nominal diameter (DN) up to 200 mm for all network. For larger diameters the use of ductile iron (DI) or mild steel pipes is highly recommended. The minimum depth of pipe invert shall be 1.5 m. For diameters of 800 mm and larger the invert depth can be of 1.8 m.
322. For the disinfection of water supply it is considered adopting liquid chlorination units, preferably of the vacuum type. Such units are compact and safe to use. Liquid chlorine is available in 400/500 kg containers in Uzbekistan.
323. The water distribution system will be equipped with flow meters at all main nodal points of the water networks, along the transmission mains, at each off-take from the transmission main, at the inlet and outlet of reservoirs, at the inlet of each settlement. District metering areas (DMA) will also be designed within each distribution area or settlement in order to allow periodical balances and control of the non-revenue water (NRW). Remote system controls will be installed at the main pumping stations in order to ensure permanent control of the flow at main pumping stations and other crucial nodal points by means of a SCADA from an operational center optimally located either within the premises of the new WTP or at the office of the Tashkent Provincial Suvokova.
324. In order to enhance voluntary household connections, the Project will finance water metering, for domestic connections at the horizon 2022. Beyond this horizon, water meters will be compulsorily installed by the Provincial Suvokova branches. Costs for the installations of the water meters will be shouldered by the consumers either upfront or in form of moderate finances included in the water bills over a given period of time.

80
7.2 Evaluation of Water Supply Development Options
325. As noted in previous sections of this report, three options were identified as potential water supply development to help meet current and future water needs in the project area. Each of the three was studied in detail to determine viability.
326. The options considered for evaluation include: Option 1 – VU-1 Wellfield as primary source, Option 2 – VU-1 and Chinaz Wellfields as primary source, and Option 3 – VU-1, Chinaz and Almazor Wellfields as primary souce as presented in Figures 7.1, 7.2 and 7.3.
327. This section explains evaluation criteria and procedures used in evaluating and rating these options. It also explains the rationale used in formulating the options.
Figure 7.1. Option 1 – VU 1 Wellfield as primary source

81
Figure 7.2. Option 2 – VU-1 and Chinaz Wellfields as primary source

82
Figure 7.3. Option 3 – VU 1, Chinaz and Almazor Wellfields as primary souce
7.2.1 Evaluation Criteria
328. The evaluation criteria were developed with input from stakeholders and the public. These criteria include economic, environmental, social, institutional, and system reliability.
7.2.2 Option Evaluation
329. Available data associated with the evaluation criteria was obtained through the project social economic, initial environmental, resettlement surveys and preliminary cost estimates. The options were evaluated in two parts: Economic Factors Evaluation, and Non-Economic Factors Evaluation.
7.2.3 Economic Factors Evaluation
330. Economic factors are based on preliminary estimated capital costs and estimated present-value life cycle costs. The capital costs are the estimated costs to construct the facilities. The purpose of evaluating the capital costs is to determine the magnitude of funding required to construct a given Option.
331. Life cycle costs represent the total discounted present value of capital costs (deferred construction costs discounted to present value), operation, maintenance and replacement costs (OM&R), and the cost of water. The cost per 1000 cubic meters delivered is calculated by dividing the life cycle cost by the projected total quantity of water delivered over the 50-year life of the project.
332. The below table 7.4 shows cost comparison for evaluation of Options.

83
Table 7.4. Economic Factors Evaluation Summary
Economic Factors Option 1 Option 2 Option 3
Capital Costs (total) (Units: 1,000) $88,000 $90,000 $92,000
Capital Costs $ per m3 capacity1 $1,467 $1,500 $1,533
Present Annual O&M Costs $ per m3 at full Capacity2 $2,190 $2,190 $2,190
Life Cycle Costs per 1000 m3 delivered (50 yrs) $1,760 $1,800 $1,840
1 Designed production at 60,000 m3/d
2 Includes O&M, treatment and disinfection of water at $0.1/m3
7.3 Non-Economic Factors Evaluation
333. The non-economic factors category includes the environmental, social, institutional, and system reliability factors. These established non-economic criteria to each of the options. The following basic assumptions were made to make the comparisons between options more logical and directly comparable:
• Groundwater can be withdrawn from all three existing wellfields at +50m3/s yield rate or higher;
• All options are subjected to the same projected project population, and would be delivered to the same specific area, and would consequently result in the same impacts on production outputs and water quality.
334. Environmental - Environmental factors considered include: environmental compliance, cultural resources, visual resources, fish and wildlife, threatened and endangered species, water quality, and instream flows. Groundwater quality as identified as the only environmental factor with the most potential for differing impacts among the options which is discussed in the following paragraph.
335. Water Quality - Groundwater quality is questionable at the two wellfields: the Almazor and the Chinaz. Due to lack of recent or current reliable testing and sampling of water quality data groundwater from these two sources was seen as unfit for water supply development at the time of this study. However, we recommend to carry out a comprehensive hydrological and water quality study at these two wellfields as a component under the Project Outputs.
336. Social and Gender – Social factors were discussed in the project PSA report and GAP. Potentially significant positive social impact and project benefits would be the same for all options. The study found no significant differences among the three Options for the other social factors.
337. Land and Resettlement - As discussed in the project LARP, there would be some insignificant impacts to private land and minor resettlement issues. The study found no significant differences among the three Options for the other land and resettlement factors.
338. Institutional – Institutional factors considered include management capability, ability to meet consummers’ demands, budget efficiency, compatibility with growth needs in the project areas, and development O&M capacity. The study found no significant differences among the three Options for institutional factors.
339. Technical – System reliability is rated based on facility integrity and system redundancy. System redundancy would be enhanced by constructing multiple sources of water to meet needs, as opposed to only one source or pipeline. Thus, Option 3 would be the best while Option 1 is the least. However, as mentioned earlier, due to lack of reliable current data on water quality the use of groundwater from Chinaz and Almazor wellfields was ruled out by local hydrology institute at this stage.

84
7.4 Selected Option
340. Resulted from comparison of scores amongst economic and non-economic evaluation, Option 1 – Vu-1 Wellfield as primary source is the least cost and was selected for water supply development for the project area with recommendations for future groundwater supply development at Almazor and Chinaz wellfields to meet future water demands.
Figure 7.4. Trunk Main Workflow Diagram (from VU-3 up to WDC “Chinoz”)
7.5 Project Development
341. Under Phase 2 of the Project, the following will be implemented:
(1) Rehabilitation of the groundwater wellfield VU-1 including:
• drilling and equipment of 12 and rehabilitation of 3 existing, 60 m deep production wells each yielding 50 l/s, including submersible pumps, wellhead, electrical switches, transformer and controls, yielding an average of 48,000 m3/d up to a maximum of 60,000 m3/d to cover the water demand of 6 settlements in Zangiota, 35 in Yangiyul and the 38 Settlements in Chinaz district;
• rehabilitation of one 2,000 m3 reservoir;
• construction of one 2,000 m3 reservoir;
• reconstruction and equipment of the chlorination unit;
• reconstruction of the 2nd lift pumping station;
• reconstruction and equipment of ancillary buildings such as operation office, mini-laboratory, workshop, and guardhouse;
• rehabilitation of premises and fencing of the immediate protection area. (2) Construction of the two transmission mains from the 2nd lift pimp at wellfield VU-1
to the WDC VU-3 in Dia 700 over a length of 16.9 km.
(3) Construction of a 48.2 km transmission from the wellfield WU-3 to the Chinaz town
including the following components:

85
• 17,64 km of main Dia 800 mm from the WDC WU-3 to the Water Tower Yangiobod;
• 30,56 km of main Dia 600 mm from the Water Tower Yangiobod to the WDC Chinaz
• Construction of 27,27 km of 400 to 140 mm distribution mains connecting off-takes in the transmission main to WDCs and water towers
• Construction of 12 new WDCs and rehabilitation of 10 existing WDC including rehabilitation and construction of chlorination devices, rehabilitation of reservoirs, guardhouses and sanitary perimeter fences.
• Construction of 5 water pressure towers.
• Construction and reconstruction of 539,76 km of water distribution networks with Dia 400 to 100 mm.
• Rehabilitation of 14 water reservoirs with a total capacity of 13,000 m3 and construction of 23 new reservoirs with a cumulated capacity of 17,300 m3.
• Installation of some 37,543 house connections with water metering.
Detailed quantities are attached as Appendix 10 and 13.
(4) Installation of about 4000 units of individual 2-m3 capacity septic tank system for about 25,000 residents of 4,000 households including kindergartens and schools in 11 prioritized rural settlements as listed below.
Table 7.5. Physical Wastewater Components for Rural Settlements under Phase 2
№ Yangiyul District
Popu- lation
House-holds
HH Wastewater System
Quantity Size of Septic Tank (m3)
1 Hakikat 3,015 424 Septic Tanks 424 2 2 Said Ota 2,140 385 Septic Tanks 385 2
№ Chinaz District Popu- lation
House-holds
HH Wastewater System
Quantity Size of Septic
Tank (m3)
1 Abzalobod 2,905 555 Septic Tanks 555 2 2 Archazor 475 91 Septic Tanks 91 2 3 Tillaobod 1,640 313 Septic Tanks 313 2 4 Guliston 2,391 406 Septic Tanks 406 2 5 Ochamayli 2,069 308 Septic Tanks 308 2 6 Yallama 2,378 354 Septic Tanks 354 2 7 Dehkonobod 2,976 444 Septic Tanks 444 2 8 Erkin 1,700 253 Septic Tanks 253 2 9 Chinmasjid 2,925 436 Septic Tanks 436 2
7.6 Other Physical Components to the Project
7.6.1 Administrative Buildings and Warehouse
342. The administrative buildings of VU-1 and Chinaz district branches will be reconstructed.
343. Two rooms will be reserved at the TPS building for the installation of monitoring devices as part of the operation Control Centre.
344. It is also foreseen to constitute a project information centre either at the TPSA or at the new warehouse. The information shall be equipped with audio-visual devices and other communication tools needed for the divulgation of the Project, the benefits expected from it for the communities, the involvement and responsibilities of Government, local communities and ADB. Activities connected to the information centre will include also dissemination workshops on economic use of water for domestic use and environment. The information centre will be constituted during years 2019 – 2020, simultaneously with the implementation of the capacity building program. Its realization will be supervised by the PMC and Project Implementation Consultant.

86
Figure 7.5. Layout of the Selected System

7.6.2 Water Quality laboratories
345. In addition to the fully equipped laboratory at the new Kadirya WTP (Phase I), it was planned to install two other laboratories; one at the wellfield VU-1, another at Chinaz Suvokova branch. The water quality laboratory equipment will be purchased using ICB, NCB or Shopping methods of procurement as appropriate.
7.6.3 Operation Control System
346. The output of the project would be a complex hydraulic system, comprising of.
• Water intakes;
• The water main span over four districts;
• Numerous distribution networks fed by the water main;
• Reservoirs for water storage at production and distribution points;
• Extensive and interlinked pumping equipment.
347. Operating such a system in a sustainable manner is a complex, multitask undertaking, requiring modern Operation Control System (OCS) for day-to-day operations management, quick and appropriate response to system failures, and optimum monitoring and control of non-revenue water (NRW). The system will comprise of three tiers of automation and control:
• Equipment level automation and control;
• Subsystem level automation and control;
• The SCADA control system.
348. Automation and control at the equipment level would involve inter alia procurement and installation of pumps with frequency controllers, enabling automatic flow adjustments, as needed, in an autonomous mode. This activity would also involve fitting equipment with flow meters, pressure gauges, water level monitoring devices, communication devices and other control features procured in conjunction with the equipment. This level of automation would be handled by procurement experts stipulating technical specifications for equipment and machinery with optimal level of automation and control. The objective of this tier is to minimize and optimize work load of central controllers of the OCS.
349. Automation and control at the subsystem level would involve identifying and delineating subsystems, such as water intakes or separate distribution networks controlled with designate Water Distribution Centers (WDC). Each subsystem would have: (a) prescribed performance parameters; (b) comprehensive water flow metering at inputs and outputs; (c) pressure gauges at inputs and strategic control points; (d) communication and telemetry systems; (e) Programmable Logic Controllers (PLCs); (f) control panels and other control features. Reservoirs, depending on their functionality, could be a part of a particular subsystem, or could be a separate subsystem. In any case, reservoirs would be equipped by water level readers, telemetry and other control devices. This automation would be undertaken in conjunction with civil works relating to respective subsystems. The objective of this tier is to enhance overall controllability of the hydraulic system and to optimize technical features of civil works.
350. The SCADA control system would be the only element of the OCS procured as a stand-alone package, but it would dictate features of procurement packages relating to equipment and civil works. The SCADA would be located at the building of the Tashkent Province Suvokova (TPS) and would involve an overall control over the whole hydraulic system. The SCADA would monitor performance of all equipment and subsystems within the system, with remote control functionality over wellfields of VU-1, Kadirya and others, as well as over control valves at connection points to the water main and critical control points within distribution networks. The SCADA would also have extensive analytical and data management capabilities to facilitate minimization of the NRW.

88
Figure 7.6. Schematic Representation of the Operation Control System

89
8 SYSTEM COST ESTIMATES
351. Base cost estimates summarized in Table 8.1 include investment costs for water supply development, transmission and distribution, as well as for renovation of the TPS and provincial branches buildings, construction of a central warehouse and workshop, installation of a remote system operation control, procurement of utility vehicles, workshop equipment, mobile repair and maintenance units and the equipment of three water quality laboratories.
Table 8.1 Cost Estimates. Base Costs ($x1,000)
2019 2020 2021 2022 2023 2024 2025 Total A. Output 1: VU-1 Regional Water Supply System Improved
1. VU-1 regional water intake and pump station - 1,59 3,32 8,03 8,23 7,62 3,05 31,85
2. Yangiyul district - 1,04 2,24 5,29 5,52 4,82 1,93 20,84
3. Chinaz district - 1,16 2,58 5,95 6,33 5,18 2,07 23,28
4. Installation of decentralized wastewater system - 0,09 0,18 0,44 0,44 0,44 0,18 1,75
5. SCADA system - 0,00 0,09 0,18 0,15 0,04 - 0,47
6. Facility for training center - - 0,40 0,80 0,60 0,20 - 2,00
7. Detailed design - 0,77 1,16 0,64 - - - 2,58 Subtotal - 4,66 9,98 21,33 21,28 18,29 7,22 82,76 B. Output 2: Institutional Capacity Strengthened 1. Sector capacity improved - 0,36 0,94 1,19 1,08 0,27 - 3,84
2. Project implementation support 0,02 0,94 1,48 1,31 0,99 0,86 0,48 6,09
0,02 5,97 12,39 23,84 23,35 19,43 7,70 92,69
Physical Contingencies - 0,12 0,26 0,62 0,64 0,57 0,23 2,44
Price Contingencies Inflation Local - 0,44 1,42 4,62 5,98 6,79 3,25 22,49
Foreign - 0,03 0,13 0,41 0,57 0,57 0,27 1,98
Subtotal Inflation - 0,48 1,55 5,03 6,55 7,36 3,52 24,48
Devaluation - - - - - - - -
Subtotal Price Contingencies - 0,48 1,55 5,03 6,55 7,36 3,52 24,48
0,02 6,56 14,20 29,48 30,54 27,36 11,44 119,61
Taxes 0,00 0,96 2,17 4,78 5,06 4,53 1,88 19,39
Foreign Exchange 0,00 2,55 5,48 9,84 9,77 7,56 2,99 38,21

90
Appendixes

91
Appendix 1. Existing coverage with water supply of the settlements included in Phase 2 of the Project
Yangiyul and Zangiota (part) Districts
№ Settlements Population
as of 01.01.18
Existing Water Supply Situation
Source of Water Supply
Water supply systems operating company
Coverage, %
Coverage, people
Not covered, people
Zangiota District
1 Chinor 2393 VU-1 wellfield Yangiyul district branch of “Suvokova” 72% 1723 670 2 Uratovul 19,399 VU-1 wellfield Yangiyul district branch of “Suvokova” 40% 7760 11639 3 Bogzor 3,066 VU-1 wellfield Yangiyul district branch of “Suvokova” 70% 2146 920 4 Dehkonobod 1,655 VU-1 wellfield Yangiyul district branch of “Suvokova” 73% 1208 447 5 Madaniyat (Botir) 2,065 VU-1 wellfield Yangiyul district branch of “Suvokova” 82% 1693 372 28578 51% 14530 14048
Yangiyul District
6 Umid 2,500 Tankered
0% 0 2,500 7 Chamanzor 2610 VU-1 wellfield Yangiyul district branch of “Suvokova” 65% 1697 914 8 Koratepa 3246 VU-1 wellfield Yangiyul district branch of “Suvokova” 38% 1233 2013 9 Ankhor 5,325 VU-1 wellfield Yangiyul district branch of “Suvokova” 70% 3728 1,598
10 Dustlik 2,245 Individual well Yangiyul district branch of “Suvokova” 7.5% 168 2,077 11 Galaba 287 VU-1 wellfield Yangiyul district branch of “Suvokova” 21.8% 63 224 12 Yangi Makhalla 513 VU-1 wellfield Yangiyul district branch of “Suvokova” 21.8% 112 401 13 Markaz 2,996 Tankered
0% 0 2,996
14 Shuralisoy 2,011 Individual well Yangiyul district branch of “Suvokova” 25.0% 502 1,509 15 Okhunboboev 1,985 Tankered
0% 0 1,985
16 Hakikat 3,015 Individual well Yangiyul district branch of “Suvokova” 10% 302 2,714 17 Bobur 2,385 Tankered
0% 0 2,385
18 Marifat 391 VU-1 wellfield Yangiyul district branch of “Suvokova” 21.8% 85 306 19 Kanalbuyi 182 VU-1 wellfield Yangiyul district branch of “Suvokova” 21.8% 40 142 20 Vatan 2,263 VU-1 wellfield Yangiyul district branch of “Suvokova” 21.8% 493 1,770 21 Mirishkor 2,390 VU-1 wellfield Yangiyul district branch of “Suvokova” 21.8% 521 1,869 22 Halkobod 4,355 VU-1 wellfield Yangiyul district branch of “Suvokova” 78.0% 3397 958 23 Ikramov 3,880 VU-1 wellfield Yangiyul district branch of “Suvokova” 78.0% 3026 854 24 Navoi 2,669 VU-1 wellfield Yangiyul district branch of “Suvokova” 21.8% 582 2,087 25 Nurobod 1,985 VU-1 wellfield Yangiyul district branch of “Suvokova” 80.3% 1594 391 26 Keskan 3,845 VU-1 wellfield Yangiyul district branch of “Suvokova” 100% 3845 0

92
№ Settlements Population
as of 01.01.18
Existing Water Supply Situation
Source of Water Supply
Water supply systems operating company
Coverage, %
Coverage, people
Not covered, people
27 Dangir 3,260 VU-1 wellfield Yangiyul district branch of “Suvokova” 7.38% 241 3,019 28 Turkis 393 VU-1 wellfield Yangiyul district branch of “Suvokova” 10% 39 354 29 Kaksha 380 VU-1 wellfield Yangiyul district branch of “Suvokova” 10% 38 342 30 Yangiobod 607 Tankered
10% 61 546
31 Kushtepa 2,799 VU-1 wellfield Yangiyul district branch of “Suvokova” 7.17% 201 2,598 32 Changtepa 3,160 VU-1 wellfield Yangiyul district branch of “Suvokova” 4.53% 143 3,017 33 Honkurgon 4,617 VU-1 wellfield Yangiyul district branch of “Suvokova” 5.38% 248 4,369 34 Kengkechik 2,392 VU-1 wellfield Yangiyul district branch of “Suvokova” 10.78% 258 2,134 35 Mustakillik 2,220 VU-1 wellfield Yangiyul district branch of “Suvokova” 10% 222 1,998 36 Tuyabugiz 2,610 VU-1 wellfield Yangiyul district branch of “Suvokova” 10% 261 2,349 37 Inogomov 3,023 VU-1 wellfield Yangiyul district branch of “Suvokova” 4% 121 2,902 38 Uzbekiston 3,018 VU-1 wellfield Yangiyul district branch of “Suvokova” 100% 3018 0 39 Galaba 3,395 VU-1 wellfield Yangiyul district branch of “Suvokova” 10% 340 3,056 40 Said Ota 2,140 VU-1 wellfield Yangiyul district branch of “Suvokova” 10% 214 1,926 41 Mirzaboboev 2,011 Tankered
0% 0 2,011
Total for Yangiyul District 87103 34% 26061 61042
115,681 40591 75090
Chinaz District
№ Settlements Population as
of 01.01.18
Existing Water Supply Situation
Source of Water Supply
Water supply systems operating company
Coverage, %
Coverage, people
Not covered, people
1 Chinoz city 27,526 Individual well Chinaz district branch of “Suvokova” 74.3% 20452 7,074 2 Birlik 2,900 Individual well Chinaz district branch of “Suvokova” 90% 2610 290 3 A. Temur 5,104 Tankered 0% 0 5,104 4 Kir 2,750 Individual well Chinaz district branch of “Suvokova” 72.6% 1997 754 5 Uzbekiston 2,814 Tankered 0% 0 2,814 6 Galaba 524 Tankered 0% 0 524

93
№ Settlements Population as
of 01.01.18
Existing Water Supply Situation
Source of Water Supply
Water supply systems operating company
Coverage, %
Coverage, people
Not covered, people
7 Ittifok 436 Tankered 0% 0 436 8 Dustlik 372 Tankered 0% 0 372 9 Kanalobod 1,287 Tankered 0% 0 1,287
10 S. Rakhimov 911 Tankered 0% 0 911 11 Sutbulok 1,919 Tankered 0.0% 0 1,919 12 A, Hudayberganov 1,704 Tankered 0% 0 1,704 13 Gayrat 3,385 Tankered 0% 0 3,385 14 Absalobod 2,905 Tankered 0% 0 2,905 15 Olmos 2,012 Tankered 0% 0 2,012 16 Mevazor 1,924 Individual well Chinaz district branch of “Suvokova” 20% 385 1,539 17 Ohunboboev 2,950 Individual well Chinaz district branch of “Suvokova” 65% 1918 1,033 18 Archazor 475 Tankered 0% 0 475 19 Tillaobod 1,640 Tankered 0% 0 1,640 20 Safarobod 1,009 Tankered 0% 0 1,009 21 Uchkun 1,600 Tankered 0% 0 1,600 22 Madaniyat 2,570 Individual well Chinaz district branch of “Suvokova” 52% 1336 1,234 23 Norkuziev 1,104 Tankered 0% 0 1,104 24 Yangiobod 3,223 Tankered 0% 0 3,223 25 Kahramon 2,800 Tankered 0% 0 2,800 26 Islomobod 3,215 Individual well Chinaz district branch of “Suvokova” 45% 1447 1,768 27 Birlik 1,602 Tankered 0% 0 1,602 28 Kutarma 2,623 Individual well Chinaz district branch of “Suvokova” 78% 2046 577 29 Kerdara 900 Individual well Chinaz district branch of “Suvokova” 10% 90 810 30 Guliston 2,391 Individual well Chinaz district branch of “Suvokova” 20% 478 1,913 31 Ochamayli 2,069 Individual well Chinaz district branch of “Suvokova” 64% 1324 745 32 Yollama 2,378 Individual well Chinaz district branch of “Suvokova” 68% 1617 761 33 Dehkonobod 2,976 Individual well Chinaz district branch of “Suvokova” 51% 1518 1,458 34 Erkin 1,700 Individual well Chinaz district branch of “Suvokova” 30% 510 1,190 35 Chinmasjid 2,925 Individual well Chinaz district branch of “Suvokova” 72% 2106 819 36 S.Ayniy 1,650 Tankered 0% 0 1,650 37 Uzumzor 1,815 Tankered 0% 0 1,815 38 Samarkand 2,676 Tankered 0% 0 2,676 Total for Chinaz District 104,764 38% 39833 64931

94
Appendix 2. Project Areas Water Supply Information
№ Settlement
s Popu-lation
Popula-tion
covered with
centrali-zed WS system
s
Coverage level, %
Wells Pumps Transformers Water Tower Water Distribution Centers Pump stations
Note
Qty Condition Qty Model and condition
Qty Model and
condition Qty
Capacity and
condition
Chlorination
Pumps and
model
Qnty of reser-voirs
Condi-tion
Model of pump
Qty Condi-
tion
Yangiyul District
Total the district
249,947 161,462 64.6 64 17 53 9 15 4 12 12 working
/соз
Yangiyul
city 63,860 63,860 100 10 2 11 3 1 6 6
1 Farkhod 6207 6207 100 7
1 to be reconstructed (3
in reserve)/
1 таъмир талаб
(3-резерв)
5
3=ЭЦВ 12-160-60,
2=ЭЦВ 10-120-60/12 900 м3/сут
(1 in reserve, 1 to
be reconstructed) (1резерв-
1таъмир талаб)
3
1=ТМ –320,
2=КТПС 25/10/0,4, 1=ТМ –
400/10 (in Yagiyul
(Suvokova)
(Янгийўл "Сувокова" ИЧШК)
1
25 м3 (to be
reconstructed)
(таъмир талаб)
1 Diff mono-meter
installed (not
working)
2 Mezon 4011 4011 100
3 S.Sultonova 4309 4309 100
Construction not
completed, belong to Yangiyul
Suvokova/Курилиши тугалланм
аган (Янгийул
"Сувокова ИЧШК"
тасарруфида
4 N.Niyozov/ 4652 4652 100 2
Yangiyul power supply
company/
2= Ц/Б3К6
17kW 2
working/ соз

95
№ Settlement
s Popu-lation
Popula-tion
covered with
centrali-zed WS system
s
Coverage level, %
Wells Pumps Transformers Water Tower Water Distribution Centers Pump stations
Note
Qty Condition Qty Model and condition
Qty Model and
condition Qty
Capacity and
condition
Chlorination
Pumps and
model
Qnty of reser-voirs
Condi-tion
Model of pump
Qty Condi-
tion
Янгийўл ЭТК
5 Ramadon 9957 9957 100 1 1 ЭЦВ 10-120-60/2
200 м3/сут
Yangiyul power supply
company/Янгийўл
ЭТК
3=Ц/Б; 2=3К6-22 kW. 1= 1,5К6-17
kW
3 working/
соз
6 Ishchilar Shaharchasi
4,904 4,904 100 Ц/Б 3К6-
17 kW 1
working/ соз
7 Mukumiy 4,006 4,006 100 1 1 ЭЦВ 10-120-60/2
200 м3/сут
Yangiyul power supply
company/Янгийўл
ЭТК
8 Oltinobod 3790 3790 100 1
1таъмир
талаб/1 to be
reconstructed
1 ЭЦВ 8-63-65/1 200 м3/сут
Yangiyul power supply
company/Янгийўл
ЭТК
9 Fayzobod 6101 6101 100 1 1 ЭЦВ 12-160-90/2
900 м3/сут
Yangiyul power supply
company/Янгийўл
ЭТК
10 Mustakillik 7089 7089 100
11 Nodibergim 4602 4602 100
12 Navruz 4232 4232 100
Yangiyul district,
total
186087
97602 52.45 54 15 42 6 18 4 6 6
U.Musaev 22237 4135 18.60 1 1 1 working/
соз
1 Tuyabuguz 2542 2542 1 16 м3 (to be
reconstr 1=1,5К/6 1
working/ соз

96
№ Settlement
s Popu-lation
Popula-tion
covered with
centrali-zed WS system
s
Coverage level, %
Wells Pumps Transformers Water Tower Water Distribution Centers Pump stations
Note
Qty Condition Qty Model and condition
Qty Model and
condition Qty
Capacity and
condition
Chlorination
Pumps and
model
Qnty of reser-voirs
Condi-tion
Model of pump
Qty Condi-
tion
ucted) (таъмир талаб)
2 Keng Kechik/
2227 240 10.78
3 Mustakillik 2343
4 Khonkurgon 4647 250 5.38
5 Chang Tepa 3088 140 4.53
6 Kush Tepa 2789 200 7.17
7 Qora Tepa 2914 763 26.18
8 Chamanzor 1687
A.Ortikov 27170 7045 25.9 11 3 9 2 1 3 3
1 Chortok 2606 200 7.67
2 Dustlik 2131 160 7.51 1 1 ЭЦВ 6-10-
50
Yangiyul power supply
company/Янгийўл
ЭТК
1
16 м3 (to be
reconstructed)
(таъмир талаб)
3 Samarkand 2485
4 Sayd Ota 2177
5 Galaba 3395 164 4.83 1 1
Yangiyul power supply
company/Янгийўл
ЭТК
1=Ц/Б 17квт-100 (2 400 м3/
сут),
1 working/
соз
6 Inogomov 3010 120 3.987
7 Uzbekiston Bekati
2345 2345 100 2
1 таъмир талаб/1
to be reconstr
ucted
2 ЭЦВ-8-40-
60 ( 40 м3/h)
Yangiyul power supply
company/Янгийўл
ЭТК
1
8 м3 (to be
reconstructed)
(таъмир талаб)
8 Nov 2924 1462 50 1 1
таъмир 1 ЭЦВ8-40-50
Yangiyul power

97
№ Settlement
s Popu-lation
Popula-tion
covered with
centrali-zed WS system
s
Coverage level, %
Wells Pumps Transformers Water Tower Water Distribution Centers Pump stations
Note
Qty Condition Qty Model and condition
Qty Model and
condition Qty
Capacity and
condition
Chlorination
Pumps and
model
Qnty of reser-voirs
Condi-tion
Model of pump
Qty Condi-
tion
талаб/1 to be
reconstructed
supply company/Янгийўл
ЭТК
9 Uzbekiston 3054 1069 35
10 Bakhor 3043 1525 50 6
1 to be recostructed/1
таъмир талаб
(ЭЦВ10-120-55)
4
3=ЭЦВ10-120-55,
1=ЭЦВ8-40-60
Yangiyul power supply
company/Янгийўл
ЭТК
hypoclorite
natrium (satisfac
tory) гипохло
рид натрий (қоника
рли)
1=500m3, 1=D 500 (Utkir Bulok Suvlari company)Ўткир Булок Сувлари МЧЖ)1 дона (резервуаров чистой воды 500 м3) 1шт (марка Д-500).
1=500 м3
working/ишч
и холат
да
(1=Ц/Б Д-500) 1=
Ц/Б17квт-100
2 working/
соз
Niyozbosh 32086 32086 100 13 2 10 3 1 2
1 Ittifok 4207 4207 100
2 Guliston 5139 5139 100
3 Namuna 5450 5450 100
4 Oybek 4131 4131 100
5 Gulbog 4435 4435 100
6 Madaniyat 5027 5027 100 13
2 to be reconstructed (1
in reserve)/
2 таъмир талаб
(1-резерв)
10
ЭЦВ12-255-32 (37 400 м3/сут)
3
2=ТМ-100 ква;
2=ТМ-160 ква;
1=ГКТП – 400-10 а
4 Кв (Yangiyul "Suvokov
a") (Янгийўл
hypoclorite
natrium (satisfac
tory) гипохло
рид натрий (қоника
рли)
2=2000 m3,
1=3000m3, D 500 (Water Intake
"Niyozboshi")/(В/З Ниёзбош
)2 шт (резерву
аров
1=2000 м3. 1=3000м3
working/ишч
и холат
да

98
№ Settlement
s Popu-lation
Popula-tion
covered with
centrali-zed WS system
s
Coverage level, %
Wells Pumps Transformers Water Tower Water Distribution Centers Pump stations
Note
Qty Condition Qty Model and condition
Qty Model and
condition Qty
Capacity and
condition
Chlorination
Pumps and
model
Qnty of reser-voirs
Condi-tion
Model of pump
Qty Condi-
tion
"Сувокова" ИЧШК)
чистой воды 1шт -
2000м3 . 1шт -3000
м3). (марка Д-
500).
7 Pakhta 3697 3697 100
Kush
Yogoch 8542 460 5.4 7 3 4 3 1
1 Kush Yogoch
3856 289 7.49 7
1 to be reconstructed (3
in reserve)/
1 таъмир талаб
(3-резерв)
4 ЭЦВ-10-60-120 ( 120
м3/h) 3
1=ТМ 1600 35/6;
2=ТМ – 100/6-2
(Yangiyul "Suvokova")(Янгий
ўл "Сувокова" ИЧШК)
1
16 м3 (to be
reconstructed)
(таъмир талаб)
2 Baytish 2506 171 6.8
3 Epkendi 2180
E.Kovunchi 24717 14270 57.73 6 4 1
1 Kovunchi 2933 2707 92.3
2 Yoshlik 3179 3179 100 1
1 to be reconstructed/1 таъмир талаб
1 ЭЦВ-10-120-63 ( 120 м3/h)
Yangiyul power supply
company/Янгийўл
ЭТК
3 Kerimkulov 3246 570 17.5 1 1 ( ЭЦВ-6-10-110, м3/h)
Yangiyul power supply
company/Янгийўл
ЭТК

99
№ Settlement
s Popu-lation
Popula-tion
covered with
centrali-zed WS system
s
Coverage level, %
Wells Pumps Transformers Water Tower Water Distribution Centers Pump stations
Note
Qty Condition Qty Model and condition
Qty Model and
condition Qty
Capacity and
condition
Chlorination
Pumps and
model
Qnty of reser-voirs
Condi-tion
Model of pump
Qty Condi-
tion
4 I.Urazov 4248 1830 35.2
5 Kirsadak 3828 2265 59.169
3
6 Jambul 2413 2413 100 3
1 to be reconstructed/1 таъмир талаб
1 ЭЦВ-8-40-
60
Yangiyul power supply
company/Янгийўл
ЭТК
7 Darkhon 2633 480 18.23 1 1 1=ЭЦВ6-10-
110
Yangiyul power supply
company/Янгийўл
ЭТК
1
16 м3 (to be
reconstructed) ( таъмир талаб)
8 Pistalik 2237 826 36.93
Shuralisoy 22464 5610 24.97 11 6 9 10
1 Mizababev 3188 2
1 to be reconstructed/ 1таъмир талаб
1 (ЭЦВ 6-10-
50)
Yangiyul power supply
company/Янгийўл
ЭТК
2
8 м3 (to be
reconstructed)
(таъмир талаб)
2 Islokhat 2028 1
1 to be reconstructed/ 1таъмир талаб
1 1=ЭЦВ8-40-
65
Yangiyul power supply
company/Янгийўл
ЭТК
1
11 м3 (to be
reconstructed)
(таъмир талаб)
3 Okhunbabaev
1938 1
1 to be reconstructed/ 1таъмир талаб
1 1=ЭЦВ 6-
10-50
Yangiyul power supply
company/Янгийўл
ЭТК
1
12 м3 (to be
reconstructed)
(таъмир талаб)
4 Yangiyul 1757 1757 100 2
1 to be reconstructed/ 1таъмир талаб
1 1=ЭЦВ 8-
40-65
Yangiyul power supply
company/Янгийўл
ЭТК
1 12 м3

100
№ Settlement
s Popu-lation
Popula-tion
covered with
centrali-zed WS system
s
Coverage level, %
Wells Pumps Transformers Water Tower Water Distribution Centers Pump stations
Note
Qty Condition Qty Model and condition
Qty Model and
condition Qty
Capacity and
condition
Chlorination
Pumps and
model
Qnty of reser-voirs
Condi-tion
Model of pump
Qty Condi-
tion
5 Khujaobod 2028 2
1 to be reconstructed/ 1таъмир талаб
2 ЭЦВ 6-10-
50
Yangiyul power supply
company/Янгийўл
ЭТК
2
8 м3 (to be
reconstructed)
(таъмир талаб)
6 Shuralisoy 2076 2076 100 1 1 1=ЭЦВ 6-
10-50
Yangiyul power supply
company/Янгийўл
ЭТК
7 Markaz 2897
8 Ittifok 1813 1 8 м3
9 Khakikat 1774
10 Navruz 2965 1777 59.9 2
1 to be reconstructed/1 таъмир талаб
2
1=ЭЦВ 8-40-60,
1=ЭЦВ 6-10-90
Yangiyul power supply
company/Янгийўл
ЭТК
2 8м3
Khalkobod 19252 4194 21.8 1 1 1 1
1 Khalkobod 4035 3147 78
hypoclorite
natrium (satisfac
tory) гипохло
рид натрий (қоника
рли)
1=1000 m3
(Zangiota Suvokova)/(Зангиота "Сувокова
" 1дона 1000м3)
1=1000м3
to be reconstructed/таъм
ир талаб
1=3К6-17 квт
1 working/
соз
2 A.Ikramov 3880
3 A.Navoi 2366
4 Vatan 2660
5 M.Bobur 2324 697 30
6 Bogbon 1931 350 18.13 1
8м3 (to be
reconstructed)

101
№ Settlement
s Popu-lation
Popula-tion
covered with
centrali-zed WS system
s
Coverage level, %
Wells Pumps Transformers Water Tower Water Distribution Centers Pump stations
Note
Qty Condition Qty Model and condition
Qty Model and
condition Qty
Capacity and
condition
Chlorination
Pumps and
model
Qnty of reser-voirs
Condi-tion
Model of pump
Qty Condi-
tion
(таъмир талаб)
7 Mirishkor 2056
Navbakhor 12117 7019 57.9 1 1
1 Dehkonobod
3253 1432 4.4
2 Dangir 3116 230 7.38 1=3К6-17
квт 1
working/ соз
3 Kesken 3768 3768 100
4 Nurobod 1980 1589 80.3
Gulbakhor 12770 8513 66.7 6 1 6
1 Ahil 2190 1 1 ЭЦВ6-10-50
Yangiyul power supply
company/Янгийўл
ЭТК
hypoclorite
natrium (satisfac
tory) гипохло
рид натрий (қоника
рли)
2 Navruz 2067 1 1 1=ЭЦВ 6-
10-50
Yangiyul power supply
company/Янгийўл
ЭТК
hypoclorite
natrium (satisfac
tory) гипохло
рид натрий (қоника
рли)
3 ГулBakhor 2402 2402 100 4
1 to be reconstructed/1 таъмир талаб
4
3=ЭЦВ 8-40-70;
1=ЭЦВ 10-120-60/5
000 м3/сут
Yangiyul power supply
company/Янгийўл
ЭТК
hypoclorite
natrium (satisfac
tory) гипохло
рид

102
№ Settlement
s Popu-lation
Popula-tion
covered with
centrali-zed WS system
s
Coverage level, %
Wells Pumps Transformers Water Tower Water Distribution Centers Pump stations
Note
Qty Condition Qty Model and condition
Qty Model and
condition Qty
Capacity and
condition
Chlorination
Pumps and
model
Qnty of reser-voirs
Condi-tion
Model of pump
Qty Condi-
tion
натрий (қоника
рли)
4 Navbakhor 2394 2394 100
5 Kukalamzor 3717 3717 100
Boz Suv 4732 0 1
1 Dustlik 2298 1
8 м3 (to be
reconstructed)
(таъмир талаб)
2 Umid 2434
№ Settlements and
makhallas Populatio
n
Covered by
central drinking
water supply system
Coverage
level,%
Number of water intakes
Capacity of water facilities,
thnd.m3/day
Daily sale, m3./day Power
consumption for 1 m3
water production
kWt
Consump-tion,lpd
Chlorination type and condition
Fenced, meter Networks and pipelines,km
total including population
trunk mains
including those which
need reconstructio
n
length of
networks
including those to be
reconstructed
total to be
reconstruct-ted
design capacit
y
actual,
thnd.m3
total
Do not comply with
KMK standards
Chinoz District
Total district 125822 60455 48.0 39 8 20.9 17.5 26.1 22.9 9.5 50-150
hypoclorite natrium, satisfactory/гипохлорит нптрий холати коникарли
2026
1576 19.9 14.3 153.95 75.7
Chinoz 13374 4391 32.8 4 2 4.224 3.569 3.569 3.469 0.34 150 480 450 0 0 15.3 5.9
1 Oydin 1972 0 0.0 1 1 0 0 0 0 0 50 0 0 0 0 0 3.3 0
2 Yangi Hayot 2248 0 0.0 0 0 0 0 0 0 0 100 0 0 0 0 0 0 0
3 Kattatepalik 2258 1396 61.8 1 0 0.24 0.2 0.2 0.194 0.18 150
hypoclorite natrium, satisfactory/гипохлорит нптрий холати коникарли
0 0 0 0 3.3 0.5
4 Gulzarobod 2574 2187 85.0 1 0 3.84 3.234 3.234 3.14 0.13 150
hypoclorite natrium, satisfactory/гипохлорит нптрий холати коникарли
450 450 0 0 3.6 1.6
5 Yovvosh 1650 808 49.0 1 1 0.144 0.135 0.135 0.135 0.03 150 0 30 0 0 0 1.9 0.6
6 Yul Tushgan 2672 0 0.0 0 0 0 0 0 0 0 100 0 0 0 0 0 3.2 3.2

103
№ Settlements and
makhallas Populatio
n
Covered by
central drinking
water supply system
Coverage
level,%
Number of water intakes
Capacity of water facilities,
thnd.m3/day
Daily sale, m3./day Power
consumption for 1 m3
water production
kWt
Consump-tion,lpd
Chlorination type and condition
Fenced, meter Networks and pipelines,km
total including population
trunk mains
including those which
need reconstructio
n
length of
networks
including those to be
reconstructed
total to be
reconstruct-ted
design capacit
y
actual,
thnd.m3
total
Do not comply with
KMK standards
Yollama 15856 7042 44.4 7 2 0.996 0.909 0.9 0.9 0.4 150 0 170 130 0 0 19.29 9.1
7 Yollama 2231 1619 72.6 1 0 0.114 0.11 0.11 0.11 0.03 150 0 50 50 0 0 3.2 1.7
8 Pulatov 2292 0 0.0 1 0 0.114 0.12 0.12 0.12 0.03 150 0 0 0 0 0 0 0
9 Kir 3187 0 0.0 0 0 0 0 0 0 0 100 0 0 0 0 0 3.2 1.5
10 Dehkonobod 1383 706 51.0 1 0 0.24 0.2 0.2 0.2 0.18 150 0 50 50 0 0 3.2 2
11 Achamayli 2335 1494 64.0 1 1 0.144 0.144 0.135 0.135 0.03 150 0 0 0 0 0 3 1.3
12 Tilla topgan 1640 1049 64.0 2 1 0.144 0.135 0.135 0.135 0.03 0 20 0 0 0 3.49 1.1
13 Chinmasjid 2788 2174 78.0 1 0 0.24 0.2 0.2 0.2 0.1 120 0 50 30 0 0 3.2 1.5
Olmazor 9051 5002 55.3 1 0 0.24 0.192 2.692 2.692 0.18 50-150 0 0 0 1.5 1 24.26 12.8
14 Navruz 2600 328 12.6 0 0 0 0 0.8 0.8 0 50 0 0 0 0 0 1.08 0.5
15 Rasulobod 1980 1881 95.0 0 0 0 0 0.9 0.9 0 150 0 0 0 1.5 1 3 1.5
16 S.Rakhimov 1845 1365 74.0 0 0 0 0 0 0 0 50 0 0 0 0 0 3.3 3.3
17 Bogbon 1618 728 45.0 1 0 0.24 0.192 0.192 0.192 0.18 150 0 0 0 0 0 8.8 3.8
18 Khamza 1008 700 69.4 0 0 0 0 0.8 0.8 0 150 0 0 0 0 0 8.08 3.7
Uzbekiston 9778 4434 45.3 4 0 0.288 0.27 1.57 1.47 0.06 100-150 0 80 40 1.2 1.2 9.2 4.8
19 Sutbulok 2692 535 19.9 0 0 0 0 0.6 0.5 0 100 0 0 0 1.2 1.2 1.8 0.8
20 Chorvador 1746 1334 76.4 0 0 0 0 0.7 0.7 0 120 0 0 0 0 0 2 0
21 Sutchilar 2490 0 0.0 0 0 0 0 0 0 0 50 0 0 0 0 0 2.5 2.5
22 Birlik 2850 2565 90.0 4 0 0.288 0.27 0.27 0.27 0.06 150 0 80 40 0 0 2.9 1.5
Kutarma 8132 3956 48.6 2 0 1.644 1.435 1.435 1.135 1.43 50-150 0 220 120 0 0 6.6 3.2
23 Dustlik 1239 768 62.0 1 0 1.5 1.3 1.3 1 1.4 150 0 200 100 0 0 3.3 1.4
24 Kutarma 1961 1745 89.0 0 0 0 0 0 0 0 50 0 0 0 0 0 1.2 1.2
25 Birlik 1725 0 0.0 0 0 0 0 0 0 0 50 0 0 0 0 0 0 0
26 Islomobod 3207 1443 45.0 1 0 0.144 0.135 0.135 0.135 0.03 50 0 20 20 0 0 2.1 0.6
Turkiston 10420 1994 19.1 2 0 0.288 0.27 0.27 0.265 0.06 150 330 250 0 0 6 3.2
27 Madaniyat 2278 1184 52.0 1 0 0.144 0.135 0.135 0.13 0.03 150
hypoclorite natrium, satisfactory/гипохлорит нптрий холати коникарли
250 250 0 0 1.8 0
28 Samarkand 2316 810 35.0 1 0 0.144 0.135 0.135 0.135 0.03 150
hypoclorite natrium, satisfactory/гипохлорит нптрий холати коникарли
80 0 0 0 1 0
29 Gayrat 3263 0 0.0 0 0 0 0 0 0 0 50 0 0 0 0 3.2 3.2
30 Tong Yuldizi 2563 0 0.0 0 0 0 0 0 0 0 0 0 0 0 0 0 0 0
Янги Chinoz 4321 4061 94.0 2 0 0.48 0.48 0.412 0.41 0.36 150 220 220 0 0 5.5 2.5
31 Markaziy 2132 2004 94.0 1 0.24 0.24 0.206 0.205 0.18 150
hypoclorite natrium, satisfactory/гипохлорит нптрий холати коникарли
20 20 0 0 2.5 1.5

104
№ Settlements and
makhallas Populatio
n
Covered by
central drinking
water supply system
Coverage
level,%
Number of water intakes
Capacity of water facilities,
thnd.m3/day
Daily sale, m3./day Power
consumption for 1 m3
water production
kWt
Consump-tion,lpd
Chlorination type and condition
Fenced, meter Networks and pipelines,km
total including population
trunk mains
including those which
need reconstructio
n
length of
networks
including those to be
reconstructed
total to be
reconstruct-ted
design capacit
y
actual,
thnd.m3
total
Do not comply with
KMK standards
32 Obi Khayot 2189 2057 94.0 1 0.24 0.24 0.206 0.205 0.18 150
hypoclorite natrium, satisfactory/гипохлорит нптрий холати коникарли
200 200 0 0 3 1
Eski Toshkent 15583 6263 40.2 3 1 1.08 1.015 1.015 0.965 0.56 150 0 0 3 3 15.5 6
33 Akhillik 4049 2915 72.0 1 0 0.24 0.21 0.21 0.21 0.18 150 0 0 0 1 1 3.5 2
34 Navruz 3542 1168 33.0 1 0 0.24 0.205 0.205 0.205 0.18 150
hypoclorite natrium, satisfactory/гипохлорит нптрий холати коникарли
0 0 0 0 2 1
35 Beshkapa 2987 2180 73.0 1 1 0.6 0.6 0.6 0.55 0.2 150
hypoclorite natrium, satisfactory/гипохлорит нптрий холати коникарли
0 0 2 2 2.8 1.8
36 A.Timur 5005 0 0.0 0 0 0 0 0 0 0 100 0 0 0 0 0 7.2 1.2
Islokhat 7240 4112 56.8 5 3 2.14 1.8 1.8 1.8 1.33 50-100 290 270 14.2 9.1 5.7 4.5
37 U.Nosir 2210 1809 81.9 0 0 0 0 0 0 0 50 0 0 0 0 0 2.5 2.5
38 Ohunboboev 2784 1809 65.0 1 1 0.24 0.2 0.2 0.2 0.18 100 0 50 30 0 0 3.2 2
39 Dustlik 2246 494 22.0 4 2 1.9 1.6 1.6 1.6 1.15 100
hypoclorite natrium, satisfactory/гипохлорит нптрий холати коникарли
240 240 14.2 9.1 0 0
Eshonobod 6211 0 0.0 0 0 0 0 0 0 0 50 0 0 0 0 0 1.5 1.5
40 Kanalobod 3115 0 0.0 0 0 0 0 0 0 0 0 0 0 0 0 0 0 0
41 Yangiobod 3096 0 0.0 0 0 0 0 0 0 0 50 0 0 0 0 0 1.5 1.5
Chinoz city 25856 19200 74.3 9 0 9.484 7.56 12.39 9.772 4.76 150 236 96 0 0 45.1 22.2
42 Pahtaobod 1400 448 32.0 0 0 0 0 0.26 0.208 0 120
hypoclorite natrium, satisfactory/гипохлорит нптрий холати коникарли
0 0 0 0 4.5 4.5
43 Yangiobod 1234 246 19.9 1 0 0.24 0.24 0.24 0.2 0.18 150 0 0 0 0 3.6 0
44 Yoshlik 1239 1239 100.0 1 0 1.56 1.06 1.06 1 2.1 150 20 0 0 0 1.8 0.8
45 Khamza 1797 1347 75.0 1 0 0.144 0.12 0.12 0.114 0.03 120 0 0 0 0 4.5 2.2
46 Avgon 2500 2365 94.6 1 0 2.8 2 2 1.5 0.78 150 40 40 0 0 3.9 1.9
47 Yangi mahalla 1734 888 51.2 0 0 0 0 1.2 0.8 0 120 0 0 0 0 4.5 2.2
48 Ishchilar shaharchasi 1934 1740 90.0 1 0 1.56 1.56 1.06 0.7 0.14 150 16 16 0 0 3.3 1.6
49 Navoi 1700 1608 94.6 0 0 0 0 1.5 1.2 0 150 0 0 0 0 4.8 2.1
50 Khuja 3557 2205 62.0 0 0 0 0 1.2 0.8 0 150 0 0 0 0 3.3 1.7
51 Okoltin 2780 2530 91.0 1 0 2.8 2.2 2.2 2 0.78 150 40 40 0 0 4.5 1.5
52 I.Sharipo 2225 1891 85.0 2 0 0.57
53 Beshkapa 2500 1685 67.4 1 0 0.38 0.38 0.35 0.25 0.18 150 120 0 0 0 3.2 1.5
54 Kozi 1256 1008 80.3 0 0 0 0 1.2 1 0 150 0 0 0 0 3.2 2.2

Appendix 3. Assessment of the Water Distribution Centres and Pumping Stations

106
Yangiyul district
Wellfield VU-1
Location: Kuyi-Chirchik district of Tashkent province. Area: 4 ha. Year of commissioning: 1982. According to design documents, capacity of the facility: 130 000 m3/day.
Current volume of water supplied to trunk main: 40 000 -50 000 m3/day. The facility includes:
• Wells – 27 units: 8 functional, 6 working.
Wells are equipped with pumps ЭЦВ 12-255-40. There are no shelters on wells. There are no access doors and no meters.
• 1 reservoir 2000 m3;
There is no access door, filters absorbers, devices
• II lift pump station.
Subsurface building (66х12м) of pumping station is in unsatisfactory condition. The pumping station is designed for 6 pumps where only pump is working (1250 m3/h). Load carrying equipment needs repair. The pumping station is operated manually.
• Chlorination plant. Design capacity = 5 kg chlorine/hour.
There is no chlorinating equipment. Water is chlorinated with hypochlorite sodium manually. Building
of the plant needs major repair.
• Administrative - ancillary building;

107
There is no equipment for chemical and bacteriological laboratories. Analysis of water is impossible.
Administrative building is not equipped and needs major repair.
Power for water intake facility is supplied from substation 110/35/6 kW «Suvchi» which is located on
the territory of the wellfield. The substation belongs to district power supply company. The substation
110/35/6 kW supplies power through double circuit line 110 kW. There is only one transformer 6300
kW. The second transformer is missing. Power control point RU-6kW is unsatisfactory condition.
Survey and repair are required.
Power control unit RU-6 kW with panels KSO-272 and transformer substation KTP-2х630-6/0,4 kW
are installed in the substation.
Transformer substation КТП-2х630-6/0,4 kW is working but needs to be surveyed and partially
repaired.
Power for well No. 26 is supplied by substation КТП-100/10/0,4 kW substation constructed in 1984
and which is located near the well.
• Wells No. 24 and No. 25 are supplied by substation КТПс-160/10/0,4 kW constructed in 2011 and
which is located near wells.
• Wells No. 1 and No. 2 are supplied by substation КТП-100/10/0,4 kW constructed in 1982 and which
is located near wells.
• Wells No. 14, 15 and No. 16 are supplied by substation КТП-250/10/0,4 kW constructed in 1991 and
which located near the wells.
• Wells No. 17, 18 and No. 19 are supplied by substation КТП-250/10/0,4 kW constructed in 1988 and
which is located near the wells.

108
• Wells No. 20, 21 and No. 22 are supplied by substation КТП-250/10/0,4 kW constructed in 1984 and
which is located near the wells.
There are no other transformer substations for supplying remaining wells.
There is mismatch between the voltage class of transformer substation and step-down transformer at
substation «Suvchi» (10 kW and 6 kW accordingly). It is necessary to determine actual voltage class
of water intake site.
There are not central panel for operating pumps and remote alarm panel.
The central control panel of the pumping units and remote alarm panel of pumping stations of the wells
are missing.
2,5 km of power supply lines ВЛ-6кВ were dismantled.
Power supply equipment in all auxiliary buildings were dismantled.
There is no security lighting of the territory.
The site is fenced. The fence does not comply with requirements of KMK standard.
Water is supplied to Chinaz city by schedule.
Pump Distribution center VU-3
Year of construction - 1982
Location – Yangiyul district.
The facility is on inventory of Zangiata “Suvokova”.
VU-3 supplies water from VU-1 to part of population of Zangiata and Yangiyul districts.
The facility includes:
Clean water reservoirs 2 x 2000 m3 (two prefabricated reinforced-concrete and one steel round reservoir D = 15 m). The reservoirs are in working condition however they need to be cleaned, repaired and equipped with filters-absorbers. Only reinforced-concrete reservoirs can be used further. Steel reservoir was installed not according to design and can be filled partially (4 meters instead of 9). Dyking of working reservoir is destroyed partially, there are no filters-absorbers.
III lift pump station. Area 70х12х9,3 m. It is made of reinforced concrete. Six pumps can be installed in the pumping station. There is one pump with capacity of 1600 m3/h and pressure = 90 m. and one pump with capacity 1250 m3/h and pressure 120 m. Load lifting equipment is in emergency condition. There are leakages on the roof.
Sodium hypochlorite is used for chlorinating of water. Temporary shelter installed on reservoir is used as water chlorination place.
Building of chlorination plant is made of brick with area of 12 x 12 m. There is no equipment in the building.

109
Power is supplied from substation “Botir”.
VU-3 territory is fenced with reinforced-concrete fence. Area of guard house is 3х6 m and it needs to be reconstructed. Auxiliary buildings are actually broken.
The WDC «VU-3» supplies water through trunk mains to Zangiata district and Yangiyul district by schedule: two days to Zangiota and two days to Yangiyul district.
WDC «Khalkabad»
The facility was constructed before 1983. It is located in Yagiyul district, on northern part of Khalkabad village. It is on inventory of Yangiyul district Suvokova. Area of the facility 0,7.
Water is supplied to WDC from «VU-1» wellfield through water distribution point VU-3 and trunk main Ø800 mm. From trunk main Ø200 mm constructed in 2013 water is supplied to clean water reservoirs.
The WDC is designed for supplying water to rural settlements Khalkabad, Ikramov, Mirishkor and Navoi.
The WDC includes the following facilities:
• Reinforced concrete clean water reservoirs 2 x 500 m3;
Diking of reservoirs is damaged. There are no access doors, filters, devices.
• II lift pump station. Subsurface building (9х7м) is in satisfactory condition. The building was reconstructed in 2013. There is no load carrying equipment in the pumping station. Windows are made of glazed frames. The building needs current repair. Two pumps are installed in the pumping station К80-50-200 N=15 kW capacity 50 m3/h, pressure 50 m (only one pump is working). The pumping station is operated manually.
• There is no building for chlorination plant. Water is not chlorinated.
• There is not checkpoint;
• Power is supplied to the facility by substation КТП-63/10/0,4 kW constructed in 1981 and which is located on territory of WDC. Power is supplied by power line ВЛ 0,4 kW = 120 m. The trunk line ВЛ 10 kW goes through the site territory.
The WDC site is fenced with reinforced concrete fence. There is no security lighting. The fence does not comply with the requirements of КМК standards.
Water is supplied to the WDC «Khalkabad» by schedule – 2 days a week.

110
Water Distribution Center “Chinor”
The facility is located in Zangiata district. Currently it is on the balance of Zangiata district Suvokova.
Area of the site 3,5 ha.
The URV is supplied from VU-1 VU-3 connection 24 hours. The URV supplies water to settlements
of Dekhkonobod and Chinor and also to wine – vodka producing plant.
The facility includes:
Clean water reservoir 1000 m3 (in normal condition). There are no filters-absorbers.
Subsurface brick II-lift pump station (9х7 m) includes two groups of pumps:
First group: – 1 pump 3К6 with capacity 60 m3/h, pressure 50 m supplies water to wine-vodka
production plant and provides water for fire hydrant.
Second group – 2 pumps with capacity 90 m3/h and pressure 32 m (1 working/1reserve) supply
water to makhallas Dehkonobod and Chinor. There is not load carrying equipment. There are
leakages on roof, the floor is partially broken. Windows and doors are in unsatisfactory condition.
There is no chlorination plant. Water is chlorinated with hypoclorite natrium directly in reservoir.
Transformer substation KTP 160-6/0,4 kW needs repair.
Power supply. The site is supplied by substation КТП-160/6/0,4 kW manufactured in 1972. Post of
ВЛ 6 kW near substation deformed and needs replacement. Trunk line ВЛ 6 kW goes near the site
at about 50 m. distance. Main distribution panel is supplied through line ВЛ 0,4 kW.
The site has no fencing.
There is no checkpoint.
The makhallas Chinor and part of makhalla Dehkonobod are supplied 24 hours. Upper part of
makhalla Dehkonobod is supplied by schedule on alternate days by 2 hours/day. This is because
old distribution networks of the village which can not withstand water pressure and this leads to
frequent break downs.
Wine – vodka production plant is supplied every day during operation hours of the plant.
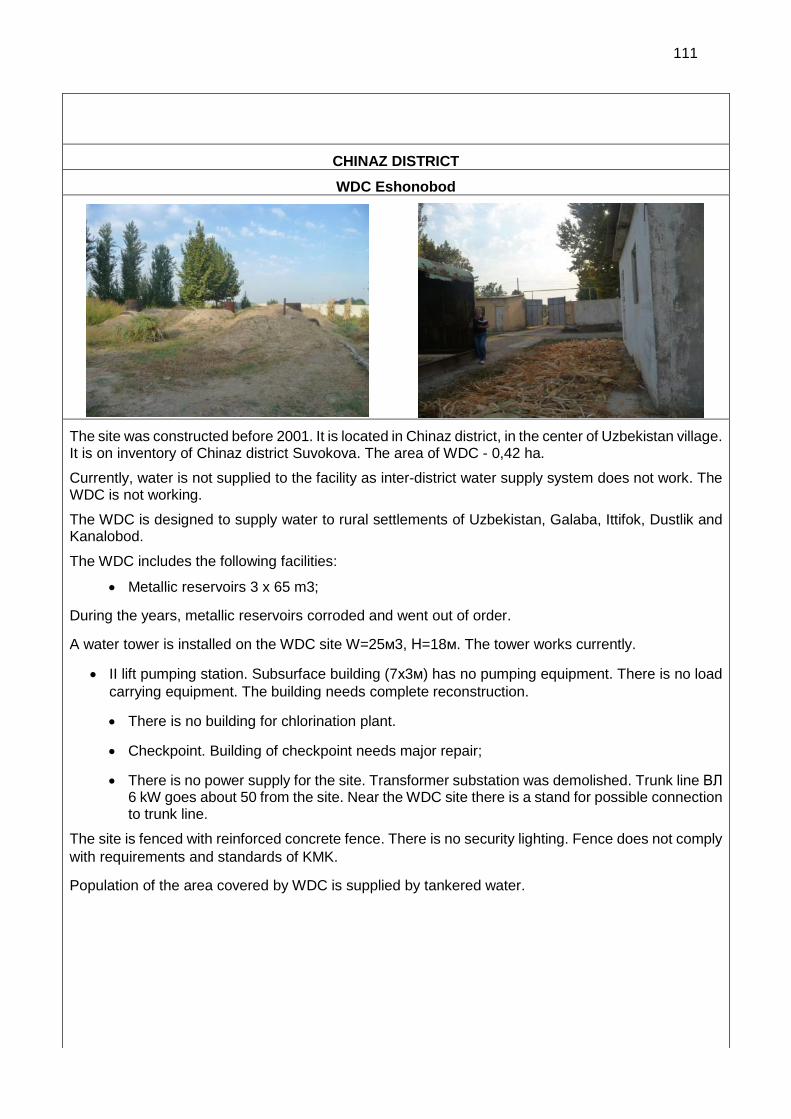
111
CHINAZ DISTRICT
WDC Eshonobod
The site was constructed before 2001. It is located in Chinaz district, in the center of Uzbekistan village. It is on inventory of Chinaz district Suvokova. The area of WDC - 0,42 ha.
Currently, water is not supplied to the facility as inter-district water supply system does not work. The WDC is not working.
The WDC is designed to supply water to rural settlements of Uzbekistan, Galaba, Ittifok, Dustlik and Kanalobod.
The WDC includes the following facilities:
• Metallic reservoirs 3 x 65 m3;
During the years, metallic reservoirs corroded and went out of order.
A water tower is installed on the WDC site W=25м3, Н=18м. The tower works currently.
• II lift pumping station. Subsurface building (7х3м) has no pumping equipment. There is no load
carrying equipment. The building needs complete reconstruction.
• There is no building for chlorination plant.
• Checkpoint. Building of checkpoint needs major repair;
• There is no power supply for the site. Transformer substation was demolished. Trunk line ВЛ 6 kW goes about 50 from the site. Near the WDC site there is a stand for possible connection to trunk line.
The site is fenced with reinforced concrete fence. There is no security lighting. Fence does not comply
with requirements and standards of KMK.
Population of the area covered by WDC is supplied by tankered water.

112
WDC Sutbulak
Area - 1 ha.
Year of construction - 1984.
Location – Chinaz district, eastern part of Sutbulok village. It is on inventory of Chinaz Suvokova.
Currently water is not supplied to the WDC due to breakdown of supply pipelines. WDC is not functioning.
The WDC is designed to supply water to rural settlements of Sutbulok, Birlik, Khudoyberganova, WDC Madaniyat and WDC Amir Timur.
The WDC includes the following facilities:
• Reinforced concrete reservoirs 2 x 1000 m3;
Diking of clean water reservoirs is deteriorated. There are not access doors, filters-absorbers and
devices.
• II lift pumping station (6х12 m.) has no pumping equipment. Also, there is no load carrying
equipment. Building of the pumping station needs full reconstruction.
• There is no building or shelter for chlorination plant.
• Checkpoint. Building of the checkpoint needs major repairs;
• There is no power supply for the site. Transformer substation was dismantled. There is no trunk line ВЛ 6 kW near the WDC.
The WDC is fenced with reinforced-concrete fence. There is no security lighting. Fence does not
comply with national KMK standards.
Population of the area covered by the WDC is supplied by tinkered water.

113
WDC «Madaniyat»
Area – 0.7 ha.
Year of construction - 1985.
Location – Chinaz district, eastern part of Madaniyat village. It is on inventory of Chinaz Suvokova.
Currently water is not supplied to the WDC due to breakdown of supply pipelines. WDC is not functioning. A well was drilled on the territory of WDC which supplies water to through water tower located near houses.
WDC is designed to supply water to rural settlements of Madaniyat, Samarkand, Uchkun as well as WDC «Amir Timur».
The WDC includes the following facilities:
• Reinforced concrete reservoirs 2 x 500 m3;
Diking of clean water reservoirs is deteriorated. There are not access doors, filters-absorbers and
devices.
• II lift pumping station (6х12 m.) has no pumping equipment. Also, there is no load carrying
equipment. Building of the pumping station needs full reconstruction.
• There is no building or shelter for chlorination plant.
• Checkpoint. Building of the checkpoint needs major repairs.
• Power is supplied to WDC site by substation КТП-160/10/0,4 kW constructed in 1985 on the territory of WDC. Trunk line goes near the WDC site.
The WDC site is fenced with reinforced-concrete fence. There is no security lighting. The fencing does
not comply with requirements of requirement of national KMK standard.
Rural settlements in the area covered by WDC are supplied by tankered water.

114
WDC «Yangiabad»
Area – 0.9 ha.
Year of construction - 1985.
Location – Chinaz district, southern part of Yangiobod village. It is on inventory of Chinaz Suvokova.
Currently water is not supplied to the WDC due to breakdown of supply pipelines. WDC is not functioning. A well was drilled on the territory of WDC which supplies water to standpipe.
The WDC is designed to supply water to rural settlements of Yangiobod and Norkuzieva.
The WDC includes the following facilities:
• Reinforced concrete reservoirs 2 x 500 m3;
Diking of clean water reservoirs is deteriorated. There are not access doors, filters-absorbers and
devices.
• II lift pumping station (6х12 m.) has no pumping equipment. Also, there is no load carrying
equipment. Building of the pumping station needs full reconstruction.
• There is no building or shelter for chlorination plant.
• Checkpoint. Building of the checkpoint needs major repairs.
• Power is supplied to WDC site by substation КТП-160/6/0,4 kW located in the territory of
WDC (currently a rural settlement is connected to the substation). Trunk line ВЛ 6 kW goes
near the WDC site
The WDC site is fenced with reinforced-concrete fence. There is no security lighting. Fence does not
comply with national standard.
Rural settlements in the area covered by WDC are supplied by tankered water.

115
WDC «Kutarma»
Area – 0.9 ha.
Location – Chinaz district, north-eastern part of Yangiobod village. It is on inventory of Chinaz Suvokova. WDC is not functioning. A well was drilled on the territory of WDC which supplies water to standpipe. The WDC facility includes the following facilities:
• Reinforced concrete reservoirs 2 x 500 m3;
Clean water reservoirs do not have slab roofs, access-doors, filters, devices. The reservoirs must be
demolished with further construction of new reservoirs.
• There is no II lift pump station.
• There is no building or shelter for chlorination plant.
• Checkpoint. Building of the checkpoint needs major repairs.
• There is no power supply for the site. Transformer substation was dismantled. Trunk line ВЛ 6 кВ goes about 500 m from the WDC site.
The WDC site has reinforced concrete fence. There is no security lighting. Fencing does not comply
with KMK standards. Rural settlements in the area covered by WDC are supplied by tankered water.
WDC «Yallama»
Area – 0.9 ha. Year of construction - 1984. Location – Chinaz district, northern part of Yallama village. It is on inventory of Chinaz Suvokova.

116
The WDC is designed to supply water to rural settlements of Yallama, Dehkonobod, Kir, Erkin and Chinmasjid. Currently, water is supplied to reservoirs from wells. 1 of 2 wells is working. The well is equipped with pump ЭЦВ 8. Shelter of the well is primitive, made of asbestos board. Well pump operation apparatus is installed inside. The WDC includes the following facilities:
• Reinforced concrete reservoirs 2 x 500 m3;
Diking of clean water reservoirs is deteriorated. There are not access doors, filters-absorbers and
devices
• II lift pumping station includes 3 pumps. 2 of them are working and 1 is not working, in dismantled
condition. There is electric beam crane. Building of pump station needs full reconstruction.
• There is no building or shelter for chlorination plant.
• Checkpoint. Building of the checkpoint needs major repair.
• Power is supplied by transformer substation КТП-160/10/0,4 kW constructed in territory of WDC in 1989. Trunk line ВЛ 10 kW goes near the WDC site.
The WDC site has reinforced concrete fence. There is no security lighting. Fencing does not comply
with KMK standards. The fence does not comply with requirements of national standard of KMK
Rural settlements in the area covered by the WDC are supplied by tankered water.
Water Intake facility «Chinaz»
Area – about 2 ha. Location – Chinaz city Year of construction - 1962. Water from the wellfield is supplied to the city water distribution network by I lift pump station. The wellfield includes the following facilities:
• 5 wells, 3 of which working. The wells are equipped with pumps ЭЦВ12-255. Depth of wells
150 m.
• There is water distribution point;
• Water is chlorinated manually;
• There is no equipment in laboratory for chemical and bacteriological analysis of water. In this
regard it is impossible to analyse quality of water;
• There are no necessary equipment in the workshop;
• Storehouse needs repair;
• There are no administrative building and garage ;
• Power supply. The site is supplied by substation ТП-63/10/0,4 kW located in territory of the
water intake. Trunk line ВЛ 10 kW goes near the site. Facilities of the facility are supplied by
line КЛ 0,4 kW, each well is supplied by lines ВЛ 0,4 кВ. Electric equipment got old, rusted
and operated manually.
The site is fenced which does not comply with requirements of KM standard.
Water is supplied to Chinaz city on schedule basis.

117
Water Intake facility «Dustlik» Almazar
Area – about 3 ha. Location – Chinaz district Year of construction - 1976.
• Water from the wellfield is supplied to the two reservoirs with volume 1000 m3 each and then
to rural settlements water distribution network by II lift pump station. Due to expiry of the
service life (more than 30 years) in the wells, the isolation of the upper aquifers was disturbed,
as a result of which the mineralization of the water in the wells increased and did not
correspond to the norm.
The wellfield includes the following facilities:
• 5 wells, 2 of which working. Depth of wells 150 m. The wells are equipped with pumps
ЭЦВ10-63-65.
• Two reservoirs with volume of 1000 m3 each;
• II lift pump station;
• Water is chlorinated manually;
• There is no equipment in laboratory for chemical and bacteriological analysis of water. In this
regard it is impossible to analyse quality of water;
• There are no administrative building and garage;
• Power supply. The site is supplied by substation ТП-63/10/0,4 kW located in territory of the
water intake. Trunk line ВЛ 10 kW goes near the site. Facilities of the facility are supplied by
line КЛ 0,4 kW, each well is supplied by lines ВЛ 0,4 кВ. Electric equipment got old, rusted
and operated manually.
The site is fenced which does not comply with requirements of KM standard.
Water is supplied to nearby villages on schedule basis – 2 hours two times a day

118
Appendix 4. Age and Material of Water Pipes per District
Age and material of water pipelines in the project area in Yangiyul district
Service Years Cast Iron
(CI) Ductile Iron
(DI)
Asbestos Cement
(AC)
Polyethylene (PE)
Totals
Total 10.6 33.9 3.2 25.4 73.1
<30 years 24.7 24.7 <30 years % 33.79% 33.79%
30-40 years 2.7 24.1 3.2 0.7 30.7 30-40 years % 3.69% 32.97% 4.38% 0.96% 42.00%
>40 year (km) 7.9 9.8 17.7 >40 year (%) 10.81% 13.41% 24.21%
Age and material of water pipelines in the project area in Chinaz district
Service Years Cast Iron
(CI) Ductile Iron (DI)
Asbestos Cement
(AC)
Polyethylene (PE)
Totals
Total (km) 5.4 126.6 22 154
<30 years (km) 22 22 <30 years % 14.29% 14.29%
30-40 years (km) 10.3 10.3 30-40 years % 6.69% 6.69%
>40 year (km) 5.4 116.3 121.7 >40 year (%) 3.51% 75.52% 79.03%

119
Appendix 5. Water Networks Condition Information
Yangiyul district
Settlement/Ахоли пункти
Pipe diameter/Диаметр
труб
Length, km/Длина (км)
Pipe material/Материал Year of
installation/Йил
1 Bozsu urban type village/пгт Бозсу 100 2.0 Ductile Iron/Сталь 1978
80 2.7 Ductile Iron/Сталь 1978
2 Dustlik/н.п.Дустлик 110 0.7 PVC/ПВХ 2010
3 Galaba/н.п.Галаба 100 1.6 Cast Iron/Чугун 1975
4 Yangi Makhalla/н.п.Янги махалля 150 1.8 Ductile Iron/Сталь 1978
5 Markaz/н.п.Марказ No pipe networks
6 Shuralisoy/н.п.Шуралисой 110 7.7 PVC/ПВХ 2014
7 Ohunboboev/н.п.им. Охунбобоева No pipe networks
8 Hakikat/н.п.Хакикат 110 2.1 PVC/ПВХ 2008
9 Babur/н.п.им. Бобура 150 2.6 Ductile Iron/Сталь 1976
10 Marifat/н.п.Маърифат No pipe networks
11 Sharafobod/н.п.Шарафобод No pipe networks
12 Kanalbuyi/н.п.Каналбуйи No pipe networks
13 Vatan/н.п.Ватан 150 4.4 Ductile Iron/Сталь 1978
14 Mirishkor/н.п.Миришкор
160 3.4 PVC/ПВХ 2015
150 1.8 Ductile Iron/Сталь 1978
80 2.0 Ductile Iron/Сталь 1978
15 Khalkobod/н.п.Халкобод No pipe networks
16 Navoi/н.п.им. Навои
150 4.0 Cast Iron/Чугун 1972
50 1.1 Ductile Iron/Сталь 1972
80 3.8 Ductile Iron/Сталь 1972
17 Nurobod/н.п.Нуробод 100 1.8 Ductile Iron/Сталь 1980
18 Keskan/н.п.Кескан 159 5.0 PVC/ПВХ 2014

120
Settlement/Ахоли пункти
Pipe diameter/Диаметр
труб
Length, km/Длина (км)
Pipe material/Материал Year of
installation/Йил
19 Dangir/н.п.Дангир 110 3.3 PVC/ПВХ 2015
20 Turkis/н.п.Туркис 400 0.7 Cast Iron/Чугун 1965
21 Kaksha/н.п.Какша 500 0.6 Ductile Iron/Сталь 1965
22 Yangiobod/н.п.Янгиобод 100 2.0 Ductile Iron/Сталь 1978
23 Kushtepa/н.п.Куштепа No pipe networks
24 Changtepa/н.п.Чангтепа 159 4.0 Ductile Iron/Сталь 1978
25 Khonkurgon/н.п.Хонкургон 250 3.2 Asbestos/Асбест 1978
26 Kengkechik/н.п.Кенгкечик 100 1.6 Ductile Iron/Сталь 1980
27 Mustakillik/н.п.Мустакиллик 89 1.7 Ductile Iron/Сталь 1975
28 Tuyabugiz/н.п.Туябугиз 110 2.5 PVC/ПВХ 2013
29 Inogomova/н.п.им. Иногомова No pipe networks
30 Uzbekiston/н.п.Узбекистон 159 2.7 Cast Iron/Чугун 1982
31 Galaba/н.п.Галаба 100 1.6 Cast Iron/Чугун 1975
32 Mirzaboboeva/н.п.им. Мирзабобоева 100 0.7 PVC/ПВХ 1979
33 Said Ota/н.п.Саид ота No pipe networks
Chinaz district
Settlement/Населенный пункт Pipe diameter/ Диаметр труб
Length, km/Длина (км)
Pipe material/Материал Year of
installation/Йил
1 Chinoz city/г.Чиноз
50 1.9 Ductile Iron/Железо 1971
75 9 Ductile Iron/Железо 1971
75 1.7 Polyethelene/ПЭ 2013
100 8.2 Ductile Iron/Железо 1974
110 3.2 Polyethelene/ПЭ 2015
150 12 Ductile Iron/Железо 1972
150 1.4 Cast Iron/Чугун 1974

121
Settlement/Населенный пункт Pipe diameter/ Диаметр труб
Length, km/Длина (км)
Pipe material/Материал Year of
installation/Йил
160 4.5 Ductile Iron/Железо 1975
200 18.6 Ductile Iron/Железо 1972-77
700 1 Ductile Iron/Железо 1980
2 Birlik urbanized village/пгт. Бирлик 110 3.8 Polyethelene/ПЭ 2015
3 A.Temur urbanized village/пгт.А.Темур 100 1.5 Ductile Iron/Железо 1968
110 6 Polyethelene/ПЭ 2013
4 Kir urbanized village/пгт Кир 100 2.5 Ductile Iron/Железо 1976
5 Uzbekiston urbanized village/н.п.Узбекистон 100 2.7 Ductile Iron/Железо 1976
6 Galaba/н.п.Галаба 100 1.7 Ductile Iron/Железо 1969
7 Ittifok/н.п.Иттифок 100 1.4 Ductile Iron/Железо 1968
8 Dustlik/н.п.Дустлик 100 1.2 Ductile Iron/Железо 1967
9 Kanalobod/н.п.Каналобод 150 2.7 Ductile Iron/Железо 1976
10 S.Rakhimov/н.п.им.С.Рахимова 100 2.7 Ductile Iron/Железо 1978
11 Sutbulok/н.п.Сутбулок 110 1.8 Cast Iron/Чугун 1972
12 A.Khudoybergenov/н.п.им. А.Худойберганова
100 2.7 Ductile Iron/Железо 1978
13 Gayrat/н.п.Гайрат 110 2.9 Ductile Iron/Железо 1972
14 Abzalobod/н.п.Абзалобод 150 2 Ductile Iron/Железо 1960
15 Olmos/н.п.Олмос 110 2.2 Ductile Iron/Железо 1968
16 Mevazor/н.п.Мевазор 100 1.3 Ductile Iron/Железо 1972
17 Okhunboboev/н.п.Охунбобоев 150 2.8 Ductile Iron/Железо 1972
18 Arhcazor/н.п.Арчазор No pipes No pipes
19 Tillaobod/н.п.Тиллаобод 100 1.4 Ductile Iron/Железо 1971
110 1.9 Polyethelene/ПЭ 2012
20 Safarobod/н.п.Сафаробод 100 1.4 Ductile Iron/Железо 1972
21 Uchkun/н.п.Учкун 110 2.7 Ductile Iron/Железо 1978
22 Madaniyat/н.п.Маданият 75 2.5 Ductile Iron/Железо 1968
100 2.2 Ductile Iron/Железо 1973
23 Norkuzieva/н.п.им. Норкузиева 100 1 Ductile Iron/Железо 1973

122
Settlement/Населенный пункт Pipe diameter/ Диаметр труб
Length, km/Длина (км)
Pipe material/Материал Year of
installation/Йил
24 Yangiobod/н.п.Янгиобод 110 1.6 Polyethelene/ПЭ 2007
25 Kakhramon/н.п.Кахрамон 50 1 Ductile Iron/Железо 1972
100 1.8 Ductile Iron/Железо 1972
26 Islomobod/н.п.Исломобод 150 2.2 Ductile Iron/Железо 1973
27 Birlik/н.п.Бирлик 100 1.2 Ductile Iron/Железо 1979
28 Kutarma/н.п.Кутарма 110 3.8 Polyethelene/ПЭ 2015
29 Kerdara/н.п.Кердара 150 1.8 Ductile Iron/Железо 1975
30 Guliston/н.п.Гулистон 100 1.1 Ductile Iron/Железо 1976
31 Ochamayli/н.п.Очамайли 100 2.3 Ductile Iron/Железо 1972
32 Yollama/н.п.Ёллама 100 2.5 Ductile Iron/Железо 1973
33 Dehkonobod/н.п.Дехконобод 150 2.7 Ductile Iron/Железо 1973
34 Erkin/н.п.Эркин 100 4.5 Ductile Iron/Железо 1974
35 Chinmasjid/н.п.Чинмасжид 110 2.3 Ductile Iron/Железо 1974
36 S.Ayniy/н.п.им. С.Айний 160 1.5 Ductile Iron/Железо 1974
37 Uzumzor/н.п.Узумзор 100 0.8 Ductile Iron/Железо 1975
38 Samarkand/н.п.Самарканд 75 4.2 Ductile Iron/Железо 1972
100 2.2 Cast Iron/Чугун 1972

Appendix 6. Infectious Disease Data
Data on infectious disease in Yangiyul district (cases/100,000)
Disease/Заболевание 2006
2007
2008
2009
2010
2011
2012
2013
2014
2015
Typhoid fever/Брюшной тиф 2 4 2 1 1 - - - 1 1
Salmonellosis/Сальмонеллез 32 42 24 38 45 47 10 6 6 2
Dysentery/Дизентерия 81 80 111
50 88 78 69 38 92 88
Acute intestinal disease/ОКЗ 280
330
193
153
484
686
197
149
344
374
Viral hepatitis type A/Вирусный гепатит А
270
428
356
317
395
333
329
587
728
392
Tuberculosis/Туберкулез 112
93 87 91 144
152
174
143
143
132
Enterobiasis/Энтеробиоз 2602
3046
3537
2750
1802
2445
2632
2686
Data on infectious disease in Chinaz district (cases/100,000)
Disease/Заболевание 2006
2007
2008
2009
2010
2011
2012
2013
2014
2015
Typhoid fever/Брюшной тиф - - - - - - - - - -
Salmonellosis/Сальмонеллез 5 6 14 18 26 14 8 11 8 3
Dysentery/Дизентерия 18 32 35 24 34 27 19 25 28 29
Acute intestinal disease/ОКЗ 141
99 107
109
113
79 101
62 44 60
Viral hepatitis type A/Вирусный гепатит А
141
128
122
149
141
168
78 177
252
219
Tuberculosis/Туберкулез 96 95 91 108
83 66 68 77 68 98
Enterobiasis/Энтеробиоз 679
738
767
762
829
1030
1138
1013
Source: Sanitary and Epidemiological Services
Uro-genital system disease – intense Indicator
District 2007 2008 2009 2010 2011 2012 2013 2014 2015
Chinaz District 488.6 642.1 622.3 734.7 724.5 617.1 605.1 603.1 592.5
Yangiyul District 231.8 267.7 389.7 247.5 190.5 253.2 431.6 429.2 425.1

124
Appendix 7. Analysis of Groundwater from Major Wellfields
№
№ o
f sam
ple
Wellfiled
name
Physical properties Hardne
ss
рН
Dry
residu
e
Uni
ts
Anions
Total
anio
ns
Cations
Total
catio
ns
F –
fluo
rine,
mg/
L
Water salinization formula
(% meq.)
Na
on fl
ame
phot
omet
er. m
g/L
Experi
mental
Des
crip
tion
Pro
pert
ies
Total
Carbon
ate
Car
bona
te io
n
СО
3
Hyd
roca
rbon
ate
ion
HC
O3
Chl
orin
e io
n C
l
Sul
phat
e io
n S
O4
Nitr
ate
ion
NO
3
Nitr
ite io
n N
O2
Cal
cium
ion
Са
Mag
nium
ion
Mg
Nat
rium
ion
Na
Pot
tasi
um io
n К
Fer
rum
oxid
e F
e 2
Fer
rum
oxid
e F
e 3
Ion
amm
oniu
m N
H4
Non-
carbon
ate
Calcul
ated
1. 6
Wellfield
«Pakhta»
(12.05.16
-
16.05.16)
colour
transpar.
deposition
taste
odor
no
transparent
no
fresh
no
2.80
7.60
280
267
mg/l
146 14 87 3 32 15 42 1 <01
0.28𝐻𝐶𝑂3
51𝑆𝑂439
(𝑁𝑎 + 𝐾)40𝐶𝑎34𝑀𝑔26 42 2.40
meq/l
no 2,40 0,40 1,82 0,05 4,67 1,60 1,20 1,84 0,03 - 4.67
0.40
%-
eq/l 51 9 39 1 34 26 39 1 -
2. 8
Wellfield
Chinobod
, well - 12
(12.05.16
-
16.05.16)
colour
transpar.
deposition
taste
odor -“-
11.50
7.00
910
867
mg/l
396 62 295 48 100 79 83 2 0.2
0.91𝐻𝐶𝑂3
43𝑆𝑂441𝐶𝑙11
𝑀𝑔43𝐶𝑎33𝑁𝑎24 81 6.50
meq/l no
6,50 1,75 6,14 0,77 15,16 5,00 6,5 3,60 0,05 0.01 15.16
5.00
%-
eq/l
43 11 41 5 33 43 24 - -
3. 5
Wellfield
Gulbakho
r
colour
transpar.
deposition
taste
odor
-“-
5.80
7.00
392
374
mg/l no
287 25 66 12 78 23 25 0.2
0.39𝐻𝐶𝑂3
67𝑆𝑂420𝐶𝑙10
𝐶𝑎56𝑀𝑔27(𝑁𝑎 + 𝐾)17 25
4.70
meq/l
4,70 0,70 1,37 0,19 6,96 3,90 1,90 1,10 0,05 0.01 6.96

125
№
№ o
f sam
ple
Wellfiled
name
Physical properties Hardne
ss
рН
Dry
residu
e
Uni
ts
Anions
Total
anio
ns
Cations
Total
catio
ns
F –
fluo
rine,
mg/
L
Water salinization formula
(% meq.)
Na
on fl
ame
phot
omet
er. m
g/L
Experi
mental D
escr
iptio
n
Pro
pert
ies
Total
Carbon
ate
Car
bona
te io
n
СО
3
Hyd
roca
rbon
ate
ion
HC
O3
Chl
orin
e io
n C
l
Sul
phat
e io
n S
O4
Nitr
ate
ion
NO
3
Nitr
ite io
n N
O2
Cal
cium
ion
Са
Mag
nium
ion
Mg
Nat
rium
ion
Na
Pot
tasi
um io
n К
Fer
rum
oxid
e F
e 2
Fer
rum
oxid
e F
e 3
Ion
amm
oniu
m N
H4
Non-
carbon
ate
Calcul
ated
(12.05.16
-
16.05.16)
1.10
%-
eq/l
no
67 10 20 3 56 27 16 1 -
4. 3
Wellfield
Nou
(12.05.16
-
16.05.16)
colour
transpar.
deposition
taste
odor -“-
8.30
6.80
574
548
mg/l
342 23 156 27 80 52 37 2 0.2
0.57𝐻𝐶𝑂3
56𝑆𝑂433
𝑀𝑔43𝐶𝑎40(𝑁𝑎 + 𝐾)17 36 5.60
meq/l no
5,60 0,65 3,26 0,44 9,95 4,00 4,30 1,59 0,05 0.01 9.95
2.70
%-
eq/l
56 7 33 4 40 43 16 1 -
5. 8
Wellfield,
well 7
(12.05.16
-
16.05.16)
colour
transpar.
deposition
taste
odor -“-
13.00
7.10
962
925
mg/l no
281 106 392 12 126 91 66 2 0.2
0.91𝑆𝑂4
51𝐻𝐶𝑂329𝐶𝑙19
𝑀𝑔42𝐶𝑎40𝑁𝑎18 64 4.60
meq/l
4,60 3,00 8,16 0,19 15,95 6,30 6,70 2,89 0,05 0.01 15.95
8.40
%-
eq/l
no
29 19 51 1 40 42 18 - -
6. 7
Wellfield
Olmazor
(12.05.16
-
16.05.16)
colour
transpar.
deposition
taste
odor
no
transparent
no
light salty
no
29.50
6.80
2474
2380
mg/l
171 97 1527 18 270 194 186 3 <01
2.47𝑆𝑂4
85
𝑀𝑔43𝐶𝑎36𝑁𝑎21 187
2.80
meq/l no
2,80 2,75 31,81 0,29 37,65 13,50 16,00 8,07 0,08 - 37.65

126
№
№ o
f sam
ple
Wellfiled
name
Physical properties Hardne
ss
рН
Dry
residu
e
Uni
ts
Anions
Total
anio
ns
Cations
Total
catio
ns
F –
fluo
rine,
mg/
L
Water salinization formula
(% meq.)
Na
on fl
ame
phot
omet
er. m
g/L
Experi
mental D
escr
iptio
n
Pro
pert
ies
Total
Carbon
ate
Car
bona
te io
n
СО
3
Hyd
roca
rbon
ate
ion
HC
O3
Chl
orin
e io
n C
l
Sul
phat
e io
n S
O4
Nitr
ate
ion
NO
3
Nitr
ite io
n N
O2
Cal
cium
ion
Са
Mag
nium
ion
Mg
Nat
rium
ion
Na
Pot
tasi
um io
n К
Fer
rum
oxid
e F
e 2
Fer
rum
oxid
e F
e 3
Ion
amm
oniu
m N
H4
Non-
carbon
ate
Calcul
ated
26.70
%-
eq/l
7 7 85 1 36 43 21 - -
7. 7 Wellfield
Olmazor
colour
transpar.
deposition
taste
odor -“-
29.00
6.80
2512
2417
mg/l no
171 89 1531 18 310 188 193 3 <01
2.51𝑆𝑂4
85
𝑀𝑔41𝐶𝑎36𝑁𝑎23 187 2.80
meq/l
2,80 2,50 31,89 0,29 37,48 13,50 15,50 8,40 0,08 - 37.48
26.20
%-
eq/l
no
7 7 85 1 36 41 23 - -
8. 8
Wellfield,
Chinoz,
well-4
colour
transpar.
deposition
taste
odor -“-
22.50
7.40
1650
1592
mg/l
250 160 844 18 200 152 90 3 <01
1.65𝑆𝑂4
56 𝐶𝑙17𝐻𝐶𝑂316
𝑀𝑔47𝐶𝑎38𝑁𝑎15 90 4.10
meq/l no
4,10 4,50 17,59 0,29 26,48 10,00 12,50 3,90 0,08 - 26.48
18.40
%-
eq/l
16 17 56 1 38 47 15 - -
9. 9
Wellfield
Yangi
Chinoz
colour
transpar.
deposition
taste
odor
no
transparent
no
fresh
no
9.00
7.40
844
812
mg/l no
342 46 332 6 86 57 111 3 <01
0.84𝑆𝑂4
50𝐻𝐶𝑂340
(𝑁𝑎 + 𝐾)36𝑀𝑔34𝐶𝑎31 108
5.60
meq/l
5,60 1,30 6,93 0,10 13,93 4,30 4,70 4,85 0,08 - 13.93

127
№
№ o
f sam
ple
Wellfiled
name
Physical properties Hardne
ss
рН
Dry
residu
e
Uni
ts
Anions
Total
anio
ns
Cations
Total
catio
ns
F –
fluo
rine,
mg/
L
Water salinization formula
(% meq.)
Na
on fl
ame
phot
omet
er. m
g/L
Experi
mental D
escr
iptio
n
Pro
pert
ies
Total
Carbon
ate
Car
bona
te io
n
СО
3
Hyd
roca
rbon
ate
ion
HC
O3
Chl
orin
e io
n C
l
Sul
phat
e io
n S
O4
Nitr
ate
ion
NO
3
Nitr
ite io
n N
O2
Cal
cium
ion
Са
Mag
nium
ion
Mg
Nat
rium
ion
Na
Pot
tasi
um io
n К
Fer
rum
oxid
e F
e 2
Fer
rum
oxid
e F
e 3
Ion
amm
oniu
m N
H4
Non-
carbon
ate
Calcul
ated
3.40
%-
eq/l
no
40 9 50 1 31 34 35 1 -
10. 5
Wellfield
Gulbakho
r
colour
transpar.
deposition
taste
odor -“-
5.70
7.30
384
370
mg/l
293 25 62 10 70 27 28 2 0.2
0.38𝐻𝐶𝑂3
69𝑆𝑂419𝐶𝑙10
𝐶𝑎50𝑀𝑔32(𝑁𝑎 + 𝐾)18 26 4.80
meq/l no
4,80 0,70 1,30 0,16 6,96 3,50 2,20 1,20 0,05 0.01 6.96
0.90
%-
eq/l
69 10 19 2 50 32 17 1 -
11. 5
Wellfield
Niyazbas
h
colour
transpar.
deposition
taste
odor -“-
5.10
7.20
334
322
mg/l no
244 21 58 10 72 18 19 2 0.1
0.33𝐻𝐶𝑂3
67𝑆𝑂420𝐶𝑙10
𝐶𝑎60𝑀𝑔25(𝑁𝑎 + 𝐾)15 20 4.00
meq/l
4,00 0,60 1,22 0,16 5,98 3,60 1,50 0,83 0,05 - 5.98
1.10
%-
eq/l
no
67 10 20 3 60 25 14 1 -
12. 5
Wellfield
Niyazbas
h
colour
transpar.
deposition
taste
odor
-“-
5.00
7.10
328
317
mg/l
244 19 57 10 70 18 20 1 0.1
0.32𝐻𝐶𝑂3
68𝑆𝑂420
𝐶𝑎59𝑀𝑔25(𝑁𝑎 + 𝐾)16 20
4.00
meq/l no
4,00 0,55 1,18 0,16 5,89 3,50 1,50 0,86 0,03 - 5.89

128
№
№ o
f sam
ple
Wellfiled
name
Physical properties Hardne
ss
рН
Dry
residu
e
Uni
ts
Anions
Total
anio
ns
Cations
Total
catio
ns
F –
fluo
rine,
mg/
L
Water salinization formula
(% meq.)
Na
on fl
ame
phot
omet
er. m
g/L
Experi
mental D
escr
iptio
n
Pro
pert
ies
Total
Carbon
ate
Car
bona
te io
n
СО
3
Hyd
roca
rbon
ate
ion
HC
O3
Chl
orin
e io
n C
l
Sul
phat
e io
n S
O4
Nitr
ate
ion
NO
3
Nitr
ite io
n N
O2
Cal
cium
ion
Са
Mag
nium
ion
Mg
Nat
rium
ion
Na
Pot
tasi
um io
n К
Fer
rum
oxid
e F
e 2
Fer
rum
oxid
e F
e 3
Ion
amm
oniu
m N
H4
Non-
carbon
ate
Calcul
ated
1.00
%-
eq/l
68 9 20 3 59 25 15 1 -
13. 5 Wellfield
Nou
colour
transpar.
deposition
taste
odor -“-
8.30
7.10
568
547
mg/l no
345 21 156 27 80 52 37 2 0.2
0.56𝐻𝐶𝑂3
57𝑆𝑂433
𝑀𝑔43𝐶𝑎40(𝑁𝑎 + 𝐾)17 37 5.65
meq/l
5,65 0,60 3,26 0,44 9,95 4,0 4,30 1,59 0,05 0.01 9.95
2.65
%-
eq/l
no
57 6 33 4 40 43 16 1 -
14. 5 Wellfield
VU-1
colour
transpar.
deposition
taste
odor -“-
6,50
6,80
416
401
mg/l
311 21 88 86 27 22 2 0,2
0.41𝐻𝐶𝑂3
68𝑆𝑂424
𝐶𝑎57𝑀𝑔25(𝑁𝑎 + 𝐾)14 22 5,10
meq/l no
5,10 0,60 1,83 7,53 4,30 2,20 0,97 0,05 0,01 7,53
1,40
%-
eq/l
68 8 24 57 29 13 1 -
15.
Wellfield
VU-2
(16.05.16
-
19.05.16)
colour
transpar.
deposition
taste
odor
-“-
6,40
6,90
412
397
mg/l
311 23 81 сл. 90 23 23 2 0,2
0.41𝐻𝐶𝑂3
68𝑆𝑂423
𝐶𝑎60𝑀𝑔26(𝑁𝑎 + 𝐾)14 23
5,10
meq/l no
5,10 0,65 1,70 743 4,50 1,90 0,99 0,05 0,01 7,45

129
№
№ o
f sam
ple
Wellfiled
name
Physical properties Hardne
ss
рН
Dry
residu
e
Uni
ts
Anions
Total
anio
ns
Cations
Total
catio
ns
F –
fluo
rine,
mg/
L
Water salinization formula
(% meq.)
Na
on fl
ame
phot
omet
er. m
g/L
Experi
mental D
escr
iptio
n
Pro
pert
ies
Total
Carbon
ate
Car
bona
te io
n
СО
3
Hyd
roca
rbon
ate
ion
HC
O3
Chl
orin
e io
n C
l
Sul
phat
e io
n S
O4
Nitr
ate
ion
NO
3
Nitr
ite io
n N
O2
Cal
cium
ion
Са
Mag
nium
ion
Mg
Nat
rium
ion
Na
Pot
tasi
um io
n К
Fer
rum
oxid
e F
e 2
Fer
rum
oxid
e F
e 3
Ion
amm
oniu
m N
H4
Non-
carbon
ate
Calcul
ated
1,30
%-
eq/l
68 9 23 60 26 13 1 -
16.
Wellfield
Centralniy
-1
(16.05.16
-
19.05.16)
colour
transpar.
deposition
taste
odor -“-
6,40
6,90
412
397
mg/l
354 35 149 6 98 43 35 2 0.2
0.57𝐻𝐶𝑂3
58𝑆𝑂431𝐶𝑙10
𝐶𝑎49𝑀𝑔35(𝑁𝑎 + 𝐾)16 36 5,10
meq/l no
5.80 1.00 3.10 0.10 10.00 4.90 3.50 1.54 0.05 0.01 10.00
1,30
%-
eq/l
58 10 31 1 49 35 15 1 -
17.
Wellfield
Centralniy
-2
(16.05.16
-
19.05.16)
colour
transpar.
deposition
taste
odor -“-
840
7.10
566
546
mg/l
354 35 150 6 96 44 36 2 0.2
0.56𝐻𝐶𝑂3
58𝑆𝑂431𝐶𝑙10
𝐶𝑎48𝑀𝑔36 𝑁𝑎16 37 5,80
meq/l no
5.80 1.00 3.12 0.10 10.02 4.80 3.60 1.56 0.05 0.01 10.02
2.60
%-
eq/l
58 10 31 1 48 36 16 - -
18.
Wellfield
Sokhibkor
(16.05.16
-
19.05.16)
colour
transpar.
deposition
taste
odor
-“-
6,50
7,20
410
395
mg/l
256 14 118 3 98 19 13 2 0,1
0.41𝐻𝐶𝑂3
59𝑆𝑂434
𝐶𝑎69𝑀𝑔22 14
4,20
meq/l no
4,20 0,40 2,45 0,05 7,10 4,90 1,60 0,55 0,05 - 7,10

130
№
№ o
f sam
ple
Wellfiled
name
Physical properties Hardne
ss
рН
Dry
residu
e
Uni
ts
Anions
Total
anio
ns
Cations
Total
catio
ns
F –
fluo
rine,
mg/
L
Water salinization formula
(% meq.)
Na
on fl
ame
phot
omet
er. m
g/L
Experi
mental D
escr
iptio
n
Pro
pert
ies
Total
Carbon
ate
Car
bona
te io
n
СО
3
Hyd
roca
rbon
ate
ion
HC
O3
Chl
orin
e io
n C
l
Sul
phat
e io
n S
O4
Nitr
ate
ion
NO
3
Nitr
ite io
n N
O2
Cal
cium
ion
Са
Mag
nium
ion
Mg
Nat
rium
ion
Na
Pot
tasi
um io
n К
Fer
rum
oxid
e F
e 2
Fer
rum
oxid
e F
e 3
Ion
amm
oniu
m N
H4
Non-
carbon
ate
Calcul
ated
2,30
%-
eq/l
59 6 34 1 69 22 8 1 -
19.
Wellfield
Uzgarish
(16.05.16
-
19.05.16)
colour
transpar.
deposition
taste
odor -“-
7.50
7.00
480
464
mg/l
357 28 96 2 106 27 26 1 0.2
0.48𝐻𝐶𝑂3
68𝑆𝑂423
𝐶𝑎61𝑀𝑔26 𝑁𝑎13 26 5.85
meq/l no
5.85 0.80 2.01 0.03 8.69 5.30 2.2 1.15 0.03 0.01 8.69
1.65
%-
eq/l
68 9 23 - 61 26 13 - -
20.
Bobur
village
(16.05.16
-
19.05.16)
colour
transpar.
deposition
taste
odor -“-
7,40
7,20
486
468
mg/l
360 26 96 3 108 24 28 3 0,2
0.48𝐻𝐶𝑂3
68𝑆𝑂423
𝐶𝑎62𝑀𝑔26 (𝑁𝑎 + 𝐾)15 27 5,90
meq/l no
5,9 0,75 2,01 0,05 8,71 5,40 2,00 1,22 0,08 0,01
1,50
%-
eq/l
68 9 23 - 62 23 14 1 -
21.
Khonaba
d village
(18.05.16
-
19.05.16)
colour
transpar.
deposition
taste
odor
-“-
5,20
7,30
932
898
mg/l
134 129 405 2 52 32 209 2 <0.1
0.93𝑆𝑂4
59 𝐶𝑙26𝐻𝐶𝑂315
𝑁𝑎64𝐶𝑎18𝑀𝑔18 217
2,20
meq/l no
2,20 3,65 8,44 0,03 14,32 2,60 2,60 9,07 0,05 - 14.32

131
№
№ o
f sam
ple
Wellfiled
name
Physical properties Hardne
ss
рН
Dry
residu
e
Uni
ts
Anions
Total
anio
ns
Cations
Total
catio
ns
F –
fluo
rine,
mg/
L
Water salinization formula
(% meq.)
Na
on fl
ame
phot
omet
er. m
g/L
Experi
mental D
escr
iptio
n
Pro
pert
ies
Total
Carbon
ate
Car
bona
te io
n
СО
3
Hyd
roca
rbon
ate
ion
HC
O3
Chl
orin
e io
n C
l
Sul
phat
e io
n S
O4
Nitr
ate
ion
NO
3
Nitr
ite io
n N
O2
Cal
cium
ion
Са
Mag
nium
ion
Mg
Nat
rium
ion
Na
Pot
tasi
um io
n К
Fer
rum
oxid
e F
e 2
Fer
rum
oxid
e F
e 3
Ion
amm
oniu
m N
H4
Non-
carbon
ate
Calcul
ated
3,00
%-
eq/l
15 26 59 - 18 18 64 - -
22.
Ittifok
(18.05.16
-
19.05.16)
colour
transpar.
deposition
taste
odor -“-
7,60
7,30
1248
1208
mg/l
128 119 639 2 82 42 255 3 0.1
1,24𝑆𝑂4
71 𝐶𝑙19𝐻𝐶𝑂311
𝑁𝑎59𝐶𝑎22𝑀𝑔19 267 2,10
meq/l no
2,10 3,35 13,30 0,03 18,78 4,10 3,50 11,10 0,08 - 18,78
5,50
%-
eq/l
11 19 71 - 22 19 59 - -
23.
Uzbekista
n station
(18.05.16
-
19.05.16)
colour
transpar.
deposition
taste
odor -“-
6,80
7,20
444
428
mg/l
293 14 120 10 78 35 23 2 <0.1
0.44𝐻𝐶𝑂3
61𝑆𝑂432
𝐶𝑎50𝑀𝑔37 𝑁𝑎13 22 4,80
meq/l no
4,80 0,40 2,50 0,16 7,68 3.90 2.90 1.01 0.05 - 7.86
2,00
%-
eq/l
61 5 32 2 50 37 13 - -
24.
Amir
Timur
(18.05.16
-
19.05.16)
colour
transpar.
deposition
taste
odor
-“-
1,50
7,80
224
215
Mg/l
146 11 53 сл 12 11 53 1 <0.1
0.22𝐻𝐶𝑂3
63𝑆𝑂429
𝑁𝑎60𝑀𝑔24 𝐶𝑎16 55
1,50
meq/l no
2,40 0,60 1,13 - 3,83 0,60 0,90 2,30 0,03 - 3,83

132
№
№ o
f sam
ple
Wellfiled
name
Physical properties Hardne
ss
рН
Dry
residu
e
Uni
ts
Anions
Total
anio
ns
Cations
Total
catio
ns
F –
fluo
rine,
mg/
L
Water salinization formula
(% meq.)
Na
on fl
ame
phot
omet
er. m
g/L
Experi
mental D
escr
iptio
n
Pro
pert
ies
Total
Carbon
ate
Car
bona
te io
n
СО
3
Hyd
roca
rbon
ate
ion
HC
O3
Chl
orin
e io
n C
l
Sul
phat
e io
n S
O4
Nitr
ate
ion
NO
3
Nitr
ite io
n N
O2
Cal
cium
ion
Са
Mag
nium
ion
Mg
Nat
rium
ion
Na
Pot
tasi
um io
n К
Fer
rum
oxid
e F
e 2
Fer
rum
oxid
e F
e 3
Ion
amm
oniu
m N
H4
Non-
carbon
ate
Calcul
ated
-
%-
eq/l
63 8 29 - 16 24 60 - -
25.
Maktab
(18.05.16
-
19.05.16)
colour
transpar.
deposition
taste
odor
no
trasnparent
no
light salty
no
21,40
6,90
2752
2647
mg/l
43 186 1658 3 200 139 436 4 0,2
2,75𝑆𝑂4
85 𝐶𝑙13
𝑁𝑎47𝑀𝑔28𝐶𝑎25 450 0,70
meq/l no
0,70 5,25 34,55 0,05 40,55 10,0 11,40 18,94 0,10 0,01 40,55
-20,70
%-
eq/l
2 13 85 - 25 28 47 - -
26.
Yallama
(18.05.16
-
19.05.16)
colour
transpar.
deposition
taste
odor
no
transparent
no
fresh
no
7,10
7,00
612
586
mg/l
366 39 167 3 66 46 80 2 0,2
0.61𝐻𝐶𝑂3
56𝑆𝑂433𝐶𝑙10
𝑀𝑔36𝑁𝑎33𝐶𝑎31 77 6,00
meq/l no
6,00 1,10 3,48 0,05 10,63 3,30 3,80 3,47 0,05 0,01 10,63
1,10
%-
eq/l
56 10 33 - 31 36 33 - -
27.
55
passing
place
colour
transpar.
deposition
taste
odor
-“-
1,70
7,60
214
205
mg/l
140 7 52 3 18 10 44 1 <0.1
0.21𝐻𝐶𝑂3
63𝑆𝑂430
(𝑁𝑎 + К)53𝐶𝑎25𝑀𝑔22 44
1,70
meq/l no
2,30 0,20 1,08 0,05 3,63 0,90 0,80 1,90 0,03 - 3,63

133
№
№ o
f sam
ple
Wellfiled
name
Physical properties Hardne
ss
рН
Dry
residu
e
Uni
ts
Anions
Total
anio
ns
Cations
Total
catio
ns
F –
fluo
rine,
mg/
L
Water salinization formula
(% meq.)
Na
on fl
ame
phot
omet
er. m
g/L
Experi
mental D
escr
iptio
n
Pro
pert
ies
Total
Carbon
ate
Car
bona
te io
n
СО
3
Hyd
roca
rbon
ate
ion
HC
O3
Chl
orin
e io
n C
l
Sul
phat
e io
n S
O4
Nitr
ate
ion
NO
3
Nitr
ite io
n N
O2
Cal
cium
ion
Са
Mag
nium
ion
Mg
Nat
rium
ion
Na
Pot
tasi
um io
n К
Fer
rum
oxid
e F
e 2
Fer
rum
oxid
e F
e 3
Ion
amm
oniu
m N
H4
Non-
carbon
ate
Calcul
ated
(23.05.16
-
25.05.16)
-
%-
eq/l
63 6 30 1 25 22 52 1 -
28.
Sharishsa
y
(20.05.16
-
23.05.16)
colour
transpar.
deposition
taste
odor
-“-
5,00
6,9
906
872
mg/l 122 117 407 2 52 29 202 2 <0.1
0.90𝑆𝑂4
61𝐶𝑙24𝐻𝐶𝑂315
𝑁𝑎64𝐶𝑎19𝑀𝑔17 193
2,00 meq/l no
2,00 3,30 8,49 0,03 13,82 2,60 2,40 8,77 0,05 - 13,82
3,00
%-
eq/l
15 24 61 - 19 17 64 - -
29.
Erkin
(20.05.16
-
23.05.16)
colour
transpar.
deposition
taste
odor
-“-
5,60
7,1
700
674
mg/l
274 64 247 52 36 134 2 0,1
0.70𝑆𝑂4
45𝐻𝐶𝑂339𝐶𝑙16
𝑁𝑎51𝑀𝑔26𝐶𝑎23 135 4,50
meq/l no 4,50 1,80 5,14 2 11,47 2,60 3,00 5,82 0,05 - 11,47
1,10
%-
eq/l
39 16 45 0,03 23 26 51 - -
30.
Chinmasji
d
(20.05.16
-
23.05.16)
colour
transpar.
deposition
taste
odor
-“-
6,20
6,7
550
534
mg/l 305 28 177 2 58 40 75 2 <0.1
0.55𝐻𝐶𝑂3
53𝑆𝑂439
𝑀𝑔35(𝑁𝑎 + К)35𝐶𝑎30 71
5,00
meq/l no
5,00 0,80 3,69 0,03 9,52 2,90 3,30 3,27 0,05 - 9,52
1,20
%-
eq/l
53 8 39 - 30 35 34 - -

134
Appendix 8. Population Projections
№№ Наименование поселков и УРВ
Чи
слен
но
сть
нас
елен
ия
в
пр
оек
тны
х н
асел
.пун
ктах
ч
ел н
а 01
.01.
2018
г
2,024 2,030 2,040 2,045
2045
Чи
слен
но
сть
нас
елен
ия
в п
ро
ектн
ых
нас
ел.п
уект
ах
тыс.
Чел
/ p
roje
cted
po
pu
lati
on
Чи
слен
но
сть
нас
елен
ия
,
охв
ачен
но
го в
од
оп
ро
во
до
м
по
пр
оек
ту /
po
pu
lati
on
serv
ed
Уд
ель
но
е хо
з-п
ить
ево
е
во
до
по
треб
лен
ие
(л/с
ут н
а ч
ел)
/ Per
cap
ita
dem
and
(lc
d)
Расходы м3/сут / Demand (m3/d)
Нас
елен
ие
/ Do
mes
tic
dem
and
Пр
ом
ыш
лен
но
сть
и
бю
дж
етн
ые
ор
ган
иза
ци
и 2
0% и
10%
со
отв
ет-т
вен
но
дл
я
р/ц
ентр
ов
и С
НП
Неу
чте
нн
ые
рас
ход
ы
10%
Об
щи
й /
To
tal d
eman
d
Об
щи
й м
акси
мал
ьн
о
суто
чн
ый
20%
/ M
axim
um
day
dem
and
ЯНГИЮЛЬСКИЙ РАЙОН
УРВ "Чинор" (реконструкция)
1 Дехконобод 1,655 1,810 1,923 2,102 2,170 2,170 2,170 120 260.38 26.04 26.04 312.45 390.56
2 Маданият 2,065
2,258 2,399 2,622 2,707 2,707 2,707 120 324.88 32.49 32.49 389.85 487.32
3 Ботир 0 0 0 0
4 Виноводочный завод 93.30 93.30 116.63
5 МФЙ Чинор (входит в состав пгт Улугбек) 2,393 2,617 2,780 3,039 3,137 3,137 3,137 120 376.48 37.65 37.65 451.78 564.72
Итого по УРВ "Чинор" 6,113 6,684 7,103 7,763 8,014 8,014 8,014 961.74 189.47 96.17 1,247.38 1,559.23
От ВУ-3 по отдельной линии
6 пгт Уртаовул 19,399 21,213 22,540 24,636 25,433 25,433 25,433 150 3,814.97 953.74 381.50 5,150.20 6,437.76
7 Богзор 3,066 3,353 3,562 3,894 4,020 4,020 4,020 140 562.76 112.55 56.28 731.58 914.48
8 Анхор 5,325 5,823 6,187 6,763 6,981 6,981 6,981 140 977.39 195.48 97.74 1,270.61 1,588.26
Итого от ВУ-3 по отдельной линии 27,790 30,388 32,290 35,292 36,434 36,434 36,434 5,355.11 1,261.77 535.51 7,152.39 8,940.49
ИТОГО по Зангиатинскому фл-лу 33,903 37,072 39,393 43,056 44,449 44,449 44,449 6,317 1,451 632 8,400 10,500
От ВУ-3 по отдельной линии
9 Мустакиллик 2,220 2,378 2,506 2,694 2,762 2,762 2,762 120 331.48 33.15 33.15 397.78 497.23
10 Туябугиз 2,610 2,796 2,946 3,167 3,248 3,248 3,248 120 389.72 38.97 38.97 467.66 584.58
11 Иногомова 3,023 3,238 3,413 3,668 3,762 3,762 3,762 120 451.39 45.14 45.14 541.66 677.08
12 Узбекистон 3,018 3,233 3,407 3,662 3,755 3,755 3,755 120 450.64 45.06 45.06 540.77 675.96
13 Галаба 3,395 3,637 3,833 4,120 4,224 4,224 4,224 120 506.93 50.69 50.69 608.32 760.40
14 Саид ота 2,140 2,292 2,416 2,597 2,663 2,663 2,663 120 319.54 31.95 31.95 383.45 479.31
15 Куштепа 2,799 2,998 3,160 3,396 3,483 3,483 3,483 120 417.94 41.79 41.79 501.53 626.91
16 Чангтепа 3,160 3,385 3,567 3,835 3,932 3,932 3,932 120 471.84 47.18 47.18 566.21 707.76
17 Хонкургон 4,617 4,946 5,212 5,603 5,745 5,745 5,745 120 689.40 68.94 68.94 827.28 1,034.09
18 Кенгкичик 2,392 2,562 2,700 2,903 2,976 2,976 2,976 120 357.17 35.72 35.72 428.60 535.75
19 chamanzor 2,610 2,796 2,946 3,167 3,248 3,248 3,248 120 389.72 38.97 38.97 467.66 584.58
20 koratepa 3,246 3,477 3,664 3,939 4,039 4,039 4,039 120 484.68 48.47 48.47 581.62 727.02
Итого от ВУ-3 по отдельной линии 35,230 37,739 39,770 42,750 43,837 43,837 43,837 5,260 526 526 6,313 7,891
УРВ "Халкабад" (реконструкция)

135
№№ Наименование поселков и УРВ
Чи
слен
но
сть
нас
елен
ия
в
пр
оек
тны
х н
асел
.пун
ктах
ч
ел н
а 01
.01.
2018
г
2,024 2,030 2,040 2,045
2045
Чи
слен
но
сть
нас
елен
ия
в п
ро
ектн
ых
нас
ел.п
уект
ах
тыс.
Чел
/ p
roje
cted
po
pu
lati
on
Чи
слен
но
сть
нас
елен
ия
,
охв
ачен
но
го в
од
оп
ро
во
до
м
по
пр
оек
ту /
po
pu
lati
on
serv
ed
Уд
ель
но
е хо
з-п
ить
ево
е
во
до
по
треб
лен
ие
(л/с
ут н
а ч
ел)
/ Per
cap
ita
dem
and
(lc
d)
Расходы м3/сут / Demand (m3/d)
Нас
елен
ие
/ Do
mes
tic
dem
and
Пр
ом
ыш
лен
но
сть
и
бю
дж
етн
ые
ор
ган
иза
ци
и 2
0% и
10%
со
отв
ет-т
вен
но
дл
я
р/ц
ентр
ов
и С
НП
Неу
чте
нн
ые
рас
ход
ы
10%
Об
щи
й /
To
tal d
eman
d
Об
щи
й м
акси
мал
ьн
о
суто
чн
ый
20%
/ M
axim
um
day
dem
and
19 Миришкор 2,390 2,560 2,698 2,900 2,974 2,974 2,974 120 356.87 35.69 35.69 428.24 535.30
20 Халкобод 4,355 4,665 4,916 5,285 5,419 5,419 5,419 140 758.65 151.73 75.87 986.25 1,232.81
21 Икрамов 3,880 4,156 4,380 4,708 4,828 4,828 4,828 120 579.35 57.93 57.93 695.22 869.02
22 Навои 2,669 2,859 3,013 3,239 3,321 3,321 3,321 120 398.53 39.85 39.85 478.23 597.79
Итого по УРВ "Халкабад" 13,294 14,241 15,007 16,132 16,542 16,542 16,542 2,093.40 285.21 209.34 2,587.94 3,234.93
УРВ-9 Нуробод (новое строительство)
23 Нуробод 1,985 2,126 2,241 2,409 2,470 2,470 2,470 120 296.39 29.64 29.64 355.67 444.59
24 Кескан 3,845 4,119 4,341 4,666 4,784 4,784 4,784 120 574.12 57.41 57.41 688.95 861.19
25 Дангир 3,260 3,492 3,680 3,956 4,056 4,056 4,056 120 486.77 48.68 48.68 584.13 730.16
26 Туркиз 393 421 444 477 489 489 489 120 58.68 5.87 5.87 70.42 88.02
27 Какша 380 407 429 461 473 473 473 120 56.74 5.67 5.67 68.09 85.11
Итого по УРВ-9 9,863 10,566 11,134 11,968 12,273 12,273 12,273 1,472.71 147.27 147.27 1,767.26 2,209.07
УРВ "Бобур" (новое строительство)
28 им. Бобура 2,385 2,555 2,692 2,894 2,968 2,968 2,968 120 356.12 35.61 35.61 427.35 534.18
29 Маърифат 391 419 441 474 487 487 487 120 58.38 5.84 5.84 70.06 87.57
30 Ватан 2,263 2,424 2,555 2,746 2,816 2,816 2,816 120 337.90 33.79 33.79 405.49 506.86
Итого по УРВ "Бобур" 5,039 5,398 5,688 6,115 6,270 6,270 6,270 752.41 75.24 75.24 902.89 1,128.61
УРВ "Шуралисой" (новое строительство)
для УРВ "Охунбобоев" 895.90 1,119.88
31 Марказ 2,996 3,209 3,382 3,636 3,728 3,728 3,728 120 447.35 44.74 44.74 536.82 671.03
32 Шуралисой 2,011 2,154 2,270 2,440 2,502 2,502 2,502 120 300.28 30.03 30.03 360.33 450.41
Итого по УРВ "Шуралисой" 5,007 5,364 5,652 6,076 6,230 6,230 6,230 747.63 74.76 74.76 1,793.06 2,241.32
УРВ "Охунбобоев" (новое строительство)
33 Охунбобоев 1,985 2,126 2,241 2,409 2,470 2,470 2,470 120 296.39 29.64 29.64 355.67 444.59
34 Хакикат 3,015 3,230 3,404 3,659 3,752 3,752 3,752 120 450.19 45.02 45.02 540.23 675.29
Итого по УРВ "Охунбобоев" 5,000 5,356 5,644 6,067 6,222 6,222 6,222 746.58 74.66 74.66 895.90 1,119.88
УРВ "Боз-Су" (реконструкция)
35 пгт Боз-сув (Умид) 2,500 2,678 2,822 3,034 3,111 3,111 3,111 150 466.62 93.32 46.66 606.60 758.25
Итого по УРВ "Боз-Су" 2,500 2,678 2,822 3,034 3,111 3,111 3,111 466.62 93.32 46.66 606.60 758.25
ВБ с н.ст. подкачки Галаба (новое строительство)
36 Галаба 287 307 324 348 357 357 357 120 42.85 4.29 4.29 51.42 64.28
Итого ВБ Галаба 287 307 324 348 357 357 357 42.85 4.29 4.29 51.42 64.28
ВБ с н.ст. подкачки Канал буйи (новое строительство)

136
№№ Наименование поселков и УРВ
Чи
слен
но
сть
нас
елен
ия
в
пр
оек
тны
х н
асел
.пун
ктах
ч
ел н
а 01
.01.
2018
г
2,024 2,030 2,040 2,045
2045
Чи
слен
но
сть
нас
елен
ия
в п
ро
ектн
ых
нас
ел.п
уект
ах
тыс.
Чел
/ p
roje
cted
po
pu
lati
on
Чи
слен
но
сть
нас
елен
ия
,
охв
ачен
но
го в
од
оп
ро
во
до
м
по
пр
оек
ту /
po
pu
lati
on
serv
ed
Уд
ель
но
е хо
з-п
ить
ево
е
во
до
по
треб
лен
ие
(л/с
ут н
а ч
ел)
/ Per
cap
ita
dem
and
(lc
d)
Расходы м3/сут / Demand (m3/d)
Нас
елен
ие
/ Do
mes
tic
dem
and
Пр
ом
ыш
лен
но
сть
и
бю
дж
етн
ые
ор
ган
иза
ци
и 2
0% и
10%
со
отв
ет-т
вен
но
дл
я
р/ц
ентр
ов
и С
НП
Неу
чте
нн
ые
рас
ход
ы
10%
Об
щи
й /
To
tal d
eman
d
Об
щи
й м
акси
мал
ьн
о
суто
чн
ый
20%
/ M
axim
um
day
dem
and
37 Канал буйи 182 195 205 221 226 226 226 120 27.18 2.72 2.72 32.61 40.76
38 Янги махаля 513 550 579 623 638 638 638 120 76.60 7.66 7.66 91.92 114.90
Итого ВБ Канал буйи 695 745 785 843 865 865 865 103.78 10.38 10.38 124.53 155.66
п Янгиобод (водонапорная башня)
39 Янгиобод 607 650 685 737 755 755 755 120 90.64 9.06 9.06 108.76 135.95
40 военная часть 20.00 25.00
Итого п Янгиобод 607 650 685 737 755 755 755 90.64 9.06 9.06 128.76 160.95
УРВ Дустлик ( новое строительство
41 Дустлик 2,245 2,405 2,534 2,724 2,793 2,793 2,793 120 335.22 33.52 33.52 402.26 502.82
Итого по ВБ Дустлик 2,245 2,405 2,534 2,724 2,793 2,793 2,793 335.22 33.52 33.52 402.26 502.82
УРВ птицефабрика (существующая)
42 птицефабрика 500.00 500.00 625.00
Итого УРВ птицефабрика 500.00 500.00 625.00
ИТОГО по Янгиюльскому ф-лу (численность населения указана с учетом поселка Мирзабобоев, см. УРВ "Амир темур" Чиназского района
81,778 87,603 92,317 99,235 101,757 101,757 101,757 12,413 1,864 1,241 16,433 20,542
ИТОГО по Янгиюльскому району 115,681 124,675 131,710 142,290 146,206 146,206 146,206 0 18,729 3,315 1,873 24,833 31,042
ЧИНАЗСКИЙ РАЙОН
г.Чиноз (реконструкция)
43 г.Чиноз 27,526 29,387 30,413 31,698 31,996 31,996 31,996 180 5,759.20 1,439.80 575.92 7,774.92 9,718.65
Итого по г.Чиноз 27,526 29,387 30,413 31,698 31,996 31,996 31,996 5,759.20 1,439.80 575.92 7,774.92 9,718.65
УРВ "Эшонобод" (реконструкция)
44 Узбекистон 2,814 3,004 3,109 3,240 3,271 3,271 3,271 120 392.51 39.25 39.25 471.01 588.77
45 Галаба 524 559 579 603 609 609 609 120 73.09 7.31 7.31 87.71 109.64
46 Иттифок 436 465 482 502 507 507 507 120 60.82 6.08 6.08 72.98 91.22
47 Дустлик 372 397 411 428 432 432 432 120 51.89 5.19 5.19 62.27 77.83
48 Каналобод 1,287 1,374 1,422 1,482 1,496 1,496 1,496 120 179.52 17.95 17.95 215.42 269.28
Итого по УРВ "Эшонобод" 5,433 5,800 6,003 6,256 6,315 6,315 6,315 757.82 75.78 75.78 909.39 1,136.73
УРВ "Сутбулок" (реконструкция)
для УРВ А.Темур, п. Абзалобода и Олмос
для пос Маданият, Учкун, Самарканд

137
№№ Наименование поселков и УРВ
Чи
слен
но
сть
нас
елен
ия
в
пр
оек
тны
х н
асел
.пун
ктах
ч
ел н
а 01
.01.
2018
г
2,024 2,030 2,040 2,045
2045
Чи
слен
но
сть
нас
елен
ия
в п
ро
ектн
ых
нас
ел.п
уект
ах
тыс.
Чел
/ p
roje
cted
po
pu
lati
on
Чи
слен
но
сть
нас
елен
ия
,
охв
ачен
но
го в
од
оп
ро
во
до
м
по
пр
оек
ту /
po
pu
lati
on
serv
ed
Уд
ель
но
е хо
з-п
ить
ево
е
во
до
по
треб
лен
ие
(л/с
ут н
а ч
ел)
/ Per
cap
ita
dem
and
(lc
d)
Расходы м3/сут / Demand (m3/d)
Нас
елен
ие
/ Do
mes
tic
dem
and
Пр
ом
ыш
лен
но
сть
и
бю
дж
етн
ые
ор
ган
иза
ци
и 2
0% и
10%
со
отв
ет-т
вен
но
дл
я
р/ц
ентр
ов
и С
НП
Неу
чте
нн
ые
рас
ход
ы
10%
Об
щи
й /
To
tal d
eman
d
Об
щи
й м
акси
мал
ьн
о
суто
чн
ый
20%
/ M
axim
um
day
dem
and
49 Сутбулок 1,919 2,049 2,120 2,210 2,231 2,231 2,231 120 267.67 26.77 26.77 321.21 401.51
50 пгт. Бирлик 2,900 3,096 3,204 3,340 3,371 3,371 3,371 150 505.63 101.13 50.56 657.32 821.65
51 А.Худойберганова 1,704 1,819 1,883 1,962 1,981 1,981 1,981 120 237.68 23.77 23.77 285.22 356.52
Итого по УРВ "Сутбулок" 6,523 6,964 7,207 7,512 7,582 7,582 7,582 1,010.99 151.66 101.10 1,263.75 1,579.69
УРВ "Маданият" (реконструкция)
52 Учкун 1,600 1,708 1,768 1,842 1,860 1,860 1,860 120 223.18 22.32 22.32 267.81 334.76
53 Самарканд 2,676 2,857 2,957 3,082 3,111 3,111 3,111 120 373.26 37.33 37.33 447.91 559.89
54 Маданият 2,570 2,744 2,840 2,960 2,987 2,987 2,987 120 358.48 45.83 35.85 440.15 550.19
Итого по УРВ "Маданият" 6,846 7,309 7,564 7,884 7,958 7,958 7,958 954.91 105.47 95.49 1,155.88 1,444.85
УРВ "Янгиобод" (реконструкция)
55 Норкузиева 1,104 1,179 1,220 1,271 1,283 1,283 1,283 120 153.99 15.40 15.40 184.79 230.99
56 Янгиобод 3,223 3,441 3,561 3,711 3,746 3,746 3,746 120 449.56 44.96 44.96 539.47 674.34
Итого по УРВ "Янгиобод" 4,327 4,619 4,781 4,983 5,030 5,030 5,030 603.55 60.36 60.36 724.26 905.33
УРВ "Кутарма" (реконструкция)
57 Исломобод 3,215 3,432 3,552 3,702 3,737 3,737 3,737 120 448.44 44.84 44.84 538.13 672.67
58 Бирлик 1,602 1,710 1,770 1,845 1,862 1,862 1,862 120 223.46 22.35 22.35 268.15 335.18
59 Кутарма 2,623 2,800 2,898 3,021 3,049 3,049 3,049 120 365.87 36.59 36.59 439.04 548.80
60 Кердара 900 961 994 1,036 1,046 1,046 1,046 120 125.54 12.55 12.55 150.64 188.30
61 Гулистон 2,391 2,553 2,642 2,753 2,779 2,779 2,779 120 333.51 33.35 33.35 400.21 500.26
Итого по УРВ "Кутарма" 10,731 11,456 11,856 12,357 12,473 12,473 12,473 1,496.81 149.68 149.68 1,796.18 2,245.22
УРВ "Яллама" (реконструкция)
62 Ёллама 2,378 2,539 2,627 2,738 2,764 2,764 2,764 120 331.70 33.17 33.17 398.03 497.54
63 Дехконобод 2,976 3,177 3,288 3,427 3,459 3,459 3,459 120 415.11 41.51 41.51 498.13 622.66
64 пгт Кир 2,750 2,936 3,038 3,167 3,197 3,197 3,197 150 479.48 95.90 47.95 623.32 779.15
65 Эркин 1,700 1,815 1,878 1,958 1,976 1,976 1,976 120 237.12 23.71 23.71 284.55 355.69
66 Чинмасжид 2,925 3,123 3,232 3,368 3,400 3,400 3,400 120 407.99 40.80 40.80 489.59 611.99
67 Очамайли 2,069 2,209 2,286 2,383 2,405 2,405 2,405 120 288.59 28.86 28.86 346.31 432.89
Итого по УРВ "Яллама" 14,798 15,798 16,350 17,041 17,201 17,201 17,201 2,160.00 263.95 216.00 2,639.94 3,299.93
УРВ "Гайрат"(новое строительство)
68 Гайрат 3,385 3,614 3,740 3,898 3,935 3,935 3,935 120 472.16 47.22 47.22 566.59 708.24
69 С.Рахимова 911 973 1,007 1,049 1,059 1,059 1,059 120 127.07 12.71 12.71 152.49 190.61
70 Кахрамон 2,800 2,989 3,094 3,224 3,255 3,255 3,255 120 390.56 39.06 39.06 468.67 585.84
71 С.Айний 1,650 1,762 1,823 1,900 1,918 1,918 1,918 120 230.15 23.02 23.02 276.18 345.23

138
№№ Наименование поселков и УРВ
Чи
слен
но
сть
нас
елен
ия
в
пр
оек
тны
х н
асел
.пун
ктах
ч
ел н
а 01
.01.
2018
г
2,024 2,030 2,040 2,045
2045
Чи
слен
но
сть
нас
елен
ия
в п
ро
ектн
ых
нас
ел.п
уект
ах
тыс.
Чел
/ p
roje
cted
po
pu
lati
on
Чи
слен
но
сть
нас
елен
ия
,
охв
ачен
но
го в
од
оп
ро
во
до
м
по
пр
оек
ту /
po
pu
lati
on
serv
ed
Уд
ель
но
е хо
з-п
ить
ево
е
во
до
по
треб
лен
ие
(л/с
ут н
а ч
ел)
/ Per
cap
ita
dem
and
(lc
d)
Расходы м3/сут / Demand (m3/d)
Нас
елен
ие
/ Do
mes
tic
dem
and
Пр
ом
ыш
лен
но
сть
и
бю
дж
етн
ые
ор
ган
иза
ци
и 2
0% и
10%
со
отв
ет-т
вен
но
дл
я
р/ц
ентр
ов
и С
НП
Неу
чте
нн
ые
рас
ход
ы
10%
Об
щи
й /
To
tal d
eman
d
Об
щи
й м
акси
мал
ьн
о
суто
чн
ый
20%
/ M
axim
um
day
dem
and
Итого по УРВ "Гайрат" 8,746 9,337 9,663 10,072 10,166 10,166 10,166 1,219.94 121.99 121.99 1,463.92 1,829.90
УРВ "А.Темур" (новое строительство)
72 Мевазор 1,924 2,054 2,126 2,216 2,236 2,236 2,236 120 268.37 26.84 26.84 322.04 402.55
73 им. Охунбобоева 2,950 3,149 3,259 3,397 3,429 3,429 3,429 120 411.48 41.15 41.15 493.78 617.22
74 Арчазор 475 507 525 547 552 552 552 120 66.26 6.63 6.63 79.51 99.38
75 пгт.А.Темур 5,104 5,449 5,639 5,878 5,933 5,933 5,933 150 889.91 177.98 88.99 1,156.89 1,446.11
76 Тиллаобод 1,640 1,751 1,812 1,889 1,906 1,906 1,906 120 228.76 22.88 22.88 274.51 343.13
77 Сафаробод 1,009 1,077 1,115 1,162 1,173 1,173 1,173 120 140.74 14.07 14.07 168.89 211.11
78 Абзалобод 2,905 3,101 3,210 3,345 3,377 3,377 3,377 120 405.20 40.52 40.52 486.24 607.81
79 Олмос 2,012 2,148 2,223 2,317 2,339 2,339 2,339 120 280.64 28.06 28.06 336.77 420.97
80 им. Мирзабобоева (Янгиюльский район) 2,011 2,154 2,270 2,440 2,502 2,502 2,502 120 300.28 30.03 30.03 360.33 450.41
Итого по УРВ "А.Темур" 20,030 21,391 22,179 23,190 23,447 23,447 23,447 2,991.64 388.16 299.16 3,678.96 4,598.70
УРВ Узумзор
81 Узумзор 1,815 1,938 2,005 2,090 2,110 2,110 2,110 120 253.17 25.32 25.32 303.80 379.75
Итого Узумзор 1,815 1,938 2,005 2,090 2,110 2,110 2,110 253.17 25.32 25.32 303.80 379.75
ИТОГО по Чиназскому району (численность населения указана без учета поселка Мирзабобоев, см. УРВ "Амир темур" Чиназского района)
104,764 111,845 115,751 120,642 121,775 121,775 121,775 16,908 2,752 1,691 21,351 26,688
ИТОГО по проектным районам 220,445 236,521 247,461 262,932 267,981 267,981 267,981 35,637 6,067 3,564 46,184 57,730
ИТОГО С учетом расхода на собственные нужды 4% 48,031 60,039

139
Appendix 9. Distribution Systems Development – Required Works
Name of WDC or treatment facility
Type of construction
Planned works Acquisition of land
VU-1 wellfielf Reconstruction
Demolition: existing building of laboratory Construction: drilling 12 wells (50 meter) I lift pump stations collector lines clean water reservoir 1 x 2000 m3 administrative building sanitation facility 50 m3 Reconstruction: 3 wells with I lift pump stations clean water reservoir 1 x 2000 m3 II lift pump station 2 guardhouses service connections in-site power supply networks, transformer substation, external power supply external power supply facilities protection perimeter fencing and land improvement
no
WDC VU-3 Reconstruction
Reconstruction: clean water reservoirs 2 x 2000m3 chlorination plant pump station, guardhouse, service connections in-site power supply networks, transformer substation, external power supply security lighting networks, control-measuring units and automation networks resurfacing, landscaping, protection perimeter fencing
no
WDC Khalkabad Reconstruction
clean water reservoirs 2 x 500 m3 pump station service connections in-site power supply networks, transformer substaion, external power supply resurfacing, landscaping, protection perimeter fencing Construction: clean water reservoir 1 x 500 m3 guardhouse
no

140
Name of WDC or treatment facility
Type of construction
Planned works Acquisition of land
chlorination plant sanitation facility security lighting networks, control-measuring units and automation networks
WDC VK–9 (Nurabad)
New construction
Construction: clean water reservoirs 2 x 500m3 pump station including chlorination plant guardhouse sanitation facility service connections in-site power supply networks, transformer substaion, external power supply security lighting networks, control-measuring units and automation networks resurfacing, landscaping, protection perimeter fencing
yes, 0,8 ha
WDC Chinor Reconstruction
pump station service connections in-site power supply networks, transformer substaion, external power supply Construction: clean water reservoir 1 x 500 m3 guardhouse chlorination plant sanitation facility security lighting networks, control-measuring units and automation networks landscaping, protection perimeter fencing
no
WDC Bobur New construction
Construction: clean water reservoirs 2 x 300m3 pump station including chlorination plant guardhouse sanitation facility service connections in-site power supply networks, transformer substaion, external power supply security lighting networks, control-measuring units and automation networks land improvement, landscaping, sanitary perimeter fencing, construction of access road
yes, 0,7 ha
WDC Churalisay New construction
Construction: clean water reservoirs 2 x 300 m3 pump station including chlorination plant in-site power supply networks, transformer substation, external power supply security lighting networks, control-measuring units and automation networks service connections
yes, 0,7 ha

141
Name of WDC or treatment facility
Type of construction
Planned works Acquisition of land
guardhouse sanitation facility land improvement, landscaping, sanitary perimeter fencing, construction of access road
WDC Okhunbabaev
New construction
Construction: clean water reservoirs 2 x 100 m3 pump station including chlorination plant service connections in-site power supply networks, transformer substation, external power supply security lighting networks, control-measuring units and automation networks guardhouse sanitation facility land improvement, landscaping, sanitary perimeter fencing, construction of access road
yes, 0,7 ha
WDC Boz-Suv New construction
Construction: clean water reservoirs 2 x 500 m3 pump station including chlorination plant service connections in-site power supply networks, transformer substation, external power supply security lighting networks, control-measuring units and automation networks guardhouse sanitation facility land improvement, landscaping, sanitary perimeter fencing, construction of access road
no
Water Tower Galaba and Water Tower Kanalbuyi
New construction
Construction: water towers 2 x 50 m3 boosting pump station service connections power supply networks land improvement, landscaping, sanitary perimeter fencing, construction of access road
yes, 0,06 ha
Water Tower Yangiyabad
New construction
Construction: water towers 2 x 50 m3 boosting pump station service connections power supply networks land improvement, landscaping, sanitary perimeter fencing, construction of access road
yes, 0,06 ha

142
Name of WDC or treatment facility
Type of construction
Planned works Acquisition of land
Water Tower Dustlik
New construction
Construction: water towers 2 x 50 m3 boosting pump station service connections power supply networks land improvement, landscaping, sanitary perimeter fencing, construction of access road
yes, 0,06 ha
WDC Eshonabad Reconstruction
Demolition: existing metallic reservoirs 3 x 65 m3 Construction: pump station including chlorination plant clean water reservoirs 2 x 300 m3 sanitation facility Reconstruction: service connections in-site power supply networks, transformer substation, external power supply guardhouse security lighting networks, control-measuring units and automation networks resurfacing, landscaping, protection perimeter fencing
no
WDC Sutbulak Reconstruction
Construction: chlorination plant guardhouse sanitation facility Reconstruction: clean water reservoirs 2 x 1000 m3 pump station service connections in-site power supply networks, transformer substation, external power supply security lighting networks, control-measuring units and automation networks resurfacing, landscaping, protection perimeter fencing
no
WDC Madaniyat Reconstruction
Construction: chlorination plant guardhouse sanitation facility Reconstruction: clean water reservoirs 2 x 500 m3
no

143
Name of WDC or treatment facility
Type of construction
Planned works Acquisition of land
pump station service connections in-site power supply networks, transformer substation, external power supply security lighting networks, control-measuring units and automation networks resurfacing, landscaping, protection perimeter fencing
WDC Amir Timur New construction
Construction: clean water reservoirs 2 x 1200m3 pump station including chlorination plant guardhouse sanitation facility service connections in-site power supply networks, transformer substation, external power supply security lighting networks, control-measuring units and automation networks land improvement, planting of landscaping, sanitary perimeter fencing, construction of access road
yes, 0,8 ha
WDC Gayrat New construction
Construction: clean water reservoirs 2 x 500 m3 pump station including chlorination plant service connections in-site power supply networks, transformer substation, external power supply security lighting networks, control-measuring units and automation networks guardhouse sanitation facility land improvement, planting of landscaping, sanitary perimeter fencing, construction of access road
no
WDC Yangiabad Reconstruction
Construction: chlorination plant sanitation facility Reconstruction: clean water reservoirs 2 x 500 m3 pump station service connections in-site power supply networks, transformer substation, external power supply security lighting networks, control-measuring units and automation networks guardhouse resurfacing, landscaping, protection perimeter fencing
no
WDC Kutarma Reconstruction Demolition: no

144
Name of WDC or treatment facility
Type of construction
Planned works Acquisition of land
reinforced-concrete reservoirs 2 x 500 m3 Construction: pump station including chlorination plant clean water reservoirs 2 x 700 m3 sanitation facility Reconstruction: service connections in-site power supply networks, transformer substation, external power supply security lighting networks, control-measuring units and automation networks guardhouse, resurfacing, landscaping, protection perimeter fencing
WDC Yallama Reconstruction
Construction: clean water reservoir 1 x 500m3 chlorination plant sanitation facility Reconstruction: clean water reservoirs 2 x 500 m3 pump station, in-site power supply networks, transformer substation, external power supply security lighting networks, control-measuring units and automation networks guardhouse, service connections resurfacing, landscaping, protection perimeter fencing
no
WDC Chinaz New construction
Demolition: building of laboratory Construction: clean water reservoirs 2 x 1700 m3 pump station including chlorination plant administrative building, service connections in-site power supply networks, transformer substaion, external power supply security lighting networks, control-measuring units and automation networks guardhouse, sanitation facility land improvement, planting of landscaping, sanitary perimeter fencing, construction of access road
no

145
Name of WDC or treatment facility
Type of construction
Planned works Acquisition of land
Water Tower Uzumzor
New construction
Construction: water towers 2 x 50 m3 boosting pump station service connections power supply networks land improvement, planting of landscaping, sanitary perimeter fencing, construction of access road
yes, 0,06 ha

146
Appendix 10. Settlements to be Covered by Project Water Supply Facilities
Yangiyul District
№ Name of settlements Household connections
Reconst ruction,
m
Const ruction,
m
Distribution Main, (m)
WDC
Note
Rehab. Constr.
1 Mustakillik 400 5277
The settlements will be connected to TM from VU-1 to VU-3 directly
2 Tuyabugiz 470 4164
3 Inogamov 544 1051 4248
4 Uzbekistan 543 2278 7295
5 Galaba 51 10731
6 Said ota 385 2018 6959
7 Kushtepa 513 498 3935
8 Changtepa 580 1500 2820
9 Chamanzor 510 3350
10 Koratepa 610 4048
11 Khankurgan 814 7839
12 Kengechik 421 8271
13 Mirishkor 429 11,872 8,602
1 WDC Khalkabad 14 Khalkabad 782 8,525 7,435
15 Nihol (Navoi) 479 2,670 2,695 1,350
16 Olmazor (A. Ikramov) 696 3,553
17 Nurobod 353 6,762
1,800 1 WDC VK-9 Nurabad
18 Keskan 685 8,827
19 Registon (Dangir) 580 12,336
20 Turkiz 70 1,600
21 Kaksha 68 2,430
22 Bobur 342 3141
580 1 WDC Bobur 23 Marifat 56 3500
24 Vatan 325 2509

147
№ Name of settlements Household connections
Reconst ruction,
m
Const ruction,
m
Distribution Main, (m)
WDC
Note
Rehab. Constr.
25 Markaz 549 7,843 1,800 1 WDC Shuralisay
26 Shuralisoy 369 11,644
27 Yangiyul (Okhunbabaev)
279 9009 4,000 1 WDC Akhunbabaev
28 Khakikat 424 8597
29 Umid 450 9,202 580 WDC Bozsu
30 Galaba 611 350 100 Water tower Galaba
31 Canal buyi 31 1,150 Water tower Kanalbuyi
32 Yangi makhalla 88 105
33 Yangiobod 111 3,863 830 1 Water tower Yangiobad
34 Dustlik 314 9,750 1 Water tower Yangiobad
35 Mirzaboboev 354 5154 6,365 Will be connected to WDC Amir Temur in Chinaz district 36 Urtaaul 3493 1290 6417
Will be connected to TM from VU-1
to VU-3 directly 37 Bogzor 552 4524 4204
38 Ankhor 959 1,070 7337
39 Chinor 429 2,680 3120 3,790 1 WDC Chinor
40 Dekhkanabad 297 3,793
41 Madaniyat, (Botir) 371 3316 1 Will be reconstructed WDC VU-3
Total for Yangiyul District 20361 48,923 225,401 15,980
Chinaz District
№ Name of
Settlements Household
connections
Distribution network, m Distribution
Main, (m)
WDC
WDC Reconst ruction
Const ruction
Rehab. Constr.
1 Chinoz city 4451 22,352 14976 1 WDC Chinor
2 Uzbekistan 430 6182
1 WDC Eshonabad 3 Galaba 80 2575 20
4 Ittifok 67 3095

148
№ Name of
Settlements Household
connections
Distribution network, m Distribution
Main, (m)
WDC
WDC Reconst ruction
Const ruction
Rehab. Constr.
5 Dustlik 57 2398
6 Kanalobod 197 2416
7 Sutbulok 315 6600
1 WDC Sutbulak 8 A. Khudayberganov 280 8210 1,750
9 Birlik town 476 14121
10 Madaniyat 435 6448
1 WDC Madaniyat 11 Uchkun 271 6030 2,800
12 Samarkand 453 7178
13 Yangiobod 372 1396 2,150 1 WDC Yangiabad
14 Norkuziev 127 5350
15 Kutarma 446 230
1 WDC Kutarma
16 Birlik 272 10330
17 Islomobod 546 3977 250
18 Kerdara 153 5615
19 Guliston 406 5359
20 Yollama 354 5513
1 WDC Yallama
21 Ochamayli 308 4238
22 Dekhkonobod 444 5512 1080
23 Erkin 253 5227
24 Chinmasjid 436 9610
25 Kir town 410 6000
26 Gayrat 542 4114
1 WDC Gayrat 27 S. Ayniy 264 7350
28 Kakhraman 448 9871
29 S. Rakhimov 146 2723
30 A. Temur town 975 5934
3,200 1 WDC Amir Temur 31 Mevazor 368 6801
32 Archazor 91 3719

149
№ Name of
Settlements Household
connections
Distribution network, m Distribution
Main, (m)
WDC
WDC Reconst ruction
Const ruction
Rehab. Constr.
33 Tillaobod 313 5364
34 Safarobod 193
35 Abzalobod 555 1788
36 Olmos 384 1650
37 Okhunbabaev 564 4785
38 Uzumzor 300 4,151 50 1 Water tower Uzumzor
Total for Chinaz District 17182 28,286 200,902 11,300

150
Appendix 11. Groundwater Development at the Wellfield VU-1
Based on the hydrogeological review in Section 4.3, it is emphasized to develop an average 50,000 m3/day from the well wellfield VU-1, in located in the food plain of the Chichik River, in the Kuyi Chirchik District.
Basically, the alluvial aquifer exploited by the wellfield is recharged by infiltration of water from the Chirchik River through the permeable alluvial sediments constituting its riverbed. Minor recharge occurs also rom infiltration of rainfall during rain events.
Based on the assessment in Section 4.3 it can reasonably be assumed that a single, 60 m deep production well in the permeable aquifer of the Chircjik River in this area can yield an average of 50 l/s on a continuous base. In order to an average abstraction of 50,000 m3/d, some 12 production wells would be needed. Another 30 stand-by units are required according to national norms requiring a stand-by capavity equivalent to 25% of the installed nominal capacity.
In broad terms, it is assumed that the terms of the groundwater balance relative to this aquifer have not changed throughout the years. However, possible decrease of the flow of the Chirchik river in the area of recharge of the aquifer, possibly due to increased abstractions operated upstream, might have some consequence on the recharge of the aquifer, which might result decreased accordingly.
It is anticipated that all production wells should be constructed to an average depth of 60 m. Prior to final construction, geophysical borehole logging will be conducted in each of the drilled holes, in order to identify more productive layers within the aquifer. The construction of each well shell be designed on the base of the borehole logging, the hydrogeologist and driller logging reports and other tests that will be carried out during construction. Inasmuch as possible screens shall be manufactured and of such design to minimize headlosses of groundwater passing through the screens. The well head shall be equipped non-return and control valves, hydro-pneumatic hammer pressure control tank, manometer and flowmeter. The well head shall be protected under a shelter appropriately designed in which will also be installed the electrical switches and other automatic switches, including remote data transmission devices as required under the detailed design.
It is foreseen that automatic switches commanded by the water level sensors in the production wells and in in the reservoirs shall be installed in each production well. Collectors shall be equipped with data transmission devices allowing automatic data acquisition within the operation center at the wellfield as well as remote control from the main operation control center (OCC) at the TPS main office.
The construction of the production wells should be preceded by a hydrogeological survey aimed to ascertain that the maximum quantity of groundwater needed to be abstracted daily and in the long term from the aquifer can be sustained by the average recharge of the aquifer. It is a prerequisite that accurate specific investigations will be carried out before undertaking construction of new production wells. Detailed specifications for the investigations to be carried out will be prepared by the project development facility (Consultant) and PCU and will be incorporated under the contract for well drilling. The following investigations will be carried out:
• Pumping tests of the existing still operational production wells and interpretation;
• Geophysical investigation within the wellfield area consisting of geo-electrical mapping and soundings;
• Establishment of a zonation map of the transmissivity and of the equal resistivity zones of the aquifer;
• establishment of updated groundwater balances under seasonal dry and high water conditions, namely September and May;

151
• Selection of those among the existing wells, that can be rehabilitated and used as piezometers for the monitoring of the groundwater level within the wellfield in the long term;
• Preparation of a plan for drilling test-production wells in the sites which, based on the geo-electrical surveys, the aquifer appear to be more permeable, therefore most suitable for the construction of production wells;
• Analysis of indicators of quality of groundwater from the existing and test wells.
Long duration (72 hours) pumping tests will be carried out in all newly constructed production wells included in the final development program will be tested for long duration pump-tested.
A long term program of monitoring the groundwater level and quality of the water before chlorination will be prepared jointly by the Project Implementation Consultant, the contractor and PMU. TPS will be endorsed with the long term responsibility to carry out the quality and dynamin monitoring of the quality and dynamic conditions of the groundwater.
A final hydrogeological and well drilling report will be established upon commissioning of the wellfield, providing details of: i) all results and outcomes of the preliminary hydrogeological investigations, ii) the results of the pumping tests, iii) the wells construction and equipment, iv) the electromechanical equipment, v) the electric controls, vi) of the automated data acquisition and transmission system, and vii) an operational manual.

152

153
Appendix 12. Water Supply Development Schemes of Project Areas

154

155

156

157

158

159
Appendix 13. Detailed Quantities Information
Trunk Main, km D-700mm 0.6
D-700mm 16.3
D-800mm 17.64
D-600mm 30.56
Total 65.1
Secondary Trunk Main, km
D-63mm 1.3
D-100mm 0.83
D-140mm 2.15
D-160mm 5.18
D-200mm 3.13
D-250mm 1.8
D-280mm 3.2
D-315mm 4.15
D-400mm 5.54
Total 27.27
Distribution networks, km
D-100mm 360.15
D-125mm 31.2
D-140mm 42.92
D-160mm 36.56
D-180mm 13.68
D-200mm 17.82
D-225mm 5.18
D-250mm 5.84
D-280mm 8.75
D-300mm 10.3
D-400mm 4.23
Total 539.76
VU-1 wellfield
Drilling and equipment of new wells 12
Rehabilitation and equipment of existing wells 3
Rehabilitation of reservoir 2000 m3 1
Construction of reservoir 2000 m3 1
Reconstruction and equipment of chlorination unit 1
Reconstruction of the 2nd lift pumping station 1
Reconstruction and equipment of operation office, mini-laboratory, workshop
Sanitation system
Installation of individual 2m3 capacity septic tank system
4000
Household connections
Yangiyul district 20,361
Chinaz district 17,182
Total 37,543