
Seawater intrusion in the Guanahacabibes Peninsula (Pinar del Rio Province, western Cuba): effects...
67
This is a preprint. Final version is subject to change. Cite as Authors (Year) Title. Environmental Earth Sciences, in press. DOI: 10.1007/s12665-014-3825-1 Always consult and cite the final, published document. See: http://link.springer.com/journal/12665 1 Seawater intrusion in the Guanahacabibes Peninsula (Pinar del Rio Province, western Cuba): effects on karst development and water isotope composition Tiziano Boschetti 1, *, Patricia González-Hernández 2 , Rebeca Hernández-Díaz 3 , Gino Naclerio 4 , Fulvio Celico 1 1 - Department of Physics and Earth Sciences “Macedonio Melloni”, University of Parma, Parco Area delle Scienze 157A, 43124 Parma, Italy *corresponding author: e-mail: [email protected]; [email protected] 2 - Faculty of Chemistry, University of Havana, Zapata between G and Carlitos Aguirre, Vedado, PC 10400 Havana, Cuba 3 – University of Pinar del Río "Hermanos Saiz Montes de Oca", Calle Marti 270 Final, Pinar del Río, 20100 Cuba 4 – Department of Biosciences and Territory, University of Molise, Contrada Fonte Lappone, 86090, Pesche (IS), Italy Abstract The water resources in the Guanahacabibes Peninsula are distributed in two areas. The northeastern area is characterized by swamps, wetlands and lagoons, with a low contribution of seawater, whereas the area in the southwestern plain shows a considerable development of the karst structures that limits the existence of superficial waters but permits the ingression of the surrounding seawater. In this latter area, the groundwater showed a marked increase in salinity with the depth. In particular, groundwater with a seawater fraction of 0.1 had the lowest Ca-(Mg)-carbonates saturation indexes calculated by modeling the mixing between freshwater and seawater using different software, thermodynamic databases and equations for activity coefficients. Generally, seawater and groundwaters with an added seawater fraction above 0.60-0.65 showed similar oversaturated indexes in high-Mg calcites and pure-Ca carbonates (calcite and aragonite). Differently, in the groundwater that showed carbonates undersaturation (generally with a seawater fraction between 0.02 and 0.60) the saturation indexes in high-Mg calcites was 0.2 lower than pure-Ca carbonates. Locally, the bacterial reduction of the dissolved sulfate enhanced the dissolution of the limestone, contributing to the increased development of the karst structures and the seawater intrusion. Finally, the presence near the coastline of fresh Ca- and Na-bicarbonate waters was in accord with the upwards flow of the shallow freshwater during the formation of the saline wedge. However, the oxygen and hydrogen stable isotope composition of the waters showed a probable contribution to the area from a deep aquifer that is recharged in the highest reliefs of the province (Cordillera de Guaniguanico).
Transcript of Seawater intrusion in the Guanahacabibes Peninsula (Pinar del Rio Province, western Cuba): effects...

This is a preprint. Final version is subject to change. Cite as Authors (Year) Title. Environmental Earth Sciences, in press.
DOI: 10.1007/s12665-014-3825-1
Always consult and cite the final, published document. See: http://link.springer.com/journal/12665 1
Seawater intrusion in the Guanahacabibes Peninsula (Pinar del Rio Province, western Cuba):
effects on karst development and water isotope composition
Tiziano Boschetti1,*, Patricia González-Hernández2, Rebeca Hernández-Díaz3, Gino Naclerio4, Fulvio
Celico1
1 - Department of Physics and Earth Sciences “Macedonio Melloni”, University of Parma, Parco Area delle Scienze
157A, 43124 Parma, Italy
*corresponding author: e-mail: [email protected]; [email protected]
2 - Faculty of Chemistry, University of Havana, Zapata between G and Carlitos Aguirre, Vedado, PC 10400 Havana,
Cuba
3 – University of Pinar del Río "Hermanos Saiz Montes de Oca", Calle Marti 270 Final, Pinar del Río, 20100 Cuba
4 – Department of Biosciences and Territory, University of Molise, Contrada Fonte Lappone, 86090, Pesche (IS), Italy
Abstract
The water resources in the Guanahacabibes Peninsula are distributed in two areas. The northeastern area is
characterized by swamps, wetlands and lagoons, with a low contribution of seawater, whereas the area in the
southwestern plain shows a considerable development of the karst structures that limits the existence of
superficial waters but permits the ingression of the surrounding seawater. In this latter area, the groundwater
showed a marked increase in salinity with the depth. In particular, groundwater with a seawater fraction of 0.1
had the lowest Ca-(Mg)-carbonates saturation indexes calculated by modeling the mixing between freshwater
and seawater using different software, thermodynamic databases and equations for activity coefficients.
Generally, seawater and groundwaters with an added seawater fraction above 0.60-0.65 showed similar
oversaturated indexes in high-Mg calcites and pure-Ca carbonates (calcite and aragonite). Differently, in the
groundwater that showed carbonates undersaturation (generally with a seawater fraction between 0.02 and
0.60) the saturation indexes in high-Mg calcites was 0.2 lower than pure-Ca carbonates. Locally, the bacterial
reduction of the dissolved sulfate enhanced the dissolution of the limestone, contributing to the increased
development of the karst structures and the seawater intrusion. Finally, the presence near the coastline of fresh
Ca- and Na-bicarbonate waters was in accord with the upwards flow of the shallow freshwater during the
formation of the saline wedge. However, the oxygen and hydrogen stable isotope composition of the waters
showed a probable contribution to the area from a deep aquifer that is recharged in the highest reliefs of the
province (Cordillera de Guaniguanico).

This is a preprint. Final version is subject to change. Cite as Authors (Year) Title. Environmental Earth Sciences, in press.
DOI: 10.1007/s12665-014-3825-1
Always consult and cite the final, published document. See: http://link.springer.com/journal/12665 2
1. Introduction
The Cuban land territory encompasses 110’992 km2, which is 66% karstified rocks, plus 67’831 km² of the
shallow-water shelf karst (Iturralde-Vinent and Gutiérrez Domech 1999). Carbonate karst aquifers are the
primary source of freshwater and are therefore essential to the future needs of the country (Seale et al. 2004).
Unfortunately, coastal plains are often contaminated by seawater intrusion, and the vulnerability to salinization
is the most common and widespread problem for an aquifer. In the Guanahacabibes Peninsula of western
Cuba, the contamination of the fresh groundwater by the saline seawater may be intensified by different,
concomitant natural and anthropogenic factors: the rain regime, sea tides, the conditions of recharge of the
aquifer(s), excessive aquifer exploitation by wells for human consumption and agricultural activities (Fagundo
Castillo and González Hernandez 1999; Hernández et al. 2013; Molerio León and Parise 2009). Therefore,
the implementation of suitable monitoring and protective actions is fundamental for the preservation of these
aquifers and for assuring the future use of this resource. In this paper, we present the first results of a study to
characterize the groundwaters of Guanahacabibes based on their major chemical and isotopic composition.
Specifically, the two main objectives are the following: i) the calculation of the seawater fraction that mixes
with the groundwater together with the influence of this fraction on karst development in terms of the
carbonates saturation index (SI) of the waters; and ii) the discrimination between the seawater ingression and
the isotope effects due to tropical climate and topographic relief on evaporation and rain recharge,
respectively. Concerning geochemical mixing modeling, new topics of wide interest were treated. In
particular, the errors on the pure calcite, Mg-calcite and aragonite saturation indexes due to the incomplete
chemistry of the end-members, to the use of different thermodynamic databases and the related activity
coefficient equations are discussed.
1.1 Mixing modeling: the state of the art
When seawater and fresh groundwater mix, the addition of ions, such as Na+ and Cl-, to a bicarbonate water
generally decreases the activity of Ca2+ and HCO3-, among other ions, and so increases the solubility of
calcium carbonates. This result is known as the ionic-strength effect, but is sometimes termed the foreign-ion
effect or, simply, the salt effect. Generally, when two waters are mixed, the species concentrations in the
mixture are volume-weighted averages of the two concentrations in the end-member solutions. However, the
thermodynamic activities of the ionic species that control mineral-water reactions in the mixture are not linear
functions of mixing, because of the nonlinear variation with ionic strength in the activity coefficients of
individual ions. Two end-member solutions could therefore be saturated with respect to a given mineral, but
the mixed solution could be either undersaturated or supersaturated (Runnells 1969). Mean surface seawater
is supersaturated in calcite and aragonite, with SIcalcite = 0.8 and SIaragonite = 0.6, and the North Atlantic and
North Pacific oceans are slightly above and below these values, respectively (Zeebe and Wolf-Gladrow 2001).

This is a preprint. Final version is subject to change. Cite as Authors (Year) Title. Environmental Earth Sciences, in press.
DOI: 10.1007/s12665-014-3825-1
Always consult and cite the final, published document. See: http://link.springer.com/journal/12665 3
Because of global warming and the increasing transport of carbon dioxide from the land to atmosphere and
then into seawater, the aqueous CO2 species in seawater increases and the pH of the water decreases slightly,
resulting in a decrease in the degree of carbonate supersaturation of coastal zone waters (Mackenzie and Ver
2010). However, note that because of inhibition effects, mainly from dissolved magnesium but also from
organic acids and phosphates, calcite, low-Mg calcite (<5% mol Mg) and dolomite cannot precipitate from
surface seawater, whereas aragonite and high-Mg calcite (>5% mol Mg) are formed (e.g., Appelo and Postma,
2007). Therefore, most of authors prefer to define the surface seawater calcite supersaturation as “apparent”
(Cooke and Kepkay 1984) and use the laboratory solubility product experimentally determined in seawater
(Emerson and Hedges 2003).
Using the WATEQ code and the Truesdell-Jones approach for activity calculation, Plummer (1975) showed
that mixtures of freshwater with a high percentage of seawater were supersaturated with respect to calcite
mainly because of the seawater supersaturation whereas, at lower seawater percentages, the mixtures were
undersaturated. Seawater ingression at the Yucatan Peninsula (Mexico) was extensively studied by Back et
al. (1986) and Stoessell et al. (1989) with the software PHREEQE and REACT software, which used a
modified (Davies or Truesdell-Jones) or extended Debye-Hückel approach, respectively, for activity
coefficients calculation. Certain minor differences between the modeling results were imputed to the diversity
in activity estimation and to the different end-members compositions (Stoessell et al. 1989). Later, Stoessel
(1992) compared an updated mixing model with the real water samples from Barbados and discovered that
minimal sulfate reduction (<50% of sulfate removed as sulfide) enhanced the dissolution of calcite in brackish
to saline mixing-zone fluids, whereas considerable sulfate reduction (>50% of sulfate removed as sulfide)
enhanced precipitation in all mixing-zone fluid compositions (Stoessel 1992).
Other studies followed, and different software were used; for example, PHREEQE and its later versions (Lin
et al. 2013; Price and Herman 1991; Sanford and Konikow 1989) or EQ3/6 (Liu and Chen 1996). Some of
these models were further improved with a solute transport model, but despite this, most of authors do not
specify: i) what equation was employed in the activity coefficients calculation, thus ignoring the error of the
saturation indexes and; ii) the inhibition effect of Mg on the saturation indexes of carbonates.
2. Geological and hydrogeological settings
Cuba is a tectonically complex island and its geological history spans the Mesozoic and Cenozoic (e.g. Seale
et al., 2004). In western Cuba, carbonate rocks range in age from recent to Upper Jurassic. Cretaceous and
Jurassic limestones constitute part of the Cordillera de Guaniguanico (Allochthonous Terrane), which is
mainly formed by the belts of Guajaibon–Sierra Azul, Northern Rosario, La Esperanza (westernmost sector
of the Northern Rosario, also named Alturas de Pizarras del Norte), Southern Rosario and the Sierra de Los
Organos belt that has been subdivided into the Mogotes and the Pizarras del Sur Alturas (Pardo, 2009; Fig.

This is a preprint. Final version is subject to change. Cite as Authors (Year) Title. Environmental Earth Sciences, in press.
DOI: 10.1007/s12665-014-3825-1
Always consult and cite the final, published document. See: http://link.springer.com/journal/12665 4
1). These carbonates are telogenetic because they have experienced significant diagenetic alteration, including
burial and uplift (Choquette and Pray 1970). In contrast with the tightly faulted, imbricated stack of south-
dipping plates in central Cuba, the western belts are less intensely tectonized, north-dipping, superimposed
thrust sheets (Pardo 2009). Miocene through recent limestones are expansive in Cuba and are separated from
the Guaniguanico Terrane by the Pinar Fault (Fig. 1). These limestones are eogenetic carbonates because they
are in situ and have experienced little burial and tectonics (Choquette and Pray 1970). Eogenetic and
telogenetic carbonate rocks differ with respect to permeability and porosity. Eogenetic carbonate rocks retain
significant matrix permeability and porosity (Budd and Vacher 2004), and may be up to 50’000 times more
permeable than telogenetic carbonates (Florea and Vacher 2006). This difference in matrix permeability has
important implications when considering groundwater flow, conduit morphology and aquifer response (Florea
and Vacher 2006). The carbonate aquifer of the Cordillera de Guaniguanico is confined by the Quaternary
sediments, thus representing the hydrological feeding zone for the south-western area of the Guanahacabibes
Peninsula. This peninsula constitutes an example of the recent geologic and geomorphologic development
with wide presence of Pliocene and Quaternary carbonate rocks that were modified mainly by karst processes.
The southwestern portion of this area, managed as a national park, is formed by two flat peninsulas with playas
and coastal cliffs, characterized by the typical diente de perro (dog’s tooth) karst surface, whereas the
northeastern portion is characterized by swamps, wetlands and lagoons. The karstification of this area is
intense and characterized by dissolution and collapse forms represented by the development of dolines,
cenotes, extensive karrenfield and caves (Díaz Guanche et al., 2013).
The investigated area is subdivided into four geologic formations (Cabrera and Peñalver 2001; Denis and Díaz
Guanche 1993; Díaz Guanche et al. 2013; Hernández et al. 2013): i) Vedado Formation, consisting of cream-
colored to white massive marly limestone of biogenic origin (reef), constituting the main nucleus of the
emerged area of the peninsula and dating from the Upper Pliocene until the lower Pleistocene. ii) Jaimanitas
Formation, consisting of limestone and biodetritic coral reef, lying on the training Vedado, occupying the first
marine terrace and dating from the Middle Pleistocene age. iii) Cayo Piedras Formation, consisting of the
middle biocalcarenitic of the retro-reef environment, also corresponding with the Versalles-Guanabo
(carbonatic) and Villaroja (terrigenous) Formations, and dating from the Middle Pleistocene age. iv) Guane
Formation, consisting of conglomerates, gravels, sands and sandy clays, weakly cemented by clays, showing
indefinite lenticular and more rarely inclined stratification deposited in a sea with abundant alluvial
contribution, that could be estuarine, measures up to 50 m in thickness and can be interdigitated with the
Vedado Formation, and dates from the Upper Pliocene-Lower Pleistocene age. Considering the lithological
similarity and their distinctness only at local scale, the Vedado, Jaimanitas and Cayo Piedra formations were
unified in Fig. 1.

This is a preprint. Final version is subject to change. Cite as Authors (Year) Title. Environmental Earth Sciences, in press.
DOI: 10.1007/s12665-014-3825-1
Always consult and cite the final, published document. See: http://link.springer.com/journal/12665 5
Two main hydrogeological units are recognized in the area (Peláez García and González Cabrera 2013). The
first unit is called the Neogene-Quaternary complex and corresponds to the Guane aquifer of Cabrera
Bermúdez et al. (2004). The complex extends broadly through the whole area in association with the carbonate
formations (Vedado, Jaimanitas), and it can reach a total thickness of 750 m and be strongly karstified in the
upper 300 m. The underground waters of this aquifer are fundamentally of the chloride-sodium type, due to
the marine intrusion with a salinity that oscillates between 1 and 5 g/l and chlorides that may vary from 500
to 800 mg/l. At isolated points of the peninsula, lenses of Ca-bicarbonate freshwater with a salinity of 0.6–0.8
g/l and chlorides between 90 and 290 mg/l overlie on the salty waters. The lagoon and mangrove deposits,
located along the north coastal belt and in some inner spots as the case of Los Remates Swamp, control the
regime of ground-water flow in the northeastern part of the aquifer (Hernández et al. 2013). The second
hydrogeological unit is the Upper Jurassic – Lower Cretaceous “Guasasa complex”. It is composed by the
gray karstified and cracked limestones of the Upper Jurassic that forms the karst denuded low mountains relief
in the Sierra de Los Organos where the hydrographic Cuyaguateje Basin is located. It includes the Guasasa
Formation (micritic limestones, calcareous sandstones and flint lens) and the Guaniguanico Basin – Los
Organos Sub-Basin of Cabrera Bermúdez et al. (2004). There is no outcrops of this unit in the studied area
because buried. However, it seems that waters emerge as fresh submarine discharge in the southwestern part
of the Guanahacabibes Peninsula, therefore, a relation with the large karst springs located in the Sierra de Los
Organos has been proposed (Peláez García and González Cabrera 2013).
3. Water Sampling, Analysis, and Calculations
3.1 Samples description
From 22 June 2013 to 27 August 2013, 62 water samples were collected at the locations shown in Figure 1b.
The samples included seawaters from 4 locations (Los Cayuelos, slc; Bahia Guadiana, sbg; Maria La Gorda,
sml; Bahia Cortes, sbc), 4 waters from karst caves (Quintana, cq; Roncali, cr; Lázaro, cl; Julia, cj), 4 surface
waters from swamps (Ciénaga of Los Remates, LR1 and LR2), lagoons (Laguna El Pesquero, LP) and river
(Cuyaguateje, rc). The remaining samples were gathered from 25 water wells, all distributed in the Sandino
municipality. Of these, 3 to 5 samples were collected from the #18, #33 and Pacheco (p) wells at certain depths
with respect to the elevation of the piezometric level (meters respect to the mean sea level).
3.2 Field and laboratory methods
At the sampling site, temperature, electrical conductivity (at 25°C), pH (at 20°C), Eh (referred to the standard
hydrogen electrode SHE) and CO2 measurements were performed using a multiparameter meter. In the
laboratory, carbonate alkalinity (cAlk as HCO3) was determined by titration using the HCl and dye indicator
method. The concentrations of major ions (Ca, Mg, Na, K, Cl, NO3, NH4 and SO4) and certain trace
This is a preprint. Final version is subject to change. Cite as Authors (Year) Title. Environmental Earth Sciences, in press.
DOI: 10.1007/s12665-014-3825-1
Always consult and cite the final, published document. See: http://link.springer.com/journal/12665 6
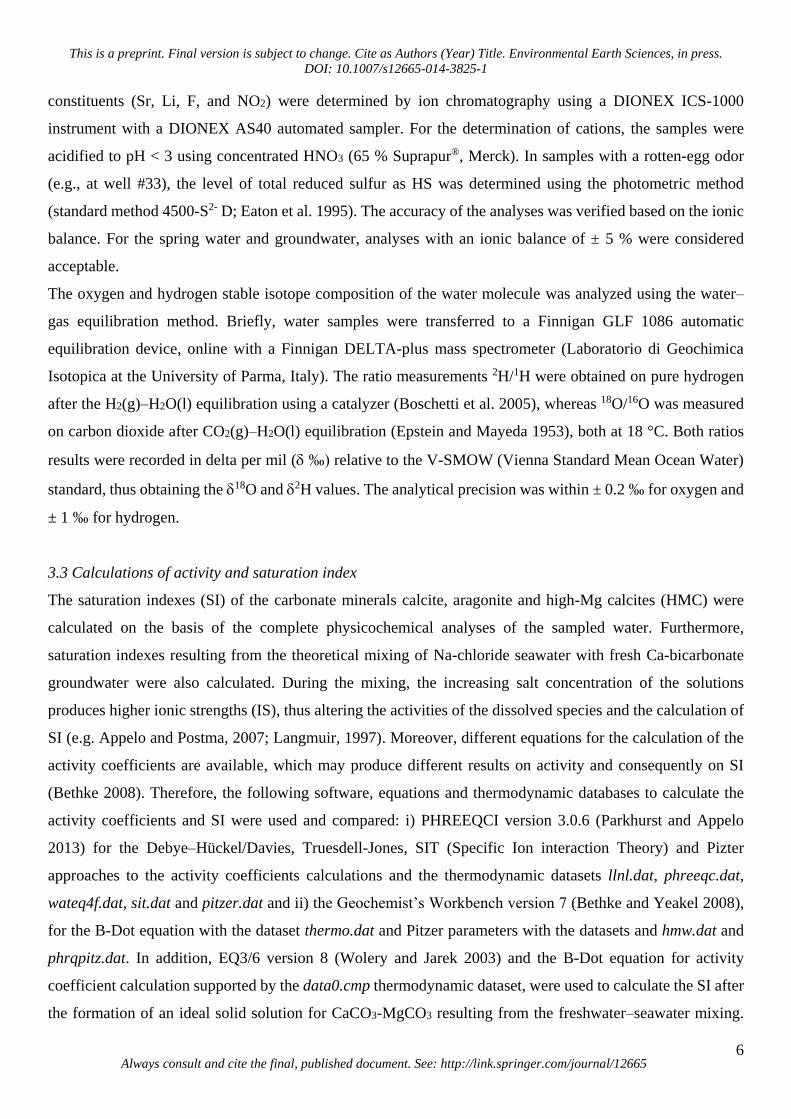
constituents (Sr, Li, F, and NO2) were determined by ion chromatography using a DIONEX ICS-1000
instrument with a DIONEX AS40 automated sampler. For the determination of cations, the samples were
acidified to pH < 3 using concentrated HNO3 (65 % Suprapur®, Merck). In samples with a rotten-egg odor
(e.g., at well #33), the level of total reduced sulfur as HS was determined using the photometric method
(standard method 4500-S2- D; Eaton et al. 1995). The accuracy of the analyses was verified based on the ionic
balance. For the spring water and groundwater, analyses with an ionic balance of ± 5 % were considered
acceptable.
The oxygen and hydrogen stable isotope composition of the water molecule was analyzed using the water–
gas equilibration method. Briefly, water samples were transferred to a Finnigan GLF 1086 automatic
equilibration device, online with a Finnigan DELTA-plus mass spectrometer (Laboratorio di Geochimica
Isotopica at the University of Parma, Italy). The ratio measurements 2H/1H were obtained on pure hydrogen
after the H2(g)–H2O(l) equilibration using a catalyzer (Boschetti et al. 2005), whereas 18O/16O was measured
on carbon dioxide after CO2(g)–H2O(l) equilibration (Epstein and Mayeda 1953), both at 18 °C. Both ratios
results were recorded in delta per mil ( ‰) relative to the V-SMOW (Vienna Standard Mean Ocean Water)
standard, thus obtaining the 18O and 2H values. The analytical precision was within ± 0.2 ‰ for oxygen and
± 1 ‰ for hydrogen.
3.3 Calculations of activity and saturation index
The saturation indexes (SI) of the carbonate minerals calcite, aragonite and high-Mg calcites (HMC) were
calculated on the basis of the complete physicochemical analyses of the sampled water. Furthermore,
saturation indexes resulting from the theoretical mixing of Na-chloride seawater with fresh Ca-bicarbonate
groundwater were also calculated. During the mixing, the increasing salt concentration of the solutions
produces higher ionic strengths (IS), thus altering the activities of the dissolved species and the calculation of
SI (e.g. Appelo and Postma, 2007; Langmuir, 1997). Moreover, different equations for the calculation of the
activity coefficients are available, which may produce different results on activity and consequently on SI
(Bethke 2008). Therefore, the following software, equations and thermodynamic databases to calculate the
activity coefficients and SI were used and compared: i) PHREEQCI version 3.0.6 (Parkhurst and Appelo
2013) for the Debye–Hückel/Davies, Truesdell-Jones, SIT (Specific Ion interaction Theory) and Pizter
approaches to the activity coefficients calculations and the thermodynamic datasets llnl.dat, phreeqc.dat,
wateq4f.dat, sit.dat and pitzer.dat and ii) the Geochemist’s Workbench version 7 (Bethke and Yeakel 2008),
for the B-Dot equation with the dataset thermo.dat and Pitzer parameters with the datasets and hmw.dat and
phrqpitz.dat. In addition, EQ3/6 version 8 (Wolery and Jarek 2003) and the B-Dot equation for activity
coefficient calculation supported by the data0.cmp thermodynamic dataset, were used to calculate the SI after
the formation of an ideal solid solution for CaCO3-MgCO3 resulting from the freshwater–seawater mixing.

This is a preprint. Final version is subject to change. Cite as Authors (Year) Title. Environmental Earth Sciences, in press.
DOI: 10.1007/s12665-014-3825-1
Always consult and cite the final, published document. See: http://link.springer.com/journal/12665 7
Differently, in the above described i) and ii) models, the Mg-calcite’s saturation indexes of solutions resulting
from mixing and containing a mole fraction x of Mg-carbonate was calculated as following (Glynn and
Reardon 1990):
2 2 21- 3 3Ca Mg CO 1 Ca + Mg + COx x x x [1]
22 23
(1 x)COCa Mg
IAP xMg calcites a a a
[2]
SI = log(IAP ) log( )Mg calcites Mg calcites Mg calcitesK [3]
where IAPMg-calcites is the ion activity product of the solution and KMg-calcites the solubility constant of the HMCs.
For these latter, 12% < x < 14% were considered in accord with the typical values found in tropical carbonates
(Agegian and Mackenzie 1989; Garrels and Wollast 1978; Perry et al. 2011), whereas -logKMg-calcites of 8.42
and 8.25 at 25°C and 1 bar for synthetic(inorganic) and biogenic were chosen, respectively (Morse and
Mackenzie 1990).
4. Chemical Composition
4.1 Results and main characteristics
The chemical composition of the sampled waters is shown in the Electronic Annex 1. The mean temperature
of the samples, T = 27.3 ± 1.6 °C, agreed with the local air temperature of the summer period (25°C).
Considering the calculated total dissolved solids (TDS; Eaton et al., 1995) and the salinity classification by
Robinove et al. (1958) that use this parameter, all of the groundwaters collected from the surface of the water
table were fresh because had TDS < 1 g/l, but two slightly saline (1 < TDS < 3 g/l) samples from #66 (TDS =
1.1 g/l) and Mella (me, TDS = 1.7 g/l) wells. Moreover, the TDS increased with the sampling depth in the
wells explored at different depths. For example, at the bottom of the wells #18 and #33, the TDS increased
toward the highly saline range (10 < TDS < 35 g/l), thus approaching the mean seawater value (35 g/l), whereas
the TDS in the Pacheco well remained in the freshwater range. Water from the well at Roncali lighthouse
(Faro Roncali, fr) showed the highest TDS value, similar to that of the seawater, both at the surface and the
well bottom. Excluding this sample, all of the water sampled at the surface of the water table showed a mean
pH of 7.43 ± 0.31, which is similar to the mean value of water from the Cuyaguateje Basin (Fig. 1; 7.00 ±
0.86; Fagundo et al., 1986). Water samples from the wells explored in depth showed values that scattered not
only between this values and that of the local seawater (pH = 8.53 ± 011), as expected for seawater intrusion
(well #18), but also values lower than 6 (well #33). Therefore, in this latter case, more complex phenomena
than the pure mixing must have occurred.
4.2 Evaluation of seawater ingression and related effects

This is a preprint. Final version is subject to change. Cite as Authors (Year) Title. Environmental Earth Sciences, in press.
DOI: 10.1007/s12665-014-3825-1
Always consult and cite the final, published document. See: http://link.springer.com/journal/12665 8
After converting the anion and cation concentration data of the major chemical constituents from mg/l to
meq/l, the four following compositional facies, listed from the least to the most salty, could be distinguished
in the sampled waters (Electronic Annex 1): six Ca-bicarbonate freshwaters (well #3; Rio Cuyaguateje, rc;
Laguna El Pesquero, lp; RGB29 well, #29; Ngouabi well, ng; Cueva Roncali, cr); two Ca-chloride freshwaters
(well Quintana, q; well #60) and two Na-bicarbonate freshwaters (Pacheco well at the surface of the water
table, p; Abasto Maria La Gorda P1, mlg1). All of the TDS of the Ca-bicarbonate and Ca-chloride waters were
0.1 < TDS < 0.5 g/l, which are excellent to good waters for irrigation and drinking purposes in terms of salinity
(CASS 2003; WHO 2011), but the water quality deteriorates when approaching to the Na-chloride
composition passing through Na-bicarbonate. Because of the swelling effect in clays, a sodium excess in water
can produce a decreased permeability with negative repercussion on the normal water supply and aeration
required for plant growth. Therefore, the sodium adsorption ratio is another parameter widely used to classify
irrigation waters (SAR, Appelo and Postma, 2007; Electronic Annex 1). However, using waters classification
by this parameter, only 4 samples picked up at water table surface showed SAR value above its critical limit
SAR > 10, which correspond to a TDS > 1.4 g/l (me, #18, fr wells and Los Remates LR2 swamp). Whereas
the Na-chloride is the typical chemical facies resulting from the pure mixing with the seawater in a coastal
karst environment, both the Ca-chloride and Na-bicarbonate are other two recurrent facies resulting from
cation exchange in this type of environment. Ca-chloride is the result of seawater intrusion in an aquifer with
Ca-bearing sediment (Ca2+ released by soil exchanger, Cl- from seawater), whereas the latter occurs when
freshwater flushes a salt water aquifer with Na-bearing sediments (Appelo and Postma 2007; Jones et al.
1999). These effects are suitably shown in the diamond of the Piper diagram (Fig. 2), where freshening and
intrusion cation exchange effects depart from the mixing line connecting the Ca-bicarbonate freshwater corner
and the saline seawater point. A pure mixing effect is shown for well #18 down to a depth of 10 m (Fig. 2b),
whereas exchange effects after seawater intrusion can be hypothesized in well #33 down to 20 m (Fig. 2c).
The Pacheco well samples are scattered in the freshening area, probably due to a secondary mixing (Fig. 2d).
The presence of freshwater very close to the coastline, as occurred for the Na-bicarbonate water at Maria La
Gorda and Ca-bicarbonate water at Cabo San Antonio promontories, might represent the effect of a lens of
freshwater floating on a deeper salty one according to the typical salt-wedge effect (Custodio 1987; Sáinz et
al. 2010). Also calcite dissolution-precipitation and sulfate reduction could be potentially visualized on the
Piper plot (Fig. 2; Appelo and Postma 2007), but the discernment is hard when more effects are combined.
Moreover, the interpretation could be complicated further by additional processes (secondary mixing, sulfide
and organic matter oxidation). Finally, the sum of the variables that characterize this diagram does not help
the purpose. Therefore, the additional effects were searched using different variables and diagrams.
The use of the conservative constituents Br and Cl provided further confirmation that mixing between the two
end members was the main salinization process because the plotted samples depict a distinct straight line that

This is a preprint. Final version is subject to change. Cite as Authors (Year) Title. Environmental Earth Sciences, in press.
DOI: 10.1007/s12665-014-3825-1
Always consult and cite the final, published document. See: http://link.springer.com/journal/12665 9
joins freshwater and seawater (Fig. 3). The only exception concerns the swamp sample LR2 which showed an
halogens enrichment, most likely due to the dissolutions of halite in an evaporitic environment (Fig. 3).
Chloride can be also used as follows to calculate the theoretical seawater fraction (f) in a mixed sample,
assuming conservative mixing between freshwater and seawater (Appelo and Postma 2007):
-
-
S fw
sw fw
Cl Clf
Cl Cl [4]
where Cls, Clfw and Clsw are the chloride content, in mol/l or meq/l, of the sample, the local freshwater and the
seawater, respectively. For Clfw and Clsw, the average content in the Cuyagateye Basin (0.621 mol/l; Fagundo
et al., 1986) and of the four local seawater sampled in this study (583 mol/l) were used, respectively. Most of
the groundwater samples showed 0.00 < f < 0.04, except the coastal part of LR2 (f = 0.28) and fr well (f =
0.86). According to Hernández et al. (2013), also #18, #33 and Pacheco wells have f < 0.04 at depths between
5-15 m. The f value gradually increased up to 0.1 at depths of 16-25 m; below this depth range, the f value
increased abruptly and quickly toward that of pure seawater (f = 1) estimated at 34-42 m (Fig. 4).
The intrusion and freshening effects in the wells monitored at different depths are also effectively shown on
binary diagrams that plot chloride and major cations (Fig. 5). In particular, the samples from well #33 showed
Ca enrichment and a Mg, Na and K depletion compared with the curves that represent binary mixing between
seawater and freshwater or rainwater on which well #18 samples are clustered. The water from Pacheco well
showed a Na-chloride composition at depth, but Na-bicarbonate at the water table and more shifted toward
rainwater, probably due to the rain washing of soil’s clay having exchangeable sodium. The greater diversity
among the fresh groundwaters and the eastern Cuba (Rodríguez et al. 2004) and Caribbean (Cerón et al. 2005)
rainwaters shown in the Cl-Ca plot (Fig. 5a) is explainable by the high variability in the Ca concentration of
the Ca-bicarbonate waters coming from the Sierra de Los Organos and Rio Cuyaguateje, whose lower values
are quite similar to those of western Cuban rainwater (Molerio León 1992; Molerio León 2012).
The mixing of freshwater and seawater, that are both saturated with calcium carbonate, can result in water that
is undersaturated with calcium carbonate; that is, calcite dissolution may occur (Richter and Kreitler 1993).
In the Ca vs HCO3 and SO4 vs Cl diagrams (Fig. 6), the calcium excess and sulfate deficit of the well #33
samples could be explained by additional calcium carbonate dissolution occurring in the presence of bacterial
sulfate reduction in organic-rich sediments. In fact, the sulfate decline shown by the well #33 occurred at a
chloride content that could not be explained by dilution (Fig. 6a). In this scenario bicarbonate should be
increasing according to the following reaction:
2- - - +
2 4 3CH O + 0.5SO HCO + 0.5HS + 0.5H [5]

This is a preprint. Final version is subject to change. Cite as Authors (Year) Title. Environmental Earth Sciences, in press.
DOI: 10.1007/s12665-014-3825-1
Always consult and cite the final, published document. See: http://link.springer.com/journal/12665 10
and this is confirmed by the presence of dissolved sulfide (up to 1.8 mg/l). However, the bicarbonate
unexpectedly decreased most likely because of its conversion to CO2 (up to 504 mg/l) caused by an extremely
low pH (down to 5.9), both measured in well #33 at depths down to 30 meters. The low pH may have resulted
from the oxidation of previously deposited sulfides. Therefore, starting from the groundwater sampled at a
shallow depth, which showed high HCO3 most likely because of the presence of organic matter, and continuing
to deeper depths, a Ca increase preceded a HCO3 decrease that followed a negative exponential curve fitted
to the samples (Fig. 6b). After a steep increase up to 44 meq/l of Ca caused by carbonate dissolution, the Ca
concentration of the groundwater decreased at well bottom to resemble seawater, which is consistent with a
deep ingression in a manner similar to the previously described “deep regime” intrusion (Back 1966; Custodio
1987). Finally, noted that the sulfate-reduction process was also revealed in the neighboring Laguna del Valle
de San Juan (Pérez and Pubillones León María 1988).
5. Mixing modeling: results and discussion
The results concerning the carbonates saturation indexes (SI) of the samples collected in this study are in the
Electronic Annex 2, here discussed and compared with the results of the freshwater-seawater mixing
modeling.
Concerning the models, the mean composition of the four local seawater (SW) samples and the Cueva Roncali
(FW) sample were used as end-members. The latter was chosen because it has a bicarbonate content similar
to that of the surface sample of well #33, but a negligible fraction of seawater typical of the Ca-bicarbonate
freshwaters. The discussion and comparison of the results with the real samples in terms of SI follow a
technical focus on SI errors, dedicated to the modeler specialists.
5.1 Error on saturation index (SI): activity calculation and charge-balance effects
If an error of ± 0.2 on SI is considered as acceptable, all of the model’s results were comparable when SIcalcite
and SIaragonite were plotted against chloride during FW-SW mixing, except for the Truesdell-Jones model using
phreeqc.dat (Fig. 7). Regarding this exception, quite different results on SI were obtained if the input data of
the end-members composition included reduced species (e.g. ammonia) without the oxidized counterparts
(nitrite, nitrate). In particular, the sampled SWs had an high ammonium content (85.5 mg/l), comparable with
that observed in coastal interstitial waters within sediments rich in organic matter (Matisoff et al. 1975).
However, in our case the nitrate data are lacking because not measured or below the detection limits. Under
these conditions, the error in the calculated SI after mixing is due to the forced charge balance, automatically
achieved by the software on both the redox potential (pe or Eh) and the pH. Mass-action and mole-balance
equations are written in terms of activity; therefore, the final error in the SI also depends on the equation used

This is a preprint. Final version is subject to change. Cite as Authors (Year) Title. Environmental Earth Sciences, in press.
DOI: 10.1007/s12665-014-3825-1
Always consult and cite the final, published document. See: http://link.springer.com/journal/12665 11
for the calculation of the activity coefficients (). In fact, the obtained SIs were worst and quite low for the
models whose activity coefficients were obtained not only by the Debye-Hückel approaches, as expected, but
also for the Truesdell-Jones model (Fig. 7). Differently, the SIs obtained by the SIT modeling were slightly
higher than the mean model at approximately 0.2 to 0.8 of the seawater fraction (Fig. 7). Thus, the results
from the different models can be considered always coherent between them when SW fraction range from 0.0
up to 0.1. In that range, calcite and aragonite are always undersaturated with SIcalcite = -0.26 ± 0.06, SIaragonite
= -0.38 ± 0.10 and SIcalcite = -0.4 ± 0.2, SIaragonite = -0.57 ± 0.07, respectively. Above SW of 0.1, the SIcalcite and
SIaragonite show abrupt decrease (up to -3.47 and -3.61 at 0.99 SW, respectively) if activity is calculated also
for reduced species, in particular when was obtained by Debye-Hückel approach and llnl.dat. This path
combines the different effects of the activity coefficient equation form (pure coulombic ion interactions, ion
size does not vary with IS, and ions of the same sign do not interact; e.g. Langmuir, 1997) with the increased
H+ activity due to the forced charge balance. Therefore, it is evident in this case that the equation is inadequate
to describe the mixing for seawater fractions above 0.1. In fact, we have IS = 0.083 for SW = 0.1 and IS =
0.153 for SW = 0.2. The Truesdell-Jones equation for the calculation of activity coefficients (Parkhurst and
Appelo 2013) was also employed in the mixing models with reduced species (Fig. 7). In this case, calcite and
aragonite are again always undersaturated, with results comparable to the other models at SW < 0.1, whereas
at higher seawater fraction a gentle decrease is shown up to SIcalcite = -0.72 ± 0.12 and SIaragonite = -0.76 ± 0.07
(mean and standard deviation between the employed wateq4f.dat and phreeqc.dat datasets). From a theoretical
point of view, the Truesdell-Jones equation should be better than Debye-Hückel for salty solution because the
former may explain NaCl solution up to IS = 2. However, SW is more complex in composition than a pure
NaCl solution; therefore, the error also increases in this case at higher SW fraction and H+ activity. Therefore,
if only the mixing models calculated from complete and consistent end-member composition were considered
(i.e. using only the major dissolved components), the obtained mixed waters were oversaturated with respect
to calcite or aragonite when the SW fraction was higher than about 0.60 or 0.65 (0.7 if the Truesdell-Jones
equation and phreec.dat are used), respectively.
5.2 High Magnesium Calcites (HMC) and carbonates saturation index
The local mean SW is oversaturated both in calcite and aragonite, SIcalcite = 1.17 ± 0.04 and SIaragonite = 1.01 ±
0.05, respectively. To overcome the problem of the inhibition effect caused by magnesium on carbonates
precipitation, the saturation state of the mixed solutions with respect to HMC was first calculated assuming a
pure solid solution between CaCO3 and MgCO3 (EQ3/6, the B-dot model for activity coefficient calculation
and the data0.cmp dataset). Using this model, mixed waters starts at equilibrium or slightly undersaturated in
HMC (SIHMC = -0.16; XMgCO3 = 5%). The more seawater fraction is added, the more the HMC saturation state
and the MgCO3 fraction increase, reaching oversaturation from approximately 0.35 mixed solutions, up to SW

This is a preprint. Final version is subject to change. Cite as Authors (Year) Title. Environmental Earth Sciences, in press.
DOI: 10.1007/s12665-014-3825-1
Always consult and cite the final, published document. See: http://link.springer.com/journal/12665 12
with SIHMC = 1.66 (xMgCO3 = 68%). Note that the modeled MgCO3 content in seawater is in accord with the
maximum detected content in fish-produced tropical carbonated (Perry et al. 2011). However, the obtained
MgCO3 fractions at oversaturation are too high to represent the typical natural HMC, in which the average
xMgCO3 content in tropical marine carbonate sediments and marine inorganic cements is approximately 13%
(Perry et al. 2011). In fact, the saturation indexes obtained in the real seawater samples and the oversaturated
mixed solutions of the modeling using the logK for synthetic and biogenic HMC at that percentage are similar
to pure calcite and aragonite, respectively (Fig. 8). Should be noted that the difference starts to be significant
at SW < 0.1 in the models (Fig. 8b) and for the undersaturated samples (Fig. 9), the SIHMC of which are lower
up to 0.2 in comparison with pure Ca-carbonates. The mean SIs calculated for Ca-bicarbonate (SIcalcite = -0.27
± 0.28; SIaragonite= -0.43 ± 0.28) and Ca-chloride waters (SIcalcite = -0.19 ± 0.21; SIaragonite = -0.35 ± 0.28)
sampled in this study are similar and slightly undersaturated in calcite and more undersaturated in aragonite,
whereas the Na-bicarbonate water sample mlg1 is oversaturated in both (Fig. 8, Fig. 9). The calculated mean
SI of the Na-chloride waters at low SW fractions < 0.02 (chloride content < 500 mg/l or 0.014 molality) show
that these groundwaters are on average in equilibrium with calcite (SI = -0.09 ± 0.35) but undersaturated in
aragonite (SI = -0.25 ± 0.35). Generally, at that low chloride content, the standard deviation of both CaCO3
phases spans between oversaturation and undersaturation, quite similarly to the Ca-bicarbonate samples at
Cuyaguateje Basin and Sierra Los Organos (Fig. 8b). At SW fractions > 0.02, the mixed waters show more
extreme variations in the carbonates SI values, in particular the opposite saturation features of wells #18 and
#33, which were both sampled at various depths. Especially, at the added SW fraction of 0.1, the groundwater
showed oversaturation at well #18 but undersaturation at well #33 (Fig. 8a). For the well #18 groundwater,
the carbonates oversaturation was most likely due to the CO2 degassing and/or re-equilibration in the soil
environment having a lower CO2 content. In fact, the lowest calcite-aragonite saturation indexes, predicted at
SW fraction of 0.1, should occur at pH = 6.85 and logPCO2 = -1.53, whereas the well #18 groundwater at a
similar chloride content (-21.5 meters sampling depth) had pH = 8.00 and logPCO2 = -2.86. For the well #33
groundwater, and according to Corbella and Ayora (2003), an additional effect such as the organic matter
decomposition as in reaction (5), should be invoked to reach the extremely low carbonate saturation indexes
(SIcalcite = -2.32; SIaragonite = -2.48). This is confirmed by using the REACT tool combined with the thermo.dat
dataset of the Geochemist’s Workbench software, which produced a similar calcite saturation index and pH
when approximately 0.35 mol of aqueous CH2O was added to the theoretical mixed solution obtained at SW
= 0.1.
6. Isotope Composition
6.1 Discriminating between seawater ingression and evaporation

This is a preprint. Final version is subject to change. Cite as Authors (Year) Title. Environmental Earth Sciences, in press.
DOI: 10.1007/s12665-014-3825-1
Always consult and cite the final, published document. See: http://link.springer.com/journal/12665 13
To critically analyze the obtained isotope results (Electronic Annex 1), the sample waters were compared with
global (GMWL) and local (LMWL) meteoric water lines (Fig. 10a). For the former, the regression equation
of the long-term mean data weighted by the amount of precipitation was given by the following equation
(Rozanski et al. 1993):
2H = (8.17 ± 0.06) x 18O + (10.35 ± 0.65). [6]
For the LMWL, the isotope data for the precipitations were chosen from the following four stations of the
Global Network of Isotopes in Precipitation (GNIP; IAEA/WMO, 2013): El Salto (37 m asl), Finca Ramirez
(170 m asl) in the Pinar del Rio Province; Santa Ana-Santa Cruz (80 m asl), Ciro Redondo (480 m asl) in the
near northeastern portion of the Artemisa Province. The least square fit was calculated as follow for all of the
unweighted monthly mean data but one outlier (Santa Ana-Santa Cruz from the 15 November 1983):
2H = (7.33 ± 0.31) x 18O + (9.13 ± 0.95), with r = 0.96 and N = 48. [7]
Other authors obtained different equations using the same data from the same stations (Arellano et al. 1989;
Arellano et al. 1992). Despite this discrepancy and the fact that fragmentary data were available for these
stations (from June to September of the 1983 and from March to November of the 1984), our equation is quite
similar to the following one obtainable for Cuba from the weighted monthly mean data of Molerio León (1992)
(CMWL in Fig. 10a) :
2H = (7.30 ± 1.01) x 18O + (6.73 ± 2.97), with r = 0.92 and N = 12. [8]
The main isotopic characteristic of the waters sampled in this study was their displacement to the right of the
meteoric water lines, with all but one (Cienaga Los Remates P1, LR1) roughly arranged along a straight line
with lower slope (Fig. 10a). Considering that wells #18 and #33 were heavily intruded by seawater during
sampling, as previously verified by chemical data, and that they were more shifted toward seawater in
comparison with most of the other freshwater samples (Fig. 10a), the straight line may represent a mixing
effect. However, according to Gonfiantini and Araguas (1988), for Caribbean areas the mixing effect may be
confused with evaporation in this kind of graph. In fact, note that the most isotopically enriched samples were
represented by the El Pesquero lagoon (LP) and the swamp LR1, which had a negligible seawater contribution.
This problem may be solved by combining the water isotope data with data from a conservative element, such
as chloride, in solution (Fig. 10b). In these plots, the mixed groundwaters from wells #18 and #33 are readily
discriminated from the evaporated ones from LP and LR1 sites. Additionally, the groundwater of the Pacheco
This is a preprint. Final version is subject to change. Cite as Authors (Year) Title. Environmental Earth Sciences, in press.
DOI: 10.1007/s12665-014-3825-1
Always consult and cite the final, published document. See: http://link.springer.com/journal/12665 14
well (p) showed an isotopic enrichment at greater depth, but at moderate chloride content (Fig. 10b). This
result was most probably due to the ingression of the waters from the neighbouring El Pesquero lagoon, as
suggested by the shift toward the LP sample in the plot (Fig. 10b). Furthermore, the seawater samples from
Guadiana and Cortés bays (evaporated seawaters; esw in Fig. 10a,b) demonstrated an isotope enrichment due
to evaporation in comparison with seawater from Cabo San Antonio and Maria La Gorda samples
(unevaporated seawaters, nesw in Fig. 10a,b), which showed a mean isotope composition more similar to those
of the Caribbean Sea (18O = +0.84 ‰, 2H = +6.6 ‰; Gonfiantini and Araguas, 1988).
To calculate the slope of a line describing the local evaporation effect, the isotope composition of the local
atmospheric moisture (water vapor) is a key parameter that should be known. By default, the isotope
composition of the vapor is often estimated by proxy, assuming isotopic equilibrium with the local
precipitation. While this approximation may be acceptable during rainy periods in a continental setting, it is
unsatisfactory in the vicinity of an evaporative source, such as a lake sea, and not during prolonged dry periods
(Gat 2010). Because the isotope composition of local atmospheric moisture is unknown, we attempted to
calculate the evaporation slope from our experimental data, that is, with the least square fit between the
evaporated and enriched samples and their possible unevaporated analogues, arranged near the water lines,
and identifiable as their meteoric recharge. For example, the Laguna El Pesquero is hydrologically connected
by channels to the Cuyaguateje Basin, and the obtained slope from the best fit between their isotope data is
approximately 5.9. Furthermore, all the four water samples from karst caves are displaced on a straight line,
the linearity and slope (5.1) of which were tested for statistical significance by Fisher’s and Student’s test,
respectively. Adding to this regression the data of the LR1 sample, the linearity and slope maintain their
significance, with the slope showing a slight decrease to 4.8 but measuring 4.4 when calculating a best fit
between LR1 and the Cuyaguateje River sample data. These latter values are more similar to the evaporation
slope of 4.6 revealed for Cuba by other authors (Molerio León 1992; Molerio León 2012; Peralta Vital et al.
2005). However, the obtained slopes of the samples from the karst caves and Cuyaguateje basin agree better
with the 5 and 6 theoretical slope range for the water surface evaporation at the mean local relative humidity
of 75% and T = 25 °C (Gonfiantini 1986; Xinping et al. 2005); therefore, the slope values less than 5 may be
attributable to an evaporative effect from soil and/or shallow groundwater (Gat 2010).
6.2 Meteoric recharge estimation
All of the water samples that were not located on the seawater mixing or evaporation lines stayed between
these lines and showed a mean deuterium excess of 6.4 ± 0.6 (Fig. 10a). This value is less than those of the
meteoric water lines, indicating that these waters falling between the aforementioned evaporation lines
suffered a moderate evaporation. The highest isotope values of this water group were consistent with those
measured in the Cuyaguateje River (18O = -3.62 ‰; 2H = -22.3‰), which in turn agreed with the mean

This is a preprint. Final version is subject to change. Cite as Authors (Year) Title. Environmental Earth Sciences, in press.
DOI: 10.1007/s12665-014-3825-1
Always consult and cite the final, published document. See: http://link.springer.com/journal/12665 15
values for the rainy period from May to October (18O = -3.46 ± 0.62 ‰; 2H = -19.3 ± 3.8 ‰; Molerio León,
1992, 2012). These higher values should also correspond with the meteoric recharge to the well #18, as shown
by extrapolating back from the chloride-isotope data of this well (Fig 10b). Therefore, the northwestern sector
of the Guanahacabibes Peninsula is most likely fed from a shallow circulation on the karst formation.
In the same manner, note that the lowest water group values coincided with the intercept between the line
fitting well #33 and the caves samples and the meteoric water lines, which occurred at approximately 18O =
-5.3 ‰. A similar value was shown also by well #3 (18O = -5.34 ‰) and the Abasto Maria la Gorda well
(18O = -5.31 ‰). To calculate the elevation effect on the meteoric recharge of groundwater, the meter-18O
equation of Molerio León (1992) could be used, here rewritten as:
H(m) = -520.83 x 18O(‰) – 1182.29, with r = 0.95 and N = 12. [9]
This equation partially coincides with that obtained from the local GNIP’s station data as reworked and
reevaluated by Arellano et al. (1992; Fig. 10c). Using this equation to calculate the local elevation effect, we
obtained a corresponding recharge elevation of approximately 700 m for the Cuyaguateje River and over 1000
meter for the Maria La Gorda transect samples, which are well over the real and maximum height of the basin
and of the Cordillera de Guaniguanico, respectively. In fact, the Cuyaguateje Basin is characterized by low,
quite irregular mountains, with average elevations between 350 and 400 m and residual limestone hills named
mogotes. By contrast, the highest elevation of the Cordillera lies in the westernmost sector of the Province
between the Doming Fault and the Northern Rosario belt (Pico Pan de Guajaibon, 700 m asl). When we tried
as an alternative to obtain a better elevational gradient equation using the GNIP’s station data as reevaluated
by Arellano et al. (1989) plus some karst springs from the St. Cruz River basin in the Pizarras del Sur and
Cangre belts (Arellano et al. 1989; Arellano et al. 1992), we obtained the following equation (Fig. 10c):
H(m) = -291.50 x 18O(‰) – 745.61, with r = 0.70 and N = 12. [10]
Note that the raw sample data showed a non-linear, exponential elevation-18O path, as revealed in other data
from Central and South America (Rozanski and Araguás-Araguás 1995). This pattern may be attributable to
the “shadow effect” on the moistures played by the continental Mexican and eastern Cuban reliefs. Despite
the poor linear correlation coefficient, the elevation estimated using the equation [10] and relating to the 18O
of the Cuyaguateje River is coherent with the average river elevation. Differently, the extremely low 18O
values measured in the groundwaters of the Maria La Gorda transect could be influenced by the elevation
effect on the rains in the Cordillera de Guaniguanico (Fig. 10c). This supposition is consistent with the
hypothesized connection between the fresh submarine discharges in the Maria La Gorda area and the large

This is a preprint. Final version is subject to change. Cite as Authors (Year) Title. Environmental Earth Sciences, in press.
DOI: 10.1007/s12665-014-3825-1
Always consult and cite the final, published document. See: http://link.springer.com/journal/12665 16
karst springs located in the Cordillera (Peláez García and González Cabrera 2013). However, we cannot
exclude the possibility that the observed, quite low isotope values are also related to the rapid infiltration in
the deeper endokarstic conduits by abundant precipitations with more negative isotope composition during
the periods of heavy rainfall, that are typical for the tropical, monsoonal climate of the area (Florea and McGee
2010). These hypotheses necessitate the collection of isotope data throughout a complete hydrological year
for confirmation.
7. Conclusions
The groundwaters of the Guanahacabibes Peninsula showed the typical chemical compositions related to
seawater ingression. The fresh Ca-bicarbonate waters are mainly located in the northeasternmost sector of the
peninsula, where the Cuyaguateje River issues into the area. More toward the southwestern sector, the shallow
groundwater show a mainly Na-chloride composition, but maintain a low seawater fraction (0.00 < f < 0.04)
up to 20 m in depth and are promptly diluted by local rain. Waters with a Ca-chloride composition were
detected in the wells just at south of the Los Remates swamp. This transitional composition, representing
seawater intrusion, occurred where the Guane terrigenous fm. displays interdigitation toward the Vedado
limestones fm. The groundwater in the southwestern plain of the Guanahacabibes Park area presented an
abrupt salinity increase at a depth of 26-30 meters, which corresponded to an added seawater fraction of 0.1.
This value coincided with the lowest Ca-(Mg)-carbonate saturation index resulting from the mixing modeling.
Generally, seawater and groundwaters with an added seawater fraction above 0.60-0.65 showed similar
oversaturated indexes in HMC and pure-Ca carbonates (calcite and aragonite). However, in the groundwaters
with a seawater fraction between 0.02 and 0.60 and that showed carbonates undersaturation, the saturation
indexes in HMC was lower than pure-Ca carbonates of about 0.2. Moreover, the tendency of the waters to
dissolve limestone is locally enhanced in organic-rich waters by sulfate reduction, contributing to the
subsequent increase in the generation of the karst structures and the intrusion of seawater into the groundwater.
This combined effect of Ca-increase and sulfate-reduction may be misinterpreted in the Piper plot as cation
exchange with clays. Unexpectedly, Ca-bicarbonate and the opposite transitional Na-bicarbonate, representing
groundwater freshening, were detected also in the almost open-ocean conditions, respectively in the south-
westernmost Cabo San Antonio and Maria La Gorda promontories. These waters may be easily explained as
a lens of freshwaters floating on a deeper salty layer, enhanced by flow inversion from sea tide effects and/or
consistent with the upward freshwater flow during the formation of the saline wedge. However, the lower
isotope composition indicated that these waters may come from the deep Jurassic aquifer, which is mainly
recharged during the rainy period (summer) occurring in the highest reliefs of Cordillera de Guaniguanico.
This hypothesis agrees with the extensive presence of freshwater discharge from submarine springs discovered
along the coast by other authors.

This is a preprint. Final version is subject to change. Cite as Authors (Year) Title. Environmental Earth Sciences, in press.
DOI: 10.1007/s12665-014-3825-1
Always consult and cite the final, published document. See: http://link.springer.com/journal/12665 17
Acknowledgements
We would like to thank the two anonymous reviewers for their suggestions and comments.
Figure’s captions
Figure 1 – Geologic maps of Cuba. (A): allochtonous terrane of Western Cuba and belts subdivision of the
Cordillera de Guaniguanico (modified from Pardo, 2009). (B): distribution of the sampling sites in the
Guanahacabibes Peninsula. For the sake of simplicity and considering the lithological similarity between
Vedado, Jaimanitas and Cayo Piedra, only the Guane and Vedado formations are represented. Symbols
represent the chemical classification. See text and Fig. 2 for details.
Figure 2 – Piper’s diagrams where waters sampled in the Guanahacabibes Peninsula are plotted using major
chemical composition (mg/l). The chemical classification of the waters (symbols in legend) was obtained by
using the sample chemical concentration in meq/l. Arrows depicts the paths due to some processes (Appelo
and Postma 2007). The transitional compositions Ca-chloride and Na-bicarbonate, which represent the switch
from Ca-bicarbonate to Na-chloride, is highlighted by the dashed area. Well #18, #33 and Pacheco explored
at certain depths are shown in B, C and D, respectively (numbers: sampling depth in meters respect to the
mean sea level).
Figure 3 – Bromide vs. chloride (in meq/l) diagram. Symbols and dashed area as in Fig. 2.
Figure 4 – Sampling depth (in meters with respect to the mean sea level) vs. seawater fraction f diagram (see
text for details on f calculation). Wells explored at certain depths are plotted.
Figure 5 – Binary diagrams plotting calcium (A), sodium (B), magnesium (C) and potassium (D) vs. chloride
concentration (all in meq/l). Symbols and dashed area as in Fig. 2. Main concentration in the rainwater samples
(Western Cuba, WC, Molerio León, 1992, 2012; Eastern Cuba, EC, Rodríguez et al., 2004; Central America,
CA, Cerón et al., 2005), Cuyaguateje River (light gray area, Fagundo et al., 1986) and Sierra de Los Organos
(dark gray area, Fagundo et al., 1987) are also showed for comparison. Binary mixing between local seawater
and CA-rain or Cuyaguateje River are represented by dashed lines.
Figure 6 – Binary diagrams plotting sulfate vs. chloride (A) and calcium vs. bicarbonate (B) concentration (all
in meq/l). In (A), symbols as in Fig. 5; moreover, depth sampling in #33 well is highlighted (numbers: sampling

This is a preprint. Final version is subject to change. Cite as Authors (Year) Title. Environmental Earth Sciences, in press.
DOI: 10.1007/s12665-014-3825-1
Always consult and cite the final, published document. See: http://link.springer.com/journal/12665 18
depth in meters respect to the mean sea level). In (B), dashed lines groups samples from the same sampling
site. Moreover, calcite and dolomite dissolution (dashed-dotted lines) and seawater mixing following
bicarbonate loss after reduction or acidification and CO2-degassing (bold curve with arrow) are shown.
Figure 7 – Mixing modeling results in terms of saturation index of calcite (A) and aragonite (B). Results were
obtained using different software and thermodynamic databases (see text for details). The physico-chemical
composition of the end-members come from this study: Cueva Roncali for Ca-bicarbonate freshwater (FW)
and local mean seawater (SW). The most of the models produced similar results (dark grey area with SI < 0.2)
when only major composition of the end-member was used in the calculations but Truesdell-Jones with
phreeqc.dat. Differently, other models shifted from this “coherence area” when other minor ions (e.g.
ammonia), that influenced pH-Eh during the forced charge balance, were considered (dotted-dashed lines).
Figure 8 – Results of the freshwater-seawater mixing modeling at the Peninsula of Guanahacabibes in terms
of saturation index (SI) of pure calcite (dark gray), pure aragonite (light gray), inorganic Mg-calcite (bricked
wall field), biogenic Mg-calcite (squamose field). The continuous curve represents a MgCO3-CaCO3 ideal
solid solution as foreseen by EQ3/6 and B-dot activity coefficient calculation. Only calculation models with
similar and coherent results were used (dark gray areas in Fig. 7). Globally comparable SIs were obtained
between pure-calcite and inorganic HMC and between pure aragonite and biogenic HMC, therefore the SI of
the pure Ca-phases of the waters sampled at Peninsula of Guanahacabibes are shown (closed symbols = pure
calcite; open symbols = pure aragonite; symbols shape as in Fig. 2; see also Fig. 9). However, at SW < 0.1,
the SIHMCs are approximatively 0.15 lower than SI of the pure-Ca carbonates. In (B), the median saturation
index for calcite and the median absolute deviation (error bars) in the waters from Sierra de Los Organos
(LO, Fagundo et al., 1987) and Cuyaguateje River (CB, Fagundo et al., 1986) are shown for comparison.
Figure 9 - Comparison between for synthetic high-magnesium calcite vs. pure calcite (A) and organic high-
magnesium calcite vs. pure aragonite (B) saturation indexes of the waters sampled at Peninsula of
Guanahacabibes (data in the electronic annex). The best-fit equations of the samples (bold) and 1:1 lines
(dashed) are also shown.
Figure 10 – (A) hydrogen (2H) vs. oxygen (18O) water stable isotope composition, both values in ‰ vs. V-
SMOW. GMWL = global meteoric water line (Rozanski et al. 1993); LMWL = local meteoric water line (this
study); CMWL = cuban meteoric water line (Molerio León 1992; Molerio León 2012). Mixing and
evaporation effect are also showed (dashed-dotted and dotted lines), with slope explicated for these latter (S).
Symbols as in Fig. 2, except for waters from kart’s caves (gray). Evaporated (esw) and non-evaporated

This is a preprint. Final version is subject to change. Cite as Authors (Year) Title. Environmental Earth Sciences, in press.
DOI: 10.1007/s12665-014-3825-1
Always consult and cite the final, published document. See: http://link.springer.com/journal/12665 19
seawater (nesw) are highlighted. (B) Chloride (mg/l) vs. hydrogen (2H) vs. oxygen (18O) isotope
composition. Symbols as in (A). (C) Altitude (meters a.s.l.) vs. oxygen isotope composition (18O). In spite of
the exponential trend of GNIP’s station data and neighboring karst springs, we obtained a recharge area
coherent with the local reliefs using the linear elevation-18O gradient as calculated in this work.
References
Agegian CR, Mackenzie FT (1989) Calcareous organisms and sediment mineralogy on a mid-depth bank in
the Hawaiian Archipelago. Pacific Science 43:55–66
Appelo CAJ, Postma D (2007) Geochemistry, groundwater and pollution. 2nd edn. A.A. Balkema, The
Netherlands
Arellano DM, Feitoó R, Seller KP, Stickler W, Rauert W (1989) Estudio isotópico de la llanura costera sur,
provincia Pinar del Río, Cuba. In: Isotope Hydrology Investigations in Latin America, IAEA-
TECDOC-502. Vienna, Austria, pp 229-243
Arellano M, Molerio León LF, Suri Hijos A Efecto de altitud del 18O en zona de articulación de llanura cripto-
karsitica con carso de montaña. In: Llanos HJ, Antiguedad I, Morell I, Eraso A (eds) I Taller
Internacional sobre Cuencas Experimentales en el Karst, Matanzas, Cuba, 1992. Grupo de Trabajo
Internacional Cuencas Experimentales Karsticas, Universitat Jaume I de Castelló, pp 29-42
Back W (1966) Hydrochemical facies and ground-water flow patterns in northern part of the Atlantic Coastal
Plain. U.S. Geological Survey Professional Paper 498-A.
Back W, Hanshaw BB, Herman JS, Van Oriel JN (1986) Differential dissolution of a Pleistocene reef in the
ground-water m1xing zone of coastal Yucatan, Mexico. Geology 14:137-140
Bethke CM (2008) Geochemical and Biogeochemical Reaction Modeling. Cambridge University Press, New
York
Bethke CM, Yeakel S (2008) The Geochemist’s Workbench Release 7.0 - Essentials Guide. Hydrogeology
Program, University of Illinois, Urbana, Illinois
Boschetti T, Venturelli G, Toscani L, Barbieri M, Mucchino C (2005) The Bagni di Lucca thermal waters
(Tuscany, Italy): an example of Ca-SO4 waters with high Na/Cl and low Ca/SO4 ratios. Journal of
Hydrology 307:270-293

This is a preprint. Final version is subject to change. Cite as Authors (Year) Title. Environmental Earth Sciences, in press.
DOI: 10.1007/s12665-014-3825-1
Always consult and cite the final, published document. See: http://link.springer.com/journal/12665 20
Budd DA, Vacher HL (2004) Matrix permeability of the confined Floridan Aquifer, Florida, USA.
Hydrogeology Journal 12:531-549
Cabrera Bermúdez J, Guardado Lacaba R, Peláez García R, González Cabrera N (2004) Regionalizacion
hidrogeologica de la Provincia de Pinar del Rio er un SIG. Minería y Geología 1-2:24-31
Cabrera M, Peñalver LL (2001) Contribución a la estratigrafía de los depósitos cuaternarios de Cuba.
Cuaternario y geomorfología 15:37-49
CASS (2003) Phase I Report - Technical Appendix A: Salinity and Total Dissolved Solids. United States
Department of Interior - Bureau of Reclamation, Central Arizona Salinity Study, Lower Colorado
Region, Phoenix Area Office.
http://www.usbr.gov/lc/phoenix/programs/cass/pdf/Phase1/ATechapdxTDS.pdf
Cerón RM, Cerón JV, Córdova AV, Zavala J, Muriel M (2005) Chemical composition of precipitation at
coastal and marine sampling sites in Mexico. Global NEST Journal 7:212-221
Choquette PW, Pray LC (1970) Geologic nomenclature and classification of porosity in sedimentary
carbonates. American Association of Petroleum Geologists Bulletin 54:207-250
Cooke RC, Kepkay PE (1984) Apparent calcite supersaturation at the ocean surface: Why the present
solubility product of pure calcite in seawater does not predict the correct solubility of the salt in nature
Marine Chemistry 15:59–69
Corbella M, Ayora C (2003) Role of fluid mixing in deep dissolution of carbonates Geologica Acta 4:305-
313
Custodio E (1987) Hydrogeochemistry and tracers. In: Custodio E (ed) Ground-water problems in coastal
areas. Studies and reports in hydrology no. 45. UNESCO, Belgium, pp 213-269
Denis R, Díaz Guanche C (1993) Características geologicas y geomorfologicas de la Península
Guanahacabibes. Dirección Provincial de Planificación Física, Pinar del Río. Dirección Provincial de
Planificación Física, Pinar del Río, Cuba
Díaz Guanche C, Aldana Vilas C, Farfán González H (2013) Mapping Groundwater Vulnerability in
Guanahacabibes National Park, Western of Cuba. In: Farfán González H, Corvea Porras JL, de
Bustamante Gutiérrez I, LaMoreaux JW (eds) Management of Water Resources in Protected Areas.
Springer-Verlag, Berlin Heidelberg, pp 87-94

This is a preprint. Final version is subject to change. Cite as Authors (Year) Title. Environmental Earth Sciences, in press.
DOI: 10.1007/s12665-014-3825-1
Always consult and cite the final, published document. See: http://link.springer.com/journal/12665 21
Eaton AD, Clesceri LS, Greenberg AE (1995) Standard Methods for the Examination of Water and
Wastewater - 19th Edition. American Public Health Association-American Water Works Association-
Water Environment Federation (APHA-AWWA-WEF), Washington DC. (USA)
Emerson S, Hedges J (2003) Sediment Diagenesis and Benthic Flux. In: Elderfield H, Holland HD, Turekian
KK (eds) The Oceans And Marine Geochemistry - Treatise on Geochemistry. Elsevier, pp 293-319
Epstein S, Mayeda T (1953) Variations of 18O/16O ratio in natural waters. Geochimica et Cosmochimica Acta
4:213–224
Fagundo Castillo JR, González Hernandez P (1999) Agricultural use and water quality at karstic Cuban
western plain. International Journal of Speleology 28:175-185
Fagundo JR, Valdés JJ, Pajon JM, de la Cruz A (1986) Caracterizacion geoquimica y geomatematica de
formaciones geologicas y sedimentos de la cuenca del rio cuyaguateje. Relacion las caracteristicas
hidroquimicas de los acuiferos. Voluntad hidráulica 23:43-48
Florea LJ, McGee DK (2010) Stable isotopic and geochemical variability within shallow groundwater beneath
a hardwood hammock and surface water in an adjoining slough (Everglades National Park, Florida,
USA). Isotopes in Environmental and Health Studies 46:190–209
Florea LJ, Vacher HL (2006) Morphologic Features of Conduits and Aquifer Response in the Unconfined
Floridian aquifer system, West Central Florida. Paper presented at the Proceedings of the 12th
Symposium on the Geology of the Bahamas and Other Carbonate Regions, Gerace Research Center,
San Salvador,Bahamas,
Garrels R, Wollast R (1978) Equilibrium criteria for two-component solids reacting with fixed composition
in an aqueous phase - example: the magnesian calcite, discussion. American Journal of Science
278:1469–1474
Gat JR (2010) Isotope Hydrology: A Study of the Water Cycle vol 6. Series On Environmental Science And
Management. Imperial College Press, London
Glynn PD, Reardon EJ (1990) Solid-solution aqueous-solution equilibria: thermodynamic theory and
representation. American Journal of Science 290:164-201
Gonfiantini R (1986) Environmental Isotopes in Lake Studies. In: Fritz P, Fontes J-C (eds) Handbook of
Environmental Isotopes Geochemistry, vol 2. Elsevier, Amsterdam, pp 113–168
This is a preprint. Final version is subject to change. Cite as Authors (Year) Title. Environmental Earth Sciences, in press.
DOI: 10.1007/s12665-014-3825-1
Always consult and cite the final, published document. See: http://link.springer.com/journal/12665 22
Gonfiantini R, Araguas LA (1988) Los Isotopes Ambientales En El Estudio De La Intrusion Marina Paper
presented at the Tecnología de la Intrusión en Acuíferos Costeros, Almuñécar, Granada, España,
Hernández R, Ramírez R, López-Portilla M, González P, Antigüedad I, Díaz S (2013) Seawater Intrusion in
the Coastal Aquifer of Guanahacabibes, Pinar del Río, Cuba. In: Farfán González H, Corvea Porras
JL, de Bustamante Gutiérrez I, LaMoreaux JW (eds) Management of Water Resources in Protected
Areas. Springer-Verlag, Berlin Heidelberg, pp 301-308
Iturralde-Vinent MA, Gutiérrez Domech MR (1999) Some examples of karst development in Cuba. Boletín
Informativo de la Comisión de Geoespeleología 14:1-4
Jones BF, Vengosh A, Rosenthal E, Yechieli Y (1999) Geochemical Investigations. In: Bear J, Cheng AHD,
Sorek S, Ouazar D, Herrera I (eds) Seawater Intrusion in Coastal Aquifers - Concepts, Methods and
Practices. Theory and Applications of Transport in Porous Media, vol 14. Springer Science+Business
Media, Dordrecht, pp 51-71
Langmuir D (1997) Aqueous Environmental Geochemistry. Prentice Hall, Upper Saddle River, New Jersey
Lin CY, Musta B, Abdullah MH (2013) Geochemical processes, evidence and thermodynamic behavior of
dissolved and precipitated carbonate minerals in a modern seawater/freshwatermixing zone of a small
tropical island. Applied Geochemistry 29:13–31
Liu CW, Chen JF (1996) The simulation of geochemical reactions in the Heng-Chun limestone formation,
Taiwan. Applied Mathematical Modelling 20:549-558
Mackenzie FT, Ver LM (2010) Land-Sea Global Transfers. In: Steele JHT, S.A.; Turekian, K.K. (ed) Marine
Chemistry & Geochemistry: a derivative of encyclopedia of ocean sciences, 2nd edition. Academic
Press, London, pp 485-494
Matisoff G, Bricker III OP, Holdren Jr. GR, Kaerk P (1975) Spatial and Temporal Variations in the Interstitial
Water Chemistry of Chesapeake Bay Sediments. In: Church TM (ed) Marine Chemistry in the Coastal
Environment. vol ACS Symposium Series 18. American Chemical Society, Washington D.C., pp 343–
363
Molerio León LF (1992) Composición Química e Isotópica de las Aguas de LLuvia de Cuba. Paper presented
at the II Congreso Espeleológico de Latinoamérica y el Caribe, Viñales, Pinar del Río, Cuba
Molerio León L, Parise M (2009) Managing environmental problems in Cuban karstic aquifers Environmental
Geology 58:275–283

This is a preprint. Final version is subject to change. Cite as Authors (Year) Title. Environmental Earth Sciences, in press.
DOI: 10.1007/s12665-014-3825-1
Always consult and cite the final, published document. See: http://link.springer.com/journal/12665 23
Molerio León LF (2012) Hidrología de trazadores en la gestión ambiental de yacimentos de petróleo onshore.
Mapping 154:46-76
Morse JW, Mackenzie FT (1990) Geochemistry of Sedimentary Carbonates. Developments in Sedimentalogy
48. Elsevier, The Netherlands
Pardo (2009) Overview. In: The geology of Cuba. AAPG Studies in Geology Series 58. pp 1–47
Parkhurst DL, Appelo CAJ (2013) Description of Input and Examples for PHREEQC Version 3 - A Computer
Program for Speciation, Batch-Reaction, One-Dimensional Transport, and Inverse Geochemical
Calculations. U.S. Geological Survey Techniques and Methods, book 6, chap. A43.
http://pubs.usgs.gov/tm/06/a43/, pp 497
Peláez García R, González Cabrera NA (2013) Underground Water of Deep Circulation in the National Park
Guanahacabibes, Pinar del Rio Province, Cuba: Another Alternative with Water Supply Aims. In:
Farfán González H, Corvea Porras JL, de Bustamante Gutiérrez I, LaMoreaux JW (eds) Management
of Water Resources in Protected Areas. Springer-Verlag, Berlin Heidelberg, pp 179-186
Peralta Vital JL, Gil Castillo R, Leyva Bombuse D, Moleiro León L, Pin M (2005) Uso de técnicas nucleares
en la evaluación de la cuenca Almendares-Vento para la gestión sostenible de sus recursos hídricos.
Forum de Ciencia y Técnica - www.forumcyt.cu,
Pérez M, Pubillones León María A (1988) Características microbiológicas de una laguna que ocupa una dolina
cársica, Laguna del Valle de San Juan, provincia de Pinar del Río. Paper presented at the Taller
Internacional sobre Hidrología del Carso en la Región del Caribe, La Habana, 4-12 december 1988,
Perry CT, Salter MA, Harborne AR, Crowley SF, Jelks HL, Wilson RW (2011) Fish as major carbonate mud
producers and missing components of the tropical carbonate factory PNAS 10:3865–3869
Price RM, Herman JS (1991) Geochemical investigation of salt-water intrusion into a coastal carbonate
aquifer: Mallorca, Spain Geological Society of America Bulletin 103:1270-1279
Richter BC, Kreitler CW (1993) Geochemical Techniques for Identifying Sources of Ground-Water
Salinization. CRC Press, Boca Raton
Robinove CJ, Langford RH, Brookhart JW (1958) Saline-water resources of North Dakota. U.S. Geological
Survey, USA

This is a preprint. Final version is subject to change. Cite as Authors (Year) Title. Environmental Earth Sciences, in press.
DOI: 10.1007/s12665-014-3825-1
Always consult and cite the final, published document. See: http://link.springer.com/journal/12665 24
Rodríguez R, Bejarano C, Riverón B, Carmenate JA (2004) Composición química de las precipitaciones,
deposición de sales y evaluación de la recarga en la región oriental de Cuba Boletín Geológico y
Minero 115:341-356
Rozanski K, Araguás-Araguás L (1995) Spatial and temporal variability of stable isotope composition of
precipitation over the south american continent Bulletin de l'Institut francais d'études Andins 24:379-
390
Rozanski K, Araguás-Araguás L, Gonfiantini R (1993) Isotopic patterns in modern global precipitation. In:
Swart PK, Lohmann KC, Mckenzie J, Savin S (eds) Climate Change in Continental Isotopic Records.
Geophysical Monograph 78. American Geophysical Union, Washington
Runnells DD (1969) Diagenesis, chemical sediments, and the mixing of natural waters. Journal of Sedimentary
Petrology 39:1188-1201
Sáinz ÁM, Molinero JJ, Saaltink MW (2010) Numerical Modelling of Coastal Aquifer Karst Processes by
Means of Coupled Simulations of Density-Driven Flow and Reactive Solute Transport Phenomena.
In: Andreo B, Carrasco F, Durán JJ, LaMoreaux JW (eds) Advances in Research in Karst Media.
Environmental Earth Sciences, pp 237-242
Sanford WE, Konikow LF (1989) Simulation of Calcite Dissolution and Porosity Changes in Saltwater Mixing
Zones in Coastal Aquifers Water Resources Research 25:655-667
Seale LD, Soto LR, Florea LJ, Fratesi B Karst of Western Cuba: Observations, Geomorphology, and
Diagenesis. In: Davis RL, Gamble DW (eds) Proceedings of the 12th Symposium on the Geology of
the Bahamas and other Carbonate Terrains, Gerace Research Center, San Salvador,Bahamas, 2004. pp
1-9
Stoessel RK (1992) Effects of sulfate reduction on CaCO3 dissolution and precipitation in mixing-zone fluids
Journal of Sedimentary Petrology 62:873-880
Stoessell RK, Ward WC, Ford BH, Schuffert JD (1989) Water chemistry and CaCO3 dissolution in the saline
part of an open-flow mixing zone, coastal Yucatan Peninsula, Mexico Geological Society of America
Bulletin 101:159-169
WHO (2011) Guidelines for Drinking-water Quality - 4th ed. World Health Organisation, Gutenberg, Malta

This is a preprint. Final version is subject to change. Cite as Authors (Year) Title. Environmental Earth Sciences, in press.
DOI: 10.1007/s12665-014-3825-1
Always consult and cite the final, published document. See: http://link.springer.com/journal/12665 25
Wolery TW, Jarek RL (2003) EQ3/6, version 8.0 - software user’s manual. Civilian radioactive waste
management system, Management & Operating Contractor, Sandia National Laboratories,
Albuquerque, New Mexico
Xinping Z, Lide T, Jingmiao L (2005) Fractionation mechanism of stable isotope in evaporating water body
Journal of Geographical Sciences 15:375-384
Zeebe RE, Wolf-Gladrow D (2001) CO2 in Seawater: Equilibrium, Kinetics, Isotopes. Elsevier Oceanography
Series 65. Elsevier Science, Amsterdam

Environmental Earth Sciences
Seawater intrusion in the Guanahacabibes Peninsula (Pinar del Rio Province, westernCuba): effects on karst development and water isotope composition
--Manuscript Draft--
Manuscript Number: ENGE-D-14-00569R2
Full Title: Seawater intrusion in the Guanahacabibes Peninsula (Pinar del Rio Province, westernCuba): effects on karst development and water isotope composition
Article Type: Original Manuscript
Corresponding Author: Tiziano Boschetti
ITALY
Corresponding Author SecondaryInformation:
Corresponding Author's Institution:
Corresponding Author's SecondaryInstitution:
First Author: Tiziano Boschetti
First Author Secondary Information:
Order of Authors: Tiziano Boschetti
Patricia González-Hernández
Rebeca Hernández-Díaz
Gino Naclerio
Fulvio Celico
Order of Authors Secondary Information:
Abstract: The water resources in the Guanahacabibes Peninsula are distributed in two areas.The northeastern area is characterized by swamps, wetlands and lagoons, with a lowcontribution of seawater, whereas the area in the southwestern plain shows aconsiderable development of the karst structures that limits the existence of superficialwaters but permits the ingression of the surrounding seawater. In this latter area, thegroundwater showed a marked increase in salinity with the depth. At the seawaterfraction of 0.1 corresponded the lowest Ca-(Mg)-carbonates saturation indexescalculated by modeling the mixing between freshwater and seawater using differentsoftware, thermodynamic databases and equations for activity coefficients. Inparticular, seawater and groundwaters with an added seawater fraction above 0.60-0.65 showed similar oversaturated indexes in high-Mg calcites and pure-Cacarbonates (calcite and aragonite). Differently, in the groundwater that showedcarbonates undersaturation (generally with a seawater fraction between 0.02 and 0.60)the saturation indexes in high-Mg calcites was 0.2 lower than pure-Ca carbonates.Locally, the bacterial reduction of the dissolved sulfate enhanced the dissolution of thelimestone, contributing to the increased development of the karst structures and theseawater intrusion. Finally, the presence near the coastline of fresh Ca- and Na-bicarbonate waters was in accord with the upwards flow of the shallow freshwaterduring the formation of the saline wedge. However, the oxygen and hydrogen stableisotope composition of the waters showed a probable contribution to the area from adeep aquifer that is recharged in the highest reliefs of the province (Cordillera deGuaniguanico).
Response to Reviewers: see attachment
Powered by Editorial Manager® and ProduXion Manager® from Aries Systems Corporation

1
Title: Seawater intrusion in the Guanahacabibes Peninsula (Pinar del Rio Province, western Cuba):
hydrogeochemistry, mixing modeling and water isotope composition
This is second round I revise the MS. I still have some comments on the manuscript.
1) Since the contents of the MS mainly focus on the hydrogeochemistry regarding seawater intrusion or
seawater-freshwater mixing, I suggest reject the contents of stable isotopic section. At least, delete the
contents after Line 17, Page 15. If authors wish to keep Section 6.1 regarding "discriminating between
seawater ingression and evaporation", please refer to:
Criss, R.E., 1999. Isotope hydrology. In: Principles of Stable Isotope Distribution, Oxford University Press,
New York, pp. 89-136.
Finally, we know and appreciate the book of Criss (1999), but it did not contain a specific section on water
isotope in arid climate as the cited chapter of Gonfianti and Araguas (1988). Moreover, for the sake of
completeness, we cite also the isotope book of Gat (2010) that is more updated and more specific for the
present case than the book of Criss (1999).
Actually, Figure 10B is enough to differentiate evaporation from seawater-freshwater mixing. The
discussion using the regression line (slope) of the samples is not much meaning since the slope of
regression line for evaporated water always falls within 4~6 depended on the extension of evaporation.
Therefore, in my opinion the current discussion is meaningless. Additionally, the content regarding using
stable water isotopes to trace groundwater source, I think, is another story.
R: Not really, because: 1) probably not all the readers know that mixing and evaporation line could be
confused, therefore the comparison of the samples in figures 10A and 10B may explain and clarify this; 2)
figures 10A and 10C are important to understand the provenance of meteoric recharge and did not occupy
space because they are included in the same figure 10. So, why delete them?
Therefore, the title of the MS may thus be changed to something like " Effect of seawater intrusion on karst
development." The new title may be more attractive for readers.
R: Good idea, but it could be also more attractive in this manner: Seawater intrusion in the Guanahacabibes
Peninsula (Pinar del Rio Province, western Cuba): effects on karst development and water isotope
composition
2) In Figure 2, is it correct that there are two CaCO3 deposition trends (lines) in the Piper diagram with
opposite direction? Or one trend is CaCO3 deposition, and another trend is CaCO3 solution?
R: Yes, you’re right. Corrected.
3) Page 6, Lines 39-45. Reference Epstein S, Mayeda T (1953) did not have experiment of the H2(g)-H2O(l)
equilibration.
Authors' Response to Reviewers' CommentsClick here to download Authors' Response to Reviewers' Comments: ResponsesToComments2.docx

2
R: Ok, sentence was reorganized and we have cited the paper Boschetti et al. (2005) as reference for H2(g)-
H2O(l) equilibration.
4) Page 9, Lines 11-19. What is the meaning or the mechanism of the text "The presence of freshwater near
to the coastline, as occurred for the Na-bicarbonate water at Maria La Gorda and Ca-bicarbonate water at
Cabo San Antonio promontories, respectively, might represent the effect of a lens of freshwater floating on
a deeper salty one according to a typical saline-wedge profile"? Please explain clearer.
R: we have corrected “near to the coastline” in “very close to the coastline”, “saline-wedge profile” in “salt-
wedge effect” and deleted “respectively” because pleonastic. Globally, we think that the sentence is clear
for hydrogeologist and hydrogeochemist because the “salt wedge” concept is treated in the basic courses.
For example, take a look to this image from an on-line course
(http://www.studyblue.com/notes/note/n/hydrogeology-final/deck/2811182).
Take a look also to the cited reference in the text (Custodito, 1987; Sainz Et Al., 2010). Finally, the concept
is resumed and explained in the conclusion.

1
Seawater intrusion in the Guanahacabibes Peninsula (Pinar del Rio Province, western
Cuba): effects on karst development and water isotope composition
Tiziano Boschetti1,
*, Patricia González-Hernández2, Rebeca Hernández-Díaz
3, Gino Naclerio
4,
Fulvio Celico1
1 - Department of Physics and Earth Sciences “Macedonio Melloni”, University of Parma, Parco Area delle
Scienze 157A, 43124 Parma, Italy
*corresponding author: e-mail: [email protected]; [email protected]
2 - Chemistry Faculty, Havana University, Zapata between G and Carlitos Aguirre, Vedado, PC 10400
Havana, Cuba
3 – University of Pinar del Río, Calle Marti 270 Final, Pinar del Río, 20100 Cuba
4 – Department of Biosciences and Territory, University of Molise, Contrada Fonte Lappone, 86090, Pesche
(IS), Italy
Abstract
The water resources in the Guanahacabibes Peninsula are distributed in two areas. The northeastern
area is characterized by swamps, wetlands and lagoons, with a low contribution of seawater,
whereas the area in the southwestern plain shows a considerable development of the karst structures
that limits the existence of superficial waters but permits the ingression of the surrounding seawater.
In this latter area, the groundwater showed a marked increase in salinity with the depth. At the
seawater fraction of 0.1 corresponded the lowest Ca-(Mg)-carbonates saturation indexes calculated
by modeling the mixing between freshwater and seawater using different software, thermodynamic
databases and equations for activity coefficients. In particular, seawater and groundwaters with an
added seawater fraction above 0.60-0.65 showed similar oversaturated indexes in high-Mg calcites
and pure-Ca carbonates (calcite and aragonite). Differently, in the groundwater that showed
carbonates undersaturation (generally with a seawater fraction between 0.02 and 0.60) the saturation
indexes in high-Mg calcites was 0.2 lower than pure-Ca carbonates. Locally, the bacterial reduction
of the dissolved sulfate enhanced the dissolution of the limestone, contributing to the increased
development of the karst structures and the seawater intrusion. Finally, the presence near the
coastline of fresh Ca- and Na-bicarbonate waters was in accord with the upwards flow of the
shallow freshwater during the formation of the saline wedge. However, the oxygen and hydrogen
stable isotope composition of the waters showed a probable contribution to the area from a deep
aquifer that is recharged in the highest reliefs of the province (Cordillera de Guaniguanico).
ManuscriptClick here to download Manuscript: BoschettiEtAl_RevisedText2.docx Click here to view linked References
1 2 3 4 5 6 7 8 9 10 11 12 13 14 15 16 17 18 19 20 21 22 23 24 25 26 27 28 29 30 31 32 33 34 35 36 37 38 39 40 41 42 43 44 45 46 47 48 49 50 51 52 53 54 55 56 57 58 59 60 61 62 63 64 65

2
1. Introduction
The Cuban land territory encompasses 110’992 km2, which is 66% karstified rocks, plus 67’831
km² of the shallow-water shelf karst (Iturralde-Vinent and Gutiérrez Domech 1999). Carbonate
karst aquifers are the primary source of freshwater and are therefore essential to the future needs of
the country (Seale et al. 2004). Unfortunately, coastal plains are often contaminated by seawater
intrusion, and the vulnerability to salinization is the most common and widespread problem for an
aquifer. In the Guanahacabibes Peninsula of western Cuba, the contamination of the fresh
groundwater by the saline seawater may be intensified by different, concomitant natural and
anthropogenic factors: the rain regime, sea tides, the conditions of recharge of the aquifer(s),
excessive aquifer exploitation by wells for human consumption and agricultural activities (Fagundo
Castillo and González Hernandez 1999; Hernández et al. 2013; Molerio León and Parise 2009).
Therefore, the implementation of suitable monitoring and protective actions is fundamental for the
preservation of these aquifers and for assuring the future use of this resource. In this paper, we
present the first results of a study to characterize the groundwaters of Guanahacabibes based on
their major chemical and isotopic composition. Specifically, the two main objectives are the
following: i) the calculation of the seawater fraction that mixes with the groundwater together with
the influence of this fraction on karst development in terms of the carbonates saturation index (SI)
of the waters; and ii) the discrimination between the seawater ingression and the isotope effects due
to tropical climate and topographic relief on evaporation and rain recharge, respectively.
Concerning geochemical mixing modeling, new topics of wide interest were treated. In particular,
the errors on the pure calcite, Mg-calcite and aragonite saturation indexes due to the incomplete
chemistry of the end-members, to the use of different thermodynamic databases and the related
activity coefficient equations are discussed.
1.1 Mixing modeling: the state of the art
When seawater and fresh groundwater mix, the addition of ions, such as Na+ and Cl
-, to a
bicarbonate water generally decreases the activity of Ca2+
and HCO3-, among other ions, and so
increases the solubility of calcium carbonates. This result is known as the ionic-strength effect, but
is sometimes termed the foreign-ion effect or, simply, the salt effect. Generally, when two waters
are mixed, the species concentrations in the mixture are volume-weighted averages of the two
concentrations in the end-member solutions. However, the thermodynamic activities of the ionic
species that control mineral-water reactions in the mixture are not linear functions of mixing,
because of the nonlinear variation with ionic strength in the activity coefficients of individual ions.
Two end-member solutions could therefore be saturated with respect to a given mineral, but the
1 2 3 4 5 6 7 8 9 10 11 12 13 14 15 16 17 18 19 20 21 22 23 24 25 26 27 28 29 30 31 32 33 34 35 36 37 38 39 40 41 42 43 44 45 46 47 48 49 50 51 52 53 54 55 56 57 58 59 60 61 62 63 64 65

3
mixed solution could be either undersaturated or supersaturated (Runnells 1969). Mean surface
seawater is supersaturated in calcite and aragonite, with SIcalcite = 0.8 and SIaragonite = 0.6, and the
North Atlantic (NA) and North Pacific (NP) oceans are slightly above and below these values,
respectively (Zeebe and Wolf-Gladrow 2001). Because of global warming and the increasing
transport of carbon dioxide from the land to atmosphere and then into seawater, the aqueous CO2
species in seawater increases and the pH of the water decreases slightly, resulting in a decrease in
the degree of carbonate supersaturation of coastal zone waters (Mackenzie and Ver 2010).
However, note that because of inhibition effects, mainly from dissolved magnesium but also from
organic acids and phosphates, calcite, low-Mg calcite (<5% mol Mg) and dolomite cannot
precipitate from surface seawater, whereas aragonite and high-Mg calcite (>5% mol Mg) are
formed (e.g., Appelo and Postma, 2007). Therefore, most of authors prefer to define the surface
seawater calcite supersaturation as “apparent” (Cooke and Kepkay 1984) and use the laboratory
solubility product experimentally determined in seawater (Emerson and Hedges 2003).
Using the WATEQ code and the Truesdell-Jones approach for activity calculation, Plummer (1975)
showed that mixtures of freshwater with a high percentage of seawater were supersaturated with
respect to calcite mainly because of the seawater supersaturation whereas, at lower seawater
percentages, the mixtures were undersaturated. Seawater ingression at the Yucatan Peninsula
(Mexico) was extensively studied by Back et al. (1986) and Stoessell et al. (1989) with the software
PHREEQE and REACT software, which used a modified (Davies or Truesdell-Jones) or extended
Debye-Hückel approach, respectively, for activity coefficients calculation. Certain minor
differences between the modeling results were imputed to the diversity in activity estimation and to
the different end-members compositions (Stoessell et al. 1989). Later, Stoessel (1992) compared an
updated mixing model with the real water samples from Barbados and discovered that minimal
sulfate reduction (<50% of sulfate removed as sulfide) enhanced the dissolution of calcite in
brackish to saline mixing-zone fluids, whereas considerable sulfate reduction (>50% of sulfate
removed as sulfide) enhanced precipitation in all mixing-zone fluid compositions (Stoessel 1992).
Other studies followed, and different software were used; for example, PHREEQE and its later
versions (Lin et al. 2013; Price and Herman 1991; Sanford and Konikow 1989) or EQ3/6 (Liu and
Chen 1996). Some of these models were further improved with a solute transport model, but despite
this, most of authors do not specify: i) what equation was employed in the activity coefficients
calculation, thus ignoring the error of the saturation indexes and; ii) the inhibition effect of Mg on
the saturation indexes of carbonates.
2. Geological and hydrogeological settings
1 2 3 4 5 6 7 8 9 10 11 12 13 14 15 16 17 18 19 20 21 22 23 24 25 26 27 28 29 30 31 32 33 34 35 36 37 38 39 40 41 42 43 44 45 46 47 48 49 50 51 52 53 54 55 56 57 58 59 60 61 62 63 64 65

4
Cuba is a tectonically complex island and its geological history spans the Mesozoic and Cenozoic
(e.g. Seale et al., 2004). In western Cuba, carbonate rocks range in age from recent to Upper
Jurassic. Cretaceous and Jurassic limestones constitute part of the Cordillera de Guaniguanico
(Allochthonous Terrane), which is mainly formed by the belts of Guajaibon–Sierra Azul, Northern
Rosario, La Esperanza (westernmost sector of the Northern Rosario, also named Alturas de Pizarras
del Norte), Southern Rosario and the Sierra de Los Organos belt that has been subdivided into the
Mogotes and the Pizarras del Sur Alturas (Pardo, 2009; Fig. 1). These carbonates are telogenetic
because they have experienced significant diagenetic alteration, including burial and uplift
(Choquette and Pray 1970). In contrast with the tightly faulted, imbricated stack of south-dipping
plates in central Cuba, the western belts are less intensely tectonized, north-dipping, superimposed
thrust sheets (Pardo 2009). Miocene through recent limestones are expansive in Cuba and are
separated from the Guaniguanico Terrane by the Pinar Fault (Fig. 1). These limestones are
eogenetic carbonates because they are in situ and have experienced little burial and tectonics
(Choquette and Pray 1970). Eogenetic and telogenetic carbonate rocks differ with respect to
permeability and porosity. Eogenetic carbonate rocks retain significant matrix permeability and
porosity (Budd and Vacher 2004), and may be up to 50’000 times more permeable than telogenetic
carbonates (Florea and Vacher 2006). This difference in matrix permeability has important
implications when considering groundwater flow, conduit morphology and aquifer response (Florea
and Vacher 2006). The carbonate aquifer of the Cordillera de Guaniguanico is confined by the
Quaternary sediments, thus representing the hydrological feeding zone for the south-western area of
the Guanahacabibes Peninsula. This peninsula constitutes an example of the recent geologic and
geomorphologic development with wide presence of Pliocene and Quaternary carbonate rocks that
were modified mainly by karst processes. The southwestern portion of this area, managed as a
national park, is formed by two flat peninsulas with playas and coastal cliffs, characterized by the
typical diente de perro (dog’s tooth) karst surface, whereas the northeastern portion is characterized
by swamps, wetlands and lagoons. The karstification of this area is intense and characterized by
dissolution and collapse forms represented by the development of dolines, cenotes, extensive
karrenfield and caves (Díaz Guanche et al., 2013).
The investigated area is subdivided into four geologic formations (Cabrera and Peñalver 2001;
Denis and Díaz Guanche 1993; Díaz Guanche et al. 2013; Hernández et al. 2013): i) Vedado
Formation, consisting of cream-colored to white massive marly limestone of biogenic origin (reef),
constituting the main nucleus of the emerged area of the peninsula and dating from the Upper
Pliocene until the lower Pleistocene. ii) Jaimanitas Formation, consisting of limestone and
biodetritic coral reef, lying on the training Vedado, occupying the first marine terrace and dating
1 2 3 4 5 6 7 8 9 10 11 12 13 14 15 16 17 18 19 20 21 22 23 24 25 26 27 28 29 30 31 32 33 34 35 36 37 38 39 40 41 42 43 44 45 46 47 48 49 50 51 52 53 54 55 56 57 58 59 60 61 62 63 64 65

5
from the Middle Pleistocene age. iii) Cayo Piedras Formation, consisting of the middle
biocalcarenitic of the retro-reef environment, also corresponding with the Versalles-Guanabo
(carbonatic) and Villaroja (terrigenous) Formations, and dating from the Middle Pleistocene age. iv)
Guane Formation, consisting of conglomerates, gravels, sands and sandy clays, weakly cemented by
clays, showing indefinite lenticular and more rarely inclined stratification deposited in a sea with
abundant alluvial contribution, that could be estuarine, measures up to 50 m in thickness and can be
interdigitated with the Vedado Formation, and dates from the Upper Pliocene-Lower Pleistocene
age. Considering the lithological similarity and their distinctness only at local scale, the Vedado,
Jaimanitas and Cayo Piedra formations were unified in Fig. 1.
Two main hydrogeological units are recognized in the area (Peláez García and González Cabrera
2013). The first unit is called the Neogene-Quaternary complex and corresponds to the Guane
aquifer of Cabrera Bermúdez et al. (2004). The complex extends broadly through the whole area in
association with the carbonate formations (Vedado, Jaimanitas), and it can reach a total thickness of
750 m and be strongly karstified in the upper 300 m. The underground waters of this aquifer are
fundamentally of the chloride-sodium type, due to the marine intrusion with a salinity that oscillates
between 1 and 5 g/l and chlorides that may vary from 500 to 800 mg/l. At isolated points of the
peninsula, lenses of Ca-bicarbonate freshwater with a salinity of 0.6–0.8 g/l and chlorides between
90 and 290 mg/l overlie on the salty waters. The lagoon and mangrove deposits, located along the
north coastal belt and in some inner spots as the case of Los Remates Swamp, control the regime of
ground-water flow in the northeastern part of the aquifer (Hernández et al. 2013). The second
hydrogeological unit is the Upper Jurassic – Lower Cretaceous “Guasasa complex”. It is composed
by the gray karstified and cracked limestones of the Upper Jurassic that forms the karst denuded
low mountains relief in the Sierra de Los Organos where the hydrographic Cuyaguateje Basin is
located. It includes the Guasasa Formation (micritic limestones, calcareous sandstones and flint
lens) and the Guaniguanico Basin – Los Organos Sub-Basin of Cabrera Bermúdez et al. (2004).
There is no outcrops of this unit in the studied area because buried. However, it seems that waters
emerge as fresh submarine discharge in the southwestern part of the Guanahacabibes Peninsula,
therefore, a relation with the large karst springs located in the Sierra de Los Organos has been
proposed (Peláez García and González Cabrera 2013).
3. Water Sampling, Analysis, and Calculations
3.1 Samples description
From 22 June 2013 to 27 August 2013, 62 water samples were collected at the locations shown in
Figure 1b. The samples included seawaters from 4 locations (Los Cayuelos, slc; Bahia Guadiana,
1 2 3 4 5 6 7 8 9 10 11 12 13 14 15 16 17 18 19 20 21 22 23 24 25 26 27 28 29 30 31 32 33 34 35 36 37 38 39 40 41 42 43 44 45 46 47 48 49 50 51 52 53 54 55 56 57 58 59 60 61 62 63 64 65

6
sbg; Maria La Gorda, sml; Bahia Cortes, sbc), 4 waters from karst caves (Quintana, cq; Roncali, cr;
Lázaro, cl; Julia, cj), 4 surface waters from swamps (Ciénaga of Los Remates, LR1 and LR2),
lagoons (Laguna El Pesquero, LP) and river (Cuyaguateje, rc). The remaining samples were
gathered from 25 water wells, all distributed in the Sandino municipality. Of these, 3 to 5 samples
were collected from the #18, #33 and Pacheco (p) wells at certain depths with respect to the
elevation of the piezometric level (meters respect to the mean sea level).
3.2 Field and laboratory methods
At the sampling site, temperature, electrical conductivity (at 25°C), pH (at 20°C), Eh (referred to
the standard hydrogen electrode SHE) and CO2 measurements were performed using a
multiparameter meter. In the laboratory, carbonate alkalinity (cAlk as HCO3) was determined by
titration using the HCl and dye indicator method. The concentrations of major ions (Ca, Mg, Na, K,
Cl, NO3, NH4 and SO4) and certain trace constituents (Sr, Li, F, and NO2) were determined by ion
chromatography using a DIONEX ICS-1000 instrument with a DIONEX AS40 automated sampler.
For the determination of cations, the samples were acidified to pH < 3 using concentrated HNO3 (65
% Suprapur®, Merck). In samples with a rotten-egg odor (e.g., at well #33), the level of total
reduced sulfur as HS was determined using the photometric method (standard method 4500-S2-
D;
Eaton et al. 1995). The accuracy of the analyses was verified based on the ionic balance. For the
spring water and groundwater, analyses with an ionic balance of ± 5 % were considered acceptable.
The oxygen and hydrogen stable isotope composition of the water molecule was analyzed using the
water–gas equilibration method. Briefly, water samples were transferred to a Finnigan GLF 1086
automatic equilibration device, online with a Finnigan DELTA-plus mass spectrometer
(Laboratorio di Geochimica Isotopica at the University of Parma, Italy). The ratio measurements
2H/
1H were obtained on pure hydrogen after the H2(g)–H2O(l) equilibration using a catalyzer
(Boschetti et al. 2005), whereas 18
O/16
O was measured on carbon dioxide after CO2(g)–H2O(l)
equilibration (Epstein and Mayeda 1953), both at 18 °C. Both ratios results were recorded in delta
per mil ( ‰) relative to the V-SMOW (Vienna Standard Mean Ocean Water) standard, thus
obtaining the 18
O and 2H values. The analytical precision was within ± 0.2 ‰ for oxygen and ± 1
‰ for hydrogen.
3.3 Calculations of activity and saturation index
The saturation indexes (SI) of the carbonate minerals calcite, aragonite and high-Mg calcites
(HMC) were calculated on the basis of the complete physicochemical analyses of the sampled
water. Furthermore, saturation indexes resulting from the theoretical mixing of Na-chloride
1 2 3 4 5 6 7 8 9 10 11 12 13 14 15 16 17 18 19 20 21 22 23 24 25 26 27 28 29 30 31 32 33 34 35 36 37 38 39 40 41 42 43 44 45 46 47 48 49 50 51 52 53 54 55 56 57 58 59 60 61 62 63 64 65

7
seawater with fresh Ca-bicarbonate groundwater were also calculated. During the mixing, the
increasing salt concentration of the solutions produces higher ionic strengths (IS), thus altering the
activities of the dissolved species and the calculation of SI (e.g. Appelo and Postma, 2007;
Langmuir, 1997). Moreover, different equations for the calculation of the activity coefficients are
available, which may produce different results on activity and consequently on SI (Bethke 2008).
Therefore, the following software, equations and thermodynamic databases to calculate the activity
coefficients and SI were used and compared: i) PHREEQCI version 3.0.6 (Parkhurst and Appelo
2013) for the Debye–Hückel/Davies, Truesdell-Jones, SIT (Specific Ion interaction Theory) and
Pizter approaches to the activity coefficients calculations and the thermodynamic datasets llnl.dat,
phreeqc.dat, wateq4f.dat, sit.dat and pitzer.dat and ii) the Geochemist’s Workbench version 7
(Bethke and Yeakel 2008), for the B-Dot equation with the dataset thermo.dat and Pitzer parameters
with the datasets and hmw.dat and phrqpitz.dat. In addition, EQ3/6 version 8 (Wolery and Jarek
2003) and the B-Dot equation for activity coefficient calculation supported by the data0.cmp
thermodynamic dataset, were used to calculate the SI after the formation of an ideal solid solution
for CaCO3-MgCO3 resulting from the freshwater–seawater mixing. Differently, in the above
described i) and ii) models, the Mg-calcite’s saturation indexes of solutions resulting from mixing
and containing a mole fraction x of Mg-carbonate was calculated as following (Glynn and Reardon
1990):
2 2 21- 3 3Ca Mg CO 1 Ca + Mg + COx x x x [1]
22 23
(1 x)COCa Mg
IAP xMg calcites a a a
[2]
SI = log(IAP ) log( )Mg calcites Mg calcites Mg calcitesK [3]
where IAPMg-calcites is the ion activity product of the solution and KMg-calcites the solubility constant of
the HMCs. For these latter, 12% < x < 14% were considered in accord with the typical values found
in tropical carbonates (Agegian and Mackenzie 1989; Garrels and Wollast 1978; Perry et al. 2011),
whereas -logKMg-calcites of 8.42 and 8.25 at 25°C and 1 bar for synthetic(inorganic) and biogenic
were chosen, respectively (Morse and Mackenzie 1990).
4. Chemical Composition
4.1 Results and main characteristics
The chemical composition of the sampled waters is shown in the Electronic Annex 1. The mean
temperature of the samples, T = 27.3 ± 1.6 °C, agreed with the local air temperature of the summer
period (25°C). Considering the calculated total dissolved solids (TDS; Eaton et al., 1995) and the
salinity classification by Robinove et al. (1958) that use this parameter, all of the groundwaters
1 2 3 4 5 6 7 8 9 10 11 12 13 14 15 16 17 18 19 20 21 22 23 24 25 26 27 28 29 30 31 32 33 34 35 36 37 38 39 40 41 42 43 44 45 46 47 48 49 50 51 52 53 54 55 56 57 58 59 60 61 62 63 64 65

8
collected from the surface of the water table were fresh because had TDS < 1 g/l, but two slightly
saline (1 < TDS < 3 g/l) samples from #66 (TDS = 1.1 g/l) and Mella (me, TDS = 1.7 g/l) wells.
Moreover, the TDS increased with the sampling depth in the wells explored at different depths. For
example, at the bottom of the wells #18 and #33, the TDS increased toward the highly saline range
(10 < TDS < 35 g/l), thus approaching the mean seawater value (35 g/l), whereas the TDS in the
Pacheco well remained in the freshwater range. Water from the well at Roncali lighthouse (Faro
Roncali, fr) showed the highest TDS value, similar to that of the seawater, both at the surface and
the well bottom. Excluding this sample, all of the water sampled at the surface of the water table
showed a mean pH of 7.43 ± 0.31, which is similar to the mean value of water from the
Cuyaguateje Basin (Fig. 1; 7.00 ± 0.86; Fagundo et al., 1986). Water samples from the wells
explored in depth showed values that scattered not only between this values and that of the local
seawater (pH = 8.53 ± 011), as expected for seawater intrusion (well #18), but also values lower
than 6 (well #33). Therefore, in this latter case, more complex phenomena than the pure mixing
must have occurred.
4.2 Evaluation of seawater ingression and related effects
After converting the anion and cation concentration data of the major chemical constituents from
mg/l to meq/l, the four following compositional facies, listed from the least to the most salty, could
be distinguished in the sampled waters (Electronic Annex 1): six Ca-bicarbonate freshwaters (well
#3; Rio Cuyaguateje, rc; Laguna El Pesquero, lp; RGB29 well, #29; Ngouabi well, ng; Cueva
Roncali, cr); two Ca-chloride freshwaters (well Quintana, q; well #60) and two Na-bicarbonate
freshwaters (Pacheco well at the surface of the water table, p; Abasto Maria La Gorda P1, mlg1).
All of the TDS of the Ca-bicarbonate and Ca-chloride waters were 0.1 < TDS < 0.5 g/l, which are
excellent to good waters for irrigation and drinking purposes in terms of salinity (CASS 2003;
WHO 2011), but the water quality deteriorates when approaching to the Na-chloride composition
passing through Na-bicarbonate. Because of the swelling effect in clays, a sodium excess in water
can produce a decreased permeability with negative repercussion on the normal water supply and
aeration required for plant growth. Therefore, the sodium adsorption ratio is another parameter
widely used to classify irrigation waters (SAR, Appelo and Postma, 2007; Tab. 1). However, using
waters classification by this parameter, only 4 samples picked up at water table surface showed
SAR value above its critical limit SAR > 10, which correspond to a TDS > 1.4 g/l (me, #18, fr wells
and Los Remates LR2 swamp). Whereas the Na-chloride is the typical chemical facies resulting
from the pure mixing with the seawater in a coastal karst environment, both the Ca-chloride and
Na-bicarbonate are other two recurrent facies resulting from cation exchange in this type of
1 2 3 4 5 6 7 8 9 10 11 12 13 14 15 16 17 18 19 20 21 22 23 24 25 26 27 28 29 30 31 32 33 34 35 36 37 38 39 40 41 42 43 44 45 46 47 48 49 50 51 52 53 54 55 56 57 58 59 60 61 62 63 64 65

9
environment. Ca-chloride is the result of seawater intrusion in an aquifer with Ca-bearing sediment
(Ca2+
released by soil exchanger, Cl- from seawater), whereas the latter occurs when freshwater
flushes a salt water aquifer with Na-bearing sediments (Appelo and Postma 2007; Jones et al.
1999). These effects are suitably shown in the diamond of the Piper diagram (Fig. 2), where
freshening and intrusion cation exchange effects depart from the mixing line connecting the Ca-
bicarbonate freshwater corner and the saline seawater point. A pure mixing effect is shown for well
#18 down to a depth of 10 m (Fig. 2b), whereas exchange effects after seawater intrusion can be
hypothesized in well #33 down to 20 m (Fig. 2c). The Pacheco well samples are scattered in the
freshening area, probably due to a secondary mixing (Fig. 2d). The presence of freshwater very
close to the coastline, as occurred for the Na-bicarbonate water at Maria La Gorda and Ca-
bicarbonate water at Cabo San Antonio promontories, might represent the effect of a lens of
freshwater floating on a deeper salty one according to the typical salt-wedge effect (Custodio 1987;
Sáinz et al. 2010). Also calcite dissolution-precipitation and sulfate reduction could be potentially
visualized on the Piper plot (Fig. 2; Appelo and Postma 2007), but the discernment is hard when
more effects are combined. Moreover, the interpretation could be complicated further by additional
processes (secondary mixing, sulfide and organic matter oxidation). Finally, the sum of the
variables that characterize this diagram does not help the purpose. Therefore, the additional effects
were searched using different variables and diagrams.
The use of the conservative constituents Br and Cl provided further confirmation that mixing
between the two end members was the main salinization process because the plotted samples depict
a distinct straight line that joins freshwater and seawater (Fig. 3). The only exception concerns the
swamp sample LR2 which showed an halogens enrichment, most likely due to the dissolutions of
halite in an evaporitic environment (Fig. 3). Chloride can be also used as follows to calculate the
theoretical seawater fraction (f) in a mixed sample, assuming conservative mixing between
freshwater and seawater (Appelo and Postma 2007):
-
-
S fw
sw fw
Cl Clf
Cl Cl [4]
where Cls, Clfw and Clsw are the chloride content, in mol/l or meq/l, of the sample, the local
freshwater and the seawater, respectively. For Clfw and Clsw, the average content in the Cuyagateye
Basin (0.621 mol/l; Fagundo et al., 1986) and of the four local seawater sampled in this study (583
mol/l) were used, respectively. Most of the groundwater samples showed 0.00 < f < 0.04, except the
coastal part of LR2 (f = 0.28) and fr well (f = 0.86). According to Hernández et al. (2013), also #18,
1 2 3 4 5 6 7 8 9 10 11 12 13 14 15 16 17 18 19 20 21 22 23 24 25 26 27 28 29 30 31 32 33 34 35 36 37 38 39 40 41 42 43 44 45 46 47 48 49 50 51 52 53 54 55 56 57 58 59 60 61 62 63 64 65

10
#33 and Pacheco wells have f < 0.04 at depths between 5-15 m. The f value gradually increased up
to 0.1 at depths of 16-25 m; below this depth range, the f value increased abruptly and quickly
toward that of pure seawater (f = 1) estimated at 34-42 m (Fig. 4).
The intrusion and freshening effects in the wells monitored at different depths are also effectively
shown on binary diagrams that plot chloride and major cations (Fig. 5). In particular, the samples
from well #33 showed Ca enrichment and a Mg, Na and K depletion compared with the curves that
represent binary mixing between seawater and freshwater or rainwater on which well #18 samples
are clustered. The water from Pacheco well showed a Na-chloride composition at depth, but Na-
bicarbonate at the water table and more shifted toward rainwater, probably due to the rain washing
of soil’s clay having exchangeable sodium. The greater diversity among the fresh groundwaters and
the eastern Cuba (Rodríguez et al. 2004) and Caribbean (Cerón et al. 2005) rainwaters shown in the
Cl-Ca plot (Fig. 5a) is explainable by the high variability in the Ca concentration of the Ca-
bicarbonate waters coming from the Sierra de Los Organos and Rio Cuyaguateje, whose lower
values are quite similar to those of western Cuban rainwater (Molerio León 1992; Molerio León
2012).
The mixing of freshwater and seawater, that are both saturated with calcium carbonate, can result in
water that is undersaturated with calcium carbonate; that is, calcite dissolution may occur (Richter
and Kreitler 1993). In the Ca vs HCO3 and SO4 vs Cl diagrams (Fig. 6), the calcium excess and
sulfate deficit of the well #33 samples could be explained by additional calcium carbonate
dissolution occurring in the presence of bacterial sulfate reduction in organic-rich sediments. In
fact, the sulfate decline shown by the well #33 occurred at a chloride content that could not be
explained by dilution (Fig. 6a). In this scenario bicarbonate should be increasing according to the
following reaction:
2- - - +
2 4 3CH O + 0.5SO HCO + 0.5HS + 0.5H [5]
and this is confirmed by the presence of dissolved sulfide (up to 1.8 mg/l). However, the
bicarbonate unexpectedly decreased most likely because of its conversion to CO2 (up to 504 mg/l)
caused by an extremely low pH (down to 5.9), both measured in well #33 at depths down to 30
meters. The low pH may have resulted from the oxidation of previously deposited sulfides.
Therefore, starting from the groundwater sampled at a shallow depth, which showed high HCO3
most likely because of the presence of organic matter, and continuing to deeper depths, a Ca
increase preceded a HCO3 decrease that followed a negative exponential curve fitted to the samples
(Fig. 6b). After a steep increase up to 44 meq/l of Ca caused by carbonate dissolution, the Ca
1 2 3 4 5 6 7 8 9 10 11 12 13 14 15 16 17 18 19 20 21 22 23 24 25 26 27 28 29 30 31 32 33 34 35 36 37 38 39 40 41 42 43 44 45 46 47 48 49 50 51 52 53 54 55 56 57 58 59 60 61 62 63 64 65

11
concentration of the groundwater decreased at well bottom to resemble seawater, which is
consistent with a deep ingression in a manner similar to the previously described “deep regime”
intrusion (Back 1966; Custodio 1987). Finally, noted that the sulfate-reduction process was also
revealed in the neighboring Laguna del Valle de San Juan (Pérez and Pubillones León María 1988).
5. Mixing modeling: results and discussion
The results concerning the carbonates saturation indexes (SI) of the samples collected in this study
are in the Electronic Annex 2, here discussed and compared with the results of the freshwater-
seawater mixing modeling.
Concerning the models, the mean composition of the four local seawater (SW) samples and the
Cueva Roncali (FW) sample were used as end-members. The latter was chosen because it has a
bicarbonate content similar to that of the surface sample of well #33, but a negligible fraction of
seawater typical of the Ca-bicarbonate freshwaters. The discussion and comparison of the results
with the real samples in terms of SI follow a technical focus on SI errors, dedicated to the modeler
specialists.
5.1 Error on saturation index (SI): activity calculation and charge-balance effects
If an error of ± 0.2 on SI is considered as acceptable, all of the model’s results were comparable
when SIcalcite and SIaragonite were plotted against chloride during FW-SW mixing, except for the
Truesdell-Jones model using phreeqc.dat (Fig. 7). Regarding this exception, quite different results
on SI were obtained if the input data of the end-members composition included reduced species
(e.g. ammonia) without the oxidized counterparts (nitrite, nitrate). In particular, the sampled SWs
had an high ammonium content (85.5 mg/l), comparable with that observed in coastal interstitial
waters within sediments rich in organic matter (Matisoff et al. 1975). However, in our case the
nitrate data are lacking because not measured or below the detection limits. Under these conditions,
the error in the calculated SI after mixing is due to the forced charge balance, automatically
achieved by the software on both the redox potential (pe or Eh) and the pH. Mass-action and mole-
balance equations are written in terms of activity; therefore, the final error in the SI also depends on
the equation used for the calculation of the activity coefficients (). In fact, the obtained SIs were
worst and quite low for the models whose activity coefficients were obtained not only by the
Debye-Hückel approaches, as expected, but also for the Truesdell-Jones model (Fig. 7). Differently,
the SIs obtained by the SIT modeling were slightly higher than the mean model at approximately
0.2 to 0.8 of the seawater fraction (Fig. 7). Thus, the results from the different models can be
considered always coherent between them when SW fraction range from 0.0 up to 0.1. In that range,
1 2 3 4 5 6 7 8 9 10 11 12 13 14 15 16 17 18 19 20 21 22 23 24 25 26 27 28 29 30 31 32 33 34 35 36 37 38 39 40 41 42 43 44 45 46 47 48 49 50 51 52 53 54 55 56 57 58 59 60 61 62 63 64 65

12
calcite and aragonite are always undersaturated with SIcalcite = -0.26 ± 0.06, SIaragonite = -0.38 ± 0.10
and SIcalcite = -0.4 ± 0.2, SIaragonite = -0.57 ± 0.07, respectively. Above SW of 0.1, the SIcalcite and
SIaragonite show abrupt decrease (up to -3.47 and -3.61 at 0.99 SW, respectively) if activity is
calculated also for reduced species, in particular when was obtained by Debye-Hückel approach
and llnl.dat. This path combines the different effects of the activity coefficient equation form (pure
coulombic ion interactions, ion size does not vary with IS, and ions of the same sign do not interact;
e.g. Langmuir, 1997) with the increased H+ activity due to the forced charge balance. Therefore, it
is evident in this case that the equation is inadequate to describe the mixing for seawater fractions
above 0.1. In fact, we have IS = 0.083 for SW = 0.1 and IS = 0.153 for SW = 0.2. The Truesdell-
Jones equation for the calculation of activity coefficients (Parkhurst and Appelo 2013) was also
employed in the mixing models with reduced species (Fig. 7). In this case, calcite and aragonite are
again always undersaturated, with results comparable to the other models at SW < 0.1, whereas at
higher seawater fraction a gentle decrease is shown up to SIcalcite = -0.72 ± 0.12 and SIaragonite = -0.76
± 0.07 (mean and standard deviation between the employed wateq4f.dat and phreeqc.dat datasets).
From a theoretical point of view, the Truesdell-Jones equation should be better than Debye-Hückel
for salty solution because the former may explain NaCl solution up to IS = 2. However, SW is more
complex in composition than a pure NaCl solution; therefore, the error also increases in this case at
higher SW fraction and H+ activity. Therefore, if only the mixing models calculated from complete
and consistent end-member composition were considered (i.e. using only the major dissolved
components), the obtained mixed waters were oversaturated with respect to calcite or aragonite
when the SW fraction was higher than about 0.60 or 0.65 (0.7 if the Truesdell-Jones equation and
phreec.dat are used), respectively.
5.2 High Magnesium Calcites (HMC) and carbonates saturation index
The local mean SW is oversaturated both in calcite and aragonite, SIcalcite = 1.17 ± 0.04 and SIaragonite
= 1.01 ± 0.05, respectively. To overcome the problem of the inhibition effect caused by magnesium
on carbonates precipitation, the saturation state of the mixed solutions with respect to HMC was
first calculated assuming a pure solid solution between CaCO3 and MgCO3 (EQ3/6, the B-dot
model for activity coefficient calculation and the data0.cmp dataset). Using this model, mixed
waters starts at equilibrium or slightly undersaturated in HMC (SIHMC = -0.16; XMgCO3 = 5%). The
more seawater fraction is added, the more the HMC saturation state and the MgCO3 fraction
increase, reaching oversaturation from approximately 0.35 mixed solutions, up to SW with SIHMC =
1.66 (xMgCO3 = 68%). Note that the modeled MgCO3 content in seawater is in accord with the
maximum detected content in fish-produced tropical carbonated (Perry et al. 2011). However, the
1 2 3 4 5 6 7 8 9 10 11 12 13 14 15 16 17 18 19 20 21 22 23 24 25 26 27 28 29 30 31 32 33 34 35 36 37 38 39 40 41 42 43 44 45 46 47 48 49 50 51 52 53 54 55 56 57 58 59 60 61 62 63 64 65

13
obtained MgCO3 fractions at oversaturation are too high to represent the typical natural HMC, in
which the average xMgCO3 content in tropical marine carbonate sediments and marine inorganic
cements is approximately 13% (Perry et al. 2011). In fact, the saturation indexes obtained in the real
seawater samples and the oversaturated mixed solutions of the modeling using the logK for
synthetic and biogenic HMC at that percentage are similar to pure calcite and aragonite,
respectively (Fig. 8). Should be noted that the difference starts to be significant at SW < 0.1 in the
models (Fig. 8b) and for the undersaturated samples (Fig. 9), the SIHMC of which are lower up to 0.2
in comparison with pure Ca-carbonates. The mean SIs calculated for Ca-bicarbonate (SIcalcite = -0.27
± 0.28; SIaragonite= -0.43 ± 0.28) and Ca-chloride waters (SIcalcite = -0.19 ± 0.21; SIaragonite = -0.35 ±
0.28) sampled in this study are similar and slightly undersaturated in calcite and more
undersaturated in aragonite, whereas the Na-bicarbonate water sample mlg1 is oversaturated in both
(Fig. 8, Fig. 9). The calculated mean SI of the Na-chloride waters at low SW fractions < 0.02
(chloride content < 500 mg/l or 0.014 molality) show that these groundwaters are on average in
equilibrium with calcite (SI = -0.09 ± 0.35) but undersaturated in aragonite (SI = -0.25 ± 0.35).
Generally, at that low chloride content, the standard deviation of both CaCO3 phases spans between
oversaturation and undersaturation, quite similarly to the Ca-bicarbonate samples at Cuyaguateje
Basin and Sierra Los Organos (Fig. 8b). At SW fractions > 0.02, the mixed waters show more
extreme variations in the carbonates SI values, in particular the opposite saturation features of wells
#18 and #33, which were both sampled at various depths. Especially, at the added SW fraction of
0.1, the groundwater showed oversaturation at well #18 but undersaturation at well #33 (Fig. 8a).
For the well #18 groundwater, the carbonates oversaturation was most likely due to the CO2
degassing and/or re-equilibration in the soil environment having a lower CO2 content. In fact, the
lowest calcite-aragonite saturation indexes, predicted at SW fraction of 0.1, should occur at pH =
6.85 and logPCO2 = -1.53, whereas the well #18 groundwater at a similar chloride content (-21.5
meters sampling depth) had pH = 8.00 and logPCO2 = -2.86. For the well #33 groundwater, and
according to Corbella and Ayora (2003), an additional effect such as the organic matter
decomposition as in reaction (5), should be invoked to reach the extremely low carbonate saturation
indexes (SIcalcite = -2.32; SIaragonite = -2.48). This is confirmed by using the REACT tool combined
with the thermo.dat dataset of the Geochemist’s Workbench software, which produced a similar
calcite saturation index and pH when approximately 0.35 mol of aqueous CH2O was added to the
theoretical mixed solution obtained at SW = 0.1.
6. Isotope Composition
6.1 Discriminating between seawater ingression and evaporation
1 2 3 4 5 6 7 8 9 10 11 12 13 14 15 16 17 18 19 20 21 22 23 24 25 26 27 28 29 30 31 32 33 34 35 36 37 38 39 40 41 42 43 44 45 46 47 48 49 50 51 52 53 54 55 56 57 58 59 60 61 62 63 64 65

14
To critically analyze the obtained isotope results (Electronic Annex 1), the sample waters were
compared with global (GMWL) and local (LMWL) meteoric water lines (Fig. 10a). For the former,
the regression equation of the long-term mean data weighted by the amount of precipitation was
given by the following equation (Rozanski et al. 1993):
2H = (8.17 ± 0.06) x
18O + (10.35 ± 0.65). [6]
For the LMWL, the isotope data for the precipitations were chosen from the following four stations
of the Global Network of Isotopes in Precipitation (GNIP; IAEA/WMO, 2013): El Salto (37 m asl),
Finca Ramirez (170 m asl) in the Pinar del Rio Province; Santa Ana-Santa Cruz (80 m asl), Ciro
Redondo (480 m asl) in the near northeastern portion of the Artemisa Province. The least square fit
was calculated as follow for all of the unweighted monthly mean data but one outlier (Santa Ana-
Santa Cruz from the 15 November 1983):
2H = (7.33 ± 0.31) x
18O + (9.13 ± 0.95), with r = 0.96 and N = 48. [7]
Other authors obtained different equations using the same data from the same stations (Arellano et
al. 1989; Arellano et al. 1992). Despite this discrepancy and the fact that fragmentary data were
available for these stations (from June to September of the 1983 and from March to November of
the 1984), our equation is quite similar to the following one obtainable for Cuba from the weighted
monthly mean data of Molerio León (1992) (CMWL in Fig. 10a) :
2H = (7.30 ± 1.01) x
18O + (6.73 ± 2.97), with r = 0.92 and N = 12. [8]
The main isotopic characteristic of the waters sampled in this study was their displacement to the
right of the meteoric water lines, with all but one (Cienaga Los Remates P1, LR1) roughly arranged
along a straight line with lower slope (Fig. 10a). Considering that wells #18 and #33 were heavily
intruded by seawater during sampling, as previously verified by chemical data, and that they were
more shifted toward seawater in comparison with most of the other freshwater samples (Fig. 10a),
the straight line may represent a mixing effect. However, according to Gonfiantini and Araguas
(1988), for Caribbean areas the mixing effect may be confused with evaporation in this kind of
graph. In fact, note that the most isotopically enriched samples were represented by the El Pesquero
lagoon (LP) and the swamp LR1, which had a negligible seawater contribution. This problem may
be solved by combining the water isotope data with data from a conservative element, such as
1 2 3 4 5 6 7 8 9 10 11 12 13 14 15 16 17 18 19 20 21 22 23 24 25 26 27 28 29 30 31 32 33 34 35 36 37 38 39 40 41 42 43 44 45 46 47 48 49 50 51 52 53 54 55 56 57 58 59 60 61 62 63 64 65
15
chloride, in solution (Fig. 10b). In these plots, the mixed groundwaters from wells #18 and #33 are
readily discriminated from the evaporated ones from LP and LR1 sites. Additionally, the
groundwater of the Pacheco well (p) showed an isotopic enrichment at greater depth, but at
moderate chloride content (Fig. 10b). This result was most probably due to the ingression of the
waters from the neighbouring El Pesquero lagoon, as suggested by the shift toward the LP sample
in the plot (Fig. 10b). Furthermore, the seawater samples from Guadiana and Cortés bays
(evaporated seawaters; esw in Fig. 10a,b) demonstrated an isotope enrichment due to evaporation in
comparison with seawater from Cabo San Antonio and Maria La Gorda samples (unevaporated
seawaters, nesw in Fig. 10a,b), which showed a mean isotope composition more similar to those of
the Caribbean Sea (18
O = +0.84 ‰, 2H = +6.6 ‰; Gonfiantini and Araguas, 1988).
To calculate the slope of a line describing the local evaporation effect, the isotope composition of
the local atmospheric moisture (water vapor) is a key parameter that should be known. By default,
the isotope composition of the vapor is often estimated by proxy, assuming isotopic equilibrium
with the local precipitation. While this approximation may be acceptable during rainy periods in a
continental setting, it is unsatisfactory in the vicinity of an evaporative source, such as a lake sea,
and not during prolonged dry periods (Gat 2010). Because the isotope composition of local
atmospheric moisture is unknown, we attempted to calculate the evaporation slope from our
experimental data, that is, with the least square fit between the evaporated and enriched samples and
their possible unevaporated analogues, arranged near the water lines, and identifiable as their
meteoric recharge. For example, the Laguna El Pesquero is hydrologically connected by channels to
the Cuyaguateje Basin, and the obtained slope from the best fit between their isotope data is
approximately 5.9. Furthermore, all the four water samples from karst caves are displaced on a
straight line, the linearity and slope (5.1) of which were tested for statistical significance by Fisher’s
and Student’s test, respectively. Adding to this regression the data of the LR1 sample, the linearity
and slope maintain their significance, with the slope showing a slight decrease to 4.8 but measuring
4.4 when calculating a best fit between LR1 and the Cuyaguateje River sample data. These latter
values are more similar to the evaporation slope of 4.6 revealed for Cuba by other authors (Molerio
León 1992; Molerio León 2012; Peralta Vital et al. 2005). However, the obtained slopes of the
samples from the karst caves and Cuyaguateje basin agree better with the 5 and 6 theoretical slope
range for the water surface evaporation at the mean local relative humidity of 75% and T = 25 °C
(Gonfiantini 1986; Xinping et al. 2005); therefore, the slope values less than 5 may be attributable
to an evaporative effect from soil and/or shallow groundwater (Gat 2010).
6.2 Meteoric recharge estimation
1 2 3 4 5 6 7 8 9 10 11 12 13 14 15 16 17 18 19 20 21 22 23 24 25 26 27 28 29 30 31 32 33 34 35 36 37 38 39 40 41 42 43 44 45 46 47 48 49 50 51 52 53 54 55 56 57 58 59 60 61 62 63 64 65

16
All of the water samples that were not located on the seawater mixing or evaporation lines stayed
between these lines and showed a mean deuterium excess of 6.4 ± 0.6 (Fig. 10a). This value is less
than those of the meteoric water lines, indicating that these waters falling between the
aforementioned evaporation lines suffered a moderate evaporation. The highest isotope values of
this water group were consistent with those measured in the Cuyaguateje River (18
O = -3.62 ‰;
2H = -22.3‰), which in turn agreed with the mean values for the rainy period from May to
October (18
O = -3.46 ± 0.62 ‰; 2H = -19.3 ± 3.8 ‰; Molerio León, 1992, 2012). These higher
values should also correspond with the meteoric recharge to the well #18, as shown by extrapolating
back from the chloride-isotope data of this well (Fig 10b). Therefore, the northwestern sector of the
Guanahacabibes Peninsula is most likely fed from a shallow circulation on the karst formation.
In the same manner, note that the lowest water group values coincided with the intercept between
the line fitting well #33 and the caves samples and the meteoric water lines, which occurred at
approximately 18
O = -5.3 ‰. A similar value was shown also by well #3 (18
O = -5.34 ‰) and the
Abasto Maria la Gorda well (18
O = -5.31 ‰). To calculate the elevation effect on the meteoric
recharge of groundwater, the meter-18
O equation of Molerio León (1992) could be used, here
rewritten as:
H(m) = -520.83 x 18
O(‰) – 1182.29, with r = 0.95 and N = 12. [9]
This equation partially coincides with that obtained from the local GNIP’s station data as reworked
and reevaluated by Arellano et al. (1992; Fig. 10c). Using this equation to calculate the local
elevation effect, we obtained a corresponding recharge elevation of approximately 700 m for the
Cuyaguateje River and over 1000 meter for the Maria La Gorda transect samples, which are well
over the real and maximum height of the basin and of the Cordillera de Guaniguanico, respectively.
In fact, the Cuyaguateje Basin is characterized by low, quite irregular mountains, with average
elevations between 350 and 400 m and residual limestone hills named mogotes. By contrast, the
highest elevation of the Cordillera lies in the westernmost sector of the Province between the
Doming Fault and the Northern Rosario belt (Pico Pan de Guajaibon, 700 m asl). When we tried as
an alternative to obtain a better elevational gradient equation using the GNIP’s station data as
reevaluated by Arellano et al. (1989) plus some karst springs from the St. Cruz River basin in the
Pizarras del Sur and Cangre belts (Arellano et al. 1989; Arellano et al. 1992), we obtained the
following equation (Fig. 10c):
H(m) = -291.50 x 18
O(‰) – 745.61, with r = 0.70 and N = 12. [10]
1 2 3 4 5 6 7 8 9 10 11 12 13 14 15 16 17 18 19 20 21 22 23 24 25 26 27 28 29 30 31 32 33 34 35 36 37 38 39 40 41 42 43 44 45 46 47 48 49 50 51 52 53 54 55 56 57 58 59 60 61 62 63 64 65

17
Note that the raw sample data showed a non-linear, exponential elevation-18
O path, as revealed in
other data from Central and South America (Rozanski and Araguás-Araguás 1995). This pattern
may be attributable to the “shadow effect” on the moistures played by the continental Mexican and
eastern Cuban reliefs. Despite the poor linear correlation coefficient, the elevation estimated using
the equation [10] and relating to the 18
O of the Cuyaguateje River is coherent with the average
river elevation. Differently, the extremely low 18
O values measured in the groundwaters of the
Maria La Gorda transect could be influenced by the elevation effect on the rains in the Cordillera de
Guaniguanico (Fig. 10c). This supposition is consistent with the hypothesized connection between
the fresh submarine discharges in the Maria La Gorda area and the large karst springs located in the
Cordillera (Peláez García and González Cabrera 2013). However, we cannot exclude the possibility
that the observed, quite low isotope values are also related to the rapid infiltration in the deeper
endokarstic conduits by abundant precipitations with more negative isotope composition during the
periods of heavy rainfall, that are typical for the tropical, monsoonal climate of the area (Florea and
McGee 2010). These hypotheses necessitate the collection of isotope data throughout a complete
hydrological year for confirmation.
7. Conclusions
The groundwaters of the Guanahacabibes Peninsula showed the typical chemical compositions
related to seawater ingression. The fresh Ca-bicarbonate waters are mainly located in the
northeasternmost sector of the peninsula, where the Cuyaguateje River issues into the area. More
toward the southwestern sector, the shallow groundwater show a mainly Na-chloride composition,
but maintain a low seawater fraction (0.00 < f < 0.04) up to 20 m in depth and are promptly diluted
by local rain. Waters with a Ca-chloride composition were detected in the wells just at south of the
Los Remates swamp. This transitional composition, representing seawater intrusion, occurred
where the Guane terrigenous fm. displays interdigitation toward the Vedado limestones fm. The
groundwater in the southwestern plain of the Guanahacabibes Park area presented an abrupt salinity
increase at a depth of 26-30 meters, which corresponded to an added seawater fraction of 0.1. This
value coincided with the lowest Ca-(Mg)-carbonate saturation index resulting from the mixing
modeling. Generally, seawater and groundwaters with an added seawater fraction above 0.60-0.65
showed similar oversaturated indexes in HMC and pure-Ca carbonates (calcite and aragonite).
However, in the groundwaters with a seawater fraction between 0.02 and 0.60 and that showed
carbonates undersaturation, the saturation indexes in HMC was lower than pure-Ca carbonates of
about 0.2. Moreover, the tendency of the waters to dissolve limestone is locally enhanced in
1 2 3 4 5 6 7 8 9 10 11 12 13 14 15 16 17 18 19 20 21 22 23 24 25 26 27 28 29 30 31 32 33 34 35 36 37 38 39 40 41 42 43 44 45 46 47 48 49 50 51 52 53 54 55 56 57 58 59 60 61 62 63 64 65

18
organic-rich waters by sulfate reduction, contributing to the subsequent increase in the generation of
the karst structures and the intrusion of seawater into the groundwater. This combined effect of Ca-
increase and sulfate-reduction may be misinterpreted in the Piper plot as cation exchange with
clays. Unexpectedly, Ca-bicarbonate and the opposite transitional Na-bicarbonate, representing
groundwater freshening, were detected also in the almost open-ocean conditions, respectively in the
south-westernmost Cabo San Antonio and Maria La Gorda promontories. These waters may be
easily explained as a lens of freshwaters floating on a deeper salty layer, enhanced by flow
inversion from sea tide effects and/or consistent with the upward freshwater flow during the
formation of the saline wedge. However, the lower isotope composition indicated that these waters
may come from the deep Jurassic aquifer, which is mainly recharged during the rainy period
(summer) occurring in the highest reliefs of Cordillera de Guaniguanico. This hypothesis agrees
with the extensive presence of freshwater discharge from submarine springs discovered along the
coast by other authors.
Acknowledgements
We would like to thank the two anonymous reviewers for their suggestions and comments.
Table and Figure’s captions
Figure 1 – Geologic maps of Cuba. (A): allochtonous terrane of Western Cuba and belts subdivision
of the Cordillera de Guaniguanico (modified from Pardo, 2009). (B): distribution of the sampling
sites in the Guanahacabibes Peninsula. For the sake of simplicity and considering the lithological
similarity between Vedado, Jaimanitas and Cayo Piedra, only the Guane and Vedado formations are
represented. Symbols represent the chemical classification. See text and Fig. 2 for details.
Figure 2 – Piper’s diagrams where waters sampled in the Guanahacabibes Peninsula are plotted
using major chemical composition (mg/l). The chemical classification of the waters (symbols in
legend) was obtained by using the sample chemical concentration in meq/l. Arrows depicts the
paths due to some processes (Appelo and Postma 2007). The transitional compositions Ca-chloride
and Na-bicarbonate, which represent the switch from Ca-bicarbonate to Na-chloride, is highlighted
by the dashed area. Well #18, #33 and Pacheco explored at certain depths are showed in B, C and
D, respectively (numbers: sampling depth in meters respect to the mean sea level).
Figure 3 – Bromide vs. chloride (in meq/l) diagram. Symbols and dashed area as in Fig. 2.
1 2 3 4 5 6 7 8 9 10 11 12 13 14 15 16 17 18 19 20 21 22 23 24 25 26 27 28 29 30 31 32 33 34 35 36 37 38 39 40 41 42 43 44 45 46 47 48 49 50 51 52 53 54 55 56 57 58 59 60 61 62 63 64 65

19
Figure 4 – Sampling depth (in meters with respect to the mean sea level) vs. seawater fraction f
diagram (see text for details on f calculation). Wells explored at certain depths are plotted.
Figure 5 – Binary diagrams plotting calcium (A), sodium (B), magnesium (C) and potassium (D)
vs. chloride concentration (all in meq/l). Symbols and dashed area as in Fig. 2. Main concentration
in the rainwater samples (Western Cuba, WC, Molerio León, 1992, 2012; Eastern Cuba, EC,
Rodríguez et al., 2004; Central America, CA, Cerón et al., 2005), Cuyaguateje River (light gray
area, Fagundo et al., 1986) and Sierra de Los Organos (dark gray area, Fagundo et al., 1987) are
also showed for comparison. Binary mixing between local seawater and CA-rain or Cuyaguateje
River are represented by dashed lines.
Figure 6 – Binary diagrams plotting sulfate vs. chloride (A) and calcium vs. bicarbonate (B)
concentration (all in meq/l). In (A), symbols as in Fig. 5; moreover, depth sampling in #33 well is
highlighted (numbers: sampling depth in meters respect to the mean sea level). In (B), dashed lines
groups samples from the same sampling site. Moreover, calcite and dolomite dissolution (dashed-
dotted lines) and seawater mixing following bicarbonate loss after reduction or acidification and
CO2-degassing (bold curve with arrow) are shown.
Figure 7 – Mixing modeling results in terms of saturation index of calcite (A) and aragonite (B).
Results were obtained using different software and thermodynamic databases (see text for details).
The physico-chemical composition of the end-members come from this study: Cueva Roncali for
Ca-bicarbonate freshwater (FW) and local mean seawater (SW). The most of the models produced
similar results (dark grey area with SI < 0.2) when only major composition of the end-member was
used in the calculations but Truesdell-Jones with phreeqc.dat. Differently, other models shifted
from this “coherence area” when other minor ions (e.g. ammonia), that influenced pH-Eh during the
forced charge balance, were considered (dotted-dashed lines).
Figure 8 – Results of the freshwater-seawater mixing modeling at the Peninsula of Guanahacabibes
in terms of saturation index (SI) of pure calcite (dark gray), pure aragonite (light gray), inorganic
Mg-calcite (bricked wall field), biogenic Mg-calcite (squamose field). The continuous curve
represents a MgCO3-CaCO3 ideal solid solution as foreseen by EQ3/6 and B-dot activity coefficient
calculation. Only calculation models with similar and coherent results were used (dark gray areas in
Fig. 7). Globally comparable SIs were obtained between pure-calcite and inorganic HMC and
1 2 3 4 5 6 7 8 9 10 11 12 13 14 15 16 17 18 19 20 21 22 23 24 25 26 27 28 29 30 31 32 33 34 35 36 37 38 39 40 41 42 43 44 45 46 47 48 49 50 51 52 53 54 55 56 57 58 59 60 61 62 63 64 65

20
between pure aragonite and biogenic HMC, therefore the SI of the pure Ca-phases of the waters
sampled at Peninsula of Guanahacabibes are shown (closed symbols = pure calcite; open symbols =
pure aragonite; symbols shape as in Fig. 2; see also Fig. 9). However, at SW < 0.1, the SIHMCs are
approximatively 0.15 lower than SI of the pure-Ca carbonates. In (B), the median saturation index
for calcite and the median absolute deviation (error bars) in the waters from Sierra de Los Organos
(LO, Fagundo et al., 1987) and Cuyaguateje River (CB, Fagundo et al., 1986) are shown for
comparison.
Figure 9 - Comparison between for synthetic high-magnesium calcite vs. pure calcite (A) and
organic high-magnesium calcite vs. pure aragonite (B) saturation indexes of the waters sampled at
Peninsula of Guanahacabibes (data in the electronic annex). The best-fit equations of the samples
(bold) and 1:1 lines (dashed) are also shown.
Figure 10 – (A) hydrogen (2H) vs. oxygen (
18O) water stable isotope composition, both values in
‰ vs. V-SMOW. GMWL = global meteoric water line (Rozanski et al. 1993); LMWL = local
meteoric water line (this study); CMWL = cuban meteoric water line (Molerio León 1992; Molerio
León 2012). Mixing and evaporation effect are also showed (dashed-dotted and dotted lines), with
slope explicated for these latter (S). Symbols as in Fig. 2, except for waters from kart’s caves
(gray). Evaporated (esw) and non-evaporated seawater (nesw) are highlighted. (B) Chloride (mg/l)
vs. hydrogen (2H) vs. oxygen (
18O) isotope composition. Symbols as in (A). (C) Altitude (meters
a.s.l.) vs. oxygen isotope composition (18
O). In spite of the exponential trend of GNIP’s station
data and neighboring karst springs, we obtained a recharge area coherent with the local reliefs using
the linear elevation-18
O gradient as calculated in this work.
References
Agegian CR, Mackenzie FT (1989) Calcareous organisms and sediment mineralogy on a mid-depth
bank in the Hawaiian Archipelago Pacific Science 43:55–66
Appelo CAJ, Postma D (2007) Geochemistry, groundwater and pollution. 2nd edn. A.A. Balkema,
The Netherlands
Arellano DM, Feitoó R, Seller KP, Stickler W, Rauert W (1989) Estudio isotópico de la llanura
costera sur, provincia Pinar del Río, Cuba. In: Isotope Hydrology Investigations in Latin
America, IAEA-TECDOC-502. Vienna, Austria, pp 229-243
1 2 3 4 5 6 7 8 9 10 11 12 13 14 15 16 17 18 19 20 21 22 23 24 25 26 27 28 29 30 31 32 33 34 35 36 37 38 39 40 41 42 43 44 45 46 47 48 49 50 51 52 53 54 55 56 57 58 59 60 61 62 63 64 65
21
Arellano M, Molerio León LF, Suri Hijos A Efecto de altitud del 18
O en zona de articulación de
llanura cripto-karsitica con carso de montaña. In: Llanos HJ, Antiguedad I, Morell I, Eraso
A (eds) I Taller Internacional sobre Cuencas Experimentales en el Karst, Matanzas, Cuba,
1992. Grupo de Trabajo Internacional Cuencas Experimentales Karsticas, Universitat Jaume
I de Castelló, pp 29-42
Back W (1966) Hydrochemical facies and ground-water flow patterns in northern part of the
Atlantic Coastal Plain. U.S. Geological Survey Professional Paper 498-A.
Back W, Hanshaw BB, Herman JS, Van Oriel JN (1986) Differential dissolution of a Pleistocene
reef in the ground-water m1xing zone of coastal Yucatan, Mexico Geology 14:137-140
Bethke CM (2008) Geochemical and Biogeochemical Reaction Modeling. Cambridge University
Press, New York
Bethke CM, Yeakel S (2008) The Geochemist’s Workbench Release 7.0 - Essentials Guide.
Hydrogeology Program, University of Illinois, Urbana, Illinois
Boschetti T, Venturelli G, Toscani L, Barbieri M, Mucchino C (2005) The Bagni di Lucca thermal
waters (Tuscany, Italy): an example of Ca-SO4 waters with high Na/Cl and low Ca/SO4
ratios. Journal of Hydrology 307:270-293
Budd DA, Vacher HL (2004) Matrix permeability of the confined Floridan Aquifer, Florida, USA
Hydrogeology Journal 12:531-549
Cabrera Bermúdez J, Guardado Lacaba R, Peláez García R, González Cabrera N (2004)
Regionalizacion hidrogeologica de la Provincia de Pinar del Rio er un SIG Minería y
Geología 1-2:24-31
Cabrera M, Peñalver LL (2001) Contribución a la estratigrafía de los depósitos cuaternarios de
Cuba Cuaternario y geomorfología 15:37-49
CASS (2003) Phase I Report - Technical Appendix A: Salinity and Total Dissolved Solids. United
States Department of Interior - Burea of Reclamation, Central Arizona Salinity Study,
Lower Colorado Region, Phoenix Area Office
Cerón RM, Cerón JV, Córdova AV, Zavala J, Muriel M (2005) Chemical composition of
precipitation at coastal and marine sampling sites in Mexico Global NEST Journal 7:212-
221
1 2 3 4 5 6 7 8 9 10 11 12 13 14 15 16 17 18 19 20 21 22 23 24 25 26 27 28 29 30 31 32 33 34 35 36 37 38 39 40 41 42 43 44 45 46 47 48 49 50 51 52 53 54 55 56 57 58 59 60 61 62 63 64 65

22
Choquette PW, Pray LC (1970) Geologic nomenclature and classification of porosity in
sedimentary carbonates American Association of Petroleum Geologists Bulletin 54:207-250
Cooke RC, Kepkay PE (1984) Apparent calcite supersaturation at the ocean surface: Why the
present solubility product of pure calcite in seawater does not predict the correct solubility
of the salt in nature Marine Chemistry 15:59–69
Corbella M, Ayora C (2003) Role of fluid mixing in deep dissolution of carbonates Geologica Acta
4:305-313
Custodio E (1987) Hydrogeochemistry and tracers. In: Custodio E (ed) Ground-water problems in
coastal areas. Studies and reports in hydrology no. 45. UNESCO, Belgium, pp 213-269
Denis R, Díaz Guanche C (1993) Características geologicas y geomorfologicas de la Península
Guanahacabibes. Dirección Provincial de Planificación Física, Pinar del Río. Dirección
Provincial de Planificación Física, Pinar del Río, Cuba
Díaz Guanche C, Aldana Vilas C, Farfán González H (2013) Mapping Groundwater Vulnerability
in Guanahacabibes National Park, Western of Cuba. In: Farfán González H, Corvea Porras
JL, de Bustamante Gutiérrez I, LaMoreaux JW (eds) Management of Water Resources in
Protected Areas. Springer-Verlag, Berlin Heidelberg, pp 87-94
Eaton AD, Clesceri LS, Greenberg AE (1995) Standard Methods for the Examination of Water and
Wastewater - 19th
Edition. American Public Health Association-American Water Works
Association-Water Environment Federation (APHA-AWWA-WEF), Washington DC.
(USA)
Emerson S, Hedges J (2003) Sediment Diagenesis and Benthic Flux. In: Elderfield H, Holland HD,
Turekian KK (eds) The Oceans And Marine Geochemistry - Treatise on Geochemistry.
Elsevier, pp 293-319
Epstein S, Mayeda T (1953) Variations of 18
O/16
O ratio in natural waters Geochimica et
Cosmochimica Acta 4:213–224
Fagundo Castillo JR, González Hernandez P (1999) Agricultural use and water quality at karstic
Cuban western plain International Journal of Speleology 28:175-185
1 2 3 4 5 6 7 8 9 10 11 12 13 14 15 16 17 18 19 20 21 22 23 24 25 26 27 28 29 30 31 32 33 34 35 36 37 38 39 40 41 42 43 44 45 46 47 48 49 50 51 52 53 54 55 56 57 58 59 60 61 62 63 64 65

23
Fagundo JR, Valdés JJ, Pajon JM, de la Cruz A (1986) Caracterizacion geoquimica y
geomatematica de formaciones geologicas y sedimentos de la cuenca del rio cuyaguateje.
Relacion las caracteristicas hidroquimicas de los acuiferos Voluntad hidráulica 23:43-48
Florea LJ, McGee DK (2010) Stable isotopic and geochemical variability within shallow
groundwater beneath a hardwood hammock and surface water in an adjoining slough
(Everglades National Park, Florida, USA) Isotopes in Environmental and Health Studies
46:190–209
Florea LJ, Vacher HL (2006) Morphologic Features of Conduits and Aquifer Response in the
Unconfined Floridian aquifer system, West Central Florida. Paper presented at the
Proceedings of the 12th
Symposium on the Geology of the Bahamas and Other Carbonate
Regions, Gerace Research Center, San Salvador,Bahamas,
Garrels R, Wollast R (1978) Equilibrium criteria for two-component solids reacting with fixed
composition in an aqueous phase - example: the magnesian calcite, discussion American
Journal of Science 278:1469–1474
Gat JR (2010) Isotope Hydrology: A Study of the Water Cycle vol 6. Series On Environmental
Science And Management. Imperial College Press, London
Glynn PD, Reardon EJ (1990) Solid-solution aqueous-solution equilibria: thermodynamic theory
and representation American Journal of Science 290:164-201
Gonfiantini R (1986) Environmental Isotopes in Lake Studies. In: Fritz P, Fontes J-C (eds)
Handbook of Environmental Isotopes Geochemistry, vol 2. Elsevier, Amsterdam, pp 113–
168
Gonfiantini R, Araguas LA (1988) Los Isotopes Ambientales En El Estudio De La Intrusion Marina
Paper presented at the Tecnología de la Intrusión en Acuíferos Costeros, Almuñécar,
Granada, España,
Hernández R, Ramírez R, López-Portilla M, González P, Antigüedad I, Díaz S (2013) Seawater
Intrusion in the Coastal Aquifer of Guanahacabibes, Pinar del Río, Cuba. In: Farfán
González H, Corvea Porras JL, de Bustamante Gutiérrez I, LaMoreaux JW (eds)
Management of Water Resources in Protected Areas. Springer-Verlag, Berlin Heidelberg,
pp 301-308
1 2 3 4 5 6 7 8 9 10 11 12 13 14 15 16 17 18 19 20 21 22 23 24 25 26 27 28 29 30 31 32 33 34 35 36 37 38 39 40 41 42 43 44 45 46 47 48 49 50 51 52 53 54 55 56 57 58 59 60 61 62 63 64 65

24
Iturralde-Vinent MA, Gutiérrez Domech MR (1999) Some examples of karst development in Cuba
Boletín Informativo de la Comisión de Geoespeleología 14:1-4
Jones BF, Vengosh A, Rosenthal E, Yechieli Y (1999) Geochemical Investigations. In: Bear J,
Cheng AHD, Sorek S, Ouazar D (eds) Seawater Intrusion in Coastal Aquifers - Concepts,
Methods and Practices. Theory and Applications of Transport in Porous Media. pp 51-71
Langmuir D (1997) Aqueous Environmental Geochemistry. Prentice Hall, Upper Saddle River,
New Jersey
Lin CY, Musta B, Abdullah MH (2013) Geochemical processes, evidence and thermodynamic
behavior of dissolved and precipitated carbonate minerals in a modern
seawater/freshwatermixing zone of a small tropical island Applied Geochemistry 29:13–31
Liu CW, Chen JF (1996) The simulation of geochemical reactions in the Heng-Chun limestone
formation, Taiwan Applied Mathematical Modelling 20:549-558
Mackenzie FT, Ver LM (2010) Land-Sea Global Transfers. In: Steele JHT, S.A.; Turekian, K.K.
(ed) Marine Chemistry & Geochemistry. pp 485-494
Matisoff G, Bricker III OP, Holdren Jr. GR, Kaerk P (1975) Spatial and Temporal Variations in the
Interstitial Water Chemistry of Chesapeake Bay Sediments. In: Church TM (ed) Marine
Chemistry in the Coastal Environment. vol ACS Symposium Series 18. American Chemical
Society, Washington D.C., pp 343–363
Molerio León L, Parise M (2009) Managing environmental problems in Cuban karstic aquifers
Environmental Geology 58:275–283
Molerio León LF (1992) Composición Química e Isotópica de las Aguas de LLuvia de Cuba. Paper
presented at the II Congreso Espeleológico de Latinoamérica y el Caribe, Viñales, Pinar del
Río, Cuba,
Molerio León LF (2012) Hidrología de trazadores en la gestión ambiental de yacimentos de
petróleo onshore Mapping 154:46-76
Morse JW, Mackenzie FT (1990) Geochemistry of Sedimentary Carbonates - Developments in
Sedimentalogy 48. Elsevier, The Netherlands
Pardo (2009) Overview. In: The geology of Cuba. AAPG Studies in Geology Series 58. pp 1–47
1 2 3 4 5 6 7 8 9 10 11 12 13 14 15 16 17 18 19 20 21 22 23 24 25 26 27 28 29 30 31 32 33 34 35 36 37 38 39 40 41 42 43 44 45 46 47 48 49 50 51 52 53 54 55 56 57 58 59 60 61 62 63 64 65

25
Parkhurst DL, Appelo CAJ (2013) Description of Input and Examples for PHREEQC Version 3 - A
Computer Program for Speciation, Batch-Reaction, One-Dimensional Transport, and
Inverse Geochemical Calculations. In: U.S. Geological Survey Techniques and Methods,
book 6, chap. A43. http://pubs.usgs.gov/tm/06/a43/, p 497
Peláez García R, González Cabrera NA (2013) Underground Water of Deep Circulation in the
National Park Guanahacabibes, Pinar del Rio Province, Cuba: Another Alternative with
Water Supply Aims. In: Farfán González H, Corvea Porras JL, de Bustamante Gutiérrez I,
LaMoreaux JW (eds) Management of Water Resources in Protected Areas. Springer-Verlag,
Berlin Heidelberg, pp 179-186
Peralta Vital JL, Gil Castillo R, Leyva Bombuse D, Moleiro León L, Pin M (2005) Uso de técnicas
nucleares en la evaluación de la cuenca Almendares-Vento para la gestión sostenible de sus
recursos hídricos. Forum de Ciencia y Técnica - www.forumcyt.cu,
Pérez M, Pubillones León María A (1988) Características microbiológicas de una laguna que ocupa
una dolina cársica, Laguna del Valle de San Juan, provincia de Pinar del Río. Paper
presented at the Taller Internacional sobre Hidrología del Carso en la Región del Caribe, La
Habana, 4-12 december 1988,
Perry CT, Salter MA, Harborne AR, Crowley SF, Jelks HL, Wilson RW (2011) Fish as major
carbonate mud producers and missing components of the tropical carbonate factory PNAS
10:3865–3869
Price RM, Herman JS (1991) Geochemical investigation of salt-water intrusion into a coastal
carbonate aquifer: Mallorca, Spain Geological Society of America Bulletin 103:1270-1279
Richter BC, Kreitler CW (1993) Geochemical Techniques for Identifying Sources of Ground-Water
Salinization. CRC Press,
Robinove CJ, Langford RH, Brookhart JW (1958) Saline-water resources of North Dakota. U.S.
Geological Survey,
Rodríguez R, Bejarano C, Riverón B, Carmenate JA (2004) Composición química de las
precipitaciones, deposición de sales y evaluación de la recarga en la región oriental de Cuba
Boletín Geológico y Minero 115:341-356
1 2 3 4 5 6 7 8 9 10 11 12 13 14 15 16 17 18 19 20 21 22 23 24 25 26 27 28 29 30 31 32 33 34 35 36 37 38 39 40 41 42 43 44 45 46 47 48 49 50 51 52 53 54 55 56 57 58 59 60 61 62 63 64 65
26
Rozanski K, Araguás-Araguás L (1995) Spatial and temporal variability of stable isotope
composition of precipitation over the south american continent Bulletin de l'Institut francais
d'études Andins 24:379-390
Rozanski K, Araguás-Araguás L, Gonfiantini R (1993) Isotopic patterns in modern global
precipitation. In: Swart PK, Lohmann KC, Mckenzie J, Savin S (eds) Climate Change in
Continental Isotopic Records. vol Geophysical Monograph 78. American Geophysical
Union, Washington, D.C.,
Runnells DD (1969) Diagenesis, chemical sediments, and the mixing of natural waters Journal of
Sedimentary Petrology 39:1188-1201
Sáinz ÁM, Molinero JJ, Saaltink MW (2010) Numerical Modelling of Coastal Aquifer Karst
Processes by Means of Coupled Simulations of Density-Driven Flow and Reactive Solute
Transport Phenomena. In: Andreo B, Carrasco F, Durán JJ, LaMoreaux JW (eds) Advances
in Research in Karst Media. vol Environmental Earth Sciences. pp 237-242
Sanford WE, Konikow LF (1989) Simulation of Calcite Dissolution and Porosity Changes in
Saltwater Mixing Zones in Coastal Aquifers Water Resources Research 25:655-667
Seale LD, Soto LR, Florea LJ, Fratesi B Karst of Western Cuba: Observations, Geomorphology,
and Diagenesis. In: Davis RL, Gamble DW (eds) Proceedings of the 12th
Symposium on the
Geology of the Bahamas and other Carbonate Terrains, Gerace Research Center, San
Salvador,Bahamas, 2004. pp 1-9
Stoessel RK (1992) Effects of sulfate reduction on CaCO3 dissolution and precipitation in mixing-
zone fluids Journal of Sedimentary Petrology 62:873-880
Stoessell RK, Ward WC, Ford BH, Schuffert JD (1989) Water chemistry and CaCO3 dissolution in
the saline part of an open-flow mixing zone, coastal Yucatan Peninsula, Mexico Geological
Society of America Bulletin 101:159-169
WHO (2011) Guidelines for Drinking-water Quality - 4th
ed. World Health Organisation,
Gutenberg, Malta
Wolery TW, Jarek RL (2003) EQ3/6, version 8.0 - software user’s manual. Civilian radioactive
waste management system, Management & Operating Contractor, Sandia National
Laboratories, Albuquerque, New Mexico
1 2 3 4 5 6 7 8 9 10 11 12 13 14 15 16 17 18 19 20 21 22 23 24 25 26 27 28 29 30 31 32 33 34 35 36 37 38 39 40 41 42 43 44 45 46 47 48 49 50 51 52 53 54 55 56 57 58 59 60 61 62 63 64 65

27
Xinping Z, Lide T, Jingmiao L (2005) Fractionation mechanism of stable isotope in evaporating
water body Journal of Geographical Sciences 15:375-384
Zeebe RE, Wolf-Gladrow D (2001) CO2 in Seawater: Equilibrium, Kinetics, Isotopes vol 65. vol
Elsevier Oceanography Series 65. Elsevier Science B.V., Amsterdam, The Netherlands
1 2 3 4 5 6 7 8 9 10 11 12 13 14 15 16 17 18 19 20 21 22 23 24 25 26 27 28 29 30 31 32 33 34 35 36 37 38 39 40 41 42 43 44 45 46 47 48 49 50 51 52 53 54 55 56 57 58 59 60 61 62 63 64 65

N
Mexico
FloridaBahamas
HaitiJamaica
Cuba
Pinar Fault
Domingo Fault
Frontal Thrust
Cuyaguateje Basin
Pinar del Rio
Artemisa
Guajabon - Sierra Azul belt
post-Middle Eocene cover
igneous-volcanic units
La Esperanza belt
north Rosario belt
south Rosario belt
Sierra de Los Organo belt - Mogotes
Sierra de Los Organo belt - Pizarras del Sur
Cangre belt
0 1 2
km
183360
slc sml
cavi
LR1
ng
moq
29
laLos Remates
slru
ro
w179
me
fr cr
cj
mlgmlg1
cl
179
66 63
p 3
sbc
carbonatic formations(Vedado, Jaimanitas, Cayo Piedra)
silicoclastic formations(Guane)
alluvial deposit
biogenic orundifferentiated
river
lake, swamp, lagoon
sampling spots
Guane
Sandino
MariaLa Gorda
CaboSan Antonio
BahiaCortes
BahiaGuadiana
Caribbean Sea
Gulf of Mexico
Havana
provincialboundary
0 25 50
km
rc
LP
sbg
ma
cq LR2
A
B
Ca-bicarbonate
Na-bicarbonate
Ca-chloride
Na-chloride
Figure01

C
DB
0.2
-11-15.8
-4.7
-29.7
-24.7
-24.7-19.7
-19.5 -22.7
-39.7
-9.7
cAlk
(as
HC
O3
-
freshening
(Na from soil)
)
seawater
freshwater
29
mlg1
crlp
rc
Q
3
60N
LR1
2+
Ca
2+
Mg
+
-C
l
+
Na+K
SO
4
2- +
intrusion
(Ca from soil)
A
5.7
-7.9
-6.3
-7.3
-10.2
Ca-bicarbonate
Ca-chloride
Na-bicarbonate
Na-chloride
well #18
well #33
pacheco well
mixing?
SO4
reduction
CaCO3
deposition
CaCO3
solution
Figure02-revised

Figure03

Figure04

Figure05

Figure06

Figure07

Figure08

Figure09
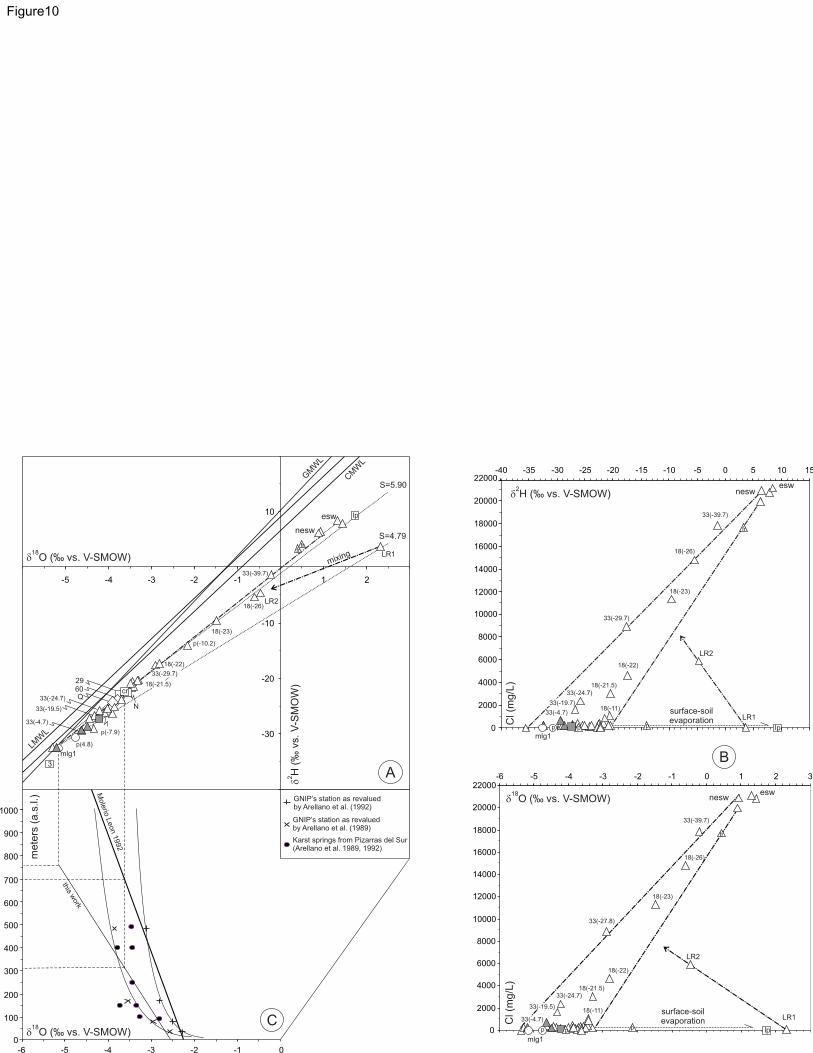
Figure10

Electronic Annex 1 - chemical and isotope dataClick here to download Supplementary Material: ElectronicAnnex01.xlsx

Electronic Annex 2 - calculation resultsClick here to download Supplementary Material: ElectronicAnnex02.xls
![genetic variation of norway spruce (picea abies [l.] karst ...](https://static.fdokumen.com/doc/165x107/633d6582b988f9753c06267d/genetic-variation-of-norway-spruce-picea-abies-l-karst-.jpg)