Seasonal variations in metal content of two Unio pictorum mancus (Mollusca, Unionidae) populations...
13
J. Limnol., 66(1): 15-27, 2007 Seasonal variations in population dynamics and biomass of two Unio pictorum mancus (Mollusca, Unionidae) populations from two lakes of different trophic state Oscar RAVERA*, Anita FREDIANI and Nicoletta RICCARDI CNR - Institute of Ecosystem Study, Largo Tonolli 50, I – 28922 Verbania Pallanza, Italy *e-mail corresponding author: [email protected] ABSTRACT Samples of Unio pictorum mancus collected monthly from spring 2003 to summer 2004 in the meso-oligotrophic Lake Maggiore and the eutrophic Lake Candia were compared to evaluate the influence of lake trophic conditions on mussel populations. Shell form, maximum age (8 years) and percentage of organic matter in the shell and soft tissues were similar in both lakes. However, comparisons between same size classes revealed that mussels from Lake Maggiore were generally older, their shells heavier and their soft tissues lighter than those from Lake Candia. Recruitment occurred in both populations in June-July. The frequency distributions of adult mussels (>30 mm) and their soft tissues and shell biomasses in all size classes (range = 2 mm) were normal, but the curves of the mussels from Lake Candia were flat in comparison to those of mussels from Lake Maggiore. The median body size of Lake Maggiore mussels was 58 mm, while that of the Lake Candia population was 72 mm. During the study period the population density of each lake was fairly constant, whereas the population structure, and consequently the biomass, showed seasonal variations. The greatest differences were found between population density and shell and tissue biomass of the two populations, which were respectively 46.86 ind. m -2 ; 408 g d.w. m -2 and 38.67 g d.w. m -2 in Lake Maggiore, and 6.93 ind. m -2 ; 92.29 g d.w. m -2 and 14.04 g d.w. m -2 in Lake Candia. These values testify to the phenotypical plasticity of Unio pictorum mancus in relation to environmental characteristics, without excluding a possible genetic influence as a result of geographical isolation and the respective selection mechanisms. The influence exerted by the lake trophic level and by the physical environment on some population characteristics is discussed. Key words: freshwater bivalve, eutrophication, population density and structure, shell and soft tissues biomasses 1. INTRODUCTION Much more information is available on the popula- tion ecology of commercial marine bivalves than on freshwater mussel populations, mainly because the latter are exploited to any great extent only in very restricted areas and for relatively limited periods. As an example, until the middle of the XX century freshwater mussels were exploited principally to produce nacre buttons, for natural pearls and to feed poultry (Tudorancea 1972; Bowen et al. 1994). Mussel populations accordingly declined in areas where these were important activities. Nowadays, the decline of many species is the conse- quence of eutrophication (Patzner & Müller 2001), toxic pollution, running water regulation and the increasing frequency and extent of invasions by allochthonous bivalve species (e.g., Dreissena polymorpha). For instance, following invasion by Dreissena, more than 70% of North American bivalve species are declining, or are already extinct (Bauer & Wachtler 2001); this has caused changes in the benthic communities, with related effects on the diet and growth of fish (McNickle et al. 2006). Studies on freshwater bivalves have been increasing steadily since the 1960s, when they began to be used as indicators of radioactive and stable pollutants in the environment (Gaglione & Ravera 1964; Bedford et al. 1968; Manly & George 1977; Millington & Walker 1983; Storey & Edward 1989). In addition, various environmental warning systems using valve movement of some freshwater mussels have been adopted (Eng- land & Heino 1994; Ham & Peterson 1994; Borcherding 2006). During the last decades, in addition to researches on freshwater mussels as pollutant concentrators, stud- ies on populations in the field have yielded a large amount of information; for example, density, biomass, and age distribution were considered in relation to mus- sel size and production rate. Negus (1966) provided the first quantitative data on growth rate and production of unionids, while Magnin & Stanczykowska (1971) were the first to quantify freshwater mussel production in Canadian lakes. Mussel soft tissues may be utilized as food by vari- ous predators, and after the mussel's death its tissues are degraded in about two weeks (Lomstein et al. 2006). In addition, the considerable amount of calcium carbonate hitherto immobilized in the shell can be returned to the environment. Mussels mineralize a great amount of organic matter through their high respiration rate, and take up suspended particles by their filtration activity (Hily 1991), while the indigestible fraction is released in the form of pellets which modify the structure of the
Transcript of Seasonal variations in metal content of two Unio pictorum mancus (Mollusca, Unionidae) populations...
J. Limnol., 66(1): 15-27, 2007
Seasonal variations in population dynamics and biomass of two Unio pictorum mancus (Mollusca, Unionidae) populations from two lakes of different trophic state
Oscar RAVERA*, Anita FREDIANI and Nicoletta RICCARDI
CNR - Institute of Ecosystem Study, Largo Tonolli 50, I – 28922 Verbania Pallanza, Italy *e-mail corresponding author: [email protected]
ABSTRACT Samples of Unio pictorum mancus collected monthly from spring 2003 to summer 2004 in the meso-oligotrophic Lake Maggiore
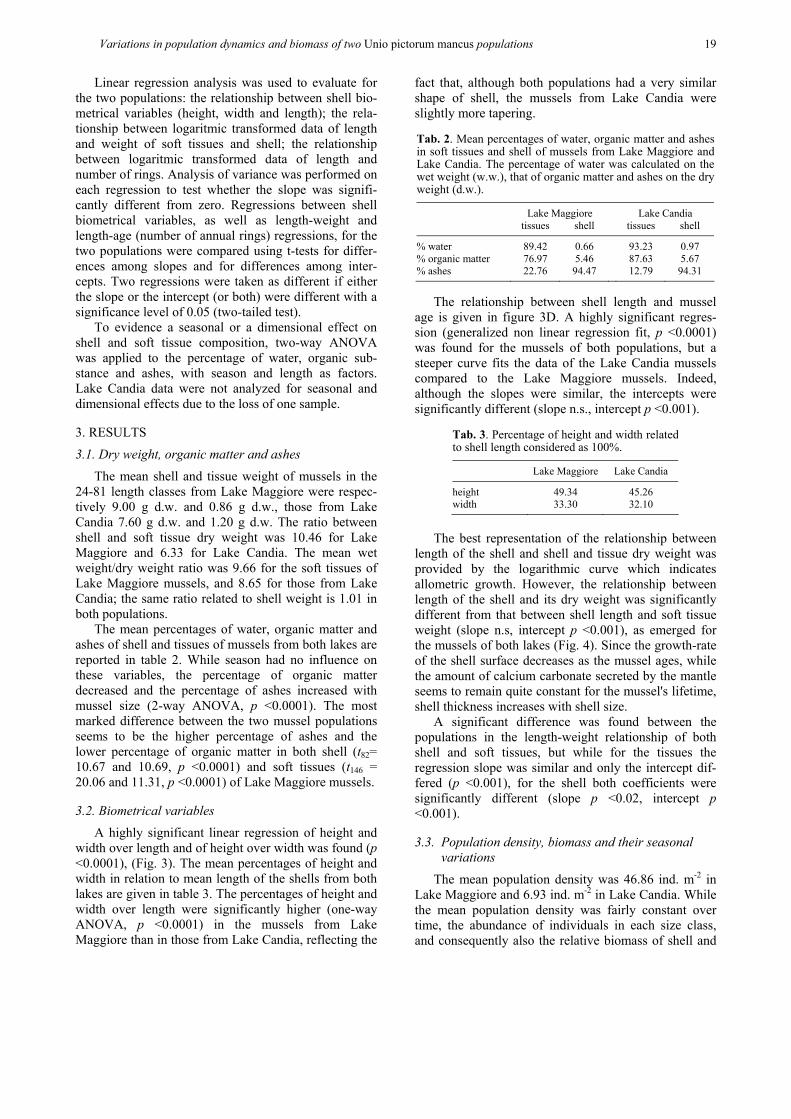
and the eutrophic Lake Candia were compared to evaluate the influence of lake trophic conditions on mussel populations. Shell form, maximum age (8 years) and percentage of organic matter in the shell and soft tissues were similar in both lakes. However, comparisons between same size classes revealed that mussels from Lake Maggiore were generally older, their shells heavier and their soft tissues lighter than those from Lake Candia. Recruitment occurred in both populations in June-July. The frequency distributions of adult mussels (>30 mm) and their soft tissues and shell biomasses in all size classes (range = 2 mm) were normal, but the curves of the mussels from Lake Candia were flat in comparison to those of mussels from Lake Maggiore. The median body size of Lake Maggiore mussels was 58 mm, while that of the Lake Candia population was 72 mm. During the study period the population density of each lake was fairly constant, whereas the population structure, and consequently the biomass, showed seasonal variations. The greatest differences were found between population density and shell and tissue biomass of the two populations, which were respectively 46.86 ind. m-2; 408 g d.w. m-2 and 38.67 g d.w. m-2 in Lake Maggiore, and 6.93 ind. m-2; 92.29 g d.w. m-2 and 14.04 g d.w. m-2 in Lake Candia. These values testify to the phenotypical plasticity of Unio pictorum mancus in relation to environmental characteristics, without excluding a possible genetic influence as a result of geographical isolation and the respective selection mechanisms. The influence exerted by the lake trophic level and by the physical environment on some population characteristics is discussed. Key words: freshwater bivalve, eutrophication, population density and structure, shell and soft tissues biomasses
1. INTRODUCTION Much more information is available on the popula-
tion ecology of commercial marine bivalves than on freshwater mussel populations, mainly because the latter are exploited to any great extent only in very restricted areas and for relatively limited periods. As an example, until the middle of the XX century freshwater mussels were exploited principally to produce nacre buttons, for natural pearls and to feed poultry (Tudorancea 1972; Bowen et al. 1994). Mussel populations accordingly declined in areas where these were important activities. Nowadays, the decline of many species is the conse-quence of eutrophication (Patzner & Müller 2001), toxic pollution, running water regulation and the increasing frequency and extent of invasions by allochthonous bivalve species (e.g., Dreissena polymorpha). For instance, following invasion by Dreissena, more than 70% of North American bivalve species are declining, or are already extinct (Bauer & Wachtler 2001); this has caused changes in the benthic communities, with related effects on the diet and growth of fish (McNickle et al. 2006).
Studies on freshwater bivalves have been increasing steadily since the 1960s, when they began to be used as indicators of radioactive and stable pollutants in the
environment (Gaglione & Ravera 1964; Bedford et al. 1968; Manly & George 1977; Millington & Walker 1983; Storey & Edward 1989). In addition, various environmental warning systems using valve movement of some freshwater mussels have been adopted (Eng-land & Heino 1994; Ham & Peterson 1994; Borcherding 2006). During the last decades, in addition to researches on freshwater mussels as pollutant concentrators, stud-ies on populations in the field have yielded a large amount of information; for example, density, biomass, and age distribution were considered in relation to mus-sel size and production rate. Negus (1966) provided the first quantitative data on growth rate and production of unionids, while Magnin & Stanczykowska (1971) were the first to quantify freshwater mussel production in Canadian lakes.
Mussel soft tissues may be utilized as food by vari-ous predators, and after the mussel's death its tissues are degraded in about two weeks (Lomstein et al. 2006). In addition, the considerable amount of calcium carbonate hitherto immobilized in the shell can be returned to the environment. Mussels mineralize a great amount of organic matter through their high respiration rate, and take up suspended particles by their filtration activity (Hily 1991), while the indigestible fraction is released in the form of pellets which modify the structure of the

O. Ravera et al. 16
sediment surface (Wotton 2006). In addition, by filtra-tion mussels reduce the seston concentration, and by excretion release ammonia, a useful nutrient for phyto-plankton, into the water. Thus, at high population den-sities, mussels play an important role in the conversion of energy and matter (Welker & Walz 1998; Vaughn & Hakenkamp 2001).
In consideration of the important ecological role of freshwater bivalves, a research project was designed to evaluate the possible influence of lake trophic state on some important biological (e.g., population density, tis-sue and shell biomasses, variations in population struc-ture) and chemical (e.g., capacity to accumulate metals in relation to their concentrations in the water) charac-teristics of mussel populations. To this end, these char-acteristics were measured in two Unio pictorum mancus populations from two Northern Italian lakes: the meso-oligotrophic Lake Maggiore and the eutrophic Lake Candia. The present paper deals with the biological characteristics; the chemical characteristics are reported in another paper (Ravera et al. 2007).
2. MATERIAL AND METHODS
2.1. Study sites
The study was carried out in two Northern Italian lakes (Fig. 1; Tab.1): the deep, meso-oligotrophic Lake Maggiore (latitude N 45°50'19"; longitude E 8°37'17") and the shallow, eutrophic Lake Candia (latitude N 45°19'32"; longitude E 7°54'38"). One sampling station
with the following characteristics was chosen in each lake: similar climate, negligible human impact, moder-ate amount of toxic pollutants, and abundnce of Unio pictorum mancus. Both lakes have already been moni-tored for several decades (e.g., Manca et al. 1992; Gius-sani & Galanti 1995).
Tab. 1. Morphometric parameters of Lake Maggiore (Am-brosetti et al. 1992) and Lake Candia (Giussani & Galanti 1992).
Lake Maggiore Lake Candia
Mean lake level (m a.s.l.) 194 226 Watershed area (km2) 6599 9.9 Lake area (km2) 212.5 1.5 Mean depth (m) 177 3.8 Maximum depth (m) 370 7.7
A sampling station ("Sabbie d'oro") was set up in the
south-eastern part of Lake Maggiore near the village of Brebbia (Province of Varese). The sampling site is a gently sloping bay about 500 m long, with silty-muddy sediments. The submersed macrophyte cover is very limited. On the beach there are some stands of Phrag-mites australis and a few trees (Salix sp.). Water trans-parency is commonly high, except during short periods of phytoplankton blooms. At low water levels, an exten-sive littoral area dries up, causing periodic mass mortal-ity of mussels. The anthropogenic impact is restricted to a few bathers. Besides a very abundant population of Unio pictorum mancus, the bay presents rare specimens
Fig. 1. Sampling stations (white spots) on Lake Maggiore (a) and Lake Candia (b).

Variations in population dynamics and biomass of two Unio pictorum mancus populations 17
of Anodonta cygnea, Viviparus ater and some Pul-monates (Lymnaea ovata and Physa acuta). Dreissena polymorpha, an epibiontic on living Unio, is fairly fre-quent.
The sampling station on Lake Candia (Province of Turin) is located in the south-eastern littoral zone of the lake. The bottom of the station has a gentle slope, with sediments composed of a mixture of mud, stones, silt and sand. Most of the lake shore is covered by caricetum and phragmitetum. In addition to Unio picto-rum mancus, rare specimens of Anodonta cygnea and some Pulmonates (Lymnaea ovata and Physa acuta) are present. The lake is naturally eutrophic, with frequent phytoplankton blooms and episodic hypoxia in the deepest water layers during the summer stratification. The most important water sources are underground springs, precipitation and runoff; in spring-summer the lake receives the surplus water from the Caluso Canal. It receives diffuse nutrient loads from the small drainage area devoted to agriculture.
Seasonal variations in water temperature and level in both lakes are given in figure 2.
2.2. Field and laboratory methods We chose the sub-species Unio pictorum mancus for
our study because of its stronger resistance to eutrophic conditions than other unionid species (e.g., Unio cras-sus). It was identified by its shell morphology and elec-trophoresis of the soft tissues according to Nagel & Badino (2001). Thirteen samplings were performed in Lake Maggiore from May 2003 to September 2004, with an interruption (November-January) due to the high water level of the lake. The same number of sam-plings was performed in Lake Candia between June 2003 and August 2004, except for December 2003 and February 2004 when the lake surface was covered with ice.
Qualitative samples of mussels were collected monthly, at random, visually and tactilely, by hand and hand-net from the littoral zone of both lakes at a maxi-
mum depth of 1 m (Strayer & Smith 2003). To evaluate the seasonal variations in the population size structure, 4048 individuals were taken from Lake Maggiore and 3338 individuals from Lake Candia; the number of mus-sels in the samples taken from the former lake varied between 221 and 389, from the latter lake between 93 to 368. Each individual was returned to its environment after measurement of shell length, using a calliper, to prevent impoverishment of the population.
To allow us to evaluate whether an easily measur-able variable such as shell length was correlated with other mussel characteristics (shell height and width, shell and soft tissue fresh and dry weight), samples were collected seasonally from both lakes (139 individuals from Lake Maggiore and 80 from Lake Candia). The external shell surface of each individual was cleaned by scrubbing off sediment particles and periphyton coating the periostracom with a nylon nailbrush, and by removing the zebra mussels attached to the Lake Maggiore specimens. The cleaned mussels were pre-served in plastic bags placed in an ice-box and brought to the laboratory, where they were kept at –20 °C until the variables listed above were measured. Additionally, the dry weight was measured after shell and soft tissue drying for 24 hours at 105 °C, and the content of ashes was determined after ignition for 6 hours at 450 °C. The annual rings on the external shell surface were counted to determine age (Strayer & Smith 2003).
The population density in both lakes was estimated by seasonally sampling all the mussels present on the sediment (30 replicates) using a frame of 0.5 m × 1.0 m. Another 35 samples were taken with the help of a Peter-sen grab (500 cm2).
Due to the relatively long life-span of the mussels, the order of magnitude of the population density might be expected to be fairly constant over relatively short time periods such as that of this study (16 months). Since this assumption was matched by the similarity of the values obtained by sampling each lake in different seasons, the mean population density calculated for each
05
10152025303540
M J J A S O N D J F M A M J J A S
°C
225
226
227
Lake
Can
dia
192
193
194
195
Lake
Mag
gior
e...
M M MJJ J J J AAFA S O N D
m a.s.l.
S
m a.s.l.
Fig. 2. Water temperature (left panel) and level (right panel) in Lake Maggiore (black circles, solid line) and Lake Candia (emptycircles, dashed line).

O. Ravera et al. 18
lake was regarded as constant for the entire study period and used in the following calculations. To follow the seasonal variations in the population size structure, the density of individuals in each size class (2 mm inter-vals) was calculated for each monthly sampling according to formula (1):
i
ii nNax = (1
where: xi = number of individuals belonging to the Li size class collected at time ti per square meter; ai = number of individuals belonging to the Li size class collected at time ti; ni = total number of individuals col-lected at time ti; N = mean population density (number of individuals m-2 in each lake).
The seasonal variations of soft tissues and shell biomass (dry weight) of each size class were estimated in the same manner.
A curvilinear regression was fitted by least squares to experimental data on the dry weight of soft tissues and shell and on the number of annual rings in relation to shell length. The best fitting of the data was per-formed by comparing the AIC value of the exponential model (y = a expbx) with that of the logarithmic model
(y =axb) where y is respectively soft tissue dry weight, shell dry weight or n° of rings, x is shell length (mm), a is the regression intercept and b the regression coeffi-cient. For each lake two equations were obtained from the experimental data on the dry weight of soft tissues and shell, in relation to shell length (Fig. 3). These equations were applied to estimate the dry weight of shell and soft tissues of the mean individuals of each length class. These values, multiplied by the population density of the corresponding size class, were used to calculate the soft tissue and shell biomass for each class.
Mean shell and soft tissue dry weight of mussels from the two populations were compared by considering only the mussels belonging to the size classes common to both lakes (i.e., the classes from 24-25 mm to 80-81 mm).
2.3. Statistics
The Kolmogorov-Smirnov two-sample test was used to test the differences between the population size dis-tributions in Lake Maggiore and Lake Candia. To iden-tify the differences due to habitat characteristics, and to minimize the seasonal effect, the test was applied to the pooled data of each lake.
A
05
10152025303540
0 10 20 30 40 50 60 70 80 90length (mm)
heig
ht (m
m)
B
0
5
10
15
20
25
30
0 10 20 30 40 50 60 70 80 90length (mm)
wid
th (m
m)
C
0
5
10
15
20
25
30
0 5 10 15 20 25 30 35 40height (mm)
wid
th (m
m)
D
y = - 2.28 x1.58
y = - 2.63 x1.89
0
2
4
6
8
10
0 10 20 30 40 50 60 70 80 90length (mm)
n° ri
ngs
Fig. 3. Relationships between Unio pictorum mancus shell length and height (A), length and width (B), and height and width (C), as well as between shell length and age (D). The full circles and solid lines refer to Lake Maggiore mussels (n = 139), the open circlesand dashed lines to Lake Candia mussels (n = 80).
Variations in population dynamics and biomass of two Unio pictorum mancus populations 19
Linear regression analysis was used to evaluate for the two populations: the relationship between shell bio-metrical variables (height, width and length); the rela-tionship between logaritmic transformed data of length and weight of soft tissues and shell; the relationship between logaritmic transformed data of length and number of rings. Analysis of variance was performed on each regression to test whether the slope was signifi-cantly different from zero. Regressions between shell biometrical variables, as well as length-weight and length-age (number of annual rings) regressions, for the two populations were compared using t-tests for differ-ences among slopes and for differences among inter-cepts. Two regressions were taken as different if either the slope or the intercept (or both) were different with a significance level of 0.05 (two-tailed test).
To evidence a seasonal or a dimensional effect on shell and soft tissue composition, two-way ANOVA was applied to the percentage of water, organic sub-stance and ashes, with season and length as factors. Lake Candia data were not analyzed for seasonal and dimensional effects due to the loss of one sample.
3. RESULTS
3.1. Dry weight, organic matter and ashes
The mean shell and tissue weight of mussels in the 24-81 length classes from Lake Maggiore were respec-tively 9.00 g d.w. and 0.86 g d.w., those from Lake Candia 7.60 g d.w. and 1.20 g d.w. The ratio between shell and soft tissue dry weight was 10.46 for Lake Maggiore and 6.33 for Lake Candia. The mean wet weight/dry weight ratio was 9.66 for the soft tissues of Lake Maggiore mussels, and 8.65 for those from Lake Candia; the same ratio related to shell weight is 1.01 in both populations.
The mean percentages of water, organic matter and ashes of shell and tissues of mussels from both lakes are reported in table 2. While season had no influence on these variables, the percentage of organic matter decreased and the percentage of ashes increased with mussel size (2-way ANOVA, p <0.0001). The most marked difference between the two mussel populations seems to be the higher percentage of ashes and the lower percentage of organic matter in both shell (t82= 10.67 and 10.69, p <0.0001) and soft tissues (t146 = 20.06 and 11.31, p <0.0001) of Lake Maggiore mussels.
3.2. Biometrical variables
A highly significant linear regression of height and width over length and of height over width was found (p <0.0001), (Fig. 3). The mean percentages of height and width in relation to mean length of the shells from both lakes are given in table 3. The percentages of height and width over length were significantly higher (one-way ANOVA, p <0.0001) in the mussels from Lake Maggiore than in those from Lake Candia, reflecting the
fact that, although both populations had a very similar shape of shell, the mussels from Lake Candia were slightly more tapering.
Tab. 2. Mean percentages of water, organic matter and ashes in soft tissues and shell of mussels from Lake Maggiore and Lake Candia. The percentage of water was calculated on the wet weight (w.w.), that of organic matter and ashes on the dry weight (d.w.).
Lake Maggiore Lake Candia tissues shell tissues shell
% water 89.42 0.66 93.23 0.97 % organic matter 76.97 5.46 87.63 5.67 % ashes 22.76 94.47 12.79 94.31
The relationship between shell length and mussel
age is given in figure 3D. A highly significant regres-sion (generalized non linear regression fit, p <0.0001) was found for the mussels of both populations, but a steeper curve fits the data of the Lake Candia mussels compared to the Lake Maggiore mussels. Indeed, although the slopes were similar, the intercepts were significantly different (slope n.s., intercept p <0.001).
Tab. 3. Percentage of height and width related to shell length considered as 100%.
Lake Maggiore Lake Candia
height 49.34 45.26 width 33.30 32.10
The best representation of the relationship between
length of the shell and shell and tissue dry weight was provided by the logarithmic curve which indicates allometric growth. However, the relationship between length of the shell and its dry weight was significantly different from that between shell length and soft tissue weight (slope n.s, intercept p <0.001), as emerged for the mussels of both lakes (Fig. 4). Since the growth-rate of the shell surface decreases as the mussel ages, while the amount of calcium carbonate secreted by the mantle seems to remain quite constant for the mussel's lifetime, shell thickness increases with shell size.
A significant difference was found between the populations in the length-weight relationship of both shell and soft tissues, but while for the tissues the regression slope was similar and only the intercept dif-fered (p <0.001), for the shell both coefficients were significantly different (slope p <0.02, intercept p <0.001).
3.3. Population density, biomass and their seasonal variations
The mean population density was 46.86 ind. m-2 in Lake Maggiore and 6.93 ind. m-2 in Lake Candia. While the mean population density was fairly constant over time, the abundance of individuals in each size class, and consequently also the relative biomass of shell and

O. Ravera et al. 20
soft tissues, varied with the season (Figs 5a and 5b). In the same months, the frequency distribution of the length classes was similar in 2003 and 2004. In Lake Maggiore, the distribution of mussels in the different length classes was generally unimodal and symmetrical, except in July 2003 when abundance of young individu-als caused three peaks of frequency: one of adults and two of young mussels, which accounted for about 40% of the total population (Fig. 5a). During the following months the number of these small specimens progres-sively decreased. Indeed, except for the June-July period, the number of small individuals was never high. In Lake Candia the frequency distribution of mussel length classes was generally multimodal (Fig. 5b) .
On an annual basis, the frequency of both population density and shell and soft tissue biomass shows a nor-mal distribution in both lakes, but the shape is consid-erably more flattened in Lake Candia than in Lake Maggiore (Fig. 6).
The mussels of Lake Candia are larger than those of Lake Maggiore: the shell length of the former ranged from 25 to 101 mm, the mean and median values being respectively 70.4 ± 10.6 mm and 72 mm, that of the latter from 14 to 81 mm, the mean and median values being respectively 55.5 ± 11.3 mm and 58 mm. The middle sized individuals were numerically dominant in both populations, but there was a significant difference between the size distribution of the two populations (Kolmogoroff-Smirnov test, p = 0.001).
In spite of the larger size of Lake Candia mussels, the far higher (about 7 times) population density in Lake Maggiore resulted in a biomass of both shell and soft tissues respectively 4-fold and 3-fold higher than in Lake Candia.
The mean soft tissue and shell biomass of Lake Maggiore mussels were 38.67 g d.w. m-2 and 408 g d.w. m-2, respectively. The corresponding values of the Lake Candia population were 14.04 g d.w. m-2 and 92.29 g d.w. m-2, respectively. The seasonal variations of the soft tissue and shell biomasses in Lake Maggiore and Lake Candia are presented in figure 7.
The coefficient of variation (% CV) calculated for the seasonal variations of shell as well as of tissue bio-mass of U. pictorum mancus from Lake Maggiore (15%) was about twofold higher than that calculated for the Lake Candia population (7%). The pattern of varia-tions over time of the shell biomass was similar to that of the soft tissues in both lakes. In Lake Candia the low-est biomass values were calculated in June-July of both 2003 and 2004. The largest biomass values were found during the cold season, when the large-sized individuals were the dominant component of the population. A similar trend was observed in Lake Maggiore: the low-est biomass values coincided with the occurrence of an abundant number of young mussels in 2003, while a corresponding decrease was not so evident in summer 2004.
4. DISCUSSION
Besides confirming the positive relationship between the size of a mussel and the trophic level of its environ-ment (Ravera et al. 2003), the results of this study high-lighted other important differences between mussel populations which are probably related to the lake tro-phic level. The population from the meso-oligotrophic Lake Maggiore has higher density, biomass, annual recruitment and shell weight to soft tissue weight ratio than those recorded in the population from the eutrophic Lake Candia.
Eight years is the maximum age attained by mussels from both lakes, but the mussels from Lake Candia have a faster growth and higher mean individual size than those from Lake Maggiore. In both populations the fre-quency distribution of mussel size is Gaussian, but the median falls at 58 mm for Lake Maggiore and 72 mm for Lake Candia. During the investigation period, the population density was fairly constant, and seasonal variations in size and biomass structure were noticeable only during the annual recruitment period, and espe-cially in the Lake Maggiore population.
y = - 4.31 x2.97
y = - 5.34 x2.98
0
5
10
15
20
25
0 20 40 60 80length (mm)
wei
ght (
g d.
w.)-
-Lake Maggiore y = - 4.03 x2.79
y = - 5.10 x2.92
0
5
10
15
20
25
30
35
0 20 40 60 80 100length (mm)
wei
ght (
g d.
w.)-
Lake Candia
Fig. 4. Relationships between shell length and shell dry weight (full circles), and between shell length and soft tissue dry weight(open circles) in from Lake Maggiore (n = 139) and Lake Candia (n = 80).

Variations in population dynamics and biomass of two Unio pictorum mancus populations 21
density shell biomass soft tissues biomass
M a y 2 0 0 3
0
2
4
6
8
1 0
1 0 2 0 3 0 4 0 5 0 6 0 7 0 8 0 9 0 1 0 0
May 2003
0
30
60
90
10 20 30 40 50 60 70 80 90 100
May 2003
0
2
4
6
8
10
10 20 30 40 50 60 70 80 90 100
Ju n e 2 0 0 3
0
2
4
6
8
1 0
1 0 2 0 3 0 4 0 5 0 6 0 7 0 8 0 9 0 1 0 0
June 2003
0
30
60
90
10 20 30 40 50 60 70 80 90 100
June 2003
0
2
4
6
8
10
10 20 30 40 50 60 70 80 90 100
J u ly 2 0 0 3
0
2
4
6
8
1 0 2 0 3 0 4 0 5 0 6 0 7 0 8 0 9 0 1 0 0
July 2003
0
30
60
10 20 30 40 50 60 70 80 90 100
July 2003
0
2
4
6
8
10 20 30 40 50 60 70 80 90
A u g u s t 2 0 0 3
0
2
4
6
8
1 0 2 0 3 0 4 0 5 0 6 0 7 0 8 0 9 0 1 0 0
August 2003
0
30
60
10 20 30 40 50 60 70 80 90 100
August 2003
0
2
4
6
8
10 20 30 40 50 60 70 80 90 100
S e p te m b e r 2 0 0 3
0
2
4
6
8
1 0 2 0 3 0 4 0 5 0 6 0 7 0 8 0 9 0 1 0 0
September 2003
0
30
60
10 20 30 40 50 60 70 80 90 100
September 2003
0
2
4
6
8
10 20 30 40 50 60 70 80 90 100
O c to b e r 2 0 0 3
0
2
4
6
8
1 0 2 0 3 0 4 0 5 0 6 0 7 0 8 0 9 0 1 0 0
October 2003
0
30
60
10 20 30 40 50 60 70 80 90 100
October 2003
0
2
4
6
8
10 20 30 40 50 60 70 80 90 100
F e b ru a ry 2 0 0 4
0
2
4
6
8
1 0 2 0 3 0 4 0 5 0 6 0 7 0 8 0 9 0 1 0 0
February 2004
0
30
60
10 20 30 40 50 60 70 80 90 100
February 2004
0
2
4
6
8
10 20 30 40 50 60 70 80 90 100
M a rc h 2 0 0 4
0
2
4
6
8
1 0 2 0 3 0 4 0 5 0 6 0 7 0 8 0 9 0 1 0 0
March 2004
0
30
60
10 20 30 40 50 60 70 80 90 100
March 2004
0
2
4
6
8
10 20 30 40 50 60 70 80 90 100
A p ril 2 0 0 4
0
2
4
6
8
1 0 2 0 3 0 4 0 5 0 6 0 7 0 8 0 9 0 1 0 0
April 2004
0
30
60
10 20 30 40 50 60 70 80 90 100
April 2004
0
2
4
6
8
10 20 30 40 50 60 70 80 90 100
M a y 2 0 0 4
0
2
4
6
8
1 0 2 0 3 0 4 0 5 0 6 0 7 0 8 0 9 0 1 0 0
May 2004
0
30
60
10 20 30 40 50 60 70 80 90 100
May 2004
0
2
4
6
8
10 20 30 40 50 60 70 80 90 100
J u n e 2 0 0 4
0
2
4
6
8
1 0 2 0 3 0 4 0 5 0 6 0 7 0 8 0 9 0 1 0 0
June 2004
0
30
60
10 20 30 40 50 60 70 80 90 100
June 2004
0
2
4
6
8
10 20 30 40 50 60 70 80 90 100
J u ly 2 0 0 4
0
2
4
6
8
1 0 2 0 3 0 4 0 5 0 6 0 7 0 8 0 9 0 1 0 0
July 2004
0
30
60
10 20 30 40 50 60 70 80 90 100
July 2004
0
2
4
6
8
10 20 30 40 50 60 70 80 90 100
A u g u s t 2 0 0 4
0
2
4
6
8
1 0 2 0 3 0 4 0 5 0 6 0 7 0 8 0 9 0 1 0 0
August 2004
0
30
60
10 20 30 40 50 60 70 80 90 100
August 2004
0
2
4
6
8
10 20 30 40 50 60 70 80 90 100 Fig. 5a. Monthly variations of population density and biomass in each length class of the population from Lake Maggiore. Shell lengths (mm) are reported on the abscisses, density (ind m-2), shell and soft tissue biomass (g d.w. m-2) on the ordinates.

O. Ravera et al. 22
density shell biomass soft tissues biomass
Ju n e 2 0 0 3
0 .0
0 .2
0 .4
0 .6
0 .8
1 .0
1 0 2 0 3 0 4 0 5 0 6 0 7 0 8 0 9 0 1 0 0
Ju n e 2 0 0 3
0
4
8
1 2
1 6
2 0
1 0 2 0 3 0 4 0 5 0 6 0 7 0 8 0 9 0 1 0 0
Ju n e 2 0 0 3
0 .0
0 .5
1 .0
1 .5
2 .0
2 .5
1 0 2 0 3 0 4 0 5 0 6 0 7 0 8 0 9 0 1 0 0 Ju ly 2 0 0 3
0 .0
0 .2
0 .4
0 .6
1 0 2 0 3 0 4 0 5 0 6 0 7 0 8 0 9 0 1 0 0
Ju ly 2 0 0 3
0
4
8
1 2
1 0 2 0 3 0 4 0 5 0 6 0 7 0 8 0 9 0 1 0 0
Ju ly 2 0 0 3
0 .0
0 .5
1 .0
1 .5
1 0 2 0 3 0 4 0 5 0 6 0 7 0 8 0 9 0 1 0 0 A u g u st 2 0 0 3
0 .0
0 .2
0 .4
0 .6
1 0 2 0 3 0 4 0 5 0 6 0 7 0 8 0 9 0 1 0 0
A u g u s t 2 0 0 3
0
4
8
1 2
1 0 2 0 3 0 4 0 5 0 6 0 7 0 8 0 9 0 1 0 0
A u g u st 2 0 0 3
0 .0
0 .5
1 .0
1 .5
1 0 2 0 3 0 4 0 5 0 6 0 7 0 8 0 9 0 1 0 0 S e p te m b e r 2 0 0 3
0 .0
0 .2
0 .4
0 .6
0 .8
1 0 2 0 3 0 4 0 5 0 6 0 7 0 8 0 9 0 1 0 0
S e p te m b e r 2 0 0 3
0
4
8
1 2
1 6
1 0 2 0 3 0 4 0 5 0 6 0 7 0 8 0 9 0 1 0 0
S e p te m b e r 2 0 0 3
0 .0
0 .5
1 .0
1 .5
2 .0
1 0 2 0 3 0 4 0 5 0 6 0 7 0 8 0 9 0 1 0 0 O c to b e r 2 0 0 3
0 .0
0 .2
0 .4
0 .6
1 0 2 0 3 0 4 0 5 0 6 0 7 0 8 0 9 0 1 0 0
O c to b er 2 0 0 3
0
4
8
1 2
1 0 2 0 3 0 4 0 5 0 6 0 7 0 8 0 9 0 1 0 0
O c to b e r 2 0 0 3
0 .0
0 .5
1 .0
1 .5
1 0 2 0 3 0 4 0 5 0 6 0 7 0 8 0 9 0 1 0 0 N o v e m b e r 2 0 0 3
0 .0
0 .2
0 .4
0 .6
0 .8
1 0 2 0 3 0 4 0 5 0 6 0 7 0 8 0 9 0 1 0 0
N o v e m b e r 2 0 0 3
0
4
8
1 2
1 6
1 0 2 0 3 0 4 0 5 0 6 0 7 0 8 0 9 0 1 0 0
N o v e m b e r 2 0 0 3
0 .0
0 .5
1 .0
1 .5
2 .0
1 0 2 0 3 0 4 0 5 0 6 0 7 0 8 0 9 0 1 0 0 J a n u a ry 2 0 0 4
0 .0
0 .2
0 .4
0 .6
0 .8
1 0 2 0 3 0 4 0 5 0 6 0 7 0 8 0 9 0 1 0 0
Ja n u a ry 2 0 0 4
0
4
8
1 2
1 6
1 0 2 0 3 0 4 0 5 0 6 0 7 0 8 0 9 0 1 0 0
J a n u a ry 2 0 0 4
0 .0
0 .5
1 .0
1 .5
2 .0
1 0 2 0 3 0 4 0 5 0 6 0 7 0 8 0 9 0 1 0 0
M a rc h 2 0 0 4
0 .0
0 .2
0 .4
0 .6
0 .8
1 .0
1 0 2 0 3 0 4 0 5 0 6 0 7 0 8 0 9 0 1 0 0
M arc h 2 0 0 4
0
4
8
1 2
1 6
2 0
1 0 2 0 3 0 4 0 5 0 6 0 7 0 8 0 9 0 1 0 0
M a rc h 2 0 0 4
0 .0
0 .5
1 .0
1 .5
2 .0
2 .5
1 0 2 0 3 0 4 0 5 0 6 0 7 0 8 0 9 0 1 0 0 A p r il 2 0 0 4
0 .0
0 .2
0 .4
0 .6
0 .8
1 0 2 0 3 0 4 0 5 0 6 0 7 0 8 0 9 0 1 0 0
A p ril 2 0 0 4
0
4
8
1 2
1 6
1 0 2 0 3 0 4 0 5 0 6 0 7 0 8 0 9 0 1 0 0
A p r il 2 0 0 4
0 .0
0 .5
1 .0
1 .5
2 .0
1 0 2 0 3 0 4 0 5 0 6 0 7 0 8 0 9 0 1 0 0
M ay 20 04
0 .0
0 .2
0 .4
0 .6
0 .8
10 20 30 40 50 60 70 80 90 100
M ay 2004
0
4
8
12
16
10 20 30 40 50 60 70 80 90 100
M ay 200 4
0 .0
0 .5
1 .0
1 .5
2 .0
10 20 30 40 50 60 70 80 90 100 Ju n e 2 0 0 4
0 .0
0 .2
0 .4
0 .6
1 0 2 0 3 0 4 0 5 0 6 0 7 0 8 0 9 0 1 0 0
Ju n e 2 0 0 4
0
4
8
1 2
1 0 2 0 3 0 4 0 5 0 6 0 7 0 8 0 9 0 1 0 0
Ju n e 2 0 0 4
0 .0
0 .5
1 .0
1 .5
1 0 2 0 3 0 4 0 5 0 6 0 7 0 8 0 9 0 1 0 0 Ju ly 2 0 0 4
0 .0
0 .2
0 .4
0 .6
1 0 2 0 3 0 4 0 5 0 6 0 7 0 8 0 9 0 1 0 0
Ju ly 2 0 0 4
0
4
8
1 2
1 0 2 0 3 0 4 0 5 0 6 0 7 0 8 0 9 0 1 0 0
Ju ly 2 0 0 4
0 .0
0 .5
1 .0
1 .5
1 0 2 0 3 0 4 0 5 0 6 0 7 0 8 0 9 0 1 0 0 A ugu st 2 004
0 .0
0 .2
0 .4
0 .6
10 20 30 40 50 60 70 80 90 100
A ugust 2004
0
4
8
12
10 20 30 40 50 60 70 80 90 100
A ugust 2004
0 .0
0 .5
1 .0
1 .5
10 20 30 40 50 60 70 80 90 100 Fig. 5b. Monthly variations of population density and biomass in each length class of the population from Lake Candia. Shell lengths (mm) are reported on the abscisses, density (ind m-2), shell and soft tissue biomass (g d.w. m-2) on the ordinates.

Variations in population dynamics and biomass of two Unio pictorum mancus populations 23
0
1
2
3
4
5
6
Lake MaggioreLake Candia
ind m-2
14 20 26 32 38 44 50 56 62 68 74 80 86 92 98
0
10
20
30
40
50
60
Lake MaggioreLake Candia
g shell d.w. m-2
14 20 26 32 38 44 50 56 62 68 74 80 86 92 98
0
1
2
3
4
5
6
Lake MaggioreLake Candia
g tissues d.w. m-2
14 20 26 32 38 44 50 56 62 68 74 80 86 92 98
Fig. 6. Population density, shell and soft tissue biomass in each length class of the Unio pictorum mancus populations (pooled over time) from Lake Maggiore and Lake Candia, respectively.

O. Ravera et al. 24
From an ecological standpoint, i.e. the role played by the mussels in their environment, population density and biomass are the most important variables. Popula-tion density in Lake Maggiore (46.86 ind. m-2), which was far greater than in Lake Candia (6.93 ind. m-2), is very high compared to values reported in literature, which range from 0.74 to 13.04 (Økland 1963; Tudo-rancea & Florescu 1968; Negus 1966; Ravera & Spro-cati 1997; Bauer & Wächtler 2001). One of the hypotheses which could explain the lower population density estimated for Lake Candia than for Lake Maggiore could be a less effective relationship with the host fish of the glochidia. This hypothesis seems to be supported by the lower number of young individuals admitted each year to the Lake Candia population com-pared to that of Lake Maggiore, but other causes (such as reduced fecundity and/or reduced survival of adult or larval stages) could be involved. The high recruitment of young mussels in Lake Maggiore seems to compen-sate, at least partly, for the high mortality due to the periodic lowering of the lake water level. This stress does not alter the population structure, but abolishes the fraction of population settled in the area most at risk of drying out.
The far greater density of mussels in Lake Maggiore (about 7-fold that of Lake Candia) meant that their tis-sue and shell biomass also widely exceeded that of Lake Candia, with values respectively about 3-fold and 4-fold higher. This suggests that mussels not only exert a greater influence on their habitat in Lake Maggiore, but also that the habitat conditions they find in the lake are more congenial. This hypothesis also seems to be sup-ported by the differences in size structure between the two populations. In fact, while in Lake Maggiore the distribution of mussels in the different length classes was generally unimodal and symmetrical, in Lake Can-dia the frequency distribution of mussel length classes was generally multimodal, suggesting that there may be marked variations in recruitment and/or mortality rates from year to year. One of the probable causes of this is
the wide variability of physico-chemical conditions which typically characterizes eutrophic water bodies.
However, if on the one hand a larger population density can be sustained in the meso-oligotrophic lake, on the other hand better nutritional conditions seem to favour individual growth in the eutrophic lake. Indeed, large-sized individuals are more abundant in the Lake Candia population than in the Lake Maggiore popula-tion, and both growth-rate and soft tissue weight per length unit are higher in Lake Candia than in Lake Maggiore mussels, as testified by the observed differ-ences in both length-soft tissue weight and length-age relationship. In fact, the steeper slope of the length-weight data from Lake Candia indicated a higher weight gain per length unit, while the steeper slope of the length-rings data from Lake Maggiore evidenced a slower length increment per time unit. The presence of epibiontic zebra mussel (Dreissena polymorpha, Pallas) on the posterior part of the shell, near the inhalant and exhalant siphons, of almost all middle and large sized Unio could be a further reason for a reduced food sup-ply. Settlement in this position enables Dreissena to use the food particles provided by the filtering flux of the host (Hörmann & Mayer 2006).
The Lake Maggiore mussels at the same shell length are not only older, but have a heavier shell than Lake Candia individuals. This difference probably reflects adaptation to the habitat, rather than the higher calcium concentration in Lake Maggiore waters (26.39 mg L-1) than in Lake Candia (15.15 mg L-1) (Ravera et al. 2007, this issue). In fact, the calcium concentration in Lake Candia, although lower than in Lake Maggiore, was not so low as to become a limiting factor for mollusc growth. It is conceivable that the heavier shell of Lake Maggiore mussels is a reaction to continuous water movements and the more compact sandy sediments of the lake.
Bigger mussels are usually older than smaller ones, but there is wide variability in this relationship, so that mussels of the same length may have different ages
0
100
200
300
400
500
600sh
ell (
g dw
m-2
)
20
30
40
50
60
70
tissu
es (g
dw
m-2
)
shell biomass soft tissues biomass
JM J NOSAJ D J F M A M J A0
100
200
300
400
500
600
shel
l (g
dw m
-2)
20
30
40
50
60
70
tissu
es (g
dw
m-2
)
shell biomass soft tissues biomass
JM J NOSAJ D J F M A M J A
Fig. 7. Monthly variations of shell and soft tissue biomasses in Unio pictorum mancus from Lake Maggiore (left panel) and Lake Candia (right panel).

Variations in population dynamics and biomass of two Unio pictorum mancus populations 25
(e.g., Botnariuc & Tudorancea 1967). Determining age by counting the annual rings is not easy, because of supernumerary rings which arise due to stress from various causes other than the cold season, the corrosion of the umbon area, and the more recent rings being con-centrated in a small space on the edge of the shell (Økland 1963; Magnin & Stanczykowska 1971). In spite of these difficulties, and the existence of more reli-able methods (e.g., Wellmann 1938; Nelson et al. 1966; Garcia & Plante 1992; Garcia 1999; Mutvei & Wester-mark 2001), ring counting is the most commonly used method because it does not require instruments or sam-ple preparation, and is therefore useful when a high number of mussels has to be analysed. This method yielded a highly significant correlation between number of rings and shell length, although the variability was rather wide.
Instead of using mussel age, which is an essential variable for studying population demography, we pre-ferred to relate the mussel variables (e.g., mussel distri-bution in size classes, percent composition of shell and soft tissues) to the dry weight of soft tissues and shell and to shell length. These variables are strictly related to biomass and mussel metabolism and, consequently, to their influence on the ecosystem. In addition, according to Bauer (1991), shell length gives an indication of soft tissue mass, which is clearly related to reproductive traits.
The percentage of small (young) individuals is typi-cally low in Unionidae samples (e.g., Negus 1966; Nardi 1972; Bauer 1983; Bauer et al. 1991; Hochwald 1997). As an example, in the monthly samples from Lake Candia the proportion of individuals smaller than 31 mm was always lower than 2%. In the samples from Lake Maggiore the proportion of individuals of this size was generally lower than 10% except for the sample of July 2003, when this proportion increased to 40%. The subsequent decrease in the proportion of small speci-mens was probably due both to their passage into the successive size classes and to mortality during the sub-sequent months until the next admission. The smallest individuals collected were 14 mm long in Lake Maggiore and 24 mm long in Lake Candia. To evaluate whether the low number of small individuals collected could be due partly to the sampling method (visual and tactile collection), sediment samples were collected with a Petersen grab in the Lake Maggiore station and the sediment collected sieved. The percentage of small individuals was very similar to that obtained by hand collection. It was suggested that in some Unio sp. populations the low percentage of young individuals is due to their higher sensitivity to environmental stress compared to adult mussels (e.g., Bauer 1983). In envi-ronments not stressed by toxic pollutants, such as our sampling stations, the low percentage of small mussels could be explained by the following hypothesis. From the length-age relationship observed in both popula-
tions, the permanence time of mussels in each size class increases exponentially with mussel size. It follows that the flux of individuals from the smallest to the succes-sive size class should be relatively rapid, and the num-ber of individuals in the smallest class comparatively small. This hypothesis seems to be supported by the rapid decrease in the number of small individuals fol-lowing each annual admission, which is probably only partially accounted for by mortality.
The differences between the population of the meso-oligotrophic Lake Maggiore and that of the eutrophic Lake Candia clearly demonstrate the plasticity of Unio pictorum in reacting to environmental characteristics. While these differences may be the result of a pheno-typical adaptation to the environment, genetic differ-ences between the two populations acquired in the course of evolution cannot be excluded.
Although it is quite clear that eutrophication affects mussels (e.g., Patzner & Müller 2001), it is very diffi-cult to establish a relationship between well-defined variables of the eutrophic environment and the charac-teristics of a euryoecious species such as Unio pictorum. The nutrient enrichment of a water body influences all the physical, chemical and biological characteristics of the ecosystem, some of which may be favourable to the mussel population (e.g., abundance of food, increase in the population density of fish which host the glochidia), while some others may be very dangerous (e.g., oxygen depletion, toxic concentrations of nitrites and ammonia). Our data suggest that while on the one hand eutrophic conditions seem to enhance individual growth rate, on the other hand they appear to limit population increase through a reduction of recruitment and/or of survival rate of the younger individuals.
ACKNOWLEDGEMENTS
We are very grateful to Prof. Sandra Spence for the careful language revision of the manuscript and to the anonymous referees who contributed to improving the manuscript with their constructive criticism.
REFERENCES Ambrosetti, W., L. Barbanti, R.Mosello, & A. Pugnetti. 1992.
Limnological studies on the deep southern alpine lakes Maggiore, Lugano, Como, Iseo and Garda. In: Guilizzoni, P., G. Tartari & G. Giussani (Eds), Limnology in Italy. Mem. Ist. ital. Idrobiol., 50: 117-146.
Bauer, G. 1983. Age structure, age specific mortality rates and population trend in the freshwater pearl mussel (Margari-tifera margaritifera) in North Bavaria. Arch. Hydrobiol., 98: 523-532.
Bauer, G. 1991. Plasticity in life-history traits of the freshwa-ter pearl mussel consequences for the danger of extinction and for conservation measures. In: A. Seitz & V. Loescheke (Eds), Species conservation: a population bio-logical approach. Birkhauser Verlag, Basel: 103-120.
Bauer, G. & K. Wachtler. 2001. Ecology and evolution of the naiads. In: G. Bauer & K. Wachtler (Eds), Ecology and Evolution of the Freshwater Mussels Unionoida. Springer Verlag, Berlin: 383-388.

O. Ravera et al. 26
Bauer, G., S. Hochwald, C. Schmidt, H. Smith & R.H. Reger. 1991. Dauerbeobachtung von Muschelbestanden. Bay-erische Akad. Natursch. Landschaftspllege, 7: 30-37.
Bedford, J.W., E.W. Roelofs & M.J. Zabik. 1968. The fresh-water mussels as a biological monitor of pesticide con-centration in a lotic environment. Limnol. Oceanogr., 13: 118-126.
Borcherding, J. 2006. Ten years of practical experience with the Dreissena-Monitor, a biological early warning system for continuous water quality monitoring. Hydrobiologia, 556: 417-426.
Botnariuc, von N. & C. Tudorancea. 1967. Beitrage zur Populationsdynamik bei Anodonta piscinalis im Flachsee Jijila (Űberschwemmungsgebeit der Donau). Arch. Hydrobiol., Suppl. XXX, 4: 400-419.
Bowen, Z.H., S.P. Malvestuto, W.D. Davies & J.H. Crance. 1994. Evaluation of the mussel fishery in Wheeler Reser-voir, Tennessee River. J. Freshwat. Ecol., 9: 313-319.
England, V.P.M. & M.P. Heino, 1994. Valve movement of Anodonta anatina and Unio tumidus (Bivalvia, Unionidae) in an eutrophic lake. Ann. Zool. Fennici, 31: 257-262.
Gaglione, P. & O. Ravera. 1964. Mn-54 concentration in fall-out, water and Unio mussels of Lake Maggiore 1960-1963. Nature, 204: 1215-1216.
García, F. 1999. Interprétation des stries valvaires pour l'évaluation de la croissance de Ruditapes decussatus, L. Oceanol. Acta, 16: 199-203.
García, F. & R. Plante. 1992. Utilisation d'un marquage natu-ral par la bauxite pour l'evaluation de la croissance de Ru-ditapes decussatus, L. du Golfe de Fos. Comptes Rendues de l'Acad. de Sc. Paris, 3: 157.
Giussani, G. & G. Galanti. 1995. Case study: Lake Candia (Northern Italy). Chapter 8 in: de Bernardi, R. & G. Gius-sani (Eds),, Biomanipulation in Lakes and Reservoirs Management. Guidelines of Lake Management, Vol. 7. ILEC: 135-146.
Giussani, G. & G. Galanti. 1992. Experience in eutrophication recovery by biomanipulation. In: P. Guilizzoni, G. Tartari & G. Giussani (Eds), Limnology in Italy. Mem. Ist. ital. Idrobiol., 50: 397-416.
Ham, K.D. & M.J. Peterson. 1994. Effect of fluctuating low level chlorine concentrations on valve movement behav-iour of the asiatic clam (Corbicula fluminea). Env. Toxi-col. and Chem., 13: 493-498.
Hily, C. 1991. Is the activity of benthic suspension feeders a factor controlling water quality in the Bay of Brest? Mar. ecol. Prog. Ser., 69: 179-188.
Hochwald, S. 1997. Populationsökologie der Bachmuschel (Unio crassus). Bayreuther Forum Okologie, 50: 1-166.
Hörman, L. & G. Maier. 2006. Do zebra mussels grow faster on live Unionids than on inanimate substrate? A study with field enclosures. Internat. Rev. Hydrobiol. 91: 113-121.
Lomstein, B.A., L.B. Guldberg & J. Hansen. 2006. Decompo-sition of Mytilus edulis: the effect on sediment nitrogen and carbon cycling. J. Exper. Mar. Biol. Ecol., 329: 251-264
Magnin, E. & A. Stanczykowska. 1971. Quelques données sur la croíssance, la bíomasse et la production annuelle de trois mollusques Unionidae de a région de Montréal. Can. J. Zool., 49: 491-497.
Manca, M., A. Calderoni & R. Mosello. 1992. Limnological research in Lago Maggiore: studies on hydrochemistry and plankton. In: P. Guilizzoni, G. Tartari & G. Giussani (Eds), Limnology in Italy. Mem. Ist. ital. Idrobiol., 50: 171-200.
Manly, R. & W.O. George. 1977. The occurrence of some heavy metals in populations of the freshwater mussel Ano-donta anatina (L.) from the River Thames. Environ. Poll., 14: 139-154.
Mc Nickle, G.G., M.D. Rennie & W.G. Sprules. 2006. Changes in benthic invertebrate communities of South Bay, Lake Huron following invasion by zebra mussels (Dreissena polymorpha), and potential effects on lkae whitefish (Coregonus clupeaformis) diet and growth. J. Great Lakes Res., 32: 180-193.
Millington, P.J. & K.F. Walker. 1983. Australian freshwater mussel Valesunio ambiguus (Philippi) as a biological monitor for zinc, iron and manganese. Aust. J. Mar. Freshwater Res., 34: 873-892.
Mutvei, H. & T. Westermark. 2001. How environmental in-formation can be obtained from Naiad shells. In: G. Bauer & K. Wachtler (Eds), Ecology and evolution of the fresh-water mussels Unionida. Ecological Studies, 145. Springer Verlag, Berlin: 367-379.
Nagel, K.O. & G. Badino. 2001. Population genetics and sys-tematics of European Unionidea. In: G. Bauer & K. Wächtler (Eds), Ecology and evolution of the Freshwater Mussels Unionida. Ecological Studies, Springer, Berlin: 51-80.
Nardi, P.A. 1972. Ricerche su un ecosistema ad Unio del Pre-appennino pavese. Bull. Pesca Piscic. Idrobiol., 27: 159-174.
Negus, C.L. 1966. A quantitative study of growth and produc-tion of unionid mussels in the river Thames at Reding. J. Anim. Ecol., 35: 513-531.
Nelson, J.L., R.W. Perkins, J.M. Nielsen & W.L. Haushild. 1966. Reactions of radionuclides from Handford reactors with Columbia River sediments. In: Proc. Disposal of Radioactive wastes into seas, oceans and surface waters. IAEA, Wien: 139-161.
Økland, J. 1963. Notes on population density, age distribution, growth and habitat of Anodonta piscinalis, Nilss (Moll. Lamellibr.) in a eutrophic Norwegian lake. Nytt. Magasin for Zoologi, 11: 19-43.
Patzner, R.A. & D. Müller. 2001. Effects of eutrophication on Unionids. In: G. Bauer & K. Watchtler (Eds), Ecology and evolution of freshwater mussels Unionoida. Springer-Verlag, Berlin. Ecological Studies, 145: 327-335.
Ravera, O., G.M. Beone, R. Cenci & P. Lodigiani. 2003. Metal concentrations in Unio pictorum mancus (Mollusca, Lamellibranchia) from of 12 Northern Italian lakes in re-lation to their trophic level. J. Limnol., 62: 121-138.
Ravera, O. & A.R. Sprocati. 1997. Population dynamic, pro-duction and respiration of two freshwater mussels: Unio mancus, Zhadin and Anodonta cygnea, Lam. Mem. Ist. ital. Idrobiol., 56: 113-130.
Ravera, O., Beone, G., Trincherini, P. & N. Riccardi. 2007. Seasonal variations in metal content of two Unio pictorum mancus (Mollusca, Unionidae) populations from two lakes of different trophic state. J. Limnol., 66(1): 28-38.
Storey, A.W. & D.H.D. Edward. 1989. The freshwater mussel Westralunio carteri as a biological monitor of organochlo-rine pesticides. Aust. J. Mar. Freshwat. Res., 40: 587-593.
Strayer, D.L. & D.R. Smith. 2003. A guide to sampling fresh-water mussel populations. American Fisheries Society Monograph, 8. American Fishery Society, Bethesda, Meryland.
Tudorancea, C. 1972. Studies on Unionidae populations from Grapina-Jijila complex of pools (Danube zone liable to in-undation). Hydrobiologia, 39: 527-561.
Tudorancea, C. & M. Florescu. 1968. Considerations con-cerning the production and energetics of Unio tumidus, Philipsson population from the Crapina marsh. Travaux du Muséum d'Hist. Nat. "Grigore Antipa", 8: 395-409.
Vaughn, C.C. & C.C. Hakenkamp. 2001. The functional role of burrowing bivalves in freshwater ecosystem. Freshwat. Biol., 46: 1431-1446.
Welker, M. & N. Walz. 1998. Can mussels control the plank-ton in rivers? A planktological approach applying a La-

Variations in population dynamics and biomass of two Unio pictorum mancus populations 27
grangian sampling strategy. Limnol. Oceanogr., 43: 753-762.
Wellmann, G. 1938. Untersuchumgen über die Fluss-perlmuschel (Margaritana margaritifera L.) und ihren
Lebensraum in Bächen der Lüneburger Heide. Zeitschrift Fisherei u Hilfswiss Neudamm und Berlin, 36: 489-603.
Wotton, R.S. 2006. Have we underestimated the role of faeces in aquatic system? Verh. Internat. Verein. Limnol., 29: 1212-1214.
Received: November 2006 Accepted: January 2007