Seasonal dynamics of zooplankton community in four Mediterranean reservoirs in humid area (Beni...
13
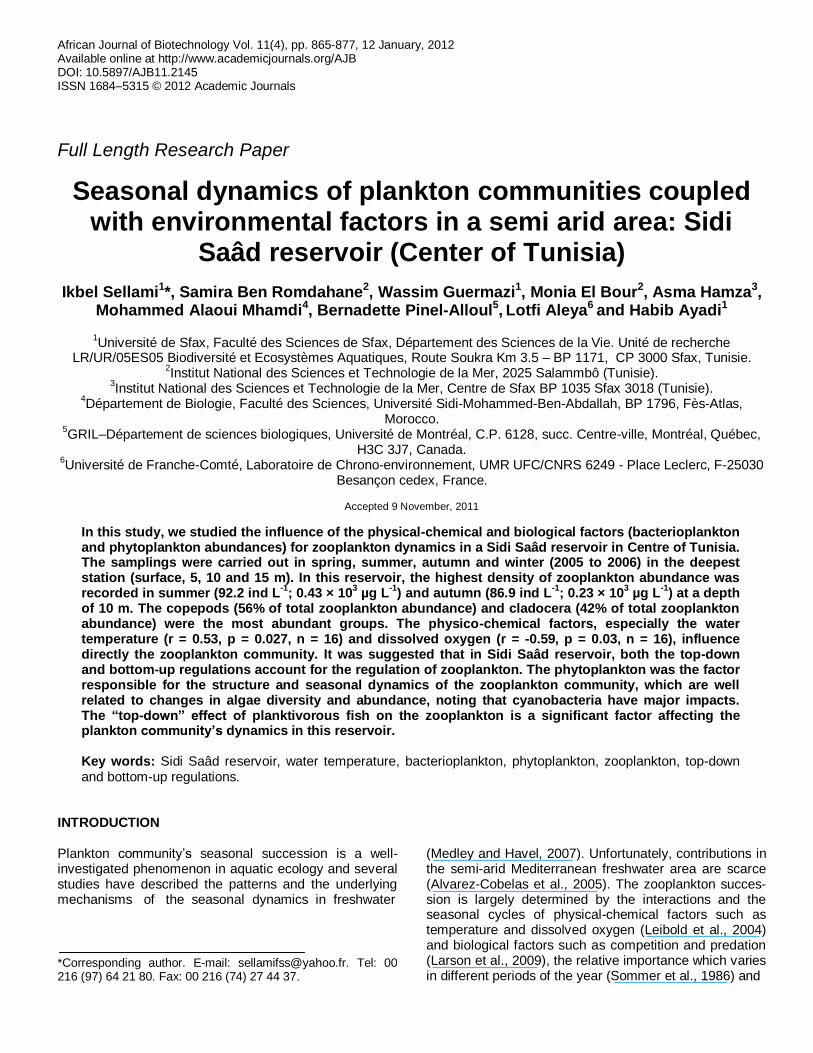
African Journal of Biotechnology Vol. 11(4), pp. 865-877, 12 January, 2012 Available online at http://www.academicjournals.org/AJB DOI: 10.5897/AJB11.2145 ISSN 1684–5315 © 2012 Academic Journals Full Length Research Paper Seasonal dynamics of plankton communities coupled with environmental factors in a semi arid area: Sidi Saâd reservoir (Center of Tunisia) Ikbel Sellami 1 *, Samira Ben Romdahane 2 , Wassim Guermazi 1 , Monia El Bour 2 , Asma Hamza 3 , Mohammed Alaoui Mhamdi 4 , Bernadette Pinel-Alloul 5 , Lotfi Aleya 6 and Habib Ayadi 1 1 Université de Sfax, Faculté des Sciences de Sfax, Département des Sciences de la Vie. Unité de recherche LR/UR/05ES05 Biodiversité et Ecosystèmes Aquatiques, Route Soukra Km 3.5 – BP 1171, CP 3000 Sfax, Tunisie. 2 Institut National des Sciences et Technologie de la Mer, 2025 Salammbô (Tunisie). 3 Institut National des Sciences et Technologie de la Mer, Centre de Sfax BP 1035 Sfax 3018 (Tunisie). 4 Département de Biologie, Faculté des Sciences, Université Sidi-Mohammed-Ben-Abdallah, BP 1796, Fès-Atlas, Morocco. 5 GRIL–Département de sciences biologiques, Université de Montréal, C.P. 6128, succ. Centre-ville, Montréal, Québec, H3C 3J7, Canada. 6 Université de Franche-Comté, Laboratoire de Chrono-environnement, UMR UFC/CNRS 6249 - Place Leclerc, F-25030 Besançon cedex, France. Accepted 9 November, 2011 In this study, we studied the influence of the physical-chemical and biological factors (bacterioplankton and phytoplankton abundances) for zooplankton dynamics in a Sidi Saâd reservoir in Centre of Tunisia. The samplings were carried out in spring, summer, autumn and winter (2005 to 2006) in the deepest station (surface, 5, 10 and 15 m). In this reservoir, the highest density of zooplankton abundance was recorded in summer (92.2 ind L -1 ; 0.43 × 10 3 μg L -1 ) and autumn (86.9 ind L -1 ; 0.23 × 10 3 μg L -1 ) at a depth of 10 m. The copepods (56% of total zooplankton abundance) and cladocera (42% of total zooplankton abundance) were the most abundant groups. The physico-chemical factors, especially the water temperature (r = 0.53, p = 0.027, n = 16) and dissolved oxygen (r = -0.59, p = 0.03, n = 16), influence directly the zooplankton community. It was suggested that in Sidi Saâd reservoir, both the top-down and bottom-up regulations account for the regulation of zooplankton. The phytoplankton was the factor responsible for the structure and seasonal dynamics of the zooplankton community, which are well related to changes in algae diversity and abundance, noting that cyanobacteria have major impacts. The “top-down” effect of planktivorous fish on the zooplankton is a significant factor affecting the plankton community’s dynamics in this reservoir. Key words: Sidi Saâd reservoir, water temperature, bacterioplankton, phytoplankton, zooplankton, top-down and bottom-up regulations. INTRODUCTION Plankton community’s seasonal succession is a well- investigated phenomenon in aquatic ecology and several studies have described the patterns and the underlying mechanisms of the seasonal dynamics in freshwater *Corresponding author. E-mail: [email protected]. Tel: 00 216 (97) 64 21 80. Fax: 00 216 (74) 27 44 37. (Medley and Havel, 2007). Unfortunately, contributions in the semi-arid Mediterranean freshwater area are scarce (Alvarez-Cobelas et al., 2005). The zooplankton succes- sion is largely determined by the interactions and the seasonal cycles of physical-chemical factors such as temperature and dissolved oxygen (Leibold et al., 2004) and biological factors such as competition and predation (Larson et al., 2009), the relative importance which varies in different periods of the year (Sommer et al., 1986) and
-
Upload
independent -
Category
Documents
-
view
0 -
download
0
Transcript of Seasonal dynamics of zooplankton community in four Mediterranean reservoirs in humid area (Beni...
African Journal of Biotechnology Vol. 11(4), pp. 865-877, 12 January, 2012 Available online at http://www.academicjournals.org/AJB DOI: 10.5897/AJB11.2145 ISSN 1684–5315 © 2012 Academic Journals
Full Length Research Paper
Seasonal dynamics of plankton communities coupled with environmental factors in a semi arid area: Sidi
Saâd reservoir (Center of Tunisia)
Ikbel Sellami1*, Samira Ben Romdahane2, Wassim Guermazi1, Monia El Bour2, Asma Hamza3, Mohammed Alaoui Mhamdi4, Bernadette Pinel-Alloul5, Lotfi Aleya6 and Habib Ayadi1
1Université de Sfax, Faculté des Sciences de Sfax, Département des Sciences de la Vie. Unité de recherche
LR/UR/05ES05 Biodiversité et Ecosystèmes Aquatiques, Route Soukra Km 3.5 – BP 1171, CP 3000 Sfax, Tunisie. 2Institut National des Sciences et Technologie de la Mer, 2025 Salammbô (Tunisie).
3Institut National des Sciences et Technologie de la Mer, Centre de Sfax BP 1035 Sfax 3018 (Tunisie).
4Département de Biologie, Faculté des Sciences, Université Sidi-Mohammed-Ben-Abdallah, BP 1796, Fès-Atlas,
Morocco. 5GRIL–Département de sciences biologiques, Université de Montréal, C.P. 6128, succ. Centre-ville, Montréal, Québec,
H3C 3J7, Canada. 6Université de Franche-Comté, Laboratoire de Chrono-environnement, UMR UFC/CNRS 6249 - Place Leclerc, F-25030
Besançon cedex, France.
Accepted 9 November, 2011
In this study, we studied the influence of the physical-chemical and biological factors (bacterioplankton and phytoplankton abundances) for zooplankton dynamics in a Sidi Saâd reservoir in Centre of Tunisia. The samplings were carried out in spring, summer, autumn and winter (2005 to 2006) in the deepest station (surface, 5, 10 and 15 m). In this reservoir, the highest density of zooplankton abundance was recorded in summer (92.2 ind L
-1; 0.43 × 10
3 µg L
-1) and autumn (86.9 ind L
-1; 0.23 × 10
3 µg L
-1) at a depth
of 10 m. The copepods (56% of total zooplankton abundance) and cladocera (42% of total zooplankton abundance) were the most abundant groups. The physico-chemical factors, especially the water temperature (r = 0.53, p = 0.027, n = 16) and dissolved oxygen (r = -0.59, p = 0.03, n = 16), influence directly the zooplankton community. It was suggested that in Sidi Saâd reservoir, both the top-down and bottom-up regulations account for the regulation of zooplankton. The phytoplankton was the factor responsible for the structure and seasonal dynamics of the zooplankton community, which are well related to changes in algae diversity and abundance, noting that cyanobacteria have major impacts. The “top-down” effect of planktivorous fish on the zooplankton is a significant factor affecting the plankton community’s dynamics in this reservoir. Key words: Sidi Saâd reservoir, water temperature, bacterioplankton, phytoplankton, zooplankton, top-down and bottom-up regulations.
INTRODUCTION Plankton community’s seasonal succession is a well- investigated phenomenon in aquatic ecology and several studies have described the patterns and the underlying mechanisms of the seasonal dynamics in freshwater
*Corresponding author. E-mail: [email protected]. Tel: 00 216 (97) 64 21 80. Fax: 00 216 (74) 27 44 37.
(Medley and Havel, 2007). Unfortunately, contributions in the semi-arid Mediterranean freshwater area are scarce (Alvarez-Cobelas et al., 2005). The zooplankton succes-sion is largely determined by the interactions and the seasonal cycles of physical-chemical factors such as temperature and dissolved oxygen (Leibold et al., 2004) and biological factors such as competition and predation (Larson et al., 2009), the relative importance which varies in different periods of the year (Sommer et al., 1986) and
866 Afr. J. Biotechnol. also among aquatic ecosystems and scales (Pinel-Alloul and Ghadouani, 2007).
Zooplankton is an important link in freshwater aquatic ecosystems, grazing on and controlling the phytoplankton (Mitra et al., 2007; Mehner et al., 2008; Li et al., 2009) and bacterioplankton (Wikner et al., 1990). Primary producers in aquatic ecosystems are affected by resources (”bottom-up” effects) and consumers (”top-down” effects) (McQueen et al., 1986, 1989). A recent research suggests that the influence of bottom-up forces is higher in Mediterranean limnosystems (Moss et al., 2004). The “top-down” effect of predators on the lower trophic levels is a significant factor in structuring communities in freshwater ecosystems (McQueen et al., 1986; Vanni et al., 1990). Zooplankton constitutes the food source of organisms at higher trophic levels (Abrantes et al., 2006; Mitra et al., 2007). Therefore, planktivorous fish are well known to impact species composition of zooplankton (Medley and Havel, 2007).
To have a better understanding of the factors responsible for changes in the annual pattern of zooplankton, it is important to better understand the link between changes in environmental parameters, biological factors and zooplankton dynamics. The present study is the first concerning a Sidi Saâd reservoir situated in a semi-arid Mediterranean area, which focuses on the influence of the physical-chemical and biological factors (bacterioplankton and phytoplankton abundances) for zooplankton dynamics. MATERIALS AND METHODS
Study site
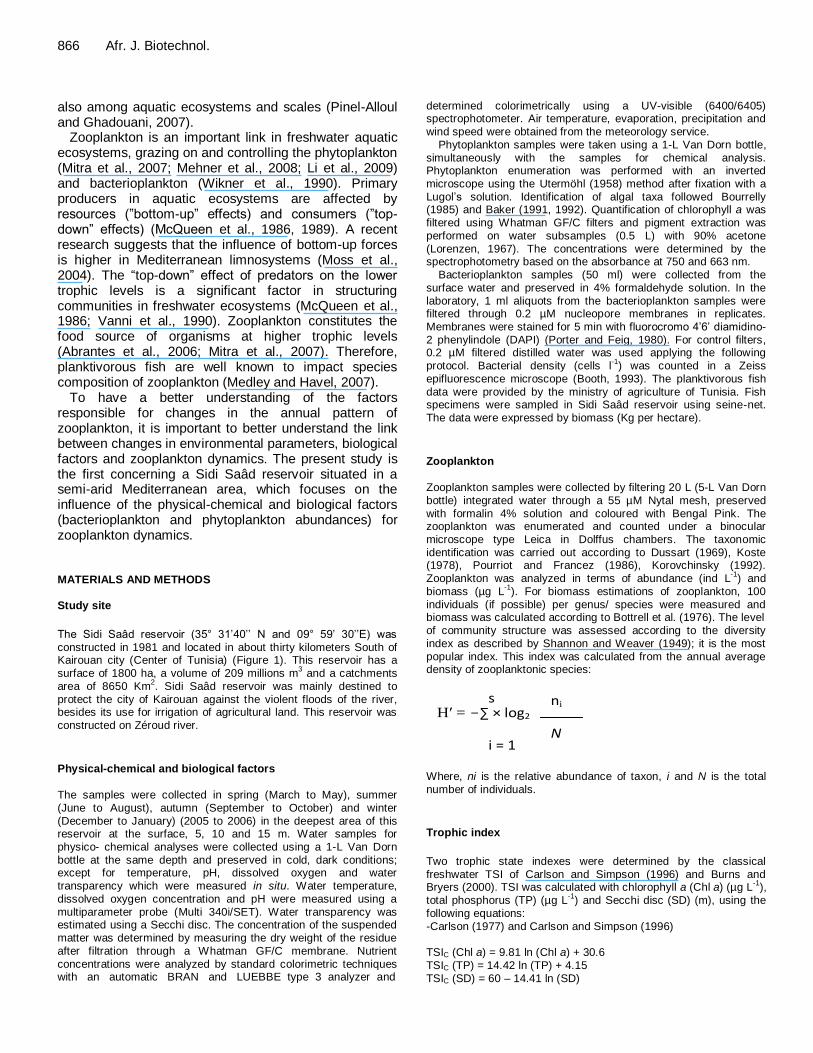
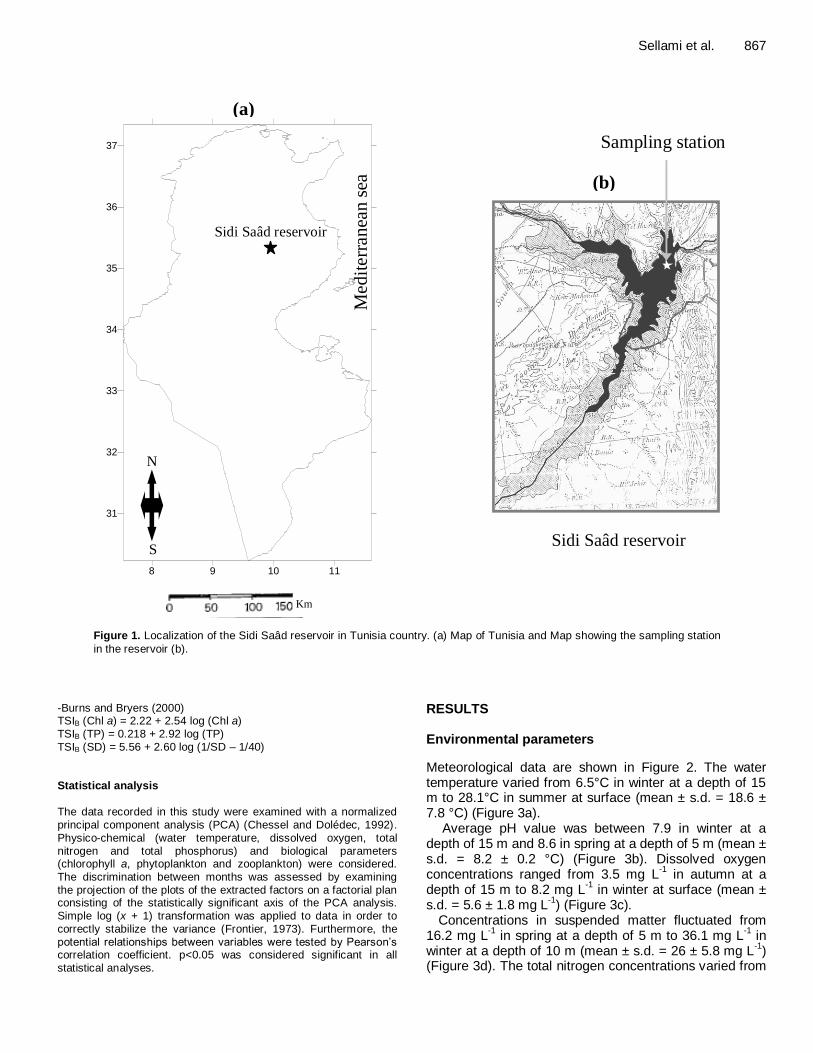
The Sidi Saâd reservoir (35° 31’40’’ N and 09° 59’ 30’’E) was constructed in 1981 and located in about thirty kilometers South of Kairouan city (Center of Tunisia) (Figure 1). This reservoir has a surface of 1800 ha, a volume of 209 millions m
3 and a catchments
area of 8650 Km2. Sidi Saâd reservoir was mainly destined to
protect the city of Kairouan against the violent floods of the river, besides its use for irrigation of agricultural land. This reservoir was
constructed on Zéroud river.
Physical-chemical and biological factors The samples were collected in spring (March to May), summer (June to August), autumn (September to October) and winter (December to January) (2005 to 2006) in the deepest area of this reservoir at the surface, 5, 10 and 15 m. Water samples for physico- chemical analyses were collected using a 1-L Van Dorn bottle at the same depth and preserved in cold, dark conditions; except for temperature, pH, dissolved oxygen and water transparency which were measured in situ. Water temperature, dissolved oxygen concentration and pH were measured using a multiparameter probe (Multi 340i/SET). Water transparency was estimated using a Secchi disc. The concentration of the suspended matter was determined by measuring the dry weight of the residue
after filtration through a Whatman GF/C membrane. Nutrient concentrations were analyzed by standard colorimetric techniques with an automatic BRAN and LUEBBE type 3 analyzer and
determined colorimetrically using a UV-visible (6400/6405) spectrophotometer. Air temperature, evaporation, precipitation and wind speed were obtained from the meteorology service.
Phytoplankton samples were taken using a 1-L Van Dorn bottle, simultaneously with the samples for chemical analysis. Phytoplankton enumeration was performed with an inverted microscope using the Utermöhl (1958) method after fixation with a Lugol’s solution. Identification of algal taxa followed Bourrelly (1985) and Baker (1991, 1992). Quantification of chlorophyll a was filtered using Whatman GF/C filters and pigment extraction was performed on water subsamples (0.5 L) with 90% acetone (Lorenzen, 1967). The concentrations were determined by the spectrophotometry based on the absorbance at 750 and 663 nm.
Bacterioplankton samples (50 ml) were collected from the surface water and preserved in 4% formaldehyde solution. In the laboratory, 1 ml aliquots from the bacterioplankton samples were filtered through 0.2 µM nucleopore membranes in replicates. Membranes were stained for 5 min with fluorocromo 4’6’ diamidino- 2 phenylindole (DAPI) (Porter and Feig, 1980). For control filters, 0.2 µM filtered distilled water was used applying the following protocol. Bacterial density (cells l
-1) was counted in a Zeiss
epifluorescence microscope (Booth, 1993). The planktivorous fish
data were provided by the ministry of agriculture of Tunisia. Fish specimens were sampled in Sidi Saâd reservoir using seine-net. The data were expressed by biomass (Kg per hectare).
Zooplankton Zooplankton samples were collected by filtering 20 L (5-L Van Dorn
bottle) integrated water through a 55 µM Nytal mesh, preserved with formalin 4% solution and coloured with Bengal Pink. The zooplankton was enumerated and counted under a binocular microscope type Leica in Dolffus chambers. The taxonomic identification was carried out according to Dussart (1969), Koste (1978), Pourriot and Francez (1986), Korovchinsky (1992). Zooplankton was analyzed in terms of abundance (ind L
-1) and
biomass (µg L-1
). For biomass estimations of zooplankton, 100 individuals (if possible) per genus/ species were measured and biomass was calculated according to Bottrell et al. (1976). The level of community structure was assessed according to the diversity index as described by Shannon and Weaver (1949); it is the most popular index. This index was calculated from the annual average density of zooplanktonic species:
H′ = -∑ × log2
s
i = 1
ni
N
Where, ni is the relative abundance of taxon, i and N is the total number of individuals.
Trophic index
Two trophic state indexes were determined by the classical freshwater TSI of Carlson and Simpson (1996) and Burns and Bryers (2000). TSI was calculated with chlorophyll a (Chl a) (µg L
-1),
total phosphorus (TP) (µg L-1
) and Secchi disc (SD) (m), using the following equations: -Carlson (1977) and Carlson and Simpson (1996)
TSIC (Chl a) = 9.81 ln (Chl a) + 30.6 TSIC (TP) = 14.42 ln (TP) + 4.15 TSIC (SD) = 60 – 14.41 ln (SD)
Sellami et al. 867
Sidi Saâd reservoir
N
0 50 100 150 200
Med
iter
ran
ean s
ea
Source : DG/BGTH, 2007
Sampling station
N
S 8 9 10 11
31
32
33
34
35
36
37
Med
iter
ran
ean s
ea
Km
Sidi Saâd reservoir
(a)
(b)
Figure 1. Localization of the Sidi Saâd reservoir in Tunisia country. (a) Map of Tunisia and Map showing the sampling station
in the reservoir (b).
-Burns and Bryers (2000) TSIB (Chl a) = 2.22 + 2.54 log (Chl a) TSIB (TP) = 0.218 + 2.92 log (TP) TSIB (SD) = 5.56 + 2.60 log (1/SD – 1/40) Statistical analysis
The data recorded in this study were examined with a normalized principal component analysis (PCA) (Chessel and Dolédec, 1992).
Physico-chemical (water temperature, dissolved oxygen, total nitrogen and total phosphorus) and biological parameters (chlorophyll a, phytoplankton and zooplankton) were considered. The discrimination between months was assessed by examining the projection of the plots of the extracted factors on a factorial plan consisting of the statistically significant axis of the PCA analysis. Simple log (x + 1) transformation was applied to data in order to correctly stabilize the variance (Frontier, 1973). Furthermore, the potential relationships between variables were tested by Pearson’s correlation coefficient. p<0.05 was considered significant in all statistical analyses.
RESULTS Environmental parameters
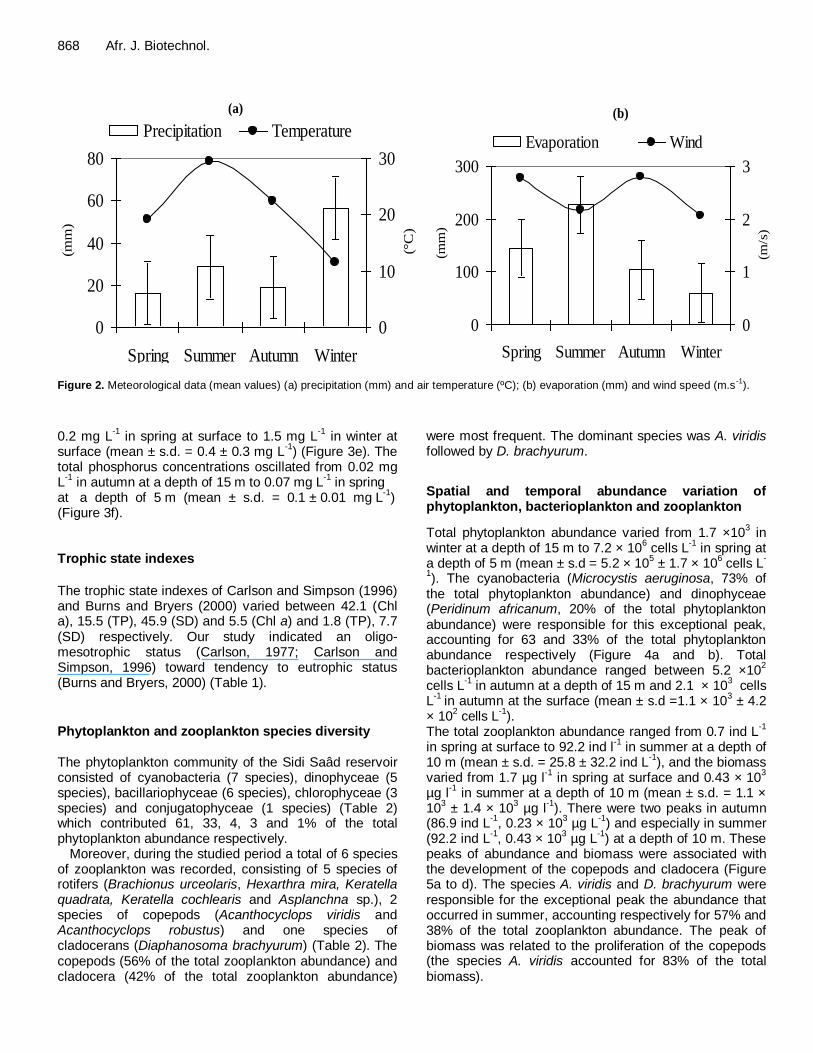
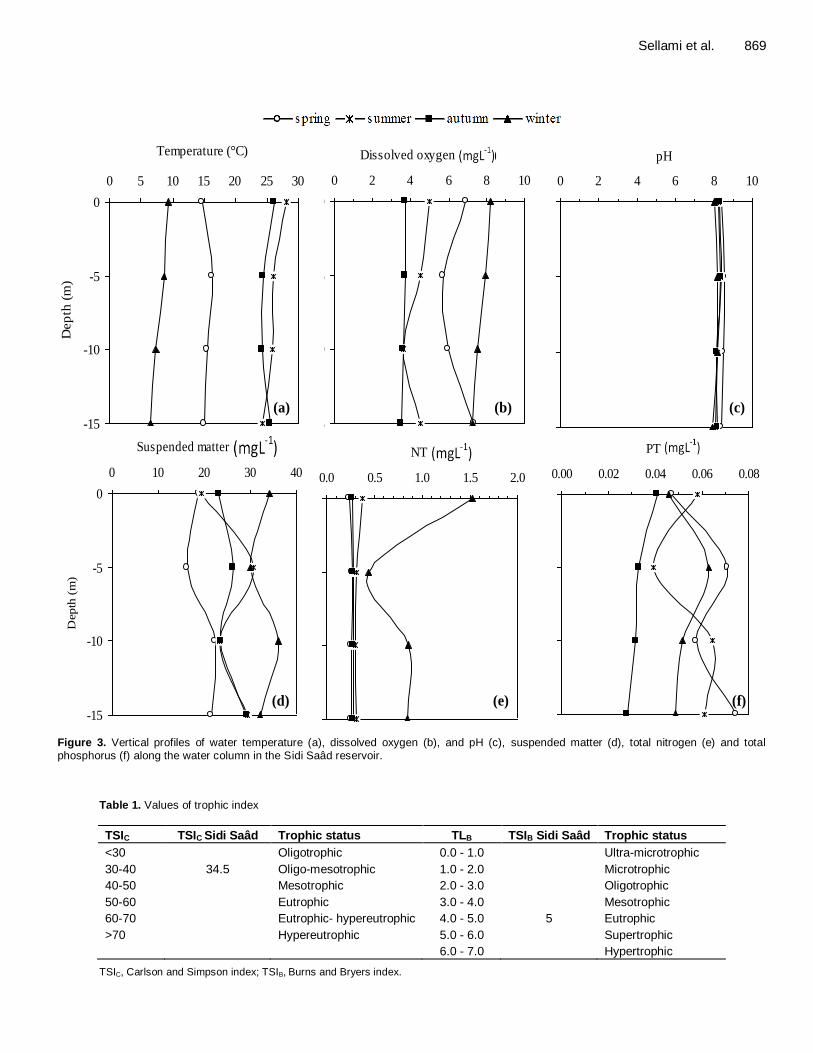
Meteorological data are shown in Figure 2. The water temperature varied from 6.5°C in winter at a depth of 15 m to 28.1°C in summer at surface (mean ± s.d. = 18.6 ± 7.8 °C) (Figure 3a).
Average pH value was between 7.9 in winter at a depth of 15 m and 8.6 in spring at a depth of 5 m (mean ± s.d. = 8.2 ± 0.2 °C) (Figure 3b). Dissolved oxygen concentrations ranged from 3.5 mg L
-1 in autumn at a
depth of 15 m to 8.2 mg L-1 in winter at surface (mean ±
s.d. = 5.6 ± 1.8 mg L-1
) (Figure 3c). Concentrations in suspended matter fluctuated from
16.2 mg L-1
in spring at a depth of 5 m to 36.1 mg L-1 in
winter at a depth of 10 m (mean ± s.d. = 26 ± 5.8 mg L-1
) (Figure 3d). The total nitrogen concentrations varied from
868 Afr. J. Biotechnol.
Figure 2.
0
20
40
60
80
Spring Summer Autumn Winter
(mm
)
0
10
20
30
(°C
)
Precipitation Temperature
0
100
200
300
Spring Summer Autumn Winter
(mm
)
0
1
2
3
(m/s
)
Evaporation Wind
(b) (a)
Figure 2. Meteorological data (mean values) (a) precipitation (mm) and air temperature (ºC); (b) evaporation (mm) and wind speed (m.s-1
).
0.2 mg L-1
in spring at surface to 1.5 mg L-1
in winter at surface (mean ± s.d. = 0.4 ± 0.3 mg L
-1) (Figure 3e). The
total phosphorus concentrations oscillated from 0.02 mg L
-1 in autumn at a depth of 15 m to 0.07 mg L
-1 in spring
at a depth of 5 m (mean ± s.d. = 0.1 ± 0.01 mg L-1
) (Figure 3f). Trophic state indexes
The trophic state indexes of Carlson and Simpson (1996) and Burns and Bryers (2000) varied between 42.1 (Chl a), 15.5 (TP), 45.9 (SD) and 5.5 (Chl a) and 1.8 (TP), 7.7 (SD) respectively. Our study indicated an oligo-mesotrophic status (Carlson, 1977; Carlson and Simpson, 1996) toward tendency to eutrophic status (Burns and Bryers, 2000) (Table 1).
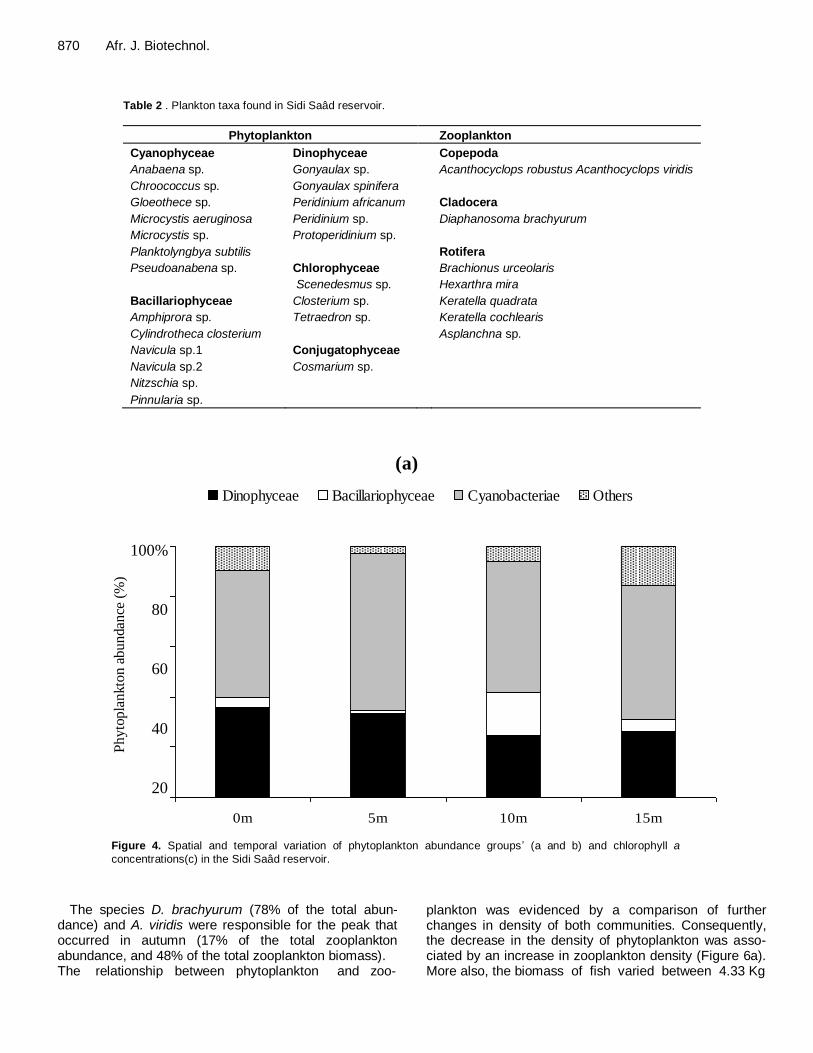
Phytoplankton and zooplankton species diversity The phytoplankton community of the Sidi Saâd reservoir consisted of cyanobacteria (7 species), dinophyceae (5 species), bacillariophyceae (6 species), chlorophyceae (3 species) and conjugatophyceae (1 species) (Table 2) which contributed 61, 33, 4, 3 and 1% of the total phytoplankton abundance respectively.
Moreover, during the studied period a total of 6 species of zooplankton was recorded, consisting of 5 species of rotifers (Brachionus urceolaris, Hexarthra mira, Keratella quadrata, Keratella cochlearis and Asplanchna sp.), 2 species of copepods (Acanthocyclops viridis and Acanthocyclops robustus) and one species of cladocerans (Diaphanosoma brachyurum) (Table 2). The copepods (56% of the total zooplankton abundance) and cladocera (42% of the total zooplankton abundance)
were most frequent. The dominant species was A. viridis followed by D. brachyurum.
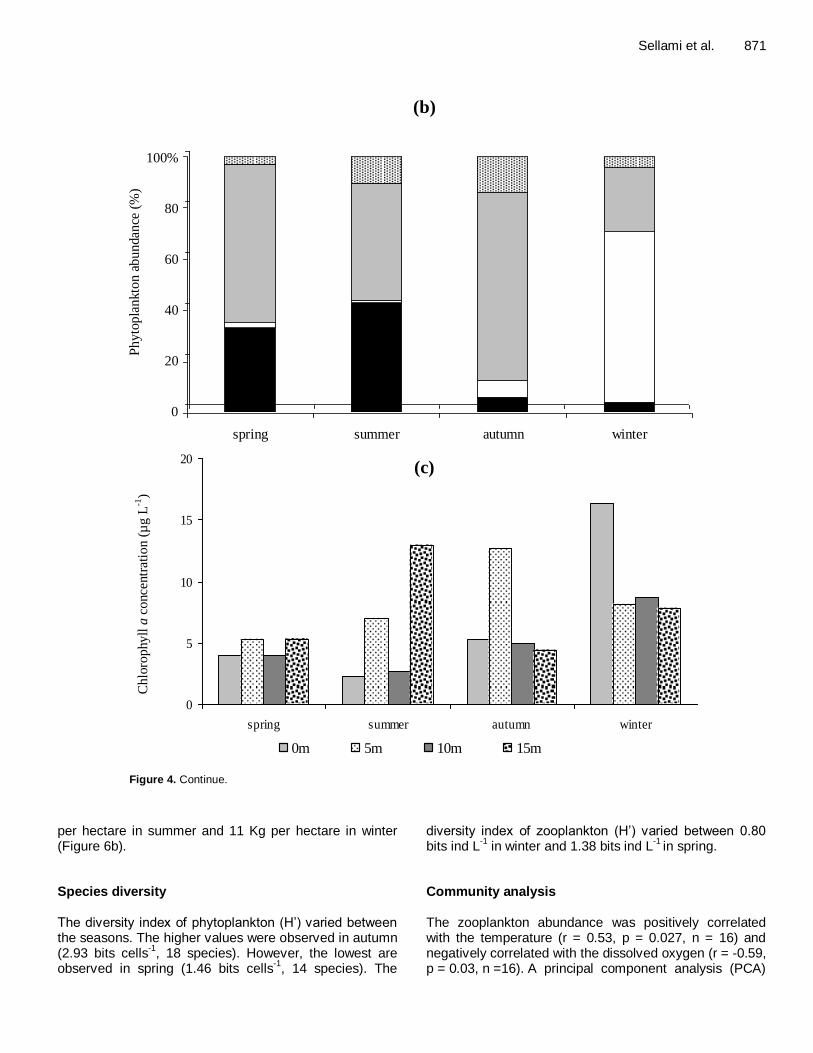
Spatial and temporal abundance variation of phytoplankton, bacterioplankton and zooplankton
Total phytoplankton abundance varied from 1.7 ×10³ in
winter at a depth of 15 m to 7.2 × 10⁶ cells L
-1 in spring at
a depth of 5 m (mean ± s.d = 5.2 × 10⁵ ± 1.7 × 10
6 cells L
-
1). The cyanobacteria (Microcystis aeruginosa, 73% of
the total phytoplankton abundance) and dinophyceae (Peridinum africanum, 20% of the total phytoplankton abundance) were responsible for this exceptional peak, accounting for 63 and 33% of the total phytoplankton abundance respectively (Figure 4a and b). Total bacterioplankton abundance ranged between 5.2 ×10
2
cells L-1
in autumn at a depth of 15 m and 2.1 × 10³ cells
L-1
in autumn at the surface (mean ± s.d =1.1 × 10³ ± 4.2
× 102 cells L
-1).
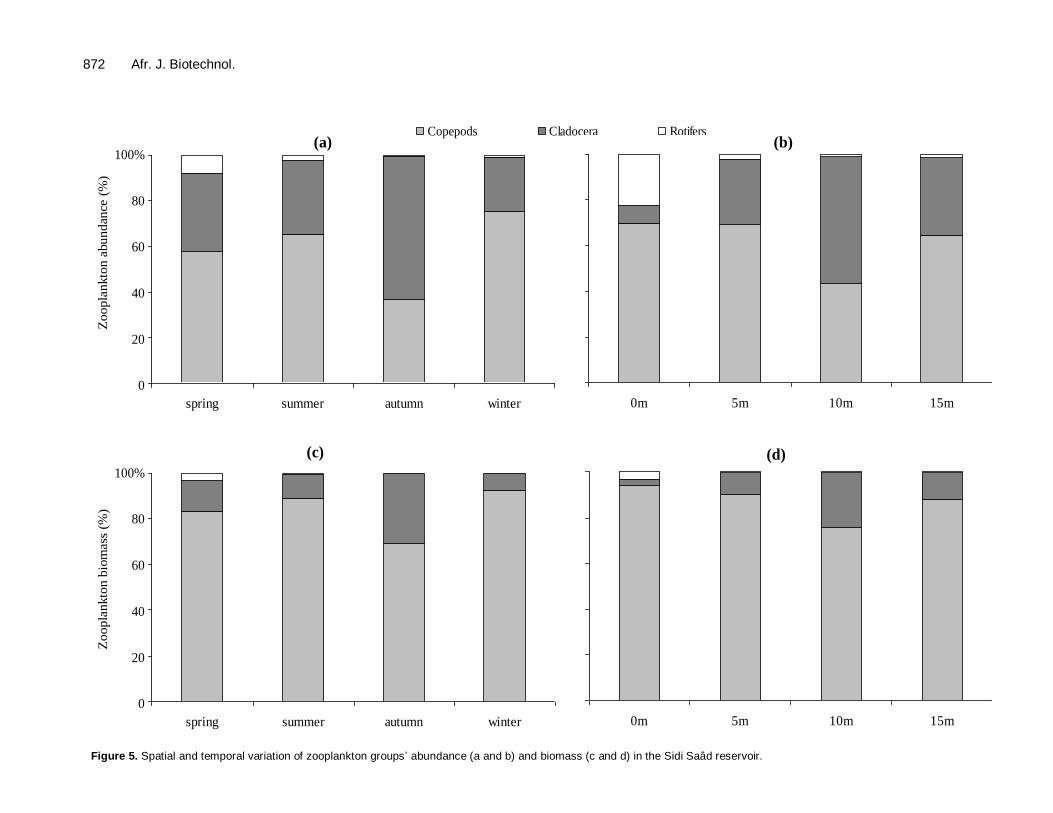
The total zooplankton abundance ranged from 0.7 ind L-1
in spring at surface to 92.2 ind l
-1 in summer at a depth of
10 m (mean ± s.d. = 25.8 ± 32.2 ind L-1
), and the biomass varied from 1.7 µg l
-1 in spring at surface and 0.43 × 10
3
µg l-1
in summer at a depth of 10 m (mean ± s.d. = 1.1 × 10
3 ± 1.4 × 10
3 µg l
-1). There were two peaks in autumn
(86.9 ind L-1
, 0.23 × 10³ µg L
-1) and especially in summer
(92.2 ind L-1, 0.43 × 10
3 µg L
-1) at a depth of 10 m. These
peaks of abundance and biomass were associated with the development of the copepods and cladocera (Figure 5a to d). The species A. viridis and D. brachyurum were responsible for the exceptional peak the abundance that occurred in summer, accounting respectively for 57% and 38% of the total zooplankton abundance. The peak of biomass was related to the proliferation of the copepods (the species A. viridis accounted for 83% of the total biomass).
Sellami et al. 869
Temperature (°C)
-15
-10
-5
0
0 5 10 15 20 25 30
Dep
th (
m)
spring summerautumn w inter
Dissolved oxygen (mg l-1
)
-15
-10
-5
0
0 2 4 6 8 10
Dep
th (
m)
spring summerautumn w inter
pH
-15
-10
-5
0
0 2 4 6 8 10
Dep
th (
m)
spring summerautumn w inter
Suspended matter (mg l-1
)
-15
-10
-5
0
0 10 20 30 40
Dep
th (
m)
spring summerautumn winter
NT (mg l-1
)
-15
-10
-5
0
0.0 0.5 1.0 1.5 2.0
Dep
th (
m)
spring summerautumn w inter
PT (mg l-1
)
-15
-10
-5
0
0.00 0.02 0.04 0.06 0.08
Dep
th (
m)
spring summerautumn w inter
(a) (b) (c)
(d) (e) (f)
Figure 3. Vertical profiles of water temperature (a), dissolved oxygen (b), and pH (c), suspended matter (d), total nitrogen (e) and total phosphorus (f) along the water column in the Sidi Saâd reservoir.
Table 1. Values of trophic index
TSIC TSIC Sidi Saâd Trophic status TLB TSIB Sidi Saâd Trophic status
<30 Oligotrophic 0.0 - 1.0 Ultra-microtrophic
30-40 34.5 Oligo-mesotrophic 1.0 - 2.0 Microtrophic
40-50 Mesotrophic 2.0 - 3.0 Oligotrophic
50-60 Eutrophic 3.0 - 4.0 Mesotrophic
60-70 Eutrophic- hypereutrophic 4.0 - 5.0 5 Eutrophic
>70 Hypereutrophic 5.0 - 6.0 Supertrophic
6.0 - 7.0 Hypertrophic
TSIC, Carlson and Simpson index; TSIB, Burns and Bryers index.
870 Afr. J. Biotechnol.
Table 2 . Plankton taxa found in Sidi Saâd reservoir.
Phytoplankton Zooplankton
Cyanophyceae Dinophyceae Copepoda
Anabaena sp. Gonyaulax sp. Acanthocyclops robustus Acanthocyclops viridis
Chroococcus sp. Gonyaulax spinifera
Gloeothece sp. Peridinium africanum Cladocera
Microcystis aeruginosa Peridinium sp. Diaphanosoma brachyurum
Microcystis sp. Protoperidinium sp.
Planktolyngbya subtilis
Rotifera
Pseudoanabena sp. Chlorophyceae Brachionus urceolaris
Scenedesmus sp. Hexarthra mira
Bacillariophyceae Closterium sp. Keratella quadrata
Amphiprora sp. Tetraedron sp. Keratella cochlearis
Cylindrotheca closterium
Asplanchna sp.
Navicula sp.1 Conjugatophyceae
Navicula sp.2 Cosmarium sp.
Nitzschia sp.
Pinnularia sp.
0%
20%
40%
60%
80%
100%
spring summer autumn winter
Dinophyceae Bacillariophyceae Cyanobacteriae others
0%
20%
40%
60%
80%
100%
0m 5m 10m 15m
Dinophyceae Bacillariophyceae Cyanobacteriae Others
100%
80
60
40
20
0
(a)
Ph
yto
pla
nkto
n a
bu
ndan
ce (
%)
100%
80
60
40
20
0
0%
20%
40%
60%
80%
100%
0m 5m 10m 15m
Dinophyceae Bacillariophyceae Cyanobacteriae Others
Ph
yto
pla
nkto
n a
bu
ndan
ce (
%)
0
5
10
15
20
spring summer autumn winter
0m 5m 10m 15m
Ch
loro
phy
ll a
co
nce
ntr
atio
n (
µg L
-1)
0
0.05
0.1
0.15
0.2
0.25
spring summer autumn winter
Millio
ns
0m 5m 10m 15m7.2
(b)
(c)
Figure 4. Spatial and temporal variation of phytoplankton abundance groups’ (a and b) and chlorophyll a
concentrations(c) in the Sidi Saâd reservoir.
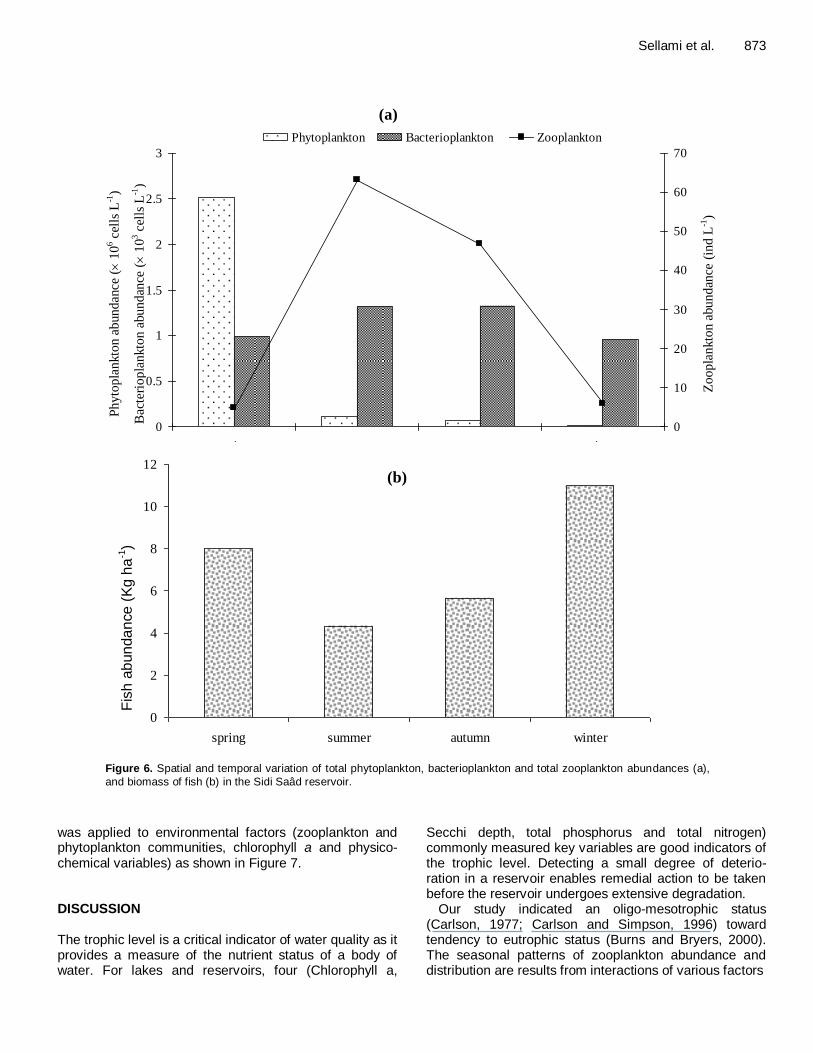
The species D. brachyurum (78% of the total abun-dance) and A. viridis were responsible for the peak that occurred in autumn (17% of the total zooplankton abundance, and 48% of the total zooplankton biomass). The relationship between phytoplankton and zoo-
plankton was evidenced by a comparison of further changes in density of both communities. Consequently, the decrease in the density of phytoplankton was asso-ciated by an increase in zooplankton density (Figure 6a). More also, the biomass of fish varied between 4.33 Kg
Sellami et al. 871
0%
20%
40%
60%
80%
100%
spring summer autumn winter
Dinophyceae Bacillariophyceae Cyanobacteriae others
0%
20%
40%
60%
80%
100%
0m 5m 10m 15m
Dinophyceae Bacillariophyceae Cyanobacteriae Others
100%
80
60
40
20
0
(a)
Ph
yto
pla
nkto
n a
bu
ndan
ce (
%)
100%
80
60
40
20
0
0%
20%
40%
60%
80%
100%
0m 5m 10m 15m
Dinophyceae Bacillariophyceae Cyanobacteriae Others
Ph
yto
pla
nkto
n a
bu
ndan
ce (
%)
0
5
10
15
20
spring summer autumn winter
0m 5m 10m 15m
Ch
loro
phy
ll a
co
nce
ntr
atio
n (
µg L
-1)
0
0.05
0.1
0.15
0.2
0.25
spring summer autumn winter
Millio
ns
0m 5m 10m 15m7.2
(b)
(c)
0%
20%
40%
60%
80%
100%
spring summer autumn winter
Dinophyceae Bacillariophyceae Cyanobacteriae others
0%
20%
40%
60%
80%
100%
0m 5m 10m 15m
Dinophyceae Bacillariophyceae Cyanobacteriae Others
100%
80
60
40
20
0
(a)
Phyto
pla
nkto
n a
bundan
ce (
%)
100%
80
60
40
20
0
0%
20%
40%
60%
80%
100%
0m 5m 10m 15m
Dinophyceae Bacillariophyceae Cyanobacteriae Others
Phyto
pla
nkto
n a
bundan
ce (
%)
0
5
10
15
20
spring summer autumn winter
0m 5m 10m 15m
Chlo
rophyll
a c
once
ntr
atio
n (
µg L
-1)
0
0.05
0.1
0.15
0.2
0.25
spring summer autumn winter
Millio
ns
0m 5m 10m 15m7.2
(b)
(c)
Figure 4. Continue.
per hectare in summer and 11 Kg per hectare in winter (Figure 6b). Species diversity The diversity index of phytoplankton (H’) varied between the seasons. The higher values were observed in autumn (2.93 bits cells
-1, 18 species). However, the lowest are
observed in spring (1.46 bits cells-1
, 14 species). The
diversity index of zooplankton (H’) varied between 0.80 bits ind L
-1 in winter and 1.38 bits ind L
-1 in spring.
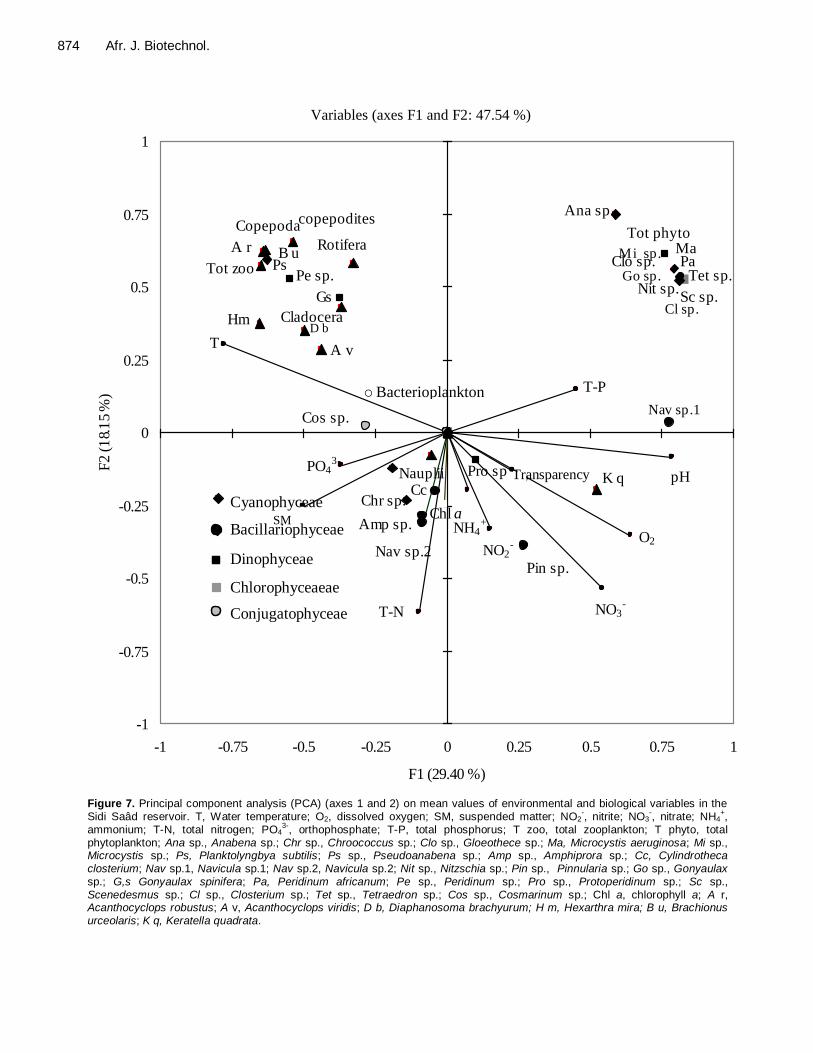
Community analysis The zooplankton abundance was positively correlated with the temperature (r = 0.53, p = 0.027, n = 16) and negatively correlated with the dissolved oxygen (r = -0.59, p = 0.03, n =16). A principal component analysis (PCA)
872 Afr. J. Biotechnol.
0%
20%
40%
60%
80%
100%
spring summer autumn winter
Copepods Cladocera Rotifers
100%
80
60
40
20
0 0%
20%
40%
60%
80%
100%
spring summer autumn winter
Copepods Cladocera Rotifers
Zo
op
lan
kto
n a
bu
nd
ance
(%
)
0%
20%
40%
60%
80%
100%
0m 5m 10m 15m
Copepods Cladocera Rotifers
Zo
op
lan
kto
n b
iom
ass
(%
)
0%
20%
40%
60%
80%
100%
spring summer autumn winter
Copepods Cladocera Rotifers
100%
80
60
40
20
0 0%
20%
40%
60%
80%
100%
0m 5m 10m 15m
Copepods Cladocera Rotifers
(a) (b)
(c) (d)
Figure 5. Spatial and temporal variation of zooplankton groups’ abundance (a and b) and biomass (c and d) in the Sidi Saâd reservoir.
Sellami et al. 873
Sidi Saâd
0
2
4
6
8
10
12
spring summer autumn winter
Sidi Saâd0
0.5
1
1.5
2
2.5
3
spring summer autumn winter
Mil
lio
ns
0
10
20
30
40
50
60
70
Phytoplankton Bacterioplankton Zooplankton
Fis
h a
bun
da
nce
(K
g h
a-1
) P
hyto
pla
nkto
n a
bundan
ce (
10
6 c
ells
L-1
)
Bac
teri
opla
nkto
n a
bundan
ce (
10
3 c
ells
L-1
)
Zoopla
nkto
n a
bundan
ce (
ind L
-1)
(a)
(b)
Figure 6. Spatial and temporal variation of total phytoplankton, bacterioplankton and total zooplankton abundances (a),
and biomass of fish (b) in the Sidi Saâd reservoir.
was applied to environmental factors (zooplankton and phytoplankton communities, chlorophyll a and physico-chemical variables) as shown in Figure 7. DISCUSSION The trophic level is a critical indicator of water quality as it provides a measure of the nutrient status of a body of water. For lakes and reservoirs, four (Chlorophyll a,
Secchi depth, total phosphorus and total nitrogen) commonly measured key variables are good indicators of the trophic level. Detecting a small degree of deterio-ration in a reservoir enables remedial action to be taken before the reservoir undergoes extensive degradation.
Our study indicated an oligo-mesotrophic status (Carlson, 1977; Carlson and Simpson, 1996) toward tendency to eutrophic status (Burns and Bryers, 2000). The seasonal patterns of zooplankton abundance and distribution are results from interactions of various factors
874 Afr. J. Biotechnol.
Variables (axis F1 and F2 : 47.54 %)
T
O2
pHZD
NO2-
NO3-
NH4+
PO43-
T-N
T-P
ChlMES
Pro sp.
PaPe sp.
GsNit sp.
Nav sp.2
Amp sp.
Pin sp.
Cc
MaClo sp.
Chr sp.
Ana sp.
Ps
Sc sp.
Tet sp.
Cos sp.
Tot phyto
A v
A r
Nauplii
copepoditesCopepoda
Hm
K q
B u
Cladocera
Rotifera
Tot zoo
-1
-0.75
-0.5
-0.25
0
0.25
0.5
0.75
1
-1 -0.75 -0.5 -0.25 0 0.25 0.5 0.75 1
F1 (29.40 %)
F2
(1
8.1
5 %
)
Nav sp.1
Cl sp.
Mi sp.
Go sp.
a SM
D b
Variables (axes F1 and F2: 47.54 %)
Bacterioplankton o
Transparency
Variables (axis F1 and F2 : 47.54 %)
T
O2
pHZD
NO2-
NO3-
NH4+
PO43-
Chl
Pro sp.
Pa
Pe sp. Gs
Nit sp.
Nav sp.2
Amp sp.
Pin sp.
Cc
MaClo sp.
Chr sp.
Ana sp.
Ps
Sc sp.
Tet sp.
Tot phyto A r
Nauplii
copepodites
Copepoda
Hm
K q
B u
Cladocera
Rotifera
Tot zoo
-1
-0.75
-0.5
-0.25
0
0.25
0.5
0.75
1
-1 -0.75 -0.5 -0.25 0 0.25 0.5 0.75 1
F1 (29.40 %)
F2
(1
8.1
5 %
)
Variables (axis F1 and F2 : 47.54 %)
T
O2
pHZD
NO2-
NO3-
NH4+
PO43-
T-N
T-P
ChlMES
Pro sp.
Pa
Pe sp.
GsNit sp.
Nav sp.2
Amp sp.
Pin sp.
Cc
Ma
Clo sp.
Chr sp.
Ana sp.Ps
Sc sp.
Tet sp.
Cos sp.
Tot phyto A v
A r
Nauplii
copepoditesCopepoda
Hm
K q
B u
Cladocera
Rotifera
Tot zoo
-1
-0.75
-0.5
-0.25
0
0.25
0.5
0.75
1
-1 -0.75 -0.5 -0.25 0 0.25 0.5 0.75 1
F1 (29.40 %)
F2
(1
8.1
5 %
)
Dinophyceae
ae
Cyanophyceae
Bacillariophyceae
Chlorophyceaeae
Conjugatophyceae
ae
Figure 7. Principal component analysis (PCA) (axes 1 and 2) on mean values of environmental and biological variables in the Sidi Saâd reservoir. T, Water temperature; O2, dissolved oxygen; SM, suspended matter; NO2
-, nitrite; NO3
-, nitrate; NH4
+,
ammonium; T-N, total nitrogen; PO43-
, orthophosphate; T-P, total phosphorus; T zoo, total zooplankton; T phyto, total
phytoplankton; Ana sp., Anabena sp.; Chr sp., Chroococcus sp.; Clo sp., Gloeothece sp.; Ma, Microcystis aeruginosa; Mi sp., Microcystis sp.; Ps, Planktolyngbya subtilis; Ps sp., Pseudoanabena sp.; Amp sp., Amphiprora sp.; Cc, Cylindrotheca
closterium; Nav sp.1, Navicula sp.1; Nav sp.2, Navicula sp.2; Nit sp., Nitzschia sp.; Pin sp., Pinnularia sp.; Go sp., Gonyaulax
sp.; G,s Gonyaulax spinifera; Pa, Peridinum africanum; Pe sp., Peridinum sp.; Pro sp., Protoperidinum sp.; Sc sp., Scenedesmus sp.; Cl sp., Closterium sp.; Tet sp., Tetraedron sp.; Cos sp., Cosmarinum sp.; Chl a, chlorophyll a; A r, Acanthocyclops robustus; A v, Acanthocyclops viridis; D b, Diaphanosoma brachyurum; H m, Hexarthra mira; B u, Brachionus
urceolaris; K q, Keratella quadrata.
such as water temperature, food quality, competition and selective feeding of fish. The highest density of zooplankton was recorded in summer and autumn; which can be related to temperature (averaged 25°C). A positive correlation was observed between zooplankton abundance and temperature (r = 0.53, p = 0.027, n =16). This is in accordance with the study of Primo et al. (2009) concluding that water temperature was the main factor influencing the spatial and temporal patterns of zoo-plankton distributions. Furthermore, not much variation in pH values was observed. Water pH is known to affect crustacean plankton community composition (DeSellas et al., 2008; Tavernini et al., 2009) with crustaceans being more sensitive than rotifers to extreme pH levels (Berzins and Bertilsson, 1990). The dissolved oxygen values were decreased in summer and autumn. This depletion was associated with the development of zooplankton. A negative correlation was observed between zooplankton abundance and dissolved oxygen (r = -0.59, p = 0.03, n = 16). Our findings appear to agree with what is known
about the influence of dissolved of oxygen on zoo-plankton densities (Whitman et al., 2004). Probably, the high abundance of phytoplankton caused high content of dissolved oxygen, thus negative correlation.
In the present study, the zooplankton abundance was dominated by cyclopoid copepods and cladocerans; comparable results have been found in floodplain reservoir (Fisher and Parsley, 1979). Among the cope-pods, juveniles (copepodites) dominated. Food availability and quality are important factors determining the abundance and composition of zooplankton communities in this reservoir. And similar results were found by Agasild et al. (2007). During the study period, the dominance of inedible cyanobacteria provokes a very low species diversity of zooplankton; only one species of cladocera, D. brachyurum was found. An ecosystem generally becomes poor at high trophic levels (Leoni and Garibaldi, 2009) with few species and a low structural complexity.
The absence of Daphnia was probably explained by the quality of food. The absence of daphnids as also caused by presence of planktivorous fish. In lakes, planktivorous fish have significant impacts on zooplankton (Persson et al., 2004) imposing top-down control on the food web. In Missisquoi Bay, introduced planktivorous fish had impact plankton communities through a reduction in Daphnia density (Couture and Watzin, 2008). Thus, good predictors for the observed variability of daphnid growth in reservoirs were found among a variety of algal quality and quantity (Scheuerell et al., 2002). The rotifers are not susceptible to a toxic influence of blue-green algae (Kirk and Gilbert, 1992). Thus, the low density of rotifer observed during this study was probably caused by other factors such as invertebrate predation. The importance of invertebrate predation on rotifer populations was confirmed by Yan et al. (1991).
Sellami et al. 875
The warm temperatures in spring, typical of semi arid area, that enables a faster growth of cyanobacteria, possibly allied with cladoceran grazing pressure (top-down control) in small edible phytoplankton, promote their dominance and the appearance of blooms in Sidi Saâd. Many studies (Weithoff et al., 2000) show that zooplankton grazing can interfere in phytoplankton dynamics and have an impact on phytoplankton diversity. The development of cyanobacteria can explain the unobserved spring peak of zooplankton in this reservoir. Similar results were found by Abrantes et al. (2006). The peak of zooplankton, especially the cladocera, occurs in autumn as a consequence of the nutrient replenishment (bottom-up control) and the subsequent development of cyanobacteria.
Therefore, smaller cladocerans are less affected by cyanobacteria (Pinel-Alloul, 1993). In contrast, cyclopoids can be expected to be more sensitive to food quantity and quality (Anneville et al., 2007). In winter, the reduction of light energy results in phytoplankton density decrease to the minimum, which is associated to cool winter temperatures and restricts zooplankton production rates and, for some species, stimulates diapause (Sommer et al., 1986). In addition, the lower temperature (< 10°C) is also an important factor that can explain their lower winter densities. Furthermore, the results showed that the zooplankton community structure is significantly influenced by precipitation, with maximum values of 56 mm in winter. The same results were found by Guevara et al. (2009) showing that a negative association was observed between zooplankton density and rainfall intensity. In the same way copepods (cyclopoids) became abundant when rainfall was lower (Sánchez-Carrillo and Cobelas, 2001).
The variation in chlorophyll a values was also reflected in zooplankton densities. An inverse zooplankton-chlorophyll a relationship was observed. These results are in agreement with study by Forrest and Arnott (2007). In addition, the highest zooplankton density was found in the upper water layer (0 to 10 m). This vertical distribution was probably related to the food accessibility. This finding supports the field observations of several studies (Cherbi et al., 2008). The zooplankton community of Sidi Saâd reservoir (mainly cyclopoids copepods and D. brachyurum) probably had a lesser impact on bacteria because of their specific feeding modes (Sanders and Wickham, 1993). Cyclopoid copepods are mainly carnivores, feeding on relatively large prey, while smaller prey like bacteria are not efficiently ingested (Sanders and Wickham, 1993). We did not observe a significant correlation between zooplankton and bacterioplankton abundances. Moreover, fish predation is another factor affecting the zooplankton community. The decline of zooplankton density in spring and winter was probably attributable to the top-down control from planktivorous fishes (Figure 6b). These results are in agreement with many studies (Abrantes et al., 2006; Medley and Havel,
876 Afr. J. Biotechnol. 2007). Conclusion Environmental parameters especially the water tempe-rature and dissolved oxygen play an important role in determining the zooplankton species abundance and diversity in the Sidi Saâd reservoir. Moreover, the present work demonstrated that phytoplankton is an important factor responsible for the succession of zooplankton community, which is well related to changes in algae composition and density, the cyanobacteria being the group with major impact. Furthermore, fish predation is another factor affecting the zooplankton seasonal dynamics. In addition, the occurrence of a massive Cyanobacteria bloom during this study and the dominance of cyclopoids copepods in this reservoir indicated high trophic levels. REFERENCES
Abrantes N, Antunes SC, Pereira MJ, Gonçalves F (2006). Seasonal
succession of cladocerans and phytoplankton and their interactions in
a shallow eutrophic lake (LakeVela, Portugal). Acta Oecol. 29: 54-64. Agasild H, Zingel P, Tonno I, Haberman J, Noges T (2007). Contribution
of different zooplankton groups in grazing on phytoplankton in
shallow eutrophic Lake Vortsjarv (Estonia). Hydrobiologia, 584: 167-77.
Alvarez-Cobelas M, Rojo C, Angeler DG (2005). Mediterranean
limnology: current status, gaps and the future. J. Limnol. 64(1): 13-29.
Anneville O, Molinero JC, Souissi S, Balvay G, Gerdeaux D (2007).
Long-term changes in the copepod community of Lake Geneva. J. Plankton Res. 29: 49-59.
Baker DR (1991). Interdiffusion of hydrous dacitic and rhyolitic melts
and the efficacy of rhyolite contamination by dacitic enclaves. Contributions, Mineral. Petrol. 106: 462-473.
Baker DR (1992). Interdiffusion of geologic melts: calculations using
transition state theory. Chem. Geol. 98: 11-21. Berzins B, Bertilsson J (1990). Occurrence of limnic microcrustaceans
in relation to pH and humic content in Swedish waterbodies. Hydrobiologia, 199: 65-71.
Booth BC (1993). Estimating cell concentration and biomass of autotrophic plankton using microscopy. In Kemp PF, Sherr BF, Cole JJ (eds), Handbook of Methods in Aquatic Microbial Ecology. Boca
Raton, Florida, pp 199-205. Bottrell HH, Duncan A, Gliwicz ZM, Grygierek E, Herzig A, Hillbricht-
Ilkowska A, Kurasawa H, Larsson P, Weglenska T (1976). A review
of some problems in zooplankton production studies. Norwegian J. Zool. 24: 419-456.
Bourrelly P (1985). Freshwater algae. Tome III: bleu and red algae.
French, Boubée and Cie, Paris, p. 606. Burns N, Bryers G (2000). Protocol for Monitoring Trophic Levels of
New Zealand lakes and Reservoirs. Lakes Consulting, Pauanui.
Carlson RE, Simpson J (1996). A Coordinator’s Guide to Volunteer Lake Monitoring Methods. N. Am. Lake Manage. Soc. p. 96
Carlson RE (1977). A trophic state index for lakes. Limnol. Oceanogr.
22: 361-369. Cherbi M, Lek-Ang S, Lek S, Arab A (2008). Zooplankton distribution in
Mediterranean lakes. C. R. Biologies, 331: 692-702.
Chessel D, Doledec S (1992). ADE Software (Version 3.6), multivariate Analyses and Graphical Display for Environmental Data. User’s Manual.
Couture SC, Watzin MC (2008). Diet of Invasive Adult White Perch (Morone americana) and their Effects on the Zooplankton Community
in Missisquoi Bay, Lake Champlain. J. Great Lakes Res. 34:485-494. DeSellas AM, Paterson AM, Sweetman JN, Smol JP (2008). Cladocera
assemblages from the surface sediments of south-central Ontario
(Canada) lakes and their relationships to measured environmental variables. Hydrobiologia, 600: 105-119.
Dussart B (1969). Freshwater copepods of the occidental Europe. Tome
II : Cyclopoides and quantitative biology, N. Boubée and Cie, French Paris, p. 292.
Fisher TR, Parsley PE (1979). Amazon lakes: water storage and
nutrient stripping by algae. Limnol. Oceanogr. 24: 547-553. Forrest J, Arnott SE (2007). Variability and predictability in a
zooplankton community: The roles of disturbance and dispersal.
Ecoscience, 14: 137-145. Frontier S (1973). Statistic study of the zooplankton dispersion. J. Exp.
Mar. Biol. Ecol. 12: 229-262.
Guevara G, Lozano P, Reinoso G, Villa F (2009). Horizontal and seasonal patterns of tropical zooplankton from the eutrophic Prado Reservoir (Colombia). Limnologica, 39: 128-139.
Kirk KL, Gilbert JJ (1992). Variation in herbivore response to chemical defenses: zooplankton foraging on toxic caynobacteria. Ecology, 73: 2208-2217.
Korovchinsky NM (1992). Sididae et holopediidae (Crustacea: Daphniiformes). Guides to the identification of the Microinvertebrates of the continental of the word 3. SPB Acad. Publ. p. 85
Koste W (1978). Rotatoria. Die Rädertiere Mitteleuropas. Ein Bestimmungswerk begründet von Max Voigt. Borntrager, Stuttgart, (1), Textband, 673(2), Tafelband, 234 pp.
Larson GL, Hoffman R, Mcintire CD, Lienkaemper G, Samora B (2009). Zooplankton assemblages in montane lakes and ponds of Mount Rainier National Park, Washington State, USA. J. Plankton Res. 31:
273-285. Leibold MA, Holyoak M, Mouquet N, Amarasekare P, Chase JM,
Hoopes MF, Holt RD, Shurin JB, Law R, Tilman D, Loreau M,
Gonzalez A (2004). The metacommunity concept: a framework for multi-scale community ecology. Ecol. Lett. 7: 601-613.
Leoni B, Garibaldi L (2009). Population dynamics of Chaoborus
flavicans and Daphnia spp.: effects on a zooplankton community in a
volcanic eutrophic lake with naturally high metal concentrations (L. Monticchio Grande, Southern Italy). J. Limnol. 68: 37-45.
Li Y, Chen Y, Song B, Olson D, YUN, Chena L (2009). Ecosystem structure and functioning of Lake Taihu (China) and the impacts of fishing. Fish. Res. 95: 309-324.
Lorenzen CJ (1967). Determination of chlorophyll and phaeopigments: Spectrophotometric equations. Limnol. Oceanogr. 12: 343-346.
McQueen DJ, France R, Post JR, Stewart TJ, Lean DRS (1989).
Bottom-up and topdown impacts on freshwater pelagic community structure. Ecol. Monogr. 59: 289-309.
McQueen DJ, Post JR, Mills EL (1986). Trophic relationships in freshwater pelagic ecosystems. Can. J. Fish. Aquat. Sci. 43: 1571-
1581. Medley KA, Havel JE (2007). Hydrology and local environmental factors
influencing zooplankton communities in floodplain ponds. Wetlands,
27: 864-872. Mehner T, Padisak J, Kasprzak P, Koschel R, Krienitz L (2008). A test
of food web hypotheses by exploring time series of fish, zooplankton
and phytoplankton in an oligo-mesotrophic lake. Limnologica, 38: 179-188.
Mitra G, Mukhopadhyay PK, Ayyappan S (2007). Biochemical
composition of zooplankton community grown in freshwater earthen ponds: Nutritional implication in nursery rearing of fish larvae and early juveniles. Aquaculture, 272: 346-360.
Moss B, Stephen D, Balayla DM, Bécares E, Collings SE, Fernández-Aláez C, Ferriol C, García P, Gomá J, Gyllström M, Hansson LA, Hietala J, Kairesalo T, Miracle MR, Romo S, Rueda J, Russell V,
Ståhl-Delbanco A, Svensson M, Vakkilainen K, Valentín M, van de Bund WH, van Donk E, Vicente E, Villena MJ (2004). Continental-scale pattern of nutrient and fish effects on shallow lakes: synthesis
of pan- European mesocosm experiments. Freshwat. Biol. 499: 1633-1649.
Persson L, Bystr ِ m P, Wahlstr ِ m E, Westman E (2004). Trophic
dynamics in a whole lake experiment: Size-structured interactions and recruitment variation. Oikos, 106: 263-274.
Pinel-Alloul B, Ghadouani A (2007). Spatial heterogeneity of planktonic
microorganisms in aquatic systems: multiscale patterns and processes. Chapter 8. In: The importance of spatial scale on the
analysis of patterns and processes in microbial communities. Franklin RB and Mills AL. (Eds.). Kluwer Publi. pp. 203-209.
Pinel-Alloul B (1993). Zooplankton community structure in hardwater
eutrophic and hypereutrophic lakes of Alberta. Water Sci. Technol. 27: 353-61.
Porter K, Feig YS (1980). The use of DAPI for identifying and counting
aquatic microflora. Limnol. Oceanogr. 25: 943-948. Pourriot R, Francez AJ (1986). Rotifers. Introduction for the systematic
of the french freshwater organism. Bull. Mens. Soc. Linn. Lyon, pp. 5-
37. Primo AL, Azeiteiro UM, Marques SC, Martinho F, Pardal MA (2009).
Changes in zooplankton diversity and distribution pattern under
varying precipitation. Estuar. Coast. Shelf Sci. 82: 341-347. Sánchez-Carrillo S, Cobelas A (2001). Nutrient dynamics and
eutrophication patterns in a semi-arid wetland: the effects of
fluctuating hydrology. Water, Air, Soil Pollut. 131: 97-118. Sanders RW, Wickham SA (1993). Planktonic protozoa and metazoa:
predation, food quality and population. Control. Mar. Microb.
Foodwebs, 7: 197-223. Scheuerell MD, Schindler DE, Litt AH, Edmondson WT (2002).
Environmental and algal forcing of Daphnia production dynamics.
Limnol. Oceanogr. 47: 1477-1485. Shannon CE, Weaver G (1949). The Mathematical Theory of
Communication. University of illinois Press, urbana, Chicago, Il.
Sommer U, Gliwicz ZM, Lampert W, Duncan A (1986). The PEG-model of seasonal succession of planktonic events in fresh waters. Arch. Hydrobiol. 106: 433-471.
Sellami et al. 877 Tavernini S, Primicerio R, Rossetti G (2009). Zooplankton assembly in
mountain lentic waters is primarily driven by local processes. Acta Oecol. 35: 22-31.
Utermöhl H (1958). Zur Vervollkommung der quantitativen Phytoplankton methodik. mitteilungen internationale Vereinigung für theoretische und angewandte. Limnol. 9: 1-38.
Vanni MJ, Luecke C, Kitchell JF, Allen Y, Temte J, Magnuson JJ (1990). Effects on lower trophic levels of massive fish mortality. Nature, 344: 333-335.
Weithoff G, Lorke A, Walz N (2000). Effects of water-column mixing on bacteria, phytoplankton, and rotifers under different levels of herbivory in a shallow eutrophic lake. Oecologia, 125: 91-100.
Whitman RL, Nevers, MB, Goodrich ML, Murphy PC, Davis BM (2004). Characterization of Lake Michigan coastal lakes using zooplankton assemblages. Ecol. Indic. 4: 277-286.
Wikner J, Rassoulzadegan F, Hagström Å (1990). Periodic bacterivore activity balances bacterial growth in the marine environment. Limnol. Oceanogr. 35: 313-324.
Yan ND, Keller W, MacIsaac HJ, McEachern LJ (1991). Regulation of zooplankton community structure of an acidified lake by Chaoborus.
Ecol. Appl. 1: 52-65.