GEOELECTRICAL STUDY ON THE GROUNDWATER OCCURRENCE IN THE AREA SOUTHWEST OF SIDI BARRANI,...
19
GEOELECTRICAL STUDY ON THE GROUNDWATER OCCURRENCE IN THE AREA SOUTHWEST OF SIDI BARRANI, NORTHWESTERN COAST, EGYPT. By Hosny, M. M. Ezz El- Deen, Al Abaseiry Abdallah. Abdel Rahman and Mostafa, S. M. Barseim Geophysical Exploration department, Desert Research Center. ABSTRACT. The study area is lying at the distance of about 35 km west of the city of Sidi Barrani and about 50 km to the east of the Sallum City and it is lying of about 9 kilometers south of the Mediterranean shore line covering about 32 Km. 2 It occupies a portion of the semiarid climatic conditions area of Egypt. Geomorphologically, the study area lies on the piedmont plain having a general slope northward towards the Mediterranean Sea. Stratigraphically, deposits in the study area ranging in age from the Tertiary to Quaternary. The Miocene is the main aquifer in the area. It consists of different varieties from carbonate rocks, which playing an important role to groundwater potentiality. The water bearing formations would be recharged from local rainfall received generally by the area and its vicinities The main purpose of the present investigation is finding out the shallow groundwater aquifer exists in the area through the application of two geoelectrical techniques (Vertical Electrical Sounding & Two-dimensional (2D) geoelectrical imaging). A grid pattern consists of 15 Vertical Electrical Sounding (V.E.S) stations have been carried out in the concerned area. The Schlumberger electrodes configuration was used, with current electrodes distance from 1000 to 1400m. Also, the two-dimensional (2D) geoelectrical imaging (Tomography) with Wenner measurements have been carried out along a profile in West-East direction with a length of 510m at Sanyet Eshenderra with purpose of finding out the extension, depth and the thickness of the shallow aquifer. This technique can determine the fractures within the aquifer with high resolution. The interpretation of the geoelectrical data led to the identification of the geoelectrical and geological successions consists of five geoelectrical layers (the first is Surface layer, the second layer is dry and composed of limestone with clay intercalation, the third layer is fractured limestone and represented of water bearing layer, the fourth layer is clay, while the last layer is dry limestone). Generally, The resistivity values and the thickness of the aquifer are increasing toward the east direction in the study area. This attributed to increasing potentiality of water, good water quality and best production of wells in that direction. The results of geoelectrical data revealed that groundwater exists in the 1
Transcript of GEOELECTRICAL STUDY ON THE GROUNDWATER OCCURRENCE IN THE AREA SOUTHWEST OF SIDI BARRANI,...
GEOELECTRICAL STUDY ON THE GROUNDWATER OCCURRENCE INTHE AREA SOUTHWEST OF
SIDI BARRANI, NORTHWESTERN COAST, EGYPT.By
Hosny, M. M. Ezz El- Deen, Al Abaseiry Abdallah. AbdelRahman
and Mostafa, S. M. Barseim
Geophysical Exploration department, Desert Research Center.
ABSTRACT. The study area is lying at the distance of about 35 km west of the city of Sidi Barrani and about 50 km to the east of the Sallum City and it is lying of about 9 kilometers south of the Mediterranean shore line covering about 32 Km.2 It occupies a portion of the semiarid climatic conditions area of Egypt. Geomorphologically, the study area lies on the piedmont plain having a general slope northward towards the Mediterranean Sea. Stratigraphically, deposits in thestudy area ranging in age from the Tertiary to Quaternary. The Miocene is the main aquifer in the area. It consists of different varieties from carbonate rocks, which playing an important role to groundwater potentiality. The water bearing formations would be recharged from local rainfall received generally by the area and its vicinities
The main purpose of the present investigation is finding out the shallow groundwater aquifer exists in the area through the application of two geoelectrical techniques (Vertical Electrical Sounding & Two-dimensional (2D) geoelectrical imaging).
A grid pattern consists of 15 Vertical Electrical Sounding (V.E.S) stations have been carried out in the concerned area. The Schlumberger electrodes configuration was used, with current electrodes distance from 1000 to 1400m. Also, the two-dimensional (2D) geoelectrical imaging (Tomography) with Wenner measurements have been carried out along a profile in West-East direction with a length of 510m at Sanyet Eshenderra with purpose of finding out the extension, depth and the thickness of the shallow aquifer. This technique can determine the fractures within the aquifer with high resolution.
The interpretation of the geoelectrical data led to the identification of the geoelectrical and geological successions consists of five geoelectrical layers (the first is Surface layer, the second layer is dry and composed of limestone with clay intercalation, the third layer is fractured limestone and represented of water bearing layer, the fourth layer is clay, while the last layer is dry limestone). Generally, The resistivity values and the thickness of the aquifer are increasing toward the east direction in the study area. This attributed to increasing potentiality of water, good water quality and best production of wells in that direction. The results of geoelectrical data revealed that groundwater exists in the
1
study area depend mainly on the density of fissures and fractures within these rocks.
The area is influenced by faults affects the subsurface successions forming a graben in the central part of the area.
The above-mentioned results can help the decision-maker in the process of agricultural development in the area.
INTRODUCTION
The Northwestern Littoral Zone of Egypt overlooking the Mediterranean Sea is a part of the Western Desert that witnessed the end of the Second World War. Thousands of mine fields are buried under the drift sands of that desert, prohibiting thus any sort of development of that part of the country. Small limited areas have been demined and cleared, however, by means of the Egyptian armed forces and became ready to be agriculturally developed. Several trials have been made to provide the needed water through rainwater harvesting such as sisters but the amount of water so provided was proved to be insufficient. Additional water resources were then planed to be complementing the irrigationwater of the area. As the nature and capacity of these local resources were not accurately known, geophysical exploration techniques are needed to clarify the groundwater setting within the demand area.
Location of the study area.The study area is in the form of a parallelogram lying at
an average distance of about 35 km west of Sidi Barrani city and about 50 km to the east of the Sallum City and it is lying of about 9 kilometers south of the Mediterranean shore line as shown in Figure (1). It lies between Latitudes 31º 24' 16" & 31º 27' 16" N and Longitudes 25º 32' 00" & 25º 38' 33" E, with an area of about 32 Km.2
2

GEOMORPHOLOGICAL AND GEOLOGICAL ASPECTS
The area of study lies within the northern part of the “Great Marmarican Homoclinal Plateau”. It is characterizedby semi-arid climatic conditions. Within the study area the ground surface has an average elevation of about 40m. Different geomorphologic and geological studies were carried out along the northwestern Mediterranean coastal zone. Among these Shata(1953, 1955 and 1971), Said (1962),Abdallah (1966 a and 1966 b), Sayed(1967), Selim(1969) andTaha (1973). The following are the geomorphologic and geological features that distinguished the study area:-
A- Geomorphologic features.The region in which the study area is located generally
characterized by landforms that reflect the combined influences of several endo-genetic and exo-genetic factors, e.g. climatic conditions, lithologic features, geologic structures, paleo-geographic elements, etc. These landforms such as southern tableland, ridges, depressions, dunes, drainage lines control the distribution of surface runoff andconsequently the groundwater accumulation and storage. According to Selim(1969), the region exhibits three main
geomorphologic units, from the south to north direction: The southern tableland., the piedmont plain and the coastal plain. The southern tableland is the most outstanding land feature in the northwestern littoral zone of Egypt. It extends southwards to the Quattara Depression. It is bounded on its northern side by an escarpment facing the coastal plain. Outlets of the drainage lines that pass to the coastalplain from high intake areas usually dissect the bounding
3
M editerranean S ea S idiB arani
3 130 '
B akbak
3120' 25 40 ' 25 50'
km
S idi B arani A irport
L egendS tudy areaR oad
0 2.5 5
35 K m
F ig (1) G eograph ic situation of th e stu dy area.
slopes of the tableland. The piedmont plain in which the present study area is actually located., it extends to the north of the tableland and to the south of the coastal plain as a transitional zone between the tableland and the coastal plain., it characterized by low land and hills. The coastal plain occupies a narrow strip of land stretching adjacent to the Mediterranean Sea. At the approaches of the headlands protruding seaward from the tableland, the coastal plain may be missing or becomes very narrow. Wherever the coastal plainis well developed, it displays features related to lithologicand structural conditions as well as fluctuation of sea level. Such features are mainly the alternation of low- lyingelongate ridges separated by narrow depressions. Two of such ridges are present at Sidi Barrani which are the foreshore ridge and the inland ridge.
B- Rock stratigraphy.The northwestern Mediterranean coastal zone is occupied by
sediment and sedimentary rocks are ranging in age from Tertiary to Quaternary (Selim, A. A.(1969) .In the study area the Miocene deposits are represented and underlay the Quaternary deposits. Quaternary deposits are exposed in the study area. It is
formed of a thin cover of drift sands and loamy deposits covering mainly low-lying areas and the floors of narrow valleys dissecting the tableland as well as oolitic and cardium limestone followed by Miocene deposits which are represented by Moghra Formation and Marmarica Formation. The Moghra Formation is represented by a basal fluviatile to fluviomarine deposits. It is composed of argillaceous limestone intercalation with sand and shale, while upper limestone rocks of shallow marine origin having a wide areal extension represent Marmarica Formation. It is formed of fracture white limestone and a lower grey calcarenite with some shale intercalation and represented the water bearing formation with salinity(>3000 ppm).
C- Geologic structures.The study area is a part of the Marmarica Homocline, which
occupies the area north of the Quttara Depression. Local structural undulations are present in the form of gentle upfold and downfold structures or broad monocline structures.
4

Most of the folded structures are oriented NE-SW. Regionally,there is a number of major faults with their downthrow towards the north.
FIELD WORKS
The field works comprised a geophysical survey and a land topographic survey. The geophysical field works involved theapplication of two geoelectrical methods of exploration to get an idea about the circumstances governing the occurrence of groundwater in the area. These methods are the Vertical Electrical Sounding method and the Electrical Imaging method .The land topographic survey was carried out to locatethe sounding stations and determine their ground elevations. Each of these works is presented in the following:
1 – Vertical Electrical Sounding.
A grid pattern consists of 15 Vertical Electrical Sounding (V.E.S) stations have been carried out. They are reasonably distributed across the study area (Fig.2) such as to yield subsurface information about the different parts of the area,accurate enough to cope with the targeted level of the present study. The current electrodes spacing used ranged between 1000 and 1400 meters in spite of the fact that the field conditions were very hard. One of the fifteen soundingshas been carried out at the site of Sanyet Esheneidra well where the depth to water could be measured (41m). This station was used for the depth to water calibration due to interpretation process.
5

Fig. (2) Location map of the VES’es, wells and directions of geoelectrical cross sections in the study area.
In the geoelectrical field survey, Schlumberger electrodes configuration was used, with current electrode distance up to1400m. The calculated apparent resistivities values (a ) were plotted against half current electrodes spacing (AB/2) on bilgarithmic scale each cycle 6.25 Cm as V.E.S curves (Fig 3-a, 3- b, 3-c). Topographic survey of V.E.S stations and wells were estimated from topographic map scale 1 : 100000. Land topographic survey was carried out in the investigated area to locate the measuring points and to determine the ground elevation at each point is listing in the following table.
VES No. Altitude
( a.s.l )(m)
Longitude
00º 00` 00``
Latitude
00º 00` 00``
1 25 25º 31` 24`` 31º 25` 19``
2 17 25º 31` 59.2`` 31º 25` 38.4``
3 25 25º 33` 17.8`` 31º 26` 11``
4 27 25º 34` 33.6`` 31º 26` 34.3``
5 31 25º 35` 39.7`` 31º 26` 59``
6 41 25º 36` 31`` 31º 27` 17.4``
7 24 25º 33` 6`` 31º 24 54``
8 28 25º 34` 19.56`` 31º 25` 14``
9 33 25º 35` 40`` 31º 35` 24``
10 38 25º 35` 41`` 31º 25` 34``
11 46 25º 37` 30`` 31º 26` 42``
6
0 1 2
3125`
3130`
25 35 ̀
25 35 ̀
3130`
3125`
K m
E l-Salou
m
S id i Barran
i
40178
45
50168
173
M ed iterranea
n sea
V E SC ross sectionIm agin g p rofileroadE l-saloumM atru h
40178
K m
K m
L egend
12
34
56
78
911
12
10
14
15
13
K mK m
C
C `B `
BA
A `
D
D `
S an yet E sheneid ra
S an yet Sam alou s
S h ore lin e
E

12 36 25º 33`53.4`` 31º 24` 6``
13 41 25º 35` 50`` 31º 24` 7.1``
14 48 25º 37` 32.4`` 31º 25` 12``
15 52 25º 38` 33`` 31º 26`
2.5``
2- Two-Dimensional (2D) geoelectrical imaging (Tomography).
To study the conditions under which groundwater occurs in the area, high-resolution two-dimensional (2D) geoelectrical imaging (Tomography) measurements have been carried out alonga profile at Sanyet Eshenderra. The profile has been measuredin West- East direction with a length of 510m. These measurements have been conducted at that locality as a case study with the main objective of studying the conditions under which groundwater occurs. This technique can determine the fractures within the aquifer.
The geoelectrical imaging technique with Wenner array involves measuring a series of constant separation traverses (datum levels) with the electrode separation being increased with each successive traverse (Fig. 4 ). The measurements continued successively to reach the last datum, which is represented by only one point with the largest electrodes separation (equals one third of the total length of the profile). The Wenner electrode configuration was applied in the present survey with unit electrode spacing (a) started with 10m and increased in the following traverses to 2a, 3a,…., i.e. 20, 30, 40,……and 170 m.
The measurements were conducted by using the direct currentresistivity meter model (SAS 300). The instrument directly measures the resistance with high accuracy.
7

DATA INTERPRETATION AND DISCUSSIONOF THE GEOELECTRICAL MEASUREMENTS
1– Interpretation of the VES curves
In the present study, the field curves were quantitatively interpreted using the computer program “RESIST” written by Van Der Velpen (1988). It is an interactive, graphically oriented, forward and inverse modeling program for interpreting the resistivity soundingdata in terms of a layered earth model. A Sounding No. 13 has been carried out at the site of Sanyet Esheneidra wellwhere the depth to water could be measured (41m). This
8
F ig u r e (4 ) T h e m e a s u r e m e n t s e q u e n c e fo r b u ild in g u p th e e le c tr ic a l im a g in g s e c t io n
......
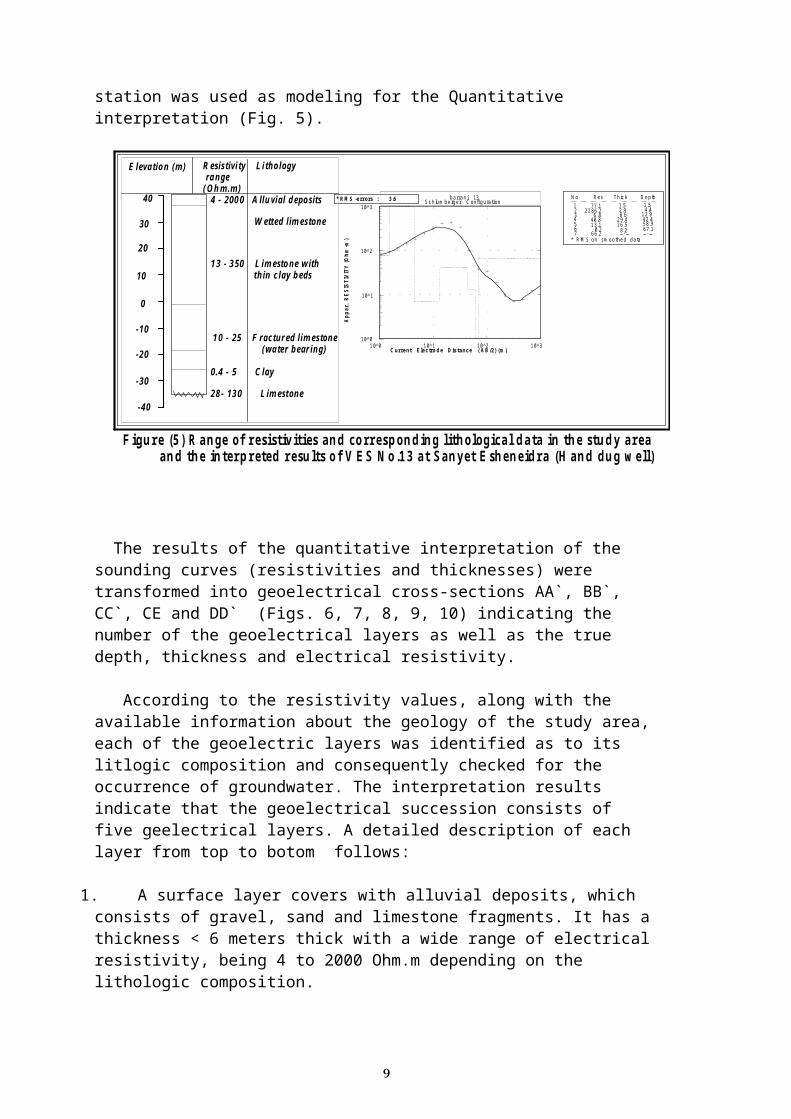
station was used as modeling for the Quantitative interpretation (Fig. 5).
The results of the quantitative interpretation of the sounding curves (resistivities and thicknesses) were transformed into geoelectrical cross-sections AA`, BB`, CC`, CE and DD` (Figs. 6, 7, 8, 9, 10) indicating the number of the geoelectrical layers as well as the true depth, thickness and electrical resistivity.
According to the resistivity values, along with the available information about the geology of the study area,each of the geoelectric layers was identified as to its litlogic composition and consequently checked for the occurrence of groundwater. The interpretation results indicate that the geoelectrical succession consists of five geelectrical layers. A detailed description of each layer from top to botom follows:
1. A surface layer covers with alluvial deposits, which consists of gravel, sand and limestone fragments. It has a thickness < 6 meters thick with a wide range of electrical resistivity, being 4 to 2000 Ohm.m depending on the lithologic composition.
9
40
30
20
10
0
-10
-20
-30
-40
R esistivi ty L i thology range( O h m.m) 4 - 200 0 A llu vial deposits
W etted limestone
13 - 350 L imestone with thin c lay beds
1 0 - 25 F ractured limestone (water bear ing) 0.4 - 5 C lay
28 - 130 L imestone
E levation (m)
10^0
10^1
10^2
10^3
10^0 10^1 10^2 10^3Ap
par. R
ESISTIVI
TY (O
hm-m
)C urrent E lectro d e D istance ( A B /2) (m )
* R M S -errors : 3.6 barrani 13S chlum berger C onfigurationN o R es Thick D epth123564
77.12286.26.840.8
13.10.2
1.52.98.629.416.5
1.54.412.942.458.9
* R M S on sm oothed data7 66.2 8.2_. _ _. _67.1
F igu re (5) R an ge of resistivities an d corresp on d in g lith ological d ata in th e stu d y area an d the interp reted resu lts of V E S N o.13 at S an yet E sh en eid ra (H an d du g w ell)
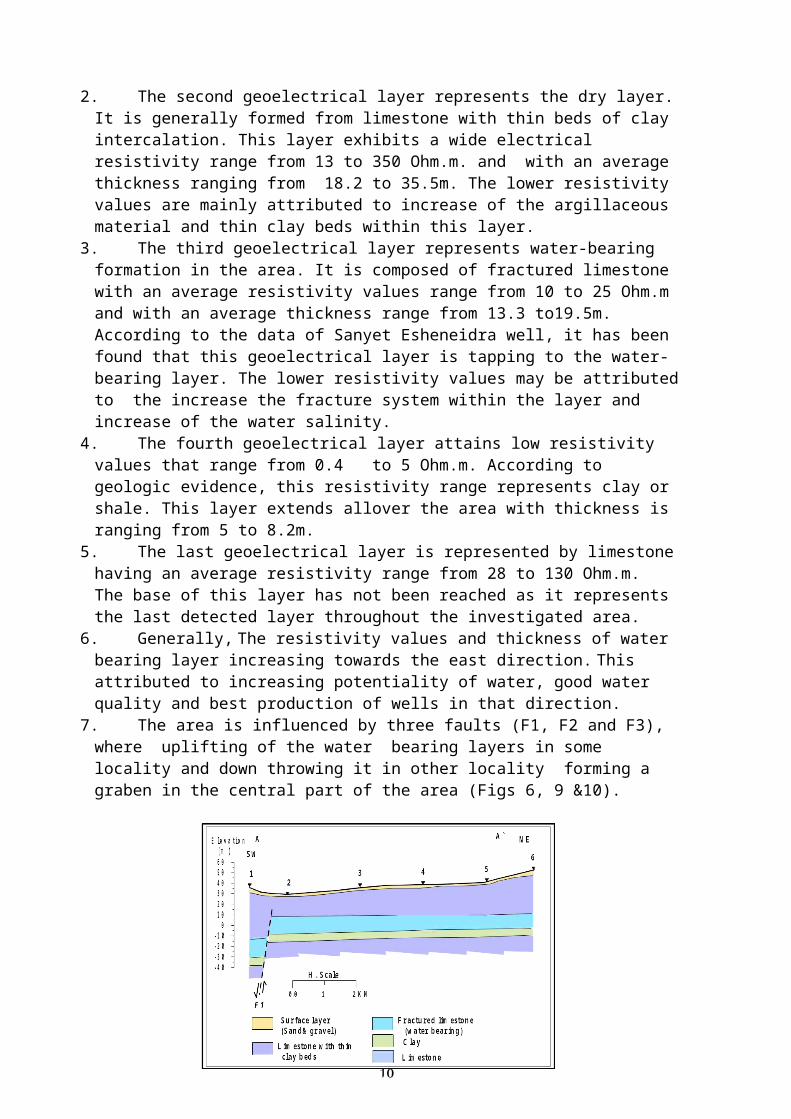
2. The second geoelectrical layer represents the dry layer.It is generally formed from limestone with thin beds of clay intercalation. This layer exhibits a wide electrical resistivity range from 13 to 350 Ohm.m. and with an average thickness ranging from 18.2 to 35.5m. The lower resistivity values are mainly attributed to increase of the argillaceous material and thin clay beds within this layer.
3. The third geoelectrical layer represents water-bearing formation in the area. It is composed of fractured limestone with an average resistivity values range from 10 to 25 Ohm.m and with an average thickness range from 13.3 to19.5m. According to the data of Sanyet Esheneidra well, it has been found that this geoelectrical layer is tapping to the water-bearing layer. The lower resistivity values may be attributedto the increase the fracture system within the layer and increase of the water salinity.
4. The fourth geoelectrical layer attains low resistivity values that range from 0.4 to 5 Ohm.m. According to geologic evidence, this resistivity range represents clay or shale. This layer extends allover the area with thickness is ranging from 5 to 8.2m.
5. The last geoelectrical layer is represented by limestonehaving an average resistivity range from 28 to 130 Ohm.m. The base of this layer has not been reached as it represents the last detected layer throughout the investigated area.
6. Generally, The resistivity values and thickness of water bearing layer increasing towards the east direction. This attributed to increasing potentiality of water, good water quality and best production of wells in that direction.
7. The area is influenced by three faults (F1, F2 and F3), where uplifting of the water bearing layers in some locality and down throwing it in other locality forming a graben in the central part of the area (Figs 6, 9 &10).
10

Fig. (6) Geoelectrical cross section A-A`
Fig. (7) Geoelectrical cross section B-B`
Fig. (8) Geoelectrical cross
section C-C`
11

Fig. (9) Geoelectrical cross section C-E
Fig. (10) Geoelectrical cross section D-D`
The upper surface of the last geoelectrical layer is selected to draw a structural contour map (Fig. 11). The structural contour map shows the locations, extension and relative displacement of the inferred faults (F1, F2 and F3) in the investigated area. From this map and according to the correlation between the equivalent layers along the cross sections, three normal faults F1, F2 and F3 affected the area. This map is characterized by high gradient in the NW- SE and NE-SW directions. The faults F1 strikes NW- SE direction, it throws towards SW direction, the fault F2
12
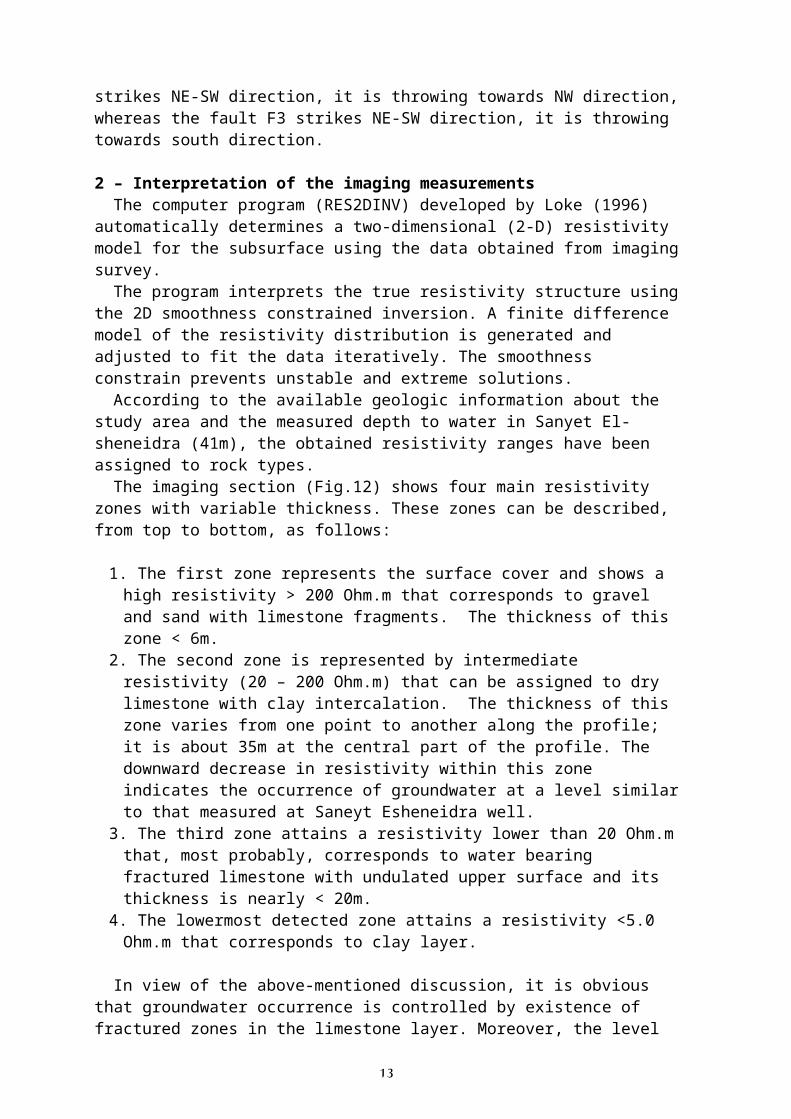
strikes NE-SW direction, it is throwing towards NW direction,whereas the fault F3 strikes NE-SW direction, it is throwing towards south direction.
2 – Interpretation of the imaging measurementsThe computer program (RES2DINV) developed by Loke (1996)
automatically determines a two-dimensional (2-D) resistivity model for the subsurface using the data obtained from imagingsurvey. The program interprets the true resistivity structure using
the 2D smoothness constrained inversion. A finite difference model of the resistivity distribution is generated and adjusted to fit the data iteratively. The smoothness constrain prevents unstable and extreme solutions.According to the available geologic information about the
study area and the measured depth to water in Sanyet El-sheneidra (41m), the obtained resistivity ranges have been assigned to rock types.The imaging section (Fig.12) shows four main resistivity
zones with variable thickness. These zones can be described, from top to bottom, as follows:
1. The first zone represents the surface cover and shows a high resistivity > 200 Ohm.m that corresponds to gravel and sand with limestone fragments. The thickness of this zone < 6m.
2. The second zone is represented by intermediate resistivity (20 – 200 Ohm.m) that can be assigned to dry limestone with clay intercalation. The thickness of this zone varies from one point to another along the profile; it is about 35m at the central part of the profile. The downward decrease in resistivity within this zone indicates the occurrence of groundwater at a level similarto that measured at Saneyt Esheneidra well.
3. The third zone attains a resistivity lower than 20 Ohm.mthat, most probably, corresponds to water bearing fractured limestone with undulated upper surface and its thickness is nearly < 20m.
4. The lowermost detected zone attains a resistivity <5.0 Ohm.m that corresponds to clay layer.
In view of the above-mentioned discussion, it is obvious that groundwater occurrence is controlled by existence of fractured zones in the limestone layer. Moreover, the level
13

and thickness of this water-bearing layer show remarkable variations along the distance of the profile.
Fig. (11) Structural contour map of the upper surfaceof the last geoelectrical layer.
Fig. (12) Two- D resistivity imaging profile
at Sanyet El-Sheneidra .
GROUNDWATER OCCURRENCE
The geoelectrical survey revealed that the groundwater exists in the investigated area. The geoelectrical layer number three represents it through the geoelectrical sections. This layer is characterized at the most soundings by resistivity values ranging between 10 to 25 Ohm.m. The lower resistivity values that have been recorded within this layer are considered to represent groundwater occurrence. Theisoresistivity contour map Fig.(13) illustrates that the third layer has resistivity values increasing gradually toward east direction of the investigated area, this can be attributed to good water quality in the same direction, while
14
3125`
25 35 ̀0 1 2 K m
3125`
25 35 ̀
L evel (m)
F 1
F 2
V E SF ault-50
-46
-42
-38
-34
-30
-26
-22
-18
-14
-10
-6
F 3
1 .0 4.0 1 2 30 5 0 80 16 0 2 50R esis tivity in O hm- m
E levation
40.0 30.0 20.0 10.0 0.0- 10.0- 20.0- 30.0
0.0 5 0 10 0 150 200 250 300 350 400 450 5 00S an yet E l- sheneidra
W E
Z on e-4 Z o ne-2 Z o ne-1Z on e-3
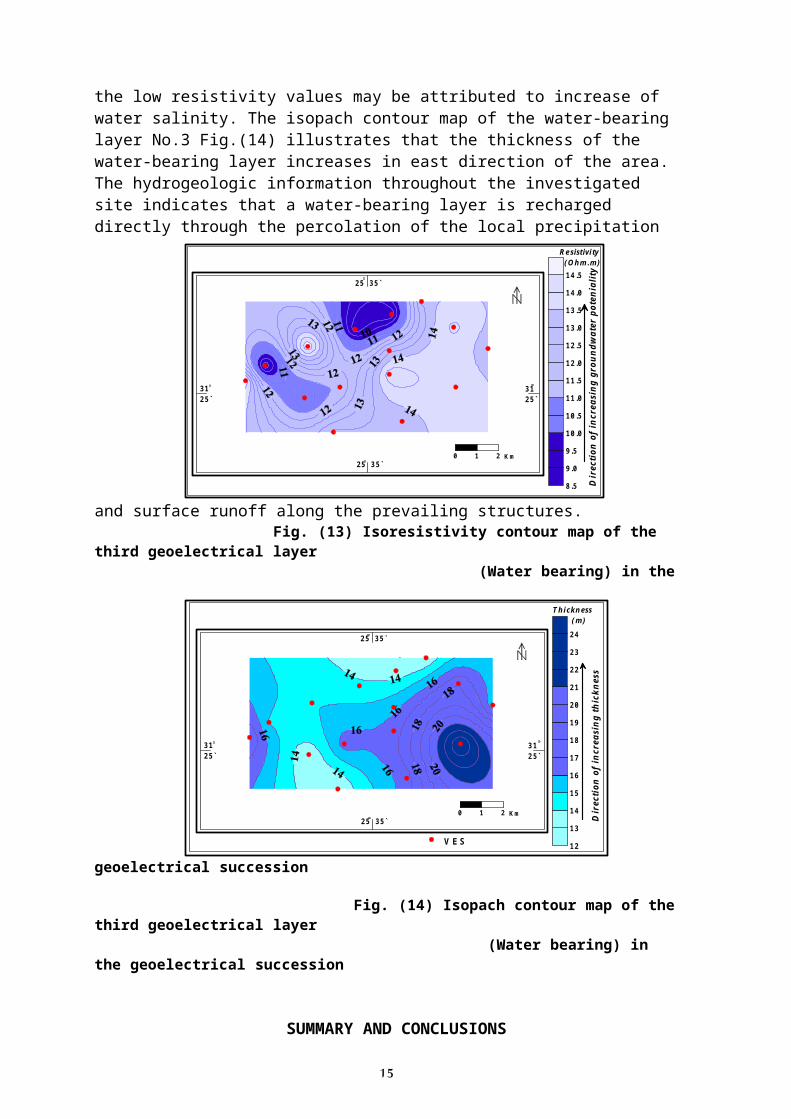
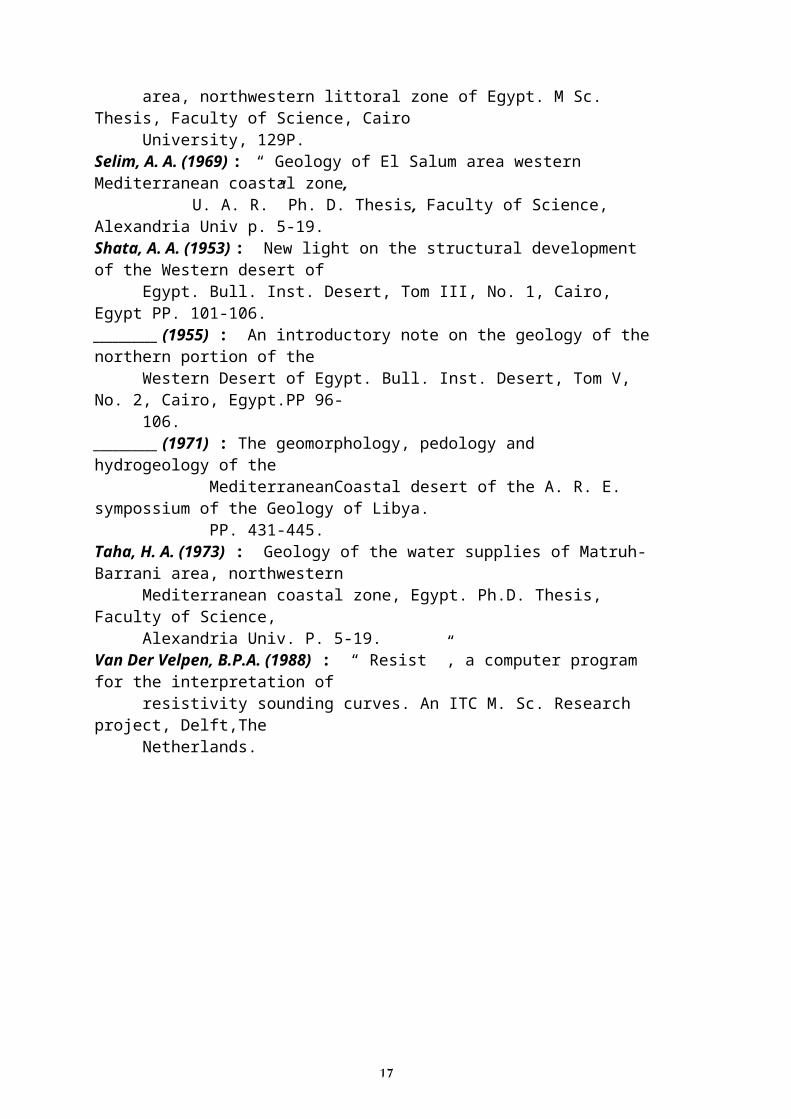
the low resistivity values may be attributed to increase of water salinity. The isopach contour map of the water-bearing layer No.3 Fig.(14) illustrates that the thickness of the water-bearing layer increases in east direction of the area. The hydrogeologic information throughout the investigated site indicates that a water-bearing layer is recharged directly through the percolation of the local precipitation
and surface runoff along the prevailing structures. Fig. (13) Isoresistivity contour map of the third geoelectrical layer (Water bearing) in the
geoelectrical succession Fig. (14) Isopach contour map of thethird geoelectrical layer (Water bearing) in the geoelectrical succession
SUMMARY AND CONCLUSIONS
15
3125`
25 35 ̀0 1 2 K m
3125`
25 35 ̀
8.5
9.0
9.5
10.0
10.5
11.0
11.5
12.0
12.5
13.0
13.5
14.0
14.5
Dir
ectio
n of
incr
easi
ng g
roun
dwat
er p
oten
ialit
y
R esistivity ( O hm.m)
3125`
25 35 ̀0 1 2 K m
3125`
25 35 ̀
12
13
14
15
16
17
18
19
20
21
22
23
24
Dir
ectio
n of
incr
easi
ng th
ickn
ess
T hickness ( m)
V E S

In view of the above-mentioned discussion, it is obvious that groundwater occurrence is controlled by existence of fractured zones within the limestone layer.
Generally, The resistivity values and the thickness of the aquifer are increasing toward the east direction in the studyarea, this attributed to increasing potentiality of water, good water quality and best production of wells in that direction. The eastern portion of the concerned area was foundthe best sits for locating production wells. This study is anexample which can be applied on large scale. Accordingly, reaching a decision for locating production wells needs carrying out further integrated geoelectrical studies as thisstudy to detect the sites with the best conditions, concerning thickness and depth, for groundwater occurrence inthe study area.
The above-mentioned results can help the decision-maker in the process of agricultural development in the area.
REFERENCES
Abdallah, A.M. (1966 a) : Geology of some gypsum deposits in the northwestern desert of
Egypt. Geol. Surv. Egypt. Paper No 41, 1- 11 p____________ (1966. B) : Stratigraphy and structure of a portionin the northwestern desert of Egypt. Geol. Surv. Egypt, Paper No. 45, 1- 19 p.Ghazarian, Gh. P. (1957) : Final report on the electrical resistivity survey carried out at
Wadi El Kharruba, Mersa Matruh, Egypt. Publ. Inst Desert No. 10, Le Caire.Loke, M.H. (1998) : “ RES2DINV”. V. 3.4, rapid 2 – D resistivity inversion using the lest-square method., ABEM instrument AB, Bromma, Sweden.Said, R. (1962) : Geology of Egypt. Elsevier Pub. Co., Amsterdam, New york.Sayed, M.A.A (1967) : Geophysical study on the groundwater resources of Ras El-Hekma
16
area, northwestern littoral zone of Egypt. M Sc. Thesis, Faculty of Science, Cairo
University, 129P.Selim, A. A. (1969) : “ Geology of El Salum area western Mediterranean coastal zone,
U. A. R.” Ph. D. Thesis, Faculty of Science, Alexandria Univ p. 5-19.Shata, A. A. (1953) : New light on the structural development of the Western desert of
Egypt. Bull. Inst. Desert, Tom III, No. 1, Cairo, Egypt PP. 101-106.__________ (1955) : An introductory note on the geology of thenorthern portion of the
Western Desert of Egypt. Bull. Inst. Desert, Tom V, No. 2, Cairo, Egypt.PP 96-
106.__________ (1971) : The geomorphology, pedology and hydrogeology of the MediterraneanCoastal desert of the A. R. E. sympossium of the Geology of Libya. PP. 431-445.Taha, H. A. (1973) : Geology of the water supplies of Matruh-Barrani area, northwestern
Mediterranean coastal zone, Egypt. Ph.D. Thesis, Faculty of Science,
Alexandria Univ. P. 5-19.Van Der Velpen, B.P.A. (1988) : “ Resist ”, a computer program for the interpretation of
resistivity sounding curves. An ITC M. Sc. Research project, Delft,The
Netherlands.
17

دي�� رب� س�ي� وب�� غ�� ن� عة� ج�� �ة� ال�واق� �طق ال�من� ة� ب�� ي� وف�� اه� ال�ج� د ال�مي� واج�� �ة� ع�لى ت� ي� ب56 وك�هر ن� "دراسة� ج��. ,� م�صــر ي� �Eب مالي� ال�غ�ر Kال�ساج�ل� ال�ش �ي�� ب�� Pب��راب"
Sـد ال�رح�ـمن ا صي�ـري ع�ي� ب�� Zد ال�لـة الأ , ع�ي� Sن�ي_ ى م�حمـود م�حمود غ�ـر� ال�د ج�ـسـن�م ى ب��رس�ي� د م�صطف� ى� س�عي� و م�صطف�
�اه�ره �جوبK ال�صحـــراء-�ال�ق مرك�ر� ب��
�ة �ع�اق�� yا �لي yدي ا Zه��ا م�م��ا ا ام ب�� ل�غ��� Zالأ �راع��ة� ة�� ل�ر� ي��� �Pب ا Kال�ي �ة� اء ال�ح��رب�� ال�غال�مي��� ي��� ب_� Zا �ي �Eب ر مالي� ال�غ��� K��ال�س��اج�ل ال�ش �ة� �طق�� ت� م�ن� غرض���� �ت��ل��ك ة� ود� �طق�� ل ال�من� ي�ره� داج��� اط�ق� ال�ص��ع� عض� ال�مي�� ام م�نS ت�� ل�غ�� Zعض� الأ راج�S ت�� خ���� yع�لى ا �ة� وس�اع�دب� ال�دولة �طق ه ال�من� ى� ه�د� ة� ف� ن�مي� ال�ت�
. و �اط�ق ه ال�مي��� د� ده� م�نS ه��� ة� ال�دراس��ة�� واج��� �طق�� ر م�ن� ي� �غت�� �ة� وت� ن�مي��� لأل�ها ل�لت� غ� �ت ة�� اللأس��� ه�مي��� Zرا� لأ ظ��� ـدين�� رب�� س�ي� وب�� غ���� ن��� ع��ة�� ج�� �ة� ال�واق� �طق�� من� Sان ة�� ف�� لي� ي� �ق �ة�� ال�مست ة�� وال�رعوي�� راع�ي� ة� ال�ر� ن�مي� ل ال�ت� ج�� Zي لأ �Eب مالي ال�غ�ر Kال�ساج�ل ال�ش �ي ب�� Pب��راب�ة� ي�� وف�� اه ال�ج� د� ال�مي�� واج�� �هات� ص�را� ب�� كل ع�ن� K�ش�ي�
�ل�ك د� ره� ول���� ي� خ���� Zالأ �واب� ى ال�س���ن� ه���ا ف� �ت لت� ك�مت� �ى�� ف� �ن م�ط���ار ال���� Zاه الأ لأف� م�ي���� خ� ة� ب�� مي���� ن� ه ال�ت� دم�هم���ا وم�س���اع�دا ل�ه���د� �ق مق�� �اف� ت� K���كس �اس�ي�ة� ي���� �Pب م�كا yد� ا واج����� �ة� ال ت� �ق��� ة�� ال�طت� ي���� وف�� اه ال�ج� ة�� ال�خام�ل���ة� ل�لمي���� حت� ال�س���طحي� ى��ت� �ن لأل�ها ك�مص���در وال���� غ� �ت مكنS اس���� ة�� ي�� مي���� ن� .� ل�لت� �ة �طق��� ه ال�من� مق����ف��ل�ه���د� �د ت�
�ة هدق� �ة� ال�مس��ت �طق�� ة�� ع�لى ال�من� ي��� ب56 وك�هر ن� راء� دراس��ة�� ج�� خ���� Zا �س��اب ة ل�عم��ل ال�ح� ي� رج�� لأمي� K���ع س ي��6� ور� �دام ت� خ� �ت اس��� وال ب�� ن� ة�ج� ي��� ب56 دده�اك�هر ة�� وع��� ال�عمودي����س��ة و 15 ل ط�ول��ة دراس��ة�� ج�� ي��� لأل� ب��روف�� ي�ر ج�� ت��� ع ف�� ي��6� ور� �دام� ت� خ� �ت اس��� غ��اد ب�� ت�� Zالأ �ة� ي��� ZPب ا ي� ة�� ب�� طعي��� �ة�� م�ق ي��� ب56 وك�هر ن� اب� م��ي�ر .وم�ن510S ج�� ال�مغلوم���
ر س�ي� ق� �ة�� ال�ت م ل�عملي��� ولي ال�لأر� Zالأ Sج م��ود� ع ال�ن� م وض��� �ة�� ت� �طق� ال�من� ده�� ب�� واج���� �ة�� ال�مخ��دوده� م�نS ال�س��واب�Pي ال�من ي��� ZPب ة�� وال�مغلوم�اب� ال�ما ي� ول�وج�� ن� ال�ح�.�ال�كمى� �ة ي����� ب56 وك�هر ن� س����اب� ال�ح� اب� ال�ح� اب������ ي� ر ل�ت5 س����ي� ق� �لأل� ال�ت ل م�نS ج�� وص����� �م ال�ن �س����اب�ل�ل ال�كمى�ت� ة��ج� ي����� ب56 وك�هر ن� ة�� ال�ح� عالي ال�عمودي������ ي_� ا �ي���� ب��
حت� ص�ح�ري� �مسة� ب� كونS م�نS ح�� �ي اب� س�طحى�� ب�� �ق نS ط�ت� Zا Kت ة�� ج�ي� ي��� وب�� ت_� ور ال�كر مه�ا م�نS ال�ص�ج� ة� م�عظ� �ق� ة� ال�خام�ل��ة�ال�طت� �ق� ة�� هى ال�طت� K�ال�ي Kال�يور ال�حح�ر� كونS م�نS ص�ج� �ي اه وب�� ي�ري� ل�لمي� ق��ال�ج� �ق Kس �.� ال�مت �ة �طق ال�من� اره�ا ب�� Kس ت� ة� س�مكها وان�� م م�غرق� � وت�
�ة� طعي��� �ة�� ال�مق ي��� ب56 وك�هر ن� اب� ال�ح� اس��� ي� �جS ال�ق ZPاب �ي�� ف�رب�� ب�� س��� Zد ا �غ��اد وف��� ت�� Zالأ �ة ي��� ZPب ا ي� ل ب�� ي��� لأل� ب��روف�� عج�� �ق �ى� ت� �ن دره� ال��� ي� ت� K��ال�س �ة ي� �Pب م��ر ي��س��ا ى ي�� ف��ة�� ال�دراس��ة �طق وب� م�ن� ن� ى��ج�� �ن ه�ا ع�لى ع�م�ق� وال��� اه ب�� د� ال�مي�� واج���� �ن رض�41 ب�� Zطج الأ ود م�ي�ر م�نS س�� عع�نS وج��� ي�6 ر Zا�ة� ي�� ب56 وك�هر ن� اب� ج�� �طاف�� ن��
18

�طاق ل ال�ن� Kمي ع وي�� ة� ب��رج�� ض� ق� ج� ة�� م�ت� وع�ي� ة� ت�� ي� ب56 اومة� ك�هر �ال�تK م�ق Kودال�ي لي� وج�� yر� ا ة� م�نS ال�حح� �ق ي�ري� ط�ت� ق��ال�ج� �ق K��س �اه وع�لى ال�مت ل ل�لمي��� ال�خام���ة� ل�ي��� yا �ي� وص���لت ىZ ال�عمق� ال�د� كاف� ل و ي�� KPمان س�اب� ع�مق� ي�� والال�ح� ن� ة��ج� ي��� ب56 يòنS ك�هر ق� ن�� واف��� �اك�� ت� ة�� وانS ه�ي�� اس��اب� ال�عمودي���� ي� �جS ال�ق ZPاب �ي� ب��
�ة� ي� ب56 وك�هر ن� ة�� وال�ح� ة�� ال�عمودي�� طعي� �غاد ال�مق ت�� Zالأ �ة ي� ZPب ا ي� .ب���حت اب� ال�ت� �ق غاب� ال�طت� ات�� �ي ر ع�لى ب�� ي� KPي Zا �يòنS ل�هم ب� �Pص�دوع ع�ادن �ة KPلأي Kي را ب�� Kب� Zا �ى� م�ي �ف ع ال�طت� ي_� ا �ي نS ال�ت� Zا �دب� ال�دراسة وج�� Zد ا �وف�
ة�� وع�لى .� س�طحي� �ة �طق ال�من� ة�� ب�� ي� وف�� اه ال�ج� د� ال�مي� واج�� �ت�ر� ة� ال�حح��� �ق طت� اب� ن�� �ق �ق Kس �ود ي� ف� ع�لى وج�� �وق� �ن ة� ال�دراسة�� ب�� �طق من� ة�� ي�� ي� وف�� اه ال�ج� د ال�مي� واج�� �نS ت� Zج ا ص� �ن جS ب�� ZPاب �ي ه ال�ت� وء ه�د� ي�ري�ع�لى ض�� ال�ج���
Sم�ن Sان لق���� �ت ح� ة� ب�� �ق��� ه ال�طت� د� مك� وع�م���ق� ه���� نS س���� Zا ك�، ف����� ل���� سة، ع�لأوه� ع�لى د� طاع���ج�� �ول ال�ق ري ع�لى ط���� خ����� Zلأ �.�اب �ة ي���� ب56 وك�هر ن� ول�كنSال�ح�غ��اد ال ت�� Zالأ �ة ي��� ZPب ا ي� ة�� ب�� طعي��� �ة�� ال�مق ي��� ب56 وك�هر ن� اب� ال�ح� اس��� ن� �اه ق ة� ال�خام�ل��ة�� ل�لمي��� �ق�� ار ال�طت� K��س ت� �Pن Zوا �مك� وع�م��ق ة� س��� �دق�� ددب�� ب�� ك�ج��� ل��� اءا ع�لى د� ي��� ب_� و
نS ال�وض�ول� Zا لي�ف�� yو�ا ن� راء� دراس��اب� ج�� خ��� Zطلت� ا �ن ار ب�� ب�� þع ل�جف�ر� الأ �د م�واق� �Pخدب ت� �رار ب�� ة�ك�هرن�� ق� لي� ص�ي� ق� �ة� ت� كام�ل�ة�ي��� �ت ه ال�دراس�ة�� م� د� ل ه�� K�م�ي ع �د ال�مواق� �Pخدب ى��ل�ت� �روف��ال�ن ل ال�ظ� ص� ف�� Zا ر� ب�� مي� �ن �ة�� ن�� ل�ن� ب� ي� وف�� اه ال�ج� داب�� ال�مي� ة� الواج�� �طق . من�
19