Seasonal changes in the pigments, carbohydrates and growth of red spruce as affected by ozone
12
Phytol (1991), 118, 127-137 Seasonal changes in the pigments, carbohydrates and growth of red spruce as affected by exposure to ozone for two growing seasons BY R. G. AMUNDSON^*, R. G. ALSCHER^ S. FELLOWS\ G. RUBIN^ J. FINCHER', P. VAN LEUKEN^ AND L. H. W E I N S T E I N ^ ^ Boyce Thompson Institute for Plant Research, Cornell University, Ithaca, NY 14853 USA -Department of Plant Pathology, Physiology, and Weed Science, Virginia Polytechnic Institute and State University, Blacksburg, VA 24061 USA ^Biometrics Unit, Cornell University, Ithaca, NY 14853 USA (Received 9 May 1990; accepted 10 January 1991) SUMMARY Three-year-old red spruce seedlings were exposed to various concentrations of ozone, from 0-4 to 3 times ambient, for two consecutive growing seasons in open-top chambers in Ithaca, NY, USA, Exposures, which varied with changes in daylength, were from 30 May to 14 December 1987 and 1 June to 1 December 1988, Seedling biomass, foliar pigments and carbohydrate content of roots and shoots were assessed once or twice per month. Tree biomass increased through the summer and declined slightly in late autumn, regardless of" ozone treatment. Biomass and contents of sugar and starch of 1988 fixed growth declined linearly with exposure to increasing levels of ozone. Rates of decline in total shoot biomass and old shoot biomass increased linearly with exposure to increasing concentrations of ozone, but tree height was not affected. Seasonal means of starch content of roots decreased linearly with increasing doses of ozone, but in contrast seasonal mean sugar content and rate of sugar accumulation of roots increased linearly, Chlorophy!! a and chlorophyll b contents were not affected by ozone. These data are consistent with the concept that ozone stress is cumulative, since effects on biomass and carbohydrate content of roots and shoots were not detected after the first year of exposure, but were detected after the second year of treatments. Furthermore, biomass was reduced by ozone only in tissues that were initiated during the first year of exposures and developed during the second year of exposures (1988 fixed grow-th). Key words; Picea rubem, forest decline, ozone, biomass, carbohydrates. Roberts & Blank, 1987; Barnes & Davison, 1988; INTRODUCTION L^^^^ ^, ^^ jgggj Ozone is the most widespread air The dieback of red spruce (Picea rubens Sarg.) at pollutant in the United States and is responsible for high elevation sites in the eastern United States, and major economic losses of crops (Heck et al., 1982, of other species across Central Europe, is thought to 1983). Since ozone concentrations at high elevations, be associated with the interaction of multiple stresses where red spruce trees are dying, are twice those at (Johnson & Siccama, 1983, 1984; Blank, 1985; low elevations where crop losses are found (Johnson Rehfuess, 1987; Johnson, Cook & Siccama, 1988). et al., 1988), there is a clear need for research on the Air pollution, and in particular, ozone, may pre- effects of ozone on red spruce physiology. In recent dispose trees to injury from naturally occurring studies, exposure to elevated levels of ozone for one stresses such as summer drought, freezing injury and growing season had no effect on photosynthetic rates winter desiccation (Friedland e/a/., 1984; Guderian, or growth of red spruce seedlings (Taylor et al., Kuppers & Six, 1985; McLaughlin, 1985; Brow^n, 1986; Laurence. Kohut & Amundson, 1989; Alscher et al., 1989). Only recently, information has become • Author to whon-i correspondence should be addressed, available on seasonal changes in other parameters
Transcript of Seasonal changes in the pigments, carbohydrates and growth of red spruce as affected by ozone

Phytol (1991), 118, 127-137
Seasonal changes in the pigments,carbohydrates and growth of red spruce asaffected by exposure to ozone for twogrowing seasons
BY R. G. A M U N D S O N ^ * , R. G. ALSCHER^ S. FELLOWS\ G. RUBIN^J. FINCHER', P. VAN LEUKEN^ AND L. H. W E I N S T E I N ^
^ Boyce Thompson Institute for Plant Research, Cornell University, Ithaca,NY 14853 USA-Department of Plant Pathology, Physiology, and Weed Science, Virginia PolytechnicInstitute and State University, Blacksburg, VA 24061 USA^Biometrics Unit, Cornell University, Ithaca, NY 14853 USA
(Received 9 May 1990; accepted 10 January 1991)
SUMMARY
Three-year-old red spruce seedlings were exposed to various concentrations of ozone, from 0-4 to 3 times ambient,for two consecutive growing seasons in open-top chambers in Ithaca, NY, USA, Exposures, which varied withchanges in daylength, were from 30 May to 14 December 1987 and 1 June to 1 December 1988, Seedling biomass,foliar pigments and carbohydrate content of roots and shoots were assessed once or twice per month. Tree biomassincreased through the summer and declined slightly in late autumn, regardless of" ozone treatment. Biomass andcontents of sugar and starch of 1988 fixed growth declined linearly with exposure to increasing levels of ozone.Rates of decline in total shoot biomass and old shoot biomass increased linearly with exposure to increasingconcentrations of ozone, but tree height was not affected. Seasonal means of starch content of roots decreasedlinearly with increasing doses of ozone, but in contrast seasonal mean sugar content and rate of sugar accumulationof roots increased linearly, Chlorophy!! a and chlorophyll b contents were not affected by ozone.
These data are consistent with the concept that ozone stress is cumulative, since effects on biomass andcarbohydrate content of roots and shoots were not detected after the first year of exposure, but were detected afterthe second year of treatments. Furthermore, biomass was reduced by ozone only in tissues that were initiatedduring the first year of exposures and developed during the second year of exposures (1988 fixed grow-th).
Key words; Picea rubem, forest decline, ozone, biomass, carbohydrates.
Roberts & Blank, 1987; Barnes & Davison, 1988;INTRODUCTION L^^^^ ^, ̂ ^ jgggj Ozone is the most widespread air
The dieback of red spruce (Picea rubens Sarg.) at pollutant in the United States and is responsible forhigh elevation sites in the eastern United States, and major economic losses of crops (Heck et al., 1982,of other species across Central Europe, is thought to 1983). Since ozone concentrations at high elevations,be associated with the interaction of multiple stresses where red spruce trees are dying, are twice those at(Johnson & Siccama, 1983, 1984; Blank, 1985; low elevations where crop losses are found (JohnsonRehfuess, 1987; Johnson, Cook & Siccama, 1988). et al., 1988), there is a clear need for research on theAir pollution, and in particular, ozone, may pre- effects of ozone on red spruce physiology. In recentdispose trees to injury from naturally occurring studies, exposure to elevated levels of ozone for onestresses such as summer drought, freezing injury and growing season had no effect on photosynthetic rateswinter desiccation (Friedland e/a/., 1984; Guderian, or growth of red spruce seedlings (Taylor et al.,Kuppers & Six, 1985; McLaughlin, 1985; Brow^n, 1986; Laurence. Kohut & Amundson, 1989; Alscher
et al., 1989). Only recently, information has become• Author to whon-i correspondence should be addressed, available on seasonal changes in other parameters

128 R. G. Amundsort and others
that are necessary to start to assess the response ofred spruce to anthropogenic pollution or to environ-mental stresses (Alscher et al., 1989, Hausladenet al., 1990).
To test for ozone-mediated changes in thesevariables, three-year-old seedlings previously fumi-gated in 1987 (Alscher et al., 1989) were exposed tofour concentrations of ozone from June untilDecember, 1988. This length of exposure was chosento include both the growing season and the intervalwhen the seedlings would be undergoing winterhardening. During the exposure period, trees wereharvested monthly or bimonthly to determinechanges in tissue biomass, pigment contents andcarbohydrate contents of needles and roots asfunctions of time and ozone exposure. Raffinosecontents were determined on tissues sampled fromAugust until December, the time period when thetrees would become cold tolerant.
METHODS AND MATERIALS
Plant material
Tw^o-year-old greenhouse-grown seedlings (from a1985 South Range, Nova Scotia provenance col-lection provided by the U.S. Forest Service) wereplanted in 2:1:1 peat-vermiculite-sand in 155cmdiameter X 17-5 cm deep plastic pots in early 1987and maintained during 1987 as described in Alscheret al. (1989). The trees over-wintered outside. Inmid-April 1988 the trees were transplanted intoCornell mix (1:2, peat-vermiculite amended with5:2:1, Hme-superphosphate-CaNOa at 4-8 kg m"^and with 75 g fritted trace elements m~ )̂ in 24 cmdiameter X 23 cm deep peat pots. On 13 June 1988each tree was fertilized with 12 g of 17-6-10 NPK.Air temperatures in the centres of an ambient plotand a chamber were monitored from 13 July until31 December with copper-constantan thermocouplesand recorded with a LI-1000 DataLogger (LICOR,Inc.). Air tennperatures were monitored in threeother chambers with hygrothermographs.
Ozone exposures
Groups of seedlings were exposed to the same ozonetreatments in 1988 as in 1987 in open-top chambers(Heagle, Body & Heck, 1973) from 1 June to 1December 1988. The treatments were charcoal-filtered air (CF), non-filtered air ( l x ) , and non-filtered air to which ozone was added to produceozone concentrations approximately two (2 x) orthree (3 x ) times ambient during the periods ofozone addition. Ozone was generated by exposingpure oxygen fronn a bottled source to an electricaldischarge. Distribution and monitoring of the ozonewere carried out as described by Kohut et al. (1987).Five chambers were used for the CF and 3 xtreatments, while three chambers were used for the
1 X and 2 x treatments. An additional treatment(ambient), consisting of potted seedlings in plotswithin chamber frames without plastic walls, wasused to determine any effect of chambers on seedlingresponse. The length of the fumigations varied withchanges in daylength; exposures started 2 h aftersunrise and ended 2 h before sunset. The treesreceived natural rainfall and in addition were wateredon average once or twice per week as needed toprevent water stress.
Sampling Procedure
Harvesting. One seedling from each chamber washarvested monthly from May to August, and inNovember and December, and bimonthly inSeptember and October. One seedling from each ofthe ambient plots was harvested monthly. The firstharvest occurred one month prior to initiation of theexposures. Each harvest took four days to complete.Before harvesting, seedlings were placed in a growthchamber for acclimation overnight, Tbe followingmorning the trees were harvested, beginningapproximately 4 h after the start of the pbotoperiod.Temperature and photoperiod regimes within thegrowth chamber were programmed to follow dailypatterns determined for each date from 1981-1984data collected at tbe Cornell University meteorologystation located within 0-5 km of the field site.
Biomass. At each harvest, each plant was partitionedinto roots, 1985 + 1986 shoots, 1987 shoots and 1988fixed- and free-growth shoots (Fig. 1). Fixed growthis defined as needles that overwinter in the buds andcontribute to the early summer growth; free growtbis defined as needles and stems that are formedduring the current season, with the stems elongatingduring the period July to September (Lanner, 1976;Cannell & Johnstone, 1978). We refer to above-ground tissues produced prior to June 1988 as oldshoot, to 1988 fixed-growth tissue plus 1988 free-growth tissue as new shoot and to all abovegroundtissue as total shoot (Fig. 1). All tissues not used forcarbohydrate, pigment, or antioxidant analyses wereoven-dried at 70 "C for 72 h and weighed.
Final tree height after extension grow t̂h had ceasedwas analyzed. All trees that remained in thechambers were measured. Bud scars indicated 1986and 1987 final heights.
Carbohydrates. Four hours after the start of thephotoperiod, foliage from each seedling wasseparated into the appropriate age class and then sixto ten sections of fixed-growth tissues were frozenimmediately in liquid nitrogen. Root material usedfor sugar and starch analyses consisted of a mixtureof fine and coarse roots excised approximately 10 cmbelow the root collar. Needle and root tissues werelyophilized and ground in a Wiley Mill to pass a

Seasonal changes in red spruce after two years of exposure to ozone 129
Biomass by age class and growth type
Free
Total tree
Figure 1. Schematic diagram of tissues into which treewas partitioned at harvest.
40-mesh screen and stored desiccated at — 4 "Cuntil analyzed. Total soluble sugars were extractedfrom ground tissue with 12:5:3 methanol:chloro-form : water (Haissig & Dickson, 1979). Sugarconcentration of the methanol-water phasf of theextract was measured by the atithrone reaction(Yemm & Willis, 1954). The starch or insolublefractions were suspended in 4 ml of 0-10 M acetate-0-(}2 M NaF buffer, pH 4-5, placed in a boilinfj waterbath for 15 min, then cooled. One ml of buffercontaining 15 units of amyloglucosidase was addedto the residue and incubated at 50 °C for 24 h.Glucose was determined using the glucose oxidasesystem (Haissig & Dickson, 1979; Ou-Lee & Setter,1985).
Raffinose was determined by passing a liquidextract through a high pressure liquid chromato-graph (Waters, 6000 Multisolvent Delivery System)for separation of sugars. A Brownlee Spheri-5(AS-MP) 5 //m silica bead, c-amino-bonded phasecolumn was eluted with an isocratic gradient ofacetonitrile-water (4:1, v/v) at a flow rate of10 ml min"' and sample concentration wasmeasured with a differential refractometer (Waters,model 410). Sample preparation for raffitiose deter-mination was described in detail by Alscher et aL,(1989).
Pigments. Needles from 1987 and 1988 fixed growthwere removed frotn the mid-section of two fised-growth twigs, weighed and immediately frozen inliquid nitrogen. Frozen needles were ground in cold80^0 acetone using a Polytron homogenizer andcentrifuged at 27000 xg to remove cell debris. Thesupernatant was filtered using a Whatman GF-Bfilter, then brought up to volume with 80 "o acetone.Chlorophylls a and b and total carotenoids weredetermined spectrophotometrically (Arnon, 1949;Wellburn & Lichtenthaier, 1984).
Statistical analyses
The experiment had a completely randomized designof ozone treatments, with the experimental unitbeing the chamber. The seedlings (sampling units)harvested from each chamber represent repeatedmeasurements of the experimental units.
Orthogonal quadratic or cubic polynomials wereused to model the nonlinear response through timeof each variable measured (Snedecor & Cochran,1980; Neter, Wasserman & Kutner, 1985). Thetime-courses of the chlorophyll a-.b ratio and sugarand starch contents of 1988 fixed-growth foliagewere modelled adequately as a linear response. Aseparate function was fit to each chamber of eachozone level for every variable. For each variable, aone-way analysis of variance model was fitted toevery regression coefficient in the polynomial modelto test if difTerent magnitudes of the coefficients wereneeded for the different ozone concentrations. If so,linear, quadratic and cubic contrasts were fitted totest if the magnitude of the regression coefficientsvaried as a function of ozone dose (Row ell & Walters,1976). Because an orthogonalized polynomial wasfitted to each variable, there were independent testsof whether the mean response (intercept), the rate ofincrease or decrease (linear coefficient), curvature(quadratic coefficient) or rate of recurving (cubiccoefficient) differed among the ozone levels. Thisprocedure made it possible to ascertain if a physio-logical response through time differed among theozone concentrations, and, if so, whether the time-courses themselves exhibited a dose-response re-lationship with ozone concentration.
The time-courses of needle raffinose content weremodelled using the natural logarithm of raffinosecontent plus one, to better satisfy the equal varianceassumption for the regressions (Snedecor &Cochran, 1980).
Tree heights or height increments for the 1987 or1988 season were compared among the ozonetreatments using analysis of covariance (Meredith,Miles-McDermott & Federer, 1988; Snedecot &Cochran, 1980), where the heights or height incre-ments were adjusted for the height of the tree priorto exposure to the ozone treatments (1986 treeheight).

130 R. G. Amundson and others
Table 1. Average hourly ozone concentration {nl I ^) for each harvest interval calculated using all 24 hours per
day
Harvest Dayno. of year Amb* CF* I x 2 x 3 x
12345678QAverage
160188216251265279293307335
29404336272425201931
17 + 1-021+0-719+1-017+1-014 + 0711+(V714 + ()-611+0-412 + 0-416 + 0'7
30 + 0-741+0'344 + 0-435 + 0-627 + 0-322+0-423 + 0-518 + 0-318 + 0-231+0-3
44 + 0-663 + 1-069 + 0-751+0-337 + 0 231+0'231+0-325+0-325 + 0-245 + 0-4
59 + 0-686 + 0-995 + 0-969 + 0'750 + 0'441 + 0-438 + 0-433 + 0-330 + 0-260 + 0-6
* In this and subsequent Tables, Amb = ambient, CF = charcoal-filtered and ] x , 2 x , 3 x = X ambient.
Table 2. Tzvelve-hoiir average ozone concentrations (nl l'^) for each harvest interval and for the entire exposure
period
Harvestno.
Dayof year Amb CF l x 2 x 3 x
123456789Average
160188216251265279293307335
35485240292727222136
19+1-3
19+1-616+1-413 ± 0-911+0-913+0-811+0-711+0-516 + 0-9
37+1-053+0-557 + 0-542 + 0-531 ±0-327 + 0-326 ±0-522 ±0-321+0-038 + 0-3
66±]-0%±l-9
108 ± 1 775 ± 0-953+0-746 ± 0-543 ±0-535 ±0-733 ±0-567 + 1-1
95±1-]
158 ±2-0109±l 378 + 0-864 ±0-757 ±0-651+0-644 ±0'397+M
RESULTSOzone exposure
The ozone treatments were started on 1 June 1988and terminated on 1 December 1988. To allowcomparison of the exposure statistics for this studywith those of other studies of ozone's effect on plantgrowth, the average hourly concentrations are pre-sented on a 24~hour per day basis as weli as on a12-hour per day basis, from 0800 to 2000 h (Tables 1and 2, respectively). The maximum ambient hourlyconcentration of ozone was 115 nl 1 ' on 7 July. Thecumulative ozone dose is presented in Figure 2. Bythe end of the experiment those plants in the CF,ambient, 2 x and 3 x treatments had been exposedto 5 1 % , 101 "b, 146% and 196%, respectively, ofthe total ozone dose of those in the 1 x treatment(Fig. 2). The seasonal 12-hour average concentra-tions in the CF, ambient, 2 x and 3 x treatmentswere ^2"^, 95°o. 179% and 251% of the 12-houraverage concentrations in the 1 x treatments.
Air temperatures w-ithin the chambers were con-sistently higher than ambient temperatures duringJuly. From 13 to 31 }uly the average maximumtemperatures were 31-8''C within the chambers and30-4 °C in the ambient plot while minimum tempera-tures were 16-5 °C and 162 °C, respectively. FromAugust until December the average minimum
300
0^150 180 210 240 270 300 330 360
Day of year
Figure 2. Seasonal cumulative 24-hour ozone dose for thefive ozone treatments in 1988. The following symbols arefor CF, • ; l x , A ; 2 x , O ; 3 x , O ; B , ambient.
temperatures were about 0-5 °C higher in thechambers compared w-ith the ambient plot while theaverage maxima were similar. Temperatures in thechambers were similar whether monitored withhygrothermograph or thermocouple.
Biomass
At the start of the treatments in May 1988, total treebiomass averaged 85 g with about 30 g of roots and

Seasonal changes in red spruce after two years of exposure to ozone 131
250'
200 H
E- 150 H
100-
5 0 -
--Total shoot - cf.--Total shoot- 1x
Totai shoot - 2x"Total shoot - 3X~Root tree-•Total
120 150 180 210 240 270
Day of year
300 330
Figure 3. EfFect of ozone on biomass of total tree, root andshoot. An equation for the time course of each variablepresented and the standard errors oi* the appropriateparameters are given in Appendix.
55 g of shoot. Cubic polynomials adequately mod-elled the changes in root biomass, total shoot biomassand total tree biomass during the year (Fig. 3). Forthese tissues, biomass increased at a decreasing rateuntil late October and then decreased. Root bion\ass,total tree biomass and the root-to-shoot ratio werenot affected by ozone treatment. There weresignificant negative linear trends with increasingozone level among the quadratic coefficients for totalshoot biomass (P = 0-019; Fig. 3), indicating that thedeclines in total shoot tissues were sharper in treesexposed to higher concentrations of ozone. Mean1988 fixed-growth biomass declined linearly withincreasing ozone treatment (P = 0'0621 ; Fig. 4).There were no effects of ozone on 1988 free growth,which was highly variable, or total 1988 biomass.
Height of the tree prior to exposure to the ozonetreatments (1986 height) accounted for a significantportion of the variability in height data, whethertotal height or height increment for either 1987 or1988 were analysed (P-value < O-Ol for all analyses).Ozone did not affect total height (about 68 cm) orheight increment in either 1987 (about 14 cm) or in1988 (about 13 cm).
Comparisons of 1 x and ambient treatment meanswere calculated for all biomass variables. There wereno significant differences in biomass between the twotreatments for 1988 fixed growth, 1987 shoots, newshoots, 1985 -^-1986 shoots, old shoots or total shoots.However, there was more 1 988 free-growth biomassfor the 1 X treatment than ambient {P ^ 0-0079) andmore total biomass in ambient than 1 x (P = 0-0137).Mean root biomass was somewhat greater forthe ambient treatment than for the 1 x treatment(P = 0-0835).
Carbohydrates
Starch content in 1988 fixed-growth foliage declinedwhile sugar content increased through the season.
IX 2XOzone treatment
3X
Figure 4. Effect of ozone on mean 1988 fixed-growthbiomass.
IX 2X 3X
Ozone treatmentFigure 5, Effect of ozone on mean starch (O) and meantotal soluble sugar (Q) contents of 1988 fixed-growthfoliage.
There were negative linear trends among the meansof starch and sugar contents with increasing ozonelevel in the 1988 fixed growth (P = 0-0624 and0-0883, respectively; Fig. 5), In addition, there alsowas a negati\e linear trend among the correspondinglinear coefficients (P = 00525) for sugar contents in1988 fixed growth. Thus, trees exposed to higherozone levels tended to have less folJar starch andsugar and accumulated sugar at a lower rate thantrees exposed to the low-er concentrations of ozone.
There were no effects of ozone treatment on thetime-courses of sugar or starch content in the 1987foliage (Fig. 6). In 1987 foliage, sugar contentreached a minimum in midsummer and then in-creased while starch content declined from springuntil midsummer, increased somewhat from mid-summer until early autumn and then declined(Fig. 6). The time-courses for sugar and starch weresimilar for both the 1987 and 1988 foliage,
Raffinose content of current year's foliage was nearor below the detection limit in July and August andthen increased rapidly after the first hard frost inOctober and remained constant to mid-December.Maximum raffinose contents ranged from 4 to 4-5 mgg-' d. w-t. There was a trend (P-vaiue = 0-0937)for a reduction in the rate of accumuiation of raffinose

132 R. G. Amundson and others
180 180
120 150 180 210 240 270
Day of year
300 330
Figure 6. Effect of ozone on mean starch and mean totalsoluble sugar contents of 1987 foliage.
in current year's foliage exposed to the two highestlevels when compared to similarly aged foliageexposed to the two lowest levels of ozone (Table 3),
In roots, sugar content reached a minimum inmidsummer and then increased while starch contentdeclined from spring through midsummer, increasedsomewhat from midsummer through early fall andthen declined (Fig. 7). The time-course of sugarcontent in roots varied for trees exposed to differentozone concentrations: trees exposed to higher con-centrations had higher contents of sugar and in-creased rates of sugar accumulation through time(Fig. 7). The mean sugar content in roots increasedin a curvilinear fashion with the increasing ozonedose (P = 0-0361; Fig. 8), while the rate of sugaraccumulation increased linearly with increasingozone dose (P — 0-0643). Ozone exposure affectedthe time-course of starch content in roots minimally.However, there was a weak trend (P ^ 0-0970;Fig. 8) for a decrease in the mean starch contentwith increasing ozone dose.
Pigments
Contents of chlorophylls a and h in 1987 and 1988foliage had similar time-courses (Figs 9a and b,respectively). Chlorophyll content peaked in earlySeptember and then declined. Carotenoid content of1987 needles declined in early summer and thenincreased until October, while in 1988 foliage
Table 3. Rate of accumulation of raffinose (In {/^.g g~^ d.wt'\-1] day'^) in red .spruce exposed to different levels ofozone. Standard errors are given in parentheses
Treatment (In {/ig g"' d. wt + 11
CFl x2x3x
0-1249(0-0062)0-1251 (0-0080)0-1109(0-0080)0-1122(0-0070)
150-
g 120-•ri"' 90-1
6 0 -
3 0 -
StarchSugar- cf.Sugar- lxSugar- 2xSugar - 3x
120 150 180 210 240 270 300 330
Day of year
Figure 7. Effect of ozone on mean starch and mean totalsoluble sugar contents of roots.
IX 2X 3X
Ozone treatment
Figure 8. Mean starch and total soluble sugar content ofroots.
1100
1000-
900-
800-
700-
600-
500-
400-
300-
200-
100-
1000-
900-
800-
700-
600-
500-
400-
300-
200-
100-
Chlorophyll aChlorophyll b
-,- - Total carotenoids
(a)
CF and 1 X vs. 2 x and 3 x , P-value = 0-0937.
120 150 180 210 240 270 300 330
Day of yearFigure 9. Seasonal changes in chlorophylls a and b andtotal carotenoids for 1987 (a) and 1988 (6) foliage.

Seasonal changes in red spruce after two years of exposure to ozone 133
Table 4. Ratio of chlorophyll a to chlorophyll b content in 1987 and 1988foliage exposed to different levels of osone. Standard errors are given inparentheses
1987 foliage 1988 foliage
Treatment
CFl x2x3xP-value (forlinear trend)
Mean
4-19 (0'04)4-34(0-05)412(0-05)418(0-04)
Mean
4-59(0-07)4-64(0-09)448 (0-09)4'54(0-07)
Slope
-0-0021(0-0009)-0'0004(0-00]2)-0-0033(0-0012)-0-0036(0-0009)
0'076
carotenoid content increased rapidly until late July,did not change through early autumn and increasedslightly in late autumn (Fig. 9 a, b). The chlorophylla/b ratio in 1987 foliage did not vary significantlyw'ith time; thus, the seasonal mean best describes itschlorophyll a/b ratio (Table 4).
Ozone treatments had no effects on seasonalchange in chlorophyll a or chlorophyll b content ofeither 1987 or 1988 foliage. Ozone did not affect theseasonal change in carotenoid content of 1987foliage; however, mean total carotenoid content of1988 foliage tended to increase linearly {P - 0-0888)with exposure to higher concentrations of ozone.The mean chlorophyll a/b ratio in 1987 foliage wasnot affected by ozone dose (Table 4). There was atrend for a sharper decline in chlorophyll a/b ratiothrough time with increasing levels of ozone in the1988 foliage {P = 0-076; Table 4).
The content of all three pigments was low in newneedles and rose rapidly as the needles matured.Pigment contents tended to be lower in 1987 than1988 foliage (Fig. 9a, b). Relative content (amount ofpigment in 1987 compared with 198S foliage on thesame tree) of al! three pigments and the relative ratioof chlorophyll a/b were not influenced hy ozone.Thus, the relationship between pigment contents in1987 and 1988 foliage was not affected by ozonetreatment.
Mean contents for all three pigments in 1987foliage were not significantly different between the1 X and ambient treatments; although the pigmentcontents were nominally higher in ambient than in1 X treatments.
DISCUSSION
These results are from the second year of a two-yearstudy of the effects of ozone on the physiology andgrowth of red spruce and permitted a comparison ofozone-induced effects after treatments over both oneand two growing seasons. Results from the first yearof treatments were presented by Alscher et al.(1989). The seasonal 12-hour and 24-hour averageconcentrations for ambient ozone monitored duringthe 1988 field season in Ithaca, NY were higher than
in the 1987 field season (Alscher et aL, 1989). The12-hour average ozone concentrations were approxi-mately 25 "o higher for the period June to October in1988 than for the same time interval monitored since1980 (36-5 vs. 45ppb; Kohut, Amundson &Laurence, 1986). The cumulative ozone dose (2001r ' -h) for the 2x treatment was equivalent to theambient ozone dose monitored at Whiteface Moun-tain, NY during the 1987 growing season (Johnsonet al., 1988). Thus, ozone exposures used in this studyranged from lower than ambient concentrations inthe eastern United States to higher than ambientconcentrations at sites where spruce dieback isoccurring.
The higher temperatures in the chambers are themost likely cause of the chamber effects noted in thisexperiment. Trees growing in the \ x chambers hadmore free growth, but less total weight and tended tohave less root weight than trees in the ambienttreatments. The consistently higher temperatures inthe chambers in this particularly warm growingseason should have negatively affected the carhonbalance of the trees. By August, Fincher (personalcommunication) found more damaged mesophyllcells in trees maintained in the chambers regardlessof ozone treatment compared with trees maintainedunder ambient conditions. Fincher's findings in-dicate that temperatures were high enough to causecellular damage in the ambient trees and that suchdamage was greater inside the chambers wheretemperatures were higher.
As in the first year of this study (Alscher et al.,1989), exposure to ozone did not affect the time-course or content of any pigment in either age classeven though ozone tended to increase carotenoidcontent in 1988 foliage. A possible explanation forlack of effects was that the variability in pigmentcontents in this population of trees was high andthus the power to detect effects was low. In a similarstudy with Norway spruce, Wallin, Skarby & Sellden(1990) found no effects of ozone on chlorophyllcontent of current year foliage, but found significantozone-induced reductions in older foliage. Chloro-phyll contents in the trees used by Wallin et al.(1990) were three times higher than in the trees used

134 R. G. Amundson and others
in this study. These differences were most likely theresult of higher rates of fertilization in the study byWallin et al. (1990). These results suggest that moreinformation is needed on possible interaetions be-tween ozone stress and foliar nutrient status. Aretrees subjected to high inputs of nitrogen moresensitive to ozone stress ?
The seasonal changes in sugar and starch contentsof red spruce needles and roots were similar to thosereported for red spruce in the first year of this study(Alscher et al. 1989) and for balsam fir (Little, 1970).Presumably, the sharp drop in starch in the year-oldneedles at budbreak resulted from the remobilizationof carbon for rapid growth of new tissues. In theautumn, as part of the cold hardening process, starchlevels dropped below the level of detection(3 mg g"̂ d. wt). During frost hardening, solublesugars become the bulk of the nonstructuralcarbohydrates in conifer needles (Little, 1970;Aronsson, Ingestad & Lars-Gorau. 1976).
In the first year of this study, no differences in thetime-courses of total sugar or starch contents ofneedles were detected among the ozone treatments(Alscher et al., 1989). In the second year, neithersugar nor starch contents were affected by ozonetreatment in 1987 foliage, but both sugar and starchcontents were reduced linearly with increasing ozonedose in 1988 fixed-growth foliage.
In 1987, exposure to higher concentrations ofozone delayed the onset of raffinose production(Alscher ei al., 1989) while in 1988 exposure to thehigher concentrations of ozone tended to reduce therate of accumulation of raffinose when comparedwith foliage exposed to the two lower ozone treat-ments. These slight differences in treatment effectsbetween the two years may be the result of timing ofthe sampling periods. Raffinose is thought to func-tion as a cryoprotectant in cold hardened tissues ofconifers. Any decrease in rates of its production mayrender the affected tissue more vulnerable to freezinginjury during the period when raffinose is reduced.
For roots of Sitka spruce, Ford & Deans (1977)found that starch content peaked in late spring-earlysummer, declined through the summer and wasrelatively low in mid-October. In contrast, rootstarch content in these red spruce seedlings reacheda minimum in mid-July and increased three-fold bymid-October in both the 1987 (Alscher et al., 1989)and the 1988 (this report) field seasons. This periodof rapid starch accumulation coincided witb theperiod of rapid root growth and is consistent w itb theresults of Marshal) & Waring (1985) where starchlevels rise as new roots are formed.
There were no effects of ozone on root biomass orcarbohydrate content in the first Held season (Alscheret al. 1989). However, in the second year, starchcontent of roots decreased and sugar content and itsrate of accumulation increased with increasing ozonedose, but biomass was not affected. These changes
suggest that carbohydrate metabolism within theroots is more sensitive to ozone stress than is totalroot biomass, since ozone-induced differences inroot biomass were not detected.
Even though ozone produced only marginalreductions in biomass of the 1988 fixed-growthtissues several factors mediate against pollutant-induced reductions in red spruce growth in studiesthat cover only a few growing seasons. First, redspruce has inherently low stomatal conductances(Seiler & Cazell, 1990), and thus, low rates ofgaseous uptake. The stomatal conductances are lesstban one fifth those of rapidly growing crop plants,and consequently red spruce foliage would take upapproximately one fifth the amount of ozone as cropspecies under the same environmental conditions(Reich & Amundson, 1985). Second, red spruceseedlings (Alscher et al., 1989; Hausladen et al.,1990) have substantial antioxidant systems thatrespond to exposure to oxidizing air pollutants. Eventhough the stimulation of these systems is notwithout cost, it is most likely to be more costeffective than repair of injured tissues or loss ofdamaged cells. Third, the phenology of red sprucefoliage formation is complex; needle initial numberis set in the growing season prior to needledevelopment. Thus, the maximum number ofneedles on a branch is fixed at the time of budbreak.Therefore, for ozone stress to change needle numberthe treatments have to be imposed for at least twoyears. As such, if a stress does not markedly affectneedle formation or needle and branch elongationthen the biomass oi that age class of foliage isrelatively fixed. However, if the stress is imposedduring the period of needle initial formation therecan be a direct effect on needle number in thefollowing year. Fourth, in young conifers, thepercentage of the total foliage that is new foliage isrelatively high com.pared with that in mature trees.This has major implications for extrapolation ofresults of pollutant studies using seedlings forprediction of effects on mature trees, since in youngtrees the bulk of the foliage is relatively young whilein mature trees only a small percentage of foliage isrenewed annually. Thus, for seedlings and saplings,a high percentage of the foliage has only beenexposed to the pollutant stress for one or twogrowing seasons. Present, cumulative effects on oldertissues may not be manifested in a reduction ingrowth since they could be masked by the higherrates of photosynthesis of the new tissues wbich havebeen minimally stressed by the pollutant.
In conclusion, the lack of an ozone effect on allbiomass measures in the first year of this two-yearstudy (Alscher et al., 1989) is in agreement withother one-year studies of red spruce in which ozonedid not afFect biomass (Taylor et al., 1986; Laurenceet al., 1989). However, in this second year of thestudy, ozone reduced foliar and root starch, increased
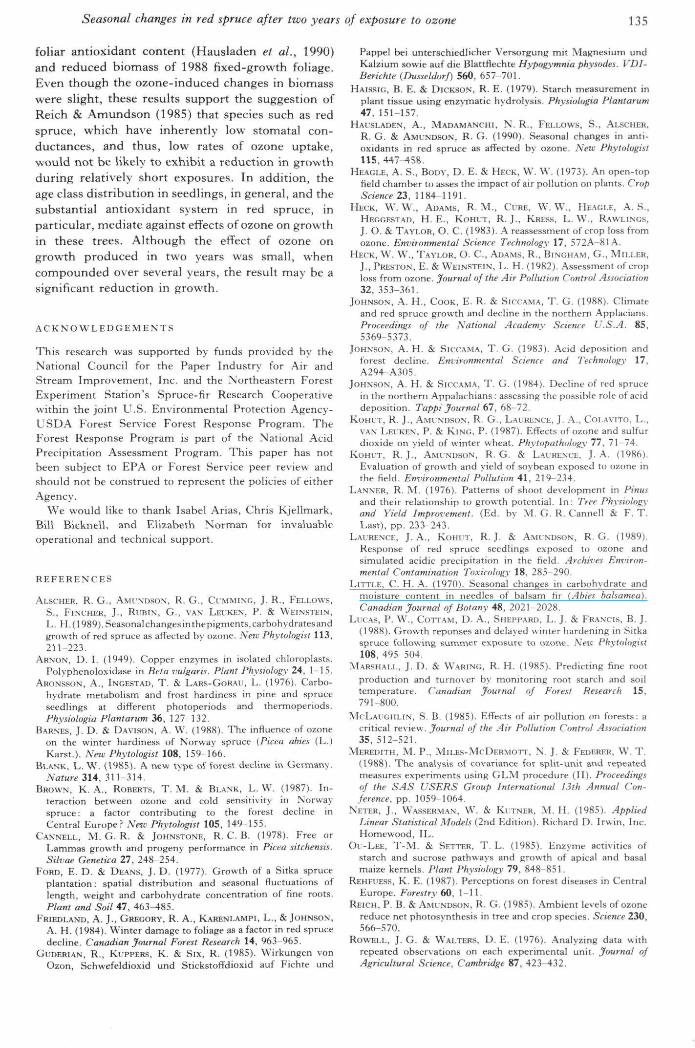
Seasonal changes in red spruce after two years of exposure to ozone 135
foliar antioxidant content (Hausladen et al., 1990)and reduced biomass of 1988 fixed-growth foliage.Even though the ozone-induced changes in biomasswere slight, these results support the suggestion ofReich & Annundson (1985) that species such as redspruce, which have inherently low stomatal con-ductances, and thus, low rates of ozone uptake,would not be likely to exhibit a reduction in growthduring relatively short exposures. In addition, theage class distribution in seedlings, in general, and thesubstantial antioxidant system in red spruce, inparticular, mediate against effects of ozone on growthin these trees. Although the effect of ozone ongrowtb produced in two years was small, whencompounded over several years, the result may be asignificant reduction in growth.
ACKNOWLEDGEMENTS
This research was supported by funds provided by theNational Council for tbe Paper Industry for Air andStream Improvement, Inc. and the Northeastern ForestExperiment Station's Spruce-fir Research Cooperativewithin the joint L^.S. Environmental Protection Agency-USDA Forest Service Forest Response Program. TheForest Response Profjram is part of the National AcidPrecipitation Assessment Program. This paper has notbeen subject to EPA or Forest Service peer review andshould not be construed to represent the policies of eitherAgency.
We would like to thank Isabel Arias, Chris Kjellmark,Bill Bicknell, and Elizabeth Norman for invaluableoperationa! and technical support.
REFERENCES
ALSCHER, R. G,, AMI'NDSON, R. G., CUMMING, J, R., FELLOWS,S., FiNCHEH, J., RUBIN, G . , VAN LEI'KEN, P. & WEINSTEIN,L. II. (1989), Seasonal changes in thepigments.carbobydratesandgrowth (if rt;d spruce as affected by ozone. New Phytologis/ 113,211-223.
ABNON, D . I. (1949). Copper enzymes in isolated chloroplasts.Polyphenoloxidase in Bela vulgaris. Plant Physiology 24, i -1 5.
ARONSSDN, A. , INGESTAD, T , & LAR.';-GoRAr, L. (197(i). Carbo-hydrate metabolism and frost hardiness in pme and spruct'seedlings at different photopcriods and thermoperiods.Physiologia Ptantarum 36, 127-132.
BARNES, J. D. & DAVISON, .\. W. (1988). Tht- infiuence of ozoneon the winter hardiness of Norway spruce (Picea abies (L.)Karst.). New Phytohgisl 108, 159 166.
BLANK, L , W . (19RS1, A new type of forest decline in Gevmany.Nature M4, .̂ 11 .314,
BROWN, K . A.. ROBERTS. T . M . & BLANK, L . W . (1987). In-teraction between ozont- and cold sensitivity in Norwayspruce: a factor contributing to the forest decline inCentral Europe? .Wew Phytohgisl 105, 149-155.
CANNELL, M . G . R. & JOHNBTONE, R. C . B. {l'^78). Free orLammas growth and progeny performance in Picea silchemis.Silvae Genetica 27, 248-254.'
FORD, E . D . & DEANS, J. D. (1977). Growth of a Sitka spruceplantation: spatial distribution and seasonal fluctuations oflength, weight and carbohydrate concentration of fine roots.Plant and Soi! 47, 4(>3^85,
FHIEDI.ANI), A, J , , GREGORY, R. A., KARKNLAMPI, L . , & JOHNSON,A, H. (1984), Winter damage to foiiase as a factor in red sprucedecline. Canadian Journal Forest Research 14, %,1 965.
CJUDERLAN, R., KUPPERS, K. & SlX, R. (1985). Wirkungen vonOzon, Schwefeldioxid und Stickstoffdioxid auf Ficbte und
Pappel bei unterschiedlicher Versorgung mit Magnesium undKalzium sowie auf die Blattflechte Hypogymnia physodes. VDl-Berichte (Dusseldorf) 560, 657-701,
HAIHSIG, B, E , & DICKSON, R. E , (1979), Starch measurement inplant tissue using enzymatic hydrolysis, Physiologia Plantarum47, i5]-LS7.
HAUSLADEN, A,, MADAMANCHI. N . R, , FELLOWS, S,, ALSCHER,R, G, & AMUNDSON, R, G , (1990), Seasonal changes in anti-oxidants in red spruce as affected by ozone. A'rtt' Phytologist115, 447-4S8,
HEAGI.1-, A , S-, BODY, D , E , & HECK, W . W , (1973), An open-topfield chamber to asses the impact of air pollution on plants. CropScienceZ3. 11S4-119],
HECK, \V, W , , AD,AM.S, R, M . , CVRE, W . W , , HHAULE, A, S,,HEGGESTAD, H . E., KOHUT, R, J., KRESS, L . W , , RAWLINGS,J, O, & TAYLOR, O . C . (1983). A reassessment of crop loss fromozone. Enmronmental Science Technology 17, 572A-S1A,
HECK, W , \V, , TAYLOR, O . C , ADAMS, R , , BINGHAM, C , MILLER,.1,, PRESTON, E . & WEINSTEIN, L , H , (19S2), Assessment of croploss from ozone. Journal of the Air Pollutiiin Control Association32, 353-361.
JOHNSON, A, H,, COOK, E . R. & SICCAMA, T , G- (1988). Climateand red spruce growth and decline in the northern Applacians,Proceedings of the National Afudemy Science U.S.A. 85,5369-5373,
JOHNSON, A. H, & SICCAMA, T , G , (1983), Acid deposition andforest decline. Environmental Science and Tei hnologr 17,A294 A3O5,
JOHNSON, A, H. & SICCAMA, T . G , (1VS4), Decline uf red sprueein the nortbern Appalachians : assessing the possible role of aciddeposition, Tappi Journal 67, (tS- 72,
KOHUT, R, J,, AMINDSON, R, G, , LAURENCE, J, A,, COLAVITO, L. ,VAN LEL"KEN, P , & KING, P, (1987), Effects of ozone and sulfurdioxide on yield of winter wheat. Phytopathology 77, 71-74
KOHUT. R, J,, .\MUNDSON, R, G . & LAURENCE, J, .^. (1986).Evaluation of grouth arid yield of soybean exposed to ozone intbe field. Environmental Pollution 41, 219-234,
LANNKR, R, M , (1976), Patterns of sboot development in Pinusand their relationship to growtb potential. In: Tri-e Physiologyand Yield Improvement. (Ed, by M, G. R, Cannell & F-T,Last), pp, 233-243,
LAURENCE, J. A,, KOHUT, R - J , & AMITNDSON, R. G . (1989).Response of red spruce seedlings exposed to ozone andsimulated acidic precipitation in the field. Archives Environ-mental Contamination Toxicology 18. 285 290.
LITTLE, C , H , A. (1970). Seasonal changes in carbohydrate andmoisture content in needles of balsam fir (Abies balsamea).Canadian Journal of Botany 48, 2021-2028,
LUCAS, P , W , , COTTAM, D . .\., SHHPPARD, L , J, & FRANCIS, B, J,(1988), Cjrowth reponseS and delayed winter hardening in Sitkaspruce foUov.ing Rummet exposure to ozone, NeK I'kylologist108, 495-504,
MARSHALL, J, D. & WARING, R, H, (1985). Predicting fine rootproduction and turnover by monitoring root starch and soiltemperature, Canadian Journal of Eorest Research 15,791-800,
MCLAUGHLTN, S, B . (1985), Effects of air pollution on forests: acritical re\ iew. Journal of the Air Pollution Control Association35, 512-521.
MEREDITH, M , P, , M I LES-Me DERM OTT, N , J, & FEDERER, W . T ,(1988), The analysis of covariance for spii\-unit and repeatedmeasures experiments using GLM procedure (H), Proceedingsof the SAS USERS Group International 13th Annua! Con-ference, pp, 1059-1064,
\ETER, J , , WASSERMAN, W , & KI:TNER, .M. H , (1985). AppliedLinear Statistical Modeh {2nA Edition), Richard D, Iruin, Inc.Homewood, IL.
OU-LEE, T - M , & SETTER, T , L , (1985), Enzyme activities ofstarch and sucrose pathways and growtb of apical and basalmaize kernels. Plant Physiology 79, 848 851.
REHFI'ESS, K, E, (1987), Perceptions on forest diseases in CentralEurope, Forestry 60, 1-11,
REICH, P. B, & AMUNDSON, R, C;, (1985), .\mbient levels of ozonereduce net photosynthesis in tree and crop species. Science 230,566-570,
ROWELL, J, G. & W'ALTERS, D , E, (1976), AnalyzinR data withrepeated obser\ations on each experimental unit. Journal ofAgricultural Science, Cambridge 87, 423-432,

136 R. G. Amundson and others
SEILER, J, R, & CAZELL. B , H , (1990), Influence of water stress ontht- physiology and growth of red spruce seedlings. TreePhysiology 6, 69-77,
SNEDECOR, G , \V, & CocHRAN, W, G. (1980), Statistical Methods(7th Edition), Iowa State University Press, Ames, Iowa,
TAYLOR, G , E , , JK., NORBY, R, ] , , MCLAVGHI,IN, S, B. , JOHNSON,A. H. & TURNER, R, S, fl98()). Carbon dioxide assimilation andgrowth of red spruce (Picea rubens .Sarg,) seedlings in responseto ozone, precipitation chemistry, and soil type. Oecoiogia(Berlin) 70, 163-171,
WALLIN, G , , SK.iCRBV, L. & SELI.DEN. (1990), Long-term exposureof Norway spruce, Picea abies (L.) Karst,, to ozone in upen-topchambers. New Phytologist 115, 335-344,
WEI.LBI'RN, A, R, & LICHTENTHALER, H , (1984), Formulae andprogram to determine total carotenoids and chlorophylls a andb of leaf extracts in different solvents. Advances in PhntosvnthesiaResearch II, 9-12.
YEMM, E , W , & Wu.Lis, A,J . (1954), The estimation ofcarbohydrates in plant extracts by anthront. Biochemicalyournal 57, 508-514,
See Appendix opposite.

Seasonal changes in red spruce after two years of exposure to ozone 137
APPENDIX Data for Figures 3, 6, 7 and 9.
Figure 3
(A) Seasonal changes in root biomassy = 312-4'54(A')+ 2-25 X 10"^(;^)-3-29 x U
(57-7)(0'821) (3'7] x lO"'') (5-34x10-'^)
(B) Seasonal changes in total sboot biomass
(115) (1-64) (7'39x]0-^) (l'O7xlO1 X v = 27-5-0-449(^0-h 6-83 X lO-^(A^)-1'37 x 10'
(139) (1-98) (8-93x10-") (1-29x102x y = 2O9-3-O8(A')+ 1-83 x ]()-2(X^)-2-91 x 10"
(120) (1-71) (771 X 10-^) (1-31x10-"3x y ^ 1 2 9 - 2 - O O ( A : ) + 1-42 X \Q-\X')-2-A9 x XO'^
(101) (1'44) (6-51x10-^) (9-40x10'^
(C) Seasonal changes in total tree biomass
(97-1) (1-38) (6-23x10^) (8-99x10-*
Figure 6
(A) Seasonal cbanges in 1987 foHage starch contentv = l ' ( ) 7 x l 0 ' - 1
(88-08) (1-25) (5-65 X 10-") (8-15 X lO"")
(B) Seasonal changes in 1987 foliage total soluble sugar contenty = 159-0-716(A0+ 1-96 x
(11-7) (0-107) (2-31x10-")
Figure 7
(A) Seasonal changes in root starcb contentV = 1-55 X 10»-
{85-2) (1-21) (5-40 X lO"*) (7-74 x
(B) Seasonal cbanges in root total soluble sugar contentCF v = ]17-0'763(A') + 2-]3x
(25-l)(0'231) (4-99 x1 X v = l l l -0 -689(A^+l '88x
(30-5) (0-28) (6-05 x2x y= 156-M5(A1+ 2-99 x
(33-3)(O'3O5) (6-59 X3 X V = I32-()-944(A')+2-65 x
(25'5)(()'233) (5-04 X
Figure 9
(A) Seasonal changes in chlorophyll a in 1987 needlesv = - 2 3 5 + 8-39(A0-172x1
(176) (1-61) (348x10-^)Seasonal changes in chlorophyll b in 1987 needles
v-2O-7+l '31(A')~2'6OxlO •'(52-4) (0-479) (l '04xl0--')
Seasonal cbanges in total carotenoids in 1987 needlesV = 661 - 6-33(A') + 2-78 x 10-^(A") - 3-83 x
(157) (2-23) (9-97 x 10-'') (1-43 x 10-")(B) Seasonal cbanges in chlorophyll a in 1988 needles
v = - 2 8 3 7 + 28-9(A^-5-41 x 1()--̂ (A'̂ )(280) (2-35) (476x10-^)
Seasonal changes m chlorophyll b in 1988 needlesV = - 560+ 5-84(A0- 1-08 x 10"'(A'^)
(71'2)(0'597) (l'21xlO-^)Seasonal changes in total carotenoids in 1988 needles
V = -2630 + 32-4(A)-0-118(^) + l-43(313) (3-98) (1-63 X 10-^) (2-18x10-^)