Basic Principles in Proteomics & Metabolomics - Weatherall ...
ORIGINAL ARTICLE
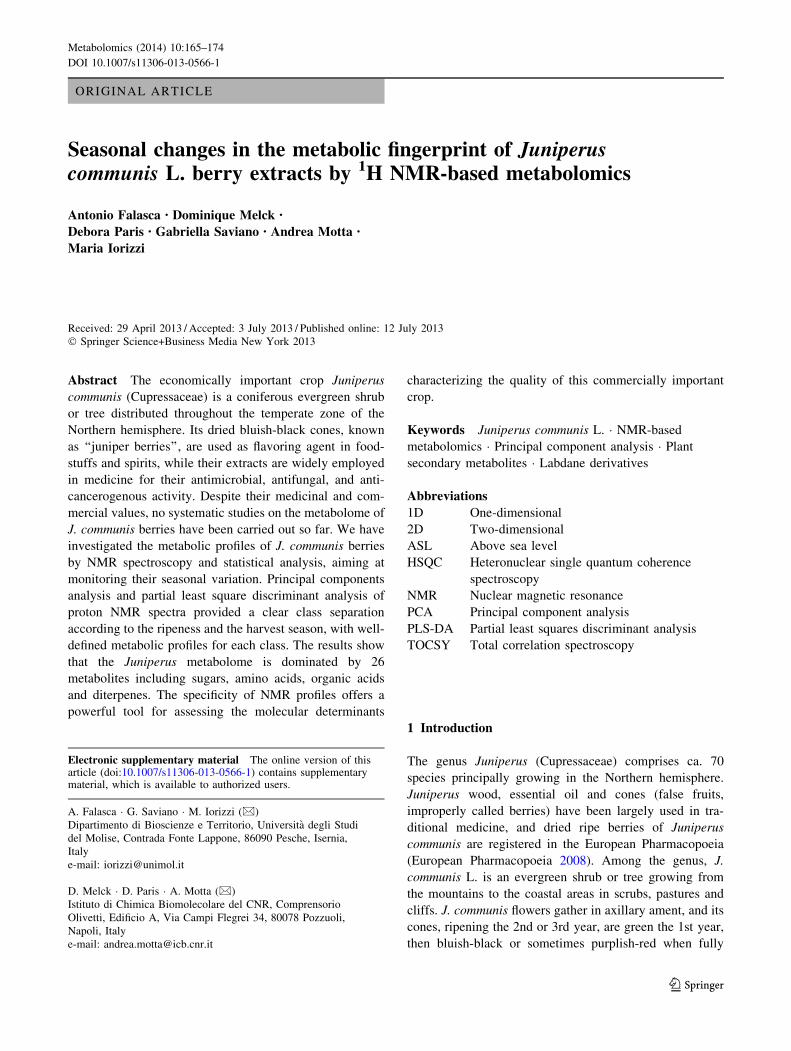
Seasonal changes in the metabolic fingerprint of Juniperuscommunis L. berry extracts by 1H NMR-based metabolomics
Antonio Falasca • Dominique Melck •
Debora Paris • Gabriella Saviano • Andrea Motta •
Maria Iorizzi
Received: 29 April 2013 / Accepted: 3 July 2013 / Published online: 12 July 2013
� Springer Science+Business Media New York 2013
Abstract The economically important crop Juniperus
communis (Cupressaceae) is a coniferous evergreen shrub
or tree distributed throughout the temperate zone of the
Northern hemisphere. Its dried bluish-black cones, known
as ‘‘juniper berries’’, are used as flavoring agent in food-
stuffs and spirits, while their extracts are widely employed
in medicine for their antimicrobial, antifungal, and anti-
cancerogenous activity. Despite their medicinal and com-
mercial values, no systematic studies on the metabolome of
J. communis berries have been carried out so far. We have
investigated the metabolic profiles of J. communis berries
by NMR spectroscopy and statistical analysis, aiming at
monitoring their seasonal variation. Principal components
analysis and partial least square discriminant analysis of
proton NMR spectra provided a clear class separation
according to the ripeness and the harvest season, with well-
defined metabolic profiles for each class. The results show
that the Juniperus metabolome is dominated by 26
metabolites including sugars, amino acids, organic acids
and diterpenes. The specificity of NMR profiles offers a
powerful tool for assessing the molecular determinants
characterizing the quality of this commercially important
crop.
Keywords Juniperus communis L. � NMR-based
metabolomics � Principal component analysis � Plant
secondary metabolites � Labdane derivatives
Abbreviations
1D One-dimensional
2D Two-dimensional
ASL Above sea level
HSQC Heteronuclear single quantum coherence
spectroscopy
NMR Nuclear magnetic resonance
PCA Principal component analysis
PLS-DA Partial least squares discriminant analysis
TOCSY Total correlation spectroscopy
1 Introduction
The genus Juniperus (Cupressaceae) comprises ca. 70
species principally growing in the Northern hemisphere.
Juniperus wood, essential oil and cones (false fruits,
improperly called berries) have been largely used in tra-
ditional medicine, and dried ripe berries of Juniperus
communis are registered in the European Pharmacopoeia
(European Pharmacopoeia 2008). Among the genus, J.
communis L. is an evergreen shrub or tree growing from
the mountains to the coastal areas in scrubs, pastures and
cliffs. J. communis flowers gather in axillary ament, and its
cones, ripening the 2nd or 3rd year, are green the 1st year,
then bluish-black or sometimes purplish-red when fully
Electronic supplementary material The online version of thisarticle (doi:10.1007/s11306-013-0566-1) contains supplementarymaterial, which is available to authorized users.
A. Falasca � G. Saviano � M. Iorizzi (&)
Dipartimento di Bioscienze e Territorio, Universita degli Studi
del Molise, Contrada Fonte Lappone, 86090 Pesche, Isernia,
Italy
e-mail: [email protected]
D. Melck � D. Paris � A. Motta (&)
Istituto di Chimica Biomolecolare del CNR, Comprensorio
Olivetti, Edificio A, Via Campi Flegrei 34, 80078 Pozzuoli,
Napoli, Italy
e-mail: [email protected]
123
Metabolomics (2014) 10:165–174
DOI 10.1007/s11306-013-0566-1
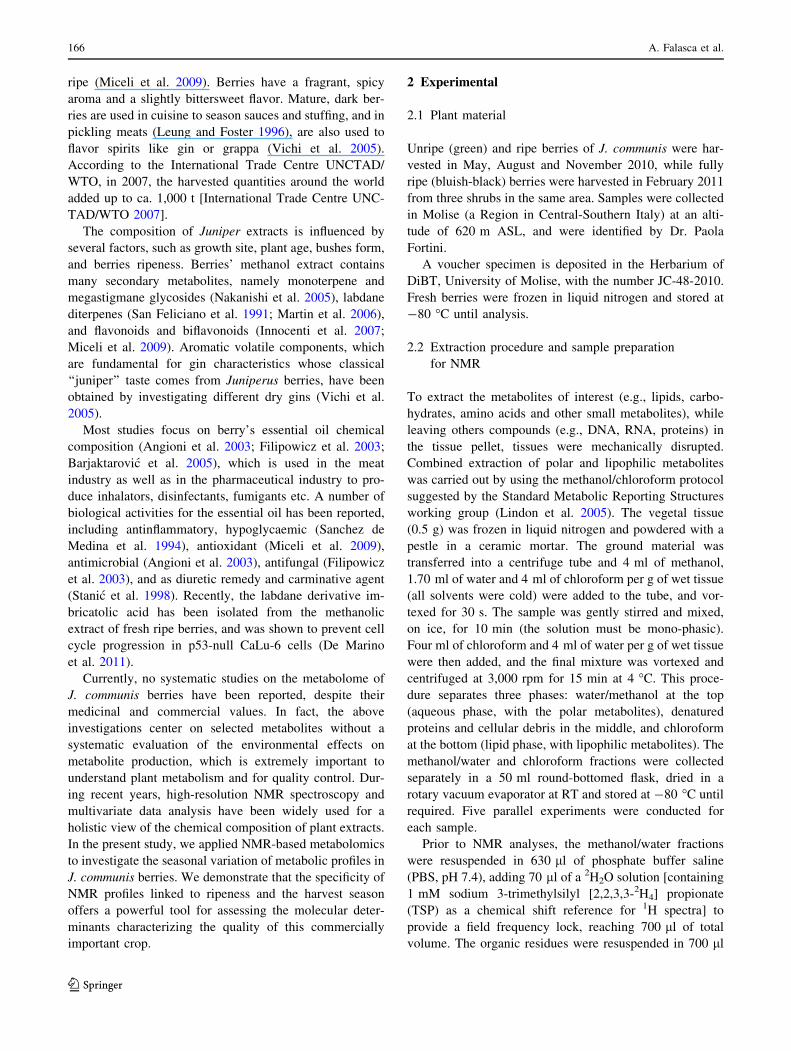
ripe (Miceli et al. 2009). Berries have a fragrant, spicy
aroma and a slightly bittersweet flavor. Mature, dark ber-
ries are used in cuisine to season sauces and stuffing, and in
pickling meats (Leung and Foster 1996), are also used to
flavor spirits like gin or grappa (Vichi et al. 2005).
According to the International Trade Centre UNCTAD/
WTO, in 2007, the harvested quantities around the world
added up to ca. 1,000 t [International Trade Centre UNC-
TAD/WTO 2007].
The composition of Juniper extracts is influenced by
several factors, such as growth site, plant age, bushes form,
and berries ripeness. Berries’ methanol extract contains
many secondary metabolites, namely monoterpene and
megastigmane glycosides (Nakanishi et al. 2005), labdane
diterpenes (San Feliciano et al. 1991; Martin et al. 2006),
and flavonoids and biflavonoids (Innocenti et al. 2007;
Miceli et al. 2009). Aromatic volatile components, which
are fundamental for gin characteristics whose classical
‘‘juniper’’ taste comes from Juniperus berries, have been
obtained by investigating different dry gins (Vichi et al.
2005).
Most studies focus on berry’s essential oil chemical
composition (Angioni et al. 2003; Filipowicz et al. 2003;
Barjaktarovic et al. 2005), which is used in the meat
industry as well as in the pharmaceutical industry to pro-
duce inhalators, disinfectants, fumigants etc. A number of
biological activities for the essential oil has been reported,
including antinflammatory, hypoglycaemic (Sanchez de
Medina et al. 1994), antioxidant (Miceli et al. 2009),
antimicrobial (Angioni et al. 2003), antifungal (Filipowicz
et al. 2003), and as diuretic remedy and carminative agent
(Stanic et al. 1998). Recently, the labdane derivative im-
bricatolic acid has been isolated from the methanolic
extract of fresh ripe berries, and was shown to prevent cell
cycle progression in p53-null CaLu-6 cells (De Marino
et al. 2011).
Currently, no systematic studies on the metabolome of
J. communis berries have been reported, despite their
medicinal and commercial values. In fact, the above
investigations center on selected metabolites without a
systematic evaluation of the environmental effects on
metabolite production, which is extremely important to
understand plant metabolism and for quality control. Dur-
ing recent years, high-resolution NMR spectroscopy and
multivariate data analysis have been widely used for a
holistic view of the chemical composition of plant extracts.
In the present study, we applied NMR-based metabolomics
to investigate the seasonal variation of metabolic profiles in
J. communis berries. We demonstrate that the specificity of
NMR profiles linked to ripeness and the harvest season
offers a powerful tool for assessing the molecular deter-
minants characterizing the quality of this commercially
important crop.
2 Experimental
2.1 Plant material
Unripe (green) and ripe berries of J. communis were har-
vested in May, August and November 2010, while fully
ripe (bluish-black) berries were harvested in February 2011
from three shrubs in the same area. Samples were collected
in Molise (a Region in Central-Southern Italy) at an alti-
tude of 620 m ASL, and were identified by Dr. Paola
Fortini.
A voucher specimen is deposited in the Herbarium of
DiBT, University of Molise, with the number JC-48-2010.
Fresh berries were frozen in liquid nitrogen and stored at
-80 �C until analysis.
2.2 Extraction procedure and sample preparation
for NMR
To extract the metabolites of interest (e.g., lipids, carbo-
hydrates, amino acids and other small metabolites), while
leaving others compounds (e.g., DNA, RNA, proteins) in
the tissue pellet, tissues were mechanically disrupted.
Combined extraction of polar and lipophilic metabolites
was carried out by using the methanol/chloroform protocol
suggested by the Standard Metabolic Reporting Structures
working group (Lindon et al. 2005). The vegetal tissue
(0.5 g) was frozen in liquid nitrogen and powdered with a
pestle in a ceramic mortar. The ground material was
transferred into a centrifuge tube and 4 ml of methanol,
1.70 ml of water and 4 ml of chloroform per g of wet tissue
(all solvents were cold) were added to the tube, and vor-
texed for 30 s. The sample was gently stirred and mixed,
on ice, for 10 min (the solution must be mono-phasic).
Four ml of chloroform and 4 ml of water per g of wet tissue
were then added, and the final mixture was vortexed and
centrifuged at 3,000 rpm for 15 min at 4 �C. This proce-
dure separates three phases: water/methanol at the top
(aqueous phase, with the polar metabolites), denatured
proteins and cellular debris in the middle, and chloroform
at the bottom (lipid phase, with lipophilic metabolites). The
methanol/water and chloroform fractions were collected
separately in a 50 ml round-bottomed flask, dried in a
rotary vacuum evaporator at RT and stored at -80 �C until
required. Five parallel experiments were conducted for
each sample.
Prior to NMR analyses, the methanol/water fractions
were resuspended in 630 ll of phosphate buffer saline
(PBS, pH 7.4), adding 70 ll of a 2H2O solution [containing
1 mM sodium 3-trimethylsilyl [2,2,3,3-2H4] propionate
(TSP) as a chemical shift reference for 1H spectra] to
provide a field frequency lock, reaching 700 ll of total
volume. The organic residues were resuspended in 700 ll
166 A. Falasca et al.
123

of C2HCl3. Then the samples were transferred in NMR
tubes.
2.3 NMR analysis
One-dimensional (1D) spectra were recorded on a Bruker
Avance III-600 MHz spectrometer (Bruker BioSpin GmbH,
Rheinstetten, Germany), equipped with a TCI CryoProbeTM
fitted with a gradient along the z-axis, at a probe tempera-
ture of 27 �C. 1D proton spectra were acquired at 600 MHz
by using the excitation sculpting sequence (Hwang and
Shaka 1995). A double-pulsed field gradient echo was used,
with a soft square pulse of 4 ms at the water resonance
frequency, with the gradient pulse of 1 ms each in duration,
adding 256 transients of 16,384 points with a spectral width
of 8,389.3 Hz. Time-domain data were all zero-filled to
32,768 points, and prior to Fourier transformation, an
exponential multiplication of 0.6 Hz was applied. For the
two-dimensional (2D) clean total correlation spectroscopy
(TOCSY) (Griesinger et al. 1988; Bax and Davis 1985)
spectra we used a standard pulse sequence with a spin-lock
period of 64 ms, achieved with the MLEV-17 pulse
sequence, and incorporating the excitation sculpting
sequence for water suppression. In general, 256 equally
spaced evolution-time period t1 values were acquired,
averaging 64 transients of 2,048 points, with 8,389.3 Hz of
spectral width. Time-domain data matrices were all zero-
filled to 4,096 points in both dimensions, thus yielding a
digital resolution of 2.04 Hz/pt. Prior to Fourier transfor-
mation, a Lorentian-to-Gauss window with different
parameters was applied for both t1 and t2 dimensions for all
the experiments. Spectra in water were referred to internal
0.1 mM TSP, assumed to resonate at d = 0.00 ppm; spectra
in chloroform were referred to the residual solvent line,
assumed to resonate at d = 7.26 ppm.
Natural abundance 2D 1H–13C heteronuclear single
quantum coherence (HSQC) spectra were recorded at
150.90 MHz for 13C, using an echo-antiecho phase sen-
sitive pulse sequence with adiabatic pulses for decoupling
(Palmer et al. 1991; Kay et al. 1992) and pre-saturation
for water suppression (Schleucher et al. 1994). 128
equally spaced evolution time period t1 values were
acquired, averaging 240 transients of 2,048 points and
using GARP4 for decoupling. The final data matrix was
zero-filled to 4,096 in both dimensions, and apodized
before Fourier transformation by a shifted cosine window
function in t2 and in t1. Linear prediction was also applied
to extend the data to twice its length in t1. HSQC spectra
in water were referred to the a-glucose doublet resonating
at 5.25 ppm for 1H and 95.10 ppm for 13C, while those in
chloroform were referred to 7.26 ppm for 1H and
77.70 ppm for 13C.
2.4 Data analysis
The 0.50–8.50 ppm proton region of aqueous extracts, and
the 0.50–7.00 ppm proton region of organic fractions were
automatically data reduced to integrated regions (buckets) of
0.02-ppm width using the AMIX 3.9.7 package (Bruker
Biospin GmbH, Rheinstetten, Germany). The residual water
resonance region (4.72–4.96 ppm) was excluded, and each
integrated region was normalized to the total spectrum area.
To differentiate samples through NMR spectra, we carried
out a multivariate statistical data analysis using projection
methods. The integrated data reduced format of the spectra
was imported into SIMCA-P? 12 package (Umetrics,
Umea, Sweden), and principal component analysis (PCA)
and partial least squares discriminant analysis (PLS-DA)
were performed. Mean-centering and Pareto scaling were
used as data pre-treatment for both PCA and PLS-DA. Each
spectral region was scaled to (1/sk)1/2, where sk is the stan-
dard deviation for variable k, increasing the contribution of
lower concentration metabolites in the generated models
compared with models where no scaling is used. In this case,
all variables are given equal weighting, so that the model is
not biased towards the higher magnitude variables (as these
generally have larger variances). This scaling effectively
increases the importance of low concentration metabolites in
the resultant models, but not to an extent where the noise
significantly contributes to the model (Llorach-Asuncion
et al. 2010).
PCA was first applied to extract and display the sys-
tematic variation in a data matrix to identify trends and
clusterings in an unsupervised manner (i.e., no prior group
knowledge is used in the calculation) (Eriksson et al.
2006). However, PLS-DA was also used to better define
clustering. This classification tool is based on the PLS
model in which the dependent variable is chosen to rep-
resent the class membership (Westerhuis et al. 2008).
Validation of the models was carried out using sevenfold
cross-validation and permutation tests (400 repeats) to test
possible model overfit. The quality of all PCA and PLS-DA
models was evaluated using the correlation coefficient R2
and a cross-validate correlation coefficient Q2.
Metabolites concentration was obtained by integrating
isolated NMR signals, referred to the internal TSP standard
of known concentration.
3 Results and discussion
3.1 Identification of metabolites in aqueous extracts
Supplementary Figure S1a–d, representing spring to win-
ter, shows the 1D 1H-NMR spectra of the aqueous extracts
Seasonal changes in Juniperus communis L. 167
123

in the four seasons. Resonances were identified by com-
parison with NMR data of authentic samples (De Marino
et al. 2011) with the help of 2D TOCSY and HSQC
experiments. Where space permits, identified resonances
are labeled according to supplementary Table S1. Visual
inspection of the aromatic (7.5–5.5 ppm), carbohydrate
(5.0–3.0 ppm), and aliphatic (3.0–1.0 ppm) regions in the
spring profile (Fig. S1a) indicates that the carbohydrate
region is rather complex because of the overlapping sig-
nals. The sucrose signals are clearly distinguishable at
5.43 ppm (label 16, H-1 of glucose) and 4.23 ppm (16, H-3
of fructose unit), associated with the characteristic signals
for the a-glucose at 5.25 ppm (label 15), and b-glucose at
4.66 ppm (label 14). The aromatic region is dominated by
signals from the anionic form of shikimic acid, and cate-
chin. Shikimate characteristic signals include an olefinic
proton at 6.50 ppm (label 9, H-2), two methylene protons
at 2.21 and 2.78 ppm (9, spectrum S1B, H2-6), and a
methine proton at 4.42 ppm (9, spectrum S1B, H-3). Res-
onances at 6.81, 6.73, 6.02 and 5.90 ppm were respectively
assigned to the H-20, overlapping H-50 and H-60, H-8 and
H-6 of the catechin moiety (label 11).
In the aliphatic region, the ring structure of quinate
(label 6, spectrum S1B) was established through the
extensive TOCSY coupling between two methylene groups
(CH2-2, 1.90/2.08 ppm; CH2-6, 2.01/2.08 ppm), and three
hydroxylated methine protons (H-3, 4.03 ppm; H-4,
3.56 ppm; H-5, 4.17 ppm). In addition, in the spring
extract (Fig. S1a), some amino acids were identified,
namely, alanine (label 4), glutamine (label 8), aspartate
(label 12), glycine (label 17) and arginine (label 5). The
presence of choline (label 13) was indicated by the char-
acteristic singlet at 3.19 ppm stemming from the N?(CH3)3
group. The assignment was supported by the HSQC cor-
relation with the methyl carbon at 56.6 ppm.
The summer (Fig. S1b) and autumn (Fig. S1c) profiles
show almost the same pattern of the spring profile,
although with different intensity: the concentration of shi-
kimate, quinate, catechin and choline increases in summer
to gradually decrease in autumn. Surprisingly, the winter
profile (Fig. S1d) only shows the carbohydrate signals from
a and b glucose (labels 15 and 14, respectively), and the
fructose (label 18). No sucrose signals were instead
detected.
3.2 Identification of metabolites in the chloroform
extracts
The 1H-NMR spectral regions of the chloroform extracts of
Juniperus berries are shown in supplementary Fig. S2a–d,
representing spring to winter. Assignment of metabolites is
reported in the supplementary Table S2. Three labdane-type
diterpenoids namely cis-communic acid, myrcecommunic
acid, and imbricatolic acid (supplementary Fig. S3) have
been detected in the proton spring spectrum (labeled 3, 1,
and 2, respectively, in Fig. S2), with cis-communic acid
being the major component. The cis-communic and myr-
cecommunic acids were identified starting from olefinic
proton signals, and recognizing the carbon resonances in
HSQC spectra. Imbricatolic acid, which bears a saturated
side chain with a terminal primary alcoholic group, was
identified from the multiplet at 3.67 ppm, labeled 2 in Fig.
S2d. An aldehyde, cis-communal, found as a minor com-
ponent in the spring extract, was identified by means of the
–CHO group characteristic signal at 9.75 ppm (inset Fig.
S2a, label 4); it correlated with the corresponding carbon at
206.2 ppm in the HSQC experiment.
The 1H-NMR profiles of summer (Fig. S2b) and autumn
(Fig. S2c) extracts present almost the same components,
although in lower concentration compared with spring. The
winter spectrum (Fig. S2d) clearly indicated an increase in
concentration of imbricatolic acid (labeled 2) with respect
to autumn, and traces of sandarocopimaric acid (label 6)
could be identified by the olefinic signal at 5.76 ppm (H-
15). Trans-communic acid (label 5 and t) was also identi-
fied from the signals at 5.40 ppm (H-12) and 6.31 ppm (H-
14), in the ratio 1:3 (inset in Fig. S2d) with the corre-
sponding isomer cis-communic acid (label 3 and c) (Fang
et al. 1993).
3.3 Statistical analysis
To obtain statistically relevant biochemical information
from NMR data, each spectrum (sample) was completely
analyzed, and pattern recognition based on multivariate data
analysis was applied. We first applied unsupervised PCA to
all pairs (spring–summer, summer–autumn, autumn–winter,
winter–spring), obtaining a sample classification of ca. 70 %
(samples classes correctly identified) (data not shown). We
next applied PLS-DA to all seasons pairs, obtaining a
stronger regression model (96 %, p \ 0.0001) between all
pairs.
The resulting supervised models were tested by itera-
tively predicting the class membership of every sample,
and the results were used to evaluate the goodness of fit
(R2) and the goodness of prediction (Q2), for which
acceptable values must be C0.5 (Eriksson et al. 2006). For
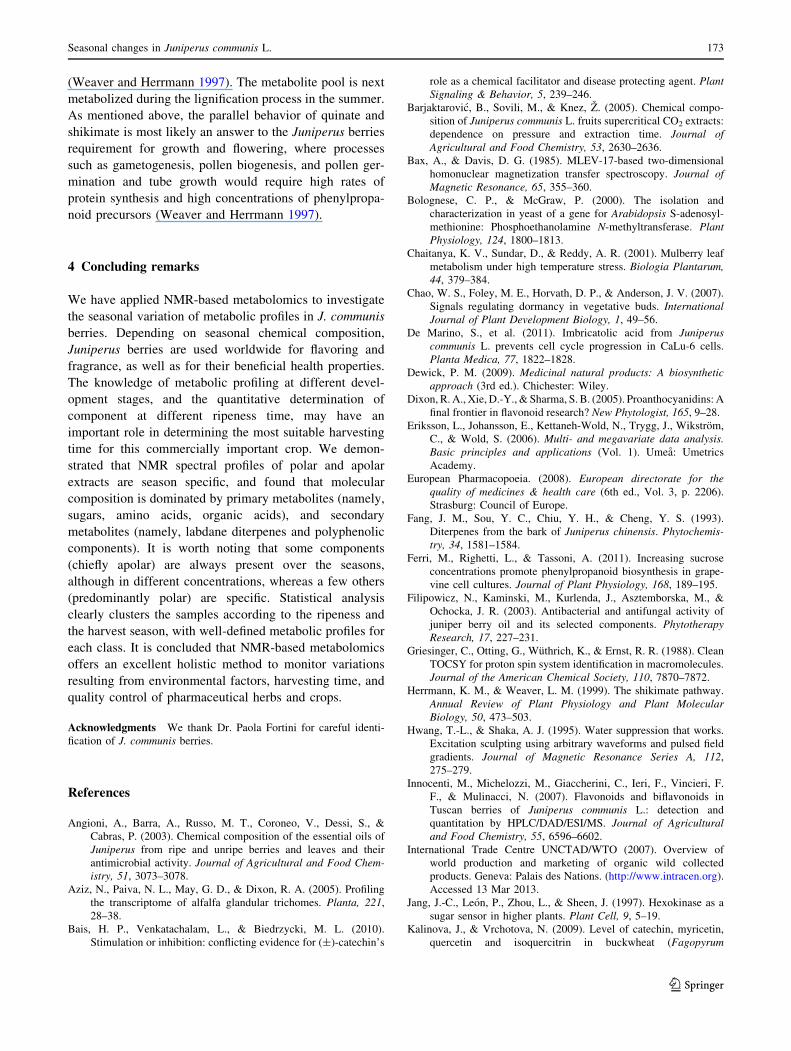
the models describing polar extracts (Fig. 1), the spring
versus summer scores plot (Fig. 1a) presented R2 = 0.884
and Q2 = 0.978; for summer versus autumn we obtained
R2 = 0.756 and Q2 = 0.963; for autumn versus winter we
recorded R2 = 0.922 and Q2 = 0.996; and for winter
versus spring we obtained R2 = 0.949 and Q2 = 0.999.
For the models describing chloroform extracts (scores plots
in Fig. 2), spring versus summer presented R2 = 0.634
and Q2 = 0.711; for summer versus autumn we obtained
168 A. Falasca et al.
123
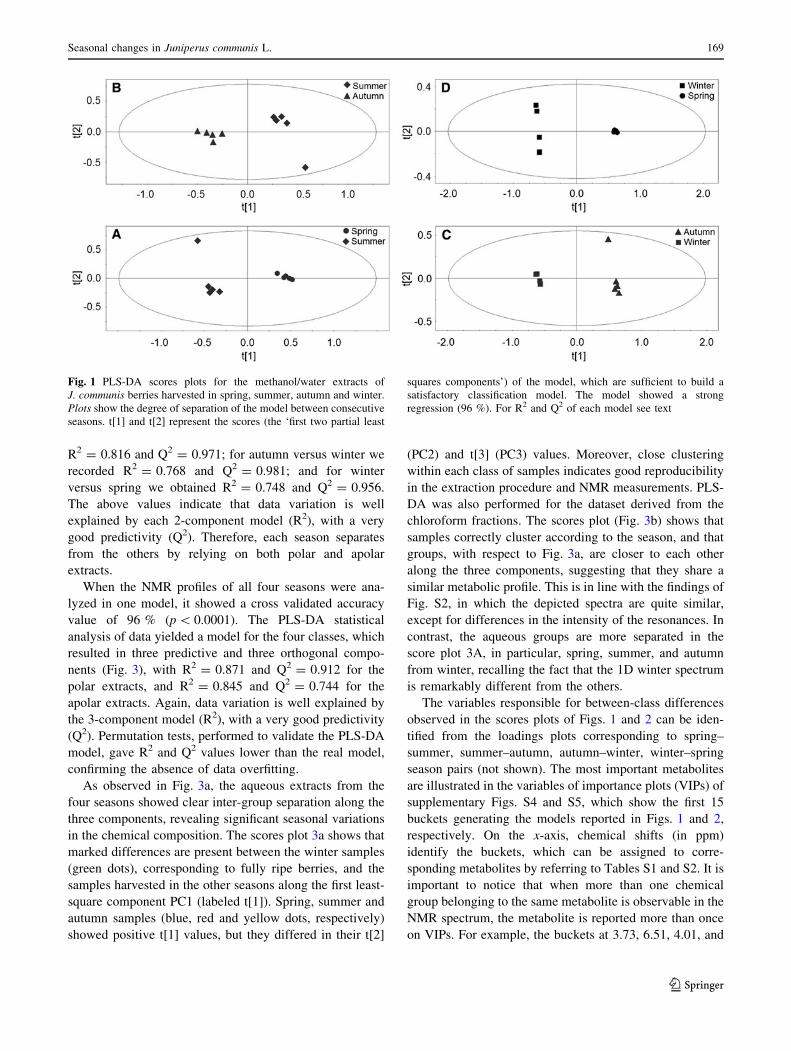
R2 = 0.816 and Q2 = 0.971; for autumn versus winter we
recorded R2 = 0.768 and Q2 = 0.981; and for winter
versus spring we obtained R2 = 0.748 and Q2 = 0.956.
The above values indicate that data variation is well
explained by each 2-component model (R2), with a very
good predictivity (Q2). Therefore, each season separates
from the others by relying on both polar and apolar
extracts.
When the NMR profiles of all four seasons were ana-
lyzed in one model, it showed a cross validated accuracy
value of 96 % (p \ 0.0001). The PLS-DA statistical
analysis of data yielded a model for the four classes, which
resulted in three predictive and three orthogonal compo-
nents (Fig. 3), with R2 = 0.871 and Q2 = 0.912 for the
polar extracts, and R2 = 0.845 and Q2 = 0.744 for the
apolar extracts. Again, data variation is well explained by
the 3-component model (R2), with a very good predictivity
(Q2). Permutation tests, performed to validate the PLS-DA
model, gave R2 and Q2 values lower than the real model,
confirming the absence of data overfitting.
As observed in Fig. 3a, the aqueous extracts from the
four seasons showed clear inter-group separation along the
three components, revealing significant seasonal variations
in the chemical composition. The scores plot 3a shows that
marked differences are present between the winter samples
(green dots), corresponding to fully ripe berries, and the
samples harvested in the other seasons along the first least-
square component PC1 (labeled t[1]). Spring, summer and
autumn samples (blue, red and yellow dots, respectively)
showed positive t[1] values, but they differed in their t[2]
(PC2) and t[3] (PC3) values. Moreover, close clustering
within each class of samples indicates good reproducibility
in the extraction procedure and NMR measurements. PLS-
DA was also performed for the dataset derived from the
chloroform fractions. The scores plot (Fig. 3b) shows that
samples correctly cluster according to the season, and that
groups, with respect to Fig. 3a, are closer to each other
along the three components, suggesting that they share a
similar metabolic profile. This is in line with the findings of
Fig. S2, in which the depicted spectra are quite similar,
except for differences in the intensity of the resonances. In
contrast, the aqueous groups are more separated in the
score plot 3A, in particular, spring, summer, and autumn
from winter, recalling the fact that the 1D winter spectrum
is remarkably different from the others.
The variables responsible for between-class differences
observed in the scores plots of Figs. 1 and 2 can be iden-
tified from the loadings plots corresponding to spring–
summer, summer–autumn, autumn–winter, winter–spring
season pairs (not shown). The most important metabolites
are illustrated in the variables of importance plots (VIPs) of
supplementary Figs. S4 and S5, which show the first 15
buckets generating the models reported in Figs. 1 and 2,
respectively. On the x-axis, chemical shifts (in ppm)
identify the buckets, which can be assigned to corre-
sponding metabolites by referring to Tables S1 and S2. It is
important to notice that when more than one chemical
group belonging to the same metabolite is observable in the
NMR spectrum, the metabolite is reported more than once
on VIPs. For example, the buckets at 3.73, 6.51, 4.01, and
Fig. 1 PLS-DA scores plots for the methanol/water extracts of
J. communis berries harvested in spring, summer, autumn and winter.
Plots show the degree of separation of the model between consecutive
seasons. t[1] and t[2] represent the scores (the ‘first two partial least
squares components’) of the model, which are sufficient to build a
satisfactory classification model. The model showed a strong
regression (96 %). For R2 and Q2 of each model see text
Seasonal changes in Juniperus communis L. 169
123

4.43 ppm in supplementary Fig. S4a all identify shikimate,
which is one of the relevant metabolites separating spring
from summer berries using polar extracts.
3.4 Quantification of metabolites generating seasonal
variation
The NMR spectra reported in Fig. S2 indicate that lipo-
philic profiles can be divided in two pairs: spring and
winter (traces S2a, d) and summer and autumn (traces S2b,
c). Overall, the profiles are virtually identical, only show-
ing different metabolite concentration. The Cupressaceae
family is known to be a rich source of sesquiterpenoids
and diterpenoids, which are important chemotaxonomic
markers and possibly important ecophysiological metabo-
lites. Plant vacuoles can serve as storage organelles for
primary and secondary metabolites, sometimes reaching
high concentration (Taiz 1992; Wink 1993). Since many of
these compounds are toxic, deterrent or repellent against
microorganisms/viruses/herbivores, when needed they can
be retrieved from the vacuole and utilized. It can be
hypothesized that the constant presence of specific apolar
metabolites can be part of the vacuole reservoir and be used
in metabolic pathways involved in actions like growth,
defense, etc., used at variable concentration over the year
(Taiz 1992; Wink 1993).
Figure 4 illustrates seasonal concentration variation of
some of the most important polar metabolites. We focused
Fig. 2 PLS-DA scores plots for the chloroform extracts of J.
communis berries harvested in spring, summer, autumn and winter.
Plots show the degree of separation of the model between consecutive
seasons. t[1] and t[2] represent the scores (the ‘first two partial least
squares components’) of the model, which are sufficient to build a
satisfactory classification model. The model showed a strong
regression (96 %). For R2 and Q2 of each model see text
Fig. 3 Score plot of three-
component PLS-DA model of
methanol/water extracts (a) and
chloroform extracts (b). t[1],
t[2] and t[3] along the axes
represent the scores (the ‘first
three partial least squares
components’) of the model,
which are sufficient to build
satisfactory classification
models that separates seasons.
The model showed a cross
validated accuracy value of
96 %, with R2 = 0.871 and
Q2 = 0.912 for the polar
extracts, and R2 = 0.845 and
Q2 = 0.744 for the chloroform
extracts
170 A. Falasca et al.
123

on polar metabolites since they showed the largest seasonal
differences (Figs. S1, S3a) with respect to those observed
for apolar profiles (Figs. S2, S3b). Compared with summer,
spring berries’ extracts show higher levels of sucrose
(histogram 4c). Summer berries present higher concentra-
tions of choline, catechin, quinate and shikimate (panels
4a, b, e, f) in comparison with spring and autumn samples.
Finally, winter samples showed high levels of a-glucose,
fructose and b-glucose (histograms 4d, g, h) as the sole
metabolites present, while choline, catechin, sucrose, qui-
nate and shikimate were beyond NMR detection. Table 1
reports the concentration of polar metabolites as obtained
from isolated 1H-NMR resonances over the seasons, in mM
and in mg/g of berries.
Sucrose showed the maximum concentration in spring
and disappeared in winter, while a-, b-glucose and fruc-
tose, virtually absent during spring, summer and autumn,
maximized the concentrations in winter when sucrose
disappears. Sugar metabolism is a very dynamic process,
and metabolic fluxes and sugar concentrations vary dra-
matically both during development and in response to
environmental signals such as diurnal changes, and biotic
and abiotic stress (Rolland et al. 2006). Sugars are known
to act as signaling molecules regulating gene expression
during plant development, and play an important role in
regulating vegetative dormancy (Chao et al. 2007). The
high sucrose content in spring (Fig. 4c) could be explained
by a low or absent enzymatic activity during the growing
season, when glucose is required as an energy source
(Koch 2004; Lunn 2008). On the contrary, fructose and
glucose accumulate in winter during a dormancy period
when they act as storage compounds (Rolland et al. 2006).
A similar sugar pattern has been reported for the pollina-
tion drops from cones of J. communis collected in the
Fig. 4 Absolute quantification
of selected metabolites,
obtained by integrating isolated
peaks in the 1H-NMR spectra.
Concentrations are given in
mg/g of berries. Data are shown
as mean of concentration ± SD,
with n = 5
Seasonal changes in Juniperus communis L. 171
123

February–March period (Mugnaini et al. 2007). The lower
levels of sugars observed in summer period (panels 4c, d, g,
h) could relate to temperature increase since, under heat
stress, sucrose synthesis is greatly influenced by the
reduced activities of sucrose phosphate synthase (Chaita-
nya et al. 2001), ADP glucose pyrophosphorylase and
invertase, with a parallel increase of starch (Vu et al. 2001).
Sugars are involved in several other processes like photo-
synthesis, respiration, nitrogen metabolism and defense
mechanisms (Jang et al. 1997). Sucrose strongly up-regu-
lates the flavonoid and anthocyanin biosynthetic pathways
in Arabidopsis thaliana; this process is sucrose-specific
since glucose and fructose produced virtually no effect
(Solfanelli et al. 2006). Similar results have been reported
for phenylpropanoid biosynthesis in Vitis vinifera cell
cultures (Ferri et al. 2011).
Juniperus communis berries contain several compounds
belonging to the category of catechins (flavan-3-ols).
Flavonoids have a number of important physiological roles
in root development, seed germination, allelopathy, plant–
bacterium interaction, UV-B protection, and plant defense
against pathogens and environmental stress (Peer and
Murphy 2006; Liu et al. 2012, and references therein). The
J. communis berries begin life as small flowering cones,
with a flowering time in April–June. Each berry contains
3–6 seeds, but some of them are often infertile due to insect
infestations. Catechin, whose highest level is often found in
plant flowers (Kalinova and Vrchotova 2009), is generally
regarded as the most common basic unit of proanthocy-
anidins, which, together with monomeric flavan-3-ols and
their derivatives, are considered the first line of defense
against microbial pathogens and insect pests (Aziz et al.
2005; Dixon et al. 2005). Therefore, an early increase of
catechin concentration, as the growing presence of catechin
up to summer (Fig. 4b), could provide a hostile environ-
ment to potential microbial invaders to protect the plant
growth. In the seed coat of Sesbania virgata (?)-catechin
seems to operate as an allelochemical (Simoes et al. 2008),
although some doubts are cast on the protecting role of
catechin (Bais et al. 2010).
Choline increases from spring to its maximum concen-
tration in summer berries, to decrease in autumn and dis-
appear in winter time (Fig. 4a). Choline is the precursor of
the osmolyte glycine betaine, which plays an important
role in conferring resistance to abiotic stresses by stabi-
lizing highly ordered structures of complex proteins and
membranes (Sakamoto and Murata 2000). Furthermore,
increased osmolytes concentration in the cytosol may
increase cellular water content, resulting in greater turgor
pressure that favors cell expansion (Zhang et al. 2007).
This, together with the fact that choline production is also
vital for synthesizing the major plant membrane lipid
phosphatidylcholine (Moore 1990; Bolognese and McGraw
2000), suggests that the observed choline variation should
be related to Juniperus berries growth.
The seasonal variation of quinate and shikimate is strictly
related (Fig. 4e, f): these compounds, with highest concen-
tration in summer, are both found in the shikimate pathway
(Herrmann and Weaver 1999; Dewick 2009). In this path-
way, the presence of a quinate hydrolyase that reversibly
catalyzes the conversion of quinate to shikimate, indicates
that shikimate is a direct degradation product of quinate. The
end product of the pathway, chorismate, is the precursor of
tyrosine, phenylalanine and tryptophan, which, in turn, are
precursors of a large variety of plant secondary metabolites
like flavonoids, many phytoalexins, indole acetate, alkaloids
such as morphine, UV light protectants, and lignin (Herr-
mann and Weaver 1999; Dewick 2009).
A high demand for shikimate pathway intermediates for
both primary and secondary metabolism is reasonable in
the growing and flowering periods (Weaver and Herrmann
1997). For example, in spring, the presence of quinate and
shikimate seems to be important in developing coniferous
needles in the course of photosynthetic CO2 fixation
Table 1 Absolute quantification (mM, with respect to 100 lM internal TSP) of principal polar metabolites obtained by integrating isolated 1H
NMR resonances
Metabolite Spring Summer Autumn Winter
mM mg/g of
berries
mM mg/g of
berries
mM mg/g of
berries
mM mg/g of
berries
a-Glucose 5.12 ± 1.01 1.29 ± 0.25 7.55 ± 0.89 1.90 ± 0.22 6.60 ± 0.32 1.66 ± 0.08 207.62 ± 18.34 52.37 ± 4.62
b-Glucose 1.53 ± 0.40 0.38 ± 0.10 2.47 ± 0.32 0.62 ± 0.08 2.35 ± 0.15 0.59 ± 0.04 105.53 ± 10.37 26.62 ± 2.62
Sucrose 32.29 ± 4.16 15.47 ± 1.99 2.30 ± 1.44 1.10 ± 0.69 9.92 ± 3.08 4.75 ± 1.48 – –
Shikimate 9.24 ± 1.88 2.24 ± 0.46 29.32 ± 2.83 7.11 ± 0.69 13.42 ± 1.61 3.25 ± 0.39 – –
Catechin 2.39 ± 0.33 0.97 ± 0.14 6.94 ± 0.75 2.82 ± 0.30 6.19 ± 2.85 2.51 ± 1.16 – –
Fructose – – – – – – 217.35 ± 12.70 54.82 ± 3.20
Quinate 2.72 ± 0.37 0.73 ± 0.10 19.23 ± 1.19 5.15 ± 0.32 5.51 ± 0.62 1.47 ± 0.17 – –
Data are shown as mean concentration ± SD, with n = 5
172 A. Falasca et al.
123
(Weaver and Herrmann 1997). The metabolite pool is next
metabolized during the lignification process in the summer.
As mentioned above, the parallel behavior of quinate and
shikimate is most likely an answer to the Juniperus berries
requirement for growth and flowering, where processes
such as gametogenesis, pollen biogenesis, and pollen ger-
mination and tube growth would require high rates of
protein synthesis and high concentrations of phenylpropa-
noid precursors (Weaver and Herrmann 1997).
4 Concluding remarks
We have applied NMR-based metabolomics to investigate
the seasonal variation of metabolic profiles in J. communis
berries. Depending on seasonal chemical composition,
Juniperus berries are used worldwide for flavoring and
fragrance, as well as for their beneficial health properties.
The knowledge of metabolic profiling at different devel-
opment stages, and the quantitative determination of
component at different ripeness time, may have an
important role in determining the most suitable harvesting
time for this commercially important crop. We demon-
strated that NMR spectral profiles of polar and apolar
extracts are season specific, and found that molecular
composition is dominated by primary metabolites (namely,
sugars, amino acids, organic acids), and secondary
metabolites (namely, labdane diterpenes and polyphenolic
components). It is worth noting that some components
(chiefly apolar) are always present over the seasons,
although in different concentrations, whereas a few others
(predominantly polar) are specific. Statistical analysis
clearly clusters the samples according to the ripeness and
the harvest season, with well-defined metabolic profiles for
each class. It is concluded that NMR-based metabolomics
offers an excellent holistic method to monitor variations
resulting from environmental factors, harvesting time, and
quality control of pharmaceutical herbs and crops.
Acknowledgments We thank Dr. Paola Fortini for careful identi-
fication of J. communis berries.
References
Angioni, A., Barra, A., Russo, M. T., Coroneo, V., Dessi, S., &
Cabras, P. (2003). Chemical composition of the essential oils of
Juniperus from ripe and unripe berries and leaves and their
antimicrobial activity. Journal of Agricultural and Food Chem-
istry, 51, 3073–3078.
Aziz, N., Paiva, N. L., May, G. D., & Dixon, R. A. (2005). Profiling
the transcriptome of alfalfa glandular trichomes. Planta, 221,
28–38.
Bais, H. P., Venkatachalam, L., & Biedrzycki, M. L. (2010).
Stimulation or inhibition: conflicting evidence for (±)-catechin’s
role as a chemical facilitator and disease protecting agent. Plant
Signaling & Behavior, 5, 239–246.
Barjaktarovic, B., Sovili, M., & Knez, Z. (2005). Chemical compo-
sition of Juniperus communis L. fruits supercritical CO2 extracts:
dependence on pressure and extraction time. Journal of
Agricultural and Food Chemistry, 53, 2630–2636.
Bax, A., & Davis, D. G. (1985). MLEV-17-based two-dimensional
homonuclear magnetization transfer spectroscopy. Journal of
Magnetic Resonance, 65, 355–360.
Bolognese, C. P., & McGraw, P. (2000). The isolation and
characterization in yeast of a gene for Arabidopsis S-adenosyl-
methionine: Phosphoethanolamine N-methyltransferase. Plant
Physiology, 124, 1800–1813.
Chaitanya, K. V., Sundar, D., & Reddy, A. R. (2001). Mulberry leaf
metabolism under high temperature stress. Biologia Plantarum,
44, 379–384.
Chao, W. S., Foley, M. E., Horvath, D. P., & Anderson, J. V. (2007).
Signals regulating dormancy in vegetative buds. International
Journal of Plant Development Biology, 1, 49–56.
De Marino, S., et al. (2011). Imbricatolic acid from Juniperus
communis L. prevents cell cycle progression in CaLu-6 cells.
Planta Medica, 77, 1822–1828.
Dewick, P. M. (2009). Medicinal natural products: A biosynthetic
approach (3rd ed.). Chichester: Wiley.
Dixon, R. A., Xie, D.-Y., & Sharma, S. B. (2005). Proanthocyanidins: A
final frontier in flavonoid research? New Phytologist, 165, 9–28.
Eriksson, L., Johansson, E., Kettaneh-Wold, N., Trygg, J., Wikstrom,
C., & Wold, S. (2006). Multi- and megavariate data analysis.
Basic principles and applications (Vol. 1). Umea: Umetrics
Academy.
European Pharmacopoeia. (2008). European directorate for the
quality of medicines & health care (6th ed., Vol. 3, p. 2206).
Strasburg: Council of Europe.
Fang, J. M., Sou, Y. C., Chiu, Y. H., & Cheng, Y. S. (1993).
Diterpenes from the bark of Juniperus chinensis. Phytochemis-
try, 34, 1581–1584.
Ferri, M., Righetti, L., & Tassoni, A. (2011). Increasing sucrose
concentrations promote phenylpropanoid biosynthesis in grape-
vine cell cultures. Journal of Plant Physiology, 168, 189–195.
Filipowicz, N., Kaminski, M., Kurlenda, J., Asztemborska, M., &
Ochocka, J. R. (2003). Antibacterial and antifungal activity of
juniper berry oil and its selected components. Phytotherapy
Research, 17, 227–231.
Griesinger, C., Otting, G., Wuthrich, K., & Ernst, R. R. (1988). Clean
TOCSY for proton spin system identification in macromolecules.
Journal of the American Chemical Society, 110, 7870–7872.
Herrmann, K. M., & Weaver, L. M. (1999). The shikimate pathway.
Annual Review of Plant Physiology and Plant Molecular
Biology, 50, 473–503.
Hwang, T.-L., & Shaka, A. J. (1995). Water suppression that works.
Excitation sculpting using arbitrary waveforms and pulsed field
gradients. Journal of Magnetic Resonance Series A, 112,
275–279.
Innocenti, M., Michelozzi, M., Giaccherini, C., Ieri, F., Vincieri, F.
F., & Mulinacci, N. (2007). Flavonoids and biflavonoids in
Tuscan berries of Juniperus communis L.: detection and
quantitation by HPLC/DAD/ESI/MS. Journal of Agricultural
and Food Chemistry, 55, 6596–6602.
International Trade Centre UNCTAD/WTO (2007). Overview of
world production and marketing of organic wild collected
products. Geneva: Palais des Nations. (http://www.intracen.org).
Accessed 13 Mar 2013.
Jang, J.-C., Leon, P., Zhou, L., & Sheen, J. (1997). Hexokinase as a
sugar sensor in higher plants. Plant Cell, 9, 5–19.
Kalinova, J., & Vrchotova, N. (2009). Level of catechin, myricetin,
quercetin and isoquercitrin in buckwheat (Fagopyrum
Seasonal changes in Juniperus communis L. 173
123

esculentum Moench), changes of their levels during vegetation
and their effect on the growth of selected weeds. Journal of
Agricultural and Food Chemistry, 57, 2719–2725.
Kay, L. E., Keifer, P., & Saarinen, T. (1992). Pure absorption gradient
enhanced heteronuclear single quantum correlation spectroscopy
with improved sensitivity. Journal of the American Chemical
Society, 114, 10663–10665.
Koch, K. (2004). Sucrose metabolism: Regulatory mechanisms and
pivotal roles in sugar sensing and plant development. Current
Opinion in Plant Biology, 7, 235–246.
Leung, A. Y., & Foster, S. (1996). Encyclopedia of common natural
ingredients used in food, drugs and cosmetics (2nd ed.,
pp. 325–327). New York: Wiley Interscience.
Lindon, J. C., et al. (2005). Standard metabolic reporting structures
working group. Summary recommendations for standardization
and reporting of metabolic analyses. Nature Biotechnology, 23,
833–838.
Liu, Y., et al. (2012). Purification and characterization of a novel
galloyltransferase involved in catechin galloylation in the tea
plant [Camellia sinensis]. The Journal of Biological Chemistry,
287, 44406–44417.
Llorach-Asuncion, R., Jauregui, O., Urpi-Sarda, M., & Andres-
Lacueva, C. (2010). Methodological aspects for metabolome
visualization and characterization. A metabolomic evaluation of
the 24 h evolution of human urine after cocoa powder
consumption. Journal of Pharmaceutical and Biomedical Anal-
ysis, 51, 373–381.
Lunn, J. E. (2008). Sucrose metabolism. In Encyclopedia of life
sciences (ELS). Chichester: Wiley Ltd. doi: 10.1002/978047001
5902.a0021259.
Martin, A. M., Queiroz, E. F., Marston, A., & Hostettmann, K.
(2006). Labdane diterpenes from Juniperus communis L. berries.
Phytochemical Analysis, 17, 32–35.
Miceli, N., et al. (2009). Comparative analysis of flavonoid profile,
antioxidant and antimicrobial activity of the berries of Juniperus
communis L. var. communis and Juniperus communis L. var.
saxatilis Pall. from Turkey. Journal of Agricultural and Food
Chemistry, 57, 6570–6577.
Moore, T. S. (1990). Biosynthesis of phosphatidylinositol. In D.
J. Morre, W. F. Boss, & F. A. Loewus (Eds.), Inositol metabolism
in plants (Vol. 9, pp. 107–112). New York: Wiley-Liss Inc.
Mugnaini, S., Nepi, M., Guarnieri, M., Piotto, B., & Pacini, E. (2007).
Pollination drop in Juniperus communis: Response to deposited
material. Annals of Botany, 100, 1475–1481.
Nakanishi, T., et al. (2005). A monoterpene glucoside and three
megastigmane glycosides from Juniperus communis var. de-
pressa. Chemical & Pharmaceutical Bulletin, 53, 783–787.
Palmer, A. G, I. I. I., Cavanagh, J., Wright, P. E., & Rance, M. (1991).
Sensitivity improvement in proton-detected two-dimensional
heteronuclear correlation NMR spectroscopy. Journal of Mag-
netic Resonance, 93, 151–170.
Peer, W. A., & Murphy, A. S. (2006). Flavonoids as signal molecules:
Targets of flavonoid action. In E. Grotewold (Ed.), The science
of flavonoids (pp. 239–268). New York: Springer Science.
Rolland, F., Baena-Gonzalez, E., & Sheen, J. (2006). Sugar sensing
and signaling in plants: conserved and novel mechanisms.
Annual Review of Plant Biology, 57, 675–709.
Sakamoto, A., & Murata, N. (2000). Genetic engineering of
glycinebetaine synthesis in plants: current status and implication
for enhancement of stress tolerance. Journal of Experimental
Botany, 51, 81–88.
San Feliciano, A., Caballero, E., Del Rey, B., & Sancho, I. (1991).
Diterpene acids from Juniperus communis subsp. hemisphaerica.
Phytochemistry, 30, 3134–3136.
Sanchez de Medina, F., Gamez, M. J., Jimenez, I., Jimenez, J., Osuna,
J. I., & Zarzuelo, A. (1994). Hypoglycemic activity of juniper
‘‘berries’’. Planta Medica, 60, 197–200.
Schleucher, J., et al. (1994). A general enhancement scheme in
heteronuclear multidimensional NMR employing pulsed field
gradients. Journal of Biomolecular NMR, 4, 301–306.
Simoes, K., et al. (2008). Phytotoxic catechin leached by seeds of the
tropical weed Sesbania virgata. Journal of Chemical Ecology,
34, 681–687.
Solfanelli, C., Poggi, A., Loreti, E., Alpi, A., & Perata, P. (2006).
Sucrose-specific induction of the anthocyanin biosynthetic
pathway in Arabidopsis. Plant Physiology, 140, 637–646.
Stanic, G., Samarzija, I., & Blazevic, N. (1998). Time-dependent
diuretic response in rats treated with juniper berry preparations.
Phytotherapy Research, 12, 494–497.
Taiz, L. (1992). The plant vacuole. Journal of Experimental Biology,
172, 113–122.
Vichi, S., Riu-Aumatell, M., Mora-Pons, M., Buxaderas, S., & Lopez-
Tamames, E. (2005). Characterization of volatiles in different
dry gins. Journal of Agricultural and Food Chemistry, 53,
10154–10160.
Vu, J. C. V., Gesch, R. W., Pennanen, A. H., Allen, L. H. J., Boote, K. J.,
& Bowes, G. (2001). Soybean photosynthesis, rubisco and
carbohydrate enzymes function at supra-optimal temperatures in
elevated CO2. Journal of Plant Physiology, 158, 295–307.
Weaver, L. M., & Herrmann, K. M. (1997). Dynamics of the shikimate
pathway in plants. Trends in Plant Science, 2, 346–351.
Westerhuis, J. A., et al. (2008). Assessment of PLSDA cross
validation. Metabolomics, 4, 81–89.
Wink, M. (1993). The plant vacuole: a multifunctional compartment.
Journal of Experimental Botany, 44(supplement), 231–246.
Zhang, H., et al. (2007). Rhizobacterial volatile emissions regulate
auxin homeostasis and cell expansion in Arabidopsis. Planta,
226, 839–851.
174 A. Falasca et al.
123
Copyright © 2022 FDOKUMEN