A non-targeted metabolomics approach to evaluate the effects of biomass growth and
38
Metabolomics A non-targeted metabolomics approach to evaluate the effects of biomass growth and chitosan elicitation on primary and secondary metabolism of Hypericum perforatum in vitro roots --Manuscript Draft-- Manuscript Number: MEBO-D-14-00002 Full Title: A non-targeted metabolomics approach to evaluate the effects of biomass growth and chitosan elicitation on primary and secondary metabolism of Hypericum perforatum in vitro roots Article Type: Original Article Keywords: Hypericum perforatum in vitro roots; metabolic profiling; metabolomics; ASCA modelling; NMR spectroscopy Corresponding Author: Alfredo Miccheli, M.D., Ph. D. Sapienza University of Rome Roma, ITALY Corresponding Author Secondary Information: Corresponding Author's Institution: Sapienza University of Rome Corresponding Author's Secondary Institution: First Author: Elisa Brasili, Ph. D. First Author Secondary Information: Order of Authors: Elisa Brasili, Ph. D. Giulia Praticò, Ph. D. Federico Marini, Ph. D. Alessio Valletta, Ph. D. Giorgio Capuani, Ph. D. Fabio Sciubba, Ph. D. Alfredo Miccheli, M.D., Ph. D. Gabriella Pasqua, Ph. D. Order of Authors Secondary Information: Abstract: Hypericum perforatum L. is a medicinal plant commonly used worldwide for the treatment of mild and moderate depression due to its wide range of bioactive compounds. H. perforatum regenerated roots have been proposed as an efficacious in vitro system to biosynthesize pharmaceutically useful secondary metabolites. Up to now the effects of the increase of biomass density and/or chitosan elicitation in addressing the metabolism of H. perforatum regenerated roots towards specific metabolic pathways have not yet been studied in depth. A metabolomic platform, which integrates a NMR-based metabolic profiling and ANOVA-simultaneous component analysis, has been applied in order to characterize the changes of the primary and secondary metabolism of H. perforatum regenerated roots during cultivation in a confined growth environment and in response to chitosan elicitation. NMR -based metabolomics allowed the primary and secondary metabolism of H. perforatum regenerated roots to be characterized and the effects due to the increasing biomass density or to the elicitation process to be determined. The most significant metabolic variations involved levels of amino acids, carbohydrates, phenylpropanoids, lipids, and isoprenoids. With the biomass growth, the levels of tryptophan, fructose, shikimic acid, and epicatechin increased, whereas γ-aminobutyric acid and histidine decreased. In response to chitosan elicitation, valine, isoleucine, glutamine, γ- Powered by Editorial Manager® and ProduXion Manager® from Aries Systems Corporation
-
Upload
independent -
Category
Documents
-
view
4 -
download
0
Transcript of A non-targeted metabolomics approach to evaluate the effects of biomass growth and

Metabolomics
A non-targeted metabolomics approach to evaluate the effects of biomass growth andchitosan elicitation on primary and secondary metabolism of Hypericum perforatum in
vitro roots--Manuscript Draft--
Manuscript Number: MEBO-D-14-00002
Full Title: A non-targeted metabolomics approach to evaluate the effects of biomass growth andchitosan elicitation on primary and secondary metabolism of Hypericum perforatum invitro roots
Article Type: Original Article
Keywords: Hypericum perforatum in vitro roots; metabolic profiling; metabolomics; ASCAmodelling; NMR spectroscopy
Corresponding Author: Alfredo Miccheli, M.D., Ph. D.Sapienza University of RomeRoma, ITALY
Corresponding Author SecondaryInformation:
Corresponding Author's Institution: Sapienza University of Rome
Corresponding Author's SecondaryInstitution:
First Author: Elisa Brasili, Ph. D.
First Author Secondary Information:
Order of Authors: Elisa Brasili, Ph. D.
Giulia Praticò, Ph. D.
Federico Marini, Ph. D.
Alessio Valletta, Ph. D.
Giorgio Capuani, Ph. D.
Fabio Sciubba, Ph. D.
Alfredo Miccheli, M.D., Ph. D.
Gabriella Pasqua, Ph. D.
Order of Authors Secondary Information:
Abstract: Hypericum perforatum L. is a medicinal plant commonly used worldwide for thetreatment of mild and moderate depression due to its wide range of bioactivecompounds. H. perforatum regenerated roots have been proposed as an efficacious invitro system to biosynthesize pharmaceutically useful secondary metabolites. Up tonow the effects of the increase of biomass density and/or chitosan elicitation inaddressing the metabolism of H. perforatum regenerated roots towards specificmetabolic pathways have not yet been studied in depth. A metabolomic platform, whichintegrates a NMR-based metabolic profiling and ANOVA-simultaneous componentanalysis, has been applied in order to characterize the changes of the primary andsecondary metabolism of H. perforatum regenerated roots during cultivation in aconfined growth environment and in response to chitosan elicitation.NMR -based metabolomics allowed the primary and secondary metabolism of H.perforatum regenerated roots to be characterized and the effects due to the increasingbiomass density or to the elicitation process to be determined. The most significantmetabolic variations involved levels of amino acids, carbohydrates, phenylpropanoids,lipids, and isoprenoids. With the biomass growth, the levels of tryptophan, fructose,shikimic acid, and epicatechin increased, whereas γ-aminobutyric acid and histidinedecreased. In response to chitosan elicitation, valine, isoleucine, glutamine, γ-
Powered by Editorial Manager® and ProduXion Manager® from Aries Systems Corporation

aminobutyric acid, fructose, sucrose, poly-unsaturated fatty acids, epicatechin,xanthones, dimethylallyl-pyrophosphate, and stigmasterol increased, while histidinedecreased.The metabolic profiling of regenerated roots shows how the cultures respond todifferent stress conditions, providing useful information for designing optimalbioprocesses to produce mixture of secondary metabolites having potentially differentbioactivities.
Powered by Editorial Manager® and ProduXion Manager® from Aries Systems Corporation

1
A non-targeted metabolomics approach to evaluate the effects of biomass growth and chitosan
elicitation on primary and secondary metabolism of Hypericum perforatum in vitro roots
Elisa Brasili1, Giulia Praticò
2, Federico Marini
2, Alessio Valletta
1, Giorgio Capuani
2, Fabio
Sciubba2 , Alfredo Miccheli
2*, Gabriella Pasqua
1
1 Department of Environmental Biology, “Sapienza” University of Rome, P. le Aldo Moro 5, 00185
Rome, Italy
2 Department of Chemistry, “Sapienza” University of Rome, P.le Aldo Moro 5, 00185 Rome, Italy
* Corresponding author: Alfredo Miccheli, Department of Chemistry, “Sapienza” University of
Rome, P. le Aldo Moro 5, 00185 Rome, Italy; PH: +39 (06) 495-8251
FAX: +39 (06) 490-631; E-mail: [email protected]
ManuscriptClick here to download Manuscript: Miccheli manuscript.doc Click here to view linked References
1 2 3 4 5 6 7 8 9 10 11 12 13 14 15 16 17 18 19 20 21 22 23 24 25 26 27 28 29 30 31 32 33 34 35 36 37 38 39 40 41 42 43 44 45 46 47 48 49 50 51 52 53 54 55 56 57 58 59 60 61 62 63 64 65

2
Abstract
Hypericum perforatum L. is a medicinal plant commonly used worldwide for the treatment of
mild and moderate depression due to its wide range of bioactive compounds. H. perforatum
regenerated roots have been proposed as an efficacious in vitro system to biosynthesize
pharmaceutically useful secondary metabolites. Up to now the effects of the increase of
biomass density and/or chitosan elicitation in addressing the metabolism of H. perforatum
regenerated roots towards specific metabolic pathways have not yet been studied in depth. A
metabolomic platform, which integrates a NMR-based metabolic profiling and ANOVA-
simultaneous component analysis, has been applied in order to characterize the changes of the
primary and secondary metabolism of H. perforatum regenerated roots during cultivation in a
confined growth environment and in response to chitosan elicitation.
NMR –based metabolomics allowed the primary and secondary metabolism of H. perforatum
regenerated roots to be characterized and the effects due to the increasing biomass density or
to the elicitation process to be determined. The most significant metabolic variations involved
levels of amino acids, carbohydrates, phenylpropanoids, lipids, and isoprenoids. With the
biomass growth, the levels of tryptophan, fructose, shikimic acid, and epicatechin increased,
whereas γ-aminobutyric acid and histidine decreased. In response to chitosan elicitation,
valine, isoleucine, glutamine, γ-aminobutyric acid, fructose, sucrose, poly-unsaturated fatty
acids, epicatechin, xanthones, dimethylallyl-pyrophosphate, and stigmasterol increased, while
histidine decreased.
The metabolic profiling of regenerated roots shows how the cultures respond to different
stress conditions, providing useful information for designing optimal bioprocesses to produce
mixture of secondary metabolites having potentially different bioactivities.
Keywords
Hypericum perforatum in vitro roots, metabolic profiling, metabolomics, ASCA modelling, NMR
spectroscopy.
1 2 3 4 5 6 7 8 9 10 11 12 13 14 15 16 17 18 19 20 21 22 23 24 25 26 27 28 29 30 31 32 33 34 35 36 37 38 39 40 41 42 43 44 45 46 47 48 49 50 51 52 53 54 55 56 57 58 59 60 61 62 63 64 65
3
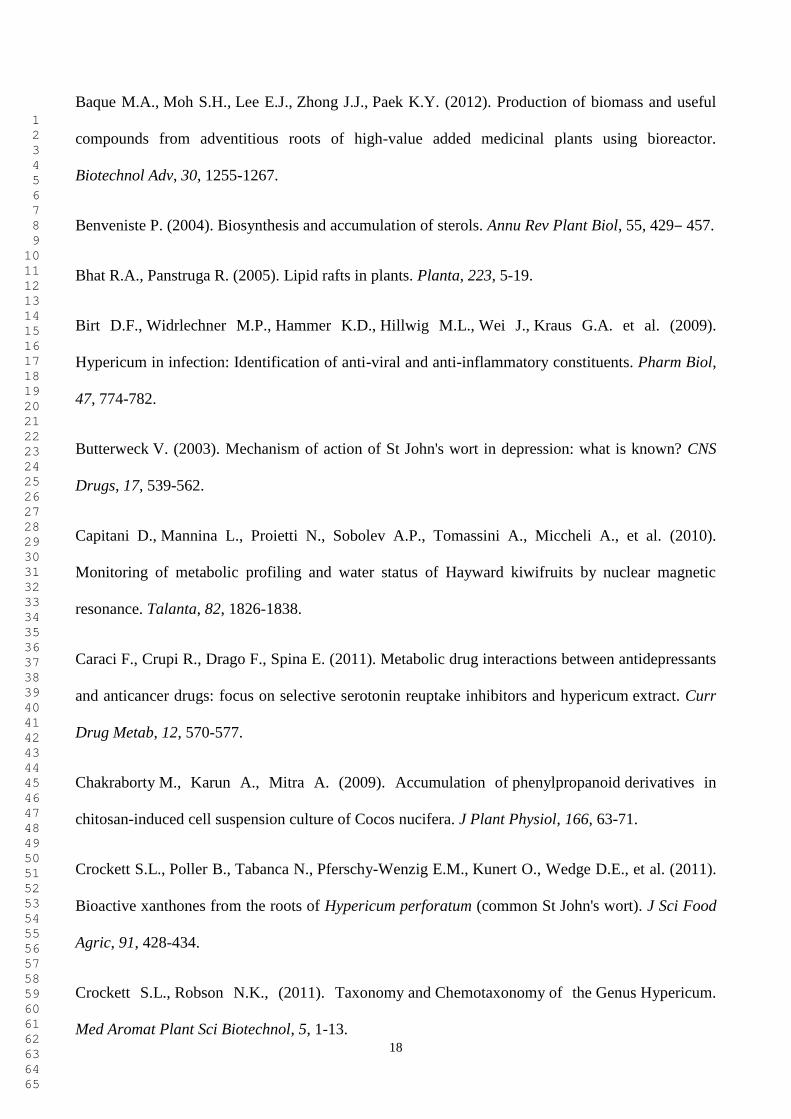
1 Introduction
Hypericum perforatum (common St. John’s wort) is a perennial herb which is distributed globally
(except Antarctica) (Nürk et al. 2013) and is commonly used worldwide for the treatment of mild
and moderate depression (Butterweck 2003; Crockett and Robson 2011; Nahrstedt and Butterweck
2010). Research on St. John’s wort has been focused primarily on hypericins and hyperforins as the
major constituents of the aerial parts of the plant and responsible for the antidepressant activity
(Walker et al. 2005). H. perforatum plant extracts also show a broad range of other pharmacological
activities, including anti-cancer, anti-inflammatory, antiviral, antioxidant, and antibacterial
properties (Birt et al. 2009; Saddiqe et al. 2010; Caraci et al. 2011) that may be correlated to other
bioactive compounds.
Although much is known about the medicinal properties of the aerial parts, little is known about the
chemical composition or the potential applications of the H. perforatum root extracts (Tocci et al.
2013; Crockett et al. 2011). Roots of many species have been studied because of the presence of
high value bioactive molecules (Baque et al. 2012; Paek et al. 2009) but the composition of
products obtained from wild-grown plants can be greatly affected by several environmental biotic
and abiotic factors and the content of bioactive secondary metabolites can be variable and not
always satisfactory for application purposes. Since the production of biomass and metabolites is
significantly affected by various parameters that need to be optimized, plant cell, tissue and organ
cultures are considered effective systems to produce natural products for bioprocessing applications
(Rao et al. 2002; Pasqua et al. 2003; Ferrari et al. 2005; Zhang et al. 2013). It has been
demonstrated that H. perforatum root cultures, because of their high rate of proliferation and high
genetic and metabolic stability, are an efficacious alternative system for controlling the factors that
affect metabolic pathways and for biosynthesizing phytochemical compounds (Cui et al. 2010,
2011; Zobayed et al. 2004).
Chitosan is frequently used as an elicitor to stimulate the production of pharmaceutically useful
compounds both in in planta and in in vitro systems (Yin et al. 2012). Chitosan elicitation has been
1 2 3 4 5 6 7 8 9 10 11 12 13 14 15 16 17 18 19 20 21 22 23 24 25 26 27 28 29 30 31 32 33 34 35 36 37 38 39 40 41 42 43 44 45 46 47 48 49 50 51 52 53 54 55 56 57 58 59 60 61 62 63 64 65

4
also adopted as an effective strategy to enhance secondary metabolite production, such as xanthones
and other polyphenols, in H. perforatum in vitro roots (Tocci et al. 2012, 2013) but up to date how
the chitosan affects the root metabolome has not been studied.
Metabolomic analysis is a powerful tool by which to gain a comprehensive view of how metabolic
networks are regulated and has indeed been applied in many researches in recent years (Nicholson
et al. 1999).
An analytical technique employed to study the metabolome and to obtain a large quantity of data is
nuclear magnetic resonance (NMR) spectroscopy. In non-targeted metabolomic analysis, NMR
spectroscopy has afforded some important advantages that can be summarized as ease of
quantification, reproducibility, straightforward metabolite identification and its ability to determine
unexpected metabolites (Kim et al. 2011). NMR based metabolomic has been applied in quality
controls for medicinal plants (Rasmussen et al. 2006; Agnolet et al. 2010; Yang et al. 2006; Falasca
et al. 2013), in chemotaxonomy studies (Kim et al. 2010; Matsuda et al. 2010), in the study of the
biological activity of plant preparations (Modarai et al. 2010) of plant interactions with other
organisms (Jahangir et al. 2008) of the fruit ripening process (Capitani et al. 2010) and of
genetically transformed plants (Manetti et al. 2006). Finally, NMR-based metabolomic analysis has
been applied to investigate the interplay between primary and secondary metabolism in Opium
poppy cells treated with a fungal elicitor (Zulak et al. 2008). Recently, NMR fingerprinting was
used to investigate the natural product diversity within the genus Hypericum and its correlation to
bioactivity, exemplified by cytotoxic properties (Porzel et al. 2013).
Applying multivariate analysis to NMR spectroscopy data it is possible to obtain comprehensive
information about the biochemical constituents of a biological system and to achieve the
quantitative assessment of time-related multiparametric metabolic responses to patho-physiological
stimuli (Nicholson et al. 1999; Lindon et al. 2001).
The aim of the present study was to characterize the changes in the primary and secondary
metabolism of in vitro regenerated roots of H. perforatum subsp. angustifolium during growth in a
1 2 3 4 5 6 7 8 9 10 11 12 13 14 15 16 17 18 19 20 21 22 23 24 25 26 27 28 29 30 31 32 33 34 35 36 37 38 39 40 41 42 43 44 45 46 47 48 49 50 51 52 53 54 55 56 57 58 59 60 61 62 63 64 65
COMPUTER
Evidenziato
eliminare ref. 1
COMPUTER
Evidenziato
eliminare ref. 1

5
confined culture environment and in response to chitosan elicitation in order to obtain baseline
information to be used in the design of optimal bioprocesses employing this biotechnological
system.
A metabolomic platform integrating non-targeted NMR-based metabolic profiling and multivariate
analysis such as ANOVA-simultaneous component analysis (ASCA) was used.
2 Materials and Methods
2.1 Plant material and organ culture
In vitro regenerated roots of H. perforatum were obtained according to the procedures described by
Tocci et al. (2011).
Liquid cultures were established after 30 days by inoculating 1 g fresh weight (FW) of roots in
magenta vessels containing 80 ml liquid MS medium supplemented with glucose (2.2 g l-1
) and IBA
(1 mg l-1
). The magenta vessels were shaken at 100 rpm at 25±1°C and maintained in the
continuous darkness. Since optimum nutrient concentration is a critical point in controlling growth
of regenerated roots and accumulation of secondary metabolites (Lian et al. 2002), the medium was
renewed every 4 days, the time necessary for biomass duplication. The roots were elicited using
chitosan (medium molecular weight; Sigma-Aldrich, Milan, Italy) dissolved in water acidified with
HCl (1M) up to a final concentration of 200 mg l−1
which was added on the twelfth day of culture
using a 0.22 µm sterile filter (Tocci et al. 2011). An appropriate amount of water was added to the
control samples. The growth curve of root biomass was recorded during a period of 15 days from
inoculum. Regenerated roots were harvested at day twelve (time 0), day thirteen (24h, time 1) and
day fifteen (72h, time 2) and divided into five groups: basal (time 0), control and treated to 24 hours
after elicitation (time 1) and control and treated to 72 hours after elicitation (time 2).
2.2 NMR Sample preparation
1 2 3 4 5 6 7 8 9 10 11 12 13 14 15 16 17 18 19 20 21 22 23 24 25 26 27 28 29 30 31 32 33 34 35 36 37 38 39 40 41 42 43 44 45 46 47 48 49 50 51 52 53 54 55 56 57 58 59 60 61 62 63 64 65

6
The metabolic quenching of the roots was performed by rapidly freezing in liquid N2. The frozen
biomass (1.5 g) was ground up in a steel pestle in liquid N2 and extracted by a solvent mixture of
methanol, chloroform and distilled water at 2:2:1.2 (v/v ratio), according to the modified Bligh-
Dyer procedure for plant samples (Miccheli et al. 1988; Manetti et al. 2004). 4.5 ml CH3 OH:CHCl3
(2:1 v/v ratio) mixture was added to the frozen powder and after mixing 1.5 ml CHCl3 and 1.8 ml
H2O were added. The samples were mixed by vortex for 1 min and allowed to stand overnight at
4°C then centrifuged for 30 min at 11,000 × g at 4°C. The resulting upper hydro-alcoholic and
lower organic phases were then carefully separated and dried under N2 flow. The dried phases were
stored at -80°C until the NMR analysis.
2.3 NMR spectroscopy
The dried residue of the hydro-alcoholic phase was dissolved in 0.6 ml CD3OD/D2O (1:2 v/v ratio)
containing 3-(trimethylsilyl)- propionic-2,2,3,3,-d4 acid sodium salt (TSP, 2mM) as internal
standard (chemical shift reference). The dried residue of the chloroformic phase was dissolved in
0.6 ml CDCl3, (Cambridge Isotope Laboratories, Inc.), (99.8%) containing 1,1,3,3,5,5-hexamethyl-
cyclo-tri-siloxane (HMS) (Sigma-Aldrich, Usa) as internal standard (2mM). NMR spectra were
obtained using a Bruker Avance 400 spectrometer operating at a frequency of 400.13 MHz for the
proton. Monodimensional proton spectra were acquired at a temperature of 298 K with a spectral
width of 15 ppm, 64k data points, 128 scans with an acquisition time of 5.45 s and a relaxation
delay of 5.05 s for a total repetition time of 10.5 s complying with the full relaxation condition after
a 90 degree pulse.
The univocal assignation of proton resonances was achieved by means of bidimensional 1H
homonuclear Total Correlation Spectrosopy (TOCSY) experiments and by bidimensional 1H-
13C
Heteronuclear Single Quantum Coherence (HSQC) experiments.
Homonuclear experiments were recorded at 298 K with a spectral width of 15 ppm in both
dimensions employing a matrix of 2k x 512 data points, a repetition time of 2 s and 64 scans. The
1 2 3 4 5 6 7 8 9 10 11 12 13 14 15 16 17 18 19 20 21 22 23 24 25 26 27 28 29 30 31 32 33 34 35 36 37 38 39 40 41 42 43 44 45 46 47 48 49 50 51 52 53 54 55 56 57 58 59 60 61 62 63 64 65

7
mixing time for the 1H–
1H TOCSY was 110ms. HSQC experiments were acquired with a spectral
width of 15 ppm in proton dimension and 220 ppm in the carbon one, employing a matrix of 2k x
256 data points for the proton and the carbon dimensions, respectively, a repetition delay of 2 s and
128 scans. The water signal was suppressed using solvent pre-saturation, with the irradiation time
following the relaxation delay. In order to minimize the variability of signal intensity due to water
suppression, a careful calibration of the soft pulse for water suppression was always performed.
1D-NMR spectra were processed using 1D-NMR Manager ver. 12.0 software (Advanced Chemistry
Development, Inc., Toronto, Ontario, Canada), whereas 2D-NMR spectra were processed using
Bruker Top Spin (Bruker, Karlsruhe, Germany).
2.4 Multivariate analysis
Multivariate data analysis was carried out using in house-written functions operating under Matlab
R2012b environment (The MathWorks, Inc., Natick, MA, USA). Spectral data were mean-centered
and scaled before analysis. Principal components analysis (PCA) was used to investigate inherent
clustering and to identify outliers. In order to assess whether treatment and/or time (corresponding
to biomass density) had an effect on the metabolic profiles, as determined by NMR spectroscopy,
ANOVA-simultaneous component analysis (ASCA) (Smilde et al. 2005; Jansen et al. 2005) was
used. ASCA can be considered as an extension of the analysis of variance (ANOVA) to multivariate
data and is particularly useful when the significance of the effect of one or more factors on the
experimental data can be evaluated (Vis et al. 2007). ASCA operates by partitioning the variation of
the experimental data, collected by NMR spectra, of different samples into the contributions
induced by the effect of controlled factors, usually a treatment or an experimental condition, or of
their interactions, and by analyzing the resulting matrices by Simultaneous Component Analysis
(SCA), a method similar to PCA (Kiers et al. 1994). Accordingly, the mean-centered matrix Xc of
the experimental data is partitioned into the individual matrices accounting for the effects of time,
1 2 3 4 5 6 7 8 9 10 11 12 13 14 15 16 17 18 19 20 21 22 23 24 25 26 27 28 29 30 31 32 33 34 35 36 37 38 39 40 41 42 43 44 45 46 47 48 49 50 51 52 53 54 55 56 57 58 59 60 61 62 63 64 65

8
treatment, time-treatment interaction, and for the residual variation (associated to the experimental
error):
Xc = X−X mean = X treatment+ X time + X time×treatment + X residual (1)
where Xmean is a matrix the rows of which are all identical to the overall mean profile.
In order to obtain a balanced design, only the data collected at time 24 h and 72 h were considered
for analysis, which was then carried out on a data matrix comprising 20 observations, i.e. 5
replicates for each of the 4 time/treatment combinations (control 24 h; control 72 h; treated 24 h;
treated 72 h).
Operationally the computation of each of the matrices corresponding to the main effects was carried
out as follows. For each of the factors considered, the rows of the centred matrix Xc corresponding
to the different levels of the design were found and averaged, and these calculated mean values
were used to build the matrix associated with the effect: if the ith
sample corresponds to the 1st level
of factor A, the ith
row of the matrix XA will contain the average vector calculated on all samples for
which factor A is at level 1, and so on. Computation of the interaction matrix is carried out
similarly, after deflation (=subtraction) of the matrices corresponding to the main effects (Figure
S1).
Simultaneous component analysis is then performed on the individual matrices to model the
variability corresponding to each effect. From a purely mathematical standpoint, SCA is identical to
PCA: the difference is only philosophical in nature. Indeed, in SCA different samples are modelled
at the same time. Accordingly, each of the matrices resulting from the ANOVA partitioning is
decomposed as:
i
T
iii EPTX (2)
where Ti and Pi are the scores and loadings for the ith
partition, respectively, and Ei is the
corresponding residual matrix.
It must be stressed that for mean centred two level balanced design like the one in this study, all the
partitions corresponding to main effects and interactions are rank one, resulting in zero errors.
1 2 3 4 5 6 7 8 9 10 11 12 13 14 15 16 17 18 19 20 21 22 23 24 25 26 27 28 29 30 31 32 33 34 35 36 37 38 39 40 41 42 43 44 45 46 47 48 49 50 51 52 53 54 55 56 57 58 59 60 61 62 63 64 65

9
As previously described, ASCA partitions the variation of the original matrix into the contribution
of the main effects of the controlled factors, of their interactions and residuals. The extent of each
contribution is expressed in the form of the sum of squares of the elements of the matrix
corresponding to the effect:
2i j
k
ijkk xSSQ X (3)
where xkij is the i
th row, j
th column entry of the matrix Xk. In order to assess whether an effect is
significant or not, the experimental sum of squares has to be compared with the distribution of
values corresponding to the null hypothesis. In this study, for each factor and interaction, the
distribution of the values of the sum of squares corresponding to the null hypothesis (no
significance of the considered effect) was estimated non parametrically by means of a permutation
(randomization) test. The permutation test works by uncoupling the group labels from the data and
randomly reassigning them: it does not change the metabolite value for a sample, but just reassigns
the sample randomly to one of the treatment groups. Partitioning the permuted data according to the
ANOVA scheme and computing the corresponding sum of squares
2,i j
permk
ij
perm
k
perm
k xSSQ X (4)
allows it to be checked whether the results with randomized data are as different from zero as those
obtained from the experimental data. Repeating the randomization procedure for an appropriate
number of times, each time calculating the corresponding sum of squares, provides an empirical
distribution of the SSQk values for the null hypothesis. Validation of the significance of the effect is
then carried out by comparison of the SSQk obtained from the experimental data with this
distribution (Vis et al. 2007).
The total variation of the experimental matrix was then partitioned according to equation 1 and the
significance of the main effects (time and/or elicitation) and of their interaction was evaluated by
permutation test (Vis et al. 2007).
1 2 3 4 5 6 7 8 9 10 11 12 13 14 15 16 17 18 19 20 21 22 23 24 25 26 27 28 29 30 31 32 33 34 35 36 37 38 39 40 41 42 43 44 45 46 47 48 49 50 51 52 53 54 55 56 57 58 59 60 61 62 63 64 65

10
SCA (after Pareto scaling) was used to model the variation in the two corresponding matrices
Xtreatment and Xtime. As only two levels were considered for each factor, single component models
explained 100% of the variance of the individual matrices, i.e. each matrix Xi was decomposed into
the product of one score and one loading vector.
In order to use SCA results for the interpretation of the metabolic effect of the considered factors,
the significance of the contribution of the experimental variables to the definition of the models (i.e.
the significance of the loadings) had to be assessed: if the loading of a variable is statistically
different from zero, then the factor has an effect on the concentration of that metabolite. In
particular, a bootstrap procedure was used to calculate the empirical distribution of the loadings, so
as to be able to check their significance. Operationally, at each bootstrap cycle, a new partition Xibstp
was constructed from the mean centered matrix by including, for each level, a random subset of the
original samples with repetitions, taking care that the numerosity of each treatment group was
preserved. For instance, if the effect considered has two levels and, in the original matrix, samples
1-10 correspond to level 1 and samples 11-20 correspond to level 2, one bootstrap cycle could
produce a matrix made up of samples [1 2 2 2 5 5 6 7 9 10 12 13 13 14 16 16 16 18 19 19]. ASCA
analysis on this matrix will result in an estimate of the loading vector for the effect so that repetition
of the procedure for a significant number of times (in our study 100000) will produce an empirical
distribution of the values of the loadings for each variable. A metabolite is then considered to
contribute significantly to the model if, based on this distribution, its loading is statistically different
from zero.
3 Results and Discussion
3.1 Effects of biomass growth on primary and secondary metabolism
The growth curve of both elicited and non-elicited H. perforatum in vitro roots is shown in Figure
1. In elicited roots, the chitosan addition at day 12 caused a sudden slowdown of growth, whereas
the growth of the control roots continued. The inhibitory effect of chitosan on biomass growth in
1 2 3 4 5 6 7 8 9 10 11 12 13 14 15 16 17 18 19 20 21 22 23 24 25 26 27 28 29 30 31 32 33 34 35 36 37 38 39 40 41 42 43 44 45 46 47 48 49 50 51 52 53 54 55 56 57 58 59 60 61 62 63 64 65

11
root cultures has been also reported for other species such as Ocimum basilicum L. (Bais et al.
2002) and Withania sominifera (L.) Dunal (Sivanandhan et al. 2012).
The hydroalcoholic and chloroformic total extracts obtained from chitosan-elicited and
control roots were investigated by 1H-NMR spectroscopy and sixty-four metabolites were assigned
(Table S1). The concentrations of forty-seven metabolites measured at basal time, 24 and 72 h both
in the control and the chitosan-elicited roots are reported in Figures S2-S5.
Several changes of primary and secondary metabolites, including levels of amino acids,
carbohydrates, small organic acids, lipids, phenolics, isoprenoids, and other compounds related to
plant metabolism were observed. An initial exploration of the whole data set was performed by
Principal Component Analysis (PCA) on the concentration of metabolites, measured at basal time
(day 0), 24 and 72 h after elicitation. The PCA score plot shows that root samples were clustered
on the basis of PC1 and PC2 scores corresponding to chitosan elicitation and to biomass growth-
related changes, respectively (Figure 2). However, the PC2 scores did not allow a separation
between basal and 24 h root samples.
ASCA modelling was applied in order to determine the metabolic variations related to root biomass
growth and to chitosan treatment, and to the interaction between them. A balanced experimental
design was constructed considering only the data at time 24 h and 72 h, excluding the basal
samples.
ASCA modelling showed that chitosan treatment and biomass increase respectively accounted for
24.1% and 23.5% of the variation in the original mean-centred matrix, while their interaction
explained 3.7% of the variance. The randomization test with 100,000 permutations showed that
only the effects of chitosan treatment and biomass increase were significant with p-values 0.0048
and 0.0053, respectively, while the effect of their interaction was not statistically different from
zero (p=0.2493) (Figure 3).
Having verified that elicitation and biomass increase had a significant effect on the metabolic
profiles of H. perforatum roots, simultaneous component analysis (SCA) was used (after Pareto
1 2 3 4 5 6 7 8 9 10 11 12 13 14 15 16 17 18 19 20 21 22 23 24 25 26 27 28 29 30 31 32 33 34 35 36 37 38 39 40 41 42 43 44 45 46 47 48 49 50 51 52 53 54 55 56 57 58 59 60 61 62 63 64 65

12
scaling) to model the variation in the two corresponding matrices Xelicitation and Xtime. The
distribution of the loadings for the SCA models of the two main effects is reported in Figure 3.
The results of ASCA modelling, associated with the root growth curve data, enable the “time
effect” to be defined as the effect of the increase of biomass density in a confined environment.
Control roots showed an increase in flavonoid levels, such as epicatechin and other phenolics, such
as shikimic acid, associated with an increase in biomass density and with a decrease in growth ratio.
The relationship between biomass density, the slowdown in biomass growth and phenol
biosynthesis was also observed by Cui et al. (2010) in H. perforatum roots cultured in a bioreactor.
In the control roots a significant correlation between tryptophan (Trp) and epicatechin increased
levels (r = 0.78, Pearson's correlation) was observed and this result pointed to a stimulation of the
phenylpropanoid pathway caused by a higher root biomass density in a confined environment.
Regarding the metabolism of aminoacids, opposite trends were observed in γ-aminobutyric acid
(GABA), histidine, and glutamine. In particular, a decrease in GABA and histidine and an increase
in glutamine occurred with increasing culture time. Moreover, a slight increase in fructose and no
significant changes in sucrose levels were observed. It is a known fact that the slower growing
plants invest more of their total root metabolites in carbon- and nitrogen-storage compounds
(Atkinson et al. 2012). In our results the significant increase in glutamine, which plays a role in
nitrogen storage, could be explained by a slowdown in the growth rate.
In control roots, fructose levels correlated significantly with shikimate (r = 0.89) and with xanthones
(r = 0.72), but correlated inversely with histidine (r
= -0.77). This correlation pattern seems to
illustrate the biochemical relationship between the synthesis of fructose, through transaldolase or
transketolase, and histidine synthesis, starting from other intermediates in the pentose phosphate
pathway. A competition between metabolic fluxes involving pentose phosphate pathway
intermediates towards fructose/erythrose-4-phosphate (via transketolase and transaldolase
reactions), channelled through the biosynthesis of shikimate and phenylpropanoid metabolites and
1 2 3 4 5 6 7 8 9 10 11 12 13 14 15 16 17 18 19 20 21 22 23 24 25 26 27 28 29 30 31 32 33 34 35 36 37 38 39 40 41 42 43 44 45 46 47 48 49 50 51 52 53 54 55 56 57 58 59 60 61 62 63 64 65

13
histidine biosynthesis (via oxidative penthose phosphate pathway and isomerase reactions), could
be hypothesized.
The increase in glutamine levels associated with a decrease in GABA levels (r = -0.72) is of
interest. GABA is a ubiquitous non-protein amino acid that in plants has been linked to stress,
signalling and storage (Fait et al. 2008). It has long been known that GABA is derived from
glutamate, through glutamate decarboxylase (GAD) activity, and is then converted to succinic
semialdehyde and succinate, which enters the tricarboxylic acid cycle. GAD activity is confined to
the cytosol, specific for glutamate, and regulated by pH and Ca2+
-calmodulin (Shelp et al. 2012). It
has been reported that this proton-consuming reaction can limit cytosolic acidosis in certain species
during exposure to various stress conditions such as hypoxia (Shelp et al. 2012). The relationship
observed between time-related decrease in GABA and increase in glutamine suggests a metabolic
flux shift from GABA synthesis towards glutamine synthesis which enhances nitrogen storage.
3.2 Effects of chitosan elicitation on primary and secondary metabolism
In the chitosan-treated roots ASCA results (Figure 3) showed a significant increase in sucrose and
fructose but not in glucose levels at 24 h and 72 h after elicitation. A significant increase in
aminoacid levels, such as isoleucine, valine, glutamine, GABA, alanine, were observed together
with a decrease in histidine.
The observed metabolic profile of root extracts is consistent with slowdown or arrested growth,
which causes a metabolic shift towards a storage of carbon and nitrogen compounds, such as
sucrose and aminoacids (Atkinson et al. 2012). However, this metabolic profile reflects also a
process of adaptation to stress conditions induced by chitosan treatment.
Since it is well known that the early defence responses elicited by chitosan include a raising of
cytosolic H+ and Ca
2+ concentrations (Zhao et al. 2005), the observed levels of GABA that are
higher than control roots, in particular at 24 hours after the chitosan treatment, can be related to a
1 2 3 4 5 6 7 8 9 10 11 12 13 14 15 16 17 18 19 20 21 22 23 24 25 26 27 28 29 30 31 32 33 34 35 36 37 38 39 40 41 42 43 44 45 46 47 48 49 50 51 52 53 54 55 56 57 58 59 60 61 62 63 64 65

14
higher GAD activity stimulated by an altered intracellular H+ and Ca
2+ homeostasis (Kinnersley et
al. 2000; Snedden et al. 1995).
An increase in phenylpropanoid-derived secondary metabolites in chitosan-elicited roots was
displayed by the ASCA model. In particular, epicatechin and xanthone levels were two- and eight-
fold higher, respectively, than the corresponding control samples at 72 h after elicitation (Figures
S2-S5). Xanthones and flavonoids are synthesized from phenylalanine through shikimate pathway.
In chitosan-treated roots, the level of shikimate, a key intermediate in the phenylpropanoid pathway,
was lower than in control roots, while benzoyl-moiety levels were ten-fold higher. These results
indicate that both the phenylpropanoid and xanthone pathways were specifically stimulated by
chitosan treatment, which is in agreement with previous results obtained using the same
experimental system by Tocci et al. (2011). A scheme of the above metabolic pathways is reported
in Figure 4.
Chitosan has been extensively studied with regard to its effects on enzymes involved in the
phenylpropanoid pathway (Baque et al. 2012; Chakraborty et al. 2009). Chitosan mimics a fungal
infection, inducing a non-host resistance through PRR-mediated recognition and priming a systemic
acquired immunity (Iriti and Faoro 2009). The observed increase in xanthones supports the
hypothesis proposed by Franklin et al. (Franklin et al. 2009) that these metabolites act as
phytoalexines, playing a role in plant chemical defence against pathogen attack.
Also of interest is the increase in dimethylallyl-pyrophosphate (DMAPP) observed in chitosan
elicited roots of H. perforatum. DMAPP content in treated roots was seven-fold higher at 24 h and
nine-fold higher at 72 h than their respective controls. DMAPP, together with its isomer isopentenyl
pyrophosphate (IPP), is the precursor of the isoprenoid compounds, including molecules such as
sterols, dolichols, triterpenes, ubiquinone, components of macromolecules such as prenyl groups,
and isopentenylated tRNAs (Sacchettini and Poulter 1997; Kuzuyama and Seto 2003). The diversity
of isoprenoids reflects the variety of important biological functions, including electron transport in
respiration and photosynthesis, hormone-based signalling, the regulation of transcriptional and post-
1 2 3 4 5 6 7 8 9 10 11 12 13 14 15 16 17 18 19 20 21 22 23 24 25 26 27 28 29 30 31 32 33 34 35 36 37 38 39 40 41 42 43 44 45 46 47 48 49 50 51 52 53 54 55 56 57 58 59 60 61 62 63 64 65

15
translational processes that control lipid glycoprotein biosynthesis, protein cleavage degradation,
meiosis and apoptosis. The isoprenoids are also important structural components of cell and
organelle membranes (Hunter 2007, 2011). In addition, they can play a crucial role as phytoalexins,
because many of them exert antibiotic, antiviral and fungitoxic or fungistatic activities (Ahuja et al.
2012). An increase in concentration of the isoprenoid phytoalexins in response to fungal elicitors in
the roots has been also observed in Oryza sativa L., in which fungal chitin oligosaccharide
stimulated the roots to biosynthesize and release several diterpenoids into the medium (Toyomasu
et al. 2008).
DMAPP and IPP may be produced through two independent metabolic pathways: the acetate-
mevalonate (MVA) pathway and the non-mevalonate pathway (non-MVA), also called the 1-deoxy-
D-xylulose-5-phosphate (DXP) or the 2-C-methyl-D-erythritol-4-phosphate (MEP) pathway
(Hunter 2007). In plants, the MVA and non-MVA pathways are compartmentalized in the
cytoplasm and plastid, respectively. Sesquiterpenes, sterols, and polyterpenes are derived via the
cytosolic MVA pathway, whereas isoprene, phytol, carotenoids, and the plant hormones gibberellic
and abscisic acid are synthesized via the plastid non-MVA pathway (Hsieh and Goodman 2005)
1H-NMR analysis failed to reveal the presence of terpenoids. However, mono- and sesquiterpenes
were isolated in Hypericum perforatum L. roots by GC-MS (Motavalizadehkakhky 2012).
It is interesting that high stigmasterol levels have been found in chitosan-treated roots. Stigmasterol
is synthesized inside the cytosol through the cytochrome P450 CYP710A1 via C22 desaturation
from β-sitosterol originating from reactions involved in the sterol branch of the isoprenoid pathway
(Benveniste 2004). Despite an increased synthesis of stigmasterol, the results show that β-sitosterol
levels were found to remain constant at 24 h and 72 h after chitosan treatment, indicating that the
chitosan treatment stimulated the de novo synthesis of β-sitosterol and its desaturation through the
sterol biosynthetic pathway.
An increased synthesis of stigmasterol was found in different plant-pathogen interactions. The
conversion of β-sitosterol to stigmasterol in Arabidopsis thaliana leaves was observed 10 and 48 h
1 2 3 4 5 6 7 8 9 10 11 12 13 14 15 16 17 18 19 20 21 22 23 24 25 26 27 28 29 30 31 32 33 34 35 36 37 38 39 40 41 42 43 44 45 46 47 48 49 50 51 52 53 54 55 56 57 58 59 60 61 62 63 64 65

16
after inoculation of virulent and avirulent Pseudomonas syringae strains (Griebel and Zeier 2010).
These authors found that the pathogen-stimulated stigmasterol was triggered by the perception of
pathogen-associated molecular patterns (PAMPs) and the generation of reactive oxygen species
(ROS) (Griebel and Zeier 2010).The role of stigmasterol in plants during stress is still poorly
understood. Sitosterol and stigmasterol, like brassinosteroids, are involved in the regulatory
function of plant development, affecting gene expression involved in cell expansion and division,
vascular tissue differentiation and several developmental programs (Sasse 2003). Several reports
have proposed the existence of sterol-membrane microdomains, so-called lipid rafts, which may
play a role in the recruitment of molecular components involved in plant defence signalling (Bhat
and Panstruga 2005). In particular, it has been suggested that a pathogen-induced change in
stigmasterol/sitosterol ratio can influence different physicochemical properties of membrane micro-
domains and thereby modulate plant defence signalling (Griebel and Zeier 2010).
Moreover, the increase in polyunsaturated fatty acids observed is in agreement with the results
found for A. thaliana leaves treated with P. syringae (Yaeno et al. 2004).
On the basis of the above evidence, the increase in polyunsaturated fatty acids and the increase in
stigmasterol levels, suggest a stimulation of a lipid desaturation process that may have altered the
membrane microdomains, favouring a change in membrane permeability.
4 Concluding Remarks
Non targeted NMR-based metabolic profiling has been used to explore the primary and secondary
metabolism of Hypericum perforatum regenerated roots. Our approach based on multivariate data
analysis, such as ANOVA Simultaneous Component Analysis, has allowed the metabolic effects
due to an increase in biomass density to be separated from those due to chitosan elicitation.
Moreover, the contemporary stimulation of phenyl-propanoid and isoprenoid pathways with an
higher yield of secondary metabolites, such as epicatechin, xanthones and stigmasterols in chitosan-
treated roots, in the considered experimental conditions has been observed.
1 2 3 4 5 6 7 8 9 10 11 12 13 14 15 16 17 18 19 20 21 22 23 24 25 26 27 28 29 30 31 32 33 34 35 36 37 38 39 40 41 42 43 44 45 46 47 48 49 50 51 52 53 54 55 56 57 58 59 60 61 62 63 64 65

17
The approach proposed in the present study can be considered an efficient tool for setting up an H.
perforatum root culture system for large-scale production of specific secondary metabolites useful
for pharmacological applications.
Acknowledgements
The present study has been supported by a research grant of Sapienza University of Rome 2011 -
prot. C26A11XLZ5.
Competing Interests
Elisa Brasili, Giulia Praticò, Federico Marini, Alessio Valletta, Giorgio Capuani, Fabio Sciubba,
Alfredo Miccheli and Gabriella Pasqua declare that they have no conflict of interest.
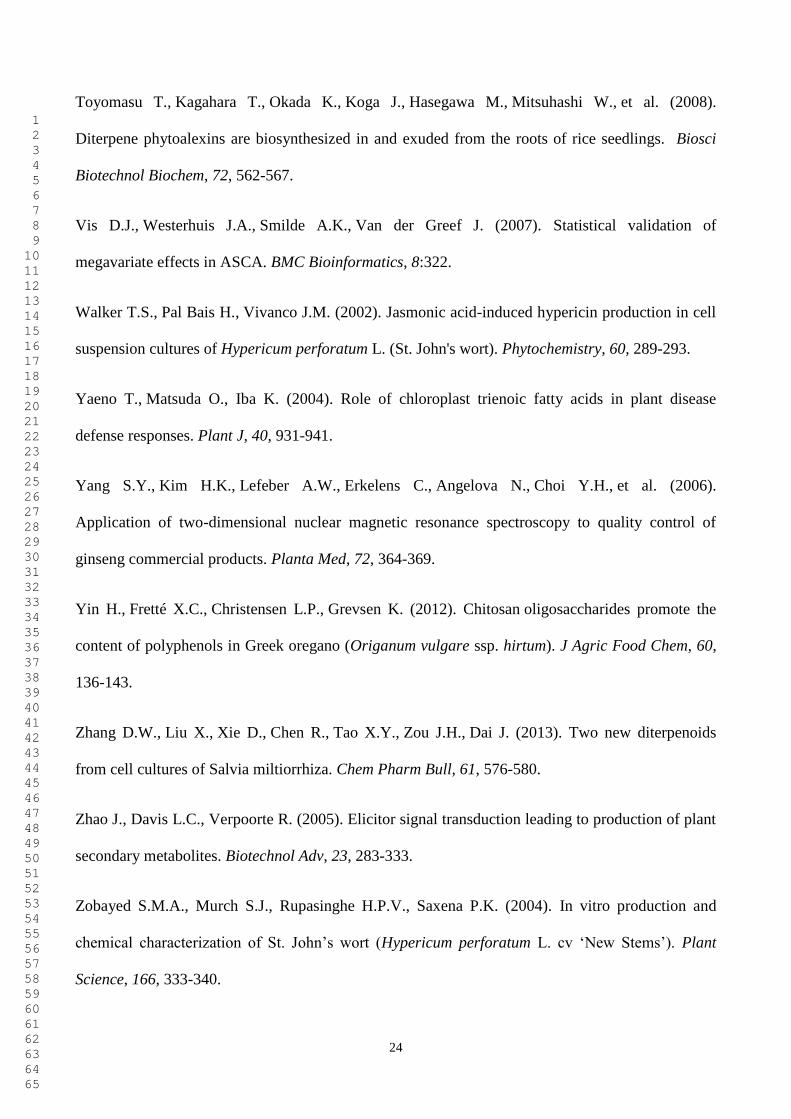
References
Agnolet S., Jaroszewski J.W., Verpoorte R., Staerk D. (2010). 1H-NMR-based metabolomics
combined with HPLC-PDA-MS-SPE-NMR for investigation of standardized Ginkgo biloba
preparations. Metabolomics, 6, 292-302.
Ahuja I., Kissen R., Bones A.M. (2012). Phytoalexins in defense against pathogens. Trends Plant
Sci, 17, 73-90.
Atkinson R.R.L, Burrell M.M., Osborne C.P., Rose K.E., Rees M. (2012). A non-targeted
metabolomics approach to quantifying differences in root storage between fast- and slow-growing
plants. New Phytol, 196, 200-211.
Bais H.P., Walker T.S., Schweizer H.P., Vivanco J.M. (2002). Root specific elicitation and
antimicrobial activity of rosmarinic acid in hairy root cultures of Ocimum basilicum. Plant
Physiology and Biochemistry, 40, 983-995.
1 2 3 4 5 6 7 8 9 10 11 12 13 14 15 16 17 18 19 20 21 22 23 24 25 26 27 28 29 30 31 32 33 34 35 36 37 38 39 40 41 42 43 44 45 46 47 48 49 50 51 52 53 54 55 56 57 58 59 60 61 62 63 64 65
18
Baque M.A., Moh S.H., Lee E.J., Zhong J.J., Paek K.Y. (2012). Production of biomass and useful
compounds from adventitious roots of high-value added medicinal plants using bioreactor.
Biotechnol Adv, 30, 1255-1267.
Benveniste P. (2004). Biosynthesis and accumulation of sterols. Annu Rev Plant Biol, 55, 429‒ 457.
Bhat R.A., Panstruga R. (2005). Lipid rafts in plants. Planta, 223, 5-19.
Birt D.F., Widrlechner M.P., Hammer K.D., Hillwig M.L., Wei J., Kraus G.A. et al. (2009).
Hypericum in infection: Identification of anti-viral and anti-inflammatory constituents. Pharm Biol,
47, 774-782.
Butterweck V. (2003). Mechanism of action of St John's wort in depression: what is known? CNS
Drugs, 17, 539-562.
Capitani D., Mannina L., Proietti N., Sobolev A.P., Tomassini A., Miccheli A., et al. (2010).
Monitoring of metabolic profiling and water status of Hayward kiwifruits by nuclear magnetic
resonance. Talanta, 82, 1826-1838.
Caraci F., Crupi R., Drago F., Spina E. (2011). Metabolic drug interactions between antidepressants
and anticancer drugs: focus on selective serotonin reuptake inhibitors and hypericum extract. Curr
Drug Metab, 12, 570-577.
Chakraborty M., Karun A., Mitra A. (2009). Accumulation of phenylpropanoid derivatives in
chitosan-induced cell suspension culture of Cocos nucifera. J Plant Physiol, 166, 63-71.
Crockett S.L., Poller B., Tabanca N., Pferschy-Wenzig E.M., Kunert O., Wedge D.E., et al. (2011).
Bioactive xanthones from the roots of Hypericum perforatum (common St John's wort). J Sci Food
Agric, 91, 428-434.
Crockett S.L., Robson N.K., (2011). Taxonomy and Chemotaxonomy of the Genus Hypericum.
Med Aromat Plant Sci Biotechnol, 5, 1-13.
1 2 3 4 5 6 7 8 9 10 11 12 13 14 15 16 17 18 19 20 21 22 23 24 25 26 27 28 29 30 31 32 33 34 35 36 37 38 39 40 41 42 43 44 45 46 47 48 49 50 51 52 53 54 55 56 57 58 59 60 61 62 63 64 65

19
Cui X.H., Chakrabarty D., Lee E.J., Paek K.Y. (2010). Production of adventitious roots and
secondary metabolites by Hypericum perforatum L. in a bioreactor. Bioresour Technol, 101, 4708-
4716.
Cui X.H., Murthy H.N., Jin Y.X., Yim Y.H., Kim J.Y., Paek K.Y. (2011). Production of
adventitious root biomass and secondary metabolites of Hypericum perforatum L. in a balloon type
airlift reactor. Bioresour Technol, 102, 10072-10079.
Fait A., Fromm H., Walter D., Galili G., Fernie A.R. (2008). Highway or byway: the metabolic role
of the GABA shunt in plants. Trends Plant Sci, 13, 14-19.
Falasca A., Melck D., Paris D., Saviano G., Motta A., Iorizzi M. (2013). Seasonal changes in the
metabolic fingerprint of Juniperus communis L. berry extracts by 1H-NMR-based metabolomics.
Metabolomics, DOI 10.1007/s11306-013-056-1.
Ferrari F., Pasqua G., Monacelli B., Cimino P., Botta B. (2005). Xanthones from calli of Hypericum
perforatum subsp. perforatum. Nat Prod Res, 19, 171-176.
Franklin G., Conceição L.F., Kombrink E., Dias A.C. (2009). Xanthone biosynthesis in Hypericum
perforatum cells provides antioxidant and antimicrobial protection upon biotic stress.
Phytochemistry, 70, 60-68.
Griebel T., Zeier J. (2010). A role for beta-sitosterol to stigmasterol conversion in plant-pathogen
interactions. Plant J, 63, 254-268.
Hsieh M.H., Goodman H.M. (2005). The Arabidopsis IspH homolog is involved in the plastid non
mevalonate pathway of isoprenoid biosynthesis. Plant Physiol, 138, 641-653.
Hunter W.N. (2007). The non-mevalonate pathway of isoprenoid precursor biosynthesis. J Biol
Chem, 282, 21573-21577.
1 2 3 4 5 6 7 8 9 10 11 12 13 14 15 16 17 18 19 20 21 22 23 24 25 26 27 28 29 30 31 32 33 34 35 36 37 38 39 40 41 42 43 44 45 46 47 48 49 50 51 52 53 54 55 56 57 58 59 60 61 62 63 64 65

20
Hunter W.N. (2011). Isoprenoid precursor biosynthesis offers potential targets for drug discovery
against diseases caused by apicomplexan parasites. Curr Top Med Chem, 11, 2048-2059.
Iriti M., Faoro F. (2009). Chitosan as a MAMP, searching for a PRR. Plant Signal Behav, 4, 66-68.
Jahangir M., Kin H.K., Choi Y.H., Verpoorte R. (2008). Metabolomic response of Brassica rapa
submitted to pre-harvest bacterial contamination. Food Chemistry, 107, 362-368.
Jansen J.J., Hoefsloot HC, Van der Greef J., Timmerman M.E., Westerhuis J.A., Smilde A.K.
(2005). ASCA: analysis of multivariate data obtained from an experimental design. J Chemom, 19,
469-481.
Kiers H.A., ten Berge J.M. (1994). Hierarchical relations between methods for simultaneous
component analysis and a technique for rotation to a simple simultaneous structure. British Journal
of Mathematical and Statistical Psychology, 47, 109-126.
Kim H.K., Choi Y.H., Verpoorte R. (2011). NMR-based plant metabolomics: where do
we stand, where do we go? Trends Biotechnol, 29, 267-275.
Kim H.K., Verpoorte R. (2010). Sample preparation for plant metabolomics. Phytochem Anal, 21,
4-13.
Kinnersley A.M. Turano F.J. (2000). Gamma Aminobutyric Acid (GABA) and Plant Responses to
Stress. Critical Reviews in Plant Sciences, 19, 479-509.
Kuzuyama T., Seto H. (2003). Diversity of the biosynthesis of the isoprene units. Nat Prod Rep, 20,
171-183.
Lian M.L., Chakrabarty D., Paek K.Y. (2002). Effect of plant growth regulators and medium
composition on cell growth and saponin production during cell suspension culture of mountain
ginseng (Panax ginseng C.A. Mayer). J .Plant Biol, 45, 201-206.
1 2 3 4 5 6 7 8 9 10 11 12 13 14 15 16 17 18 19 20 21 22 23 24 25 26 27 28 29 30 31 32 33 34 35 36 37 38 39 40 41 42 43 44 45 46 47 48 49 50 51 52 53 54 55 56 57 58 59 60 61 62 63 64 65

21
Lindon J.C., Holmes E., Nicholson J.K. (2001). Pattern recognition methods and applications in
biomedical magnetic resonance. Prog Nucl Magn Reson Spectrosc, 39, 1-40.
Manetti C., Bianchetti C., Casciani L., Castro C., Di Cocco M.E., Miccheli A., et al. (2006). A
metabonomic study of transgenic maize (Zea mays) seeds revealed variations in osmolytes and
branched amino acids. J Exp Bot, 57, 2613-2625.
Manetti C., Bianchetti C., Bizzarri M., Casciani L., Castro C., D'Ascenzo G., et al. (2004). NMR-
based metabonomic study of transgenic maize. Phytochemistry, 65, 3187-3198.
Matsuda F., Ishihara A., Takanashi K., Morino K., Miyazawa H., Wakasa H., et al. (2010).
Metabolic profiling analysis of genetically modified rice seedlings that overproduce tryptophan
reveals the occurrence of its inter-tissue translocation. Plant Biotechnol, 27, 17-27.
Miccheli A., Aureli T., Delfini M., Di Cocco M.E., Viola P., Gobetto R., et al. (1988). Study on
influence of inactivation enzyme techniques and extraction procedures on cerebral phosphorylated
metabolite levels by 31P NMR spectroscopy. Cell Mol Biol, 34, 591-603.
Modarai M., Yang M., Suter A., Kortenkamp A., Heinrich M. (2010). Metabolomic profiling of
liquid Echinacea medicinal products with in vitro inhibitory effects on cytochrome P450 3A4
(CYP3A4). Planta Med, 76, 378-385.
Motavalizadehkakhky A. (2012). Antimicrobial activity and chemical composition of essential oils
of four Hypericum from Khorasan, Iran. Journal of Medicinal Plants Research, 6, 2478-2487.
Nahrstedt A., Butterweck V. (2010). Lessons learned from herbal medicinal products: the example
of St. John's Wort (perpendicular). J Nat Prod, 73, 1015-1021.
Nicholson J.K., Lindon J.C., Holmes E. (1999). 'Metabonomics': understanding the metabolic
responses of living systems to pathophysiological stimuli via multivariate statistical analysis of
biological NMR spectroscopic data. Xenobiotica, 29, 1181-1189.
1 2 3 4 5 6 7 8 9 10 11 12 13 14 15 16 17 18 19 20 21 22 23 24 25 26 27 28 29 30 31 32 33 34 35 36 37 38 39 40 41 42 43 44 45 46 47 48 49 50 51 52 53 54 55 56 57 58 59 60 61 62 63 64 65

22
Nürk, N.M., Madriñán S., Carine M.A., Chase M.W., Blattner F.R. (2013). Molecular
phylogenetics and morphological evolution of St. John's wort (Hypericum; Hypericaceae). Mol
Phylogenet Evol, 66, 1-16.
Paek K.Y., Murthy H.N., Hahn E.J., Zhong J.J. (2009). Large scale culture of ginseng adventitious
roots for production of ginsenosides. Adv Biochem Eng Biotechnol, 113, 151-176.
Pasqua G., Avato P., Monacelli B., Santamaria A.R., Argentieri M.P. (2003). Metabolites in cell
suspension cultures, calli, and in vitro regenerated organs of Hypericum perforatum cv. Top Plant
Sci, 165, 977-982.
Porzel A., Farag M.A., Mülbradt J., Wessjohann L.A. (2013). Metabolite profiling and
fingerprinting of Hypericum species: a comparison of MS and NMR metabolomics. Metabolomics,
DOI 10.1007/s11306-013-0609-7.
Rao S.R., Ravishankar G.A. (2002). Plant cell cultures: chemical factories of secondary
metabolites. Biotechnol Adv, 20, 101-153.
Rasmussen B., Cloarec O., Tang H., Staerk D., Jaroszewski J.W. (2006). Multivariate analysis of
integrated and full-resolution 1H-NMR spectral data from complex pharmaceutical preparations: St.
John's wort. Planta Med, 72, 556-563.
Sacchettini J.C., Poulter C.D. (1997). Creating isoprenoid diversity. Science, 277, 1788-1789.
Saddiqe Z., Naeem I., Maimoona A. (2010). A review of the antibacterial activity
of Hypericum perforatum. J Ethnopharmacol, 131, 511-521.
Sasse J.M. (2003). Physiological Actions of Brassinosteroids: An Update. J Plant Growth Regul,
22, 276-288.
Shelp B.J., Mullen R.T., Waller J. (2012). Compartimentation of GABA metabolism raises
intriguing questions. Trends Plant Sci, 17, 57-59.
1 2 3 4 5 6 7 8 9 10 11 12 13 14 15 16 17 18 19 20 21 22 23 24 25 26 27 28 29 30 31 32 33 34 35 36 37 38 39 40 41 42 43 44 45 46 47 48 49 50 51 52 53 54 55 56 57 58 59 60 61 62 63 64 65

23
Sivanandhan G., Arun M., Mayavan S, Rajesh M., Mariashibu T.S., Manickavasagam M., et al.
(2012). Chitosan enhances withanolides production in adventitious root cultures of Withania
somnifera (L.) Dunal. Industrial Crops and Products, 37, 124-129.
Smilde A.K., Jansen J.J., Hoefsloot H.C., Lamers R.J., Van der Greef J., Timmerman M.E (2005).
ANOVA-simultaneous component analysis (ASCA): a new tool for analyzing designed
metabolomics data. Bioinformatics, 21, 3043-3048.
Snedden W.A., Arazi T., Fromm H., Shelp B.J. (1995). Calcium/Calmodulin Activation of Soybean
Glutamate Decarboxylase. Plant Physiol, 108, 543-549.
Tocci N., Ferrari F., Santamaria A.R., Valletta A., Rovardi I., Pasqua G. (2010). Chitosan enhances
xanthone production in Hypericum perforatum subsp. angustifolium cell cultures. Nat Prod Res, 24,
286-293.
Tocci N., Simonetti G., D'Auria F.D., Panella S., Palamara A.T., Valletta A. et al. (2011) Root
cultures of Hypericum perforatum subsp. angustifolium elicited with chitosan and production of
xanthone-rich extracts with antifungal activity. Appl Microbiol Biotechnol, 91, 977-987.
Tocci N., D'Auria F.D., Simonetti G., Panella S., Palamara A.T., Debrassi A. et al. (2013).
Bioassay-guided fractionation of extracts from Hypericum perforatum in vitro roots treated with
carboxymethylchitosans and determination of antifungal activity against human fungal pathogens.
Plant Physiol Biochem, 70, 342-347.
Tocci N., D'Auria F.D., Simonetti G., Panella S., Palamara A.T., Pasqua G. (2012). A three-
step culture system to increase the xanthone production and antifungal activity of Hypericumperfor
atum subsp. angustifolium in vitro roots. Plant Physiol Biochem, 57, 54-58.
1 2 3 4 5 6 7 8 9 10 11 12 13 14 15 16 17 18 19 20 21 22 23 24 25 26 27 28 29 30 31 32 33 34 35 36 37 38 39 40 41 42 43 44 45 46 47 48 49 50 51 52 53 54 55 56 57 58 59 60 61 62 63 64 65
24
Toyomasu T., Kagahara T., Okada K., Koga J., Hasegawa M., Mitsuhashi W., et al. (2008).
Diterpene phytoalexins are biosynthesized in and exuded from the roots of rice seedlings. Biosci
Biotechnol Biochem, 72, 562-567.
Vis D.J., Westerhuis J.A., Smilde A.K., Van der Greef J. (2007). Statistical validation of
megavariate effects in ASCA. BMC Bioinformatics, 8:322.
Walker T.S., Pal Bais H., Vivanco J.M. (2002). Jasmonic acid-induced hypericin production in cell
suspension cultures of Hypericum perforatum L. (St. John's wort). Phytochemistry, 60, 289-293.
Yaeno T., Matsuda O., Iba K. (2004). Role of chloroplast trienoic fatty acids in plant disease
defense responses. Plant J, 40, 931-941.
Yang S.Y., Kim H.K., Lefeber A.W., Erkelens C., Angelova N., Choi Y.H., et al. (2006).
Application of two-dimensional nuclear magnetic resonance spectroscopy to quality control of
ginseng commercial products. Planta Med, 72, 364-369.
Yin H., Fretté X.C., Christensen L.P., Grevsen K. (2012). Chitosan oligosaccharides promote the
content of polyphenols in Greek oregano (Origanum vulgare ssp. hirtum). J Agric Food Chem, 60,
136-143.
Zhang D.W., Liu X., Xie D., Chen R., Tao X.Y., Zou J.H., Dai J. (2013). Two new diterpenoids
from cell cultures of Salvia miltiorrhiza. Chem Pharm Bull, 61, 576-580.
Zhao J., Davis L.C., Verpoorte R. (2005). Elicitor signal transduction leading to production of plant
secondary metabolites. Biotechnol Adv, 23, 283-333.
Zobayed S.M.A., Murch S.J., Rupasinghe H.P.V., Saxena P.K. (2004). In vitro production and
chemical characterization of St. John’s wort (Hypericum perforatum L. cv ‘New Stems’). Plant
Science, 166, 333-340.
1 2 3 4 5 6 7 8 9 10 11 12 13 14 15 16 17 18 19 20 21 22 23 24 25 26 27 28 29 30 31 32 33 34 35 36 37 38 39 40 41 42 43 44 45 46 47 48 49 50 51 52 53 54 55 56 57 58 59 60 61 62 63 64 65

25
Zulak K.G., Weljie A.M., Vogel H.J., Facchini P.J. (2008). Quantitative 1H NMR metabolomics
reveals extensive metabolic reprogramming of primary and secondary metabolism in elicitor-
treated opium poppy cell cultures. BMC Plant Biol, 8:5.
Figure Captions
Fig.1 The growth curve of H. perforatum in vitro roots over a period of 15 days. Growth is
expressed as a natural logarithm of fresh weight biomass. Data are presented as the mean ± standard
deviation (SD) of five samples in five independent experiments
Fig.2 The PC scores plot relative to whole set of H. perforatum root data. basal samples;
control samples at 24 h, control samples at 72 h; chitosan-elicited samples at 24 h; chitosan-
elicited samples at 72 h. Total variance explained by PCs was 40% and 15.4 % for PC1 and PC2,
respectively
Fig.3 ASCA modelling. (A-B) Evaluation of the significance of the multivariate effect of elicitation
(A), and time (B) by means of permutation tests. The blue histograms represent the distributions of
sum of squares values under the null hypothesis, while the red dots correspond to the
experimentally observed values. (C-D) SCA analysis on the effect matrices for elicitation (C) and
time (D): variable loadings for the one-component SCA model (blue line) and their 95% confidence
intervals (red). (E) Heatmap highlighting the metabolites that contribute significantly to the model
for time and elicitation effects. Red corresponds to significant loadings with positive sign
(increase); blue corresponds to significant loading with negative sign (decrease); white indicates
metabolites whose loadings were not significant
1 2 3 4 5 6 7 8 9 10 11 12 13 14 15 16 17 18 19 20 21 22 23 24 25 26 27 28 29 30 31 32 33 34 35 36 37 38 39 40 41 42 43 44 45 46 47 48 49 50 51 52 53 54 55 56 57 58 59 60 61 62 63 64 65

26
Fig. 4 Schematic representation of root metabolic network. The metabolite level changes observed
after 24 and 72 h of chitosan elicitation are shown. The significant metabolites as evaluated by
ASCA modelling for chitosan treatment effect are represented by coloured boxes. The color code
designates changed and unchanged metabolite abundances as follows: red - significantly increased;
yellow - not significantly changed; blue - significantly decreased. The significant differences
between treated and control at corresponding experimental times were assessed by using Student’s t
test. Solid arrows in the network diagram specify a single step connecting two metabolites; dashed
arrows indicate at least two steps. CHS: chalcone synthase; BPS: benzophenone synthase
Fig. S1 Scheme of the ANOVA-like variance partitioning involved in ASCA modelling
Fig. S2-5 Metabolic composition of the root extracts. Histograms representing the quantitative
composition of the assigned metabolites grouped into distinct classes. Data are expressed in µmol/g
of fresh weight and are presented as the mean ± standard deviation (SD) of five samples in five
independent experiments. White and grey bars represent control and chitosan elicited samples,
respectively, at various experimental times. * Different from control at time 0; ** Different from
corresponding treatment at 24 hours; *** Different from control at the same experimental time as
assessed by univariate unpaired Student’s t-test. P < 0.05
1 2 3 4 5 6 7 8 9 10 11 12 13 14 15 16 17 18 19 20 21 22 23 24 25 26 27 28 29 30 31 32 33 34 35 36 37 38 39 40 41 42 43 44 45 46 47 48 49 50 51 52 53 54 55 56 57 58 59 60 61 62 63 64 65

Figure 1Click here to download high resolution image

Figure 2Click here to download high resolution image

Figure 3Click here to download high resolution image

Figure 4Click here to download high resolution image

Supplementary TableClick here to download Supplementary Material: Miccheli Table S1.doc

Supplementary Figure 1Click here to download Supplementary Material: Miccheli Figure S1.tif

Supplementary Figure 2Click here to download Supplementary Material: Miccheli Figure S2.TIF

Supplementary Figure 3Click here to download Supplementary Material: Miccheli Figure S3.tif

Supplementary Figure 4Click here to download Supplementary Material: Miccheli Figure S4.tif

Supplementary Figure 5Click here to download Supplementary Material: Miccheli Figure S5.tif