Applying a targeted label-free approach using LC-MS AMT tags to evaluate changes in protein...
22
Applying a Targeted Label-free Approach using LC-MS AMT Tags to Evaluate Changes in Protein Phosphorylation Following Phosphatase Inhibition Feng Yang 1,* , Navdeep Jaitly 1,* , Hemalatha Jayachandran 2,* , Quanzhou Luo 1 , Matthew E. Monroe 1 , Xiuxia Du 1 , Marina A. Gritsenko 1 , Rui Zhang 1 , David J. Anderson 1 , Samuel O. Purvine 1 , Joshua N. Adkins 1 , Ronald J. Moore 1 , Shi-Jian Ding 1 , Heather M. Mottaz 1 , Mary S. Lipton 1 , David G. Camp II 1 , Harold R. Udseth 1 , Richard D. Smith 1 , and Sandra Rossie 2,# 1Biological Sciences Division, Pacific Northwest National Laboratory 2Department of Biochemistry and Purdue Cancer Center, Purdue University West Lafayette, Indiana 47907-2084 Abstract In order to identify phosphoproteins regulated by the phosphoprotein phosphatase (PPP) family of S/T phosphatases, we performed a large-scale characterization of changes in protein phosphorylation on extracts from HeLa cells treated with or without calyculin A, a potent PPP enzyme inhibitor. A label-free comparative phosphoproteomics approach using immobilized metal ion affinity chromatography and targeted tandem mass spectrometry was employed to discover and identify signatures based upon distinctive changes in abundance. Overall, 232 proteins were identified as either direct or indirect targets for PPP enzyme regulation. Most of the present identifications represent novel PPP enzyme targets at the level of both phosphorylation site and protein. These data can be used to define the underlying signaling pathways and events regulated by the PPP family of S/T phosphatases. Keywords Label-free quantitation; Targeted MS/MS; AMT tag pipeline; Comparative phosphoproteomics; Immobilized metal ion affinity chromatography (IMAC); Mass spectrometry; 20 μm ID monolithic column; Phosphoprotein phosphatase (PPP) family; Ser/Thr protein phosphatase; Calyculin A INTRODUCTION In eukaryotes important functions ranging from metabolism and gene expression to cell cycle regulation and cellular stress responses are governed by reversible phosphorylation at specific serine, threonine, and tyrosine protein residues. Together with protein kinases, phosphatases control the phosphorylation status of proteins in the cell. Members of the phosphoprotein phosphatase (PPP) structural family of S/T protein phosphatases, which includes protein phosphatase 1 (PP1), protein phosphatase 2A (PP2A) and others, control the cellular function of a wide variety of proteins. This may occur by direct dephosphorylation of a protein or indirectly via regulation of other kinases, phosphatases, or protein partners. Malfunctions of # Correspondence: Sandra Rossie, Department of Biochemistry, Purdue University, 175 S. University St., West Lafayette, IN 47907, Phone (765) 494-3112, Fax (765) 494-7897, Email [email protected]. * Contributed equally NIH Public Access Author Manuscript J Proteome Res. Author manuscript; available in PMC 2008 November 1. Published in final edited form as: J Proteome Res. 2007 November ; 6(11): 4489–4497. NIH-PA Author Manuscript NIH-PA Author Manuscript NIH-PA Author Manuscript
-
Upload
independent -
Category
Documents
-
view
2 -
download
0
Transcript of Applying a targeted label-free approach using LC-MS AMT tags to evaluate changes in protein...

Applying a Targeted Label-free Approach using LC-MS AMT Tagsto Evaluate Changes in Protein Phosphorylation FollowingPhosphatase Inhibition
Feng Yang1,*, Navdeep Jaitly1,*, Hemalatha Jayachandran2,*, Quanzhou Luo1, Matthew E.Monroe1, Xiuxia Du1, Marina A. Gritsenko1, Rui Zhang1, David J. Anderson1, Samuel O.Purvine1, Joshua N. Adkins1, Ronald J. Moore1, Shi-Jian Ding1, Heather M. Mottaz1, MaryS. Lipton1, David G. Camp II1, Harold R. Udseth1, Richard D. Smith1, and Sandra Rossie2,#
1Biological Sciences Division, Pacific Northwest National Laboratory
2Department of Biochemistry and Purdue Cancer Center, Purdue University West Lafayette, Indiana47907-2084
AbstractIn order to identify phosphoproteins regulated by the phosphoprotein phosphatase (PPP) family ofS/T phosphatases, we performed a large-scale characterization of changes in protein phosphorylationon extracts from HeLa cells treated with or without calyculin A, a potent PPP enzyme inhibitor. Alabel-free comparative phosphoproteomics approach using immobilized metal ion affinitychromatography and targeted tandem mass spectrometry was employed to discover and identifysignatures based upon distinctive changes in abundance. Overall, 232 proteins were identified aseither direct or indirect targets for PPP enzyme regulation. Most of the present identificationsrepresent novel PPP enzyme targets at the level of both phosphorylation site and protein. These datacan be used to define the underlying signaling pathways and events regulated by the PPP family ofS/T phosphatases.
KeywordsLabel-free quantitation; Targeted MS/MS; AMT tag pipeline; Comparative phosphoproteomics;Immobilized metal ion affinity chromatography (IMAC); Mass spectrometry; 20 μm ID monolithiccolumn; Phosphoprotein phosphatase (PPP) family; Ser/Thr protein phosphatase; Calyculin A
INTRODUCTIONIn eukaryotes important functions ranging from metabolism and gene expression to cell cycleregulation and cellular stress responses are governed by reversible phosphorylation at specificserine, threonine, and tyrosine protein residues. Together with protein kinases, phosphatasescontrol the phosphorylation status of proteins in the cell. Members of the phosphoproteinphosphatase (PPP) structural family of S/T protein phosphatases, which includes proteinphosphatase 1 (PP1), protein phosphatase 2A (PP2A) and others, control the cellular functionof a wide variety of proteins. This may occur by direct dephosphorylation of a protein orindirectly via regulation of other kinases, phosphatases, or protein partners. Malfunctions of
#Correspondence: Sandra Rossie, Department of Biochemistry, Purdue University, 175 S. University St., West Lafayette, IN 47907,Phone (765) 494-3112, Fax (765) 494-7897, Email [email protected].*Contributed equally
NIH Public AccessAuthor ManuscriptJ Proteome Res. Author manuscript; available in PMC 2008 November 1.
Published in final edited form as:J Proteome Res. 2007 November ; 6(11): 4489–4497.
NIH
-PA Author Manuscript
NIH
-PA Author Manuscript
NIH
-PA Author Manuscript

PPP enzymes have been implicated in numerous disease states,1-3 underscoring the importanceof defining cellular targets for these enzymes. However, our knowledge of substrates andpathways regulated by PPP enzymes has lagged behind that of protein S/T kinases. Unlikemany kinases, the substrate specificity for this family of phosphatases is not defined byconsensus sequences within each substrate, but is instead controlled in a complex manner byregulatory subunits and protein-protein interactions within the cell.4, 5 Identification ofsubstrates and downstream effectors for PPP enzymes is thus best addressed in the context ofthe cell.
Qualitative global phosphoproteomics studies typically focus on cells experiencing a singledefined condition,6-10 however this offers little information about the relevance of aphosphoprotein in the context of a particular pathway or cell response. Regulatory pathwayscan be more effectively probed with quantitative and comparative approaches that measurechanges between the resting and treated states. Comparative quantitative studies of thephosphoproteome have thus far been rare and typically involve the use of stable isotopiclabeling e.g. with either 3D-methanol or 13C, 14N -SILAC or iTRAQ reagent 11-14. Mann andcolleagues recently combined triple-encoding SILAC and phosphopeptide enrichmenttechniques for identification and quantitation of phosphorylation sites as a function of stimulus,time, and subcellular location.14 However, isotopic labeling can be costly and may increasethe sample complexity.
Label-free approaches for quantitative proteomics have been hindered primarily by technicalproblems such as non-linear responses and strongly biased detection of co-eluting species dueto ionization suppression effects, especially in the circumstance of complex biologicalmatrixes. Recently, our lab developed and applied small ID (10 and 20 μm i.d.) silica-basedmonolithic capillary columns for more quantitative and sensitive proteomics measurementsand showed that low nL/min LC flow rates for ESI-MS improved quantitation based upon themore uniform signal intensities obtained for different peptides and good linear correlationsbetween MS responses and peptide amounts.15, 16 With this development, in the present studywe employed a targeted and label-free approach to identify phosphopeptides whose abundancechanged in response to treatment with an inhibitor of the PPP family of phosphatases.Abundance profiles of features from replicate LC-MS analyses of phosphopeptides derivedfrom untreated and calyculin A-treated HeLa cells were created using recently developedalignment and clustering algorithms.17 Features up-regulated in treated samples were thentargeted for fragmentation in LC-MS/MS analyses. This analysis identified 583 uniquephosphopeptides representing 416 unique proteins. Of these, 285 phosphopeptidesrepresenting 232 proteins appeared to be regulated by PPP enzymes. The majority of theserepresent new PPP targets.
EXPERIMENTAL PROCEDURESCell culture and treatment
HeLa cells were grown in Dulbecco’s Modified Eagle Medium with high glucose (Invitrogen,Carlsbad, CA) supplemented with 10% fetal bovine serum (Clontech, Mountain View, CA)and penicillin/streptomycin (Invitrogen) at 37°C in 5% CO2. At optimal confluency, cells weretreated with DMSO vehicle (control), 10 nM or 20 nM calyculin A for 15 min at 37°C andharvested for SDS-PAGE or protein extraction.
SDS-PAGE and western blottingCells were lysed in (Tris-buffered saline (TBS) with 2% SDS, 5 μM zinc acetate, 1 mM sodiumorthovanadate, 2 mM β-glycerophosphate, 1 mM PMSF, EDTA-free protease inhibitor cocktail(Roche Applied Science, Indianapolis, IN), 100 nM microcystin) and boiled for 5 min. Protein
Yang et al. Page 2
J Proteome Res. Author manuscript; available in PMC 2008 November 1.
NIH
-PA Author Manuscript
NIH
-PA Author Manuscript
NIH
-PA Author Manuscript

concentrations were determined using the BCA protein assay kit (Pierce, Rockford, IL) withBSA as standard. Samples were diluted in SDS gel loading buffer (25 mM Tris-HCl pH 6.8,12 mM EDTA, 2% SDS, 160 mM sucrose, 0.1% bromophenol blue, 2% β-mercaptoethanol),and 25 μg of each sample were subjected to SDS-PAGE using either a 6% (for the phospho-T blot) or a 12% (for elongation factor 2 (EF2) blots) resolving gel. Proteins were transferredto nitrocellulose membranes (Schleicher and Schuell Bioscience) for 1 h at 100 V in 50 mMTris, 39 mM glycine, 0.03% SDS, 20% methanol (pH 9). The membranes were incubated inblocking buffer (5% non-fat milk, 0.1% Tween-20 in TBS) for 1 h at room temperature. Thephospho-T blot was incubated with phospho-T primary antibody (1:500, Cell SignalingTechnology, Danvers, MA) in TBS containing 0.1% Tween (TBST) and 5% BSA overnightat 4°C, and bound antibody detected with goat anti-rabbit IgG secondary antibody conjugatedto horseradish peroxidase (1:5000, Cell Signaling Technology) and chemiluminescence (ECLplus Western Blotting Detection System, Amersham Biosciences, Pittsburgh, PA). Becausethe antibodies for total and phospho-T56 EF2 were both from rabbit, a single blot containingtwo lanes for each sample was prepared. A lane for each sample was probed for either total orphospho-T56 EF2 together with glyceraldehyde-3-phosphate dehydrogenase (GAPDH) as aloading control. The section of the blot probed with phospho-T56 EF2 primary antibody (1:500)was incubated overnight at 4°C. Other portions of the blot were incubated with total EF2primary antibody (1:500) or GAPDH primary antibody (1:16000, Ambion, Austin, TX) for 1h at room temperature. Blots were washed with TBST, and bound phospho-T56 or total EF2antibody detected with goat anti-rabbit secondary antibody conjugated to IR-680 dye (1:10000,Molecular Probes, Eugene, OR), while GAPDH antibody binding was visualized with goatanti-mouse secondary antibody conjugated to IR-680 dye (1:10000, Molecular Probes). Signalswere quantified using an Odyssey infrared imaging system (Li-Cor Biosciences, Lincoln, NE).Fluorescent signals for phospho- and total EF2 were normalized to their respective GAPDHsignals, then the ratio of phospho-T56 EF2: total EF2 was calculated.
Protein extraction, digestion and methylationFor each sample, protein was extracted using Trizol reagent (Invitrogen, Inc.) according to themanufacturer’s instructions with modifications as described.18 The final protein pellet wasresolubilized in 6 M guanidine hydrochloride. Two batches of cells (from 5 nearly confluent100 mm plates) were independently treated and harvested, followed by protein extraction.Proteins from the two independent biological samples were pooled. Protein concentration wasdetermined and the extracts were stored at - 80°C until further use. Samples were diluted 10-fold with 50 mM NH4HCO3 (pH 7.4) and digested with modified trypsin (Promega, Madison,WI) at a trypsin/protein ratio of 1:20 at 37 °C for 4 h, then for an additional 16 h at roomtemperature after treatment with a second aliquot of trypsin. Proteolysis was terminated byacidifying the reaction mixture with glacial acetic acid (HOAc). The tryptic digest was desaltedusing a SPE C18 column (Supelco, Bellefonte, PA), dried under vacuum, then methylatedaccording to the published protocol6 with the exception that the 1 h methylation reaction wasrepeated a second time to ensure complete methylation.
IMACMethylated peptides from each sample (~1.5 mg) were resuspended in 600 μL of 0.1% HOAc/MeCN/MeOH (1:1:1), and loaded onto Fe+3 -activated IMAC MacroTrap cartridges (3 mmi.d. × 8 mm length) (Michrom, Auburn, CA) custom packed with POROS 20 MC resin (AppliedBiosystems, Foster city, CA). The IMAC cartridges were washed first with 300 μL of 25/74/1MeCN/H2O/HOAc containing 100 mM NaCl, then with 300 μL 0.1% acetic acid, and wereeluted with 150 μL of 50 mM Na2HPO4 (pH~8.5). Eluted peptides were immediately acidifiedwith glacial HOAc to pH~4.
Yang et al. Page 3
J Proteome Res. Author manuscript; available in PMC 2008 November 1.
NIH
-PA Author Manuscript
NIH
-PA Author Manuscript
NIH
-PA Author Manuscript

Quantitative LC-MS analysis by LC-FTICRTo achieve ultra-sensitive comparative phosphoproteomics measurements, aliquots of IMAC-enriched samples were analyzed using a 20 μm i.d. silica-based monolithic column (~20 nL/min) coupled to an 11 Tesla FTICR 19. Samples were loaded onto a reversed phase pre-column(360 μm O.D. × 75 μm I.D.) packed with 5 cm of YMC 5-15 μm C18 resin (Waters Inc.,Milford, MA), washed with 0.1% HOAc, then the pre-column was connected to an analyticalHPLC silica-based monolithic column (360 μm O.D. × 20 μm I.D., 40 cm long) integratedwith a laser-pulled electrospray ionization emitter tip (2-4 μm in diameter). The HPLC gradient(A = 100 mM HOAc in water, B = 80% MeCN/100 mM HOAc in water) was 0 – 40% B for180 min, 40 – 60% B for 20 min, 60 –100% B for 15 min, 100 – 0% B for 10 min, and 0% Bfor an additional 120 min to re-equilibrate the column. Replicate LC-FTICR analyses wereperformed for treated (5 analyses) and control (4 analyses) samples.
Data analysis pipelineThe analysis pipeline used for this study is outlined in Figure 1. Features from all the LC-FTICR analyses were collapsed into mass, elution time and abundance values using theDecon2LS and VIPER software packages (http://ncrr.pnl.gov/software/).20 After eachanalysis was aligned to one baseline dataset to correct for mass and elution time variation,abundance profiles of common features with similar mass and elution time were collated intoa master list. Each group of common features is referred to as a cluster. The mass and elutiontime of each cluster was calculated as the median of the mass and elution time of each set ofgrouped features. 17
Two target lists were created from this master list by selecting those clusters showing greaterabundance in treated samples relative to control samples at two different levels of statisticalsignificance, using z-score thresholds of 1 and 0.5 respectively, then entered into the LTQinstrument XCalibur control software (ThermoElectron, San Jose, CA) as inclusion lists toprioritize the acquisition of MS/MS spectra for features that were up-regulated in treatedsamples. Because the software does not allow specification of LC elution times in the inclusionlist, we partitioned the LC-MS/MS experiment into 27 segments of 10 min intervals each. Thenormalized elution times (NETs) (defined in Supplementary Material) of the clusters in thetarget lists were scaled into the time segments and each cluster put into its respective segment;clusters at segment boundaries were entered into straddling segments. Elution times of theclusters were adjusted for expected variability for the analysis by first performing screeninganalyses in normal data-dependent mode on samples and realigning the clusters to the screeninganalyses. An additional dead time correction was made by manually entering an adjustmentbased on the m/z of three ions we observed in the screening analysis.
We acquired MS/MS spectra for the 10 most abundant species in the inclusion list after eachMS scan, with up to 3 MS/MS spectra allowed for each species (to provide the highest qualitymerged spectra). In addition, we performed normal data-dependent analyses for the 10 mostabundant species from each MS scan for any time segment that lacked inclusion list featuresto maximize the possibility of identifying peptides of changing abundance. For each target list,two replicate analyses were performed for the control and treated sample. HPLC conditionsused for these analyses were identical to those for LC-MS analyses, except that a 360 μm O.D.× 100 μm I.D. pre-column packed with 5 cm of YMC 5-15 μm C18 resin (Waters Inc., Milford,MA) and an analytical HPLC silica-based monolithic column (360 μm O.D. × 50 μm I.D., 40cm long) integrated with a laser-pulled electrospray ionization emitter tip (2-4 μm in diameter)were utilized.
The targeted LC-MS/MS results were analyzed by SEQUEST using static methylation on D,E and the C terminus, as well as dynamic phosphorylation of S, T and Y residues. Tandem MS
Yang et al. Page 4
J Proteome Res. Author manuscript; available in PMC 2008 November 1.
NIH
-PA Author Manuscript
NIH
-PA Author Manuscript
NIH
-PA Author Manuscript

peaks were generated by extract_msn.exe, part of the SEQUEST software package. The humanInternational Protein Index (IPI) database (Version 3.05 containing 49,161 protein entries,available on line at www.ebi.ac.uk/IPI) was combined with its reversed sequences and used inthe SEQUEST search. LC-MS clusters were identified by aligning the clusters to the LC-MS/MS database of results and matching clusters to peptides based on mass and elution timetolerances. The matching was done while controlling the false discovery rate (FDR) asdescribed in Supplementary Materials.
To measure the probability of correct phosphorylation site localization in each identifiedpeptide that passed the FDR, a probability-based score, the AScore, was calculated for eachphosphorylation site based on the presence of site-determining ions in MS/MS spectra,according to Gygi’s recently published approach.21
RESULTSEstablishing calyculin A treatment conditions
To define conditions for elevating phosphorylation, HeLa cells were treated with various dosesof calyculin A for increasing amounts of time. Phosphorylation was elevated with 10-20 nMcalyculin A treatment as early as 15 min (Fig 2). To minimize potential toxicity from exposureto this potent phosphatase inhibitor, treatment with 10 nM calyculin A for 15 min was chosento prepare samples for proteomics analysis.
Identification of phosphopeptides using the global targeted approach1351 clusters were identified with a constraint of 5% FDR at 2.3 standard deviations(Mahalanobis distance) of mass and elution time variability. This corresponded to an ellipticalregion with a mass tolerance of 12 ppm and a NET tolerance of 0.06. As a result, 583phosphopeptides were identified. The XCorr threshold was 2.65 for charge 3+ peptides andwas 2.01 for charge 2+ peptides. These peptides are listed in Supplementary Table 1. Spectrafor all 583 phosphopeptides and their SEQUEST identification information are included in theSpectrumLook Software Package (see Supplementary Materials).
Quantitation of protein phosphorylationA t-test was performed at a significance level of 5% on the set of identified clusters afterperforming a log base 2 transformation of the intensities. 184 phosphopeptides were found tobe differentially abundant, with 145 exhibiting up-regulation in the treated condition (listed inSupplementary Table 2A). Figure 3 shows the clustergram of peak areas of the phosphopeptidesinferred as being differentially abundant from the t-test.
A number of phosphopeptides that were either undetected or detected only once in onecondition, but were found three or more times in the other condition, were also considered tohave changed significantly: 90 phosphopeptides were observed 3-5 times in treated samples,but were not observed or observed only once in control (referred to as C1T3), whereas 11phosphopeptides were found in control samples 3-4 times, but were detected only once or notat all in treated samples (referred to as C3T1). These phosphopeptides, together with theirabundance information, are included in Supplementary Table 2B.
Table 1 summarizes the number of identified phosphopeptides for different types of MSanalyses (5% FDR), and the number in the final phosphopeptide lists after peak matching ofthe clusters to the AMT tag database (5% FDR, 583 phosphopeptides, listed in SupplementaryTable 2C). From Table 1, it is clear that the greatest number of changing phosphopeptides wereidentified in the targeted analyses of treated samples. In normal data-dependent analyses ofcontrol and treated samples, although 218 phosphopeptides were identified, only 60 (standard
Yang et al. Page 5
J Proteome Res. Author manuscript; available in PMC 2008 November 1.
NIH
-PA Author Manuscript
NIH
-PA Author Manuscript
NIH
-PA Author Manuscript

t-test plus C1T3 peptides) of these showed significant up-regulation in the treated sample.Similarly, only 54 phosphopeptides up-regulated in response to calyculin A treatment weredetected in targeted analyses for control samples. In contrast, 189 up-regulatedphosphopeptides were identified from targeted analyses of treated samples. This indicates theeffectiveness of using the targeted approach to identify changed features (in this study, up-regulated features) in treated samples compared to the use of normal data-dependent analysis.Even though all features in the target lists were chosen based on their up-regulation, somedown-regulated features and C3T1 peptides were also identified. This is not surprising, sincewe programmed the MS/MS analysis in such a way that when the targets were not availableduring a given time interval, the LTQ instrument acquired MS/MS for the 10 most abundantpeptides in its normal data-dependent mode of operation to identify more phosphopeptides.Because we limited our target lists to up-regulated features, the real number of down-regulatedphosphopeptides occurring as a function of calyculin A treatment is likely to be much greater.
Validation of peptide identification cut-off criteriaManual confirmation of phosphopeptides that passed the 5% FDR filter from several datasetswas also performed. This manual confirmation verified that the estimated FDR of thephosphopeptides was similar to that observed above. Figure 4 shows the MS/MS spectrum ofa phosphopeptide from a known PP2A target, EF2. 22, 23 Manual confirmation of this spectrumverified the EF2 phosphopeptide sequence, and an increase in EF2 phosphorylation at this siteas a result of calyculin A treatment was confirmed by quantitative western blot analysis (Fig5). Despite this, the EF2 phosphopeptide change failed the 5% FDR criterion used for filteringthe phosphopeptides in our initial data analyses to build the AMT tag database for peakmatching. In addition, several other phosphopeptides, including some from known PPP enzymetargets such as stathmin24 and cytochrome P450 C17A1,25 which failed to pass the FDR filterwere also shown to be correct based on manual confirmation. Overall, this indicates that the5% FDR filter applied in this study is conservative and underestimates the number of changedphosphoproteins.
For phosphopeptides that passed the 5% FDR filter we occasionally observed that, even thoughthe peptide sequence was correct, our manual analysis indicated that the phosphorylation siteassignment was incorrect. In some cases the phosphorylation site can be determined from theb- and y-ions associated with a specific phosphorylated residue and/or the correspondingneutral loss ions; however, in some cases, especially for peptides with multiple phosphorylationsites, assignment can be problematic. Thus, the effective 5% FDR refers to the peptide sequenceand number of phosphorylation sites, but does not reflect the FDR for phosphorylation siteidentification. In cases where more than one phosphorylation site assignment is possible,additional confirmation is required. For this purpose, we calculated the ambiguity scoreAScore21 to estimate the confidence in the phosphorylation site assignment based on thepresence of related site-determining ions in MS/MS spectra. Supplementary Table 3 lists theAScores for each ambiguous phosphorylation site. An AScore greater than 19 was considereda confident assignment of a particular phosphorylation site.21
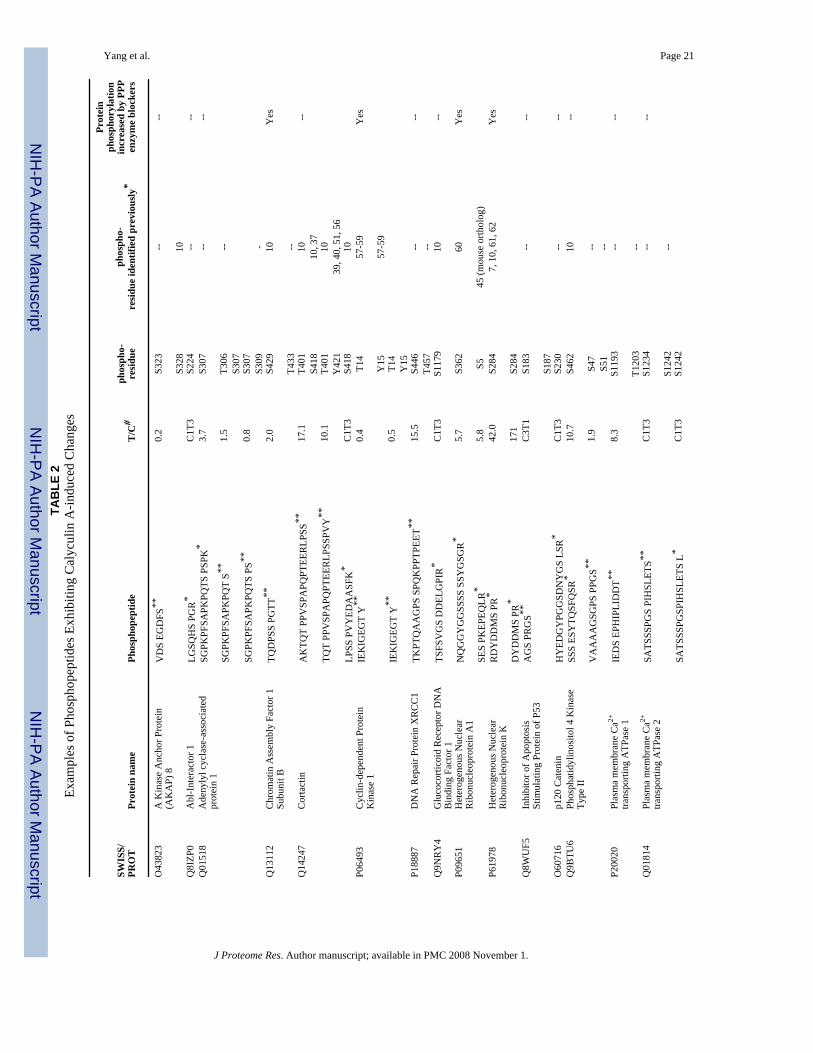
Identification of known and novel targets for regulation by PPP enzymesA number of proteins with phosphorylation elevated by calyculin A treatment are well-established direct or indirect targets of PPP enzymes. These are listed in Table 2, together witha small sample of the novel targets for regulation identified in this study. For cyclin-dependentprotein kinase (CDK1), PP1 regulatory subunit 12, and heterogenous ribonucleoprotein(HnRNP)-K, the sites of phosphorylation seen to increase following calyculin A treatment haveall been previously documented as either direct or indirect targets for PPP enzymes, or sensitiveto PPP enzyme blockers (see Table 2 for refs).
Yang et al. Page 6
J Proteome Res. Author manuscript; available in PMC 2008 November 1.
NIH
-PA Author Manuscript
NIH
-PA Author Manuscript
NIH
-PA Author Manuscript

Vimentin is a cytoplasmic intermediate filament protein that undergoes a complex pattern ofphosphorylation by multiple kinases. Calyculin A treatment caused an apparent increase invimentin-derived peptides containing p-S4, p-S55 and p-S458. Elevated 32P incorporation intothe residues corresponding to S55 and S458 of vimentin from hamster-derived BHK cellsfollowing calyculin A treatment has been reported previously.26 Other studies have also shownthat PPP enzyme blockers elevate vimentin phosphorylation and that PP2A is associated withvimentin.27-35
Plectin, which links various cytoskeletal proteins with each other and with other targets, alsoundergoes elevated phosphorylation by treatment with PPP enzyme inhibitors,36 however,specific sites have not been identified. In the present study, a peptide containing p-S4386 waselevated, indicating that this site is a target for PPP enzyme regulation.
The actin binding protein, cortactin, is phosphorylated by activation of the Extracellular signal-regulating kinase (ERK) MAP kinase pathway, most likely by ERK itself.37 Although theeffect of PPP blockers on cortactin has not been reported, ERK is inactivated by PP2A and isactivated by okadaic acid treatment.38 Two cortactin residues identified in this study, T401and S418, are followed by proline, the minimal requirement for an ERK phosphorylation site.Serine 418 is phosphorylated in vivo following growth factor stimulation and by ERK invitro.37 Although ERK phosphorylation of T401 was not observed in vitro, an increase inphosphothreonine at an unidentified site was shown to occur in a growth factor-stimulated,MAP-kinase/ERK kinase (MEK)-dependent manner.37 We also observed elevatedphosphorylation of cortactin residue Y421, which can be attacked by the tyrosine kinasesSrc39 and Abl;40 thus elevated phosphorylation of this site may reflect indirect regulation ofone of these tyrosine kinases by PP2A38 or another member of this family.
HnRNP-A1, which plays a role in mRNA splicing, is phosphorylated by numerous kinases invitro and contains multiple phosphorylation sites.41 The phosphorylation of HnRNP-A1wasshown to be elevated by cell treatment with another PPP enzyme blocker okadaic acid,42-44although the sites of phosphorylation influenced by okadaic acid were not mapped in thesestudies. In the present study, S5 and S362 exhibited elevated phosphorylation followingcalyculin A treatment. Phosphorylation of hnRNP-A1 S5 was reported in calyculin A-treatedmurine cells45, however in this study no comparison was made between untreated and treatedcells. Our results demonstrate that phosphorylation at both S5 and S362 is influenced by PPPenzyme activity.
The B subunit of chromatin assembly factor 1 (CAF-1B) undergoes a cycle of phosphorylationand dephosphorylation during S phase chromatin assembly46 that involves multiplephosphorylation events.47-49 This is thought to involve cyclin-dependent protein kinases andPP1 and to be required for nucleosome assembly concomitant with DNA synthesis.50Phosphorylation site(s) in CAF-1B relevant to nucleosome assembly have not been identified.Our study revealed two residues in CAF-1B, S429 and T433, whose phosphorylation wasincreased by calyculin A. Each of these residues is followed by a proline, consistent with thepossibility that they are cyclin kinase-dependent phosphorylation sites.
It should be noted that while specific PPP family members have been implicated in directly orindirectly controlling the phosphorylation status of these protein targets for each of the casesdescribed above, other calyculin A-sensitive PPP family members may also be involved incontrolling the sites identified in these proteins.
Novel targets for PPP regulation identified in this study also represent proteins with a widevariety of functions and residing in numerous subcellular compartments. All targets (285unique phosphopeptides) regulated by PPP enzymes are listed in Supplementary Table 2A and2B (t-test, C1T3 and C3T1). Cases in which tyrosine phosphorylation was altered clearly
Yang et al. Page 7
J Proteome Res. Author manuscript; available in PMC 2008 November 1.
NIH
-PA Author Manuscript
NIH
-PA Author Manuscript
NIH
-PA Author Manuscript

represent indirect action of PPP enzymes. However, for those cases in which phosphorylationwas up-regulated the effect of PPP enzymes may be either direct or indirect.
DISCUSSIONThis study presents a novel label-free and global targeted approach for comparativephosphoproteomics applied to the analysis of proteins subject to regulation by PPP-type S/Tprotein phosphatases. The confirmation of phosphorylation sites in proteins already known tochange as a function of PPP enzyme inhibitor treatment, such as T14 and Y15 in CDK1 andS284 in hnRNP-K, validates our proteomics strategy for identifying PPP enzyme targets. Wealso identified calyculin A-sensitive sites within known protein targets for PPP enzymes forwhich specific sites have not previously been defined (e.g. plectin). Other calyculin A-sensitivephosphorylation sites found in this study represent sites identified in various globalphosphoproteomic screens,7, 10, 45, 51, 52 such as T457 in DNA Repair Protein XRCC1, forwhich no functional information about regulation by phosphorylation is currently available.Our study confirms the identification of these sites and further shows that their phosphorylationstatus is influenced by PPP family phosphatases. This new information, together withknowledge of the kinase attacking these sites and the protein function, will assist in formulatinghypotheses about the signaling pathways and regulatory events involving thesephosphoproteins. Other sites identified in this study include phosphorylation sites notpreviously reported in proteins that have established or unknown functions. Identification ofnovel phosphorylation sites and their regulation by a PPP family member provides an importantnew clue concerning the regulation of these proteins. Altogether, 232 known and novel proteintargets for PPP enzymes were identified. We estimate that over 95% of these represent newphosphorylation sites and protein targets.
To date, only one other study has compared phosphoproteins from samples treated with orwithout a PPP enzyme inhibitor. In this study of phosphorylation changes in neurons inducedby okadaic acid, a strategy involving isolation of phosphoproteins, followed by ICAT labelingwas employed. These investigators also found that the majority of peptides did not change inphosphorylation status and identified 75 unique peptide pairs yielding 13 proteins with changedphosphorylation status.53 Although several other global phosphoproteomic studies used a PPPinhibitor to elevate phosphorylation, no comparison between treated and untreated sampleswas performed to determine whether phosphorylation sites were subject to PPP enzymeregulation.45, 54, 55 Despite the large number of novel targets for PPP enzyme regulationrevealed in this study, many well-established targets were not identified. This may be due tothe fact that phosphorylation of some targets requires activation of specific signaling pathways,the nature of the ion fragmentation processes, or to limitations in sensitivity, dynamic rangeor from ion suppression by more abundant species. In addition, sample preparation stepsincluding the Trizol extraction procedure, IMAC and the use of trypsin are factors that caninfluence protein or peptide recovery.
The success of the present strategy is due to the inclusion of several technical, analytical andinformatics advances. Building on our earlier study demonstrating the effects of LC columndimensions and flow rate on quantitation,16 in the present study we employed a long (40 cm)monolithic column with a small I.D. (20 μm),15 operated at ~20 nL/min, providing higherseparation power compared with shorter columns (15 cm or less) and greater sensitivitycompared to the higher LC flow rates employed in other studies.10, 11, 13 This provided morereliable, sensitive and comprehensive quantitation results. The targeted analyses themselveswere only possible through the extension of the AMT tag strategy20 employed for this analysiswhere LC-MS datasets were first aligned to each other to detect clusters which showedinteresting abundance profiles. The identification of the clusters themselves was performedusing the traditional AMT tag approach by collating the LC-MS/MS results together.
Yang et al. Page 8
J Proteome Res. Author manuscript; available in PMC 2008 November 1.
NIH
-PA Author Manuscript
NIH
-PA Author Manuscript
NIH
-PA Author Manuscript

In this study we encountered several challenges, both in performing the experiment and inanalyzing the results. The construction of inclusion lists was challenging because someinstrument control software does not provide a mechanism for use of LC elution times withthe inclusion list. Even when a mechanism is provided for specification of elution time, LC-MS separation times are generally not perfectly reproducible, and none provide for automatedcorrection of the elution times of inclusion lists to account for chromatographic variability inthe current experiment. Such capabilities will be essential if targeted experiments are to besuccessful on a regular basis in high throughput settings.
Targeted studies, such as ours, based on feature profiling, can increase analyses efficiency,sensitivity and throughput by focusing tandem MS capabilities on peptides of interest. It cangreatly facilitate studies in which the amount of sample is limited and the objective is to identifychanged features under different biological conditions without the need to comprehensivelycharacterize all the features, most of which are often not related to the biological stimulus ofinterest. This is particularly helpful for changes occurring in low abundance proteins. Thisapproach also minimizes the number of fractionation or chemical modification steps, whichcan be time consuming and cause sample losses, as well as the extensive analyses requiredwith other approaches to obtain a similar level of identification for features exhibitingdifferential abundance. In this study, we performed targeted analyses for both significantlychanged features and features displaying only modest up-regulation in treated samples.According to our results, targeted analysis could be further improved by focusing on onlysignificantly changed features such as those with z>1. Further success can be achieved bycombining the profiling strategy with “smart” mass spectrometry which would combine on-line alignment algorithms and intelligent on-line acquisition of relevant, informative spectrausing selective application of MSn or ETD capabilities when sufficient sensitivity exists.
Supplementary MaterialRefer to Web version on PubMed Central for supplementary material.
Acknowledgements
This research was supported by NIH grants NS031221 (SR) and RR18522 (RDS), and a grant from the Indiana ElksCharities Inc./Walther Cancer Institute (SR). We thank Dr. Angus Nairn (Yale University, School of Medicine) forthe kind gift of EF2 antibodies. The Proteomics NCRR Biomedical Technology Resource Center is located in theEnvironmental Molecular Sciences Laboratory at Pacific Northwest National Laboratory and the authors thank theEnvironmental Molecular Sciences Laboratory (EMSL) for use of the instrumentation applied in this research. EMSLis a U.S. Department of Energy (DOE) national scientific user facility located at PNNL in Richland, Washington.PNNL is a multi-program national laboratory operated by Battelle Memorial Institute for the DOE under ContractDE-AC05-76RL01830. Documentation of previously identified phosphorylation sites was performed in part use ofPhosphosite® (www.phosphosite.org).
References1. Arroyo JD, Hahn WC. Involvement of PP2A in viral and cellular transformation. Oncogene 2005;24
(52):7746–55. [PubMed: 16299534]2. Brady MJ, Saltiel AR. The role of protein phosphatase-1 in insulin action. Recent Prog Horm Res
2001;56:157–73. [PubMed: 11237211]3. Oliver CJ, Shenolikar S. Physiologic importance of protein phosphatase inhibitors. Front Biosci
1998;3:D961–72. [PubMed: 9727084]4. Janssens V, Goris J. Protein phosphatase 2A: a highly regulated family of serine/threonine phosphatases
implicated in cell growth and signalling. Biochem J 2001;353(Pt 3):417–39. [PubMed: 11171037]5. Ceulemans H, Bollen M. Functional diversity of protein phosphatase-1, a cellular economizer and reset
button. Physiol Rev 2004;84(1):1–39. [PubMed: 14715909]
Yang et al. Page 9
J Proteome Res. Author manuscript; available in PMC 2008 November 1.
NIH
-PA Author Manuscript
NIH
-PA Author Manuscript
NIH
-PA Author Manuscript

6. Ficarro SB, McCleland ML, Stukenberg PT, Burke DJ, Ross MM, Shabanowitz J, Hunt DF, WhiteFM. Phosphoproteome analysis by mass spectrometry and its application to Saccharomyces cerevisiae.Nat Biotechnol 2002;20(3):301–5. [PubMed: 11875433]
7. Kim JE, Tannenbaum SR, White FM. Global phosphoproteome of HT-29 human colonadenocarcinoma cells. Journal of Proteome Research 2005;4(4):1339–1346. [PubMed: 16083285]
8. Moser K, White FM. Phosphoproteomic analysis of rat liver by high capacity IMAC and LC-MS/MS.Journal of Proteome Research 2006;5(1):98–104. [PubMed: 16396499]
9. Ballif BA, Villen J, Beausoleil SA, Schwartz D, Gygi SP. Phosphoproteomic analysis of the developingmouse brain. Molecular & Cellular Proteomics 2004;3(11):1093–1101. [PubMed: 15345747]
10. Beausoleil, SA.; Jedrychowski, M.; Schwartz, D.; Elias, JE.; Villen, J.; Li, JX.; Cohn, MA.; Cantley,LC.; Gygi, SP. Large-scale characterization of HeLa cell nuclear phosphoproteins; Proceedings ofthe National Academy of Sciences of the United States of America; 2004. p. 12130-12135.
11. Stover DR, Caldwell J, Marto J, Root R, Mestan J, Stumm M, Ornatsky O, Orsi C, Radosevic N, LiaoL, Fabbro D, Moran MF. Differential phosphoprofiles of EGF and EGFR kinase inhibitor-treatedhuman tumor cells and mouse xenografts. Clin Proteomics 2004;1:069–080.
12. Gruhler A, Olsen JV, Mohammed S, Mortensen P, Faergeman NJ, Mann M, Jensen ON. Quantitativephosphoproteomics applied to the yeast pheromone signaling pathway. Molecular & CellularProteomics 2005;4(3):310–327. [PubMed: 15665377]
13. Zhang Y, Wolf-Yadlin A, Ross PL, Pappin DJ, Rush J, Lauffenburger DA, White FM. Time-resolvedmass spectrometry of tyrosine phosphorylation sites in the epidermal growth factor receptor signalingnetwork reveals dynamic modules. Mol Cell Proteomics 2005;4(9):1240–50. [PubMed: 15951569]
14. Olsen JV, Blagoev B, Gnad F, Macek B, Kumar C, Mortensen P, Mann M. Global, in vivo, and site-specific phosphorylation dynamics in signaling networks. Cell 2006;127(3):635–648. [PubMed:17081983]
15. Luo QZ, Shen YF, Hixson KK, Zhao R, Yang F, Moore RJ, Mottaz HM, Smith RD. Preparation of20-mu m-i.d. silica-based monolithic columns and their performance for proteomics analyses.Analytical Chemistry 2005;77(15):5028–5035. [PubMed: 16053318]
16. Luo QZ, Tang KQ, Yang F, Elias A, Shen YF, Moore RJ, Zhao R, Hixson KK, Rossie SS, Smith RD.More sensitive and quantitative proteomic measurements using very low flow rate porous silicamonolithic LC columns with electrospray ionization-mass spectrometry. Journal of ProteomeResearch 2006;5(5):1091–1097. [PubMed: 16674098]
17. Jaitly N, Monroe ME, Petyuk VA, Clauss TRW, Adkins JN, Smith RD. Robust algorithm foralignment of liquid chromatography-mass spectrometry analyses in an accurate mass and time tagdata analysis pipeline. Analytical Chemistry 2006;78(21):7397–7409. [PubMed: 17073405]
18. Yang F, Stenoien DL, Strittmatter EF, Wang JH, Ding LH, Lipton MS, Monroe ME, Nicora CD,Gristenko MA, Tang KQ, Fang RH, Adkins JN, Camp DG, Chen DJ, Smith RD. Phosphoproteomeprofiling of human skin fibroblast cells in response to low-and high-dose irradiation. Journal ofProteome Research 2006;5(5):1252–1260. [PubMed: 16674116]
19. Harkewicz R, Belov ME, Anderson DA, Pasa-Tolic L, Masselon CD, Prior DC, Udseth HR, SmithRD. ESI-FTICR Mass Spectrometry Employing Data-Dependent External Ion Selection andAccumulation. J Amer Soc Mass Spectrom 2002;13:144–154. [PubMed: 11838018]
20. Zimmer JSD, Monroe ME, Qian WJ, Smith RD. Advances in proteomics data analysis and displayusing an accurate mass and time tag approach. Mass Spectrometry Reviews 2006;25(3):450–482.[PubMed: 16429408]
21. Beausoleil SA, Villén J, Gerber SA, Rush J, Gygi SP. A probability-based approach for high-throughput protein phosphorylation analysis and site localization. Nat Biotechnol 2006:1–8.[PubMed: 16404373]
22. Redpath NT, Proud CG. The tumour promoter okadaic acid inhibits reticulocyte-lysate proteinsynthesis by increasing the net phosphorylation of elongation factor 2. Biochem J 1989;262(1):69–75. [PubMed: 2510715]
23. Redpath NT, Proud CG. Activity of protein phosphatases against initiation factor-2 and elongationfactor-2. Biochem J 1990;272(1):175–80. [PubMed: 2176079]
Yang et al. Page 10
J Proteome Res. Author manuscript; available in PMC 2008 November 1.
NIH
-PA Author Manuscript
NIH
-PA Author Manuscript
NIH
-PA Author Manuscript

24. Tournebize R, Andersen SS, Verde F, Doree M, Karsenti E, Hyman AA. Distinct roles of PP1 andPP2A-like phosphatases in control of microtubule dynamics during mitosis. Embo J 1997;16(18):5537–49. [PubMed: 9312013]
25. Pandey AV, Mellon SH, Miller WL. Protein phosphatase 2A and phosphoprotein SET regulateandrogen production by P450c17. J Biol Chem 2003;278(5):2837–44. [PubMed: 12444089]
26. Eriksson JE, He T, Trejo-Skalli AV, Harmala-Brasken AS, Hellman J, Chou YH, Goldman RD.Specific in vivo phosphorylation sites determine the assembly dynamics of vimentin intermediatefilaments. J Cell Sci 2004;117(Pt 6):919–32. [PubMed: 14762106]
27. Almazan G, Afar DE, Bell JC. Phosphorylation and disruption of intermediate filament proteins inoligodendrocyte precursor cultures treated with calyculin A. J Neurosci Res 1993;36(2):163–72.[PubMed: 8263969]
28. Turowski P, Myles T, Hemmings BA, Fernandez A, Lamb NJ. Vimentin dephosphorylation by proteinphosphatase 2A is modulated by the targeting subunit B55. Mol Biol Cell 1999;10(6):1997–2015.[PubMed: 10359611]
29. Cheng TJ, Lin YL, Chiang AS, Lai YK. Association of protein phosphatase 2A with its substratevimentin intermediate filaments in 9L rat brain tumor cells. J Cell Biochem 2000;79(1):126–38.[PubMed: 10906761]
30. Eriksson JE, Brautigan DL, Vallee R, Olmsted J, Fujiki H, Goldman RD. Cytoskeletal integrity ininterphase cells requires protein phosphatase activity. Proc Natl Acad Sci U S A 1992;89(22):11093–7. [PubMed: 1332069]
31. Lai YK, Lee WC, Chen KD. Vimentin serves as a phosphate sink during the apparent activation ofprotein kinases by okadaic acid in mammalian cells. J Cell Biochem 1993;53(2):161–8. [PubMed:7693732]
32. Lee WC, Yu JS, Yang SD, Lai YK. Reversible hyperphosphorylation and reorganization of vimentinintermediate filaments by okadaic acid in 9L rat brain tumor cells. J Cell Biochem 1992;49(4):378–93. [PubMed: 1331124]
33. Ho DT, Roberge M. The antitumor drug fostriecin induces vimentin hyperphosphorylation andintermediate filament reorganization. Carcinogenesis 1996;17(5):967–72. [PubMed: 8640945]
34. Hirano K, Hartshorne DJ. Phosphorylation of vimentin in the C-terminal domain after exposure tocalyculin-A. Eur J Cell Biol 1993;62(1):59–65. [PubMed: 8269979]
35. Yatsunami J, Fujiki H, Suganuma M, Yoshizawa S, Eriksson JE, Olson MO, Goldman RD. Vimentinis hyperphosphorylated in primary human fibroblasts treated with okadaic acid. Biochem BiophysRes Commun 1991;177(3):1165–70. [PubMed: 1647766]
36. Larsen AK, Moller MT, Blankson H, Samari HR, Holden L, Seglen PO. Naringin-sensitivephosphorylation of plectin, a cytoskeletal cross-linking protein, in isolated rat hepatocytes. J BiolChem 2002;277(38):34826–35. [PubMed: 12095991]
37. Campbell DH, Sutherland RL, Daly RJ. Signaling pathways and structural domains required forphosphorylation of EMS1/cortactin. Cancer Res 1999;59(20):5376–85. [PubMed: 10537323]
38. Millward TA, Zolnierowicz S, Hemmings BA. Regulation of protein kinase cascades by proteinphosphatase 2A. Trends Biochem Sci 1999;24(5):186–91. [PubMed: 10322434]
39. Huang C, Liu J, Haudenschild CC, Zhan X. The role of tyrosine phosphorylation of cortactin in thelocomotion of endothelial cells. J Biol Chem 1998;273(40):25770–6. [PubMed: 9748248]
40. Goss VL, Lee KA, Moritz A, Nardone J, Spek EJ, MacNeill J, Rush J, Comb MJ, Polakiewicz RD.A common phosphotyrosine signature for the Bcr-Abl kinase. Blood 2006;107(12):4888–97.[PubMed: 16497976]
41. Soret J, Tazi J. Phosphorylation-dependent control of the pre-mRNA splicing machinery. Prog MolSubcell Biol 2003;31:89–126. [PubMed: 12494764]
42. Cobianchi F, Calvio C, Stoppini M, Buvoli M, Riva S. Phosphorylation of human hnRNP protein A1abrogates in vitro strand annealing activity. Nucleic Acids Res 1993;21(4):949–55. [PubMed:8451194]
43. Hamilton BJ, Burns CM, Nichols RC, Rigby WF. Modulation of AUUUA response element bindingby heterogeneous nuclear ribonucleoprotein A1 in human T lymphocytes. The roles of cytoplasmiclocation, transcription, and phosphorylation. J Biol Chem 1997;272(45):28732–41. [PubMed:9353343]
Yang et al. Page 11
J Proteome Res. Author manuscript; available in PMC 2008 November 1.
NIH
-PA Author Manuscript
NIH
-PA Author Manuscript
NIH
-PA Author Manuscript

44. Hermann R, Hensel F, Muller EC, Keppler M, Souto-Carneiro M, Brandlein S, Muller-HermelinkHK, Vollmers HP. Deactivation of regulatory proteins hnRNP A1 and A2 during SC-1 inducedapoptosis. Hum Antibodies 2001;10(2):83–90. [PubMed: 11673663]
45. Shu H, Chen S, Bi Q, Mumby M, Brekken DL. Identification of phosphoproteins and theirphosphorylation sites in the WEHI-231 B lymphoma cell line. Mol Cell Proteomics 2004;3(3):279–86. [PubMed: 14729942]
46. Krude T, Keller C. Chromatin assembly during S phase: contributions from histone deposition, DNAreplication and the cell division cycle. Cell Mol Life Sci 2001;58(56):665–72. [PubMed: 11437228]
47. Martini E, Roche DM, Marheineke K, Verreault A, Almouzni G. Recruitment of phosphorylatedchromatin assembly factor 1 to chromatin after UV irradiation of human cells. J Cell Biol 1998;143(3):563–75. [PubMed: 9813080]
48. Smith S, Stillman B. Immunological characterization of chromatin assembly factor I, a human cellfactor required for chromatin assembly during DNA replication in vitro. J Biol Chem 1991;266(18):12041–7. [PubMed: 2050697]
49. Marheineke K, Krude T. Nucleosome assembly activity and intracellular localization of human CAF-1changes during the cell division cycle. J Biol Chem 1998;273(24):15279–86. [PubMed: 9614144]
50. Keller C, Krude T. Requirement of Cyclin/Cdk2 and protein phosphatase 1 activity for chromatinassembly factor 1-dependent chromatin assembly during DNA synthesis. J Biol Chem 2000;275(45):35512–21. [PubMed: 10938080]
51. Salomon AR, Ficarro SB, Brill LM, Brinker A, Phung QT, Ericson C, Sauer K, Brock A, Horn DM,Schultz PG, Peters EC. Profiling of tyrosine phosphorylation pathways in human cells using massspectrometry. Proc Natl Acad Sci U S A 2003;100(2):443–8. [PubMed: 12522270]
52. Brill LM, Salomon AR, Ficarro SB, Mukherji M, Stettler-Gill M, Peters EC. Robustphosphoproteomic profiling of tyrosine phosphorylation sites from human T cells using immobilizedmetal affinity chromatography and tandem mass spectrometry. Anal Chem 2004;76(10):2763–72.[PubMed: 15144186]
53. Hill JJ, Callaghan DA, Ding W, Kelly JF, Chakravarthy BR. Identification of okadaic acid-inducedphosphorylation events by a mass spectrometry approach. Biochem Biophys Res Commun 2006;342(3):791–9. [PubMed: 16499873]
54. Hoffert, JD.; Pisitkun, T.; Wang, GH.; Shen, RF.; Knepper, MA. Quantitative phosphoproteomics ofvasopressin-sensitive renal cells: Regulation of aquaporin-2 phosphorylation at two sites.Proceedings of the National Academy of Sciences of the United States of America; 2006. p.7159-7164.
55. Nousiainen M, Sillje HH, Sauer G, Nigg EA, Korner R. Phosphoproteome analysis of the humanmitotic spindle. Proc Natl Acad Sci U S A 2006;103(14):5391–6. [PubMed: 16565220]
56. Dudek SM, Jacobson JR, Chiang ET, Birukov KG, Wang P, Zhan X, Garcia JG. Pulmonaryendothelial cell barrier enhancement by sphingosine 1-phosphate: roles for cortactin and myosin lightchain kinase. J Biol Chem 2004;279(23):24692–700. [PubMed: 15056655]
57. Norbury C, Blow J, Nurse P. Regulatory phosphorylation of the p34cdc2 protein kinase in vertebrates.Embo J 1991;10(11):3321–9. [PubMed: 1655417]
58. Solomon MJ, Lee T, Kirschner MW. Role of phosphorylation in p34cdc2 activation: identificationof an activating kinase. Mol Biol Cell 1992;3(1):13–27. [PubMed: 1532335]
59. Krek W, Nigg EA. Differential phosphorylation of vertebrate p34cdc2 kinase at the G1/S and G2/Mtransitions of the cell cycle: identification of major phosphorylation sites. Embo J 1991;10(2):305–16. [PubMed: 1846803]
60. Buxade M, Parra JL, Rousseau S, Shpiro N, Marquez R, Morrice N, Bain J, Espel E, Proud CG. TheMnks are novel components in the control of TNF alpha biosynthesis and phosphorylate and regulatehnRNP A1. Immunity 2005;23(2):177–89. [PubMed: 16111636]
61. Kwiek NC, Thacker DF, Datto MB, Megosh HB, Haystead TA. PITK, a PP1 targeting subunit thatmodulates the phosphorylation of the transcriptional regulator hnRNP K. Cell Signal 2006;18(10):1769–78. [PubMed: 16564677]
62. Habelhah H, Shah K, Huang L, Ostareck-Lederer A, Burlingame AL, Shokat KM, Hentze MW, RonaiZ. ERK phosphorylation drives cytoplasmic accumulation of hnRNP-K and inhibition of mRNAtranslation. Nat Cell Biol 2001;3(3):325–30. [PubMed: 11231586]
Yang et al. Page 12
J Proteome Res. Author manuscript; available in PMC 2008 November 1.
NIH
-PA Author Manuscript
NIH
-PA Author Manuscript
NIH
-PA Author Manuscript

63. Niiro N, Ikebe M. Zipper-interacting protein kinase induces Ca(2+)-free smooth muscle contractionvia myosin light chain phosphorylation. J Biol Chem 2001;276(31):29567–74. [PubMed: 11384979]
64. Broustas CG, Grammatikakis N, Eto M, Dent P, Brautigan DL, Kasid U. Phosphorylation of themyosin-binding subunit of myosin phosphatase by Raf-1 and inhibition of phosphatase activity. JBiol Chem 2002;277(4):3053–9. [PubMed: 11719507]
65. Begum N, Sandu OA, Ito M, Lohmann SM, Smolenski A. Active Rho kinase (ROK-alpha) associateswith insulin receptor substrate-1 and inhibits insulin signaling in vascular smooth muscle cells. J BiolChem 2002;277(8):6214–22. [PubMed: 11739394]
66. Sakurada S, Takuwa N, Sugimoto N, Wang Y, Seto M, Sasaki Y, Takuwa Y. Ca2+-dependentactivation of Rho and Rho kinase in membrane depolarization-induced and receptor stimulation-induced vascular smooth muscle contraction. Circ Res 2003;93(6):548–56. [PubMed: 12919947]
67. Birukova AA, Smurova K, Birukov KG, Kaibuchi K, Garcia JG, Verin AD. Role of Rho GTPases inthrombin-induced lung vascular endothelial cells barrier dysfunction. Microvasc Res 2004;67(1):64–77. [PubMed: 14709404]
68. Birukova AA, Liu F, Garcia JG, Verin AD. Protein kinase A attenuates endothelial cell barrierdysfunction induced by microtubule disassembly. Am J Physiol Lung Cell Mol Physiol 2004;287(1):L86–93. [PubMed: 15003930]
69. Birukova AA, Smurova K, Birukov KG, Usatyuk P, Liu F, Kaibuchi K, Ricks-Cord A, Natarajan V,Alieva I, Garcia JG, Verin AD. Microtubule disassembly induces cytoskeletal remodeling and lungvascular barrier dysfunction: role of Rho-dependent mechanisms. J Cell Physiol 2004;201(1):55–70.[PubMed: 15281089]
70. Yazaki A, Tamaru S, Sasaki Y, Komatsu N, Wada H, Shiku H, Nishikawa M. Inhibition by Rho-kinase and protein kinase C of myosin phosphatase is involved in thrombin-induced shape changeof megakaryocytic leukemia cell line UT-7/TPO. Cell Signal 2005;17(3):321–30. [PubMed:15567063]
71. Xiao D, Longo LD, Zhang L. Alpha1-adrenoceptor-mediated phosphorylation of MYPT-1 andCPI-17 in the uterine artery: role of ERK/PKC. Am J Physiol Heart Circ Physiol 2005;288(6):H2828–35. [PubMed: 15665049]
72. Watanabe Y, Faraci FM, Heistad DD. Activation of Rho-associated kinase during augmentedcontraction of the basilar artery to serotonin after subarachnoid hemorrhage. Am J Physiol Heart CircPhysiol 2005;288(6):H2653–8. [PubMed: 15665056]
73. Vijayan KV, Liu Y, Sun W, Ito M, Bray PF. The Pro33 isoform of integrin beta3 enhances outside-in signaling in human platelets by regulating the activation of serine/threonine phosphatases. J BiolChem 2005;280(23):21756–62. [PubMed: 15826939]
74. Lontay B, Kiss A, Gergely P, Hartshorne DJ, Erdodi F. Okadaic acid induces phosphorylation andtranslocation of myosin phosphatase target subunit 1 influencing myosin phosphorylation, stress fiberassembly and cell migration in HepG2 cells. Cell Signal 2005;17(10):1265–75. [PubMed: 16038801]
75. Porter M, Evans MC, Miner AS, Berg KM, Ward KR, Ratz PH. Convergence of Ca2+-desensitizingmechanisms activated by forskolin and phenylephrine pretreatment, but not 8-bromo-cGMP. Am JPhysiol Cell Physiol 2006;290(6):C1552–9. [PubMed: 16421202]
76. Usui H, Inoue R, Tanabe O, Nishito Y, Shimizu M, Hayashi H, Kagamiyama H, Takeda M. Activationof protein phosphatase 2A by cAMP-dependent protein kinase-catalyzed phosphorylation of the 74-kDa B” (delta) regulatory subunit in vitro and identification of the phosphorylation sites. FEBS Lett1998;430(3):312–6. [PubMed: 9688562]
77. Korotchkina LG, Patel MS. Mutagenesis studies of the phosphorylation sites of recombinant humanpyruvate dehydrogenase. Site-specific regulation. J Biol Chem 1995;270(24):14297–304. [PubMed:7782287]
78. Korotchkina LG, Patel MS. Site specificity of four pyruvate dehydrogenase kinase isoenzymes towardthe three phosphorylation sites of human pyruvate dehydrogenase. J Biol Chem 2001;276(40):37223–9. [PubMed: 11486000]
79. Korotchkina LG, Sidhu S, Patel MS. Characterization of testis-specific isoenzyme of human pyruvatedehydrogenase. J Biol Chem 2006;281(14):9688–96. [PubMed: 16436377]
Yang et al. Page 13
J Proteome Res. Author manuscript; available in PMC 2008 November 1.
NIH
-PA Author Manuscript
NIH
-PA Author Manuscript
NIH
-PA Author Manuscript

80. Stefanovic S, Windsor M, Nagata KI, Inagaki M, Wileman T. Vimentin rearrangement during Africanswine fever virus infection involves retrograde transport along microtubules and phosphorylation ofvimentin by calcium calmodulin kinase II. J Virol 2005;79(18):11766–75. [PubMed: 16140754]
81. Tang DD, Bai Y, Gunst SJ. Silencing of p21-activated kinase attenuates vimentin phosphorylationon Ser-56 and reorientation of the vimentin network during stimulation of smooth muscle cells by5-hydroxytryptamine. Biochem J 2005;388(Pt 3):773–83. [PubMed: 15766329]
82. Ermakova S, Choi BY, Choi HS, Kang BS, Bode AM, Dong Z. The intermediate filament proteinvimentin is a new target for epigallocatechin gallate. J Biol Chem 2005;280(17):16882–90. [PubMed:15713670]
83. Tsujimura K, Ogawara M, Takeuchi Y, Imajoh-Ohmi S, Ha MH, Inagaki M. Visualization andfunction of vimentin phosphorylation by cdc2 kinase during mitosis. J Biol Chem 1994;269(49):31097–106. [PubMed: 7983050]
84. Shiromizu T, Goto H, Tomono Y, Bartek J, Totsukawa G, Inoko A, Nakanishi M, Matsumura F,Inagaki M. Regulation of mitotic function of Chk1 through phosphorylation at novel sites by cyclin-dependent kinase 1 (Cdk1). Genes Cells 2006;11(5):477–85. [PubMed: 16629900]
Yang et al. Page 14
J Proteome Res. Author manuscript; available in PMC 2008 November 1.
NIH
-PA Author Manuscript
NIH
-PA Author Manuscript
NIH
-PA Author Manuscript

Figure 1.The data analysis pipeline used for this study. Replicate LC-MS analyses were performed oncontrol and treated samples and accurate mass and time features discovered in each sample.The datasets were aligned to each other to correct for mass measurement and elution time drifts.Similar features from all experiments were grouped together into one cluster if their mass andelution times were similar by using single linkage clustering. As a result a feature master listwas created, with each cluster having an abundance in an experiment equal to the intensity ofthe feature in that experiment that was mapped to the cluster. The abundance profile of featuresin a cluster was used to select those clusters whose features were up-regulated in treated samplesas compared to control samples, after normalization was performed. The m/z and elution timeof these clusters were used to perform targeted LC-MS/MS analyses. Clusters in the masterlist were then aligned and peak matched against peptides identified by LC-MS/MS analysesusing an automated method that controlled the FDR of the process by an extension of the decoydatabase method to include the use of elution time tolerances.
Yang et al. Page 15
J Proteome Res. Author manuscript; available in PMC 2008 November 1.
NIH
-PA Author Manuscript
NIH
-PA Author Manuscript
NIH
-PA Author Manuscript

Figure 2.Elevation of protein phosphorylation in response to calyculin A treatment. Samples treatedwith DMSO vehicle control (0 nM), 10 nM or 20 nM calyculin A were subjected to SDS-PAGEand western blot analysis for phospho-T. The migration of molecular weight standards ismarked.
Yang et al. Page 16
J Proteome Res. Author manuscript; available in PMC 2008 November 1.
NIH
-PA Author Manuscript
NIH
-PA Author Manuscript
NIH
-PA Author Manuscript

Figure 3.Clustergram of peak areas for phosphopeptides inferred as being differentially abundantbetween the four control (labeled C1 to C5) and five treated samples (labeled T1 to T5). Wecan see several different clusters showing different patterns of differential expression.Prominently, we see several clusters showing up-regulation in treated samples in the upper halfof the clustergram, while the lower section shows clusters showing up-regulation in controlsamples.
Yang et al. Page 17
J Proteome Res. Author manuscript; available in PMC 2008 November 1.
NIH
-PA Author Manuscript
NIH
-PA Author Manuscript
NIH
-PA Author Manuscript

Figure 4.Manual confirmation of the MS/MS spectrum for a phosphopeptide derived from EF2.
Yang et al. Page 18
J Proteome Res. Author manuscript; available in PMC 2008 November 1.
NIH
-PA Author Manuscript
NIH
-PA Author Manuscript
NIH
-PA Author Manuscript

Figure 5.Elevation of EF2 phospho-T56 levels in response to calyculin A treatment. Samples fromvehicle control (0 nM) and 10 nM calyculin A treatment were subjected to SDS-PAGE andwestern blot analysis for phospho-T56 EF2 or EF2. GAPDH was monitored as a loadingcontrol. Blots were quantified using fluorescent secondary antibodies and Li-Cor fluorescencebased imaging and the ratio of treated to control showed a 3-fold increase in phospho-T levelsfollowing treatment with 10 nM calyculin A.
Yang et al. Page 19
J Proteome Res. Author manuscript; available in PMC 2008 November 1.
NIH
-PA Author Manuscript
NIH
-PA Author Manuscript
NIH
-PA Author Manuscript

NIH
-PA Author Manuscript
NIH
-PA Author Manuscript
NIH
-PA Author Manuscript
Yang et al. Page 20
TABLE 1Number of phosphopeptides identified in different types of MS analyses.
MS analyses Phosphopeptides Up-regulated phosphopeptides in the treatedsample (Standard t-test/C1T3)
Total 583 145/91Control & Treated Data-dependent analysis 218 38/22
Control targeted analysis total 233 41/13
Treated targeted analysis total 407 118/71
J Proteome Res. Author manuscript; available in PMC 2008 November 1.
NIH
-PA Author Manuscript
NIH
-PA Author Manuscript
NIH
-PA Author Manuscript
Yang et al. Page 21TA
BLE
2Ex
ampl
es o
f Pho
spho
pept
ides
Exh
ibiti
ng C
alyc
ulin
A-in
duce
d C
hang
es
SWIS
S/PR
OT
Prot
ein
nam
ePh
osph
opep
tide
T/C
#ph
osph
o-re
sidu
eph
osph
o-re
sidu
e id
entif
ied
prev
ious
ly*
Prot
ein
phos
phor
ylat
ion
incr
ease
d by
PPP
enzy
me
bloc
kers
O43
823
A K
inas
e A
ncho
r Pro
tein
(AK
AP)
8V
DS
EGD
FS**
0.2
S323
----
S328
10Q
8IZP
0A
bl-I
nter
acto
r 1LG
SQH
S PG
R*
C1T
3S2
24--
--Q
0151
8A
deny
lyl c
ycla
se-a
ssoc
iate
dpr
otei
n 1
SGPK
PFSA
PKPQ
TS P
SPK
*3.
7S3
07--
--
SGPK
PFSA
PKPQ
T S**
1.5
T306
--S3
07SG
PKPF
SAPK
PQTS
PS**
0.8
S307
S309
-Q
1311
2C
hrom
atin
Ass
embl
y Fa
ctor
1Su
buni
t BTQ
DPS
S PG
TT**
2.0
S429
10Y
es
T433
--Q
1424
7C
orta
ctin
AK
TQT
PPV
SPA
PQPT
EER
LPSS
**17
.1T4
0110
--S4
1810
, 37
TQT
PPV
SPA
PQPT
EER
LPSS
PVY
**10
.1T4
0110
Y42
139
, 40,
51,
56
LPSS
PV
YED
AA
SFK
*C
1T3
S418
10P0
6493
Cyc
lin-d
epen
dent
Pro
tein
Kin
ase
1IE
KIG
EGT
Y**
0.4
T14
57-5
9Y
es
Y15
57-5
9IE
KIG
EGT
Y**
0.5
T14
Y15
P188
87D
NA
Rep
air P
rote
in X
RC
C1
TKPT
QA
AG
PS S
PQK
PPTP
EET**
15.5
S446
----
T457
--Q
9NR
Y4
Glu
coco
rtico
id R
ecep
tor D
NA
Bin
ding
Fac
tor 1
TSFS
VG
S D
DEL
GPI
R*
C1T
3S1
179
10--
P096
51H
eter
ogen
ous N
ucle
arR
ibon
ucle
opro
tein
A1
NQ
GG
YG
GSS
SS S
SYG
SGR
*5.
7S3
6260
Yes
SES
PKEP
EQLR
*5.
8S5
45 (m
ouse
orth
olog
)P6
1978
Het
erog
enou
s Nuc
lear
Rib
onuc
leop
rote
in K
RD
YD
DM
S PR
*42
.0S2
847,
10,
61,
62
Yes
DY
DD
MS
PR*
171
S284
Q8W
UF5
Inhi
bito
r of A
popt
osis
Stim
ulat
ing
Prot
ein
of P
53A
GS
PRG
S**C
3T1
S183
----
S187
O60
716
p120
Cat
enin
HY
EDG
YPG
GSD
NY
GS
LSR
*C
1T3
S230
----
Q9B
TU6
Phos
phat
idyl
inos
itol 4
Kin
ase
Type
IISS
S ES
YTQ
SFQ
SR*
10.7
S462
10--
VA
AA
AG
SGPS
PPG
S**1.
9S4
7--
S51
--P2
0020
Plas
ma
mem
bran
e C
a2+
trans
porti
ng A
TPas
e 1
IED
S EP
HIP
LID
DT**
8.3
S119
3--
--
T120
3--
Q01
814
Plas
ma
mem
bran
e C
a2+
trans
porti
ng A
TPas
e 2
SATS
SSPG
S PI
HSL
ETS**
C1T
3S1
234
----
S124
2--
SATS
SSPG
SPIH
SLET
S L*
C1T
3S1
242
J Proteome Res. Author manuscript; available in PMC 2008 November 1.

NIH
-PA Author Manuscript
NIH
-PA Author Manuscript
NIH
-PA Author Manuscript
Yang et al. Page 22
SWIS
S/PR
OT
Prot
ein
nam
ePh
osph
opep
tide
T/C
#ph
osph
o-re
sidu
eph
osph
o-re
sidu
e id
entif
ied
prev
ious
ly*
Prot
ein
phos
phor
ylat
ion
incr
ease
d by
PPP
enzy
me
bloc
kers
Q15
149
Plec
tinSS
S V
GSS
SSY
PISP
AV
SR*
2.9
S438
67,
10
Yes
O14
737
Prog
ram
med
Cel
l Dea
thPr
otei
n 5
VM
DS
DED
DD
Y*
7.8
S118
10--
RK
VM
DS
DED
DD
Y*
7.7
S118
O14
974
Prot
ein
phos
phat
ase
1R
egul
ator
y su
buni
t 12A
RST
QG
VTL
TDLQ
EAEK
*C
1T3
T696
63-7
5Y
es
Q14
738
Prot
ein
Phos
phat
ase
2A, 5
6K
da re
gula
tory
subu
nit,
delta
isof
orm
PS*
NS*
T* P
PPTQ
LSK
IKY
* S*
GG
PQIV
KC
1T3
S60
76--
S62
--T6
3--
Y74
--S7
576
P298
03Py
ruva
te D
ehyd
roge
nase
E1
com
pone
nt a
lpha
subu
nit
Y H
GH
SMSD
PGV
S**1.
7Y
289
40
S300
77-7
9P4
6060
Ran
GTP
ase
Act
ivat
ing
Prot
ein
1IL
DPN
TGEP
APV
LS S
PPPA
DV
STFL
AFP
S**C
1T3
S427
/S42
8†10
, 55
(for
S42
8)--
S442
10, 5
5Q
1415
5R
ho G
uani
ne N
ucle
otid
eEx
chan
ge F
acto
r 7M
S G
FIY
QG
KLP
TTG
MTI
TK*
C1T
3S3
40--
--
Q8I
WW
6R
ho-G
TPas
e A
ctiv
atin
gPr
otei
n 12
ATT
PPN
QG
RPD
S**0.
5T2
3145
(mou
se o
rthol
og),
52--
S240
45(m
ouse
orth
olog
), 52
P172
75Tr
ansc
riptio
n Fa
ctor
JunB
SRD
AT
PPV
S**3.
2T2
55--
--S2
5910
P086
70V
imen
tinS
VSS
SSY
R*
80.7
S4--
Yes
DG
QV
INET
S Q
HH
DD
LE*
11.9
S458
--SL
YA
SS P
GG
VY
ATR
*30
.7S5
526
,55,
80-
84
† site
may
be
one
of tw
o se
quen
tial r
esid
ues
# C1T
3-pe
ptid
e ob
serv
ed ≤
1 ti
me
in c
ontro
l sam
ple,
but
≥ 3
tim
es in
trea
ted
sam
ple
C3T
1- p
eptid
e ob
serv
ed ≥
3 ti
mes
in c
ontro
l sam
ple,
but
≤ 1
tim
e in
trea
ted
sam
ple
* indi
cate
s no
repo
rt, n
umbe
r ind
icat
es re
fere
nce
for r
esid
ues p
revi
ousl
y id
entif
ied
J Proteome Res. Author manuscript; available in PMC 2008 November 1.