Characterizations of long-run producer optima and the short-run

Facultad de Ciencias Económicas y EmpresarialesUniversidad de Navarra
Working Paper nº 08/04
Seasonal and long run fractional integration in theIndustrial Production Index of some Latin American
countries
Luis Alberiko Gil-Alana and Bertrand Candelon
Facultad de Ciencias Económicas y EmpresarialesUniversidad de Navarra
Seasonal and long run fractional integration in the Industrial Production Index of someLatin American countriesLuis A. Gil-Alana and Bertrand CandelonWorking Paper No.08/04April 2004JEL Codes: C15; C22.
ABSTRACT
In this article we propose a new approach that permits us to simultaneously test unit andfractional roots at the long run and the seasonal frequencies. We examine the industrialproduction indexes in four Latin American countries (Brazil, Argentina, Colombia andMexico), using new statistical tools based on seasonal and non-seasonal long memoryprocesses. Results show that the root at the long run or zero frequency plays a much moreimportant role than the seasonal one. Nevertheless, in the cases of Brazil and Argentina acomponent of long memory behaviour is also present at the seasonal structure, indicatingthat shocks modify the seasonal structure for a long period. Policy makers should thus payattention to this result in choosing the optimal economic policy.
Luis A. Gil-AlanaUniversidad de NavarraDepartamento de Economía31080 [email protected]

1. Introduction
The recent economic literature has stressed two major characteristics of macroeconomic
series which has been used by academics or economic advisers to better understand the
consequences of economic policies. First, since the seminal paper of Nelson and Plosser
(1982), it appears that almost all series possess a unit root. The consequences of the presence
of a stochastic trend are major for the modelling and the decision of economic policies, as a
shock affecting the series will be persistent and will never die out. The second stylized fact
is the presence of seasonal components. Traditionally, seasonal fluctuations have been
considered as a nuisance that shadows the most important components of the series (namely
the growth and the business cyclical components, e.g., Burns and Mitchell, 1946). They are
often removed beforehand via seasonal adjustment procedures. Thus most of the empirical
works considers simply seasonally adjusted data, without paying attention to the role of
seasonality. A lot of papers have stressed on one of these two features, but only a few have
been concerned with the linkages between the seasonal and the long run structures.
Hasza and Fuller (1982) have shown that seasonal adjustment biases traditional unit root
tests. Such errors are very difficult to measure and so to correct by systematic procedures.
Nevertheless, the consequences for political advisors are strong as the persistence of shocks
are not correctly determined, leading to misperception in the consequences of economic
policies. Moreover, seasonal adjustment procedures do not generally take into account the
possible fractional roots at seasonal frequencies, leading thus to erroneous conclusions about
its behaviour. For example, a structural economic policy (aiming at modifying the long run
behaviour) may induce a persistent modification of the seasonal structure, ruling out the
initial objectives.
In this article we develop a new framework allowing for unit and fractional roots
simultaneously at zero (long run) and the seasonal frequencies. It constitutes an alternative
to tests for (fractional) unit roots without using any prior seasonal adjustment. To illustrate
our theoretical concept, we analyse the monthly structure of several Industrial Production
Indexes (IPI) in some Latin American countries. The results suggest that the series can be
well characterized in terms of I(d) processes with roots at both the zero and the seasonal
(monthly) frequencies. The structure of the paper is as follows: Section 2 briefly describes a
model that incorporates seasonal and non-seasonal roots. Section 3 presents a version of the
tests of Robinson (1994) that permits us to test this type of model. In Section 4, the tests are
applied to IPI series, while Section 5 contains some concluding comments.
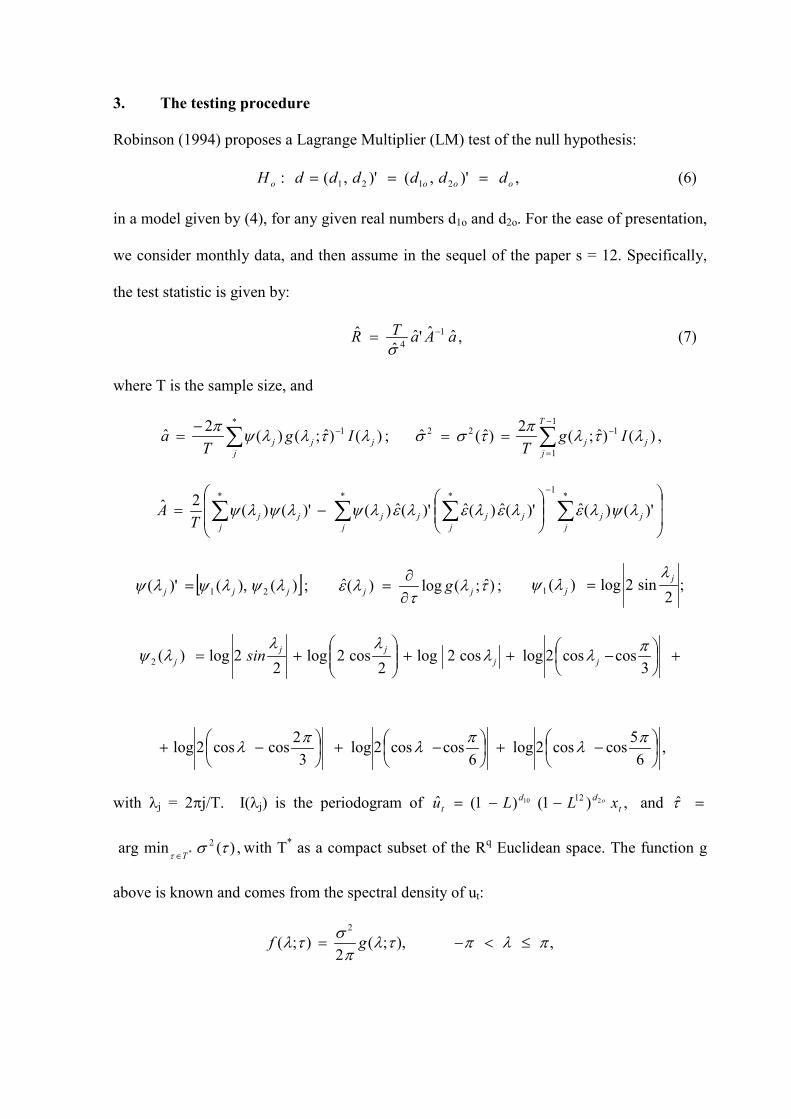
2. A model with seasonal and non-seasonal unit and fractional roots
It is a well-known fact that many time series contain important seasonal components and
seasonal first differences is the easiest way to remove the seasonal component. Dickey,
Hasza and Fuller (DHF, 1984); Hylleberg, Engle, Granger and Yoo (HEGY, 1990),
Beaulieu and Miron (1993), Tam and Reinsel (1997), amongst others proposed test statistics
to eliminate the seasonal unit roots in raw time series. Thus, for example, if xt is the time
series we observe, with a seasonal changing pattern, we can consider the model,
,...,2,1,)1( ��� tuxL tts (1)
where Ls is the seasonal lag operator (Lsxt = xt-s); s is the number of time periods in a year,
and where ut is an I(0) process, defined as a covariance stationary process with positive and
finite spectral density function at any frequency of the spectrum. Note that the polynomial in
(1) can be decomposed into:
)()1()...1()1( 12 LSLLLLL s�������
� . (2)
That is, the seasonal difference operator can be broken down into the product of the first
difference operator and the moving-average filter S(L), containing further roots of modulus
unity. Therefore, the root at the zero frequency appears as a component of the seasonal

polynomial in (1). However, there are many cases where this frequency plays a major role,
describing not only part of the seasonal structure but also the trending stochastic behaviour
of the series. In fact, Hasza and Fuller (1982) consider the model:
,...,2,1,)1()1( ���� tuxLL tts (3)
where the first polynomial in (3) represents a stochastic trend, while the second indicates a
seasonal structure. In their unit-root test, they suggest to estimate the equations:
,13211 tststtt uxxxx ��������
���
,)( 11211 tststtt uxxxx ��������
���
and then to test the restrictions [�1, �2, �3] = [1, 1, -1] or [�1, �2] = [1, 1] with a standard F-
statistic and using the proper tabulated distributions. Dickey and Pantula (1987) pointed out,
however, the inappropriateness of such tests since they are two sided in nature whereas the
alternative of stationarity is one-sided.
In this article we generalize the model in the above unit-root test to allow for fractional roots
at zero and the seasonal frequencies. Besides, using the LM-based testing procedure
developed by Robinson (1994), the tests are the most powerful ones when directed against
the appropriate (fractional) alternatives, and due to the use of the latter alternatives, free of
the Dickey and Pantula’s (1987) criticism. Robinson’s (1994) tests have also the advantage
of being pivotal, and so finite-sample size distortions can easily be corrected by re-sampling
methods such as bootstrap (see, e.g., Candelon and Gil-Alana, 2003).
Hence, model (3) can be viewed as a particular case of a much more general type of long
memory processes, allowing fractional roots at zero and the seasonal frequencies of form:
...,,2,1,)1()1( 21���� tuxLL tt
dsd (4)
for given real values d1 and d2. Here, the first fractional polynomial can be expressed in
terms of its binomial expansion such that for all real d1,

,...2
)1(1)1()1( 2111
0
11 ��
�������
����
�� �
�
�
LddLdLjd
L jj
j
d
and similarly for the seasonal structure,
....2
)1(1)1()1( 2222
0
22 ��
�������
����
�� �
�
�
sssjj
j
ds LddLdLjd
L
Clearly, imposing d1 = 0 and d2 = 1, (4) becomes the seasonal unit root model (1) proposed
by Hasza and Fuller (1982), and, imposing d1 = d2 = 1, we obtain (3). Let us consider first
the case of d2 = 0. In this context, if d1 > 0, xt is said to be a long memory process (at the
long run frequency), so-called because of the strong association between observations
widely separated in time. In such a case, the series does not exhibit seasonal movement. The
long run effect of shocks is then crucial for the global dynamic of the process. Similarly,
imposing d1 = 0, the model in (4) becomes:
,...,2,1,)1( 2��� tuxL tt
ds (5)
and if d2 > 0, it is called a seasonally fractionally integrated (or seasonal long memory)
process. In such a case, the seasonal dynamics are of major importance for the behaviour of
the series. Extreme cases appear when d2 > 1. Several studies have explored this topic (see
Porter-Hudak (1990) and Gil-Alana and Robinson (2001) inter alii). However, there are not
so far empirical works that simultaneously test the degrees of integration at zero and the
seasonal frequencies and, in that respect, the present paper considers the general model (4),
allowing for simultaneous seasonal and non-seasonal unit and fractional roots, at the same
time, trying of being an alternative credible approach to the traditional models based on (1)
or (3). This approach constitutes a new framework for empirical analyses with seasonal data.
It leads to an unbiased estimation of the degree of the seasonal and the long run fractional
integration. Thus economics advisers are able to discriminate the optimal economic policy.
3. The testing procedure
Robinson (1994) proposes a Lagrange Multiplier (LM) test of the null hypothesis:
,)',()',(: 2121 oooo ddddddH ��� (6)
in a model given by (4), for any given real numbers d1o and d2o. For the ease of presentation,
we consider monthly data, and then assume in the sequel of the paper s = 12. Specifically,
the test statistic is given by:
,ˆˆ'ˆˆ
ˆ 14 aAaTR �
�
�
(7)
where T is the sample size, and
��
�
�
*1 )()ˆ;()(2ˆ
jjjj Ig
Ta �����
� ; ��
�
�
��
1
1
122 )()ˆ;(2)ˆ(ˆT
jjj Ig
T���
���� ,
��
�
�
��
�
�
���
����
��� � ���
�
* *1
**
')()(ˆ)'(ˆ)(ˆ)'(ˆ)()'()(2ˆj j
jjj
jjjjj
jjTA ����������������
� �)(),()'( 21 jjj ������ � ; )ˆ;(log)(ˆ ���
�� jj g�
�� ; ;
2sin2log)(1
jj
��� �
���
���
������
�
����
��
3coscos2logcos2log
2cos2log
22log)(2
���
���� jj
jjj sin
,6
5coscos2log6
coscos2log3
2coscos2log ��
���
����
�
���
����
�
���
���
��
��
��
with �j = 2�j/T. I(�j) is the periodogram of ,)1()1(ˆ 210 12t
ddt xLLu o
��� and ��̂
,)(minarg 2* ��
� T� with T* as a compact subset of the Rq Euclidean space. The function g
above is known and comes from the spectral density of ut:
,),;(2
);(2
������
��� ���� gf

and the summation on * in the above expressions refers to the discrete bounded frequencies
�j.
Based on Ho (6), Robinson (1994) established that, under certain regularity conditions:
.,ˆ 22 ��� TasR d � (8)
Thus, unlike other procedures, we are in a classical large-sample testing situation by reasons
described in Robinson (1994), who also showed that the tests are efficient in the Pitman
sense against local departures from the null. A test of (6) will reject Ho against the
alternative Ha: d � do if R̂ > 2,2 �
� , where Prob ( 2,2 �
� > 22� ) = �.
4. An application to industrial production index in Latin American countries
The time series data used in this section correspond to the log-transformation of the monthly
structure of the Industrial Production Indeces (IPI) series in Brazil, Mexico, Colombia and
Argentina, obtained from the IFS database of the International Monetary Fund. These series
are seasonally unadjusted. The starting date is January-1980 for Brazil and Mexico, January-
1985 for Argentina, and January-1986 for Colombia, and all series end in November-2001.
(Insert Figures 1 – 3 about here)
Figure 1 contains plots of the original series with their corresponding correlograms
and periodograms. The series have a nonstationary appearance and the correlograms clearly
show a seasonal pattern, especially for Brazil and Colombia, though a visual inspection at
the periodograms also indicates the importance of the root at the long run frequency. Similar
plots for the first differenced data are given in Figure 2, and the seasonal component,
revealed by the 11 peaks in the periodogram, becomes apparent in all cases. Finally, the
plots of first and first seasonal (monthly) differences are displayed in Figure 3, and the
correlograms and the periodograms in this figure suggest that the series might now be
overdifferenced with respect to both, the zero and the seasonal frequencies.

Denoting the time series by xt, we employ throughout model (4), testing Ho (6) for values
d1o, d2o = 0, (0.25), 2, including thus tests for a unit root exclusively at the long run (zero
frequency), (d1o = 1, d2o = 0); tests for seasonal unit roots, (d1o = 0, d2o = 1); unit and
seasonal unit roots, (d1o = d2o = 1); as well as other fractionally integrated possibilities. We
assume that ut is white noise, and though not reported in the paper, we also consider the case
of autocorrelated disturbances, in particular, AR(1) and seasonally monthly AR(1)
processes.
The test statistic reported across Table 1 is the one given by R̂ in (7). However,
instead of presenting the results for all values of d1o and d2o, we just report across the tables
those cases where we find at least one non-rejection value for each country. We observe that
Ho (6) cannot be rejected for any series when (d1o, d2o) = (0.00, 1.00), implying that a
seasonal unit root with white noise ut may be a plausible way of modelling the series.
However, apart from this case, all the remaining non-rejection values take place when d1o =
1, 1.25, 1.50 and 1.75 with d2o = 0 or 0.25. Thus, we observe higher degrees of integration at
the long run frequency than at the seasonal ones. Some differences appear across countries.
More non-rejections are observed for Brazil and Argentina than for Colombia and Mexico.
In fact, Ho (6) cannot be rejected when d1o = 1, 1.25, 1.50 and 1.75, with d2o = 0.25 for
Brazil and Argentina, these hypotheses being rejected for the remaining two countries. Thus,
it turns out that models with fractional roots at seasonal frequencies are more rejected for
Colombia and Mexico than for Brazil and Argentina, implying that the seasonal structure
appears more important for these two later countries. Such a result indicates that seasonal
shocks are more persistent in Brazil and Argentina than in Mexico or Colombia.
(Insert Tables 1 and Figure 4 about here)
In order to have a more precise view about the message contained in this table, we have
performed the same tests, but this time using increments for d1o and d2o of 0.01. Figure 4

displays the non-rejection regions for each country. We see that d1o is in all cases higher
than d2o, stressing once more the importance of the root at zero over the seasonal ones.
Also, the fact that d1 is in all cases higher than 0.5 indicates that the component
corresponding to the zero frequency is clearly nonstationary. On the other hand, we observe
that d2 is always strictly smaller than 0.5, suggesting that, if the long run trend is considered,
the seasonal structure is stationary though with a component of long memory behaviour. It
should also be noted that though the tests are unable to reject the null when d2o = 0, i.e., with
no seasonal fractional roots, these hypotheses are in all cases “less clearly non-rejected”1
than when d2o is positive, suggesting that a component of long memory is present in relation
with the seasonal part.
These results have thus strong implications in terms of economic policy and planning
inference. A particular shock will simultaneously affect the seasonal and the long run
structure of the IPI. Nevertheless, shocks will be mean reverting for the seasonal structure
(i.e. their effects disappear in the long run), whereas the effect will persist on the long-run
structure. Thus, a structural economic policy, aiming at modifying the long run properties of
the IPI, can be run out without paying too much attention to the effects on the seasonal
structure, as they will quickly die out. Nevertheless, this policy advice has to be modulated
for Brazil and Argentina, where the seasonal fractional root is found to lie between 0.3 and
0.6. In these cases, even if shocks are shown to be mean reverting for the seasonal structure,
they posses long memory. It means that an economic policy will have a long run effect and
will take time before dying out. Hence, if a structural economic policy is performed in Brazil
and Argentina, it will induce a modification in the seasonal structure of the IPI. These
effects will not be permanent (the unit-root hypothesis at seasonal frequencies is rejected)
but very long lasting. Particular attention should thus be paid to seasonal effects of economic
policies in Brazil and Argentina, which is not the case for Colombia and Mexico.
1 By ‘less clearly non-rejected’, we mean that the value of the test statistic is closer to the rejection values.

We also performed the tests for the case of autocorrelated disturbances and the
results were similar in both cases and also similar to those given in Table 1. Thus, apart from
the case of (d1o, d2o) = (0, 1), all the other non-rejection values take place when d1o is
between 0.75 and 1.75 with d2o = 0 or 0.25.
The results presented across this paper present some ambiguous conclusions. Thus,
on the one hand, the seasonal unit root model cannot be rejected for any series and any type
of disturbances. On the other hand, most of the non-rejections occur when d1o is between
0.75 and 1.75 with d2o = 0 or 0.25. This may be explained by the fact that the tests of
Robinson (1994), when integer values of d1o and d2o are entertained, have low power to
detect fractional models. In fact, we made several Monte Carlo experiments, conducting the
tests with (d1o, d2o) = (0, 1) on fractional series with d1 = 1, 1.25, 1.50 and 1.75, and d2 = 0
and 0.25, and the rejection frequencies of the tests never exceeded 0.400. On the other hand,
performing the tests with d1o � [0.75, 1.75] and d2o � [0, 0.25] on purely seasonal unit-root
models, the rejection probabilities were practically 1 in all cases for series of length
considered here. In view of this, we can conclude by saying that the non-rejections obtained
for the seasonal unit-root model are perhaps spurious and due to the low power of this
version of the tests for testing integer differences when fractional models are entertained.
4. Concluding comments
In this article we have examined the monthly structure of the log-transformation of the
Industrial Production Indexes in several Latin American countries by means of a version of
the tests of Robinson (1994) that permits us to simultaneously test the degrees of integration
at zero and the seasonal monthly frequencies. These tests have standard null and local limit
distributions and several experiments conducted via Monte Carlo show that the tests perform
relatively well in finite samples. The results show that the long run or zero frequency plays a

crucial role when modelling the time series behaviour of the series, with an order of
integration ranging between 0.75 and 1.75, though the seasonal root should also be
incorporated in the model, with an order of integration ranging between 0 and 0.5 for
Argentina and Brazil, and slightly smaller for the other two countries. The presence of the
fractional seasonal roots will affect the conclusions obtained by classical unit-root tests.
Policy advices can be drawn from this model as our new framework helps to better
characterize the mean reverting properties of the series at seasonal and zero frequencies.
Applying it to the IPI in four Latin American countries, it turns out that long run effects of
shocks might not be mean reverting, indicating the importance of long run effect of
economic policies. It is also noticeable that seasonal fluctuations have shorter memory in
Colombia and Mexico than in Brazil and Argentina. For these last two countries, policy
makers should pay particular attention at the seasonal effect of shocks, as they take time
before dying out.

References
Beaulieu, J.J. and J.A. Miron, 1993, Seasonal unit roots in aggregate U.S. data, Journal of
Econometrics 55, 305-328.
Burns, A.F. and W.C. Mitchell, 1946, Measuring business cycles, National Bureau of
Economic Research, New York, NY.
Candelon, B. and L.A. Gil-Alana, 2003, On finite sample critical values of the tests of
Robinson (1994), Journal of Statistical Computation and Simulation, 73(6), 445-464.
Dickey, D. A., D. P. Hasza and W. A. Fuller, 1984, Testing for unit roots in seasonal time
series, Journal of the American Statistical Association 79, 355-367.
Dickey, D.A. and S.G. Pantula, 1987, Determining the order of differencing in
autoregressive processes, Journal of Business and Economic Statistics 5, 455-461.
Gil-Alana, L.A. and P.M. Robinson, 2001, Testing seasonal fractional integration in the UK
and Japanese consumption and income, Journal of Applied Econometrics 16, 95-114.
Hasza, D.P. and W.A. Fuller, 1982, Testing for nonstationary parameter specifications in
seasonal time series models, Annals of Statistics 10, 1209-1216.
Hylleberg, S., R.F. Engle, C.W.J. Granger and B.S. Yoo, 1990, Seasonal integration and
cointegration, Journal of Econometrics 44, 215-238.
Porter-Hudak, S., 1990, An application of the seasonal fractionally differenced model to the
monetary aggregates, Journal of the American Statistical Association 85 (410), 338-344.
Robinson, P.M., 1994, Efficient tests of nonstationary hypotheses, Journal of the American
Statistical Association 89, 1420-1437.
Tam, W. and G. C. Reimsel, 1997, Tests for seasonal moving average unit root in ARIMA
models, Journal of the American Statistical Association 92, 725-738.

FIGURE 1Log of the Industrial Production Indexes (IPI), with their corresponding correlograms and periodograms
BRAZIL Correlogram Periodogram
ARGENTINA Correlogram Periodogram
MEXICO Correlogram Periodogram
COLOMBIA Correlogram Periodogram
The large sample standard error under the null hypothesis of no autocorrelation is 1/�T or roughly 0.07 for series oflength considered here.

FIGURE 2First differences of the IPI, with their corresponding correlograms and periodograms
(1 – L) BRAZIL Correlogram Periodogram
(1 – L) ARGENTINA Correlogram Periodogram
(1 – L) MEXICO Correlogram Periodogram
(1 – L) COLOMBIA Correlogram Periodogram
The large sample standard error under the null hypothesis of no autocorrelation is 1/�T or roughly 0.07 for series oflength considered here.

FIGURE 3First and first seasonal differences of the IPI, with their corresponding correlograms and periodograms
(1 – L) (1 – L12) BRAZIL Correlogram Periodogram
(1 – L) (1 – L12) ARGENTINA Correlogram Periodogram
(1 – L) (1 – L12) MEXICO Correlogram Periodogram
(1 – L) (1 – L12) COLOMBIA Correlogram Periodogram
The large sample standard error under the null hypothesis of no autocorrelation is 1/�T or roughly 0.07 for series oflength considered here.

TABLE 1
Testing Ho (6) in (4) with the tests of Robinson (1994) and white noise disturbances
d1o d2o BRASIL ARGENTINA MEXICO COLOMBIA
0.00 1.00 1.011 0.646 1.213 3.325 0.75 0.00 0.358 0.444 0.723 1.936 0.75 0.25 4.105 3.330 5.751 5.528 1.00 0.00 0.527 0.656 1.276 2.728 1.00 0.25 4.905 4.026 8.089 8.119 1.25 0.00 0.348 0.653 1.418 2.835 1.25 0.25 4.874 4.232 10.943 9.004 1.50 0.00 0.183 0.555 1.389 2.560 1.50 0.25 4.343 4.052 8.885 13.243 1.75 0.00 0.242 0.438 1.320 2.210 1.75 0.25 3.365 3.655 10.045 5.297 1.75 0.50 7.654 5.964 13.214 11.345
In bold, the non-rejection values at the 5% significance level.
FIGURE 4
Regions of values of d1o and d2o where Ho (6) cannot be rejected at the 5% significance level
BRAZIL ARGENTINA
0
0,25
0,5
0,75
1
0 0,5 1 1,5 2
d1
d2
0
0,25
0,5
0,75
1
0 0,5 1 1,5 2
d1
d2
MEXICO COLOMBIA
0
0,25
0,5
0,75
1
0 0,5 1 1,5 2
d1
d2
0
0,25
0,5
0,75
1
0 0,5 1 1,5 2
d1
d2
Copyright © 2022 FDOKUMEN