Seasonal and interannual variability of the mineral dust cycle under present and glacial climate...
19
Seasonal and interannual variability of the mineral dust cycle under present and glacial climate conditions M. Werner, 1,2 I. Tegen, 1 S. P. Harrison, 1 K. E. Kohfeld, 1 I. C. Prentice, 1 Y. Balkanski, 3 H. Rodhe, 4 and C. Roelandt 1,5 Received 23 March 2002; revised 17 July 2002; accepted 17 July 2002; published 18 December 2002. [1] We present simulations of the dust cycle during present and glacial climate states, using a model, which explicitly simulates the control of dust emissions as a function of seasonal and interannual changes in vegetation cover. The model produces lower absolute amounts of dust emissions and deposition than previous simulations of the Last Glacial Maximum (LGM) dust cycle. However, the simulated 2- to 3-fold increase in emissions and deposition at the LGM compared to today, is in agreement with marine- and ice-core observations, and consistent with previous simulations. The mean changes are accompanied by a prolongation of the length of the season of dust emissions in most source regions. The increase is most pronounced in Asia, where LGM dust emissions are high throughout the winter, spring and summer rather than occurring primarily in spring as they do today. Changes in the seasonality of dust emissions, and hence atmospheric loading, interact with changes in the seasonality of precipitation, and hence of the relative importance of wet and dry deposition processes at high northern latitudes. As a result, simulated dust deposition rates in the high northern latitudes show high interannual variability. Our results suggest that the high dust concentration variability shown by the Greenland ice core records during the LGM is a consequence of changes in atmospheric circulation and precipitation locally rather than a result of changes in the variability of dust emissions. INDEX TERMS: 0305 Atmospheric Composition and Structure: Aerosols and particles (0345, 4801); 0315 Atmospheric Composition and Structure: Biosphere/atmosphere interactions; 1615 Global Change: Biogeochemical processes (4805); 3319 Meteorology and Atmospheric Dynamics: General circulation; 3344 Meteorology and Atmospheric Dynamics: Paleoclimatology; KEYWORDS: dust, mineral aerosol, glacial climate, GCM simulation, LGM, GRIP/GISP ice cores Citation: Werner, M., I. Tegen, S. P. Harrison, K. E. Kohfeld, I. C. Prentice, Y. Balkanski, H. Rodhe, and C. Roelandt, Seasonal and interannual variability of the mineral dust cycle under present and glacial climate conditions, J. Geophys. Res., 107(D24), 4744, doi:10.1029/2002JD002365, 2002. 1. Introduction [2] Marine, terrestrial and ice-core records indicate that the Last Glacial Maximum (LGM, approximately 21,000 calendar years B.P.) was characterized by a more active dust cycle, with rates of mineral dust deposition approximately 2 – 5 times greater than today in the tropics and midlatitudes, and up to 20 times greater than today in polar regions [see Kohfeld and Harrison, 2001, and references therein]. Initial attempts to simulate these changes as a direct consequence of the glacial climate, and in particular increased wind speeds, reduced strength of the hydrological cycle and changes in dust transport pathways brought about by atmospheric cir- culation changes, could account for only a small part of the observed strengthening of the dust cycle at the LGM [see, e.g., Joussaume, 1990; Genthon and Armengaud, 1995]. More recent simulations have reproduced both the overall magnitude and the large-scale spatial patterns of the LGM dust cycle by taking into account long-term (centennial to millennial scale) changes in dust source areas as a conse- quence of climatically induced changes in soil hydrology [e.g., Andersen et al., 1998] and vegetation [e.g., Mahowald et al., 1999]. Indeed, Mahowald et al. [1999] suggested that these changes in dust source areas were the dominant cause of the strengthening of the dust cycle at the LGM. [3] The modern dust cycle is characterized by high short- term (interannual to interdecadal) variability in both emis- sions [e.g., Middleton and Goudie, 2001] and deposition [Pye and Zhou, 1989]. High-resolution ice-core records from both Greenland and Antarctic [Steffensen, 1988; Taylor et al., 1993; Hansson, 1994; Ram and Koenig, 1997; Ram et al., 1997; Fuhrer et al., 1999] suggest that the increased average dust concentration in ice cores at the JOURNAL OF GEOPHYSICAL RESEARCH, VOL. 107, NO. D24, 4744, doi:10.1029/2002JD002365, 2002 1 Max-Planck-Institute for Biogeochemistry, Jena, Germany. 2 Formerly at Department of Meteorology, Stockholm University, Stockholm, Sweden. 3 Laboratoire des Sciences du Climat et de l’Environnement, U.M.R. CEA-CNRS, Gif-sur-Yvette, France. 4 Department of Meteorology, Stockholm University, Stockholm, Sweden. 5 Now at Department of Geography, Universite ´ Catholique de Louvain, Louvain-la-Neuve, Belgium. Copyright 2002 by the American Geophysical Union. 0148-0227/03/2002JD002365$09.00 AAC 2 - 1
Transcript of Seasonal and interannual variability of the mineral dust cycle under present and glacial climate...
Seasonal and interannual variability of the mineral dust cycle
under present and glacial climate conditions
M. Werner,1,2 I. Tegen,1 S. P. Harrison,1 K. E. Kohfeld,1 I. C. Prentice,1 Y. Balkanski,3
H. Rodhe,4 and C. Roelandt1,5
Received 23 March 2002; revised 17 July 2002; accepted 17 July 2002; published 18 December 2002.
[1] We present simulations of the dust cycle during present and glacial climate states,using a model, which explicitly simulates the control of dust emissions as a function ofseasonal and interannual changes in vegetation cover. The model produces lower absoluteamounts of dust emissions and deposition than previous simulations of the LastGlacial Maximum (LGM) dust cycle. However, the simulated 2- to 3-fold increase inemissions and deposition at the LGM compared to today, is in agreement with marine- andice-core observations, and consistent with previous simulations. The mean changes areaccompanied by a prolongation of the length of the season of dust emissions in mostsource regions. The increase is most pronounced in Asia, where LGM dust emissions arehigh throughout the winter, spring and summer rather than occurring primarily in spring asthey do today. Changes in the seasonality of dust emissions, and hence atmosphericloading, interact with changes in the seasonality of precipitation, and hence of the relativeimportance of wet and dry deposition processes at high northern latitudes. As a result,simulated dust deposition rates in the high northern latitudes show high interannualvariability. Our results suggest that the high dust concentration variability shown by theGreenland ice core records during the LGM is a consequence of changes in atmosphericcirculation and precipitation locally rather than a result of changes in the variability ofdust emissions. INDEX TERMS: 0305 Atmospheric Composition and Structure: Aerosols and particles
(0345, 4801); 0315 Atmospheric Composition and Structure: Biosphere/atmosphere interactions; 1615 Global
Change: Biogeochemical processes (4805); 3319 Meteorology and Atmospheric Dynamics: General
circulation; 3344 Meteorology and Atmospheric Dynamics: Paleoclimatology; KEYWORDS: dust, mineral
aerosol, glacial climate, GCM simulation, LGM, GRIP/GISP ice cores
Citation: Werner, M., I. Tegen, S. P. Harrison, K. E. Kohfeld, I. C. Prentice, Y. Balkanski, H. Rodhe, and C. Roelandt, Seasonal and
interannual variability of the mineral dust cycle under present and glacial climate conditions, J. Geophys. Res., 107(D24), 4744,doi:10.1029/2002JD002365, 2002.
1. Introduction
[2] Marine, terrestrial and ice-core records indicate thatthe Last Glacial Maximum (LGM, approximately 21,000calendar years B.P.) was characterized by a more active dustcycle, with rates of mineral dust deposition approximately2–5 times greater than today in the tropics and midlatitudes,and up to 20 times greater than today in polar regions [seeKohfeld and Harrison, 2001, and references therein]. Initialattempts to simulate these changes as a direct consequence ofthe glacial climate, and in particular increased wind speeds,
reduced strength of the hydrological cycle and changes indust transport pathways brought about by atmospheric cir-culation changes, could account for only a small part of theobserved strengthening of the dust cycle at the LGM [see,e.g., Joussaume, 1990; Genthon and Armengaud, 1995].More recent simulations have reproduced both the overallmagnitude and the large-scale spatial patterns of the LGMdust cycle by taking into account long-term (centennial tomillennial scale) changes in dust source areas as a conse-quence of climatically induced changes in soil hydrology[e.g., Andersen et al., 1998] and vegetation [e.g., Mahowaldet al., 1999]. Indeed, Mahowald et al. [1999] suggested thatthese changes in dust source areas were the dominant causeof the strengthening of the dust cycle at the LGM.[3] The modern dust cycle is characterized by high short-
term (interannual to interdecadal) variability in both emis-sions [e.g., Middleton and Goudie, 2001] and deposition[Pye and Zhou, 1989]. High-resolution ice-core recordsfrom both Greenland and Antarctic [Steffensen, 1988;Taylor et al., 1993; Hansson, 1994; Ram and Koenig,1997; Ram et al., 1997; Fuhrer et al., 1999] suggest thatthe increased average dust concentration in ice cores at the
JOURNAL OF GEOPHYSICAL RESEARCH, VOL. 107, NO. D24, 4744, doi:10.1029/2002JD002365, 2002
1Max-Planck-Institute for Biogeochemistry, Jena, Germany.2Formerly at Department of Meteorology, Stockholm University,
Stockholm, Sweden.3Laboratoire des Sciences du Climat et de l’Environnement, U.M.R.
CEA-CNRS, Gif-sur-Yvette, France.4Department of Meteorology, Stockholm University, Stockholm,
Sweden.5Now at Department of Geography, Universite Catholique de Louvain,
Louvain-la-Neuve, Belgium.
Copyright 2002 by the American Geophysical Union.0148-0227/03/2002JD002365$09.00
AAC 2 - 1
LGM was associated with short-term variability in dustdeposition significantly greater than today. The causes ofthis increased variability are unknown. Short-term changesin vegetation cover (which would impact on dust emissions)and short-term variations in the polar circulation (whichwould change the balance between wet and dry deposition)have been invoked as possible explanations [Mayewski etal., 1994; Alley et al., 1995; Mayewski et al., 1997].[4] In principle, the causes of changes in the variability of
dust deposition in polar regions can be addressed using amodel of the dust cycle. For this purpose, dust sources needto be determined as a function of the seasonal cycle ofvegetation cover, snow cover and soil hydrology, and thedust source scheme must explicitly incorporate the depend-ence of emissions on vegetation phenology. Recent work byTegen et al. [2002] has shown that a realistic simulation ofthe seasonality of modern dust emissions can be achievedby taking into account the existence of geomorphicallyfavorable sites for dust sources (a point also demonstratedby Ginoux et al. [2001]) and by prescribing the seasonalcycle of vegetation in semi-arid regions based on satellitedata. Tegen et al.’s simulation is among the first to produce,for example, both a realistic spring peak in dust emissionsfrom Asia and a summer maximum of emissions fromnorthern Africa. Summer atmospheric dust concentrationsin the western North Atlantic region are up to an order ofmagnitude lower than observations, while the model resultsagree relatively well with observations at remote NorthPacific locations downwind of the Asian continent (see alsodiscussion by Tegen et al. [2002]).[5] In this paper, we extend the model developed by
Tegen et al. [2002] to include a prognostic simulation ofvegetation phenology, allowing us to simulate the seasonalcycle of vegetation coverage and dust emissions in achanged climate. We use this model to simulate the modernand LGM dust cycles, including their seasonal and inter-annual variability. Analyses of these simulations enable usto address the question of the relative roles of temporalchanges in emission, transport and deposition patterns inexplaining observed changes in the variability of dustdeposition bxoth in polar regions and elsewhere.
2. Dust Cycle Model and Analytical Approach
2.1. Modeling Strategy
[6] The dust cycle model consists of a scheme to predictdust sources, an emission scheme, a tracer transport model,and a deposition scheme. The dust cycle model is driven byclimate data (wind fields, temperature, precipitation, netradiation) derived from an atmospheric general circulationmodel (AGCM) simulation of the present and Last GlacialMaximum (LGM, approximately 21,000 yr B.P.) climate.Since the dust model is run ‘‘offline’’ from the climatemodel, the simulations do not take into account feedbacksbetween the simulated atmospheric dust loading and theclimate.[7] Model performance under modern conditions is eval-
uated using observations from the Dust Indicator andRecords of Terrestrial and Marine Palaeoenvironments(DIRTMAP) database [Kohfeld and Harrison, 2001]. Thecurrent version of this database contains over 300 dustrecords from various terrestrial, marine and ice core archives.
Here we limit our comparison to dust accumulation recordscalculated from mass estimates from polar ice cores, modernmarine sediment traps and terrigenous accumulation inmarine sediments. We specifically exclude terrestrial dustrecords, which might be strongly influenced by local, small-scale dust sources and deposition processes not well repro-duced at the coarse scale of our dust model.[8] In order to assess how well our prognostic model of
vegetation performs, we compare the simulated seasonalcycle of vegetation directly with satellite-derived recon-structions of seasonal changes in vegetation cover [Braswellet al., 1997]. We also compare our modern dust cyclesimulations with the results from the Tegen et al. [2002]simulations, which were derived using satellite-derivedprescribed seasonal changes in vegetation cover and climatedata from the European Center for Medium-Range WeatherForecast (ECMWF) reanalysis. The simulated mean changesin the dust cycle between the LGM and the present areevaluated using dust records derived from ice-core andmarine sediment-core data archived in the DIRTMAP data-base [Kohfeld and Harrison, 2001].[9] Although it should be possible to derive records of
interannual variability in dust deposition fluxes at the LGMfrom annually-laminated lake sediments [e.g., Hu et al.,1999; Zolitschka et al., 2000], the only records of multi-annual variability that are currently available are from icecore records from the polar regions [Steffensen, 1988;Taylor et al., 1993; Hansson, 1994; Ram and Koenig,1997; Ram et al., 1997; Fuhrer et al., 1999]. We thereforecompare the interannual variability of our simulations withthese records.
2.2. Dust Cycle Model
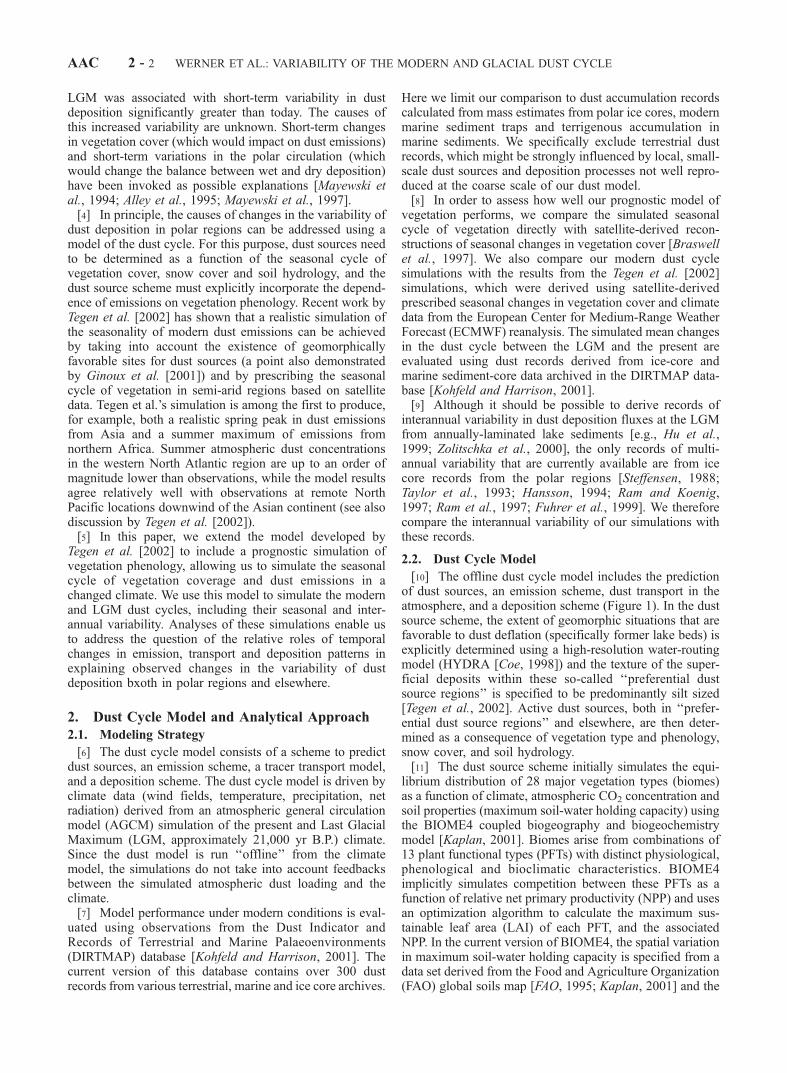
[10] The offline dust cycle model includes the predictionof dust sources, an emission scheme, dust transport in theatmosphere, and a deposition scheme (Figure 1). In the dustsource scheme, the extent of geomorphic situations that arefavorable to dust deflation (specifically former lake beds) isexplicitly determined using a high-resolution water-routingmodel (HYDRA [Coe, 1998]) and the texture of the super-ficial deposits within these so-called ‘‘preferential dustsource regions’’ is specified to be predominantly silt sized[Tegen et al., 2002]. Active dust sources, both in ‘‘prefer-ential dust source regions’’ and elsewhere, are then deter-mined as a consequence of vegetation type and phenology,snow cover, and soil hydrology.[11] The dust source scheme initially simulates the equi-
librium distribution of 28 major vegetation types (biomes)as a function of climate, atmospheric CO2 concentration andsoil properties (maximum soil-water holding capacity) usingthe BIOME4 coupled biogeography and biogeochemistrymodel [Kaplan, 2001]. Biomes arise from combinations of13 plant functional types (PFTs) with distinct physiological,phenological and bioclimatic characteristics. BIOME4implicitly simulates competition between these PFTs as afunction of relative net primary productivity (NPP) and usesan optimization algorithm to calculate the maximum sus-tainable leaf area (LAI) of each PFT, and the associatedNPP. In the current version of BIOME4, the spatial variationin maximum soil-water holding capacity is specified from adata set derived from the Food and Agriculture Organization(FAO) global soils map [FAO, 1995; Kaplan, 2001] and the
AAC 2 - 2 WERNER ET AL.: VARIABILITY OF THE MODERN AND GLACIAL DUST CYCLE
model is forced with monthly mean values of temperature,precipitation and net radiation interpolated to the daily timestep used by the model to calculate soil hydrology.[12] The daily evolution of vegetation cover within each
biome is simulated using a biome-dust interface algorithm.This algorithm requires the same inputs (temperature, pre-cipitation and net radiation, atmospheric CO2 concentration,maximum soil-water holding capacity) as the BIOME4model. The algorithm assumes that the mean fraction ofabsorbed photosynthetically active radiation (FPAR) can beused as a surrogate for the fraction of each grid cell coveredby vegetation. FPAR is determined from the simulated leafarea index (LAI) of each PFT present using the relationship:FPAR = 1 � exp (�0.5/LAI) [Monsi and Saeki, 1953]. Themean value of FPAR is a proportional average of the simu-lated FPAR for each PFT present. The presence/absence andrelative importance of each PFT is specified from theBIOME4 simulations. Evergreen PFTs are assumed to havea constant LAI throughout the year. In deciduous PFTs, theevolution of LAI during the growing season is determinedby several factors. The timing of initial leaf-out is deter-mined by a combination of the accumulated temperaturesum, air temperature, soil moisture conditions and daylength. Both the accumulated temperature sum and theday length required to trigger growth are PFT-specific.Plants do not respond to instantaneous drought stress, andso the soil moisture criterion for growth initiation is esti-mated based on a running average over 3 days and that fordeath due to drought stress on a running average over 5days. In addition to drought stress, leaf death is triggered bythe reduction in day length below a threshold value. Simu-lated daily LAI also decreases (and eventually becomeszero) as the leaves become old. The maximum leaf longev-ity is PFT specific.[13] To derive the effective surface fraction Aeff for dust
emission in each grid cell from the vegetation coversurrogate FPAR, we apply the same approach as Tegen etal. [2002]. For grass-dominated biomes we assume that dustdeflation can occur whenever the green vegetation is belowa certain limit (FPAR < 0.25). This limit prevents dustemissions by modest and dense grass cover. The effectivedust source area Aeff increases linearly with decreasingvegetation to a maximum of Aeff = 1 for FPAR = 0:
for grass� dominated biomes :
Aeff ¼1� FPAR if FPAR � 0:25
0 otherwise
�:
[14] For shrub-dominated biomes we must use a differentcalculation of Aeff since shrubs can protect the soil surfaceeven when no leaves are present (FPAR = 0). For shrub-
dominated tundra biomes we assume that the effectivevegetation cover is constant throughout the year and equalsthe annual maximum of FPAR. Again, we set a limit ofFPAR(maxann) < 0.25 to prevent dust emissions by modestor dense shrub coverage. The effective dust source area Aeff
stays constant throughout the year but increases linearlywith a decrease of FPAR(maxann) to a maximum of Aeff = 1for FPAR(maxann) = 0:
for shrub� dominated biomes :
Aeff ¼1� FPAR maxannð Þ if FPAR maxannð Þ � 0:25
0 otherwise
�:
[15] Temperate and tropical shrublands can be character-ized by a mixture of shrubs and grasses. We have used themean annual FPAR value as a criterion to treat such biomeseither as grass-dominated vegetation or as shrub-dominatedvegetation. Depending on the classification, the effectivedust source area Aeff for these biomes was calculated as forgrass-dominated biomes or shrub-dominated biomes (seealso discussion by Tegen et al., 2002]).[16] In order to simulate the daily changes in vegetation
cover, the biome-dust interface algorithm must also simulatethe temporal evolution of other land-surface parameters thataffect dust emission strength, specifically snow cover andsoil water status. Following the approach of Roelandt[2001], water occurs either as snow (when the near-surfaceair temperature is below 0�C) or rain (when the near surfacetemperature is above 0�C). Snow is stored on the soilsurface and only contributes water to the soil once it hasmelted. The soil reservoir is represented as a 15-layercascading bucket scheme. The depth of each of these 15buckets increases down profile from 1cm in the uppermostlayer to 10 cm in the lowermost layer, such that the totaldepth of the soil is 1m. The available water-holding capacityof the whole soil column, as given by the BIOME4 model,is distributed between the 15 buckets proportionally to theirrelative size. The uppermost soil bucket is filled by precip-itation. When this bucket is full, excess water is allowed tofill the underlying bucket, and when this is in turn full it willsupply water to the underlying bucket until the whole soilcolumn is saturated. Surface runoff is only allowed to occurwhen the whole of the soil column is saturated. Water isremoved from the soil either through evaporation or bytranspiration. Evaporation from the surface of the soiloccurs as a function of temperature and net radiation. Whenthe uppermost bucket is depleted, water is removed sequen-tially from the underlying buckets (in a simplified emulationof the process of capillary rise). Water is also removed fromeach bucket through transpiration. Transpiration is calcu-lated, following Haxeltine et al. [1996], as the lesser of a
Figure 1. Schematic overview of the dust cycle model and its different components.
WERNER ET AL.: VARIABILITY OF THE MODERN AND GLACIAL DUST CYCLE AAC 2 - 3

supply function (determined by available water in the soil)and a demand function (determined by surface air temper-ature and net radiation). The water uptake by plants fromeach soil bucket is proportional to the amount of rootspresent. The rooting profile with depth for different PFTs isspecified following Jackson et al. [1996]: Arboreal PFTshave a smaller fraction of their roots in the upper soil layerswhile nonarboreal PFTs have a larger proportion of theirroots in the upper layers.[17] Dust deflation is inhibited when soils are wet. How-
ever, deflation is possible shortly after precipitation eventsbecause the uppermost soil layer may dry very quickly[Gillette, 1999]. We therefore prohibit dust deflation only ifthe relative soil moisture over the total soil depth, assimulated by the biome-dust interface algorithm, is greaterthan 99% (i.e., the soil is completely saturated). We alsoprohibit dust deflation from any part of a grid cell that iscovered by snow. In the biome-dust interface algorithm, thesnow area fraction ASnow of each grid cell is estimated fromsimulated snow depth Sn using the relationship ASnow = Sn/(Sn + Sncrit), with a critical snow depth Sncrit set to 50 mm[Douville et al., 1995].[18] To classify different soil types, seven soil texture
categories with different populations of coarse sand,medium/fine sand, silt and clay (based on the FAO/UNESCO Soil Map of the World [Zobler, 1986]) aredefined. Each of these four populations has a differentmean particle diameter (coarse sand: 710 mm, medium/finesand: 160 mm, silt: 15 mm, clay: 2 mm) and a differentprescribed ratio a (m�1) of vertical to horizontal soilparticle flux (coarse sand: 10�9 m�1, medium/fine sand:10�8 m�1, silt: 10�7 m�1, clay: 10�8 m�1). This definitionof different soil texture categories is identical to the oneused by Tegen et al. [2002]. Due to the lack of equivalentpaleo-environmental data, we apply identical maps of soiltypes for the present and glacial climate simulation.[19] Dust emission occurs from active sources when the
prescribed wind speed exceeds a certain threshold velocity[Marticorena and Bergametti, 1995], which is dependent onsoil texture. We use the approach of Tegen et al. [2002] tocalculate the dust emission flux F:
F ¼ a � Aeff � 1� ASnowð Þ � Gwith
G ¼rag� u*ð Þ3�
Pi
�1þ utr* Dpið Þ
u*
� ��1� u*tr Dpið ÞÞ2
u*ð Þ2��si�for u* � u*tr
0 otherwise
8<:
and air density ra (kgm�3), gravitational constant g (ms�2),
surface wind velocity u* (ms�1), threshold velocity utr*(ms�1) (as a function of mean diameter Dpi), and relativesurface si covered by each size fraction i. For completelysaturated soils, F is set to zero.[20] The surface wind velocities u* required to calculate
dust emission fluxes were derived from 12-hour averages ofthe wind speed at 10m simulated by ECHAM4. As a resultof their coarse spatial resolution, most AGCMs (includingECHAM4) simulate peak wind speeds considerably lowerthan observed [Bengtsson et al., 1995]. This is likely to
have a substantial impact on the simulated dust emissionfluxes. In an attempt to minimize the impact of thisdeficiency, we derived a procedure to ‘‘correct’’ for thissmoothing effect of the simulated wind strengths. TheECHAM monthly wind fields from the control simulationwere first relaxed towards the spatially more finely resolvedwind fields from the ECMWF reanalysis data (1984–1993).The ECHAM 12h wind speeds (u) were then ‘‘corrected’’such that u* = m � u + b, with
m ¼ smonECMWF
smonECHAM
b ¼ umonECMWF � umon
ECHAM �m �
where u* is the corrected 12-hour wind speed fromECHAM4, u is the uncorrected 12-hour wind speed fromECHAM4, uECHAM
mon is the monthly mean wind speedfrom ECHAM4, sECMWF
mon is the monthly mean wind speedfrom ECMWF, sECHAM
mon is the standard deviation of theECHAM monthly wind speed values, and sECMWF
mon is thestandard deviation of the ECMWF monthly wind speedvalues. The coefficients m and b were calculated for everygrid point and every month independently. These correc-tion values were subsequently applied to the LGMECHAM4 wind fields.[21] Dust transport in the atmosphere and the deposition
processes are simulated using the tracer transport modelTM3 [Heimann, 1995; The global atmospheric tracer modelTM3 (model description and user manual), manuscript inpreparation, 2002]. The TM3 model is run with 4� 5�horizontal resolution, 19 vertical levels and a 12-hourly timestep. Seven different size classes of dust (size class radiuslimits: 0.1 mm, 0.3 mm, 0.9 mm, 2.6 mm, 8 mm, 24 mm, 72 mm,219 mm) are transported independently. Dust removal fromthe atmosphere occurs by dry or wet deposition. Drydeposition occurs through gravitational settling and turbu-lent mixing to the surface. The vertical temperature profile,required to compute the vertical extent of individual atmos-pheric layers from pressure coordinates and thus to calculateatmospheric sedimentation rates, is derived directly from theclimate model simulation. Wet deposition occurs duringconvective or large-scale precipitation events. The verticalstructure of precipitation is derived directly from the climatemodel simulation. For convective precipitation, we assumea complete washout of dust particles below the uppermostlevel of precipitation formation. For large-scale precipita-tion, the amount of dust removal is proportional to theamount of precipitation. The scavenging ratio (defined asdust concentration in precipitation divided by dust concen-tration in air) is set to 1000. Although this value is 25%higher than the value used by Tegen et al. [2002], sensitivitytests suggest that the results of our simulation of the moderndust cycle are not sensitive to the choice of scavenging ratiowithin a range from 750 to 1250.
2.3. Present and LGM Climate Forcing
[22] The atmospheric fields used to force the dust cyclemodel are derived from two 9-year-long simulations madewith a recent version of the Hamburg AGCM (ECHAM4[Roeckner et al., 1996]). The model has a horizontalresolution of approximately 3.75� by 3.75� and 19 verticallevels. In the simulation of the modern climate, the mean
AAC 2 - 4 WERNER ET AL.: VARIABILITY OF THE MODERN AND GLACIAL DUST CYCLE
seasonal cycle of sea-surface temperatures (SSTs) and seaice coverage averaged over the period 1979–1988 wasprescribed from the Atmospheric Model IntercomparisonProject (AMIP) data set and CO2 was set to 350 ppmv. TheLGM simulation was run following the PalaeoclimateModelling Intercomparison Project (PMIP) [Joussaumeand Taylor, 1995]) protocol, with realistic changes in theorbital configuration [Berger, 1978], prescribed changes ingeography (including land-sea distribution and the extentand height of the ice sheets) according to Peltier [1994],seasonal SSTs and sea ice extent prescribed from CLIMAP[CLIMAP Project Members, 1981] and CO2 set to 200ppmv [Barnola et al., 1987]. Strictly, the LGM CO2 levelshould have been set to 203 ppmv (i.e. 200/345 350ppmv) to conform to the PMIP protocol. However, thedifference is too small to have an effect on a climatesimulation made using fixed SSTs. Although the SSTforcing varies seasonally, there is no change in the boundaryconditions from year to year. Thus, the ECHAM4 forcingfields used to drive the dust cycle model represent theinherent variability of the atmosphere but not that of theocean or land surface.[23] The source and emissions schemes in the dust cycle
model are run on a 0.5� by 0.5� grid. Modern and glacialatmospheric forcing fields were interpolated from thecoarser ECHAM4 grid to this finer scale. The BIOME4model is calibrated for a modern CO2 level of 324 ppmv
(corresponding to the mean CO2 level during the yearsaveraged to produce the modern climatology). The LGMBIOME4 simulation uses anomalies from the ECHAM4simulations (control minus LGM) superimposed on themodern climatology (CLIMATE 2.2). In accordance withthe PMIP protocol, the glacial CO2 level was set to 188ppmv (i.e., 200/345 324 ppmv) for the LGM BIOME4run. A similar procedure was used for the biome-dustinterface algorithm. The dust fluxes simulated on the 0.5�by 0.5� grid were interpolated to the coarser resolution (4� 5�) of the TM3 tracer transport model, as were theatmospheric forcing fields (3.75� 3.75�) required to runthe tracer model. The dust cycle model was run using thefull nine years of the modern simulation and the LGMsimulation.
3. Results
3.1. Modern Dust Cycle
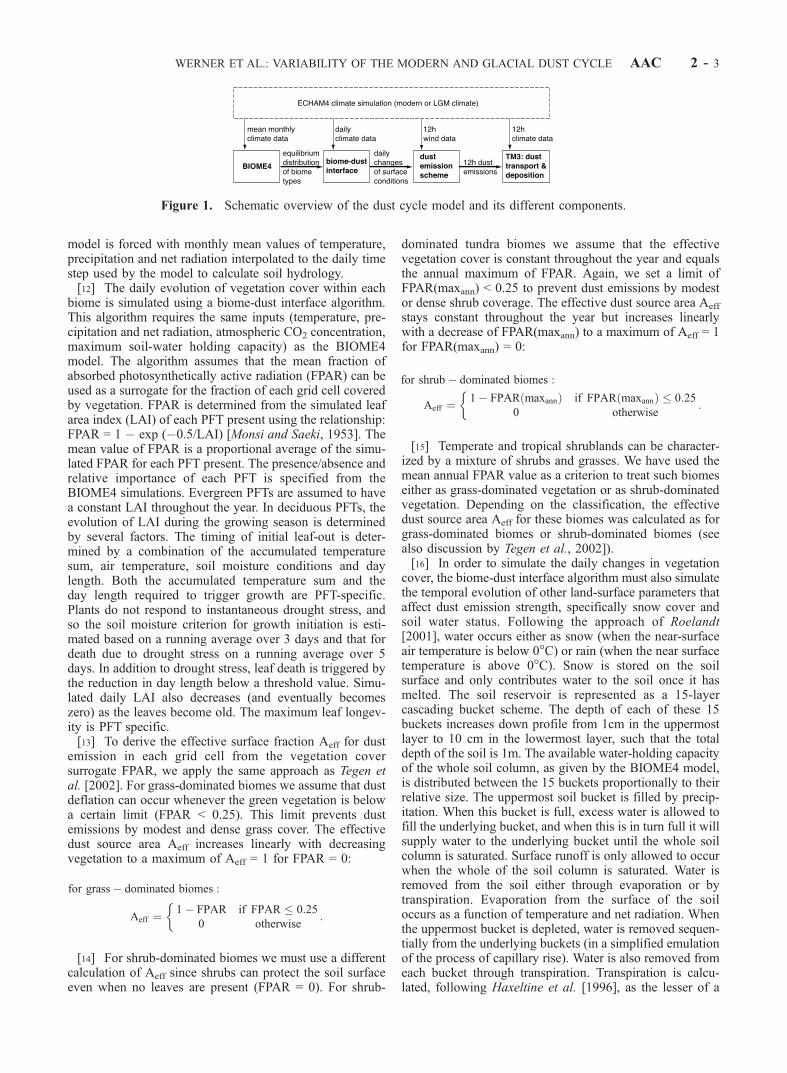
[24] Emissions from the major dust source regions in themodern simulation (Figure 2) are markedly seasonal incharacter. Dust emissions from Asia, including the GobiDesert, peak in the Northern Hemisphere (NH) spring(MAM) while emissions from the southern Sahara/Sahelregion peak in spring and summer (MAMJJA). In thesouthern hemisphere (SH), Australian emissions are max-imal in SH spring (ON) and summer (DJ). Emissions from
Figure 2. Simulated seasonal dust emission fluxes for the present climate using mean modernECHAM4 atmospheric forcing fields and a prognostic biome-dust interface algorithm to predict modernvegetation coverage. The seasons are conventionally defined as December–January–February (DJF),March–April–May (MAM), June–July–August (JJA), and September–October–November (SON).
WERNER ET AL.: VARIABILITY OF THE MODERN AND GLACIAL DUST CYCLE AAC 2 - 5
other SH sources are rather small but nevertheless also tendto show a spring to summer peak. The emission peaks arereflected in the simulated near-surface atmospheric dustloading patterns. The timing of the simulated peak inemissions for each of the major source areas is in goodagreement with regional observations of both emissions[Orgill and Sehmel, 1976; Iwasaka et al., 1983; Middletonet al., 1986; Pye, 1987; Parungo et al., 1995], atmospherictransport patterns as seen by regional monitoring stations[Prospero, 1996] and satellite data [Herman et al., 1997;Husar et al., 1997]. According to our simulations, there is alag of 1 month between peak emissions and peak dustdeposition at distant locations in the mid-oceans and in NHpolar regions. The maximum lag appears to be in thedeposition of Asian dust to Greenland, which occurs inJune approximately 4–6 weeks after the peak in emissions.[25] In our simulations, the seasonal cycle of vegetation
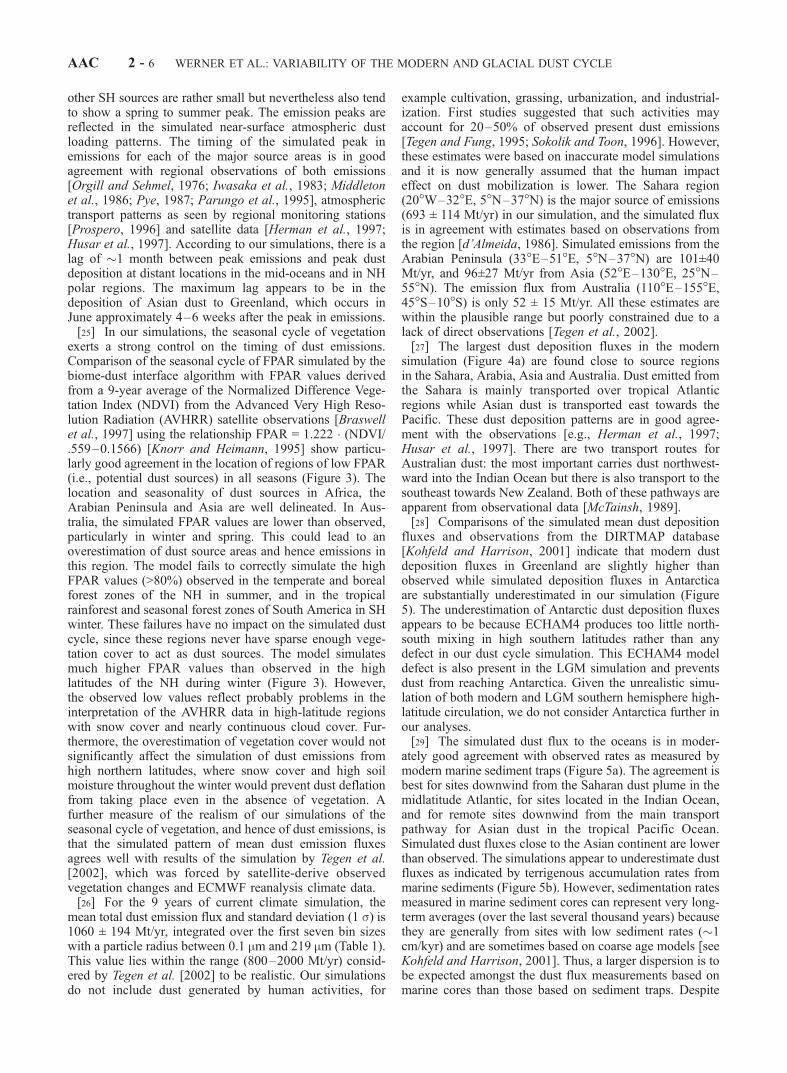
exerts a strong control on the timing of dust emissions.Comparison of the seasonal cycle of FPAR simulated by thebiome-dust interface algorithm with FPAR values derivedfrom a 9-year average of the Normalized Difference Vege-tation Index (NDVI) from the Advanced Very High Reso-lution Radiation (AVHRR) satellite observations [Braswellet al., 1997] using the relationship FPAR = 1.222 � (NDVI/.559–0.1566) [Knorr and Heimann, 1995] show particu-larly good agreement in the location of regions of low FPAR(i.e., potential dust sources) in all seasons (Figure 3). Thelocation and seasonality of dust sources in Africa, theArabian Peninsula and Asia are well delineated. In Aus-tralia, the simulated FPAR values are lower than observed,particularly in winter and spring. This could lead to anoverestimation of dust source areas and hence emissions inthis region. The model fails to correctly simulate the highFPAR values (>80%) observed in the temperate and borealforest zones of the NH in summer, and in the tropicalrainforest and seasonal forest zones of South America in SHwinter. These failures have no impact on the simulated dustcycle, since these regions never have sparse enough vege-tation cover to act as dust sources. The model simulatesmuch higher FPAR values than observed in the highlatitudes of the NH during winter (Figure 3). However,the observed low values reflect probably problems in theinterpretation of the AVHRR data in high-latitude regionswith snow cover and nearly continuous cloud cover. Fur-thermore, the overestimation of vegetation cover would notsignificantly affect the simulation of dust emissions fromhigh northern latitudes, where snow cover and high soilmoisture throughout the winter would prevent dust deflationfrom taking place even in the absence of vegetation. Afurther measure of the realism of our simulations of theseasonal cycle of vegetation, and hence of dust emissions, isthat the simulated pattern of mean dust emission fluxesagrees well with results of the simulation by Tegen et al.[2002], which was forced by satellite-derive observedvegetation changes and ECMWF reanalysis climate data.[26] For the 9 years of current climate simulation, the
mean total dust emission flux and standard deviation (1 s) is1060 ± 194 Mt/yr, integrated over the first seven bin sizeswith a particle radius between 0.1 mm and 219 mm (Table 1).This value lies within the range (800–2000 Mt/yr) consid-ered by Tegen et al. [2002] to be realistic. Our simulationsdo not include dust generated by human activities, for
example cultivation, grassing, urbanization, and industrial-ization. First studies suggested that such activities mayaccount for 20–50% of observed present dust emissions[Tegen and Fung, 1995; Sokolik and Toon, 1996]. However,these estimates were based on inaccurate model simulationsand it is now generally assumed that the human impacteffect on dust mobilization is lower. The Sahara region(20�W–32�E, 5�N–37�N) is the major source of emissions(693 ± 114 Mt/yr) in our simulation, and the simulated fluxis in agreement with estimates based on observations fromthe region [d’Almeida, 1986]. Simulated emissions from theArabian Peninsula (33�E–51�E, 5�N–37�N) are 101±40Mt/yr, and 96±27 Mt/yr from Asia (52�E–130�E, 25�N–55�N). The emission flux from Australia (110�E–155�E,45�S–10�S) is only 52 ± 15 Mt/yr. All these estimates arewithin the plausible range but poorly constrained due to alack of direct observations [Tegen et al., 2002].[27] The largest dust deposition fluxes in the modern
simulation (Figure 4a) are found close to source regionsin the Sahara, Arabia, Asia and Australia. Dust emitted fromthe Sahara is mainly transported over tropical Atlanticregions while Asian dust is transported east towards thePacific. These dust deposition patterns are in good agree-ment with the observations [e.g., Herman et al., 1997;Husar et al., 1997]. There are two transport routes forAustralian dust: the most important carries dust northwest-ward into the Indian Ocean but there is also transport to thesoutheast towards New Zealand. Both of these pathways areapparent from observational data [McTainsh, 1989].[28] Comparisons of the simulated mean dust deposition
fluxes and observations from the DIRTMAP database[Kohfeld and Harrison, 2001] indicate that modern dustdeposition fluxes in Greenland are slightly higher thanobserved while simulated deposition fluxes in Antarcticaare substantially underestimated in our simulation (Figure5). The underestimation of Antarctic dust deposition fluxesappears to be because ECHAM4 produces too little north-south mixing in high southern latitudes rather than anydefect in our dust cycle simulation. This ECHAM4 modeldefect is also present in the LGM simulation and preventsdust from reaching Antarctica. Given the unrealistic simu-lation of both modern and LGM southern hemisphere high-latitude circulation, we do not consider Antarctica further inour analyses.[29] The simulated dust flux to the oceans is in moder-
ately good agreement with observed rates as measured bymodern marine sediment traps (Figure 5a). The agreement isbest for sites downwind from the Saharan dust plume in themidlatitude Atlantic, for sites located in the Indian Ocean,and for remote sites downwind from the main transportpathway for Asian dust in the tropical Pacific Ocean.Simulated dust fluxes close to the Asian continent are lowerthan observed. The simulations appear to underestimate dustfluxes as indicated by terrigenous accumulation rates frommarine sediments (Figure 5b). However, sedimentation ratesmeasured in marine sediment cores can represent very long-term averages (over the last several thousand years) becausethey are generally from sites with low sediment rates (1cm/kyr) and are sometimes based on coarse age models [seeKohfeld and Harrison, 2001]. Thus, a larger dispersion is tobe expected amongst the dust flux measurements based onmarine cores than those based on sediment traps. Despite
AAC 2 - 6 WERNER ET AL.: VARIABILITY OF THE MODERN AND GLACIAL DUST CYCLE
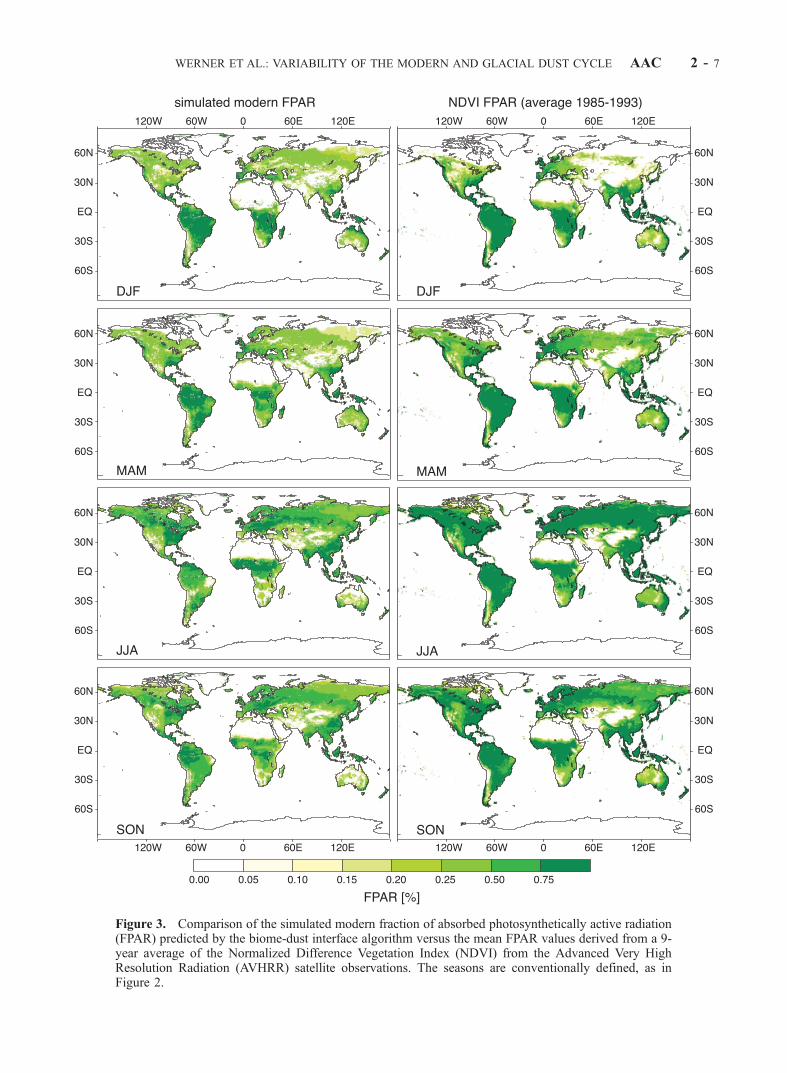
Figure 3. Comparison of the simulated modern fraction of absorbed photosynthetically active radiation(FPAR) predicted by the biome-dust interface algorithm versus the mean FPAR values derived from a 9-year average of the Normalized Difference Vegetation Index (NDVI) from the Advanced Very HighResolution Radiation (AVHRR) satellite observations. The seasons are conventionally defined, as inFigure 2.
WERNER ET AL.: VARIABILITY OF THE MODERN AND GLACIAL DUST CYCLE AAC 2 - 7
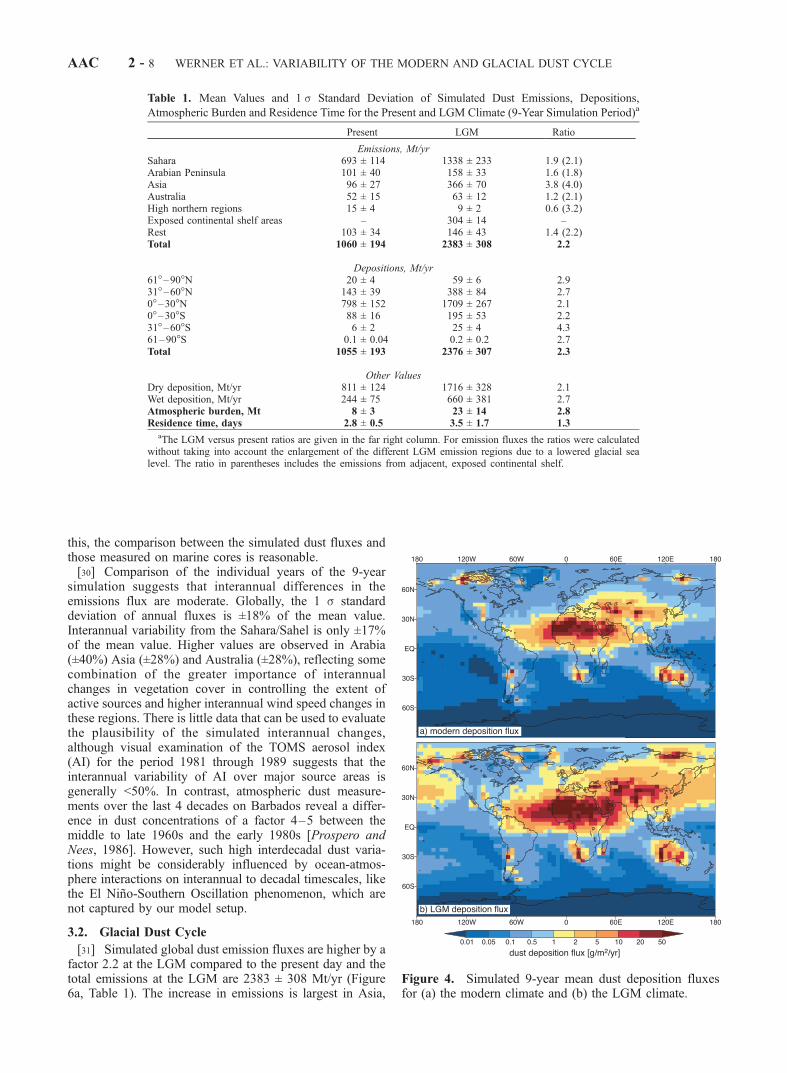
this, the comparison between the simulated dust fluxes andthose measured on marine cores is reasonable.[30] Comparison of the individual years of the 9-year
simulation suggests that interannual differences in theemissions flux are moderate. Globally, the 1 s standarddeviation of annual fluxes is ±18% of the mean value.Interannual variability from the Sahara/Sahel is only ±17%of the mean value. Higher values are observed in Arabia(±40%) Asia (±28%) and Australia (±28%), reflecting somecombination of the greater importance of interannualchanges in vegetation cover in controlling the extent ofactive sources and higher interannual wind speed changes inthese regions. There is little data that can be used to evaluatethe plausibility of the simulated interannual changes,although visual examination of the TOMS aerosol index(AI) for the period 1981 through 1989 suggests that theinterannual variability of AI over major source areas isgenerally <50%. In contrast, atmospheric dust measure-ments over the last 4 decades on Barbados reveal a differ-ence in dust concentrations of a factor 4–5 between themiddle to late 1960s and the early 1980s [Prospero andNees, 1986]. However, such high interdecadal dust varia-tions might be considerably influenced by ocean-atmos-phere interactions on interannual to decadal timescales, likethe El Nino-Southern Oscillation phenomenon, which arenot captured by our model setup.
3.2. Glacial Dust Cycle
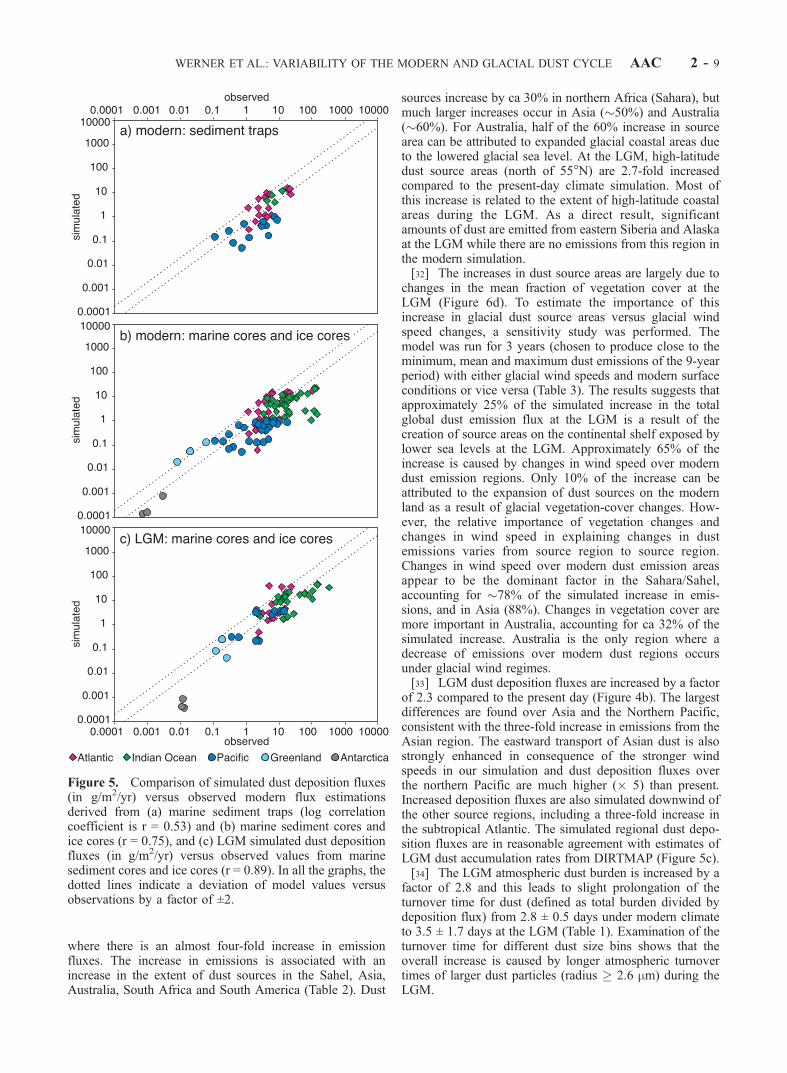
[31] Simulated global dust emission fluxes are higher by afactor 2.2 at the LGM compared to the present day and thetotal emissions at the LGM are 2383 ± 308 Mt/yr (Figure6a, Table 1). The increase in emissions is largest in Asia,
Table 1. Mean Values and 1 s Standard Deviation of Simulated Dust Emissions, Depositions,
Atmospheric Burden and Residence Time for the Present and LGM Climate (9-Year Simulation Period)a
Present LGM Ratio
Emissions, Mt/yrSahara 693 ± 114 1338 ± 233 1.9 (2.1)Arabian Peninsula 101 ± 40 158 ± 33 1.6 (1.8)Asia 96 ± 27 366 ± 70 3.8 (4.0)Australia 52 ± 15 63 ± 12 1.2 (2.1)High northern regions 15 ± 4 9 ± 2 0.6 (3.2)Exposed continental shelf areas – 304 ± 14 –Rest 103 ± 34 146 ± 43 1.4 (2.2)Total 1060 ± 194 2383 ± 308 2.2
Depositions, Mt/yr61�–90�N 20 ± 4 59 ± 6 2.931�–60�N 143 ± 39 388 ± 84 2.70�–30�N 798 ± 152 1709 ± 267 2.10�–30�S 88 ± 16 195 ± 53 2.231�–60�S 6 ± 2 25 ± 4 4.361–90�S 0.1 ± 0.04 0.2 ± 0.2 2.7Total 1055 ± 193 2376 ± 307 2.3
Other ValuesDry deposition, Mt/yr 811 ± 124 1716 ± 328 2.1Wet deposition, Mt/yr 244 ± 75 660 ± 381 2.7Atmospheric burden, Mt 8 ± 3 23 ± 14 2.8Residence time, days 2.8 ± 0.5 3.5 ± 1.7 1.3
aThe LGM versus present ratios are given in the far right column. For emission fluxes the ratios were calculatedwithout taking into account the enlargement of the different LGM emission regions due to a lowered glacial sealevel. The ratio in parentheses includes the emissions from adjacent, exposed continental shelf.
Figure 4. Simulated 9-year mean dust deposition fluxesfor (a) the modern climate and (b) the LGM climate.
AAC 2 - 8 WERNER ET AL.: VARIABILITY OF THE MODERN AND GLACIAL DUST CYCLE
where there is an almost four-fold increase in emissionfluxes. The increase in emissions is associated with anincrease in the extent of dust sources in the Sahel, Asia,Australia, South Africa and South America (Table 2). Dust
sources increase by ca 30% in northern Africa (Sahara), butmuch larger increases occur in Asia (50%) and Australia(60%). For Australia, half of the 60% increase in sourcearea can be attributed to expanded glacial coastal areas dueto the lowered glacial sea level. At the LGM, high-latitudedust source areas (north of 55�N) are 2.7-fold increasedcompared to the present-day climate simulation. Most ofthis increase is related to the extent of high-latitude coastalareas during the LGM. As a direct result, significantamounts of dust are emitted from eastern Siberia and Alaskaat the LGM while there are no emissions from this region inthe modern simulation.[32] The increases in dust source areas are largely due to
changes in the mean fraction of vegetation cover at theLGM (Figure 6d). To estimate the importance of thisincrease in glacial dust source areas versus glacial windspeed changes, a sensitivity study was performed. Themodel was run for 3 years (chosen to produce close to theminimum, mean and maximum dust emissions of the 9-yearperiod) with either glacial wind speeds and modern surfaceconditions or vice versa (Table 3). The results suggests thatapproximately 25% of the simulated increase in the totalglobal dust emission flux at the LGM is a result of thecreation of source areas on the continental shelf exposed bylower sea levels at the LGM. Approximately 65% of theincrease is caused by changes in wind speed over moderndust emission regions. Only 10% of the increase can beattributed to the expansion of dust sources on the modernland as a result of glacial vegetation-cover changes. How-ever, the relative importance of vegetation changes andchanges in wind speed in explaining changes in dustemissions varies from source region to source region.Changes in wind speed over modern dust emission areasappear to be the dominant factor in the Sahara/Sahel,accounting for 78% of the simulated increase in emis-sions, and in Asia (88%). Changes in vegetation cover aremore important in Australia, accounting for ca 32% of thesimulated increase. Australia is the only region where adecrease of emissions over modern dust regions occursunder glacial wind regimes.[33] LGM dust deposition fluxes are increased by a factor
of 2.3 compared to the present day (Figure 4b). The largestdifferences are found over Asia and the Northern Pacific,consistent with the three-fold increase in emissions from theAsian region. The eastward transport of Asian dust is alsostrongly enhanced in consequence of the stronger windspeeds in our simulation and dust deposition fluxes overthe northern Pacific are much higher ( 5) than present.Increased deposition fluxes are also simulated downwind ofthe other source regions, including a three-fold increase inthe subtropical Atlantic. The simulated regional dust depo-sition fluxes are in reasonable agreement with estimates ofLGM dust accumulation rates from DIRTMAP (Figure 5c).[34] The LGM atmospheric dust burden is increased by a
factor of 2.8 and this leads to slight prolongation of theturnover time for dust (defined as total burden divided bydeposition flux) from 2.8 ± 0.5 days under modern climateto 3.5 ± 1.7 days at the LGM (Table 1). Examination of theturnover time for different dust size bins shows that theoverall increase is caused by longer atmospheric turnovertimes of larger dust particles (radius � 2.6 mm) during theLGM.
Figure 5. Comparison of simulated dust deposition fluxes(in g/m2/yr) versus observed modern flux estimationsderived from (a) marine sediment traps (log correlationcoefficient is r = 0.53) and (b) marine sediment cores andice cores (r = 0.75), and (c) LGM simulated dust depositionfluxes (in g/m2/yr) versus observed values from marinesediment cores and ice cores (r = 0.89). In all the graphs, thedotted lines indicate a deviation of model values versusobservations by a factor of ±2.
WERNER ET AL.: VARIABILITY OF THE MODERN AND GLACIAL DUST CYCLE AAC 2 - 9
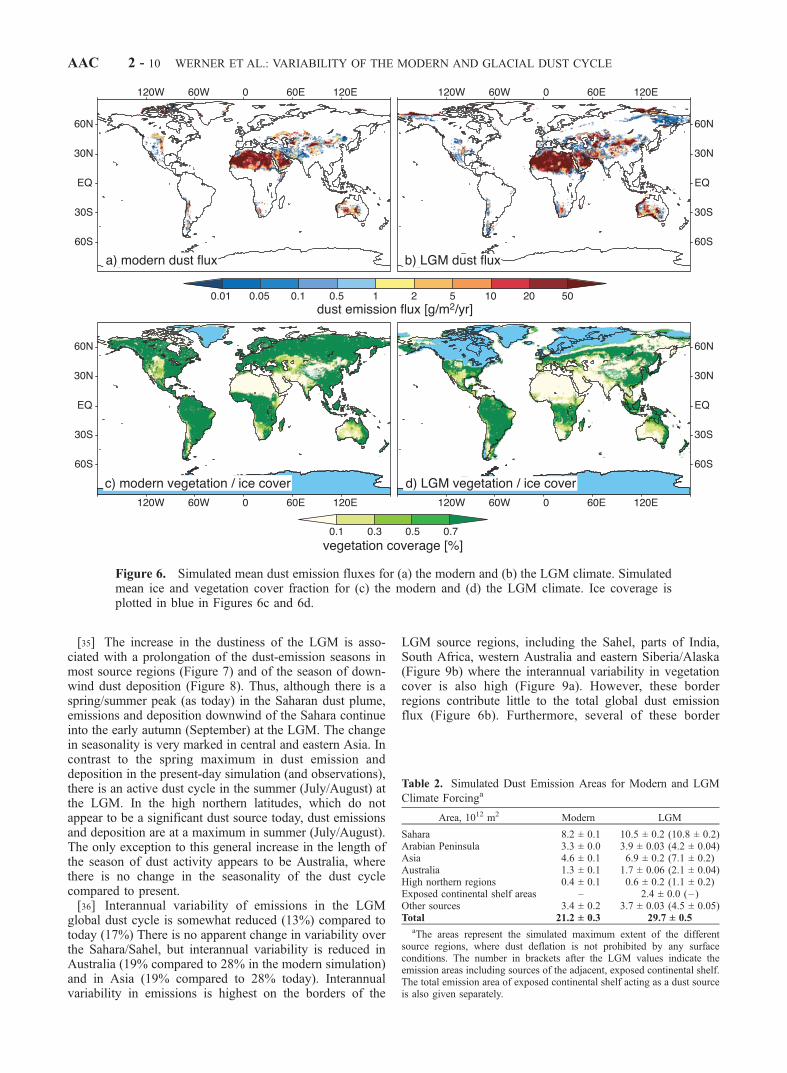
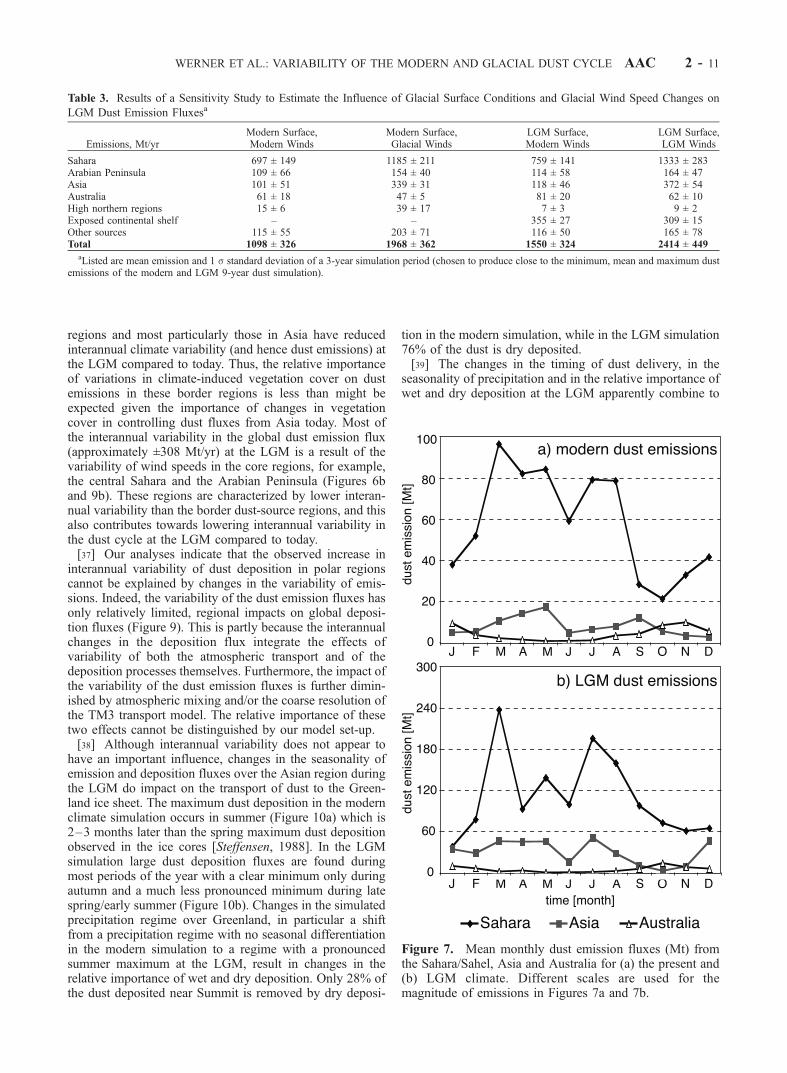
[35] The increase in the dustiness of the LGM is asso-ciated with a prolongation of the dust-emission seasons inmost source regions (Figure 7) and of the season of down-wind dust deposition (Figure 8). Thus, although there is aspring/summer peak (as today) in the Saharan dust plume,emissions and deposition downwind of the Sahara continueinto the early autumn (September) at the LGM. The changein seasonality is very marked in central and eastern Asia. Incontrast to the spring maximum in dust emission anddeposition in the present-day simulation (and observations),there is an active dust cycle in the summer (July/August) atthe LGM. In the high northern latitudes, which do notappear to be a significant dust source today, dust emissionsand deposition are at a maximum in summer (July/August).The only exception to this general increase in the length ofthe season of dust activity appears to be Australia, wherethere is no change in the seasonality of the dust cyclecompared to present.[36] Interannual variability of emissions in the LGM
global dust cycle is somewhat reduced (13%) compared totoday (17%) There is no apparent change in variability overthe Sahara/Sahel, but interannual variability is reduced inAustralia (19% compared to 28% in the modern simulation)and in Asia (19% compared to 28% today). Interannualvariability in emissions is highest on the borders of the
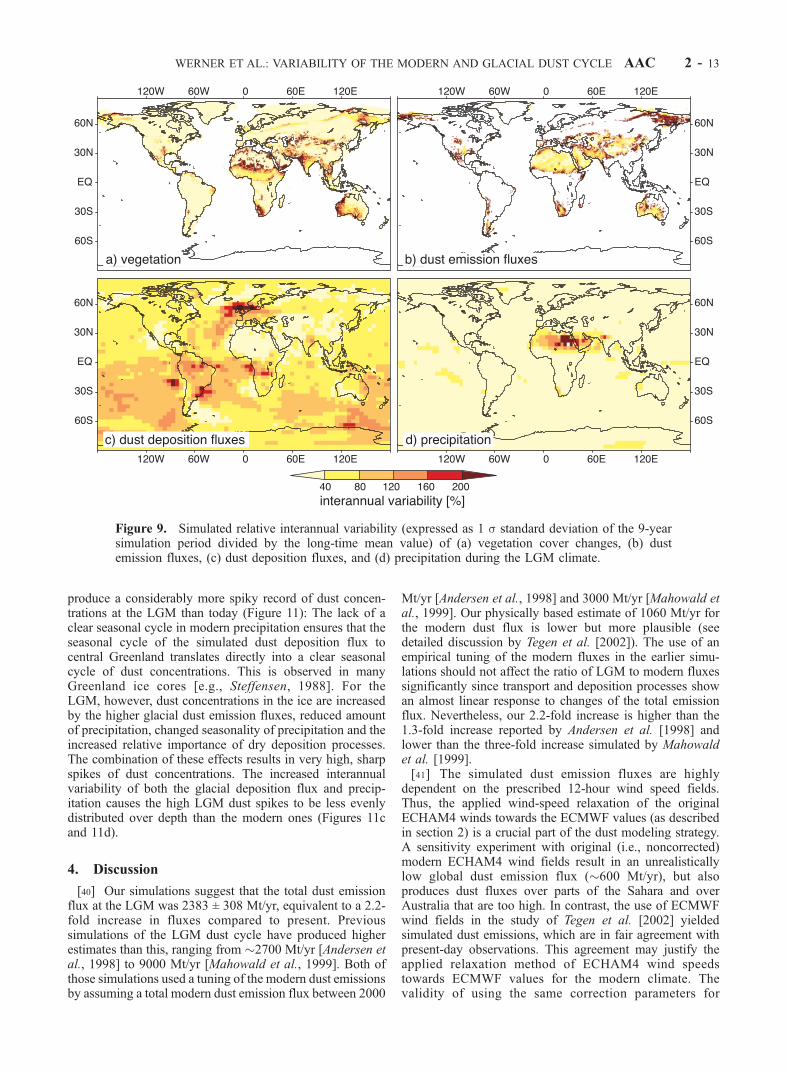
LGM source regions, including the Sahel, parts of India,South Africa, western Australia and eastern Siberia/Alaska(Figure 9b) where the interannual variability in vegetationcover is also high (Figure 9a). However, these borderregions contribute little to the total global dust emissionflux (Figure 6b). Furthermore, several of these border
Figure 6. Simulated mean dust emission fluxes for (a) the modern and (b) the LGM climate. Simulatedmean ice and vegetation cover fraction for (c) the modern and (d) the LGM climate. Ice coverage isplotted in blue in Figures 6c and 6d.
Table 2. Simulated Dust Emission Areas for Modern and LGM
Climate Forcinga
Area, 1012 m2 Modern LGM
Sahara 8.2 ± 0.1 10.5 ± 0.2 (10.8 ± 0.2)Arabian Peninsula 3.3 ± 0.0 3.9 ± 0.03 (4.2 ± 0.04)Asia 4.6 ± 0.1 6.9 ± 0.2 (7.1 ± 0.2)Australia 1.3 ± 0.1 1.7 ± 0.06 (2.1 ± 0.04)High northern regions 0.4 ± 0.1 0.6 ± 0.2 (1.1 ± 0.2)Exposed continental shelf areas – 2.4 ± 0.0 (– )Other sources 3.4 ± 0.2 3.7 ± 0.03 (4.5 ± 0.05)Total 21.2 ± 0.3 29.7 ± 0.5
aThe areas represent the simulated maximum extent of the differentsource regions, where dust deflation is not prohibited by any surfaceconditions. The number in brackets after the LGM values indicate theemission areas including sources of the adjacent, exposed continental shelf.The total emission area of exposed continental shelf acting as a dust sourceis also given separately.
AAC 2 - 10 WERNER ET AL.: VARIABILITY OF THE MODERN AND GLACIAL DUST CYCLE
regions and most particularly those in Asia have reducedinterannual climate variability (and hence dust emissions) atthe LGM compared to today. Thus, the relative importanceof variations in climate-induced vegetation cover on dustemissions in these border regions is less than might beexpected given the importance of changes in vegetationcover in controlling dust fluxes from Asia today. Most ofthe interannual variability in the global dust emission flux(approximately ±308 Mt/yr) at the LGM is a result of thevariability of wind speeds in the core regions, for example,the central Sahara and the Arabian Peninsula (Figures 6band 9b). These regions are characterized by lower interan-nual variability than the border dust-source regions, and thisalso contributes towards lowering interannual variability inthe dust cycle at the LGM compared to today.[37] Our analyses indicate that the observed increase in
interannual variability of dust deposition in polar regionscannot be explained by changes in the variability of emis-sions. Indeed, the variability of the dust emission fluxes hasonly relatively limited, regional impacts on global deposi-tion fluxes (Figure 9). This is partly because the interannualchanges in the deposition flux integrate the effects ofvariability of both the atmospheric transport and of thedeposition processes themselves. Furthermore, the impact ofthe variability of the dust emission fluxes is further dimin-ished by atmospheric mixing and/or the coarse resolution ofthe TM3 transport model. The relative importance of thesetwo effects cannot be distinguished by our model set-up.[38] Although interannual variability does not appear to
have an important influence, changes in the seasonality ofemission and deposition fluxes over the Asian region duringthe LGM do impact on the transport of dust to the Green-land ice sheet. The maximum dust deposition in the modernclimate simulation occurs in summer (Figure 10a) which is2–3 months later than the spring maximum dust depositionobserved in the ice cores [Steffensen, 1988]. In the LGMsimulation large dust deposition fluxes are found duringmost periods of the year with a clear minimum only duringautumn and a much less pronounced minimum during latespring/early summer (Figure 10b). Changes in the simulatedprecipitation regime over Greenland, in particular a shiftfrom a precipitation regime with no seasonal differentiationin the modern simulation to a regime with a pronouncedsummer maximum at the LGM, result in changes in therelative importance of wet and dry deposition. Only 28% ofthe dust deposited near Summit is removed by dry deposi-
tion in the modern simulation, while in the LGM simulation76% of the dust is dry deposited.[39] The changes in the timing of dust delivery, in the
seasonality of precipitation and in the relative importance ofwet and dry deposition at the LGM apparently combine to
Table 3. Results of a Sensitivity Study to Estimate the Influence of Glacial Surface Conditions and Glacial Wind Speed Changes on
LGM Dust Emission Fluxesa
Emissions, Mt/yrModern Surface,Modern Winds
Modern Surface,Glacial Winds
LGM Surface,Modern Winds
LGM Surface,LGM Winds
Sahara 697 ± 149 1185 ± 211 759 ± 141 1333 ± 283Arabian Peninsula 109 ± 66 154 ± 40 114 ± 58 164 ± 47Asia 101 ± 51 339 ± 31 118 ± 46 372 ± 54Australia 61 ± 18 47 ± 5 81 ± 20 62 ± 10High northern regions 15 ± 6 39 ± 17 7 ± 3 9 ± 2Exposed continental shelf – – 355 ± 27 309 ± 15Other sources 115 ± 55 203 ± 71 116 ± 50 165 ± 78Total 1098 ± 326 1968 ± 362 1550 ± 324 2414 ± 449
aListed are mean emission and 1 s standard deviation of a 3-year simulation period (chosen to produce close to the minimum, mean and maximum dustemissions of the modern and LGM 9-year dust simulation).
Figure 7. Mean monthly dust emission fluxes (Mt) fromthe Sahara/Sahel, Asia and Australia for (a) the present and(b) LGM climate. Different scales are used for themagnitude of emissions in Figures 7a and 7b.
WERNER ET AL.: VARIABILITY OF THE MODERN AND GLACIAL DUST CYCLE AAC 2 - 11

3
Figure 8. Mean seasonal patterns of dust deposition fluxes for (left) the modern and (right) the LGMclimate. The seasons are conventionally defined, as in Figure 2.
AAC 2 - 12 WERNER ET AL.: VARIABILITY OF THE MODERN AND GLACIAL DUST CYCLE
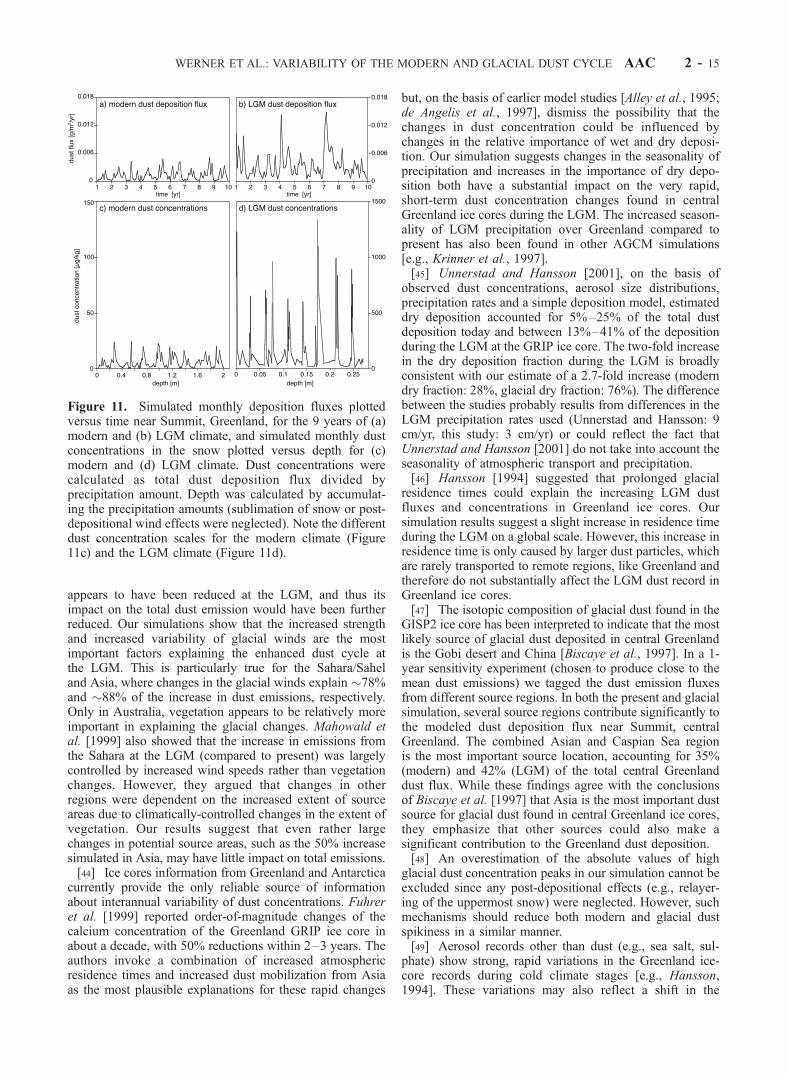
produce a considerably more spiky record of dust concen-trations at the LGM than today (Figure 11): The lack of aclear seasonal cycle in modern precipitation ensures that theseasonal cycle of the simulated dust deposition flux tocentral Greenland translates directly into a clear seasonalcycle of dust concentrations. This is observed in manyGreenland ice cores [e.g., Steffensen, 1988]. For theLGM, however, dust concentrations in the ice are increasedby the higher glacial dust emission fluxes, reduced amountof precipitation, changed seasonality of precipitation and theincreased relative importance of dry deposition processes.The combination of these effects results in very high, sharpspikes of dust concentrations. The increased interannualvariability of both the glacial deposition flux and precip-itation causes the high LGM dust spikes to be less evenlydistributed over depth than the modern ones (Figures 11cand 11d).
4. Discussion
[40] Our simulations suggest that the total dust emissionflux at the LGM was 2383 ± 308 Mt/yr, equivalent to a 2.2-fold increase in fluxes compared to present. Previoussimulations of the LGM dust cycle have produced higherestimates than this, ranging from 2700 Mt/yr [Andersen etal., 1998] to 9000 Mt/yr [Mahowald et al., 1999]. Both ofthose simulations used a tuning of the modern dust emissionsby assuming a total modern dust emission flux between 2000
Mt/yr [Andersen et al., 1998] and 3000 Mt/yr [Mahowald etal., 1999]. Our physically based estimate of 1060 Mt/yr forthe modern dust flux is lower but more plausible (seedetailed discussion by Tegen et al. [2002]). The use of anempirical tuning of the modern fluxes in the earlier simu-lations should not affect the ratio of LGM to modern fluxessignificantly since transport and deposition processes showan almost linear response to changes of the total emissionflux. Nevertheless, our 2.2-fold increase is higher than the1.3-fold increase reported by Andersen et al. [1998] andlower than the three-fold increase simulated by Mahowaldet al. [1999].[41] The simulated dust emission fluxes are highly
dependent on the prescribed 12-hour wind speed fields.Thus, the applied wind-speed relaxation of the originalECHAM4 winds towards the ECMWF values (as describedin section 2) is a crucial part of the dust modeling strategy.A sensitivity experiment with original (i.e., noncorrected)modern ECHAM4 wind fields result in an unrealisticallylow global dust emission flux (600 Mt/yr), but alsoproduces dust fluxes over parts of the Sahara and overAustralia that are too high. In contrast, the use of ECMWFwind fields in the study of Tegen et al. [2002] yieldedsimulated dust emissions, which are in fair agreement withpresent-day observations. This agreement may justify theapplied relaxation method of ECHAM4 wind speedstowards ECMWF values for the modern climate. Thevalidity of using the same correction parameters for
Figure 9. Simulated relative interannual variability (expressed as 1 s standard deviation of the 9-yearsimulation period divided by the long-time mean value) of (a) vegetation cover changes, (b) dustemission fluxes, (c) dust deposition fluxes, and (d) precipitation during the LGM climate.
WERNER ET AL.: VARIABILITY OF THE MODERN AND GLACIAL DUST CYCLE AAC 2 - 13

ECHAM4 LGM wind fields is an open question. Althoughthere have been some attempts made to reconstruct glacialwind speeds from aeolian dune formations, these estimatesonly provide (at best) information on the strength of local-scale dune-forming winds. Thus, they cannot be used to testthe validity of the correction parameters we use for theLGM.[42] Mahowald et al. [1999] made the first attempt to
account for the effects of mean glacial vegetation changeson the emission of dust particles into the atmosphere. In thisstudy we have gone a step further by considering a morediverse distribution of biome types and by taking intoaccount daily changes in vegetation phenology. The gla-cial-interglacial change in vegetation cover is somewhatreduced in our simulation compared to the changes shownbyMahowald et al. [1999]. The changes in vegetation coverover Africa, India and Australia are consistent with obser-vations [Elenga et al., 2000; J.-P. Sutra et al., Application ofa global plant functional type scheme in the reconstructionof modern and palaeovegetation of the Indian subcontinentfrom pollen, manuscript in preparation, 2002; E. Pickett etal., Pollen-based reconstructions of biome distributions forAustralia, South East Asia and the Pacific (SEAPAC region)at 0, 6000 and 18,000 14C yr B.P., manuscript in prepara-tion, 2002]. The glacial high-latitudinal source region foundin our simulation is also consistent with observations [Beget,
1996; Edwards et al., 2000]. However, we appear to over-estimate the extent of forests in Asia [Yu et al., 2000;Harrison et al., 2001] and thus probably underestimatethe extent of potential dust sources in this region. Despitethis, our estimates of the changes in dust emissions appearto be in better agreement with observations than previoussimulations, particularly in Asia and Australia [Kolla andBiscaye, 1977; Hesse, 1994; Kawahata, 2002]. GlacialAustralian dust emissions are increased by a factor of 2.1compared to modern, while Asian dust emissions increasedby a factor of 4.0.[43] The seasonal cycle of vegetation changes appears to
exert a strong influence on the seasonality of dust emissionsin Asia, both in the modern simulation and at the LGM.Under modern conditions, interannual changes in vegetationcover on the margins of the major dust source regionsinfluence the magnitude of dust emissions and provide anexplanation for at least part of the interannual variabilityseen in emissions and atmospheric dust loadings. Thelargest impacts seem to be registered in Asia, southernAfrica and Australia. However, given that the contributionof these border zones to the overall magnitude of dustemitted from each source is small, interannual changes invegetation cover are not the most important control oneither the total dust flux or its variability under modernconditions. The interannual variability of vegetation cover
Figure 10. Simulated seasonal cycle of dust deposition near Summit, centralGreenland for the (a)modernand (b) glacial climate. Mean monthly values (solid line) and the simulated 1 s variability of the 9-yearsimulation period (shaded area) are shown, as are the simulated contribution of wet (short-dashed line) anddry (long-dashed line) deposition. The relative contribution ofwet (shaded area) versus drydeposition (whitearea) and the seasonal cycle of the simulatedprecipitationamount (solid linewithmarkers) for (c)modern and(d) LGM are shown. The mean December and January values are shown twice.
AAC 2 - 14 WERNER ET AL.: VARIABILITY OF THE MODERN AND GLACIAL DUST CYCLE
appears to have been reduced at the LGM, and thus itsimpact on the total dust emission would have been furtherreduced. Our simulations show that the increased strengthand increased variability of glacial winds are the mostimportant factors explaining the enhanced dust cycle atthe LGM. This is particularly true for the Sahara/Saheland Asia, where changes in the glacial winds explain 78%and 88% of the increase in dust emissions, respectively.Only in Australia, vegetation appears to be relatively moreimportant in explaining the glacial changes. Mahowald etal. [1999] also showed that the increase in emissions fromthe Sahara at the LGM (compared to present) was largelycontrolled by increased wind speeds rather than vegetationchanges. However, they argued that changes in otherregions were dependent on the increased extent of sourceareas due to climatically-controlled changes in the extent ofvegetation. Our results suggest that even rather largechanges in potential source areas, such as the 50% increasesimulated in Asia, may have little impact on total emissions.[44] Ice cores information from Greenland and Antarctica
currently provide the only reliable source of informationabout interannual variability of dust concentrations. Fuhreret al. [1999] reported order-of-magnitude changes of thecalcium concentration of the Greenland GRIP ice core inabout a decade, with 50% reductions within 2–3 years. Theauthors invoke a combination of increased atmosphericresidence times and increased dust mobilization from Asiaas the most plausible explanations for these rapid changes
but, on the basis of earlier model studies [Alley et al., 1995;de Angelis et al., 1997], dismiss the possibility that thechanges in dust concentration could be influenced bychanges in the relative importance of wet and dry deposi-tion. Our simulation suggests changes in the seasonality ofprecipitation and increases in the importance of dry depo-sition both have a substantial impact on the very rapid,short-term dust concentration changes found in centralGreenland ice cores during the LGM. The increased season-ality of LGM precipitation over Greenland compared topresent has also been found in other AGCM simulations[e.g., Krinner et al., 1997].[45] Unnerstad and Hansson [2001], on the basis of
observed dust concentrations, aerosol size distributions,precipitation rates and a simple deposition model, estimateddry deposition accounted for 5%–25% of the total dustdeposition today and between 13%–41% of the depositionduring the LGM at the GRIP ice core. The two-fold increasein the dry deposition fraction during the LGM is broadlyconsistent with our estimate of a 2.7-fold increase (moderndry fraction: 28%, glacial dry fraction: 76%). The differencebetween the studies probably results from differences in theLGM precipitation rates used (Unnerstad and Hansson: 9cm/yr, this study: 3 cm/yr) or could reflect the fact thatUnnerstad and Hansson [2001] do not take into account theseasonality of atmospheric transport and precipitation.[46] Hansson [1994] suggested that prolonged glacial
residence times could explain the increasing LGM dustfluxes and concentrations in Greenland ice cores. Oursimulation results suggest a slight increase in residence timeduring the LGM on a global scale. However, this increase inresidence time is only caused by larger dust particles, whichare rarely transported to remote regions, like Greenland andtherefore do not substantially affect the LGM dust record inGreenland ice cores.[47] The isotopic composition of glacial dust found in the
GISP2 ice core has been interpreted to indicate that the mostlikely source of glacial dust deposited in central Greenlandis the Gobi desert and China [Biscaye et al., 1997]. In a 1-year sensitivity experiment (chosen to produce close to themean dust emissions) we tagged the dust emission fluxesfrom different source regions. In both the present and glacialsimulation, several source regions contribute significantly tothe modeled dust deposition flux near Summit, centralGreenland. The combined Asian and Caspian Sea regionis the most important source location, accounting for 35%(modern) and 42% (LGM) of the total central Greenlanddust flux. While these findings agree with the conclusionsof Biscaye et al. [1997] that Asia is the most important dustsource for glacial dust found in central Greenland ice cores,they emphasize that other sources could also make asignificant contribution to the Greenland dust deposition.[48] An overestimation of the absolute values of high
glacial dust concentration peaks in our simulation cannot beexcluded since any post-depositional effects (e.g., relayer-ing of the uppermost snow) were neglected. However, suchmechanisms should reduce both modern and glacial dustspikiness in a similar manner.[49] Aerosol records other than dust (e.g., sea salt, sul-
phate) show strong, rapid variations in the Greenland ice-core records during cold climate stages [e.g., Hansson,1994]. These variations may also reflect a shift in the
Figure 11. Simulated monthly deposition fluxes plottedversus time near Summit, Greenland, for the 9 years of (a)modern and (b) LGM climate, and simulated monthly dustconcentrations in the snow plotted versus depth for (c)modern and (d) LGM climate. Dust concentrations werecalculated as total dust deposition flux divided byprecipitation amount. Depth was calculated by accumulat-ing the precipitation amounts (sublimation of snow or post-depositional wind effects were neglected). Note the differentdust concentration scales for the modern climate (Figure11c) and the LGM climate (Figure 11d).
WERNER ET AL.: VARIABILITY OF THE MODERN AND GLACIAL DUST CYCLE AAC 2 - 15
seasonality of glacial precipitation and the strong increaseof the relative importance of dry deposition processes thatwe invoke as an explanation of the variability of dustrecords in ice cores during the LGM. Wet deposition of allaerosol species would be inhibited during glacial winter,resulting in either enhanced dry deposition (which wouldraise concentration levels in the surface snow) or the build-up of aerosol loads in the atmosphere (leading to higherwet deposition fluxes during subsequent precipitationevents). Our results indicate that such a shift of the relativeimportance of dry deposition processes during the LGM isnot confined to Greenland, but occurs over most areasnorth of 60�N. No changes of the wet to dry depositionratio are found in midlatitudinal and subtropical regions inthe LGM simulation.[50] The robustness of our results will be influenced by
the correctness of the simulated LGM climate. TheECHAM4 simulation for the LGM followed the PMIPprotocol in specifying ice sheet extent and height fromPeltier [1994] and sea-surface conditions (both sea-surfacetemperatures and sea-ice extent) from CLIMAP [CLIMAPProject Members, 1981]. Recent work suggests that certainaspects of both of these data sets may be unrealistic.[51] Recent reconstructions of tropical SSTs, based on
alkenone unsaturation ratios [Ohkouchi et al., 1994; Zhao etal., 1995; Chapman et al., 1996; Bard et al., 1997; Rosell-Mele et al., 1998; Sonzogni et al., 1998], oxygen-isotopes[Lee and Slowey, 1999] or modern-analog analyses of new(or extended) biotic assemblage data sets [Guilderson et al.,1994; Wolff et al., 1998; Mix et al., 1999; Liu et al., 2000]indicate that the tropical oceans were cooler than shown byCLIMAP [CLIMAP Project Members, 1981]. Conversely,reconstructions based on both dinoflagellate cysts [DeVernal et al., 1997; Rochon et al., 1998; de Vernal andHillaire-Marcel, 2000] and foraminiferal assemblages [Wei-nelt et al., 1996] indicate that the North Atlantic waswarmer during the summer season than shown by CLIMAP.All PMIP simulations using CLIMAP SSTs underestimatethe observed tropical cooling, and most of the models alsounderestimate the extent of glacial aridity across the tropics[Pinot et al., 1999a]. Both effects would most likely lead toa reduced vegetation cover in those areas. Thus we mightexpect our simulation to underestimate LGM dust emissionsin tropical regions. Evaluations using pollen-based recon-structions of temperature and moisture balance parametersacross Europe and Russia suggest that the underestimationof tropical SSTs at the LGM in the PMIP simulations resultsin the simulation of climates across western and centralEurope, and the eastern Mediterranean, that are too warmand wet [Kageyama et al., 2001]. These regions are notmajor dust sources in our LGM simulation. However, ifclimate were drier than simulated (as shown by the pollendata), we might expect significant dust sources to becreated. Thus, we expect our simulations to underestimatedust emissions from southern and central Europe as a resultof the prescription of CLIMAP SSTs in the tropics. Incontrast, it would appear that the use of CLIMAP SSTs inthe North Atlantic is unlikely to have a significant effect onour simulation of the LGM dust cycle. Sensitivity experi-ments with two versions of the LMD AGCM suggest thatthe impact of a warmer North Atlantic during the LGMsummer is restricted to creating warmer conditions in east-
ern North America, Europe north of the Mediterraneanregion, and western Siberia [Pinot et al., 1999b]. Thewarmer North Atlantic does not appear to impact on thehydrological cycle, and thus can be expected to have little orno effect on the area of dust sources in the midlatitudes.[52] The Peltier [1994] reconstruction of the LGM ice
sheets shows the European ice sheet as more extensive thanit was in reality [Astakhov et al., 1999]. Furthermore,according to the Peltier [1994] reconstruction the Greenlandice sheet is 500 m higher than today, whereas recentreconstructions suggest there was little difference in theheight of the Greenland ice sheet from today [Cuffey andClow, 1997]. The impact of ice over western and northernSiberia on the simulated climate and dust cycle at the LGMis uncertain. On one hand, the unrealistically extended icesheet would limit the possible extent of high-latitude sour-ces and thus reduce possible emissions. However, themagnitude and spatial extent of glacial cooling and ariditydownwind from the European ice sheet is at least partiallyinfluenced by the extent of the ice sheet. Thus, the pre-scription of an unrealistically large ice sheet would result incolder and drier conditions in the high-northern latitudes,thus creating more extensive potential dust sources. Thebalance between these two effects cannot be determinedwithout running new climate simulations. The impact of theincorrect specification of the height of the Greenland icesheet has, however, been evaluated. When the Greenland icesheet at the LGM is specified according to Peltier’s recon-struction, the simulated mean precipitation is only 3 cm/yrin central Greenland. This is 1.5–6 cm/yr lower thanestimates of the LGM precipitation derived from the GRIPand GISP2 ice cores [Johnsen et al., 1995; Cuffey and Clow,1997]. Reducing the change in elevation of the LGMGreenland ice sheet by 400 m results in a more realisticsimulation of the LGM precipitation in central Greenland[Werner et al., 2000]. However, neither imposing a morerealistic Greenland ice sheet nor more realistic SSTs in theNorth Atlantic and in the tropics substantially affects thesimulated seasonality of precipitation on Greenland [Werneret al., 2001]. Our results invoke a change in the seasonalityand interannual variability of precipitation to explain theextreme variability in dust concentration seen in the Green-land ice cores during the glacial, and thus our conclusionsare unaffected by the use of the Peltier reconstruction of theice sheets.[53] Mineral aerosols play multiple roles in the climate
system, including changing the radiative balance of theatmosphere [Intergovernmental Panel on Climate Change,2001], influencing the physical properties of clouds [Levinet al., 1996; Zhang and Carmichael, 1999; Wurzler et al.,2000], and acting as a source of micronutrients to marine[Martin, 1991; Coale et al., 1996; Hutchins and Bruland,1998] and terrestrial [Swap et al., 1992; Chadwick et al.,1999] ecosystems. The change in the radiative balance ofthe atmosphere caused by the increased glacial atmosphericdust loads could be substantial in tropical and subtropicalregions [Claquin et al., 2002]. Recent simulations suggestthat the impact of glacial fertilization of marine ecosystemswas rather small, although nonnegligible [Bopp, 2001].Given that these feedbacks can occur rather rapidly (i.e.,on subannual to decadal timescales), they may influence theinterannual variability of climate (and hence of the dust
AAC 2 - 16 WERNER ET AL.: VARIABILITY OF THE MODERN AND GLACIAL DUST CYCLE
cycle) as well as the mean climate state of the LGM.Determining how these feedbacks will impact on theLGM dust cycle, however, will require coupling a dustsources, emission, transport and deposition scheme, such asthe offline scheme used here, into a climate model.
5. Conclusions
[54] Our simulations of the atmospheric dust cycle withprescribed modern and LGM boundary conditions show thefollowing.1. There is a two- to three-fold increase of the global
atmospheric dust load during the LGM compared tomodern. This is in general agreement with previous studies.However, our improved dust emission scheme indicatessubstantially lower absolute values of total dust emissionsfor both modern and LGM climate.2. One third of the simulated increase in the total global
dust emission flux at the LGM is related to source-regionchanges, while two thirds is caused by glacial wind speedchanges over modern dust emission regions.3. The season of dust emission for most source regions is
longer in the LGM climate simulation than in the modernsimulation. In particular in central Asia strong glacial dustemissions were simulated from early winter through to latesummer in contrast to the clear modern spring maximum.4. A substantial increase in the importance of dry
deposition processes is found for most northern high-latitude regions during the LGM.5. Changes in LGM dust emissions would only produce
relatively small changes in dust deposition in Greenland.The very large observed changes in dust concentrations inGreenland ice cores can only be explained by taking intoaccount changes in the seasonal cycle of both dust emissionand of precipitation.
[55] Acknowledgments. This paper is a contribution to the MAGIC(Mineral Aerosols and Glacial-Interglacial Cycles) project, originallyfunded by the Swedish Natural Research Council (NFR) and now supportedby the Max-Planck-Institute for Biogeochemistry. M. Werner, K. E.Kohfeld, and C. Roelandt were all originally supported as postdoctoralscientists by the NFR; this support is gratefully acknowledged. We thankKerstin Sickel for assistance with the BIOME4 simulations and WolfgangCramer for providing the CLIMATE2.2 data set. The ECHAM4 simulationswere performed with support from the German Climate Computing Center(DKRZ) in Hamburg, Germany. The constructive comments and criticismsfrom two anonymous reviewers helped us improving our manuscript andare greatly appreciated.
ReferencesAlley, R., R. C. Finkel, K. Nishiizumi, S. Anandakrishnan, C. A. Shuman,G. R. Mershon, G. A. Zielinski, and P. A. Mayewski, Changes in con-tinental and sea-salt atmospheric loadings in central Greenland during themost recent deglaciation: Model-based estimates, J. Glaciol., 41, 503–514, 1995.
Andersen, K. K., A. Armengaud, and C. Genthon, Atmospheric dust underglacial and interglacial conditions, Geophys. Res. Lett., 25(13), 2281–2284, 1998.
Astakhov, V. I., J. I. Svendsen, A. Matiouchkov, J. Mangerud, O. Masle-nikova, and J. Tveranger, Marginal formations of the last Kara andBarents ice sheets in northern European Russia, Boreas, 28(1), 23–45,1999.
Bard, E., F. Rostek, and C. Sonzogni, Interhemispheric synchrony of thelast deglaciation inferred from alkenone palaeothermometry, Nature, 385,707–710, 1997.
Barnola, J. M., D. Raynaud, Y. S. Korotkevich, and C. Lorius, Vostok icecore provides 160,000-year record of atmospheric CO2, Nature, 329,408–414, 1987.
Beget, J. E., Tephrochronology and paleoclimatology of the last intergla-cial-glacial cycle recorded in Alaskan loess deposits, Quat. Int., 34(6),121–126, 1996.
Bengtsson, L., M. Botzet, and M. Esch, Hurricane-type vortices in a generalcirculation model, Tellus, Ser. A, 47, 175–196, 1995.
Berger, A. L., Long-term variations of daily insolation and Quarternaryclimatic changes, J. Atmos. Sci., 35, 2362–2367, 1978.
Biscaye, P. E., F. E. Grousset, M. Revel, S. Vandergaast, G. A. Zielinski,A. Vaars, and G. Kukla, Asian provenance of glacial dust (stage 2) in theGreenland Ice Sheet Project 2 ice core, Summit, Greenland, J. Geophys.Res., 102(C12), 26,765–26,781, 1997.
Bopp, L., Changements climatiques et biogeochimie oceanique, Ph.D. the-sis, 318 pp., Univ. Pierre et Marie Curie, Paris, France, 2001.
Braswell, B. H., D. S. Schimel, E. Linder, and B. Moore, The response ofglobal terrestrial ecosystems to interannual temperature variability,Science, 278, 870–872, 1997.
Chadwick, O. A., L. A. Derry, P. M. Vitousek, B. J. Huebert, and L. O.Hedin, Changing sources of nutrients during four million years of eco-system development, Nature, 397, 491–497, 1999.
Chapman, M. R., N. J. Shackleton, M. Zhao, and G. Eglinton, Faunal andalkenone reconstructions of subtropical North Atlantic surface hydrogra-phy and paleotemperature over the last 28 Kyr, Paleoceanography, 11(3),343–357, 1996.
Claquin, T., et al., Radiative forcing of climate by ice-age atmospheric dust,Clim. Dyn., in press, 2002.
CLIMAP Project Members, Seasonal reconstruction of the Earth surface atthe Last Glacial Maximum, Map and Chart. Ser. MC-36, Geol. Soc. ofAm., Boulder, Colo., 1981.
Coale, K. H., et al., A massive phytoplankton bloom induced by an eco-system-scale iron fertilization experiment in the Equatorial Pacific Ocean,Nature, 383, 495–501, 1996.
Coe, M. T., A linked global model of terrestrial hydrologic processes:Simulation of modern rivers, lakes, and wetlands, J. Geophys. Res.,103(D8), 8885–8899, 1998.
Cuffey, K. M., and G. D. Clow, Temperature, accumulation, and ice sheetelevation in central Greenland through the last deglacial transition,J. Geophys. Res., 102(C12), 26,383–26,396, 1997.
d’Almeida, G. A., A model for Saharan dust transport, J. Clim. Appl.Meteorol., 25(7), 903–916, 1986.
de Angelis, M., J. P. Steffensen, M. Legrand, H. Clausen, and C. Hammer,Primary aerosol (sea salt and soil dust) deposited in Greenland ice duringthe last climatic cycle: Comparison with East Antarctic records, J. Geo-phys. Res., 102(C12), 26,681–26,698, 1997.
de Vernal, A., and C. Hillaire-Marcel, Sea-ice cover, sea-surface salinityand halo-/thermocline structure of the northwest North Atlantic: Modernversus full glacial conditions, Quat. Sci. Rev., 19, 65–85, 2000.
de Vernal, A., A. Rochon, J. L. Turon, and J. Matthiessen, Organic-walledDinoflagellate cysts-Palynological tracers of sea-surface conditions inmiddle to high latitude marine environments, Geobios, 30(7), 905–920, 1997.
Douville, H., J. F. Royer, and J. F. Mahfouf, A new snow parameterizationfor the Meteo-France climate model: Validation in stand-alone experi-ments, Clim. Dyn., 12(1), 21–35, 1995.
Edwards, M. E., et al., Pollen-based biomes for Beringia 18,000, 6000 and0 C-14 yr BP, J. Biogeogr., 27(3), 521–554, 2000.
Elenga, H., et al., Pollen-based biome reconstruction for southern Europeand Africa 18,000 yr BP, J. Biogeogr., 27(3), 621–634, 2000.
Food and Agriculture Organization, Digital soil map of the world andderived soil properties, report, Rome, 1995.
Fuhrer, K., E. W. Wolff, and S. J. Johnsen, Timescales for dust variability inthe Greenland Ice Core Project (GRIP) ice core in the last 100,000 years,J. Geophys. Res., 104(D24), 31,043–31,052, 1999.
Genthon, C., and A. Armengaud, GCM simulations of atmospheric tracersin the polar latitudes-South Pole (Antarctica) and Summit (Greenland)cases, Sci. Total Environ., 161, 101–116, 1995.
Gillette, D. A., A qualitative geophysical explanation for ‘‘hot spot’’ dustemitting source regions, Contrib. Atmos. Phys., 72, 67–77, 1999.
Ginoux, P., M. Chin, I. Tegen, J. M. Prospero, B. Holben, O. Dubovik, andS. J. Lin, Sources and distributions of dust aerosols simulated with theGOCART model, J. Geophys. Res., 106(D17), 20,255–20,273, 2001.
Guilderson, T. P., R. G. Fairbanks, and J. L. Rubenstone, Tropical tempera-ture variations since 20,000 years ago: Modulating interhemispheric cli-mate change, Science, 263, 663–665, 1994.
Hansson, M. E., The Renland ice core-A Northern Hemisphere record ofaerosol composition over 120,000 years, Tellus, Ser. B, 46, 390–418, 1994.
Harrison, S. P., G. Yu, H. Takahara, and I. C. Prentice, Diversity of tempe-rate plants in East Asia, Nature, 413, 129–130, 2001.
Haxeltine, A., I. C. Prentice, and I. D. Creswell, A coupled carbon andwater flux model to predict vegetation structure, J. Veg. Sci., 7(5), 651–666, 1996.
WERNER ET AL.: VARIABILITY OF THE MODERN AND GLACIAL DUST CYCLE AAC 2 - 17
Heimann, M., The global atmospheric tracer model TM2 (model descrip-tion and user manual), Tech. Rep. 10, 47 pp., Deutsches Klimarechenzen-trum, Hamburg, Germany, 1995.
Herman, J. R., P. K. Bhartia, O. Torres, C. Hsu, C. Seftor, and E. Celarier,Global distribution of UV-absorbing aerosols from Nimbus 7/TOMSdata, J. Geophys. Res., 102(D14), 16,911–16,922, 1997.
Hesse, P. P., The record of continental dust from Australia in Tasman Seasediments, Quat. Sci. Rev., 13, 257–272, 1994.
Hu, F. S., D. Slawinski, H. E. Wright, E. Ito, R. G. Johnson, K. R. Kelts,R. F. McEwan, and A. Boedigheimer, Abrupt changes in North Americanclimate during early Holocene times, Nature, 400, 437–440, 1999.
Husar, R. B., J. M. Prospero, and L. L. Stowe, Characterization of tropo-spheric aerosols over the oceans with the NOAA advanced very highresolution radiometer optical thickness operational product, J. Geophys.Res., 102(D14), 16,889–16,909, 1997.
Hutchins, D. A., and K. W. Bruland, Iron-limited diatom growth and Si/Nuptake ratios in a coastal upwelling regime, Nature, 393, 561–564,1998.
Intergovernmental Panel on Climate Change, Climate Change 2001: TheScientific Basis: Contribution of Working Group I to The Third Assess-ment Report of the Intergovernmental Panel on Climate Change, editedby J. T. Houghton et al., 881 pp., Cambridge Univ. Press, New York,2001.
Iwasaka, Y., H. Minoura, and K. Nagaya, The transport and spatial scale ofAsian dust-storm clouds-A case-study of the dust-storm event of April1979, Tellus, Ser. B, 35, 189–196, 1983.
Jackson, R. B., J. Canadell, J. R. Ehleringer, H. A. Mooney, O. E. Sala, andE. D. Schulze, A global analysis of root distributions for terrestrialbiomes, Oecologia, 108(3), 389–411, 1996.
Johnsen, S. J., D. Dahl-Jensen, W. Dansgaard, and N. S. Gundestrup,Greenland paleotemperatures derived from GRIP bore hole temperatureand ice core isotope profiles, Tellus, Ser. B, 47, 624–629, 1995.
Joussaume, S., Three-dimensional simulation of the atmospheric cycle ofdesert dust particles using a general circulation model, J. Geophys. Res.,95(D2), 1909–1941, 1990.
Joussaume, S., and K. E. Taylor, Status of the Paleoclimate ModellingIntercomparison Project (PMIP), in First International AMIP ScientificConference, pp. 425–430, World Clim. Res. Programme, Geneva, 1995.
Kageyama, M., O. Peyron, S. Pinot, P. Tarasov, J. Guiot, S. Joussaume, andG. Ramstein, The Last Glacial Maximum climate over Europe and wes-tern Siberia: A PMIP comparison between models and data, Clim. Dyn.,17(1), 23–43, 2001.
Kaplan, J. O., Geophysical applications of vegetation modeling, Ph.D.thesis, Dep. of Ecol., Lund Univ., Lund, Sweden, 2001.
Kawahata, H., Shifts in oceanic and atmospheric boundaries in the Tas-man Sea (Southwest Pacific) during the late Pleistocene: Evidence fromorganic carbon and lithogenic fluxes, Palaeogeogr. Palaeoclimatol.Palaeoecol., 2771, 1–25, 2002.
Knorr, W., and M. Heimann, Impact of drought stress and other factors onseasonal land biosphere CO2 exchange studied through an atmospherictracer transport model, Tellus, Ser. B, 47, 471–489, 1995.
Kohfeld, K. E., and S. P. Harrison, DIRTMAP: The geological record ofdust, Earth Sci. Rev., 54, 81–114, 2001.
Kolla, V., and P. E. Biscaye, Distribution and origin of quartz in sedimentsof Indian ocean, J. Sediment. Petrol., 47(2), 642–649, 1977.
Krinner, G., C. Genthon, and J. Jouzel, GCM analysis of local influences onice core delta signals, Geophys. Res. Lett., 24(22), 2825–2828, 1997.
Lee, K. E., and N. C. Slowey, Cool surface waters of the subtropical NorthPacific Ocean during the last glacial, Nature, 397, 512–514, 1999.
Levin, Z., E. Ganor, and V. Gladstein, The effects of desert particles coatedwith sulfate on rain formation in the Eastern Mediterranean, J. Appl.Meteorol., 35(9), 1511–1523, 1996.
Liu, Z., S. Shin, P. Behling, W. Prell, M. Trend-Staid, S. P. Harrison, andJ. E. Kutzbach, Dynamical and observational constraints on tropical Pa-cific sea surface temperatures at the Last Glacial Maximum, Geophys.Res. Lett., 27(1), 105–108, 2000.
Mahowald, N., K. Kohfeld, M. Hansson, Y. Balkanski, S. P. Harrison, I. C.Prentice, M. Schulz, and H. Rodhe, Dust sources and deposition duringthe Last Glacial Maximum and current climate: A comparison of modelresults with paleodata from ice cores and marine sediments, J. Geophys.Res., 104(D13), 15,895–15,916, 1999.
Marticorena, B., and G. Bergametti, Modeling the atmospheric dust cycle:Design of a soil-derived dust emission scheme, J. Geophys. Res.,100(D8), 16,415–16,430, 1995.
Martin, J. H., Iron still comes from above, Nature, 353, 123, 1991.Mayewski, P. A., et al., Changes in atmospheric circulation and ocean icecover over the North Atlantic during the last 41,000 years, Science, 263,1747–1751, 1994.
Mayewski, P. A., L. D. Meeker, M. S. Twickler, S. Whitlow, Q. Z. Yang,W. B. Lyons, and M. Prentice, Major features and forcing of high-latitude
Northern Hemisphere atmospheric circulation using a 110,000-year-longglaciochemical series, J. Geophys. Res., 102(C12), 26,345–26,366,1997.
McTainsh, G. H., Quaternary aeolian dust processes and sediments in theAustralian region, Quat. Sci. Rev., 8, 235–253, 1989.
Middleton, N. J., and A. S. Goudie, Saharan dust: Sources and trajectories,Trans. Inst. Brit. Geogr., 26(2), 165–181, 2001.
Middleton, N. J., A. S. Goudie, and G. L. Wells, The frequency and sourceareas of dust storms, in Aeolian Geomorphology, edited by W. G. Wick-ling, pp. 237–260, Inst. of Brit. Geogr., London, 1986.
Mix, A. C., A. E. Morey, N. G. Pisias, and S. W. Hostetler, Foraminiferalfaunal estimates of paleotemperature: Circumventing the no-analog pro-blemyields cool ice age tropics,Paleoceanography,14(3), 350–359, 1999.
Monsi, M., and T. Saeki, Uber den Lichtfaktor in den Pflanzengesellschaf-ten und seine Bedeutung fur die Stoffproduktion, Jpn. J. Bot., 14, 22–52,1953.
Ohkouchi, N., K. Kawamura, T. Nakamura, and A. Taira, Small changes inthe sea-surface temperature during the last 20,000 Years: Molecular evi-dence from the western tropical Pacific, Geophys. Res. Lett., 21(20),2207–2210, 1994.
Orgill, M. M., and G. A. Sehmel, Frequency and diurnal variation of duststorms in contiguous U.S.A., Atmos. Environ., 10(10), 813–825, 1976.
Parungo, F., et al., Asian dust storms and their effects on radiation andclimate, Tech. Rep. STC2906, Natl. Oceanic and Atmos. Admin., SilverSpring, Md., 1995.
Peltier, W. R., Ice age paleotopography, Science, 265, 195–201, 1994.Pinot, S., G. Ramstein, S. P. Harrison, I. C. Prentice, J. Guiot, M. Stute, andS. Joussaume, Tropical paleoclimates at the Last Glacial Maximum:Comparison of Paleoclimate Modeling Intercomparison Project (PMIP)simulations and paleodata, Clim. Dyn., 15(11), 857–874, 1999a.
Pinot, S., G. Ramstein, I. Marsiat, A. de Vernal, O. Peyron, J. C. Duplessy,and M. Weinelt, Sensitivity of the European LGM climate to NorthAtlantic sea-surface temperature, Geophys. Res. Lett., 26(13), 1893–1896, 1999b.
Prospero, J. M., The Atmospheric Transport of Particles to the Ocean, JohnWiley, New York, 1996.
Prospero, J. M., and R. T. Nees, Impact of the North African drought and ElNino on mineral dust in the Barbados trade winds, Nature, 320, 735–738, 1986.
Pye, K., Aeolian Dust and Dust Deposits, 334 pp., Academic, San Diego,Calif., 1987.
Pye, K., and L.-P. Zhou, Late Pleistocene and Holocene aeolian dust de-position in north China and the northwest Pacific Ocean, Palaeogeogr.Palaeoclimatol. Palaeoecol., 73, 11–23, 1989.
Ram, M., and G. Koenig, Continuous dust concentration profile of pre-Holocene ice from the Greenland Ice Sheet Project 2 ice core: Duststadials, interstadials, and the Eemian, J. Geophys. Res., 102(C12),26,641–26,648, 1997.
Ram, M., M. Stolz, and G. Koenig, Eleven year cycle of dust concentrationvariability observed in the dust profile of the GISP2 ice core from CentralGreenland: Possible solar cycle connection, Geophys. Res. Lett., 24(19),2359–2362, 1997.
Rochon, A., A. de Vernal, H. P. Sejrup, and H. Haflidason, Palynologicalevidence of climatic and oceanographic changes in the North Sea duringthe last deglaciation, Quat. Res., 49(2), 197–207, 1998.
Roeckner, E., K. Arpe, L. Bengtsson, M. Christoph, M. Claussen, L. Du-menil, M. Esch, M. Giorgetta, U. Schlese, and U. Schulzweida, Theatmospheric general circulation model ECHAM4: Model descriptionand simulation of present-day climate, Tech. Rep. 218, Max-Planck-Inst.for Meteorol., Hamburg, Germany, 1996.
Roelandt, C., Coupled simulation of potential natural vegetation, terrestrialcarbon balance and physical land-surface properties with the ALBIOCmodel, Ecol. Model., 143(3), 191–214, 2001.
Rosell-Mele, A., M. Weinelt, M. Sarnthein, N. Koc, and E. Jansen, Varia-bility of the Arctic front during the last climatic cycle: Application of anovel molecular proxy, Terra Nova, 10(2), 86–89, 1998.
Sokolik, I. N., and O. B. Toon, Direct radiative forcing by anthropogenicairborne mineral aerosols, Nature, 381, 681–683, 1996.
Sonzogni, C., E. Bard, and F. Rostek, Tropical sea-surface temperaturesduring the last glacial period: A view based on alkenones in Indian Oceansediments, Quat. Sci. Rev., 17(12), 1185–1201, 1998.
Steffensen, J. P., Analysis of the seasonal variation in dust, Cl�, NO3� and
SO42� in two central Greenland firn cores, Ann. Glaciol., 10, 171–177,
1988.Swap, R. M., M. Garstang, S. Greco, R. Talbot, and P. Kallberg, Saharandust in the Amazon basin, Tellus, Ser. B, 44, 133–149, 1992.
Taylor, K. C., C. U. Hammer, R. B. Alley, H. B. Clausen, D. Dahl-Jensen,A. J. Gow, N. S. Gundestrup, J. Kipfstuhl, J. C. Moore, and E. D.Waddington, Electrical conductivity measurements from the GISP2 andGRIP Greenland ice cores, Nature, 366, 549–552, 1993.
AAC 2 - 18 WERNER ET AL.: VARIABILITY OF THE MODERN AND GLACIAL DUST CYCLE

Tegen, I., and I. Fung, Contribution to the atmospheric mineral aerosol loadfrom land surface modification, J. Geophys. Res., 100(D9), 18,707–18,726, 1995.
Tegen, I., S. P. Harrison, K. Kohfeld, I. C. Prentice, M. Coe, and M.Heimann, The impact of vegetation and preferential source areas onglobal dust aerosols: Results from a model study, J. Geophys. Res.,107, 4576, doi:10.1029/2001JD000963, 2002.
Unnerstad, L., and M. Hansson, Simulated airborne particle size distribu-tions over Greenland during Last Glacial Maximum, Geophys. Res. Lett.,28(2), 287–290, 2001.
Weinelt, M., M. Sarntheim, U. Pflaumann, H. Schulz, S. Jung, and H.Erlenkeuser, Ice-free Nordic Seas during the Last Glacial Maximum?Potential sites of deepwater formation, Paleoclimates, 1, 283–309, 1996.
Werner, M., U. Mikolajewicz, M. Heimann, and G. Hoffmann, Boreholeversus isotope temperatures on Greenland: Seasonality does matter, Geo-phys. Res. Lett., 27(5), 723–726, 2000.
Werner, M., M. Heimann, and G. Hoffmann, Isotopic composition andorigin of polar precipitation in present and glacial climate simulations,Tellus, Ser. B, 53, 53–71, 2001.
Wolff, T., S. Mulitza, H. Arz, J. Patzold, and G. Wefer, Oxygen isotopesversus CLIMAP (18 ka) temperatures—A comparison from the tropicalAtlantic, Geology, 26(8), 675–678, 1998.
Wurzler, S., T. G. Reisin, and Z. Levin, Modification of mineral dustparticles by cloud processing and subsequent effects on drop size dis-tributions, J. Geophys. Res., 105(D4), 4501–4512, 2000.
Yu, G., et al., Palaeovegetation of China: A pollen data-based synthesis forthe mid-Holocene and Last Glacial Maximum, J. Biogeogr., 27(3), 635–664, 2000.
Zhang, Y., and G. R. Carmichael, The role of mineral aerosol in tropo-spheric chemistry in East Asia—A model study, J. Appl. Meteorol.,38(3), 353–366, 1999.
Zhao, M., N. A. S. Beveridge, N. J. Shackleton, M. Sarnthein, and G.Eglinton, Molecular stratigraphy of cores off northwest Africa: Sea sur-face temperature history over the last 80 ka, Paleoceanography, 10(3),661–675, 1995.
Zobler, L., A world soil file for global climate modeling, NASA Tech. Rep.TM-87802, 32 pp., 1986.
Zolitschka, B., A. Brauer, J. F. W. Negendank, H. Stockhausen, and A.Lang, Annually dated late Weichselian continental paleoclimate recordfrom the Eifel, Germany, Geology, 28(9), 783–786, 2000.
�����������������������Y. Balkanski, Laboratoire des Sciences du Climat et de l’Environnement,
U.M.R. CEA-CNRS, F-91191 Gif-sur-Yvette Cedex, France. ([email protected])S. P. Harrison, K. E. Kohfeld, I. C. Prentice, I. Tegen, and M. Werner,
Max-Planck-Institute for Biogeochemistry, Postbox 100164, D-07701 Jena,Germany. ([email protected]; [email protected]; [email protected]; [email protected];[email protected])H. Rodhe, Department of Meteorology, Stockholm University, S-10691
Stockholm, Sweden. ([email protected])C. Roelandt, Department of Geography, Universite catholique de
Louvain, Place Louis Pasteur 3, B-1348 Louvain-la-Neuve, Belgium.([email protected])
WERNER ET AL.: VARIABILITY OF THE MODERN AND GLACIAL DUST CYCLE AAC 2 - 19