Sea Surface Temperature Variability at the Scripps Institution ...
16
Sea Surface Temperature Variability at the Scripps Institution of Oceanography Pier* DAVID M. CHECKLEY JR. AND MARTIN LINDEGREN 1 Scripps Institution of Oceanography, University of California, San Diego, La Jolla, California (Manuscript received 29 October 2013, in final form 21 July 2014) ABSTRACT Sea surface temperature (SST) has been measured from near the end of the Scripps Institution of Oceanography (SIO) pier daily since 1916. It is one of the world’s longest instrumental time series of SST. It is widely used in studies of climate and marine ecosystems and in fisheries management. The authors hypoth- esized that a discontinuity exists in 1988, when the old pier was replaced with the present pier. A regression of annual-mean SST at SIO (SST SIO ) on the Pacific decadal oscillation index for 1916–87 was used to predict annual-mean SST (SST SIO, PDO ) for 1916–present. The residual (ResSST SIO 5 SST SIO 2 SST SIO,PDO ) time series shows a positive discontinuity in 1988, when the present SIO pier was first used to measure SST SIO . No discontinuity in 1988 was observed for ResSST at 12 other shore stations or in nearby waters. Use of the first principal component of other shore station time series of annual-mean SST as the predictor yields similar results. SST SIO measured over 3 days shows a diel cycle and short-term variability consistent with rip current transport of warm surf-zone water to the end of the SIO pier. This study hypothesizes that rip current transport increased with the change from the old to the present pier and contributed to the observed dis- continuity in SIO pier SST. The authors estimate an artifact of about 10.458C due to both rapid (1988 pier change) and gradual processes. Adjusting the SIO pier SST time series for this artifact reduces the long-term trend from 11.18 to 10.68C century 21 , consistent with the global rate of change of SST over the past century. 1. Introduction SST has been measured daily from the Scripps In- stitution of Oceanography (SIO) pier (La Jolla, Cal- ifornia; 32852.0 0 N, 117815.5 0 W) since 22 August 1916 (Fig. 1a). It is widely used in studies of ocean climate and marine ecosystems (Tegner et al. 1996; Gargett 1997; Mantua et al. 1997; Schwing and Mendelssohn 1997; McGowan et al. 1998; Dayton et al. 1999; Hare and Mantua 2000; Hobday and Tegner 2002; Lavaniegos and Ohman 2003; Hsieh et al. 2005; Breaker 2007; Breaker and Flora 2009; Kim et al. 2009; Mackas and Beaugrand 2010; Parnell et al. 2010; Hatch 2012; Sugihara et al. 2012; Deyle et al. 2013; Hatch et al. 2013; Jacobson and McClatchie 2013; Lindegren et al. 2013; Miller and McGowan 2013) and fisheries management (Jacobson and MacCall 1995; McClatchie et al. 2010; Lindegren and Checkley 2013). The SIO pier SST (SST SIO ) has increased more rapidly (1 1.18C century 21 ) than global SST (1 0.78C century 21 ), indicating faster coastal than oceanic warming (Smith et al. 2008; Kadir et al. 2013). In 1988, the SIO pier, hereinafter termed the old pier (305 m long), was replaced with the present pier (322 m long). We hypothe- sized that the change in measurement of SST SIO from the old to the present SIO pier caused a discontinuity in the time series of annual-mean SST SIO . A standard protocol to measure SIO pier SST has been used since 1916. A weighted bucket is lowered through an opening in the pier by means of a hand winch and wire, filled, and raised to the pier deck. Temperature is measured immediately to 0.18C. The change from mercury to digital (thermistor) thermometers occurred gradually between 2008 and 2010 (M. Carter, SIO, 2013, personal communication). The sampling location on the * Supplemental information related to this paper is available at the Journals Online website: http://dx.doi.org/10.1175/JPO-D-13- 0237.s1. 1 Current affiliation: Centre for Ocean Life, National Institute of Aquatic Resources, Technical University of Denmark, Charlot- tenlund, Denmark. Corresponding author address: David M. Checkley, Jr., Scripps Institution of Oceanography, University of California, San Diego, 9500 Gilman Drive, La Jolla, CA 92093-0218. E-mail: [email protected] NOVEMBER 2014 CHECKLEY AND LINDEGREN 2877 DOI: 10.1175/JPO-D-13-0237.1 Ó 2014 American Meteorological Society
-
Upload
khangminh22 -
Category
Documents
-
view
2 -
download
0
Transcript of Sea Surface Temperature Variability at the Scripps Institution ...

Sea Surface Temperature Variability at the Scripps Institution ofOceanography Pier
DAVID M CHECKLEY JR AND MARTIN LINDEGREN1
Scripps Institution of Oceanography University of California San Diego La Jolla California
(Manuscript received 29 October 2013 in final form 21 July 2014)
ABSTRACT
Sea surface temperature (SST) has been measured from near the end of the Scripps Institution of
Oceanography (SIO) pier daily since 1916 It is one of the worldrsquos longest instrumental time series of SST It is
widely used in studies of climate and marine ecosystems and in fisheries management The authors hypoth-
esized that a discontinuity exists in 1988 when the old pier was replaced with the present pier A regression of
annual-mean SST at SIO (SSTSIO) on the Pacific decadal oscillation index for 1916ndash87 was used to predict
annual-mean SST (SSTSIO PDO) for 1916ndashpresent The residual (ResSSTSIO 5 SSTSIO 2 SSTSIOPDO) time
series shows a positive discontinuity in 1988 when the present SIO pier was first used to measure SSTSIO No
discontinuity in 1988 was observed for ResSST at 12 other shore stations or in nearby waters Use of the first
principal component of other shore station time series of annual-mean SST as the predictor yields similar
results SSTSIO measured over 3 days shows a diel cycle and short-term variability consistent with rip current
transport of warm surf-zone water to the end of the SIO pier This study hypothesizes that rip current
transport increased with the change from the old to the present pier and contributed to the observed dis-
continuity in SIO pier SST The authors estimate an artifact of about 10458C due to both rapid (1988 pier
change) and gradual processes Adjusting the SIO pier SST time series for this artifact reduces the long-term
trend from1118 to1068Ccentury21 consistent with the global rate of change of SST over the past century
1 Introduction
SST has been measured daily from the Scripps In-
stitution of Oceanography (SIO) pier (La Jolla Cal-
ifornia 3285200N 11781550W) since 22 August 1916
(Fig 1a) It is widely used in studies of ocean climate and
marine ecosystems (Tegner et al 1996 Gargett 1997
Mantua et al 1997 Schwing and Mendelssohn 1997
McGowan et al 1998 Dayton et al 1999 Hare and
Mantua 2000 Hobday and Tegner 2002 Lavaniegos and
Ohman 2003 Hsieh et al 2005 Breaker 2007 Breaker
and Flora 2009 Kim et al 2009 Mackas and Beaugrand
2010 Parnell et al 2010 Hatch 2012 Sugihara et al
2012 Deyle et al 2013 Hatch et al 2013 Jacobson and
McClatchie 2013 Lindegren et al 2013 Miller and
McGowan 2013) and fisheries management (Jacobson
andMacCall 1995McClatchie et al 2010 Lindegren and
Checkley 2013) The SIO pier SST (SSTSIO) has increased
more rapidly (1 118Ccentury21) than global SST (1078Ccentury21) indicating faster coastal than oceanic
warming (Smith et al 2008 Kadir et al 2013) In 1988 the
SIO pier hereinafter termed the old pier (305m long) was
replaced with the present pier (322m long) We hypothe-
sized that the change in measurement of SSTSIO from the
old to the present SIO pier caused a discontinuity in the
time series of annual-mean SSTSIO
A standard protocol to measure SIO pier SST has
been used since 1916 A weighted bucket is lowered
through an opening in the pier by means of a hand winch
andwire filled and raised to the pier deck Temperature
is measured immediately to 018C The change from
mercury to digital (thermistor) thermometers occurred
gradually between 2008 and 2010 (M Carter SIO 2013
personal communication) The sampling location on the
Supplemental information related to this paper is available at
the Journals Online website httpdxdoiorg101175JPO-D-13-
0237s11Current affiliation Centre forOceanLife National Institute of
Aquatic Resources Technical University of Denmark Charlot-
tenlund Denmark
Corresponding author address David M Checkley Jr Scripps
Institution of Oceanography University of California San Diego
9500 Gilman Drive La Jolla CA 92093-0218
E-mail dcheckleyucsdedu
NOVEMBER 2014 CHECKLEY AND L INDEGREN 2877
DOI 101175JPO-D-13-02371
2014 American Meteorological Society
present pier is4m seaward of that on the old pier The
time of sampling has varied between 0800 and 1700 h
local time (LT) (SIO Shore Stations program www
shorestationucsdedu)
To test our hypothesis of a discontinuity in 1988 in the
time series of annual-mean SSTSIO we first account for
large-scale natural variability and then apply two types
of tests for discontinuity We account for long-term
natural variability by predicting annual-mean SSTSIO
using regressions of observed annual-mean SSTSIO on
two predictors the Pacific decadal oscillation (PDO)
(Mantua et al 1997) and the first principal component
(PC1) of SST time series for shore stations to the north
of the SIO pier We then use two types of tests for dis-
continuity in the time series of residuals between pre-
dicted and observed values of annual-mean SSTSIO This
allows for four tests (two time series and two test types)
of our hypothesis We then present and analyze a 3-day
time series of SSTSIO using a new instrument After
presenting our results we discuss rip current transport of
warm surf-zone water as a possible cause of the observed
discontinuity and implications of our study
2 Materials and methods
Temperature data are from the SIO Shore Stations
program covering the entire US West Coast (www
shorestationucsdedu) and for waters off Southern
California from the California Cooperative Oceanic
Fisheries Investigations (CalCOFI) program (http
calcofiorgdatahtml) and the extended reconstructed
sea surface temperature (ERSSTv3b) gridded rean-
alysis of global SST (ftpftpncdcnoaagovpubdata
cmbersst) (Smith et al 2008) Large-scale variability in
SSTSIO may mask the smaller hypothesized variability
associated with the change in piers For example sig-
nificant discontinuities in the daily SST time series at
SIO and Pacific Grove in 1977 and 1989 have been
identified (Breaker 2007) We accounted for natural
large-scale variability by standardizing each annual-
mean SST time series using an underlying large-scale
reference (predictor) variable We tested five variables
(Table 1) Selection of the variable with greatest ex-
planatory power was objective The PDO the first
principal component of the time series of detrended
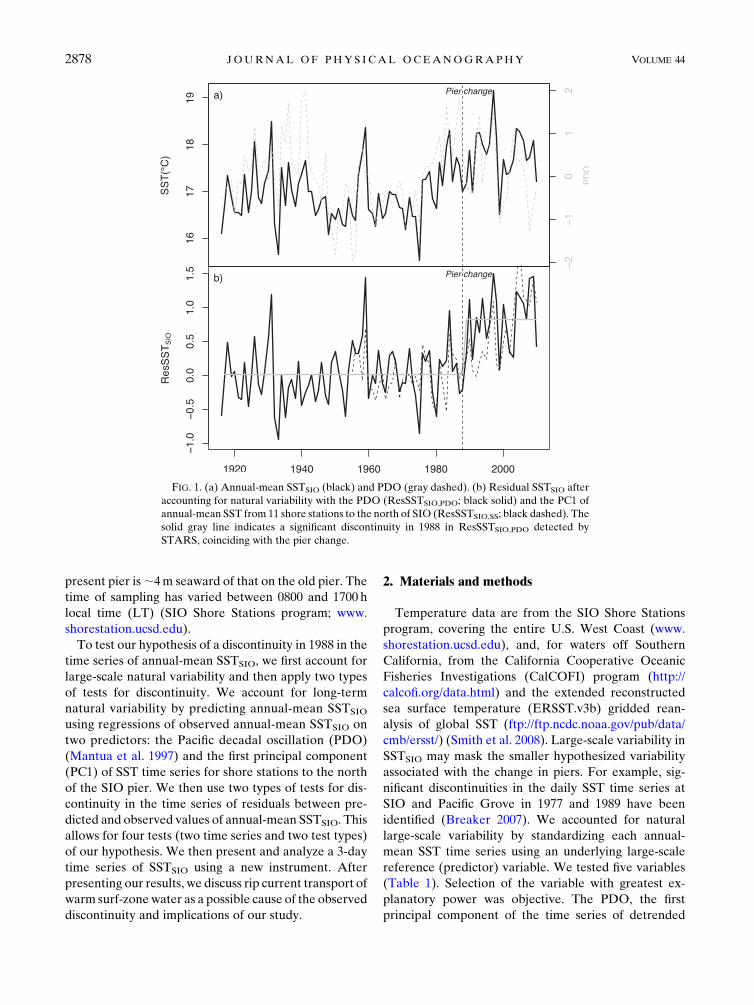
FIG 1 (a) Annual-mean SSTSIO (black) and PDO (gray dashed) (b) Residual SSTSIO after
accounting for natural variability with the PDO (ResSSTSIOPDO black solid) and the PC1 of
annual-mean SST from 11 shore stations to the north of SIO (ResSSTSIOSS black dashed) The
solid gray line indicates a significant discontinuity in 1988 in ResSSTSIOPDO detected by
STARS coinciding with the pier change
2878 JOURNAL OF PHYS ICAL OCEANOGRAPHY VOLUME 44
anomalies of SST poleward of 208N in the North Pacific
(Mantua et al 1997) explained most variability in
annual-mean SSTSIO (Table 2) Four other indexes [ie
themultivariate ENSO index (MEI) North PacificGyre
Oscillation (NPGO) Southern Oscillation index (SOI)
and Northern Oscillation index (NOI)] did not explain
significantly more variability in annual-mean SSTSIO
and thus were not further considered (Tables 1 2) Annual-
mean SST fromERSSTv3b for nine data blocks (318ndash378N
east of 1238W) explained a relatively small amount of
variability in annual-mean SSTSIO (R2 5 0097 p 50004) and was not further considered as a predictor
We first fit a linear regression to the annual-mean SST
(response) with the PDO (predictor) from the start of
each time series through 1987 (ie the last full year the
old pier was in use) then predicted the annual-mean
SST over the entire time series (eg 1916ndashpresent for
SIO) and finally computed the residuals between pre-
dicted and observed values (ResSSTSIOPDO for SIO)
This was done for each time series (Table 3)We applied
two statistical methods for identifying discontinuities
(i) the sequential t test analysis of regime shifts
(STARS) with a significance value p of 001 and a cutoff
length of 10 yr (Rodionov 2004) and (ii) a generalized
fluctuation test based on the cumulative sumof recursive
residuals of ordinary least squares residuals (OLS-CU-
SUM) with 95 confidence intervals (Brown et al 1975
Ploberger and Kraumlmer 1992) Neither method makes an
a priori assumption about the existence of discontinu-
ities We also investigated whether the relationship be-
tween annual-mean SSTSIO and the PDO remained
stable throughout the period by estimating the intercept
and slope of the linear regression (as described above)
over a sliding window of 10 yr for the entire period
To assess whether detrending in computing the PDO
(Mantua et al 1997) affects our results we subtracted
annual values of the global annual-mean SST anomaly
(httpwwwncdcnoaagovcagtime-seriesglobal) used
to calculate the PDO from the annual-mean SSTSIO
We used the same subset of global SST anomaly ob-
servations as used by Mantua et al (1997) This grid file
is available online (at ftpftpatmoswashingtonedu
mantuapdofilesgridtempglob_ocean977) We then
repeated our analyses using the PDO as the predictor
and STARS and OLS-CUSUM as the test types
We created a second predictor using time series of
annual-mean SST from other shore stations For each
annual-mean SST time series (response) the first
principal component (PC1SS) of all the remaining
times series (10 or 11) was used as a predictor variable
(Table 4)We excluded SIO and San Clemente (SC) due
to discontinuities based on the STARS and OLS-
CUSUM analyses Residuals were computed as de-
scribed above but using PC1SS (eg ResSSTSIOSS for
SIO) and tested for discontinuities using STARS and
OLS-CUSUM
To measure the variation of SIOSST on the scale of
minutes we created the continuous sea surface temper-
ature (CSST) instrument (Fig 2) The CSST instrument
consists of two floats connected by an articulated arm
The vertical float tracks the water surface while sur-
rounding a plastic-coated wire suspended through the
same opening in the SIO pier through which the standard
SSTSIO bucket sample is taken and held taut by a 10-kg
weight 1m above the bottom The horizontal float has
a data loggerwith temperature sensor (OnsetU12ndash015ndash02)
attached to its lower surface The sensor has a 25-s re-
sponse time and temperature is recorded every minute
TABLE 1 Climate covariates used in model fitting
Abbreviation Variable Source
PDO Pacific decadal oscillation httpjisaowashingtonedupdoPDOlatest
MEI Multivariate ENSO index httpwwwesrlnoaagovpsddatacorrelationmeidata
NPGO North Pacific Gyre Oscillation httpwwwo3dorgnpgo
SOI Southern Oscillation index httpwwwesrlnoaagovpsddatacorrelationsoidata
NOI Northern Oscillation index httpwwwesrlnoaagovpsddatacorrelationnoidata
TABLE 2Model selection Based on likelihood ratio tests andAkaike Information Criterion (AIC) scores (Akaike 1974)R2adj (adjusted
R2) is explained variance p is significance of the likelihood ratio test andN is degrees of freedom Number 4 is the final model MEI was
excluded during model fitting (r 5 062 n 5 93 and p 00001) due to colinearity with the PDO
No Model AIC R2adj () p N
1 SSTSIO a 1 PDO 1 SOI 1NPGO 1 NOI 1 laquo 531 484 33
2 SSTSIO a 1 PDO 1 SOI 1NPGO 1 laquo 511 499 094 34
3 SSTSIO a 1 PDO 1 NPGO 1 laquo 491 514 098 35
4 SSTSIO a 1 PDO 1 laquo 478 518 042 36
NOVEMBER 2014 CHECKLEY AND L INDEGREN 2879
to 0018C Visual observations from above and in the
water showed the temperature sensor to be 1ndash4 cm be-
low the sea surface thus measuring the lsquolsquotrue bulkrsquorsquo SST
(cf Webster et al 1996) SST from the bucket sample
and CSST instrument were indistinguishable
The CSST instrument was deployed 7ndash10 July 2014
from the SIO pier Air temperature and water level
relative to mean lower low water (MLLW) at the SIO
pier were recorded every 6min and available from the
National Oceanic and Atmospheric Administration
(NOAA) (httptidesandcurrentsnoaagovstationhome
htmlid59410230) Significant wave height (HS the
average of the 13 of the highest waves) every hour at the
SIO pier was available from the Coastal Data Infor-
mation Program (httpcdipucsdeduximg5searchamp
xsearch5073ampxsearch_type5Station_ID) A double
running-mean procedure (zero-phase digital filter) was
used to smooth the time series of SSTSIO from the CSST
instrument using averaging windows of four lengths
(30ndash240min) Power spectra were computed for the
time series of residuals The same data logger with the
temperature sensor as used on the CSST instrument was
lowered from the SIO pier and submerged completely at
multiple locations in the surf zone on 14 July 2014 These
measurements were compared with SSTSIO measured
immediately afterward using the CSST instrument to
test the hypothesis that water in the surf zone is warmer
than SSTSIO
Statistical analyses were conducted using the R soft-
ware version 2121 (wwwr-projectorg)Matlab (R2013b
MathWorks Natick Massachusetts) and the Excel add-
in software for STARS (wwwberingclimatenoaagov)
3 Results
The PDO and PC1SS accounted for significant vari-
ability in annual-mean SST at stations along the US
West Coast through 1987 with highly significant linear
regression parameters overall (Tables 3 4) except for
a nonsignificant slope for Charleston (CHA) and the
PDO (Table 3) Regression slope did not vary with
shore station latitude (Kendallrsquos rank correlation t 52010 p 5 067 and n 5 13) while the intercept de-
creased significantly with increasing latitude (t52090
p 0 and n 5 13)
TABLE 3 Sea surface temperature sources and regressions of SST on PDOAnnual-mean SST data sources Some time series have gaps
see Fig 3 Intercept slope and explained variance (R2) of linear regression models fitting SST to PDO through 1987 All intercepts and
slopes are significant at p 0001 with the exception of CHA slope (not significant)
SST time series Location Dates Intercept Slope R2
SIO Scripps CA 1916ndash2010 1694 049 048
SC San Clemente CA 1955ndash2010 1658 049 032
NP Newport Beach CA 1925ndash2010 1643 053 049
SM Santa Monica CA 1946ndash2001 1680 082 066
PD Point Dume CA 1975ndash2010 1577 066 055
SB Santa Barbara CA 1946ndash2010 1585 049 060
MB Morro Bay CA 1962ndash96 1337 072 062
PG Pacific Grove 1919ndash2010 1307 034 023
FAR Farallon Islands CA 1925ndash2010 1224 042 028
BB Bodega Bay CA 1957ndash2001 1145 058 053
CC Crescent City CA 1933ndash2001 1202 062 055
CHA Charleston OR 1966ndash97 1130 020 012
NB Neah Bay WA 1935ndash2001 971 038 049
ERSST Southern California 1854ndash2010 1603 021 011
CalCOFI Southern California 1950ndash2010 1373 049 031
See grid boxes in McClatchie et al (2010)
CalCOFI lines 767ndash933 5ndash15-m depth
TABLE 4 Regressions of SST on PC1 of Shore Stations SSTN is
number of SST time series used in PCA Intercept slope and ex-
plained variance (R2) of linear regression models fitting annual-
mean SST to PC1 of SST for N shore stations through 1987 (see
Table 3 for locations) For all cases intercept and slope are signifi-
cant p 0001
SST time series N Intercept Slope R2
SIO 11 1745 378 072
SC 11 1670 332 055
NP 10 1652 391 075
SM 10 1679 581 083
PD 10 1578 468 073
SB 10 1584 340 074
MB 10 1335 456 069
PG 10 1336 340 079
FAR 10 1242 356 045
BB 10 1143 404 070
CC 10 1199 371 049
CHA 10 1130 180 036
NB 10 969 259 059
ERSST 11 1380 353 048
CalCOFI 11 1620 142 016
2880 JOURNAL OF PHYS ICAL OCEANOGRAPHY VOLUME 44
Our response variable was annual-mean SST (Fig 3)
We used two predictors the PDO and PC1SS and two
test types STARS and OLS-CUSUM This resulted in
four tests of our hypothesis We first present results for
PDO as the predictor followed by those using PC1SS
a Test 1 PDO and STARS
ResSSTXXXPDO (XXX denotes an individual shore
station) (Table 3) fluctuates around zero for all stations
(Figs 1b 4) except for SIO and SC for which STARS
show significant positive discontinuities in 1988 and
1983 respectively The significant discontinuities for
Pacific Grove (PG) and ERSSTv3b (ER) residuals in
1928 are likely due to edge effects caused by lowmean
values at the start of both time series
b Test 2 PDO and OLS-CUSUM
The OLS-CUSUM test identified significant change
points in ResSSTSIOPDO (1988 Figs 5a 6) and
ResSSTSCPDO (1988 Fig 6) that manifest as troughs con-
sistent with the STARS analysis The other OLS-CUSUM
plots using PDO as the predictor show fluctuations
largely within the confidence intervals except for PG
and ER during the 1930s (Fig 6) These results are in-
sensitive to the regression period for example the same
discontinuity was detectedwhen the predictor was based
on the PDOndashSSTSIO regression from 1916 to 1975 (not
shown) rather than 1916 to 1987
The results using the PDO as predictor (STAR and
OLS-CUSUM) were unchanged when the response vari-
able was the annual-mean SSTSIO 2 global annual-mean
SST anomaly (see Fig S1 in the supplemental material)
c Test 3 PC1SS and STARS
Using PC1SS instead of the PDO as the predictor
(ResSSTSIOSS) produced similar results (Table 4
Figs 5b 7) Regression of annual-mean SST on PC1SSwas highly significant for all shore stations (Table 4)
STARS shows ResSSTSIOSS with a positive disconti-
nuity in 1992 (Fig 7a) we note that the time series was
54 yr long due to length limitations of the other shore
station SST time series (Table 3) The only other shore
FIG 2 CSST instrument (a) On SIO pier (b) In water below SIO pier (c) Image taken in the
water showing submerged probe Vertically oriented float rides on plastic-coated wire sus-
pended from SIO pier and with 10-kg weight 1m above the ocean bottom Horizontal float has
HOBO U12 stainless 500 probe temperature logger (Onset U12-015-02) attached to the un-
derside shielded by PVC and is attached to vertical float by an aluminum rod by a rotary joint
that allows motion in the vertical plane Periodic visual observation from above and below the
sea surface during 3 day deployment 7ndash10 Jul 2014 showed the probe to be 1ndash4 cm below the sea
surface and not exposed to air
NOVEMBER 2014 CHECKLEY AND L INDEGREN 2881
station to have a significant discontinuity using PC1SSand STARS was SC in 1983 (Fig 7b)
d Test 4 PC1SS and OLS-CUSUM
Using the PC1SS as the predictor OLS-CUSUM has
a broad trough from1982 to 1995 (Figs 5b 8a) again
the time series was 54 yr long Shore stations in addi-
tion to SIO having significant troughs using PC1SS and
OLS-CUSUM were SC (1982ndash88) and Neah Bay
(NB) Washington (1986ndash87) Morro Bay (MB) Cal-
ifornia had a significant peak in 1988 (Fig 8)
The intercept and slope of the linear regression for
annual-mean SSTSIO on PDO using a 10-yr sliding
window fluctuate throughout the period (Figs 5cd)
However only the intercept shows a significant change
following its abrupt increase in 1988 (Fig 5c)
Results from deployment of the CSST instrument and
ancillary data are shown in Fig 9 Three complete diel
FIG 3 Annual-mean SST (SSTXXX where XXX is SST time series abbreviation) for shore stations ranging from (a)ndash(m) Southern
California to the state of Washington as well as from (n)ndash(o) nearby offshore waters (See Table 3 for time series abbreviations)
2882 JOURNAL OF PHYS ICAL OCEANOGRAPHY VOLUME 44
cycles were observed Air temperature increased after
sunrise and began to decline in midafternoon each day
Both water level and significant wave height varied mod-
erately SSTSIO measured by the CSST instrument showed
a strong diel variation minimal near sunrise and maximal
near sunset Notable were pulses of warming during the
daytime SSTSIO from standard bucket sampling and the
CSST instrument were indistinguishable (Fig 9d red
crosses and black line respectively) Time series of
residuals (unfilteredndashfiltered SSTSIO from CSST in-
strument) for averaging windows of 30ndash240min (Figs 9e
and 9f respectively) show the greatest variability during
daylight Power spectra of these time series (Fig 10)
show an abrupt increase in power for periods 40min and
greater Measurements on 14 July 2014 between 1412
and 1727 LT showed water in the surf zone to be sig-
nificantly (Studentrsquos t test p 00001) warmer (232160018C mean6 standard error and n5 52) than SSTSIO
FIG 4 Annual-mean residuals (ResSSTXXXPDO where XXX is SST time series abbreviation) of observed SST from SST predicted from
PDO using linear regressions of SST on the PDO until 1987 for (a)ndash(m) shore stations and (n)ndash(o) offshore SST time series Significant
discontinuities in ResSST detected by STARS are shown in gray (See Table 3 for time series abbreviations)
NOVEMBER 2014 CHECKLEY AND L INDEGREN 2883
(2253 6 0018C n 5 27) During this period air tem-
perature was 2048C and HS was 06m
4 Discussion
We assume that the water temperature has been
measured accurately and hence is comparable over the
entire time series at SIO and elsewhere At SIO the
same protocol has been used to collect water since 1916
The change from mercury to digital thermometers was
gradual over the period 2008ndash10 Thus we conclude that
changes in temperature are not due to measurement
error We also assume that the SST time series at other
shore stations are comparable (cf McGowan et al
1998)
STARS and OLS-CUSUM tests show a positive dis-
continuity in ResSST based on the PDO in 1988 at SIO
but not at other shore stations to the north The 1988
discontinuity based on the PDO remains when the
global annual-mean SST is subtracted from the annual-
mean SSTSIO consistent with the discontinuity not
having resulted from detrending in the PDO calculation
(Mantua et al 1997) Both types of tests are sensitive to
the length and period of the time series When the pre-
dictor was PC1 of the annual-mean SST time series for
shore stations to the north (excluding SC) STARS showed
a discontinuity in 1992 (Fig 7a) and OLS-CUSUM
a broad trough from 1982 to 1995 (Figs 5b 8) We
attribute the different results using the PDO and PC1SSto lesser precision associated with the shorter time series
(54 yr) used to compute PC1SS compared with the lon-
ger time series for SSTSIO and PDO (95 yr) In addition
there are other unaccounted sources of variation in the
shore station SST time series and thus PC1SS The
abrupt increase in the intercept but not the slope of the
regression of annual-mean SSTSIO on the PDO (Figs 5c
and 5d respectively) is also consistent with an abrupt
increase in annual-mean SSTSIO in 1988 Collectively
these results are consistent with a change in 1988 of SST
measured at the SIO pier but not at other locations with
the exception of SC
SSTSIO measured every minute by the CSST in-
strument during the period 7ndash10 July 2014 varied on
a diel cycle and at shorter time scales manifest by pulses
of warming (Figs 9d 10) Daytime increase in SST is
common (eg Webster et al 1996 Prytherch et al
FIG 5 OLS-CUSUM based on (a) ResSSTSIOPDO and (b) ResSSTSIOSS (c) Intercept and (d) slope of a linear
regression of SSTSIO on PDO using a sliding window of 10 yr Vertical black dashed lines indicate SIO pier change in
1988
2884 JOURNAL OF PHYS ICAL OCEANOGRAPHY VOLUME 44
2013) due to daytime increases in the fluxes of sensible
heat and shortwave radiation into the ocean Overlaid
on this gradual increase were distinct pulses of warming
notable in the time domain for both SSTSIO (Fig 9d) and
residuals from the smoothed time series of SSTSIO
(Figs 9endashh) Power spectra of the residuals show an
abrupt increase in variance at periods equal to and
greater than 40min (Fig 10) Monthly averages of daily
power spectra of high-passed near-surface temperature
measured at the end of the SIO pier during 2011 also
peaked at40min (Figs S2 and S3 in the supplemental
material) Such variability is consistent with that pre-
viously observed for rip currents near the SIO pier
(Smith and Largier 1995) Measurements made 1412ndash
1727 LT 14 July 2014 showed water in the surf zone to be
078Cwarmer than SSTSIO despite the air being cooler
than the water and thus the flux of sensible heat being
from the ocean to the atmosphere indicating shortwave
radiation as the cause of ocean heating Shortwave ra-
diation heats the surf zone both directly by heating the
FIG 6 OLS-CUSUM of residual SST time series based on the PDO (ResSSTXXXPDO where XXX is SST time series abbreviation) Red
solid lines indicate 95 confidence intervals (See Table 3 for time series abbreviations)
NOVEMBER 2014 CHECKLEY AND L INDEGREN 2885
water and indirectly by heating the beach that in turn
heats the water during wave runup (Stockdon et al
2006) and flood tide Enhanced flow by rip currents of
surf-zone water warmer than the surface water near the
end of the pier where SSTSIO is measured will act as
a buoyant surface jet (cf Jirka et al 1981) and contribute
to warmer SSTSIO Enhanced flow by rip currents of
surf-zone water cooler than surface water near the end
of the pier will act as a negatively buoyant jet and sink
beneath warmer less dense surface water and not af-
fect SSTSIO (cf Saeedi et al 2012) We assume the
forcing of rip currents is positively related to signifi-
cant wave height HS which does not vary on a diel
cycle (eg Fig 9c) Our observations of diel variation
in SSTSIO and ResSSTSIO (Figs 9dndashh) showing greater
high-frequency variability during the day than night
FIG 7 Annual-mean residuals (ResSSTXXXSS where XXX is SST time series abbreviation) of observed SST from SST predicted
from PC1 of other shore station time series using linear regressions of annual-mean SST on PC1 until 1987 for (a)ndash(m) shore stations and
(n)ndash(o) offshore SST time series Significant discontinuities in ResSST detected by STARS are shown in gray [See Table 3 for time series
abbreviations and number of shore station time series used in each principal component analysis (PCA)]
2886 JOURNAL OF PHYS ICAL OCEANOGRAPHY VOLUME 44
are consistent with rip currents occurring during both
day and night but affecting SSTSIO primarily during
the day
Rip currents are associated with piers due to bottom
scouring around pilings and reduced surface wave energy
(Haller et al 2002 MacMahan et al 2006 Dalrymple
et al 2011 Farahani et al 2014) Preliminary observa-
tions show the bottom depth beneath the outer50m of
the present SIO pier to be approximately one meter
deeper than adjacent depths (Fig S4 in the supple-
mental material) consistent with bottom scouring as-
sociated with the pier pilings
Collectively our results indicate rip currents transport
relatively warm water from the surf zone to the location
where SSTSIO ismeasured Our results are also consistent
with prior observations of rip currents at the present SIO
pier (Smith and Largier 1995 Chang and Twardowski
2011 Twardowski et al 2012)
FIG 8 OLS-CUSUM of residual annual-mean SST time series based on the PC1 of other shore station time series (ResSSTXXXSS
where XXX is SST time series abbreviation) Red solid lines indicate 95 confidence intervals (See Table 3 for time series abbreviations
and number of shore station time series used in each PCA)
NOVEMBER 2014 CHECKLEY AND L INDEGREN 2887
Wehypothesize that the abrupt increase in ResSSTSIO
and implicitly SSTSIO in 1988 was due in part to en-
hancement of rip current transport of relatively warm
surf-zone water at the present SIO pier We assume that
rip currents were associated with the old SIO pier We
propose that the 54 increase in area of pilings from the
old (133m2) to the present (208m2) pier led to in-
creased scouring and decreased wave energy and thus
increased rip current transport Comparable observa-
tions for the old SIO pier are not available and no longer
possible Hence we are unable to rigorously test our
hypothesis
The only other shore station to show such a change in
ResSST with both test types is the San Clemente pier
(STARS 1983 OLS-CUSUM 1988 Figs 3 4b 6ndash8)
The SC pier was built in 1928 with wood pilings it was
extensively damaged during an El Nintildeo in 1983 and re-paired in 1985 with new and larger pilings Although theSC time series is shorter and information limited SSTmeasured at both the SIO and SC piers may have beenaffected by similar structural enhancements and thusincreased rip current transportHare and Mantua (2000) analyzed time series of 100
physical (atmosphere rivers and ocean including
FIG 9 SST measured from SIO pier by CSST instrument and related variables (a) Air
temperature (8C) (b) Water level (m) (c) Significant wave height (m) (d) SSTSIO (8C) fromCSST (black line) and standard bucket sample (red cross) Black bars denote sunset to sunrise
(e)ndash(h) Residual of SSTSIO (d) minus double runningmean of SSTSIO computed using windows
of 30 60 120 and 240 values (min) respectively
2888 JOURNAL OF PHYS ICAL OCEANOGRAPHY VOLUME 44
SSTSIO) and biological (plankton nekton and birds)
variables together and in groups In addition to a major
change in 1977 an abrupt change in 1989 was observed
in a number of cases more for biological than physical
variables with SSTSIO showing a relatively small in-
crease (ibidem) Breaker (2007) and Breaker and Flora
(2009) analyzed time series of SST for the SIO pier PG
andKokoHead (KH) Hawaii Brief decreases in SST in
1989 were observed at all three locations using CUSUM
A newer test the method of expanding means was used
to assess long-term change associated with observed
shifts and showed no response at SIO and 048C de-
crease at KH Rebstock (2002) analyzed copepod
(zooplankton) abundance for 1951ndash99 in the CalCOFI
region Abrupt changes for some taxa including late
developmental stages of Calanus pacificus occurred in
1989 but were neither consistent among taxa nor long-
lived McGowan et al (1998) showed SST to vary co-
herently and simultaneously on the annual time scale
along theUSWest Coast Our use of residuals from the
regression of annual-mean SST on the PDO and PC1 of
the West Coast SST time series accounts for large-scale
variation in SST Thus while such change occurred in
the North Pacific in 1977 and the late 1980s it does not
explain the discontinuity in ResSSTSIO in 1988
5 Conclusions
We show a positive discontinuity in ResSSTSIO and
implicitly SSTSIO in 1988 after accounting for large-scale
FIG 10 (a)ndash(d) Power spectra of ResSSTSIO using a double running-mean window of 30 60 120 and 240min
(Figs 9endashh) relative to a distribution of Gaussian (white) noise Mean and 95 confidence intervals are shown by
horizontal gray lines respectivelyMost power is at periods longer than 40min (vertical red line) but is removedwhen
averaging window approaches as in (b) or is shorter than this period as in (a)
NOVEMBER 2014 CHECKLEY AND L INDEGREN 2889
variation in SST represented by the PDO and PC1 of
the other West Coast SST time series This disconti-
nuity is coincident with the change in measurement of
SSTSIO from the old to the present pier We hypothesize
this discontinuity is due in part to enhanced rip current
transport of relatively warm surf-zone water to the lo-
cation of measurement of SSTSIO The discontinuity in
1988 (Fig 1b) indicates the timing of the abrupt shift in
the annual time series The 1988 discontinuity (10798CResSSTSIO1989-2010-ResSSTSIO1916-1987 Fig 1b) can be
attributed to processes not accounted for by the
PDO including long-term warming (10348CERSSTv3b1989-2010-ERSSTv3b1916-1987) and artifact
(10458C) due to both rapid (1988 pier change) and
gradual (eg time of day of SSTSIO measurement)
processes It is incumbent on users of the SSTSIO time
series to consider the sources of variability in SSTSIO in
each specific use The long-term (1916 to present)
trend of SSTSIO without adjustment for artifact is
1118Ccentury21 (p 0001 MannndashKendall correla-
tion10299 p 0001 n5 93) If the artifact (10458C)is subtracted from SIOSST from 1988 onward the long-
term trend is 1068Ccentury21 (p 5 0007 Mannndash
Kendall correlation 10190 p 5 0007 n 5 93) While
the unadjusted trend has been cited as evidence of faster
increase of California coastal than global SST (Kadir
et al 2013) the adjusted trend is consistent with the
twentieth-century trend in global SST (107 6028Ccentury21 Smith et al 2008)
This artifact may also have contributed to the more
variable relationship between SSTSIO and recruitment
of the Pacific sardine (Sardinops sagax) in recent de-
cades (McClatchie et al 2010 Sugihara et al 2012
Lindegren and Checkley 2013) with implications for
sardine management SSTSIO explained significant var-
iability in the relationship between biomass and re-
cruitment for the Pacific sardine based on data for 1935ndash
63 and 1986ndash90 (Jacobson and MacCall 1995) This led
to the use of the 3-yr running mean of annual-mean
SSTSIO in the fishery harvest guideline that determines
the fraction (F percent) of available sardine biomass
allocated for capture (eg Hill et al 2011) Had SSTSIO
been adjusted for the artifact after 1988 F would have
decreased in cool years For example in 2001 the 3-yr
running mean of SSTSIO was 1728C An adjustment of
SSTSIO by 20458C would have decreased F from 15
to 6 the sardine quota by 23 and the ex-vessel
landing revenues of the fishery by $6 million A tem-
perature index from theCalifornia CooperativeOceanic
Fisheries Investigations (CalCOFI) explains more vari-
ability than SSTSIO in the relationship between sardine
biomass and recruitment (Lindegren and Checkley
2013) In March 2014 the Pacific Fishery Management
Council decided to use the CalCOFI temperature index
rather than SSTSIO in the sardine harvest guideline
(Pacific Fishery Management Council 2014)
Time series of measurements from the SIO pier in-
cluding SST are of increasing value particularly in the
context of climate change Our intent in this paper has
been to further increase the value of the SSTSIO time
series through an enhanced understanding of its prop-
erties We strongly advocate it be continued
Finally three points merit mention First this study
reemphasizes the need for the careful maintenance of
environmental time series What may appear to be small
changes in protocol can have significant consequences
for measurements Any change in protocol should be
critically assessed Second the interpretation of time
series of environmental data must take into account any
changes in protocol and their effects Third many
coastal time series are from regular measurements made
from piers Such measurements may be affected by rip
currents and hence changes in pier structure and wave
power (eg Bromirski et al 2013)
AcknowledgmentsWe thank Reinhard Flick Melissa
Carter and Eric Terrill for access to data We thank
Mark Morales for help in field measurements Melissa
Carter Dan Cayan Falk Fedderson Reinhard Flick
Robert Guza Eddie Kisfaludy and John McGowan
provided valuable comments on the study Mario
Aguilera three anonymous reviewers and the editor
provided constructive comments on the manuscript ML
was supported by a Scripps Institution of Oceanography
(SIO) Postdoctoral Fellowship with funds fromSIO and
NSF Grant OCE-0928425 to DMC
REFERENCES
Akaike H 1974 New look at statistical-model identification IEEE
TransAutomControl 19 716ndash723 doi101109tac19741100705
Breaker L C 2007 A closer look at regime shifts based on coastal
observations along the eastern boundary of the North Pacific
Cont Shelf Res 27 2250ndash2277 doi101016jcsr200705018
mdashmdash and S J Flora 2009 Expressions of 1976ndash1977 and 1988ndash
1989 regime shifts in sea-surface temperature off Southern
California and Hawailsquoi Pac Sci 63 39ndash60 doi102984
1534-6188(2009)63[39EOARSI]20CO2
Bromirski P D D R Cayan JHelly and PWittmann 2013Wave
power variability and trends across theNorthPacific JGeophys
Res Oceans 118 6329ndash6348 doi1010022013JC009189
Brown R L J Durbin and J M Evans 1975 Techniques for
testing the constancy of regression relationships over time
J Roy Stat Soc 37B 149ndash163
Chang G and M S Twardowski 2011 Effects of physical forcing
and particle characteristics on underwater imaging per-
formance J Geophys Res 116 C00H03 doi101029
2011JC007098
2890 JOURNAL OF PHYS ICAL OCEANOGRAPHY VOLUME 44
Dalrymple R A J H MacMahan A Reniers and V Nelko
2011 Rip currents Annu Rev Fluid Mech 43 551ndash581
doi101146annurev-fluid-122109-160733
Dayton P K M J Tegner P B Edwards and K L Riser 1999
Temporal and spatial scales of kelp demography The role of
oceanographic climate Ecol Monogr 69 219ndash250
doi1018900012-9615(1999)069[0219TASSOK]20CO2
Deyle E R and Coauthors 2013 Predicting climate effects on
Pacific sardine Proc Natl Acad Sci USA 110 6430ndash6435
doi101073pnas1215506110
Farahani R J R A Dalrymple A Herault and G Bilotta 2014
Three-dimensional SPHmodeling of a barrip channel system
J Waterw Port Coastal Ocean Eng 140 82ndash99 doi101061
(ASCE)WW1943-54600000214
Gargett A E 1997 The optimal stability lsquowindowrsquo A mechanism
underlying decadal fluctuations in North Pacific salmon
stocks Fish Oceanogr 6 109ndash117 doi101046
j1365-2419199700033x
Haller M C R A Dalrymple and I A Svendesen 2002 Ex-
perimental study of nearshore dynamics on a barred beach
with rip channels J Geophys Res 107 (C6) doi101029
2001JC000955
Hare S R and N J Mantua 2000 Empirical evidence for North
Pacific regime shifts in 1977 and 1989 Prog Oceanogr 47
103ndash145 doi101016S0079-6611(00)00033-1
Hatch M B A 2012 The schlerochronology of Donax gouldii
and Chione undatella Environmental archives of the past and
present Southern California Bight PhD dissertation Scripps
Institution of Oceanography 128 pp
mdashmdash S A Schellenberg and M L Carter 2013 BaCa variations
in the modern intertidal bean clam Donax gouldii An up-
welling proxy Palaeogeogr Palaeoclimatol Palaeoecol 373
98ndash107 doi101016jpalaeo201203006
Hill K T P R Crone N C H Lo B J Macewicz E D Dorval
J D McDaniel and Y Gu 2011 Assessment of the Pacific
sardine resource in 2011 for US management in 2012 NOAA
NationalMarine Fisheries Service Southwest Fisheries Science
Center Rep 6 pp [Available online at httpwwwpcouncil
orgwp-contentuploadsF2b_ATT1_SARDINE_EXSUM_
NOV2011BBpdf]
Hobday A J and M J Tegner 2002 The warm and the cold
Influence of temperature and fishing on local population dy-
namics of red abalone CalCOFI Rep 43 74ndash96 [Available
online at wwwcalcofiorgpublicationscalcofireportsv43
Vol_43_Hobday___Tegnerpdf]
Hsieh C H S M Glaser A J Lucas and G Sugihara 2005
Distinguishing random environmental fluctuations from eco-
logical catastrophes for the North Pacific Ocean Nature 435
336ndash340 doi101038nature03553
Jacobson L and A MacCall 1995 Stock-recruitment models for
Pacific sardine (Sardinops sagax) Can J Fish Aquat Sci 52
566ndash577 doi101139f95-057
mdashmdash and S McClatchie 2013 Comment on temperature-
dependent stockndashrecruitmodeling for Pacific sardine (Sardinops
sagax) in Jacobson and MacCall (1995) McClatchie et al
(2010) and Lindegren andCheckley (2013)Can J Fish Aquat
Sci 70 1566ndash1569 doi101139cjfas-2013-0128
Jirka G H K D Stolzenbach and E E Adams 1981 Buoyant
surface jets J Hydraul Div 107 1467ndash1487
Kadir T L Mazur C Milanes and K Randles Eds 2013 In-
dicators of climate change in California Office of Environ-
mental Health Hazard Assessment California Environmental
Protection Agency 228 pp [Available online at wwwoehha
cagovmultimediaepicpdfClimateChangeIndicatorsReport2013
pdf]
Kim H-J A J Miller J McGowan and M L Carter 2009
Coastal phytoplankton blooms in the Southern California
Bight Prog Oceanogr 82 137ndash147 doi101016
jpocean200905002
Lavaniegos B E and M D Ohman 2003 Long-term changes in
pelagic tunicates of the California Current Deep-Sea Res II
50 2473ndash2498 doi101016S0967-0645(03)00132-2
Lindegren M and D M Checkley Jr 2013 Temperature
dependence of Pacific sardine (Sardinops sagax) recruitment
in the California Current ecosystem revisited and revised
Can J Fish Aquat Sci 70 245ndash252 doi101139
cjfas-2012-0211
mdashmdash D M Checkley T Rouyer A D MacCall and N C
Stenseth 2013 Climate fishing and fluctuations of sardine
and anchovy in the California Current Proc Natl Acad Sci
USA 110 13 672ndash13 677 doi101073pnas1305733110
Mackas D L and G Beaugrand 2010 Comparisons of zoo-
plankton time series J Mar Syst 79 286ndash304 doi101016
jjmarsys200811030
MacMahan J H E B Thornton and A Reniers 2006 Rip cur-
rent review Coastal Eng 53 191ndash208 doi101016
jcoastaleng200510009
Mantua N S Hare Y Zhang J Wallace and R Francis 1997 A
Pacific interdecadal climate oscillationwith impacts on salmon
production Bull Amer Meteor Soc 78 1069ndash1079
doi1011751520-0477(1997)0781069APICOW20CO2
McClatchie S R Goericke G Auad and K Hill 2010 Re-
assessment of the stockndashrecruit and temperaturendashrecruit
relationships for Pacific sardine (Sardinops sagax) Can
J Fish Aquat Sci 67 1782ndash1790 doi101139f10-101
McGowan J A D R Cayan and L M Dorman 1998 Climate-
ocean variability and ecosystem response in the northeast Pa-
cific Science 281 210ndash217 doi101126science2815374210
Miller E F and J A McGowan 2013 Faunal shift in Southern
Californiarsquos coastal fishes A new assemblage and trophic
structure takes hold Estuarine Coastal Shelf Sci 127 29ndash36
doi101016jecss201304014
Pacific Fishery Management Council 2014 Decision summary
document Pacific fishery management council meeting March
8-13 2014 Pacific Fishery Management Council Rep 6 pp
[Available online at wwwpcouncilorgwp-contentuploads
0314decisionspdf]
Parnell P E E FMiller C E Lennert-Cody P K DaytonM L
Carter and T D Stebbins 2010 The response of giant kelp
(Macrocystis pyrifera) in Southern California to low-
frequency climate forcing Limnol Oceanogr 55 2686ndash2702Ploberger W and W Kraumlmer 1992 The CUSUM test with OLS
residuals Econometrica 60 271ndash285 doi1023072951597
Prytherch J J T Farrar and R A Weller 2013 Moored surface
buoy observations of the diurnal warm layer J Geophys Res
Oceans 118 4553ndash4569 doi101002jgrc20360
Rebstock G A 2002 Climatic regime shifts and decadal-scale
variability in calanoid copepod populations off southern
California Global Change Biol 8 71ndash89 doi101046
j1365-2486200200456x
Rodionov S N 2004 A sequential algorithm for testing climate
regime shifts Geophys Res Lett 31 L09204 doi101029
2004GL019448
Saeedi M A A Farahani O Abessi and T Bleninger 2012
Laboratory studies defining flow regimes for negatively
NOVEMBER 2014 CHECKLEY AND L INDEGREN 2891
buoyant surface discharges into crossflow Environ Fluid
Mech 12 439ndash449 doi101007s10652-012-9245-4
Schwing F B and R Mendelssohn 1997 Increased coastal up-
welling in the California Current System J Geophys Res
102 3421ndash3438 doi10102996JC03591
Smith J A and J G Largier 1995 Observations of nearshore
circulation Rip currents J Geophys Res 100 10 967ndash10 975
doi10102995JC00751
Smith T M R W Reynolds T C Peterson and J Lawrimore
2008 Improvements to NOAArsquos historical merged landndash
ocean surface temperature analysis (1880ndash2006) J Climate
21 2283ndash2296 doi1011752007JCLI21001
Stockdon H F R A Holman P A Howd and A H Sallenger
2006 Empirical parameterization of setup swash and runup
Coastal Eng 53 573ndash588 doi101016jcoastaleng200512005
Sugihara G R May H Ye C H Hsieh E Deyle M Fogarty
and S Munch 2012 Detecting causality in complex ecosys-
tems Science 338 496ndash500 doi101126science1227079
Tegner M J P K Dayton P B Edwards and K L Riser 1996
Is there evidence for long-term climatic change in Southern
California kelp forests CalCOFI Rep 37 111ndash126
[Available online at httpwwwcalcofiorgpublications
calcofireportsv37Vol_37_Tegner_etalpdf]
Twardowski M and Coauthors 2012 The optical volume scat-
tering function in a surf zone inverted to derive sediment and
bubble particle subpopulations J Geophys Res 117
C00H17 doi1010292011JC007347
Webster P J C A Clayson and J A Curry 1996 Clouds ra-
diation and the diurnal cycle of sea surface temperature in the
tropical western Pacific J Climate 9 1712ndash1730 doi1011751520-0442(1996)0091712CRATDC20CO2
2892 JOURNAL OF PHYS ICAL OCEANOGRAPHY VOLUME 44
present pier is4m seaward of that on the old pier The
time of sampling has varied between 0800 and 1700 h
local time (LT) (SIO Shore Stations program www
shorestationucsdedu)
To test our hypothesis of a discontinuity in 1988 in the
time series of annual-mean SSTSIO we first account for
large-scale natural variability and then apply two types
of tests for discontinuity We account for long-term
natural variability by predicting annual-mean SSTSIO
using regressions of observed annual-mean SSTSIO on
two predictors the Pacific decadal oscillation (PDO)
(Mantua et al 1997) and the first principal component
(PC1) of SST time series for shore stations to the north
of the SIO pier We then use two types of tests for dis-
continuity in the time series of residuals between pre-
dicted and observed values of annual-mean SSTSIO This
allows for four tests (two time series and two test types)
of our hypothesis We then present and analyze a 3-day
time series of SSTSIO using a new instrument After
presenting our results we discuss rip current transport of
warm surf-zone water as a possible cause of the observed
discontinuity and implications of our study
2 Materials and methods
Temperature data are from the SIO Shore Stations
program covering the entire US West Coast (www
shorestationucsdedu) and for waters off Southern
California from the California Cooperative Oceanic
Fisheries Investigations (CalCOFI) program (http
calcofiorgdatahtml) and the extended reconstructed
sea surface temperature (ERSSTv3b) gridded rean-
alysis of global SST (ftpftpncdcnoaagovpubdata
cmbersst) (Smith et al 2008) Large-scale variability in
SSTSIO may mask the smaller hypothesized variability
associated with the change in piers For example sig-
nificant discontinuities in the daily SST time series at
SIO and Pacific Grove in 1977 and 1989 have been
identified (Breaker 2007) We accounted for natural
large-scale variability by standardizing each annual-
mean SST time series using an underlying large-scale
reference (predictor) variable We tested five variables
(Table 1) Selection of the variable with greatest ex-
planatory power was objective The PDO the first
principal component of the time series of detrended
FIG 1 (a) Annual-mean SSTSIO (black) and PDO (gray dashed) (b) Residual SSTSIO after
accounting for natural variability with the PDO (ResSSTSIOPDO black solid) and the PC1 of
annual-mean SST from 11 shore stations to the north of SIO (ResSSTSIOSS black dashed) The
solid gray line indicates a significant discontinuity in 1988 in ResSSTSIOPDO detected by
STARS coinciding with the pier change
2878 JOURNAL OF PHYS ICAL OCEANOGRAPHY VOLUME 44
anomalies of SST poleward of 208N in the North Pacific
(Mantua et al 1997) explained most variability in
annual-mean SSTSIO (Table 2) Four other indexes [ie
themultivariate ENSO index (MEI) North PacificGyre
Oscillation (NPGO) Southern Oscillation index (SOI)
and Northern Oscillation index (NOI)] did not explain
significantly more variability in annual-mean SSTSIO
and thus were not further considered (Tables 1 2) Annual-
mean SST fromERSSTv3b for nine data blocks (318ndash378N
east of 1238W) explained a relatively small amount of
variability in annual-mean SSTSIO (R2 5 0097 p 50004) and was not further considered as a predictor
We first fit a linear regression to the annual-mean SST
(response) with the PDO (predictor) from the start of
each time series through 1987 (ie the last full year the
old pier was in use) then predicted the annual-mean
SST over the entire time series (eg 1916ndashpresent for
SIO) and finally computed the residuals between pre-
dicted and observed values (ResSSTSIOPDO for SIO)
This was done for each time series (Table 3)We applied
two statistical methods for identifying discontinuities
(i) the sequential t test analysis of regime shifts
(STARS) with a significance value p of 001 and a cutoff
length of 10 yr (Rodionov 2004) and (ii) a generalized
fluctuation test based on the cumulative sumof recursive
residuals of ordinary least squares residuals (OLS-CU-
SUM) with 95 confidence intervals (Brown et al 1975
Ploberger and Kraumlmer 1992) Neither method makes an
a priori assumption about the existence of discontinu-
ities We also investigated whether the relationship be-
tween annual-mean SSTSIO and the PDO remained
stable throughout the period by estimating the intercept
and slope of the linear regression (as described above)
over a sliding window of 10 yr for the entire period
To assess whether detrending in computing the PDO
(Mantua et al 1997) affects our results we subtracted
annual values of the global annual-mean SST anomaly
(httpwwwncdcnoaagovcagtime-seriesglobal) used
to calculate the PDO from the annual-mean SSTSIO
We used the same subset of global SST anomaly ob-
servations as used by Mantua et al (1997) This grid file
is available online (at ftpftpatmoswashingtonedu
mantuapdofilesgridtempglob_ocean977) We then
repeated our analyses using the PDO as the predictor
and STARS and OLS-CUSUM as the test types
We created a second predictor using time series of
annual-mean SST from other shore stations For each
annual-mean SST time series (response) the first
principal component (PC1SS) of all the remaining
times series (10 or 11) was used as a predictor variable
(Table 4)We excluded SIO and San Clemente (SC) due
to discontinuities based on the STARS and OLS-
CUSUM analyses Residuals were computed as de-
scribed above but using PC1SS (eg ResSSTSIOSS for
SIO) and tested for discontinuities using STARS and
OLS-CUSUM
To measure the variation of SIOSST on the scale of
minutes we created the continuous sea surface temper-
ature (CSST) instrument (Fig 2) The CSST instrument
consists of two floats connected by an articulated arm
The vertical float tracks the water surface while sur-
rounding a plastic-coated wire suspended through the
same opening in the SIO pier through which the standard
SSTSIO bucket sample is taken and held taut by a 10-kg
weight 1m above the bottom The horizontal float has
a data loggerwith temperature sensor (OnsetU12ndash015ndash02)
attached to its lower surface The sensor has a 25-s re-
sponse time and temperature is recorded every minute
TABLE 1 Climate covariates used in model fitting
Abbreviation Variable Source
PDO Pacific decadal oscillation httpjisaowashingtonedupdoPDOlatest
MEI Multivariate ENSO index httpwwwesrlnoaagovpsddatacorrelationmeidata
NPGO North Pacific Gyre Oscillation httpwwwo3dorgnpgo
SOI Southern Oscillation index httpwwwesrlnoaagovpsddatacorrelationsoidata
NOI Northern Oscillation index httpwwwesrlnoaagovpsddatacorrelationnoidata
TABLE 2Model selection Based on likelihood ratio tests andAkaike Information Criterion (AIC) scores (Akaike 1974)R2adj (adjusted
R2) is explained variance p is significance of the likelihood ratio test andN is degrees of freedom Number 4 is the final model MEI was
excluded during model fitting (r 5 062 n 5 93 and p 00001) due to colinearity with the PDO
No Model AIC R2adj () p N
1 SSTSIO a 1 PDO 1 SOI 1NPGO 1 NOI 1 laquo 531 484 33
2 SSTSIO a 1 PDO 1 SOI 1NPGO 1 laquo 511 499 094 34
3 SSTSIO a 1 PDO 1 NPGO 1 laquo 491 514 098 35
4 SSTSIO a 1 PDO 1 laquo 478 518 042 36
NOVEMBER 2014 CHECKLEY AND L INDEGREN 2879
to 0018C Visual observations from above and in the
water showed the temperature sensor to be 1ndash4 cm be-
low the sea surface thus measuring the lsquolsquotrue bulkrsquorsquo SST
(cf Webster et al 1996) SST from the bucket sample
and CSST instrument were indistinguishable
The CSST instrument was deployed 7ndash10 July 2014
from the SIO pier Air temperature and water level
relative to mean lower low water (MLLW) at the SIO
pier were recorded every 6min and available from the
National Oceanic and Atmospheric Administration
(NOAA) (httptidesandcurrentsnoaagovstationhome
htmlid59410230) Significant wave height (HS the
average of the 13 of the highest waves) every hour at the
SIO pier was available from the Coastal Data Infor-
mation Program (httpcdipucsdeduximg5searchamp
xsearch5073ampxsearch_type5Station_ID) A double
running-mean procedure (zero-phase digital filter) was
used to smooth the time series of SSTSIO from the CSST
instrument using averaging windows of four lengths
(30ndash240min) Power spectra were computed for the
time series of residuals The same data logger with the
temperature sensor as used on the CSST instrument was
lowered from the SIO pier and submerged completely at
multiple locations in the surf zone on 14 July 2014 These
measurements were compared with SSTSIO measured
immediately afterward using the CSST instrument to
test the hypothesis that water in the surf zone is warmer
than SSTSIO
Statistical analyses were conducted using the R soft-
ware version 2121 (wwwr-projectorg)Matlab (R2013b
MathWorks Natick Massachusetts) and the Excel add-
in software for STARS (wwwberingclimatenoaagov)
3 Results
The PDO and PC1SS accounted for significant vari-
ability in annual-mean SST at stations along the US
West Coast through 1987 with highly significant linear
regression parameters overall (Tables 3 4) except for
a nonsignificant slope for Charleston (CHA) and the
PDO (Table 3) Regression slope did not vary with
shore station latitude (Kendallrsquos rank correlation t 52010 p 5 067 and n 5 13) while the intercept de-
creased significantly with increasing latitude (t52090
p 0 and n 5 13)
TABLE 3 Sea surface temperature sources and regressions of SST on PDOAnnual-mean SST data sources Some time series have gaps
see Fig 3 Intercept slope and explained variance (R2) of linear regression models fitting SST to PDO through 1987 All intercepts and
slopes are significant at p 0001 with the exception of CHA slope (not significant)
SST time series Location Dates Intercept Slope R2
SIO Scripps CA 1916ndash2010 1694 049 048
SC San Clemente CA 1955ndash2010 1658 049 032
NP Newport Beach CA 1925ndash2010 1643 053 049
SM Santa Monica CA 1946ndash2001 1680 082 066
PD Point Dume CA 1975ndash2010 1577 066 055
SB Santa Barbara CA 1946ndash2010 1585 049 060
MB Morro Bay CA 1962ndash96 1337 072 062
PG Pacific Grove 1919ndash2010 1307 034 023
FAR Farallon Islands CA 1925ndash2010 1224 042 028
BB Bodega Bay CA 1957ndash2001 1145 058 053
CC Crescent City CA 1933ndash2001 1202 062 055
CHA Charleston OR 1966ndash97 1130 020 012
NB Neah Bay WA 1935ndash2001 971 038 049
ERSST Southern California 1854ndash2010 1603 021 011
CalCOFI Southern California 1950ndash2010 1373 049 031
See grid boxes in McClatchie et al (2010)
CalCOFI lines 767ndash933 5ndash15-m depth
TABLE 4 Regressions of SST on PC1 of Shore Stations SSTN is
number of SST time series used in PCA Intercept slope and ex-
plained variance (R2) of linear regression models fitting annual-
mean SST to PC1 of SST for N shore stations through 1987 (see
Table 3 for locations) For all cases intercept and slope are signifi-
cant p 0001
SST time series N Intercept Slope R2
SIO 11 1745 378 072
SC 11 1670 332 055
NP 10 1652 391 075
SM 10 1679 581 083
PD 10 1578 468 073
SB 10 1584 340 074
MB 10 1335 456 069
PG 10 1336 340 079
FAR 10 1242 356 045
BB 10 1143 404 070
CC 10 1199 371 049
CHA 10 1130 180 036
NB 10 969 259 059
ERSST 11 1380 353 048
CalCOFI 11 1620 142 016
2880 JOURNAL OF PHYS ICAL OCEANOGRAPHY VOLUME 44
Our response variable was annual-mean SST (Fig 3)
We used two predictors the PDO and PC1SS and two
test types STARS and OLS-CUSUM This resulted in
four tests of our hypothesis We first present results for
PDO as the predictor followed by those using PC1SS
a Test 1 PDO and STARS
ResSSTXXXPDO (XXX denotes an individual shore
station) (Table 3) fluctuates around zero for all stations
(Figs 1b 4) except for SIO and SC for which STARS
show significant positive discontinuities in 1988 and
1983 respectively The significant discontinuities for
Pacific Grove (PG) and ERSSTv3b (ER) residuals in
1928 are likely due to edge effects caused by lowmean
values at the start of both time series
b Test 2 PDO and OLS-CUSUM
The OLS-CUSUM test identified significant change
points in ResSSTSIOPDO (1988 Figs 5a 6) and
ResSSTSCPDO (1988 Fig 6) that manifest as troughs con-
sistent with the STARS analysis The other OLS-CUSUM
plots using PDO as the predictor show fluctuations
largely within the confidence intervals except for PG
and ER during the 1930s (Fig 6) These results are in-
sensitive to the regression period for example the same
discontinuity was detectedwhen the predictor was based
on the PDOndashSSTSIO regression from 1916 to 1975 (not
shown) rather than 1916 to 1987
The results using the PDO as predictor (STAR and
OLS-CUSUM) were unchanged when the response vari-
able was the annual-mean SSTSIO 2 global annual-mean
SST anomaly (see Fig S1 in the supplemental material)
c Test 3 PC1SS and STARS
Using PC1SS instead of the PDO as the predictor
(ResSSTSIOSS) produced similar results (Table 4
Figs 5b 7) Regression of annual-mean SST on PC1SSwas highly significant for all shore stations (Table 4)
STARS shows ResSSTSIOSS with a positive disconti-
nuity in 1992 (Fig 7a) we note that the time series was
54 yr long due to length limitations of the other shore
station SST time series (Table 3) The only other shore
FIG 2 CSST instrument (a) On SIO pier (b) In water below SIO pier (c) Image taken in the
water showing submerged probe Vertically oriented float rides on plastic-coated wire sus-
pended from SIO pier and with 10-kg weight 1m above the ocean bottom Horizontal float has
HOBO U12 stainless 500 probe temperature logger (Onset U12-015-02) attached to the un-
derside shielded by PVC and is attached to vertical float by an aluminum rod by a rotary joint
that allows motion in the vertical plane Periodic visual observation from above and below the
sea surface during 3 day deployment 7ndash10 Jul 2014 showed the probe to be 1ndash4 cm below the sea
surface and not exposed to air
NOVEMBER 2014 CHECKLEY AND L INDEGREN 2881
station to have a significant discontinuity using PC1SSand STARS was SC in 1983 (Fig 7b)
d Test 4 PC1SS and OLS-CUSUM
Using the PC1SS as the predictor OLS-CUSUM has
a broad trough from1982 to 1995 (Figs 5b 8a) again
the time series was 54 yr long Shore stations in addi-
tion to SIO having significant troughs using PC1SS and
OLS-CUSUM were SC (1982ndash88) and Neah Bay
(NB) Washington (1986ndash87) Morro Bay (MB) Cal-
ifornia had a significant peak in 1988 (Fig 8)
The intercept and slope of the linear regression for
annual-mean SSTSIO on PDO using a 10-yr sliding
window fluctuate throughout the period (Figs 5cd)
However only the intercept shows a significant change
following its abrupt increase in 1988 (Fig 5c)
Results from deployment of the CSST instrument and
ancillary data are shown in Fig 9 Three complete diel
FIG 3 Annual-mean SST (SSTXXX where XXX is SST time series abbreviation) for shore stations ranging from (a)ndash(m) Southern
California to the state of Washington as well as from (n)ndash(o) nearby offshore waters (See Table 3 for time series abbreviations)
2882 JOURNAL OF PHYS ICAL OCEANOGRAPHY VOLUME 44
cycles were observed Air temperature increased after
sunrise and began to decline in midafternoon each day
Both water level and significant wave height varied mod-
erately SSTSIO measured by the CSST instrument showed
a strong diel variation minimal near sunrise and maximal
near sunset Notable were pulses of warming during the
daytime SSTSIO from standard bucket sampling and the
CSST instrument were indistinguishable (Fig 9d red
crosses and black line respectively) Time series of
residuals (unfilteredndashfiltered SSTSIO from CSST in-
strument) for averaging windows of 30ndash240min (Figs 9e
and 9f respectively) show the greatest variability during
daylight Power spectra of these time series (Fig 10)
show an abrupt increase in power for periods 40min and
greater Measurements on 14 July 2014 between 1412
and 1727 LT showed water in the surf zone to be sig-
nificantly (Studentrsquos t test p 00001) warmer (232160018C mean6 standard error and n5 52) than SSTSIO
FIG 4 Annual-mean residuals (ResSSTXXXPDO where XXX is SST time series abbreviation) of observed SST from SST predicted from
PDO using linear regressions of SST on the PDO until 1987 for (a)ndash(m) shore stations and (n)ndash(o) offshore SST time series Significant
discontinuities in ResSST detected by STARS are shown in gray (See Table 3 for time series abbreviations)
NOVEMBER 2014 CHECKLEY AND L INDEGREN 2883
(2253 6 0018C n 5 27) During this period air tem-
perature was 2048C and HS was 06m
4 Discussion
We assume that the water temperature has been
measured accurately and hence is comparable over the
entire time series at SIO and elsewhere At SIO the
same protocol has been used to collect water since 1916
The change from mercury to digital thermometers was
gradual over the period 2008ndash10 Thus we conclude that
changes in temperature are not due to measurement
error We also assume that the SST time series at other
shore stations are comparable (cf McGowan et al
1998)
STARS and OLS-CUSUM tests show a positive dis-
continuity in ResSST based on the PDO in 1988 at SIO
but not at other shore stations to the north The 1988
discontinuity based on the PDO remains when the
global annual-mean SST is subtracted from the annual-
mean SSTSIO consistent with the discontinuity not
having resulted from detrending in the PDO calculation
(Mantua et al 1997) Both types of tests are sensitive to
the length and period of the time series When the pre-
dictor was PC1 of the annual-mean SST time series for
shore stations to the north (excluding SC) STARS showed
a discontinuity in 1992 (Fig 7a) and OLS-CUSUM
a broad trough from 1982 to 1995 (Figs 5b 8) We
attribute the different results using the PDO and PC1SSto lesser precision associated with the shorter time series
(54 yr) used to compute PC1SS compared with the lon-
ger time series for SSTSIO and PDO (95 yr) In addition
there are other unaccounted sources of variation in the
shore station SST time series and thus PC1SS The
abrupt increase in the intercept but not the slope of the
regression of annual-mean SSTSIO on the PDO (Figs 5c
and 5d respectively) is also consistent with an abrupt
increase in annual-mean SSTSIO in 1988 Collectively
these results are consistent with a change in 1988 of SST
measured at the SIO pier but not at other locations with
the exception of SC
SSTSIO measured every minute by the CSST in-
strument during the period 7ndash10 July 2014 varied on
a diel cycle and at shorter time scales manifest by pulses
of warming (Figs 9d 10) Daytime increase in SST is
common (eg Webster et al 1996 Prytherch et al
FIG 5 OLS-CUSUM based on (a) ResSSTSIOPDO and (b) ResSSTSIOSS (c) Intercept and (d) slope of a linear
regression of SSTSIO on PDO using a sliding window of 10 yr Vertical black dashed lines indicate SIO pier change in
1988
2884 JOURNAL OF PHYS ICAL OCEANOGRAPHY VOLUME 44
2013) due to daytime increases in the fluxes of sensible
heat and shortwave radiation into the ocean Overlaid
on this gradual increase were distinct pulses of warming
notable in the time domain for both SSTSIO (Fig 9d) and
residuals from the smoothed time series of SSTSIO
(Figs 9endashh) Power spectra of the residuals show an
abrupt increase in variance at periods equal to and
greater than 40min (Fig 10) Monthly averages of daily
power spectra of high-passed near-surface temperature
measured at the end of the SIO pier during 2011 also
peaked at40min (Figs S2 and S3 in the supplemental
material) Such variability is consistent with that pre-
viously observed for rip currents near the SIO pier
(Smith and Largier 1995) Measurements made 1412ndash
1727 LT 14 July 2014 showed water in the surf zone to be
078Cwarmer than SSTSIO despite the air being cooler
than the water and thus the flux of sensible heat being
from the ocean to the atmosphere indicating shortwave
radiation as the cause of ocean heating Shortwave ra-
diation heats the surf zone both directly by heating the
FIG 6 OLS-CUSUM of residual SST time series based on the PDO (ResSSTXXXPDO where XXX is SST time series abbreviation) Red
solid lines indicate 95 confidence intervals (See Table 3 for time series abbreviations)
NOVEMBER 2014 CHECKLEY AND L INDEGREN 2885
water and indirectly by heating the beach that in turn
heats the water during wave runup (Stockdon et al
2006) and flood tide Enhanced flow by rip currents of
surf-zone water warmer than the surface water near the
end of the pier where SSTSIO is measured will act as
a buoyant surface jet (cf Jirka et al 1981) and contribute
to warmer SSTSIO Enhanced flow by rip currents of
surf-zone water cooler than surface water near the end
of the pier will act as a negatively buoyant jet and sink
beneath warmer less dense surface water and not af-
fect SSTSIO (cf Saeedi et al 2012) We assume the
forcing of rip currents is positively related to signifi-
cant wave height HS which does not vary on a diel
cycle (eg Fig 9c) Our observations of diel variation
in SSTSIO and ResSSTSIO (Figs 9dndashh) showing greater
high-frequency variability during the day than night
FIG 7 Annual-mean residuals (ResSSTXXXSS where XXX is SST time series abbreviation) of observed SST from SST predicted
from PC1 of other shore station time series using linear regressions of annual-mean SST on PC1 until 1987 for (a)ndash(m) shore stations and
(n)ndash(o) offshore SST time series Significant discontinuities in ResSST detected by STARS are shown in gray [See Table 3 for time series
abbreviations and number of shore station time series used in each principal component analysis (PCA)]
2886 JOURNAL OF PHYS ICAL OCEANOGRAPHY VOLUME 44
are consistent with rip currents occurring during both
day and night but affecting SSTSIO primarily during
the day
Rip currents are associated with piers due to bottom
scouring around pilings and reduced surface wave energy
(Haller et al 2002 MacMahan et al 2006 Dalrymple
et al 2011 Farahani et al 2014) Preliminary observa-
tions show the bottom depth beneath the outer50m of
the present SIO pier to be approximately one meter
deeper than adjacent depths (Fig S4 in the supple-
mental material) consistent with bottom scouring as-
sociated with the pier pilings
Collectively our results indicate rip currents transport
relatively warm water from the surf zone to the location
where SSTSIO ismeasured Our results are also consistent
with prior observations of rip currents at the present SIO
pier (Smith and Largier 1995 Chang and Twardowski
2011 Twardowski et al 2012)
FIG 8 OLS-CUSUM of residual annual-mean SST time series based on the PC1 of other shore station time series (ResSSTXXXSS
where XXX is SST time series abbreviation) Red solid lines indicate 95 confidence intervals (See Table 3 for time series abbreviations
and number of shore station time series used in each PCA)
NOVEMBER 2014 CHECKLEY AND L INDEGREN 2887
Wehypothesize that the abrupt increase in ResSSTSIO
and implicitly SSTSIO in 1988 was due in part to en-
hancement of rip current transport of relatively warm
surf-zone water at the present SIO pier We assume that
rip currents were associated with the old SIO pier We
propose that the 54 increase in area of pilings from the
old (133m2) to the present (208m2) pier led to in-
creased scouring and decreased wave energy and thus
increased rip current transport Comparable observa-
tions for the old SIO pier are not available and no longer
possible Hence we are unable to rigorously test our
hypothesis
The only other shore station to show such a change in
ResSST with both test types is the San Clemente pier
(STARS 1983 OLS-CUSUM 1988 Figs 3 4b 6ndash8)
The SC pier was built in 1928 with wood pilings it was
extensively damaged during an El Nintildeo in 1983 and re-paired in 1985 with new and larger pilings Although theSC time series is shorter and information limited SSTmeasured at both the SIO and SC piers may have beenaffected by similar structural enhancements and thusincreased rip current transportHare and Mantua (2000) analyzed time series of 100
physical (atmosphere rivers and ocean including
FIG 9 SST measured from SIO pier by CSST instrument and related variables (a) Air
temperature (8C) (b) Water level (m) (c) Significant wave height (m) (d) SSTSIO (8C) fromCSST (black line) and standard bucket sample (red cross) Black bars denote sunset to sunrise
(e)ndash(h) Residual of SSTSIO (d) minus double runningmean of SSTSIO computed using windows
of 30 60 120 and 240 values (min) respectively
2888 JOURNAL OF PHYS ICAL OCEANOGRAPHY VOLUME 44
SSTSIO) and biological (plankton nekton and birds)
variables together and in groups In addition to a major
change in 1977 an abrupt change in 1989 was observed
in a number of cases more for biological than physical
variables with SSTSIO showing a relatively small in-
crease (ibidem) Breaker (2007) and Breaker and Flora
(2009) analyzed time series of SST for the SIO pier PG
andKokoHead (KH) Hawaii Brief decreases in SST in
1989 were observed at all three locations using CUSUM
A newer test the method of expanding means was used
to assess long-term change associated with observed
shifts and showed no response at SIO and 048C de-
crease at KH Rebstock (2002) analyzed copepod
(zooplankton) abundance for 1951ndash99 in the CalCOFI
region Abrupt changes for some taxa including late
developmental stages of Calanus pacificus occurred in
1989 but were neither consistent among taxa nor long-
lived McGowan et al (1998) showed SST to vary co-
herently and simultaneously on the annual time scale
along theUSWest Coast Our use of residuals from the
regression of annual-mean SST on the PDO and PC1 of
the West Coast SST time series accounts for large-scale
variation in SST Thus while such change occurred in
the North Pacific in 1977 and the late 1980s it does not
explain the discontinuity in ResSSTSIO in 1988
5 Conclusions
We show a positive discontinuity in ResSSTSIO and
implicitly SSTSIO in 1988 after accounting for large-scale
FIG 10 (a)ndash(d) Power spectra of ResSSTSIO using a double running-mean window of 30 60 120 and 240min
(Figs 9endashh) relative to a distribution of Gaussian (white) noise Mean and 95 confidence intervals are shown by
horizontal gray lines respectivelyMost power is at periods longer than 40min (vertical red line) but is removedwhen
averaging window approaches as in (b) or is shorter than this period as in (a)
NOVEMBER 2014 CHECKLEY AND L INDEGREN 2889
variation in SST represented by the PDO and PC1 of
the other West Coast SST time series This disconti-
nuity is coincident with the change in measurement of
SSTSIO from the old to the present pier We hypothesize
this discontinuity is due in part to enhanced rip current
transport of relatively warm surf-zone water to the lo-
cation of measurement of SSTSIO The discontinuity in
1988 (Fig 1b) indicates the timing of the abrupt shift in
the annual time series The 1988 discontinuity (10798CResSSTSIO1989-2010-ResSSTSIO1916-1987 Fig 1b) can be
attributed to processes not accounted for by the
PDO including long-term warming (10348CERSSTv3b1989-2010-ERSSTv3b1916-1987) and artifact
(10458C) due to both rapid (1988 pier change) and
gradual (eg time of day of SSTSIO measurement)
processes It is incumbent on users of the SSTSIO time
series to consider the sources of variability in SSTSIO in
each specific use The long-term (1916 to present)
trend of SSTSIO without adjustment for artifact is
1118Ccentury21 (p 0001 MannndashKendall correla-
tion10299 p 0001 n5 93) If the artifact (10458C)is subtracted from SIOSST from 1988 onward the long-
term trend is 1068Ccentury21 (p 5 0007 Mannndash
Kendall correlation 10190 p 5 0007 n 5 93) While
the unadjusted trend has been cited as evidence of faster
increase of California coastal than global SST (Kadir
et al 2013) the adjusted trend is consistent with the
twentieth-century trend in global SST (107 6028Ccentury21 Smith et al 2008)
This artifact may also have contributed to the more
variable relationship between SSTSIO and recruitment
of the Pacific sardine (Sardinops sagax) in recent de-
cades (McClatchie et al 2010 Sugihara et al 2012
Lindegren and Checkley 2013) with implications for
sardine management SSTSIO explained significant var-
iability in the relationship between biomass and re-
cruitment for the Pacific sardine based on data for 1935ndash
63 and 1986ndash90 (Jacobson and MacCall 1995) This led
to the use of the 3-yr running mean of annual-mean
SSTSIO in the fishery harvest guideline that determines
the fraction (F percent) of available sardine biomass
allocated for capture (eg Hill et al 2011) Had SSTSIO
been adjusted for the artifact after 1988 F would have
decreased in cool years For example in 2001 the 3-yr
running mean of SSTSIO was 1728C An adjustment of
SSTSIO by 20458C would have decreased F from 15
to 6 the sardine quota by 23 and the ex-vessel
landing revenues of the fishery by $6 million A tem-
perature index from theCalifornia CooperativeOceanic
Fisheries Investigations (CalCOFI) explains more vari-
ability than SSTSIO in the relationship between sardine
biomass and recruitment (Lindegren and Checkley
2013) In March 2014 the Pacific Fishery Management
Council decided to use the CalCOFI temperature index
rather than SSTSIO in the sardine harvest guideline
(Pacific Fishery Management Council 2014)
Time series of measurements from the SIO pier in-
cluding SST are of increasing value particularly in the
context of climate change Our intent in this paper has
been to further increase the value of the SSTSIO time
series through an enhanced understanding of its prop-
erties We strongly advocate it be continued
Finally three points merit mention First this study
reemphasizes the need for the careful maintenance of
environmental time series What may appear to be small
changes in protocol can have significant consequences
for measurements Any change in protocol should be
critically assessed Second the interpretation of time
series of environmental data must take into account any
changes in protocol and their effects Third many
coastal time series are from regular measurements made
from piers Such measurements may be affected by rip
currents and hence changes in pier structure and wave
power (eg Bromirski et al 2013)
AcknowledgmentsWe thank Reinhard Flick Melissa
Carter and Eric Terrill for access to data We thank
Mark Morales for help in field measurements Melissa
Carter Dan Cayan Falk Fedderson Reinhard Flick
Robert Guza Eddie Kisfaludy and John McGowan
provided valuable comments on the study Mario
Aguilera three anonymous reviewers and the editor
provided constructive comments on the manuscript ML
was supported by a Scripps Institution of Oceanography
(SIO) Postdoctoral Fellowship with funds fromSIO and
NSF Grant OCE-0928425 to DMC
REFERENCES
Akaike H 1974 New look at statistical-model identification IEEE
TransAutomControl 19 716ndash723 doi101109tac19741100705
Breaker L C 2007 A closer look at regime shifts based on coastal
observations along the eastern boundary of the North Pacific
Cont Shelf Res 27 2250ndash2277 doi101016jcsr200705018
mdashmdash and S J Flora 2009 Expressions of 1976ndash1977 and 1988ndash
1989 regime shifts in sea-surface temperature off Southern
California and Hawailsquoi Pac Sci 63 39ndash60 doi102984
1534-6188(2009)63[39EOARSI]20CO2
Bromirski P D D R Cayan JHelly and PWittmann 2013Wave
power variability and trends across theNorthPacific JGeophys
Res Oceans 118 6329ndash6348 doi1010022013JC009189
Brown R L J Durbin and J M Evans 1975 Techniques for
testing the constancy of regression relationships over time
J Roy Stat Soc 37B 149ndash163
Chang G and M S Twardowski 2011 Effects of physical forcing
and particle characteristics on underwater imaging per-
formance J Geophys Res 116 C00H03 doi101029
2011JC007098
2890 JOURNAL OF PHYS ICAL OCEANOGRAPHY VOLUME 44
Dalrymple R A J H MacMahan A Reniers and V Nelko
2011 Rip currents Annu Rev Fluid Mech 43 551ndash581
doi101146annurev-fluid-122109-160733
Dayton P K M J Tegner P B Edwards and K L Riser 1999
Temporal and spatial scales of kelp demography The role of
oceanographic climate Ecol Monogr 69 219ndash250
doi1018900012-9615(1999)069[0219TASSOK]20CO2
Deyle E R and Coauthors 2013 Predicting climate effects on
Pacific sardine Proc Natl Acad Sci USA 110 6430ndash6435
doi101073pnas1215506110
Farahani R J R A Dalrymple A Herault and G Bilotta 2014
Three-dimensional SPHmodeling of a barrip channel system
J Waterw Port Coastal Ocean Eng 140 82ndash99 doi101061
(ASCE)WW1943-54600000214
Gargett A E 1997 The optimal stability lsquowindowrsquo A mechanism
underlying decadal fluctuations in North Pacific salmon
stocks Fish Oceanogr 6 109ndash117 doi101046
j1365-2419199700033x
Haller M C R A Dalrymple and I A Svendesen 2002 Ex-
perimental study of nearshore dynamics on a barred beach
with rip channels J Geophys Res 107 (C6) doi101029
2001JC000955
Hare S R and N J Mantua 2000 Empirical evidence for North
Pacific regime shifts in 1977 and 1989 Prog Oceanogr 47
103ndash145 doi101016S0079-6611(00)00033-1
Hatch M B A 2012 The schlerochronology of Donax gouldii
and Chione undatella Environmental archives of the past and
present Southern California Bight PhD dissertation Scripps
Institution of Oceanography 128 pp
mdashmdash S A Schellenberg and M L Carter 2013 BaCa variations
in the modern intertidal bean clam Donax gouldii An up-
welling proxy Palaeogeogr Palaeoclimatol Palaeoecol 373
98ndash107 doi101016jpalaeo201203006
Hill K T P R Crone N C H Lo B J Macewicz E D Dorval
J D McDaniel and Y Gu 2011 Assessment of the Pacific
sardine resource in 2011 for US management in 2012 NOAA
NationalMarine Fisheries Service Southwest Fisheries Science
Center Rep 6 pp [Available online at httpwwwpcouncil
orgwp-contentuploadsF2b_ATT1_SARDINE_EXSUM_
NOV2011BBpdf]
Hobday A J and M J Tegner 2002 The warm and the cold
Influence of temperature and fishing on local population dy-
namics of red abalone CalCOFI Rep 43 74ndash96 [Available
online at wwwcalcofiorgpublicationscalcofireportsv43
Vol_43_Hobday___Tegnerpdf]
Hsieh C H S M Glaser A J Lucas and G Sugihara 2005
Distinguishing random environmental fluctuations from eco-
logical catastrophes for the North Pacific Ocean Nature 435
336ndash340 doi101038nature03553
Jacobson L and A MacCall 1995 Stock-recruitment models for
Pacific sardine (Sardinops sagax) Can J Fish Aquat Sci 52
566ndash577 doi101139f95-057
mdashmdash and S McClatchie 2013 Comment on temperature-
dependent stockndashrecruitmodeling for Pacific sardine (Sardinops
sagax) in Jacobson and MacCall (1995) McClatchie et al
(2010) and Lindegren andCheckley (2013)Can J Fish Aquat
Sci 70 1566ndash1569 doi101139cjfas-2013-0128
Jirka G H K D Stolzenbach and E E Adams 1981 Buoyant
surface jets J Hydraul Div 107 1467ndash1487
Kadir T L Mazur C Milanes and K Randles Eds 2013 In-
dicators of climate change in California Office of Environ-
mental Health Hazard Assessment California Environmental
Protection Agency 228 pp [Available online at wwwoehha
cagovmultimediaepicpdfClimateChangeIndicatorsReport2013
pdf]
Kim H-J A J Miller J McGowan and M L Carter 2009
Coastal phytoplankton blooms in the Southern California
Bight Prog Oceanogr 82 137ndash147 doi101016
jpocean200905002
Lavaniegos B E and M D Ohman 2003 Long-term changes in
pelagic tunicates of the California Current Deep-Sea Res II
50 2473ndash2498 doi101016S0967-0645(03)00132-2
Lindegren M and D M Checkley Jr 2013 Temperature
dependence of Pacific sardine (Sardinops sagax) recruitment
in the California Current ecosystem revisited and revised
Can J Fish Aquat Sci 70 245ndash252 doi101139
cjfas-2012-0211
mdashmdash D M Checkley T Rouyer A D MacCall and N C
Stenseth 2013 Climate fishing and fluctuations of sardine
and anchovy in the California Current Proc Natl Acad Sci
USA 110 13 672ndash13 677 doi101073pnas1305733110
Mackas D L and G Beaugrand 2010 Comparisons of zoo-
plankton time series J Mar Syst 79 286ndash304 doi101016
jjmarsys200811030
MacMahan J H E B Thornton and A Reniers 2006 Rip cur-
rent review Coastal Eng 53 191ndash208 doi101016
jcoastaleng200510009
Mantua N S Hare Y Zhang J Wallace and R Francis 1997 A
Pacific interdecadal climate oscillationwith impacts on salmon
production Bull Amer Meteor Soc 78 1069ndash1079
doi1011751520-0477(1997)0781069APICOW20CO2
McClatchie S R Goericke G Auad and K Hill 2010 Re-
assessment of the stockndashrecruit and temperaturendashrecruit
relationships for Pacific sardine (Sardinops sagax) Can
J Fish Aquat Sci 67 1782ndash1790 doi101139f10-101
McGowan J A D R Cayan and L M Dorman 1998 Climate-
ocean variability and ecosystem response in the northeast Pa-
cific Science 281 210ndash217 doi101126science2815374210
Miller E F and J A McGowan 2013 Faunal shift in Southern
Californiarsquos coastal fishes A new assemblage and trophic
structure takes hold Estuarine Coastal Shelf Sci 127 29ndash36
doi101016jecss201304014
Pacific Fishery Management Council 2014 Decision summary
document Pacific fishery management council meeting March
8-13 2014 Pacific Fishery Management Council Rep 6 pp
[Available online at wwwpcouncilorgwp-contentuploads
0314decisionspdf]
Parnell P E E FMiller C E Lennert-Cody P K DaytonM L
Carter and T D Stebbins 2010 The response of giant kelp
(Macrocystis pyrifera) in Southern California to low-
frequency climate forcing Limnol Oceanogr 55 2686ndash2702Ploberger W and W Kraumlmer 1992 The CUSUM test with OLS
residuals Econometrica 60 271ndash285 doi1023072951597
Prytherch J J T Farrar and R A Weller 2013 Moored surface
buoy observations of the diurnal warm layer J Geophys Res
Oceans 118 4553ndash4569 doi101002jgrc20360
Rebstock G A 2002 Climatic regime shifts and decadal-scale
variability in calanoid copepod populations off southern
California Global Change Biol 8 71ndash89 doi101046
j1365-2486200200456x
Rodionov S N 2004 A sequential algorithm for testing climate
regime shifts Geophys Res Lett 31 L09204 doi101029
2004GL019448
Saeedi M A A Farahani O Abessi and T Bleninger 2012
Laboratory studies defining flow regimes for negatively
NOVEMBER 2014 CHECKLEY AND L INDEGREN 2891
buoyant surface discharges into crossflow Environ Fluid
Mech 12 439ndash449 doi101007s10652-012-9245-4
Schwing F B and R Mendelssohn 1997 Increased coastal up-
welling in the California Current System J Geophys Res
102 3421ndash3438 doi10102996JC03591
Smith J A and J G Largier 1995 Observations of nearshore
circulation Rip currents J Geophys Res 100 10 967ndash10 975
doi10102995JC00751
Smith T M R W Reynolds T C Peterson and J Lawrimore
2008 Improvements to NOAArsquos historical merged landndash
ocean surface temperature analysis (1880ndash2006) J Climate
21 2283ndash2296 doi1011752007JCLI21001
Stockdon H F R A Holman P A Howd and A H Sallenger
2006 Empirical parameterization of setup swash and runup
Coastal Eng 53 573ndash588 doi101016jcoastaleng200512005
Sugihara G R May H Ye C H Hsieh E Deyle M Fogarty
and S Munch 2012 Detecting causality in complex ecosys-
tems Science 338 496ndash500 doi101126science1227079
Tegner M J P K Dayton P B Edwards and K L Riser 1996
Is there evidence for long-term climatic change in Southern
California kelp forests CalCOFI Rep 37 111ndash126
[Available online at httpwwwcalcofiorgpublications
calcofireportsv37Vol_37_Tegner_etalpdf]
Twardowski M and Coauthors 2012 The optical volume scat-
tering function in a surf zone inverted to derive sediment and
bubble particle subpopulations J Geophys Res 117
C00H17 doi1010292011JC007347
Webster P J C A Clayson and J A Curry 1996 Clouds ra-
diation and the diurnal cycle of sea surface temperature in the
tropical western Pacific J Climate 9 1712ndash1730 doi1011751520-0442(1996)0091712CRATDC20CO2
2892 JOURNAL OF PHYS ICAL OCEANOGRAPHY VOLUME 44
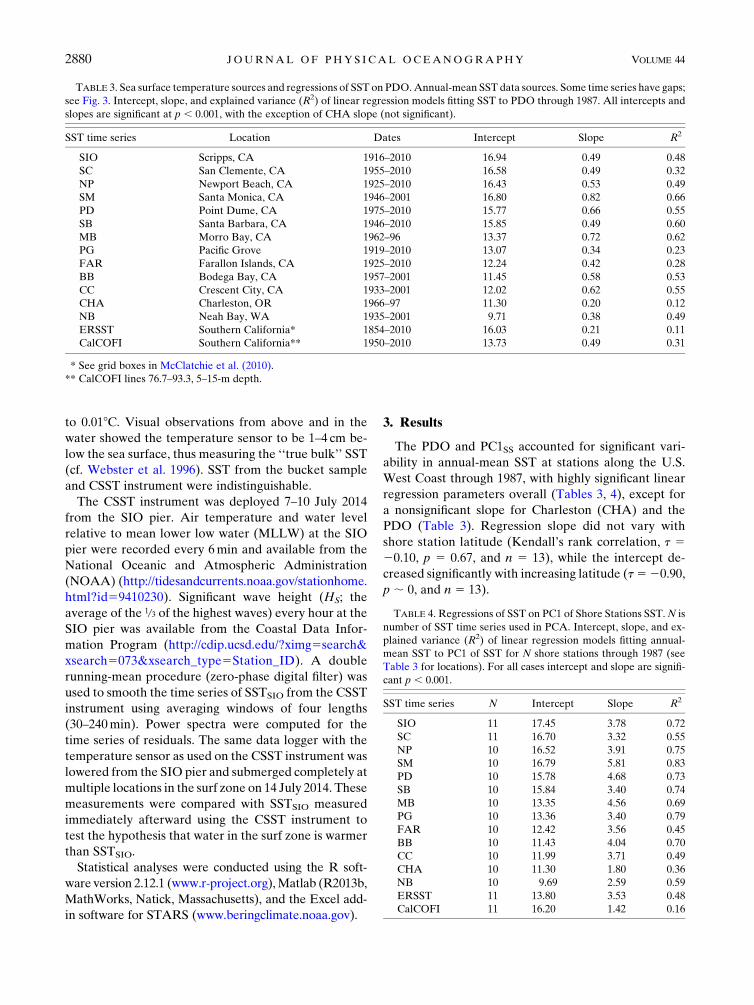
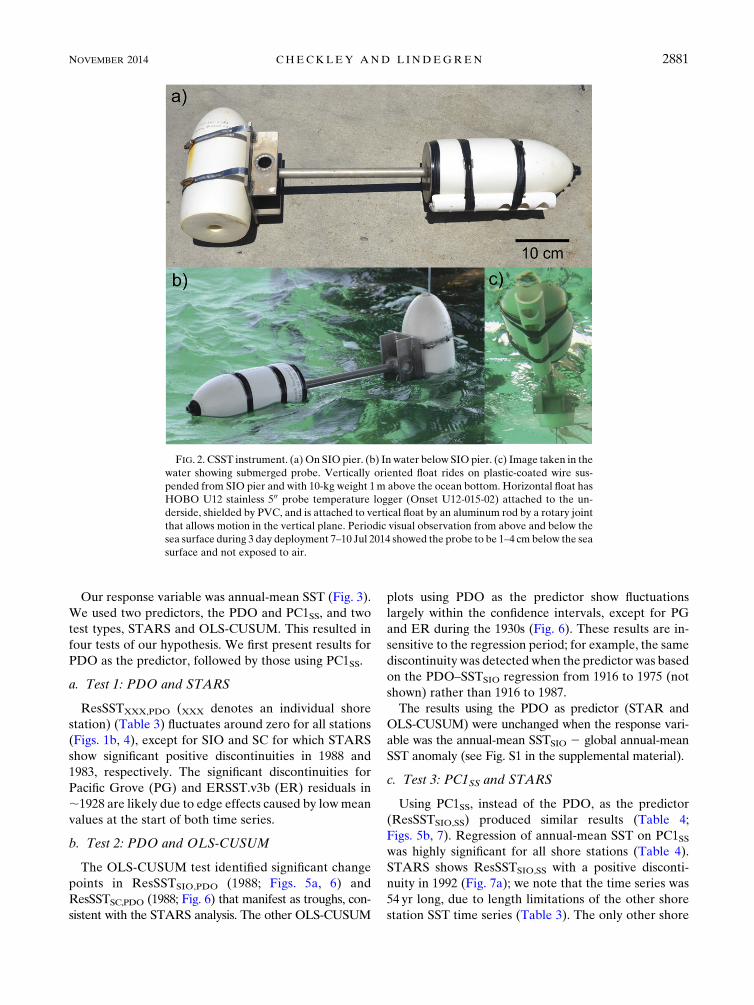
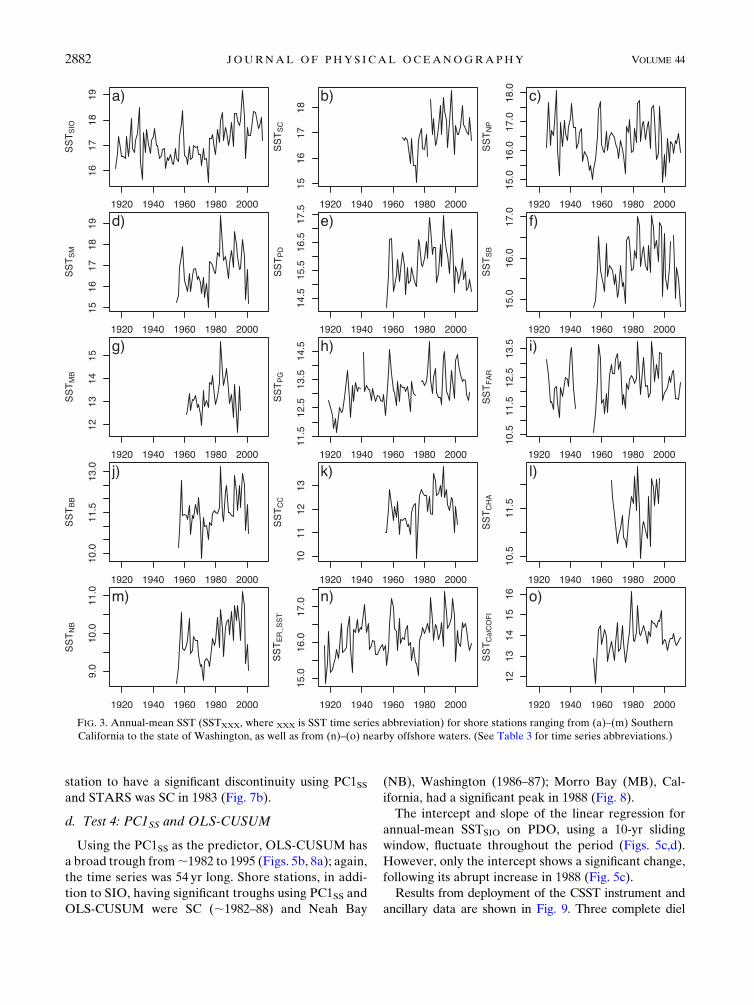
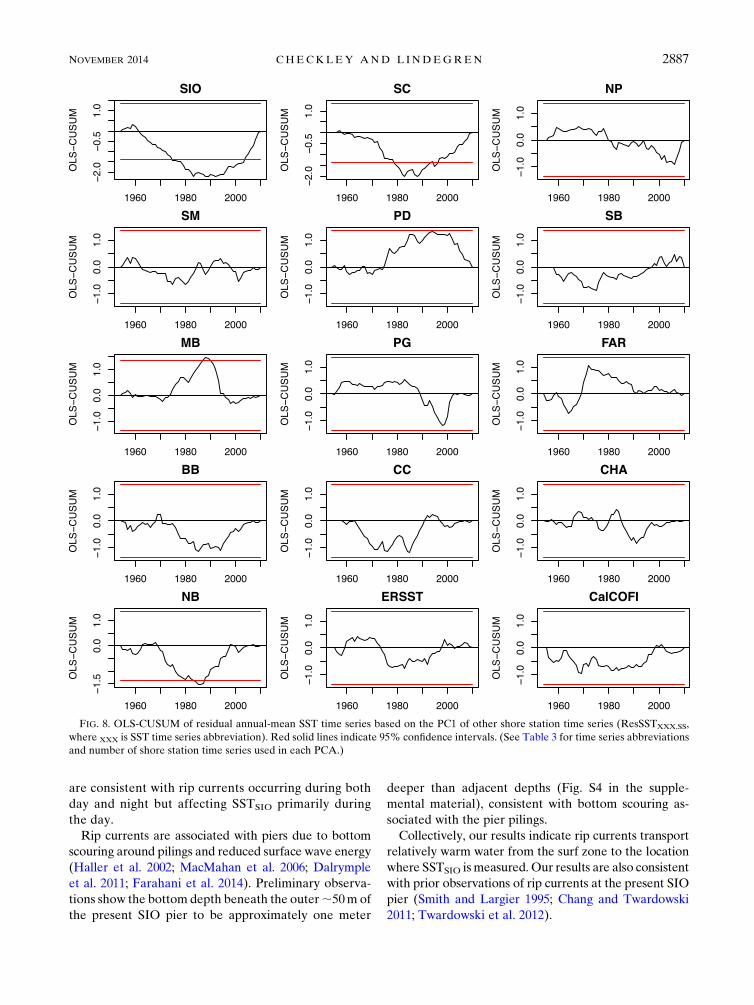
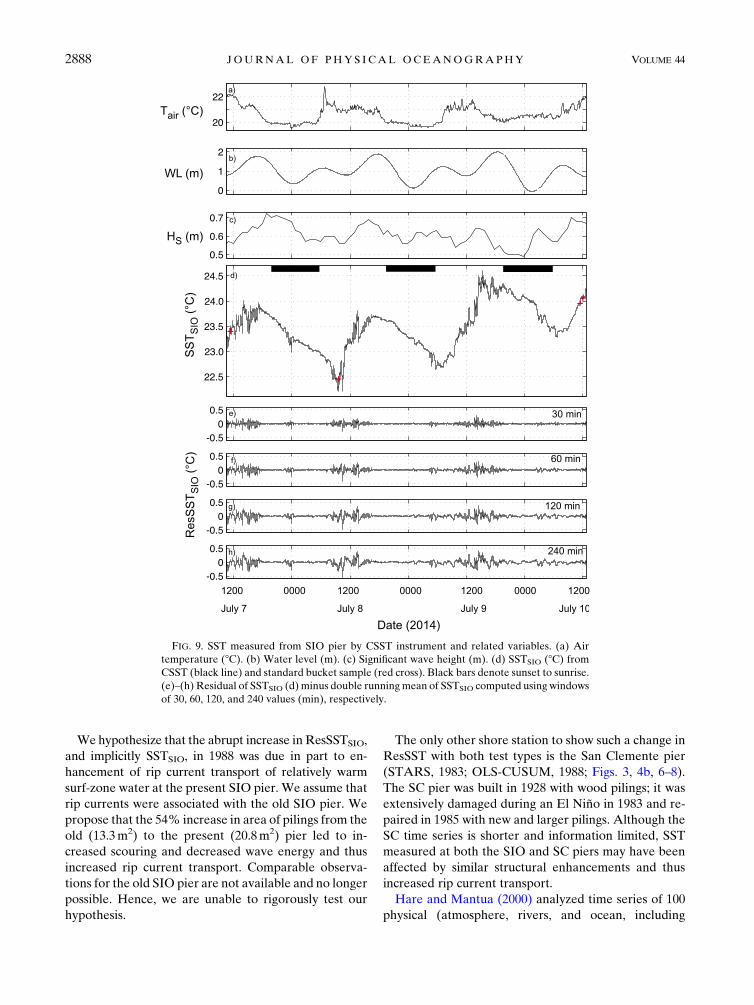
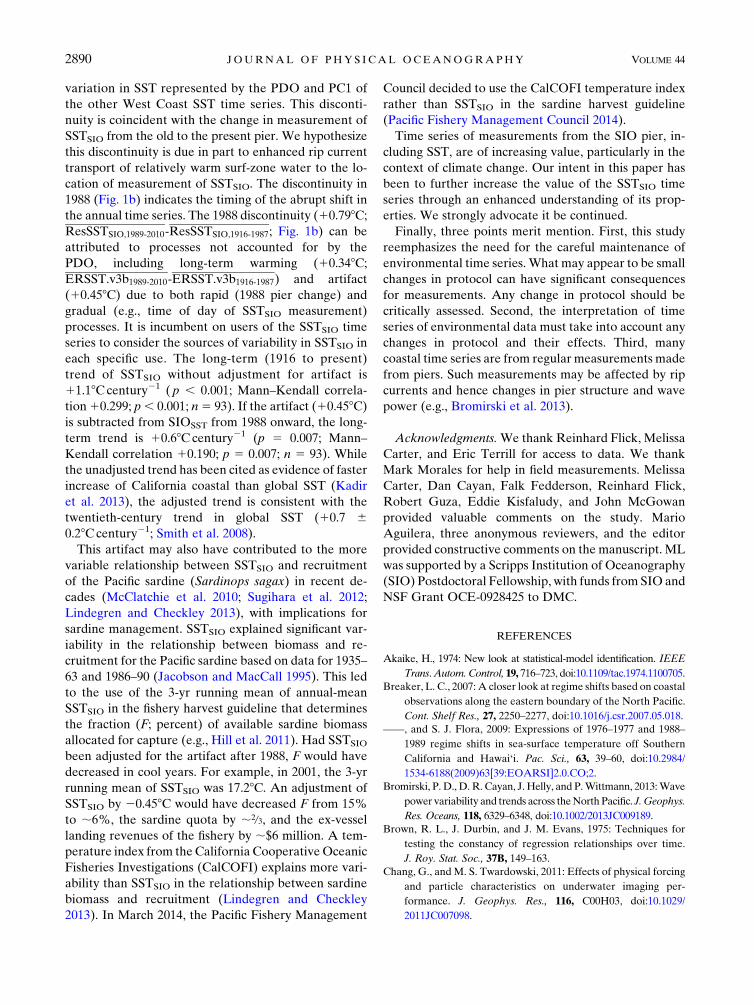