
2022 Awarding institution - Research Portal
394
Bangor University DOCTOR OF PHILOSOPHY The Impact of Transactional Website Adoption on Banks’ Performance Dang, Ho Phuong Lan Award date: 2022 Awarding institution: Bangor University Link to publication General rights Copyright and moral rights for the publications made accessible in the public portal are retained by the authors and/or other copyright owners and it is a condition of accessing publications that users recognise and abide by the legal requirements associated with these rights. • Users may download and print one copy of any publication from the public portal for the purpose of private study or research. • You may not further distribute the material or use it for any profit-making activity or commercial gain • You may freely distribute the URL identifying the publication in the public portal ? Take down policy If you believe that this document breaches copyright please contact us providing details, and we will remove access to the work immediately and investigate your claim. Download date: 01. Apr. 2022
-
Upload
khangminh22 -
Category
Documents
-
view
3 -
download
0
Transcript of 2022 Awarding institution - Research Portal
Bangor University
DOCTOR OF PHILOSOPHY
The Impact of Transactional Website Adoption on Banks’ Performance
Dang, Ho Phuong Lan
Award date:2022
Awarding institution:Bangor University
Link to publication
General rightsCopyright and moral rights for the publications made accessible in the public portal are retained by the authors and/or other copyright ownersand it is a condition of accessing publications that users recognise and abide by the legal requirements associated with these rights.
• Users may download and print one copy of any publication from the public portal for the purpose of private study or research. • You may not further distribute the material or use it for any profit-making activity or commercial gain • You may freely distribute the URL identifying the publication in the public portal ?
Take down policyIf you believe that this document breaches copyright please contact us providing details, and we will remove access to the work immediatelyand investigate your claim.
Download date: 01. Apr. 2022

1
TheImpactofTransactionalWebsiteAdoptiononBanks’Performance
ByHoPhuongLanDANG
Ph.D.Thesis
BangorBusinessSchool
BangorUniversity
26thJanuary2022

2
DECLARATION
Iherebydeclare that this thesis is theresultsofmyown investigations,exceptwhere
otherwisestated.Allothersourcesareacknowledgedbybibliographicreferences.This
work has not previously been accepted in substance for any degree and is not being
concurrentlysubmittedincandidatureforanydegreeunless,asagreedbytheUniversity,
forapproveddualawards.
Yrwyfdrwyhynyndatganmaicanlyniadfyymchwilfyhunyw’rthesishwn,aceithrio
lle nodir ynwahanol. Caiff ffynonellau eraill eu cydnabodgandroednodiadauyn rhoi
cyfeiriadaueglur.Nidywsylweddygwaithhwnwedicaeleidderbyno’rblaenargyfer
unrhywradd,acnidyw’ncaeleigyflwynoaryrunprydmewnymgeisiaethamunrhyw
raddonibaieifod,felycytunwydganyBrifysgol,amgymwysteraudeuolcymeradwy.
3
ABSTRACT
The aim of this thesis is to examine the value that the adoption of the transactional
websitehasaddedtobanks’financialperformanceandmarketvalue,overboththeshort
runandlongrun.Followingtheliterature,thisthesisdefinesthetransactionalwebsiteas
abankingwebsitethatallowscustomersto(i)accessinformationand(ii)conductthe
mostbasictransactionsviathesite,atleastbillpaymentsandfundstransfer.
Thisthesisbeginswithanoveldataincluding307fullylistedcommercialbanksintheUS
that launched their transactional website between 1996 and 2010. Following this,
conceptualmodelsareproposedbasedon the resource-basedview.This combination
allows the considerationof the impactof transactionalwebsite adoptionbasedon its
internalstrengthsandthereactionofthemarketandinvestors.
Subsequently, event study and financial measures are the principal methodologies
applied.ItisthefirsttimethatthetwometricsofCumulativeAbnormalReturnandBuy-
and-HoldAbnormalReturnareincorporatedintodigitalbankingliterature,allowingthe
exploitation of market responses and investor behaviour. Furthermore, this thesis
employsfinancialmeasures,alongwithaseriesofregressions,toexaminethestrategic
roleof transactionalwebsite adoption, via its strategic attributes. Strategic attributes,
underthegroundofresource-basedview,willbetherootofthesustainabilityoffirms’
strategy.Itisbecausetheycan(i)deliversuperiorperformanceandcompetitiveedge,
and (ii) preserve value and limit competition. In the banking literature so far, the
adoption of the transactional website is only verified to be profitable, efficient, and
innovativebutnotstrategicandsustainable.
Theresultsbringnewstoriesabouttransactionalwebsiteadoption.Most importantly,
the activation of transactional websites delivers value to both banks’ financial
performance and their market value in both the short- and long-term intervals,
complyingwiththevaluemindsetandsustainabilitymindset.Furthermore, itsatisfies
the conditions of the resource-based view by virtue of its six features, namely value,
appropriability,durability,inimitability,embeddedness,andinterconnectedness.These
features are proved via the way transactional website adoption strengthens the
profitabilityandefficiencyaswellasgeneratesisolatedmechanismstolimitcompetition
(e.g., cumulative experiences, the interconnectedness between transactional website
adoptionandmobilewebsiteadoption).Additionally,thisthesisprovidesnewfindings
oftheimpactofthesizefactor,timingfactorandvicariouslearningbehaviour.Ofwhich,

4
small banks and latecomers tends to achieve more superior performance from their
activation of transactionalwebsites. Furthermore, public information on theprevious
transactional website adoptions becomes an important mechanism for investors’
enhancementinevaluatingofotherwebsiteeventsafterward.
Such evidence suggests that it is time for banks to pay more attention to the value
delivered by their transactional website enablement. At the same time, investor
behaviour,marketresponse,andmulti-channelcombinationarealsowhatbanksshould
focusontodrivetheirsuccessinimplementingtransactionalwebsiteinitiatives.

5
ACKNOWLEDGEMENT
Inthissection,Iwouldliketoexpressmysincerethankstothosewhohaveaccompanied
andhelpedmeduringmydoctoralprogram.
Firstofall,IwouldliketothankBangorUniversityandthecollectiveacademicstaffin
generalfortheirsupport.ThankstoafullscholarshipfromBangorUniversityforhelping
mefulfilmydreamofresearchingadoctorate.
Following this, I would like to extend my sincere and special thanks to my three
supervisors.
Iwould like to expressmydeepest thanks toProf SantiagoCarbo-Valverde.He is the
personwhomostdeeplyinspiredmetoresearchinthebankingandfinancediscipline.
Heisalsoapersonwhohassupportedmealotsincemymaster'sdegree.Santiagohas
accompanied me through many difficulties during my PhD program. He is also my
teachingadvisor,helpingmetoachievemyFHEAdegreeintheprocessofimplementing
my PhD program. With all my gratitude, I want to thank Santiago for his wisdom,
understanding,andsupportthroughouttheyears.
IwouldliketoexpressmydeepgratitudetoDrSaverioStentellaLopeswhohasbeenof
great help inmy PhD thesis. The ideas of the URL data, the long-term buy-and-hold
abnormalreturnsaswellasthestatisticpartsweregreatlysupportedbySaverio.Healso
gaveme great creative inspiration and encouragedme a lot during difficult times of
mine.It canbesaid thatSaverio's ideasare the inspiration for thedevelopmentofmy
knowledge base later. Even when Saverio left Bangor University, he never stopped
helpingandcaringaboutmyPhD.AllIcansayisI'mreallygratefulforthis!
OneofthepeoplewhohadthebiggestinfluenceonmeduringthelastyearsofmyPhD
wasGwion. Iwould liketoextendmygratitudetoGwionforhishelp,whichhaseven
exceededmyexpectations.Hishelpisnotonlyprofessionalbutalsospiritual,whichhelps
mealottoovercomedifficulties.Hehasaccompaniedmethroughmanyupsanddowns
andisapersonwhocalmlysolvesproblemsthatarise.IcanonlysaythatGwion'ssupport

6
has greatly influenced the success of this PhD thesis. I hope he understands I cannot
expressmygratitudeforhishelpbywords.
I know that the abovewords formy supervisors are not never enough.With all my
respect, I thank and admire Santiago, Saverio, and Gwion for their great expertise,
understanding,sincerity,andsupportovertheyears.Iamforevergratefulforthat.You
guysarethebestteachersofmylife.
Iwouldalso like to thankProf.RashaAlsakka forherconcern forPhDstudents'well-
being. Additionally, I would like to thank Prof. Owain, Prof Owain ap Gwilym, Prof
Jonathan Williams, Prof Aziz Jaafar, Prof Edward Shiu, Prof Lynn Hodgkinson, Prof
AndrewHiscock,DrDanialHemmings,DrAlanThomas,DrNoemiMantovan,NiaWyn
Weatherleyfortheirprofessionalassistance.IwouldliketothankBangorUniversity's
academicstaffandotherstafffortheirdedicationtostudents(especiallyJulieBolton).I
wouldliketothanktheInternationalStudentTeam,Visa&Immigrationteam(especially
AlanEdwards),andthecounsellingserviceteamofBangorUniversity.ThankyoutoDr
RosannaRobisonandPGCertteamfororganizingusefulprogramsforus.
Thankyoutomyfamilywhohasbeenwithmethroughmanyupsanddowns.Thankyou
forplacingyourtrustinme.Throughmanyupsanddowns,Irealizethatfamilyisthebest
thingandIwouldliketothankmyparents(VanNghiepandMinhSuong)andmylittle
sister(AnhDang).Pleaseforgivethetimesthatupsetthefamily.Butthewayfromnow
onwillbebrightforme.Thankyoutomygrandmother,aunts(DiBa,DiBon,coHoa),
uncles(cauHai,cauBay),cousins(anhTin,anhSon,chiDiem,Chieu,Be),nephews(Ti,
Chuot),niecesforcaringandlovingme.ThePhDperiodwassobusythat Ididn'tpay
muchattentiontoyouguys.Butsurelymyloveforfamilyandrelativesneverchanges.
Love you forever,mom, dad, little sister, grandma, aunties, uncles, cousins, nephews,
nieces.
Iwouldliketothankmybestfriends.ThankyouPhuDat,VanDai,NgocThuy,TanLoc,
HanaNhi,ThaiNgoc(andhisfamilyandfriends),ThuSang,NgocDiep(andherfriends),
Rachel,Wang,Dong,TienLee(andhis familyandfriends)whohavebeenbymyside.
ThankstoVictoria,mybestfriend,aDr.inLaw,foraccompanyingandhelpingmeover

7
the years. Thanks to Josef for his great help in PhD proofreading. Thanks tomy PhD
colleagues (Summer,Alessio,Tolope,Weifei, Taniyang,Reida, Susan) for theirhelpful
suggestionsandsupport.ThankyoutoalltheotherfriendsinVietnam(especiallyThich
Le,TuanAnh,BaoAnh,MinhKhue,DieuMinh,DaiDuyenandThienPhuc,Lana,Tra,Minh
Quan),intheUK(especiallyJoeandJessica,Stephan,Cecil,Waleed,IoIo,Zelda,Baboo,
Azhar,)andothercountriesfortheirunderstandingandsharing.
Last but not least, I extendmy gratitude to the exminers of this thesis- Dr TimKing
(externalexaminer)andProfessorRashaAlsakka(internalexaminer).Their feedback
didhelptoimprovethisPhDthesispositivelyanditwasabsolutelyvaluablefeedbackfor
me. I firmlybelieve thatmyacademic expertise in the futurewill bepartly improved
thanks to the feedback from the examiners. Please allowme to be grateful for their
attentionandsupport.SpecialthanksalsogotoDrDanialHemming(chair),DrNoemi
Mantovan (as PGR Lead), Professor Andrew Hiscock (Dear of PGR), Prof Owain ap
Gwilym,andJulieBoltonforallthesupportthroughout.
Withallmygratitude,Iwouldliketothankandrememberthehelpinthisheartforever
after.
8
TABLEOFCONTENTS
DECLARATION...................................................................................................................................................2
ABSTRACT............................................................................................................................................................3
ACKNOWLEDGEMENT...................................................................................................................................5
TABLEOFCONTENTS.....................................................................................................................................8
LISTOFTABLES..............................................................................................................................................16
LISTOFFIGURES.............................................................................................................................................18
1 Chapter1:Introduction......................................................................................................................19
1.1 Background....................................................................................................................................19
1.2 MotivationsandAims................................................................................................................23
1.3 Methodology..................................................................................................................................26
1.4 Contribution..................................................................................................................................27
1.5 Structure.........................................................................................................................................28
2 Chapter2:LiteratureReviewandTheoreticalFramework...............................................30
2.1 TheoreticalFramework-Resource-basedView...........................................................30
2.1.1 TheGeneralConceptoftheResource-BasedView.............................................30
2.1.2 ResourcesandCapabilities............................................................................................30
2.1.3 AttributesofStrategicResources...............................................................................32
2.1.4 ImplicationsoftheResource-BasedViewforDigitalBankingAdoption..39
2.2 TheGeneralContextofDigitalization.................................................................................41
2.2.1 DigitalizationintheBankingIndustry.....................................................................41
2.2.2 OpportunitiesandChallengesinBankingDigitalization.................................42
2.3 ValueofDigitalization...............................................................................................................44
2.3.1 ValueofDigitalizationDeliveredtoCustomers...................................................44
2.3.2 ValueofDigitalizationAddedtoBanks’Performance.......................................53
2.4 TheUSbankingevolutionanddigitalizationintheUSbankingindustry..........65
2.4.1 Thederegulationsincethe1990s..............................................................................65
2.4.2 Financialcrisis(2007-2009)........................................................................................69
2.4.3 Post-crisisreforms(2010-2016)...............................................................................69
2.4.4 ThecompetitivelandscapeinUSbankingindustry...........................................70

9
2.4.5 TheimportanceofdigitalizationintheUSbankingindustry........................75
3 Chapter3:DataCollectionandDescription...............................................................................77
3.1 Sampling..........................................................................................................................................77
3.1.1 Thedefinitionoftransactionalwebsiteadoption...............................................77
3.1.2 Themotivationofchoosingthetransactionalwebsite.....................................78
3.2 DataCollection..............................................................................................................................80
3.2.1 Constructingthesampleofbanks..............................................................................80
3.2.2 TheTransactionalWebsiteAdoptionDate............................................................80
3.3 DataDescription..........................................................................................................................87
3.4 SomeImportantConsiderations...........................................................................................94
3.4.1 Marketreactiontothetransactionalwebsiteadoption...................................94
3.4.2 Banks’spre-announcements........................................................................................95
3.4.3 Survivorshipbias...............................................................................................................96
3.4.4 M&Aactivities.....................................................................................................................97
4 Chapter4:DoTransactionalWebsiteInitiativesAddValuetoBanks?.........................99
4.1 Introduction...................................................................................................................................99
4.2 Literaturereviewandhypothesisdevelopment.........................................................103
4.2.1 Theimpactofdigitalinitiativesonthemarketvalueofbanks....................103
4.2.2 TheMagnitudeEffect.....................................................................................................107
4.2.3 TheInfluenceoftheTimingEffect...........................................................................108
4.3 DataandMethodology............................................................................................................110
4.3.1 Data........................................................................................................................................110
4.3.2 Eventstudymethodology............................................................................................111
4.4 EmpiricalResultsandDiscussions....................................................................................115
4.4.1 EmpiricalResultsforHypothesis4.1:Wealthcreationoftransactional
websitelauncheventsovertheshortterm.............................................................................115
4.4.2 EmpiricalresultsforHypothesis4.2:Themagnitudeeffectintheshort-
termuponatransactionalwebsitelaunchevent..................................................................116
4.4.3 EmpiricalResultsforHypothesis4.3:Timingeffect........................................118
10
4.5 RobustnessTesting..................................................................................................................124
4.5.1 Alternativeestimationperiods..................................................................................124
4.5.2 Alternativemarketindex.............................................................................................124
4.6 Conclusion....................................................................................................................................125
4.6.1 SummaryofFindings.....................................................................................................125
4.6.2 ManagerialImplications...............................................................................................127
4.6.3 LimitationsandDirectionsforFutureResearch................................................128
5 Chapter5:DoestheAdoptionofTransactionalWebsitesImproveBanks’Financial
Performance?.................................................................................................................................................130
5.1 Introduction.................................................................................................................................130
5.2 LiteratureReview.....................................................................................................................133
5.2.1 Theaccounting-basedapproachanditssuperiority.......................................133
5.2.2 Theaccounting-basedapproachindigitalbankingliterature.....................134
5.2.3 LiteratureGaps.................................................................................................................135
5.3 HypothesesProposal...............................................................................................................139
5.3.1 TheFeaturesofValue,AppropriabilityandDurabilityinTransactional
WebsiteAdoption...............................................................................................................................139
5.3.2 TheFeaturesofEmbeddedness,Interconnectedness,andInimitabilityof
TransactionalWebsiteAdoption..................................................................................................140
5.3.3 Inter-FirmHeterogeneityduetotheSizeEffect................................................144
5.3.4 Inter-FirmHeterogeneityduetotheTimingOrderEffect............................147
5.4 Data.................................................................................................................................................151
5.4.1 Mobileadoptiondata.....................................................................................................151
5.5 MethodologyandEmpiricalResults.................................................................................153
5.5.1 Hypothesis5.1:Thelong-termimpactoftransactionalwebsiteadoption
onbanks’financialperformance..................................................................................................153
5.5.2 Hypothesis5.2:TheFeaturesofEmbeddedness,Interconnectedness,and
InimitabilityofTransactionalWebsiteAdoption.................................................................164
5.5.3 Hypothesis5.5:TheInter-FirmHeterogeneityAttributedtoSizeEffect178
11
5.5.4 Hypothesis5.4:Inter-firmHeterogeneityAttributedtotheTimingOrder.
186
5.6 Robustnesstest..........................................................................................................................191
5.6.1 Meandifferenceinbanksaccountingperformance.........................................191
5.6.2 Dynamicstesting..............................................................................................................192
5.6.3 Re-categorizationofbanksizeintothreequantiles.........................................193
5.6.4 Re-estimationofallmainequations,usingyear,stateandbank-levelfixed
effect 193
5.7 Conclusion....................................................................................................................................195
5.7.1 SummaryofFindings.....................................................................................................195
5.7.2 MainContributions.........................................................................................................198
5.7.3 ManagerialImplications...............................................................................................200
5.7.4 LimitationsandFutureDiscussion..........................................................................201
6 Chapter6:DoDigitalTransactionalWebsiteInitiativesAddValuetoBanksinLong
Run?...................................................................................................................................................................204
6.1 Introduction.................................................................................................................................204
6.2 LiteratureReview.....................................................................................................................208
6.2.1 Theimpactofdigitaladoptiononbanks’performanceinthelongrun..208
6.2.2 Thegapindigitalbankingliteratureandtheimportanceoflong-term
examination...........................................................................................................................................208
6.2.3 Long-runreturnAnomaliesLiterature..................................................................209
6.2.4 Mainfindingsintheliteratureandthisresearchcontribution...................210
6.3 HypothesisProposal................................................................................................................214
6.3.1 Hypothesis6.1:Wealthcreationoftransactionalwebsiteadoptioninthe
longterm.................................................................................................................................................214
6.3.2 Hypothesis6.2:Theimpactofthe“learningbyobserving”effect.............220
6.3.3 Hypothesis6.3andHypothesis6.4:Theimpactofthemagnitudeeffect
andtimingeffectoverthelongterm..........................................................................................221
6.4 MethodologyandDataDescription...................................................................................222
6.4.1 Estimationoflong-termAbnormalReturns........................................................222

12
6.4.2 MethodologyofHypothesis6.1:TheregressionbetweenBHARand
transactionalwebsiteadoption....................................................................................................230
6.4.3 MethodologyofHypothesis6.2:Theimpactofthe“learningbyobserving”
231
6.4.4 MethodologyofHypothesis6.3:Theimpactofmagnitudeeffectinthe
longrun 232
6.4.5 MethodologyofHypothesis6.4:Theimpactoftimingeffectinthelongrun
233
6.4.6 DescriptiveStatistics......................................................................................................237
6.5 EmpiricalResults.......................................................................................................................240
6.5.1 ResultsofHypothesis6.1:Wealthcreationoftransactionalwebsite
adoptioninthelongterm................................................................................................................240
6.5.2 ResultsofHypothesis6.2:Theimpactofthe“learningbyobserving”....245
6.5.3 ResultsofHypothesis6.3:Theimpactofmagnitudeeffectinthelongrun
249
6.5.4 ResultsofHypothesis6.4:Theimpactoftimingeffectinthelongrun...252
6.6 RobustnessTests.......................................................................................................................257
6.6.1 Applicationofalternativebenchmarks..................................................................257
6.6.2 The“Learning-by-observing”effect........................................................................257
6.6.3 Thesizeeffectoverbothex-anteandex-postperiodsoftransactional
websitelaunchingevents................................................................................................................258
6.6.4 Thetimingeffectovertheex-postperiodoftransactionalwebsitelaunch
events. 259
6.6.5 Re-estimationofallmainequations,usingfixedeffects................................260
6.7 Conclusion....................................................................................................................................260
6.7.1 SummaryofFindings.....................................................................................................260
6.7.2 SupportiveLiteratureandFurtherDiscussions.................................................262
6.7.3 ManagerialImplications...............................................................................................264
6.7.4 LimitationsandFutureDiscussions........................................................................266
7 Chapter7:Conclusion......................................................................................................................268
7.1 TheFindingsineachEmpiricalChapter.........................................................................268
13
7.1.1 Chapter4:DoTransactionalWebsiteInitiativesAddValuetoBanks?...268
7.1.2 Chapter5:DoestheAdoptionofTransactionalWebsitesImproveBanks’
FinancialPerformance?....................................................................................................................269
7.1.3 Chapter6:DoDigitalTransactionalWebsiteInitiativesAddValueto
BanksinLongRun?............................................................................................................................270
7.2 ResearchContributions..........................................................................................................272
7.3 ManagerialImplications.........................................................................................................273
7.4 LimitationsandFurtherResearch.....................................................................................275
REFERENCES.................................................................................................................................................277
APPENDIX.......................................................................................................................................................327
AppendixA-AdditionalAnalysesforModelsinChapter4...................................................327
TableA.4.5CumulativeAbnormalReturnuponWebsite-LaunchingAnnouncements,
usingalternativeestimationperiods..............................................................................................328
TableA.4.6CAR(%)offirms,whicharesubsampledusingmarketsizearoundthe
dateofannouncement...........................................................................................................................329
TableA.4.7CumulativeAbnormalReturnuponWebsite-LaunchingAnnouncements,
usingalternativebenchmark..............................................................................................................330
TableA.4.8CumulativeAbnormalReturnofSub-samplesuponWebsite-Launching
Announcements,usingalternativebenchmark..........................................................................331
TableA.4.9CAR(%)ofCumulativeAbnormalReturnofSub-samplesuponWebsite-
LaunchingAnnouncements,usingalternativebenchmark...................................................332
AppendixB-AdditionalAnalysesforModelsinChapter5...................................................333
FigureA.5.4NetInterestMarginforallU.SBanksfrom1986to2020............................334
TableA.5.11TransformationinFinancialPerformanceof307USBankssincethe
TransactionalWebsiteAdoption.......................................................................................................335
TableA.5.12DynamicImpactsofTransactionalWebsiteAdoptiononBanks’
Performance...............................................................................................................................................336
TableA.5.13Themagnitudeeffectintransactionalwebsiteadoption,usingthreesize-
basedquantiles.........................................................................................................................................338
TableA.5.14Themagnitudeeffectintransactionalwebsiteadoption,usingthreesize-
basedquantiles.........................................................................................................................................340
TableA.5.15Variationin“LearningbyBehaviour”Variable................................................343

14
TableA.5.16Re-estimationofEquation5.1,usingYearandStateFixedEffects.........344
TableA.5.17Re-estimationofEquation5.2,usingYearandStateFixedEffect...........345
TableA.5.18Re-estimationofEquation5.3,usingYearandStateFixedEffects.........346
TableA.5.19Re-estimationofEquation5.4,usingYearandStateFixedEffects.........347
TableA.5.20Re-estimationofEquation5.5,usingYearandStateFixedEffects.........349
TableA.5.21Re-estimationofEquation5.6,usingYearandStateFixedEffects.........350
TableA.5.22Re-estimationofSub-samples,basedontheirsize,usingyearandstate
fixedeffects.................................................................................................................................................352
TableA.5.23Re-estimationofEquation5.7,usingYearandStateFixedEffects.........354
TableA.5.24Re-estimationofEquation5.1,usingYear,StateandBankFixedEffects
..........................................................................................................................................................................356
TableA.5.25Re-estimationofEquation5.2,usingYear,StateandBankFixedEffects
..........................................................................................................................................................................357
TableA.5.26Re-estimationofEquation5.3,usingYear,StateandBankFixedEffects
..........................................................................................................................................................................358
TableA.5.27Re-estimationofEquation5.4,usingYear,StateandBankFixedEffects
..........................................................................................................................................................................359
TableA.5.28Re-estimationofEquation5.5,usingYear,StateandBankFixedEffects
..........................................................................................................................................................................361
TableA.5.29Re-estimationofEquation5.6,usingYear,StateandBankFixedEffects
..........................................................................................................................................................................362
TableA.5.30Re-estimationofSub-samples,basedontheirsize,usingyear,stateand
bankfixedeffects.....................................................................................................................................364
TableA.5.31Re-estimationofEquation5.7,usingYear,StateandBankFixedEffects
..........................................................................................................................................................................366
AppendixC-AdditionalAnalysesforModelsinChapter6...................................................368
TableA.6.11TheimpactoftransactionalwebsiteadoptiononBHARsoverthree
holdingperiods,usingalternativebenchmarks.........................................................................369
TableA.6.12Theimpactof“Learning-by-Observing”from2-yearInformation
SpilloveronBHARssincethetransactionalwebsiteadoption............................................370
TableA.6.13Theimpactof“Learning-by-Observing”from3-yearInformation
SpilloveronBHARs.................................................................................................................................372
sincethetransactionalwebsiteadoption......................................................................................372

15
TableA.6.14ThemagnitudeeffectonBHARuponex-anteandex-postperiodofthe
transactionalwebsiteadoption.........................................................................................................373
TableA.6.15ThetimingeffectonBHARuponex-anteandex-postperiodofthe
transactionalwebsiteadoption.........................................................................................................375
TableA.6.16Re-estimationofEquation6.6,usingfixedeffects..........................................377
TableA.6.17Re-estimationofEquation6.7,usingfixedeffects..........................................381
TableA.6.18Re-estimationofEquation6.8,usingfixedeffects..........................................385
TableA.6.19Re-estimationofEquation6.9,usingfixedeffects..........................................389
16
LISTOFTABLES
Table2.1StrategicAttributesofResourcesandCapabilities......................................................35
Table2.2StrategicAttributesofDigitalAdoptionandInfluenceonCustomerBehaviour
inUse....................................................................................................................................................................49
Table2.3DigitalBankingAdoptionandtheImpactonCustomerOutcomes......................55
Table2.4DigitalBankingAdoptionandtheImpactonFinancialPerformance.................60
Table2.5USBankingStructurefrom1990-2018............................................................................67
Table2.6Thenumberoflargemergertransactionsfrom1980to1998...............................68
Table2.7ConcentrationinAssetsandDepositsinUSBankingMarketfrom1994-2018
.................................................................................................................................................................................72
Table3.1SampleSizeDistribution.........................................................................................................89
Table3.2BankCharterandSizeDistribution....................................................................................90
Table3.3EventdateandBanksizeDistribution..............................................................................91
Table3.4Countoffinancialinstitutionsbystate,asofMarch31,2020................................92
Table4.1SummaryofEventDatesandTestPeriodsforAbnormalReturns.....................114
Table4.2CumulativeAbnormalReturnuponWebsite-LaunchAnnouncements...........121
Table4.3CAR(%)offirms,whicharesubsampledusingmarketsize.................................122
Table4.4CAR(%)offirmsaroundtheirannouncementdates,.............................................123
Table5.1SummaryofVariables.............................................................................................................156
Table5.2Pre-adoptionandPost-adoptionPerformanceofSampleBanks........................160
Table5.3Theimpactoftransactionalwebsiteadoptiononthefinancialperformanceof
banks..................................................................................................................................................................163
Table5.4Theoverall impactof transactionalwebsiteadoptions’experienceonbanks’
performance....................................................................................................................................................166
Table5.5Theimpactofmobilewebsiteadoptiononbanks’performance........................171
Table5.6Theimpactofinterconnectednessbetweentransactionalwebsiteadoptionand
mobilewebsiteadoptiononbanks’performance..........................................................................172
Table5.7Theimpactof“learningby-observing”onbanks’performance..........................177
Table5.8Theimpactofsizeeffectonbanks’performance.......................................................182
Table5.9Themagnitudeimpactinadoptingtransactionalwebsite-Sub-samples........184
Table5.10Theimpactoftimingeffectinadoptingthetransactionalwebsite..................189
Table6.1Literatureontheimpactsofdigitaladoptiononbanks’performanceinthelong
run.......................................................................................................................................................................212
17
Table 6.2 Proposed Strategic Resources and Capabilities of Transactional Website
Adoption...........................................................................................................................................................217
Table6.3Summaryofstudiesanalysinglong-runabnormalstockreturns.......................224
Table6.4SummaryofVariables.............................................................................................................234
Table6.5DataDescription.......................................................................................................................239
Table6.6Buy-and-HoldAbnormalReturns(BHARs)upon......................................................243
Table6.7The impact of transactionalwebsite adoptiononBHARsover threeholding
periods...............................................................................................................................................................244
Table6.8Theimpactof“Learning-by-Observing”fromInformationSpilloveronBHARs
sincethetransactionalwebsiteadoption..........................................................................................248
Table6.9ThemagnitudeeffectonBHARuponex-postperiodofthetransactionalwebsite
adoption............................................................................................................................................................250
Table6.10ThetimingeffectonBHARuponex-postperiodofthetransactionalwebsite
adoption............................................................................................................................................................254

18
LISTOFFIGURES
Figure2.1Trend inConcentration inAssets andDeposits inUSBankingSystem from
1994-2018.........................................................................................................................................................73
Figure3.1SnapshotsofWellFargowebsiteonWaybackMachine..........................................84
Figure3.2HistoricalWellFargowebsitepageviaitsfirstsnapshot.......................................84
Figure3.3HistoricalWellFargowebsitepageviaitsfirstsnapshot.......................................85
Figure3.4DistributionofSampleBanksbytheirEventYear.....................................................86
Figure3.5ReturnsonequallyweightedInternetindex,S&P500,andNasdaqcomposite
.................................................................................................................................................................................93
Figure4.1Theinvolvementofinternalfactors(resourcesandcapabilities)andexternal
factors(marketandinvestors)ininfluencingbankperformance..........................................106
Figure5.1FrameworkofResearchHypotheses.............................................................................150
Figure5.2SnapshotsofWellFargowebsiteonWaybackMachine........................................152
Figure5.3ScreenshotofWellsFargo'sMobileWebsiteInformation....................................153
Figure6.1Keyrolesofresourcesandcapabilities.........................................................................216
Figure6.2TheenlargementofthesizeeffectonBHARsofsmallandlargebanks.........251
Figure6.3TheenlargementofthetimingeffectonBHARsamongsecond-moverandfirst-
movergroupsoverthe24-monthand36-monthperiodsfollowingtransactionalwebsite
events.................................................................................................................................................................256
Figure6.4TheenlargementofthetimingeffectagainstBHARsamonglargerandfirst-
movergroupsoverthe24-monthand36-monthperiodsfollowingtransactionalwebsite
events.................................................................................................................................................................256
19
1 Chapter1:Introduction
1.1 Background
Globalspendingondigitaltransformationisestimatedtoamountto$2.3trillionby2023,
asreportedbyIDC(2019).95%ofcustomerinteractionswillbecontrolledbyArtificial
Intelligence systems by 2025, as reported by Servion (2018). 59%of enterprises are
afraidthattheyarelateintheirdigitaltransformationefforts,andonly7%ofbusinesses
believetheyhavefullysettheirdigitaltransformationsinmotion,asreportedbyForbes
(2019).These areonly a fewoutof themany statisticsdepicting the current stateof
digitalizationandtheenormousandevolvingexpansionofdigitalactivities intoevery
cornerofsocietyandindustry.Indeed,nowadays,digitalizationintegratesintoalmostall
corporate strategies as well as alters the scale and scope of various aspects of
organizations(Bharadwajetal.,2013;BirgitandElsa,2019;GroverandKohli,2012;Hess
etal.,2016;Ngaietal.,2011;Pagani,2013).
The banking industry is certainly not on the sidelines of this digital transformation.
Indeed,thefinancialsectorisamongthetopthreeindustriesfordigitaltransformation,
with93%ofbusinessesalreadyimplementingadigital-firstbusinessstrategyaccording
toIDG(2018).By2024,mobileandonlinebankingareanticipatedtohavegrownby54%
comparedto2020,withmorethan3.6billioncustomersusingtheseservices(Juniper
Research, 2020). Academic studies also provide evidence that the re-configuration of
financial institutions take intoaccount thesemassivedigitaldisruptions isproceeding
vigorously and diversely, with omnichannel integration and diversification in digital
products/servicesmorestreamlinedprocesses,andbetterservicedeliverywithfewer
mistakesandmoreagileemployees(Carbó-Valverdeetal.,2020;Kelly,2014;Siaetal.,
2016).
Thedigitaltransformationofthebankingindustry,however,hasprovokedanumberof
concerns.Asoftoday,banksarefacinganumberofpressures,suchas:(i)thethreatfrom
digitaldisruptiongeneratedbytheFinTechandBigTechindustries;(ii)nichenewmarket
entrantswithinnovativebusinessmodels;(iii)furtherlegalregulations;(iv)theperilsof
Blockchain;and(v)therisingdemandofdigitallysavvycustomerswhoareincreasingly
awareofbankingcapabilitiestoofferthemdigitalfinancialservices(Carbó-Valverdeet
al.,2020;NättiandLähteenmäki,2016;Siaetal.,2016;Swacha-Lech,2017).Forexample,
banksaroundtheworldlosemorethan$1trilliontocybercrimeseachyear,asreported

20
byAccenture(2019).Databreaches increasedby480%in2018(compared to2017),
equatingtoalossofabout$3.86billionaccordingtoFinancialTimes(2018).Thethreat
fromthedigitaldisruptionofFinTechsandBigTechsisestimatedtodestroysignificant
valueforbanksatleast30-50%ofthenetprofitofbanks(Siaetal.,2016).Therecent
global survey of Deloitte in 2018 shows that 56% of surveyed customers leave their
primarybankinthenexttwoyearsastheyfindbetterpricing,lowerfees,or/andmore
personalizedservicesaswellasmoreattractive loyaltyandreward/programatother
banks.
Underavarietyofpressuressuchascosts,traditionalandinterdisciplinarycompetitors,
aswell as cybersecurity risks, banks are now having problemswithwhere their key
digitalprioritiesshouldbe.“Banksstruggletodeliverinnovativefunctionalitiesandare
stillhesitatingaboutkeyprioritiestopursue”asdescribedbyDeloitte(2019).Moreover,
thepressureisnowcomingfrominvestors,analysts,andmanagementteamswhomay
raise questions about the lack of progress coming from their investments. “Financial
institutions are struggling to make and deliver on the investments they need to be
successfulin10years’timewhiledeliveringvalueforshareholdersintheshort-term”,
saidWyman(2020,p.4).Consideringthis,forthepresenttime,itisessentialtofindthe
preferreddigitaldirectionforfinancialinstitutions.
Most recently, a numberof researchpapers specifically emphasize the role of aweb-
basedbankingchannel.Thesedocumentsshowthatweb-basedbanking is indeedstill
playinganintegralroleinthebankingdeliverysystem,despitethedominanceofmobile
banking and banking applications. More specifically, the report of Deloitte (2018)
concerningitsglobalsurveytakinginMay2018revealsthat94%ofsurveyedcustomers
using mobile banking services use their PC/laptop to access their online banking
platformsatleastonceamonth.1Amongthem,upto38%prefertousetheirlaptopsto
maketransfers,only10%lowerthanthosewhoprefertouseamobilephoneforthesame
transactions.Morenotably,up to53%ofcustomerswilluse theircomputers tomake
1 Please access to the report via https://www2.deloitte.com/us/en/insights/industry/financial-services/online-banking-usage-in-mobile-centric-world.html.Also,forfurtherinformationconcerningthesurveyofDeloitte(2018),pleaseaccesstohttps://www2.deloitte.com/us/en/insights/industry/financial-services/digital-transformation-in-banking-global-customer-survey.html. In which, 17,100 bankingconsumersacross17countriesinMay2018weresurveyedbytheDeloitteCentreforFinancialServicestoestimatethecurrentstateofbanks’digitalengagement.
21
international transactions, comparedwith 24% of customers whowill do it on their
phones.ThesurveyofDeloittealso figuresoutseveralreasonswhyweb-basedonline
banking still plays a vital role in the mobile-centric era which are security and
convenience.ThesefindingsareinlinewiththerecentacademicstudyofCarbó-Valverde
et al. (2020) which reveals that perceived safety influences consumers’ adoption
decisionswhentheygotodigitalbanking.Moreinterestingly,theresultsrevealthatan
averageof58.97%ofcustomersfeelssafeorverysafewithonlinebankingwhilethat
percentageisonly44.29%formobilebanking.Meanwhile,customersfeelthatitiseasier
touseonlinebankingovermobilebanking(66.86versus63.59).2
Thesementioneddocumentssuggest thatwebsite-basedbankinghasan irreplaceable
roledespitetheadventanddominanceofmobilebankingapps.AsDeloitte(2018)states
“Therearepotentialchallengesifbanksallowmobilebankingtoeclipseonlinebanking
fully”,aquestionwasraisedastowhetherthetransactionalwebsiteinitiativeisexactly
what investorsand theoristsexpected,whichwillpotentiallygeneratebothshortand
long-termreturnsforfinancialinstitutionsontheirpathofdigitalization?Intheacademic
worldsofar,however,therearestillsomegapsasfollow:
Firstly,therearethreemainliteraturelinesinthefieldofdigitalbankingasfollows.The
firststreamfocusesonthefeaturesofdigitaladoptionswhichmaysignificantlyinfluence
customerbehaviour,suchasusefulness,easeofuseandsafety(Aliyuetal.,2014;Gerrard
andBarton,2003;Lee,2009;Liuetal.,2011;MannandSahni,2011;Royetal.,2017).The
secondstreamfocusesontheimpactofadigitaladoptionaddedtocustomeroutcomes,
such as higher customer revenue and lower customer costs (Gensler et al., 2012),
increasedengagementinonlineactivities(HittandFrei,2002;StraderandHendrickson,
2001;Xueetal.,2011),andsuperiorcustomerexperience(MbamaandEzepue,2018).
Thethirdstreamfocusesonthefinancialbenefitsofadigitaladoptionaddedtobanks.
Morespecifically,viaadigitaladoptionbankscanbenefitintermsof:(i)newrevenue
streams;(ii)non-interestactivitiesdiversification;and(iii)effectivenessandefficiency
2Conciselyput,theresearchofCarbó-Valverdeetal.(2020)isalsoinlinewithotherstudiesthatfoundthatonline/Internetbankingbringssomeadvantages(e.g.easeofuse,usefulness,safety),whichsignificantlyincrease customer outcomes (e.g. higher customer revenue and lower customer costs, increasedengagement in online activities, superior customer experience, customer satisfaction and trust andcustomerefficiency).(AhmadandAl-Zu’bi,2011;Buelletal.,2010;Dabholkar,1996;FirdousandFarooqi,2017;HittandFrei,2002;MannandSahni,2011;MbamaandEzepue,2018;Xuetal.,2013;Xueetal.,2011).PleasereferChapter2,Section2.3.1forfurtherdiscussion.
22
(Al-HawariandWard,2006;Cicirettietal.,2009;Delgadoetal.,2007;DeYoung,2005;
DeYoungetal.,2007;Furstetal.,2002;GohandKauffman,2015;HernandoandNieto,
2007;MbamaandEzepue,2018;Momparleretal.,2013;Pignietal.,2002;Scottetal.,
2017;Sullivan,2000;Xueetal.,2007).
Nevertheless,theseaboveliteraturestreamsfacesomechallenges.Firstly,fromtheangle
of some theories that take into account firms' capabilities and competencies (e.g.,
resource-basedtheoryorknowledge-basedtheory),customervalueisnecessarybutnot
sufficient to spell out all the mechanisms determining the performance of firms.3
Secondly, the financial metrics are in low frequency by reason of being reported
periodically. Besides, it has been emphasized that there exists intangible strategic
resourcesandcapabilitieswhichareunderlyingmuchofthesuccessofthefirmbutare
virtually invisible on financial statements and thereby, tortuous to be tracked and
evaluated.4
So far, very little attention paid to the market value of a digital adoption which is
evaluatedbythemarketandinvestors.Accordingtoboththeoreticalandempiricalwork,
investorshavetheroleofdetecting,evaluatingandpredicting(Balasubramanianetal.,
2005;Benbunan-FichandFich,2004;Deaneetal.,2019;SabherwalandSabherwal,2005;
Xiaetal.,2016).Marketreactionsandinvestors’actionsareperceivedassuperiorasthey
canofferevaluationsinthemostcomprehensivemannerandattheearliestopportunity
(Fama,1970,1998,2021;Malkiel,1989).Moreover,thevisionarycapabilityisameritof
market judgment,potentiallybringing to light the intangiblevaluesofevents thatare
latent behind the accounting figures. Market evaluation and investor participation,
however,arestillmostlyinaccessibletodigitalbankingliteratureinboththeshort-run
andlong-run.
Intermsoftransactionalwebsiteadoption,inparticular,therehasbeenlittlequantitative
analysis of more extended up-to-date examinations concerning the impact of
transactional website adoption on banks’ performance. The value that transactional
3Coyne(1986)andHall(1993)suggestthatnotonlydotheproductand/ordeliverysystemattributestocustomersneedtobesignificant,buttheyalsoneedtobetheresultofacapabilitydifferentialwhichwillendure.4 ItamiandRoehl(1991)pointout that therearesome intangibleassetsare lessreadilyandhardly tomeasureespeciallysomeincrementalvaluesaddedtoemployee’sskillsandknowledge.Forexample,itishard to reflect in financial statement the enhancing experience of customer service department afterdealingwithabundleofnon-standardizedproblemsofcustomers.

23
websiteshaveaddedtofinancialinstitutionshasbeensofarmostlyscopedwithinthe
earlystageofInternetbankingand/orovertheshortormediumterm(Delgadoetal.,
2007;DeYoungetal.,2007;Furstetal.,2000a;Sullivan,2000).Furthermore,thereisa
lackofemphasisonthestrategicattributesof transactionalwebsiteadoptionthrough
clarification of its sustainable values.More specifically, previous studies consider the
transactionalwebsiteasanadditionalchannelthatcomplementstraditionalbranching
channelsratherthanastrategicbankingdeliverychannel(Cicirettietal.,2009).Several
otherstudiesfocusonsomeparticularfeaturesoftransactionalwebsiteadoption,such
asinnovation(DeYoungetal.,2007;Pignietal.,2002),efficiencyandeffectiveness(Furst
etal.,2002),diversification(DeYoungetal.,2007;Pignietal.,2002).Sofar, littlepaid
attentiontothestrategicattributesoftransactionalwebsiteswhichcouldbetherootof
banks’economicbenefitsovertime,assuggestedbytheperspectiveofresource-based
view.
1.2 MotivationsandAims
Basedonthebackgroundindigitalbankingdisciplineasdiscussedabove,thisthesisaims
atexaminingthevalueoftransactionalwebsiteadoptioninboththemarketperspective
and financial perspective, inboth the short run and long run.This thesis is primarily
motivated by: (i) The important and unreplaceable role of transactionalwebsites, as
suggested by the literature; (ii) Some gaps in digital banking literature; and (iii) The
importanceofexaminationinboththeshortandlongrun.
Firstly, the advent of the transactional website is an important mark in the digital
transformation route of the banking industry. Before the advent of transactional
websites,financialtransactionswereconductedthroughface-to-faceinteractions.Since
theactivationoftransactionalwebsites,bankscanstartofferingtheirservicesatanytime
andanywheregeographicallymoreeffectively(Nathetal.,2001).Therefore,sincethe
activationofbankingwebsites, thebankwouldhavegradually formedthe firstdigital
capabilitiesandresourcesofitsown.5Overtime,digitalcapabilitiesandresourcesfrom
thetransactionalwebsitecanalsobetransferredandinterconnectedwithotherdigital
5SomedigitalcapabilitiesandresourcesofInternetbankingareinformationquality,system'sintegration,assuggestedbyOliveiraetal.(2016).
24
bankingdeliverychannels.6Furthermore,recentdocumentsalsohighlightthatwebsite-
basedbankinghas an irreplaceable role despite the advent anddominance ofmobile
bankingapps(Carbó-Valverdeetal.,2020;Deloitte,2018).
Secondly,thereissomelackindigitalbankingliteratureingeneralandinthescopeof
transactionalwebsiteadoption:(i)Thereislittleattentionpaidtomarketparticipantsin
evaluatingthevalueofdigitalbankingadoptionwhicharesuggestedmoreimmediate,
comprehensive and predictive; (ii) Literature so far only focuses on early stage of
transactional website adoption as well as the short to medium-term impact of this
adoptiononbank’sperformance;and(iii)Relativelylittleisknownaboutthestrategic
attributesofdigitaladoptionandtransactionalwebsiteadoptionwhicharesuggestedby
theresource-basedviewastherootofthesuperiorperformanceoffirms.
Thirdly, the perspective of resource-based view emphasises the importance of both
short-andlong-termexaminationoftheimpactofaninitiative.Alsosuggestedbysome
studies,withoutshort-termwealthdelivered,coupledwithalackofvisionordiscipline,
neither managers nor investors would want to waste their resources on further
strategies.7 In this case, the evaluation of market and investors in the short run is
importantasitsimultaneouslyreflectsamosttimelyintrinsicvalueaswellasindicates
thepredictionsofthefuturebenefitsofthatportfolio(suchassustainability,potential
growth, transformative benefits). By contrast, as the financial ratios are reported
periodically, the short-term intrinsic value of a portfolio is hard to be captured
immediately.Furthermore,by improvingthemarketvalue intheshortrun,bankscan
satisfytheircurrentshareholdersandgaintheirconfidence.8Fromthat,bankscanbetter
plantheircapitalstrategytopursuelonger-termgoals.Butcertainly,allbusinessentities
expectvaluecreationandsustainablegrowthofthebusinessovertime.Therefore,the
proof in short-term value is vital but not adequate to convince managers and
stakeholders to keep focusing on a particular portfolio. It is the case of transactional
6Forexample,Oliveiraetal.(2002)statesthatInternetbankingplaysanimportantroleinformingthecombinativecapabilitiesofservicequality,delivery,theflexibilityofbankinge-services.7Accordingtorecentreports,whatinvestorsexpecttobeforthcomingisawell-fundedorientationintosmallbut sustainabledigital initiativeswhichcancreateeconomic rents in the short runandpreservesustainable earnings and competitive advantages in the long run (Accenture, 2019; Wyman, 2020).Furthermore,asclaimedbyWyman(2020,p.5),"Currentvalueswillbringtransparency,controllability,andcontinuouseliminationoffailinginvestments".8Forexample,empiricalfindingsofSwitzerandCao(2011)showthathighshareholderconfidencevalueisassociatedwithhigherfirms’economicvalueadded.

25
websiteadoptionasaconcernmayberaisedastoifthetransactionalwebsitestilladds
valuetobanksoverthe longrun.Forexample,nowadays, thedigitalbankingdelivery
system tends tobedominatedbydigitalmobile banking andmobile applications, the
managersmaybeconcernedifthevalueoftransactionalwebsitesmaygraduallyerode,
whichmightgiveanindicationofthe impactthatdigitalmobile initiativeshaveinthe
longrun.
Followingpreviousstudies(Dandapanietal.,2018;DeYoungetal.,2007;Eglandetal.,
1998;Furstetal.,2000a;OCC,2000,2019),thisthesisdefinesatransactionalwebsiteas
a site which allows customers to access information and perform the most basic
transactions,includingpayingthebillandtransferringfunds.9,10Thisthesisthenseeks
to address the following researchquestionswhich are in turnpresented in empirical
Chapters4,5and6:
(i)“Whetherornotthetransactionalwebsiteeventsgainedasignificantresponsefrom
themarket in the short term. If applicable,what storyabout the implementationof a
transactionalwebsitewouldberevealed?”
(ii) “Does the transactional website strategically deliver value to a bank’s financial
performanceovertime?Ifthatisthecase,wheredoesthevaluecomefrom?”and
(iii)“Dotransactionalwebsiteinitiativescreatevalueforfinancialinstitutionsinthelong
run? What will be revealed about the transactional website adoption behind the
investor’sbuy-and-holdstrategy?”
Moreconcretely,Chapter4 intends toaddresshowthemarketreacts to transactional
website-enabled events in the short run, reflected through excess returns earned by
banks surrounding their transactionalwebsite-enabled events. In addition, Chapter 4
aimstoexaminesomemoderatingeffectsthatpossiblydifferentiateperformanceamong
banksaswellasalterthewaythemarketreactstotransactionalwebsitelaunchevents,
includingthemagnitudeeffectandtimingeffect.Thereafter,Chapter5isdevotedtothe
impact of transactionalwebsite adoption on the financial performance of banks over
time.Sixattributesoftransactionalwebsiteadoptionbasedontheresource-basedview
9Thisdefinitionisthebasisforthevalidationoftransactionalwebsiteeventdatesofthesamplebanks.MoredetailisdiscussedinChapter3,Section3.2.2.10MorediscussiononthedefinitionoftransactionalwebsiteisprovidedinChapter3,especiallySection3.1.1. Also please refer to Sections 3.1.1 and 3.1.2 for further discussions on the reason of choosingtransactionalwebsiteadoptionastheunitofanalysisaswellasmoreliteraturereviewontransactionalwebsiteadoptioninparticular.

26
are then examined, namely value, appropriability, durability, embeddedness,
inimitability, and interconnectedness. Such attributes clarify the strategic role of the
transactionalwebsite.Theheterogeneityamongbanksisalsotestedwhichispotentially
attributedtothesizeeffectandtimingordereffect.Finally,Chapter6aimstoexamine
howtheinvestorsevaluatetransactionalwebsiteadoptionthroughtheirbuy-and-hold
strategy in relation to the abovebenchmarks.This chapter also strives to answer the
questionoftowhatextentthetransactionalwebsiteadoptionimpactsthebuy-and-hold
abnormal returns (BHAR)which are treated as a proxy for banks’ long-termmarket
performance. Learning-by-observing, size effect and timing order effect are also
objectivesofthatchapter.
1.3 Methodology
Thefollowingmethodologyisappliedbasedonthedataof307fullylistedcommercial
banksintheUSmarket.
Firstly, Chapter 4 applies event studymethodology to estimateCumulativeAbnormal
Returnsearnedbybankssurroundingtheir launchevents.Morecharacteristically, the
marketmodelhasbeenconstructeduponseveralshort-runwindows[including(-1,+1);
(-2,+2);(-3,+3)]anddifferentestimationperiods(including-120days,-180days,-200
days, -300 days). On the foundation of the efficientmarket hypothesis (Fama, 1998),
event study is a great tool to recognize the added value of a specific corporate event
thanks to its ability to react immediately, precisely, and predicatively to themarket.
Today, event study has become one of themostwell-liked approaches, and iswidely
applied inmany disciplines (e.g., IT investments, e-commerce, security breach, M&A,
innovation,R&D,corporateawards).
Secondly, Chapter 5 employs a series of regression analysis to measure the direct
relationshipbetween transactionalwebsiteadoptionand the financialperformanceof
banksoveryears.Regressionanalysisisareliablemethodtoconfidentlydetermineifa
transactionalwebsite is a strategic digital initiative by estimating the effect of its six
attributes: value, appropriation, durability, embeddedness, inimitability, and
interconnectedness.Thesesixfeaturesaretestedtosatisfytheresource-basedview:(i)
competitive advantage and superior performance, and (ii) limit competition and
preservethevalue.

27
Finally, the event-time approach with the Buy-and-Hold Abnormal Return (BHAR)
metric,accompaniedbyregressionanalysisisthefoundationofChapter6.Tomeasure
BHAR,fivedifferentbenchmarksareapplied,includingthreemarketindices,anex-ante
buy-and-holdportfolioandanon-eventsize-matchedcontrolfirmportfolio.BHARisalso
treatedastheproxyofbanks’long-termperformancetofacilitatefurtherexaminationof
thedirecteffectsoftransactionalwebsiteadoption,informationspillovereffect,timing
effect,andsizeeffectonbanks’long-termperformance.
1.4 Contribution
(i) Firstly, in terms of data, this thesis provides exclusive data from 307 fully listed
commercial banks in the US market, concerning their transactional website launch
announcements from 1996-2010. Based on this data, this thesis becomes the first to
enable the participation ofmarkets and investors in evaluating transactionalwebsite
eventsasthefirstdigitalinitiativeoffinancialinstitutions.Also,basedonthisdataset,
themostup-to-dateaccountingdataisprovidedforthesamplebanksfrom1993-2018,
accordinglyauthenticatingtheimpactsoftransactionalwebsitesontheperformanceof
banksinamoresystematicandupdatedmannerinbankingliterature.
(ii)Secondly,intermsofmethodology,thisthesisisthefirstindigitalbankingliterature
puttheevent-timeapproachaccompaniedbytwometricsCumulativeAbnormalReturn
(CAR)(fortheshort-termhorizon)andBuy-and-HoldAnormalReturn(BHAR)(forthe
long-termhorizon)intopractice.CARandBHARarewidelyknownastworobustmetrics
for tracking down market evaluation and investor actions as well as offering an
evaluationofthevalueofeventsinatimely,relevant,accurate,andforward-lookingway.
Unfortunately,bothmetricsarestilluntappedindigitalbankingduetodataconstraints
and the rigour of benchmark selection. Furthermore, this thesis applies some non-
parametricbenchmarkswhicharewell-suited to situationswhere theassumptionsof
parametricstatisticsarenotmet,whichistypicallythecaseforsmallsamplesizes.
(iii)Thirdly,intermsoffindings,thisthesisprovidesempiricalresultswhich:
-Confirmthattransactionalwebsitesimprovemarketperformanceandfinancial
performanceofbanksinboththeshort-termandlong-termperspectives.Therewarding
featuresoftheadoptionofdigitaltransactionalwebsitesareconfirmedbythepositive
market reaction in the short runwith positive cumulative abnormal returns, positive

28
financialperformancethroughouttheyearsandpositiveinvestorevaluationinthelong
runthroughtheirbuy-and-holdstrategy.
- Confirm the impact and strategic role of transactional website adoption via
providing empirical results for six strategic attributes of the transactional websites’
adoption including value, appropriability, durability, embeddedness, inimitability, and
interconnectedness. Through possession of the six above-mentioned attributes, the
transactionalwebsitedeservesappreciationasastrategicdigitalinitiativeofbanksthat
cangenerateandpreservewealthoverthelong-term.Besidesthis,theempiricalfindings
provide a new understanding of the intangible attributes of transactional website
adoption,whicharebeyondthetwostandardattributesdetectedbypreviousstudies-
innovativenessandprofitability.
- Prove the rationality of themarket and investors in evaluating transactional
website portfolio. The verifying evidence includes (i) the existence of learning-by-
observingbehaviourofinvestorsthroughtheinformationspillovermechanism,(ii)the
existence of efficient or semi-efficient markets as the information spillover effect
becomes a learning mechanism of investors (iii) consistency between investors’
predictionsintheshortrunandinvestors’actionsinthelongrunand(iv)consistency
betweentheevaluationofinvestorsandactualfinancialperformanceofbanks.
(iv)Finally, thisthesisbringssomeimplications intermsofconceptualanalysis.More
specifically,thisthesisprovidesconceptualmodelson(i)theroleofinvestorsand(ii)on
howthe internal components (e.g., resourcesandcapabilitiesofdigital initiative)and
externalcomponents(marketandinvestors)interact.Alistofresourcesandcapabilities
of transactionalwebsites (e.g., digital culture, tacitdigitalknowledge,digitalnetwork,
digitalhuman) isalsosuggestedby this thesis tosupport therationalityofmarket. In
short, the conceptual analyses of this thesis have applied the crossover between the
resource-basedview,theefficientmarkethypothesisandmarketsignallinghypothesisto
explainhowtheinternalfactorsandexternalfactorscaninteracttogetherinthecaseof
transactionalwebsiteadoption.Theseconceptshavesofarreceivedlittleattentioninthe
literature.
1.5 Structure
The overall structure of this thesis takes the form of seven chapters, including this
introductorychapter.Chapter2providesthereviewonkeyconceptsandimplicationsof
29
resource-basedviewasthemaintheoreticalframeworkofthisthesis.Afterwards,that
chapterdiscussesonthemostrecentliteraturestreamsrelevanttothevalueofdigital
adoption in general and transactional website adoption in particular as well as the
landscapeofUSbankingindustryduringtheresearchperiod.Subsequently,Chapter3
discussesindetailtheformulationandthedescriptivestatisticsoftheresearchsample
andeventdates.Chapters4,5and6,inturn,provideempiricalresultstoachieveresearch
questions and objectives.More pointedly, Chapter 4 examines the short-termmarket
reactiontowardsthebank’stransactionalwebsiteeventssurroundingthetimetheyare
announced to the market. Subsequently, Chapters 5 and 6 investigate the impact of
transactionalwebsiteadoptiononbanks’performanceinthelongrun,inturnthrough
accountingmeasures(Chapter5)andBHARsmetric(Chapter6).Finally,Chapter7gives
a summaryof themain findingsof eachof theprevious chapters,main contributions,
managerialimplications,researchlimitationsandsomesuggestionsforfurtherresearch
inthefuture.
30
2 Chapter2:LiteratureReviewandTheoreticalFramework
2.1 TheoreticalFramework-Resource-basedView
Theresource-basedviewisthemaintheoreticalframeworkinthisresearch.Thissection
firstly discusses some key concepts of the resource-based view. After that, it will be
followedbythediscussiononwhytheresource-basedviewis important inthedigital
bankingliteratureandhowdotheconceptsrelatetotheaimsandobjectivesofthethesis.
2.1.1 TheGeneralConceptoftheResource-BasedView
At the heart of the resource-based view, the underlying source of firms' competitive
advantages and sustainable success is their idiosyncratic competencies (Amit and
Schoemaker,1993;Barney,1991;Petoeraf,1993).Organizationsarestronglybelievedto
gaineconomicrentsonlyinthecasethattheyareabletoefficientlyleveragetheirown
resources and capabilities which possess strategic features, such as value, firm-
specificity, inimitability, durability, appropriability, limited substitutability (Amit and
Schoemaker,1993;Barney,1991;CollisandMontgomery,1995;DierickxandCool,1989;
Grant,1991b;LippmanandRumelt,1982;Peteraf,1993;RumeltandLamb,1997).
Theresource-basedliteraturealsoconsiderstheimportanceofthemarket,e.g.,Rumelt
andLamb(1997,p.141)saythattheopportunitiesforfirmstoearnsuperiorrentmight
"jumpbehind"iffirmsdonotorareslowtoreacttounexpectedchangesinthemarket,
such as the changes in technology, regulation, consumer behaviour and so forth. In
another study, Amit and Schoemaker (1993) suggest "strategic industry factors"
significantly influence the path of firms' success, including involvement of market
participants(e.g.customers,stakeholders)aswellasthedynamicoftheeconomy.
2.1.2 ResourcesandCapabilities
"Resourcesarecrownjewelsandneedtobeprotectedastheyplayapivotalroleinthe
competitivestrategywhichthefirmpursues"(Grant,1991b,p.129).
Atfirst,resourcesaretheprimemoverofsuperiorperformance.Itiswidelyadmittedby
boththeoristsandempiricaladvocatesoftheresource-basedviewthatresources,dueto
the features specific to firms and their idiosyncrasies, have the ability to create
differentiationamongfirmsandaccordinglyendowfirmswithacompetitiveadvantage
(Barney,1991;Porter,1990)andinter-firmprofitdifferentiations(Grant,1991b;Winter,
1995). Therefore, in the language of the resource-based view, by focusing on the

31
exploitationofsuchundertaking-specificfactorsanddistinctivecompetenciesasinner
strengths,firmsareputtingthemselvesonasuccessfulpathwithsuperiorperformance
(Barney, 1991; Peteraf, 1993; Porter, 1990). For illustration, a substantial amount of
attentionhasbeenpaid to the conceptofknowledgeasoneof themostvaluableand
fundamental resources of the firm. Knowledge is believed to be the basis of a firm’s
superiorperformancenotonlybecausetheyaretheguideforanyactionandanystrategy
of the firm, but also because they are implicit, casually ambiguous, unique to firms,
socially involved and challenging for any external observation. Thereby, the rewards
firms obtain from their knowledge are differential economic rents and competitive
position(Hall,1993;OlavarrietaandFriedmann,1999;SpenderandGrant,1996;Teece,
1988).Conversely,firmsarefoundtoquitepossiblylosetheircompetitiveedgeifthey
emphasize investment without cautiously considering their tacit knowledge
(Johannessenetal.,2001;NonakaandTakeuchi,1995).
Asasecondpoint,resourcesareacompetitivebarriertoprotectthevalueof thefirm
sustained over time. This then suggests there are three features enabling resources
operating through this mechanism. Firstly, it is emphasized by Grant (1991a) that
resources,alongwithcapabilities,givedirectiontothefirmtodefineitself, identifyits
mission, strategy, targeted customers, andmarket.11 Similarly, Grant (1991b, p. 543)
assertsthat"thecompetitiveadvantageisprimarilyconcernedwithexploitingsuperior
resources and capabilities". Itmeans that by understanding and deploying resources
efficiently as inner strength, firms are able to direct themselves to cope with the
uncertaintyofthemarketaswellasthethreatfromtheirrivals.Secondly,resourceshave
thepowertolimitcompetitionthankstothefeaturesofspecificity,tacitness,complexity,
and stickiness to the firmwith time, thereby being a stumbling block to imitation or
substitution(Wernerfelt,1984).
Moreover, some authors call attention to the interconnectedness of resources as an
essential feature in limiting the competition (Barney, 1991; Black and Boal, 1994;
11Grant(1991a)reinforcesthispointbyrecallingTheodoreLevitt'ssuggestionthatenterprisesshouldre-definetheirservedmarketsmorebroadlytomanagetheriskofmarketchange.TheodoreLevitsuggeststhatrailroadsshouldnotbemerelyawareofthemasrailroadbusinessesbuttransportationbusinesseswhichallowthemtodiversifytheirbusinessandregulatethemselvesinthedynamicofexternalmarket.Grant(1991a)hasarguedagainstthisideabyquestioningwhetheritisreasonableforarailroadbusinesstodevelopsuccessfullyinrail,airorcarbusinesses.Hepointsoutthatthelineenterpriseisstillappropriatein the construction andmanagement of oil and gas pipelines as this somehow is compatiblewith theresourcesandcapabilitiesofrailroadsenterprise.
32
DierickxandCool,1989;Winter,1995).ItisclaimedbyWinter(1995,p.14)that"the
valueofidiosyncraticresourcestothefirm--i.e.,thepresentvalueoftheirfuturerent
streamsareaffectedbythefactthattheirpossibleusesincludethedevelopmentofmore
idiosyncraticresources".Theimplicationisthattheinterconnectednessamongspecific
resources within firms offers an additional advantage: an increase in the structural
complexity and ambiguous causalitywith the firm'sperformance. In thismanner, the
interconnectedness of resources would be considered as an isolating mechanism to
protectthefirm'srentsfromunfavourableimitationorreplicationofmovesfromothers
(Barney,1991).
Finally,resourcesarefoundtobeaninstrumentforfacilitatingdiversification.Wernerfelt
(1984)createdtheresource-productmatrix,whichindicatesthedynamicityofresources
inallocatingproducts/servicespreferabletoeachparticularmarket.Ittherebyshowsthe
roleofresourcesinrewardingfirmswithgrowthopportunitiesaswellasthedynamic
capabilitytoadapttodifferentmarkets.
Intermsofcapabilities,theyaregenerallydefinedasfirms'abilitytoemploy,combine,
and deploy their appropriate resources with the pursuit of an efficient and effective
ending.Putdifferently,"thecapabilitiesofafirmarewhatitcandoasaresultofteamsof
resources working together" (Grant, 1991b, p. 120). Amit and Schoemaker (1993)
distinguish capabilities from resources by proposing the role of capabilities towards
organizational systems and the responsiveness to themarket. They put forward that
thesecapabilitiesassisttheorganizationinshorteningthedevelopmentcycle,facilitating
innovation,andactivating flexibilities for repeatedprocesses.Also, capabilitiesenable
firmstoidentify,acknowledge,comprehendandpredictthemarket;accordingly,firms
gainbetterresponsivenesstowardthemarket.Grant(1991a)definescapabilitiesasthe
meansthroughwhichafirm’sresourcesarecoordinated.Resourcesenhancecapabilities
inlong-runadvantage(Winter,1995).Therefore,itisworthhighlightingthatthereisno
separatingoperationbetweenorganizationalresourcesandcapabilities.Instead,theyare
inanintertwinedandmutuallysupportiverelationship.
2.1.3 AttributesofStrategicResources
Theorists of the resource-based view have identified sets of resource attributes that
might conceptually influence a firm’s competitive advantages. In general, the authors
believethatresourcesandcapabilitiesbecomestrategically importantonlywhenthey

33
possessafullsetofrelevantcharacteristics.Forinstance,itisproposedbyBarney(1991)
thatthereareasetoffourconditionsthataresourceshouldcompletelyfulfiltobecome
strategic,namelyvalue,rareness, inimitability,andnone-substitutability.Evenfurther,
AmitandSchoemaker(1993)suggesteightattributesforastrategicresource,including
complementary,scarcity,lowtradability,inimitability,durability,appropriability,limited
substitutability,complementarityandoverlapwithstrategicindustryfactors.
Overall, a great number of attributes has been proposed as necessary conditions for
strategic resources. Notably, those attributes are diverse in both substance and
terminology.Asanexample,mobilityisofinteresttobothAmitandSchoemaker(1993)
andGrant(1991b)inconsideringthestrategicattributesofresourcesandcapabilities,
albeititisnamedwithdifferentterms:tradabilityandtransferability,respectively.Based
onthedepictionsofeachterminologyproposedbyauthors,thischaptercategorizesthem
into several headings where they are likely to possess similar features. More details
pertainingtothestrategicattributesofresourcesandcapabilitiesarepresentedinTable
2.1.
The details of Table 2.1. highlight a set of six attributes that potentially make the
resources/capabilities tobecome strategically important.Value andappropriation, on
thegroundofquiteanumberofresource-basedviewtheoristsandempiricaladvocates,
are fundamental for firmstoenhanceefficiency(Barney,1991)aswellascapturethe
valueinthemostfeasibleway(CollisandMontgomery,1995).Rarity,whichisalsocalled
by other terminologies, such as scarcity (Amit and Schoemaker, 1993), heterogeneity
(Peteraf,1993),oridiosyncraticassets(Williamson,1979)isthefactordifferentiatinga
firmfromotherstopreventasubstantialnumberofstrategies/actionsimplementedina
similarwayandatthesametime.Inspiredbythedepictionsfromsometheorists(e.g.
Barney, 1991; Peteraf, 1993; Wade and Hulland, 2004), it suggests that the three
abovementionedresourcespossesstheabilitytolimitcompetitionandgainrentsinthe
ex-antestage.
Iftheex-antestageisthewindowofopportunityforseekingprimerentsandefficiency,
the ex-post stage is the time for the firm to protect and sustain those values. Peteraf
(1993)describesthepictureofvalueintheex-antestageasbeingshort-lived,uncertain,
andfleetingduetothepotentialexistenceofimitationandsubstitutionfromotherrivals.
Thereby,regardlessofthediscussionbroughtupthattheresourceswhichpossessthe
featureofvalue,appropriabilityandfirm-specialtyareattheheartofafirm'svalues,they
34
are not sufficient for the sustainability of those values over time. In the long run,
resourcesandcapabilitiesmustbecapableofpreservingvaluesandprotectinga firm
from competitive imitation or resource substitution. In the long run, the profitability,
growth, and survival of a firmdepend on how it establishes "relatively impregnable"
bases. From this, the firm is able to adapt and extend its operations in an uncertain,
changing,andcompetitiveworld(Penrose,1955,p.121,2009). Inorder to limitsuch
competition,thereisanecessityforresourcestobetime-consuming,costly,andbeyond
possibility for other firms who do not possess those resources to comprehend their
nature; capture similar ones or produce equivalent outcomes. Imitability, limited
substitutability,and immobilityare idealattributesproposedtogive thepossibility to
resourcestoaddressthecoreofthematter.ItisdescribedmorepreciselyinTable2.1
whyresources thathold thoseattributeshave thepower topreventother firms from
takingaperfectimitationorsubstitutiontoproducesimilarproductsinsimilarareas.

35
Table2.1StrategicAttributesofResourcesandCapabilities
ResourceAttribute
Definition Terminology Examples
Ex-antestrategictofirms
Value
Aresource/capabilityisperceivedasbeing valuable if it makes thepossibility for a firm to evolve andimplementstrategies inthemannerof efficiency and effectiveness(Barney,1991),
Value(Barney,1991;DierickxandCool,1989).
Organizationalculturecouldbringvaluetofirms. Firms without a nurturing culturegenerally could not achieve their aims inmaximizing their employee productivity(Barney,1986a).
Rarity
A resource/capability comes toknowasbeingrareintheeventthatit is not concurrently implementedby a large number of other firms(Barney,1991).
- Rarity(Barney,1991)- Scarcity (Amit andSchoemaker,1993)
- Idiosyncratic assets(Williamson,1979)
- Heterogeneity (Peteraf,1993)
An ATM network might have significantvaluetoabank.However,sinceitisnotrare,it is unlikely to confer a strategic benefit(WadeandHulland,2004).
Appropriability
The appropriability of aresource/capabilityisverified,giventhatitoffersahighprobabilityforafirm to capture sustained profit. Bycontrast, the resource/capability isunlikelytobeappropriateifitisnotintricately bound to the companyand makes it hard to gain profit(CollisandMontgomery,1995).
Appropriability (Amit andSchoemaker,1993;CollisandMontgomery, 1995; Grant,1991b).
Notallprofitsfromaresourceautomaticallyflow to the company that owns theresources. In fact, the value is alwayssubject to bargaining among a host ofplayers, including customers, distributors,suppliers, and employers (Collis andMontgomery,1995).Humancapitalisafirm’sresource,butnotall the specific skills of employees areappropriate for a firm to gain sustainedcompetitive advantage. Instead, a highly
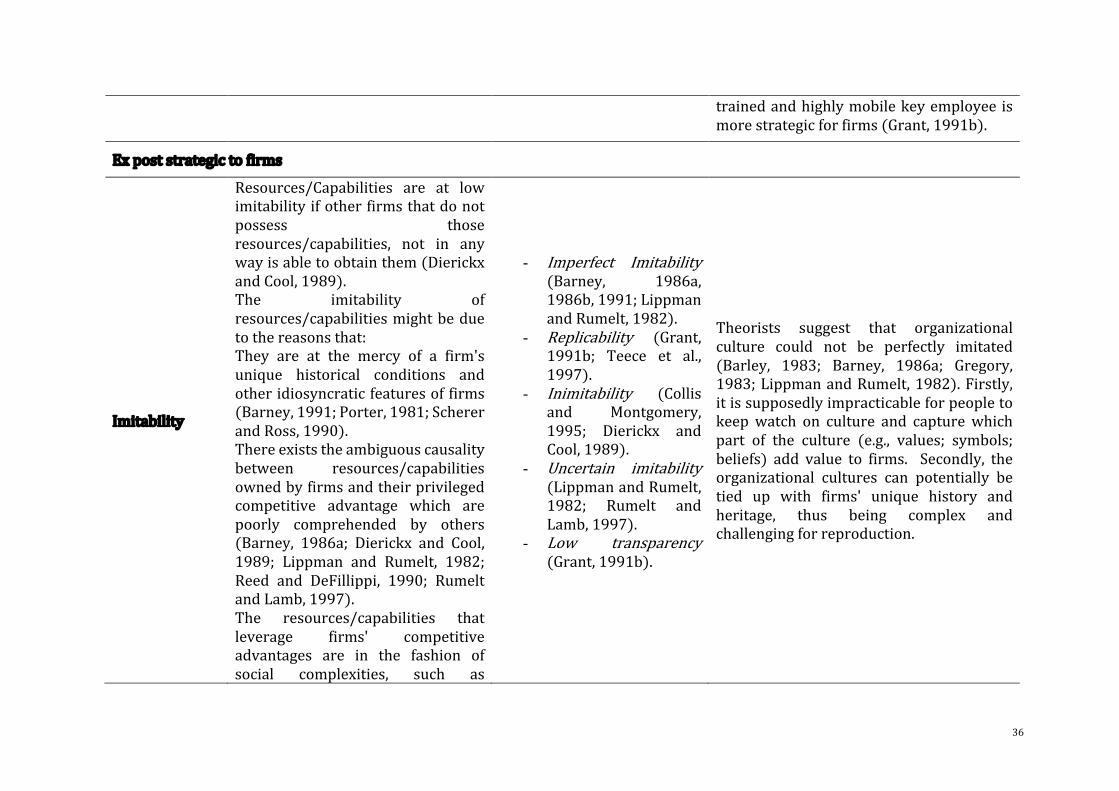
36
trainedandhighlymobilekeyemployee ismorestrategicforfirms(Grant,1991b).
Expoststrategictofirms
Imitability
Resources/Capabilities are at lowimitabilityifotherfirmsthatdonotpossess thoseresources/capabilities, not in anywayisabletoobtainthem(DierickxandCool,1989).The imitability ofresources/capabilitiesmightbeduetothereasonsthat:They are at the mercy of a firm'sunique historical conditions andotheridiosyncraticfeaturesoffirms(Barney,1991;Porter,1981;SchererandRoss,1990).Thereexiststheambiguouscausalitybetween resources/capabilitiesownedbyfirmsandtheirprivilegedcompetitive advantage which arepoorly comprehended by others(Barney, 1986a; Dierickx and Cool,1989; Lippman and Rumelt, 1982;Reed and DeFillippi, 1990; RumeltandLamb,1997).The resources/capabilities thatleverage firms' competitiveadvantages are in the fashion ofsocial complexities, such as
- Imperfect Imitability(Barney, 1986a,1986b,1991;LippmanandRumelt,1982).
- Replicability (Grant,1991b; Teece et al.,1997).
- Inimitability (Collisand Montgomery,1995; Dierickx andCool,1989).
- Uncertain imitability(LippmanandRumelt,1982; Rumelt andLamb,1997).
- Low transparency(Grant,1991b).
Theorists suggest that organizationalculture could not be perfectly imitated(Barley, 1983; Barney, 1986a; Gregory,1983;LippmanandRumelt,1982).Firstly,itissupposedlyimpracticableforpeopletokeepwatch on culture and capture whichpart of the culture (e.g., values; symbols;beliefs) add value to firms. Secondly, theorganizational cultures can potentially betied up with firms' unique history andheritage, thus being complex andchallengingforreproduction.
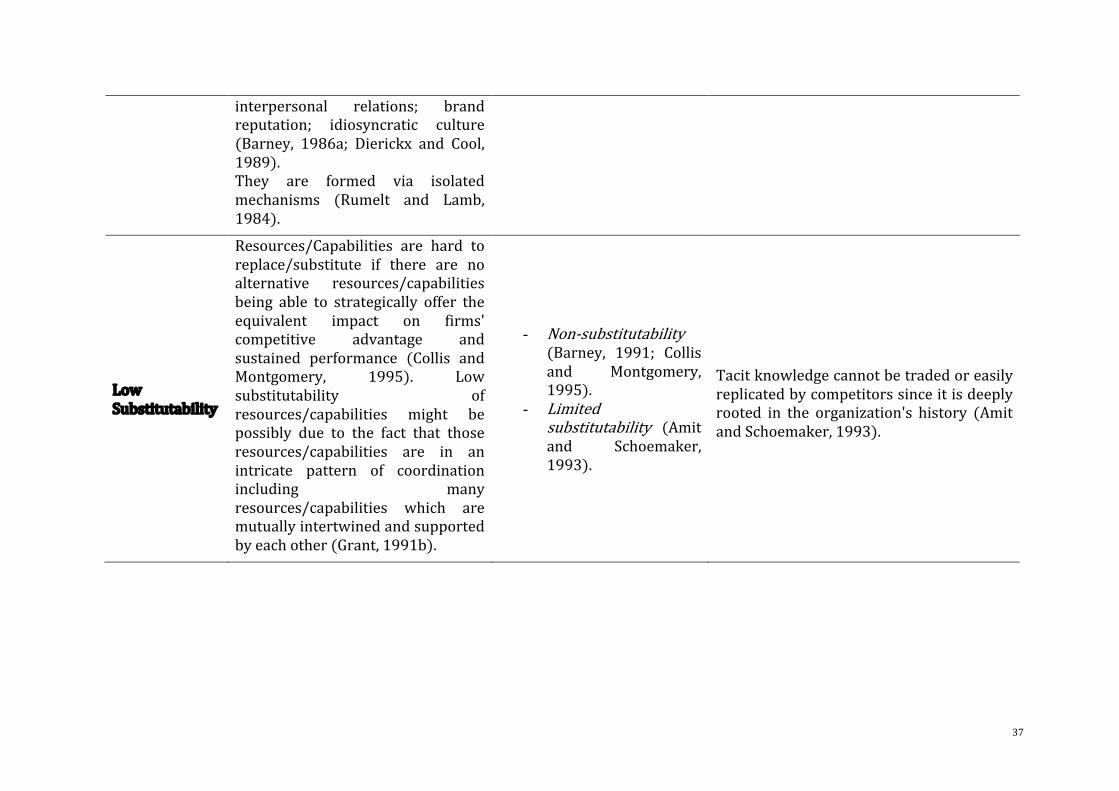
37
interpersonal relations; brandreputation; idiosyncratic culture(Barney, 1986a; Dierickx and Cool,1989).They are formed via isolatedmechanisms (Rumelt and Lamb,1984).
LowSubstitutability
Resources/Capabilities are hard toreplace/substitute if there are noalternative resources/capabilitiesbeing able to strategically offer theequivalent impact on firms'competitive advantage andsustained performance (Collis andMontgomery, 1995). Lowsubstitutability ofresources/capabilities might bepossibly due to the fact that thoseresources/capabilities are in anintricate pattern of coordinationincluding manyresources/capabilities which aremutuallyintertwinedandsupportedbyeachother(Grant,1991b).
- Non-substitutability(Barney, 1991; Collisand Montgomery,1995).
- Limitedsubstitutability (Amitand Schoemaker,1993).
Tacitknowledgecannotbetradedoreasilyreplicatedbycompetitorssinceitisdeeplyrooted in the organization's history (AmitandSchoemaker,1993).
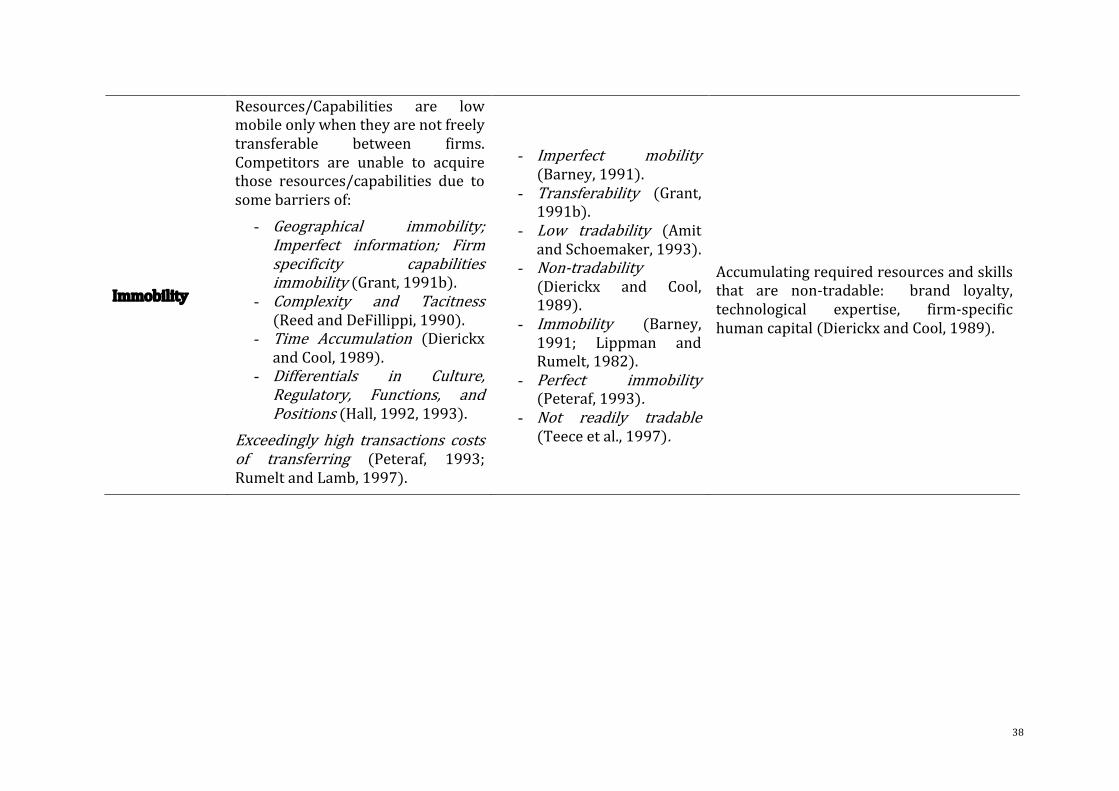
38
Immobility
Resources/Capabilities are lowmobileonlywhentheyarenotfreelytransferable between firms.Competitors are unable to acquirethose resources/capabilities due tosomebarriersof:
- Geographical immobility;Imperfect information; Firmspecificity capabilitiesimmobility(Grant,1991b).
- Complexity and Tacitness(ReedandDeFillippi,1990).
- Time Accumulation (DierickxandCool,1989).
- Differentials in Culture,Regulatory, Functions, andPositions(Hall,1992,1993).
Exceedingly high transactions costsof transferring (Peteraf, 1993;RumeltandLamb,1997).
- Imperfect mobility(Barney,1991).
- Transferability (Grant,1991b).
- Low tradability (AmitandSchoemaker,1993).
- Non-tradability(Dierickx and Cool,1989).
- Immobility (Barney,1991; Lippman andRumelt,1982).
- Perfect immobility(Peteraf,1993).
- Not readily tradable(Teeceetal.,1997).
Accumulatingrequiredresourcesandskillsthat are non-tradable: brand loyalty,technological expertise, firm-specifichumancapital(DierickxandCool,1989).

39
2.1.4 ImplicationsoftheResource-BasedViewforDigitalBankingAdoption.
The importance of resources and capabilities in determining firms' better market
position and superior performance has been discussed earlier in Section 2.1.1. That
sectionhasprovidedanunderstandingofthemechanismstodeploytheseresourcesand
capabilitiesinawayinwhichcompetitiveadvantagescanbestrategicallyobtainedand
sustainedovertime.Therefore,fromatheoreticalperspective,theresource-basedview
is a strong foundation for the investigation into the impact of digital adoptions
contributingtotheperformanceofbanks,withreferenceto its fourmainimplications
following.
Firstly,theresource-basedviewisasuitablemechanismforsolvingthedilemmaof"isdigitaladoptionstrategictobanks?"byfiguringouttherootofafirm’scompetitiveedgeandeconomicrent.Inthecontextofdigitalization,itseemsimpossibleforbankstohold
themonopolypowerindigitaladoptionasitislikelytobeduplicatedorsubstitutedby
agile rivals. In this manner, no matter how valuable this digital adoption is, the
evaluationsthatarereliedonthefinalproduct/servicecouldnotfigureouttherootof
abnormal returns achieved. It is because this digital product/service couldbe similar
among numerous bank providers. Furthermore, even in the case that companies aregainingmonopoly rents frombeing technological firstmovers, nothing can guarantee
thatthosecompetitiveedgescanbepreservedsinceothercompetitorsmaytrytoimitate
or substitutewith other optimal products/services not long afterwards.On the other
hand,an insight into firms'resourcesandcapabilities ispreferableat thepoint that it
endorsesinter-firminnerdifferences,whichshouldbethesourceofcompetitiveposition
and profitability. Put differently, the resource/capability mechanism can argue that
although a digital adoption might be similar among suppliers, the underlying power
insidethefirmiswhatotherrivalsfindimpossibletocomprehendorsubstituteforthe
equivalentoutcomes.Itisalsothekeytosolvingthedoubtconcerningifdigitaladoption
isstrategic,dependinguponthecriticalresourcesandcapabilitiesthisdigitaladoption
endowstothebank.
Secondly,theresource-basedviewallowstheassessmentofthevalueofdigitaladoptions
inacomprehensivemanner.Inwhich,digitaladoptionsareexpectedtoaddmorevalue
tobanks'performancewhichgoesbeyondthevaluedeliveredtocustomers.Indeed,the
resource-based view can validate this assumption. The focus on the potential
resources/capabilitiesthatadigitaladoptionendowsbankscanapproachtheimpactsof
40
digital adoption on any aspect it involves. For instance, the launching of the digital
transactionalwebsitemaynotonlyenhancethebank'scapabilityofservingitscustomers
butalsoenrich itsdigitalknowledgerelevanttocustomertastes, technological trends,
potentialrisk,etcetera.Thisdigitalknowledgebaseafterwardsdramaticallyfacilitates
thebankinstrengtheningitsstrategicpartnershipsbyexchangingwin-winknowledgein
platformsorsupplychainsitisinvolvedin.Itisevidentinsuchacasethatthebenefitsof
digitaltransactionalwebsiteadoptiondonotstopatthecustomervalueonlybutalsoat
otheraspectsandtheentiresystemofthebank.Therefore,theresource-basedviewcould
be awide-ranging approach to evaluate the impact of not only transactionalwebsite
adoptionbutalsootherdigitaladoptionsonbanks’performance.
Thirdly,theresource-basedviewisthebasisforobservingtheroleofdigitaladoptionin
thelongterm.Asmentionedinthefirstpoint,thestrategicattributesofadigitaladoption
dependnotonlyonthevaluecontributedtofirmsintheearlyphasebutalsoontheability
toprotectthevalueovertime.Resource-basedtheoristsemphasizethatthevalueofa
strategyislikelytobeshort-livedandfleetingifthisstrategyhasnocapacitytoprevent
theperfectimitationandsubstitutionofothercompetitorsinthefuture.Incontrast,firms
canput themselves intoasustainablesuccesspathwith inviolabledifferentials if they
implementtheirstrategiesinastrategicanduniqueway(suchasbyeffectivelyexploiting
and leveraging idiosyncratic and inimitable resources, being agile in recognizing and
capturing the value ofmarket transformation). Such inter-firm discrepancies are the
basisforthefirmtopreserveitssustainedcompetitiveedgeandsuperiorperformance
overtime,eveninthescenarioofthehighlycompetitivemarketwhereothercompanies
are also endeavouring to implement the same strategy or find better alternatives to
defeat.
However, it should also be noted that the resource-based view theory tends to not
indicate strategic resources for any particular discipline or any specific strategy of
businesses.Therefore,empiricalresearcherstendtoapplytheconceptoftheresource-
based view to propose a set of strategic resources and capabilities related to specific
disciplines.Inthefieldofdigitalbanking,theresource-basedviewhasbeenappliedbut
almostinIT-relatedinvestmentandgenerale-businesscontext.Forexample,basedon
the ground of resource-based view, Lüneborg and Nielsen (2003) point to internal
knowledge as a strategic resource of IT adoption and prove that IT-related internal
knowledge has a positive impact on Internet adoption as well as customer-related
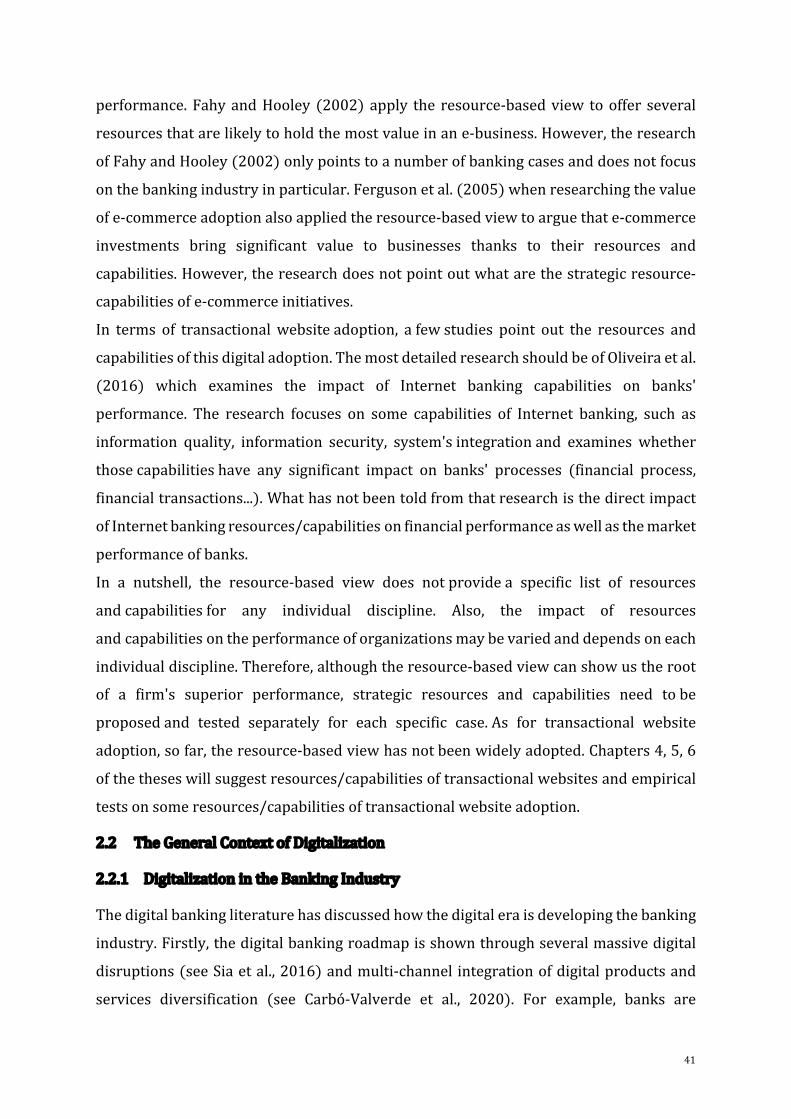
41
performance.FahyandHooley (2002)apply the resource-basedview tooffer several
resourcesthatarelikelytoholdthemostvalueinane-business.However,theresearch
ofFahyandHooley(2002)onlypointstoanumberofbankingcasesanddoesnotfocus
onthebankingindustryinparticular.Fergusonetal.(2005)whenresearchingthevalue
ofe-commerceadoptionalsoappliedtheresource-basedviewtoarguethate-commerce
investments bring significant value to businesses thanks to their resources and
capabilities.However,theresearchdoesnotpointoutwhatarethestrategicresource-
capabilitiesofe-commerceinitiatives.
In terms of transactionalwebsiteadoption, afewstudies point out the resources and
capabilitiesofthisdigitaladoption.ThemostdetailedresearchshouldbeofOliveiraetal.
(2016) which examines the impact of Internet banking capabilities on banks'
performance. The research focuses on some capabilities of Internet banking, such as
information quality, information security, system'sintegrationand examines whether
thosecapabilitieshave any significant impact on banks' processes (financial process,
financialtransactions...).Whathasnotbeentoldfromthatresearchisthedirectimpact
ofInternetbankingresources/capabilitiesonfinancialperformanceaswellasthemarket
performanceofbanks.
In a nutshell, the resource-based view does notprovidea specific list of resources
andcapabilitiesfor any individual discipline. Also, the impact of resources
andcapabilitiesontheperformanceoforganizationsmaybevariedanddependsoneach
individualdiscipline.Therefore,althoughtheresource-basedviewcanshowustheroot
of a firm's superior performance, strategic resources and capabilities need tobe
proposedand tested separately for each specific case.As for transactional website
adoption,sofar,theresource-basedviewhasnotbeenwidelyadopted.Chapters4,5,6
ofthetheseswillsuggestresources/capabilitiesoftransactionalwebsitesandempirical
testsonsomeresources/capabilitiesoftransactionalwebsiteadoption.
2.2 TheGeneralContextofDigitalization
2.2.1 DigitalizationintheBankingIndustry
Thedigitalbankingliteraturehasdiscussedhowthedigitaleraisdevelopingthebanking
industry.Firstly,thedigitalbankingroadmapisshownthroughseveralmassivedigital
disruptions(seeSiaetal.,2016)andmulti-channel integrationofdigitalproductsand
services diversification (see Carbó-Valverde et al., 2020). For example, banks are

42
investingheavilyindigitalbankingtechnologiestomagnifytheiromni-channelbanking
strategy, including the integration of mobile, web or digital platforms. Additionally,
artificial intelligence solutions on the front end are constantly enabled in order to
facilitate customer identification and authentication, supplant live employees through
flexible chatbots and voice assistants, strengthen customer relationships, and offer
personalized insightsandrecommendations.Secondly,nowadayscustomersaremore
consciousofthepotentialcapabilitiesofbanksinofferingthemavarietyoffavourable
andnew-fashionedbankingservices(Carbó-Valverdeetal.,2020).
Recently,TandaandSchena(2019)proposedasystematicapproachtodigitalbanking
strategy.Firstly,throughthesampledataofthirty-twoincumbentbanks,whichincludes
twenty-fourbanksfromEurope,theauthorsreportonsomedigitalbankingstrategies
implementedinreality.FourmainstrategiescategorizedbyTandaandSchena(2019)
include (i) Shareholding-orientated (the acquisitions of FinTech or Tech firms); (ii)Partnership-orientated (the establishment of partnerships for the development oftechnologically advanced products and services); (iii) In-house developer (theinvestment into IT infrastructure) and (iv) Mixed strategy (the combination of thevariousstrategicapproacheslistedabove).Thereportindicatesthatbanksareinclined
toadoptamixedstrategywhenembracingdigitaldevelopments.Secondly,Tandaand
Schena (2019)outline thekeyareasofbanks involved indigital strategies.Theseare
financial intermediation activities (e.g., lending and financing personal financingcorporate banking services, payment); technological, functional or instrumentalactivities(e.g.,Blockchain,dataanalytics,security,andRegTech)aswellasthevarioustypesofdigitalstrategicsolutions(e.g.,artificial intelligence).ThestudyofTandaandSchena (2019) systematically reaffirmed the picture of digitalization in the banking
industry.Tobemorespecific,banksshowatendencyofimplementingamixedstrategy
that favours banks with comprehensive digital transformation. Also, banks are
diversifyingtheirrelationshipswithshareholdersandexternalpartnershipsaswellas
financialactivitiesandtechnologicalinnovations.
2.2.2 OpportunitiesandChallengesinBankingDigitalization
Evidenceinrecentyearssuggeststhattheenthusiasticembraceofdigitalizationbrings
patternsofbenefitstobanks.TandaandSchena(2019)highlighttwotypicalprocesses
of digitalization (digital transformation and digital disruption) that potentially offer
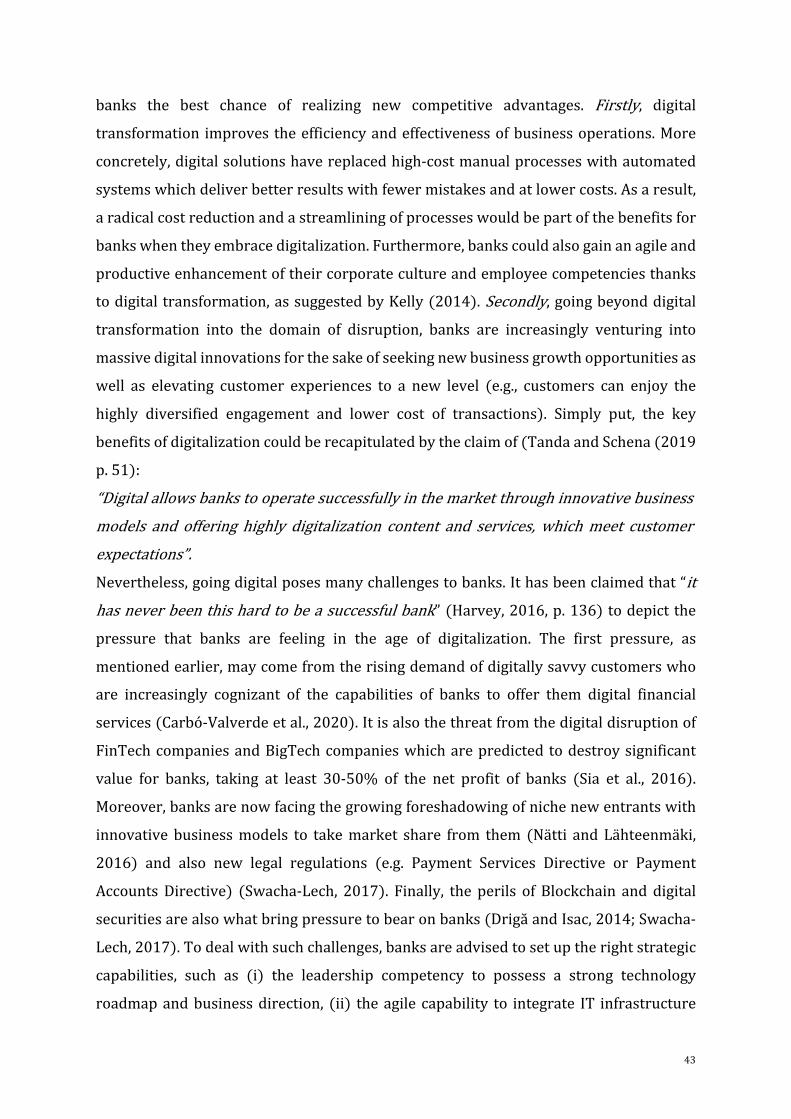
43
banks the best chance of realizing new competitive advantages. Firstly, digitaltransformation improvestheefficiencyandeffectivenessofbusinessoperations.More
concretely,digitalsolutionshavereplacedhigh-costmanualprocesseswithautomated
systemswhichdeliverbetterresultswithfewermistakesandatlowercosts.Asaresult,
aradicalcostreductionandastreamliningofprocesseswouldbepartofthebenefitsfor
bankswhentheyembracedigitalization.Furthermore,bankscouldalsogainanagileand
productiveenhancementoftheircorporatecultureandemployeecompetenciesthanks
todigitaltransformation,assuggestedbyKelly(2014).Secondly,goingbeyonddigitaltransformation into the domain of disruption, banks are increasingly venturing into
massivedigitalinnovationsforthesakeofseekingnewbusinessgrowthopportunitiesas
well as elevating customer experiences to a new level (e.g., customers can enjoy the
highly diversified engagement and lower cost of transactions). Simply put, the key
benefitsofdigitalizationcouldberecapitulatedbytheclaimof(TandaandSchena(2019
p.51):
“Digitalallowsbankstooperatesuccessfullyinthemarketthroughinnovativebusinessmodels and offering highly digitalization content and services,whichmeet customerexpectations”.Nevertheless,goingdigitalposesmanychallengestobanks.Ithasbeenclaimedthat“ithasneverbeenthishardtobeasuccessfulbank”(Harvey,2016,p.136)todepictthepressure that banks are feeling in the age of digitalization. The first pressure, as
mentionedearlier,maycomefromtherisingdemandofdigitallysavvycustomerswho
are increasingly cognizant of the capabilities of banks to offer them digital financial
services(Carbó-Valverdeetal.,2020).Itisalsothethreatfromthedigitaldisruptionof
FinTechcompaniesandBigTechcompanieswhicharepredictedtodestroysignificant
value for banks, taking at least 30-50% of the net profit of banks (Sia et al., 2016).
Moreover,banksarenowfacingthegrowingforeshadowingofnichenewentrantswith
innovative businessmodels to takemarket share from them (Nätti andLähteenmäki,
2016) and also new legal regulations (e.g. Payment Services Directive or Payment
AccountsDirective) (Swacha-Lech, 2017). Finally, the perils of Blockchain anddigital
securitiesarealsowhatbringpressuretobearonbanks(DrigăandIsac,2014;Swacha-
Lech,2017).Todealwithsuchchallenges,banksareadvisedtosetuptherightstrategic
capabilities, such as (i) the leadership competency to possess a strong technology
roadmapandbusinessdirection, (ii) theagile capability to integrate IT infrastructure
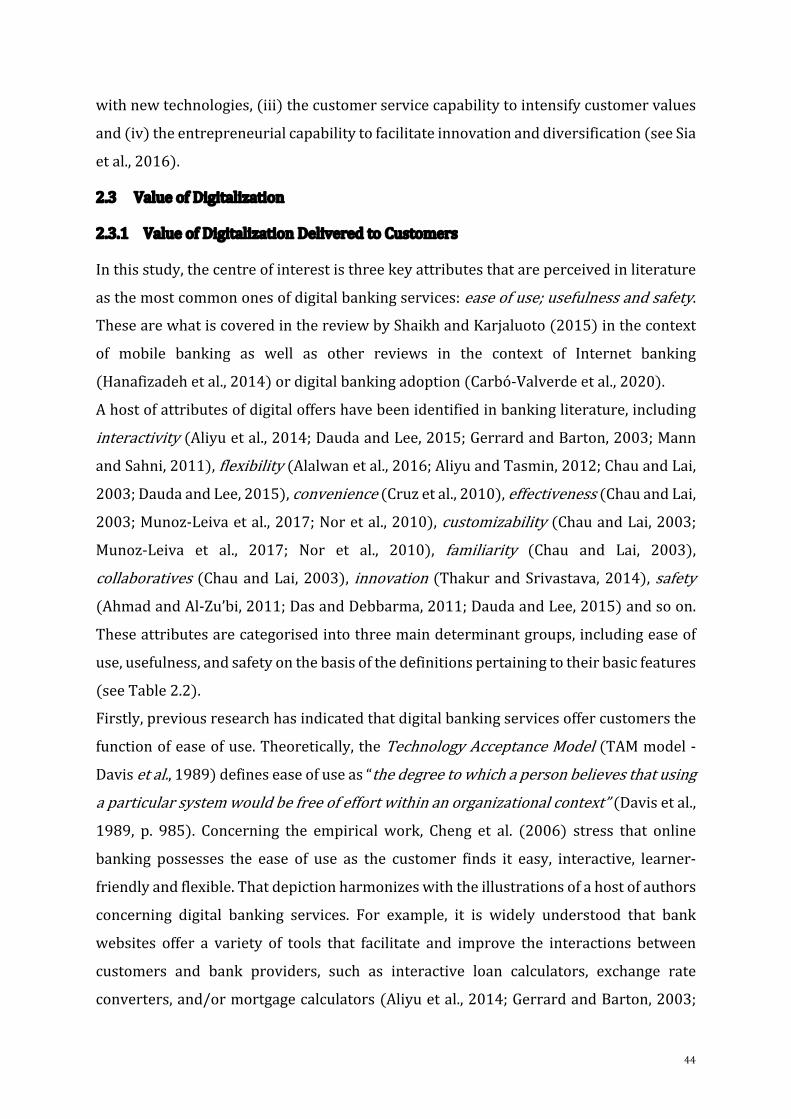
44
withnewtechnologies,(iii)thecustomerservicecapabilitytointensifycustomervalues
and(iv)theentrepreneurialcapabilitytofacilitateinnovationanddiversification(seeSia
etal.,2016).
2.3 ValueofDigitalization
2.3.1 ValueofDigitalizationDeliveredtoCustomers
Inthisstudy,thecentreofinterestisthreekeyattributesthatareperceivedinliterature
asthemostcommononesofdigitalbankingservices:easeofuse;usefulnessandsafety.ThesearewhatiscoveredinthereviewbyShaikhandKarjaluoto(2015)inthecontext
of mobile banking as well as other reviews in the context of Internet banking
(Hanafizadehetal.,2014)ordigitalbankingadoption(Carbó-Valverdeetal.,2020).
Ahostofattributesofdigitaloffershavebeenidentifiedinbankingliterature,including
interactivity(Aliyuetal.,2014;DaudaandLee,2015;GerrardandBarton,2003;MannandSahni,2011),flexibility(Alalwanetal.,2016;AliyuandTasmin,2012;ChauandLai,2003;DaudaandLee,2015),convenience(Cruzetal.,2010),effectiveness(ChauandLai,2003;Munoz-Leivaetal.,2017;Noretal.,2010),customizability(ChauandLai,2003;Munoz-Leiva et al., 2017; Nor et al., 2010), familiarity (Chau and Lai, 2003),collaboratives(ChauandLai,2003), innovation(ThakurandSrivastava,2014), safety(AhmadandAl-Zu’bi,2011;DasandDebbarma,2011;DaudaandLee,2015)andsoon.
Theseattributesarecategorisedintothreemaindeterminantgroups,includingeaseof
use,usefulness,andsafetyonthebasisofthedefinitionspertainingtotheirbasicfeatures
(seeTable2.2).
Firstly,previousresearchhasindicatedthatdigitalbankingservicesoffercustomersthe
functionofeaseofuse.Theoretically,theTechnologyAcceptanceModel(TAMmodel-Davisetal.,1989)defineseaseofuseas“thedegreetowhichapersonbelievesthatusingaparticularsystemwouldbefreeofeffortwithinanorganizationalcontext”(Davisetal.,1989, p. 985). Concerning the empirical work, Cheng et al. (2006) stress that online
banking possesses the ease of use as the customer finds it easy, interactive, learner-
friendlyandflexible.Thatdepictionharmonizeswiththeillustrationsofahostofauthors
concerning digital banking services. For example, it is widely understood that bank
websites offer a variety of tools that facilitate and improve the interactions between
customers and bank providers, such as interactive loan calculators, exchange rate
converters,and/ormortgagecalculators(Aliyuetal.,2014;GerrardandBarton,2003;

45
MannandSahni,2011).Furthermore, it isalsodocumentedthatbanksareimmensely
supported by digital technologies that enable them to serve customers without the
constraints of geographic distance. Nowadays, thanks to the integration of digital
infrastructure andother informationand communication technologies, there is a vast
choice of places for customers toperform their financial transactions via amyriadof
channels,rangingfromphysicalplaceslikebankbranches,domiciles,workplaces,shop
storestotheirowndigitalconnectionsliketransactionalwebsite,mobileanddigitalapps
(Aliyu and Tasmin, 2012). Real-time interaction and virtual communities (e.g. video-
enabledmobilephones,webconferencing,onlinechat,TVbanking,3Dbanking,andvideo
teller) are also distinctive features of digital banking services that alleviate the
complexityofuse(DaudaandLee,2015).
Secondly, it is proven that usefulness is also something that digital banking services
delivertocustomers.Thereisahostofrepresentationsofusefulnessindigitalbanking
which is commonly given by literature, such as effectiveness, convenience,
customizability, familiarity, allegiance to service and innovation. Customization is
definedasthedegreetowhichthefirm’sofferingiscustomizedtomeetheterogeneous
customerneeds(Fornelletal.,1996).Furthermore,customization,basedonacustomer-
orientedperspective,isbelievedtobeoneofthemostimportantvariablesindetermining
customer satisfaction (The American Customer Satisfaction Index (ACSI)).12 It is also
whatFung(2008,p.296)emphasizestodescribetheroleofcustomization:“Enormousindustry faith has been put in customization as a panacea, no matter what sorts ofcustomization are offered, because the individual needs of each consumer can besatisfied”.With reference to the banking context, experts classify the customization function of
bankingserviceasthedegreetowhichthebankunderstandsspecificneedsandisaware
of customers’ best interests (Considine and Cormican, 2016). In fact, this function is
commonlyillustratedviatransactionalwebsitesthataredesignedtoenablecustomers
to personalize content and fit their preferences (Liu et al., 2011). Regarding non-
12TheAmericanCustomerSatisfactionIndex(ACSI)isthenationalcross-industrymeasureofcustomersatisfactionintheintheUnitedStates.TheAmericanCustomerSatisfactionIndexrepresentsasignificantstepforwardintheevolutionofnationalsatisfactionindicators.Formanagersandinvestors,ACSIprovidesanimportantmeasureofthefirm'spastandcurrentperformance,aswellasfuturefinancialhealth.TheACSI provides ameans ofmeasuring one of a firm'smost fundamental revenue-generating assets: itscustomers(Centeretal.,1995;Fornelletal.,1996).
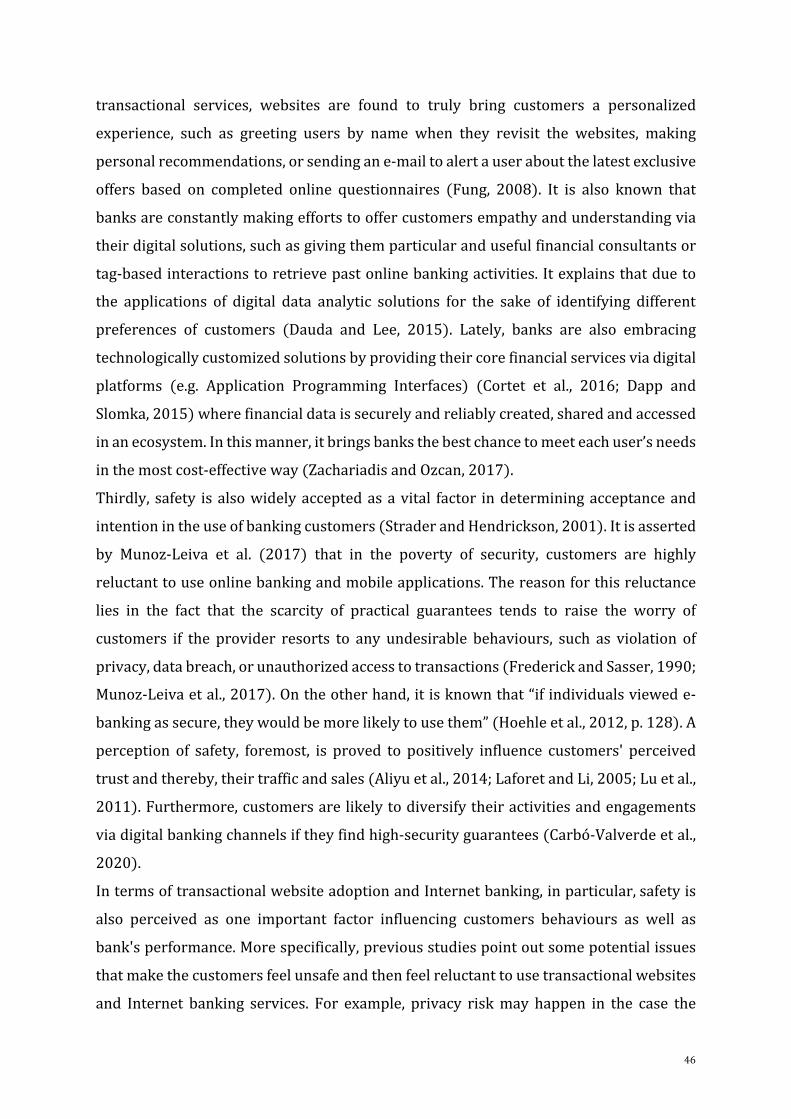
46
transactional services, websites are found to truly bring customers a personalized
experience, such as greeting users by name when they revisit the websites, making
personalrecommendations,orsendingane-mailtoalertauseraboutthelatestexclusive
offers based on completed online questionnaires (Fung, 2008). It is also known that
banksareconstantlymakingeffortstooffercustomersempathyandunderstandingvia
theirdigitalsolutions,suchasgivingthemparticularandusefulfinancialconsultantsor
tag-basedinteractionstoretrievepastonlinebankingactivities.Itexplainsthatdueto
the applications of digital data analytic solutions for the sake of identifying different
preferences of customers (Dauda and Lee, 2015). Lately, banks are also embracing
technologicallycustomizedsolutionsbyprovidingtheircorefinancialservicesviadigital
platforms (e.g. Application Programming Interfaces) (Cortet et al., 2016; Dapp and
Slomka,2015)wherefinancialdataissecurelyandreliablycreated,sharedandaccessed
inanecosystem.Inthismanner,itbringsbanksthebestchancetomeeteachuser’sneeds
inthemostcost-effectiveway(ZachariadisandOzcan,2017).
Thirdly, safety isalsowidelyacceptedasavital factor indeterminingacceptanceand
intentionintheuseofbankingcustomers(StraderandHendrickson,2001).Itisasserted
by Munoz-Leiva et al. (2017) that in the poverty of security, customers are highly
reluctanttouseonlinebankingandmobileapplications.Thereasonforthisreluctance
lies in the fact that the scarcity of practical guarantees tends to raise the worry of
customers if the provider resorts to any undesirable behaviours, such as violation of
privacy,databreach,orunauthorizedaccesstotransactions(FrederickandSasser,1990;
Munoz-Leivaetal.,2017).Ontheotherhand,itisknownthat“ifindividualsviewede-
bankingassecure,theywouldbemorelikelytousethem”(Hoehleetal.,2012,p.128).A
perception of safety, foremost, is proved to positively influence customers' perceived
trustandthereby,theirtrafficandsales(Aliyuetal.,2014;LaforetandLi,2005;Luetal.,
2011).Furthermore,customersarelikelytodiversifytheiractivitiesandengagements
viadigitalbankingchannelsiftheyfindhigh-securityguarantees(Carbó-Valverdeetal.,
2020).
IntermsoftransactionalwebsiteadoptionandInternetbanking,inparticular,safetyis
also perceived as one important factor influencing customers behaviours as well as
bank'sperformance.Morespecifically,previousstudiespointoutsomepotentialissues
thatmakethecustomersfeelunsafeandthenfeelreluctanttousetransactionalwebsites
and Internet banking services. For example, privacy riskmay happen in the case the

47
information provided by customers via their online banking transactionis
misusedordisclosedtoathirdparty(Lee,2009).Thisriskisprovedtohaveanegative
impactoncustomers’attitudesandintentionsinusingInternetbankingservices(Kuisma
etal.,2007;Lee,2009;Royetal.,2017).Socialriskcanalsocomeabout inthecase it
createsapossiblelossofself-imageorstatusduringthepurchaseofspecificproductsor
services(Lee,2009).InthecaseofInternetbanking,KassimandRamayah(2015)point
outthatsomeconsumersareafraidandfeelunsafethatifsomethingwentwrongwith
online transactions, their friends,family,and colleagues would think less of them.
Financialriskreferstothepossibilityofmonetarylossbecauseoftransactionerrorsor
bank account misapplication (Suganthi, 2001). Previous studies indicate that many
consumersarereluctanttouseonlinebankingsincetheyfearfinanciallosses(Kuismaet
al.,2007).Lee(2009)arguesthattraditionalofflineservicewouldbefinanciallysafer.It
is because the traditional banking service provides clerical personnel to verify the
transactionwhileonlinebankingmayprovideartificialtechnology.Thisinnovationatthe
beginningcangeneratefeelingsofinsecurityanduncertainty.
Thesafetyoftransactionalwebsitebankingisalsoaconcernforregulators.Forexample,
the interpretive letter number 928 in of OCC highlighted: “In connection with these
Internet-relatedweb services, theBankwill adviseandadvise theCustomeronhow the
websiteshouldbedesignedandoperatedsothatthewebsitehostedbytheBankandrelated
information is protected confidentiality from unauthorized access while accessing the
Bank'sFacilities,intransittoandfromtheBank,andwhileintheCustomer'spossession.”
(OCC,2001,p.2).Recently,OCCprovidedguidanceontheE-bankingriskandhighlighted
that when offering digital delivery channels, banks should be aware that the risks
associatedwiththird-partyrelationships,cybersecurity,interconnectivity,andelectronic
banking(OCC,2019,p.31).Clearly,overtime,thesafetyofonlinebankingingeneraland
ofthetransactionalwebsiteisalwaystheconcernofregulators.
Ascanbeseen,therearepotentialrisksthatoccurduringtheprocessofInternetbanking
which lead topotential insecurityanduncertaintyofcustomers.Chang(2002)argues
that, as theconsumersare stillcautious about the safety of Internet banking, thefirst
movers do not necessarily earn any early advantage. The study of Chang (2002)
alsofindsno significant advantages for the firstmovers in adopting Internet banking.
Thisisconsistentwithsomeotherstudiesthatclaimthatthequalityofservicesdelivered
viaawebsiteismuchmoreimportantforfirms'successthanlowpricesorbeingthefirst
48
mover in the market (Mahajan et al., 2002; Reibstein, 2002; Shankar et al., 2003).
Therefore, when it comes to the implications, one might counsel stakeholders to
concentrate on promoting a healthy financial and business environment. In which,
financialcybersecurityissuesviaweb-basedpaymentsor/andviaotherdigitalpayment
channelsshouldbeparticularlypaidattentionto.Besides,goodmeasuresandsecurity
protocolsaresomesuggestionsfortheestablishmentofappropriatefinancialsecurity.It
isalsosoanimplicationforfirstmoversinadoptingtransactionalwebsitesor/andother
digital innovations.Besides thebenefits of being apioneer, themanagers should also
consider therisk factors.Whentheadoptionofdigitalbanking isstillquitenew,risk-
reducing strategies and safety guarantees should be considered to enhance customer
intention in use and perceived safety. Following the regulatory guidance is also a
suggestiontoimprovetheconfidenceofregulatorsandotherparties.
Tosummarise,thereisevidenceinthebankingliteraturethatdigitalbankinghasvital
attributesthatcanaddvaluetocustomersandinfluencecustomers'behaviours,through
usefulness,easeofuseandsafety.Theseattributesarereflectedviatheenhancementof
customer experience (e.g., faster and convenient transactions, compatibility amongdigital channels, personalizedonline access to financial information), lower economiccost (e.g., reducedcommuting, checking,andpostageexpenses),high levelof security(mobilewallet,websitefirewalls,encryption,biometrics, integratedIT). It istherefore
fashionabletosaythatalthoughbankshavedigitalizedtheirservicesnowadaystokeep
upwiththedevelopmentofhightechnology,theheartofdigitalbankingstrategyisnot
aboutfrequencyorquantityofcontactswithcustomersnorthelaunchofanewbanking
appornewdigitalsoftware,butitisaboutqualityandpersonalrelevancetocustomers.
Table2.2belowisgoingtogivemoredetailsconcerningsometypicalfunctionsofdigital
adoptionandtheirinfluenceoncustomers’behaviour,documentedbyliterature.
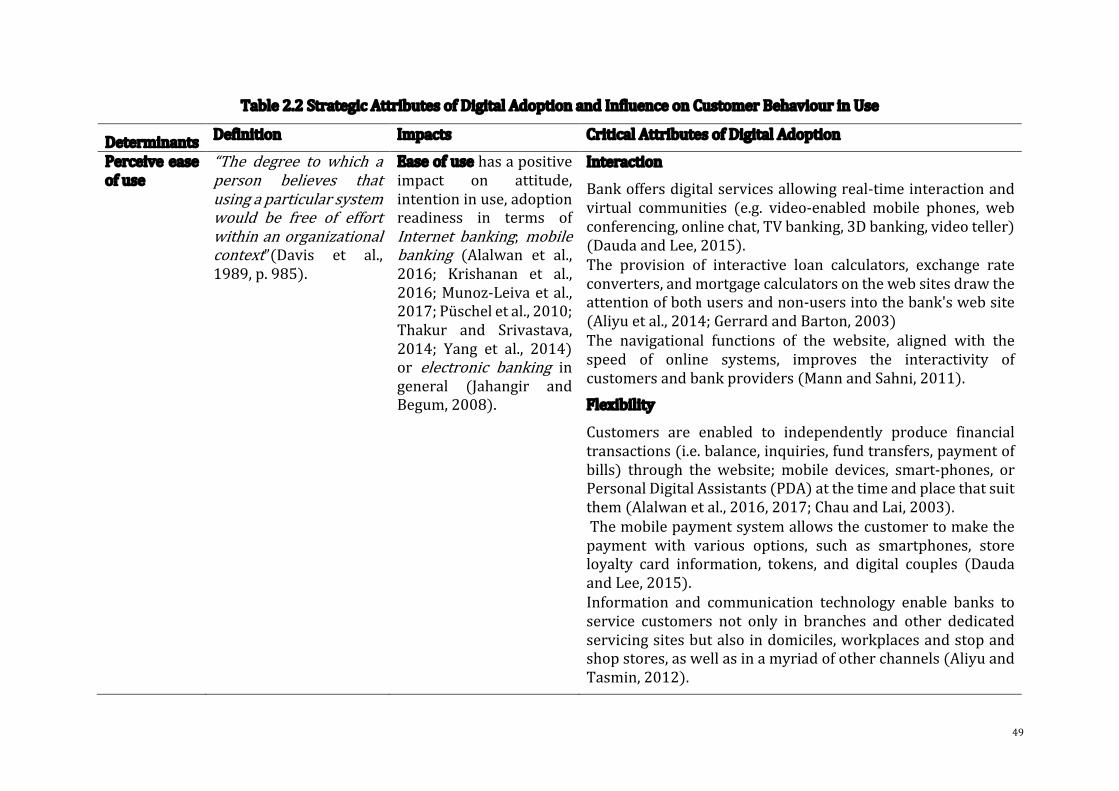
49
Table2.2StrategicAttributesofDigitalAdoptionandInfluenceonCustomerBehaviourinUse
Determinants Definition Impacts CriticalAttributesofDigitalAdoption
Perceiveeaseofuse
“The degree to which aperson believes thatusingaparticularsystemwould be free of effortwithinanorganizationalcontext”(Davis et al.,1989,p.985).
Easeofusehasapositiveimpact on attitude,intentioninuse,adoptionreadiness in terms ofInternet banking; mobilebanking (Alalwan et al.,2016; Krishanan et al.,2016;Munoz-Leivaetal.,2017;Püscheletal.,2010;Thakur and Srivastava,2014; Yang et al., 2014)or electronic banking ingeneral (Jahangir andBegum,2008).
Interaction
• Bankoffersdigitalservicesallowingreal-timeinteractionandvirtual communities (e.g. video-enabled mobile phones, webconferencing,onlinechat,TVbanking,3Dbanking,videoteller)(DaudaandLee,2015).
• The provision of interactive loan calculators, exchange rateconverters,andmortgagecalculatorsonthewebsitesdrawtheattentionofbothusersandnon-usersintothebank'swebsite(Aliyuetal.,2014;GerrardandBarton,2003)
• The navigational functions of the website, aligned with thespeed of online systems, improves the interactivity ofcustomersandbankproviders(MannandSahni,2011).
Flexibility
• Customers are enabled to independently produce financialtransactions(i.e.balance,inquiries,fundtransfers,paymentofbills) through the website; mobile devices, smart-phones, orPersonalDigitalAssistants(PDA)atthetimeandplacethatsuitthem(Alalwanetal.,2016,2017;ChauandLai,2003).
• Themobilepaymentsystemallowsthecustomertomakethepayment with various options, such as smartphones, storeloyalty card information, tokens, and digital couples (DaudaandLee,2015).
• Information and communication technology enable banks toservice customers not only in branches and other dedicatedservicingsitesbutalsoindomiciles,workplacesandstopandshopstores,aswellasinamyriadofotherchannels(AliyuandTasmin,2012).
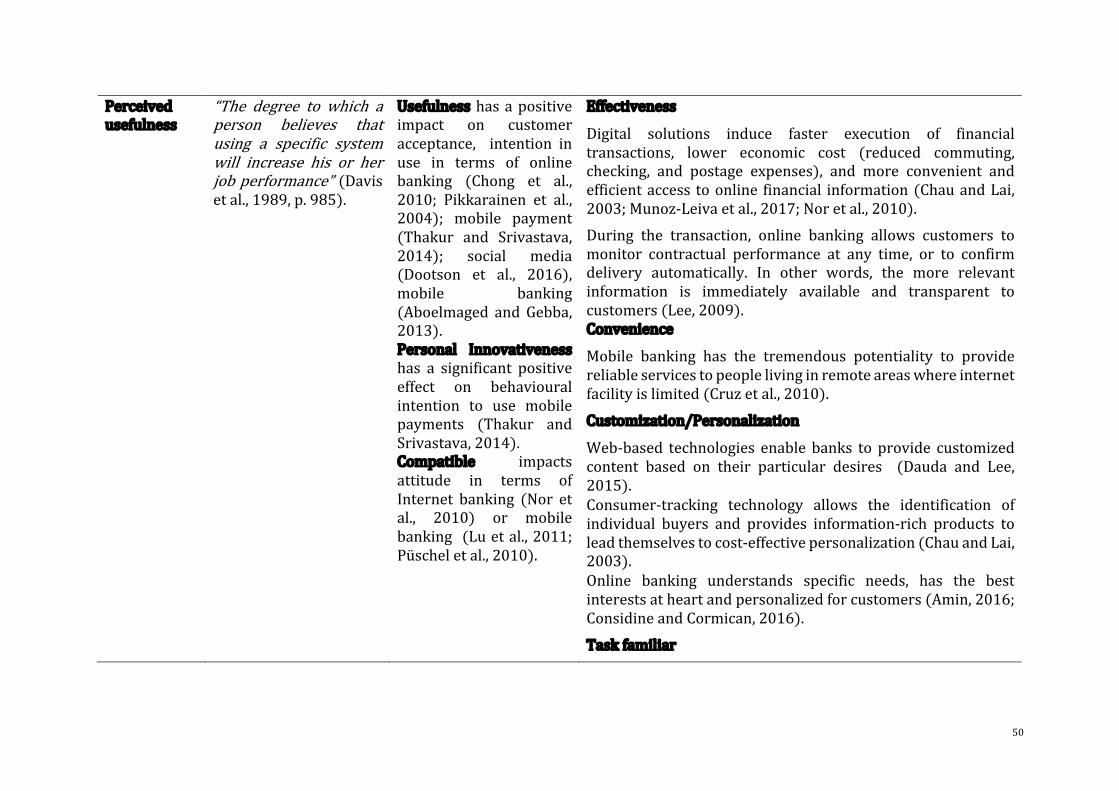
50
Perceivedusefulness
“The degree to which aperson believes thatusing a specific systemwill increase his or herjobperformance”(Davisetal.,1989,p.985).
Usefulnesshasapositiveimpact on customeracceptance, intention inuse in terms of onlinebanking (Chong et al.,2010; Pikkarainen et al.,2004); mobile payment(Thakur and Srivastava,2014); social media(Dootson et al., 2016),mobile banking(Aboelmaged and Gebba,2013).Personal Innovativenesshas a significant positiveeffect on behaviouralintention to use mobilepayments (Thakur andSrivastava,2014).Compatible impactsattitude in terms ofInternet banking (Nor etal., 2010) or mobilebanking (Luetal.,2011;Püscheletal.,2010).
Effectiveness
• Digital solutions induce faster execution of financialtransactions, lower economic cost (reduced commuting,checking, and postage expenses), and more convenient andefficientaccess toonline financial information(ChauandLai,2003;Munoz-Leivaetal.,2017;Noretal.,2010).
During the transaction, online banking allows customers tomonitor contractual performance at any time, or to confirmdelivery automatically. In other words, the more relevantinformation is immediately available and transparent tocustomers(Lee,2009).Convenience
• Mobile banking has the tremendous potentiality to providereliableservicestopeoplelivinginremoteareaswhereinternetfacilityislimited(Cruzetal.,2010).
Customization/Personalization
• Web-based technologies enable banks to provide customizedcontent based on their particular desires (Dauda and Lee,2015).
• Consumer-tracking technology allows the identification ofindividual buyers and provides information-rich products toleadthemselvestocost-effectivepersonalization(ChauandLai,2003).
• Online banking understands specific needs, has the bestinterestsatheartandpersonalizedforcustomers(Amin,2016;ConsidineandCormican,2016).
Taskfamiliar
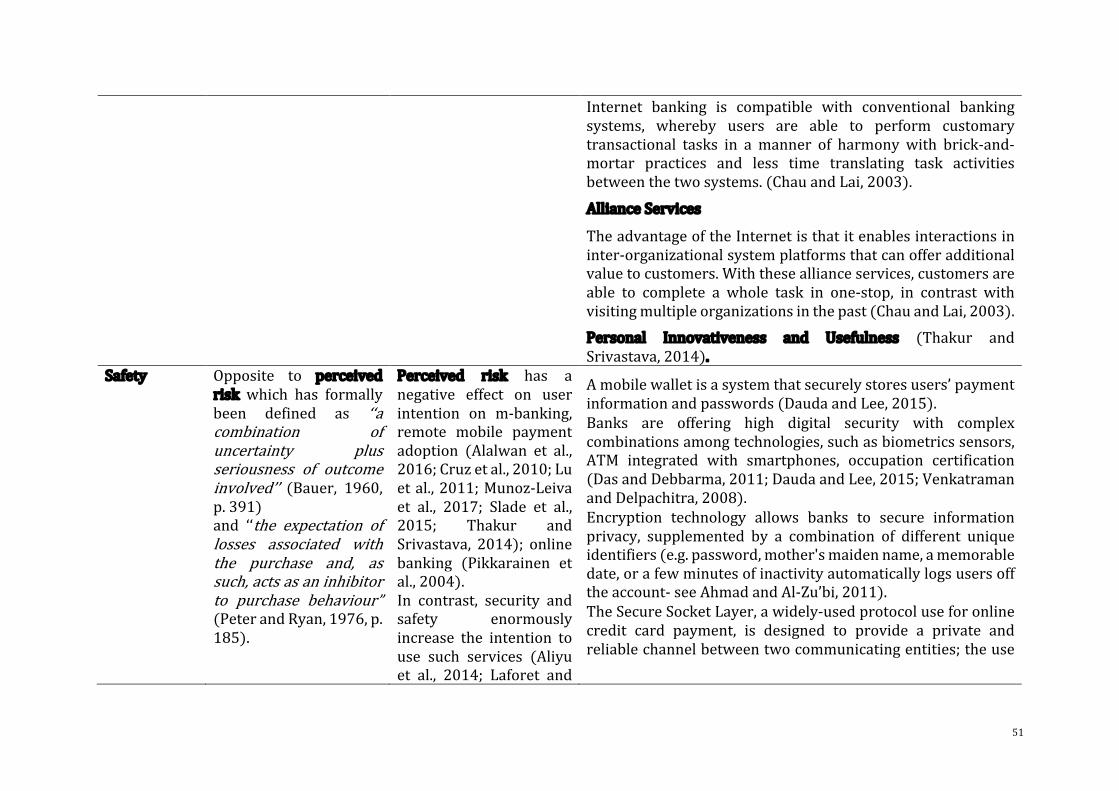
51
• Internet banking is compatible with conventional bankingsystems, whereby users are able to perform customarytransactional tasks in a manner of harmony with brick-and-mortar practices and less time translating task activitiesbetweenthetwosystems.(ChauandLai,2003).
AllianceServices
• TheadvantageoftheInternetisthatitenablesinteractionsininter-organizationalsystemplatformsthatcanofferadditionalvaluetocustomers.Withtheseallianceservices,customersareable to complete a whole task in one-stop, in contrast withvisitingmultipleorganizationsinthepast(ChauandLai,2003).
Personal Innovativeness and Usefulness (Thakur andSrivastava,2014).
Safety Opposite to perceivedrisk which has formallybeen defined as ‘‘acombination ofuncertainty plusseriousness of outcomeinvolved’’ (Bauer, 1960,p.391)and ‘‘the expectation oflosses associated withthe purchase and, assuch,actsasaninhibitorto purchase behaviour”(PeterandRyan,1976,p.185).
Perceived risk has anegative effect on userintention on m-banking,remote mobile paymentadoption (Alalwan et al.,2016;Cruzetal.,2010;Luetal.,2011;Munoz-Leivaet al., 2017; Slade et al.,2015; Thakur andSrivastava, 2014); onlinebanking (Pikkarainen etal.,2004).In contrast, security andsafety enormouslyincrease the intention touse such services (Aliyuet al., 2014; Laforet and
• Amobilewalletisasystemthatsecurelystoresusers’paymentinformationandpasswords(DaudaandLee,2015).
• Banks are offering high digital security with complexcombinationsamongtechnologies,suchasbiometricssensors,ATM integrated with smartphones, occupation certification(DasandDebbarma,2011;DaudaandLee,2015;VenkatramanandDelpachitra,2008).
• Encryption technology allows banks to secure informationprivacy, supplemented by a combination of different uniqueidentifiers(e.g.password,mother'smaidenname,amemorabledate,orafewminutesofinactivityautomaticallylogsusersofftheaccount-seeAhmadandAl-Zu’bi,2011).
• TheSecureSocketLayer,awidely-usedprotocoluseforonlinecredit card payment, is designed to provide a private andreliablechannelbetweentwocommunicatingentities;theuse
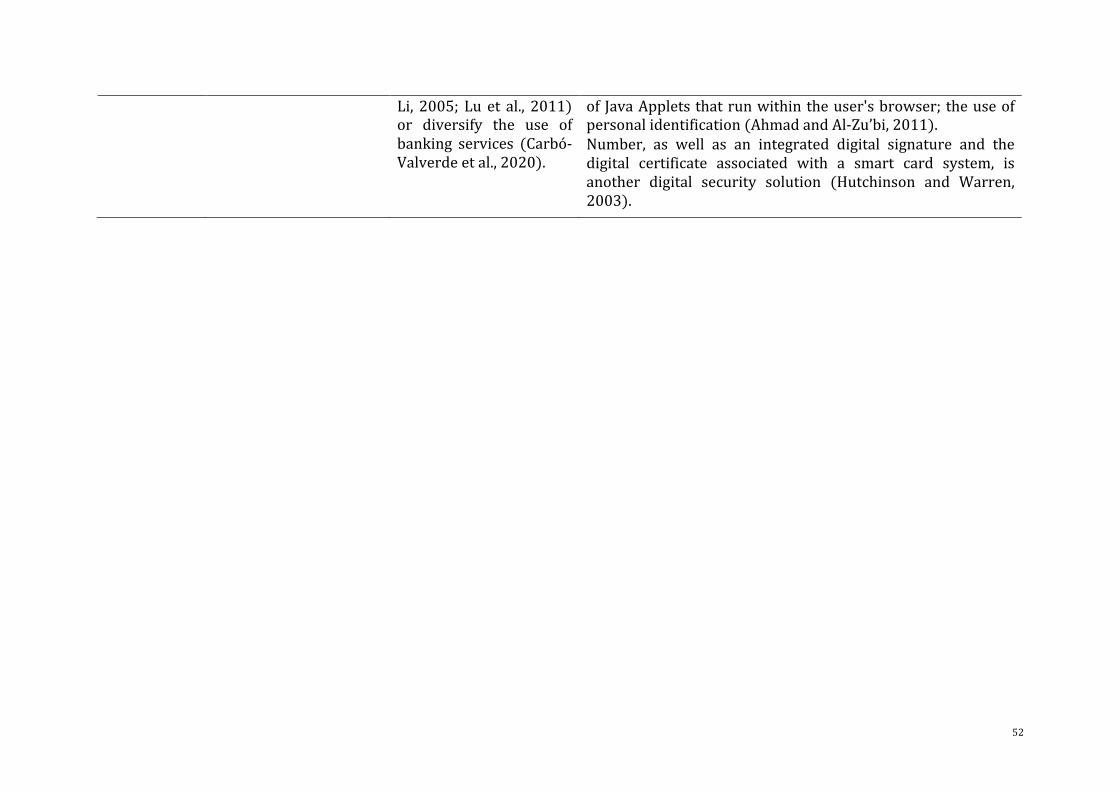
52
Li, 2005; Lu et al., 2011)or diversify the use ofbanking services (Carbó-Valverdeetal.,2020).
of JavaAppletsthatrunwithintheuser'sbrowser; theuseofpersonalidentification(AhmadandAl-Zu’bi,2011).
• Number, as well as an integrated digital signature and thedigital certificate associated with a smart card system, isanother digital security solution (Hutchinson and Warren,2003).

53
2.3.2 ValueofDigitalizationAddedtoBanks’Performance
2.3.2.1 CustomerOutcomesandBanks’Performance
Byraisingcustomervalue, the firm is increasing its tendencytogainhighercustomer
participation, satisfaction, retention, and, thereby achieving better profits and
performance. In fact, a good deal of studies has clearly shown evidence of customer
outcomesafterdigitaladoption.Ingreaterdepth,whenfirmscometodigitalization,ithas
beenfoundthatthereisanincreaseincustomerparticipation(Dabholkar,1996;HittandFrei,2002;Xueetal.,2011); customerretention(CampbellandFrei,2010;Xueetal.,2011);customerexperience(MbamaandEzepue,2018);customersatisfaction(Ahmadand Al-Zu’bi, 2011; Firdous and Farooqi, 2017; Mann and Sahni, 2011); customerefficiency(Xueetal.,2007).Customeroutcomesarewelldocumentedbyboththeprecedingtheoreticalandempirical
studiesasrewardsforfirms.Moreprecisely,customeroutcomesarefoundtoconnect
witheachotherandsubsequentlydeepentherelationshipbetweencustomersandfirms,
therebyinducinganincreaseinprofitandgrowth.Forexample,customerexperienceis
found to induce higher customer satisfaction (Setia et al., 2013), whereas customer
satisfactioniscapableofremarkablyincreasingloyalty(Neilletal.,2007).Bycontrast,
whendissatisfied,customershavetheoptionofexiting(e.g.,goingtoacompetitor)or
voicingtheircomplaintsinanattempttoreceiveretribution.Accordingly,firmsarelikely
toloseopportunitiestomorecompetentrivalsthroughlackofsatisfaction(Johnsonet
al.,1996).Meanwhile,adeeprelationshipbetweencustomersandfirmsresultingfroma
highlevelofsatisfactionisfoundtoinducealowercostofservicing,reducingmarketing
expendituresandincreasedbusinessandgreaterprofits(Heskettetal.,1994;Reichheld
and Sasser, 1990). Simply put, customer outcome is one of the most fundamental
revenue-generatingassetsoffirms(Johnsonetal.,1996).Itisalsoverifiedinthecontext
ofbankingliteraturethatcustomeroutcomesandbankperformancehaveasignificant
relationship(Fathollahzadehetal.,2011;Hallowell,1996;Keisidouetal.,2013).
ThestudyofAl-HawariandWard(2006)examinestheconnectionbetweenthecustomer
and the performance of banks in the realm of automated services (including ATM,
telephonebankingandInternetbanking).Uniqueattributesofautomatedservicesare
given, such as the availability of website content, ease of use, the accuracy of online
transactions, the speed of delivery and security. Such attributes are shown to make

54
contributionstothequalityofbankingservices, therebyelevatingcustomervalueand
inspiring a high level of customer satisfaction. Subsequently, customer satisfaction is
found to play a mediating role that critically influences the financial performance of
banks.Putbriefly,thefindingofAl-HawariandWard(2006)isthatautomatedbanking
services have a significant impact on banks' performance, and one vital mechanism
considerablypromotingthisimpactisattributedtocustomersatisfaction.
In thesamespirit, thecentreof the investigationofMbamaandEzepue(2018) is the
influenceofcustomersonthefinancialperformanceofbanks.Notably,itisputinamore
expandedandcomprehensivecontext:digitalization.Similartoavarietyofotherdigital-relatedstudies,thisstudyrevealstheforemostimplicationattributedtodigitalbanking,
whichistheproductionofsignificantadditionalvaluetocustomers.Inthisfashion,akey
takeaway from this study is that the bank is giving itself an increase in customer
satisfaction and the strengthening of a customer-provider relationship (e.g., word-of-
mouth, retention, loyalty) when going digital. Ultimately, banks' profitability and
financialperformancearefoundtobeimprovedsubstantially.
ThefocalpointofCampbellandFrei(2010);Gensleretal.(2012);HittandFrei(2002);
Xue et al. (2007, 2011) is the relationship between customer efficiency and banks'
performance in the context of digitalization. It is depicted in these studies that
digitalizationstarts thewaveof self-servicewherecustomershave thebest chance to
utilizefewerresourcestoyieldmoreorthesameamountofoutputintheirengagement
with the service process. In general, two notable findings brought to light are (i)
increased customer efficiency and (ii) better firm performance. Firstly, in the age ofdigitalization,customersarefoundtobemoreefficientinexecutingfinancialactivities.
This isexplainedbyvirtueof the integrationamongbankingdeliveringchannels (e.g.
branch, ATM, website, mobile banking) coupled with the customized design of each
channel in order to fit the diversity of user demographics (e.g. age, marriage status,
education, income and so on- see Xue et al., 2007). Gensler et al. (2012) explain the
greatercustomerefficiencyisbecauseonlinechannelsoffer(i)moreusefulinformation
(ii) greater convenience and (iii)more interactive tools. Consequently, an increase in
customerefficiency,whichisinducedbydigitaldevelopments,isdetectedtodrivemore
significantprofittobanks.Forexample,itwasdiscoveredbyXueetal.(2007)thatone
customer with a standard deviation above the mean of efficiency approximately
contributes$4.76ofadditionalprofitpermonth.

55
Table2.3DigitalBankingAdoptionandtheImpactonCustomerOutcomes
Authors Datasample Mainfindings
Hitt and Frei
(2002)
Thedatacollectionincludesinterviewswithmorethan60
individualsinavarietyoffunctionsrelatedtoPCbanking
andadataextractofcustomeraccountrecordsfromeach
ofsevenbanksasofthesecondquarterof1998.
PCbankingcustomersaremorevaluablethanregular
bankingcustomers.PCcustomersusemoreproducts
andmaintainhigherassetandliabilitybalancesthan
regularbankingcustomers.
Al-Hawari and
Ward(2006)
A qualitative study consisting of two stages. Stage one
involved 35 interviewers and stage two involved 600
surveystoarandomsampleofpeoplefromthepublic.
Bankdata:tendifferentbanks,creditunionsandbuilding
societiesinQueensland,Australia.
Each banking channel has unique attributes which
shape customer perception. An enhancement in
automated banking channels, therefore, has a
significantimpactoncustomerperception,eventually
leadingtocustomersatisfactionandretention.
Xue et al.
(2007)
The data includes a random sample of about 25.000
households extracted from the database of one of the
largestretailbanksintheUnitedStates.Thosecustomers
arerequiredtohavemonthlytransactionrecordsforeach
monthfromJuly2002toJune2003
Bankswithmulti-digitalchannelsincreasecustomer
efficiency and higher customer efficiency and are
associatedwithgreaterprofitability.
Campbell and
Frei(2010)
The primary data for this study consist of a random
sampleof100.000customerswhoenrolled inanonline
bankingchannelduring2006intheUnitedStates.
There is a substantial increase in total transaction
volumeinonlinebanking.Onlinebanking,therefore,
is associated with higher customer retention rates
overone-year,two-year,andthree-yearhorizons.
Ahmad and Al-
Zu’bi(2011)
Apurposivesamplingtechniquewasemployedtorecruit
179 customers representing the desired range of
demographic characteristics (e.g., gender, age, and
computer use), previous internet experience levels and
product-relatedknowledgewithinJordanianCommercial
Banks.
Adoption of e-banking (with accessibility,
convenience,security,privacy,content,design,speed,
fees)hadapositiveeffecton JordanianCommercial
Bank customers' satisfaction, loyalty, and positive
wordofmouth.
MannandSahni
(2011)
ThreehundredandfiftyactiveusersofInternetBanking
usingitsproductsandservices.Thesurveywasconducted
inthreecitiesinthestateofPunjabandChandigarh.
Websitedesignfactors(e.g.,navigationstructureand
information content) are essential antecedents to
customer service quality, which further influences
customersatisfactionandtrust.

56
Ninebanksprovidedthecompletelistsoftheircustomers
usingInternetBanking.
Xue et al.
(2011)
Nine thousand three hundred fifty-nine customers
adoptedthebank’sInternetbankingduringthe57-month
study period starting from January 1999 to September
2003.
Internet banking adoption is associated with
increased total transactionactivity, lower likelihood
of customer departure from the bank and greater
productuse.
Gensler et al.
(2012)
Arandomsampleofapproximately87.000privateclients
ofalargeEuropeanretailbankoverathree-monthperiod.
Online use increases customer revenue and lowers
the cost to serve customers due to its strategic
attributes(e.g.,interactive,assessable,useful).
Aliyu et al.
(2014)
Datawerecollectedthroughanonlinequestionnairefrom
several universities on the West Coast of Malaysia.
Respondentswererandomlychosenfromthelistofboth
undergraduateandpostgraduatestudents.
Two constructs, namely convenience and security,
have strong evidence of customer satisfaction via
online banking. They are also the mediators
influencingtherelationshipbetweenonlinebanking
andcustomerservicedelivery.
Firdous and
Farooqi(2017)
An exploratory survey (with the help of a Likert-based
questionnaire)wasconductedtoinvestigatetheimpactof
InternetBankingservicequalityoncustomersatisfaction
inNewDelhi. Datawas collected from a sample of 194
Internetbankingcustomers.
TheInternetbankingservicequalitydimensionshave
a significant impact on the satisfaction of Internet
banking customers. Eachof thedimensions, namely
efficiency, system availability, fulfillment, privacy,
contact, responsiveness, and contact individually
contribute70%totheoverallcustomersatisfactionin
Internetbanking.
Mbama and
Ezepue(2018)
Customers sample: a 49-question online survey of 680
participants, including 50 lecturers and 200 students
fromSheffieldHallamUniversity;180staffmembersfrom
two large UK companies and 250 candidates from
professionalLinkedIn.
Bank sample: six UK banks with public access to their
financialstatusandfinancialreports.
Customer experience is significantly enhanced by
virtue of attributes of digital banking, such as
convenient, functional, useful, trustable, and
interactive. This increase in customer experience,
subsequently,drivecustomersatisfactionandloyalty.

57
2.3.2.2 TheDirectRelationshipbetweenDigitalAdoptionandFinancialPerformanceofBanks
Itistheacknowledgmentofanumberofstudiesthatdigitalserviceadoptionspotentially
improvetheperformanceofbanks,especiallyintermsofprofitabilityandefficiency(Al-
Hawari and Ward, 2006; Ciciretti et al., 2009; Delgado et al., 2007; DeYoung, 2005;
DeYoungetal.,2007;Furstetal.,2002;GohandKauffman,2015;HernandoandNieto,
2007;MbamaandEzepue,2018;Momparleretal.,2013;Pignietal.,2002;Scottetal.,
2017;Sullivan,2000;Xueetal.,2007).Manyexplanationshavebeenproposedand/or
empirically examined,mainly attributed to an increase in customer participation andoutcomes (Al-Hawari andWard, 2006; Campbell and Frei, 2010;Mbama andEzepue,2018;Xueetal.,2007);theadvancementinservicequality(Pignietal.,2002;Scottetal.,2017);aswellastheamplificationinrevenuestreamsthankstonewonlineservicesandmixedproducts/services(Cicirettietal.,2009;DeYoungetal.,2007;HernandoandNieto,2007).
Forexample,itisdiscoveredbyHernandoandNieto(2007)thatbusinessinteractionis
greateramongcustomersandbankswhoofferbankingservicesviabothtraditionaland
Internetchannels,especiallyintermsofLoans,Deposits,Off-BalancesheetsandTrading
Portfolioactivities.Asaresult,theadoptionofanInternetplatformstrengthensbanks’
profitabilityby8.5%intermsofROEand2%intermsofROAafterthreeyearsofthe
initialadoption.Inthesamesense,thebreakdownofInternetbankactivitiesinthestudy
byCiciretti et al. (2009) reveals that the Internetoffersbanksawide rangeofonline
bankingactivitiessuchasTradingandInvestmentActivities,CommercialLoan-To-Asset,
Off-Balance Sheet. By doing so, Internet banks dominate their non-Internet rivals in
earning ROA (0.993% relative to 0.842%) and stock return (14.981% compared to
7.861%).
AnotherexampleisthestudyofScottetal.(2017)whoexaminetheinfluenceofSWIFT
(anetwork-basedtechnologicalinfrastructure)onbanks'profitabilityandrisk.Thestudy
isbasedonalengthwisedatasetconsistingof6.848banksin29countriesinEuropeand
the Americas. Generally, a superior performance achieved by banks attributed to the
SWIFTadoption is themain findingof this study.More concretely, theenablementof
SWIFT is found to significantly support banks in achieving cost efficiency, enhanced
productquality,highcustomervalueandexternalnetworkvalue.Itisalsoworthnoting
58
thattheeffectofSWIFTactivationonfirms’profitisfoundtobelong-lastingandableto
maintainuptotenyearsafterimplementation.
Concerningthecostofdigitaladoption,thisisstillsomewhatambiguous.Conventionally,
cost-effectiveness is perceived as a driver to induce banks to venture into the digital
world.Indeed,someauthorsshowthatbanksreducetheiroverheadcoststhankstotheir
digitaladoption(DeYoung,2001;HernandoandNieto,2007).Inthesamevein,Scottet
al. (2017) also find that after three years, SWIFT adoption benefits banks with cost
reductionsdue toautomationandan increase inefficiency in theproductionprocess.
Nevertheless,itappearsinanecdotalevidencethatdigitalbankingenablementislikely
to lead to higher costs, especially in terms of staff salary andmarketing expenditure
(Cicirettietal.,2009;DeYoung,2001,2005;HernandoandNieto,2007).Forexample,it
isnotedbyCicirettietal.(2009)thattheemployeeexpensesratioforInternetbanksis
highercomparedtothatoftraditionalbanks(1.98comparedto1.73).Thisfindingisin
linewiththestudyofDandapanietal.(2018)intermsofthestandpointthatanyfirm
thatdevelopsawebsite, including financial institutions,mustalso incuran initialcost
(e.g.set-upcost,ITsupport,connectingsupport,dataencryption).Suchambiguityinthe
sortofthecostsideofdigitaladoptionisalsoadmittedbyDeYoungetal.(2007)asthey
claimthatthereisnoacademicstudythathasproventhatInternetadoptionhashelped
institutions in systematically lowering their fixed costs. Indicatively, the adoption of
digitalplatformsispossiblyacostburdenforbanks,especiallyintheearlyphaseofthe
adoption.Althoughoverheadexpenditures arevisually associatedwitha reduction in
physicalbranch construction, the activationof anew innovativeproduct/servicemay
alsoentailahostofothercostlyexpendituresasmentionedabove.
Table2.4belowprovidesthesummaryofpreviousstudieswhichexaminetheimpactof
digital banking adoption on banks’ performance. Please note that, as transactional
websiteadoptionistheunitofanalysisofthisthesis,thetableisdividedintotwopanels.
PanelApresentsthestudiesthatfocusonparticulartransactionalwebsiteadoptionwhile
PanelBdiscusses thestudieswhich focusonotherdigitaladoptions. In this thesis,as
followedbybankingliterature(Dandapanietal.,2018;DeYoungetal.,2007;Eglandet
al.,1998;Furstetal.,2000a;OCC,2000,2019),atransactionalwebsite isdefinedasa
banking website which allows customers to access to information relevant to their
private accounts andbank’spublished information aswell asperform themostbasic
59
transactionsthroughthiswebsite,includingpaybillandtransferfunds.13Morepointedly,
atransactionalwebsiteiscomposedoftwoelements:(i)awebsitethatallowscustomers
toaccessbankinginformationviathatsiteand(ii)awebsitethatenablescustomersto
maketransactionsviaitssites,atleastthemostbasictransactionsrelatedtopaythebill
andcashtransfer.Amorethoroughdefinitionofatransactionalwebsiteisprovidedin
Chapter3inSection3.1.
13PleasenotethatsomepreviousstudiesdefinebankswhoadopttransactionalwebsitesasInternetbanks.Forexample,Sullivan(2000,p.3)definesanInternetbankasabankthatoffersatransactionalWebsite.DeYoungetal.(2007)definetheInternetvariableas1sincethebanksoffertheirtransactionalwebsites.Cicirettietal.(2009,p84)definetheterm“Internet”astheabilityofbankstooffertheirwebsitesasanadditionaldeliverychannelforbankingservicesandtransactions.GohandKauffman(2015,p.8)statethata bank is verified as an Internet bank if its website offers financial services between the bank andcustomers.Forexample,Sullivan(2000).Tobeconsistentwiththetermusedinthethesis,inTable2.4,theterm "bankswho adopt transactionalwebsites" is used rather than “Internet banks” as used by somestudies.
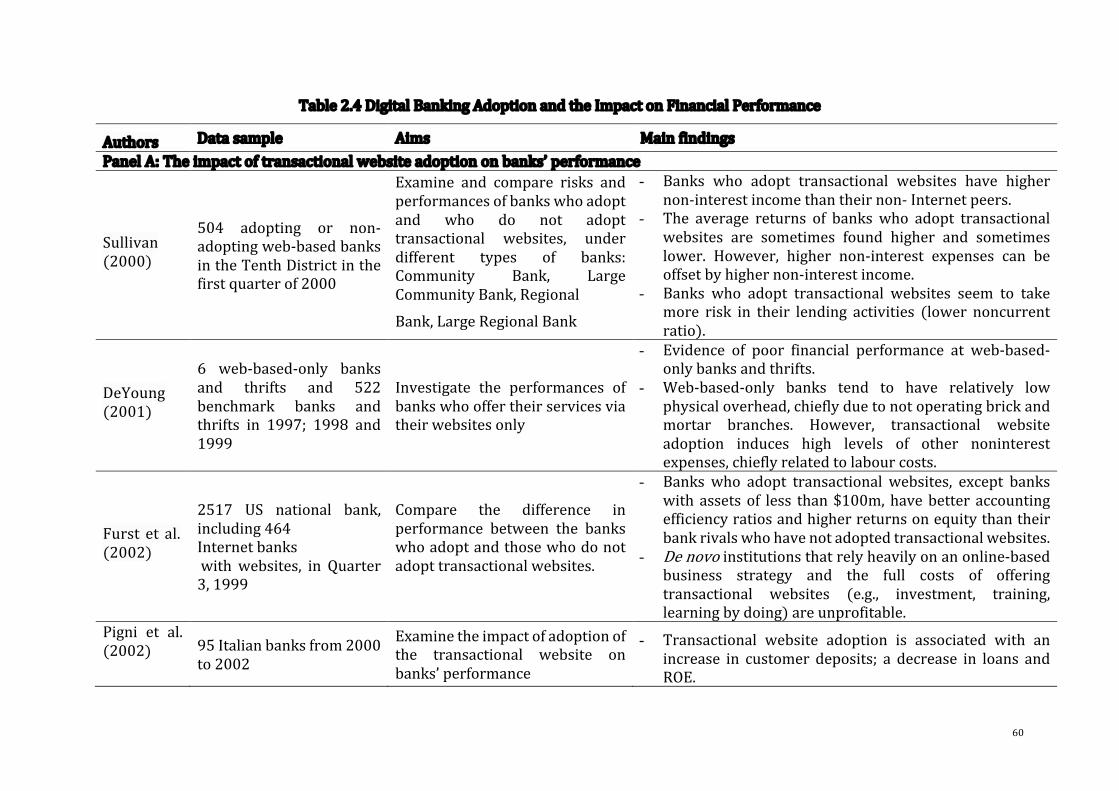
60
Table2.4DigitalBankingAdoptionandtheImpactonFinancialPerformance
Authors Datasample Aims MainfindingsPanelA:Theimpactoftransactionalwebsiteadoptiononbanks’performance
Sullivan(2000)
504 adopting or non-adoptingweb-basedbanksintheTenthDistrictinthefirstquarterof2000
Examine and compare risks andperformancesofbankswhoadoptand who do not adopttransactional websites, underdifferent types of banks:Community Bank, LargeCommunityBank,RegionalBank,LargeRegionalBank
- Banks who adopt transactional websites have highernon-interestincomethantheirnon-Internetpeers.
- The average returns of banks who adopt transactionalwebsites are sometimes found higher and sometimeslower. However, higher non-interest expenses can beoffsetbyhighernon-interestincome.
- Banks who adopt transactional websites seem to takemore risk in their lending activities (lower noncurrentratio).
DeYoung(2001)
6 web-based-only banksand thrifts and 522benchmark banks andthrifts in 1997; 1998 and1999
Investigate the performances ofbankswhooffertheirservicesviatheirwebsitesonly
- Evidence of poor financial performance at web-based-onlybanksandthrifts.
- Web-based-only banks tend to have relatively lowphysicaloverhead,chieflyduetonotoperatingbrickandmortar branches. However, transactional websiteadoption induces high levels of other noninterestexpenses,chieflyrelatedtolabourcosts.
Furst et al.(2002)
2517 US national bank,including464Internetbankswith websites, in Quarter3,1999
Compare the difference inperformance between the bankswhoadoptandthosewhodonotadopttransactionalwebsites.
- Banks who adopt transactional websites, except bankswith assets of less than$100m,havebetter accountingefficiencyratiosandhigherreturnsonequitythantheirbankrivalswhohavenotadoptedtransactionalwebsites.
- Denovoinstitutionsthatrelyheavilyonanonline-basedbusiness strategy and the full costs of offeringtransactional websites (e.g., investment, training,learningbydoing)areunprofitable.
Pigni et al.(2002)
95Italianbanksfrom2000to2002
Examinetheimpactofadoptionofthe transactional website onbanks’performance
- Transactional website adoption is associated with anincrease in customer deposits; a decrease in loans andROE.
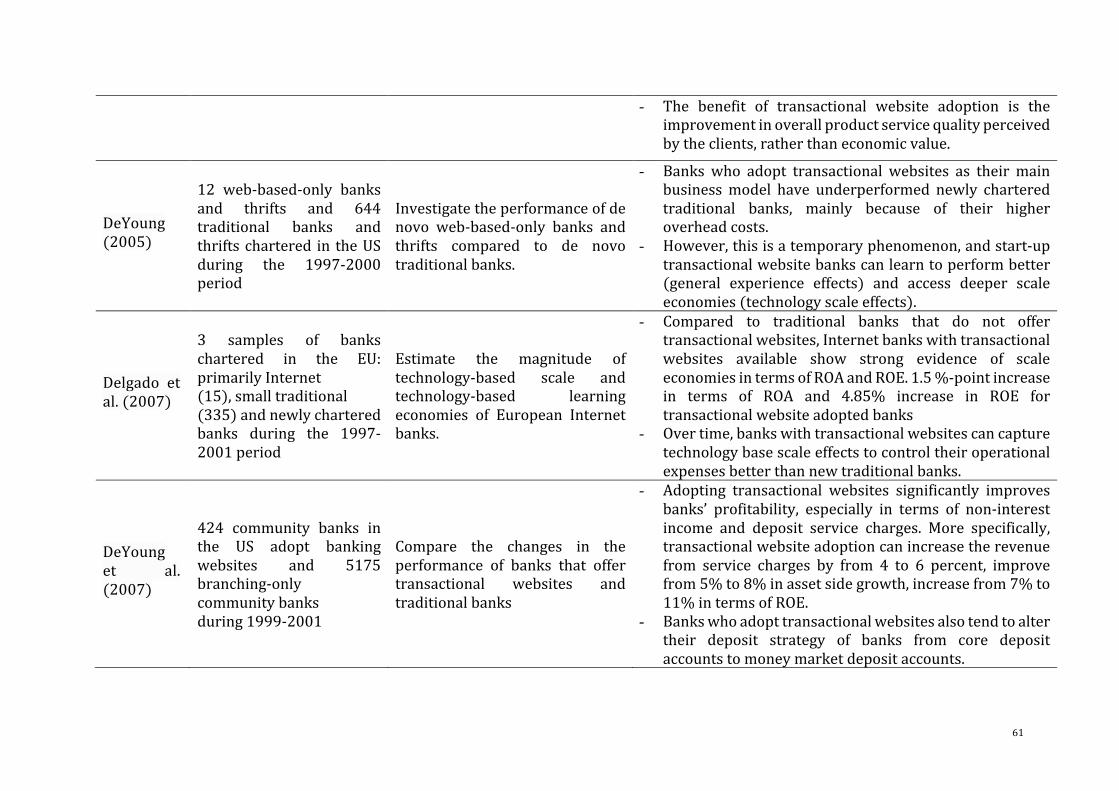
61
- The benefit of transactional website adoption is theimprovementinoverallproductservicequalityperceivedbytheclients,ratherthaneconomicvalue.
DeYoung(2005)
12 web-based-only banksand thrifts and 644traditional banks andthriftschartered in theUSduring the 1997-2000period
Investigatetheperformanceofdenovo web-based-only banks andthrifts compared to de novotraditionalbanks.
- Banks who adopt transactional websites as their mainbusinessmodel have underperformed newly charteredtraditional banks, mainly because of their higheroverheadcosts.
- However,thisisatemporaryphenomenon,andstart-uptransactionalwebsitebankscanlearntoperformbetter(general experience effects) and access deeper scaleeconomies(technologyscaleeffects).
Delgado etal.(2007)
3 samples of bankschartered in the EU:primarilyInternet(15),smalltraditional(335)andnewlycharteredbanks during the 1997-2001period
Estimate the magnitude oftechnology-based scale andtechnology-based learningeconomies of European Internetbanks.
- Compared to traditional banks that do not offertransactionalwebsites,Internetbankswithtransactionalwebsites available show strong evidence of scaleeconomiesintermsofROAandROE.1.5%-pointincreasein terms of ROA and 4.85% increase in ROE fortransactionalwebsiteadoptedbanks
- Overtime,bankswithtransactionalwebsitescancapturetechnologybasescaleeffectstocontroltheiroperationalexpensesbetterthannewtraditionalbanks.
DeYounget al.(2007)
424 community banks inthe US adopt bankingwebsites and 5175branching-onlycommunitybanksduring1999-2001
Compare the changes in theperformance of banks that offertransactional websites andtraditionalbanks
- Adopting transactional websites significantly improvesbanks’ profitability, especially in terms of non-interestincome and deposit service charges. More specifically,transactionalwebsiteadoptioncanincreasetherevenuefrom service charges by from 4 to 6 percent, improvefrom5%to8%inassetsidegrowth,increasefrom7%to11%intermsofROE.
- Bankswhoadopttransactionalwebsitesalsotendtoaltertheir deposit strategy of banks from core depositaccountstomoneymarketdepositaccounts.

62
Hernandoand Nieto(2007)
72 Spanish commercialbanksfrom1994to2002
Examine the impact of thetransactionalwebsiteadoptiononthebanks’performance
- Theadoptionof the transactionalwebsiteasadeliverychannel has apositive impact onbanks’ profitability intermsofROAandROEafteroneandahalfyears,mainlyexplained by the increase in online brokeragecommissionincome.
- Regardingthecostside,theoverheadexpensesdecreaseafter18monthsoftheadoptionoftransactionalwebsites,especially in staff costs. The transactional websiteadoption also increases the IT expense during the firstyear.
- In the short term, the adoption of the transactionalwebsite increasesmarketing expenses and informationtechnologycosts.
Ciciretti etal.(2009)
Apanel data includes 105banks which representover 80% of the bankingassets of the Italianbanking industry duringthe1993-2002period
Examine the impact oftransactionalwebsiteadoptiononthebanks’financialperformance
- Banks who adopt transactional websites outperformbanks who have not adopted transactional websites(0.993%relativeto0.842%intermsofROA).
- Banks who adopt transactional websites are less riskythanbankswhohavenotadoptedtransactionalwebsites(3.45 relative to 4.03 in terms of non-performing loanratios).
- Bankswho adopt transactionalwebsites have a higheremployee expenses ratio than banks who have notadoptedtransactionalwebsites(1.98comparedto1.73).
- Thereisastrongpositiverelationshipbetweenofferingsoftransactionalwebsiteservicesandbankperformance,especially in Loan, Trading and Investment, and Off-balancesheetactivities.
Goh andKauffman(2015)
Banks thatweremembersof the United StatesFederal Deposit Insurance
Examinethebusinessoutcomesofweb-basedinnovationinfinancialservices
- By investing in transactional websites, banks candecreasetheirtransactionalcostby7.3%,increasetheirdepositsby29.3%,increasetheirrevenueby14.5%and

63
Corporation(FDIC)duringthe2003to2005period
increasetheirnetoperatingincomeby18.1%,inrelationtobankswhodidnotinvestintransactionalwebsites.
PanelB:Theimpactofotherdigitalbankingadoptionsonbanks’performance
Al-Hawariand Ward(2006)
Customer data: 35interviewers and600 surveyattendantsBankdata:10differentbanks,credit unions and buildingsocieties in Queensland,Australia
Examine the impact ofautomated service quality(Internetbank,ATM)onbankfinancial performance wherecustomer retention plays theroleasmediatingvariable.
- Customerretentionisthemediatingmechanismthroughwhich automated service quality dimensions have apositiveimpactonthebank’sfinancialperformance.
Campbelland Frei(2010)
A random sample of 100000customers enrolled in theonline banking channelduring2006.Monthlypaneldatasetforthe30-month period fromDecember2004toMay2007
Investigate the outcome ofusing online banking as self-service channels to altercustomerinteractionswiththefirm.
- Thereisanincreaseinthemarketshareofthebanksduetothehigherratesofuseofonlinebanking.
Scott et al.(2017)
Entire SWIFT adoptersworldwide from 1977 to2006including3380banksin29countries
Examine the impact on bankperformanceoftheadoptionofSWIFT, a network-basedtechnologicalinfrastructure
- The adoption of SWIFT as digital innovation has largeeffectsonprofitabilityinthelongterm(upto9years)aswell as exhibits significant network effects onperformance.
MbamaandEzepue(2018)
Customers sample: A 49-questiononlinesurveyof680participants, including 50lecturers and 200 studentsfrom Sheffield HallamUniversity; 180 staffmembers from two large UKcompanies and 250
Examinecustomerperceptionsof digital banking, customerexperience, loyalty, andfinancialperformance.
- Banks can improve their financial performance (ROA,cost-to-income ratio, net interestmargin) by offering agooddigitalbankingexperience.
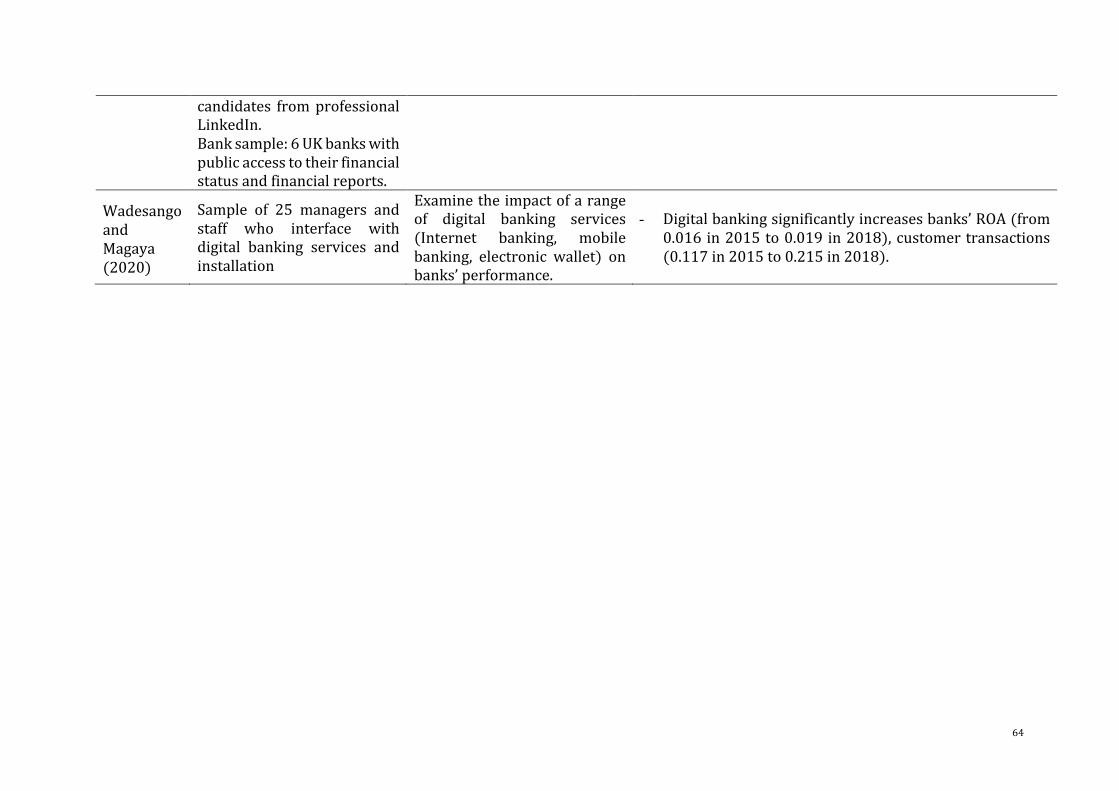
64
candidates fromprofessionalLinkedIn.Banksample:6UKbankswithpublicaccesstotheirfinancialstatusandfinancialreports.
WadesangoandMagaya(2020)
Sample of 25 managers andstaff who interface withdigital banking services andinstallation
Examinetheimpactofarangeof digital banking services(Internet banking, mobilebanking, electronic wallet) onbanks’performance.
- Digitalbankingsignificantlyincreasesbanks’ROA(from0.016in2015to0.019in2018),customertransactions(0.117in2015to0.215in2018).
65
2.4 TheUSbankingevolutionanddigitalizationintheUSbankingindustry
2.4.1 Thederegulationsincethe1990s
Inthe1990s,aseriesofnewlegislativeandregulatoryintroducedhasremarkablyaltered
thebankingenvironment.TheFederalDepositInsuranceCorporationImprovementAct
(FDICIA)of1991wasintroducedtorespondtothecrisisinthe1980s.AccordingtoBarth
et al. (2010), this Act has encouraged banks to be more cautious in measuring and
managingriskexposures.TheRiegle-NealInterstateBankingandBranchingEfficiency
Actof1994eliminatedmanyoftherestrictionsontheacquisitionofinterstatebanksand
permittedthecreationof“interstatebranches”.Itauthorizedthecreationofbankholding
companiesthatcouldacquirebanksanywhere intheUnitedStatesanddiversify their
assets.
In1999, theGramm-Leach-BilleyAct(GLBA)widenedtherangeofactivities inwhich
banksandtheirholdingcompaniescanengage.Barthetal.(2010)claimthattheGLBA
was a capstone to a decades-long process to counter restrictive laws. In fact, GLBA
repealedsignificantpartsoftheGlass-SteagallActwhichseparatescommercialbanking
fromthesecuritiesbusiness,aswellaspartsoftheBankHoldingCompanyActof1956
whichseparatescommercialbankingfromtheinsurancebusiness(Barthetal.,2000).
Thechangesinlawsandregulationsinthe1990sledtoadramaticchangeinthebanking
industry. Most particularly, a wave of M&A occurred right after the Riegle-Neal Act
(Berger,2003;Calzadaetal.,2019;DeYoung,2010;Rhoades,2000;Vives,2016).
DatacollectedfromtheFDIC(seeTable2.5)showsthehighnumberofannualstandard
mergertransactionsstartingin1990(excludingmergerstoresolvefailing/failedbanks).
Ifconsidering1990asastartingpoint,in1994,thenumberoftransactionsincreasedby
38.79%(548 comparedwith392).Thenumberofmergers transactions continued to
holdatarecordhighfrom1994-1998withbetween550-600transactionsperyear.In
thefollowingyears,M&Ahasstartedtocooldown,andbythemiddleofthe2000s,the
number of M&A transactions has dropped to an average of 250-300 transactions
annually.14 It is alsoworth noting that the number ofmerger transactions to resolve
failingbankswasverysmallduringthisperiod.AccordingtothedatafromTable2.5,on
14ThefigureofthissectionisconsistentwiththeclaimofDeYoung(2010)highlightingthattherewereapproximatelymore5000bankmergersinthe1990s,andabove2000bankmergersfrom2000to2006(seeDeYoung,2010,p.11).
66
averageperyearfrom1994-2007,therewerelessthantenmergertransactionsrelated
tofailingbanks.
Thefactthatthestandardmergertransactionskeptatarecordhighwhilethemerger
deals involving failing/failed banks remained at a very low level to some extent
demonstratedaspecificM&AstrategyofUSbanksduringthisperiod.Inwhich,sincethe
US banking system is opened up by the deregulation, banks tend to acquirewell-run
bankstopursuegeographicdiversificationandextendtheiractivities,thenpotentially
putting high competitive pressure on the remaining poor performers (Calzada et al.,
2019;Elfakhanietal.,2003;JonesandCritchfield,2005;StirohandStrahan,2003).This
pointisalsotosomeextentsupportedbythedataofRhoades(2000,p.8)whichshows
thatduringthe1990s,relativelylargebankmergerstookplace(Table2.6).Inwhich,177
large banks with assets greater than $1billion were acquired during this period,
comparedwith71similardealsinthe1980s.Thisnumberincreasedcontinuouslyfrom
1996to1998withfrom25-35largermergeractivitieseachyear.
ThedataofRhoades(2000,p.8)alsoshowsthatthenumberoflargeinter-statemerge
deals increasessignificantlysincethe1990s(Table2.6).Therewerefrom10-15large
inter-state merger transactions each year from 1991-1995 and from 20 to 30 large
interstatemergertransactionshasprocessedannuallyfrom1996-1998.Meanwhile,no
largeinterstatemergeintheearly1980sandonlyfrom5-11largeinterstatemergerdeals
occurred each year from 1984-1989. These figures support the argument of many
authors that the removal of various restrictions on geographic expansion stimulated
merger activity, especially larger mergers across states (Jones and Critchfield, 2005;
StirohandStrahan,2003).
ThisstrongM&Amovementsincethe1990shassignificantlychangedthestructureof
theUSbankingsystem,especiallythenumberofbanks(Calzadaetal.,2019;DeYoung,
2010;JonesandCritchfield,2005;Tregenna,2009;Vives,2016).Indeed,accordingtothe
dataofFIDC(Table2.5),thenumberofbankscontinuouslydecreaseduringthe1990s.
Onaverage,eachyeartheUSindustryhaswitnessedadeclineof400-500banksfrom
1990-1998(Table2.5).Thenumberofbankscontinuedtodecreaseinthefollowingyears
butataslowerrate,from150to300banksperyearfrom1999-2002andfrom100to
150 banks from 2003-2006. Although the number of banks has decreased quite
significantlyduringthisperiod,thenumberoffailedbankswasquitelowduring1994-
2006. Most of each year during 1994-2006, there were less than 15 failed banks,

67
approximately135%decreasecomparedto1990.Especially,in2005and2006,nobank
failureswererecorded.Thus,itcanbeseenthat,inthesameperiod,thenumberofbanks
decreasedsharplybutthenumberoffailedbankswasinsignificant,indicatingthatM&A
isamajorfactorleadingtothedeclineofbankssincethe1990s.
Table2.5USBankingStructurefrom1990-201815
YearFailure:Assistedmerger
Unassistedmerger
Newcharter
Bankfailure
Totalofbanks
Changeinbanks(compared tothelastyear)
1990 151 392 138 382 12347 .1991 101 447 77 271 11927 -4201992 87 429 40 181 11467 -4601993 56 481 47 50 10961 -5061994 12 548 46 15 10453 -5081995 6 608 97 8 9943 -5101996 5 554 139 6 9530 -4131997 1 601 182 1 9144 -3861998 3 560 187 3 8775 -3691999 7 419 228 8 8582 -1932000 6 456 188 7 8315 -2672001 3 359 125 4 8082 -2332002 6 276 90 11 7887 -1952003 2 225 110 3 7767 -1202004 3 263 120 4 7628 -1392005 0 271 167 0 7523 -1052006 0 309 178 0 7397 -1262007 1 293 175 3 7279 -1182008 19 260 90 25 7077 -2022009 114 157 24 140 6829 -2482010 130 183 5 157 6519 -3102011 84 166 0 92 6275 -2442012 39 172 0 51 6072 -2032013 22 203 1 24 5847 -2252014 14 238 0 18 5607 -2402015 8 264 1 8 5340 -2672016 5 223 0 5 5112 -2282017 6 196 5 8 4918 -1942018 0 226 7 0 4717 -201Source:FDIC
15 The structure data of US banks was collected via FDIC platform at the following link:https://banks.data.fdic.gov/explore/historical?displayFields=STNAME%2CTOTAL%2CBRANCHES%2CNew_Char&selectedEndDate=2020&selectedReport=CBS&selectedStartDate=1934&selectedStates=0&sortField=YEAR&sortOrder=desc.
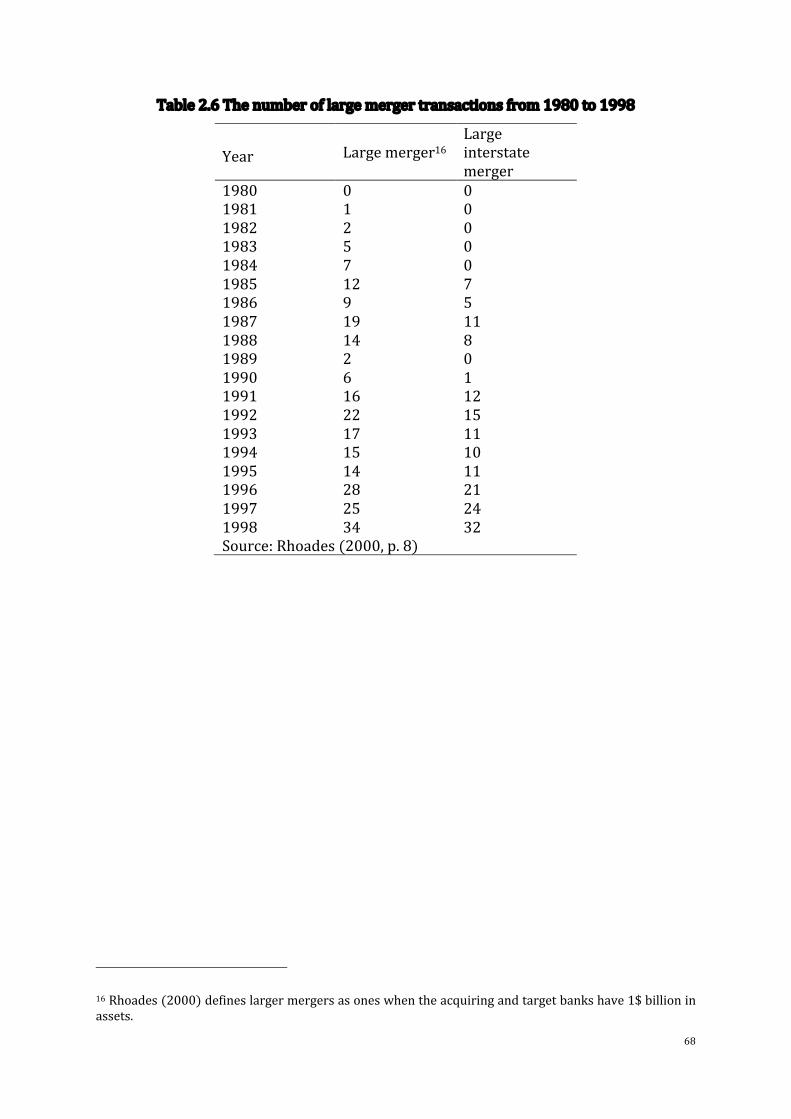
68
Table2.6Thenumberoflargemergertransactionsfrom1980to1998
Year Largemerger16Largeinterstatemerger
1980 0 01981 1 01982 2 01983 5 01984 7 01985 12 71986 9 51987 19 111988 14 81989 2 01990 6 11991 16 121992 22 151993 17 111994 15 101995 14 111996 28 211997 25 241998 34 32Source:Rhoades(2000,p.8)
16Rhoades(2000)defineslargermergersasoneswhentheacquiringandtargetbankshave1$billioninassets.

69
2.4.2 Financialcrisis(2007-2009)
ThefinancialcrisiscausedthenumberofbankfailuresintheUStoskyrocketaftermore
thanadecadeofmodestfailureactivity.AscouldbeseenfromTable2.5,thenumberof
failed banks increased approximately tenfold in 2008 and approximately 50 times in
2009and2010, compared to2007.The crisishas led to a change in thenumberand
natureofM&Aactivitiesofthebankingindustry.Inwhich,therehasbeenashiftinthe
merger form from traditionalM&A to acquisitions of failed or distressed institutions
(Adams,2012).Morespecific, from2008to2010there isasignificant increase inthe
numberoftransactionsthatinvolvedfailedorfailinginstitutions(seeTable2.5).More
pointedly, more than 100mergers involved failed banks each year from 2009-2010,
comparedtobelow10transactionswiththesametypefrom1994-2007.Meanwhile,the
number of standard acquisitions decreased significantly. From 150 to 200 standard
mergerseachyearfrom2009-2010,comparedto250-300standardmergerseachyear
inthe2000sand400-600transactionsinthe1990s(seeTable2.5).Adams(2012)points
outanumberofreasonsforthedecreaseinthenumberofnon-failingmergersduringthe
crisisperiod.Morespecifically,potentialbankacquirerscouldnotreliablyascertainthe
qualityandvalueoftargetbankportfolios.Furthermore,publiclytradedbankstocksfell
duringthisperiod,makingstock-basedtransactionsmoredifficulttocomplete.
2.4.3 Post-crisisreforms(2010-2016)
Since 2010, regulators have implemented a series of mechanisms to prevent further
crisesinthebankingindustry.Mostparticularly,theDodd-FrankAct(2010)waspassed
with the aims to protect consumers, discipline banks, avoid bank bailouts and create
banksthatwere“toobigtofail”.Theliteraturepointsoutsomesignificantimplications
oftheregulationssincepost-crisis.Mostsignificantly,manyauthorsbelievethatthere
wasamarkeddecreaseinthenumberofnewbanksjoiningtheindustry(Calzadaetal.,
2019).AscouldbeseenfromTable2.5,since2011,belowfivenewbanksjoiningtheUS
bankingsystemeachyear.Morespecially,infouryears2011,2012,2014,and2016,there
arenobanks joining.Thismatter is explainedby the implementationofnewbanking
regulationswhichhasincreasedbankingcostsandalsokeeptheindustryprofitabilityat
alowerlevel(Mendenhall,2019;Wilson,2018).
M&Aalsotookplaceinthepost-crisisperiodbutataflatlevel(MCKinsey,2019).Ascould
be seen from Table 2.5, from 150-250 standardmergers each year from 2011-2018.
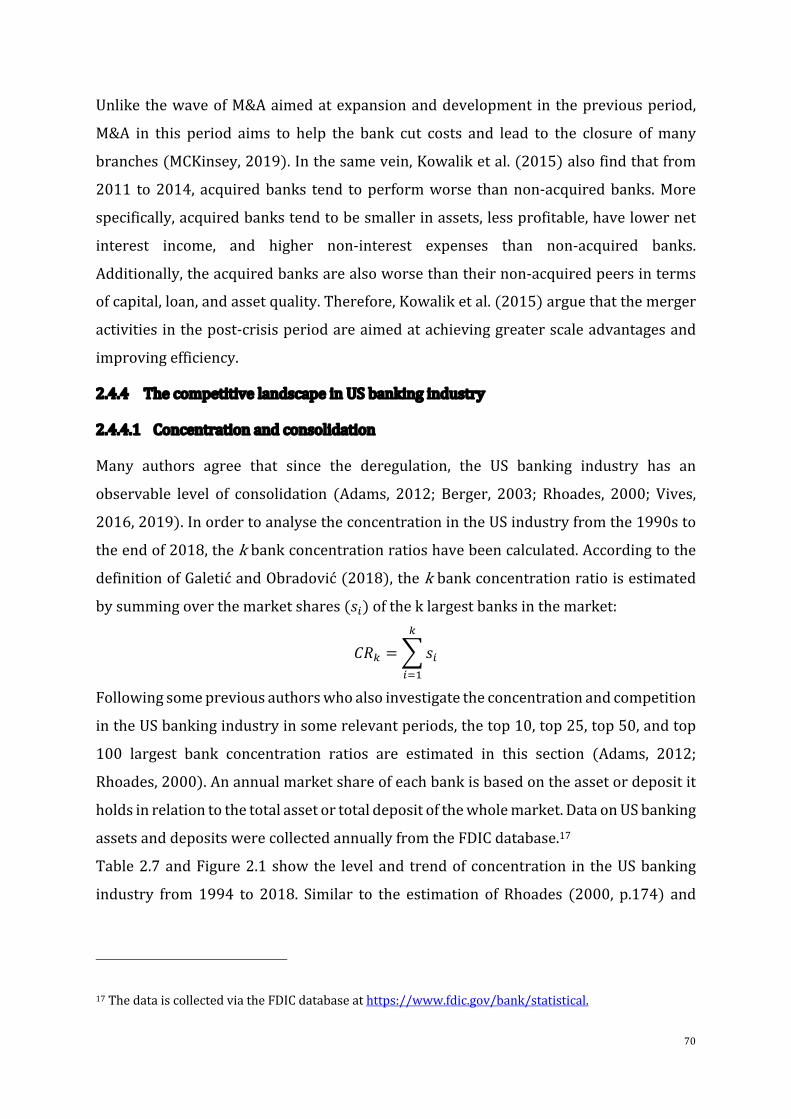
70
Unlike thewaveofM&Aaimedatexpansionanddevelopment in thepreviousperiod,
M&A in this period aims to help the bank cut costs and lead to the closure ofmany
branches(MCKinsey,2019).Inthesamevein,Kowaliketal.(2015)alsofindthatfrom
2011 to2014, acquiredbanks tend toperformworse thannon-acquiredbanks.More
specifically,acquiredbankstendtobesmallerinassets,lessprofitable,havelowernet
interest income, and higher non-interest expenses than non-acquired banks.
Additionally,theacquiredbanksarealsoworsethantheirnon-acquiredpeersinterms
ofcapital,loan,andassetquality.Therefore,Kowaliketal.(2015)arguethatthemerger
activitiesinthepost-crisisperiodareaimedatachievinggreaterscaleadvantagesand
improvingefficiency.
2.4.4 ThecompetitivelandscapeinUSbankingindustry
2.4.4.1 Concentrationandconsolidation
Many authors agree that since the deregulation, the US banking industry has an
observable level of consolidation (Adams, 2012; Berger, 2003; Rhoades, 2000; Vives,
2016,2019).InordertoanalysetheconcentrationintheUSindustryfromthe1990sto
theendof2018,thekbankconcentrationratioshavebeencalculated.AccordingtothedefinitionofGaletićandObradović(2018),thekbankconcentrationratioisestimatedbysummingoverthemarketshares(k!)oftheklargestbanksinthemarket:
lm" =ok!"
!#$
Followingsomepreviousauthorswhoalsoinvestigatetheconcentrationandcompetition
intheUSbankingindustryinsomerelevantperiods,thetop10,top25,top50,andtop
100 largest bank concentration ratios are estimated in this section (Adams, 2012;
Rhoades,2000).Anannualmarketshareofeachbankisbasedontheassetordepositit
holdsinrelationtothetotalassetortotaldepositofthewholemarket.DataonUSbanking
assetsanddepositswerecollectedannuallyfromtheFDICdatabase.17
Table2.7andFigure2.1showthe leveland trendof concentration in theUSbanking
industry from1994 to 2018. Similar to the estimation of Rhoades (2000, p.174) and
17ThedataiscollectedviatheFDICdatabaseathttps://www.fdic.gov/bank/statistical.
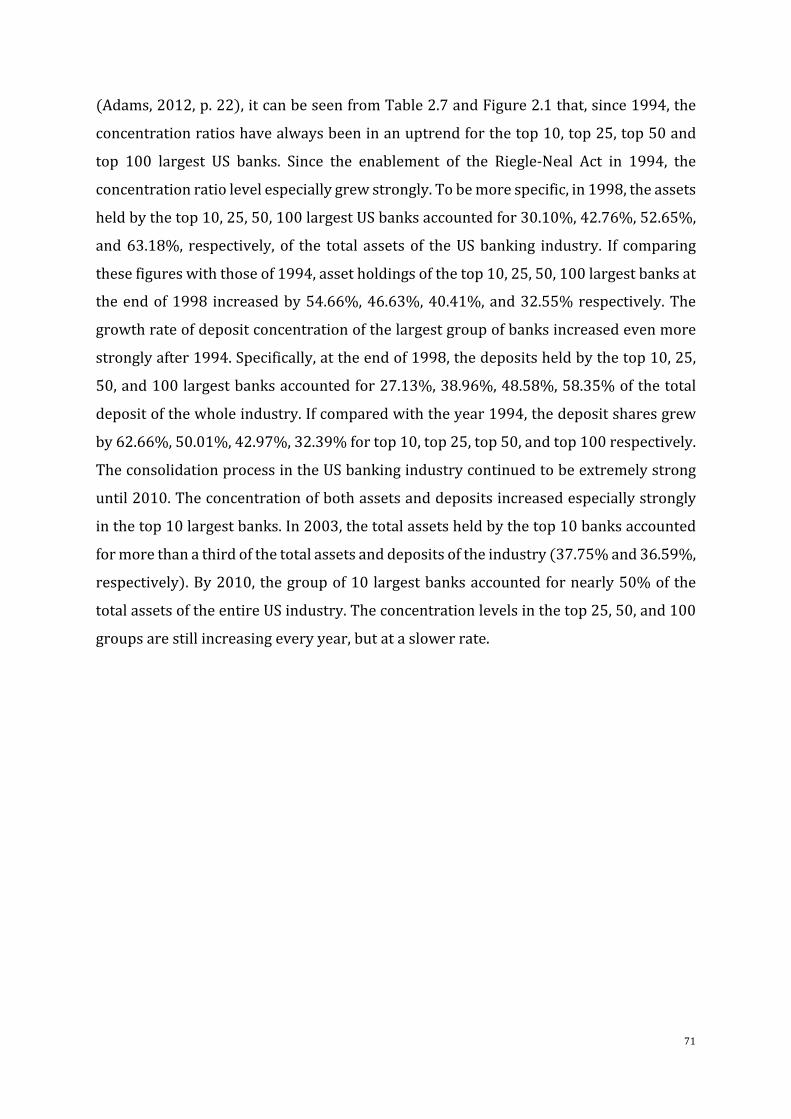
71
(Adams,2012,p.22),itcanbeseenfromTable2.7andFigure2.1that,since1994,the
concentrationratioshavealwaysbeeninanuptrendforthetop10,top25,top50and
top 100 largest US banks. Since the enablement of the Riegle-Neal Act in 1994, the
concentrationratiolevelespeciallygrewstrongly.Tobemorespecific,in1998,theassets
heldbythetop10,25,50,100largestUSbanksaccountedfor30.10%,42.76%,52.65%,
and63.18%, respectively, of the total assetsof theUSbanking industry. If comparing
thesefigureswiththoseof1994,assetholdingsofthetop10,25,50,100largestbanksat
theendof1998 increasedby54.66%,46.63%,40.41%,and32.55%respectively.The
growthrateofdepositconcentrationofthelargestgroupofbanksincreasedevenmore
stronglyafter1994.Specifically,attheendof1998,thedepositsheldbythetop10,25,
50,and100largestbanksaccountedfor27.13%,38.96%,48.58%,58.35%ofthetotal
depositofthewholeindustry.Ifcomparedwiththeyear1994,thedepositsharesgrew
by62.66%,50.01%,42.97%,32.39%fortop10,top25,top50,andtop100respectively.
TheconsolidationprocessintheUSbankingindustrycontinuedtobeextremelystrong
until2010.Theconcentrationofbothassetsanddepositsincreasedespeciallystrongly
inthetop10largestbanks.In2003,thetotalassetsheldbythetop10banksaccounted
formorethanathirdofthetotalassetsanddepositsoftheindustry(37.75%and36.59%,
respectively).By2010,thegroupof10largestbanksaccountedfornearly50%ofthe
totalassetsoftheentireUSindustry.Theconcentrationlevelsinthetop25,50,and100
groupsarestillincreasingeveryyear,butataslowerrate.
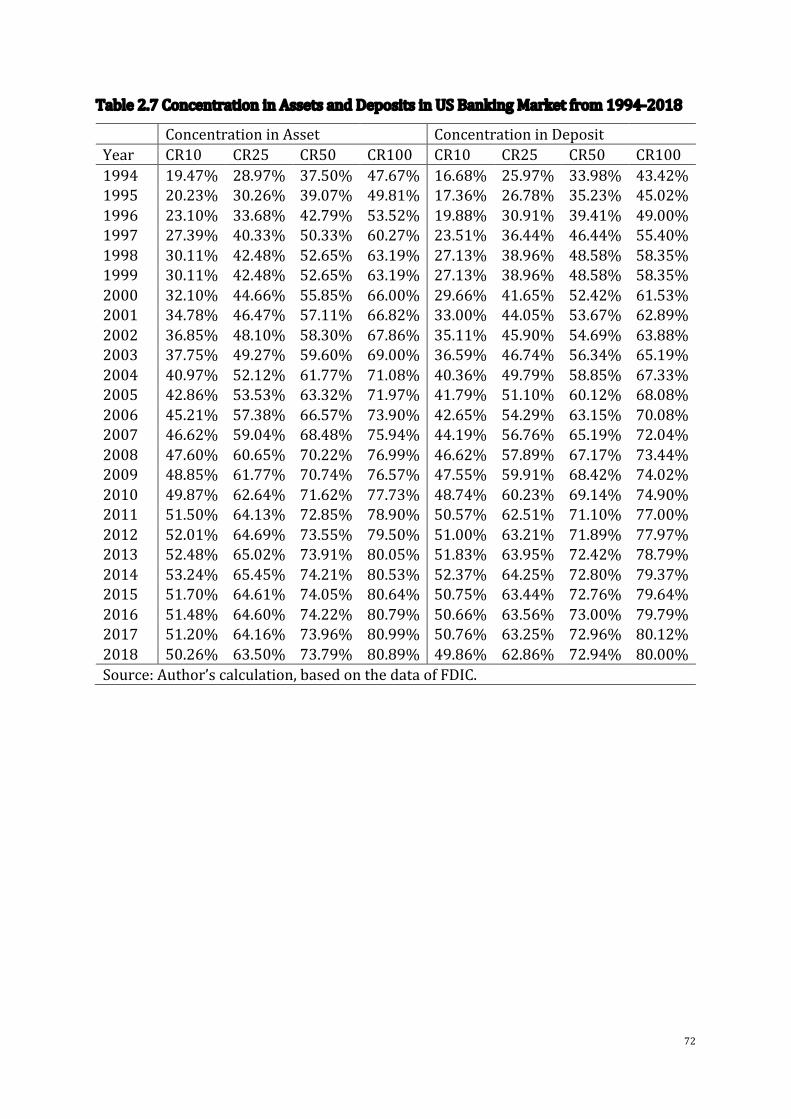
72
Table2.7ConcentrationinAssetsandDepositsinUSBankingMarketfrom1994-2018 ConcentrationinAsset ConcentrationinDeposit Year CR10 CR25 CR50 CR100 CR10 CR25 CR50 CR1001994 19.47% 28.97% 37.50% 47.67% 16.68% 25.97% 33.98% 43.42%1995 20.23% 30.26% 39.07% 49.81% 17.36% 26.78% 35.23% 45.02%1996 23.10% 33.68% 42.79% 53.52% 19.88% 30.91% 39.41% 49.00%1997 27.39% 40.33% 50.33% 60.27% 23.51% 36.44% 46.44% 55.40%1998 30.11% 42.48% 52.65% 63.19% 27.13% 38.96% 48.58% 58.35%1999 30.11% 42.48% 52.65% 63.19% 27.13% 38.96% 48.58% 58.35%2000 32.10% 44.66% 55.85% 66.00% 29.66% 41.65% 52.42% 61.53%2001 34.78% 46.47% 57.11% 66.82% 33.00% 44.05% 53.67% 62.89%2002 36.85% 48.10% 58.30% 67.86% 35.11% 45.90% 54.69% 63.88%2003 37.75% 49.27% 59.60% 69.00% 36.59% 46.74% 56.34% 65.19%2004 40.97% 52.12% 61.77% 71.08% 40.36% 49.79% 58.85% 67.33%2005 42.86% 53.53% 63.32% 71.97% 41.79% 51.10% 60.12% 68.08%2006 45.21% 57.38% 66.57% 73.90% 42.65% 54.29% 63.15% 70.08%2007 46.62% 59.04% 68.48% 75.94% 44.19% 56.76% 65.19% 72.04%2008 47.60% 60.65% 70.22% 76.99% 46.62% 57.89% 67.17% 73.44%2009 48.85% 61.77% 70.74% 76.57% 47.55% 59.91% 68.42% 74.02%2010 49.87% 62.64% 71.62% 77.73% 48.74% 60.23% 69.14% 74.90%2011 51.50% 64.13% 72.85% 78.90% 50.57% 62.51% 71.10% 77.00%2012 52.01% 64.69% 73.55% 79.50% 51.00% 63.21% 71.89% 77.97%2013 52.48% 65.02% 73.91% 80.05% 51.83% 63.95% 72.42% 78.79%2014 53.24% 65.45% 74.21% 80.53% 52.37% 64.25% 72.80% 79.37%2015 51.70% 64.61% 74.05% 80.64% 50.75% 63.44% 72.76% 79.64%2016 51.48% 64.60% 74.22% 80.79% 50.66% 63.56% 73.00% 79.79%2017 51.20% 64.16% 73.96% 80.99% 50.76% 63.25% 72.96% 80.12%2018 50.26% 63.50% 73.79% 80.89% 49.86% 62.86% 72.94% 80.00%Source:Author’scalculation,basedonthedataofFDIC.

73
Figure2.1TrendinConcentrationinAssetsandDepositsinUSBankingSystemfrom1994-2018
Source:Author’scalculation,basedonthedataofFDIC.
0.00%
10.00%
20.00%
30.00%
40.00%
50.00%
60.00%
70.00%
80.00%
90.00%
1994
1995
1996
1997
1998
1999
2000
2001
2002
2003
2004
2005
2006
2007
2008
2009
2010
2011
2012
2013
2014
2015
2016
2017
2018
ConcentrationTrendinAssets,USBankingSystem,1994-2018
CR10 CR25 CR50 CR100
0.00%
10.00%
20.00%
30.00%
40.00%
50.00%
60.00%
70.00%
80.00%
90.00%
1994
1995
1996
1997
1998
1999
2000
2001
2002
2003
2004
2005
2006
2007
2008
2009
2010
2011
2012
2013
2014
2015
2016
2017
2018
ConcentrationTrendinDeposits,USBankingSystem,1994-2018
CR10 CR25 CR50 CR100
74
2.4.4.2 Competitivepressure
Competitive pressure in the US banking industry increases sharply since the
deregulation. Vives (2016) points out that, in the pre-deregulation period (from the
1940sto1970s),competitionamongbankswastremendouslylimitedduetoregulations
ofrates,activitiesaswellasclearseparationamongcommercialbanks, insuranceand
investment banks. Furthermore, restrictions on the activities of saving banks and the
geographical separationwere also factors that limited competition in theUS banking
industry from the 1940s to 1970s. Since the controls on rates, banking investment
activitiesandgeographicalbarriershavebeenlifted(especiallysincetheRiegle-NealAct
of1994hasbeenpassed),thecompetitioninUSbankingindustryhasbeenpromoted.
Theincreasedcompetitioninthepost-deregulationhasrelocatedthemarketshareofthe
US banking industry. The study of Stiroh and Strahan (2003) shows that, after the
deregulation, only banks with above-median ROE gain market share through M&A
activities,while bankswith lowROE losemarket share. Putdifferently, the increased
competitionpost-deregulationhasimposedpressureonweakerbanksandredistributed
market share into better performing banks. This process, therefore, underpinned the
performanceoftheUSbankingindustrypost-deregulation.
Itisalsoworthnotingthat,sincefinancialderegulation,USbankshavealsobeguntoface
competitionfromothernon-traditionalcompetitors.DatafromVives(2019)showsthat
themarketshareheldbydepositoryinstitutionsintheUShasfallensharply,from63%
in1950tolessthan30%between2000and2007.Meanwhile,thereisasignificantrise
in shadowbanks since 2000which steadily gained ground in the traditional banking
sector—and actually surpassed the banking sector for a brief time after the 2000s
(Financial Crisis Inquiry Commission, 2011). Furthermore, in the post-crisis, as
mentioned, theDodd-Frank Act passed includes over 400 post-crisis ruleswhich put
significantpressureontraditionalbanksandtheirregulators(Buchaketal.,2018;Stulz,
2019;Tarullo,2019;Vives,2017).Therigourofpost-crisisregulationsisalsoabarrierto
entryofdenovotraditionalbanks(Calzadaetal.,2019).Atthistime,Fintechcompanies
areseenasnewcompetitorsthatcontinuetothreatenthemarketshareof traditional
banksintheUS(Stulz,2019;Thakor,2020;Vives,2016,2017).Forexample,Buchaket
al.(2018)showthat,intheresidentialmortgagesector,thenumberoffintechlenders
increaseddramaticallyinthe2007-2015period.Ifthemarketshareofshadowbanksin

75
residential mortgage doubled from 2007 to 2015, fintech firms also accounted for
roughlyaquarterofshadowbankloanoriginationsin2015.
2.4.5 TheimportanceofdigitalizationintheUSbankingindustry
Inthecontextofincreasedcompetitivepressures,digitalizationhasbecomeanimportant
and indispensable process in the banking industry to remain competitive and retain
customers (Berger, 2003, p. 149). In fact, in the post-deregulation, US banks are
constantlyseeking innovationsto increasetheircompetitiveadvantageandfulfil their
growthaspiration.Manyauthorsadmitthat,besidesfinancialengineering,information
technologiesarethemostobviousinnovationoftheUSbankingindustrysincethe1990s
(DeYoung,2007;DeYoungetal.,2004;Vives,2019).DeYoung(2007)stressthatsince
the1990s,informationtechnology,withtheadventoftheInternet,hasshapedtheway
banksdelivertheirproductsandservicesaswellasre-structuredthebankingindustry
becauseinformationisthenatureofbanking.TriplettandBosworth(2003)alsostate
thatthebankingindustryisthemostIT-intensiveindustryintheUSasmeasuredbythe
ratioofcomputingequipmentandsoftwaretovalue-added.Inaddition,theimprovement
in computerpower and technology information in this period is given as an effective
support tool for banks in managing customer information and cross-selling financial
services.
Digitalization plays an important role in bank management and communication,
especiallysince1994whenthegeographicalexpansionstartedtoincrease(Berger,2003;
Berger and DeYoung, 2006; DeYoung, 2010). More pointedly, technological progress
(includingInternettransactionalwebsites)wouldhelpbanksmanagesubsidiariesmore
efficiently over time.With the improvements of information technology, banks could
reduceagencycostsinmonitoringandcommunicatingwithstaffatdistantsubsidiaries.
Also, the information via digital platforms tends to be quantifiable and verifiable
thereforeithelpsbankstrackandmanagethewholesystem(Berger,2003).
Furthermore,goingdigitalisalsoofgreatsignificanceforbanksinreachinglong-distant
customers.Asthecustomersdonotneedtobegeographicallyclosetoreceivingservices,
customer experience and performance should be enhanced. Also, digital channels are
greatwaysforbankstointeractwiththeircustomersoverlongdistances.Consequently,
bankscanpromoteconsumer,mortgage,creditcard,andevensomesmallbusinessloans
to borrowers via their digital channels without face-to-face meetings (Petersen and

76
Rajan,2002).Thispointisconsistentwiththefindingsofanumberofrecentempirical
studieswhichfindthatUSbanksareincreasingthedistanceatwhichtheymakesmall
business loans and the interactions between firms and their lenders become more
impersonal(DeYoungetal.,2011;PetersenandRajan,2002).
Embracing digital technologies could facilities banks in achieving cost savings and
efficiencyenhancements,accordingtoanumberofstudies(Berger,2003;Calzadaetal.,
2019; FrameandWhite, 2014).More specifically, thedigital channels canhelpbanks
reducedistance-relateddiseconomies.Berger(2003)claimsthatthecostofproviding
servicesviatheInternetdoesnotvarymuchwithdistance,incomparisontotraditional
cashmanagementandrelationship-basedservices.Otherauthorsalsofindthatovertime,
thenegativeeffectsofdistanceontheefficiencyofbankshavediminished(Bergerand
DeYoung, 2006). Berger (2003) that the gradual reduction of the negative effects of
distance on the efficiency of banks is due to the improvements of technical progress,
includingInternetbanking.Stulz(2019)claimsthat,inordertocompeteinthepost-crisisperiod,traditionalbanks
need to understand their competitive advantages and uniqueness. More specifically,
traditionalbankshave largeestablishedconsumerbasesandabroadersetofproduct
offerings.Inthismanner,digitalizationshouldbeconsideredasamatterofurgencyto
help banks leverage their competitive advantages (Cuesta et al., 2015). Digitalization
helps banks to satisfy the ever-changing demand of customers who are increasingly
knowledgeableabouttheadvancementoftechnologicalanddigitalinnovations(Carbó-
Valverdeetal.,2020).Atthesametime,digitalizationalsofacilitatesbanksinbringing
variousservices/productstocustomersoverthedistancewithfewercosts(Vives,2016,
p.13).

77
3 Chapter3:DataCollectionandDescription
3.1 Sampling
3.1.1 Thedefinitionoftransactionalwebsiteadoption
Transactional website adoption has been defined quite specifically and in detail in
previousstudies.Eglandetal.(1998),whoareonesoftheearlyauthorsinthefieldof
Internetbanking,definedtransactionalInternetbankingasprovidingcustomerswiththe
abilitytoaccesstheiraccountandatminimumtransferfundsbetweenaccounts.In2000,
basedontheOCChandbook,Furstetal.(2000a)gaveabasicdefinitionoftransactional
website adoption in order to differentiate from the pure informational websites.
Accordingly,thetransactionalwebsiteisawebsitethatallowscustomerstomakeonline
transactions. The study extends the definition by showing the transactional activities
offered through the transaction website, including electronic bill presentment and
payment,receivingandpayingbills.SimilartoFurstetal.(2000a),DeYoungetal.(2007)
discussthatatransactionalwebsiteisadoptedwhenit"permitscustomerstoperform
actual banking transactions over the website, for example, moving funds betweenaccounts,payingbills,makinginvestmentallocations,orapplyingforloans".Dandapanietal.,2018(p.244)distinguishtransactionalwebsitesfromtwoothertypesofbanking
websites, which are informative and interactive websites. In which, an informative
websiteonlyprovidessomeinformationofthebank(e.g.,bank’shistory,bank’sproducts
and services, bank’s location, bank ‘s mission and so forth). An interactive website
enablesmembers to access to their personal account and statements. A transactional
websiteisdefinedas“themostextensive”whichallowscustomersto“paytheircreditcards, deposit money, transfer funds, and manage their credit more efficiently” (seeDandapanietal.(2018,p.244)).Recently,thebooklet“LicensingManual:Charters”ofOCC(2019,p.61)hasre-affirmedtheInternetbankingplatforms,whichshould“allowbankcustomerstoaccessinformationandsystemsdirectly,includingthosethatenablefundstransfers”.Ascouldbeseen,themostintuitivecommonalityintheliteratureisthatatransactionalwebsiteiscomposedoftwobasicelements:
1.Informativesiteallowsaccesstobank’sinformation.
2.Transactionalsiteallowsbankingtransactionsonline.
Inthisthesis,basedontheliterature,oneconsistentdefinitionfortransactionalwebsites
isapplied.Itisthesitewhich:
78
-Allowcustomerstoaccessinformationviathatsite.
-Allowscustomerstoperformthemostbasictransactions(includingpaybillsandbank
transfers).
Notably, the functionsof transactionalwebsitescouldbewellextendedandupgraded
acrossyearsthankstothecontinuousimprovementofscienceandtechnology.Someof
themostbasicfunctionsofatransactionalwebsitecanbereferencedviathereportby
OCC (2000). OCC divides the website's transaction activities into three main areas,
including personal products (including interest-bearing activities such as deposits,
savingaccounts,commercial loans,credit loans),personalservices(suchas isbalance
inquiryondepositaccounts,billpayment,billpresentationforretailcustomers,customer
electronicmail),andbusinessactivitiesandservices.ThereportofOCCshowsthatmost
bankshaveprovidedpersonalservices tocustomers through theirwebsitesasof July
2000, especially bill inquiry, bill payment, fund transfers. The report also shows that
banks intend to continue to expand interest-based services for both personal and
businessaccountsvia their transactionalwebsites in later2000andasearlyas2001.
Someadvancedfunctionsofatransactionalwebsiteinthecontextofdigitalizationcould
be the enhancements in the online consultation, settlement, account specialization,
simulationofinvestmentactivities,pensionsavingaccountsandsoforth,assuggestedby
Deloitte(2017).
3.1.2 Themotivationofchoosingthetransactionalwebsite
Firstly,thelaunchofthetransactionalwebsiteisamilestoneinbankingdigitalization.It
isacceptedthattheadoptionoftransactionalwebsitesmarksthefirststeptowardsthe
digitalembracementoffinancialinstitutions,anditinvolvesbothdigitaldisruptionand
digital transformation. The launching of transactional websites fundamentally and
comprehensivelyreshapesthebankinbothin-houseandfront-endoperations.Itisalso
adisruptionthatenablesbankstocapturenewvaluefromdigitalizationsuchascustomer
experience, finance,humanresources,andothercorporatefunctions.Moreover,based
ontheresource-basedview,theestablishmentoftransactionalwebsitesendowsbanks
withagrass-rootsfoundationofongoingdigitalresourcesandcapabilitieswhichhave
the capacity for interconnectedness and synergy. Therefore, in the long-run, the
transactionalwebsiteoffersbankstheabilitytooptimizeotherdigitalstrategies;cohere
79
into further digital transformation and innovation; enhance seamless customer
experienceviaomni-digitalintegrationandstreamlineprocesses.
Secondly,thetransactionalwebsiteisanappropriateandmeaningfulunitofanalysisfor
themarket-basedapproachandtheresearchmethodologyofthisstudy.Moreprecisely,
the transactional website launch has the three features of detection, evaluation, and
predictionfromthemarkettowardstheannouncementfromafirmreleasedtothepublic.
AtthetimeoftheInternetrevolution,transactionalwebsitelauncheswerestillanovel
phenomenoninthebankingindustry,therefore, it isnewsthatmayprovokeamarket
reaction.Oncethemarketbecomesawareofunexpectednewsfromthecompany,it is
likely to immediately evaluate the new value appropriate for the company. The
evaluationtendstodependonthepotentialtogeneratewealthandacompetitiveedgein
boththeshortandlongtermreleasedfromthenews.Asmentionedbefore,thelaunchof
atransactionalwebsitecertainlydeservesinterestandevaluationfromthemarketdue
toitbeingasignalofalucrativeprospect.Furthermore,itisalsoworthnotingthatthere
is a lack of data in terms of digital banking launch announcement dates. In these
circumstances, themanualcollectionof thedata in termsof the transactionalwebsite
launchingdatemakessense forapproachingmarketevaluationaswell as serving the
eventstudymethodology.
The transactional website is one of a host of digital initiatives undertaken by banks.
However, based on the resource-based view and market signalling perspective, it is
arguedthattheassessmentofthetransactionalwebsitestillmakessenseforaddressing
the doubt pertaining to the value of digitalization that is added to the bank. This is
becausethevalueofadigitaladoptionviaitscorestrategicdigital-relatedcompetencies
conferredonbanksandsignalledtothemarket,ratherthanviaitsparticularoperating
functionalities. On the one hand, the focus on the functional featuresmay reflect the
similarity among numerous bank providers, and it is challenging to figure out the
differencesineconomicrentsandcompetitiveedgesamongbanks.Ontheotherhand,an
insightintobanks'digitalresourcesandcapabilitiesispreferableinthatitendorsesinner
differences,whicharethefundamentalsourceofacompetitivepositionandsustained
superiorperformance.Therefore,giventheconstraintsofbankingdigitaladoptiondata,
the transactional website is an ideal representative for observing the value of
digitalizationaddedtothebank.

80
3.2 DataCollection
3.2.1 Constructingthesampleofbanks
ThefirststepinthisprocesswastobuildapreliminarylistofcommercialbanksintheUS
market.AsChapter4and6examinethemarketimpactoftransactionalwebsiteadoption
intheshort-runandlong-run,respectively,thesamplebanksarerequiredtobelistedon
the stock exchange. Therefore, the source to get the sample bank list was the SNL
Financialplatform(SNLFinancialisnowapartofS&PGlobalMarketIntelligence).Using
theSNLplatform,alistofcommercialbanksintheUSthatarelistedonthestockexchange
(asoftheendof2018)wascollected.
TheSNLplatformportalmainlyprovidesbankingfinancialdataratherthanmarketdata
(such as stock prices), the list of banks from SNLwasmergedwith the list of banks
availableontheThompsonReutersDatastream.Afterwards,forservingthecollectionof
otheraccountingdata,banksthatwerecodedwithSNLandThompsonarecheckedand
then the FDIC identification codes were collected. The FDIC platform provides
comprehensivefinancialanddemographicdatabase.Inshort,thesamplebanksinthis
thesisallhavethreeidentificationcodes:SNL,Thompson,andFDIC.
3.2.2 TheTransactionalWebsiteAdoptionDate
3.2.2.1 ObtainingtheURL
Tosetupadatabaserelatedtotransactionalwebsiteadoptioneventsofthesamplelist,
URLofeachsamplebankwascollected.Asdiscussed,thesamplebanksarecodedwith
theSNL,Thompson,andFDIC.URLaddressesaremainlycollectedfromSNLandFDIC.
TheURLsarealsotestedoraddedfromBloomberg,banks'website,andbanks'annual
reports.
3.2.2.2 Thesourceofeventdates
ThedatabaseoftransactionalwebsitelauncheventsiscreatedviatheWaybackMachine.
This is a digital archive maintained by the Internet Archive, via the link
http://web.archive.org.TheWaybackMachineperiodicallycrawlsandstoressnapshots
ofnearlyallexistingwebsites.WhentheusersenteraURLintotheWaybackMachine,
thearchive returns snapshotsatdifferentpoints in time (“vertical surfing”)or follow
linkstootherpagesifthesehavebeenarchived(“horizontalsurfing”).Figure3.1depicts
theuserinterfaceoftheWaybackMachineaftersearchingaURL.
81
Since the 2000s, the Wayback Machine has been widely perceived as a tool for
historiographicalresearch,especiallyininvolvingtheevolutionofwebsites(Chuetal.,
2007;CurtyandZhang,2013;HackettandParmanto,2005;Holzmannetal.,2016;Kraft
et al., 2003), hyperlink structures (Jalal, 2019;Kraft et al., 2003).Among them, some
studiesareparticularlyinterestedinthelifetime(birth,death,andlife)ofthewebsites.
Forexample,CurtyandZhang(2013);Harmanen(2019);Koford(2009)applyInternet
Archivetotrackthelaunchyearofdigitalwebsites.Holzmannetal.(2016)examinethe
evolutionofGermanwebsitesbytrackingtheirtimelifefromthefirstdatetheyappeared
intheWebarchiveuntiltheywerelastseenonline.18De-Aguilera-Moyanoetal.(2019)
trackthequarterlyevolutionoftheYouTubeSpainhomepagefrom2009to2018.Corsini
etal.(2020)alsousetheInternetArchiveandWaybackMachinetotrackthefirstdates
theMarkerprojectslaunched.
Some studies use theWaybackMachine to collect event data. For example, Card and
DellaVigna(2012)collecttheeventdatesrelevanttothepolicychangesoftwojournals
inordertoinvestigatetheimpactofthepoliciesontheresponseofauthors.Byusingthe
WaybackMachine,theauthorstrackthedateswhenpagelimitpolicieswereintroduced
aswellasthedatesthepagelimitpolicieswereremoved.Afterthat,theimpactsofthe
15-monthpre-policy, the3-monthperiodsince thepolicyhasbeen introducedand9-
monthpost-policyareinvestigated(seeCardandDellaVigna,2012,p.8).ViaWayback
Machine,Rakowskietal.(2021)identify86individualdayswhereadocumentedTwitter
outageoccurs.Afterwards,theauthorsusedthoseeventdatestoinvestigatetheimpact
oftheTwitteroutageontheretailinvestorstradingactivities.
Thus,itcanbeseenoverthepasttwodecades,theWaybackMachineviaInternetArchive
has beenwidely used to serve research related to digitized information andwebsite
evolution.Bystoringimportantandvaluableinformationwhichtheorganizationsaddor
leaveontheirwebsites,theWaybackMachineallowsresearcherstoretrievetheexact
dateaspecificactionoccurred(e.g.,Twitteroutages),thetimerangeofapolicysinceit
wasintroducedtillitwasremoved(pagelimitpolicyofajournal),thebirthdate/death
18Tobemorespecific,Holzmannetal.(2016)useInternetArchivetotrackthefirstdateawebsiteappearstoestimatethedomainstatistics(e.g.,foradomainthatappearsfirstint!=04.05.200010:30:45,agei=0spansfromt!to04.05.200110:30:44)-seeHolzmannetal.(2016,p.76).

82
dateofawebsite, thedateawebsitepublishedheadlinenews.This thesis follows the
footstepsofpreviousstudies,usingtheWaybackmachineto:
-CollectthedatewhenthefirstsnapshotofeachURLappeared.19
- Check the archive website at the time the first snapshot appeared to check if the
archivedinformationmatchesthecriteriaabouttransactionalwebsiteadoption.20
3.2.2.3 Collectingtheeventdates
Tocollecttheeventdates,thefollowingstepsweretaken:
Firstly,URLaddressesareindividuallytypedintotheWaybackMachine.Foreachtime
anURLisenteredintheWayback,thesystemreturnsatimelineofwebsitehistorysince
thedateitwasactivatedandthelistofsnapshotsoftheURL.Thefirstsnapshotwastaken
asthedatethewebsitehasbeenactivated.
Secondly,thehistoricalwebsiteatthetimethefirstsnapshotappearedtocheckif the
archivedinformationmatchesthecriteriaabouttransactionalwebsiteadoptionfromthe
Wayback Machine. As discussed in Section 3.1.1, a banking website is defined as a
transactionalwebsiteonceitallowscustomerstoperformthemostbasictransactions
through this website, including cash inquiry and transfer of funds. As such, for each
website URL imported into theWayback, the history page of this website is verified
against its firstsnapshotdate.Theeventdate isconsideredvalidonly if thehistorical
websiteonthesnapshotdateshowsthatthebankofferedtransactionalservices,atleast
fundstransferservices,viaitswebsite.
Toillustrate,theprocesstakentocollectthetransactionalwebsitelaunchofWellsFargo
is discussed. The URL website of this bank is https://www.wellsfargo.com. When
enteringthisaddressintotheWaybacksystem,thesystemwillreturnthefirstsnapshot
dateasDecember26,1996(seeFigure3.1).Byclickingonthissnapshotdate,thesystem
willnavigatetothehistorypageoftheWellsFargowebsiteonDecember26,1996.Ascan
be seen in Figure 3.2, Wells Fargo's homepage shows that they have offered online
banking to their customers at that date. Continuing through to Wells Fargo's online
19Asmentioned,Holzmannetal. (2016)defines the launchofasamplewebsite isat thedate the firstsnapshotappearsonInternetArchive(Waybackmachine).20AuthorsinInternetbankingliteraturenoticethedifferencesbetweenthetransactionalwebsitesandtheinformationalwebsites of banks (Furst et al., 2002). Therefore, I need to check the historical bankingwebsitetomakesureitisatransactionalwebsite.

83
banking(seeFigure3.3),itshowsthatWellsFargobankhasallowedtheircustomersto
transfermoneybetweenaccounts,andevenpaybillstoanyoneintheU.S.Asthewebsite
ofWellFargoonDecember26,1996,matchesthedefinitionofatransactionalwebsite,
December26,1996,isavalideventdate.

84
Figure3.1SnapshotsofWellFargowebsiteonWaybackMachine
Figure3.2HistoricalWellFargowebsitepageviaitsfirstsnapshotonWaybackMachine(Part1)
The first s
napshot
ofWell
Fargo
website
appears
onWayb
ack
Machine
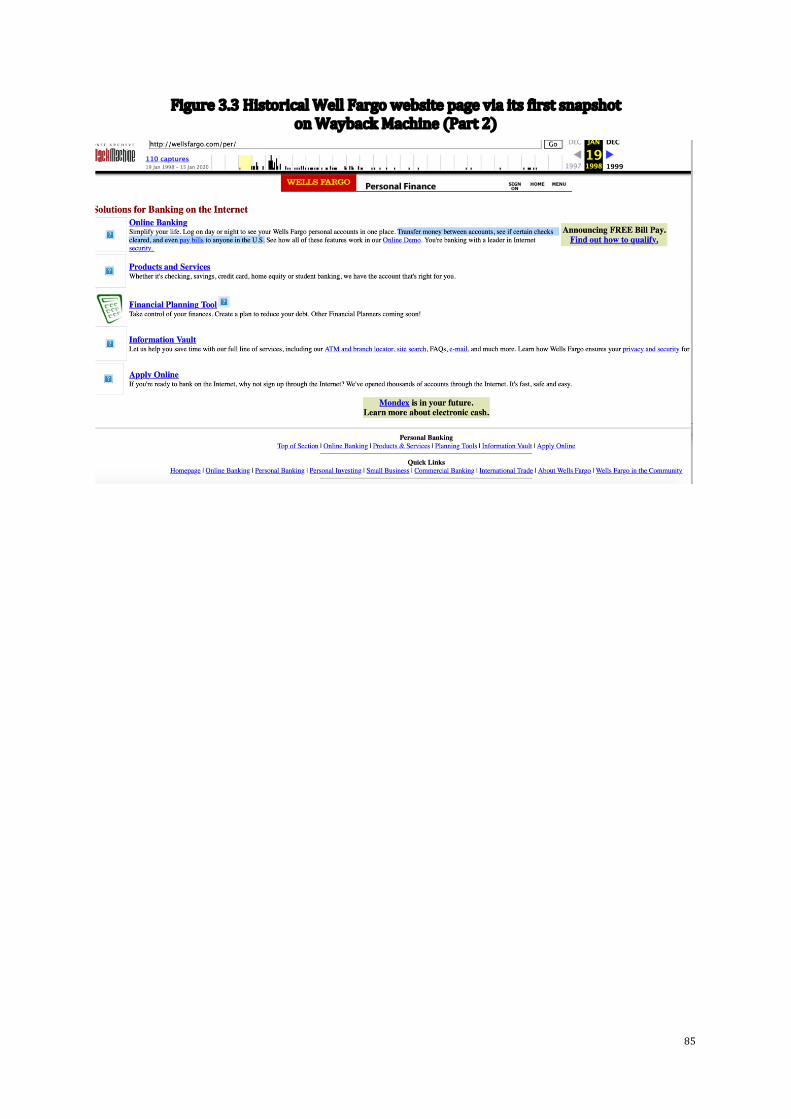
85
Figure3.3HistoricalWellFargowebsitepageviaitsfirstsnapshotonWaybackMachine(Part2)
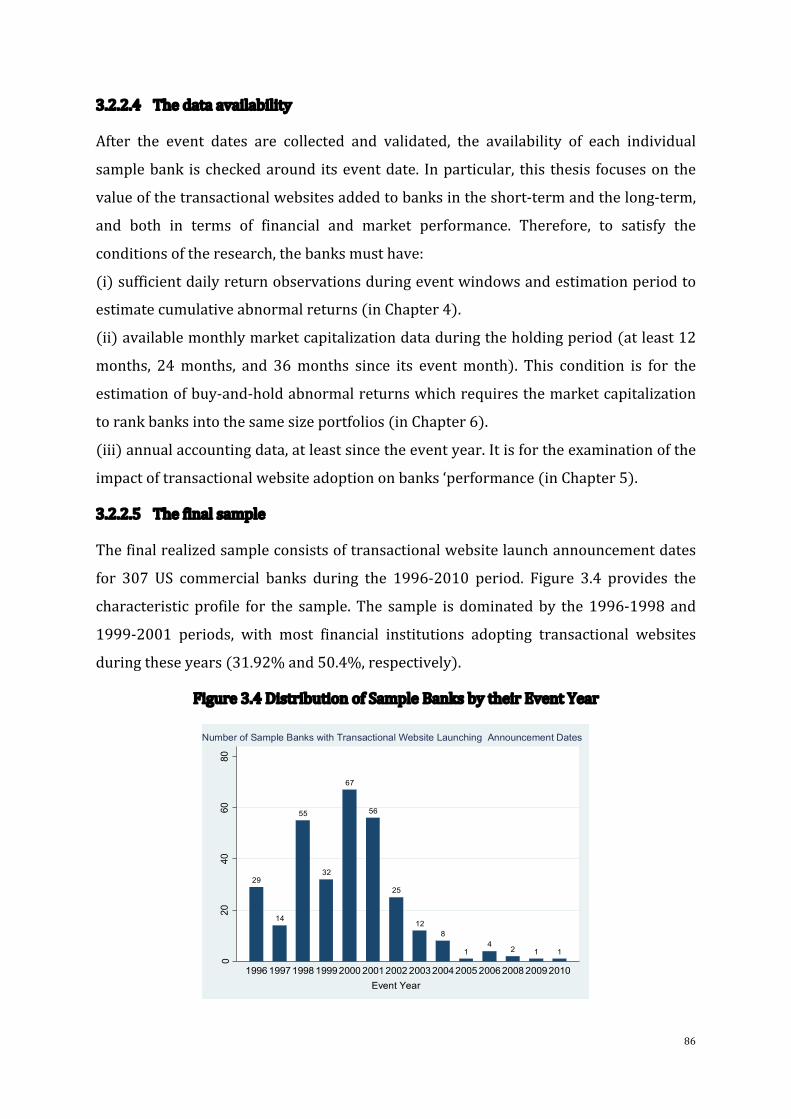
86
3.2.2.4 Thedataavailability
After the event dates are collected and validated, the availability of each individual
samplebank ischeckedaround itseventdate. Inparticular, this thesis focuseson the
valueofthetransactionalwebsitesaddedtobanksintheshort-termandthelong-term,
and both in terms of financial and market performance. Therefore, to satisfy the
conditionsoftheresearch,thebanksmusthave:
(i)sufficientdailyreturnobservationsduringeventwindowsandestimationperiodto
estimatecumulativeabnormalreturns(inChapter4).
(ii)availablemonthlymarketcapitalizationdataduringtheholdingperiod(atleast12
months, 24months, and 36months since its eventmonth). This condition is for the
estimationofbuy-and-holdabnormalreturnswhichrequiresthemarketcapitalization
torankbanksintothesamesizeportfolios(inChapter6).
(iii)annualaccountingdata,atleastsincetheeventyear.Itisfortheexaminationofthe
impactoftransactionalwebsiteadoptiononbanks‘performance(inChapter5).
3.2.2.5 Thefinalsample
Thefinalrealizedsampleconsistsoftransactionalwebsitelaunchannouncementdates
for 307 US commercial banks during the 1996-2010 period. Figure 3.4 provides the
characteristic profile for the sample. The sample is dominatedby the1996-1998 and
1999-2001 periods, with most financial institutions adopting transactional websites
duringtheseyears(31.92%and50.4%,respectively).
Figure3.4DistributionofSampleBanksbytheirEventYear
29
14
55
32
67
56
25
128
14
2 1 1
020
4060
80
Num
ber o
f US
liste
d ba
nks
with
ann
ounc
emen
t dat
es
1996 19971998 19992000 20012002 200320042005 20062008 20092010Event Year
Number of Sample Banks with Transactional Website Launching Announcement Dates
87
3.3 DataDescription
Table3.1,Table3.2,Table3.3andTable3.4describethecharacteristicsaswellasreveal
severalfactsaboutthesample.Table3.1showsthesizedistributionofthesamplebanks
atthetimetheyannouncedtheirenablementoftransactionalwebsites.Moreprecisely,
sample banks are categorized into three equally distributed size portfolios. TheMV1
portfolio includes103samplebankswiththesmallestcapitalization,whereasthe102
largest-capitalized banks are listed in theMV3portfolio.MV2 consists of 102 sample
bankswhosemarketsizeisrankedinthemiddlerange.ItbringsforwardfromTable3.3
that the third quantile outperformed the first and second quantiles in market
capitalizationvalues.The ratiobetween theaveragebank size in the first and second
quantileisabout4.08times,whiletheratiobetweenthefirstquantileandthirdquantile
is131times.Thethirdquantileisalsoaveragely32timesmorethanthesecondquantile
intermsofmarketcapitalizationvalues.
Regardingthedemographicsofthesamplebanks,itisshowninTable3.2thatmorethan
half of the banks are state-chartered and supervised by the FDIC (50.81%). In
comparison,theremainingsamplebanksaremonitoredfairlyevenlybyOCC(25.41%)
andFRB(23.78%).Regardingthedemographiccharacteristicsofthesamplebanksbased
ontheirmarketvalues,itisdetectedthatsmallbanksaremainlymanagedbytheFDIC
(58outof103banks).Itissimilartothesituationofthemedium-sizedbanksinthatthey
arealsomainlymanagedby theFDIC(60outof102).Meanwhile, thecharter typeof
largestbankshasbeenrelativelyevenlyallocatedtonationalandstatecharterandthe
threeregulatorsOCC,FIDC,andFRB.Intermsofthemarketvalueofeachbankcharter
group,due to thesuperiorityof themarketvalueof the largest-scaledbanks,national
bankshaveanaveragevalueof1869.708,whichisabout2.59timestheaveragemarket
valueof thewhole sample (721.302).Although50.81%ofbanks aremanagedby the
FDIC,themarketvalueofthisgroupisrelativelymodest(206.510)andisapproximately
3.49timessmallerthantheaveragemarketvalue(721.302)asthisgroupconsistsmainly
ofsmall-scalebanks.ThemarketvalueoftheSMgroupisslightlylessthantheaverage
value of the whole sample (594.341 compared to 721.302) and thereby indicates a
clusterofmediumandsmall-scaledbanks.
Theaveragemarketvalueandthenumberofbanksregardingthetransactionalwebsite
launchtimestagesaredepictedinTable3.3.Definitionstodescribethebankinggroups
are consistent with prior studies. Furst et al. (2002) describe banks that launched

88
transactionalwebsitesby1998as“firstmovers”.Therefore,bankswitheventsfrom1996
to1998,aretreatedinthe“first-mover”group.“Second-movers”areclassediftheeventoccursintheyear1999or2000.Previousstudiesreportthatfromthelatterpartof1999
to spring 2000, the market experienced an extraordinary surge in the stock market
causedbyexcessive investment into Internet-relatedandwebsite-relatedevents(Lee,
1998; Ofek and Richardson, 2003; Singhania and Girish, 2015; Walden and Browne,
2008). In this stage, stock prices reached a peak in the Autumn of 2000 before they
plummetedbacktothegroundinlate2000(seeFigure3.5).The“laggards”arebanksthathaveadoptedwebsitesfrom2001onwards.
Table3.3revealsthatthelargestbanksaremostlikelytobethefirstmovers(55outof
102),whereasthenumberofmedium-scaledbanksinallthreephasesisrelativelyeven
(29, 36, and37out of 102, respectively). Small banks tend tobe the second and late
adopters as they have enabled their transactional websites mostly upon the two
followingphases(40and49outof102,respectively).
Table 3.4 provides details on the distribution of the sample bank by state. Inwhich,
samplebanksappearinatotalof48states.Thesamplebanksaremostconcentratedin
thestateofPennsylvania(accountingfor11.4%)andCalifornia(accountingfor11.1%).
AsmallernumberofbanksareconcentratedinOhio(7.5%)andNewYork(6.8%).There
are about10-18 (3%-6%of the total sample)banks concentrated in eachofVirginia,
Indiana, Michigan, Georgia, Illinois, and New Jersey. Notably, there are 38/48 states
where there are less than 10 banks in each state (less than 3%of the total sample).
AccordingtodatafromtheCensus(2021)fromthe1990sto2020,thestateofCalifornia
hasalwaysbeen the statewith thehighestpopulation, fallingapproximatelybetween
29,700,000(1990s)–39,500,000(2020).Pennsylvania isalsoamongthetop5states
withthehighestpopulationfromthe1990stothepresent.Severalotherstates,suchas
NewYork,Virginia,Indiana,Michigan,Georgia,Illinois,andNewJerseyarealsoregions
withhighpopulations(top15 in the1990s-2010).Somestateswitha lownumberof
samplebanks,suchasWyoming,Vermont,andUtah,areamongtheleastpopulated.
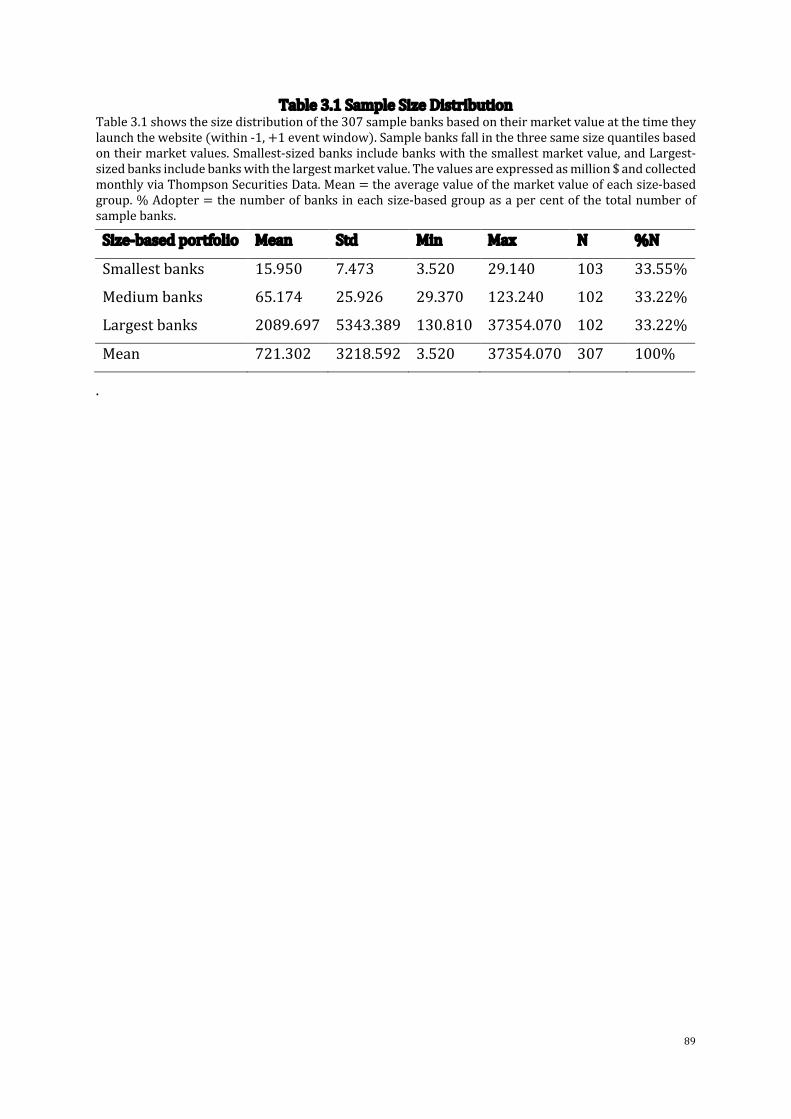
89
Table3.1SampleSizeDistributionTable3.1showsthesizedistributionofthe307samplebanksbasedontheirmarketvalueatthetimetheylaunchthewebsite(within-1,+1eventwindow).Samplebanksfallinthethreesamesizequantilesbasedontheirmarketvalues.Smallest-sizedbanksincludebankswiththesmallestmarketvalue,andLargest-sizedbanksincludebankswiththelargestmarketvalue.Thevaluesareexpressedasmillion$andcollectedmonthlyviaThompsonSecuritiesData.Mean=theaveragevalueofthemarketvalueofeachsize-basedgroup.%Adopter=thenumberofbanksineachsize-basedgroupasapercentofthetotalnumberofsamplebanks.
.
Size-basedportfolio Mean Std Min Max N %N
Smallestbanks 15.950 7.473 3.520 29.140 103 33.55%
Mediumbanks 65.174 25.926 29.370 123.240 102 33.22%
Largestbanks 2089.697 5343.389 130.810 37354.070 102 33.22%
Mean 721.302 3218.592 3.520 37354.070 307 100%

90
Table3.2BankCharterandSizeDistribution
Table3.2showsthedistributionofthe307samplebanksbasedontheirsize-basedgroupandchartertype.Samplebanksarecategorizedintothreedifferentsizeportfoliosandthreedifferentbankchartertypes.Samplebanksfallinthethreesamesizequantilesbasedontheirmarketvalues.Smallest-sizedbanksincludebankswiththesmallestmarketvalue,andlargest-sizedbanksincludebankswiththelargestmarketvalue.BanksareclassifiedintogroupNiftheyarenationallycharteredandsupervisedbyOCC.NMisagroupofbanksthatarestate-charteredandsupervisedbyFDIC.StatecharterbanksthataresupervisedbyFRBareclassifiedintotheSMgroup.Thedataofmarketvalueisexpressedasmillion$andcollectedmonthlyviaThompsonSecuritiesData.Thedataofbanks’chartertypeiscollectedviaFIDC.Thesizedistributionisbasedontheaveragemarketvalueofsamplebankswithinthethree-dayeventwindow(-1+1).N=Numberofadopters,%N=%ofadopters.FIDC-FederalDepositInsuranceCorporation,OCC-TheOfficeoftheComptrolleroftheCurrency,FRB-FederalReserveBank.
BankCharterSize-basedportfolio
N NM SMMean N %N Mean N %N Mean N %N
Smallestbanks 17.559 21 6.84% 15.691 58 18.89% 15.167 24 7.82%Mediumbanks 68.427 20 6.51% 61.581 60 19.54% 72.015 22 7.17%Largestbanks 3894.593 37 12.05% 726.595 38 12.38% 1534.762 27 8.79%N 1869.708 78 25.41% 206.510 156 50.81% 594.341 73 23.78%

91
Table3.3EventdateandBanksizeDistributionTable3.3showsthesize-baseddistributionsamplebanksizeoverthe1996-2010period.Samplebanksarecategorizedintothreedifferentsizeportfoliosandthreedifferenteventperiods.Samplebanksfallinthethreesamesizequantilesbasedontheirmarketvalues.Thesmallest-sizedgroupincludesbankswiththesmallestmarketvalue,andthelargest-sizedgroupincludesbankswiththemostmassivemarketvalue.Samplebanksarealsocategorizedintothreedifferenteventyearperiods:1996-1998,1999-2000,andafter2000.Thesizedistributionisbasedontheaveragemarketvalueofsamplebankswithinthe3-dayeventwindow(-1,+1).Thedataisexpressasmillion$andcollectedmonthlyviaThompsonSecuritiesData.Thecut-offyearsarealsoinspiredbytheargumentsofFurstetal.(2002)whodescribesthebankswholaunchedtransactionalwebsiteby1998as“firstmovers”,byauthorswhodescribetheperiodof1999-2000ashotbubbleperiod(Lee,1998;OfekandRichardson,2003;SinghaniaandGirish,2015;WaldenandBrowne,2008)andauthorswhodescribetheperiodafter2000asinformationavalanche(Dehningetal.,2004;Lee,1998). Firstmovers Secondmovers Laggards
Eventyear (1996-1998) (1999-2000) (After2000)Mean N % Mean N % Mean N %
Smallestbanks 18.084 14 4.56% 14.643 40 13.03% 16.407 49 15.96%
Mediumbanks 73.494 29 9.45% 65.399 36 11.73% 58.434 37 12.05%
Largestbanks 3265.607 55 17.92% 998.909 23 7.49% 440.242 24 7.82%
N 1857.071 98 31.92% 261.768 99 32.25% 123.017 110 35.83%
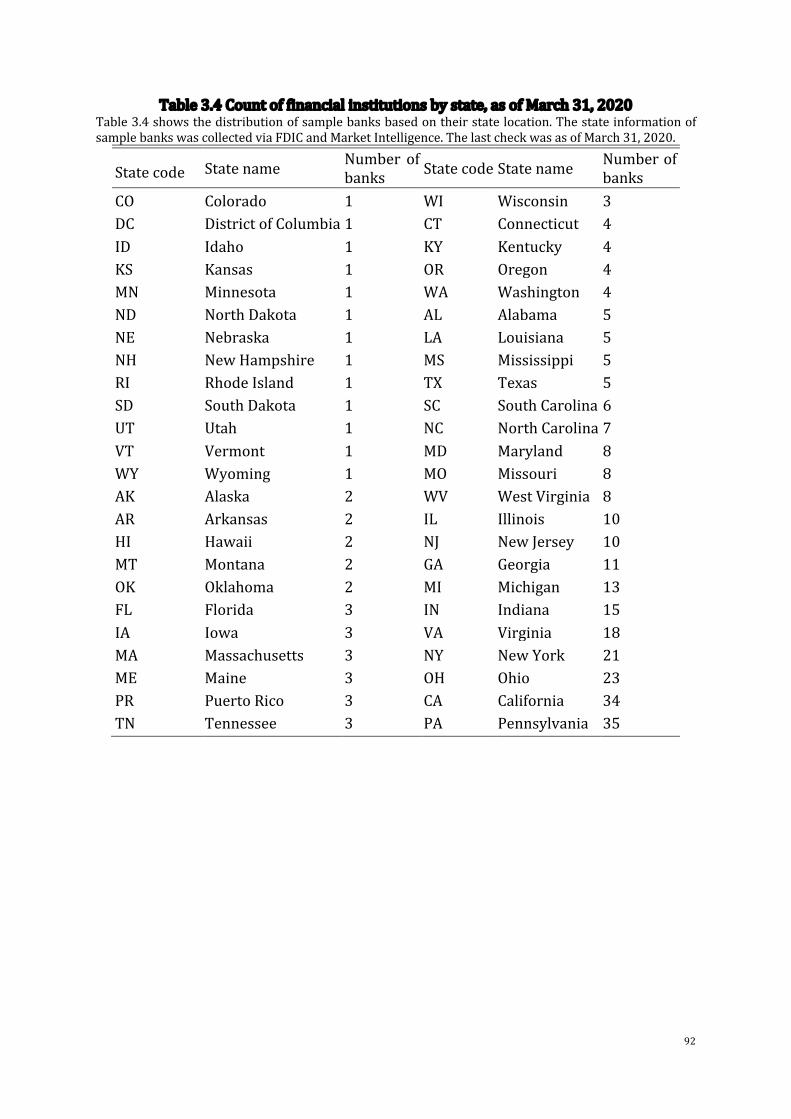
92
Table3.4Countoffinancialinstitutionsbystate,asofMarch31,2020Table3.4showsthedistributionofsamplebanksbasedontheirstatelocation.ThestateinformationofsamplebankswascollectedviaFDICandMarketIntelligence.ThelastcheckwasasofMarch31,2020.
Statecode Statename Number ofbanks StatecodeStatename Numberof
banksCO Colorado 1 WI Wisconsin 3DC DistrictofColumbia1 CT Connecticut 4ID Idaho 1 KY Kentucky 4KS Kansas 1 OR Oregon 4MN Minnesota 1 WA Washington 4ND NorthDakota 1 AL Alabama 5NE Nebraska 1 LA Louisiana 5NH NewHampshire 1 MS Mississippi 5RI RhodeIsland 1 TX Texas 5SD SouthDakota 1 SC SouthCarolina6UT Utah 1 NC NorthCarolina7VT Vermont 1 MD Maryland 8WY Wyoming 1 MO Missouri 8AK Alaska 2 WV WestVirginia 8AR Arkansas 2 IL Illinois 10HI Hawaii 2 NJ NewJersey 10MT Montana 2 GA Georgia 11OK Oklahoma 2 MI Michigan 13FL Florida 3 IN Indiana 15IA Iowa 3 VA Virginia 18MA Massachusetts 3 NY NewYork 21ME Maine 3 OH Ohio 23PR PuertoRico 3 CA California 34TN Tennessee 3 PA Pennsylvania 35
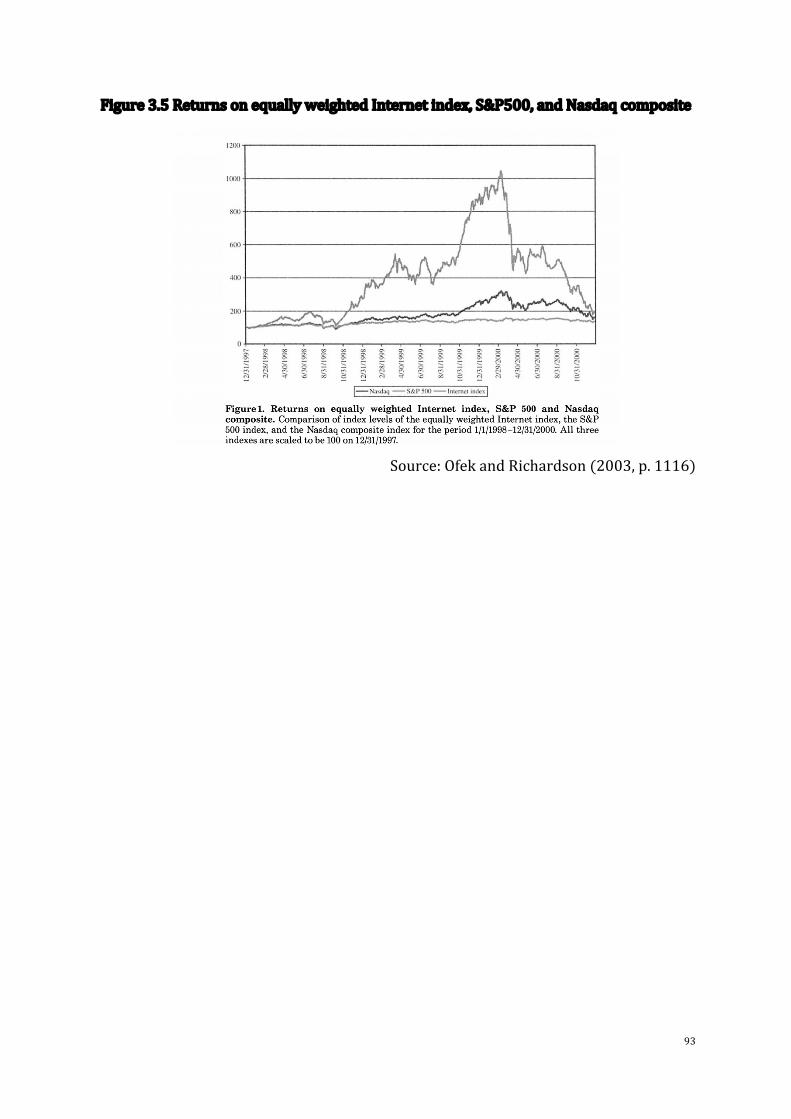
93
Figure3.5ReturnsonequallyweightedInternetindex,S&P500,andNasdaqcomposite
Source:OfekandRichardson(2003,p.1116)

94
3.4 SomeImportantConsiderations
3.4.1 Marketreactiontothetransactionalwebsiteadoption
In Chapter 4, a short-term event study is conducted to examine the impact of
transactionalwebsiteadoptiononthesharepricesofthebanks.AccordingtoEfficient
Market Hypothesis (EMH, Fama, 1970) when new information comes to themarket,
priceswill reflect this new information very quickly. If the information is previously
unknown(i.e.,theinformationisnew)andreflectseitheranincreaseordecreaseinfirm
value,thenpriceswillreactaccordinglywithimmediateeffect.Intermsoftheobjectives
ofChapter4,accordingtoEMHifthemarketvalueofthebanksreactstothetransactional
website adoption (either positively or negatively), then this is signalling thatmarket
participantsaretrackingtheadoptionandevaluatingthisinformationasbeingimportant
andthatitthisinformationisnew,asitwasn’tpreviouslypriced.
It’spossiblethattherehavebeenpriorannouncementsfromallorsomeofthesample
banksontheirintentiontoadoptthetransactionalwebsite,andaccordingtoEMH,this
informationwillalreadybereflectedinthebanks’marketvalue.Thedatacollectionfor
theeventdateisexplainedinSection3.2.2.3,andunfortunately,ithasn’tbeenpossibleto
collect information on whether there have been any pre-event announcements. The
resultsoftheshort-termeventstudyanalysisinChapter4willshowwhetherthereare
abnormal returns immediately surrounding the transactional website adoption date.
Somepossible results from theevent studyareas follows: (a) if significant abnormal
returnsarefoundintheshort-termeventwindows,thenaccordingtoEMHthisindicates
thatthetransactionalwebsiteadoptionisreleasingnewandvaluableinformationtothe
market; (b) the abnormal returns are insignificant, therefore it may be because the
transactionalwebsiteadoptionisalreadyreflectedinmarketpricesduetopre-adoption
announcementsand/oranticipation;and(c)itmaybethecasethattherehavebeenpre-
adoptionannouncementsand/oranticipationofthetransactionalwebsiteadoption,and
significantabnormalreturnsarestill found.Alimitationoftheshort-termeventstudy
methodologyemployedinChapter4isthatitwon’tbepossibletodistinguishbetween
conclusion(a)or(c),assumingsignificantabnormalreturnsarefound.Butif(a)or(c)is
theconclusion,thenitwillyieldanimportantinsightintotheinformationalcontentof
transactionalwebsiteadoptionandwillbeevidencethatmarketparticipantsareactively
observing/trackingtheimplementationofthistechnologyinthebankingsector.
95
Another important consideration is that the banks’ transactional websites will be in
constantdevelopmentovertime,i.e.,aftertheinitialadoptionit’slikelythatthewebsite
willbesubjecttoupdating,withnewfeaturesandlayoutsbeingimplemented.Thisthesis
isfocusedontheinitialadoptiondateanddoesnotconsideranyspecificdevelopments
tothetransactionalwebsitethatfollows.InChapter4,thisisoflittleconcern,astheaim
istoexaminetheimmediateimpactofthewebsiteadoption.AccordingtoBenbunan-Fich
andFich(2005),themarketdoesn’treacttowebsiteredesigns,andsoIwouldn’texpect
toseeanyimmediatemarketreactiontoanydevelopmentstotheexistingtransactional
website. The long-term impact of the transactional website adoption is examined in
Chapters5and6,and it isacknowledgedthe lackofdataandanalysisonany further
developmentinthetransactionalwebsitesfollowingtheinitialadoptionisalimitation.
3.4.2 Banks’spre-announcements
Before banks launch the transactional websites, they may have already put in place
advertisingstrategiestoannouncetheirupcomingtransactionalwebsitelaunch.Mishra
andBhabra(2001)arguethatthepre/intendedannouncementisanindependentaction
andcanbedistinguished fromtheactualannouncement.Morespecifically, theystate:
"Whiletheexistingliteraturefocusesonactualproductlaunchannouncements,relativelylittleresearchattentionhasbeendirectedtowardunderstandingtheeconomicimpactofintendedproductlaunches"(MishraandBhabra,2001,p.74).MishraandBhabra(2001)alsoclaimthatthepre-announcementtendtobetakenfromafewweekstoafewmonths
before the actual announcement. In the same vein, Eliashberg and Robertson (1988,
p.282) emphasize that pre-announcement is a “formal, deliberate communication"beforeafirmactuallylaunchesintoaparticularaction.
The pre-announcement action, on the one hand, can achieve its desired effects. For
example, Farrell (1987) shows that pre-announcements tend to negatively affect the
decisionsofenteringthemarketofothercompetitors.Furthermore,preannouncingmay
alsogivethefirst-moverfirmthepositivebenefitbypositioningitsproductinthemost
profitable segmentand to re-allocate less lucrative segments to latermarketentrants
(Eliashberg andRobertson, 1988). The pre-announcing actionmay also grab positive
attention from themarket if it contains convincing information (Mishra and Bhabra,
2001).Bycontrast,ifthepre-eventannouncementdidnotcontainmuchinformation,it
is likely tobe ignoredby the stockmarket (Mishra andBhabra, 2001).Also, thepre-

96
announcementmayalsoaffectstockpricenegativelyif itwasdeliberatelydesignedto
misleadthemarket(MishraandBhabra,2001).Inshort,thepre-announcementaction
mayhavemixedimpactsonfirms’prices,asshownbyliterature.
Inthecaseofthetransactionalwebsiteadoption,asdiscussed,thebanksmayhavea"pre-
launch announcement" to get the notice from the market or earn some competitive
advantages.Theinformationof"pre-launchannouncement"wouldbeaboutthebank's“upcoming transactionalwebsite” or “intended transactionalwebsite”. Therefore, anypricingon “pre-launchannouncement", ifany, isbasedon the"intended transactionalwebsite” information rather than “actual transactional website” information. Indeed,
accordingtotheefficientmarkethypothesis,anyinformationthatisputonthemarket
will be immediately and accurately evaluated. Therefore, thepricing on twodifferent
piecesofinformation:“anintendedtransactionalwebsite"and"anactualtransactionalwebsite"couldbewellseparated.Furthermore,thepre-eventannouncementisadmittedas a deliberate event and the pricing on a pre-event announcement is also studied
independentlyinliterature(EliashbergandRobertson,1988;MishraandBhabra,2001).
Withinsomecertainlimits,thisthesisonlyfocusesonthepricing(ifany)onthe“actualtransactionalwebsitelaunch”,asfollowedbynumerousstudies.Theexaminationisalsoextendedtoacoupleofdayspriortotheeventdate(-1day,-3days,-5days)inorderto
cover any information leak prior to the actual event, as following literature. More
discussion on this construction is provided in Chapter 4, especially Section 4.3.2-
Methodology.
3.4.3 Survivorshipbias
Another issue considered in this thesis is the survivor bias. It is well established in
financialresearchthatignoringdelistedcompanieswhenconductinghistoricalresearch
leadstosurvivorshipbiasinresults(GilbertandStrugnell,2010;Rohlederetal.,2011).
Thisbiasresultsfromtheuseofadatasetthatconsistsofthesurvivorsoveraperiod,not
thefullsetofcompaniesthatwerelistedoverthisperiod.Asthecharacteristicsofthe
survivorsarelikelytodiffersystematicallyfromthosewhohavedelisted,theresultsof
such a studywill bebiased. It can lead to overly optimistic beliefs as the failures are
ignored(suchaswhencompaniesthatnolongerexistareexcludedfromtheanalysesof
financialperformance).Itcanalsoleadtothefalsebeliefthatthesuccessesinagroup
havesomespecialproperty,ratherthanjustcoincidence(Rohlederetal.,2011).
97
However, collecting data for delisted companies is a time-consuming and expensive
process(GilbertandStrugnell,2010).Duetothelimitationofthedatabaseaswellasthe
rigoursofthemethodology,thisthesisfocusesonlyonthesamplebankswhichsurvive
duringthefullresearchperiodfrom1996to2018.Thebankswhichdelistedbefore2018
or/and banks with insufficient data are excluded from the final sample. Thus, it’s
acknowledgedthatsurvivorshipbiasisalimitationwithinthesample.
3.4.4 M&Aactivities
It’spossiblethatM&Aactivitiesarepresentinthesampleofbanksinthisthesis.Dueto
thedifferentmethodologiesappliedinChapters4,5and6,thepotential issueofM&A
activitiesisaddressedasfollows:
1.Mainlyrelatedtotheshort-runeventstudyinChapter4,amanualcheckofwhether
anyM&Aeventsoccurduringtheeventwindowhasbeenconducted.Inthisthesis,short-
termeventwindows(3days,5days,and7days)areapplied.Therefore,foreachsample
bank,sevendays(-3,+3)surroundingthetransactionalwebsitelaunchingeventhave
beenchecked.
ThehistoricaleventdatarelevanttoM&AofsamplebankshasbeentrackedattheFDIC
platformviathelinkhttps://banks.data.fdic.gov/bankfind-suite/bankfind.ForeachFDIC
certthatisinserted,theFDICsystemwillreturnthespecificdatesoftheeventsrelated
totheM&Aactivitiesofeachbank.
Followingthemanualcheck,itisconfirmedthatnoneofthebanksinthesamplehadany
M&Aactivitywithinthe7days(-3,+3)surroundingitsevent.Assuch,intheshortterm,
transactionalwebsiteadoptioneventsofthesamplebanksarenotaffectedbyanyM&A
activity.
2.Related to thestudyconducted inChapter5, Ihavebeenunable tocollect thedata
requiredtocheckforM&Aactivityforthesamplebanks.Therefore,Iacknowledgethat
thereisalimitationwithregardstothis.
3.InthelongruneventstudyinChapter6,variousbenchmarkportfoliosaretestedfor
in the buy-and-hold abnormal returns. One of the portfolios is constructed using a
matchedportfolioapproach(followingBarberandLyon,1997a;Ikenberryetal.,1995),
therefore, eachbank'sperformance (treatedbank) is comparedwithbanksof similar
characteristics (control banks). In this methodology both the treated bank and the
control bank should have an equal probability of other events occurring within the

98
holdingperiod.Therefore,theconcernssurroundingM&Arelatedeventsareminimised
withthisapproach.BarberandLyon(1997a)showthatmatchingtoacontrolfirmbased
onsimilarcharacteristicscaneliminatemanybiasesthatmaybeinthesample.
WithrespecttothepresenceofBankHoldingCompanies(BHCs)havinganeffectinthe
sample,Iacknowledgethatit’sbeenbeyondthescopeofthisthesistoexaminethisand
thereforeisalimitation.

99
4 Chapter4:DoTransactionalWebsiteInitiativesAddValuetoBanks?
4.1 Introduction
Theimpactoftransactionalwebsiteadoptiononbanksisnotanewtopic.Sincethefirst
transactional websites were adopted, research of their influence on financial
performancesandcustomeroutcomesofbankenterpriseshasbeenundertaken.Whatis
mainlyfoundinliteratureistheactualimprovementofbanks’performanceattributedto
their transactional website adoption, especially the increment in profitability andefficiency(Al-HawariandWard,2006;Cicirettietal.,2009;DeYoung,2005;Furstetal.,2002;GohandKauffman,2015;MbamaandEzepue,2018;Momparleretal.,2013;Pigni
et al., 2002; Scott et al., 2017; Sullivan, 2000; Xue et al., 2007) and enhancement in
customeroutcomes(Dabholkar,1996;HittandFrei,2002;Xueetal.,2007,2011).Unfortunately, up to this point, how investors and themarket react towards digital-
relatedevents in thebanking industry ingeneraland transactionalwebsite launching
events, in particular, is still untapped in the literature. The aim of this chapter is to
examinethemarketimpactoftransactionalwebsiteadoptiononbanks’shareprices.
Thischapter,therefore,hasbeendevelopedonthebasisoftwovitalmotivations:
- The essentials of getting insights into the wealth of digital-based initiatives
conferredonfinancialinstitutions’performance,especiallyinshortrun,and
- The lack of studies on the role ofmarket evaluations in assessing the value of
transactionalwebsiteenablementaddedtoinstitutions.
Theaimofthischapteristoanswertheresearchquestion“Dothetransactionalwebsitelaunching events gain a significant response from the market in the short term? Ifapplicable,whatstoryaboutthetransactionalwebsiteadoptionwouldberevealed?”Morespecifically,thischapteraimstoachievethefollowingspecificresearchobjectives:
- Investigate thecumulativeexcessreturns immediatelygainedbybanksaround
theirtransactionalwebsite-enabledannouncements.
- Inquire into the moderating effects that possibly differentiate performances
among banks aswell as alter theway themarket reacts to the transactionalwebsite
announcements,includingthemagnitudeeffect(orsizeeffect)andtimingordereffect.Tofacilitatetheresearchobjectives,thischapterfirstlylooksforapositivemarket-based
reaction that is significantlybeneficial to the institutions following their transactional
websitelaunch.Themainhypothesisinthischapterisbasedontheinteractionofseveral
100
theoretical perspectives, including the resource-based view (Amit and Schoemaker,1993;Barney,1991;Grant,1991b;Peteraf,1993),efficientmarkethypothesis(seeFama,1970,1995;Famaetal.,1969;Malkiel,2003;Samuelson,2016),andmarketsignallingperspective(Arthursetal.,2009;CampbelandKracaw,1980;Connellyetal.,2011;Famaetal.,1969;Herbig,1996;ParkandMezias,2005;Spence,1978,2002).
It isalsoworthnoting theargument that therearealternative factors thatneed tobe
consideredastheypossiblyimpacttheinnovation-performancenexus(e.g.,thetypeofinnovation,theintensityofcompetition,or/andthetimingoftheinnovation-Koellinger(2008)).Thischapterexpectsheterogeneityinthemarketreactionindifferentperiods
attributing to thedifferentiatedcompetitiveadvantagesof the firstmovers fromtheirfollowers(AlpertandKamins,1995;ChatterjeeandPacini,2002;Dehningetal.,2003;
DosSantosandPeffers,1995;JarvenpaaandTodd,1996;KalyanaramandUrban,1992;
LiebermanandMontgomery,1988;LilienandYoon,1990;Mascarenhas,1992a,1992b;
Tufano,1989).Thischapteralsopaysspecialattentiontomarketconditions,i.e.bubbleperiod (Cipriani and Guarino, 2013; Lee, 1998; Ofek and Richardson, 2003) andinformational avalanche (Dehning et al., 2004; Lee, 1998) as they are perceived tosignificantlyinfluenceinvestors’behaviour(DockingandKoch,2005;Veronesi,1999).
Concerningsizeeffect,inashort-runhorizoninvestigation,thischapterisbasedontheperspective of information asymmetry (Atiase, 1985; Bamber, 1987; Freeman, 1987;Llorenteetal.,2002),heterogeneityandspecificityininter-firmcompetitiveadvantages(Barney, 1996; Cainelli and Ganau, 2019; Jin et al., 2019; Rosen, 1991). These
perspectives enable this chapter to expect the cross-sectional variation in market
responsetowebsite-enabledannouncementsofdifferentfirmsizeclassifications.
Toachievetheresearchobjectives,eventstudymethodologyisemployedtoestimatethe
CumulativeAbnormalReturn(CAR)metric,basedontheoriginaldataof307fullylisted
commercial banks in the US. The event study methodology is widely used in many
business disciplines to facilitate investigations of the impact of managerial decision-
making,shareholderinitiatives,andothereconomicfactorsonthebasisofthecreation
ordestructionoffirmvalue.
The event studymethod iswidely accepted as apowerful tool because it enables the
abilitytopredictfuturebenefitstreamsoccurringfrominitiativesannouncedbyfirms.
Theeventstudyisoperatedbysumminguptheincrementalfuturecashflowsexpected
fromthefirm'sannouncement,whicharediscountedtothecurrentperiod.Thus,forthe

101
sake of forward-looking objectives, this approach is appropriate for predicting the
influenceofaparticulareventonorganizationalperformance.
Tothebestofmyknowledge,thereareseveralimportantareaswherethisstudymakes
anoriginalcontribution.
Firstly, in terms of data, this chapter provides original manually collected data on
transactional website launch event dates of 307 commercial banks listed on the US
market(seeChapter3forfurtherdetailsonthedatacollection).AsdiscussedinChapter
2, Section2.3, so far there are threemain streamsof literature relating to the digital
banking discipline: (i) the features of digital adoption which significantly influencecustomers’behaviour,(ii)theimpactofdigitaladoptiononthegeneralperformanceofbanks,especiallyoncustomeroutcomes,and(iii)theimpactofdigitaladoptiononthefinancial performance of banks. Little attention has been paid in the literature to themarketvalueofdigital-relatedinitiativesaddedtobankswhichareevaluatedbymarket
andinvestors.Accordingtotheefficientmarkethypothesisandrelevantempiricalwork,
marketandinvestorscandetectandevaluatetheintrinsicvalueofacertaininvestment
addedtoacorporation, in themost immediatelyandaccuratelymanner(Fama,1970,
1998,2021;Malkiel,1989).Furthermore,theevaluationofmarketandinvestorscanalso
transmittheinformationoffirm’sfutureearningprospect(BravandGompers,1997a;
Cole,1980;Fama,1995;TimmermannandGranger,2004).However,todate,therehas
beennoofficialdatabaseprovidingdataofdigitalbankingadoptionevents,makingthe
evaluationofdigitaladoptionsunderthemarketperspectivedifficultandscarceindigital
banking literature. The event data of this chapter, therefore, makes the original
contribution toenabling theevaluationof themarketand investors towardsadigital-
relatedbankingadoption.
Secondly,intermsofresearchmethodology,onthestrengthofeventdata,thischapteris
oneofthefirststudiesthatapplytheeventstudymethodologytoassessadigital-related
activityinthebankingsector.Itischallengingforaccountingmeasurestoimmediately
reflect thevalueof the transactionalwebsiteadoption. It isbecauseaccounting-based
metrics suffer the low frequencies as reportedperiodically (Ball andGallo, 2018).By
contrast, capital markets are featured of a round-the-clock flow of information and
therefore,theeconomicdataisobservedatrelativelyhighfrequencies(e.g.,dailystock
returns)(BallandGallo,2018).Therefore,themarket-basedapproachcancapturethe
value of any information available tomarket in a timelymanner. Furthermore, event
102
studymethodologycanisolatethevalue-addedofaparticulareventfromotheractivities
(MacKinlay,1997;Weekenborg,2018).Sometheoriesarguethatintangiblevaluemaybe
invisible in financial indicators (Itami and Roehl, 1991). Meanwhile, market-based
performance measures integrate all relevant information and therefore, unlike
accounting-based measures, they are not restricted in any single scope of firm
performance(LubatkinandShrieves,1986,p.499).Additionally,marketparticipantscan
bebetterpositionedthaninsiderstoanalysewhatissuesarerelevanttothefirm’sactions
(e.g.,international,macro-economic-seeLuo,2005).
Thirdly,intermsoffindingsandimplications,thischapterprovidesnewevidenceabout
the value of transactionalwebsite adoption conferred on banks, especially for banks’
shareholders. To be more specific, the results show that banks immediately earn
significant excess returns by launching their websites, and thereby, enhancing their
marketperformanceandshareholdervalue.Previousstudiesprovethatthetransactional
websiteadoptionsignificantlydeliversvaluetocustomersandfinancialperformanceof
banks.However,theevidencedoesnotexplicitlyanddirectlyproveiftheshareholders’
value can be gained by transactional website investment. For example, providing
customer satisfaction does not automatically convert into shareholder value, as
suggestedbyRappaport(1999,p.8).Furthermore,Johnsonetal.(1985,p.52)arguethat
financial ratios are not perfect proxies for shareholder wealth creation. The results
remainconsistentwhentestingforthemagnitudeeffectandtimingordereffect.Furthermore, as prior to this study the banking literature lacks evidence of any
immediatemarketvalueaddedfromtransactionalwebsiteadoption,itishardforbanks
andtheirmanagerstosetuptheircapitalstrategyinfollowingtheadoption.Thebanks
andmanagersmightneedtoknowifitiseasytoraisecapitaltopursuetheirlong-term
goal relevant to transactional websites. By proving that transactional website has
immediatebenefitsintermsofmarketvaluation,bankscanunderstandthattheycanbe
freed-upfromthemandatoryspendingandimproveaccesstocapitaltomaintaintheir
long-termgoal.21
21Forexample,accordingtoDeYoung(2007),smallbankssincetheadventofInternettendtofocusonhigh-value-addedtransactions(e.g.person-to-personservices).Comparedtothelargebanks,itseemstobeharderforsmallInternetbankstogaintheeconomicsofscaleadvantages.Smallbanks,therefore,needahealthycapitalbudgettopursuetheirstrategy.Theenhancementinmarketvalueoftransactionalwebsite
103
Finally, this chapter provides an original conceptual model which combines three
theoretical linkages: resource-based view, efficient market hypothesis and market
signallingperspectiveindigitalbankingdiscipline.Basedonthetheoryofresource-based
viewandmarketsignalling, firstly,themodelsuggeststhatresourcesfromthedigital-
related adoptions are positive signals for the market. Potential signals proposed are
superiorperformance,potentialgrowthandsustainabilityandcompetitiveadvantages,
which are based on numerous studies on digital adoption in other disciplines.
Subsequently, theefficientmarkethypothesisandmarketsignallingperspectiveallow
theexplanationsofthemechanismsbywhichinvestorsreacttothesignalsofthedigital
bankingadoptionevents.
The remainder of this chapter is organized as follows. Section 4.2 provides a brief
overviewoftherelevanttheoreticalperspectivesandempiricalfindings.Thisisfollowed
bytheresearchmethodology,datacollectiondesign,description,empiricalfindings,and
discussions. Section 4.6 is the conclusion, which includes a summary of the findings,
discussions of theoretical andmanagerial implications, and the directions for further
research.
4.2 Literaturereviewandhypothesisdevelopment
4.2.1 Theimpactofdigitalinitiativesonthemarketvalueofbanks
There are three main literature streams relating to digitalization that support the
hypotheses,namely,thebankingliterature,resource-basedliterature,andmarket-based
literature.
Firstly,regardingthescopeofdigitalizationinthebankingindustry,numerousstudies
haveattemptedtoestimatetheroleofdigitaladoptionininfluencingtheperformanceof
financial institutions. In general, it’s found that the launch of digital initiatives and
diffusionimprovebanks’performancesignificantly,especiallyintermsof(i)customeroutcomes(AhmadandAl-Zu’bi,2011;Buelletal.,2010;Dabholkar,1996;FirdousandFarooqi,2017;HittandFrei,2002;MannandSahni,2011;MbamaandEzepue,2018;Xu
etal.,2013;Xueetal.,2011),(ii)profitabilityand(iii)efficiencyandeffectiveness(Al-Hawari and Ward, 2006; Ciciretti et al., 2009; Delgado et al., 2007; DeYoung, 2005;
investment intheshorttermcanhelpsmallbanksmaintaintheircapitalandhaveopportunitytoraisecapitalfortheirlong-termgoals.
104
DeYoungetal.,2007;Furstetal.,2002;GohandKauffman,2015;HernandoandNieto,
2007;MbamaandEzepue,2018;Momparleretal.,2013;Pignietal.,2002;Scottetal.,
2017;Sullivan,2000;Xueetal.,2007).Itistherebyindicatedbythebankingliteraturethattherearetwocriticaldeterminantsofthelevelofbanks'performancewhengoing
digital;thoseare(i)newvaluecreationandcaptureand(ii)effectivenessandefficiencysynergy.As an example, the embracement of digital transformation potentially rewards banks
withanenhancementincustomervalue.Itismostlikelybecausedigitaltechnologiesand
solutions possess strategic characteristics that can satisfy the expectations and
perceptionsofcustomers(e.g.,easeofuse,usefulness,safety,andsoforth).22Accordingly,
digital transformations are highly likely to exert a positive influence on consumer
behaviourinusinganddiversifyingtheirdigitalbankingactivities,increasingcustomer
retention rate, and deepening the relationship between customers and their banking
serviceproviders.Regardingbanksthemselves,goingdigitalenablesbankstocapture
newvalue by diversifying their revenue streams through a broader range of services
offered inbothofflineandonline channels (e.g., deposits,borrowing, investment, and
trading), via mixed business strategies (cross-selling, non-financial partners), and
throughtheintegrationofdeliverychannels(e.g.,smartATM,web-basedbanking,mobile
banking;digitalapplication,contactcentres).Thedigitalrevolutionalsohassignificant
implicationsforbanksintheendowmentofapreferredstreamlinedprocess,"learningbyexperience"capability,aswellaslesseninghumanerrors.Secondly, it is supported by resource-based literature that digital enablement
significantlyendowsfirmswithstrategicresourcesandcapabilities.Putinthelanguage
oftraditionaltheorists,strategicresourcesandcapabilitiesarethefundamentalsources
ofsustainablecompetitiveadvantageandsuperiorperformance(AmitandSchoemaker,
1993;DierickxandCool,1989;Grant,1991b;HansenandWernerfelt,1989;Prahaladand
Hamel,1997;Wernerfelt,1984).Re-affirmedinrecentempiricalstudies,digitaladoption
is found tobepositively linkedwith firms’ superiorperformance, suchas in termsof
customerserviceperformance(Raietal.,2006;Setiaetal.,2013),operationalefficiency,and effectiveness (Rai et al., 2006), financial performance (Alexandru et al., 2019;
22PleaserefertoSection2.3.1forfurtherdiscussionsaboutstrategicattributesofdigitaladoption.
105
Homburgetal.,2019;MbamaandEzepue,2018),marketreturnperformance(McAlisteretal.,2012).Theresource-basedviewsuggeststhatbyembracingdigitalization,banks
are given rewards in strategic resources and capabilities (e.g., digital culture; digitalknowledge-based; sense-making capabilities, dynamic capabilities; integration andagilitycapability)whichisalwaysofgreatvaluetoimprovethelikelihoodofsuccess.Finally,regardingtheimpactofdigitaladoptiononthemarketvalueofbanks,despitethe
scarcityofrelevantresearchinbankingliterature,thishypothesisisstillsupportedby
studiesfromotherfields.Ingeneral,convincingevidenceshowsthatbylaunchingdigital
solutionsorimplementinginnovations,firmsarelikelytogainthepositiveevaluationof
themarketandearnpositiveabnormalreturns(Andoh-Baidooetal.,2012;Chatterjeeet
al.,2001;Drechsleretal.,2019;Imetal.,2001;LiandHuang,2012;SearsandHoetker,
2014;SternalandSchiereck,2019).Toexplainthevalueofdigitalactivitiesconferredon
banksaswellastherationalityofmarketevaluation,scholarstendtofavouranapproach
independentorparalleltothebasisofthemarketsignallingperspectiveandresource-
based view. Put concisely, on the one hand, the studies strongly believe that digital-
related activities actually possess strategic resources and capabilities. Therefore, the
value of the digital-related activities is likely to be accurately and immediately to be
incorporatedintomarketprices.Ontheotherhand,scholarsareconvincedthatdigital
embracementhasgivenattractivesignalstoinvestorsasapotentialportfolio,andthus
tendtogainpositivereactionsfromthemarket.Suchstandpointssuggestthreebenefits
ofdigitaladoptionthatpotentiallyinduceanenhancementofthemarketvalueofbanks
bypromotinginternalperformanceaswellasattractinginvestors.Thoseare(i)superiorperformance,(ii)competitiveadvantage,and(iii)potentialgrowthandsustainability,asillustratedinFigure4.1.
Hypothesis4.1:Wealthcreationof transactionalwebsite launcheventsover theshortterm
Banksearnsignificantpositiveabnormalreturnsimmediatelyupontheirtransactionalwebsiteevents.

106
Figure4.1Theinvolvementofinternalfactors(resourcesandcapabilities) and externalfactors(marketandinvestors)in influencing bankperformance
Source:Authors
DigitalInitiatives
Strategiccapabilities:
CompetitiveAdvantages+StrategicPartnerships+Superiormarket-orientedperformance+Superiorcustomeroutcomes+Technicalleadership+Strategicinterconnecteddigital-basedcompetencies+Knowledgesharing
SuperiorPerformance+Increasedcustomervalue+Boostedbusinesssales+Improvedefficiencyandeffectiveness+Enhancedemployeeperformance
PotentialGrowthandSustainability+Strengthencustomerrelationship+Strengthenefficiencyandeffectiveness+Simulateinnovationandnewdigitalopportunities+Leverageotherdigitalstrategies+Simulatecontinuousorganizationallearning+Minimizemarketrisks
Strategicresources:
Market
MarketSignals
Positivereaction Positivesignals
Interconnected
107
4.2.2 TheMagnitudeEffect
A substantial body of research has noted that returns are affected by several
compoundingeffects(suchasindustry,timing,companysize,dividendyield,thematurityofthecompany)aswellasawidevarietyofotherfactorsdependingontheparticularresearch discipline. Regarding the company size, from the viewpoint of financial
economists, efficientmarketmodels are found to be incorrectwhen the size effect is
ignored(DimsonandMarsh,1986;Reinganum,1981).Thefirstevidenceoftheexistence
ofthesizeeffectisprobablygivenbyBanz(1981)andReinganum(1981).Theyshow
that common stocks of small-capitalization firms are likely to produce considerably
higher returns than common stocks of large peers after taking risk into account. The
researchofBanz(1981)andReinganum(1981)hascaughttheattentionofnumerous
scholars afterwards. They have attempted to show further evidence of size-related
anomalies (Basu, 1983; Brown et al., 1983; Keim, 1983) or propose an economic
explanationforthisphenomenon(Reinganum,1983;Roll,1983;Schultz,1983;Stolland
Whaley,1983).Collectively,thesestudieshighlighttheneedfortakingsizefactorsinto
accountwhenevaluatingfirms'marketperformance.
To explain the heterogeneity of market reaction to the announcements of firms in
differentsizegroups,scholarstendtoadvocatetheinformationasymmetryhypothesis
which uses firm size as a proxy of information available to the public (Atiase, 1985;
Bamber,1987;Freeman,1987;Llorenteetal.,2002).Morespecifically,largefirmsare
perceivedasmorevisible,whereassmallerfirmsseemtobelessvisibletothemarket.
Therefore, inter-firmheterogeneity inearningexcessreturnsmayprevailbecause the
amountoftimeusedtoevaluatethetruenatureofthesignalssentbysmallbanksand
largebanksmightbedifferent.Asthesmallbanksarelessvisible,itmaytakemoretime
for themarket to fully react to their events. Empirically, a lot of evidencehas shown
differentiationinmarketreactionamongtheeventsofsmallfirmsandlargerfirmsdue
toasymmetriesininformation(Chaneyetal.,1991;FilbeckandWebb,2001;Imetal.,
2001;Slovinetal.,1992;SternalandSchiereck,2019;Xiaetal.,2016).
Nevertheless,thedifferentialinformationeffectmayonlypartlyreflectthedifferencein
earnings gained by differently sized firms (Barry and Brown, 1984). Given that the
market ability to assess and predict the value-enhancing prospects of news, the
heterogeneityofthereactionislikelytobeinducedfromfirm-specificadvantages.The
resource-basedview,innovationtheory,andotherrelevantliteraturesuggestthatfirms

108
havebothadvantagesandchallengesinimplementingtheirstrategies.Forexample,large
firmsmightbenefitfromeconomiesofscale,predominanceinR&D,andtheprofusionof
resources and capabilities (Nooteboom,1994;Rothwell andDodgson, 1994)whereas
small enterprises are better positioned in opportunity-seeking skills (Ketchen et al.,
2007)andagileanddynamiccapabilities(ChenandHambrick,1995;Deanetal.,1998;
Nooteboom,1994).Therefore,thewayinvestorsreacttoeventsmaybuilduponhowthey
envisagethefuturecashflowsandpotentialbenefitsof the idiosyncraticadvantageof
eachfirm’ssize,ratherthanmerelybecausethefirmsarelargeorsmall.
Inthismanner,thishypothesisproposesthat:
Hypothesis 4.2: Themagnitude effect in the short-term upon a transactionalwebsitelaunchevent.
There exists heterogeneity in cumulative abnormal returns among banks of differentsizes.
4.2.3 TheInfluenceoftheTimingEffect
As was analysed in Hypothesis 4.1: Wealth creation of transactional website launch
eventsovertheshortterm,theacademicworldhaswitnessedanenormousamountof
researchthatdocumentsgoodevidencefortheexistenceofamarketreactiontowards
disclosures of enterprises. These findings, generally in favour of the efficientmarket
hypothesis,spotlightthepowerofthemarketinassessingtheworthoffirmsinvolving
theirproclamations,whenconveyedunexpectedly to thepublic.Nevertheless, studies
fromthemarket-basedperspectivehavealsounderscoredalackofstabilityinmarket
reaction metrics to firms' announcements over different periods (Konchitchki and
O’Leary,2011).Thisnon-stabilityhassparkedtheinterestofscholarsindiscoveringthe
potentialexplanatorypowerofthetimefactorduringthereturnyieldingprocess.This
research, accordingly, is alsomotivated to examinewhether the time factor critically
variesthemarketvaluesoffirmsaddedfromtheirdigitalinitiatives.
In order to justify market discrepancies in reacting and evaluating digital banking
initiatives,severaltheoriesthatexplainthefinancialbehaviourandmotivesofinvestors
are applied, such as first-mover advantage, hot bubble, market turbulence, andinformationavalanche.
109
Whatisconsideredfirstiswhetherinvestorsshowanysignificantattentivenesstowards
firstmovers.Firstmoversinthisstudyarebanksthatareamongthefirsttoadoptthe
transactionalwebsites. In literature,scholarshaveexpressedenormousregardforthe
potentialrewardofbeingthefirstmoverinaninnovativestrategy.Somedistinctfirst-
moveradvantagesare learning-by-doingdifferentiation (LiebermanandMontgomery,1988), market share enhancement (Mascarenhas, 1992a, 1992b; Tufano, 1989),customersatisfactionandpurchaseretention(AlpertandKamins,1995;KalyanaramandUrban,1992),costsavings(JarvenpaaandTodd,1996).Therefore,thefirstadoptersmaygain a significantly positive evaluation from the market. Some of the authors have
demonstrated positive abnormal returns earned by first movers around their
announcementsinthehigh-techindustry(ZantoutandChaganti,1996),new/innovative
products (Lee et al., 2000), R&D expenditure plan (Zantout and Tsetsekos, 1994),
corporatecapitalinvestment(ChenandSu,2010).
Althoughthereisalotofexplicitevidenceinsupportofthefirst-moveradvantagetheory,
therealsoisagooddealofconfirmationforareversalthatsignificantlyadvocatesthe
outperformance of followers. More concretely, such evidence argues that it’s the
followersandnotthefirstmoversthatgethigherappreciationinthemarket.Thisisdue
toanumberofadvantagesthatthefollowingentrantscanachieve,especially learning
fromtheirpredecessorsorrivalsinordertoreduceoravoidmistakes,innovatingand
seekingoutunconventionalsolutions(BaldwinandChilds,1969;Drucker,1985;Hege
andHennessy,2010;Zachetal.,2020).Thefollowersmayalsobenefitbywaitinguntil
critical technological and market difficulties have been resolved (Lieberman, 1987;
LiebermanandMontgomery,1988;Utterback,1994).23
Moreover,duringtheperiodofinformationshiftingfromcascadetoavalanche,investors
tendtohaveaccesstomorewidelyavailableinformationfromtherecentpastwhichmay
influencehowtheyevaluatethevalueofsame-contentannouncementsinthepresent.24
Therefore,thefollowerscancompletelyoverpowerfirstmoversandearngreaterexcess
returns if investors are aware of the superior performance attributed to the
23Sometheoristsdefinethisadvantageoffollowingmoversasfree-rideradvantage.24Dehningetal.(2004)claimedthatthemorecompleteinformationwasavailablesince2000andwasrepresentedasaninformationalavalancheaftertheDotcombubble.

110
announcement.25Conversely,inthescenarioofacascadeofinformationwherethefirst
moversarestillheldasnewphenomena,investmentinfirst-moverfirmsmaybefraught
with reservations.26 Some empirical studies that support followers’ advantage are
relevanttotheannouncementsofthefoodanddrugadministration(SarkaranddeJong,2006),socialmediaadoption(Cummingsetal.,2018).27It'simportanttomentionthatthe1999-2000periodwitnessedcatastrophicvolatilityin
pricesduetothedot-combubblephenomenon(Lee,1998;OfekandRichardson,2003;
SinghaniaandGirish,2015;WaldenandBrowne,2008).Agoodamountofevidencehas
also shown thatmarket volatility can significantly influence investor preferences and
decision-making(Dehningetal.,2004;DockingandKoch,2005;Veronesi,1999).
Therefore, this hypothesis proposes that the reaction of the market and investors
towards transactional website events during this periodwould bemore volatile and
complex.
Hypothesis4.3:TimingEffectThemarketreactsdifferentlytowardswebsite-launcheventsdependingonthetimetheeventsareannounced.
4.3 DataandMethodology
4.3.1 Data
AsmentionedinChapter3,thefinalsampleincludes307USbankslistedonthestock
exchangeasofDecember2018.PleaserefertoChapter3,especiallyinSections3.2and
3.3 formore information on collecting and screening the data aswell as the statistic
descriptionofthesamplebanks.
Inthischapter,themarketmodelisappliedtoestimateshort-runabnormalreturnsthe
banks may earn from their transactional website launch event. Therefore, the daily
closingpriceindexof307banks,aswellasthedailyclosingpricesofamarketindexare
25Someauthors(DeLongandDeYoung,2007;Francisetal.,2014;Liangetal.,2021)foundthatthereexistthe“learning-by-observing”behaviouroftheinvestors.Morespecially,thepasteventinformationcanhelptheinvestorsbetterlearnandidentifythevalueofthesamecurrentevents.26Forinstance,SarkaranddeJong(2006)foundnegativeabnormalreturnssurroundingfoodanddrugadministrationoffirst-moverfirmsasinvestorsarereluctanttoinvestinpioneers.27Additionally,Polettietal.(2008)detectedthatthefirst-moveradvantagearedismissedovertime.

111
alsocollectedintheresearchperiod.ThetimescopeofdataispresentedlaterinTable
4.1,afterdiscussingtheeventwindowandestimationperiod.ThemainindexisNasdaq
whichwas collected via theDatastream system (nowThompsonReuters Eikon).28 In
addition,inordertoservetheexaminationofsizeeffect,themarketcapitalizationpoints
ofsamplebanksattheeventtimearealsocollected.
4.3.2 Eventstudymethodology
Tocarryoutaneventstudy,researchersmustdefinetheestimationperiodandtheevent
window.Theestimationperiodistheperiodoverwhichnoeventhasoccurred.Itisused
toestablishhowthereturnsonthestockshouldbehaveintheabsenceoftheanalysed
event.AccordingtoKritzman(1994),theestimationperiodshouldrangefrom100to300
days.Followingseveralpreviousstudies,thetimechosenisof120days(-20,-139)and
180days(-20,-199)beforetheevent.29,30Furthermore,aneventstudythatisovera200-
day estimation period and a 300-day estimation period is also estimated in the
robustnesstestsection.FollowingAmicietal.(2013),alloftheestimationperiodsinthis
chapterend20daysbeforetheannouncement.
Choosinganeventwindowisalsocrucialsinceitisdefinedasthetimewhenthemarket
firstlearnsabouttherelevantnewinformation.Ifthewindowsizeistoolong,itmaybe
affectedbyotherevents thusreducing thereliabilityofaneventanalysis (Brownand
Warner,1980;1985).31Bycontrast,ifthewindowsizeistooshort,itmaymisscritical
information and cause the problem of conditional heteroskedasticity. Put simply,
McWilliamsandSiegel(1997)suggestthattheeventwindowshouldbelongenoughtocomprehendthesignificanceoftheevent,butshortenoughtoruleoutdisturbingeffects.
Adopting the style of many studies that carry out Internet-related event studies
(Benbunan-FichandFich,2004;Cooperetal.,2001;Lee,2001;TelangandWattal,2005),
shorteventwindowsareadopted.Althoughsomestudies suggest choosingaone-day
eventperiod(thedayoftheannouncementorday“0”),Imetal.(2001)proposethatthe
one-day period can cause misleading results as we cannot access the exact time of
28PleasenotetheS&P500indexwastestedforrobustnessandshowedtheconsistentresults.Also,aUSbankingindexwastestedandreturnedthesimilarfindings.29 The chosen 120-day estimation period was followed some studies in the following parentheses(Campbelletal.,2003;Chengetal.,2007).30Thechosen180-dayestimationperiodwasfollowthestudyofAndrewetal.(1997).31Theseeventsarealsocalledconfoundingevents.

112
announcements.Moreconcretely,ifthemarketwereinformedaboutaneventearlieror
slightlyaftertheeventannouncementdate,anyvaluationwouldbeprobablyreflectedon
thedaybefore theannouncement.Bycontrast, if the information isrevealedafter the
closeof tradingonthepreviousday, thevaluationwillbereflectedonthedateof the
announcement.Inthesamevein,KonchitchkiandO’Leary(2011)assertthatthethree-
daywindow is optimal as it examines the informative contentof the event in amore
completeway.Morepointedly,thethree-daywindowallowsobservingbothleakagesof
informationpriortoeventannouncementsaswellasslightlybelatedresponsesafterthe
eventdates.Followingplentyofpreviousstudies,thischapteroptsforathree-dayevent
window,includingonedaybeforeandonedayafter(-1,+1).Also,twoadditionalevent
windows(-2,+2)and(-3,+3)aretestedforfollowingthesuggestionofKonchitchkiand
O’Leary(2011).
4.3.2.1 ModellingExpectedReturns
Expected returns are defined as the normal returns earned by a company without
experiencing an event. The normal returns of an event over an event window are
estimated, based on coefficients from the regression of returns of the firm over an
estimationperiod.Therefore, it is necessary to identify amodel that iswell suited to
captureascompletelyaspossiblethepriceimpactfromtheevent.Forexample,Kothari
andWarner(2007)indicatethatit’snotpossibletomeasuretheabnormal/unexpected
returnswithoutmodellingthenormal/expectedreturns.
Themeasurementofastandardreturncanbeclassifiedintothreegroups:modelsthat
capture the significant risks and characteristics of event firms, reference portfolios
matched with event firms with similar characteristics, and lastly, the control firm
approach.Thefivepopularmodelsaretheconstant-mean-returnmodel,marketmodel,market-adjustedmodel, capital asset pricingmodel (CAPM), andmulti-factormodels(suchastheFama-Frenchthree-factormodelorCarhartfour-factormodel).
Regardingthechoiceofexpectedreturnmodel,someeconometricianssuggestthatany
differences between their performance is less significant in a short-run event study
comparedtoalong-runeventstudy.Itmaybeduetothefactthatdailyabnormalreturn
isabout0.05%(KonchitchkiandO’Leary,2011).Thereby,eveninastatewheretherisk
factor (i.e. betas) have been stringently estimated, the error of calculating abnormal
returns isnegligiblewhen theyarebetween0.5%and1.0%.KonchitchkiandO’Leary

113
(2011)suggestthatintheshortrun,researcherscanuseeithermarket,Fama-French,or
Carhartmodelsbecausethemetricusedtoestimateabnormalreturnsisstraightforward
andlessrestrictive.Followingpreviousauthors,themarketmodelisappliedbecauseof
its simplicityandefficiency. It representsapotential improvementover the constant-
mean-returnmodel by controllingmarket risk (see Campbell et al., 1997;MacKinlay,
1997).
Inmoredetail,themarketmodelisastatisticalmodelthatrelatesthereturnofanygiven
securitytothereturnofthemarketportfolio.Foranysecurity,themarketmodelis:
m(n!") = p! + q!n#" + r!"
∈!," ~u(0, v%,!& )(Equation4.1)
Where n#" is the market return, while r!" captures the unsystematic risk that is
endogenoustoindividualstocks.Theparametersofthemarketmodelareestimatedby
runningregressionovertheestimationperiod,whichend20daysbeforeday0,which
limitsthepossibilityoftheeventdateinfluencingreturnsintheestimationperiod.
4.3.2.2 EstimationofAbnormalReturn
Theabnormalreturnissimplythedifferencebetweenactualstockreturnsandstandard
returns.Duetothedifferentdefinitionsoftheexpectedreturn,aspreviouslydiscussed,
resultscouldvary.
wn!," =n!," − m(n!,") (Equation4.2)
Once abnormal returns for yzz{|! during the event windows are calculated, the
cumulationmethodneedstobecarefullychosensinceresearchersaremoreinterested
intheperformanceofthestockoraportfolioofstocksoverthegivenperiod.Abnormal
returnscanbecumulatedeitherbystocksorovertime.Foreacheventwindow,CARsare
obtainedasfollow:
}wn!("!,"") =~ wn!("!,"")
""
")"! (Equation4.3)
Wheret1andt2arethestartingandtheenddatesoftheconsideredwindow.wn!("!"")is
aggregatedovertheeventwindowperiodforeachfirm.
4.3.2.3 HypothesisTesting
After the calculation of CARs, what is tested is the hypothesis of whether a market
reaction is significantly different from zero. As noted in Cummins andWeiss (2004),

114
variousstudieshavedocumentedavariance increase inARduringthedaynear toan
event,withrespecttotheestimationperiod,asaneffectoftheannouncement.Also,Amici
etal.(2013)highlightthatiftheincreaseinvarianceisnotconsideredinthehypothesis
test,theresultscanbebiasedtooverlyrepresenttherejectionofanullhypothesis.In
ordertoovercomethislimitation,theapproachofAmicietal.(2013)isadoptedtocarry
outtheZ-statisticsasfollows:
� =1u∑ Ån!*
!)+
Ç 1u(u − 1)∑ (Ån! − ∑
Ån!u )*
!)+&
*!)+
(Equation4.4)
WhereSRiiscalculatedas:
Ån! =}wn!(|+, |&)
v%!ÇÉ, +É,&É +
∑ (n#" − É,(n#ÑÑÑÑ))&""")"!∑ (n#" − n#ÑÑÑÑ)&-")"!
Inwhich
v%!:thestandarddeviationofabnormalreturnsestimatedwiththemarketmodel.
Éz:thenumberofdaysintheconsideredeventwindow(t1,t2).
É:thenumbersofdaysintheestimationperiod(É+, É&).
n#:themarketportfolioreturn.
nÑ#:theaveragemarketportfolioreturnsduringtheestimationperiod.
Table4.1SummaryofEventDatesandTestPeriodsforAbnormalReturns
Methodology Eventwindow
Firsteventdate
Lasteventdate
Test period(180days)
Test period(120days) Conditions
Marketmodel
(-1+1)window
17 Oct1996
15 Jul2010
7Feb1996to 16 Jul2010
1May1996to 16 Jul2010 Price
Indexavailabilityinalleventwindowsmustreach100%
(-2+2)window
17 Oct,1996
15 Jul,2010
6 Feb 1996to 19 Jul,2010
30 April1996 to 19Jul,2010
(-3+3)window
17 Oct,1996
15 Jul,2010
5 Feb 1996to 20 Jul,2010
29 April1996 to 20Jul,2010

115
4.4 EmpiricalResultsandDiscussions
4.4.1 Empirical Results forHypothesis 4.1:Wealth creation of transactionalwebsite
launcheventsovertheshortterm.
Table4.2presentsasummaryofthestatisticsforcumulativeaveragereturnsforthree
differenteventwindowsandtwodifferentestimationperiods,alongwiththez-scoresfor
thesignificancetest.Theresultshaverevealedthefollowing:
Firstly,thevaluesofCARarefoundtobepositiveacrossallwindowsbutstatisticallymost
robustinthethree-daywindow(-1,+1).Morespecifically,overthethreedays(day-1,
day0,andday+1)surroundingthewebsitelaunchannouncements,banksarelikelyto
earn positive cumulative excess returns in the range of 0.125%- 0.132% which are
statisticallysignificantata5%level(Z-scoreequals1.704and1.855inthe120-dayand
180-dayestimationperiods,respectively).Intermsoffive-dayandseven-daywindows,
thevaluesofCARkeepreflectingthepositiveresponsefromthemarket,rangingfrom
0.169%to0.175%duringthesefivedaysandfrom0.144%to0.178%oversevendays.
Nonetheless, CAR points are seemingly less statistically significant upon five-day and
seven-dayintervalsincomparisontothree-dayintervals.
Secondly,CARpointsappeartobeproportionaltothelengthofthewindows.Whenthe
windowlengthiswidened,especiallyfromthethree-daywindowtothefive-daywindow,
CARvaluesaremostlikelytofollowanincreasingtendency.Forexample,overthe120-
dayestimationperiod,CARvalues increase from0.125%to0.175%and0.178%over
threedays,fivedays,andsevendays,respectively.Thisexcessisequivalenttogrowthof
40% and 42.4% of CARs upon five-day and seven-day terms, compared to three-day
intervals.
TheevidenceinTable4.2suggeststhatthetransactionalwebsitelauncheventsgaineda
reasonably immediate and remarkable response from the market at the time of the
adoption.Anintuitiveinterpretationofthisresultisthattheinvestorsandmarketfeel
less uncertainty about future cash flows surrounding transactionalwebsite adoption,
leadingthemtoreactpromptlytowebsite-launchevents.Therefore,bankstendtoearn
excessreturnsveryclosetotheirannouncement,ratherthanseeingalaginevaluation
fromthemarket.Someorallbanksinthesamplemayhaveannouncedtheirintentionto
adoptthetransactionalwebsitepriortotheactualadoptiondate.Ifso,it’spossiblethat
marketpriceswouldalreadyreflectthisinformation,andhencemarketreactionswould
116
notoccurimmediatelysurroundingtheevent.However,thepositiveandsignificantCARs
found immediately around the adoption date is evidence that new and valuable
information is added to the market regardless of any market impact from prior
announcements.
Itshouldalsobenotedthat,duringthefiveandsevendayssurroundingtheevents,the
CARvaluesarestillpositiveandenlarged.Assuch,itsuggeststhatex-postandex-ante
tradingactivitiesmaystilloccur.However,theseactivitiesmaydependonthenatureof
thebusinessorthetimethattheeventshavebeenreleased.Tofurtherclarifythat,the
nextsectionswill lookathowthemarketreacts towardsbanks thatpossessdifferent
sizesanddifferenttimeannouncements.
4.4.2 EmpiricalresultsforHypothesis4.2:Themagnitudeeffectintheshort-termupon
atransactionalwebsitelaunchevent.
Table 4.3 presents the results obtained from the investigation intowhether firm size
factors significantly alter the abnormal returns gained from banking transactional
website launchevents.Tobemorespecific,samplebankswerecategorized intothree
equally distributed quantiles. TheMV1 portfolio includes 103 sample bankswith the
smallestcapitalization,whereasthe102largest-capitalizedbanksarelistedintheMV3
portfolio.MV2consistsof102samplebankswhosemarketsizeisrankedinthemiddle
range.AspredictedfromHypothesis4.2,whatispresentedinTable4.3showsamarked
heterogeneityincumulativeexcessreturnsearnedbyeachsizegroupsurroundingtheir
events.
Theeventsofthelargestbankstendtograbthemostenthusiasmfromthemarketwithin
threedaysnearesttotheevent,withtheCARvalueat0.312%andsignificantatthe1%
level.Overlongerperiods(fivedaysandsevendays),themarketreactiontowardsthe
largestbanks'eventsappearstobelowerandlessrobust.Specifically,theCAR(-2,+2)
valueisapproximatelytwiceaslow(0.132%)whereastheCAR(-3,+3)valueisnegative
(-0.48%)andinsignificant,comparedtoCAR(-1,+1).Incontrasttothelargest-scaled
banks,thesmallest-scaledbankshaveattractedthestrongestattentionfromthemarket
fromfivetosevendayssurroundingtheevents.Moreconcretely,withinthefirstthree
days,iflargebanksgrabmorerobustCARpoints,thesmallestcounterpartstendtogain
afairlymodestandinsignificantCAR(0.035%).Themarketreactiontothegroupofsmall
banks only appears to be robust in longer intervals, where the CAR value increased

117
stronglyto0.476%withinfivedaysand0.584%withinsevendays.Notably,CARvalues
inthefive-dayandseven-dayintervalsarebothstatisticallyrobustatthe1%level(Z-
score=4.791and4.277).Regardingtheeventsofmedium-scaledbanks,theresponse
fromthemarketshowsmorecomplicatedvolatility.Inthethree-dayintervalandfive-
day interval, themarket seems to be less interested in the website-launch events of
mediumbanks,comparedtothetwoothergroups.Themarket'sreactiontotheeventsof
themediumbankgroupisonlygenuinelyremarkableintheseven-daywindow.Inwhich,
mediumbankscouldearnCARof0.427%,approximatelyequivalent to theCARvalue
earnedbysmallbanks.
Together,theseresultsprovidethefollowinginsights:
Firstly,assetoutinHypothesis4.2,thereactionsofthemarketvaryacrosssize-related
groups. In which, the market demonstrates the most immediate and significant
preferenceforwebsite-adoptioneventsofthelargestbanks.Oneexplanationisbecause
themarketconsidersthatthevalueofthetransactionalwebsite,whenattributedtolarge-
scaled banks, is remarkable, clear, and feasible. Therefore, the value of transactional
websiteeventswasimmediatelyincorporatedintothestockpricesofsuchbanks.Indeed,
large-scaledbankspossesspossiblesourcesthatallowthemtobesuccessfulinadopting
their digital initiatives (e.g., instance economies of scale and scope, more abundant
financialresources,or/andgreatercapacityforspecializationanddiversification).
Meanwhile,therearemoreex-anteandex-postactivitiesinvolvingsmallerscalebanks.
Therearesomeexplanations for that.Firstly, ifsize factor isconsideredasan inverse
variableoftheamountof informationleakedinthepre-announcementperiod(Atiase,
1985;Bamber,1987;Freeman,1987;Llorenteetal.,2002),theninformationfromsmall
bankscouldbemorelimitedinthemarket.Asaresult,ex-postactivitiesmayhavetaken
placemore for the small group of banks since it potentially takesmore time for the
markettoreactandfullypredictthepotentialthattransactionalwebsiteadoptionwill
bring to small banks.However, the information effectmight only explainparts of the
smallfirmeffect(BarryandBrown,1984).Itisalsoverylikelythatinvestorsfindthat
high rewards couldbe added to small-scaledbanks thanks to theirwebsite adoption,
leadingtomoretradingactivitiesrelevanttosmallbanks’events.Infact,smallbanksare
foundtobenimbler, lesshierarchal,andmakedecisionsquicker(ChenandHambrick,
1995;Deanetal.,1998).Also,theyhaveapropensitytopositionthemselvesdifferently
fromtheirlargerrivalstograbnewopportunitiesfromnichemarkets(Deanetal.,1998).
118
Accordingly,itistotallyfeasiblethatsmallbanks’website-launcheventsturnouttobe
attractivetothemarket.
Ingeneral,theresultssupportHypothesis4.2inthatthereisheterogeneityinthemarket
reactiontowardstheeventsofdifferentsizedbanks.Mostnotably,intheshortrun,most
of the banks would benefit from their website launch events by gaining positive
cumulative excess returns. The heterogeneity in earnings thereby might not only be
attributable to size, but also to the amount of pre-information disclosure, the signals
deliveredtothemarketorthespecifiedpotentialofeachbankgroup.
Please note that, in addition to firm size, book-to-market is also a firm characteristic
favouredbystudiestoexplaincross-sectionalvariationinexpectedreturns(Barberand
Lyon,1997a;BravandGompers,1997b;Ikenberryetal.,1995;Liuetal.,2013;Savorand
Lu,2009).BarberandLyon(1997b,p.883)arguethat,alongwithbanksize,thebook-
to-market ratios also “explain in an economically meaningful way cross-sectional
variationinsecurityreturns".Oneassumptionisthatthebook-to-marketratioisaproxy
forpricedrisk(Bartrametal.,2020).Forexample,high-riskfirmstendtodiscountfuture
cashflowsathigherrates.Therefore,thesefirmsarelikelytohavelowmarketpricesand
high book-to-market ratios (Berk, 1995). In the same vein, Fama and French (1992,
1993)assumebook-to-marketratioandcapitalizationstockascompensation forrisk.
ThehigherreturnsfoundinFamaandFrench(1992,1993)areattributedtohighbook-
to-marketstocksandlowcapitalizationstocks.Itmeansthatthesestocksareexpectedto
earn higher rates of return because they are riskier. However, other asset pricing
literatureemphasizethat,althoughbook-to-marketandsize-relatedfactorscouldwell
capture the variation in expected returns, there has been no strong theoretical
justification that the common variation in returns is systematically driven by these
factors(Dempsey,2010).Forexample,FamaandFrench(1995,p.164)state:“Wedofindthatthemarketandsizefactorsinearninghelpexplainthemarketandsizefactorsinreturns.Butwe findnoevidence that return respond to thebook-to-market factor inearnings”.Focusingonthesizeeffectonlyandnotthebook-to-marketratioisalimitationofthischapter.
4.4.3 EmpiricalResultsforHypothesis4.3:Timingeffect
Table 4.4 shows the empirical results forHypothesis 4.3,which analyses if there are
remarkable differences in CAR values produced at differentwebsite-launch times. As

119
discussed in the section on descriptive statistics, event years are divided into three
equally distributed groups. The first-mover group consists of ninety-eight banks that
launchedtheirtransactionalwebsitebetween1996and1998.Thesubsequentninety-
ninebankswhich enabled theirwebsites from1999 to2000are categorized into the
second-movergroup.Theremainingbanksthathaveadoptedwebsitesafter2000are
treatedas laggards.The sampledefinition is inspiredby thediscussionofFurst et al.
(2002)whodescribesthebankswholaunchedtransactionalwebsitesby1998as“first
movers”,byseveralauthorswhodescribetheperiodof1999-2000asahotbubbleperiod
(Lee,1998;OfekandRichardson,2003;SinghaniaandGirish,2015;WaldenandBrowne,
2008), and authorswho describe the period after 2000 as an information avalanche
period(Dehningetal.,2004;Lee,1998).
Firstly, themarketresponsewasfoundtobeverystrongtowardsearlyevents(1996-
1998)and laterevents (after2000). Specifically, firstmoversand laggardsbothkeep
positiveandsignificantCARinthree-,five-andseven-dayperiodsaroundtheirevents.
Onthecontrary,themarketreactionseeminglyshowedamorevolatiletrendagainstthe
eventsofsecondcomers.Moreconcretely,withinthreedaysproximatetothewebsite-
initiated bulletins, the CAR attributed to the second-runner group are negative (-
0.452%).Whentheexaminedwindowwasenlargedtofive-dayandseven-day,theCAR
valueschangedpositively(0.071%and0.054%),buttheywerestillnegligibleandmuch
lowerthantheCARpointsgainedbyfirstrunnersandlateadopters.
Secondly,firstadoptersweretheoneswhoharvestedthehighestvalueofCARwhilelate
adoptionbanksweretheoneswhogetthesteadiestCARvalues.Morespecifically,during
thethree-dayevent,theCARvaluesachievedbyfirst-moverfirmsareatthegreatestand
most full extent (0.465% with Z-score = 7.446). In the circumstances when the
monitoredintervalswereextended,theCARvaluesoffirstmovershalvesoverfivedays
and drops to approximately ten times upon seven days. In another entirely different
story, laggardsevidentlyhavemaintainedpreferable stability in theirexcessearnings
compared to their predecessor counterparts. More concretely, CAR values earned by
laggardsrunwithintherangeof0.241%to0.408%overthethreeexaminedwindows,
andtheyareallstatisticallysignificantatthe1%level.
Theaboveresultsshowthat thewebsite-launchevents in the first threeyears(1996-
1998)attractedthemostattentionfromthemarket.Thisisinlinewiththeoreticaland
empiricalevidenceof"first-moveradvantage".Asfirstadoptersaresupposedtobenefit

120
morefromtheirtechnologicalinitiatives(suchasmarketshareintensification,customer
satisfaction,customerretention,customerawareness), it is feasible for themtogaina
favourablereactionfromthemarket,atleastintheshortterm.32
Even though the firstmoversare theoneswhogained thehighestexcessreturns, the
laggardsaretheoneswhoexperiencedmorestableanddurableexcessreturns.Thisis
possiblebecauseafterfiveyearssincethefirsttransactionalwebsitehasadoptedin1996,
the information concerning website-launch events as well as the value the websites
addedtobanks,aremoretransparent.Therefore, themarkethasmore justificationto
evaluatethewebsite-adoptioneventsinthelaterstages.Moreinteresting,thepositive
and stable excess returns could suggest that the transactional website actually adds
excellentvaluetobanksasthetransactionalwebsitelauncheventsstillgrabtheattention
ofthemarketatdifferenttimes,regardlesstheyarepioneersorlatecomers.
Italsocouldnotbeignoredtheperiodbetween1999and2000asthereismorevolatility
from the market towards the website-launch announcements during this period.
Historically, the economy witnessed the Dotcom bubble period in 1999-2000 that
exhibitedextremevolatility in thestockpriceasprice indicesskyrocketedandwould
reach apeak in2000before it plummetedback to the ground.Therefore, thisperiod
mightwitnessinvestorpanicandtheirhesitationininvestinginwebsite-relatedlaunch
events(Dehningetal.,2004;DockingandKoch,2005;Veronesi,1999).
Ingeneral,theresultssupportHypothesis4.3whentheydemonstratedifferentiationin
the market evaluation of transactional website events at different time stages.
Nevertheless, itshouldbehighlightedthatallbanksstillgainedpositiverewardsfrom
the market, showing that transactional websites indeed possess value-enhancing
potential,nomatteriftheyareadoptedearlyorlate.Potentially,theearningsvarywith
specificgrowthopportunitiesofthefirmgroupsaswellasthemarketconditions.
32Keyauthorsare in the followingparenthese (Alpert andKamins,1995;ChatterjeeandPacini,2002;Dehningetal.,2003;DosSantosandPeffers,1995; JarvenpaaandTodd,1996;KalyanaramandUrban,1992; Lieberman andMontgomery, 1988; Lilien and Yoon, 1990;Mascarenhas, 1992a, 1992b; Tufano,1989).
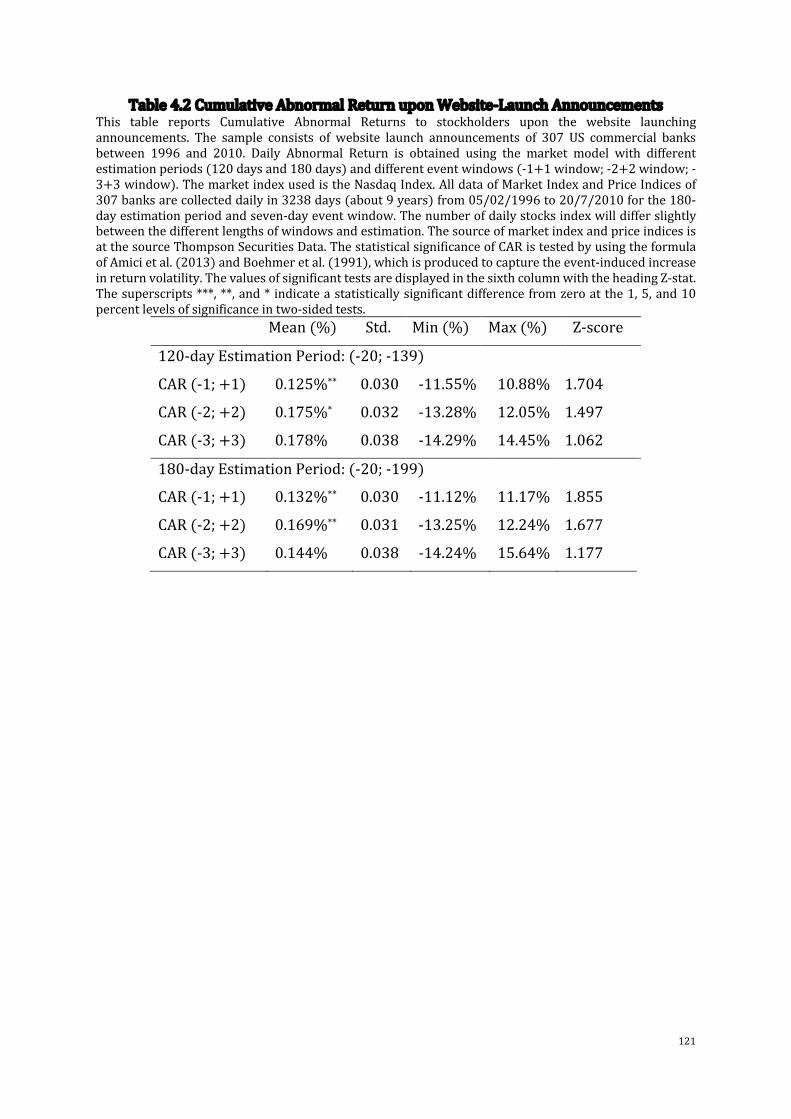
121
Table4.2CumulativeAbnormalReturnuponWebsite-LaunchAnnouncementsThis table reports Cumulative Abnormal Returns to stockholders upon the website launchingannouncements. The sample consists of website launch announcements of 307 US commercial banksbetween 1996 and 2010. Daily Abnormal Return is obtained using the market model with differentestimationperiods(120daysand180days)anddifferenteventwindows(-1+1window;-2+2window;-3+3window).ThemarketindexusedistheNasdaqIndex.AlldataofMarketIndexandPriceIndicesof307banksarecollecteddailyin3238days(about9years)from05/02/1996to20/7/2010forthe180-dayestimationperiodandseven-dayeventwindow.Thenumberofdailystocksindexwilldifferslightlybetweenthedifferentlengthsofwindowsandestimation.ThesourceofmarketindexandpriceindicesisatthesourceThompsonSecuritiesData.ThestatisticalsignificanceofCARistestedbyusingtheformulaofAmicietal.(2013)andBoehmeretal.(1991),whichisproducedtocapturetheevent-inducedincreaseinreturnvolatility.ThevaluesofsignificanttestsaredisplayedinthesixthcolumnwiththeheadingZ-stat.Thesuperscripts***,**,and* indicateastatisticallysignificantdifferencefromzeroatthe1,5,and10percentlevelsofsignificanceintwo-sidedtests.
Mean(%) Std. Min(%) Max(%) Z-score
120-dayEstimationPeriod:(-20;-139)
CAR(-1;+1) 0.125%** 0.030 -11.55% 10.88% 1.704
CAR(-2;+2) 0.175%* 0.032 -13.28% 12.05% 1.497
CAR(-3;+3) 0.178% 0.038 -14.29% 14.45% 1.062
180-dayEstimationPeriod:(-20;-199)
CAR(-1;+1) 0.132%** 0.030 -11.12% 11.17% 1.855
CAR(-2;+2) 0.169%** 0.031 -13.25% 12.24% 1.677
CAR(-3;+3) 0.144% 0.038 -14.24% 15.64% 1.177
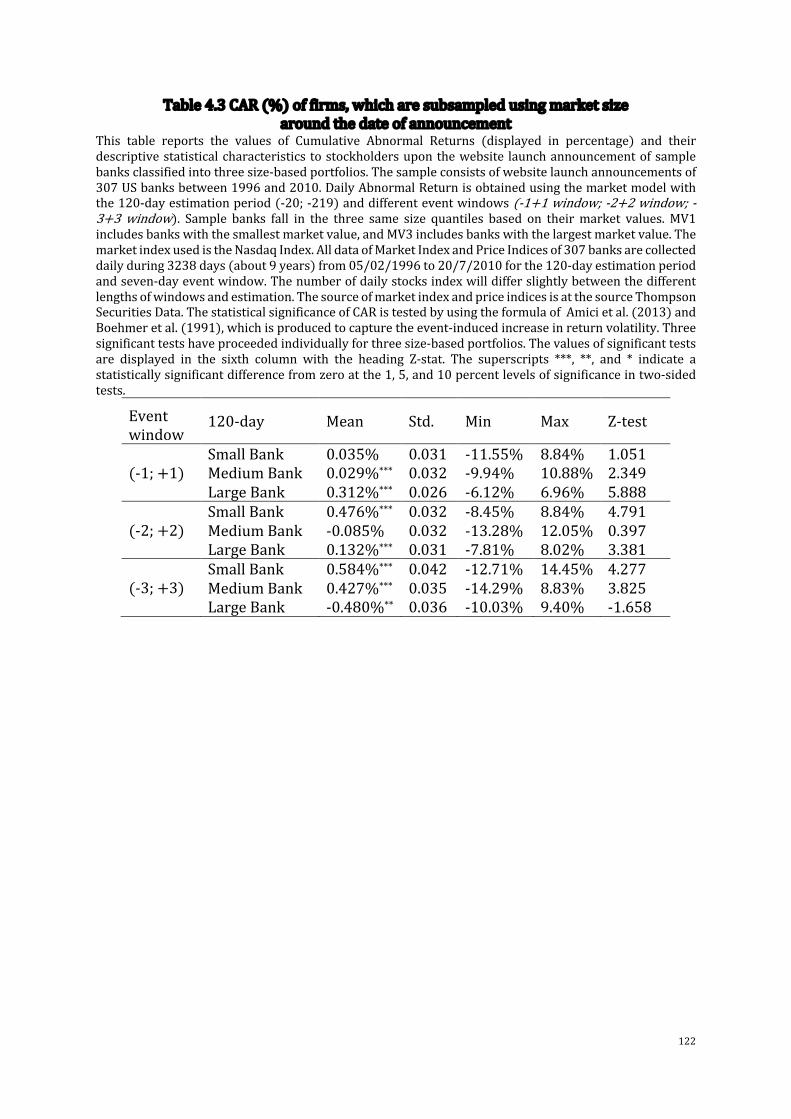
122
Table4.3CAR(%)offirms,whicharesubsampledusingmarketsizearoundthedateofannouncement
This table reports the values of Cumulative Abnormal Returns (displayed in percentage) and theirdescriptivestatisticalcharacteristics tostockholdersuponthewebsite launchannouncementofsamplebanksclassifiedintothreesize-basedportfolios.Thesampleconsistsofwebsitelaunchannouncementsof307USbanksbetween1996and2010.DailyAbnormalReturnisobtainedusingthemarketmodelwiththe120-dayestimationperiod(-20;-219)anddifferenteventwindows(-1+1window;-2+2window;-3+3window). Sample banks fall in the three same size quantiles based on theirmarket values.MV1includesbankswiththesmallestmarketvalue,andMV3includesbankswiththelargestmarketvalue.ThemarketindexusedistheNasdaqIndex.AlldataofMarketIndexandPriceIndicesof307banksarecollecteddailyduring3238days(about9years)from05/02/1996to20/7/2010forthe120-dayestimationperiodandseven-dayeventwindow.Thenumberofdailystocksindexwilldifferslightlybetweenthedifferentlengthsofwindowsandestimation.ThesourceofmarketindexandpriceindicesisatthesourceThompsonSecuritiesData.ThestatisticalsignificanceofCARistestedbyusingtheformulaofAmicietal.(2013)andBoehmeretal.(1991),whichisproducedtocapturetheevent-inducedincreaseinreturnvolatility.Threesignificanttestshaveproceededindividuallyforthreesize-basedportfolios.Thevaluesofsignificanttestsare displayed in the sixth column with the heading Z-stat. The superscripts ***, **, and * indicate astatisticallysignificantdifferencefromzeroatthe1,5,and10percentlevelsofsignificanceintwo-sidedtests.
Eventwindow
120-day Mean Std. Min Max Z-test
SmallBank 0.035% 0.031 -11.55% 8.84% 1.051(-1;+1) MediumBank 0.029%*** 0.032 -9.94% 10.88% 2.349 LargeBank 0.312%*** 0.026 -6.12% 6.96% 5.888 SmallBank 0.476%*** 0.032 -8.45% 8.84% 4.791(-2;+2) MediumBank -0.085% 0.032 -13.28% 12.05% 0.397 LargeBank 0.132%*** 0.031 -7.81% 8.02% 3.381 SmallBank 0.584%*** 0.042 -12.71% 14.45% 4.277(-3;+3) MediumBank 0.427%*** 0.035 -14.29% 8.83% 3.825 LargeBank -0.480%** 0.036 -10.03% 9.40% -1.658
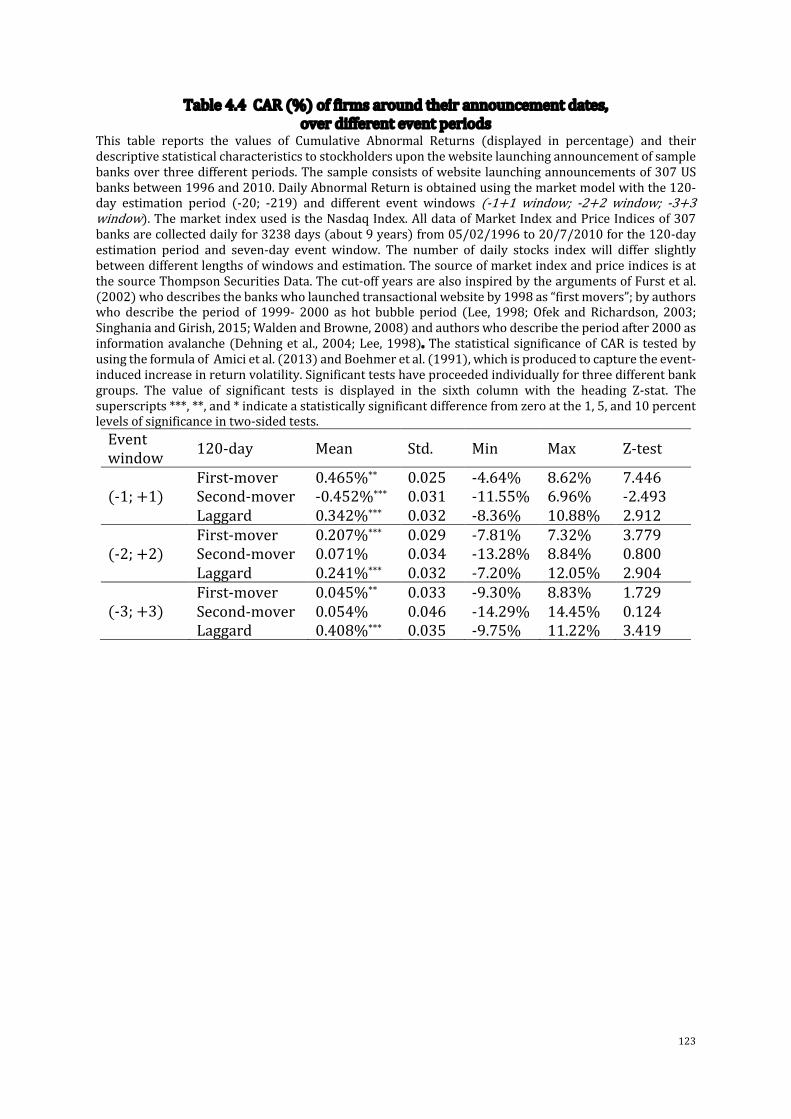
123
Table4.4CAR(%)offirmsaroundtheirannouncementdates,overdifferenteventperiods
This table reports the values of Cumulative Abnormal Returns (displayed in percentage) and theirdescriptivestatisticalcharacteristicstostockholdersuponthewebsitelaunchingannouncementofsamplebanksoverthreedifferentperiods.Thesampleconsistsofwebsitelaunchingannouncementsof307USbanksbetween1996and2010.DailyAbnormalReturnisobtainedusingthemarketmodelwiththe120-day estimation period (-20; -219) and different event windows (-1+1 window; -2+2 window; -3+3window).ThemarketindexusedistheNasdaqIndex.AlldataofMarketIndexandPriceIndicesof307banksarecollecteddailyfor3238days(about9years)from05/02/1996to20/7/2010forthe120-dayestimation period and seven-day event window. The number of daily stocks index will differ slightlybetweendifferentlengthsofwindowsandestimation.ThesourceofmarketindexandpriceindicesisatthesourceThompsonSecuritiesData.Thecut-offyearsarealsoinspiredbytheargumentsofFurstetal.(2002)whodescribesthebankswholaunchedtransactionalwebsiteby1998as“firstmovers”;byauthorswho describe the period of 1999- 2000 as hot bubble period (Lee, 1998; Ofek and Richardson, 2003;SinghaniaandGirish,2015;WaldenandBrowne,2008)andauthorswhodescribetheperiodafter2000asinformationavalanche(Dehningetal.,2004;Lee,1998).ThestatisticalsignificanceofCAR is testedbyusingtheformulaofAmicietal.(2013)andBoehmeretal.(1991),whichisproducedtocapturetheevent-inducedincreaseinreturnvolatility.Significanttestshaveproceededindividuallyforthreedifferentbankgroups. The value of significant tests is displayed in the sixth column with the heading Z-stat. Thesuperscripts***,**,and*indicateastatisticallysignificantdifferencefromzeroatthe1,5,and10percentlevelsofsignificanceintwo-sidedtests.Eventwindow 120-day Mean Std. Min Max Z-test
First-mover 0.465%** 0.025 -4.64% 8.62% 7.446(-1;+1) Second-mover -0.452%*** 0.031 -11.55% 6.96% -2.493 Laggard 0.342%*** 0.032 -8.36% 10.88% 2.912 First-mover 0.207%*** 0.029 -7.81% 7.32% 3.779(-2;+2) Second-mover 0.071% 0.034 -13.28% 8.84% 0.800 Laggard 0.241%*** 0.032 -7.20% 12.05% 2.904 First-mover 0.045%** 0.033 -9.30% 8.83% 1.729(-3;+3) Second-mover 0.054% 0.046 -14.29% 14.45% 0.124 Laggard 0.408%*** 0.035 -9.75% 11.22% 3.419
124
4.5 RobustnessTesting
4.5.1 Alternativeestimationperiods
Inthissection,twoalternativeestimationperiodsareapplied,whichare(-20,-219)and
(-20,-319),toestimatetheCARvaluesgainedbythewholesampleandbysub-samples
(sizeandtimingorders).The200-dayestimationand300-dayestimationhavealsobeen
usedbymanyauthors,especiallyintheITadoptiondiscipline(Imetal.,2001;Lohand
Venkatraman, 1992;Mei and Sun, 2007;Meng andLee, 2007; Peak et al., 2002). The
resultsconcerningCARvaluesof thewhole307-banksample, sizegroups,and timing
ordergroupsarepresentedinTableA.4.5andA.4.6intheAppendix,respectively.Put
shortly, theresultsusingalternateestimationperiodsarestronglyconsistentwiththe
criticaloutcomesreportedinTable4.2,Table4.3andTable4.4.Inwhich,theCARpoints
acrossthewholesamplearemostbuoyantandrobustwithinthreedaysandfivedaysin
the vicinity of transactional website events. The CAR points are more statistically
significantamongsub-samples.ThemoststableanddurableCARpointsareachievedby
thesmallest-scaledbanksandlaggards,whilepioneeringandmassive-scaledbanksget
holdofthemostimmediatefavourableCARpoints.
4.5.2 Alternativemarketindex
Intherobustnesssection,anequally-weightedUSbankingmarketindexhasbeenused
insteadofNasdaqportfolio.AccordingtoHaleblianetal.(2006)usingindustry-specific
benchmarkstomeasureabnormalreturnswouldeliminateextraneousnoiseresulting
fromcompaniesofotherindustries.
Toservethispurpose,firstly,thedailypricesandestimateddailyreturnsofallUSbanks
from5Feb1996to20Jul2010iscollectedviaThompsonReutersEikonplatform.Allthe
bankscollectedaretreatedasbenchmarkbanks.Afterwards,eachsamplebanki,willbeexcludedfromthebenchmarkbanks.Dailymarketreturns,accordingly,wereestimated
asequally-weighteddailyreturnsofallremainingbanksinthebenchmarkportfolioafter
excludingthetreatedbankfromtheportfolio.
NewresultsregardingCARvalueofthewholesample,sub-samplesdividedbysizeand
sub-samplesdividedbytimeofadoptionarepresentedinAppendix,TableA.4.7,A.4.8
andA.4.9,respectively.Ingeneral,thenewresultsusingthealternativemarketindexare
consistentwiththeoriginalfindingspresentedinTable4.2,4.3and4.4.Thefindingsthen
supporttheclaimofpreviouseconometriststhatthemetricusedtoestimateabnormal

125
returnintheshortrunislessrestrictiveandmorestraightforward.Eveninastatewhere
the risk factors (i.e., betas) have been stringently estimated, the error of calculating
abnormalreturnsisnegligiblewhentheyarebetween0.5%and1.0%(Konchitchkiand
O’Leary,2011).
4.6 Conclusion
Whathasbeeninvestigatedinthisstudyishowthemarketreactstothetransactional
website launch announcements of 307 banks in the US market from 1996 to 2010,
accordingly,indicatingthewealth-creatingcapabilityoftransactionalwebsiteinitiatives.
To the best of my knowledge, this is the first study that applies the market-based
approach indigitalbanking literaturewhichallowsthe testingofmarketreactionand
investorbehaviour.EfficientMarketHypothesisandrelevantempiricalworkshavebeen
sofarprovedthattheevaluationofmarketandinvestorsisquickasthought,accurate
and predative, therefore market-based approach can overcome some challenges of
accounting-basedmeasures.Furthermore,byverifyingifthereisanyvalueenhancement
in the market performance of financial institutions attributed to their transactional
website launch events, this chapter makes an original contribution in terms of
shareholder value perspective and digital information value which have not been
conclusivelyanalysedindigitalbankingliteraturesofar.Moreover,thischapterprovides
manuallycollectedexclusivedataofannouncementdatesofafulllistofavailablebanks
listedontheUSstockmarketsasofDecember2018.Therefore,thischapteristhefirstto
provide systematic evidence concerning the market value-enhancing capability of a
bankingdigitalinitiative,thetransactionalwebsiteadoption.Thischapterisalsothefirst
totakeintoaccountsomecriticalmoderatingeffects,includingthesizeeffectandtimingordereffect,whichaddsfurtherinsightintomarketandinvestorsbehaviourinthedigitalbankingdiscipline.Finally,anoriginalconceptualmodelisprovidedtobuildtheresearch
hypothesisonhowthetransactionalwebsites(andotherdigitaladoptions)mightcreate
marketvalueandhowtheinvestorsmightreacttosuchdigital-relatedevents.
4.6.1 SummaryofFindings
Overall,thischapterprovidesthefollowingfindings:
Firstly, transactionalwebsitespossessavalue-enhancingcapabilitythatawardsbanks
with cumulative excess returns at least over short time periods. In this manner, the
findingsstronglysupportnumerousstudiesadvocating themarket-basedapproach in
126
investigatingtheimpactofdigital-relatedactivitiesonorganizationalperformance,such
asintermsofdigitalinitiativesandM&A(SternalandSchiereck,2019);digital-relatedorganizationalmanagement (Drechsler et al., 2019); IT investment (Chatterjee et al.,
2001; Im et al., 2001; Li and Huang, 2012); technological transformation (Sears and
Hoetker,2014);e-commerce initiatives(Andoh-Baidooetal.,2012).ThepositiveCAR
valueswouldsuggesttwocrucialimplicationsconcerningtransactionalwebsites.Firstly,
investorsperceivetransactionalwebsiteeventstobevaluable,andthereforewealthis
created for shareholders. Secondly, the positive reaction from themarket has shown
expectationstowardsthevalue-enhancingpotentialoftransactionalwebsiteadoptionin
thefuture.
Secondly, the results show that banks of any size and at any time of adoption can
successfully enter the playing field. The adoption of transactional websites brings
significant positive excess returns to most types of banks. If interpreted from the
resource-based view perspective, all groups of banks have different resources and
capabilities,hencetheyarealllikelytoreceivepositiveevaluationsfromthemarket.For
example,ifthelarge-scalebankshaveadvantagesintermsofeconomicscaleandscope,
abundantresources,R&D, theirsmallerpeersappear tobe incrediblynimble, flexible,
opportunistic, and adept at significant innovation (Cohen and Klepper, 1996; Rosen,
1991;Vossen,1998).Likewise, if first-moverbankspotentiallyhavetheadvantagesof
reputation,customerawareness,marketshare(AlpertandKamins,1995;Chatterjeeand
Pacini,2002;Dehningetal.,2003;DosSantosandPeffers,1995; JarvenpaaandTodd,
1996;KalyanaramandUrban,1992;LiebermanandMontgomery,1988;LilienandYoon,
1990;Mascarenhas,1992a,1992b;Tufano,1989),thelater-comersstillgainthebenefits
offree-riders,learningbyobserving(Levinetal.,1992;Lieberman,1987;Liebermanand
Montgomery,1988;Utterback,1994).Theresultsthenfavourstudiesthatsupportthe
ideathatthemarketexpectsfirmswithdifferentsizesallbenefitfrominnovation(Neill
etal.,2001),and/orapositivereturnforlarge-scaledfirms(ChhaochhariaandGrinstein,
2007),smallfirms(Chaneyetal.,1991;Imetal.,2001;SternalandSchiereck,2019;Xia
etal.,2016), firstmovers(ChenandSu,2010;Lee,etal.,2000;ZantoutandChaganti,
1996;ZantoutandTsetsekos,1994)andlatecomers(Cooperetal.,2005;Cummingset
al.,2018;SarkaranddeJong,2006).
Itisalsoworthnotingthatthesizeeffectandtimingordereffectsignificantlydifferentiate
the excess earnings among banks surrounding their website-launch announcements.
127
Smallbanksandlatecomersseemtohavemoredurableandstableabnormalreturns.It
is also very likely that investors predict higher potentials from thewebsite-adoption
eventsofsmall-banksandlatecomers.Indeed,smallbankstendtolinkwithhighrisk-
adjusted returns (Banz, 1981; Reinganum and Smith, 1983) and they are widelyperceivedtobemoresuccessfulinmajorinnovations(CohenandKlepper,1996;Rosen,
1991). Concerning banks at a later stage, the findings also support the informationavalanche(Dehningetal.,2004;Lee,1998)whentheimpactofthetransactionalwebsiteismorevisible,leadingtomoreconfidencefrominvestorstoevaluate.Also,laggardsmay
beattractivetoinvestorsduetothepotentialbenefitsoflearningfromthesuccess/failure
of theprevious adopters, getting to leapfrog theprogress (Baldwin andChilds, 1969;
Drucker, 1985; Hege and Hennessy, 2010; Lieberman, 1987; Lieberman and
Montgomery, 1988;Utterback, 1994; Zach et al., 2020).At this point, the results also
supportauthorswhofoundhighermarketvalueaddedbylaggards(Cooperetal.,2005;
Cummingsetal.,2018;Leeetal.,2000;SarkaranddeJong,2006).
Lastly,theresultsshowthattheeconomicandmarketconditionsmayhaveabearingon
theextenttowhichtheinvestorsrespondtowebsite-launchevents.Morespecifically,the
results show the volatility in CAR values over the period of 1999-2000 which is
historically perceived as the period of the “dot-com bubble” (Lee, 1998; Ofek andRichardson,2003;SinghaniaandGirish,2015;WaldenandBrowne,2008).Therefore,it
isverylikelythattheinvestorsarereluctanttoinvestinwebsite-relatedportfoliosatthat
time as they aremore uncertain about the real state of theworld. The findings also
suggest that investors' confidencemight only really come back after 2001 when the
market has regained balance or/and information about the impact of transactional
website adoption has beenmore clearly reflected. The findings are then in linewith
authorswhosuggest(i) theunderreactionof investorstogoodnewsinthebadtimes
(Veronesi, 1999), (ii) themore significant uncertainty of investors during the highly
volatilemarket(DockingandKoch,2005),(iii)thedecreaseinCARvaluessurrounding
e-commerceandwebsite-relatedannouncementsintheperiodof1999-2000(Dehning
etal.,2004).
4.6.2 ManagerialImplications
Thischapterofferssomecriticalmanagerialimplicationsasfollows:

128
Firstly, this chapter provides authentication of the value-enhancing capability of
transactional website adoptions. As the information on transactional website launch
eventswasimmediatelycapitalizedinthestockprice,itissuggestedthattransactional
website adoption is valuable to a company. Banks should take advantage of this
evaluationandpredictionofthemarkettoanalysethepotentialoftransactionalwebsite
initiatives (e.g., it may strengthen the customer relationship, improve efficiency and
effectiveness,aswellassimulateinnovationsandcontinuousorganizational learning).
Asdiscussed,thereactionsofmarketparticipantscontainalotofinformationandina
forward-lookingmanner.Theprosperousnessofaninitiative,therefore,alsodependson
towhatextentmanagersunderstandthenatureoftheproblem.
Secondly, this investigation finds significant roles of the market and investors in
detecting,evaluating,andpredictingthevalueofastrategy/adoptionaddedtofirms.This
chapter recommends that managers should consider the financial behaviour of the
marketaswellasfactorsinfluencingmarketreactionsanddecisions.Byunderstanding
thenatureofthemarket,managerscangivethemostaccuratesignalstothemarket.
Thirdly,thefindingshighlighttheheterogeneityofthemarketacrossdifferentgroupsof
banks,dependingontheirsizeandthetimetheyhavelaunchedtransactionalwebsites.
Accordingly,whatisrecommendedisthatbanksshouldunderstandtheirorganizational
characteristicstogivetheclearestandmostaccuratesignalstoinvestors.Banksallhave
theirownuniqueadvantages;thus,itisofimportancethattheycomeupwiththemost
relevantandengaging signals to show their idiosyncratic competitiveadvantagesand
prospects. More significantly, in volatile stages when investor behaviour is more
sensitive,banksshouldgivethemostappropriateandtransparentsignalstobuildtrust
frominvestors.“Tomakerealmoneyinanevolvingmarket,youneedtoanalyzethekindofenvironmentthatsurroundsthenewcategory;toassessthecharacteranddepthofyourresources.Remember,onceyouhavegoneintothewater,youhavenochoicebuttoswim”(SuarezandLanzolla,2005,p.127).
4.6.3 LimitationsandDirectionsforFutureResearch
Thefindingsofthisstudyaresubjecttosomelimitationsasfollows.
Firstly, due to the constraints of data availability, only the launch of transactional
websites in unit analysis is applied. Although some critical implications of the
transactionalwebsiteinbankingdigitalizationhavebeenproposed,thisunitcouldnot
129
fully reflect the impact of digital transformation on the performance of financial
institutions. Inorder to facilitate further investigation into theeffectsofdigitalization
uponbanks,especiallybybothaccounting-basedandmarket-basedapproaches,more
availabilityofdatafordigital-relatedannouncementdatesisrequired.Itwouldalsobe
theperfectwaytoinvestigatetheconnectionsbetweentransactionalwebsitesandother
digitalinitiativestobetterreflecttheimpactofdigitalizationininfluencingthebanking
landscape.
Furthermore, the reliance on short-term examination hasmet the challenge from the
literatureonlong-runreturnanomalies.Thisviewpointarguesthatthestockpricedoes
notfullyandimmediatelyreflectthenewinformationintheshortrun,andthereexist
abnormal returns in the long term. For example, in the overreaction camp, there is a
growingbodyofstudiesfocusingonfindingevidencefor“anomalies”inlong-termpost-
eventreturns,suchasIPO(Carteretal.,1998;Levis,1993;Loughran,1993;Loughran
andRitter,1995;RajanandServaes,1997),SEOs(Jegadeesh,2000;LoughranandRitter,
1995; Smith, 1977; Spiess andAffleck-Graves, 1995). Therefore, the limitation of this
studyopensopportunitiesforfurtherinvestigationinthelongrunreactionofthemarket
towards transactional website launch announcements. The long-run response of the
market is also an ideal approach to observe if the transactional website adoption is
genuinelybeneficialforbanksinthelongterm.
Finally,duringtheexaminationofheterogeneityamongbankenterprisesattributedto
theirsizeandadoptiontime,thischapterhasnotdelvedintotheprinciplesbehindthose
differences.Thischapterdrawsinferencesonwhysmallbanksandlaggardsreapmore
stable and durable excess returns in comparison to their other rivals (e.g., due to
informationasymmetry,informationavalanche,uniqueadvantages).Nevertheless,itis
necessary to study further the underlying basis, which genuinely differentiates the
performanceamongbankinggroups.Afurtherlimitationofthischapteristhatitdidn’t
examine the impact of the book-to-market ratio on the abnormal returns. Following
BarberandLyon(1997b), it ispossible for futureresearch indigitalbank technology
adoptiontoexplorethisimpact.
130
5 Chapter5:DoestheAdoptionofTransactionalWebsitesImproveBanks’Financial
Performance?
5.1 Introduction
Previous studies have found that transactional website adoption can improve banks’
financialperformance,especiallyintermsofprofitabilityandefficiency(Al-Hawariand
Ward,2006;Cicirettietal.,2009;DeYoung,2005;Furstetal.,2002;GohandKauffman,
2015;MbamaandEzepue,2018;Momparleretal.,2013;Pignietal.,2002;Scottetal.,
2017; Sullivan, 2000; Xue et al., 2007). The literature also clarifies some particular
features of transactionalwebsite adoption, such as innovation (DeYoung et al., 2007;
Pigni et al., 2002), efficiency and effectiveness (Furst et al., 2002), diversification
(DeYoungetal.,2007;Pignietal.,2002).However,thosestudieshaveonlyfocusedon
theshort-to-mediumimpactoftransactionalwebsiteadoption,ratherthanitslong-term
impact,onbanks’financialperformance.Fromwhich,thestrategicroleoftransactional
websiteadoptioninthelongrunalsohavenotbeenvalidated.
Meanwhile,many studies in other disciplines state that it takes time to conclude the
rewards of a business practice added to firms’ performance (Brynjolfsson, 1991;
Brynjolfsson andHitt, 1996; Campbell, 2012; DeLong and DeYoung, 2007; Hitt et al.,
2002;KohliandDevaraj,2003;ThanosandPapadakis,2012).Theresource-basedview
also argues that “The short-termwindow is easily faded away" and the profitability,growth, and survival of firms depend on how they establish “relatively impregnable”basestoadaptandextendtheiroperations inanuncertain,changing,andcompetitive
world inthe longrun(Penrose,1955,p.121,2009).Therefore, it isalso importantto
considerthestrategicroleofabusinesspracticebyvalidatingifthisactivitycanprotect
theadvantagesandsustainablebenefitsofbusinessesovertime(Peteraf,1993;Rumelt
andLamb,1997;Wernerfelt,1984).Nevertheless, as the studies inbanking literature
tendtofocusontheshortandmediumtermoftransactionalwebsiteadoption,systematic
evidenceonthestrategicroleoftransactionalwebsiteadoptioninprotectingthebank's
financialbenefitsinthelongtermisstillscarceandunclear.
Toshedlightonthenewvalueoftransactionalwebsitesthathasnotbeenclarifiedinthe
literature,thischapteraimstoaddressthecentralquestion:
“Does the transactional website strategically deliver value to a bank’s financialperformanceovertime?Ifthatisthecase,wheredoesthevaluecomefrom?”

131
Surrounding thecentral researchquestion thereare threemain themes in thisstudy.
Firstly, thischapteraimstoexaminetheexistenceofanysignificantvaluetoabank's
financialperformancedirectlyaddedby thepresenceof transactionalwebsites in the
long run. This objective is the basis for making findings on three features of the
transactional website: value, appropriability, and durability. Secondly, this chapter
considersiftheadoptionoftransactionalwebsitesiscapableofpreservingthevalueand
thecompetitiveadvantageofbanks in the longterm.Followingthat, thischapterwill
examinetowhatextentfinancialperformancehaschanged,whichiscausedseparately
by: i) Cumulative transactional website experiences; ii) The combinative capability
between transactional website adoption and mobile website adoption; and iii) The
"learning-by-observing"behaviour.Finally,thischapteraimstofindoutifthereexists
anyheterogeneityamongenterprisesbasedontheirassetscaleandtheeventtime.If
inter-heterogeneity does exist, the ability to create a distinct competitive advantage
amongbusinessgroupsoftransactionalwebsiteadoptionwillbereinforced.
This chapter utilises the transactionalwebsite adoption of 307 listedUS commercial
banksoverthe1993-2018period(seeChapter3).Theyear1993marksthethree-year
ex-antestageofbanksthathaveactivatedwebsitesearliest in1996.2018isthemost
recenttimetheaccountingdataoftheUSbanksisupdatedintheFDICplatform.Inorder
to test the attributes of value and appropriability of transactional website adoption,
accounting-based measures and regression analysis have been employed. Seven
accountingmetrics,representingprofitabilityandefficiency,havebeentestedtoseeif
theyaresignificantlyimpactedbythetransactionalwebsiteadoption.Inthenextstep,
three separate proxies have been created, in turn, representing the attributes of
embeddedness,interconnectedness,andimitation.Theseproxieswillbedefinedinmore
detailinthemethodologysection.Notably,theseconddataforthisstageisthemobile
websiteadoptionwhichwasgeneratedtogaugethecombinativecapabilitybetweenit
andtransactionalwebsiteadoption.
Tothebestofmyknowledge,thischapterprovidesthefollowingcontributions.Firstly,
intermsofdata,thischapterprovidesoriginaldataonthetimetransactionalwebsites
werelaunchedbyfullylistedUScommercialbanks.Therefore,thisisthefirststudyto
providesystematicevidenceofhowthefinancialperformanceoflistedbanksintheUS
markethasbeenimpactedbytheirtransactionalwebsiteadoption.
132
Secondly,intermsofthetheoreticalframework,forthefirsttimeinthedigitalbanking
discipline, the resource-based view has been applied in terms of both an analytic
perspectiveandempiricalexamination.Morespecifically,resource-basedtheoristshave
pointed out that the underlying basis of corporations' prosperity and sustainability
comesfromstrategicresourcesandcapabilities.Theseresourcesandcapabilitiesneedto
satisfytwoconditionsintwophases:
(i) Stageone:Generatingcompetitiveadvantageandsuperiorperformance.
(ii) Stagetwo:Limitingcompetitionandprotectingvaluecreatedduringstageone.
Thisfoundationopensanovelapproachindigitalbankingliteraturetostudytheroleand
strategicvalueofdigitaladoption.Thisisthefirststudythatappliesthisbasistosetup
the hypotheses and construct empirical examinations concerning the impact of
transactionalwebsiteinitiatives.
Thirdly,intermsofresearchmethodology,atleastwithintheframeworkofthedigital
bankingdiscipline,Iwouldliketoarguetwomoreoutstandingfeaturesofaccounting
measures. Accounting measures are seemingly unable to reflect explicitly invisible
value, as argued by some studies.33 Moreover, authors of the event-based approach
rarely use accounting measures as a reliable method of validating how the market
reactsandpredicts in the short term. In this chapter, apart from theexaminationof
transactionalwebsites,Ialsoapplythismethodtocompareandvalidatethepredictions
andevaluationofthemarket(aswhatwasfoundinChapter4aboutmarketreactions
totransactionalwebsiteeventsovershort-termwindows).Thefindingsinthischapter
willclarifytheseviews,withthedesiretosomehowinspirefurthersynthesisbetween
theaccounting-basedapproachandmarket-basedapproachindigitalbankingstudies.
Fourthly,intermsofmainfindings,transactionalwebsiteadoptionisproventoprovide
newvalue,whichhasnotbeencoveredbeforeinpreviousliterature.Thefindingsreveal
that transactionalwebsitevaluedoesnotstopat twostandard features:profitability
andefficiencyovertheshortandmedium-term,asprovedbypreviousstudies.Further
tothis,transactionalwebsitescanretainvalueandlimitcompetitionfromothersover
33Forexample,ItamiandRoehl(1991)pointoutthattherearesomeintangibleassetsarelessreadilyandhardly tomeasureespeciallysome incrementalvaluesaddedtoemployee’sskillsandknowledge.Theyargue that it is hard to reflect in financial statements some intangible assets, such as the enhancingexperienceofcustomerservicedepartmentafterdealingwithabundleofnon-standardizedproblemsofcustomers.
133
thelong-term.Thesefindingsthenareoriginalinclaimingthattransactionalwebsite
adoptionisstrategicallyvaluableandsustainableforthelong-termwealthofbanks.
Finally, the transition between two digital adoptions and the existence of their
combinative capability has been shown for the first time. Previous studies have
examinedtheresearchontherelationshipbetweenthebranchandInternetbankingor
between ATM and Internet banking. Nevertheless, there are no studies that set the
activationoftransactionalwebsitesasastartingpoint.Forthefirsttime,inthischapter,
the adoptionof the transactionalwebsite is treated as a newpoint of departure for
analysingthetransformationanddevelopmentofdigitalbanking.
Theremainderofthischapterisorganizedasfollows.Thefirstsectionprovidesabrief
outlinepertainingtosomerelevanttheoreticalperspectivesandempiricalfindings.This
section is followed by research methodology, data collection design, description,
empirical findings,anddiscussions.The lastpart is theconclusion,which includesthe
summary of findings, discussions of theoretical andmanagerial implications, and the
directionsforfurtherresearch.
5.2 LiteratureReview
5.2.1 Theaccounting-basedapproachanditssuperiority
The firstadvantageof theaccountingmethod is that itallowsresearchers toconsider
organizationalperformanceinmultipleaspects.Asanillustration,someofthepreferred
accounting ratios are profitability ratios (e.g., ROA, ROE), efficiency ratios (e.g., non-interestexpensesbynet income),and leverageratios (e.g., totaldebtdividedby totalassets).Itcouldbeviewedthatsuchratioshavespecifiedinterpretationsregardingfirms’
performance. Therefore, the application of accounting methods allows a remarkably
diverseandextensiveviewoforganizationalhealth,efficiencylevel,profitability,aswell
as the performance of particular business activities. With this advantage from
accounting-based measures, many researchers have applied a series of financial
indicatorstostudythefirm'sperformanceconcerningM&A(Huian,2012;Mat-Noretal.,
2006;SinghandZollo,1999),ITadoption(Dehningetal.,2007;GalyandSauceda,2014;
Lunardietal.,2014;Maslietal.,2011;Wangetal.,2018),environmentalperformance
(Haninunetal.,2018;Songetal.,2017;Sudha,2020;Trinksetal.,2020)andsoforth.
Secondly,anothersuperiorityoftheaccountingapproachisthatitgivespermissionto
long-termcorporateperformancetracking.Agoodnumberofstudieshavearguedthat

134
someactivities,especiallythosewithhighlycomplexstructuresorsynergies,requirea
sufficient length of time for the value of such activities to be thoroughly reflected
(Brynjolfsson,1991;BrynjolfssonandHitt,1996;Campbell,2012;DeLongandDeYoung,
2007;Hittetal.,2002;KohliandDevaraj,2003;ThanosandPapadakis,2012).34Thus,the
accountingapproachisanappropriatewaytoinvestigatetheactualinfluenceofbusiness
practices on organizational performance over the long term. Some long-term time
intervalsempiricallyexecutedbypreviousstudiesare3-5years(DeLongandDeYoung,
2007;HsuandJang,2007;Huntonetal.,2003),6-8years(Hopkins,1987;Schneideret
al., 2003; Wardhani, 2019), 10 years or over (Quah and Young, 2005; Rhyne, 1986;
Simmonds,1990;VithessonthiandRacela,2016).
Finally, thethirdmeritoftheaccountingmethodisthat itenablesacomparisontobe
drawnbetweencurrentperformanceandpreviousrecordsofenterprises.Bycomparing
theperformancebeforeandafteranactivityhasbeensetinmotion,theresearchersare
abletotracktheaddedvalueofsuchactivitiestotheenterprise.Besidesthis,thescholars
alsoput theaccountingmethod intopractice to facilitate thecomparisonbetweenthe
firm's performance and similar non-event competitors. This advantageousness of the
accountingmethodhasbeentakenbymanyresearcherstoclarifythevalue-enhancing
capability of innovation (Clarkson et al., 2011; Putri et al., 2019), managerial
improvements (GalyandSauceda,2014;Nicolaou,2004;Songetal.,2017), initiatives
(Lunardietal.,2014;Maslietal.,2011)andsoforth.
5.2.2 Theaccounting-basedapproachindigitalbankingliterature
Theaccounting-basedapproachhasbeenfeaturedinmanydisciplines,andthebankingindustry isnoexception.Broadlyspeaking, theaccountingapproachhasbeenapplied
commonly in the banking sector, for example in terms such as corporate governance
(Basuony et al., 2014; Fanta et al., 2013; Simpson and Kohers, 2002), environmental
management (Finger et al., 2018). Thismethod, in general, has a great deal of use in
evaluating the benefits of business practices added to returns, non-interest activities
(Goddardetal.,2008),efficiency(Akhigbe,2002;Boninetal.,2005),andsoforth.
34Forexample,someactivitiesarguedtotakealongtimetotracktheirinfluenceareM&Aactivities(Thanosand Papadakis, 2012), IT adoption (Brynjolfsson and Hitt, 1996), R&D investment (Vithessonthi andRacela,2016).
135
The digital banking literature also shows a preference for accounting methods in
analysing the influenceof digital adoptions, such as in termsof Internet banking (Al-
Hawari andWard, 2006; Ciciretti et al., 2009; DeYoung, 2001; DeYoung et al., 2004;
DeYoung,2005;DeYoungetal.,2007;Eglandetal.,1998;Furstetal.,2000a,2002;Gutu,
2014; Pigni et al., 2002; Sullivan, 2000; Sullivan and Wang, 2013), digital banking
(MbamaandEzepue,2018),digitalinnovation(Scottetal.,2017).
Ingeneral,oneofthemostoutstandingcontributionsofdigitalbankingliteraturewhen
it comes to the accounting approach is that it provides evidence of actual banking
performancerelevanttotheadoptionofdigitalinitiatives.Suchevidencesuggeststhat
theenthusiasticembraceofdigitalizationbringsbenefitstobanksthemselves,suchas
offeringthemnewbusinessgrowthopportunities,improvingoperatingactivitiesaswell
aselevatingthecustomerexperiencetoanewlevelwithahighlydiversifiedengagement
andlowercostoftransactions.Oneofthemostsignificantchallengesisoperatingcosts
asbankswillhavetopaymorefornewinstallationcostsor/andsalariesforhigh-tech
staff.Besidesthis,theemergenceofhybridmodelscombiningonline,andofflinedelivery
channelssuggeststhatbanksmustcovernewmanagementcosts.
5.2.3 LiteratureGaps
5.2.3.1 Thelackofanupdateonthetimeperiodofresearchandsampling
Firstly,moststudieslookattheimpactofdigitaladoptiononbanks’performanceover
short-termormedium-termintervals.Morepointedly,standardwindowsthathavebeen
applied are one year (Furst et al., 2002; Sullivan, 2000), three years (DeYoung et al.,
2007),fouryears(DeYoung,2005),fiveyears(Delgadoetal.,2007).Asmallnumberof
other studies have investigated the relationship between digital adoption and banks’
performanceoverthelongterm(Cicirettietal.,2009;Momparleretal.,2013;Scottetal.,
2017)butthosestudiesalsohavesomelimitationsintermsofdatasamplingandtime
periodupdates.35Momparleretal. (2013)study Internetbankingover thenineyears
from 2002 to 2010 but with a modest amount of data sampled (22 US financial
institutions)whichmaynotbeenoughtomakeasystematicconclusionabouttheeffects
ofdigitaladoption.TheresearchperiodofHernandoandNieto(2007)isnineyearsfrom
35PleasealsorefertoChapter6,Section6.2.1,andTable6.1forfurtherliteraturereviewontheimpactofdigitaladoptionsonbanks’performance.

136
1994 to 2002 for 72 Spanish banks whereas Ciciretti et al. (2009) examine the
performanceof105InternetbanksinItalyduringa10-yearintervalfrom1993to2002.
However,bothstudyresearchtimesareintheinitialstagesoftheInternetrevolution,
whichtherebyleadstoalackofmonitoringofthevalueofInternetbankinginlaterstages.
It isthesamesituationforthestudyofScottetal.(2017)whichstudiestheimpactof
network-based technological infrastructure on banks’ performance. In that study,
althoughtheexaminationperiodisextended(from1977to2006)andappliedwidelyfor
29countries,theendpointofthestudyperiodis2006,whichisrelativelyfarfromthe
presenttime.
Asdiscussedpreviously,manystudiesbelievethatitrequiresalongtimetoconcludethe
rewards of a business practice added to firms’ performance (Brynjolfsson, 1991;
Brynjolfsson andHitt, 1996; Campbell, 2012; DeLong and DeYoung, 2007; Hitt et al.,
2002;KohliandDevaraj,2003;ThanosandPapadakis,2012).Accordingtotheresource-
basedview,anactivitythatisconsideredstrategicisnotonlyabouthowmanyshort-term
benefitsitdeliverstofirmsbutalsoaboutwhethersuchactivitiesprotecttheadvantages
andsustainablebenefitsofbusinessesovertime(Peteraf,1993;RumeltandLamb,1997;
Wernerfelt, 1984).36 Therefore, a systematic and up-to-date empirical examination is
essential to provide evidence of the long-term impact of a technological initiative on
organizationalperformance.
5.2.3.2 The lack of evidence in clarifying the strategic role of transactional websiteadoption.
MoststudiesfocusontheinitialperiodofInternetbankinganddonotpreciselystatethe
strategic role of transactional website adoption. More specifically, previous studies
considerthetransactionalwebsiteasanadditionalchannelthatcomplementstraditional
branching channels (Ciciretti et al., 2009) rather than a strategic banking delivery
channel.Severalotherstudiesfocusonsomeparticularfeaturesoftransactionalwebsite
adoption, suchas innovation (DeYounget al., 2007;Pigni et al., 2002), efficiencyand
effectiveness(Furstetal.,2002),diversification(DeYoungetal.,2007;Pignietal.,2002).
36Morespecially,asdiscussedpreviously,Peteraf (1993)describesvalue in theex-antestageasbeingtemporary,precarious,andeasytofleetawayduetothepotentialexistenceofimitationandsubstitutionfromotherrivals.Resourcesandcapabilitiesmustbecapableofpreservingvalueandprotectingafirmfromcompetitiveimitationorresourcesubstitutionoverthelongrun.

137
Tothebestofmyknowledge,theliteraturesofarhasnotdelvedintothestrategicrole
oftransactionalwebsiteadoptionviaitsspecifiedattributes,suchasvalue,durability,andidiosyncrasyoverthelongterm.37Meanwhile,assuggestedbytheresource-basedview,suchattributesaretherootofafirm’ssustainableoutstandingperformanceover
thelongrun.
5.2.3.3 Thelackofconsiderationintotransactionalwebsiteadoptioninthecontextofdigitalization
The adoption of transactionalwebsites has been in progress formore than 20 years
(since 1996). That makes many scholars focus on the adoption of the transactional
websiteinthepreliminarystagesofInternetbankingorconsideritasacomplementary
channel.Besidesthis,banksarenowembracingmassivedigitaldisruptions(Siaetal.,
2016),multi-channelintegrationaswellasdigitalproductsandservicesdiversification
(Carbó-Valverdeetal.,2020).Onthataccount,theimpactofthetransactionalwebsiteis
nolongerpaidattentionto.Tomyknowledge,veryfewresearchpapersputtransactional
websiteactivationinthebankingdigitalizationcontext.
As the transactional website enablement involves both digital disruption and digital
transformation, it would be a milestone in banking digitalization. The influence of
transactionalwebsiteinitiativesdoesnotstopattheinitialstagesofInternetbanking.
Instead,theestablishmentoftransactionalwebsitesendowsbankswiththegrass-roots
foundation of ongoing digital resources and capabilities which have the capacity of
interconnectedness. In the long term, the transactionalwebsite couldofferbanks the
ability to optimize other digital strategies, cohering them into further digital
transformationandinnovation.Accordingly,consideringtheadoptionoftransactional
websites separatelyoronly in thepreliminarystagesof Internetbankingmay ignore
manyofitsstrategicfeaturesandcapabilitiesinthedigitalbankingroadmap.
Giventhesegapsintheliterature,thischapterwillbethefirstto:
(i) Providethelatestupdatesontheimpactoftransactionalwebsiteadoptiononbankingperformanceinthelongterm.
(ii) Confirmthatthefinancialvaluedeliveredbytransactionalwebsiteadoptionisstrategicandsustainable.
37PleaserefertoTable2.1forthedefinitionandexamplesoftheseattributes.

138
(iii) Provide some features and mechanisms that make transactional websiteadoptionstrategicandsustainable.
(iv) Testify the combined capabilities of transactional website adoption withanotherdigitaldisruptioninthedigitaltransformationcontext.
(v) Bearwitnesstotheexistenceofinter-firmheterogeneity,attributedtothesizeeffectandtimingordereffect.

139
5.3 HypothesesProposal
5.3.1 TheFeaturesofValue,AppropriabilityandDurability inTransactionalWebsite
Adoption
Thishypothesisproposesthattransactionalwebsiteadoptionhasapositiveimpacton
banks’financialperformanceinthelongrun.Resultingfromthat,threecriticalfeatures
oftransactionalwebsiteadoptioncanbeverified,whicharevalue,appropriability,anddurability.Valueandappropriability,onthebasisofquiteanumberofresource-basedviewtheoristsandempiricaladvocators,arefundamentalforfirmstoenhanceefficiency
(Barney, 1991) as well as capture sustained profit (Collis and Montgomery, 1995).
Meanwhile, durability is the ability by which a business can retain its competitive
advantageandvalueovertime(BlackandBoal,1994;Dagnino,1996;Grant,1991b).Re-
affirmed in recent empirical studies, digital adoption is found to be valuable and
appropriateasitispositivelylinkedwithafirm'ssuperiorperformance,e.g.,customer
service performance (Rai et al., 2006; Setia et al., 2013), operational efficiency, and
effectiveness(Raietal.,2006),financialperformance(Alexandruetal.,2019;Homburg
et al., 2019;Mbama andEzepue, 2018),market return performance (McAlister et al.,
2012).
In termof thebankingdiscipline, the literaturehasshown that the launchofbanking
digital initiatives significantly improves banks performance, especially in terms of (i)
customer outcomes (Ahmad andAl-Zu’bi, 2011; Campbell and Frei, 2010;Dabholkar,
1996;FirdousandFarooqi,2017;HittandFrei,2002;MannandSahni,2011;Mbamaand
Ezepue,2018;Xuetal.,2013;Xueetal.,2011);(ii)profitabilityandefficiency(Al-Hawari
andWard,2006;Cicirettietal.,2009;Delgadoetal.,2007;DeYoung,2005;DeYounget
al.,2007;Furstetal.,2002;GohandKauffman,2015;HernandoandNieto,2007;Mbama
andEzepue,2018;Momparleretal.,2013;Pignietal.,2002;Scottetal.,2017;Sullivan,
2000;Xueetal.,2007).
Suchevidencefromtheliteraturesuggeststhattheenablementofatransactionalwebsite
significantlyrewardsbankswithsuperiorfinancialperformance,especiallyintermsof
profitability and efficiency. As discussed in detail previously, transactional website
adoption(i)haschangedthefaceofthebank-clientrelationshipand(ii)enablesbanks
to capture new value by diversifying their revenue streams via a broader range of

140
servicesofferedbothofflineandonline channels.38Therefore, thishypothesis expects
that:
Hypothesis 5.1: The long-term impact of transactional website adoption on banks’financialperformance
Transactionalwebsite adoptionpositively impacts the financialperformanceofbanksovertime.
5.3.2 The Features of Embeddedness, Interconnectedness, and Inimitability of
TransactionalWebsiteAdoption
5.3.2.1 TheFeatureofEmbeddedness
Thetermembeddednessisusedtodescribethecompetencies,skills,andhabitsthatare
deeply ingrained into intra-firm relationships and knowledge base of the firms,
influences how the firms operate and become a starting point for new knowledge-
creationprocesses(KogutandZander,1992;RumeltandLamb,1984).Somewell-known
resourcesandcapabilitieswhichpossesstheembeddednessfeaturearetacitknowledgeandcumulativeexperiencesandpractices(Grant,1991a;Hart,1995; ItamiandRoehl,1991; Nielsen, 2005; Polanyi, 1966). In terms of Information and CommunicationTechnology (ITC) and digital adoption particularly, authors also point out some
resourcesthatareembeddedintofirmsasanintegralpartofsystemsovertime,suchas
humanresources,businessresources,technologyresources,expertise,knowledge,andsolutions(Bharadwaj,2000;Bietal.,2014;Lin,2007;Popaetal.,2018;PowellandDent-
Micallef,1997;Setiaetal.,2011).
According to theorists of the resource-based view, embeddedness is perceived as an
isolating mechanism of “time compression diseconomies” that limits competition
(Rumelt,1984).Moreconcretely,theembeddednessofresourcesandcapabilitiescreates
complexity foreachorganizationwhich is tough forother firms to imitateor transfer
betweenfirms(Barney,1991;GrewalandSlotegraaf,2007;Hsuehetal.,2010;Reedand
DeFillippi,1990).
38PleaserefertoSection2.3forfurtherdetailsaboutthevalueoftransactionalwebsiteandotherinitiativesaddvaluetocustomers.
141
Concerningtheimpactofembeddednessoncorporateperformance,anumberofstudies
have proved that embeddedness improves efficiency (Gieskes and Heijden, 2004),simulate innovation (Dasgupta and Gupta, 2009), determines competitiveness andsustainabledevelopment (Dayasindhu,2002;Hart,1995). In thedisciplineof ITCand
digital adoption, embeddedness is the determinant of inter-diffusion (Andrews et al.,
2018).Furthermore,itcanalsocreatevalue(Lin,2007),enhanceeffectivegovernance
structure and stakeholder commitment (Setia et al., 2011), and explain significant
performancevarianceamongfirms(PowellandDent-Micallef,1997).
5.3.2.2 TheInterconnectednessofTransactionalWebsiteAdoption
Theinterconnectednessofresources/capabilitiesisunderstoodasalimittocompetition.
(Barney,1991;BlackandBoal,1994;DierickxandCool,1989;Hart,1995;Winter,1995).
ItisclaimedbyWinter(1995,p.14)that"thevalueofidiosyncraticresourcestothefirm-- i.e., thepresentvalueof their futurerentstreamsareaffectedby the fact that theirpossibleusesincludethedevelopmentofmoreidiosyncraticresources".Theimplicationisthattheinterconnectednessamongspecificresourceswithinfirmsoffersanadditional
advantage:an increase in structural complexityandambiguouscausality in the firm's
performanceduetothedevelopmentofnewsetsofresourcesandcapabilities(Kuncand
Morecroft,2010).Bythismeans,theinterconnectednessofresourcesisdeemedasan
isolating mechanism to protect the firm's rents from unfavourable imitation or
substitutability of others (Barney, 1991; Grant, 1991b). “Resources may potentiallyimpacthigheronfirmsuccesswhenexaminedaspartofaninterconnectedsystemratherthan when examined individually” (Galbreath, 2005, p. 985). Furthermore,interconnectedness is also incorporated into the creativemanner,which isoneof the
organizationalstrategicmannerismssuggestedbytheoriststooptimizefirms’strategies
and limit competition. More precisely, the creative manner is a procedure in which
resourcesare interconnected inanovelway,andnewactivitiesare initiated(Winter,
1995).
RegardingthedisciplineofdigitalandITCadoption,empiricalscholarshaveprovedthat
the interconnectednessofresources/capabilities is therootof innovation(Chouetal.,
2017;OliveiraandMartins,2011)andfirms’performance(CohenandOlsen,2013;Lin,
2007). Besides this, some other authors also point out the benefits arising when
resources are brought together and mutually supported, such as added-value
142
information system (Ruivo et al., 2014), competitive sustainability (April, 2004),
enhancedcustomerserviceoutcomes(PowellandDent-Micallef,1997).Significantly,the
intersectionamongresourcesandcapabilitiesisdescribedbyKogutandZander(1992,
p.391)as“technologicalopportunity”.
5.3.2.3 TheFeatureofInimitability
Definedbytheorists,theresources/capabilitiesofafirmareatlowimitabilityiftheyare
notpossessedorobtainedperfectlybyothers(DierickxandCool,1989).Somespecial
mechanisms which make resources/capabilities inimitable are unique historicalconditionsandidiosyncraticfeaturesoffirms(Barney,1991;Porter,1981;SchererandRoss, 1990), ambiguous causality between resources/capabilities owned by firms(Barney, 1986a; Dierickx and Cool, 1989; Lippman and Rumelt, 1982; Reed and
DeFillippi, 1990; Rumelt and Lamb, 1997), social complexities (e.g. interpersonalrelations, brand reputation, idiosyncratic culture) (Barney, 1986a; Dierickx and Cool,
1989)39.
Inthelongrun,profitability,growth,andsurvivalarecontingentoniffirmscanestablish
thecomparatively immunecapability tohelp thempreserve theireconomicrentsandcompetitive edge (Penrose, 1955, 2009). In order to accomplish these aims,
resources/capabilitiesareaskedtobeundetectable,equivocal, time-consuming,costly
forotherfirmswhodonotpossessthoseresourcestogettothebottomoftheirnature,
duplicatesimilaronesandreapthesamebenefits.
Following in the footsteps of theorists, scholars of digital and ITC disciplines have
clarifiedarespectablenumberofresources/capabilitiesthatarehardtobeobservedand
imitated, such as knowledge (Bloodgood and Salisbury, 2001), IT integration, causal
ambiguity(Ohetal.,2007),corecompetencies,complementaryresources(Arslanand
Ozturan,2011),ITpartnerships(Tianetal.,2010).Theseresourcesandcapabilitiesare
detected to strengthen firms’ competitive advantages (Oh et al., 2007), bring on
profitabilityandsuperiorperformance(ArslanandOzturan,2011;Dibrelletal.,2008;
Tianetal.,2010).
39PleaserefertoChapter2,Section2.1.3-AttributesofStrategicResourcesforfurtherdetails.
143
5.3.2.4 The Attributes of Embeddedness, Interconnectedness, and Inimitability ofTransactionalwebsiteAdoption
Firstly,thishypothesisexpectsthattransactionalwebsiteadoptionendowsbankswith
tacitanduniqueexperiencesthatarecumulatedandembeddedinbanksoveryears.For
example, during dealing with transactional website adoption, banks have their own
experiences concerning their leadership, customers, partnerships, employees, or the
market.Basedonthat,theycansetuptheirownstandardcriteriafortheirorganizational
mannerisms,strategicpartnerships,customerperceptions,customertastes,thespeeds
ofmarket turbulence, digital trends, digital problems, solutions, et cetera. Over time,
theseexperienceswouldenrichbanks’digital-relatedknowledge,solutions,competence,
andflexibilitytooptimizetheirdigitalbusinessstrategy,eventuallyincorporatingthem
toproducesuperiorfinancialperformance.
Secondly, this hypothesis suggests that the establishment of transactional websites
favoursbankswithdigitalresourcesandcapabilitieswhichhavethecapacitytobecross-
connected and supplementary. For example, the transactionalwebsite could promote
otherdigital initiatives toenhance thecapabilityofdiscoveringandexploitingdigital-
relatedopportunities(e.g.,awarenessofcustomertrends,newscientificdiscovery,the
optimalproductdesign,optimizationof functionalitycost,andreliability).Asa result,
banks are far better at understanding the nature and commercial potential of digital
adoption,predicting turbulence from themarket, improving customer servicequality,
stimulating continuous innovation, generating new knowledge, and exploiting the
unexplored potential of the technology. In the end, superior financial performance is
expected from the interconnectedness of transactionalwebsite adoption and another
adoption.
Finally,itisastrongpossibilitythattheadoptionofthetransactionalwebsiteproduces
uniqueresourcesandcapabilities,whichare invisibleandambiguous foranyexternal
observation and imitation. Some potential mechanisms could be (i) the distinctive
experiencesofindividualbanksresultingfromprovidingservicestotheircustomers,(ii)
cognitive solutionsproposedbydepartments, (iii) the learningbydoingprocess, (iv)
embeddedtacitdigital-relatedknowledge.Besidesthis,inthelongterm,theadoptionof
thetransactionalwebsitecreatesambiguouscausalityduetothecomplexityofintegrated
infrastructure, unique digital knowledge, strategic partnerships, idiosyncratic culture,
and personnel. All the above cases could create inconspicuousness, complexity, and

144
differentiation,whichtherebymakeithardforopponentstocaptureandgainthebenefits
entirely.
Hypothesis5.2:TheFeaturesofEmbeddedness,Interconnectedness,andInimitabilityofTransactionalWebsiteAdoption
Overtime,transactionalwebsiteadoptionpositivelyimpactsthefinancialperformanceofbanksduetotheattributesofembeddedness,interconnectedness,andinimitability.
5.3.3 Inter-FirmHeterogeneityduetotheSizeEffect
Regarding banking literature, there have been several comparisons of performance
amongbanksofvariedsizeswhentheyadoptdigitalinitiatives(Furstetal.,2000b,2002;
Sullivan,2000;SullivanandWang,2013).Inmoredetail,SullivanandWang(2013)claim
thatlargebankstendtoenjoyacostadvantagewhenadoptingdigitalinitiatives.Furstet
al. (2000b, 2002) find that non-interest expenses arehigher for small Internet banks
(under$100millioninassets),comparedtonon-Internetbanks.However,littleemphasis
isplacedonthe influenceof thesizeeffectonthestrengthofdigitaladoptionandthe
long-termperformanceofbanks.
Thepredictionconcerningtheinfluenceofthesizeeffectisbasedonseveralstudiesthat
suggest thatmoresubstantial returnsandhighergrowthopportunitiesareassociated
withsmallersize firms.Firstly, fromthestandpointof resourcesandcapabilities, it is
likely that small banks gain better value from the website adoption due to (i) their
dynamicandabsorptivecapability,(ii)theirlesssophisticatedorganizationalstructures,
and(iii)theirmoreopportunisticbehaviour.Tobemorespecific,previousstudiesprove
thatsmallbanksarenimbler,lesshierarchal,andmakedecisionsmorequickly(Chenand
Hambrick,1995;Deanetal.,1998).Therefore,itissuggestedthatsmall-scalefirmstend
toreactmorequicklytonewopportunitiesaswellasaremoreadaptivetotherapidpace
ofmarketchange(CarsonandMcCartan-Quinn,1995;ChenandHambrick,1995);are
closertocustomersandcansuccessfullydeepentheircustomercontacts(Meziou,1991);
aremore efficient in operation and communication (Hamilton et al., 2009); aremore
proficient at exploiting knowledge spill-overs than larger businesses (MacPherson,
1998).
145
Furthermore,assmallbankshavemorelimitedresourcesandcapabilities,theyhavea
propensity to position themselves differently from their larger rivals to grab new
opportunitiesfromnichemarkets(Deanetal.,1998).Forexample,RegehrandSengupta
(2016)statethatsmallbankstendtotargetmoreremotegeographicareas.Therefore,
smallbankscanaccessuniqueinformationthatfacilitatestheminsettingbettercontract
terms and making better decisions in credit underwriting. Not only that, but some
authorsalsoarguethatsmallbanksaremoreaggressivethanbigbanksin lookingfor
opportunities.“Theyhaveagreaterneedthantheirlargerrivalstoactaggressivelyinthemarketandchallengethestatusquobyinitiatingcompetitiveactions”stressedChenandHambrick (1995, p. 459). As a result, such competitive actions and responses should
matter to the performance of small banks, as in line with some theorists (Chen and
Hambrick,1995;Smithetal.,1991).
OnequestiontoconsideriswhethersmallbankscanaffordtoinvestinInternetbanking
tosatisfytheirambitiousstrategies(e.g.,targetingmoreremotegeographicareas).For
example,whenexamining the impactof transactionalwebsitebankingon community
banks,DeYoungetal.(2007)findasignificantincreaseinbankexpenditure,especially
wagesforskilledlabourtorunInternetdeliverysystems.Tobemorespecific,DeYoung
(2007)assertsthatwiththeadventoftheInternet,smallbanksthatarewellmanaged
can earn satisfactory profit to offset the high-cost structure. It is because after the
deregulation,alongwiththeadventofInternetbanking,smallbankstendtofocusonlow
volumebuthigh-value-added transactions, suchas localmarketandperson-to-person
services, therefore their service quality is enhanced. As suggested by the banking
literature (Carter andMcNulty, 2005; DeYoung, 2007), the strategy of small banks is
completelydifferentfromtheirlargerrivals.Inwhich,largebankstendtofocusonhigh
volumebutlow-value-addedtransactions(e.g.,homemortgages,creditcardloans,online
brokerage),takingadvantageofeconomiesofscale.Thecleardivergencebetweenlarge
and small banks partly reflects that, even in the case that the investment in Internet
bankingiscostly,smallbankscanstillearnsatisfactoryprofitandoffsettheexpenditure
of Internet banking. For example,DeYoung et al. (2007) find a significant increase in
profitabilityofcommunitybanksthatadopt Internetbankingthankstoan increase in
noninterestincomefromservicechargesondepositaccounts.Thestudyexplainsthatas
Internetbanksbringconvenience,thedepositorsarehappytopayextrafortheservices
146
theypreviouslytransactedatbankbranches.Tosum,“Internethasthepotentialtoadd
valueforbothlargebanksandsmallbanks”,asstatedbyDeYoungandHunter(2001,p.1).
DeYoungandHunter(2003,p.170)emphasisethatwell-managedsmallbankscan“turn
competitive threats into their opportunities”. For example, small banks can combine
Internetdistributionandallianceswithotherbankstomakethembetter inexploiting
existinginformationadvantagesoftheirlocalbranchingnetworks.Smallbankscanalso
fullyoptforcost-optimizedstrategieswhichstillfittheirmarketdevelopmentgoals.For
example,Mols(1998)suggeststhatsmallbankscanfindthemostsuitablepartiesintheir
Internet banking strategywith the aimof fastest-growing customer’s segment. In the
samevein,assuggestedbyDeYoungandHunter(2001),smallbanksstillpartiallyreduce
their cost disadvantages compared to large banks if they distribute their budgets
reasonably.
AnotherquestionisifM&AactivitieshaveanyimpactonthepotentialvaluethatInternet
banking adds to the bank?What happens if a large bank canmerely acquire a small
successfulbankandgrabtheexistingbenefitsfromthatbank.Theliteraturesuggeststhat
Internetbankinghasdrivenawedge in the strategiesof smallbanksand largebanks
(CarterandMcNulty,2005;DeYoung,2007).However,thestrategiesofbothsmalland
largebanksarepotentiallyprofitableforthem(DeYoungandHunter,2001,2003).Thus,
whether M&A activities among banks are successful could firstly depend on their
strategiesandmanagement.
Numerous studies have demonstrated that, in some cases, the acquisition of small
successfulbanksbylargerbanksarenotcertaintoyieldbenefitstothelargebanks.For
example,Doz(1987,p.31)arguesthat“acquisitionsofsmallerfirmsbylargeroneshave
rarelybeenasuccess,astheoften-anticipatedsynergiesmosthavenotmaterialized”.In
the same vein, Christensen (2006) claims that it is easily failed for a large mature
companytomanageasmall,acquiredsubsidiaryaswellasaccesstoitsinnovativeway
ofoperating.Obviously,smallbanks focusonpersonal-to-personalserviceswith large
scale services.Within the limits of this thesis, it is argued thatM&A activities do not
necessarily bring success. However, future empirical tests should be put into
consideration to be better involved in the issue. Please see Section 3.4.4 for further
discussionofM&Aactivitywithinthedataset.
147
Basedon the above theoretical and empirical studies, this hypothesis expects amore
considerable impact of the transactional website adoption on small-sized banks,
comparedtoonlarger-sizedbanks.40
Hypothesis5.3:TheInter-FirmHeterogeneityAttributedtoSizeEffectSmallscalebanksarelikelytoenjoysuperiorperformancewhenadoptingtransactionalwebsitescomparedtotheirlarger-sizedpeers.
5.3.4 Inter-FirmHeterogeneityduetotheTimingOrderEffect
Whetherornotafirmshouldbealeaderinitsfieldisacontroversialissue.Asstatedby
SuarezandLanzolla(2005),itiswidelybelievedbyexecutivesthatthefirstcompanyin
a new product/service category will obtain an important “head start” and achieve
enduringbenefits.However,“first-moveradvantageismorethanamythbutfarlessthanasurething”,theyargue(SuarezandLanzolla,2005,p.121).Ontheonehand,anumberoftheoreticalscholarshaveexpressedenormousregardfor
the potential reward of being the firstmovers of an innovative strategy, such as the
learning-by-doing experiences (Lieberman and Montgomery, 1988), market shareenhancement (Mascarenhas, 1992a, 1992b; Tufano, 1989), customer satisfaction andpurchase retention (Alpert andKamins, 1995; Kalyanaram andUrban, 1992). On theotherhand, several critical viewshave suggested thatbeinga leaderpresents certain
disadvantages, such as the free-rider effect (Lieberman, 1987; Lieberman andMontgomery,1988;Utterback,1994),technologicalormarketuncertainty(OlaussonandBerggren2010).Thesedebatesraisesuspicionsthatleadingcompaniesmaynotbeable
tokeep/orgainsustainablebenefitsinthelongterm.
40However,thedirectionoftheimpactoftransactionaladoptiononperformanceforeachsizegroupcouldgo either way. Some authors argue that the impact of the size on firms’ performance is likely veryenvironment-specificandhighlydependentonseveralinstitutionalfactorswhichaffecttheperformanceoffirms(seeDaltonetal.,1980;Vossen,1998).Assuggestedbythoseauthors,enterpriseswithdifferentsizesallposessdistinctadvantages.Forexample,largefirmsoftenbenefitfromtheirimmenseresources,such as scale and scope, more cost-effective financial resources, more plentiful human resources andequipment(Nooteboom,1994;RothwellandDodgson,1994).Onthecontrary,behaviouralcharacteristicsareconsideredtobeoneofthemostsuperioradvantagesofsmallbanksastheyhavemorevariationinpersonnel tasks, tacit knowledge, dynamic capability (Chen and Hambrick, 1995; Dean et al., 1998;Nooteboom,1994).
148
Inthefieldofdigitalbankingliterature,unfortunately,onlyahandfulofresearchpapers
focuson this issue.Thesestudies find that in theshort-term, firstmoversofadopting
digitalinitiativesareabletoearnsuperiorperformancecomparedtolaggards(Linetal.,
2011;LópezandRoberts,2002).However,itseemstocontradictsomeotherstudiesthat
provideevidenceofthecostburdenthatleadingbankssufferedduringtheearlystageof
Internetbanking(Furstetal.,2000a;SullivanandWang,2013).Theseinconsistencies
raisethequestionofwhetherthebankleadersinadoptingthetransactionalwebsitesget
superiorperformance,andifso,whetherthisperformancewillbepreservedovertime.
Ontheonehand,pioneeringbanksinadoptingthetransactionalwebsitearelikelytoreap
morebenefitsthanlateadopters.Theymaygaintheupperhandinreputationbecauseof
beingthefirstrunnersinthemarketpotentiallyinducingagreaterextentofcustomer
awareness (Kerin et al., 1992). Furthermore, leading enterprises are possibly more
preeminentthanlatecomersininfluencingconsumers’perceptionsofhowattributesof
transactional websites are valued (Carpenter and Nakamoto, 1989, 1990). This is
because,intheearlystage,customersmayknowverylittleabouttransactionalwebsite
attributes, and their evaluations are presumably based on the quality of the earliest
provided services. Furthermore, it is pointed out by scholars that entry order is a
determinantofmarketshare,andtherebyfirstrunnersmaygainmoremarketsharethan
latecomers(Urbanetal.,1986).
Ontheotherhand,somestudiesstatethattheadvantagesoffirstmoverscouldbeshort-
livedornotguaranteedinthelongterm.ItissuggestedbyDuttaetal.(2014)thatthe
laggardspotentiallypossessuniquecapabilitiestogaincompetitiveadvantagesoreven
outperformthosewhocamefirst.Inthesamevein,SuarezandLanzolla(2005)explain
that the advantages of the firstmovers depend greatly on circumstances andmarket
conditions.Inthecaseoffirmsthatturnouttobetechnologyleaders,theauthorswarned
thattheever-changingnatureoftechnologycouldgivelaterentrantslotsofweaponsfor
attacking firstmovers. Furthermore,when discussing first-mover advantages, several
studies have stated that the advantages can be achieved onlywhen businesses really
understandwhattheirresourcesare,howthemarketcontexttheyareinvolvedinis,as
wellasthewaytheydifferentiatethemselvesfromotherrivals(CarpenterandNakamoto,
1990;Dutta et al., 2014; Suarez andLanzolla, 2005).This is in the same spirit as the
resource-basedviewthatisdiscussedthroughoutthechapter.

149
Hypothesis5.4:TheInter-FirmHeterogeneityAttributedtoTimingEffectThereexiststheimpactofthetimingordereffectwhichsignificantlydifferentiatestheimpact of transactional website adoption on the bank's performance across differentadoptiontimes.
Figure5.1belowshowsadiagramofthesixproposedfeaturesaswellasthehypotheses
settoprovethosefeatures,basedontheresource-basedviewtheory.

150
Figure5.1FrameworkofResearchHypotheses
Somekeytheoristsareinfollowingparentheses(1)(Barney,1991;DierickxandCool,1989);(2)(AmitandSchoemaker,1993;CollisandMontgomery,1995;Grant,1991b);(3)(BlackandBoal,1994;Dagnino,1996;Grant,1991b);(4)(Barney,1991;GrewalandSlotegraaf,2007;Hsuehetal.,2010;Porter,1981;ReedandDeFillippi,1990;Rumelt,1984);(5)(Barney,1991;BlackandBoal,1994;DierickxandCool,1989;Hart,1995;Winter,1995);(6)(Barney,1986a;DierickxandCool,1989;LippmanandRumelt,1982;ReedandDeFillippi,1990;RumeltandLamb,1997);(7)-(8)(Peteraf,1993;RumeltandLamb,1997;Wernerfelt,1984).
StrategicrolesofTransactionalwebsiteadoption
Hypothesis5.1:Transactionalwebsiteadoptionpositivelyimpactsthe
financialperformanceofbanksovertime.
Value(1)
Appropriability(2)
Durabiliity(3)
Hypothesis5.2:Transactionalwebsiteadoptionpositivelyimpactsthe
financialperformanceofbanksovertimeduetoitsattributesof
embeddedness,interconnectednessandunobservability.
Embeddedness(4)
Interconnectedness
(5)
Inimitability (6)Hypothesis5.3:Smallscalebanksarelikelytoenjoysuperior
performancewhenadoptingtransactionalwebsitescomparedtotheir
larger-sizedpeers.
Hypothesis5.4:Thereexiststheinvolvementoftimingorder effectwhich
differentiatetheimpactoftransactionalwebsiteadoptiononthebank's
performanceacrossdifferentadoptiontimes.
Inter-firm
Heterogeneity
(7)
Competition
Edge&
Superior
Performance
(7)
Limitto
Competition
&Preserve
Value(8)
151
5.4 Data
Thischapteremploysasampleof307listedcommercialbanksthatadoptedtransactional
websitesfrom1996to2010intheUS,asdiscussedindetailinChapter3.Thefocusof
Chapter 5 is on the long-term impact of transactional website adoption on banks’
financialperformance,thereforeaccountingdataforthe307samplebankswascollected.
Annualperformanceratiosandotheraccountingcharacteristicsarecollectedfromthe
FDIC,SNL,MarketIntelligence,andBloombergduringtheperiodof1993-2018.Section
5.5.1willdiscusstheperformanceratiosandaccountingcharacteristicsindetail.
The dataset is an unbalanced panel data of banks. Some sample banks are long-
established banks while some other banks are IPOs/de novo banks at the time theylaunchwebsites. These IPObanksdonot have any annual data available before their
websitelauncheventtimes.Astherearedifferencesinthenatureofthesamplebanks,
theirbusinessmodelsmightvaryandinfluencetherelationshipbetweentransactional
websiteadoptionandbanks’performance.
Relatingtootherpotentialconfoundingeventsthathappentoanybankduringthe1993-
2018timeperiod, it isbeyondthescopeofthisthesistomanuallycheckforM&Aand
stocksplitactivitiesthatoccuratanygiventime.Therefore,it’sacknowledgedthatthere
maybe a limitationwith respect to this. Please seeChapter3, Section3.4 for further
detailsonpossibleM&Aactivity.
5.4.1 Mobileadoptiondata
Tocapturethecombinativecapabilitybetweenthetransactionalwebsiteinitiativeand
mobile website initiative, the data on the mobile website adoption event years was
collected.Thedefinitionofthemobilewebsiteadoptionismainlybasedontheliterature.
Tobemorespecific,previousstudiesdefinethemobilewebsiteadoptionastheadoption
whichallowsuserstoretrieveinformationoraccessservicesviatheirhandhelddevices
(Hungetal.,2003,p.43;Zhou,2011,p.636).Thebankingliteraturealsodefinesmobile
website adoption as the banking delivery channel which allows customers to access
servicesviatheirsmartphone(NiralaandPandey,2015;Taylor,2012).Furthermore,on
thewebsitepage,WellFargobanksays:‘Themobilewebsiteisoptimizedtoeasilymake
transfers between your accounts and to other customers, pay your bills, findATMs, and
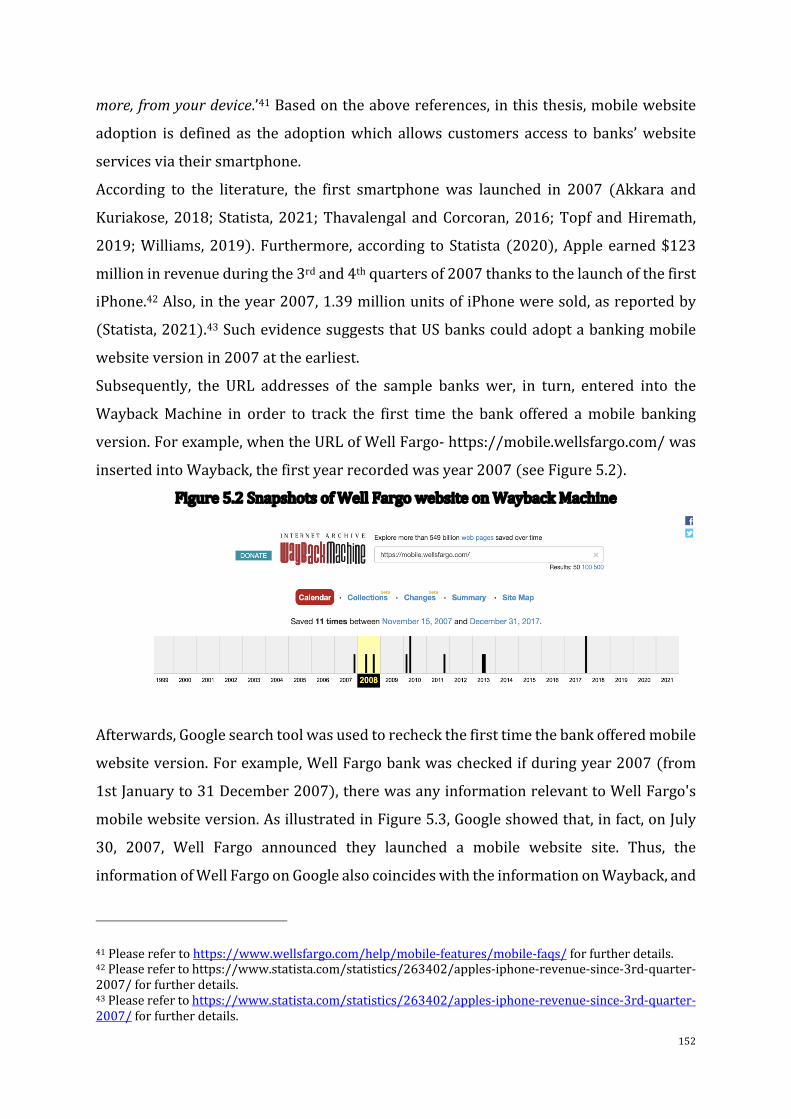
152
more,fromyourdevice.’41Basedontheabovereferences,inthisthesis,mobilewebsite
adoption is defined as the adoptionwhich allows customers access tobanks’website
servicesviatheirsmartphone.
According to the literature, the first smartphone was launched in 2007 (Akkara and
Kuriakose,2018; Statista,2021;Thavalengal andCorcoran,2016;Topf andHiremath,
2019;Williams,2019).Furthermore, according toStatista (2020),Appleearned$123
millioninrevenueduringthe3rdand4thquartersof2007thankstothelaunchofthefirst
iPhone.42Also,intheyear2007,1.39millionunitsofiPhoneweresold,asreportedby
(Statista,2021).43SuchevidencesuggeststhatUSbankscouldadoptabankingmobile
websiteversionin2007attheearliest.
Subsequently, the URL addresses of the sample banks wer, in turn, entered into the
WaybackMachine in order to track the first time the bank offered amobile banking
version.Forexample,whentheURLofWellFargo-https://mobile.wellsfargo.com/was
insertedintoWayback,thefirstyearrecordedwasyear2007(seeFigure5.2).
Figure5.2SnapshotsofWellFargowebsiteonWaybackMachine
Afterwards,Googlesearchtoolwasusedtorecheckthefirsttimethebankofferedmobile
websiteversion.Forexample,WellFargobankwascheckedifduringyear2007(from
1stJanuaryto31December2007),therewasanyinformationrelevanttoWellFargo's
mobilewebsiteversion.AsillustratedinFigure5.3,Googleshowedthat,infact,onJuly
30, 2007, Well Fargo announced they launched a mobile website site. Thus, the
informationofWellFargoonGooglealsocoincideswiththeinformationonWayback,and
41Pleaserefertohttps://www.wellsfargo.com/help/mobile-features/mobile-faqs/forfurtherdetails.42Pleaserefertohttps://www.statista.com/statistics/263402/apples-iphone-revenue-since-3rd-quarter-2007/forfurtherdetails.43Pleaserefertohttps://www.statista.com/statistics/263402/apples-iphone-revenue-since-3rd-quarter-2007/forfurtherdetails.

153
alsocoincideswiththetimewhenthefirstiPhonewaslaunched.Accordingly,themobile
websiteeventyearofWellFargowasrecordedintheyear2007.
Figure5.3ScreenshotofWellsFargo'sMobileWebsiteInformation
onGoogleToolin2007
Thesameprocesswastakendownfortheremainingsamplebanks.Thefinaldatashows
thatthereare303banksthathaveadoptedtheirmobilewebsiteversionin2007.There
are2,1and1banks,inturn,adopttheirmobilewebsiteversionin2008,2009and2010,
respectively.
5.5 MethodologyandEmpiricalResults
5.5.1 Hypothesis5.1:Thelong-termimpactoftransactionalwebsiteadoptiononbanks’
financialperformance
5.5.1.1 Methodology
Asetof regressions is constructed inpursuanceofexploring ifbanksareappreciably
benefitedwhenembracingdigitalbylaunchingtheirtransactionalwebsiteinitiatives.In
which a set of seven performance variables are regressed against a dummy variable
denotingtheadoptionofthetransactionalwebsiteaswellasasetofcontrolvariables.
Thecoefficientsassociatedwiththedummyvariablewillindicatethestrengthanddirect
associationbetweentransactionalwebsiteenablementandtheperformanceoffinancial
institutions.
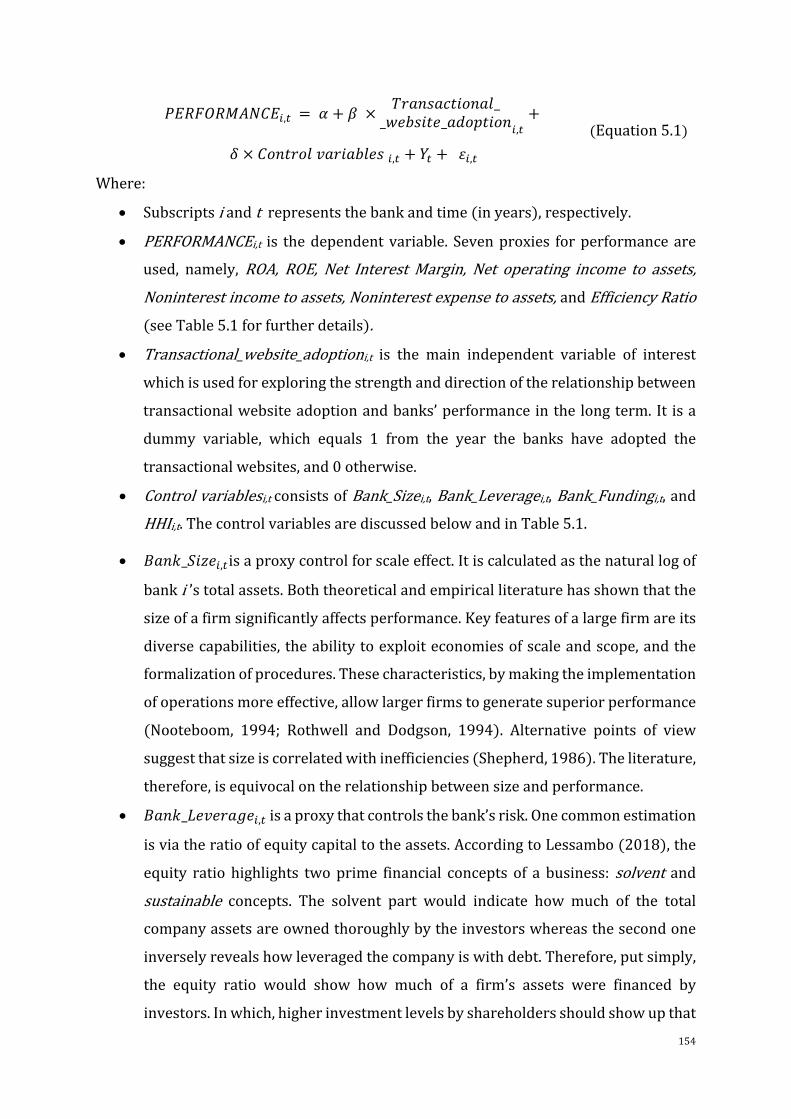
154
efghigjklmf!,# = o + q × stuvwuxyz{vu|__~�Äwzy�_uÅ{Çyz{v!,#
+
É × m{vyt{|ÑutzuÄ|�w!,# + Ö# +Ü!,# (Equation5.1)
Where:
• Subscriptsiandtrepresentsthebankandtime(inyears),respectively.
• PERFORMANCEi,t is thedependentvariable. Sevenproxies forperformanceareused, namely, ROA, ROE, Net Interest Margin, Net operating income to assets,Noninterestincometoassets,Noninterestexpensetoassets,andEfficiencyRatio(seeTable5.1forfurtherdetails).
• Transactional_website_adoptioni,t is the main independent variable of interestwhichisusedforexploringthestrengthanddirectionoftherelationshipbetween
transactionalwebsiteadoptionandbanks’performanceinthe longterm.It isa
dummy variable, which equals 1 from the year the banks have adopted the
transactionalwebsites,and0otherwise.
• Controlvariablesi,tconsistsofBank_Sizei,t,Bank_Leveragei,t,Bank_Fundingi,t,andHHIi,t.ThecontrolvariablesarediscussedbelowandinTable5.1.
• àuvâ_äzã�!,#isaproxycontrolforscaleeffect.Itiscalculatedasthenaturallogof
banki’stotalassets.Boththeoreticalandempiricalliteraturehasshownthatthesizeofafirmsignificantlyaffectsperformance.Keyfeaturesofalargefirmareits
diversecapabilities,theabilitytoexploiteconomiesofscaleandscope,andthe
formalizationofprocedures.Thesecharacteristics,bymakingtheimplementation
ofoperationsmoreeffective,allowlargerfirmstogeneratesuperiorperformance
(Nooteboom, 1994; Rothwell and Dodgson, 1994). Alternative points of view
suggestthatsizeiscorrelatedwithinefficiencies(Shepherd,1986).Theliterature,
therefore,isequivocalontherelationshipbetweensizeandperformance.
• àuvâ_å�Ñ�tuç�!,#isaproxythatcontrolsthebank’srisk.Onecommonestimation
isviatheratioofequitycapitaltotheassets.AccordingtoLessambo(2018),the
equity ratio highlights twoprime financial concepts of a business: solvent andsustainable concepts. The solvent part would indicate how much of the totalcompanyassetsareownedthoroughlybytheinvestorswhereasthesecondone
inverselyrevealshowleveragedthecompanyiswithdebt.Therefore,putsimply,
the equity ratio would show how much of a firm’s assets were financed by
investors.Inwhich,higherinvestmentlevelsbyshareholdersshouldshowupthat
155
the firm is worth investing in as so many investors are happy to finance the
company. Furthermore, a higher ratio also shows potential creditors that that
companyismoretrustworthyandsecuretolendfutureloansto.
• àuvâ_hévÅzvç!,#isaproxythatcontrols for thebank’s liquidityrisk(DeYoung
andJang,2016).Itisestimatedastheratioofnetloansandleasesoverthecore
deposit.Aloan-to-depositratioexpressestheabilityofabanktocoverloanlosses
andwithdrawalsbyitscustomers.Iftheratioisatatoohighlevel,itindicatesthat
the bank might not have sufficient liquidity to cover any unforeseen funding
requirements. Additionally, the rising ratiomight also reflect the pressure the
industry confronts in achieving sustainable core deposits. Therefore, bank
liquiditywithahigh level isexpected tonegatively impactbanks’performance
(Bilinskietal.,2012).
• êêë!,#is a common proxy that controls the competitive condition of banks
(Hannan,1997).ItiscalculatedthroughtheHerfindahl-Hirschmanindex(HHI).
TheHHIiscalculatedbysquaringthemarketshareofeachfirmcompetinginthe
marketandthensummingtheresultingnumbers(asfollowingU.S.Departmentof
Justice,2018).AhighvalueofHHIindicatesahighlyconcentratedmarketplace.
According to the literature, a highly concentrated market imposes a negative
impactonthefirm’sperformance(UddinandSuzuki,2014).
• Ytisafullsetofyeardummiestocontrolforunobservedheterogeneityintheform
ofcyclicalchangesofbankperformancethatmaynotbecapturedbytheother
control variables. This is consistent in all subsequent equations.Thepreferred
specificationistocontrolfortheyearfixedeffectsonly,whichisconsistentwith
numerouspriorstudies(DeLongandDeYoung,2007;DeYoung,2005;DeYounget
al.,2013;ElDirietal.,2021;Srivastavetal.,2018).Stateandbankfixedeffectsare
alsoincludedforrobustness(seeSection5.6).
• Equation5.1isestimatedwithrobuststandarderrorsclusteredatbanklevelto
accountforserialcorrelationoftheerrorterm.
• Table5.1offersadescriptionofthevariablesusedinthischapter.

156
Table5.1SummaryofVariables
Variables Aim Estimation Expectedsign
Dependentvariable
ROA%,&(Return onassets)
Examine theoverallperformanceofbanks
Net income after taxes andextraordinary items (annualized)asapercentofaveragetotalassets.
ROE%,&(Return onequity)
Examine theoverallperformanceofbanks
Annualized net income as apercentofaveragetotalequity.
NIM%,&(Net InterestMargin)
Examinebanks’profitabilityandgrowth
Total interest income less totalinterestexpense(annualized)asapercentofaverageearningassets.
NOIA%,&(Net operatingincome toassets)
Examine theoperatingactivities ofbanks
Netoperatingincome(annualized)asapercentofaveragetotalassets.
NIIA%,&(Noninterestincome toassets)
Examinenoninterestactivities ofbanks
Incomederivedfrombankservicesand sources other than interest-bearing assets (annualized) as apercentofaveragetotalassets.
NIEA%,&(Noninterestexpense toassets)
Examinenoninterestactivities ofbanks
Salaries and employee benefits,expenses of premises and fixedassets, and other noninterestexpenses(annualized)asapercentofaveragetotalassets.
EFFR%,&EfficiencyRatio
Examine theefficiency inoperations ofbanks
Noninterest expense lessamortization of intangible assetsasapercentofnetinterestincomeplusnoninterestincome
Controlvariables
Bank_Size%,&Control forscaleeffects.
Calculated as the natural log ofÄuvâ! ’sasset
+/-
Bank_Leverage%,&Control for thebank’srisk.
Estimated as the ratio of equitycapitaltotheasset.
+
Bank_Funding%,&Control for thebank’sliquidity.
EstimatedastheratioofNetloansandleasesoverCoreDeposit. -
HHI%,&Control formarketconcentration
TheHHI is calculatedbysquaringthe market share of each firmcompetinginthemarketandthensummingtheresultingnumbers.AhighvalueofHHIindicatesahighlyconcentratedmarketplace.
-
157
5.5.1.2 Results
Table5.2illustrateshowhavethesamplebanksperformedovertwodifferentperiods:
theex-anteperiod(pre-adoption)andtheex-postperiod(post-adoption).Theadoption
yearisnotthesameforeachbankinthesample(seeFigure3.4forthedistributionof
transactionalwebsiteadoptionactivitybyyear), therefore thepre-adoptionandpost-
adoptionperioddependonwhichyearbanksadoptedthetransactionalwebsite.
Firstly,regardingthemeanofROAandROEshownincolumn[1]-PanelA,itcanbeseen
thatbankswereseeminglyequallyprofitableintermsofROAbeforeandaftertheyhave
adoptedthewebsiteswhileROEwashigherintheex-anteperiod(11.855versus9.333).
PanelBalsodoesnotshowanystatisticaldifferenceinmeanROAvaluebutasignificant
difference in ROE is reported between the two periods. However, in considering the
standarddeviationshownincolumn[3]-PanelA,itisclearerthatpost-adoptionROAand
ROEweremuchhigher than thepre-adoptionROAandROE(2.675versus0.916,and
10.320versus7.214,respectively).Thesefiguresindicatethattheremaybealargergap
betweenonedatavalueandanother in thepost-adoptionperiod. Inotherwords, the
profitabilitygapbetweenbankspotentiallywidenedsincetheyadoptedthetransaction
websites.Thispoint is also reinforced through themaximumvalueand theminimum
value which are shown in columns [4] and [5]. As can be seen, after adopting the
transactionalwebsite,thehighestvalueofprofitabilitythatthebankscanreceiveisupto
102.158intermsofROAandupto319.744intermsofROE.Morepointedly,compared
totheROAandROEinthepreviousperiod,thepost-adoptionROAandROEwerehigher
byapproximately25.79timesand6.11times.
Subsequently,4.421and3.888aretheaverageofthenetinterestmarginbeforeandafter
bankshaveactivatedwebsites,respectively.Also,PanelBshowsthat,onaverage,thenet
interestmargin of banks significantly declines by 0.533% following the transactional
website adoption. A possible reason for such a decline is possibly an increasing
competitioninthebankingsector,inwhichbankswerestrivingagainstotherstooffer
lower rates to borrowers (Saksonova, 2014). Alternatively, Saksonova (2014) also
suggests that caused by compression in spreads (the difference between lending and
borrowingrates),theremightoccuraspeedygrowthofinterest-bearingassets,whichis
notoffsetbythegrowthofinterestincome.Inaddition,thenetinterestmarginissaidto
bealsosignificantlyaffectedbytheeconomyaswellasmonetarypoliciessetbycentral
banks (Altavilla et al., 2018; Arseneau, 2017). For example, in referring to the US
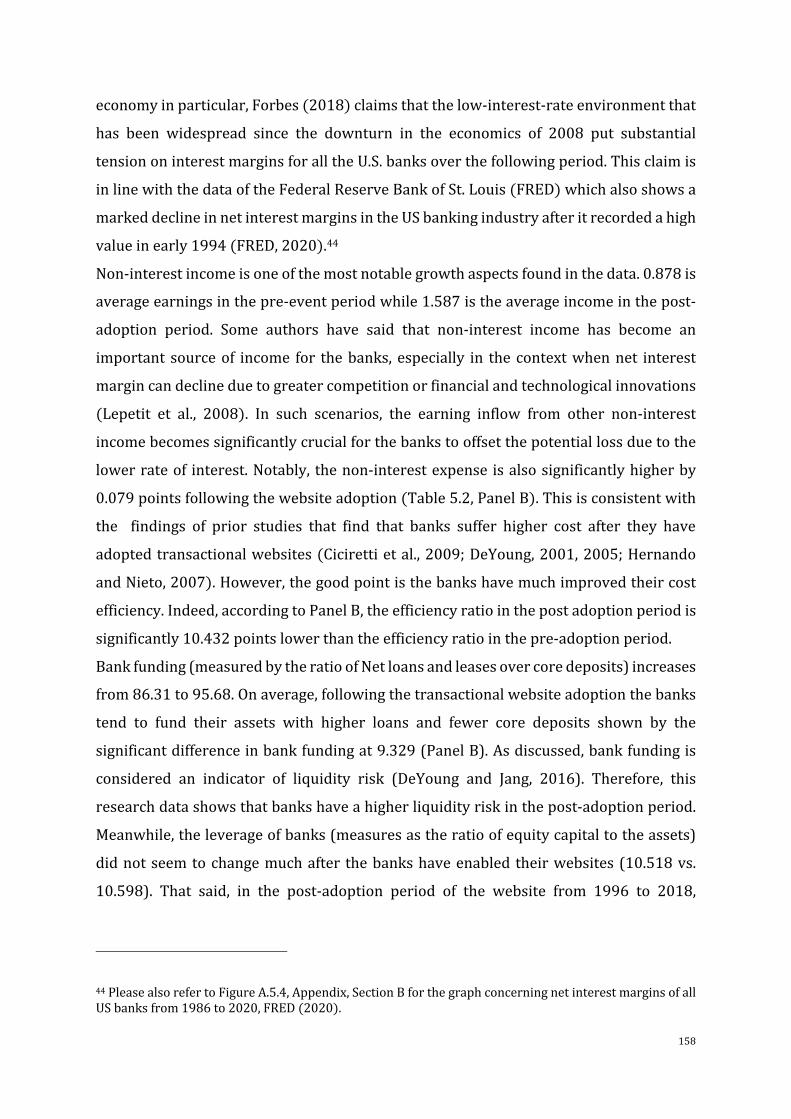
158
economyinparticular,Forbes(2018)claimsthatthelow-interest-rateenvironmentthat
has been widespread since the downturn in the economics of 2008 put substantial
tensiononinterestmarginsforalltheU.S.banksoverthefollowingperiod.Thisclaimis
inlinewiththedataoftheFederalReserveBankofSt.Louis(FRED)whichalsoshowsa
markeddeclineinnetinterestmarginsintheUSbankingindustryafteritrecordedahigh
valueinearly1994(FRED,2020).44
Non-interestincomeisoneofthemostnotablegrowthaspectsfoundinthedata.0.878is
averageearningsinthepre-eventperiodwhile1.587istheaverageincomeinthepost-
adoption period. Some authors have said that non-interest income has become an
important sourceof income for thebanks, especially in thecontextwhennet interest
margincandeclineduetogreatercompetitionorfinancialandtechnologicalinnovations
(Lepetit et al., 2008). In such scenarios, the earning inflow from other non-interest
incomebecomessignificantlycrucialforthebankstooffsetthepotentiallossduetothe
lowerrateof interest.Notably, thenon-interestexpense isalsosignificantlyhigherby
0.079pointsfollowingthewebsiteadoption(Table5.2,PanelB).Thisisconsistentwith
the findings of prior studies that find that banks suffer higher cost after they have
adoptedtransactionalwebsites(Cicirettietal.,2009;DeYoung,2001,2005;Hernando
andNieto,2007).However,thegoodpointisthebankshavemuchimprovedtheircost
efficiency.Indeed,accordingtoPanelB,theefficiencyratiointhepostadoptionperiodis
significantly10.432pointslowerthantheefficiencyratiointhepre-adoptionperiod.
Bankfunding(measuredbytheratioofNetloansandleasesovercoredeposits)increases
from86.31to95.68.Onaverage,followingthetransactionalwebsiteadoptionthebanks
tend to fund their assets with higher loans and fewer core deposits shown by the
significantdifferenceinbankfundingat9.329(PanelB).Asdiscussed,bankfundingis
considered an indicator of liquidity risk (DeYoung and Jang, 2016). Therefore, this
researchdatashowsthatbankshaveahigherliquidityriskinthepost-adoptionperiod.
Meanwhile,theleverageofbanks(measuresastheratioofequitycapitaltotheassets)
didnotseemtochangemuchafter thebankshaveenabled theirwebsites (10.518vs.
10.598). That said, in the post-adoption period of the website from 1996 to 2018,
44PleasealsorefertoFigureA.5.4,Appendix,SectionBforthegraphconcerningnetinterestmarginsofallUSbanksfrom1986to2020,FRED(2020).
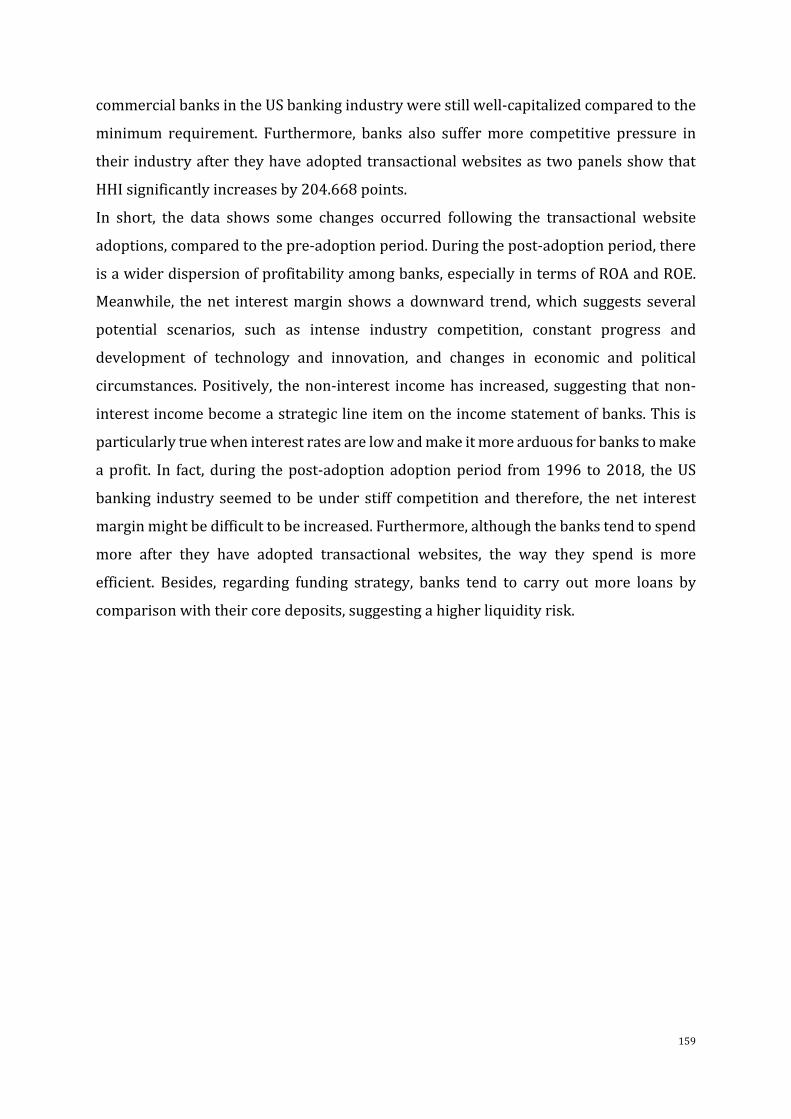
159
commercialbanksintheUSbankingindustrywerestillwell-capitalizedcomparedtothe
minimum requirement. Furthermore, banks also suffermore competitive pressure in
their industryaftertheyhaveadoptedtransactionalwebsitesastwopanelsshowthat
HHIsignificantlyincreasesby204.668points.
In short, the data shows some changes occurred following the transactional website
adoptions,comparedtothepre-adoptionperiod.Duringthepost-adoptionperiod,there
isawiderdispersionofprofitabilityamongbanks,especiallyintermsofROAandROE.
Meanwhile, thenet interestmargin showsadownward trend,which suggests several
potential scenarios, such as intense industry competition, constant progress and
development of technology and innovation, and changes in economic and political
circumstances.Positively, thenon-interest incomehas increased, suggesting thatnon-
interestincomebecomeastrategiclineitemontheincomestatementofbanks.Thisis
particularlytruewheninterestratesarelowandmakeitmorearduousforbankstomake
aprofit. In fact, during thepost-adoptionadoptionperiod from1996 to2018, theUS
banking industry seemed tobeunder stiff competitionand therefore, thenet interest
marginmightbedifficulttobeincreased.Furthermore,althoughthebankstendtospend
more after they have adopted transactional websites, the way they spend is more
efficient. Besides, regarding funding strategy, banks tend to carry outmore loans by
comparisonwiththeircoredeposits,suggestingahigherliquidityrisk.

160
Table5.2Pre-adoptionandPost-adoptionPerformanceofSampleBanksThis table reports the comparison of the banks themselves before and after they have adopted thetransactionalwebsitesacrosssevendifferentfinancialperformancemeasures,includingROA,ROE,NetInterestMargin,Netoperating incometoassets,Noninterest incometoassets,Noninterestexpensetoassets, andEfficiencyRatioduring the1993-2018period.The tablealso reports the funding strategy,liquidityrisk,thestateofcapitalizationofsamplebanksaswellasthelevelofindustrycompetitionbeforeand after the banks have adopted their website, which in turn are presented via the variables:Bank_Funding,Bank_Leverage,andHHI.
Panel A: Descriptive Statistics of Performance Ratios of 307 Sample Banks in their pre-adoptionandpost-adoptionperiods
Pre-adoption Mean Median Std. Min Max N
ROA 1.052 1.178 0.916 -8.504 3.96 1744
ROE 11.855 12.658 7.214 -67.233 52.262 1744
NetInterestMargin 4.422 4.441 1.053 0.014 11.117 1744
Non-interestIncome 0.878 0.666 0.983 0 17.74 1744
Non-interestExpense3.204 3.064 1.263 0 17.024 1744
NetOperatingIncome1.012 1.16 0.93 -8.504 3.96 1744
EfficiencyRatio 75.937 61.466 246.193 0 9800 1744
BankFunding 86.351 82.545 28.859 0 291.008 1742
BankLeverage 10.518 9.213 6.327 3.119 99.064 1742
HHI 1480.181 1429.153 138.813 1320.721 1976.71 1744
Post-adoption Mean Median Std. Min Max N
ROA 1.021 0.992 2.675 -10.341 102.158 5858
ROE 9.333 9.707 10.32 -101.547 319.744 5858
NetInterestMargin 3.888 3.808 0.815 -3.627 9.491 5858
Non-interestIncome 1.587 0.875 7.869 -0.995 227.426 5858
Non-interestExpense3.372 2.894 4.638 0.258 135.349 5858
NetOperatingIncome1.01 0.982 2.672 -10.341 102.158 5858
EfficiencyRatio 65.505 63.697 21.386 -820 577.617 5858
BankFunding 95.68 93.239 30.978 0 464.369 5855
BankLeverage 10.598 9.854 5.705 1.427 98.027 5856
HHI 1684.849 1729.61 139.852 1320.721 1976.71 5858
PanelB:DifferenceinPerformanceRatiosbetweenpre-adoptionandpost-adoption
Variable ∆Mean(Post-Pre) Std.E t-value
ROA -0.031 0.065 0.472
ROE -2.522*** 0.265 9.535
NetInterestMargin -0.533*** 0.024 22.327

161
Non-interestIncome 0.002 0.065 0.032
Non-interestExpense0.709*** 0.189 -3.752
NetOperatingIncome0.168* -0.168-1.495
EfficiencyRatio -10.432*** 3.2570.001
BankFunding 9.329*** 0.833 -11.205
BankLeverage 0.080 0.160 -0.500
HHI 204.668*** 3.808 -53.741

162
Table 5.3 represents the results of Equation 5.1, investigating to what extent the
enablement of transactional websites adds value to the performance of financial
institutions.Overall,theresultssupportHypothesis5.1inthatthetransactionalwebsite
significantlyimprovesthefinancialperformanceofbanksintermsofvariousdimensions.
To be more specific, banks are found to increase their profitability thanks to their
adoptionoftransactionalwebsites.Byactivatingwebsites,banksachieveanadditional
0.932, 3.446, and 0.231 points (p<0.05) in terms of ROA andROE, andNet Interest
Margin, respectively. Furthermore, banks also improve their ability to perform their
operatingactivitiesandutilizetheirexpenses,withanincreaseinnetoperatingincome
ratioby0.962points(p<0.05)andadecreaseinnon-interestexpenseratioby11.639
points(p<0.05).Intermsofnon-interestactivities,theendorsementofwebsiteadoption
isanincreaseinnon-interestincomeby3.059points(p<0.05),inrelationtototalassets.
Notably,theadoptionalsoinduceshighernon-interestexpenses(e.g.,employees’salary
andbenefits,premises,andfixedassets)forbanksby1.969(p<0.01),inrelationtototal
assets. Nevertheless, the escalation in non-interest expenses is carried by a threefold
incrementinnon-interestincome(1.969comparedto3.059).
To sum up, the findings presented in Table 5.3 strongly supportHypothesis 5.1. The
results are firstly consistent with the evidence provided by previous authors on the
relationship between digital banking adoption and banks' performance, especially in
termsof profitability and efficiency (seeHypothesis5.1). Furthermore, the growthof
non-interest activities due to digital banking adoption is also acknowledged by some
previousscholars(Delgadoetal.,2007;DeLongandDeYoung,2007;Furstetal.,2000a,
2002;He et al., 2020).This finding implies that the transactionalwebsite adoption is
innovativeandthereforerewardingbankswiththecapabilityofdiversifyingnon-interest
revenue streams. Finally, the findings authenticate three features set up by resource-
basedview:value,appropriability,anddurability(AmitandSchoemaker,1993;Barney,
1991; Collis andMontgomery, 1995; Dierickx and Cool, 1989; Grant, 1991b; Peteraf,
1993).
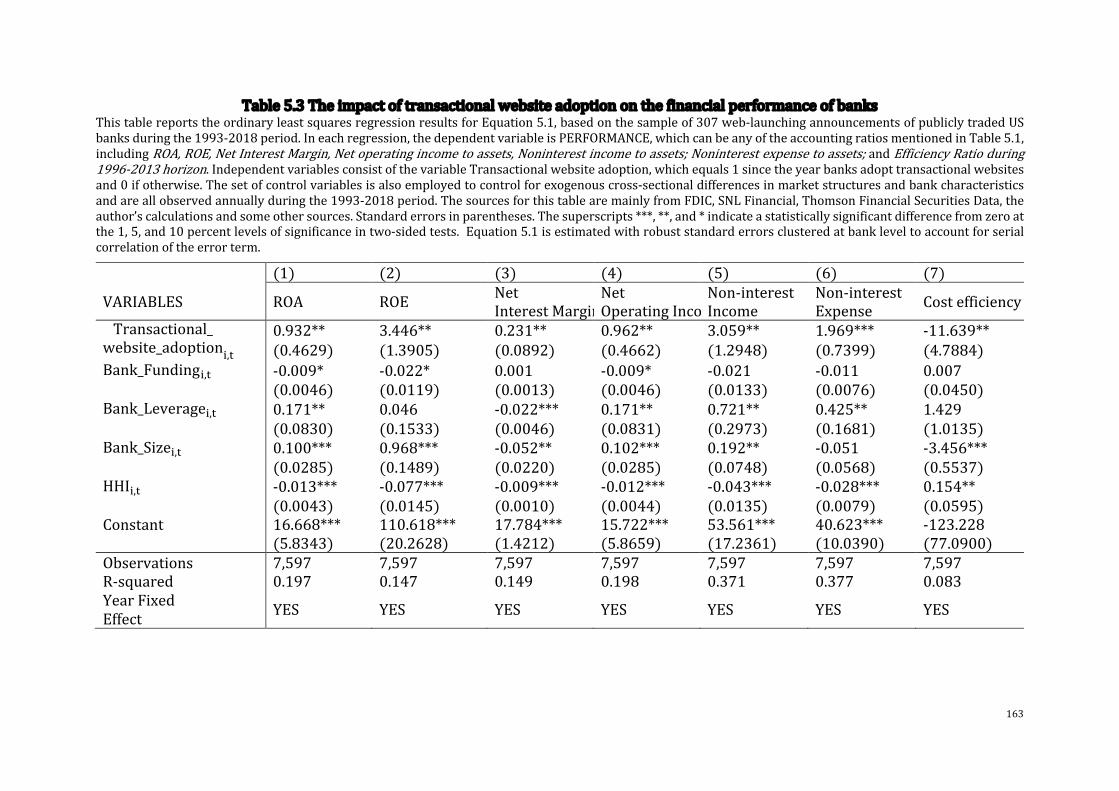
163
Table5.3Theimpactoftransactionalwebsiteadoptiononthefinancialperformanceofbanks
ThistablereportstheordinaryleastsquaresregressionresultsforEquation5.1,basedonthesampleof307web-launchingannouncementsofpubliclytradedUSbanksduringthe1993-2018period.Ineachregression,thedependentvariableisPERFORMANCE,whichcanbeanyoftheaccountingratiosmentionedinTable5.1,includingROA,ROE,NetInterestMargin,Netoperatingincometoassets,Noninterestincometoassets;Noninterestexpensetoassets;andEfficiencyRatioduring1996-2013horizon.IndependentvariablesconsistofthevariableTransactionalwebsiteadoption,whichequals1sincetheyearbanksadopttransactionalwebsitesand0ifotherwise.Thesetofcontrolvariablesisalsoemployedtocontrolforexogenouscross-sectionaldifferencesinmarketstructuresandbankcharacteristicsandareallobservedannuallyduringthe1993-2018period.ThesourcesforthistablearemainlyfromFDIC,SNLFinancial,ThomsonFinancialSecuritiesData,theauthor’scalculationsandsomeothersources.Standarderrorsinparentheses.Thesuperscripts***,**,and*indicateastatisticallysignificantdifferencefromzeroatthe1,5,and10percentlevelsofsignificanceintwo-sidedtests.Equation5.1isestimatedwithrobuststandarderrorsclusteredatbankleveltoaccountforserialcorrelationoftheerrorterm.
(1) (2) (3) (4) (5) (6) (7)
VARIABLES ROA ROENet
InterestMargin
Net
OperatingIncome
Non-interest
Income
Non-interest
ExpenseCostefficiency
Transactional_
website_adoption!,#
0.932** 3.446** 0.231** 0.962** 3.059** 1.969*** -11.639**
(0.4629) (1.3905) (0.0892) (0.4662) (1.2948) (0.7399) (4.7884)
Bank_Funding!,# -0.009* -0.022* 0.001 -0.009* -0.021 -0.011 0.007
(0.0046) (0.0119) (0.0013) (0.0046) (0.0133) (0.0076) (0.0450)
Bank_Leverage!,# 0.171** 0.046 -0.022*** 0.171** 0.721** 0.425** 1.429
(0.0830) (0.1533) (0.0046) (0.0831) (0.2973) (0.1681) (1.0135)
Bank_Size!,# 0.100*** 0.968*** -0.052** 0.102*** 0.192** -0.051 -3.456***
(0.0285) (0.1489) (0.0220) (0.0285) (0.0748) (0.0568) (0.5537)
HHI!,# -0.013*** -0.077*** -0.009*** -0.012*** -0.043*** -0.028*** 0.154**
(0.0043) (0.0145) (0.0010) (0.0044) (0.0135) (0.0079) (0.0595)
Constant 16.668*** 110.618*** 17.784*** 15.722*** 53.561*** 40.623*** -123.228
(5.8343) (20.2628) (1.4212) (5.8659) (17.2361) (10.0390) (77.0900)
Observations 7,597 7,597 7,597 7,597 7,597 7,597 7,597
R-squared 0.197 0.147 0.149 0.198 0.371 0.377 0.083
YearFixed
EffectYES YES YES YES YES YES YES

164
5.5.2 Hypothesis 5.2: The Features of Embeddedness, Interconnectedness, and
InimitabilityofTransactionalWebsiteAdoption
5.5.2.1 Methodologyfortheimpactoftheembeddednessonbanks’performance
Firstly, the embedded functionality of the transactionalwebsite is explored using the
variable "IJKLMKNOPQLKR_TUVMPOU_UWXUJPULNU!,#". It is calculated as the accumulated
number of years since the adoption of the transactional website. Therefore, the
IJKLMKNOPQLKRTUVMPOUUWXUJPULNU!,#variablewillbe0intheperiodbeforeanduptothe
eventyearandwillgetincrementalvalueeachyearaftertheeventyear,startingat1.For
example,ifabankadoptsitswebsitein1996,itstransactionalwebsiteexperiencevalue
willbe0beforeandin1996.Afterthat,itstransactionalwebsiteexperiencepointswill
be 1 in 1997, 2 in 1998, 3 in 1999 and so forth. The increased value in the
IJKLMKNOPQLKR_TUVMPOU_UWXUJPULNU!,#variablewillreflectthedeeperembeddednessof
thetransactionalwebsiteadoptionintothebusinessflowoftheVKL_! .
Notably,thewayIJKLMKNOPQLKR_TUVMPOU_UWXUJPULNU!,#definedisbasedonanumberof
papers, especially the paper ofDeYoung (2005).45More specifically,DeYoung (2005)examinestheimpactofaccumulatedexperiencesontheperformanceofbanks,basedon
thesampleof12start-upInternetbanksand644start-upnon-Internetbanks.Inwhich,
thestudyofDeYoung(2005)usesaccumulatedtimeastheproxyforexperiences(seeDeYoung, 2005, p.6). The variable IJKLMKNOPQLKR_TUVMPOU_UWXUJPULNU!,# is defined
similarlytothe“technology-basedexperience”variableinthestudyofDeYoung(2005)which is estimatedas accumulated time since the start-upbanks adopt their Internet
bankingservices.
ijklmknopqj!,# = s + u ×
IJKLMKNOPQLKR_TUVMPOU_UWXUJPULNU!,# + w ×qQLOJQRxKJPKVRUM!,# + y# +z!,#
(Equation5.2)
Where:
• Subscriptsiandtrepresentsthebankandtime(inyears),respectively.
• PERFORMANCEi,tandControlvariablesi,tareasdefinedisEquation5.1.
45Ialsofollowotherpapers(Delgadoetal.,2007;Hasanetal.,2002)whichalsouseaccumulatedtimeasproxyofbank’sexperiences.

165
• IJKLMKNOPQLKR_TUVMPOU_UWXUJPULNU!,# is the main independent variable of
interest.
• Ytisafullsetofyeardummies.PleaseseethedescriptionofEquation5.1inSection5.5.1.1forfurtherexplanationonthefixedeffects.
• Equation5.2isestimatedwithrobuststandarderrorsclusteredatthebankleveltoaccountforserialcorrelationoftheerrorterm.
In this section, followed the paper ofDeYoung (2005), only year time fixed effect isappliedforEquation5.2.However,Ialsoacknowledgethattherearetwotypesofbanks
in the sample (ones that have shifted their models from traditional banking to both
branchingand Internetbankingandothers thathaveadopted Internetbankingat the
timetheyappear).Therefore,theIJKLMKNOPQLKR_TUVMPOU_UWXUJPULNU!,#variablemight
notcaptureapotentialshiftinthebusinessmodelsofsomesamplebanks.Stateandbank
fixedeffectsareaddedinrobustnesstestsforEquation5.2inSection5.6.4.
5.5.2.2 ResultsfortheinfluenceofEmbeddedness
AscouldbeseenfromTable5.4,theadoptionofthetransactionalwebsiteindeedrewards
bankswithexperience,whichisembeddedovertheyearsandhasasignificantimpacton
financialperformanceovervariousaspects.Morepointedly,exceptfortheaspectsofcost
efficiency and net interest margin, other aspects (including ROA, ROE, core business
activities, and non-interest activities) are all significantly affected by cumulative
transactional website experiences. More pointedly, 0.154 points (p<0.05) and 0.610
points(p<0.01)arethebenefitsaddedtoROAandROE,indicatingthatwebsite-related
experience strongly supports banks in generating returns from their assets and
shareholders’investment.Furthermore,Table5.4alsorevealsaconsiderableimpactof
experienceonnon-interestactivitiesofbanks(e.g.,loanprocessingfee,latepaymentfees,
credit card charges, service charges, penalties, et cetera),with an increment of 0.477
points(p<0.05)intermsofthenon-interestincomeratio.
Insuchaway,theoutcomesofTable5.4arehighlysupportiveofHypothesis4.2inthat
banks can ultimately benefit from their accumulated experience which results from
transactionalwebsiteadoption(e.g.,humanresources,businessresources, technology
resources, expertise, knowledge, solutions).Over time, theseexperiencesare likely to
endowbankswithefficiency,competitiveness,innovation,diversificationandeventually
turnthisintolong-termwealthgeneration.
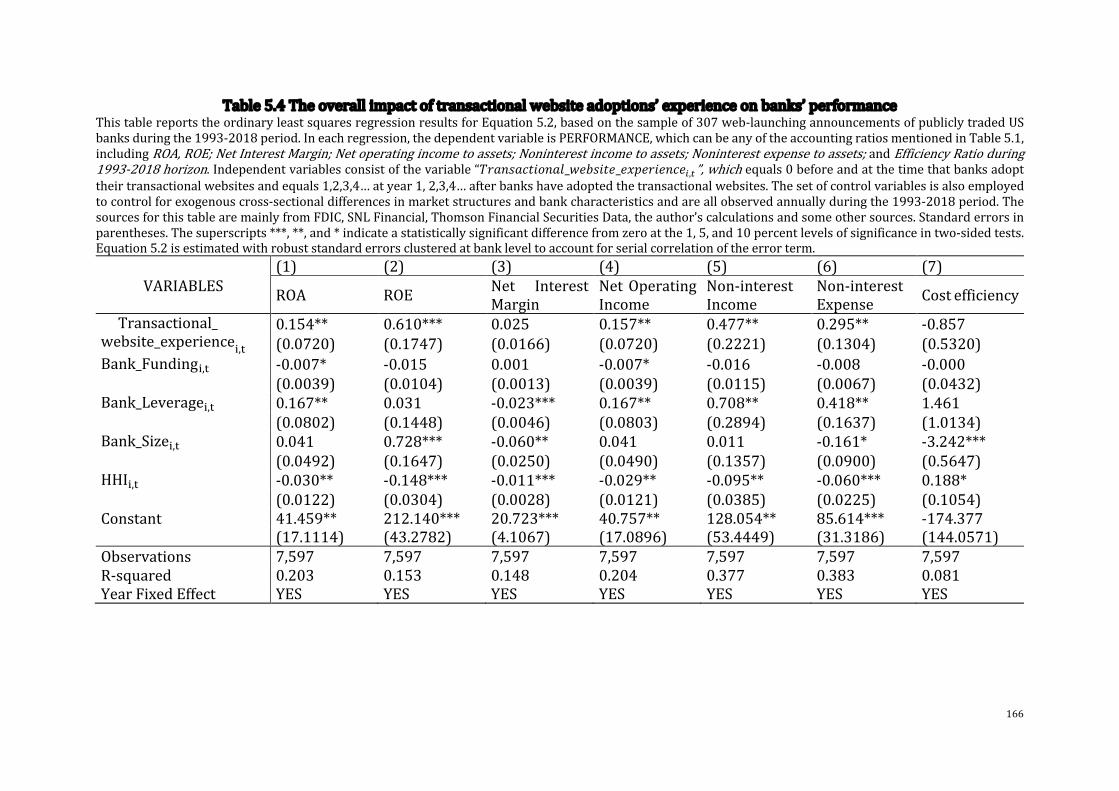
166
Table5.4Theoverallimpactoftransactionalwebsiteadoptions’experienceonbanks’performanceThistablereportstheordinaryleastsquaresregressionresultsforEquation5.2,basedonthesampleof307web-launchingannouncementsofpubliclytradedUSbanksduringthe1993-2018period.Ineachregression,thedependentvariableisPERFORMANCE,whichcanbeanyoftheaccountingratiosmentionedinTable5.1,includingROA,ROE;NetInterestMargin;Netoperatingincometoassets;Noninterestincometoassets;Noninterestexpensetoassets;andEfficiencyRatioduring1993-2018horizon.Independentvariablesconsistofthevariable“UVWXYWZ[\]XW^_`abY\[a_acdaV\aXZa!,#”,whichequals0beforeandatthetimethatbanksadopttheirtransactionalwebsitesandequals1,2,3,4…atyear1,2,3,4…afterbankshaveadoptedthetransactionalwebsites.Thesetofcontrolvariablesisalsoemployedtocontrolforexogenouscross-sectionaldifferencesinmarketstructuresandbankcharacteristicsandareallobservedannuallyduringthe1993-2018period.ThesourcesforthistablearemainlyfromFDIC,SNLFinancial,ThomsonFinancialSecuritiesData,theauthor’scalculationsandsomeothersources.Standarderrorsinparentheses.Thesuperscripts***,**,and*indicateastatisticallysignificantdifferencefromzeroatthe1,5,and10percentlevelsofsignificanceintwo-sidedtests.Equation5.2isestimatedwithrobuststandarderrorsclusteredatbankleveltoaccountforserialcorrelationoftheerrorterm.
(1) (2) (3) (4) (5) (6) (7)
VARIABLESROA ROE
Net Interest
Margin
NetOperating
Income
Non-interest
Income
Non-interest
ExpenseCostefficiency
Transactional_website_experience!,#
0.154** 0.610*** 0.025 0.157** 0.477** 0.295** -0.857
(0.0720) (0.1747) (0.0166) (0.0720) (0.2221) (0.1304) (0.5320)
Bank_Funding!,# -0.007* -0.015 0.001 -0.007* -0.016 -0.008 -0.000
(0.0039) (0.0104) (0.0013) (0.0039) (0.0115) (0.0067) (0.0432)
Bank_Leverage!,# 0.167** 0.031 -0.023*** 0.167** 0.708** 0.418** 1.461
(0.0802) (0.1448) (0.0046) (0.0803) (0.2894) (0.1637) (1.0134)
Bank_Size!,# 0.041 0.728*** -0.060** 0.041 0.011 -0.161* -3.242***
(0.0492) (0.1647) (0.0250) (0.0490) (0.1357) (0.0900) (0.5647)
HHI!,# -0.030** -0.148*** -0.011*** -0.029** -0.095** -0.060*** 0.188*
(0.0122) (0.0304) (0.0028) (0.0121) (0.0385) (0.0225) (0.1054)
Constant 41.459** 212.140*** 20.723*** 40.757** 128.054** 85.614*** -174.377
(17.1114) (43.2782) (4.1067) (17.0896) (53.4449) (31.3186) (144.0571)
Observations 7,597 7,597 7,597 7,597 7,597 7,597 7,597
R-squared 0.203 0.153 0.148 0.204 0.377 0.383 0.081
YearFixedEffect YES YES YES YES YES YES YES
167
5.5.2.3 Methodologyfortheinterconnectednessoftransactionalwebsiteinitiativesandmobilewebsiteadoption
To examine the interconnectedness of transactionalwebsite adoption, another digital
disruptionischosenthatisclosesttothetransactionalwebsiteadoptionevents:mobile
websiteadoption.Thepurposeistoexaminewhetherthecross-connectionbetweenthe
transactionalwebsiteandmobilewebsiteexertsanyconsiderable influenceonbanks'
performance.
Inordertoachievethisaim,thefollowingprocesswastaken:
-Asan initialstep,avariable that is theproxy for theadoptionof themobilewebsite
versionwascreated.This isadummyvariable thatequals0before themobileweb is
adoptedandequalsonesincetheyearbankslaunchthemobilewebversion.
- Following this, the gap between transactionalwebsite adoption andmobilewebsite
adoptionisestimated.Fromthat,twoequallydistributedquantileshavebeensetup.The
firstquantileincludesthebankswhosedistancesbetweentwoadoptionsarecloserthan
the ones of banks in the second quantile. The first quantile is named as HIJ_LMN!,#
variablewhilethesecondquantileistitledasOPQℎ_LMN!,#variable.
-Subsequently,inordertoreflecttheinterconnectednessbetweentransactionalwebsite
adoption and mobile website adoption, HIJ_LMN!,# is interacted with the
TIUPVW_JWUXPYW_MZINYPI[!,#variable.
- Finally, the following regressions are constructed to examine the impact of
interconnectednessonbanks’performance.
-Also,alltheequations5.3and5.4areestimatedwithrobuststandarderrorsclustered
atbankleveltoaccountforserialcorrelationoftheerrorterm.
]^_`a_Tbcd $,#= f + h × TIUPVW_JWUXPYW_MZINYPI[!,#+ j × dI[YkIVlMkPMUVWX!,# + m# +n!,#
(Equation5.3)
]^_`a_Tbcd $,#
= f + h × TIUPVWJWUXPYWMZINYPI[!,#+ r × HIJ_LMN!,#+ s ×TIUPVWJWUXPYWMZINYPI[!,# × HIJ_LMN!,#+ j × dI[YkIVlMkPMUVWX!,# + m# +n!,#
(Equation5.4)

168
Where:
• Subscriptsiandtrepresentsthebankandtime(inyears),respectively.
• PERFORMANCEi,tandControlvariablesi,tareasdefinedinEquation5.1.
• ThemainvariableofinterestisMobile_website_adoptioni,tinEquation5.3,andtheinteractionbetweenMobile_website_adoptioni,tandLow_Gapi,tinEquation5.4.
• ThequantileofbanksthatqualifyasOPQℎ_LMN!,#isusedasthereferencecategory
inEquation5.4.
• Yt is a full set of year dummies. Please see the description og Equation 5.1 in
Section5.5.1.1forfurtherexplanationonthefixedeffects.
• Equation5.3and5.4areestimatedwithrobuststandarderrorsclusteredatbank
leveltoaccountforserialcorrelationoftheerrorterm.
5.5.2.4 ResultsfortheinfluenceofInterconnectedness
Theresultsconcerningtheinterconnectednessbetweentransactionalwebsiteadoption
andmobilewebsiteadoptionarepresentedinTable5.5andTable5.6.Inwhich,Table
5.5showstheoverallimpactofmobilewebsiteadoptionwhileTable5.6makesexplicit
how the relationship between mobile website adoption and transactional website
adoptionexertsinfluenceonbanks'performance.
Firstly, as can be seen from Table 5.5, the adoption of mobile websites significantly
strengthensbanks’performance,withregardstoprofitabilityandnon-interestactivities.
TheimpactofmobilewebsiteadoptionissignificantforROE,withanincreaseof9.738
pointsovertheyearsandcriticallysignificantat1%.Furthermore,improvementisalso
reflected via the enhancement of 2.524points (p <0.05) in net operating income and
growth of 3.765 points (p<0.01) in terms of non-interest income. Furthermore, the
activation of amobilewebsite induces an increase in non-interest expenses by 1.486
points(p<0.05),butitisoffsetbyhighernon-interestincome.
Thereafter, Table 5.6 explores the results concerning the examination of the
interconnectedness, shown via the interaction between themobile adoption variable
Low_Gap.The results show thathighand lowgapbankscouldgaindifferent financial
benefitsfromtheinterconnectedness.Tobemorespecific,banksthathaveashortergap
betweenthetwodigitalinitiativestendtohavemorebenefitsfromthemobilewebsite
adoption relative to the banks that had a larger gap between the two adoptions. The
mobilewebsiteadoptionyieldshigherprofitabilityandefficiencyforlow-gapbanksby
169
0.228,1.540,and0.166points(p<0.05)intermsofROA,ROE,andNetInterestMargin,
respectively, aswell asby0.232and1.050points (p<0.05) in termsofNetOperating
Income and Non-interest income, respectively. In terms of cost, it is seeminglymore
costlyforlow-gapbankstoimplementtheconnectioncomparedtotheirhigh-gaprivals
(0.816,p<.01).However,inreturn,low-gapbanksalsogainaremarkableincomewhich
is three times theamount they spend (3.329,p<0.05 compared to1.192). Finally, the
interaction seems to be cost-effective for all groups of banks, but there is no sign of
statisticalclarity.
Basedontheaboveresults,thefollowingdiscussionscanbedrawn:
Firstofall,suchfindingsdemonstratethatthereexistslong-termwealthgainedfromthe
interconnectivitybetweentransactionalwebsiteadoptionandmobilewebsiteadoption.
These outcomes, therefore, support the ideas of twomain theory streams: resource-
basedviewandinnovation.Onthebasisoftheresource-basedview,interconnectedness
is considered an isolating mechanism that strengthens organizational structural
complexity, inter-firm heterogeneity, ambiguous causality, and resource development
(Barney,1991;BlackandBoal,1994;DierickxandCool,1989;Hart,1995;Rumelt,1984;
Winter, 1995). The interconnectedness, thereby, potentially limits the imitability and
offers sustainable growth (April, 2004; Kogut and Zander, 1992; Ruivo et al., 2014).
Furthermore, the ground of innovation theory claims that the combinative capability
between resources is beneficial for firms as it could deliver value to organizational
versatility,servethepurposeofinnovation(O’Cassetal.,2014),rewardfirmswithstable
marketpositionsandmoreextraordinaryperformanceresults(Sheng,2017).Ingeneral,
the findings provide some support for both referred theories by proving that the
combination of two digital adoptions can ultimately promote bank firms’ financial
prosperity.
Secondly,thefindingsrevealthattheconnectionbetweentwodigitaladoptionswould
appeartobestrongerifthegapbetweenthemcomescloser.Thefindingsthensomehow
advocatea theoreticalbackground in termsofexploitative innovationandexplorative
innovation. According to Jansen et al. (2006), exploitative innovation refers to
innovations that are based on the further manipulation of the current technological
resourcebasewhileexploratoryinnovationhintsattheinnovationswhicharebuiltupon
anewtechnologicalresourcebase.
170
Theresults,ontheonehand,revealthatbankswithahighertransferredgapbetweenthe
two digital adoptions generally perform better, indicating that they are likely to be
superiorintheirexploitativeinnovationactivities.Indeed,previousauthorshavefound
that such well-established firms possess effective business processes, experiential
market knowledge bases, well-constructed organizational standards (Anderson and
Eshima, 2013; Slevin and Covin, 1997). Therefore, these firms benefit more from
accustomed routines and processes which reinforce their competitive advantage in
establishedmarketcontextsandentrepreneurialstrategies(Freemanetal.,1983).Onthe
otherhand,newbankswith the lower transferredgapbetween twodigital adoptions
seem to achieve better results in their exploratory innovation. The findings are
compatiblewithsomeauthorswhostressthatnewfirmshadaslightdominanceover
older firms in exploring new technologies (Nooteboom et al., 2006), leveraging their
knowledgeandexpandingtheirbusinessesviathe launchofnewproductsorservices
(NaldiandDavidsson,2014).Thepotentialexplanationsarebecausenewfirmstendto
react to newmarket opportunitiesmore quickly (Kilenthong et al., 2016) and/or are
moreadaptivetowardschangingexigenciesofthemarket(HillandRothaermel,2003).
Inshort,thefindingsprovethattheenablementoftransactionalwebsitesisbeneficialfor
bankenterprisesintheirdigitaltransformationcontext,nomattertheyareeitherold-
establishedornewlyestablishedorganizations.However,itshouldbenotedthatthese
benefitstendtovaryfrombanktobank,potentiallydependingonorganizationalnorms
andentrepreneurialstrategies.
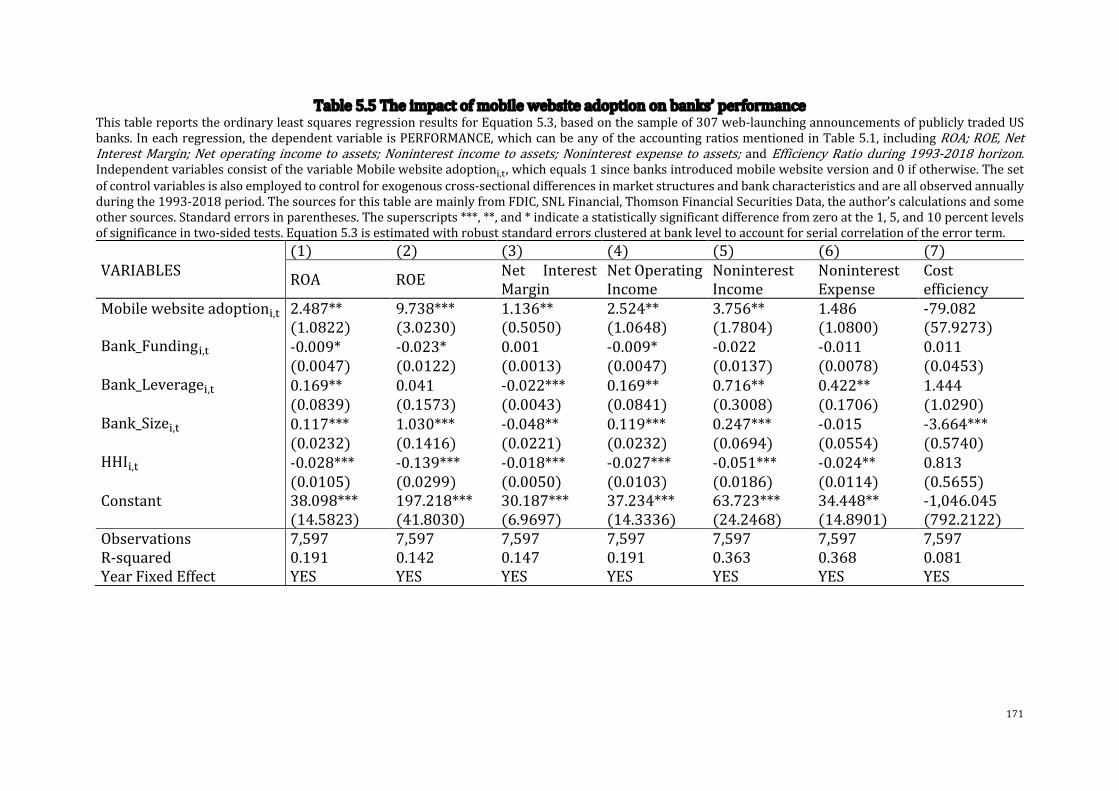
171
Table5.5Theimpactofmobilewebsiteadoptiononbanks’performanceThistablereportstheordinaryleastsquaresregressionresultsforEquation5.3,basedonthesampleof307web-launchingannouncementsofpubliclytradedUSbanks.Ineachregression,thedependentvariableisPERFORMANCE,whichcanbeanyoftheaccountingratiosmentionedinTable5.1,includingROA;ROE,NetInterestMargin;Net operating income to assets;Noninterest income to assets;Noninterest expense to assets; andEfficiencyRatio during1993-2018horizon.IndependentvariablesconsistofthevariableMobilewebsiteadoption!,#,whichequals1sincebanksintroducedmobilewebsiteversionand0ifotherwise.Thesetofcontrolvariablesisalsoemployedtocontrolforexogenouscross-sectionaldifferencesinmarketstructuresandbankcharacteristicsandareallobservedannuallyduringthe1993-2018period.ThesourcesforthistablearemainlyfromFDIC,SNLFinancial,ThomsonFinancialSecuritiesData,theauthor’scalculationsandsomeothersources.Standarderrorsinparentheses.Thesuperscripts***,**,and*indicateastatisticallysignificantdifferencefromzeroatthe1,5,and10percentlevelsofsignificanceintwo-sidedtests.Equation5.3isestimatedwithrobuststandarderrorsclusteredatbankleveltoaccountforserialcorrelationoftheerrorterm. (1) (2) (3) (4) (5) (6) (7)VARIABLES ROA ROE Net Interest
MarginNetOperatingIncome
NoninterestIncome
NoninterestExpense
Costefficiency
Mobilewebsiteadoption!,# 2.487** 9.738*** 1.136** 2.524** 3.756** 1.486 -79.082(1.0822) (3.0230) (0.5050) (1.0648) (1.7804) (1.0800) (57.9273)
Bank_Funding!,# -0.009* -0.023* 0.001 -0.009* -0.022 -0.011 0.011 (0.0047) (0.0122) (0.0013) (0.0047) (0.0137) (0.0078) (0.0453)Bank_Leverage!,# 0.169** 0.041 -0.022*** 0.169** 0.716** 0.422** 1.444 (0.0839) (0.1573) (0.0043) (0.0841) (0.3008) (0.1706) (1.0290)Bank_Size!,# 0.117*** 1.030*** -0.048** 0.119*** 0.247*** -0.015 -3.664*** (0.0232) (0.1416) (0.0221) (0.0232) (0.0694) (0.0554) (0.5740)HHI!,# -0.028*** -0.139*** -0.018*** -0.027*** -0.051*** -0.024** 0.813 (0.0105) (0.0299) (0.0050) (0.0103) (0.0186) (0.0114) (0.5655)Constant 38.098*** 197.218*** 30.187*** 37.234*** 63.723*** 34.448** -1,046.045 (14.5823) (41.8030) (6.9697) (14.3336) (24.2468) (14.8901) (792.2122)Observations 7,597 7,597 7,597 7,597 7,597 7,597 7,597R-squared 0.191 0.142 0.147 0.191 0.363 0.368 0.081YearFixedEffect YES YES YES YES YES YES YES

172
Table5.6Theimpactofinterconnectednessbetweentransactionalwebsiteadoptionandmobilewebsiteadoptiononbanks’performanceThistablereportstheordinaryleastsquaresregressionresultsforEquation5.4,basedonthesampleof307web-launchingannouncementsofpubliclytradedUSbanksduringthe1993-2018period.Ineachregression,thedependentvariableisPERFORMANCE,whichcanbeanyoftheaccountingratiosmentionedinTable5.1,includingROA;ROE;NetInterestMargin;Netoperatingincometoassets;Noninterestincometoassets;Noninterestexpensetoassets;andEfficiencyRatioduring1993-2018horizon.IndependentvariablesconsistofthevariableLow_Gap!,#,High_Gap!,#,Mobile_website_adoption!,#andtheinteractionbetweenthem.Thesetofcontrolvariablesisalsoemployedtocontrolforexogenouscross-sectionaldifferencesinmarketstructuresandbankcharacteristicsandareallobservedannuallyduringthe1993-2018period.ThesourcesforthistablearemainlyfromFDIC,SNLFinancial,ThomsonFinancialSecuritiesData,theauthor’scalculationsandsomeothersources.Standarderrorsinparentheses.Thesuperscripts***,**,and*indicateastatisticallysignificantdifferencefromzeroatthe1,5,and10percentlevelsofsignificanceintwo-sidedtests.Equation5.4isestimatedwithrobuststandarderrorsclusteredatbankleveltoaccountforserialcorrelationoftheerrorterm.
(1) (2) (3) (4) (5) (6) (7)VARIABLES ROA ROE Net Interest
MarginNet OperatingIncome
Non-interestIncome
Non-interestExpense Costefficiency
Mobile_websiteadoption !,#
2.274** 8.663*** 1.031** 2.302** 2.874* 0.838 -79.662(1.0861) (3.1784) (0.5077) (1.0695) (1.6145) (0.9264) (57.8291)
Low_Gap!,# -0.409** -1.860*** -0.171** -0.429** -1.638*** -1.178*** -1.051(0.2043) (0.5968) (0.0838) (0.2043) (0.6250) (0.3738) (2.0222)
Low_Gap!,#xMobile_website_adoption !,#
0.228** 1.540** 0.166** 0.232** 1.050*** 0.816*** 0.777
(0.0980) (0.6596) (0.0706) (0.0999) (0.3176) (0.2307) (2.1319)
Bank_Funding!,# -0.008* -0.020* 0.001 -0.008* -0.019 -0.010 0.013 (0.0044) (0.0114) (0.0012) (0.0044) (0.0127) (0.0072) (0.0441)Bank_Leverage!,# 0.170** 0.043 -0.022*** 0.169** 0.717** 0.423** 1.448 (0.0815) (0.1463) (0.0050) (0.0815) (0.2909) (0.1635) (1.0396)Bank_Size!,# 0.074* 0.835*** -0.065** 0.073* 0.072 -0.141* -3.781*** (0.0393) (0.1660) (0.0254) (0.0393) (0.1031) (0.0724) (0.5916)HHI!,# -0.025** -0.125*** -0.016*** -0.024** -0.038** -0.015 0.821 (0.0104) (0.0313) (0.0050) (0.0102) (0.0158) (0.0093) (0.5642)Constant 34.630** 180.152*** 28.464*** 33.602** 49.601** 24.077* -1,054.827 (14.5844) (43.8344) (7.0090) (14.3467) (21.2803) (12.4322) (790.6668)Observations 7,571 7,571 7,571 7,571 7,571 7,571 7,571R-squared 0.199 0.152 0.155 0.199 0.377 0.389 0.082

173
YearFixedEffect YES YES YES YES YES YES YESReferencevariable High-gap High-gap High-gap High-gap High-gap High-gap High-gap

174
5.5.2.5 MethodologyfortheInimitabilityofTransactionalWebsiteAdoption
Forassessingtheinimitabilityfeatureoftransactionalwebsiteadoption,therelationship
between“vicariouslearning”behaviourandbanks’performancesareexplored.Vicarious
learning behaviour, which is also known under many other terminologies (such as
“observational learning “or “learning by observing”), is a knowledge-accumulated
process that occurs throughobserving thebehaviour, actions, and activities of others
(Bandura,1980;Weiss,1990).Thissectionproposestwoscenariosrelevanttovicarious
learning:
- Firstly, if vicarious learning behaviour exerts a remarkable positive effect on
financialperformance, then the transactionalwebsiteadoptionsofantecedents
couldbelearnedandduplicatedbyfollowerstoimprovetheirownperformance.
- On the contrary, if this “learning-by-observing” behaviour has a negative or
insignificantimpactontheperformanceofobservers,itwouldbeunsuccessfulfor
lateradopterstomerelyobserveandmimictheadoptionoftransactionalwebsites
ofearlierrunners.
Theconstructionofthe“learningbyobserving”variable-RSTU!,# followsthedesignof
DeLongandDeYoung(2007)andMoatti (2009).46,47Thisvariable is estimatedas the
cumulativenumberofsamplebanksthatadoptedtransactionalwebsitesduringthethree
yearspriortothetransactionalwebsiteofbank$,%.Asaresult,thisvariableshouldbethe
proxy for “learning by observing” behaviour or more to the point, for perceivable
informationspilloverfromapreviousbank’stransactionalwebsiteadoption,asinline
withthedescriptionofDeLongandDeYoung(2007).48
Thedescriptive statistics of the “learningbyobserving” variables areprovided in the
Appendix,TableA.5.15.BasedontheconstructionofDeLongandDeYoung(2007),three
“learning by observing” variables- LBOY1, LBOY2, LBOY3 are constructed, in turn
representingthenumberofbanksthatadoptedtransactionalwebsitesintheprevious
one,twoorthreeyears,respectively.Forexample,forthebanksthatadopttransactional
46ThisvariableisalsofollowedandappliedbyotherstudiesafterwardsintermsofM&Adiscipline(e.g.Liangetal.,2020;Francisetal.,2014).47Moatti(2009)alsoconstructsthesamewaytoDeLongandDeYoung(2007)anddefinesthevariableastheproxyofimitationbehaviour.Inwhich,imitationbehaviourisestimatedthroughthenumberofM&Acarriedoutbyotherfirmsfortwoyearspriorortotheobservation.48The“learningbyobserving”behaviourofinvestorsisalsoexaminedinthenextchapter.Pleasereferto6.3.2forfurtherdiscussionaboutthisbehaviour.
175
websitesin1999,thereare55banks(LBOY1),69banks(LBOY2)and98banks(LBOY3)
thatadoptedtransactionalwebsitesin1998,1997&1998,and1996-1998,respectively.
The valueof “learningbyobserving” is basedon thenumberof banks that adopt the
transactionalwebsiteinagivenperiodoftime,i.e.,one,twoorthreeyears.Ascanbeseen
in Figure 3.4 in Chapter 3, in the sample used in this thesis, banks have adopted the
transactional website over 15 years between 1996 and 2010. The majority of the
transactionalwebsiteadoptionoccursbefore2003,andthereissignificantvariationin
thetotaladoptionswithinayearbetweenthemostactiveyears,from14in1997to67in
2000. the years. This means that there is significant variation in the “learning by
observing” variable over the years 1996-2010. As shown in Table A.5.15, the sample
years is similar in length to that studiedbyDeLongandDeYoung(2007),where they
examine the “learning by observing” in bankmergers and acquisitions over 13 years
between1987-1999.Thedistributionoftheir“learningbyobserving”variablesissimilar
tothiscase,whereseveralhighandlowpointsareobserved.
abcdTcefghb!,#
= j + l × RSTU!,# + n × hopqrosturvuwsxy!,# +U# + z!,#
(Equation5.5)
Where:
• Subscriptsiandtrepresentsthebankandtime(inyears),respectively.
• PERFORMANCEi,tandControlvariablesi,tareasdefinedisEquation5.1.
• LBOYi,tisthemainindependentvariableofinterest.
• Ytisafullsetofyeardummies.PleaseseethedescriptionofEquation5.1inSection
5.5.1.1forfurtherexplanationonthefixedeffects.
• Equation5.5isestimatedwithrobuststandarderrorsclusteredatbanklevelto
accountforserialcorrelationoftheerrorterm.
5.5.2.6 ResultsforInimitabilityofTransactionalWebsiteAdoption
Theresultsoftheinquiryintotheinimitabilityfeatureoftransactionalwebsiteadoption
are shown inTable5.7.Asproposed, anegativeor insignificant relationshipbetween
"learning by observing" and financial performance would suggest that there are no
significant financial awards for observing and reduplicating previous transactional
websiteadoptions.Overall,authenticatingHypothesis5.2., theresultsshowanegative

176
and/or insignificant impact of "observational learning" behaviour on banks'
performance,makingcleartheinimitabilityfeatureoftransactionalwebsiteadoption.
Firstly,observationallearningbehaviourisshowntomakeasignificantlynegativeimpact
onROEandnon-interest incomeofbanks,byadecreaseof0.015(p<0.05)and0.017
(p<0.01),respectively.Theresultssuggestthatitwouldbeharmfultobanksintermsof
theirabilitytogenerateprofit(especiallybyusinginvestors’moneyandinnon-interest
activities)iftheytrytoobserveandcopythetransactionalwebsiteadoptionofprevious
banks. Furthermore, in other respects (including ROA, Net Interest Margin, Cost
Efficiency), “learningbyobserving”behaviourdoesnotbring any significant financial
benefits.Theonlyaspectthatshouldbeadvantageousfromthe“learningbyobserving"
actionisthenon-interestexpensewithadropof0.012points(p<0.01).Nevertheless,it
isoutbalancedbytheworsedecreaseregardingnon-interestincome(-0.017point).
Tosumup, theresultsshownoevidence thatbankscanachieveremarkable financial
returnsandefficiencybyobservingandimitatingtheadoptionoftransactionalwebsites
frompreviousadopters.Furthermore,imitatingbehaviourcouldworsenabadscenario
byreducingbankfirms’profitabilityandefficiency.Thefindings,inthisfashion,would
indicatethattheadoptionofthetransactionalwebsiteofeachbankpotentiallyhastacit
andspecific features thatmake itnoteasy tobeperfectlymimickedandprofitable to
othercompetitors.Thefindings,therefore,supportstudiesthatpointoutspecificassets
of ITC adoption and digital adoption that make it incomprehensible, elusive, and
ambiguouslycorrelatedwithindividualfirms(ArslanandOzturan,2011;Dibrelletal.,
2008;Ohetal.,2007;Tianetal.,2010).Ontopofthis,thefindingssupportotherresearch
which clears up the biases, constraints, and negative consequences of imitative or
vicariouslearningmechanism(ArgyrisandSchön,1978;DeCarolis,2003;Levinthaland
March,1993;MinerandMezias,1996;TerlaakandGong,2008).
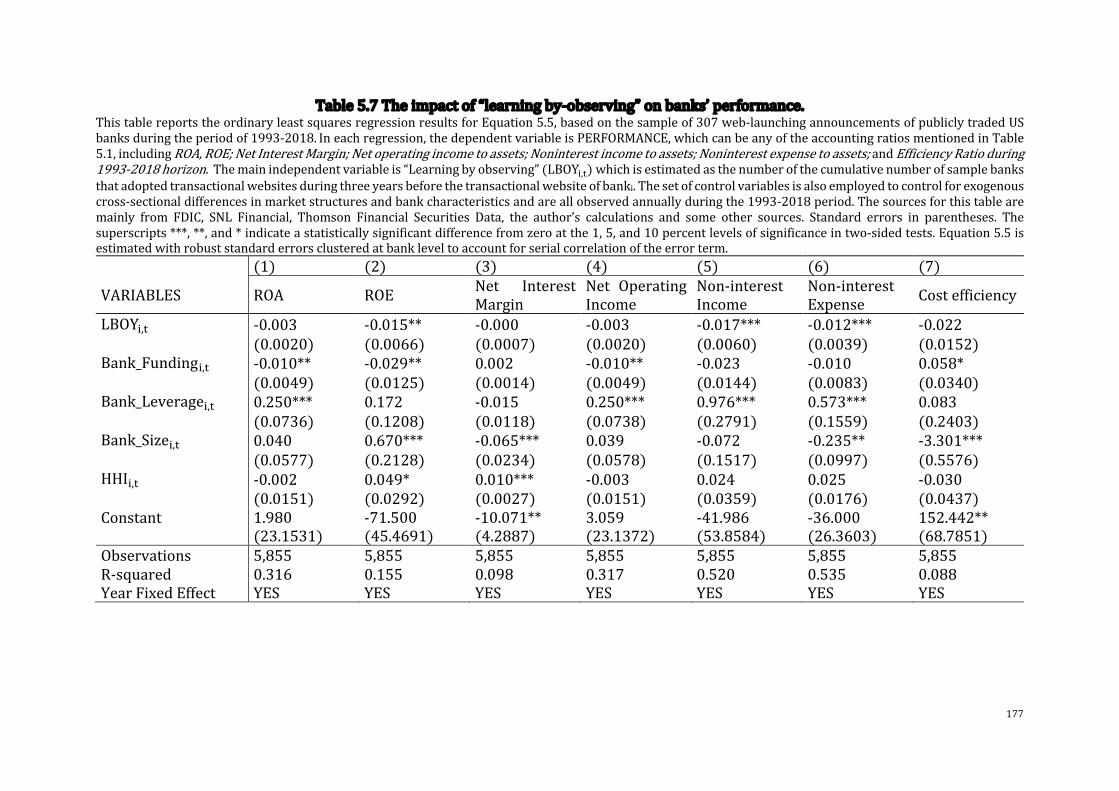
177
Table5.7Theimpactof“learningby-observing”onbanks’performance.ThistablereportstheordinaryleastsquaresregressionresultsforEquation5.5,basedonthesampleof307web-launchingannouncementsofpubliclytradedUSbanksduringtheperiodof1993-2018.Ineachregression,thedependentvariableisPERFORMANCE,whichcanbeanyoftheaccountingratiosmentionedinTable5.1,includingROA,ROE;NetInterestMargin;Netoperatingincometoassets;Noninterestincometoassets;Noninterestexpensetoassets;andEfficiencyRatioduring1993-2018horizon.Themainindependentvariableis“Learningbyobserving”(LBOY!,#)whichisestimatedasthenumberofthecumulativenumberofsamplebanksthatadoptedtransactionalwebsitesduringthreeyearsbeforethetransactionalwebsiteofbanki.Thesetofcontrolvariablesisalsoemployedtocontrolforexogenouscross-sectionaldifferencesinmarketstructuresandbankcharacteristicsandareallobservedannuallyduringthe1993-2018period.Thesourcesforthistablearemainly from FDIC, SNL Financial, Thomson Financial Securities Data, the author’s calculations and some other sources. Standard errors in parentheses. Thesuperscripts***,**,and*indicateastatisticallysignificantdifferencefromzeroatthe1,5,and10percentlevelsofsignificanceintwo-sidedtests.Equation5.5isestimatedwithrobuststandarderrorsclusteredatbankleveltoaccountforserialcorrelationoftheerrorterm.
(1) (2) (3) (4) (5) (6) (7)
VARIABLES ROA ROENet InterestMargin
Net OperatingIncome
Non-interestIncome
Non-interestExpense
Costefficiency
LBOY!,# -0.003 -0.015** -0.000 -0.003 -0.017*** -0.012*** -0.022 (0.0020) (0.0066) (0.0007) (0.0020) (0.0060) (0.0039) (0.0152)Bank_Funding!,# -0.010** -0.029** 0.002 -0.010** -0.023 -0.010 0.058* (0.0049) (0.0125) (0.0014) (0.0049) (0.0144) (0.0083) (0.0340)Bank_Leverage!,# 0.250*** 0.172 -0.015 0.250*** 0.976*** 0.573*** 0.083 (0.0736) (0.1208) (0.0118) (0.0738) (0.2791) (0.1559) (0.2403)Bank_Size!,# 0.040 0.670*** -0.065*** 0.039 -0.072 -0.235** -3.301*** (0.0577) (0.2128) (0.0234) (0.0578) (0.1517) (0.0997) (0.5576)HHI!,# -0.002 0.049* 0.010*** -0.003 0.024 0.025 -0.030 (0.0151) (0.0292) (0.0027) (0.0151) (0.0359) (0.0176) (0.0437)Constant 1.980 -71.500 -10.071** 3.059 -41.986 -36.000 152.442** (23.1531) (45.4691) (4.2887) (23.1372) (53.8584) (26.3603) (68.7851)Observations 5,855 5,855 5,855 5,855 5,855 5,855 5,855R-squared 0.316 0.155 0.098 0.317 0.520 0.535 0.088YearFixedEffect YES YES YES YES YES YES YES

178
5.5.3 Hypothesis5.5:TheInter-FirmHeterogeneityAttributedtoSizeEffect
5.5.3.1 Methodology
Firstofall, foreachyear,thebanksaredividedintotwoequallydistributedquantiles:
Small-sizedbanksandLarge-sizedbanks.Thesmall-sizedbankgroupmakesup50%of
samplebankswiththesmallestassetvalueeachyear,andthelarge-sizedbankincludes
theremaining50%ofbankswiththelargestassetvalue.It’simportanttonotethatin
Chapter4,Section4.4.2,samplebanksaredividedintothreesub-samplesbasedontheir
size.WiththeaimofsimplifyingtheinterpretationoftheinteractionterminEquation5.6
below,it’sdecidedtousetwogroupsbasedonbanksizehere.However,tobeconsistent
withChapter4andforrobustness,inSection5.6.3,theresultsusingthreegroupsbased
onbanksizearealsoexamined.
Subsequently, two dummy variables are created, including STUVV_XUYZ!,# and
[U\]^_XUYZ!,# . Regarding the STUVV_XUYZ!,# variable, only banks that belong to the
Small-sizedgroupwillreceivethevalueof1,andtherebybanksintheLarge-sizedgroup
willreceivethevalueof0.Inasimilarprocess,concerningthe[U\]^_XUYZ!,#variable,
onlybanks in theLarge-sizedgroupwill get a valueof 1. Finally, these twovariables
independently interactedwith the`\UYaUbcdeYUV_f^gadc^_UheicdeY!,# variable.These
interactionswillservewelltheaimoftheresearchobjectiveastheyenableustotrack
down two distinct degrees of transactional websites’ impact on bank’s performance
acrossdifferentsizegroups.
ThemodelforHypothesis5.3ispresentedasfollows:
!"#$%#&'()"%,'= , + . × 0123425678329_;<=476<_2>8?6783%,'+ k × @A299_B23C%,'+ l ×0123425678329_;<=476<_2>8?6783%,'
× @A299_B23C%,' +D × )836189E2172=9<4%,' +m$ + F%,'
(Equation
5.6)
179
Where:
• Subscriptsiandtrepresentsthebankandtime(inyears),respectively.
• PERFORMANCEi,tandControlvariablesi,tareasdefinedisEquation5.1.
• Theinteractionbetween`\UYaUbcdeYUV_f^gadc^_^ti^\d^Yb^!,#andSmall_Banki,t
isthemainindependentvariableofinterest.Large_Banki,tisusedasthereference
category.
• Ytisafullsetofyeardummies.PleaseseethedescriptionofEquation5.1inSection
5.5.1.1forfurtherexplanationonthefixedeffects.
• Equation5.6isestimatedwithrobuststandarderrorsclusteredatbanklevelto
accountforserialcorrelationoftheerrorterm.
• Thelarge-sizedbankgroupisusedasthereferencecategory.
Inaddition, regressionson twodifferentsub-samplesbasedonsmall-sizedbanksand
large-sizedbanksarealsoexaminedtoconsiderifthereisanysignificantdistinctionin
the impact of transactionalwebsite adoption on the performance of each sub-sample
group.TheequationissimilartoEquation5.1butitisregressedintwodifferentsamples.
5.5.3.2 ResultsfortheSizeEffect
Table5.8andTable5.9reportonhowthesizeeffectinfluencestherelationshipbetween
transactionalwebsiteadoptionandbanks’performance.Inparticular,Table5.8presents
the results for the full sample,which includesboth small-sizedbanks and large-sized
banks whereas Table 5.9 shows the independent outcomes for two subsamples: the
small-sizedbankgroup(PanelA)andthelarge-sizedbankgroup(PanelB).Ingeneral,
bothrevealthattheadoptionofthetransactionalwebsitehasamoreprofoundeffecton
smallbanksthanlargerones.
Firstly, as presented inTable5.8, a significantdifference in theperformanceof small
banks couldbe seen in theabsenceandavailabilityof transactionalwebsiteadoption
comparedtotheirmajorcompetitors.Withthelackoftransactionalwebsites,smallbanks
arelikelytoperformworsethanlargerbankswithnegativecoefficientsinbothfivefirst
termsandpositivecoefficientsintermsofcost-efficiency.Moreconcretely,withoutthe
adoptionofthetransactionalwebsite,comparedtothelargebanks,smallbanksleadtoa
decreaseof-0.819,-4.276,-0.824,and14.035points(allp-values<0.01)intermsofROA,
ROE,non-interest incomeandcostefficiency, respectively. Smallbanks seem toenjoy
180
lowernon-interest expenses (-1.042, p<0.1), but they still suffer frommorenegative
non-interestincome(-2.220,p<0.05)comparedtotheirlarge-sizedrivals.
Butthesituationhaschangedsincetransactionalwebsiteswereactivated.Smallbanks
showaremarkableimprovementoverthebigcompetitors.Inparticular,thecoefficient
valuesoftheinteractionbetweensmallbanksandtransactionalwebsiteadoptionareall
positive for the first five columns, indicating that the impact of transactionalwebsite
adoptionhasamoresignificanteffectonsmaller-sizedcompanies thanon large-scale
companies.Small-scaledbanks,byadoptingtransactionalwebsites,couldenjoyhigher
ROA,ROE,netinterestmargin,Netoperatingincome,andNoninterestincomeby0.626
(p<0.1),1.741(p<0.1),0.197(p<0.05),0.620(p<0.1)and2.077(p<0.1)percentage
points,respectively,comparedtotheir largerivals.Thenon-interestexpenseofsmall-
sized banks is also higher by 1.437 points (p<0.05), but it is also offset by a higher
increaseof2.077(p<0.1)ofnon-interestincome.
Whenthesamplebanksaredividedintotwosizegroups,thesignofmagnitudeeffectis
stillhold.Tobemorespecific, theperformanceof smallbankswasmoresignificantly
affectedbythetransactionalwebsiteadoptionthanthelargecompanies.Aspresentedin
Table5.9,thecoefficientvaluescorrespondingtoSmallBanks(PanelA)aresignificant
mostly,atleastat10%.Meanwhile,thecoefficientvaluesregardingLargeBanks(Panel
B)arefarlesssignificant(onlysignificantat10%intermsofNetOperatingIncomeand
Non-interest income).Moreover, the coefficients that show the effect of transactional
websiteadoptiononsmallbanksarealsohigherthanonlargeones.Thecoefficientsare
15.9times,4.54times,2.84times,11.591higherforsmallerbanks,correspondingtothe
areaofROA,ROE,andNetInterestMarginandNetOperatingincome,respectively.Small
banksimmenselyimprovecostefficiencycomparedtolargebanks,astheadoptionofa
transactionalwebsitereducesthecost-efficiencyratioby58.75times(-29.317compared
to 0.499). The margin of difference between income and expenses in non-interest
activitiesisalsohigherforsmallbanks.Incomeisabout1.62timeshigherthanexpenses
regardingsmallbankswhilethisratiois1.26forlargebanks.
Tosumup,theresultspresentedinTable5.8andTable5.9stronglysupportHypothesis
5.3, inwhich,thetransactionalwebsiteadoptionmattersmorefortheperformanceof
smallbanks,comparedtothelarge-scalebanks.Putdifferently,smallbankenterprises
are more financially benefited than larger peers from the transactional website
enablement. Some potential explanations and relevant literature have been already

181
discussedinSection5.3.3.Inwhich,smallbanksarelikelytogainbettervaluesfromthe
transactionalwebsiteadoptiondueto(i) theirdynamicandabsorptivecapability, (ii)
their less sophisticated organizational structures, and (iii) their more opportunistic
behaviour.Thisviewpointisalsoinlinewithauthorswhoalsosuggestthatsmallbanks
aremoresuccessfulandefficientininnovatingor/andimplementingbusinesspractices
(Acs and Audretsch, 1990; Hamilton et al., 2009; Zenger, 1994). Furthermore, the
findingsalsosuggestthattransactionalwebsiteadoptionbringsmoreopportunitiesfor
smallbanksand leverages theirpotentialcapacities.Putdifferently, “Internetbanking
couldofferentryandexpansionopportunitiesthatsmallbankstraditionallylacked”,as
saidbyCarlsonetal.(2001,p.1).

182
Table5.8Theimpactofsizeeffectonbanks’performance
ThistablereportstheordinaryleastsquaresregressionresultsforEquation5.6,basedonthesampleof307web-launchingannouncementsofpubliclytradedUSbanksduringthe1993-2018period.Ineachregression,thedependentvariableisPERFORMANCE,whichcanbeanyoftheaccountingratiosmentionedinTable5.1;includingROA;ROE;NetInterestMargin;Netoperatingincometoassets;Noninterestincometoassets;Noninterestexpensetoassets;andEfficiencyRatioduring1996-2013 horizon. The main independent variables areSmall_Bank!,#and the interaction with the*+,-.,/012-,3_456.105_,728012-!,#.Thesetofcontrolvariablesisalsoemployedtocontrolforexogenouscross-sectionaldifferencesinmarketstructuresandbankcharacteristicsandareall observedannuallyduring the1993-2013period.The sources for this tablearemainly fromFDIC, SNLFinancial,ThomsonFinancialSecurities Data, the author’s calculations and some other sources. Please note that the results in this table only display the coefficients ofSmall_Bank!,#andSmall_Bank!,#x Transactional_website_adoption!,#. Large_Bank!,# is treated as a reference category. Therefore, the coefficients shownSmall_Bank!,#andSmall_Bank!,#x Transactional_website_adoption!,#variables present the comparison to Large_Bank!,#andLarge_Bank!,#xTransactional_website_adoption!,#. Thesmall-sized bankgroup comprises 50% of sample banks with the smallest asset values each year, and thelarge-sizedbankgroupincludestheremaining50%ofbankswiththelargestmarketcapitalization.Standarderrorsinparentheses.Thesuperscripts***,**,and*indicateastatisticallysignificantdifferencefromzeroatthe1,5,and10percentlevelsofsignificanceintwo-sidedtests.Equation5.6isestimatedwithrobuststandarderrorsclusteredatbankleveltoaccountforserialcorrelationoftheerrorterm.
(1) (2) (3) (4) (5) (6) (7)
VARIABLESROA ROE
Net Interest
Margin
NetOperating
Income
Noninterest
Income
Noninterest
ExpenseCostefficiency
Transactional_
website_adoption!,#
0.591** 2.694** 0.083 0.624** 1.916*** 1.115*** -9.474**
(0.2500) (1.0784) (0.0966) (0.2530) (0.6598) (0.4010) (4.1598)
Small_Bank!,#-0.819*** -4.276*** -0.074 -0.824*** -2.220** -1.042* 14.035***
(0.2889) (0.7516) (0.1044) (0.2895) (0.9939) (0.5769) (3.4405)
Small_Bank!,#xTransactional_
website_adoption!,#
0.626* 1.741* 0.197** 0.620* 2.077* 1.437** -5.751
(0.3666) (0.9111) (0.0917) (0.3674) (1.1981) (0.6868) (3.6802)
Bank_Funding!,#-0.008* -0.018 0.001 -0.009* -0.020 -0.011 -0.007
(0.0047) (0.0121) (0.0013) (0.0047) (0.0136) (0.0077) (0.0446)
Bank_Leverage!,#0.170** 0.025 -0.020*** 0.170** 0.720** 0.430** 1.510
(0.0840) (0.1567) (0.0049) (0.0841) (0.2987) (0.1678) (1.0147)
HHI!,#-0.010** -0.059*** -0.009*** -0.010** -0.038*** -0.028*** 0.093*
(0.0043) (0.0145) (0.0010) (0.0043) (0.0129) (0.0075) (0.0557)
Constant15.207*** 99.614*** 17.948*** 14.228** 50.454*** 40.177*** -87.396
(5.6292) (20.0706) (1.4288) (5.6629) (16.4186) (9.5353) (75.2170)
Observations 7,597 7,597 7,597 7,597 7,597 7,597 7,597
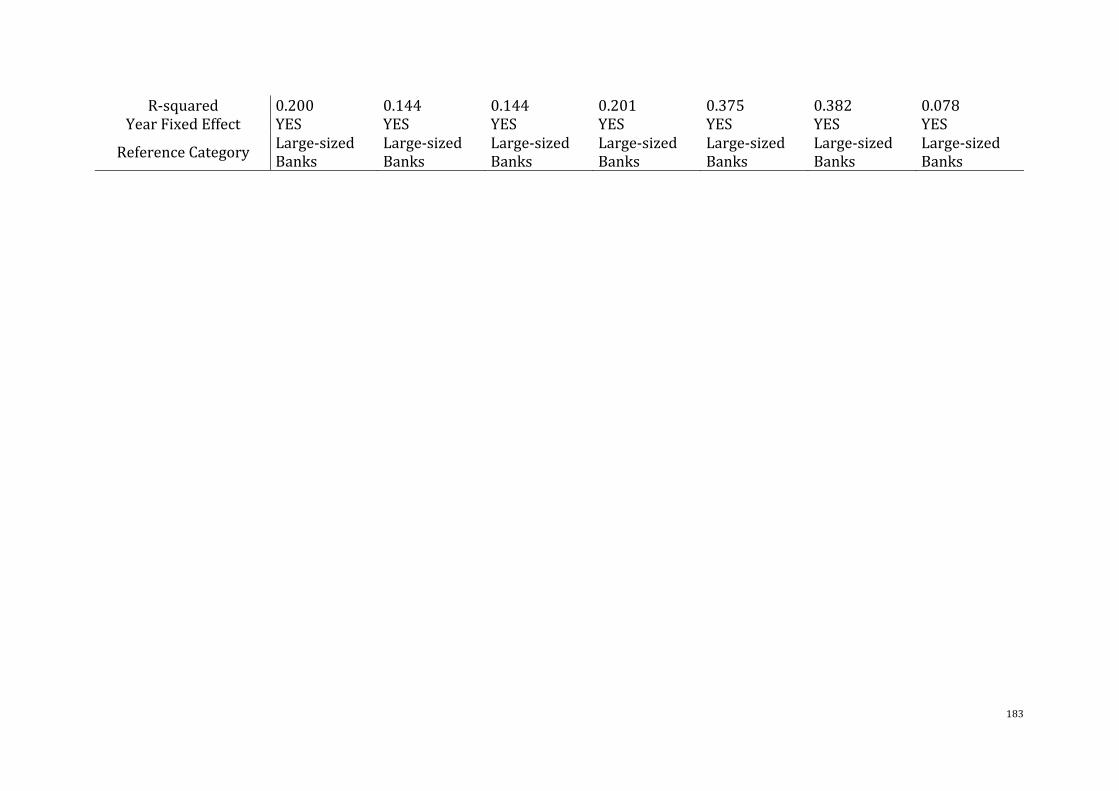
183
R-squared 0.200 0.144 0.144 0.201 0.375 0.382 0.078
YearFixedEffect YES YES YES YES YES YES YES
ReferenceCategoryLarge-sized
Banks
Large-sized
Banks
Large-sized
Banks
Large-sized
Banks
Large-sized
Banks
Large-sized
Banks
Large-sized
Banks

184
Table5.9Themagnitudeimpactinadoptingtransactionalwebsite-Sub-samples.
ThistablereportstheordinaryleastsquaresregressionresultsforEquation5.1,basedonthesub-sampleofsmall-sizedbanks(PanelA)andlarger-sizedbanks(PanelB).Theoriginaldatasampleincludes307web-launchingannouncementsofpubliclytradedUSbanksduringthe1993-2018periodbasedonthesampleof307web-launchingannouncementsofpubliclytradedUSbanksduringthe1996-2013period.Ineachregression,thedependentvariableisPERFORMANCE,whichcanbeanyoftheaccountingratiosmentionedinTable5.1;includingROA,ROE,NetInterestMargin,Netoperatingincometoassets,Noninterestincometoassets,Noninterestexpensetoassets,andEfficiencyRatio.Thesetofcontrolvariables isalsoemployedtocontrol forexogenouscross-sectionaldifferences inmarketstructuresandbankcharacteristicsandareallobservedannuallyduringthe1993-2013period.ThesourcesforthistableareSNLFinancial,FIDC,ThomsonFinancialSecuritiesData,theauthor’scalculations,andothersources.Standarderrorsinparentheses.Thesuperscripts***,**,and*indicateastatisticallysignificantdifferencefromzeroatthe1,5,and10percentlevelsofsignificanceintwo-sidedtests.Equation5.1isestimatedwithrobuststandarderrorsclusteredatbankleveltoaccountforserialcorrelationoftheerrorterm.
PanelA:Sub-sample-SmallBanks
(1) (2) (3) (4) (5) (6) (7)
VARIABLES ROA ROE Net Interest
Margin
Net
Operating
Income
Non-interest
Income
Non-interest
Expense
Costefficiency
Transactional_
website_adoption!,#
1.671* 5.386* 0.435*** 1.704** 4.281** 2.641** -29.317***
(0.8538) (2.7530) (0.1540) (0.8620) (2.1160) (1.1925) (9.3580)
Bank_Funding!,# -0.018* -0.046** 0.002 -0.018* -0.044* -0.021 0.061
(0.0092) (0.0224) (0.0021) (0.0092) (0.0258) (0.0146) (0.0923)
Bank_Leverage!,# 0.185*** 0.146 -0.028*** 0.185*** 0.768*** 0.443*** 1.257
(0.0677) (0.0901) (0.0056) (0.0679) (0.2564) (0.1493) (1.1701)
HHI!,# -0.020*** -0.111*** -0.011*** -0.019*** -0.034*** -0.017** 0.537***
(0.0037) (0.0178) (0.0020) (0.0037) (0.0100) (0.0067) (0.1268)
Bank_Size!,# 0.293 2.692*** -0.016 0.292 -0.138 -0.554 -15.170***
(0.3027) (0.8872) (0.0882) (0.3013) (0.6120) (0.3638) (3.1987)
Constant 24.554*** 138.901*** 19.787*** 23.031*** 45.477*** 29.950*** -531.727***
(6.2674) (28.9970) (2.3480) (6.3640) (15.0727) (9.0219) (151.0744)
Observations 3,805 3,805 3,805 3,805 3,805 3,805 3,805
R-squared 0.225 0.114 0.155 0.225 0.426 0.443 0.105
Fixedeffect YES YES YES YES YES YES YES
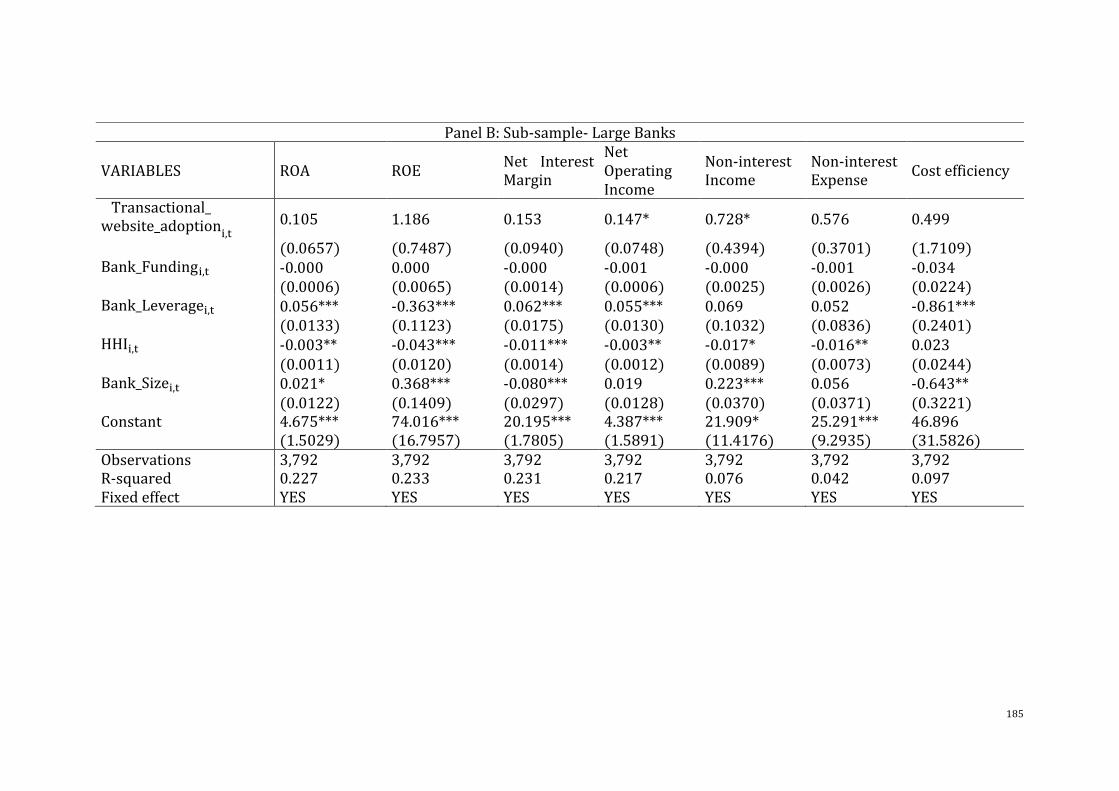
185
PanelB:Sub-sample-LargeBanks
VARIABLES ROA ROENet Interest
Margin
Net
Operating
Income
Non-interest
Income
Non-interest
ExpenseCostefficiency
Transactional_
website_adoption!,# 0.105 1.186 0.153 0.147* 0.728* 0.576 0.499
(0.0657) (0.7487) (0.0940) (0.0748) (0.4394) (0.3701) (1.7109)
Bank_Funding!,# -0.000 0.000 -0.000 -0.001 -0.000 -0.001 -0.034
(0.0006) (0.0065) (0.0014) (0.0006) (0.0025) (0.0026) (0.0224)
Bank_Leverage!,# 0.056*** -0.363*** 0.062*** 0.055*** 0.069 0.052 -0.861***
(0.0133) (0.1123) (0.0175) (0.0130) (0.1032) (0.0836) (0.2401)
HHI!,# -0.003** -0.043*** -0.011*** -0.003** -0.017* -0.016** 0.023
(0.0011) (0.0120) (0.0014) (0.0012) (0.0089) (0.0073) (0.0244)
Bank_Size!,# 0.021* 0.368*** -0.080*** 0.019 0.223*** 0.056 -0.643**
(0.0122) (0.1409) (0.0297) (0.0128) (0.0370) (0.0371) (0.3221)
Constant 4.675*** 74.016*** 20.195*** 4.387*** 21.909* 25.291*** 46.896
(1.5029) (16.7957) (1.7805) (1.5891) (11.4176) (9.2935) (31.5826)
Observations 3,792 3,792 3,792 3,792 3,792 3,792 3,792
R-squared 0.227 0.233 0.231 0.217 0.076 0.042 0.097
Fixedeffect YES YES YES YES YES YES YES

186
5.5.4 Hypothesis5.4:Inter-firmHeterogeneityAttributedtotheTimingOrder.
5.5.4.1 Methodology
Theaimof this section is touse regressionequations to considerwhether the timing
ordersaffecttheinfluenceofbankingwebsiteadoptionontheperformanceofbankfirms.
Todothis,thefollowingstepswerecarriedout:
Firstly,thebanksamplesareclassifiedintothreegroupswithequallydistributedtiming
orders: the first-mover group, the second-mover group, and the laggard group.More
pointedly, the first-movergroup includesbankswhohaveadopted their transactional
website earliest, from 1996 to 1998.Meanwhile, the second-mover group consists of
bankswhowerethefollowersinlaunchingtransactionalwebsites.Theeventtimeofthis
group falls into the1999-2000period.Finally, the laggardgroupcoversbankswhose
transactionalwebsiteshavebeentriggeredaftertheyear2000.
Afterwards,basedontheseclassifications,threeseparatedummyvariablesarecreated,
namely LMNOP_RSTUNO!,# , VUWSXY_RSTUNO!,# , and Z[\\[NY!,# , which represent three
distincttimingorderbankinggroups,asdiscussedabove.LMNOP_RSTUNO!,#variableequals
1,ifbankshavetheadoptionyearwithinthe1996-1998interval,otherwiseitequals0.
Similarly, the VUWSXY_RSTUNO!,# variable equals 1 if the event year fallswithin 1999-
2000,otherwise,itequals0.Z[\\[NY!,#equals1iftheadoptionyearisafter2000.
Finally, to explore the influence of the timing order effect on the relationship of
transactionalwebsiteadoptionandbank’sperformance,thevariablesLMNOP_RSTUNO!,# ,
and VUWSXY_RSTUNO!,# interacted with `N[XO[WPMSX[a_bUcOMPU_[YSdPMSX!,# ,
independently.
ThemodelforHypothesis5.4ispresentedasfollows:
efgLhgijklf!,#= n + p × `N[XO[WPMSX[abUcOMPU[YSdPMSX!,#+ r% × LMNOPRSTUNO!,# + r& × VUWSXYRSTUNO!,#+ s% × `N[XO[WPMSX[abUcOMPU[YSdPMSX!,# × LMNOPRSTUNO!,#+ s& × `N[XO[WPMSX[abUcOMPU[YSdPMSX!,# × VUWSXYRSTUNO!,# +t × lSXPNSaT[NM[caUO!,# + u#+v!,#
(Equation5.7)
187
Where:
• Subscriptsiandtrepresentsthebankandtime(inyears),respectively.
• PERFORMANCEi,tandControlvariablesi,tareasdefinedisEquation5.1.
• The interaction between `N[XO[WPMSX[a_bUcOMPU_UÄdUNMUXWU!,# and
First_moversi,tandtheinteractionbetween N[XO[WPMSX[a_bUcOMPU_UÄdUNMUXWU!,#
andSecond_moversi,tarethemainindependentvariablesofinterest.Laggardsi,tis
usedasthereferencecategory.
• Ytisafullsetofyeardummies.PleaseseethedescriptionofEquation5.1inSection
5.5.1.1forfurtherexplanationonthefixedeffects.
• Equation5.7isestimatedwithrobuststandarderrorsclusteredatbanklevelto
accountforserialcorrelationoftheerrorterm.
5.5.4.2 ResultsfortheTimingEffect
Table5.10showstheexaminationoftheimpactoftimingordereffectontherelationship
betweenthetransactionalwebsiteadoptionandbanks’performance.Overall,theresults
showthattheadvantagesoffirstandearlymoverswouldseemtobedismissedovertime.
The results are firstly reflected via the coefficients of the variables
[LMNOPiSTUNÄ`N[XO[WPMSX[aÑUcOMPUjYSdPMSX] and [VUWSXYiSTUN xTransactional
websiteAdoption]49.Ascouldbeseen,theadoptionofthetransactionalwebsiteappears
tofavourfirstandsecondrunners.TherelevantcoefficientsarepositiveintermsofROA,
ROE,NetOperatingIncome,Non-interestIncomeandnegativeintermsofCostEfficiency
Ratio.Morepointedly,bytheadoptionofatransactionalwebsite,thefirstadopterscould
gainasurgeof0.224and0.554intermsofROAandROEwhilethesecondmoverscan
potentiallyenjoythegrowthof0.069and0.156intermsofthesamedimensions.Also,
firstmoversarelikelytomanagetheirexpendituremosteffectivelywithareductionin
cost efficiency ratio (-0.491). In the interim, second-adopting firms appear to be less
efficientinadoptingtheirtransactionalwebsiteasthecostefficiencyratiostepsupby
4.998points. Interestingly, this finding isalsocompatiblewiththedifferencebetween
earningsandexpensesofnon-interestactivities.Leading-announcerfirmsseemtomake
49 Please note that theLaggard!,# is the reference variable in all the regressions, so the coefficientsassociatedwiththisvariablewillnotbeshown.

188
moremoneythanwhattheymustpay(1.003and0.533)wheretherewouldseemnotto
bemuchdifferenceinoverheadsandincomefromthesecondaryadopters'non-interest
activities(0.474and0.305).
Although the coefficients are likely to reward first launchers andother early birds in
comparisontotheirlate-adoptedrivals,itshouldbestressedthatthosecoefficientsare
not statistically significant. Moreover, predecessors tend to be less profitable than
latecomersthroughouttheyearsintermsofNetInterestMargin(-0.315and-0.217).
Inshort,theresultspresentedinTable5.10couldclaimthatthefirst-moverstatusseems
to bring more generous benefits, but these rewards do not appear to induce any
appreciabledifferencebetweenfirstrunnersandthosewhoarrivelateinthelongterm.
Consequently,theresultsareincommonwithstudiesthatshowthattheadvantagesof
firstcomersarequicklyeliminatedandcouldbenotinsuredovertime(Carpenterand
Nakamoto,1990;Duttaetal.,2014;SuarezandLanzolla,2005).Theresultsalsosupport
the studieswhichargue thatadoptersatdifferent stagesof adoptionpotentiallyhave
theirownidiosyncraticadvantages.Thereby,thetimingorderisnotthekeydeterminant
in significantlydifferentiating the financialprofitsearned from transactionalwebsites
whichareadoptedatdifferenttimes.However,itwouldbeworthwhiletofurtherdelve
into what the distinctive competitive edges of early adopters and latecomers are in
adoptingtransactionalwebsitesovertime.Toanswerthequestion,moreconceptualand
empiricalexaminationshouldbedevelopedinthefuture.

189
Table5.10Theimpactoftimingeffectinadoptingthetransactionalwebsite.
ThistablereportstheordinaryleastsquaresregressionresultsforEquation5.7,basedonthesampleof307web-launchingannouncementsofpubliclytradedUSbanksduringthe1993-2018period.Ineachregression,thedependentvariableisPERFORMANCE,whichcanbeanyoftheaccountingratiosmentionedinTable5.1,includingROA,ROE,NetInterestMargin,Netoperatingincometoassets,Noninterestincometoassets,Noninterestexpensetoassets,andEfficiencyRatioduring1993-2018 horizon. Independent variables consist of three dummy variables: First_mover!,#, Second_mover!,#, and their interactions withTransactional_website_adoption!,#.Thesetofcontrolvariablesisalsoemployedtocontrolforexogenouscross-sectionaldifferencesinmarketstructuresandbankcharacteristicsandareall observedannuallyduring the1993-2018period.The sources for this tablearemainly fromFDIC, SNLFinancial,ThomsonFinancialSecurities Data, the author’s calculations and some other sources. Please note that the results in the table only display the coefficients of First_mover!,#,Second_mover!,#,andtheir interactionswithTransactional_website_adoption!,#.Laggard!,# is treatedasareferencecategory.Therefore, thecoefficientsshowninFirst_mover!,#, Second_mover!,#, and their interactions with Transactional_website_adoption!,# would reveal the comparison to Laggard!,# andTransactional_website_adoption!,# × Laggards!,#.Standarderrorsinparentheses.Thesuperscripts***,**,and*indicateastatisticallysignificantdifferencefromzeroatthe1,5,and10percentlevelsofsignificanceintwo-sidedtests.Equation5.7isestimatedwithrobuststandarderrorsclusteredatbankleveltoaccountforserialcorrelationoftheerrorterm.VARIABLES (1) (2) (3) (4) (5) (6) (7)
ROA ROE Net Interest
Margin
Net
Operating
Income
Non-interest
Income
Non-interest
Expense
Costefficiency
Transactional_
website_adoption!,#
0.631* 1.926 0.270*** 0.667* 1.949** 1.274** -12.707**
(0.3363) (1.2018) (0.0888) (0.3398) (0.8692) (0.4950) (5.2169)
First_mover!,# 0.269** 2.091*** 0.381*** 0.310*** 0.694* 0.536* 0.169
(0.1135) (0.7314) (0.1312) (0.1159) (0.3695) (0.2737) (6.4495)
Second_mover!,# 0.131 1.029 0.278** 0.192 0.004 -0.042 -6.397
(0.1283) (0.6904) (0.1353) (0.1303) (0.4177) (0.2957) (4.1513)
Transactional_
website_adoption!,#x
First_mover!,#
0.224 0.554 -0.315*** 0.200 1.003 0.533 -0.491
(0.2288) (0.7458) (0.1061) (0.2322) (0.8554) (0.5456) (6.1286)
Transactional_
website_adoption!,#x
Second_mover!,#
0.069 0.156 -0.217** 0.018 0.474 0.305 4.998
(0.1325) (0.7056) (0.1026) (0.1348) (0.4303) (0.2822) (4.0458)
Bank_Funding!,#-0.008* -0.016 0.001 -0.008* -0.018 -0.009 0.007
(0.0041) (0.0110) (0.0013) (0.0041) (0.0121) (0.0069) (0.0440)
0.169** 0.036 -0.022*** 0.169** 0.713** 0.420** 1.423

190
Bank_Leverage!,# (0.0809) (0.1450) (0.0049) (0.0809) (0.2906) (0.1641) (1.0128)
Bank_Size!,# 0.055 0.723*** -0.059** 0.055 0.028 -0.156* -3.512***
Constant -0.679** 4.158** 5.238*** -0.770*** -5.079*** 1.760 95.163***
(0.2697) (1.8056) (0.3359) (0.2723) (1.5759) (1.1902) (11.2587)
Observations 7,597 7,597 7,597 7,597 7,597 7,597 7,597
R-squared 0.202 0.156 0.156 0.203 0.378 0.385 0.084
YearFixedEffect YES YES YES YES YES YES YES
ReferenceVariable Laggards Laggards Laggards Laggards Laggards Laggards Laggards

191
5.6 Robustnesstest
5.6.1 Meandifferenceinbanksaccountingperformance.
Todeterminethecontributionofaspecificpracticetotheperformanceoffirms,previous
studiesemployanaccountingapproachtocomparetheperformanceoffirmsbeforeand
after adopting such practices (e.g. Cornett and Tehranian, 1992; Healy et al., 1992;
Cornettetal.,2006;DeLongandDeYoung,2007).Thecreationofpre-ratiosandpost-
ratiosallowsresearcherstodrawtheconclusionofwhetherthereisanimprovementin
the firmbeforeandafter theiradoptionofparticularbusinesspractices.Cornettetal.
(2006) discuss the possibility that accounting ratios enable us to consider overall
financialperformance(ROA,ROE)aswellascomprehensivelyanalysemanydimensions
ofperformance(e.g.,costefficiency,coredepositfunding).Inthesamefashion,DeLong
andDeYoung(2007)agreethattheaccounting-basedapproachoutperformsthemarket-
basedapproachincapturingactualfinancialperformanceoveraspecifictimeinterval.
Followingthespiritofthepreviousstudies,themeandifferencetestisappliedtofindout
towhatextentandinwhichaspectstheactivationofthetransactionalwebsitemayalter
thebanks’performance.
Inmore detail, to decipher if the formation of the transactionalwebsite considerably
improvesthebank’sperformance,themeandifferencesinaccountingratiosofbanksare
tested in the first, second, or the third year after the year banks have launched their
website, as compared to the event year. To bemore specific, the year of thewebsite
launchingannouncementofeachtargetedTUVW! isset to0(X"#$%! = 0).Subsequently,
the first, second, and third years after the announcement year are set as X"#$%! = 1,
X"#$%! = 2, and X"#$%! = 3, respectively. A set of accounting performance ratios,
thereafter,werecollectedat the timeX"#$%! = 0, X"#$%! = 1, X"#$%! = 2andX"#$%! = 3.
Afterthat,thedifferenceintheaccountingperformanceofTUVW! wereobservedbetweensets of two separate times (X"#$%! = 1 and X"#$%! = 0), (X"#$%! = 2 andX"#$%! = 0),
(X"#$%! = 3andX"#$%! = 0).Thesevariationswouldindicatethepotentialtransformation
in the performance of banks after one, two, or three years after they set up their
transactional websites. Finally, the t-test was conducted to gauge if performance
differencesarecriticallysignificant.
Theresultsfortheinvestigationofthemeandifferenceinbanksaccountingperformance
arepresentedinTableA.5.11.Ingeneral,theresultsrevealanappreciableimprovement
192
inbanks’profitability,atleastoverthreeyearssincetheirenablementofatransactional
website,duetoagrowingtrendintermsofROAandROEovertheyears.Significantly,the
valuesofROAandROEareenlargedapproximatelybythreetimesafterthreeyearssince
the timethe transactionalwebsites launched. Inwhich,ROA increases from0.1845to
0.533whereasROEincreasesfrom0.7382to2.327overthenextthree-yearinterval.
Secondly,thefindingsalsoshowanimprovingsenseregardingtheinterestincomeand
non-interest income dimensions. More indicatively, the variation in the ratio of net
operatingincomerelativetoassetsincreasesapproximatelyfivetimes(from0.1779to
0.5274) whereas the variation in the ratio of non-interest income to assets (NIIA)
increases11times(from0.07to0.794)afterthreeyears.
Thirdly,thetransformationincostefficiency(EFFR)andnon-interestexpensetoassets
(NIEA) indicators show that the bank has effectively employed capital and asset
resources to generate income. EFFR continuously decreases from7.309 to 8.639 and
9.053whileNIEAisfoundtobeloweruponthefirsttwoyears(0.1319and0.1454).Over
threeyears,NIEAincreasesto0.095,butitiscriticallyinsignificantandapproximately
11timessmallerthanNIIA.
5.6.2 Dynamicstesting
Transactionalwebsiteadoptionmayhaveagradual influenceonbanks'efficiencyand
risk,whichmanifestsdifferentimpactsintheshorttermandlongterm.Followingfrom
somepreviousstudies(Heetal.,2020),thedynamiceffectistestedusingthefollowing
equation:
bcdefdgUVhc!&= i + k' × mdUVnUhXdofVUp_rcTnoXc_UsftXofV!,&+ k) × (mdUVnUhXdofVUp_rcTnoXc_UsftXofV0!,&+ mdUVnUhXdofVUp_rcTnoXc_UsftXofV1!,&) + k* × (mdUVnUhXdofVUp_rcTnoXc_UsftXofV2!,&+ mdUVnUhXdofVUp_rcTnoXc_UsftXofV3!,&) + k+ × (mdUVnUhXdofVUp_rcTnoXc_UsftXofV4!,&+ mdUVnUhXdofVUp_rcTnoXc_UsftXofV5!,&)+ k, × mdUVnUhXdofVUp_rcTnoXc_UsftXofV6!,& + u ×vfVXdfpwUdUoTpc!,& + x!,&
(Equation5.8)
Inwhich,thevariableTransactional_website_adoption0-,.=1fortheeventyearofthe
adoption of the transactional website, and zero otherwise. The variable
Transactional_website_adoption1-,. = 1 for the first year since the adoption of
193
transactional website channel, and zero otherwise. It is analogous to
Transactional_website_adoption2-,., Transactional_website_adoption3-,.,
Transactional_website_adoption4-,., Transactional_website_adoption5-,.. The variable
Transactional_website_adoption6-,.forthesixthyearandonwardsafterthetransactional
websiteadoption.
PleasenotethatEquation5.8isestimatedwithrobuststandarderrorsclusteredatbank
leveltoaccountforserialcorrelationoftheerrorterm.
Theresults(reportedintableA.5.12)showsthatthevalueofthetransactionalwebsite
adoption delivered to the performance of banks has been consistently enlarged
throughouttheyearsanalysed.Thesefindingsalsosuggestthattheembeddednessofthe
transactionalwebsiteexperiencehasstrengthenedthecontinualanddurablegrowthof
financialperformance.
5.6.3 Re-categorizationofbanksizeintothreequantiles
Tofacilitatetherobustnesstestofthesizeeffect,thesampleisdividedintothreesamples:
small,medium,andlargebanks.PleasenotethatEquation5.9isestimatedwithrobust
standarderrorsclusteredatbankleveltoaccountforserialcorrelationoftheerrorterm
ResultsarepresentedinTableA.5.13andTableA.5.14intheAppendix.Thefindingsare
entirelyconsistentwithpreviousfindingsusingthetwo-sizequantiles,makingitclear
thatsmallbanksachievebetterperformancefromtheirtransactionalwebsiteadoption
whencomparedtotheirlarger-scaledcounterpartsoverthelongterm.
b{|}~|�ÄÅv{!,&= i + k × mdUVnUhXofVUp_rcTnoXc_UsftXofV!,&+ Ç) × ÉgUpp_ÑUVW!,& + Ç* ×�csoÖg_ÑUVW!,&+ Ü) ×mdUVnUhXofVUp_rcTnoXc_UsftXofV!,&
× ÉgUpp_ÑUVW!,&+ Ü* ×mdUVnUhXofVUp_rcTnoXc_UsftXofV!,&
× �csoÖg_ÑUVW!,&u × vfVXdfpwUdoUTpcn!,& +x!,&
(Equation
5.9)
• BanksthatarerankedasLargeisusedasthereferencecategoryinEquation5.9.
5.6.4 Re-estimationofallmainequations,usingyear,stateandbank-levelfixedeffect
Assuggestedbytheliterature(seeLahoueletal.,2019,p.355),theendogeneityissuecan
betheresultof:(i)simultaneity(orreversecausality)whichoccurswhenexplanatory
194
andresponsevariablesaffect/causeeachotherandhavereciprocalfeedbackloops(Attig
etal.,2016;Lahoueletal.,2019);and(ii)unobservedheterogeneitythatcorrespondsto
theomissionofvariablesintheregressionequation.Forexample,McWilliamsandSiegel
(2000) argue that the association between explanatory and response variables are
doubtfulifvariablesareomittedthathavebeenshowntobeimportantdeterminants.
Intermsofthereversecausality,thefixedeffecttwo-stageleastsquarewithinstrumental
variablescanbeconsidered,assuggestedbytheliterature.Forexample,whenexamining
the business value of big data and analytics, Müller et al. (2018) apply the average
diffusion rates for these systems as instrumental variables to solve or reduce the
potentialproblemofreversecausality.Inthecaseoftransactionalwebsiteadoption,the
diffusion of computer users in each state can be used as an instrumental variable.
However,thedatacollectionforinstrumentalvariableshasbeenbeyondthescopeofthis
thesisandthereforeisalimitationinthischapter.
Theissueofunobservedheterogeneityiswhentheexplanatoryvariablesdonotexplain
“the fullamountof individualheterogeneity in theconditionalmeanof thedependent
variable” (Winkelmann, 2008, p. 127). The omitted variables become a part of
unobserved heterogeneity, occurringwhen the analysismay exclude some important
explanatoryvariables(Manneringetal.,2016,p.12).Theunobservedheterogeneityand
omitted variables, accordingly, canmake the associationof explanatory and response
variables doubtful (McWilliams and Siegel, 2000). In this chapter, there are a limited
numberofcontrolvariablesinEquations5.1to5.7,thereforethesemodelsmaysuffer
fromunobservedheterogeneityandomittedvariablesbias.
Prior studies suggest that the problem of unobserved heterogeneity and omitted
variablescanbesolvedbyusingpaneldataandbyadoptinga fixedeffect(FE)model
(BellandJones,2015;Gómez-Herrera,2013;KarlbergandÅkesson,2015).Forexample,
BellandJones(2015,p.6)claimthat“becauseFEmodelsonlyestimatewithineffects,theycannotsufferfromheterogeneitybias”.Also,RobertsandWhited(2012,p.77)statethat fixed effects can address the problem that some time-invariant characteristics
cannotbeobservedinthedataathand.Accordingtothebankingliterature,inparticular,
anumberof studies state that theyapply time fixedeffect toaddress theunobserved
heterogeneouscomponents(DeMarcoandWieladek,2015,p.13;Liuetal.,2020,p.3;
Moseretal.,2018,p.9;NamandAn,2018,p.159).
195
Aswellastimefixedeffects,bankandstate-levelfixedeffectsareconsideredtocontrol
for unobservedheterogeneity. Thebank fixed effect canbeused to capture the time-
invariantdifferentiationatbanklevel(Riziki,2015).Forexample,Chuietal.(2010)apply
thebankfixedeffecttocontrolallunobservedtime-invariantcharacteristicsoftheloan
supplyofabank(e.g.,thebusinessmodel).Furthermore,statefixedeffectcancontrolfor
differentiationacrossUSstatesthatmayaffectthevalueoftransactionalwebsiteaddsto
banks’ performance, such as culture, economic strength, specific policies, customer
preferences(Lin,2018;Shresthaetal.,2007).
In this section, all the main equations (Equations 5.1 to 5.7) of Section 5.5 are re-
estimatedfirstlywithyearandstate,andthenwithyear,state,andbankfixedeffects.The
resultswithyearandstate fixedeffectsareshowninAppendix,SectionB, fromTable
A.5.16 toTableA.5.23. In general, the results are consistentwith the original results,
indicating that the influence of explanatory variables (e.g., transactional website
adoption, mobile website adoption, transactional website adoption, bank size, time
effect) remains consistent, after controlling for the variationwithin states andwithin
years.
Next,allregressionsarere-estimatedwithyear,state,andbank-fixedeffects.Theresults
areshowninAppendix,SectionB,fromTableA.5.24toTableA.5.31.Themainfindings
fromSection5.5 tend tochangeandsignificancedisappears,with the inclusionof the
bankfixedeffects inthemodels.Therefore, theresultswithin individualbanksdonot
agreewiththemainconclusionsdrawnfromSection5.5, i.e., theresultsacrossbanks.
Following the reasoning of DeYoung (2005),much of the variation in the variable of
interestissoakedupduetothebankfixedeffects.Asthemainvariableofinterest,the
transactionalwebsiteadoption,isabank-specificdummyvariable,thereislittlevariation
inthisvariablethroughtheyearsacrossallthebanks.Therefore,it’snotsurprisingtosee
thatmostoftheresultsdisappearwiththeinclusionofthebankfixedeffects.
5.7 Conclusion
5.7.1 SummaryofFindings
Thisstudyinvestigatedtheimpactoftransactionalwebsiteadoptionontheperformance
of307banksintheUSmarketfrom1993to2018,viaconstructingtheregressionanalysis
viasevenaccountingmeasuresasproxies for the financialperformanceofbanks.The
mainresultsareasfollows.

196
Firstly, the results strongly suggest that transactional website adoption should be
appreciatedasastrategicinitiative.Thisisbecausethisadoptionsatisfiesboththevalue
visionof thestakeholdersand thesustainableperspectiveof theresource-basedview
(Amit and Schoemaker, 1993; Dierickx and Cool, 1989; Grant, 1991b; Hamel and
Prahalad, 1996; Hansen and Wernerfelt, 1989; Penrose, 1955, 2009; Peteraf, 1993;
PrahaladandHamel,1997;Rumelt,1984;Wernerfelt,1984).
More specifically, for the first time, it is robustly confirmed that banks can achieve
financialsustainabilitythroughtheadoptionoftransactionalwebsites.Morepointedly,
transactional website adoption durably rewards banks with an enlargement in
profitability,anincreaseinincomeandexpenditureefficiencyaswellasgrowthofnon-
interestactivities.Againstthisbackground,thetransactionalwebsitehasprovenitselfto
possessthreefeatures:value,appropriability,anddurability,satisfyingthefirsttermof
resource-based view theory (Amit and Schoemaker, 1993; Barney, 1991; Collis and
Montgomery,1995;DierickxandCool,1989;Grant,1991b;Peteraf,1993).Theresults
are also compatiblewith authors in digital banking literaturewho found the positive
impactofdigitaladoptiononfinancialperformance(Al-HawariandWard,2006;Ciciretti
etal.,2009;Delgadoetal.,2007;DeYoung,2005;DeYoungetal.,2007;Furstetal.,2002;
Goh and Kauffman, 2015; Hernando and Nieto, 2007; Mbama and Ezepue, 2018;
Momparleretal.,2013;Pignietal.,2002;Scottetal.,2017;Sullivan,2000;Xueetal.,
2007).
Furthermore,goingbeyondthesefeatures,transactionalwebsiteadoptionisalsoproven
to be able to preserve banks' competitive advantages, protect the financial value and
contributetocontinuousgrowth.Moreconcretely, theresultsprovethattransactional
websiteadoptionendowsbankswith superiorperformance, in turn, attributed to the
embeddednessofitsexperience,andinter-connectednesswithotherdigitaldisruptions.
Moreover,theresultsshowthattheobservationallearningbehaviourisnotfavourable
forthefollowingadopters,indicatingthatthetransactionalwebsiteadoptionofabank
canlimittheimitationofitsfollowingrivals.
From the basis of the resource-based view, these features are perceived as isolating
mechanismsthatleadtoambiguouscausality,resourcedevelopment,tacitresources,and
capabilities,makingitmorestringentandcostlyforrivalstolearnandduplicate(Barney,
1986a,1986b,1991;DierickxandCool,1989;Grant,1991b;LippmanandRumelt,1982;
Peteraf,1993;Rumelt,1984;Teeceetal.,1997).
197
Thefindingsinthischapterareconsistentwithauthorswhofindapositiverelationship
betweencumulativeIT/digitalexperiencesandfirms’performance(Bharadwaj,2000;Bi
et al., 2014; Lin, 2007; Popa et al., 2018; Powell andDent-Micallef, 1997; Setia et al.,
2011), thenegativeoutcomesofobservational learning (Argyris andSchön,1978;De
Carolis,2003;LevinthalandMarch,1993;MinerandMezias,1996;TerlaakandGong,
2008), the inimitability of IT and digital (Arslan and Ozturan, 2011; Bloodgood and
Salisbury, 2001; Oh et al., 2007; Tian et al., 2010), the positive influence of the
interconnectednessamong resourcesandcapabilities (April, 2004;Chouet al., 2017;
CohenandOlsen,2013;KogutandZander,1992;Lin,2007;OliveiraandMartins,2011;
PowellandDent-Micallef,1997;Ruivoetal.,2014).
Secondly,thesizeeffectisfoundtoaffecttheimpactoftransactionalwebsiteadoptionon
financialperformanceamongbanks. Inwhich, there isamoredramaticchange in the
financialperformanceofsmallbankswhentheyundergotransactionalwebsiteadoption
whencomparedtotheirlargercounterparts.Theresultsareconsistentwiththeauthors
who claim that small banks are more successful innovators/implementors (Acs and
Audretsch,1990;Hamiltonetal.,2009;Zenger,1994).Thesuggestiononwhythesmall
bankscouldbemoresuccessfulininnovatingiswellprovidedintheliterature(Chenand
Hambrick, 1995; Dean et al., 1998; MacPherson, 1998; Meziou, 1991; Regehr and
Sengupta,2016).Furthermore,whenexamining theperformanceof twosub-samples:
small banks and large banks, the results also show the more significant impact of
transactionalwebsiteadoptiononsmallbanks'profitabilityandefficiency.Thisfinding,
therefore,suggeststhattransactionalwebsiteadoptiontendstomattermoreforsmall
banks.Itmightbebecausethetransactionalwebsiteadoptioncanpromoteandoptimize
thepotentialcapabilitiesofsmallbanksaswellasprovideinnovativecapabilitywhich
facilitates thosebanks inapproachingmoreopportunities,exploitnewnichemarkets,
deepencustomerrelationships,andalleviatecompetitionthreatsfromlargebanks.
Thirdly,thefindingsrevealthattimingorderisnotadeterminantindifferentiatingthe
impact of transactional website adoption on banks. More specifically, transactional
website adoption seems no longer favour first movers with significantly improved
profitabilityandefficiencyinthelongrun.Thefindingsarethencompatiblewithauthors
whoshowthatfirst-moveradvantagesmaybediminishedovertime.Also,thefindings
supporttheviewthatlate-joiningorganizationscancompetewithandevenovertakefirst

198
movers bydeveloping similar or better capabilities in digital systems (Carpenter and
Nakamoto,1990;Duttaetal.,2014;SuarezandLanzolla,2005).
Finally, the findings, which are about the cross-connection of transactional website
adoptionandmobilewebsiteadoption,mightbetosomeextentrelevanttothetermsof
exploitativeandexplorativeinnovations.50Morepointedly,thefindingsshowthatbanks
with a big gap between their digital innovations are likely to achieve better financial
performance in general. Meanwhile, banks with a smaller gap between their
transactionalwebsiteadoptionandmobilewebsiteadoptiontendtoreapmorefinancial
rewards in exploring the value of the interaction between those two adoptions. The
findings, therefore, suggest that banks with a large gap tend to benefit more from
innovating and exploiting the advantages from their current transactional website
adoptionbase.Meanwhile,bankswithasmallergaptendtoreapmorefinancialrewards
inexploringthevalueoftheinteractionbetweenthetwoadoptions.Therefore,during
thedigitalbankingtransformation,transactionalwebsiteadoptionshouldbefavourable
forbanksthatarebotheitherneworold-established.Nevertheless,benefitsshouldvary
asbothneworold-establishedbankshavetheirownstrengthsandconstraints.Onthis
point, this chapter supports authorswho find the positive relationship between new
firmsandexplorative innovations(HillandRothaermel,2003;Kilenthongetal.,2016;
NaldiandDavidsson,2014;Nooteboometal.,2006)andthepositivecorrelationbetween
establishedfirmsandexploitativeinnovations(AndersonandEshima,2013;Freemanet
al.,1983;SlevinandCovin,1997).
5.7.2 MainContributions
What this chapterwishes for is to show the enhanced value of transactionalwebsite
adoptioninthebankingdigitalizationcontext,whichdoesnotseemtogetmuchinterest
incurrentliteratureincomparisontothepast.Thereisalackofupdatesandvalidation
of the long-term and sustainable value of transactional website adoption in digital
bankingliterature,andthisisthefirstmotivationforustoconductthisresearch.Tomy
knowledge,theresearchhasthefollowingnewfeaturesandcontributions:
50PleaserefertoSection5.5.2.4forfurtherdetails.

199
Firstly, with original data retrieved and synthesized from different platforms,
accompaniedwiththemostup-to-dateaccountingdatafromthe26yearsbetween1993
and2018,thischapteristhefirsttovalidatethesustainabilityoftransactionalwebsite
adoptionindeliveringvaluetobanks'financialperformance.
Secondly,thecentralthemeofconceptualanalysisandempiricalexaminationismainly
influencedbyitsfoundationintheresource-basedview.Thisisthefirsttimeindigital
bankingliteraturethatviewpointsaboutthefundamentalofsuperiorperformanceand
competitive edges, intangible resources and capabilities, and the conditions and
mechanisms of sustainability have been applied to develop conceptual models and
empiricalhypotheses.Thispointcouldbecomeaninspirationforfurtherresearchonthe
origins andmechanisms for the sustainability of bank enterprisesduring theirdigital
innovationandtransformation.
Thirdly, based on this theoretical background, this chapter is the first to approach
transactionalwebsiteadoptioninanovelandmorecomprehensivemanner.Tobemore
specific,themechanismsandfeaturesoftransactionalwebsitesareestimatedthatmake
them strategic and sustainable, beyond three features that have been exploited by
previous authors: lucrativeness, innovation, and efficiency. Also, the transactional
websiteadoptionisalsoexaminedinthespiritofconnectingtoanotherdigitaldisruption.
Thisisalsothefirst-timetransactionalwebsiteadoptionisevaluatedasanewstarting
point.
Fourthly, this chapter provides robust proofs of the sustainability of transactional
websiteadoption,includingsixstrategicfeaturesthathavenotbeennamedbefore:value,
appropriability, durability, embeddedness, inimitability, and interconnectedness. This
chapterisalsothefirstinprovidingevidenceofinter-firmheterogeneity,observational
learning, combinative capability throughout the time since the websites have been
triggered.
In short, the empirical evidence has filled a gap in the literature about the value of
transactionalwebsiteadoption,including(i)thelong-termanddurableimpact(ii)the
sourcesandmechanismsofsustainability(iii)intangiblesandtacitvalues(iv)astarting
pointofinterconnectionandcomplementaryvalueinthedigitalcontext.
200
5.7.3 ManagerialImplications
Firstly,under theviewpointsof somepractitioners,banksarestruggling to figureout
where their priorities should be in the digital transformation. This chapter provides
authenticatedevidencethattransactionalwebsitesareworthbeingalong-termpriority
andshouldbeprizedfortheirstrategicattributes.Furthermore,managersshouldpay
more attention to the intangible values and tacitmechanisms thatwould explain the
underlyingbasisoffinancialvaluesandcompetitiveadvantages.Somemechanismsfor
managersthathavebeenverifiedinthisstudyare(i)embeddeddigitalcompetenciesand
experiences,(ii)combinativecapabilitybetweentwodigitaldisruptions,(iii)theability
tolimitlearningbehaviour.Thesustainabilityofadigitalinitiativeshouldbeassessedin
acomprehensivemannertothoroughlyinvestigateitscapabilityofgeneratingvaluesand
limitingcompetition.
Secondly, this chapterdetects that learningbyobservingbehaviourhasnosignificant
impact on the observers' financial performance, and perhaps this behaviour is even
harmfulinsomecases.Therefore,whenmakinguseofobservationinformationspillover
frompreviousadopters,bankmanagersshouldbeaware that thesuccessofprevious
adoptersmaybecausedbyambiguouscausality,thedevelopmentofresources,corporate
culture,andtacitknowledge.Vicariouslearningshouldbeappliedappropriatelytoeach
enterprisedisciplineratherthanmerelyduplicated."Experienceisoftenapoorteacher,beingtypicallyquitemeagrerelativetothecomplexandchangingnatureoftheworldinwhichlearningistakingplace",saidLevinthalandMarch(1993,p.96)and"Evenhighlycapable individuals and organizations are confused by the difficulties of using smallsamplesofambiguousexperience to interpretcomplexworlds"(LevinthalandMarch,1993,p.97).
Fourthly, managers should consider the size effect when undergoing their digital
initiatives.Asarguedbymanyscholars,smallfirmsarelikelytoberelativelyrobustin
practiceswheretheycantakeadvantageoftheirflexibilityandvicinitytosatisfymarket
demand (e.g., new products/services, modifications to existing products for niche
markets, and small-scale applications).51 In such a way, small banks should take
advantageofdigitaldisruptionasatriggerfortheirotherpotentialcapabilitiessuchas
51Somekeyrelevantauthorsareinthefollowingparentheses(AcsandAudretsch,1990;Hamiltonetal.,2009;Zenger,1994).
201
dynamiccapabilities,absorptivecapabilities,andnewnichemarkets.Nevertheless,itis
neither small firms nor large firms that are the better innovators/adopters per se.
Instead,smallandlargefirmsareprobablygoodatdifferenttypesofpractices,assaidby
Vossen(1998).Inthissense,digitalandotherinitiativesshouldbeappliedanddeployed
efficientlytobestsuitthesize,capability,anddisciplineoftheenterprises.“Banksneednotgrowlargertobesuccessful:businessstrategiesandlocaleconomicgrowtharenoless important indeterminingbankprofitability than size”, saidRegehrandSengupta(2016,p.85).Finally,firmsshouldbeawarethattheadvantageoftimingordercouldbediminished
overtime.Ontheonehand,thebusinessvaluefromearlyinvestmentsintoinnovationis
likelytobeassociatedwithsuperiorprofitability.Nevertheless,overtime,timingorder
maynolongerplayavitalroleinachievingfinancialperformance.Thefollowingentrants
canultimatelydefeattheirpredecessorsiftheycancreatetheirownuniqueadvantages,
innovate,ordevelopcapabilitiesindigitalsystems(Duttaetal.,2014).Inotherwords,
managersshouldbeawarethatwhenafirminvestsindigitalprojects,thebusinessvalue
ofthatsystemwillnotbeaccruedinstantaneously,butovertime,andcompetitorswill
notsitstillduringthattime.Instead,focusingontheuniqueresourcesandcapabilitiesof
the business as well as understandingmarket conditions and competitors should be
criticalprioritiesforbankfirms.
5.7.4 LimitationsandFutureDiscussion
Thissectionprovidessomelimitationsaswellassomesuggestionsforfurtherresearch.
Firstly, thischapterhadnotgoneintoadetailedanalysisofthespecificdimensionsof
banks (e.g., the balance sheet items, income items). Therefore, a further dig into
particularfinancial itemsofbankswouldbehelpfultoseehowtransactionalwebsites
deliver value to production processes, product mix and to particular activities (e.g.,
transactionsdeposits,smalltimedeposits,fedfunds,brokereddeposits,consumerloans,
creditcardloans,realestateloans).Furtherstudiesoffinancialcategorieswouldalsobe
worthwhileastheycouldpointoutwheretheearningscomefrom(e.g.,debtsecurities,
tradingaccountassets,servicecharges,cardincome)andhowbankshaveutilizedtheir
operating expenditureswith the companionship of website adoption in each of their
activities (e.g., personnel, marketing, professional fees). Given this limitation, more

202
evidence into these specified items should be provided, assistingmanagers in better
targetingtheircategories.
Secondly, although this chapter proves the existence of cumulative experiences,
connectedness,andinimitabilityoftransactionalwebsiteadoption, ithasnotspecified
whatresourcesarecausallyrelated.Somepotentialresources,suchastacitknowledge,
digitalculture,uniqueexperiences,networkswerepointedout,butnevertheless,onlyat
Theconceptualandanalyticalperspective.Acontinuationinidentifyingandexamining
theimpactofspecificresourcesandcapabilitiesrelatedtotransactionalwebsiteadoption
isasuggestionforfurtherresearch.
Thirdly,giventheexistenceofthesizeeffect,thischapterhasnotyettoexaminewhat
specificfactorsthisisactuallyinvolvedin.Somepotentialcaseswerediscussed,suchas
small banks being nimbler, agile, less hierarchal, and targeting themselves uniquely.
However, they have not been examined empirically yet. Further empirical tests to
supportthesediscussions,therefore,areessential.Thiswillhelpbanksunderstandmore
deeply which advantages are activated in their system since they have adopted
transactional websites and what they should focus on with the companionship of a
transactionalwebsite.
Fourthly,thischapterhasnotyetexploreddeeplythedistinctadvantagesofbothfirst
moversandlaggardsintermsoftheirtransactionalwebsiteadoption.Furtherresearch
intotheparticularadvantagesoffirstmovers(andoflaggardsaswell)wouldbeuseful
todeterminewhattheiractualsustainableadvantagesareandprovidebankswithmore
justificationstodecideontheirstrategictiming.
Besides,anumberofotherfollowingsuggestionsforthefuturewouldbe:
Firstly, external factors (e.g., brands, customers, stakeholders, strategic partners,
outsourcingagreements,networks,andeco-systemrelationships)shouldbeincludedin
future investigations of the relationship between transactional website adoption and
banks'performance.Externalfactorshavebeenproventopossessintangibleattributes
(Srivastavaetal.,2001;Varadarajan,2020).Therefore,mostlikely,websiteadoptionhas
createdsomestrategicexternalresourcesandresources,whichthenalsorewardbanks
withsustainableperformance.
Furthermore, the interconnection between omni-digital channels as well as the
interconnectionbetweendigitalchannelsandtraditionalchannelsshouldbecontinued
tobeexamined.Thecombinationoftransactionalwebsiteadoptionandmobilewebsite

203
adoptioninthischapterishopefullyaninspirationforwiderandmoremultidimensional
researchinthefuture.
204
6 Chapter6:DoDigitalTransactionalWebsiteInitiativesAddValuetoBanksinLong
Run?
6.1 Introduction
Ahighlighttakenfromrecentarticlesisthatinvestorsnowlackconvictioninthefinancial
service industry'sdigital strategies.According to a reportbyWyman (2020), only25
percent of investors surveyed are optimistic that banking digital transformation
strategieswillbeeffective,andlessthan1percenthavefaiththatdigitalplanswillbe
transparentandcredible.Morespecifically,investorsareconfusedaboutthedirectionof
banks'digitalinvestments,andtheyareunclearwhetherthebanks'digitalinvestments
willdeliverthereturnsandoffsetthecoststheyinvestedin.“Investorsdonotfeeltheyunderstandwhatfirmsareinvestingin,orwhy–...Theydon’tseeanyusefulmetricsonprogress,andtheyarelargelydistrustfulofthecost-benefitcaseofsignificanttechnologyinvestments"(Wyman,2020,p.10).ThispointofWymanindicatestwoissuesthatthebanksarefacingintheirdigitalroadmapnowadaystoimproveinvestors’confidenceand
attract more investors. Firstly, banks are lacking clear evidence of their digital
orientations (e.g., what digital investments banks are focusing on) to attract more
conservativeinvestorsandmaximizemarketvaluation.Secondly,banksseeminglyfailto
separatetheuniquemeritsandbenefitsofeachoftheirdigitalinitiatives,makingtheir
digitalstrategiesambiguousanduncleartoinvestors.
However,someoptimismstillexistsamonginvestorsthatdigitalinvestmentdoeshave
the possibility to drive earnings improvement. “80 percent still say transformation iscriticalorimportantintheirinvestmentappetite.Nearly60percentofinvestorsbelievedigitalwillimpactprofitabilitypositivelyoverthenextfiveyears”(Wyman,2020,p.10).Thus, investors have not necessarily lost faith in digital projects, but they needmore
convincing evidence frombanks for their investment strategies. Therefore, it ismore
essentialforbankstoprovideevidenceofbothshort-termandlong-termperformanceof
digital technology investments. As Wyman suggested, banks need to provide value
metricsforeveryinvestmentineachstagebeforethenextfundingisreleased.
Regrettably,indigitalbanking,thestudyofthemarketperformanceofdigitalinitiatives
is exceedingly rare.Researchmainlypaysheed to accountingmetrics (Al-Hawari and
Ward, 2006; Ciciretti et al., 2009; DeYoung, 2001, 2005; DeYoung et al., 2004, 2007;
Eglandetal.,1998;Furstetal.,2000a,2002;Gutu,2014;MbamaandEzepue,2018;Pigni

205
et al., 2002; Scott et al., 2017; Sullivan, 2000; Sullivan andWang, 2013;Weigelt and
Sarkar,2012).However,thisapproachislikelytolaginmeasuringtheimmediateimpact
of digital initiative events.52 Additionally, it is more challenging for the accounting
approach to show how investors react to digital adoptions over the long termwhile
investors' evaluation is a preeminent measure of the efficiency and outstanding
performanceoforganizations'strategies.
Thischapter,therefore,isdevelopedbasedontwovitalmotivations:
(i) the need to get insights into the impact of digital-based initiatives on financialinstitutions’performanceinthelongterm,and(ii)thelackofresearchpapersontheroleofmarketevaluationinassessingthevalueoftransactionalwebsiteadoptionaddedtoinstitutionsinthelongterm.Theobjectiveofthischapteristoanswertheresearchquestion“Dotransactionalwebsiteinitiativescreatevalueforfinancialinstitutionsinthelongrun?Whatwillberevealedaboutthetransactionalwebsiteadoptionbehindtheinvestor’sbuy-and-holdstrategy?”Morespecifically,thisresearchaimstoachievethefollowingspecificresearchobjectives:
- Investigate the wealth-creating capability of transactional website adoption
eventsinthelongterm,governedbythebuyandholdstrategyofinvestors.
- Investigatethelearning-by-observingmechanismofinvestorstoexplainwhythe
investorsandthemarketcanrecognizethevaluecreationintransactionalwebsite
adoptionevents.
- Inquire into some moderating effects that possibly differentiate performance
betweenbanksaswellasalterthewaythemarketreactstotransactionalwebsite
announcements,includingthe“magnitudeeffect”and“timingorder”.
Firstly, a long-termpositivemarket reaction to the transactionalwebsite is expected,
comprehensivelybasedontheresource-basedview(Grant,1991b;Barney,1991;AmitandSchoemaker,1993;Peteraf,1993).53Moredirectly,itisassertedbyresource-based
52AlsorefertoChapter5,Section5.2, for furtherdiscussiononaccountingmeasures indigitalbankingliterature.53Overthelongrun,theevaluationofthemarketcouldovercomeanumberofpotentialbiasesintheshortterm, such as hot-market issue, overreaction. Therefore, under a long-term perspective, this chapterfocusesontheoretical foundationsthatshowthemarketevaluation'svalidity.Theresource-basedviewwaspreferredasitallowstoexplainwhyabankislikelytogainsuperiorperformanceoverthelongtermsincetheirtransactionalwebsiteadoption,thusitalsomakessensewiththerationalityofmarket.
206
theoriststhattheimpactofstrategyonfirmsisbasedontwodifferentstages:theex-anteandex-poststage(Peteraf,1993;RumeltandLamb,1997;Wernerfelt,1984).Iftheex-antestageisanexcellentopportunityforseekingsuperiorrentsandefficiency,theex-
poststagewillbethetimeforthefirmtopreserveandsustainthosevalues.Fromthis,a
setofresourcesandcapabilitiesoftransactionalwebsiteinitiativesisproposedthatare
likelytobecomehard-to-copycompetitiveadvantagesofbanksinthelongterm,suchas
tacitknowledge,digitalculture,anddigitalhumanities.Basedonthissetofcapabilities,thebankcanattainsuperiormarketvalueinthelongtermstartingfromthetimethey
embracetransactionalwebsitechannels.Awiderangeoftheoriesisalsoreferencedin
thischaptertopredicttheimpactofthe“vicariouslearning”effect,sizeeffect,andtimingeffectonbanks’marketperformanceduringtheiradoptionoftransactionalwebsites.Inorder toestimate the long-termperformanceofbanks, theBuy-and-holdAbnormal
Returnsmetric(BHAR)isemployed,whichaccordingtoLyonetal.(1999,198)hasthe
advantageofyielding“anabnormalreturnmeasurethataccuratelyrepresentsinvestorexperience”. Thismetric is defined as themeasurement ofmulti-year returns from astrategyofinvestinginallfirmsthatcompleteaneventandsellingattheendofaspecific
holding period versus a tantamount strategy using other benchmarks (Mitchell and
Stafford, 2000). Following several studies, this chapter examines five different
benchmarks,includingthemarketindices(includingS&P500,Nasdaq,equally-weighted
MarketIndex),control-firmportfolio,andex-anteBuy-and-Holdbenchmark.TheBHAR
afterwardswasestimatedasthedifferencebetweenbuy-and-holdreturnsofthetargeted
banksandthebenchmarks,overa12-month,24-month,and36-monthperiodsincethe
eventmonth.
Subsequently,toinvestigatetheimpactoftransactionalwebsiteadoptiononlong-term
excessearningsofbanks,anumberofregressionsareconductedoverboththeex-ante
period and ex-post period of the transactional website adoption. The regressions
examinethemechanismsofthe"learning-by-observing"behaviour,thesizeeffect,and
thetimingordereffect.Theseeffectspotentiallyinfluenceinvestors’behaviouraswellas
differentiatetheexcessingearningsattributedtothetransactionalwebsiteadoption.
Theresultsprovideimportantinsightsintotheimpactoftransactionalwebsiteadoption.
Abnormalreturns(BHAR)turnedouttobepositiveandsignificantover12-month,24-
month,and36-monthtimeperiodsfollowingthetransactionalwebsitelaunch.Apositive
andsignificantrelationshipisalsoshownbetweenBHARandthetransactionalwebsite
207
adoption variable. As a result, the study is an effective reassertion of the benefits of
transactionalwebsiteadoptiononbanks’long-termperformance.
Thesignificantimpactsofthelearning-by-observingeffect,sizeeffect,andtimingordereffectonBHARaslong-termperformanceofbanksarealsoconfirmedinthischapter.Inwhich,thelearning-by-observingeffecthasapositiveimpactoninvestor'sevaluationof
transactionalwebsiteadoption.Thesizeeffectandthetimingordereffectaretwocritical
factors leading to heterogeneity among different banking groups in earning excess
returns.Morenotably,small-sizedbanksandlateradopters(includingsecondmoversandlaggards)aremostpositivelyaffectedbytransactionalwebsiteadoption.Incontrast,
the advantages of the first-mover banks seem to be eliminatedwhile the large-sized
bankstendtogetfewerbenefitsofadoptingtransactionalwebsitesthantheirsmall-sized
rivalsinthelongrun.
Tothebestofmyknowledge,thischaptermakesthefollowingkeycontributions:
Firstly,regardingmethodology,thisisthefirsttoadopttheevent-timeapproachwiththe
Buy-and-HoldAbnormalReturn(BHAR)metrictoassessthevalueofadigitalbanking
initiative. Secondly, this chapter reveals the existence of "learning by observing"
behaviourwhichsignificantlyimprovestheeconomicvalueofdigitaladoption.Thirdly,
thischapterconfirmstheexistenceof"sizeeffect"and"timingeffect"whichsignificantly
influence the long-term excess earnings of banks via their transactional website
investment.Tothebestofmyknowledge,thesizeeffectandthetimingordereffecthave
been rarely examined as moderating effects in the discipline of digital banking
literature.54
Theremainderofthischapterisorganizedasfollows:Section6.2providesabriefoutline
oftherelevanttheoreticalperspectivesandempiricalfindings,Section6.3presentsthe
54-SizeeffectinInternetbankingdisciplineismostcommonlyassociatedwiththeworkofDeYoung(2005)andCyreeetal.(2009).Nevertheless,DeYoung(2005)examinethesizeeffectonthesampleofonly12banksfrom1992to2000whileCyreeetal.(2009)onlyexaminethesizeeffectof17banksduringtheperiodof1993to2003.Furthermore,theirdatasampleincludesInternet-primarybanksonly.-Oneofthemostrecentcitedstudieswhichinvestigatesthefirst-moveradvantageofInternetbankingisthatofLinetal.(2011).Inthatstudy,theauthorslookintotheimpactoftimingordersontheprobabilityofimprovedperformanceduringtheperiodof2003-2008.Thischapterfocusesonacomparativeanalysisofthevalueaddedtobankswhichareinthreedifferenttimingorders:firstmovers,secondmoversandlaggards.Besides,thischapteralsooffersaninvestigationoftimingordersinthemoreextendedperiodfrom1993to2013.

208
hypotheses,Section6.4presentsthemethodologyanddata,Section6.5and6.6discusses
theresultsandrobustnesstests,respectively,andSection6.7concludesthechapter.
6.2 LiteratureReview
6.2.1 Theimpactofdigitaladoptiononbanks’performanceinthelongrun.
There has been little analysis of research on banks' long-term performance
correspondingtotheirtransactionalwebsiteadoption.Abriefontypicalstudies,which
provide themost relevant evidence concerning the long-termperformance of digital-
enabledbanks,ispresentedinTable6.1below.Brieflyput,inthelongterm,innovation
iswidelyacceptedasthecorebenefitgainedthroughdigitalbankingadoption(DeYoung
etal.,2007;Pignietal.,2002).Tobemorespecific,byembracingdigitalinitiatives,banks
cometobemorediversifiedandadvancedintermsoftheirtransactionalactivities(e.g.,
inputmix,productioninnovation,lendingprocess).Innovativefeatures,therefore,could
potentiallyendowbankswithanenhancementincustomers'valueperception(Pigniet
al.,2002)andanincreaseintermsofROE,ROAinthelongrun(DeYoungetal.,2007;Goh
andKauffman,2013;Scottetal.,2017).
Regarding long-term operating expenses, however, there are still conflicts between
studies.Someresearchershaveshownevidencethatactivatingdigitalbankingdoesnot
reducecostsasexpectedintheory.Conversely,inthelongrun,labourcostsincreasedue
totherequirementsofhighlyskilledlabour(Cicirettietal.,2009).Incontrast,Scottetal.
(2017)provideevidencethattheoperatingcostssignificantlydecreasefromthethird
year of the SWIFT adoption. In themore neutral position, DeYoung (2005) found no
differenceinoperatingcostsamongInternet-basedbanksandbranch-basedbanksinthe
preliminarystagesofInternetadoption.
6.2.2 Thegapindigitalbankingliteratureandtheimportanceoflong-termexamination
Ingeneral,therehasbeenempiricalevidenceconcerningthelong-termperformanceof
banks that have embraced digitalization. Nevertheless, they still mainly rely on
accounting metrics. In contrast to the limited research in digital banking literature
towards a long-term vision of the field, IT-related literature has made explicit why
organizationalperformanceshouldbeexaminedoverthelongterm.Moreindicatively,
thesestudiesdenoteasignificantdifferencebetweentheshort-termandthelong-term
performanceofITinvestment(X.BiandZhang,2008;Brynjolfsson,1991;Brynjolfsson

209
andHitt,1996;M.Campbell,2012;Hittetal.,2002;Jietal.,2021;Kimetal.,2017;Kohli
andDevaraj,2003;SabherwalandJeyaraj,2015;Winarnoetal.,2021;Yaoetal.,2010;Yu
et al., 2020). Authors believe that there is a remarkable lag in the returns to IT
investmentsovertime(Brynjolfsson,1991;BrynjolfssonandHitt,1996;Campbell,2012;
Hittetal.,2002;KohliandDevaraj,2003).Forexample,Brynjolfsson(1992)hasclaimed:
“InvestmentsinITsystemsmaytakeyearstoaddvaluetoafirmandarethereforemorelikelytobereflectedinfutureprofitstreams”(Brynjolfsson,1991,p.1011).Meanwhile,BrynjolfssonandHitt(1996)findoutthatlong-termreturnsareaboutfromtwotoeight
timesgreaterthanshort-termgains.
Toexplainwhythelong-termvalueofaninvestmentisremarkablynon-identicalwith
thevaluegainedintheshortterm,authorstendtoblamethelageffectinmarketreaction.
Forinstance,BaruaandMani(2018)detectaconsiderableamountofpositivelong-term
marketreturnsgainedbyITeventsthatinvolvelowtechnologicalmaturityorrequirea
largeamountofchangeinthebusiness.Thisisexplainedbythefactthatthemarketneeds
significant timeand information to assess such ITevents.Besides this, an insufficient
amountofinformationinthepastcouldalsocauseaninadequateunderstandingofthe
long-termbenefitsofITevents.Asaresult,theauthorsadvocatelong-termobservation
wherebyinvestorshaveplentyoftimetoaccuratelyevaluateandpredicttheunderlying
valueandgrowthopportunitiesoftheseITevents.
6.2.3 Long-runreturnAnomaliesLiterature.
WhatisprovedbyITliteratureisalsosomehowlinkedwiththeperspectiveoflong-runreturnanomaliesliterature.Inwhich,advocatorsoflong-runreturnanomaliesarguethatthestockpricedoesnotfullyandimmediatelyreflectnewinformationintheshortrun
andabnormal returnsdoexist in the long run(Afego,2018;BesslerandThies,2007;
Carteretal.,1998;ChenandZheng,2021;CremersandPareek,2015;Cusatisetal.,1993;
Ikenberry et al., 1996; Jegadeesh, 2000; Kadiyala and Rau, 2004; Kolari et al., 2021;
Lakonishok andVermaelen, 1990; Levis, 1993; Loughran, 1993; Loughran andRitter,
1995;RajanandServaes,1997;SehgalandSingh,2008;SpiessandAffleck-Graves,1995;
Wang et al., 2021). To explain the phenomenon of anomalies, academics have given
several hypotheses, especially the overreaction hypothesis and the underreaction
hypothesis. More pointedly, the overreaction hypothesis asserts that stock that has
underperformed the market over a time interval will outperform the market over a

210
subsequentandsimilarperiod.Inotherwords,pastwinnerstendtobefuturelosersand
vice versa. By contrast, the idea of underreaction is that investors underreact to the
positivesignalsexpressedbyeventsaboutfutureperformance,therebyleadingtheway
todifferentreturnpatternsandexplainingthelong-runpositivetrendinreturns.Inthe
overreactioncamp,thereisagrowingbodyofstudiesthathaveprovidedevidencefor
“anomalies”inlong-termpost-eventreturns,suchasintermsofIPOs(e.g.,Levis,1993;
Loughran,1993;LoughranandRitter,1995;RajanandServaes,1997;Carteretal.,1998),
SEOs(e.g.LoughranandRitter,1995;SpiessandAffleck-Graves,1995;Jegadeesh,2000).
Meanwhile,sometypicalstudiesadvocatingtheunderreactionhypothesisareofCusatis
et al. (1993), Ikenberry et al. (1996), Kadiyala and Rau (2004), Lakonishok and
Vermaelen(1990).
Notably, hot-issue market phenomena also deserve attention as an abnormality ininvestors’reactions.55Moreconcretely,thehot-issuemarketphenomenonisafeatureofaperiodwhereinvestors’demandisincrediblyhigh.Thephenomenongoesagainstthe
hypothesis of the efficient market hypothesis as it does not believe there is a full
assessmentofthemarkettowardsevents.Conversely,thehot-issuemarketphenomenonindicatesthatthebehaviourofinvestorsisirrationalduetosomeheuristic-drivenbiases
(e.g.,imitating,bettingontrends,regrettinginmind)(Shefrin,2002).Suchabehaviour
therebypotentiallyleadstoanunprecedentedincreaseinstockpricessurroundingan
event.Statedmorethoroughly,ifthereisalargenumberofcompaniesannouncingthe
sameactivityoveracontinuous-timeband,the"hot-issue"notionmayexistandexplainfor“irrationalpricesintheaftermarket”(Shefrin,2002,p.249).
6.2.4 Mainfindingsintheliteratureandthisresearchcontribution.
Inshort,theliteraturesofarhasshown:
(i) There is an appreciably positive impact of digital adoption on the long-term
performanceofbanks,at least reflected throughaccounting indicators(Cicirettietal.,
2009;DeYoung,2005;DeYoungetal.,2007;GohandKauffman,2013;Scottetal.,2017).
Despitethat,howwelldigital-activatedeventsaffectthemarketperformanceoffinancial
55Hot-issuemarketphenomenonisdocumentedinIbbotsonetal.(1988),IbbotsonandJaffe(1975),Ritter(1984).
211
institutions, based on investor participation and evaluation, is still an underexplored
matterthusfar.
(ii)There isremarkabledifferentiationbetweentheshort-termandlong-termmarket
valueofeventsrelatedtoITinvestmentandothertechnologicalinitiatives,mainlydueto
thelatencyofinformationevaluationinacomprehensivemanner(X.BiandZhang,2008;
Brynjolfsson,1991;BrynjolfssonandHitt,1996;M.Campbell,2012;Hittetal.,2002;Jiet
al.,2021;Kimetal.,2017;KohliandDevaraj,2003;SabherwalandJeyaraj,2015;Winarno
etal.,2021;Yaoetal.,2010;Yuetal.,2020).Suchevidencetherebyclarifieswhythelong-
termmarket performance examination should bemonitored, in order that the value-
enhancingcapabilityoftechnological-initiatedeventsiscomprehensivelyauthenticated.
(iii)Thereareargumentsregardingmarketanomaliesandirrationalinvestorbehaviour,
especiallyinashorttimeintervalimmediatelyuponthenews(Afego,2018;Besslerand
Thies,2007;R.B.Carteretal.,1998;H.ChenandZheng,2021;CremersandPareek,2015;
Cusatisetal.,1993;Duttaetal.,2014;IgualandSantamaría,2017;Ikenberryetal.,1996;
Jegadeesh,2000;KadiyalaandRau,2004;Kolarietal.,2021;LakonishokandVermaelen,
1990;Levis,1993;T.-Y.Linetal.,2021;LoughranandRitter,1995;Mayur,2018;Rajan
andServaes,1997;SehgalandSingh,2008;SpiessandAffleck-Graves,1995;F.Wanget
al., 2021). Accordingly, the scrutiny of long-term market behaviour becomes more
authenticandcomprehensiveinevaluatingthevalueofcorporateevents.Moreover, it
wouldbetheoptimalwaytovalidatewhetherthemarketmakessenseintheshortrun.
Basedonthediscussionsabove,thischapteraimstocontributethefirstevidencetobe
exploredsofarinbankingliteratureregarding:
(i)Thegenuinevalueoftransactionalwebsitesaddedtobanks'performance,especially
tobanks’shareholders,evaluatedbythemarketandinvestors.
(ii)Thelong-termmarketperformanceinvestigationinthefieldofdigitalbanking.
(iii)Theimportanceandrationalityofmarketsandinvestors’participationinpredicting
andevaluatingbankingdigitalinitiativeevents.
Thefollowingsectionswillshedmorelightonthepointsmentionedabove.

212
Table6.1Literatureontheimpactsofdigitaladoptiononbanks’performanceinthelongrun.
AuthorsExaminationPeriod
Mainfindings
Pigni et al.(2002)
The 3-yearwindow from2000to2002
- Internetbankingadoptionisassociatedwithanincreaseof0.4%incustomerdepositsandadecreaseinloans(-0.9%)andROE(from18.1%in2000to16.2%in2001).
- ThebenefitofInternetadoptionistheimprovementinoverallproductservicequalityperceivedbytheclients,ratherthaneconomicvalue.
DeYoung(2005)
The 5-yearwindow from1997to2001
- Internet-only de novo banks have access to significant technology-based scale economies, over andabovethesignificantbroad-scaleeconomiesavailabletoallstart-upbanks.
- ProfitabilityatthetypicalInternet-onlystart-upbankwaslowerthanthealreadypoorprofitabilityatthetypicalbranchingstart-upbank.Onaverage,ROAandROEwereabout300and1,400basispointslower,respectively.
- OverheadspendingisnoloweratInternet-onlybanks,comparedtothebranchingbanks(includingNon-interest expense, Premise and Equipment Expense, the book value of the physical asset, employeesalary).
DeYoung etal.(2007)
The 2-yearwindow from1999to2001
- Revenuesfromservicechargesatclick-and-mortalbanksincreasefrom4to6percent.- Profitabilityincreasesfrom7%to11%.- Salariesandbenefitsincreasefrom2.2%to4.6%astheshiftfromlower-skilledtohigher-skilledlabour.- Internetbankingisaprocessofinnovation,changeinproductioncost,inputmix,lendingprocesses.
Ciciretti etal.(2009)
The the10-year windowfrom 1993-2002
- ByactivatingInternetbanking:- ROAincreasesby5.92%,15.251%,and21.331%after1,3,and5years.- Commercialloanssignificantlyincreaseby4.912%,3.032%;7.736%after1,3,and5years.- Employeeexpensessignificantlyincreaseby8.559%afterfiveyears
Goh andKauffman(2013,2015)
The 3-yearwindow from2003to2005
- BanksthatinvestedinInternetbankingincur7.3%lowertransactioncosts.- BanksthatinvestedinInternetbankingcancapture29.3%moredepositsthanthosethatdidnot.- Internetbankinginvestmentisassociatedwithanincreaseof18.1%innetoperatingincome.
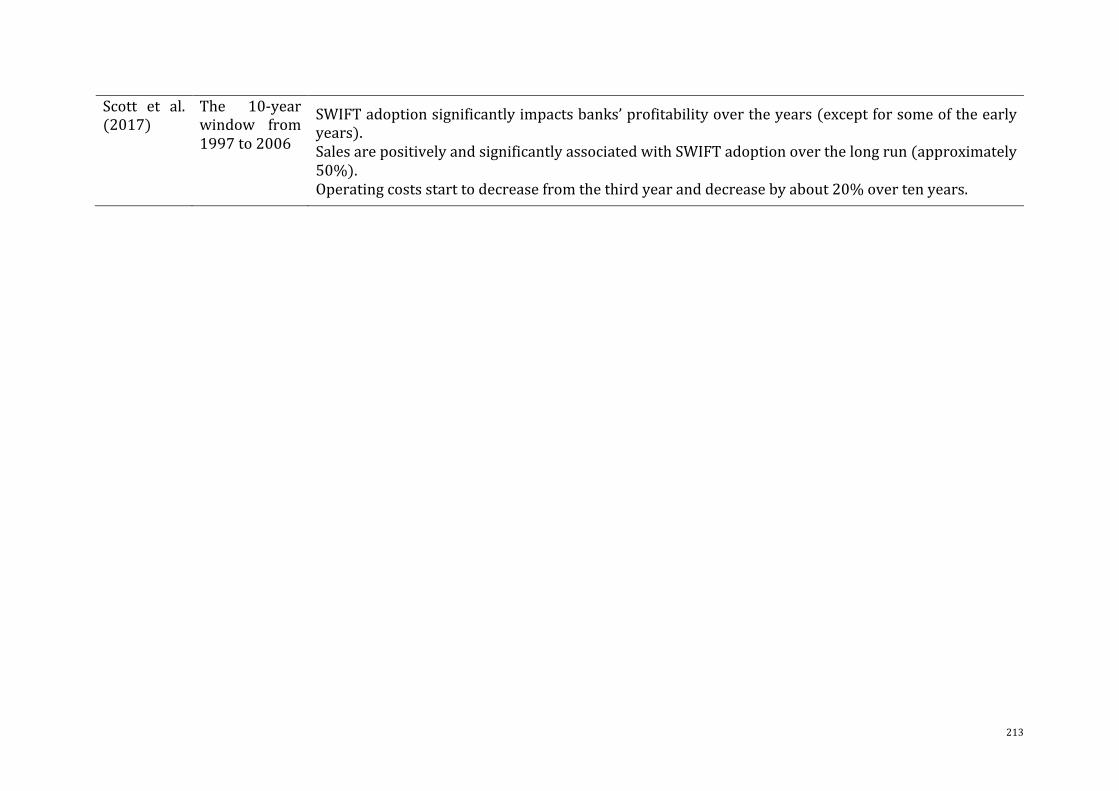
213
Scott et al.(2017)
The 10-yearwindow from1997to2006
- SWIFTadoptionsignificantlyimpactsbanks’profitabilityovertheyears(exceptforsomeoftheearlyyears).
- SalesarepositivelyandsignificantlyassociatedwithSWIFTadoptionoverthelongrun(approximately50%).
- Operatingcostsstarttodecreasefromthethirdyearanddecreasebyabout20%overtenyears.
214
6.3 HypothesisProposal
6.3.1 Hypothesis 6.1:Wealth creation of transactional website adoption in the long
term.
The hypothesis is about the long-term wealth creation of the transactional website.
Primarily based on the resource-based point of view, the transactional website
enablementisexpectedtodeliversustainablevalueinthelongrun.Themainexplanation
is because transactional website adoption can create unique valuable resources and
competencies.Therefore,bankscansustaincompetitiveadvantagesoverthelongterm
that cannot be easily imitated by competitors, as suggested by resource-based view
theorists (Amit and Schoemaker, 1993; Barney, 1991; Collis andMontgomery, 1995;
DierickxandCool,1989;Grant,1991b;LippmanandRumelt,1982;Peteraf,1993;Rumelt
andLamb,1997).Figure6.1isprovidedbelowtoclarifywhyresourcesandcapabilities
cancreatesuperiorperformanceandcompetitiveadvantagesforfirmsinboththeshort
termandlongterm.
AscanbeseenfromFigure6.1,organizationalresourcesandcapabilitiesare likelyto
havean intertwinedandmutuallysupportivecorrelation.Throughthis,resourcesand
capabilitiesconceivablyendowfirmswithstrategicadvantages(e.g.,uniqueness,value,appropriability, interconnectedness, agility, dynamicity) which thereby become thefundamentalbaseofenterprises'competitiveadvantageandoutstandingperformance.
Besidesthis,strategicresourcesandcapabilitiescouldalsoengendermonopolisticvalues
(e.g., invisibilityand inimitability;complexityand limitedsubstitution;diversification)
whicharedeeplyembeddedineachorganizationandassucharelaborioustobeimitated
byotherfirms.Inthisvein,itisfarbetterforfirmstopreservetheirvalueandcompetitive
advantagesinthelongterm.
Therefore, one of the justifications for investors to evaluate an event relevant to
transactional website activation may stem from a query as to whether transactional
websitesgivebirthtoanystrategicresourcesandcapabilitiesinthelongrun.Tosupport
thepointthattransactionalwebsiteadoptioncancreateuniquevaluableresourcesand
competencies, Table 6.2 is providedbelow. Inwhich, that table exhibits the potential
resources and capabilities originating from transactionalwebsite adoption. As can be
seen,transactionalwebsiteadoptionmayrewardbankswithsomestrategicresources,
inthelongrun,includingdigitaltangibleassets(e.g.,digitalhuman)andintangibleassets
215
(e.g.,organizationalknowledge,culture).Basedonaseriesoftheories,theseresources
will rewardbankswitha setof strategicadvantages (e.g.,differentiation fromothers,
promotionofstrategicadvantages,market-orientedperformance).56
BasedonthejustificationofFigure6.1andTable6.2,thishypothesisexpectsapositive
wealthcreationfromtransactionalwebsiteinvestmentinthelongrun.Thisexpectation
isalsobasedonagoodnumberofempiricalstudiesinbankingliterature(Cicirettietal.,
2009;DeYoung,2005;DeYoungetal.,2007;GohandKauffman,2013;Scottetal.,2017-
asdiscussedinSection6.2LiteratureReview)isalsofollowed.Althoughthesestudiesdo
notusethemarket-basedapproach,thepositivefindingsinaccountingmetrics(e.g.,ROE,
ROA)couldbecountedasreferencesforthelong-termimpactoftransactionalwebsite
adoption.Theliteratureaboutthereactionofinvestorstosomeeventssimilartobanking
website-enabledevents isalsothereferenceforthishypothesis,suchas inthecaseof
enterpriseresourceplanning(Morris,2011),innovation(Szutowski,2018,2019),supply
chain management investment (Hendricks et al., 2007), blockchain announcements
(Cahilletal.,2020),e-commerceinitiatives(SubramaniandWalden,2002),value-added
economic adoption (Hamilton et al., 2009), capability maturity model investment
(Filbecketal.,2013).Ingeneral,investorsarefoundtoreactpositivelytotheseevents.
Thestandardexplanationfromscholarsisthatthereisanincrementalvaluefromthose
eventsaddedtotheperformanceandgrowthofthebusiness.
Inthismanner:
Hypothesis6.1:Wealth-creatingcapabilityoftransactionalwebsiteadoptioninthelong
run.
a.Banksearnpositivelong-runabnormalreturnsfollowingtheirtransactionalwebsiteadoption.
b.Transactionalwebsite adoptionpositively impacts theperformanceofbanks in thelongterm
56SeeColumn2,Table6.2.
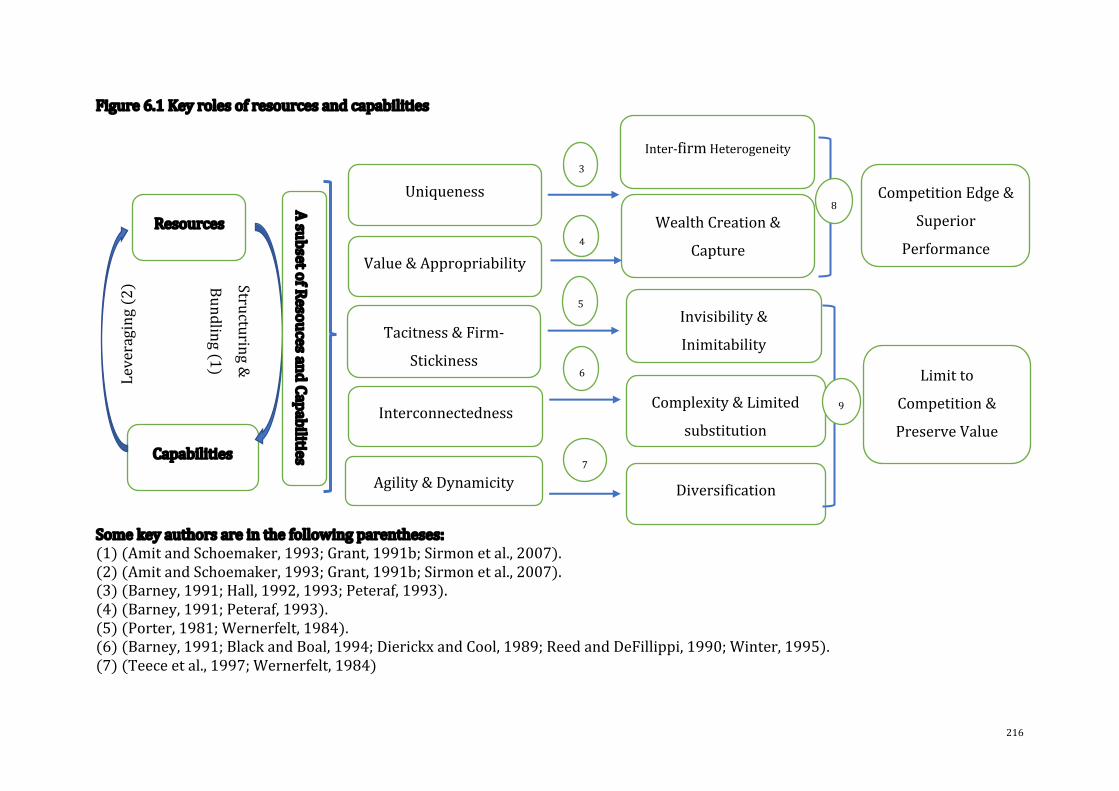
216
Figure6.1Keyrolesofresourcesandcapabilities
Somekeyauthorsareinthefollowingparentheses:(1)(AmitandSchoemaker,1993;Grant,1991b;Sirmonetal.,2007).(2)(AmitandSchoemaker,1993;Grant,1991b;Sirmonetal.,2007).(3)(Barney,1991;Hall,1992,1993;Peteraf,1993).(4)(Barney,1991;Peteraf,1993).(5)(Porter,1981;Wernerfelt,1984).(6)(Barney,1991;BlackandBoal,1994;DierickxandCool,1989;ReedandDeFillippi,1990;Winter,1995).(7)(Teeceetal.,1997;Wernerfelt,1984)
Resources
Capabilities
Value&Appropriability
Uniqueness
Agility&Dynamicity
Tacitness&Firm-
Stickiness
Interconnectedness
WealthCreation&
Capture
Invisibility&
Inimitability
Complexity&Limited
substitution
Diversification
CompetitionEdge&
Superior
Performance
Limitto
Competition&
PreserveValue
Structuring&
Bundling(1)Leveraging(2)
AsubsetofResoucesandCapabilities
3
4
5
6
7
8
9
Inter-firmHeterogeneity

217
Table6.2ProposedStrategicResourcesandCapabilitiesofTransactionalWebsiteAdoption
Resources Theoreticalbase EndowmentsTransferredcompetitiveadvantages
TangibleassetsDigitalHuman
- Digital technical skills:programming, systemsintegration, databasedevelopment
- Digital managerial skills:project planning,interpersonalskills
Corecompetencies(Nordhaug,1993)Dynamic capabilities (Wright andSnell,1998)
- -Organizationarchitecture(NadlerandTushman,1997).- -AnenvironmentinwhichITpersonnelcanleveragenotonlytheirowntechnicalandmanagerialskillsbutcanalsoeffectivelybringtobear theassetsof theentire socio-technicalnetwork towhich themembersbelong.
- -Thecollaborationwithbusinessunitsandexternalorganizationsprojectplanning(Bharadwaj,2000;Melvilleetal.,2004).
IntangibleassetsTacit knowledge (Nonakaand Takeuchi, 1995;Polanyi,1966):
- Awareness of customers’problemsanddesires
- Capabilitiesofcompetitors- Marketvalue- The change of technologyandmarketbusinessExplicitknowledgeExperiences
Differentiatefromothers(CohenandLevinthal, 1990; Johannessen et al.,2001; Peteraf, 1993; Rumelt andLamb,1984,1997).
- Capabilities: absorptive capabilities, entrepreneurial capabilities,adaptivecapabilities.
Promotestrategicadvantages(Cohenand Levinthal, 1990; Johannessen etal.,2001).
- Optimal digital-based strategies by giving the appropriability ofstrategicandtacitactions.
Market-oriented performance(Shane, 2000; Slater and Narver,1995)
-Intensify the comprehension of customer tastes, the speed ofmarket movement, standard criteria for positive customeroutcomes.-Recognizeuniquedigitalproblemsduringdealingwithcustomers.-Enrichbanksknowledge,solutions,experiences,competencies,andabilitytorespondtocustomers.-Predictmoreprecisely thenatureandthepotentialofchanges intheenvironment.

218
Strategic partnership (Slater andNarver,1995)
- - Enhance banks' digital knowledge base which enables banks tobuild/reinforcerelationshipswithtargetedpartnerswhoalsowanttosharedigitalknowledgeforwin-winpurposes.
Innovation (Sabherwal andSabherwal,2005;Shane,2000)
-Enhancethecapabilityofdiscoveringandexploitingdigital-relatedopportunities (e.g., customer trends awareness, new scientificdiscovery,optimalproductdesignanddecision).
Competitive Advantages (Barney,1986a; Camerer and Vepsalainen,1988; Deal and Kennedy, 1982;GordonandDiTomaso,1992;NadlerandTushman,1980;OuchiandCuchi,1981;Petersetal.,1982)
- -Beinglinkedwithbanks’tacitknowledge.- -Differentiatewithothersduetothecollectiveleadershipattitudestomanagechangeandteamlearning.
- -Becomethedeterminantofeconomicvaluebecauseit intensifiesharmony around digital-related strategic direction and places thehighestpriorityonprofitabilitycreationaswellascustomervalue.
Digital-basedOrganizationalCulture
EfficiencyandEffectiveness (Barney,1986a;OuchiandCuchi,1981;SlaterandNarver,1995)
Fosterbehaviours that lead to improvementsandeffectivenessorefficiencyinthedigitalera.Enhanceemployeeproductivityandenrichemployeecommitment(e.g., align and clarify staff members to their specific role andfunction).Promote a digital-based learning environment that encouragesemployeestolearnanddevelopnewskillsandsharetheirexistingskillsandperspectiveswithcolleagues.
Innovation (Deshpandé et al., 1993;SlaterandNarver,1995)
- Provide unique insight into opportunities in a new or existingmarket.
- Encourageentrepreneurialbehaviourstoseekfurtherandcapturedigitalvalue.
- Encourage creative atmosphere for innovation (e.g., unusual orexcitingplans,digital-relatedscientificdiscussions,frame-breakingactions).
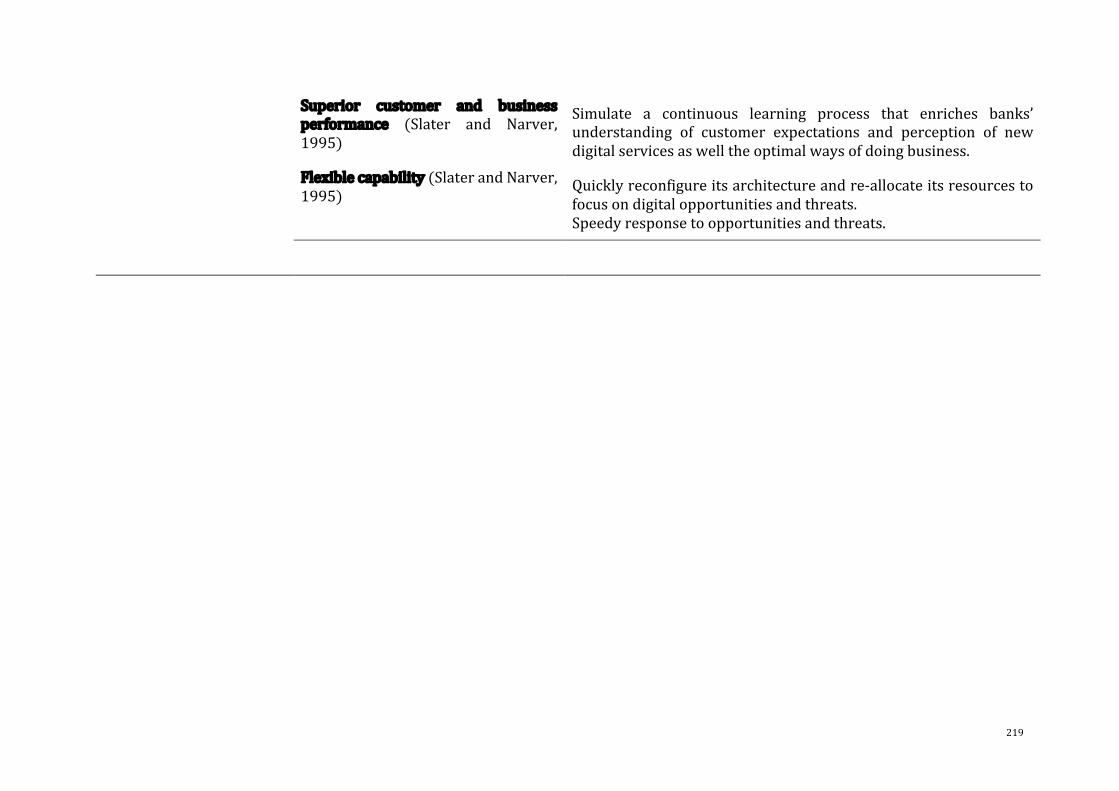
219
Superior customer and businessperformance (Slater and Narver,1995)
- Simulate a continuous learning process that enriches banks’understanding of customer expectations and perception of newdigitalservicesaswelltheoptimalwaysofdoingbusiness.
Flexiblecapability(SlaterandNarver,1995)
- Quicklyreconfigureitsarchitectureandre-allocateitsresourcestofocusondigitalopportunitiesandthreats.
- Speedyresponsetoopportunitiesandthreats.
-

220
6.3.2 Hypothesis6.2:Theimpactofthe“learningbyobserving”effect.
“Learningbyobserving”hasbeendiscussedinChapter5(seeSection5.5.2.5)todescribe
aknowledge-accumulatedprocessofthefirmwhichcanbeobtainedbyobservingand
learning the actions, activities from others (e.g. competitors, suppliers, customers,
universities,andgovernments)(Bandura,1980;Weiss,1990).Theroleof learningby
observinghasalsobeenexaminedinmanyfields,suchasinnovationincentives(Riedl
andSeidel,2018),mergerandacquisitions(DeLongandDeYoung,2007;Francisetal.,
2014;Haunschild,1993;Liangetal.,2021),thechoiceofnewprojects(OfekandSarvary,
2001),corporatefinancialpolicy(AdhikariandAgrawal,2018;LearyandRoberts,2014).
Althoughthe“vicariouslearning”ideahasbeendeveloped,observationofthiseffecton
investorbehaviourandmarketreactionsisstillquitelimited.Afewtypicalstudiesthat
have demonstrated a link between learning-by-observing and market reaction are
DeLongandDeYoung(2007)andthefollowers(Francisetal.,2014;Liangetal.,2021).
To bemore specific, DeLong andDeYoung (2007) detect that in the context that the
marketpossessesasufficientlygoodamountofinformationonM&Aeventsintherecent
past,investorsarelikelytobetterappreciatethevaluegeneratedbyasimilareventinthe
presenttime.Itisinterpretedbytheauthorsthatinvestorsareexternaltothefirmsthey
are attempting to evaluate and accordingly, it is unattainable for the stockmarket to
“learn-by-doing” but “learn-by-observing” throughout private information that spills
overtothepublicsphere.Asthe investorsareunabletoaccesspreviousperformance
informationsufficiently, theycouldonlybasetheirevaluationsontheaccumulationof
observableinformationreleasedtothemarket.
Regarding the context of bankingwebsite-enabled events, this hypothesis follows the
viewpointofDeLongandDeYoung(2007) that themarket ismost likely to fall intoa
semi-strong state where the amount of information concerning the digital banking
transformationtransmittedouttothepublic isnot initsentiretybutonlytoacertain
extent.Therefore,investorstendtotakeadvantageofsuchinformationrelevanttodigital
launcheventsovertherecentpasttoassessthepotentialvaluecreatedbyasimilarevent.

221
Hypothesis6.2:Theimpactofthe“learningbyobserving”effect.
The stockmarketwill be better able to identify value-enhancing banks’ transactional
websiteadoptionsifasubstantialnumberofotherbankshaveenabledwebsitesinthe
recentpast.
6.3.3 Hypothesis6.3andHypothesis6.4:Theimpactofthemagnitudeeffectandtiming
effectoverthelongterm.
Theimportanceofsizeeffectandtimingeffectinpredictingfirms'marketperformance
havebeendiscussedindetailpreviously(Section4.4.2andSection4.4.3,Chapter4).In
thelongrun,thegapsinexcessreturnsamongbanks,attributedtotheirsizeandtimeof
events,arelikelytobewider.Itmightbebecause,inthelongrun,investorscouldhave
plenty of information and time to analyse the value of a business
practice/innovation/adoption.Infact,themarket-basedliteratureshowstheevidenceof
superiorlong-termearningsforsmallerfirmscomparedtotheirlargepeers,suchasin
the discipline of equity issuance (Krishnamurthy et al., 2005), innovations (Sood and
Tellis, 2009), internationalmomentum strategies (Rouwenhorst, 1998). Some studies
alsofindthatfirmsthatlaunchnewproductsdonotoutperformtheirrivalpeersinthe
sameindustryoverthethree-yearperiodfollowingtheinnovationannouncement(e.g.,
Akhigbe,2002).
Hypothesis5.3andHypothesis5.4inthepreviouschapter(inSection5.3.3and5.3.4)
discussed some reasonswhy small banks and laggards tend to bemore successful in
adopting and leveraging their digital or/and technological adoption. In which, small
banks are likely to be more dynamic, more flexible, less sophisticated in their
organizational structures and more opportunistic behaviour in making decisions,
communicating,or/andaccessingnewmarkets(ChenandHambrick,1995;Deanetal.,
1998). Therefore, small banks are likely to be more successful in
adopting/innovating/implementingandearninghigherreturnsfromtheiradoptionsin
thelongterm.Thelaggardsalsohavesomeadvantagesthatmayleadthemtooutperform
their earlier adopted rivals in earning long-termbenefits, such as learning from their
predecessors'failuresandofferingmoreeffectivesolutionsorimprovements(Zachetal.,
2020), takingadvantageofkey technological andmarketdifficultieswhichhavebeen
resolved(Lieberman,2005).

222
InthesameveinwiththeviewpointofHypothesis5.3andHypothesis5.4inChapter5,
thissectionexpects:
Hypothesis6.3:Theimpactofmagnitudeeffectinthelongrun
Smallerbanksaremore likely toenjoysuperiorperformanceupontheir transactional
websiteenablement,inrelationtotheirlarger-sizedpeers.
Hypothesis6.4:Theimpactofthetimingeffectinthelongrun
The following transactional website adopters are likely to outperform pioneers in
achievinghigherlong-runabnormalreturns.
6.4 MethodologyandDataDescription
6.4.1 Estimationoflong-termAbnormalReturns
ThereisaconsiderablenumberofstudiesemployingtheCumulativeAbnormalReturn
(CAR)metrictoestimatetheshort-windowabnormalreturn.57Unfortunately,theCAR
metricisunderstoodtosufferfromseveralpitfallswhenappliedoverthelongterm.A
well-knowncriticismoftheCARmetricisthatitignoresthefactthatinvestorsregularly
buyastockandholditforaparticulartimeratherthaninstantlysellit.Incontrast,BHAR
correctsCAR’sdrawbackbyassuminginvestorsholdthesameportfoliooveracertain
investmentperiod.
Researchersinvestigatinglong-runabnormalreturnsalsoadvocatefortheBHARmetric
asitalleviatesmeasurementbiascomparedtotheCARmetric.Ofrelevancehereisthe
empirical investigation of Barber and Lyon (1997a), which underlines the incorrect
inferencesresultingfromtheCARmetric.Primarily,thestudydocumentthatasampleof
firmsthatallhavezeroannualBHARvalueshaveacorresponding12-monthcumulative
abnormalreturnof+5%onaverage.Inthiscase,researcherswhorelyonCARandignore
theBHARmetricmayconcludethatthesampleearnedlong-runabnormalreturnswhen
57Forexample,theCARmetricisappliedinITinvestment(DosSantosetal.,1993;Imetal.,2001;ChatterjeeandCarlPacini,2002),e-commerceannouncements(Agrawaletal.,2006;Benbunan-FichandFich,2004,2005;Lee,2001),securitybreach(Campbelletal.,2003;Kannanetal.,2007;RoztockiandWeistroffer,2011;Rosatietal.,2017).PleasealsorefertoChapter4,especiallySection4.2forfurtherdetails.
223
itdidnot.Inanotherway,theBHARmetricissuperiortotheCARmetricasitincludes
theeffectsofcompounding.
Considering these discussions, the BHAR metric is selected to estimate long-run
abnormalreturnsinthischapter.Thefollowingsectionwilldiscuss inmoredetail the
estimationoftheBHARmetric.
6.4.1.1 DeterminingBenchmarks
Researchershavepointedoutseveralbiases thatmay lead to themismeasurementof
long-termabnormal returns.Of relevance, there is the researchof Fama (1998),who
argues that long-term abnormal returns are vulnerable to some bad models. More
specifically,theCAPMmodel,whichexplainsthecross-sectionofstockreturnswithonly
one factor (the systematic risk), can produce spurious abnormal returns due to the
mismeasurementofrisk.Meanwhile,themarketmodelalsodoesnotentirelydescribe
expected returns because this model cannot identify anomalies (e.g. size effect).58
MitchellandStafford(2000)alsoarguethatabnormalreturnestimationmaybebiased
if the factormodelsofexpectedreturnsare incomplete inmeasuringrisks.Therefore,
authorsemployinglong-termeventstudiesareoftencautiousinchoosingtheirapproach.
AccordingtoBarberandLyon(1997a),therearethreepopularapproaches:(1)Market-
index(2)Control-firmPortfolioand(3)Multi-factorModels.Table6.3belowshowssome
typical studiesusingBHARmetricwithdifferentbenchmarks. PanelA showsstudies
whichobservethesampleinacross-sectionofindustrieswhilePanelBprovidesstudies
inthebankingindustryonly.Ascanbeseen,thestudiesinPanelAshowagreaterdeal
of variety in the benchmarks. Meanwhile, in the discipline of banking industries in
particular (Panel B), most of studies apply market indices as the benchmark. Some
studiesalsoapplysize-matched,book-to-marketor/andmomentumreferenceportfolios
inbankingindustryasbenchmarksbutthesamplesizeisquitesmall(Cornettetal.,1998,
2006;Cyreeetal.,2012;Filbecketal.,2013).
58SeeBanz(1981)

224
Table6.3Summaryofstudiesanalysinglong-runabnormalstockreturns.
Authors Eventstudies Data ReturnBenchmark
PanelA:Cross-sectionalindustries
Ritter(1991)
Initial PublicOffering(IPO)
1526IPOsfrom1975to1984 MarketIndexSize/industrycontrolapproachSizeportfolio
Agrawal etal.(1992) Acquisition 937mergersand227tenderoffersfrom1955to1987. Sizeportfolio
Ikenberryetal.(1995)
Sharesrepurchase
1239marketsharerepurchaseannouncementsfrom1980to1990. MarketIndexSizeportfolioSizeandbook-to-marketportfolio
Loughranand Ritter(1995)
Initial Public andSeasoned EquityOffering
4753 operating firms from1970-1990who go public in the nextthreeyears.
MarketIndexSizecontrolFirmThree-FactorModel
Womack(1996)
Analystrecommendations
1573recommendationchangesfrom1989to1991.
SizeportfolioThree-factormodel
Brav andGompers(1997)
Initial PublicOffering
934 venture-backed IPOs from 1972 to 1992 and 3,407 non-venture-backedIPOsfrom1975to1992. SizeandBook-to-marketportfolio
Dichev andPiotroski(2001)
Bonds RatingChange
5493bondratingchangesfromMoody'sDefaultRiskService,from1970-1977. SizeandBook-to-marketportfolio
(Otchere,2005)
Privatizationannouncements
18banksthatwereprivatizedbetween1989and1997and28rivalbanks.
Marketindex
Byun andRozeff(2003)
StockSplit12,747stocksplitsfrom1927to1996 Size and book-to-market
control/referencefirms
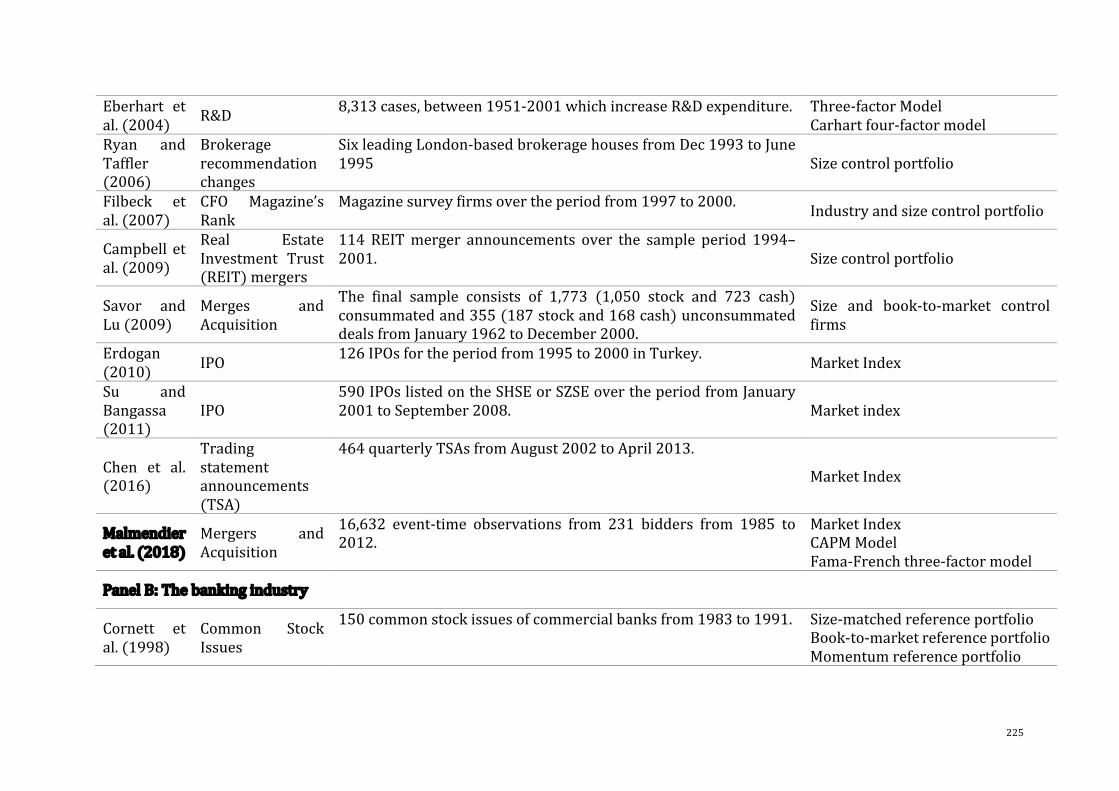
225
Eberhart etal.(2004) R&D 8,313cases,between1951-2001whichincreaseR&Dexpenditure. Three-factorModel
Carhartfour-factormodelRyan andTaffler(2006)
Brokeragerecommendationchanges
SixleadingLondon-basedbrokeragehousesfromDec1993toJune1995 Sizecontrolportfolio
Filbeck etal.(2007)
CFO Magazine’sRank
Magazinesurveyfirmsovertheperiodfrom1997to2000. Industryandsizecontrolportfolio
Campbell etal.(2009)
Real EstateInvestment Trust(REIT)mergers
114 REITmerger announcements over the sample period 1994–2001. Sizecontrolportfolio
Savor andLu(2009)
Merges andAcquisition
The final sample consists of 1,773 (1,050 stock and 723 cash)consummatedand355(187stockand168cash)unconsummateddealsfromJanuary1962toDecember2000.
Size and book-to-market controlfirms
Erdogan(2010) IPO 126IPOsfortheperiodfrom1995to2000inTurkey. MarketIndex
Su andBangassa(2011)
IPO590IPOslistedontheSHSEorSZSEovertheperiodfromJanuary2001toSeptember2008. Marketindex
Chen et al.(2016)
Tradingstatementannouncements(TSA)
464quarterlyTSAsfromAugust2002toApril2013.
MarketIndex
Malmendieretal.(2018)
Mergers andAcquisition
16,632 event-time observations from 231 bidders from 1985 to2012.
MarketIndexCAPMModelFama-Frenchthree-factormodel
PanelB:Thebankingindustry
Cornett etal.(1998)
Common StockIssues
150commonstockissuesofcommercialbanksfrom1983to1991. Size-matchedreferenceportfolioBook-to-marketreferenceportfolioMomentumreferenceportfolio
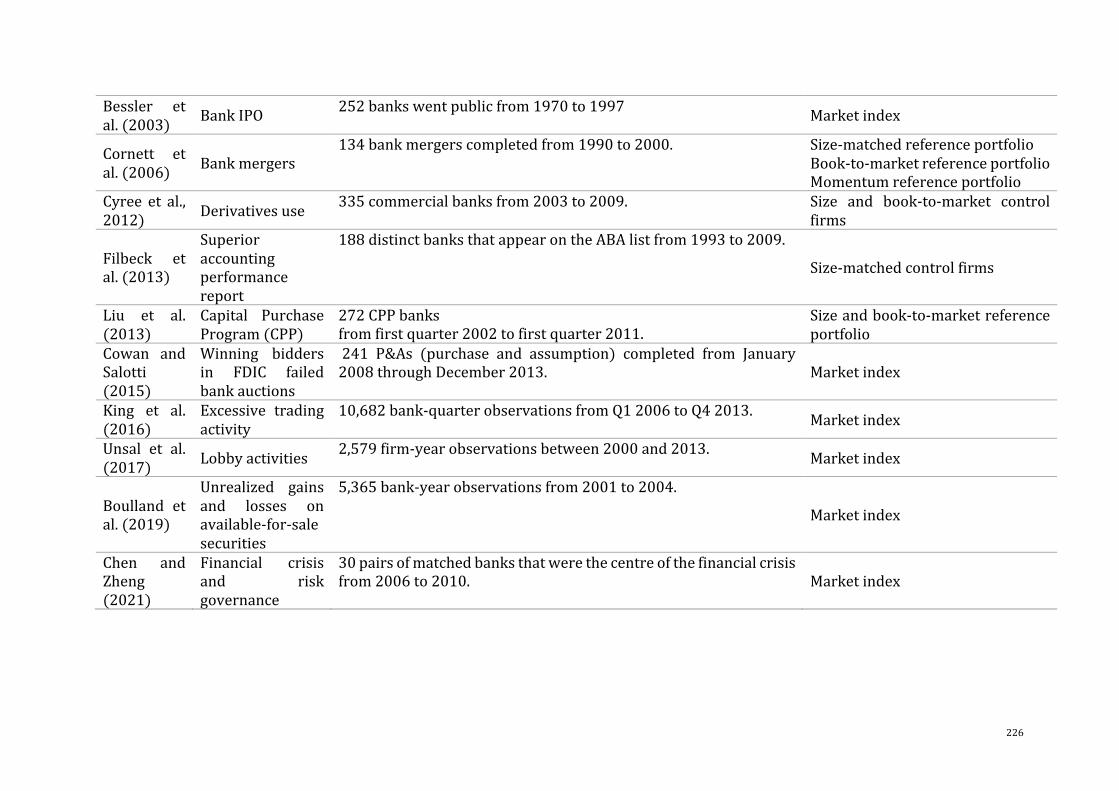
226
Bessler etal.(2003) BankIPO 252bankswentpublicfrom1970to1997 Marketindex
Cornett etal.(2006) Bankmergers
134bankmergerscompletedfrom1990to2000. Size-matchedreferenceportfolioBook-to-marketreferenceportfolioMomentumreferenceportfolio
Cyree et al.,2012) Derivativesuse 335commercialbanksfrom2003to2009. Size and book-to-market control
firms
Filbeck etal.(2013)
Superioraccountingperformancereport
188distinctbanksthatappearontheABAlistfrom1993to2009.
Size-matchedcontrolfirms
Liu et al.(2013)
Capital PurchaseProgram(CPP)
272CPPbanksfromfirstquarter2002tofirstquarter2011.
Sizeandbook-to-marketreferenceportfolio
Cowan andSalotti(2015)
Winning biddersin FDIC failedbankauctions
241 P&As (purchase and assumption) completed from January2008throughDecember2013.
Marketindex
King et al.(2016)
Excessive tradingactivity
10,682bank-quarterobservationsfromQ12006toQ42013. Marketindex
Unsal et al.(2017) Lobbyactivities 2,579firm-yearobservationsbetween2000and2013. Marketindex
Boulland etal.(2019)
Unrealized gainsand losses onavailable-for-salesecurities
5,365bank-yearobservationsfrom2001to2004.
Marketindex
Chen andZheng(2021)
Financial crisisand riskgovernance
30pairsofmatchedbanksthatwerethecentreofthefinancialcrisisfrom2006to2010. Marketindex
227
Notably,thedatapropertiesandresearchpurposesarethekeyfactorsdeterminingthe
chosenbenchmarkinthischapter.
Firstly,themarketindexisappliedasabenchmarktomeasureBHARbecauseitdoesnot
requiresizeorbook-to-marketdata.Withthenatureofthesample,therearesomebanks
facingproblemsofamissingvalueofbook-to-market.Theselectionofcontrol/reference
firmsalsohasaproblembecausesomebanksmaynotfindthematchedfirms,leadingto
the potential of sample size reduction.59 Therefore, to preserve sample size when
calculatingBHAR,marketindicesarechosenasthebenchmarks.
Furthermore,thecontrol/referenceportfolioiswhatisadoptedfor.Severalauthorshave
claimedthatcross-firmvariationcanbecontrolledbyestimatingabnormalreturnsusing
thecontrolfirmapproach.AccordingtoFama(1998),averagestockreturnsarerelated
tofirmsizeandbook-to-marketratio.Thus,thecontrolfirmapproachdoesnotsolvethe
bad-modelproblem,butityieldswell-specifiedteststatisticsasitcontrolsforthenew
listing,rebalancing,andskewnessbiases(BarberandLyon,1997a).60
Inshort,twomarketindices,includingS&P500andNasdaq,andthematched-sizefirm
controlportfolioareadoptedasthemainbenchmarks.61Whatfollowsisadescriptionof
howtoestimatethosebenchmarksforsamplefirmsandthecalculationofBHAR.
6.4.1.2 Matched-firmPortfolioSelection.
Asdescribedearlier,thecontrol-firmportfolioapproach(whichcanincludeeithersingle
or multi-firm possessing closet characteristics to event firms), is selected for
benchmarking.Intheinitialstageoftheprocess,theannouncementmonthofthewebsite
launch of each sample bank is assumed to be X!. At this point, the standards for the
portfolioaresetasfollows.
59Forexample,thebankswhoadoptatransactionalwebsitein2010couldnotfindthematchedfirmsasnobanksinoursamplelaunchthewebsiteafter2010.60AccordingtoBarberandLyon(1997a),newlistingbiasarisesineventstudiesoflong-termabnormalreturnsbecausesamplefirmsusuallyhavealongpre-eventreturnrecord.Atthesametime,thebenchmarkportfoliomayincludefirmsthathaveonlyrecentlybeguntradingandareknowntounderperformmarketaverages.Secondly,rebalancingbiasarisesbecausethecompoundedreturnonthebenchmarkportfoliotypically assumes periodic rebalancing of the portfolio weights, while sample firms’ returns arecompoundedwithoutrebalancing.Lastly,skewnessbiasarisesbecauselong-termabnormalreturnsarelikelytobepositivelyskewed,i.e.,theyhavearight-skeweddistribution.61Notably,theequallyweightedmarketindexaswellastheex-antebuy-and-holdreturnarealsousedasthealternativebenchmarks.ThosebenchmarkswillbediscussedfurtherinSection6.6-RobustnessTests.Additionally,asthelimitofthischapter,themultifactormodelswerenotapplied.BarberandLyon(1997a),however,arguethatthearithmeticsummationofreturndoesnotpreciselymeasureinvestorexperiencewiththeconstructionofmultifactormodels.

228
Foreachsamplebank",thecandidatebanksmustlaunchthewebsiteatleast36months
(threeyears)afterthissamplebank'seventtime.62Inotherwords,foreachsamplebank",
otherbanksthathavedebutedtheirwebsitesbeforeorwithinthefirst36monthssince
theeventmonthof the samplebank" areexcluded from the listof control firms.This
setting is because abnormal returns are estimated as the difference between actual
returns and normal returns. Accordingly, the banks selected to the benchmarkmust
ensurethemaintenanceofnormalreturnswithinaspecifictimearoundtheeventdate
oftargetedbanks.Forsuchareason,banksselectedascandidatesforthebenchmarks
arethosethatsetupwebsitesatleast36monthslaterthanthesamplebanks.
The next step is identifying matched banks that must satisfy the criteria of size.63
FollowingthemethodologyofIkenberryetal.(1995)andBarberandLyon(1997a),at
eachmonth,allthesamplebanksaresortedintotendecile-sizedportfolios.Theportfolio
mustincludethebanksofthesamesizerankasthetargetedbank.Asthesizeisreset
eachmonth,thebenchmarkportfolioisdifferenteachmonth.
To sum up, the control-firm portfolio selected for each sample firmmust satisfy two
conditions:(1)launchwebsitesatleast36monthslaterthanthesamplefirm,(2)possess
thesizecharacteristicsimilartothesamplefirmduringtheholdingperiod(inthesame
sizerankwiththesamplebank).However, itshouldbeacknowledgedthatsettingthe
above conditions cannot guarantee that each samplebankwill havea full ten control
firms.ReferringtoSavorandLu(2009),thematchedportfolioscontaininglessthanten
controlbanksarestillkeptincasetherearenotenoughtoreachtenbankssatisfyingall
threecriteria,aslongastheamountofcontrolbanksisatleastone.
6.4.1.3 MarketIndexPortfolio
Followingsomeauthors(Ikenberryetal.,1995;Ritter,1991),themarketindexisalso
adopted for estimating the BHAR. To bemore specific, twomainmarket indices are
62Forexample,ifthetargebankhastheeventinJanuary1996(t! = January1996),thecontrolbanksneedtohavetheeventsatleastafter36months(fromt"# =January1999).63Firmsizeisdefinedasthemarketcapitalization(BarberandLyon,1997a;SavorandLu,2009).

229
applied,whichareS&P500andNasdaq.64BothS&P500andNasdaqarecollectedmonthly
fromtheThompsondatasource.
6.4.1.4 ModelofAbnormalReturns
BHARisdescribedasthedifferenceinreturnbetweenabuy-and-holdinvestmentinthe
samplefirmandabuy-and-holdinvestmentincontrol-firm/referenceportfolio:
]^_`#$ = ]^#$ − ]^#% (Equation6.1)
Where]^#$ isthebuy-and-holdreturnfordefg$ overtheholdingperiodand]^#%isthe
correspondingbuy-and-holdreturnmatchedportfolioofdefg$ .
Similar to the short-run investigation, abnormal return estimation cannot be reached
untiltheholdingperiodisset.Referringtomanystudies,themainholdingperiodschosen
areT(0,11);T(0,23);T(0,35).
AscanbeseeninEquation6.1,twometricsshouldbeestimatedfirst:thebuy-and-hold
returnofeachtargetbank(]^#$ )andthebuy-and-holdreturnofthebenchmark(]^#%).
Equation6,2,Equation6.3andEquation6.4areappliedfortheconstructionofbuy-and-
holdreturnoftargetbank"anditsbenchmarks.Toestimate]^#%inthiscase,themonthly
mean return for each portfolio is calculated first, and then the mean return is
compoundedovertheholdingperiod.
]^#$ =hi1 + `$,'k − 1'()
'(! (Equation6.2)
Where:
• `$,'=monthlyreturnoflmno$ duringtheholdingperiod.
∏ i1 + `$,'k − 1'()'(! =compoundedreturnofmonthlyreturnsoflmno$ duringtheholdingperiod.
]^#% =hq1 +∑ `*+',-$,&.&$(/
n's − 1
'()
'(! (Equation6.3)
64AsfollowedBarberandLyon(1997a),theequallyweightedindexisalsoapplied,whichisestimatedbythemeanreturnofthethreelargeststockindicesintheUS:S&P500,Nasdaq,andDowJones.Theresultsofequallyweightedmarketindexarepresentedintherobustnesstestsection.

230
Where:
• ∑ 1'(&)*$,&+&,-.
.&=monthlyaveragereturnofmatchedfirmsduringtheholdingperiod.
∏ q1 +∑ 1'(&)*$,&+&,-.
.&s − 1'()
'(! =compoundedreturnofmonthlyaveragereturnsduringtheholding
period.
]^#% =hi1 + `*,'k − 1'()
'(! (Equation6.4)
Where:
• `*,'=monthlyreturnofmarketindexduringtheholdingperiod.
∏ i1 + `*,'k − 1'()'(! = compounded return of monthly returns of the market index during the
holdingperiod.
Twocommonlyappliedtestsineventstudiesaretheparametrictestthatsupportsthe
assumptionofnormaldistributionand thenonparametric testbeingdistribution-free.
TheparametrictestischosenbyfollowingtherecommendationofBrownandWarner
(1985) and some other authors. The authors indicate that parametric tests arewell-
specifiedwhentestingtheabnormalperformanceofstocks.
X = 2341/55555555567(2341,)/√<
(Equation6.5)
Where:
• ]^_`=tttttttttisthemeanvalueofexcessreturnsofthewholesampleofsecuritiesduring
theholdingperiod.
• uv(]^_`$) is the standard deviation of excess returns of thewhole sample of
securitiesduringtheholdingperiod.
• Nisthenumberofsamplesecuritieswhoseexcessreturnsareavailableduring
theholdingperiod.
6.4.2 MethodologyofHypothesis6.1:TheregressionbetweenBHARandtransactional
websiteadoption
Toexaminetheimpactoftransactionalwebsiteadoptiononthelong-termperformance
ofbanks,theregressionwiththeequationiscarriedoutasfollow:

231
]^_`$,' = w + x × zfmnum{Xe|nm}_�ÄlueXÄ_mvX|Åe|n$,'
+ Ç × É|nXf|}Ñmfeml}Äu$,' + Ö$,'(Equation6.6)
• ]^_`$,' is the difference in the monthly compounded returns of banks and the
monthlycompoundedreturnsofthebenchmark,duringthepre-adoptionandpost-
adoption of the transactional websites. The holding periods used are 12 months
before(-12,-1)and12monthssincethetransactionalwebsiteeventmonth(0,11);
24months before (-24, -1) and 24months since the transactional website event
month (0, 23); 36months before (-36, -1) and 36months since the transactional
websiteeventmonth(0,35).
• zfmnum{Xe|nm}_�ÄlueXÄ_mv|ÅXe|n$,'isadummyvariable,whichequals1if]^_`$,'
isestimatedinthepostadoptionperiod(0,11);(0,23)or(0,35).Otherwise, this
variableequalto0if]^_`$,'isestimatedinthepre-adoptionperiod(-12,-1);(-24,
-1);(-36,-1).
• ∆`à_$,' , âänvenã$,' , åÄÑÄfmãÄ$,' , ]mnoçeéÄ$,' , ^^è$,' are the set of control variables
that are estimated forboth thepreadoptionperiodandpost-adoptionperiod.The
definitionofthissetofcontrolvariablesissummarizedinTable6.4.
6.4.3 MethodologyofHypothesis6.2:Theimpactofthe“learningbyobserving”
Hypothesis 6.2 investigates the impact of “learning-by-observing” on banks’
performance, expecting that investors can evaluate the transactional website
announcementsofbanksbetterbyobservingtheperformanceofbankswhoadoptedthe
transactional website earlier. To verify Hypothesis 6.2, the following equation is
constructed:
Å|uX − ]^_`$,'= w + x × å]àì(1)$,' +Ç × É|nXf|}Ñmfeml}Äu$,'
+ Ö$,'
(Equation6.7)

232
• Specifically,Equation6.7isusedtotesttherelationshipbetweenpost-BHARand
the impact of the learning-by-observing effect, under the control of a set of
variables.
• Å|uX − ]^_`$,'arethemonthlycompoundedreturnsofbanksaftertheyadopted
thetransactionalwebsites.Theholdingperiodsusedare12months,24months,
and36months,usingthreedifferentbenchmarksmentionedinSection6.4.1
• Thevariableå]àì(1)$,'istheproxyforlearningbyobserving,ormoreprecisely,
for observable information spillover from transactional website adoption of
previousbanksfromwhichbankinvestorscanpotentiallylearn.å]àì(1)$,'isthe
cumulativenumberofsamplebanksthatadoptedtransactionalwebsitesduring
oneyearpriortothetransactionalwebsiteoflmno$ .65
6.4.4 MethodologyofHypothesis6.3:Theimpactofmagnitudeeffectinthelongrun
Hypothesis 6.3 investigates how the magnitude effect influences the impact of the
transactional website adoption on financial performance among banks. To test
Hypothesis6.3,thefollowingequationisconstructedwhichexaminetheimpactofthe
sizeeffectonthelong-termperformanceofbanksinthepost-adoptionperiodonly.66
]^_`$,' = w + γ × åmfãÄlmno$,' +Ç × É|nXf|}Ñmfeml}Äu$,'+Ö$,'
(Equation6.8)
Inwhich, foreachyear, thebanksaredivided into twogroups:small-sizedbanksand
large-sizedbanks.Thesmall-sizedbankgroupcomprises50%ofsamplebankswiththe
smallestassetvalueseachyear,andthelarge-sizedbankgroupincludestheremaining
50%ofbankswiththelargestassetvalues.Afterthat,twodummyvariableswerecreated,
includingSmallbank",?andLargebank",?.FortheSmallbank",?variable,banksthatbelong
totheSmall-sizedgroupwillreceivethevalueof1,andbanksintheLarge-sizedgroup
willreceivethevalueof0.Incontrast,fortheLargebank",?variable,banksinthelarge-
65TheimpactofLBOY(2)0,1andLBOY(3)0,1ontheBHARarealsotestedtoavoidthebiasselection.PleaserefertoSection6.6-RobustnessTestsforfurtherdetails.66Thesizeeffectoverbothex-anteandex-postperiodsofthetransactionalwebsitelaunchingeventisalsotested.PleaserefertoSection6.6-RobustnessTestsformoredetails.
233
sizedgroupwillreceivethevalueof1,andbanksinsmall-sizedgroupwillreceivethe
value of 0. Notably, in this chapter, Smallbank",? variable is treated as the reference
variable. Therefore, the empirical results only show the coefficient values of
theLargebank",?variable.
Additionally,BHARandotherindependentvariableswereestimatedduringtheex-post
period of transactional website adoption only. Therefore, three holding periods
employedwere(0,11);(0,23);(0,35).BHARandothervariablesaresimilartotheones
inEquation6.6.
6.4.5 MethodologyofHypothesis6.4:Theimpactoftimingeffectinthelongrun
Hypothesis 6.4 investigates if the timing order influences the relationship between
transactional website adoption and banks’ performance. To test Hypothesis 6.4, the
followingequation is constructedwhichexamines the impactof the sizeeffecton the
long-termperformanceofbanksinthepost-adoptionperiodonly.67
]^_`$,' = w + γ/ × çÄ{|nv_g|ÑÄf$,' +γ@ × Laggard$,'+Ç × É|nXf|}Ñmfeml}Äu$,' +Ö$,'
(Equation6.9)
In which, three different dummy variables are created, namely First_movers",?,
Second_movers",?andLaggard",?.First_movers",?equals1iftheadoptionyeariswithinthe
1996-1998interval,otherwise,itequals0.Second_movers",?equals1iftheadoptionyear
iswithin1999-2000,otherwiseequals0.68Laggard",?equals1iftheadoptionyearisafter
2000. In this chapter, First_mover",? variable is treated as the reference variable.
Therefore,theempiricalresultsonlyshowthecoefficientvaluesoftheSecond_movers",?
andLaggard",?variables.
Besides, BHAR",? and other independent variables are estimated during the post-
adoptiononly(0,11);(0,23);(0,35).
67Thetimingordereffectoverbothex-anteandex-postperiodsof thetransactionalwebsite launchingeventisalsotested.PleaserefertoSection6.6-RobustnessTestsformoredetails.68Theselectedcut-offyearsarediscussedindetailinSection3.3-DataDescription.

234
Table6.4SummaryofVariables Aim Estimation ExpectedsignDependentvariable
BHAR!,#Examine the long-runperformanceofbanks
Estimated as the difference incompounding return between a buy-and-hold investment in the samplefirm and its benchmark during aspecifiedholdingperiod.Threebenchmarkshavebeenapplied:S&P 500, Nasdaq, and matched-bankportfolio.Sixdifferentholdingperiodshavebeenapplied:(-12,-1);(0,11);(-24,-1);(0,23);(-36,-1);(0,35).
Independentvariable
Transactional_website_adoption!,#
Examine the impact oftransactional websitelaunching on banks’performance.
Dummyvariableequals1iftheholdingperiodsare(0,+11months); (0,+23months);(0,+35months)andequals0if the holding periods are (-1, -12months); (-1,- 23 months); (-1, -35months).
X >0 indicatestransactional websiteadoption positivelyimpacts the long-runperformanceofbanks.
LBOY(1)!,#
The variable LBOY is theproxy for “learning byobserving” effect, or moreprecisely, for observableinformation spillover fromprevious bank transactionalwebsite adoption fromwhich bank managers andbank investors canpotentiallylearn.
_`ab(1)$,% is the number of thecumulative number of sample banksthat adopted transactional websitesduring one year before thetransactionalwebsiteofbankt.
X >0 indicates that themore information aboutwebsite adoption in therecent past, the better aninvestor's assessment ofthe value of the currentbank'swebsiteadoption.
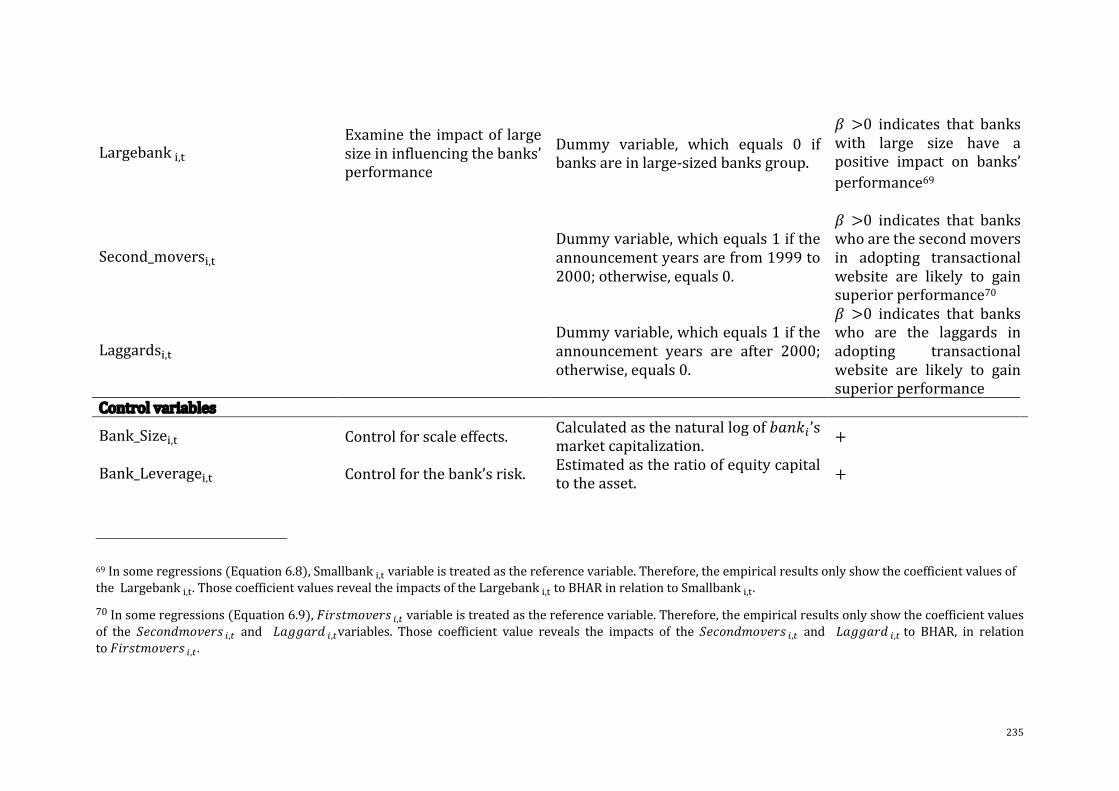
235
Largebank!,#Examine the impactof largesizeininfluencingthebanks’performance
Dummy variable, which equals 0 ifbanksareinlarge-sizedbanksgroup.
X >0 indicates that bankswith large size have apositive impact on banks’performance69
Second_movers!,# Dummyvariable,whichequals1iftheannouncementyearsarefrom1999to2000;otherwise,equals0.
X >0 indicates that bankswhoarethesecondmoversin adopting transactionalwebsite are likely to gainsuperiorperformance70
Laggards!,# Dummyvariable,whichequals1iftheannouncement years are after 2000;otherwise,equals0.
X >0 indicates that bankswho are the laggards inadopting transactionalwebsite are likely to gainsuperiorperformance
Controlvariables
Bank_Size!,# Controlforscaleeffects. Calculatedasthenaturallogofghij$ ’smarketcapitalization. +
Bank_Leverage!,# Controlforthebank’srisk. Estimatedastheratioofequitycapitaltotheasset. +
69Insomeregressions(Equation6.8),Smallbank",$variableistreatedasthereferencevariable.Therefore,theempiricalresultsonlyshowthecoefficientvaluesoftheLargebank",$.ThosecoefficientvaluesrevealtheimpactsoftheLargebank",$toBHARinrelationtoSmallbank",$.
70Insomeregressions(Equation6.9),IJKLMNOPQKL%,&variableistreatedasthereferencevariable.Therefore,theempiricalresultsonlyshowthecoefficientvaluesof theRQSOTUNOPQKL%,& and VWXXWKU%,&variables. Those coefficient value reveals the impacts of the RQSOTUNOPQKL%,& and VWXXWKU%,&to BHAR, in relationtoIJKLMNOPQKL%,& .

236
Bank_Funding!,#Control for the bank’sliquidity.
EstimatedastheratioofNetloansandleasesoverCoreDeposit. -
HHI!,#Control for marketconcentration
Calculated by squaring the marketshare of each firm competing in themarket and then summing theresultingnumbers.AhighvalueofHHIindicates a highly concentratedmarketplace.
∆ROA!,#Control for changes infinancialperformance
Calculated as the difference inperformancebeforeandafteradoptingthetransactionalwebsite.
+
237
6.4.6 DescriptiveStatistics
Table6.5providessomeimportantstatisticalinformationaboutthedatainthepre-event
(PanelA)andinthepost-eventoftransactionalwebsiteadoptions(PanelB).
Firstly,whatisstrikinginthistableisthecontinualgrowthofROA.Specifically,after1,
2,and3yearsfromtheyearofwebsiteenablement,thebankcanincreaseto0.185,0.482,
0.533pointsoftheirROArespectively(seepanelB).Meanwhile,inthe3yearspriorto
theadoption,theimprovementofROAcouldbebetween0.031pointsand0.081points
(seepanelA).Ifcomparedoverthesame3-yearperiodbeforeandaftertheadoption,the
improvementinprofitabilityinthepost-adoptionperiodcouldbeupto17times(0.533
vs0.185).
Secondly,therehasbeenamarkedchangeinbankfundingstrategyintheex-postperiod.
Morepointedly,theratioofnetloanandleasetocoredepositsofbankstendstoincrease
sharply,showingthattheirliquidityriskislikelytobehighersincetheyhaveadopted
websites.Onaverage,overone, two, threeyears fromthe timeofadoption, themean
scoreofthebankfundingratiocouldreach99.82%,99.49%,100.63%,respectively(see
panelB).Meanwhile,intheex-anteadoption,bankshadmaintainedafundingstrategy
withlowerliquidityrisk(thefundingratiorangesfrom89.25%to91.96%)(seepanel
A).Theseratesarebetween7.86%-11.013%lowerthantheratesintheex-postadoption
period.
Thirdly,thebank'scapitalizationstatusalsoshowsadecreasefromabout11.940%to
10.807%onaverageaftertheadoption(seepanelB).However,asthemedianandmean
capitalratiosarebothinexcessof10%,itislikelythatthebanksarestillwellabovethe
statutoryrequirements.
Fourthly,itcanbeclearlyseeninthistableisthegrowthofthemarketvalueofsample
banks.Overthethreeyearssincetheadoption,theaveragemarketvalueofthesample
banks has increased significantly, reaching around USD 970 million (see panel B).
Meanwhile,theaveragevaluewasbetween442and566millionUSDdollarsoverthe3
yearsprecedingtheadoption(seepanelA).Iftheaveragemarketvalueofthe3rdyear
beforeadoption(marketvalue-1,-4)istakenasabenchmark,thenthegrowthofmarket
value in the following years will be 9.5%, 28.05%, 62.44 %, 88.91%, and 119.46%,
respectively.
Finally,itisworthnotingthattheHHIisconsistentlyabove1500points,andassuchthe
sample banks are considered to be in a consistently highly competitive status (as

238
followingtheguidelinesoftheU.S.DepartmentofJustice,2018)(seebothpanelAand
B).
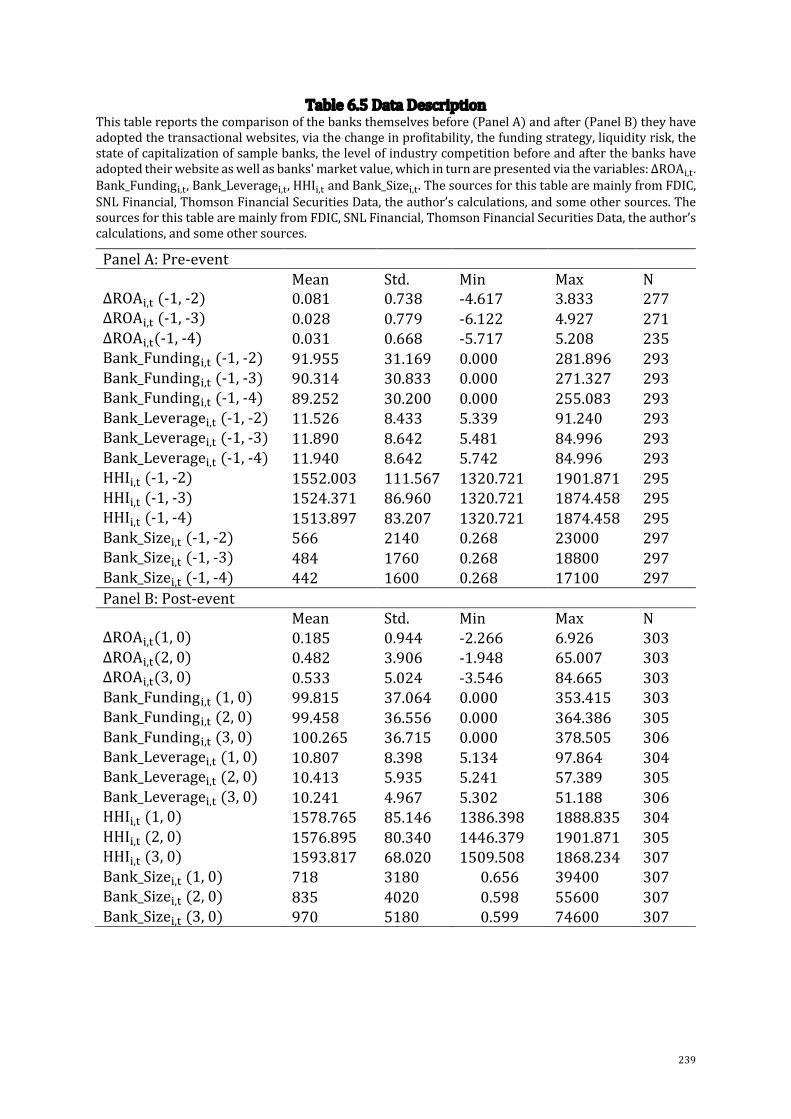
239
Table6.5DataDescriptionThistablereportsthecomparisonofthebanksthemselvesbefore(PanelA)andafter(PanelB)theyhaveadoptedthetransactionalwebsites,viathechangeinprofitability,thefundingstrategy,liquidityrisk,thestateofcapitalizationofsamplebanks,thelevelofindustrycompetitionbeforeandafterthebankshaveadoptedtheirwebsiteaswellasbanks'marketvalue,whichinturnarepresentedviathevariables:∆ROA!,#.Bank_Funding!,#,Bank_Leverage!,#,HHI!,#andBank_Size!,#.ThesourcesforthistablearemainlyfromFDIC,SNLFinancial,ThomsonFinancialSecuritiesData,theauthor’scalculations,andsomeothersources.ThesourcesforthistablearemainlyfromFDIC,SNLFinancial,ThomsonFinancialSecuritiesData,theauthor’scalculations,andsomeothersources.
PanelA:Pre-event Mean Std. Min Max N∆ROA!,#(-1,-2) 0.081 0.738 -4.617 3.833 277∆ROA!,#(-1,-3) 0.028 0.779 -6.122 4.927 271∆ROA!,#(-1,-4) 0.031 0.668 -5.717 5.208 235Bank_Funding!,#(-1,-2) 91.955 31.169 0.000 281.896 293Bank_Funding!,#(-1,-3) 90.314 30.833 0.000 271.327 293Bank_Funding!,#(-1,-4) 89.252 30.200 0.000 255.083 293Bank_Leverage!,#(-1,-2) 11.526 8.433 5.339 91.240 293Bank_Leverage!,#(-1,-3) 11.890 8.642 5.481 84.996 293Bank_Leverage!,#(-1,-4) 11.940 8.642 5.742 84.996 293HHI!,#(-1,-2) 1552.003 111.567 1320.721 1901.871 295HHI!,#(-1,-3) 1524.371 86.960 1320.721 1874.458 295HHI!,#(-1,-4) 1513.897 83.207 1320.721 1874.458 295Bank_Size!,#(-1,-2) 566 2140 0.268 23000 297Bank_Size!,#(-1,-3) 484 1760 0.268 18800 297Bank_Size!,#(-1,-4) 442 1600 0.268 17100 297PanelB:Post-event Mean Std. Min Max N∆ROA!,#(1,0) 0.185 0.944 -2.266 6.926 303∆ROA!,#(2,0) 0.482 3.906 -1.948 65.007 303∆ROA!,#(3,0) 0.533 5.024 -3.546 84.665 303Bank_Funding!,#(1,0) 99.815 37.064 0.000 353.415 303Bank_Funding!,#(2,0) 99.458 36.556 0.000 364.386 305Bank_Funding!,#(3,0) 100.265 36.715 0.000 378.505 306Bank_Leverage!,#(1,0) 10.807 8.398 5.134 97.864 304Bank_Leverage!,#(2,0) 10.413 5.935 5.241 57.389 305Bank_Leverage!,#(3,0) 10.241 4.967 5.302 51.188 306HHI!,#(1,0) 1578.765 85.146 1386.398 1888.835 304HHI!,#(2,0) 1576.895 80.340 1446.379 1901.871 305HHI!,#(3,0) 1593.817 68.020 1509.508 1868.234 307Bank_Size!,#(1,0) 718 3180 0.656 39400 307Bank_Size!,#(2,0) 835 4020 0.598 55600 307Bank_Size!,#(3,0) 970 5180 0.599 74600 307
240
6.5 EmpiricalResults
6.5.1 ResultsofHypothesis6.1:Wealthcreationof transactionalwebsiteadoption in
thelongterm.
Table6.6andTable6.7presentthelong-termabnormalreturnsearnedbybankssince
theirtransactionalwebsiteshavebeenadopted.Inwhich,Table6.6displaysthevalues
ofBHARearnedwithinthe12-monthperiod(PanelA),24-monthperiod(PanelB),and
36-monthperiod(PanelC)sincetheadoptionofthetransactionalwebsite.Meanwhile,
Table6.7showstheresultsoftheregressionsreflectingtherelationshipbetweenBHAR
andtransactionalwebsiteadoption.
Overall,theresultsofTable6.6stronglysupportHypothesis6.1atthepointthatbanks
earnsignificantpositiveabnormalreturnsinthelongtermfromwhentheyembracedthe
transactionalwebsitechannel.Table6.7alsosupportsHypothesis6.1astheyexhibita
positive impact of transactional website adoption on BHARs, indicating the wealth-
creatingcapabilityofthisdigitalinitiative.
Tobemorespecific,theresultsinTable6.6revealsomefactsasfollows:
Firstly,thebuy-and-holdabnormalreturnsofbankeventsarefoundtohaveconsecutive
growth over 12, 24, and 36 months following their transactional website launch
announcements.Morepointedly,overthefirst12months,bankscanearnexcessreturns
ranging from 2.7% (p<0.1) to 8.7% (p<0.01). Excess returns continue to increase
significantlywhenthewindowlengthisextendedto24months(rangefrom4.7%,p<0.1
to23.8%,p<0.01)and36months(rangefrom9.5%,p<0.01to33%,p<0.01).
Secondly,BHARshowsthehighestgrowthifthebenchmarkistheNasdaqindexwhile
BHARexperiencesthestrongestchangeifthebenchmarkisthenon-eventmatched-size
bankportfolio.Morespecifically,BHARusingNasdaqbenchmarkincreasedfrom0.087,
(12-month,p<0.01)to0.238(24-month,p<0.01)and0.33(36-month,p<0.01).Thus,
comparedwith 12-monthBHAR, 24-monthBHAR and 36-monthBHAR increased by
173.56% and 279.3%, respectively. Meanwhile, regarding control-firm benchmark,
BHARssawastrongincreasefrom74.07%inthefirst24months(upfrom0.027,p<0.1
to0.047,p<0.1)to251.9%in36months(upfrom0.027,p<0.1to0.095,p<0.01).
Those findings, thereby, authenticate the growth in themarketperformanceofbanks
fromwhentheyadoptdigitalwebsites.Thefindingsalsoprovidecomparativeevidence
that website-event banks outperform themarket and their non-event competitors in
241
holding long-termbuy-and-hold investments. Also, the findings reveal higher interest
andfaithofinvestorsfortransactionalwebsiteadoptionportfoliosinthelongterm,in
relationtootherportfoliosinthemarketonaverageaswellasespeciallyinrelationto
similar-capitalizedbankcompetitorswithnotransactionalwebsiteadoption.
Table6.6earlierprovidesevidencethatcomparesthebuy-and-holdstrategiesofevent
banks against their hypothetical benchmarks since the time website events were
announced.Table6.7ismoreinclinedtoprovideevidenceofadifferenceinthebuy-and-
hold performance of banks before and after they adopt transactional websites when
comparedwiththesamebenchmarks.Thus,thefindingsinTable6.7canshowthedirect
valuethattransactionalwebsitescontributetothemarketperformanceofbankadopters
aswellastheirabilitytocreatewealthforshareholders.
Tobemorespecific,byadoptingatransactionalwebsite,atleastinrelationtothemarket
asahypotheticalportfolio,bankscansignificantlyenhancetheirmarketperformanceby
from0.074(p<0.05)to0.082(p<0.1)pointsoverthefirst12monthsoftheadoption.71
Over24months,transactionalwebsiteadoptioncontinuestoaddfrom0.281(p<0.01)
to0.397points(p<0.01)tobanks’performanceinrelationtothemarket.Equivalently,
theimpactoftransactionalwebsitesonthemarketperformanceofbankshasgrownup
to384.1%over24monthsand850%over36months following themonth theyhave
adopted,incomparisontothefirst12-monthperiod.72
Inconclusion,theresultsinthissectionrevealthefollowingfindings.Firstly,thereisthe
directinvolvementofthemarketuponbankingwebsitelauncheventsinthelongterm.
Portfoliospertainingtosucheventsarefoundtoholdsignificantgrowthoveralongterm
interval,atleastforthreeyearsfollowingthelaunchevent.Thisreactionfromthemarket,
thereby, enables banks to achieve favourable market performance which vigorously
71RegardingthevalueoftransactionalwebsiteadoptionaddstoBHARusingthematched-firmportfolio,althoughthecoefficientsarepositive,theyarenotstatisticallysignificant.Toclarifythisissue,theimpactofthetransactionalwebsitevariableonBHARatbothlevels0and1aretested.Theresultsrevealwhenthetransactionalwebsiteadoptionvariable=1,itshowsasignificantinfluenceonthebank'sBHARover24month (10% level)and36months (1% level).This findingsuggests that theadoptionof transactionalwebsiteneedsatleast24monthstoshowitssignificantvalueaddedtoeventbanks,comparedtothegroupofnon-eventcompetitors.Meanwhile,whenexaminingtheimpactoftransactionalwebsiteadoptiononBHARusingthemarketindices,thetransactionalwebsiteadoptionclearlydemonstratedthespectaculartransformationofBHARbeforeandafteradoption.72Themaximumimpactoftransactionalwebsiteadoptionon12-monthBHARand24-monthBHARare0.082 (p<0.1) and 0.281 (p<0.01), respectively. Therefore, over 24-month period, the impact oftransactionalwebsite adoption can growup to by (%.'()*%.%(')%.%(' % = 384.1%, compared to the 12-monthperiod.

242
grows over the following years. Secondly, compared to the ex-ante period, the
enablementofwebsiteshadamarkedly increased impacton thevalueofBHAR,with
BHARgrowthreachingatleast384.1%aftertwoyearsandupto850%afterthreeyears.
Theresultsarepartlyconsistentwiththeresource-basedviewtheory,withtheprovision
ofatleasttwocriticalattributesofdigitalinnovation,value,anddurability.Thefindings
also support some studies in banking literature that digital banking exerts a positive
influenceonbanks’performanceoverthelongterm(Cicirettietal.,2009;DeYoung,2005;
DeYoung et al., 2007; Goh and Kauffman, 2013; Scott et al., 2017).73 However, while
digitalbankingliteraturesofartendstomainlyfocusonthelong-termfinancialbenefits
ofdigitalbankingadoption,thischapterprovidesnewevidenceregardingthelong-term
benefitsoftransactionalwebsiteadoptionaddedtoshareholders.
73PleasealsorefertoSection6.2.1forfurtherdiscussionsaboutdigitalbankingliterature.

243
Table6.6Buy-and-HoldAbnormalReturns(BHARs)uponthetransactionalwebsitelaunchingannouncementsof307banks.
ThistablereportsthevaluesofBuy-and-HoldAbnormalReturns(BHARs)andtheirdescriptivestatisticalcharacteristicstostockholdersuponthetransactionalwebsitelaunchingannouncementofsamplebanks.The sample consists ofwebsite launch announcements of 307US banks between1996 and2010. TheBHARsareobtainedbytakingthedifferenceinreturnbetweenabuy-and-holdinvestmentinthesamplebankanda specificbenchmark.Threebenchmarksusedare theS&P500Market Index,NasdaqMarketIndexandmatchedportfolio.ThetableisdividedintothreepanelswhichpresenttheBHARscalculatedduring threedifferentholdingperiods:12-monthperiod(PanelA),24-month(PanelB),and36-month(PanelC).ThedataofMarketIndiceswerecollectedfromThomsonReuters.Thesuperscripts***,**,and*indicateastatisticallysignificantdifferencefromzeroatthe1,5,and10percentlevelsofsignificanceintwo-sidedtests.
12-monthperiod hijkllllllll Std. t-stat Min Max NBHARusingMarketIndexS&P500 0.079*** 0.350 3.958 -0.731 1.421 307BHARusingMarketIndexNasdaq 0.087*** 0.553 2.752 -1.320 1.526 307BHARusingmatched-firmportfolio 0.027* 0.313 1.292 -1.105 1.067 22024-monthperiod hijkllllllll Std. t-stat Min Max NBHARusingMarketIndexS&P500 0.185*** 0.563 5.757 -1.102 2.305 307BHARusingMarketIndexNasdaq 0.238*** 0.745 5.595 -1.629 2.352 307BHARusingmatched-firmportfolio 0.047* 0.466 1.540 -1.333 1.703 23136-monthperiod hijkllllllll Std. t-stat Min Max NBHARusingMarketIndexS&P500 0.299*** 0.699 7.498 -1.656 2.326 307BHARusingMarketIndexNasdaq 0.330*** 0.898 6.438 -2.229 2.613 307BHARusingmatched-firmportfolio 0.095*** 0.635 2.326 -1.522 2.202 240

244
Table6.7TheimpactoftransactionalwebsiteadoptiononBHARsoverthreeholdingperiodsThistablereportstheordinaryleastsquareregressionresultsforEquation6.6.basedonthesampleof307web-launchingannouncementsofpubliclytradedU.S.banks.Ineachregression,thedependentvariableisBHAR,whichisestimatedasthedifferencebetweenthecompoundedreturnsofsamplebanks,andthebenchmarkreturnsovertheholdingperiods.TheholdingperiodsusedtoestimateBHARareoverbothex-anteandex-postperiodofthewebsite-activatedevents,including(-12,-1);(0,11);(-24,-1);(0,23);(-36,-1);(0,35).ThreebenchmarksusedtoestimateBHARareS&P500,Nasdaq,andmatched-bankportfolio.ThemainindependentvariableisthevariableTransactional_website_adoption!,#whichequals0iftheholdingperiodsareex-ante(-12,-1);(-24,-1);(-36,-1),equals1iftheholdingperiodsareex-post(0;11);(0;23);(0;35).Thecontrolvariablesarealsoemployedtocontrol forexogenouscross-sectionaldifferences inmarketstructuresandbankcharacteristicsandareallobservedannually.ThesourcesforthistableareFDIC,SNLFinancial,WaybackMachineU.S.CensusBureauofEconomic(BEA),U.S.BureauofLaborStatistics,theWorldBank,ThomsonFinancialSecuritiesData,andtheauthor’scalculations.Thesuperscripts***,**,and*indicateastatisticallysignificantdifferencefromzeroatthe1,5,and10percentlevelsofsignificanceintwo-sidedtests.
PanelA:12-monthperiod PanelB:24-monthperiod PanelC:36-monthperiod (1) (2) (3) (1) (2) (3) (1) (2) (3)
VARIABLES BHARS&P500
BHARNasdaq
BHARmatchedportfolio
BHARS&P500
BHARNasdaq
BHARmatchedportfolio
BHARS&P500
BHARNasdaq
BHARmatchedportfolio
Transactional_website_adoption!,# 0.074** 0.082* 0.001 0.281*** 0.397*** 0.031 0.606*** 0.779*** 0.037 (0.0310) (0.0464) (0.0366) (0.0496) (0.0683) (0.0558) (0.0699) (0.0924) (0.0863)Bank_Size!,# -0.004 -0.004 -0.023** -0.018 -0.026 -0.033** -0.060*** -0.102*** -0.032 (0.0094) (0.0141) (0.0109) (0.0143) (0.0196) (0.0150) (0.0185) (0.0245) (0.0203)Bank_Leverage!,# 0.004 0.004 0.010*** 0.001 -0.002 0.002 -0.002 -0.004 0.003 (0.0023) (0.0035) (0.0037) (0.0043) (0.0059) (0.0070) (0.0085) (0.0112) (0.0131)Bank_Funding!,# 0.000 0.001 0.000 0.001 0.001 0.001 0.002* 0.002* 0.002 (0.0005) (0.0007) (0.0006) (0.0007) (0.0010) (0.0009) (0.0009) (0.0012) (0.0012)HHI!,# -0.000 0.000 -0.000 -0.000 -0.000 -0.001 -0.001* -0.001** -0.001* (0.0002) (0.0003) (0.0002) (0.0003) (0.0004) (0.0004) (0.0005) (0.0007) (0.0007)∆ROA!,# -0.006 -0.015 -0.002 -0.002 0.002 0.003 -0.001 -0.003 0.003 (0.0186) (0.0279) (0.0237) (0.0086) (0.0118) (0.0092) (0.0089) (0.0118) (0.0101)Constant 0.269 -0.180 0.492 0.707 0.535 1.387* 2.072** 3.340*** 2.414** (0.3496) (0.5239) (0.4210) (0.6091) (0.8389) (0.7456) (0.8582) (1.1351) (1.2016)Observations 576 576 411 570 570 424 534 534 408R-squared 0.020 0.011 0.030 0.064 0.072 0.017 0.157 0.154 0.021
245
6.5.2 ResultsofHypothesis6.2:Theimpactofthe“learningbyobserving”
Table6.8presentstheinvestigationintotheimpactof“learning-by-observing”behaviour
andinformationspilloveronbanks’BHARintheex-postperiodoftransactionalwebsite
adoption,overthreedifferentholdingperiods(12months,24months,and36months,
respectively).Ingeneral,theresultsstronglysupportHypothesis6.2,suggestingthatthe
“learning-by-observing”behaviour,whichisthroughoutthemechanismofinformation
spillovertothepublic,hasapositiveimpactonthelong-termexcessearningsofbanks
followingtheiradoptionoftransactionalwebsites.Thefindingsalsoshowthatthestock
market would be better in identifying the value of the current transactional website
adoptionifasubstantialnumberofotherbankshaveenabledwebsitesintherecentpast.
To be more specific, for all three holding periods, the coefficients of the LBOY(1)!,#
variable are significantly positive and almost significant at a 1% level. As described
previously, the LBOY(1)!,#is the proxy of the amount of information spillover in the
recent past pertaining to transactional website adoption. Therefore, the coefficients
foundinTable6.8indicatethattheamountoftransactionalwebsiteadoptioninthepast
positivelyimpactstheabnormalreturnearnedbycurrenttransactionalwebsiteevents.
For example, as illustrated in Table 6.8 (panel A), over the holding period of the 12
months following the adoptionof a transactionalwebsite, a one-point increase in the
LBOY(1)!,#variablewillbuilduptheBHARvaluebyfrom0.001(p<0.05)to0.004points
(p<0.01). These figures suggest that if the number of banks that adopt transactional
websitesbefore the targetbank!increasesbyone, the targetbank!canearna further
0.001to0.004pointsofabnormalreturnswithinthenext12months.Inthesamevein,
inTable6.8-panelB,the24-monthBHARvalueofthetargetbank!potentiallyincreases
by the range of 0.003 (p<0.01)-0.009 (p<0.01) if the number of banks that adopt
transactionalwebsitesincreasesbyonewithinoneyearpriortotheadoptionofbank!.
Finally,inTable6.8-PanelC,ifthereisonemorebankthathasadoptedatransactional
website one year before the transactionalwebsite announcement of the target bank!,
from0.006(p<0.01)to0.014points(p<0.01)wouldbeaddedtothe36-monthBHARof
thetargetedbank!.
Notably,withthesameLBOY(1)!,#variableusedforallthreehorizons,thevalueofthe
variable BHAR continued to expand. For example, regarding the S&P500 benchmark
(Column1), a one-point increase in the LBOY(1)!,# variablewould enlarge from0.004

246
pointsto0.009points(anincreaseof12.5%)and0.011(growthof17.5%)ofBHARover
12,24and36months,respectively.Thesamethingalsohappenedfortheremainingtwo
benchmarks(Columns2and3).Theseresultssuggestthecriticalmeaningoftheamount
of information extracted from banks that adopted digital websites a year before the
currentwebsite-enabledevent.Inwhich,suchanamountofinformationisstillvitalfor
market assessment over the next three years. Also, it is most likely one of the core
grounds for investors to evaluate and identify the value enhancement of a current
transactional website launch during their portfolio's holding period. Following the
viewpoint of DeLong and DeYoung (2007), it is likely that in a semi-strong efficient
market, investors are unlikely to access the full information. As the information is
materially inadequate, some additional information from the surrounding period can
helpinvestorsidentifythevalueenhancementaddedtothetransactionalwebsiteevents
moreaccurately.
In conclusion, the results in this section reveal findings of the positive impact of
informationspilloverand“learningbyobserving”behaviour.Suchfindingsrevealthatat
leastwithinthefirstthreeyearsfollowingtheannouncementofatransactionalwebsite
event, investors' judgment andmarket assessment towards this event are potentially
impactedbytheamountofinformationfromprevioustransactionalwebsiteevents.Put
differently, investors could assess the long-term value of the current transactional
websiteeventsbetterbycapturingtheinformationofothertransactionalwebsiteevents
intherecentpast.Sofar,indigitalbankingliterature,only“learningbydoing”mechanism
ofbanksisempiricallytestedtoseeifthismechanismaddsanyfinancialbenefitstobanks
(Delgadoetal.,2007;DeYoung,2002,2005;Hasanetal.,2002).74However,inthemarket,
astheinvestorsareexternaltothebanks,theycouldnotlearnbydoingbutlearningby
observingviatheinformationrevealedtothepublic(seeDeLongandDeYoung,2007,p.
189). Therefore, this evidence can advance the understanding of a new learning
mechanismindigitalbankingthatcanaddeconomicvaluetobanks’shareholders.The
resultsalsoargueforrationalityinmarketassessmentandinvestorbehaviourinthelong
term. The market evaluation would most likely be based on precise mechanisms,
especially the information of the samewebsite enablement events in the recent past,
74PleaserefertoSection5.5.2.5fortherelevantdiscussion.

247
rather than one based on constrained behaviours and anomalies (e.g., hot issue,
imitation).
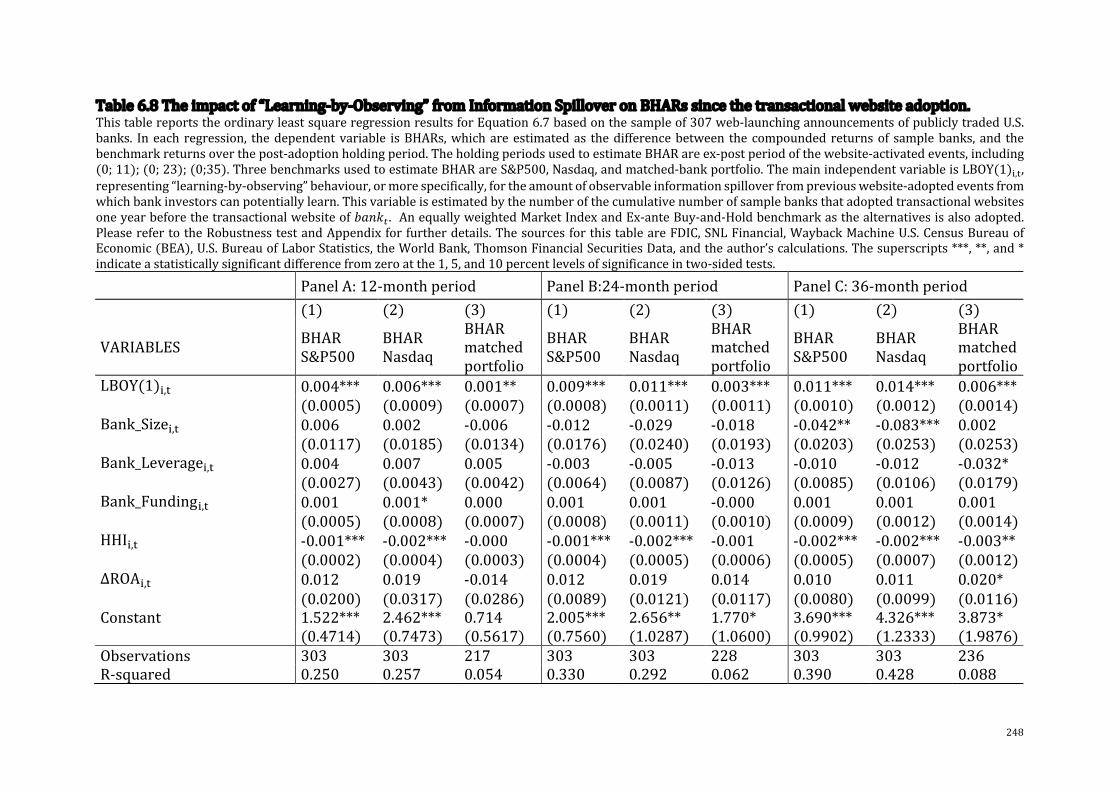
248
Table6.8Theimpactof“Learning-by-Observing”fromInformationSpilloveronBHARssincethetransactionalwebsiteadoption.ThistablereportstheordinaryleastsquareregressionresultsforEquation6.7basedonthesampleof307web-launchingannouncementsofpubliclytradedU.S.banks. Ineach regression, thedependentvariable isBHARs,whichareestimatedas thedifferencebetween thecompoundedreturnsof samplebanks, and thebenchmarkreturnsoverthepost-adoptionholdingperiod.TheholdingperiodsusedtoestimateBHARareex-postperiodofthewebsite-activatedevents,including(0;11);(0;23);(0;35).ThreebenchmarksusedtoestimateBHARareS&P500,Nasdaq,andmatched-bankportfolio.ThemainindependentvariableisLBOY(1)!,#,representing“learning-by-observing”behaviour,ormorespecifically,fortheamountofobservableinformationspilloverfrompreviouswebsite-adoptedeventsfromwhichbankinvestorscanpotentiallylearn.ThisvariableisestimatedbythenumberofthecumulativenumberofsamplebanksthatadoptedtransactionalwebsitesoneyearbeforethetransactionalwebsiteofXYZ[$ . AnequallyweightedMarketIndexandEx-anteBuy-and-Holdbenchmarkasthealternativesisalsoadopted.PleaserefertotheRobustnesstestandAppendixforfurtherdetails.ThesourcesforthistableareFDIC,SNLFinancial,WaybackMachineU.S.CensusBureauofEconomic(BEA),U.S.BureauofLaborStatistics,theWorldBank,ThomsonFinancialSecuritiesData,andtheauthor’scalculations.Thesuperscripts***,**,and*indicateastatisticallysignificantdifferencefromzeroatthe1,5,and10percentlevelsofsignificanceintwo-sidedtests.
PanelA:12-monthperiod PanelB:24-monthperiod PanelC:36-monthperiod (1) (2) (3) (1) (2) (3) (1) (2) (3)
VARIABLES BHARS&P500
BHARNasdaq
BHARmatchedportfolio
BHARS&P500
BHARNasdaq
BHARmatchedportfolio
BHARS&P500
BHARNasdaq
BHARmatchedportfolio
LBOY(1)!,# 0.004*** 0.006*** 0.001** 0.009*** 0.011*** 0.003*** 0.011*** 0.014*** 0.006*** (0.0005) (0.0009) (0.0007) (0.0008) (0.0011) (0.0011) (0.0010) (0.0012) (0.0014)Bank_Size!,# 0.006 0.002 -0.006 -0.012 -0.029 -0.018 -0.042** -0.083*** 0.002 (0.0117) (0.0185) (0.0134) (0.0176) (0.0240) (0.0193) (0.0203) (0.0253) (0.0253)Bank_Leverage!,# 0.004 0.007 0.005 -0.003 -0.005 -0.013 -0.010 -0.012 -0.032* (0.0027) (0.0043) (0.0042) (0.0064) (0.0087) (0.0126) (0.0085) (0.0106) (0.0179)Bank_Funding!,# 0.001 0.001* 0.000 0.001 0.001 -0.000 0.001 0.001 0.001 (0.0005) (0.0008) (0.0007) (0.0008) (0.0011) (0.0010) (0.0009) (0.0012) (0.0014)HHI!,# -0.001*** -0.002*** -0.000 -0.001*** -0.002*** -0.001 -0.002*** -0.002*** -0.003** (0.0002) (0.0004) (0.0003) (0.0004) (0.0005) (0.0006) (0.0005) (0.0007) (0.0012)∆ROA!,# 0.012 0.019 -0.014 0.012 0.019 0.014 0.010 0.011 0.020* (0.0200) (0.0317) (0.0286) (0.0089) (0.0121) (0.0117) (0.0080) (0.0099) (0.0116)Constant 1.522*** 2.462*** 0.714 2.005*** 2.656** 1.770* 3.690*** 4.326*** 3.873* (0.4714) (0.7473) (0.5617) (0.7560) (1.0287) (1.0600) (0.9902) (1.2333) (1.9876)Observations 303 303 217 303 303 228 303 303 236R-squared 0.250 0.257 0.054 0.330 0.292 0.062 0.390 0.428 0.088
249
6.5.3 ResultsofHypothesis6.3:Theimpactofmagnitudeeffectinthelongrun
Table6.9presentsresultrelevanttotheimpactofthesizeeffectonbanks'performance
over the long term following their transactional website adoption. In general, these
results robustly support Hypothesis 6.3, which proposes that small banks are more
positivelyinfluencedbytheirwebsiteadoptionthantheirlarger-scaledpeers.
Inwhich, the coefficients of the Largebank!,# variablewere found to be negative and
statisticallysignificantacrosstheeventwindows.Thisresultindicatesthatintheex-post
periodoftransactionalwebsiteadoption,smallbanksoutperformthebigonesinearning
buy-and-hold excess returns. In the first 12 months since the event month, when
comparedtosmallbanks,largebankshavealowervalueofBHARfrom0.098(p<0.05)
to0.182points(p<0.01).Over24months,thesizeeffectcontinuestodrasticallylower
BHARoflargebanksfrom0.229(p<0.01)to0.356points(p<0.01),comparedtosmaller
banks.Upona36-monthwindow,theBHARvaluecontinuedtobelowerforlargebanks,
rangingfrom0.162(p<0.1)to0.337(p<0.01).Ifdescribedinpercentages,inrelationto
the12-monthperiod,thesizeeffectovera24-monthperiodincreasesitsinfluencebyat
least95.6%andupto133.67%.Upon36months,thesizeeffectincreasesitspowerin
therangeof158.24%to276.74%,whencomparedtothefirst12-monthperiod.
Ingeneral,thefindingssupportthenotionthatthesizeeffectismostlikelyacriticalfactor
thatheavilyinfluencestheresponseandevaluationofthemarkettocorporateevents.
Regarding the events of banking website enablement, this effect significantly
differentiates the market performance between small and large banks. The
differentiationinmarketperformanceismostdramaticfollowingthesecondyearofthe
website-activatedevent,followedbythegrowingtendencyafterwards.Tothebestofmy
knowledge,notmuchattentionispaidintheliteratureonsizeeffectininfluencingthe
valuethattransactionalwebsiteadoptionaddstobanks.A fewrelevantstudiesareof
DeYoung (2005) and Cyree et al. (2009) but the number of research banks is quite
moderateandtheresearchtimesofthosestudieshavebeenawhileago.Meanwhile,asset
pricing literature and market advocators state that size is an important factor in
predicting the cross-sectional variation in firms’ returns and should be taken into
consideration.Thischapter,accordingly,strengthenstheunderstandingoftheimpactof
size factor in influencing theeconomicvalueof transactionalwebsiteadoption, in the
moreup-to-dateresearchtimeandmoresystematicresearchsample.
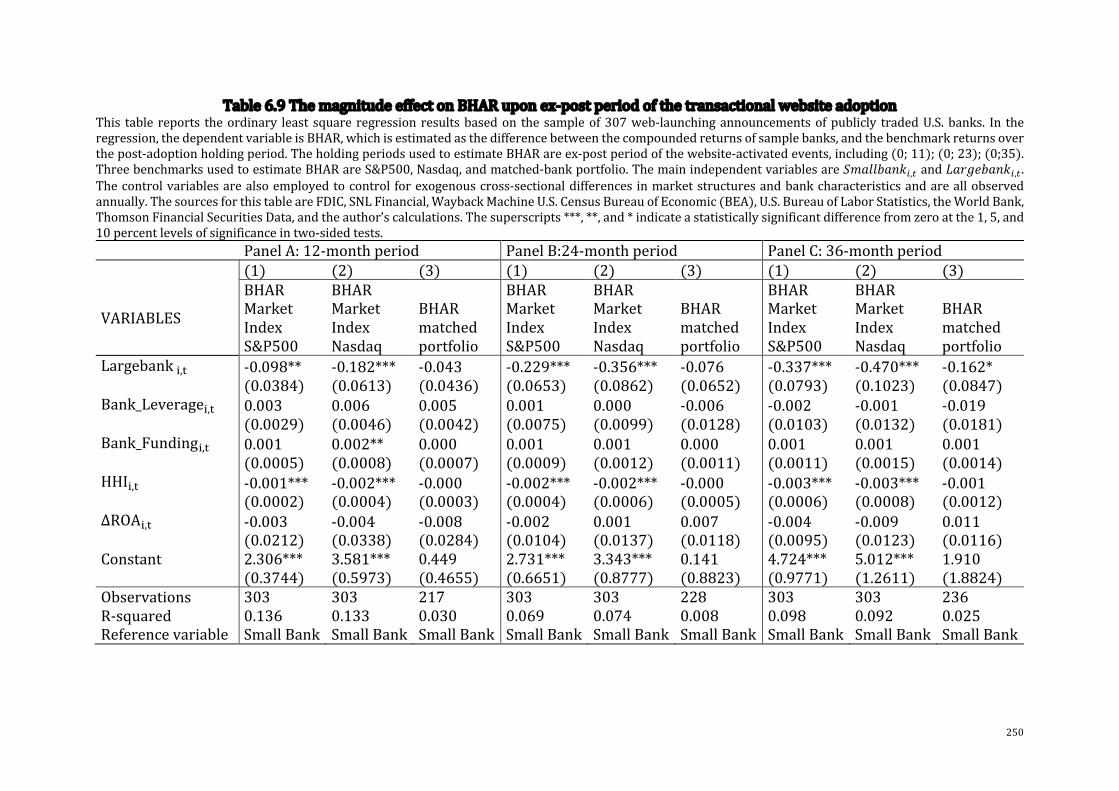
250
Table6.9ThemagnitudeeffectonBHARuponex-postperiodofthetransactionalwebsiteadoptionThis table reports theordinary least square regressionresultsbasedon thesampleof307web-launchingannouncementsofpublicly tradedU.S.banks. In theregression,thedependentvariableisBHAR,whichisestimatedasthedifferencebetweenthecompoundedreturnsofsamplebanks,andthebenchmarkreturnsoverthepost-adoptionholdingperiod.TheholdingperiodsusedtoestimateBHARareex-postperiodofthewebsite-activatedevents,including(0;11);(0;23);(0;35).ThreebenchmarksusedtoestimateBHARareS&P500,Nasdaq,andmatched-bankportfolio.ThemainindependentvariablesareQRSTTUSVW!,#andXSYZ[USVW!,# .Thecontrolvariablesarealsoemployedtocontrol forexogenouscross-sectionaldifferences inmarketstructuresandbankcharacteristicsandareallobservedannually.ThesourcesforthistableareFDIC,SNLFinancial,WaybackMachineU.S.CensusBureauofEconomic(BEA),U.S.BureauofLaborStatistics,theWorldBank,ThomsonFinancialSecuritiesData,andtheauthor’scalculations.Thesuperscripts***,**,and*indicateastatisticallysignificantdifferencefromzeroatthe1,5,and10percentlevelsofsignificanceintwo-sidedtests. PanelA:12-monthperiod PanelB:24-monthperiod PanelC:36-monthperiod (1) (2) (3) (1) (2) (3) (1) (2) (3)
VARIABLES
BHARMarketIndexS&P500
BHARMarketIndexNasdaq
BHARmatchedportfolio
BHARMarketIndexS&P500
BHARMarketIndexNasdaq
BHARmatchedportfolio
BHARMarketIndexS&P500
BHARMarketIndexNasdaq
BHARmatchedportfolio
Largebank",$ -0.098** -0.182*** -0.043 -0.229*** -0.356*** -0.076 -0.337*** -0.470*** -0.162* (0.0384) (0.0613) (0.0436) (0.0653) (0.0862) (0.0652) (0.0793) (0.1023) (0.0847)Bank_Leverage",$ 0.003 0.006 0.005 0.001 0.000 -0.006 -0.002 -0.001 -0.019 (0.0029) (0.0046) (0.0042) (0.0075) (0.0099) (0.0128) (0.0103) (0.0132) (0.0181)Bank_Funding",$ 0.001 0.002** 0.000 0.001 0.001 0.000 0.001 0.001 0.001 (0.0005) (0.0008) (0.0007) (0.0009) (0.0012) (0.0011) (0.0011) (0.0015) (0.0014)HHI",$ -0.001*** -0.002*** -0.000 -0.002*** -0.002*** -0.000 -0.003*** -0.003*** -0.001 (0.0002) (0.0004) (0.0003) (0.0004) (0.0006) (0.0005) (0.0006) (0.0008) (0.0012)∆ROA",$ -0.003 -0.004 -0.008 -0.002 0.001 0.007 -0.004 -0.009 0.011 (0.0212) (0.0338) (0.0284) (0.0104) (0.0137) (0.0118) (0.0095) (0.0123) (0.0116)Constant 2.306*** 3.581*** 0.449 2.731*** 3.343*** 0.141 4.724*** 5.012*** 1.910 (0.3744) (0.5973) (0.4655) (0.6651) (0.8777) (0.8823) (0.9771) (1.2611) (1.8824)Observations 303 303 217 303 303 228 303 303 236R-squared 0.136 0.133 0.030 0.069 0.074 0.008 0.098 0.092 0.025Referencevariable SmallBank SmallBank SmallBank SmallBank SmallBank SmallBank SmallBank SmallBank SmallBank

251
Figure6.2TheenlargementofthesizeeffectonBHARsofsmallandlargebanks
overthe24-monthand36-monthperiod
.
0.00%
50.00%
100.00%
150.00%
200.00%
250.00%
300.00%
12-month window 24-month window 36-month window
BHARs using S&P500 benchmark
BHARs using Nasdaq benchmark
BHARs using matched-portfolio benchmark

252
6.5.4 ResultsofHypothesis6.4:Theimpactoftimingeffectinthelongrun
Table6.10presentstheresultsoftheinvestigationconcerningtheimpactofthetiming
effect on banks' market performance in the long term following their transactional
website adoption. Put differently, Table 6.10 shows the results pertaining to the
relationshipbetweentransactionalwebsiteadoptionandthelong-termperformanceof
different banks who launch the websites at different times: LMNOP_RSTUNO,
VUWSXY_RSTUNO,Z[\\[NYO.Overall,theresultssupportHypothesis6.4inthefollowing
points:
• Firstly, there isa strong influenceof the timingeffectupon thewebsite-launch
events, leadingtosignificantheterogeneity inabnormalreturnsofbanksinthe
longrun.
• Secondly, secondmovers and laggards aremore rewarded by the adoption of
transactionalwebsites,comparedtotheirfirst-moverpeersinthelongrun.
Tobemorespecific,investorstendtoappreciatethewebsiteportfolioofsecondmovers
and laggards more when compared to their first-mover peers. For example, second
movers potentially gain higher points of BHAR than their first-mover peers, to a
maximumof0.888points(p<0.01),1.510points(p<0.01),and1.421points(p<0.01)
over12months,24-months,and36-months,respectively.Inthesamevein,incomparison
withfirstmovers,thelaggardbankspotentiallythriveontheamplificationofthevalueof
BHAR,toamaximumof0.754points(p<0.01),1.108points(p<0.01),and1.164points
(p<0.01) in the interval of 12-month, the 24-month and the 36-month periods,
correspondingly.
Moreover,thetimingordereffectisreflectedquickestifthebenchmarkisamarketindex.
Inwhich,BHARoffirstmoversandfollowersaresignificantlydifferentsincethefirst12
months. Meanwhile, the timing effect takes at least 24 months to show a significant
impactonBHARusingthecontrolfirmapproach.
Besides, the timing order effect has themost powerful impact on theBHARwith the
matched-firm benchmark. Regarding the secondmovers and firstmovers, the timing
effectgrowsby64.957%over24monthsandby417.07%over36months,inrelationto
the12-monthperiod.Regarding laggardsand firstmovers, the timingeffectgrowsby
74.828%over24monthsandby691.78%over36months,inrelationtothe12-month
period.Meanwhile,ifthebenchmarkisamarketindex(NasdaqorS&P500),thetiming
253
effectreachesthemaximumgrowthof58.412%and155.53%over24monthsand36
monthsrespectively,inrelationtothe12-monthperiod.
In general, the findings show that the timing effect should be one of the main
determinantswhichexertinfluenceonthebank'slong-termmarketperformanceintheir
website-adoptedevents.Surprisingly,itisnotthepioneers,butthelateradoptersofthe
transactionalwebsitesaretheoneswhogainmoresustainableandevolvingreturnsin
thelongtermwhentheirvalueofBHARcontinuallywidensovertheyearssincetheevent
month.ThetimingeffectisdetectedtohavethemostrobustinfluenceonBHARusingthe
matched-firmportfolio, especiallywithin a 36-month period.Meanwhile, BHARusing
S&P500andBHARusingNasdaqaremoststronglyinfluencedbythetimingeffectover
aperiodof24monthsbeforeamildergrowthtendencyhasbeenshownafterwards.The
growth of timing effect towards ex-post BHAR using three different benchmarks is
illustratedinFigure6.3andFigure6.4.Tothebestofmyknowledge,therehasbeenlittle
discussiononthecross-sectionalvariationintransactionalwebsitevalue,attributedto
thetimeofadoption.ItisbecausethestudiestendtofocusontheearlystageofInternet
bankingandtherefore,thevalueoftransactionalwebsiteinthelaterstagehasnotbeen
exploredextensively.Priortothisstudy,thelongesttimeperiodexaminedisfrom2003
to2008inthestudyofLinetal.(2011).Comparedtoliterature,thischapterprovidesa
comparativeanalysisoftheeconomicvalueaddedtobankswhichareinthreedifferent
timingorders: firstmovers,secondmoversand laggards in themoreextendedperiod
from1993to2013.
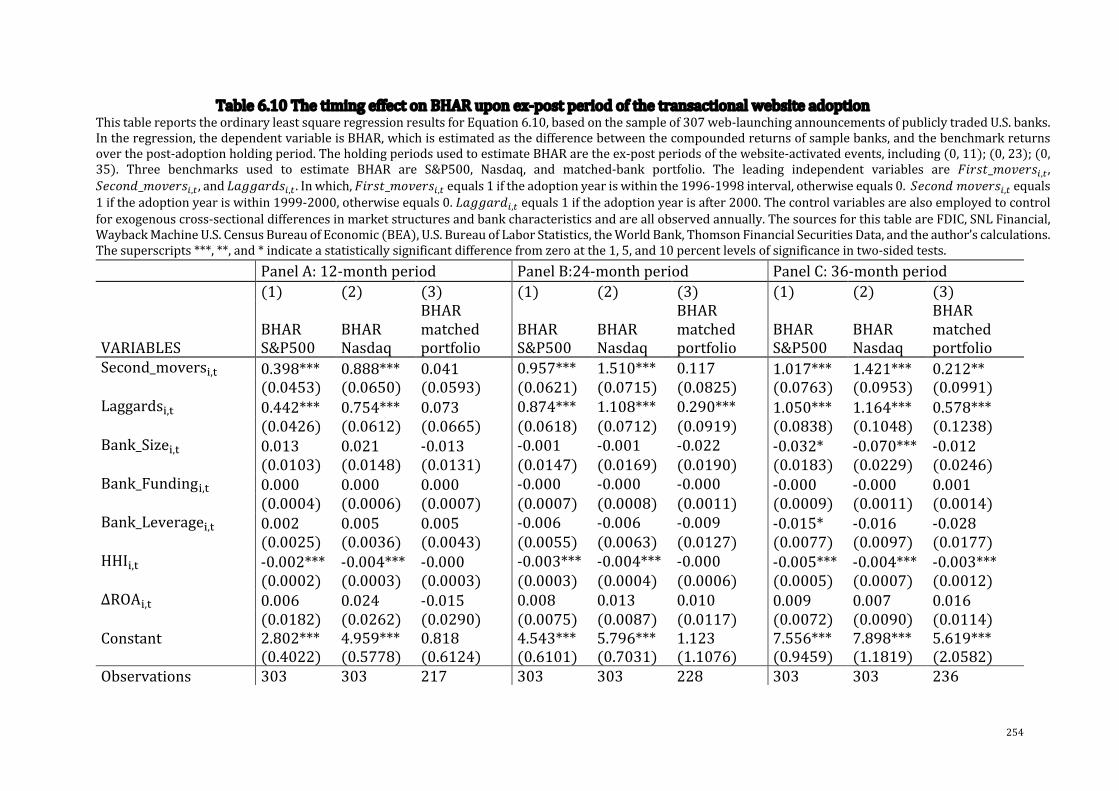
254
Table6.10ThetimingeffectonBHARuponex-postperiodofthetransactionalwebsiteadoptionThistablereportstheordinaryleastsquareregressionresultsforEquation6.10,basedonthesampleof307web-launchingannouncementsofpubliclytradedU.S.banks.Intheregression,thedependentvariableisBHAR,whichisestimatedasthedifferencebetweenthecompoundedreturnsofsamplebanks,andthebenchmarkreturnsoverthepost-adoptionholdingperiod.TheholdingperiodsusedtoestimateBHARaretheex-postperiodsofthewebsite-activatedevents,including(0,11);(0,23);(0,35). Three benchmarks used to estimate BHAR are S&P500, Nasdaq, and matched-bank portfolio. The leading independent variables are STUVW_YZ[\UV!,# ,]\^Z_`_YZ[\UV!,# ,andabccbU`V!,# .Inwhich,STUVW_YZ[\UV!,#equals1iftheadoptionyeariswithinthe1996-1998interval,otherwiseequals0.]\^Z_`YZ[\UV!,#equals1iftheadoptionyeariswithin1999-2000,otherwiseequals0.abccbU`!,#equals1iftheadoptionyearisafter2000.Thecontrolvariablesarealsoemployedtocontrolforexogenouscross-sectionaldifferencesinmarketstructuresandbankcharacteristicsandareallobservedannually.ThesourcesforthistableareFDIC,SNLFinancial,WaybackMachineU.S.CensusBureauofEconomic(BEA),U.S.BureauofLaborStatistics,theWorldBank,ThomsonFinancialSecuritiesData,andtheauthor’scalculations.Thesuperscripts***,**,and*indicateastatisticallysignificantdifferencefromzeroatthe1,5,and10percentlevelsofsignificanceintwo-sidedtests. PanelA:12-monthperiod PanelB:24-monthperiod PanelC:36-monthperiod (1) (2) (3) (1) (2) (3) (1) (2) (3)
VARIABLESBHARS&P500
BHARNasdaq
BHARmatchedportfolio
BHARS&P500
BHARNasdaq
BHARmatchedportfolio
BHARS&P500
BHARNasdaq
BHARmatchedportfolio
Second_movers!,# 0.398*** 0.888*** 0.041 0.957*** 1.510*** 0.117 1.017*** 1.421*** 0.212** (0.0453) (0.0650) (0.0593) (0.0621) (0.0715) (0.0825) (0.0763) (0.0953) (0.0991)Laggards!,# 0.442*** 0.754*** 0.073 0.874*** 1.108*** 0.290*** 1.050*** 1.164*** 0.578*** (0.0426) (0.0612) (0.0665) (0.0618) (0.0712) (0.0919) (0.0838) (0.1048) (0.1238)Bank_Size!,# 0.013 0.021 -0.013 -0.001 -0.001 -0.022 -0.032* -0.070*** -0.012 (0.0103) (0.0148) (0.0131) (0.0147) (0.0169) (0.0190) (0.0183) (0.0229) (0.0246)Bank_Funding!,# 0.000 0.000 0.000 -0.000 -0.000 -0.000 -0.000 -0.000 0.001 (0.0004) (0.0006) (0.0007) (0.0007) (0.0008) (0.0011) (0.0009) (0.0011) (0.0014)Bank_Leverage!,# 0.002 0.005 0.005 -0.006 -0.006 -0.009 -0.015* -0.016 -0.028 (0.0025) (0.0036) (0.0043) (0.0055) (0.0063) (0.0127) (0.0077) (0.0097) (0.0177)HHI!,# -0.002*** -0.004*** -0.000 -0.003*** -0.004*** -0.000 -0.005*** -0.004*** -0.003*** (0.0002) (0.0003) (0.0003) (0.0003) (0.0004) (0.0006) (0.0005) (0.0007) (0.0012)∆ROA!,# 0.006 0.024 -0.015 0.008 0.013 0.010 0.009 0.007 0.016 (0.0182) (0.0262) (0.0290) (0.0075) (0.0087) (0.0117) (0.0072) (0.0090) (0.0114)Constant 2.802*** 4.959*** 0.818 4.543*** 5.796*** 1.123 7.556*** 7.898*** 5.619*** (0.4022) (0.5778) (0.6124) (0.6101) (0.7031) (1.1076) (0.9459) (1.1819) (2.0582)Observations 303 303 217 303 303 228 303 303 236
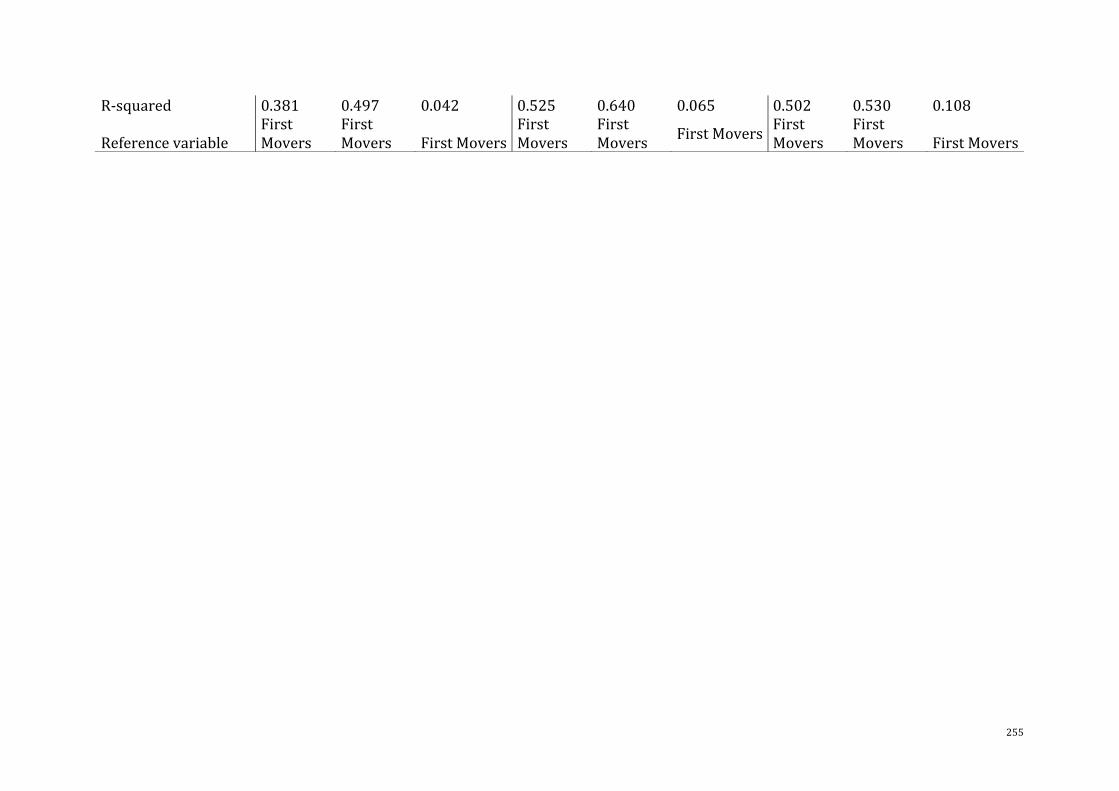
255
R-squared 0.381 0.497 0.042 0.525 0.640 0.065 0.502 0.530 0.108
ReferencevariableFirstMovers
FirstMovers FirstMovers
FirstMovers
FirstMovers FirstMovers FirstMovers
FirstMovers FirstMovers
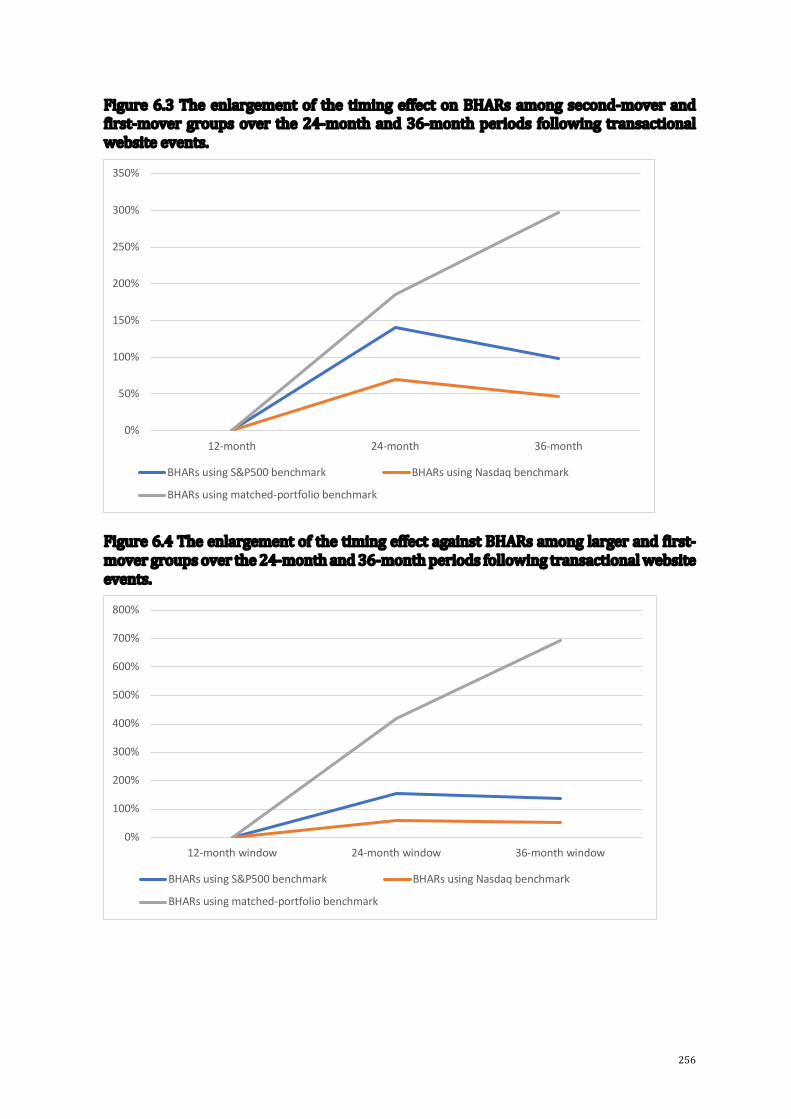
256
Figure6.3Theenlargementof the timingeffectonBHARsamongsecond-moverandfirst-movergroupsover the24-monthand36-monthperiods following transactionalwebsiteevents.
Figure6.4TheenlargementofthetimingeffectagainstBHARsamonglargerandfirst-movergroupsoverthe24-monthand36-monthperiodsfollowingtransactionalwebsiteevents.
0%
50%
100%
150%
200%
250%
300%
350%
12-month 24-month 36-month
BHARs using S&P500 benchmark BHARs using Nasdaq benchmark
BHARs using matched-portfolio benchmark
0%
100%
200%
300%
400%
500%
600%
700%
800%
12-month window 24-month window 36-month window
BHARs using S&P500 benchmark BHARs using Nasdaq benchmark
BHARs using matched-portfolio benchmark

257
6.6 RobustnessTests
6.6.1 Applicationofalternativebenchmarks
In this section, two other alternative benchmarks are used to look at the impact of
transactionalwebsiteadoptiononabank's long-termstockperformance.Firstly, the
Buy-and-Hold Returns (IJ!" ) of sample banks are verified if they are significantly
impactedbythelaunchofwebsites.Subsequently,thesameequation(Equation6.6)is
appliedbutinthisequation,thevariableIJOP!" isreplacedbyvariableIJ!" .
IJ!" = R + T × VWXYZX[\]^YX__abcZ]\b_Xd\^e]^Y",$
+ f × g^Y\W^_hXW]Xc_bZ",$ + i",$
(Equation
6.10)
Secondly, following thismethod, anequallyweightedmarket indexasanalternative
benchmarktocalculatetheBHARisapplied.Morespecially,equallyweightedmarket
indexiscalculatedastheaveragevalueofthethreelargestUSstockmarkets:DowJones,
S&P500,andNasdaq.
TheresultsforIJ!" andIJOP!" usinganequallyweightedmarketindexareshownin
TableA.6.11,Column(1).All thecoefficientsarefoundtobepositiveandsignificant.
Thevaluesarestrongestover24-monthsand36-monthswhenallcoefficientsinColumn
(2)andColumn(3)aresignificantat1%.
6.6.2 The“Learning-by-observing”effect.
In this section,LBOY(2)%& andLBOY(3)%& insteadofLBOY(1)%& areused to see if the
“learning-by-observing” effect is still effective over a longer time period. In which,
LBOY(2)%&andLBOY(3)%&arethenumbersofsamplebanksthatadoptedtransactional
websitesduringthetwoandthreeyearspriortothetransactionalwebsiteadoptionof
bank%,respectively.Ingeneral,theresults(presentedinTableA.6.12andTableA.6.13,
Appendix)arefoundtobeconsistentwiththeresultsinSection6.5.2,suggestingthe
positiveinfluenceof“learning-by-observing”behaviourandtheinformationspillover
effect.Especially,theresultspresentthepositivecoefficientsofLBOY(3)%&onBHARover
36-months,indicatingthatoldinformationrelatingtothesamebankingdigital-enabled
eventsisstilleffectiveoverthenextsixyears.

258
6.6.3 Thesizeeffectoverbothex-anteandex-postperiodsof transactionalwebsite
launchingevents.
In this section, the size effect is tested over both ex-ante and ex-post periods of the
transactional website launching event. To serve this objective, firstly, two variables
Smallbank%,&andLargebank%,&arecreatedwhicharethesameasthevariablesdescribed
in Section 6.4.4. Afterwards, these two variables interacted with the
Transactional_website_adoption%,&variable,respectively.Notably, Smallbank%,&variable
is treated as the reference variable. Therefore, the empirical results only show the
coefficientvaluesoftheLargebank%,&variable.
The results are presented in Appendix, Table A.6.14 In general, the findings are
compatiblewiththeresultsinSection6.5.3.Tobemorespecific,theresultsshowthe
significantinfluenceofthesizeeffectuponbankingwebsitelaunchevents, leadingto
considerable differentiation inmarket performance among small and large banks. It
could be seen that the coefficients of LargeBank%,& and
Transactional_website_adoption%,&inPanelB(24months)andPanelC(36months)are
allnegativeandmostsignificant.Thesefindingstherebyrevealthatthereisasignificant
influence of the size effect on the value of transactionalwebsite adoptions added to
banks,atleastover24monthsand36months.Inwhich,websiteadoptionhasamore
powerful influenceonsmall-sizedbanks incomparisonwith large-sizedbanks.More
concretely,within the 24months following the eventmonth (Panel B), the value of
websiteadoptionaddedtoBHARoflargebanksislessthantoBHARofsmallbanksfrom
0.188points (p<0.05) to0.281points (p<0.05).Over36months, this effect further
degradestheBHARoflargebanks(inrelationtosmallbanks)from0.29points(p<0.05)
to0.403points(p<0.01).Ifdescribedinpercentages,over36months,thesizeeffect
increasesthedifferenceininfluencebetweenlarge-capBHARandsmall-capBHARby
43.41%-54.2%,comparedtothe24-monthperiod.
IJOP",$ = R + T × VWXYZX[\]^YX__abcZ]\b_Xd^e\]^Y",$+ γ × ÇXWÉbcXYÑ",$+ ρ × VWXYZX[\]^YX__abcZ]\b_Xd^e\]^Y",$
× ÇXWÉbcXYÑ",$ +f × g^Y\W^_hXW]Xc_bZ",$ +i",$
(Equation6.11)

259
6.6.4 Thetimingeffectovertheex-postperiodoftransactionalwebsitelaunchevents.
Inthissection,thetimingeffectisre-testedoverbothex-anteandex-postperiodsofthe
transactional website launching event. In the same way with Section 6.4.5, three
differentdummyvariables,namelyFirst_movers%,&,Second_movers%,&andLaggard%,&are
created. Afterwards, those variables interact with the variable
Transactional_website_adoption%,&.
IJOP",$ = R + T × VWXYZX[\]^YX__abcZ]\b_Xd^e\]^Y",$+ Ü( × áb[^Yd_à^hbWZ",$ +Ü) × ÇXÉÉXWd",$+ â( × VWXYZX[\]^YX__abcZ]\b_Xd^e\]^Y",$× áb[^Yd_à^hbWZ",$+ â) × VWXYZX[\]^YX__abcZ]\b_Xd^e\]^Y",$× ÇXÉÉXWd",$ +f × g^Y\W^_hXW]Xc_bZ",$ +i",$
(Equation6.12)
BHAR%,&, Transactional_website_adoption%,& and the set of control variables are
described similarly to Equation6.6.Notably, First_mover%,& variable is treated as the
referencevariable.Therefore,theempiricalresultsonlyshowthecoefficientvaluesof
theSecond_movers%,&andLaggard%,&variables.
TheresultsarepresentedinTableA.6.15,Appendix.Ingeneral,theresultsareinline
withthefindingsofSection6.5.4.Morepointedly,whentreatingthemarketindexasa
hypothetical portfolio, within the first 12months, the transactional websites which
wereadoptedfrom1999to2000contributedahighervalueofBHARsfrom0.454points
(p<0.01) to 1.999 points (p<0.01) compared to the transactionalwebsites adopted
from1996to1998.Thetimingeffectcontinuedtoexpandover24monthsto36months,
divergingthevalueofwebsiteadoptionaddedtofirstmoversandsecondmoversfrom
1.160points,p<0.01to2.210points,p<0.01(24months)andfrom1.276,p<0.01to
2.369points,p<0.01(36months).
Furthermore,therewouldbeatimelagforthetimingordereffecttohaveasignificantly
differentimpactonthevalueoftransactionalwebsiteadoptionaddedtofirstmovers
and laggards. Upon the first 12 months (Panel A), the coefficients concerning the
interactionbetweenlaggardsandwebsitesrangefrom-0.02to-0.003,butnovaluesare
statisticallysignificant.Conversely,overthe24-month(PanelB)and36-month(Panel
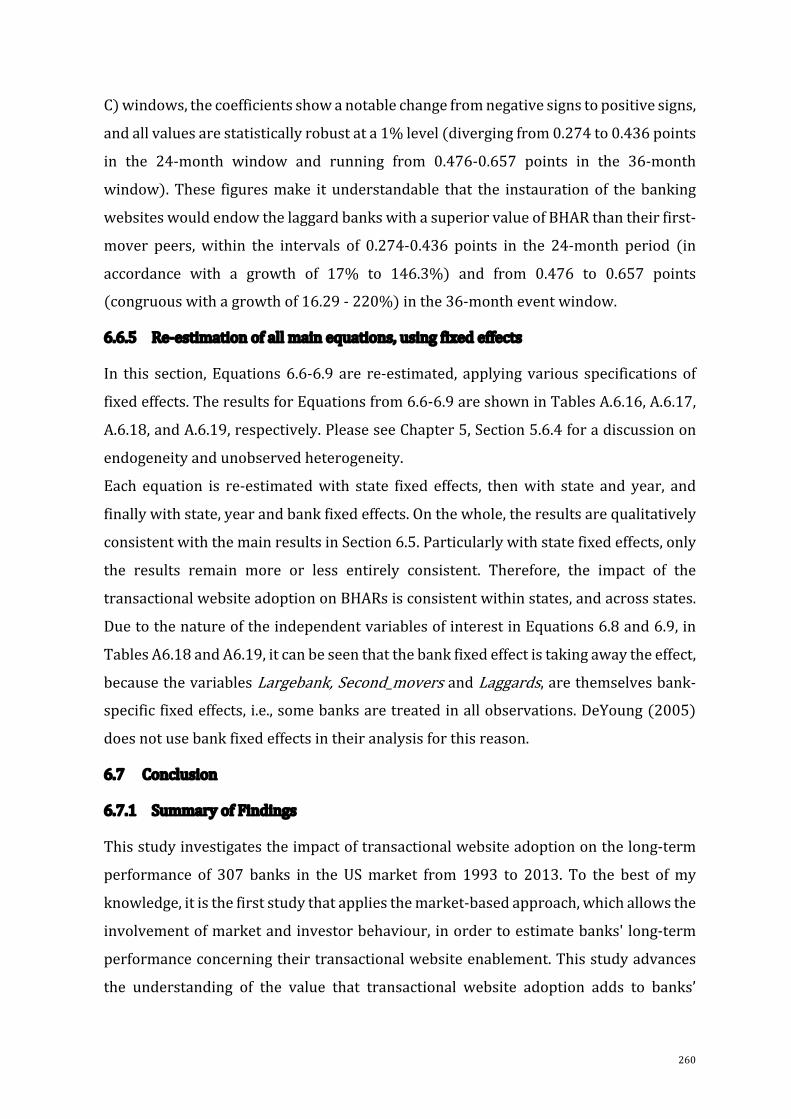
260
C)windows,thecoefficientsshowanotablechangefromnegativesignstopositivesigns,
andallvaluesarestatisticallyrobustata1%level(divergingfrom0.274to0.436points
in the 24-month window and running from 0.476-0.657 points in the 36-month
window).These figuresmake it understandable that the instaurationof thebanking
websiteswouldendowthelaggardbankswithasuperiorvalueofBHARthantheirfirst-
mover peers, within the intervals of 0.274-0.436 points in the 24-month period (in
accordance with a growth of 17% to 146.3%) and from 0.476 to 0.657 points
(congruouswithagrowthof16.29-220%)inthe36-montheventwindow.
6.6.5 Re-estimationofallmainequations,usingfixedeffects
In this section,Equations6.6-6.9 are re-estimated, applyingvarious specificationsof
fixedeffects.TheresultsforEquationsfrom6.6-6.9areshowninTablesA.6.16,A.6.17,
A.6.18,andA.6.19,respectively.PleaseseeChapter5,Section5.6.4foradiscussionon
endogeneityandunobservedheterogeneity.
Each equation is re-estimatedwith state fixed effects, thenwith state and year, and
finallywithstate,yearandbankfixedeffects.Onthewhole,theresultsarequalitatively
consistentwiththemainresultsinSection6.5.Particularlywithstatefixedeffects,only
the results remain more or less entirely consistent. Therefore, the impact of the
transactionalwebsiteadoptiononBHARsisconsistentwithinstates,andacrossstates.
DuetothenatureoftheindependentvariablesofinterestinEquations6.8and6.9,in
TablesA6.18andA6.19,itcanbeseenthatthebankfixedeffectistakingawaytheeffect,
becausethevariablesLargebank,Second_moversandLaggards,arethemselvesbank-specificfixedeffects,i.e.,somebanksaretreatedinallobservations.DeYoung(2005)
doesnotusebankfixedeffectsintheiranalysisforthisreason.
6.7 Conclusion
6.7.1 SummaryofFindings
Thisstudyinvestigatestheimpactoftransactionalwebsiteadoptiononthelong-term
performance of 307 banks in the USmarket from 1993 to 2013. To the best ofmy
knowledge,itisthefirststudythatappliesthemarket-basedapproach,whichallowsthe
involvementofmarketandinvestorbehaviour,inordertoestimatebanks'long-term
performanceconcerningtheirtransactionalwebsiteenablement.Thisstudyadvances
the understanding of the value that transactional website adoption adds to banks’

261
shareholderswhilethedigitalbakingliteraturesofarhasonlyfocusedonthefinancial
benefitsofdigitaladoptions.Moreover,theestimationisbasedonmanuallycollected
exclusivedataofannouncementdatesofafull listofavailablebankslistedontheUS
stock markets as of December 2018, thereby being the first to provide systematic
evidenceconcerningthevalue-creatingcapabilityofbankingwebsiteinitiatives.Thisis
alsothefirststudytoconfirmtherationalityofthemarketinassessingbankingdigital
initiativeeventsthrough“learning-by-observing”behaviouraswellastoexaminesome
critical moderating effects that may alter the relationship between transactional
websiteadoptionandbanks'performance.Inrelationtorelevantliterature,tothebest
ofmyknowledge,onlythe“learningbyobserving”mechanismisempiricaltested,butit
isnot feasible in themarketperspective.75Furthermore, sizeeffectand timingeffect
havebeentestedovertheextendedperiod(1993-2013)andforasystematicdata(full
listedUSbanks)sofar.76
Inthemostgeneralway,thefollowingfindingsaremade:
(1)Investorsstillheldtheirportfoliosandkepttheirpositiveoptimismconcerningthe
bankingwebsite-launcheventsoverthelongterm,rewardingeventbankswithhigher
returnsrelativetothemarketandtheirnon-eventcompetitors(withthesamescaleand
inthesameindustry).Thisfindingalsoconfirmsthatthetransactionalwebsiteisoneof
the bank’s strategic digital initiatives due to its two key characteristics: value and
durability.
(2)Theparticipationofinvestorsinbankingwebsite-launcheventsisnotonlyvitalbut
alsorationaldue to their “learningbyobserving”behaviour.Wherein, theamountofinformationconcerningthesamewebsite-launcheventsintherecentpastwouldbea
criticalmechanismforinvestorstoidentifythevalueofthecurrentevent.
(3)Thetimingeffectandthesizeeffectarecriticalfactorsthatrobustlydifferentiatethemarketperformancebetweenbanks,althoughsucheffects lagbeforeshowingup
andthriving.Valuationsforsmall-capandlateenablershavebeenatdesirable levels
overthethreeyearsfollowingtheirwebsite-launchevents,relativetotheir large-cap
andfirst-movercounterparts.
75PleaserefertoSection6.5.2forfurtherdiscussions.76PleaserefertoSections6.5.3and6.5.4forfurtherdiscussions.

262
6.7.2 SupportiveLiteratureandFurtherDiscussions.
By applying different benchmarks, this chapter provides robust evidence that banks
earn significant positiveBuy-and-HoldAbnormalReturns over 12-month, 24-month,
and36-monthperiodsfollowingtheirtransactionalwebsiteadoption.Concurrently,the
relationshipbetweentransactionalwebsiteadoptionandBHARistested,controllingfor
exogenous cross-sectional differences inmarket structures and bank characteristics.
The main results reveal that transactional website adoption endows banks with
superiormarket values in the long term, accordingly, enhancing banks’ shareholder
wealth.Thisfindingislinedupwithpreviousstudiesthatalsofindthepositiveimpacts
of digital initiatives influencing the performance of financial institutions, such as
Internetbanking(Al-HawariandWard,2006;Cicirettietal.,2009;Delgadoetal.,2007;DeYoung, 2005; DeYoung et al., 2007; Furst et al., 2002; Goh and Kauffman, 2015;
HernandoandNieto,2007;MbamaandEzepue,2018;Momparleretal.,2013;Pigniet
al.,2002;Scottetal.,2017;Sullivan,2000;Xueetal.,2007),e-banking(Akhisaretal.,
2015), technological innovation(Scottetal.,2017;WeigeltandSarkar,2012),digital
banking(MbamaandEzepue,2018).Itisalsoinconcurrencewithsomestudieswhich
supportthepositivereactionofinvestorsonfirms’implementation.Thefreshevidence
fromthischaptercomparedtorecentdigitalbankingliteratureisthelong-termvalueof
transactionalwebsiteadoptionconferredonnotfinancialperformancebutshareholder
wealth. As suggested by some studies, the superior financial performance does not
necessarily convert into shareholder value (Johnson et al., 1985; Rappaport, 1999;
Reimann, 1987). The evidence of improved shareholder wealth in the long run via
transactional website investment, therefore, brings fresh implications for banks,
especiallyfortheircapitalstrategy.
This chapter also looks at factors influencing BHAR, including the "learning-by
observing"effect.ThefindingsrevealthattheincreaseinBHARissignificantlyrelated
tothenumberofbanksadoptingtransactionalwebsitesduringthepreviousyears.Put
differently, this chapter finds evidence ofmore accurate stockmarket prediction on
long-run financial performance when a large number of banks have adopted a
transactionalwebsiteintherecentpast.Thisfindingistherebyconsistentwiththesemi-
strong Efficient Market Hypothesis. In a semi-strong efficient market, investors are
unlikelytohaveaccesstothefull,butratherthepartialinformation.Astheinformation
ismateriallyinadequate,someadditionalinformationfromrecenteventspossiblyhelps
263
investors identify value more accurately. This finding is supported by several
researchers investigating the impact of “learning–by–observing" on the long-term
performance of firms (DeLong andDeYoung, 2007; Francis et al., 2014; Liang et al.,
2021).
Regardingmagnitude effect, the findings show that there are divergences in banks’
performance, based on the different sizes of the banks. More specifically, when
interactingwithtransactionalwebsiteadoptioninthelongterm,small-sizedbanksare
morelikelytobenefitfromtheadoptionoftransactionalwebsiteswhencomparedto
theirlarge-scaledrivals.Thisfindingisinlinewithrecentevidence,whichsuggeststhat
smaller firmsbenefitmore than largeones from financialdevelopment (Guisoet al.,
2004;RegehrandSengupta,2016).Putanotherway,transactionalwebsiteadoptionhas
agreaterimpactonsmall-scaledbanks.Thismighthaveresultedfromthereasonthat
thetransactionalwebsiteadoptionhassignificantlychangedtheoperationalstructure,
profit streams, and deepened customer relationships. Moreover, it might also be
because transactionalwebsite adoption allows small banks to reach targets inmore
remotegeographicareasandgetaccesstoproprietaryinformationwhichisusefulin
settingcontracttermsandmakingbettercreditunderwritingdecisions.77
Besidesthis,thepost-adoptionperiodhasshownthatsmallbanksperformbetterthan
their larger peers. The results, hence, may support the theories of small banks’
advantages, in which, small banks may enjoy benefits from their structure, such as
flexibilityandlesscomplexity,whichmakesthemmoreefficientintheirmanagement
(Hamiltonetal.,2009;Premkumar,2003;WalkerandPetty,1978).Also,smallbanks
havemorefinancialslack,incomparisontotheirlargepeers.Therefore,theycanenjoy
a significant degree of freedomusing their resources for various strategic operating
purposes,suchascapabilitiesutilization(ParidaandÖrtqvist,2015).
Lastly, the timingordereffect is found tosignificantlydifferentiate thebuy-and-hold
excessreturnsbetweenfirstmoversandfollowers.Whenobservingthetimingeffect,
theresultsalsoshowthatthecompetitiveadvantagesofpioneersarelessenedinthe
longrun.Incontrast,secondandlatterentrantsgainahigherlong-termmarketvalue
77Pleasealsorefer toChapter4,Section4.2.2 for furtherdiscussionsabout the transactionalwebsiteadoptionofsmallbanksandlargebanks.

264
thanpioneers.Withthosefindings,theresultssupporttheauthorswhocontendthatthe
following competitors are the ones who will benefit more from their adoption
(Lieberman,1987;LiebermanandMontgomery,1988;Utterback,1994).
6.7.3 ManagerialImplications
Thefindingsofthisresearchhavesomeusefulmanagerialimplicationslistedbelow:
Firstly, this research givesmanagers and investors a convincing justification for the
valuecreationofdigital initiatives.These findingsconfirmthatbankscanearnvalue
from theirdigital initiatives, at leastwithin the threeyears following their adoption.
Theseresultscanbeusedasareferenceforinvestorsandmanagerswhentheyconsider
investinginadigitalbankingportfolio.Aspresented,only25percentofinvestorsare
found to be confident that the financial service industry's digital transformation is
effective although 80 percent of investors still believe digital transformation is
important(Wyman,2020).Obviously,therearestillmanyinvestorswhoarewaryof
bankdigitalinvestmentsandhesitatingininvestingindigitalbankingbecausetheylack
cleardata.Therefore,proofofpositivelong-termvaluewithinthefirstthreeyearsof
transactionalwebsiteadoptioncanbeanimportantreferenceforinvestorsinthenext
stagesoftheircapitalinvestment.
Secondly, bank managers should exploit the market performance and investor
behaviour in the long run to evaluate their business health. As both scholars and
practitioners admit, the abnormal returnof an investment is an indicationof how it
performedoveragivenperiod.Itwouldreflectinvestorperceptionsofitsabilitytoearn
andgrowprofitsinthefuture.Therefore,bykeepingtrackofhowtheinvestorsholdand
buy stocks over time,managersmay enhance their understanding of how investors
evaluatetheirfinancialhealthrelevanttodigitalactivities.Itshouldalsobenoticedthat
itmight take time for investors to fullyevaluateaportfolioand therefore, long-term
evaluationishighlyrecommendedformanagersinjudginghowwellaninvestmentis
doing.
Thirdly, managers should consider the "learning-by-observing" behaviour andinformation spillover effect as it may significantly affect investors' evaluations and
reactionsatpresent.Thisstudy'sfindingshavedrawnattentiontothefactthatinvestors
canbetteridentifyandassessthevaluecreationofatransactionalwebsiteadoptionif
there isagoodnumberofbanksadoptingawebsite in therecentpast.Thiseffect is

265
foundtobeeffectiveforuptosixyears,whichmeansthatinvestorscanrefertothepast
sixyearsofinformationtoevaluatecurrentportfolios.Therefore,managersshouldtake
the “learning-by-observing” effect into account, such as considering how theirprocessorsperformsincetheirdigitaladoption,atleastwithinthelastsixyears.Thisis
becauseinvestorsarelikelytoconsultsuchinformationbeforedecidingtoinvestina
current digital project. In another scenario, assuming themarket becomes scarce of
sources of information for pricing, managers should give more explicit signals to
investorsastheymayfeelconfusedandinconclusive.
Fourthly,managersshouldproducemanagementpoliciesthatareappropriateforthe
size of the business. The findings of this study highlight the heterogeneity in the
performance of banks in different size groups since their adoption of transactional
websites.Therefore,formoreaccurateestimationandpredictionofthelong-termvision
ofdigitaltransformation,managersshouldtakeintoconsiderationthesizefactor.For
largebanks,as theyare foundtobe less impactedbytransactionalwebsiteadoption
when compared to small-scaled rivals, it may require more comprehensive and
innovativestrategiestoacceleratethevalue-enhancingcapabilityoftheirtransactional
website. For example, managers can promote omnichannel strategies, where
transactionalwebsitesandotherdigitalchannelscanbeintertwinedandcomplement
resources.Regardingsmallbanks,transactionalwebsiteadoptionseemstohaveamore
profound effect on their operating structure and value creation. Therefore, when it
comestodigitalinitiatives,smallcompaniesshouldconsiderwhethertheseinitiatives
are conducive to restructuring and enhancing value streams. An excellent digital
initiative (like transactional website adoption) should help them to strengthen
relationships with their customers and to increasingly focus on niche markets in a
particular market segment, geographic region, part of the supply chain, or specific
service.
Fifthly,selectingthetimingofdigitaladoptionisalsoanimportantfactoraffectingthe
long-term market performance of banks. It seems that the advantages of the
predecessorsareeliminatedoveralong-termperiod.Instead,thesecondmoversand
thelaggardsarelikelytogetmorefavourfromadoptingtheirtransactionalwebsiteover
time.Therefore,managers shouldbear the implicationsof the timing effect inmind,
especially in the long-term vision. For example, managers should consider the
sustainableadvantagesandpotentialdisadvantagesofbeingfirstmoversorfollowers

266
in adopting digital initiatives in the long-term perspective. Short-term competitive
advantagescouldfadeawayovertimeastheindustryisever-changing,andcompetitors
are not treading water. Kalyanaram and Urban (1992, p. 219) state that: “Marketpioneeringisnotforarisk-averseorfinanciallystrappedbusiness.Abusinessshouldattempttopioneeranewmarketonlyifithasanappropriateskillandresourceprofileandiswillingtopursueahighrisk-highreturnstrategy”.Finally,marketsignallingshouldalwaysbethetoppriorityofmanagerstocommunicate
wellwith their investors.Nomatterwhat structure and size the banks are orwhen
banks launched their digital adoption or how the context in which the amount of
informationwasleakedtothemarket,managersneedtogivemorereliablesignalsto
theirinvestors.Wyman(2020)hassuggestedquantifyingprogressinwhichinvestors
areinterestedinhowthefirmsareperformingandwhattheyareplanning.Herecorded
that“Whatinvestorsneedaremorenumbers-itishardtofindevenanecdotesonwhatthebenefits are andwhat costs are comingout” (Wyman,2020,p. 29).Accordingly,providing signals (e.g., commitment, improvement, achievements) related to digital
adoptionisvitaltodeterminingahealthylong-termmarketperformanceofbankson
theirdigitalizationroadmap.
6.7.4 LimitationsandFutureDiscussions
Thisresearchcouldnotavoidsomecertainlimitationsasfollow:
Firstly,duetothelimitednumberofsamples(n=307),benchmarksforestimationof
BHAR (e.g., control banks; size-matched portfolios) faced some challenges. More
precisely, using these benchmarks requires ous conditions (e.g., the homogeneity of
size),leadingtotheeliminationofsomeineligiblesamplebanksfromthebenchmark
portfolio.Withasamplesizeof307,continuingtoexcludesomebanksfromthesample
portfoliomayresultinbiases.Inordertooptimizethebenchmarkselection,researchers
shouldalsoconsidertheexpansionofthesample(e.g.,banksinothercountries);and/or
thedevelopmentofbenchmarkcandidates(e.g.,firmsthatadopttransactionalwebsites
inotherindustries).
Secondly,thereisalimitationinthebanksample.Inmoredetail,theselectionconsists
ofseveralbankswhosetimeoftransactionalwebsitelaunchescoincideswiththefirst
timethosebanksshowupinthemarket,leadingtotheabsenceofdatabeforethetime
267
thewebsiteshadbeenestablished.Therefore,itistoughtocompareperformancebefore
andafterwebsitecreation.
Thirdly,inthisresearch,onlymarketcapitalizationisusedasasizeproxyforselecting
thebenchmarkinthematchedportfolioanalysis.Ithasbeenshownthatthebook-to-
market ratio is an important factor to consider in long-run returns, and so future
research could test for this factor also (Barber and Lyon, 1997a; Barber and Lyon,
1997b).
Finally,furtherinvestigationofsomelargeeventsthatmayoccurinthelongrun,such
asmobilebanking,digitalapplications, is suggested. Itmayhelpreduceconfounding
event bias while also demonstrating the impact of complementary capabilities and
resourcesamongdigitaladoptionsonthelong-termhorizon.

268
7 Chapter7:Conclusion
Thepurposeof this thesiswas toexamine if transactionalwebsiteadoptiondelivers
significantvaluetobanksandtheirshareholdersoverbothshort-termandlong-term
intervals. More specifically, three main research aims were set up to examine if
transactionalwebsiteadoptioncan:
• (i) deliver short-term value to banks’ shareholders under the assessment ofmarketandinvestors
• (ii) generate strategic and sustainable value via the reflection of accountingmeasuresinthelongrun
• (iii)bringlong-termvaluetobanks’shareholdersundertheassessmentofbuy-and-holdstrategy.
ThethreemaintargetswererespectivelyaddressedinEmpiricalChapters4,5,and6by
employing(i)eventstudymethodologywithCARmetric;(ii)accountingmeasureswithsevendimensionsand(iii)BHARmetricwithfivedifferentbenchmarks.Ingeneral,theresults provide new findings regarding the value of transactional website adoption
conferred on banks and their shareholders, which have not been explored in the
literatureofthepasttwodecades.
7.1 TheFindingsineachEmpiricalChapter
7.1.1 Chapter4:DoTransactionalWebsiteInitiativesAddValuetoBanks?
ThemainaimofChapter4wastoexamineiftheadoptionoftransactionalwebsitesadds
any immediatevalue tobanks’shareholders,under theevaluationof themarketand
investors.
This chapter firstly, setupa conceptualmodelbasedon thegroundsof: (i)EfficientMarketHypothesis;(ii)Resource-basedView;and(iii)MarketSignallingPerspective.
Thismodelhelpedtoexplainhowtransactionalwebsiteadoptionmightenhancebanks’
marketvalueandbyhowthemarketcanevaluateandpredictthevalueoftransactional
websiteadoption.Tobemorespecific,thismodelexpectedthattransactionalwebsite
adoption assesses strategic resources and capabilities. Under the perspective of the
resource-basedview,suchstrategicresourcesandcapabilitieswouldbetherootofthe
valuecreationoftransactionalwebsiteadoption.Subsequently,basedonthegroundof
marketsignallingperspectiveandefficientmarkethypothesis,themodelproposedthat

269
strategic resources and capabilities are the right signals released to the market. In
return,themarketcouldpotentiallyexploitthosegoodsignalstoaccuratelyevaluate
andpredictthevalueandpotentialbroughtfromwebsite-activatedevents.
Subsequently, event study methodology was employed to estimate Cumulative
AbnormalReturnmetric(CAR)uponseveralshort-termeventwindows.AsCARisthe
differenceinthevalueofbanksinthecasebanksadopttransactionalwebsitesandin
thecasethatbanksdonotadopttransactionalwebsites,itcanreflecttheaddedvalue
from the adoption of transactional websites in particular. Furthermore, as CAR is
estimatedunderthereactionofmarketparticipants,theinformationreflectedbyCAR
isimmediate,accurateandpredictive,assuggestedbyEfficientMarketHypothesis.
Chapter 4 found that the transactional website induces significantly positive CAR
immediatelyaroundthetimeitwaslaunched.Suchfindingswerestillrobusteveninthe
intervenceoftimingandsizefactors.Tobemorespecific,intheshortrun,transactional
websiteadoptioncreatedalevelplayingfieldforbanks,regardlessofwhethertheyare
large-scaledorsmall-scaledandwhethertheyarethefirstrunnersandlatecomers.The
findings, accordingly, verified the value that transactional website adds to banks’
shareholders in the short run. Furthermore, as the market showed a considerate
enthusiasmandfaithtowardstransactionalwebsiteadoptionevents,itindicatedalong-
termprosperousfuturebyinvestingintransactionalwebsites.
7.1.2 Chapter 5: Does the Adoption of Transactional Websites Improve Banks’
FinancialPerformance?
ThepurposeofChapter5wastoexamineiftransactionalwebsiteadoptionisastrategic
initiative that could sustainably deliver value in the long run. Under the ground of
resource-based view, an initiative is considered strategic if it possesses strategicresources and capabilities. Strategic resources and capabilities are what possess
strategicattributes(e.g.value,firm-specificity,inimitability,durability,appropriability,limitedsubstitutability)andarecapableof:(i)creatingcompetitiveedgesandinducingsuperior performance; and (ii) preserving value and limiting competition (Amit and
Schoemaker, 1993; Barney, 1991; Collis and Montgomery, 1995; Dierickx and Cool,
1989; Grant, 1991b; Lippman and Rumelt, 1982; Peteraf, 1993; Rumelt and Lamb,
1997).
270
Fromtheresource-basedview,sixfeaturesoftransactionalwebsiteadoptionwereset
up, namely appropriability, durability, embeddedness, inimitability, and
interconnectedness.Firstly,theattributesofvalueandappropriabilitywereverifiedbythewaytransactionalwebsiteadoptionsignificantlydeliversprofitabilityandefficiency
tobanks.Subsequently,embeddednesswasreflectedviathecumulativetransactionalwebsite experience proxy which significantly improves banks’ performance. The
inimitabilitywasdemonstratedviatheunsuccessingaininganyfinancialbenefitfrom
vicarious learning behaviour. Interconnectedness was reflected through thecombinationof transactionalwebsiteadoptionandmobilewebsiteadoption.Finally,
durabilitywasprovedbyobservingtheimpactoftransactionalwebsiteadoptiononthefinancialperformanceofbanksovertimesincethetimetheywerelaunched.
Ingeneral,Chapter5foundthat:
- Over the long run, transactional website adoption rewards banks with an
increase inprofitability,astrengthening in incomeandexpenditureefficiency,
andgrowthofnon-interestactivities.Thisevidence,hence,verifiedtheattributes
ofvalue,appropriabilityanddurability.
- Transactionalwebsiteadoptionendowsbankswithsustainableperformance,in
turn, attributed to the embeddedness of its cumulative experiences, the
limitation of observational learning behaviour of rivals, and the inter-
connectedness with the next digital disruption. This evidence, accordingly,
verifiedtheattributesofembeddedness,inimitabilityandinterconnectedness.- There exists a differentiation amongbanks in earning financial rewards from
theirwebsiteadoption,attributedtotheirsizeortimingordereffects.Ofwhich,
smallbanksarefoundtobemoresuccessfulthantheirlargerpeerswhilefirst
movers no longer earn significant earnings in adopting transactionalwebsite
adoptionoverthelongrun.
7.1.3 Chapter6:DoDigitalTransactionalWebsite InitiativesAddValue toBanks in
LongRun?
Chapter6aimedtoexaminethelong-termvalueoftransactionalwebsiteaddstobanks’
shareholders.Researchershaveaffirmedthatthesuccessofabusinessdoesnotonly
depend on how it delivers financial performance. The bottom line lies in how this
businessbenefitsthecommunitiesitinvolvesin.

271
Firstly,theevent-timeapproachwasappliedtoestimatetheBuy-and-HoldAbnormal
Return(BHAR)metrictocapturethedynamicsininvestors'tradingstrategyoverayear,
twoyears, and three years following thebankingwebsite events announcements. In
more detail, the BHAR metric was calculated as the mean difference between the
investor'sbuy-and-holdreturnsgainedfromwebsiteeventsandstandardbuy-and-hold
returns. The three main benchmarks used to estimate the standard buy-and-hold
returnsweretwomarketindices(S&P500andNasdaq)andthematched-firmportfolio,
which include the non-event but same-type candidates. Thereafter, two alternative
benchmarksappliedfortherobustnesstestweretheequallyweightedmarketportfolio
and the ex-ante buy-and-hold portfolio. As BHAR is calculated as the subtraction of
event-firmreturnsfromthestandardreturnsheldoverthesameintervals,apositive
valueofthismetricwouldverifytheenthusiasmandappreciationofinvestorstowards
theeventinthelongterm.
Furthermore,inChapter6,BHARwastreatedasaproxyofbanks'performance.From
which, a setof regressionswas constructed,usingBHARas representativeofbanks'
performance,tocapturethecapabilityoftransactionalwebsiteadoptionindelivering
excess returns to shareholders over the long term. Besides this, the learning by
observingproxy,size-quantizedproxies,andtimingorderproxieswerealsoregressed
tocapturetheirimpactsonBHAR.
Ingeneral,Chapter6foundthat:
- Investors still hold their portfolios and keep are optimistic with the banking
website-launcheventoverthelongterm,awardingeventbankswithabnormal
positive returns. In return, the adoption of the transactionalwebsite delivers
wealthtoshareholdersoverthelongrun.
- Thepublishedinformationfrompasttransactionalwebsiteeventscanenhance
thevalueofcurrenttransactionalwebsiteevents.Thefindingthenindicatedthat
"learning by observing" would be a mechanism for investors to learn andenhancetheirevaluationofcurrentportfolios.
- The timing effect and the size effect are the critical factors that robustlydifferentiatethemarketperformanceamongbanks.Morespecifically,long-term
valuationsforsmall-capandlateenablerswerehigherrelativetotheirlarge-cap
andfirst-movercounterparts.

272
7.2 ResearchContributions
Firstly, this thesis providednovel data of digital event data in the banking industry,
hence,activatingtheaccesstomarket-basedapproachandtheexaminationofthevalue
of a digital adoption under the evaluation of market and investors. From that, two
performancemetricswereappliedforthefirsttimeindigitalbankingliterature,CAR
and BHAR. These metrics can gauge the evaluation of the market towards an
event/activity inan immediate,accurateandpredictivemanner,asstatedbyvarious
authors.Unfortunately,thesemetricsrequirethecollectionofeventdatedataandinthe
digitalbankingdiscipline,suchdatahasnotbeenprovidedsystematicallyinanyofficial
databaseplatform.CARandBHAR,therefore,havenotbeenestimatedindigitalbanking
literature.
Anotherkeystrengthofthisthesisistheresearchduration.Comparedtootherprevious
studiesinthescopeoftransactionalwebsiteadoption,thisthesisobservestheimpact
oftransactionalwebsiteadoptiononbanks’financialperformanceoveramorerecent
period - 26 years from 1993 to 2018. Based on this, this thesis improves the
understandingoftheimpactoftransactionalwebsiteadoptionsinthelongrunaswell
asclarifyitsdurationattributes.
Furthermore, this thesis advances the understanding of the value of transactionalwebsitesaddedtobanks’shareholders.Tomyknowledge,customervalueandfinancial
benefitsarewhatareprimarilyfocusedonindigitalbankingliterature.Meanwhile,as
arguedbysomestudies,shareholdervalueisalsoanotherimportantindicatorofbanks’
success. However, this perspective has not been explored widely in digital banking
literature. By using CAR and BHAR, this thesis provides evidence that transactional
websiteadoptioncandeliverwealthforbanks’shareholdersinboththeshortandlong
run.Thefindingsthengivetheimplicationforbanksinsatisfyingtheirshareholdersas
wellasplanningtheircapitalstrategyinboththeshortandlongrun.
Additionally,thisthesisadvancestheunderstandingofthestrategicroleoftransactionalwebsiteadoption.Inwhich,transactionalwebsiteadoptionpossessessixattributesthat
positivelyimpactbanks’financialperformanceoverthelongterm.Thus,comparedto
previousstudies,thisthesisfindsthattransactionalwebsiteadoptionnotonlybrings
profitabilityandefficiencytobanksbutalsopossesssomeattributeswhichcanbethe
rootofbanks’superiorperformanceinthelongrun.
273
Thisthesishasextendedtheknowledgeconcerningtheimpactofsizefactorandtiming
factorininfluencingthevalueoftransactionalwebsites.Tomyknowledge,moststudies
intheimpactofsizefactoronthevalueoftransactionalwebsitehavebeencarriedout
insmallsamples(Cyreeetal.,2009;DeYoung,2005)whilesomeothershavetendedto
focusontheperformanceoffirstmoversonly(Lin,2011).Since1992,thedivergencein
thestrategiesofsmallandlargebanksisincreasinglywider.Byexaminingtheimpactof
size factor in a larger and more systematic, this thesis allows advancing the
understandingofthestrategiesandbehaviourofsmallandlargebanksinembracing
Internetbanking.Furthermore,asthetimeresearchextendsfromtheearlystage(since
1996)totheverylatestage(in2010),thisthesisprovidesacomparativeanalysisofnot
only first movers but also second movers and laggards who adopted transactional
websitesinlaterstages.
Finally,learningbyobservingforbothbanksandinvestorsisnowexaminedforthefirst
timeindigitalbankingliterature.Beforethat,onlylearningbydoingisexaminedbefore
by some studies in the scope of Internet banking. The learning by observing the
behaviourofthemarketisalsoexaminedprimarilyintheM&Adiscipline.Theevidence
concerningthe"learningbyobserving"behaviourofthethesis,accordingly,bringnew
implicationsforbanksonthewaytheywouldliketolearnfromothersand/ormaximize
theirshareholdervalue.Theevidencealsoindicatestherationalityofthemarketand
investorsas they tend toobserveandanalysepiecesofpast information toevaluate
theircurrentportfoliointhelongrun.
7.3 ManagerialImplications
Firstly,thisthesissuggeststhatmanagersshouldconsiderthetruenatureofgeneratingbenefitsinadoptingtransactionalwebsitesintheshortandlongterm.Forexample,the
findingsinChapter4indicatethattheshort-termexcessreturnsearnedbytransactional
websiteeventswelldependonhowthemarketparticipantspredictthefuturepotential.
Chapter5revealsthatthelong-termfinancialrewardsareattributedtotransactional
websiteattributes,suchasvalue,appropriability,durability,embeddedness,imitation,andinterconnectedness.Finally,Chapter6suggeststhattransactionalwebsiteadoptionmight possess the resources and capabilities that keep it being on the right track,
maintainingtheenthusiasmandconfidenceofinvestorsovertime.Takentogether,the
successinadoptingtransactionalwebsiteswouldbringotherstoriesbehind.Therefore,

274
tomaximizewealth for the banks themselves and their shareholders from a digital
adoption,managersshouldfirstunderstandtherootofthesuccessineachstage.The
findingsofthisthesissuggestsomeimportantfactorsthatmayaffectthewealthcreation
from transactionalwebsite adoption: (i) strategic resources and capabilities; (ii) the
perceptionofinvestorsandmarkettowardsanevent;(iii)theinformationofthesame
events/activities fromthepastpublishedto themarket;and(iv) thesizeand/or the
timethewebsitehasbeenadopted.
Secondly, given the importance and rationality of the market and investors inperceiving, evaluating, and predicting, managers should focus on building a deep
understandingofthenatureofthemarketaswellasthefinancialbehavioursofmarket
participants. In the short term, when the formation of initiatives is still new to the
market,banksshouldfocusongivingclearandpositivesignalstogainattentionfrom
themarketandconnectionswithinvestors.Inthelongterm,banksshouldkeepbuilding
deep trust by providing groundwork and evidence of their success, sharing the key
metricstotrackprogress.
Thirdly,businessesshouldbeawareofwheretherearedistinctstrengthsanduniquecompetitiveadvantagesduringtheimplementationoftheirstrategies.Theevidenceof
thisthesissuggeststhatbanksdonothavetobelargeorleadtobecomingsuccessfulin
digitaladoption.Also, the thesis found thatbankswhohave launched theirwebsites
duringtheturbulenceofthestockmarketarestillthrivinginthelongrunandgainthe
trustofinvestors.Furthermore,inthelongterm,thelateadoptersaretheoneswhosee
the higher earnings growth from their website events. These things show that the
advantagesoftimingordersarenotdecisivefactorsinlong-termsuccess.Thecoreof
themattermighthingeonhowenterprisesarecognizantoftheinherentfeaturesofthe
adoptionaswellasthewaytheyleveragetheirdistinctcompetitiveadvantages.
Finally,thisthesissuggestssomerecommendationsregardinglearningbehaviourintheadoptionoftransactionalwebsites.Theevidenceshowsthatbusinessesbenefitmore
from their learning behaviour rather than from tracking and copying fromprevious
banks‘adoptions.Morespecifically,Chapter5foundthatbusinessesbenefitfinancially
from experience accumulated over the time of website adoption. On the contrary,
businesseswouldnotgainfinancialbenefitbymerelycapturingthevisualinformation
fromtheirpreviousrivals'adoptions.Therefore,thisthesissuggeststhatthesuccessor
failureinadoptingthispracticemayhaveambiguouscausalitywitheachspecificfirm
275
discipline (e.g., culture, knowledge base, unique resources, cumulative experience).
Therefore, bank firms should be aware of the adverse effects of vicarious learning
or/andimitatebehaviourandinwhatsituations,actionsshouldbefollowingbusiness
disciplineandfirms’idiosyncraticstrengths.
7.4 LimitationsandFurtherResearch
Firstly,thisthesisfocusesonthevalueofthetransactionalwebsitedeliveredtobanks’financialperformanceandtheirshareholders.Furtherresearchcanexaminethevalue
oftransactionalwebsiteadoptiondeliveredtootherstakeholders,suchascustomers,
regulators, andalliances.As stressed,bankscouldnotaccomplish theirdesiredaims
relatingtodigitalprojectsbydeliveringfinancialbenefitstothemselvesonly.Farmore,
duringtheirdigitaltransformation,sustainablewealthcreationtostakeholdersisalso
of fundamental importance. By examining various stakeholders, banks can advance
their understanding of what each group of stakeholders is most concerned with,
accordingly,definingtheirstrategicprioritiestomaximizethewealthcreatedfromtheir
transactionalwebsiteadoptionor/andotherdigitaladoptions.
Secondly,thisthesisonlyprovidessomeempiricalresultsconcerningafewnumbersofresourcesandcapabilitiesstemmingfromtheadoptionoftransactionalwebsites(e.g.,
cumulative transactional website experiences, interconnectedness capability).
However,asanalyticallyproposedinChapter6,theremightexistotherresourcesand
capabilities which could be the root for the sustainability of transactional website
adoption, such as digital culture, digital humans, knowledge exchange, and so on.
Furtherstudiescouldcontinuetodigintothevalueofeachspecificresource/capability
oftransactionalwebsiteadoptionorotherdigitalinitiativesbestowedonbanks.
Thirdly,thisthesishasnotdelvedintotheprinciplesbehindtheheterogeneityamongbank enterprises attributed to their size and adoption time. This thesis only
conceptually suggests some potential reasons why small banks and laggards reap
superiorlong-termadvantages,incomparisontotheirotherrivals.Forexample,small
banks tend to be more dynamic, agile, and opportunistic than their larger rivals in
grabbingnewmarketshareandcustomers.Likewise,laggardsmaydifferentiatefrom
theirpredecessorsbyupgradingmorefeaturesfortheirtransactionalwebsitesreaping
thefruitsfromthetechnologicalrefinementcausedbyfeedbackfromtheearlybirds.
276
Nevertheless, it is necessary to study further the underlying basis, which genuinely
differentiatestheperformanceamongbankinggroups.
Fourthly,thisthesisdidnotincludeotherdigital-relatedandorganizationalfactorsthatmight affect the influence of transactional website adoption. Nowadays, banks are
implementingmixedstrategies that combinesome financial intermediationactivities
(e.g., lendingand financingpersonal financingcorporatebankingservices,payment),
technological, functional, or instrumental activities (e.g., Blockchain, data analytics,
security) as well as the various type of digital strategic solutions (e.g., artificial
intelligence). Furthermore, a few studies have admitted the influence of corporate
governance on the adoption of innovation and digital initiatives. For example, well-
governedcompaniesaremoreattractiveto investments(TrickerandTricker,2015);
improvedshareholders'protectionandrights(KlapperandLove,2004);significantly
associated long-term wealth creation with sustainability (Kocmanová et al., 2011).
Thereby, further investigations of digital-related factors and corporate governance
would beworthwhile as theywill better reflect the impact of transactionalwebsite
adoption in the flowofdigitalizationand the roleof corporate governance indigital
transformation.
Finally,thisthesissuggestsanexpansionofevent-relateddatainorderthatthemarket-
basedmethodologyindigitalbankingisappliedmorewidely.Thisthesisonlyprovided
transactional website launch event data of 307 banks in the USmarket.With these
unavoidable limitations in the data, this thesis could not construct some other
benchmarks tooptimize theCARandBHARmetrics (e.g., employingbook-to-market
ratiooracombinationofmarketcapitalizationandbook-to-marketratio).Thisthesis
suggestsanexpansionofthetransactionalwebsitelauncheventsacrosscountriesoran
extensionofthetypeofdigitalinitiatives(e.g.,mobilebanking,mobileapps).Withthat
said,CARandBHARareoptimalmetricsthatreflecttheassessmentofinvestorsandthe
marketoftheimpactandpotentialofinitiativesinboththeshorttermandlongterm.
Therefore, further research can consider improving data and methods to optimize
market-basedmetricsindigitalbankingliterature.
277
REFERENCES
Aboelmaged, M., Gebba, T. R. (2013). Mobile banking adoption: an examination of
technology acceptance model and theory of planned behaviour. InternationalJournalofBusinessResearchandDevelopment,2(1),35–50.
Accenture. (2019). Does digital leadership in banking really matter? Retrieved 30
November 2019, from https://www.accenture.com/us-
en/insights/banking/does-digital-banking-leadership-matter
Acs,Z.J.,Audretsch,D.B.(1990).Innovationandsmallfirms.Cambridge,MassachusettsandLondon,England:MITPress.
Adams,R.M. (2012).Consolidationandmergeractivity in theUnitedStatesbankingindustry from 2000 through 2010 (FEDS Working Paper No. 2012–51).Washington, DC: FEDS. Retrieved from
https://papers.ssrn.com/sol3/papers.cfm?abstract_id=2193886#
Adhikari, B. K., Agrawal, A. (2018). Peer influence on payout policies. Journal ofCorporateFinance,48(44),615–637.
Afego,P.N. (2018). Indexshocks, investoractionand long-runstockperformance in
Japan:Acaseofculturalbehaviouralism?JournalofBehaviouralandExperimentalFinance,18,54–66.
Agrawal, A., Jaffe, J. F., Mandelker, G. N. (1992). The post-merger performance of
acquiring firms: a re-examination of an anomaly. The Journal of Finance, 47(4),1605–1621.
Agrawal,M.,Kishore,R.,Rao,H.R.(2006).Marketreactionstoe-businessoutsourcing
announcements:Aneventstudy.Information&Management,43(7),861–873.Ahmad, A. M. K., Al-Zu’bi, H. A. (2011). E-banking functionality and outcomes of
customer satisfaction: an empirical investigation. International Journal ofMarketingStudies,3(1),50–65.
Akhigbe, A. (2002). New product innovations, information signalling and industry
competition. Applied Financial Economics, 12(5), 371–378.
https://doi.org/10.1080/09603100010007715
Akhisar, İ., Tunay, K. B., Tunay, N. (2015). The effects of innovations on bank
performance: The case of electronic banking services. Procedia-Social andBehaviouralSciences,195,369–375.
Akkara,J.D.,Kuriakose,A.(2018).Innovativesmartphoneappsforophthalmologists.
278
KeralaJournalofOphthalmology,30(2),138–144.Al-Hawari,M.,Ward,T.(2006).TheeffectofautomatedservicequalityonAustralian
banks’ financial performance and the mediating role of customer satisfaction.
MarketingIntelligence&Planning,24(2),127–147.Alalwan,A.A.,Dwivedi,Y.K.,Rana,N.P.(2017).Factorsinfluencingadoptionofmobile
bankingbyJordanianbankcustomers:ExtendingUTAUT2withtrust.InternationalJournalofInformationManagement,37(3),99–110.
Alalwan,A.A.,Dwivedi,Y.K.,Rana,N.P.P.,Williams,M.D.(2016).Consumeradoption
ofmobilebankinginJordan:examiningtheroleofusefulness,easeofuse,perceived
riskandself-efficacy.JournalofEnterpriseInformationManagement,29(1),118–139.
Alexandru,I.O.,Sascha,A.,Christian,S.,Jan,W.(2019).DoesDigitalTransformationin
B2B Sales Really Pay Off? The Core Role of Selling Complexity. In K. L. Son, G.
Markus, & L. Xueming (Eds.), Understanding Complexity, Transforming theMarketplace(p.PS-4).Austin,TX:2019AmericanMarketingAssociationWinterConference.
Aliyu,A.A.,Rosmain,T.,Takala,J.(2014).Onlinebankingandcustomerservicedelivery
in Malaysia: data screening and preliminary findings. Procedia-Social andBehaviouralSciences,129,562–570.
Aliyu, A. A., Tasmin, R. (2012). The impact of information and communication
technologyonbanks’performanceandcustomerservicedelivery in thebanking
industry.InternationalJournalofLatestTrendsFinanceandEconomy,2(1),80–90.Alpert, F.H.,Kamins,M.A. (1995).An empirical investigationof consumermemory,
attitude, and perceptions toward pioneer and follower brands. Journal ofMarketing,59(4),34–45.
Altavilla,C.,Boucinha,M.,Peydró,J.-L.(2018).Monetarypolicyandbankprofitabilityin
alowinterestrateenvironment.EconomicPolicy,33(96),531–586.Amici,A., Fiordelisi, F.,Masala, F.,Ricci,O., Sist, F. (2013).Value creation inbanking
throughstrategicalliancesandjointventures.JournalofBanking&Finance,37(5),1386–1396.
Amin,M. (2016). Internet banking service quality and its implication on e-customer
satisfactionande-customerloyalty.InternationalJournalofBankMarketing,34(3),280–306.
279
Amit,R.,Schoemaker,P.J.H.(1993).Strategicassetsandorganizationalrent.StrategicManagementJournal,14(1),33–46.
Anderson,B.S.,Eshima,Y.(2013).Theinfluenceoffirmageandintangibleresourceson
the relationship between entrepreneurial orientation and firm growth among
JapaneseSMEs.JournalofBusinessVenturing,28(3),413–429.Andoh-Baidoo,F.K.,Osei-Bryson,K.-M.,Amoako-Gyampah,K.(2012).Effectsoffirmand
ITcharacteristicsonthevalueofe-commerceinitiatives:Aninductivetheoretical
framework.InformationSystemsFrontiers,14(2),237–259.Andrew,C. J.,Mills,T.C.,Roberts, J. (1997).Timeseriesandcross-sectionparameter
stability in themarketmodel: the implications for event studies. The EuropeanJournalofFinance,3(3),243–259.
Andrews, D., Nicoletti, G., Timiliotis, C. (2018). Going digital: What determines
technology diffusion among firms. In The 3rd Annual Conference of the GlobalForum on Productivity. (pp. 1–74). Ottawa. Retrieved from
http://www.csls.ca/events/cea2018/nicoletti.pdf
April, K. (2004).AResource-BasedViewof the Firm: Integrating theRole of IT as aStrategic Resource (PhDThesis). Cape Town,Western Cape: University of CapeTown.
Argyris,C.,Schön,D.A.(1978).OrganizationalLearning.ATheoryofActionPerspective.Reading,MA:AddisonWesleyLongmanPublishingCo.
Arseneau, D. M. (2017). How would US banks fare in a negative interest rateenvironment? (FEDSWorking PaperNo. 2017– 030).Washington, D.C.: FederalReserveBoard.
Arslan,B.,Ozturan,M.(2011).Thepathtoinformationtechnologybusinessvalue:Case
ofTurkey.TechnologyandInvestment,2(1),52–63.Arthurs,J.D.,Busenitz,L.W.,Hoskisson,R.E.,Johnson,R.A.(2009).Signalingandinitial
public offerings: The use and impact of the lockup period. Journal of BusinessVenturing,24(4),360–372.
Atiase,R.K.(1985).Predisclosure information, firmcapitalization,andsecurityprice
behaviouraroundearningsannouncements.JournalofAccountingResearch,23(1),21–36.
Attig,N.,Boubakri,N.,ElGhoul,S.,Guedhami,O.(2016).Firminternationalizationand
corporatesocialresponsibility.JournalofBusinessEthics,134(2),171–197.

280
Balasubramanian,S.K.,Mathur, I.,Thakur,R.(2005).Theimpactofhigh-qualityfirm
achievementsonshareholdervalue:focusonMalcolmBaldrigeandJDPowerand
Associatesawards.JournaloftheAcademyofMarketingScience,33(4),413–422.Baldwin, W. L., Childs, G. L. (1969). The fast second and rivalry in research and
development.SouthernEconomicJournal,36(1),18–24.Ball,R.T.,Gallo,L.A.(2018).Amixeddatasamplingapproachtoaccountingresearch.
Retrieved 20 June 2021, from
https://papers.ssrn.com/sol3/papers.cfm?abstract_id=3250445
Bamber, L. S. (1987). Unexpected earnings, firm size, and trading volume around
quarterlyearningsannouncements.AccountingReview,62(3),510–532.Bandura,A.(1980).SociallearningtheoryofAggression.InR.Falk&S.S.Kim(Eds.),
TheWarSystem:AnInterdisciplinaryApproach(1sted.,pp.141–158).NewYorkandOxon:Routledge.
Banz, R.W. (1981). The relationship between return andmarket value of common
stocks.JournalofFinancialEconomics,9(1),3–18.Barber, B. M., Lyon, J. D. (1997a). Detecting long-run abnormal stock returns: The
empiricalpowerandspecificationofteststatistics.JournalofFinancialEconomics,43(3),341–372.
Barber,B.M.,Lyon,J.D.(1997b).Firmsize,book-to-marketratio,andsecurityreturns:
Aholdoutsampleoffinancialfirms.TheJournalofFinance,52(2),875–883.Barley,S.R.(1983).Semioticsandthestudyofoccupationalandorganizationalcultures.
AdministrativeScienceQuarterly,28(3),393–413.Barney,J.B.(1986a).Organizationalculture:canitbeasourceofsustainedcompetitive
advantage?AcademyofManagementReview,11(3),656–665.Barney, J. B. (1986b). Strategic Factor Markets: Expectations, Luck, and Business
Strategy. Management Science, 32(10), 1231–1241.
https://doi.org/10.1287/mnsc.32.10.1231
Barney, J.B. (1991).Firmresourcesandsustainedcompetitiveadvantage. JournalofManagement,17(1),99–120.
Barney,J.B.(1996).Theresource-basedtheoryofthefirm.OrganizationScience,7(5),469–592.
Barry,C.B.,Brown,S.J.(1984).Differentialinformationandthesmallfirmeffect.JournalofFinancialEconomics,13(2),283–294.

281
Barth,J.R.,Li,T.,Lu,W.(2010).BankregulationintheUnitedStates.CESifoEconomicStudies,56(1),112–140.
Bartram,S.M.,Grinblatt,M.,Nozawa,Y. (2020).Book-to-market,mispricing, and thecross-sectionofcorporatebondreturns(WorkingpaperNo.27655).Cambridge,Massachusetts:NationalBureauofEconomicResearch.
Barua,A.,Mani,D. (2018).Reexamining themarket value of information technology
events.InformationSystemsResearch,29(1),225–240.Basu,S.(1983).Therelationshipbetweenearnings’yield,marketvalueandreturnfor
NYSE common stocks: Further evidence. Journal of Financial Economics, 12(1),129–156.
Basuony,M.,Ehab,K.A.,Al-Baidhani,A.M.(2014).Theeffectofcorporategovernance
onbank financialperformance: evidence from theArabianPeninsula.CorporateOwnership&Control,11(2),178–191.
Bauer,R.A.(1960).Consumerbehaviourasrisktaking.InE.Robert&S.Hancock.(Eds.),
Dynamic Marketing for a Changing World (pp. 384–398). Chicago: AmericanMarketingAssociation.
Bell,A., Jones,K.(2015).ExplainingFixedEffects:RandomEffectsModelingofTime-
Series Cross-Sectional and Panel Data, 3(1), 133–153.
https://doi.org/10.1017/psrm.2014.7
Benbunan-Fich, R., Fich, E.M. (2004). Effects ofweb traffic announcements on firm
value.InternationalJournalofElectronicCommerce,8(4),161–181.Benbunan-Fich,R.,Fich,E.M.(2005).Measuringthevalueofrefiningawebpresence.
JournalofElectronicCommerceinOrganizations,3(1),35–52.Berger,A.N.(2003).Theeconomiceffectsoftechnologicalprogress:Evidencefromthe
bankingindustry.JournalofMoney,CreditandBanking,35(2),141–176.Berger,A.N.,DeYoung,R.(2006).Technologicalprogressandthegeographicexpansion
ofthebankingindustry.JournalofMoney,CreditandBanking,38(6),1483–1513.Berk,J.B.(1995).Acritiqueofsize-relatedanomalies.TheReviewofFinancialStudies,
8(2),275–286.Bessler,W., Murtagh, J. P., Siregar, D. (2003). Dividend policy of bank initial public
offerings.InM.Bagella,L.Becchetti,&H.Iftekhar(Eds.),Transparency,governanceandmarkets(1sted.).Oxford:EmeraldGroupPublishing.
Bessler,W., Thies, S. (2007). The long-run performance of initial public offerings in
282
Germany.ManagerialFinance.Bharadwaj, A. (2000). A resource-based perspective on information technology
capabilityandfirmperformance:anempiricalinvestigation.MISQuarterly,24(1),169–196.
Bharadwaj,A.,ElSawy,O.,Pavlou,P.,Venkatraman,V.(2013).Digitalbusinessstrategy:
towardanextgenerationofinsights.MISQuarterly,37(2),471–482.Bi,R.,Davison,R.M.,Smyrnios,K.X.(2014).E-BusinessUseandValueforFastGrowth
Small-to-medium Eenterprises in Turbulent Environment. In PACIS 2014Proceedings.Chengdu,China.
Bi, X., Zhang, H. (2008). An empirical research on relationship between information
technologycapabilityandfirmperformancetheevidencefromthelistedcompanies
and informatization power 500 in China. In 2008 International Conference onComputerScienceandSoftwareEngineering(Vol.5,pp.540–544).IEEE.
Bilinski,P.,Liu,W.,Strong,N.(2012).Doesliquidityriskexplainlowfirmperformance
followingseasonedequityofferings?JournalofBanking&Finance,36(10),2770–2785.
Birgit,A.A. S., Elsa,K. (2019).TheComplexityofEventManagement froma Service
EcosystemsPerspective.InK.L.Son,G.Markus,&L.Xueming(Eds.),UnderstandingComplexity,TransformingtheMarketplace(p.CFR-29).Austin,TX.
Black, J.A.,Boal,K.B.(1994).Strategicresources:Traits,configurationsandpathsto
sustainable competitive advantage. StrategicManagement Journal, 15(S2), 131–148.
Bloodgood,J.M.,Salisbury,W.D.(2001).Understandingtheinfluenceoforganizational
change strategies on information technology and knowledge management
strategies.DecisionSupportSystems,31(1),55–69.Boehmer, E., Masumeci, J., Poulsen, A. B. (1991). Event-study methodology under
conditionsofevent-inducedvariance.JournalofFinancialEconomics,30(2),253–272.
Bonin,J.P.,Hasan,I.,Wachtel,P.(2005).Bankperformance,efficiencyandownershipin
transitioncountries.JournalofBanking&Finance,29(1),31–53.Boulland, R., Lobo, G. J., Paugam, L. (2019). Do investors pay sufficient attention to
banks’ unrealized gains and losses on available-for-sale securities? EuropeanAccountingReview,28(5),819–848.

283
Brav,A.,Gompers,P.A.(1997a).MythorReality?TheLong-RunUnderperformanceof
Initial Public Offerings: Evidence from Venture and Nonventure Capital-Backed
Companies. The Journal of Finance, 52(5), 1791–1821.
https://doi.org/10.2307/2329465
Brav,A.,Gompers,P.A.(1997b).Mythorreality?The long-rununderperformanceof
initial public offerings: Evidence from venture and nonventure capital-backed
companies.TheJournalofFinance,52(5),1791–1821.Brown,P.,Kleidon,A.W.,Marsh,T.A.(1983).Newevidenceonthenatureofsize-related
anomaliesinstockprices.JournalofFinancialEconomics,12(1),33–56.Brown, S. J., Warner, J. B. (1980). Measuring security price performance. Journal of
FinancialEconomics,8(3),205–258.Brown,S.J.,Warner,J.B.(1985).Usingdailystockreturns:Thecaseofeventstudies.
JournalofFinancialEconomics,14(1),3–31.Brynjolfsson, E. (1991). The productivity of information technology: Review and
assessment(SloanSchoolWorkingPaperNo.3417–3492).Cambridge,MA:CenterforCoordinationScience,MITSloanSchoolofManagement.
Brynjolfsson, E., Hitt, L. (1996). Paradox lost? Firm-level evidence on the returns to
informationsystemsspending.ManagementScience,42(4),541–558.Buchak,G.,Matvos,G.,Piskorski,T.,Seru,A.(2018).Fintech,regulatoryarbitrage,and
theriseofshadowbanks.JournalofFinancialEconomics,130(3),453–483.Buell,R.W.,Campbell,D.,Frei,F.X.(2010).Areself-servicecustomerssatisfiedorstuck?
ProductionandOperationsManagement,19(6),679–697.Byun,J.,Rozeff,M.S.(2003).Long-runperformanceafterstocksplits:1927to1996.The
JournalofFinance,58(3),1063–1085.Cahill,D.,Baur,D.G.,Liu,Z.F.,Yang,J.W.(2020).IAmaBlockchainToo:HowDoesthe
Market Respond to Companies’ Interest in Blockchain? Journal of Banking andFinance,113,1–16.
Cainelli, G., Ganau, R. (2019). Related variety and firm heterogeneity. What really
matters for short-run firm growth? Entrepreneurship & Regional Development,31(9–10),768–784.
Calzada, J.,Fageda,X.,Martínez-Santos,F. (2019).Mergers,branchconsolidationandfinancial exclusion in the US bank market (UB EconomicsWorking Papers No.E19/397).Barcelona:UniversitydeBarcelona.
284
Camerer, C., Vepsalainen, A. (1988). The economic efficiency of corporate culture.
StrategicManagementJournal,9(S1),115–126.Campbel,T.S.,Kracaw,W.A.(1980).Informationproduction,marketsignalling,andthe
theoryoffinancialintermediation.TheJournalofFinance,35(4),863–882.Campbell, D., Frei, F. (2010). Cost structure, customer profitability, and retention
implications of self-service distribution channels: Evidence from customer
behaviourinanonlinebankingchannel.ManagementScience,56(1),4–24.Campbell, J. Y., Lo, A. W., MacKinlay, A. C. (1997). Event-study analysis. In The
Econometrics of Financial Markets (pp. 149–180). Princeton, NJ: PrincetonUniversityPress.
Campbell,K.,Gordon,L.A.,Loeb,M.P.,Zhou,L.(2003).Theeconomiccostofpublicly
announced information security breaches: Empirical evidence from the stock
market. Journal of Computer Security, 11(3), 431–448.
https://doi.org/10.3233/JCS-2003-11308
Campbell,M. (2012).What a difference a yearmakes: time lag effect of information
technologyinvestmentonfirmperformance.JournalofOrganizationalComputingandElectronicCommerce,22(3),237–255.
Campbell,R.D.,Giambona,E.,Sirmans,C.F.(2009).Thelong-horizonperformanceof
REITmergers.TheJournalofRealEstateFinanceandEconomics,38(2),105–114.Carbó-Valverde, S., Cuadros-Solas, P., Rodríguez-Fernández, F. (2020). A Machine
LearningApproachtotheDigitalizationofBankCustomers:EvidencefromRandom
andCausalForests’.PlosOne,15(10),1–39.Card,D.,DellaVigna,S.(2012).Revealedpreferencesforjournals:Evidencefrompage
limits(WorkingPaperNo.18863).Cambridge,Massachusetts:NationalBureauofEconomicResearch.
Carlson, J., Furst, K., Lang, W. W., Nolle, D. E. (2001). Internet banking: market
developmentsandregulatoryissues.InPaperpresentedtoSocietyofGovernmentEconomists. Washington, DC.: Citeseer. Retrieved from
www.occ.treas.gov/netbank/SGEC2000.pdf
Carpenter,G.S.,Nakamoto,K.(1989).Consumerpreferenceformationandpioneering
advantage.JournalofMarketingResearch,26(3),285–298.Carpenter,G.S.,Nakamoto,K.(1990).Competitivestrategiesforlateentryintoamarket
withadominantbrand.ManagementScience,36(10),1268–1278.

285
Carson,D.,McCartan-Quinn,D.(1995).Non-PracticeofTheoreticallyBasedMarketing
in Small Business-Issues Arising and Their Implications. Journal of MarketingTheory and Practice, 3(4), 24–32.
https://doi.org/10.1080/10696679.1995.11501702
Carter,D.A.,McNulty,J.E.(2005).Deregulation,technologicalchange,andthebusiness-
lendingperformanceoflargeandsmallbanks.JournalofBanking&Finance,29(5),1113–1130.
Carter,R.B.,Dark,F.H.,Singh,A.K.(1998).Underwriterreputation,initialreturns,and
thelong-runperformanceofIPOstocks.TheJournalofFinance,53(1),285–311.Census. (2021). Datasets. Retrieved 4 November 2021, from
https://www2.census.gov/programs-surveys/popest/datasets/
Chaney, P. K., Devinney, T. M., Winer, R. S. (1991). The impact of new product
introductionsonthemarketvalueoffirms.JournalofBusiness,64(4),573–610.Chang,Y.(2002).Dynamicsofbankingtechnologyadoption:AnapplicationtoInternet
banking (Economic Research Papers). Coventry: Department of Economics,UniversityofWarwick.
Chatterjee,D.,Pacini,V.S.C.(2002).Theshareholder-wealthandtrading-volumeeffects
of information-technology infrastructure investments. Journal of ManagementInformationSystems,19(2),7–42.
Chatterjee,D.,Richardson,V.J.,Zmud,R.W.(2001).Examiningtheshareholderwealth
effectsofannouncementsofnewlycreatedCIOpositions.MISQuarterly,25(1),43–70.
Chau,P.Y.K.,Lai,V.S.K.(2003).Anempiricalinvestigationofthedeterminantsofuser
acceptanceofinternetbanking.JournalofOrganizationalComputingandElectronicCommerce,13(2),123–145.
Chen,H.,Zheng,M.(2021).IPOUnderperformanceandtheIdiosyncraticRiskPuzzle.
JournalofBanking&Finance,131,1–12.Chen,M.-J.,Hambrick,D.C.(1995).Speed,stealth,andselectiveattack:Howsmallfirms
differfromlargefirmsincompetitivebehaviour.AcademyofManagementJournal,38(2),453–482.
Chen, S.-S., Su, X.-Q. (2010). Market reaction to entry timing of corporate capital
investment announcement: Evidence from announcement-period abnormal
returnsandanalysts’earningsforecastrevisions.ReviewofPacificBasinFinancial

286
MarketsandPolicies,13(04),495–515.Chen,X.,Solomon,E.,Verousis,T.(2016).Asymmetricpost-announcementdrifttogood
andbadnews:evidence fromvoluntary tradingdisclosures in theChinesestock
market.InternationalJournaloftheEconomicsofBusiness,23(2),183–198.Cheng, J. M.-S., Tsao, S.-M., Tsai, W.-H., Tu, H. H.-J. (2007). Will eChannel additions
increase the financial performance of the firm?—The evidence from Taiwan.
IndustrialMarketingManagement,36(1),50–57.Cheng,T.C.E.,Lam,D.Y.C.,Yeung,A.C.L. (2006).Adoptionof internetbanking:an
empiricalstudyinHongKong.DecisionSupportSystems,42(3),1558–1572.Chhaochharia,V.,Grinstein,Y.(2007).Corporategovernanceandfirmvalue:Theimpact
ofthe2002governancerules.TheJournalofFinance,62(4),1789–1825.Chong,A.Y.-L.,Ooi,K.-B.,Lin,B.,Tan,B.-I.(2010).Onlinebankingadoption:anempirical
analysis.InternationalJournalofBankMarketing,28(4),267–287.Chou,C.Y.,Chen,J.-S.,Liu,Y.-P.(2017).Inter-firmrelationalresourcesincloudservice
adoption and their effect on service innovation. The Service Industries Journal,37(3–4),256–276.
Christensen, K. S. (2006). Losing innovativeness: the challenge of being acquired.
ManagementDecision,4(9),1161–1182.Chu,S.-C.,Leung,L.C.,Hui,Y.Van,Cheung,W.(2007).Evolutionofe-commerceWeb
sites: A conceptual framework and a longitudinal study. Information &Management, 44(2), 154–164.
https://doi.org/https://doi.org/10.1016/j.im.2006.11.003
Chui,M.K.F.,Domanski,D.,Kugler,P.,Shek,J.(2010).Thecollapseofinternationalbankfinanceduring the crisis: evidence fromsyndicated loanmarkets (BISQuarterlyReviewSeptember-2010).Basel:BankforInternationalSettlements.
Ciciretti,R.,Hasan,I.,Zazzara,C.(2009).Dointernetactivitiesaddvalue?Evidencefrom
thetraditionalbanks.JournalofFinancialServicesResearch,35(1),81–98.Cipriani,M.,Guarino,A.(2013).Theimpactsofcomplementaryinformationtechnology
resourcesontheservice-profitchainandcompetitiveperformanceofSouthAfrican
hospitality firms. International JournalofHospitalityManagement,34,245–254.Retrievedfromhttps://papers.ssrn.com/sol3/papers.cfm?abstract_id=965422
Clarkson,P.M.,Li,Y.,Richardson,G.D.,Vasvari,F.P.(2011).Does itreallypaytobe
green? Determinants and consequences of proactive environmental strategies.

287
JournalofAccountingandPublicPolicy,30(2),122–144.Cohen, J.F.,Olsen,K. (2013).The impactsof complementary information technology
resourcesontheservice-profitchainandcompetitiveperformanceofSouthAfrican
hospitality firms. International Journal of Hospitality Management, 34(1), 245–254.
Cohen, W. M., Klepper, S. (1996). Firm size and the nature of innovation within
industries: the caseof process andproductR&D.TheReviewofEconomics andStatistics,78(2),232–243.
Cohen, W. M., Levinthal, D. A. (1990). Absorptive capacity: A new perspective on
learningandinnovation.AdministrativeScienceQuarterly,35(1),128–152.Cole,J.A.(1980).Theoryandevidenceregardingtheinformationcontentindividends
(PhDThesis).AnnArbor,Michigan:UniversityofMichigan.
Collis,D.J.,Montgomery,C.A.(1995).CompetingonResources:Strategyinthe1990s.
HarvardBusinessReview,73(4),118–128.Connelly,B.L.,Certo,S.T.,Ireland,R.D.,Reutzel,C.R.(2011).Signalingtheory:Areview
andassessment.JournalofManagement,37(1),39–67.Considine, E., Cormican, K. (2016). Self-service technology adoption: An analysis of
customertotechnologyinteractions.ProcediaComputerScience,100,103–109.Cooper,M.J.,Dimitrov,O.,Rau,P.R.(2001).Arose.combyanyothername.TheJournal
ofFinance,56(6),2371–2388.Cooper,M.J.,Khorana,A.,Osobov,I.,Patel,A.,Rau,P.R.(2005).Managerialactionsin
responsetoamarketdownturn:Valuationeffectsofnamechangesinthedot.com
decline.JournalofCorporateFinance,11(1–2),319–335.Cornett,M.M.,McNutt, J. J.,Tehranian,H.(2006).Performancechangesaroundbank
mergers:Revenueenhancementsversuscostreductions.JournalofMoney,CreditandBanking,38(4),1013–1050.
Cornett,M.M.,Mehran,H.,Tehranian,H.(1998).Arefinancialmarketsoverlyoptimistic
about the prospects of firms that issue equity? Evidence from voluntary versus
involuntaryequityissuancesbybanks.TheJournalofFinance,53(6),2139–2159.Cornett,M.M.,Tehranian,H.(1992).Changesincorporateperformanceassociatedwith
bankacquisitions.JournalofFinancialEconomics,31(2),211–234.Corsini,L.,Dammicco,V.,Bowker-Lonnecker,L.,Blythe,R.(2020).TheMakermovement
anditsimpactinthefightagainstCOVID-19(CentreforTechnologyManagement
288
WorkingPaperSeriesNo.5).Cambridge:UniversityofCambridge.
Cortet,M.,Rijks,T.,Nijland,S.(2016).PSD2:Thedigitaltransformationacceleratorfor
banks.JournalofPaymentsStrategy&Systems,10(1),13–27.Cowan,A.R.,Salotti,V.(2015).Theresolutionoffailedbanksduringthecrisis:Acquirer
performanceandFDICguarantees,2008–2013.JournalofBanking&Finance,54,222–238.
Coyne, K. P. (1986). Sustainable competitive advantage—What it is, what it isn’t.
BusinessHorizons,29(1),54–61.Cremers, M., Pareek, A. (2015). Short-term trading and stock return anomalies:
Momentum,reversal,andshareissuance.ReviewofFinance,19(4),1649–1701.Cruz,P.,BarrettoFilgueirasNeto,L.,Munoz-Gallego,P.,Laukkanen,T.(2010).Mobile
bankingrolloutinemergingmarkets:evidencefromBrazil.InternationalJournalofBankMarketing,28(5),342–371.
Cuesta,C.,Ruesta,M.,Tuesta,D.,Urbiola,P.(2015).Thedigital transformationof thebankingindustry(BBVAResearchWorkingPaper).BBVAResearch.
Cummings, J.,Dennis,A.,Cho,W.,Cooney,K.(2018).TheBenefitofBeingSecond:An
EventStudyofSocialMediaAdoption.ACMSIGMISDatabase:TheDATABASEforAdvancesinInformationSystems,49(2),54–78.
Cummins,J.D.,Weiss,M.A.(2004).ConsolidationintheEuropeaninsuranceindustry:
domergers and acquisitions create value for shareholders? Brookings-WhartonPapersonFinancialServices,217–258.
Curty, R. G., Zhang, P. (2013).Website features that gave rise to social commerce: a
historicalanalysis.ElectronicCommerceResearchandApplications,12(4),260–279.
Cusatis,P. J.,Miles, J.A.,Woolridge, J.R. (1993).Restructuring throughspinoffs:The
stockmarketevidence.JournalofFinancialEconomics,33(3),293–311.Cyree,K.B.,Delcoure,N.,Dickens,R.(2009).Anexaminationoftheperformanceand
prospects for the future of internet-primary banks. Journal of Economics andFinance,33(2),128–147.https://doi.org/10.1007/s12197-008-9048-0
Cyree, K. B., Huang, P., Lindley, J. T. (2012). The economic consequences of banks’
derivativesuseingoodtimesandbadtimes.JournalofFinancialServicesResearch,41(3),121–144.
Dabholkar, P. A. (1996). Consumer evaluations of new technology-based self-service
289
options: an investigation of alternative models of service quality. InternationalJournalofResearchinMarketing,13(1),29–51.
Dagnino, G. (1996). Understanding the enconomics of Riracdian, Chamberlinian and
Schumpeterianrents.InternationalReviewofEconomics&Business,43(1),213–235.
Dalton, D. R., Todor, W. D., Spendolini, M. J., Fielding, G. J., Porter, L. W. (1980).
Organization structure and performance: A critical review. Academy ofManagementReview,5(1),49–64.
Dandapani, K., Lawrence, E. R., Rodriguez, J. (2018). Determinants of Transactional
InternetBanking.JournalofFinancialServicesResearch,54,243–267.Dapp,T.,Slomka,L.(2015).Fintechreloaded–Traditionalbanksasdigitalecosystems
(DeutscheBankResearch).Frankfurt:DeutscheBank.
Das,S.,Debbarma,J.(2011).Designingabiometricstrategy(fingerprint)measurefor
enhancing atm security in indian e-banking system. International Journal ofInformationandCommunicationTechnologyResearch,1(5),197–203.
Dasgupta,M.,Gupta,R.K.(2009).Innovationinorganizations:Areviewoftheroleof
organizational learning and knowledge management. Global Business Review,10(2),203–224.
Dauda, S. Y., Lee, J. (2015). Technology adoption: A conjoint analysis of consumers׳
preferenceonfutureonlinebankingservices.InformationSystems,53,1–15.Davis, F. D., Bagozzi, R. P., Warshaw, P. R. (1989). User acceptance of computer
technology:acomparisonoftwotheoreticalmodels.ManagementScience,35(8),982–1003.
Dayasindhu, N. (2002). Embeddedness, knowledge transfer, industry clusters and
globalcompetitiveness:acasestudyoftheIndiansoftwareindustry.Technovation,22(9),551–560.
De-Aguilera-Moyano, M., Castro-Higueras, A., Pérez-Rufí, J.-P. (2019). Between
broadcastyourselfandbroadcastwhatever:YouTube’shomepageasasynthesisof
itsbusinessstrategy.ProfesionaldeLaInformación,28(2),1–13.DeCarolis,D.M.(2003).Competenciesandimitabilityinthepharmaceuticalindustry:
Ananalysisof theirrelationshipwith firmperformance. JournalofManagement,29(1),27–50.
DeMarco,F.,Wieladek,T.(2015).Therealeffectsofcapitalrequirementsandmonetary
290
policy:EvidencefromtheUnitedKingdom(Staffworkingpaper-JournalofBankingandFinance,Forthcoming.No.573).London:BankofEngland.
Deal,T.E.,Kennedy,A.A.(1982).Corporatecultures.Reading,MA:AddisonWesley.Dean, T. J., Brown, R. L., Bamford, C. E. (1998). Differences in large and small firm
responses to environmental context: Strategic implications from a comparative
analysisofbusinessformations.StrategicManagementJournal,19(8),709–728.Deane,J.K.,Goldberg,D.M.,Rakes,T.R.,Rees,L.P.(2019).Theeffectof information
securitycertificationannouncementsonthemarketvalueofthefirm.InformationTechnologyandManagement,20(3),1–15.
Dehning,B.,Richardson,V.J.,Urbaczewski,A.,Wells,J.D.(2004).Reexaminingthevalue
relevanceofe-commerceinitiatives.JournalofManagementInformationSystems,21(1),55–82.
Dehning, B., Richardson, V. J., Zmud, R. W. (2003). The value relevance of
announcements of transformational information technology investments. MisQuarterly,27(4),637–656.
Dehning,B.,Richardson,V.J.,Zmud,R.W.(2007).Thefinancialperformanceeffectsof
IT-based supply chain management systems in manufacturing firms. Journal ofOperationsManagement,25(4),806–824.
Delgado,J.,Hernando,I.,Nieto,M.J.(2007).DoEuropeanprimarilyInternetbanksshow
scale and experience efficiencies? EuropeanFinancialManagement, 13(4), 643–671.
Deloitte. (2017). Deloitte Luxembourg Digital Banking Benchmark – improving thedigital performance. Luxembourg. Retrieved from
https://www2.deloitte.com/lu/en/pages/banking-and-
securities/articles/digital-banking-benchmark.html
Deloitte. (2018). The value of online banking channels in a mobile-centric world.
Retrieved 1 January 2019, from
https://www2.deloitte.com/us/en/insights/industry/financial-services/online-
banking-usage-in-mobile-centric-world.html#
Deloitte.(2019).DigitalBankingBenchmarkImprovingdigitalperformance.Retrieved
20 October 2019, from
https://www2.deloitte.com/content/dam/Deloitte/lu/Documents/financial-
services/Banking/lu-digital-banking-benchmark.pdf
291
DeLong,G.,DeYoung,R. (2007).Learningbyobserving: Informationspillovers in the
executionandvaluationofcommercialbankM&As.TheJournalofFinance,62(1),181–216.
Dempsey,M.(2010).Thebook-to-marketequityratioasaproxyforrisk:evidencefrom
Australianmarkets.AustralianJournalofManagement,35(1),7–21.Deshpandé, R., Farley, J. U., Webster Jr, F. E. (1993). Corporate culture, customer
orientation,and innovativeness in Japanese firms:aquadradanalysis. JournalofMarketing,57(1),23–37.
DeYoung,R.(2001).ThefinancialperformanceofpureplayInternetbanks.EconomicPerspectives,25(1),60–75.
DeYoung,R.(2002).Learning-by-doing,scaleefficiencies,andfinancialperformanceatInternet-onlybanks(FRBChicagoWorkingPaperNo.2001–06).Chicago:FederalReserveBankofChicago.
DeYoung, R. (2005). The performance of Internet-based business models: Evidence
fromthebankingindustry.TheJournalofBusiness,78(3),893–948.DeYoung,R.(2007).Safety,soundness,andtheevolutionoftheUSbankingindustry.
EconomicReview-FederalReserveBankofAtlanta,92(1/2),41–66.DeYoung,R.(2010).BankingintheUnitedStates.InA.N.Berger,P.Molyneux,&J.O.S.
Wilson (Eds.), TheOxford handbook of banking (1st ed., pp. 777–806). Oxford:OxfordUniversityPress.
DeYoung,R.,Frame,W.S.,Glennon,D.,Nigro,P.(2011).Theinformationrevolutionand
small business lending: The missing evidence. Journal of Financial ServicesResearch,39(1–2),19–33.
DeYoung, R., Hunter, W. C. (2001). Deregulation, the Internet, and the competitiveviabilityof largebanksandcommunitybanks (No.WP-01-11).Chicago:FederalReserveBankofChicago.
DeYoung,R.,Hunter,W.C.(2003).LargeBanksandCommunityBanks.TheFutureofBanking,173.
DeYoung,R.,Hunter,W.C.,Udell,G.F.(2004).Thepast,present,andprobablefuturefor
communitybanks.JournalofFinancialServicesResearch,25(2–3),85–133.DeYoung, R., Jang, K. Y. (2016).Do banks activelymanage their liquidity? Journal of
Banking&Finance,66,143–161.DeYoung, R., Lang, W. W., Nolle, D. L. (2007). How the Internet affects output and
292
performance at community banks. Journal of Banking & Finance, 31(4), 1033–1060.
DeYoung,R.,Peng,E.Y.,Yan,M.(2013).Executivecompensationandbusinesspolicy
choices at US commercial banks. Journal of Financial andQuantitative Analysis,48(1),165–196.
Dibrell, C., Davis, P. S., Craig, J. (2008). Fueling innovation through information
technologyinSMEs.JournalofSmallBusinessManagement,46(2),203–218.Dichev,I.D.,Piotroski,J.D.(2001).Thelong-runstockreturnsfollowingbondratings
changes.TheJournalofFinance,56(1),173–203.Dierickx,I.,Cool,K.(1989).Assetstockaccumulationandsustainabilityofcompetitive
advantage.ManagementScience,35(12),1504–1511.Dimson,E.,Marsh,P.(1986).Eventstudymethodologiesandthesizeeffect:Thecaseof
UKpressrecommendations.JournalofFinancialEconomics,17(1),113–142.Docking,D.S.,Koch,P.D.(2005).Sensitivityofinvestorreactiontomarketdirectionand
volatility:dividendchangeannouncements. JournalofFinancialResearch,28(1),21–40.
Dootson,P.,Beatson,A.,Drennan,J.(2016).Financialinstitutionsusingsocialmedia–do
consumersperceivevalue?InternationalJournalofBankMarketing,34(1),9–36.Dos Santos, B. L., Peffers, K. (1995). Rewards to investors in innovative information
technologyapplications:Firstmoversandearly followers inATMs.OrganizationScience,6(3),241–259.
DosSantos,B.L.,Peffers,K.,Mauer,D.C.(1993).Theimpactofinformationtechnology
investmentannouncementsonthemarketvalueofthefirm.InformationSystemsResearch,4(1),1–23.
Doz, Y. L. (1987). Technology partnerships between larger and smaller firms: Some
criticalissues.InternationalStudiesofManagement&Organization,17(4),31–57.Drechsler,K.,Wagner,H.-T.,Reibenspiess,V.A.(2019).RiskandReturnofChiefDigital
Officers’ Appointment–An Event Study. In 40th International Conference onInformationSystem(pp.1–17).Munich,Germany.
Drigă,I.,Isac,C.(2014).E-bankingservices–features,challengesandbenefits.AnnalsoftheUniversityofPetroşani.Economics,14(1),49–58.
Drucker,P.F.(1985).Entrepreneurialstrategies.CaliforniaManagementReview,27(2),9–21.

293
Dutta, A., Lee, H., Yasai-Ardekani, M. (2014). Digital systems and competitive
responsiveness:Thedynamicsof ITbusinessvalue. Information&Management,51(6),762–773.
Eberhart, A. C., Maxwell,W. F., Siddique, A. R. (2004). An examination of long-term
abnormalstockreturnsandoperatingperformancefollowingR&Dincreases.TheJournalofFinance,59(2),623–650.
Egland,K.L.,Gurst,K.,Nolle,D.E.,Robertson,D.(1998).SpecialStudiesonTechnology
andBanking:BankingovertheInternet.OfficeoftheComptrolleroftheCurrencyQuarterlyJournal,17(4),25–30.
El Diri, M., King, T., Spokeviciute, L., Williams, J. (2021). Hands in the cookie jar:
Exploiting loan lossprovisionsunderbank financialdistress.EconomicsLetters,209,110098.
Elfakhani, S., Ghantous, R. F., Baalbaki, I. (2003). Mega-mergers in the US banking
industry.AppliedFinancialEconomics,13(8),609–622.Eliashberg,J.,Robertson,T.S.(1988).Newproductpreannouncingbehaviour:Amarket
signalingstudy.JournalofMarketingResearch,25(3),282–292.Erdogan,A. (2010).The long-runperformanceof initialpublicofferings:Thecaseof
Turkey.EuropeanJournalofEconomics,FinanceandAdministrativeSciences,26,57–64.
Fahy, J.,Hooley,G. (2002).Sustainablecompetitiveadvantage inelectronicbusiness:
towardsacontingencyperspectiveontheresource-basedview.JournalofStrategicMarketing,10(4),241–253.
Fama,E.F.(1970).EfficientCapitalMarkets:AReviewofTheoryandEmpiricalWork.
TheJournalofFinance,25(2),383–417.https://doi.org/10.2307/2325486Fama,E.F.(1995).Randomwalks instockmarketprices.FinancialAnalysts Journal,
51(1),75–80.Fama, E. F. (1998). Market efficiency, long-term returns, and behavioural finance.
JournalofFinancialEconomics,49(3),283–306.Fama,E.F.(2021).Efficientcapitalmarketsareviewoftheoryandempiricalwork.InJ.
H.Cochrane&T.J.Moskowitz(Eds.),TheFamaPortfolio:SelectedPapersofEugeneF.Fama(pp.76–121).Moskowitz,Chicago:UniversityofChicagoPress.
Fama,E.F.,Fisher,L.,Jensen,M.C.,Roll,R.(1969).Theadjustmentofstockpricestonew
information.InternationalEconomicReview,10(1),1–21.
294
Fama,E.F.,French,K.R.(1992).Thecross-sectionofexpectedstockreturns.TheJournalofFinance,47(2),427–465.
Fama,E.F.,French,K.R.(1993).Commonriskfactorsinthereturnsonstocksandbonds.
JournalofFinancialEconomics,33(1),3–56.Fama, E. F., French, K. R. (1995). Size and book-to-market factors in earnings and
returns.TheJournalofFinance,50(1),131–155.Fanta,A.B.,Kemal,K.S.,Waka,Y.K.(2013).Corporategovernanceandimpactonbank
performance.JournalofFinanceandAccounting,1(1),19–26.Farrell,J.(1987).Cheaptalk,coordination,andentry.TheRANDJournalofEconomics,
18(1),34–39.Fathollahzadeh, M., Hashemi, A., Kahreh, M. S. (2011). Designing a new model for
determining customer value satisfaction and loyalty towards banking sector of
Iran.EuropeanJournalofEconomics,FinanceandAdministrativeSciences,28(1),126–138.
Ferguson,C.,Finn,F.,Hall, J.(2005).Electroniccommerceinvestments, theresource-
basedviewofthefirm,andfirmmarketvalue.InternationalJournalofAccountingInformationSystems,6(1),5–29.
Filbeck,G.,Krueger,T.,Preece,D.(2007).CFOMagazine’s"workingcapitalsurvey":do
selected firms work for shareholders? Quarterly Journal of Business andEconomics,46(2),3–22.
Filbeck,G.,Preece,D.,Zhao,X.(2013).Topperformingbanks:thebenefitstoinvestors.
JournalofEconomicsandFinance,37(4),560–583.Filbeck,G.,Swinarski,M.,Zhao,X.(2013).Shareholderreactiontofirminvestmentsin
the capabilitymaturitymodel: an event study. European Journal of InformationSystems,22(2),170–190.https://doi.org/10.1057/ejis.2012.54
Filbeck,G.,Webb,S.E.(2001).Informationasymmetries,managerialownership,andthe
impact of layoff announcements on shareholder wealth. Quarterly Journal ofBusinessandEconomics,40(2),31–47.
Financial Crisis Inquiry Commission. (2011). The financial crisis inquiry report: ThefinalreportoftheNationalCommissiononthecausesofthefinancialandeconomiccrisisintheUnitedStatesincludingdissentingviews.(D.Schechter,Ed.).NewYork:Cosimo,Inc.
FinancialTimes. (2018, February 25). Cyber attacks on financial services sector rise
295
fivefold in 2018. Retrieved 20 June 2019, from
https://www.ft.com/content/6a2d9d76-3692-11e9-bd3a-8b2a211d90d5
Finger,M.,Gavious,I.,Manos,R.(2018).Environmentalriskmanagementandfinancial
performance in the banking industry: A cross-country comparison. Journal ofInternationalFinancialMarkets,InstitutionsandMoney,52,240–261.
Firdous,S.,Farooqi,R.(2017).Impactofinternetbankingservicequalityoncustomer
satisfaction.TheJournalofInternetBankingandCommerce,22(1),1–17.Forbes.(2018).WhyHaveNetInterestMarginsTrendedLowerForSomeOfTheLargest
U.S. Banks? Retrieved 28 January 2020, from
https://www.forbes.com/sites/greatspeculations/2018/09/10/why-have-net-
interest-margins-trended-lower-for-some-of-the-largest-u-s-
banks/?sh=61218b2e6fcb
Forbes. (2019). 100 Stats On Digital Transformation And Customer Experience.
Retrieved 1 October 2020, from
https://www.forbes.com/sites/blakemorgan/2019/12/16/100-stats-on-digital-
transformation-and-customer-experience/#50236e053bf3
Fornell,C.,Ittner,C.D.,Larcker,D.F.(1996).Thevaluationconsequencesofcustomersatisfaction (National Quality Research CenterWorking Paper). Ann Arbor, MI:NationalQualityResearchCenter.
Fornell,C.,Johnson,M.D.,Anderson,E.W.,Cha,J.,Bryant,B.E.(1996).TheAmerican
customersatisfaction index:nature,purpose,and findings. JournalofMarketing,60(4),7–18.
Frame, W. S., White, L. J. (2014). Technological change, financial innovation, and
diffusioninbanking.InA.N.Berger,P.Molyneux,&J.O.S.Wilson(Eds.),TheOxfordHandbookofBanking(2nded.).Oxford:OxfordUniversityPress.
Francis, B. B., Hasan, I., Sun, X.,Waisman,M. (2014). Can firms learn by observing?
Evidencefromcross-borderM&As.JournalofCorporateFinance,25,202–215.FRED.(2020).NetInterestMarginforallU.S.Banks.Retrieved18January2021,from
https://fred.stlouisfed.org/series/USNIM/
Frederick,F.R.,Sasser,W.E.(1990).Zerodefections:qualitycomestoservices.HarvardBusinessReview,68(5),105–111.
Freeman, J., Carroll, G. R., Hannan, M. T. (1983). The liability of newness: Age
dependence in organizational death rates. American Sociological Review, 48(5),

296
692–710.
Freeman, R. N. (1987). The association between accounting earnings and security
returnsforlargeandsmallfirms.JournalofAccountingandEconomics,9(2),195–228.
Fung, T. K. F. (2008). Banking with a personalized touch: Examining the impact of
websitecustomizationoncommitment.JournalofElectronicCommerceResearch,9(4),296–309.
Furst, K., Lang, W. W., Nolle, D. E. (2000a). Internet banking: developments andprospects(EconomicandPolicyAnalysisWorkingPaperNo.2000–9).Washington,D.C:OfficeoftheComptrolleroftheCurrency.
Furst,K.,Lang,W.W.,Nolle,D.E.(2000b).SpecialStudiesonTechnologyandBanking.
QuarterlyJournal,19(2),29–48.Furst,K.,Lang,W.W.,Nolle,D.E.(2002).Internetbanking.JournalofFinancialServices
Research,22(1),95–117.Galbreath,J.(2005).Whichresourcesmatterthemosttofirmsuccess?Anexploratory
studyofresource-basedtheory.Technovation,25(9),979–987.Galetić,F.,Obradović,T.(2018).MeasuringConcentrationoftheBankingMarketofthe
Republic of Croatia. In 6th International OFEL Conference on Governance,Management and Entrepreneurship. New Business Models and InstitutionalEntrepreneurs: Leading Disruptive Change. April 13th-14th, 2018, Dubrovnik,Croatia (pp. 598–625). Zagreb: Governance Research and Development Centre(CIRU).
Galy,E.,Sauceda,M.J.(2014).Post-implementationpracticesofERPsystemsandtheir
relationshiptofinancialperformance.Information&Management,51(3),310–319.Gensler, S., Leeflang, P., Skiera,B. (2012). Impact of online channeluseon customer
revenues and costs to serve: Considering product portfolios and self-selection.
InternationalJournalofResearchinMarketing,29(2),192–201.Gerrard, P., Barton, C. J. (2003). The diffusion of internet banking among Singapore
consumers.InternationalJournalofBankMarketing,21(1),16–28.Gieskes,J.,Heijden,B.vander.(2004).Measuringandenablinglearningbehaviourin
productinnovationprocesses.CreativityandInnovationManagement,13(2),109–125.
Gilbert, E., Strugnell, D. (2010). Does survivorship bias really matter? An empirical
297
investigation into its effects on themean reversion of share returns on the JSE
(1984–2007).InvestmentAnalystsJournal,39(72),31–42.Goddard, J., McKillop, D., Wilson, J. O. S. (2008). The diversification and financial
performanceofUScreditunions.JournalofBanking&Finance,32(9),1836–1849.Goh, K. H., Kauffman, R. J. (2013). Firm strategy and the Internet in US commercial
banking.JournalofManagementInformationSystems,30(2),9–40.Goh, K. H., Kauffman, R. J. (2015). Investments in internet-based innovations for
financialservices:strategicadvantageorstrategicnecessity?InternationalJournalofBusinessExcellence,8(4),378–395.
Gómez-Herrera,E.(2013).Comparingalternativemethodstoestimategravitymodels
ofbilateraltrade.EmpiricalEconomics,44(3),1087–1111.Gordon, G. G., DiTomaso, N. (1992). Predicting corporate performance from
organizationalculture.JournalofManagementStudies,29(6),783–798.Grant, R. M. (1991a). Porter’s ‘competitive advantage of nations’: an assessment.
StrategicManagementJournal,12(7),535–548.Grant,R.M.(1991b).Theresource-basedtheoryofcompetitiveadvantage:implications
forstrategyformulation.CaliforniaManagementReview,33(3),114–135.Gregory,K.L.(1983).Native-viewparadigms:Multipleculturesandcultureconflictsin
organizations.AdministrativeScienceQuarterly,28(3),359–376.Grewal, R., Slotegraaf, R. J. (2007). Embeddedness of organizational capabilities.
DecisionSciences,38(3),451–488.Grover, V., Kohli, R. (2012). Cocreating IT value: New capabilities and metrics for
multifirmenvironments.MisQuarterly,36(1),225–232.Guiso,L., Jappelli,T.,Padula,M.,Pagano,M.(2004).Financialmarket integrationand
economicgrowthintheEU.EconomicPolicy,19(40),524–577.Gutu, L. M. (2014). The impact of internet technology on the Romanian banks
performance. In Proceedings of International Academic Conferences. Prague:InternationalInstituteofSocialandEconomicSciences.
Hackett, S., Parmanto, B. (2005). A longitudinal evaluation of accessibility: higher
educationweb sites. InternetResearch: ElectronicNetworkingApplications andPolicy,15(3),281–294.
Haleblian,J.,Kim,J.-Y.,Rajagopalan,N.(2006).Theinfluenceofacquisitionexperience
and performance on acquisition behaviour: Evidence from the US commercial

298
bankingindustry.AcademyofManagementJournal,49(2),357–370.Hall,R. (1992).The strategic analysis of intangible resources. StrategicManagement
Journal,13(2),135–144.Hall,R.(1993).Aframeworklinkingintangibleresourcesandcapabiliitestosustainable
competitiveadvantage.StrategicManagementJournal,14(8),607–618.Hallowell,R.(1996).Therelationshipsofcustomersatisfaction,customerloyalty,and
profitability: an empirical study. International Journal of Service IndustryManagement,7(4),27–42.
Hamel,G.,Prahalad,C.K.(1996).CompetingfortheFuture.Boston:HarvardBusinessPress.
Hamilton,J.,Rahman,S.,Lee,A.C.(2009).EVA:doessizematter?ReviewofPacificBasinFinancialMarketsandPolicies,12(02),267–287.
Hanafizadeh, P., Keating, B.W., Khedmatgozar, H. R. (2014). A systematic review of
Internetbankingadoption.TelematicsandInformatics,31(3),492–510.Haninun, H., Lindrianasari, L., Denziana, A. (2018). The effect of environmental
performance and disclosure on financial performance. International Journal ofTradeandGlobalMarkets,11(1–2),138–148.
Hannan,T.H.(1997).Marketshareinequality,thenumberofcompetitors,andtheHHI:
Anexaminationofbankpricing.ReviewofIndustrialOrganization,12(1),23–35.Hansen,G. S.,Wernerfelt,B. (1989).Determinantsof firmperformance:The relative
importanceofeconomicandorganizationalfactors.StrategicManagementJournal,10(5),399–411.
Harmanen,J.(2019).DigitalonlinestrategyforB2Binternationalizationamultiplecase-studyonmanufacturingSMEs(MasterDissertation).Espoo:AaltoUniversity.
Hart,S.L.(1995).Anatural-resource-basedviewofthefirm.AcademyofManagementReview,20(4),986–1014.
Harvey,D.(2016).Digitaltransformationinbanks:Thetrials,opportunitiesandaguide
towhatisimportant.JournalofDigitalBanking,1(2),136–145.Hasan,I.,Maccario,A.,Zazzara,C.(2002).DoInternetactivitiesaddvalue?TheItalian
bank experience (Consolidated and Bank Financial Statements and Auditor’sReport for the year ended). New York: Berkley Research Center, New York
University.
Haunschild, P. R. (1993). Interorganizational imitation: The impact of interlocks on

299
corporateacquisitionactivity.AdministrativeScienceQuarterly,38(4),564–592.He,D.,Ho,C.-Y.,Xu,L.(2020).Riskandreturnofonlinechanneladoptioninthebanking
industry.Pacific-BasinFinanceJournal,60,1–22.Healy,P.M.,Palepu,K.G.,Ruback,R.S.(1992).Doescorporateperformanceimprove
aftermergers?JournalofFinancialEconomics,31(2),135–175.Hege,U.,Hennessy,C.(2010).Acquisitionvaluesandoptimalfinancial(in)flexibility.
TheReviewofFinancialStudies,23(7),2865–2899.Hendricks,K.B.,Singhal,V.R.,Stratman,J.K.(2007).Theimpactofenterprisesystems
oncorporateperformance:AstudyofERP,SCM,andCRMsystemimplementations.
JournalofOperationsManagement,25(1),65–82.Herbig,P.(1996).Marketsignalling:areview.ManagementDecision,34(1),35–45.Hernando, I., Nieto, M. J. (2007). Is the Internet delivery channel changing banks’
performance? The case of Spanish banks. Journal of Banking & Finance, 31(4),1083–1099.
Heskett,J.L.,Jones,T.O.,Loveman,G.W.,Sasser,W.E.,Schlesinger,L.A.(1994).Putting
theservice-profitchaintowork.HarvardBusinessReview,72(2),164–174.Hess, T., Matt, C., Benlian, A.,Wiesböck, F. (2016). Options for formulating a digital
transformationstrategy.MISQuarterlyExecutive,15(2),123–139.Hill,C.W.L.,Rothaermel,F.T.(2003).Theperformanceofincumbentfirmsintheface
ofradicaltechnologicalinnovation.AcademyofManagementReview,28(2),257–274.
Hitt, L. M., Frei, F. X. (2002). Do better customers utilize electronic distribution
channels?ThecaseofPCbanking.ManagementScience,48(6),732–748.Hitt, L. M., Wu, D. J., Zhou, X. (2002). Investment in enterprise resource planning:
Business impactandproductivitymeasures. JournalofManagementInformationSystems,19(1),71–98.
Hoehle, H., Scornavacca, E., Huff, S. (2012). Three decades of research on consumer
adoption and utilization of electronic banking channels: A literature analysis.
DecisionSupportSystems,54(1),122–132.Holzmann,H.,Nejdl,W., Anand,A. (2016). TheDawnof today’s popular domains:A
study of the archived German Web over 18 years. In 2016 IEEE/ACM JointConferenceonDigitalLibraries(JCDL)(pp.73–82).Piscataway,NewJersey:IEEE.
Homburg,C.,Wielgos,D.,Kuehnl,C.(2019).DigitalBusinessCapabilityandItsEffecton
300
Firm Performance. In S. K. Lam, M. Giesler, & X. Luo (Eds.), UnderstandingComplexity,Transforming theMarketplace (pp. ICM–2).Austin,TX: Lam, SonK.Retrievedfromhttps://www.ama.org/wp-content/uploads/2019/02/2019-AMA-
Winter-Academic-Conference.pdf?rs=true&wid=
Hopkins,H.D.(1987).Long-termacquisitionstrategiesintheUSeconomy.JournalofManagement,13(3),557–572.
Hsu,L.-T., Jang,S. (2007).Thepostmerger financialperformanceofhotelcompanies.
JournalofHospitality&TourismResearch,31(4),471–485.Hsueh,J.-T.,Lin,N.-P.,Li,H.-C.(2010).Theeffectsofnetworkembeddednessonservice
innovationperformance.TheServiceIndustriesJournal,30(10),1723–1736.Huian,M.C.(2012).PostM&AaccountingperformanceofRomanianbanks.Journalof
EasternEuropeResearchinBusiness&Economics,IBIMAPublishing,2012,1–12.Hung,S.-Y.,Ku,C.-Y.,Chang,C.-M.(2003).CriticalfactorsofWAPservicesadoption:an
empiricalstudy.ElectronicCommerceResearchandApplications,2(1),42–60.Hunton, J.E.,Lippincott,B.,Reck, J.L. (2003).Enterprise resourceplanningsystems:
comparingfirmperformanceofadoptersandnonadopters.InternationalJournalofAccountingInformationSystems,4(3),165–184.
Ibbotson,R.G., Jaffe, J.F. (1975). “Hot issue”markets.The JournalofFinance,30(4),1027–1042.
Ibbotson, R. G., Sindelar, J. L., Ritter, J. R. (1988). Initial public offerings. Journal ofAppliedCorporateFinance,1(2),37–45.
IDG. (2018). StateofDigitalBusinessTransformation.Retrieved10December2019,
from https://resources.idg.com/download/white-paper/2018-digital-
business?hsCtaTracking=0e45fea0-22ec-40e4-9408-
ac5ce60e7d1d%7Ca4c6ab9d-9cf1-4ee6-bf66-398a5357d2ba
Igual, M. G., Santamaría, T. C. (2017). Overconfidence, loss aversion and irrational
investor behaviour: a conceptual map. Journal of Economic & ManagementPerspectives,11(1),273–290.
Ikenberry, D., Lakonishok, J., Vermaelen, T. (1995). Market underreaction to open
marketsharerepurchases.JournalofFinancialEconomics,39(2–3),181–208.Ikenberry,D.,Rankine,G.,Stice,E.(1996).Whatdostocksplitsreallysignal?Journalof
FinancialandQuantitativeAnalysis,31(3),357–375.Im,K.S.,Dow,K.E.,Grover,V.(2001).AreexaminationofITinvestmentandthemarket
301
value of the firm—Anevent studymethodology. Information SystemsResearch,12(1),103–117.
Itami, H., Roehl, T. W. (1991). Mobilizing invisible assets (1st ed.). Cambridge,MassachusettsandLondon,England:HarvardUniversityPress.
Jahangir,N.,Begum,N.(2008).Theroleofperceivedusefulness,perceivedeaseofuse,
securityandprivacy,andcustomerattitudetoengendercustomeradaptationinthe
contextofelectronicbanking.AfricanJournalofBusinessManagement,2(2),32–40.
Jalal, S. K. (2019). Exploring Web Link Analysis of Websites of Indian Institute of
Technology.DESIDOCJournalofLibrary&InformationTechnology,39(1),3–9.Jansen,J.J.P.,VanDenBosch,F.A.J.,Volberda,H.W.(2006).Exploratoryinnovation,
exploitative innovation, and performance: Effects of organizational antecedents
andenvironmentalmoderators.ManagementScience,52(11),1661–1674.Jarvenpaa,S.L.,Todd,P.A.(1996).Consumerreactionstoelectronicshoppingonthe
WorldWideWeb.InternationalJournalofElectronicCommerce,1(2),59–88.Jegadeesh,N.(2000).Long-termperformanceofseasonedequityofferings:Benchmark
errorsandbiasesinexpectations.FinancialManagement,29(3),5–30.Ji, P., Yan, X., Shi, Y. (2021). Information technology investment and innovation
performance:doesinvestmentparadoxexist?JournalofAsiaBusinessStudies.Jin, Z.,Navare, J., Lynch,R. (2019).The relationshipbetween innovation culture and
innovationoutcomes:exploring theeffectsof sustainabilityorientationand firm
size.R&DManagement,49(4),607–623.Johannessen,J.-A.,Olaisen,J.,Olsen,B.(2001).Mismanagementoftacitknowledge:the
importanceoftacitknowledge,thedangerofinformationtechnology,andwhatto
doaboutit.InternationalJournalofInformationManagement,21(1),3–20.Johnson,M.D.,Nader,G.,Fornell,C.(1996).Expectations,perceivedperformance,and
customer satisfaction for a complex service: The case of bank loans. Journal ofEconomicPsychology,17(2),163–182.
Johnson,W.B.,Natarajan,A.,Rappaport,A.(1985).Shareholderreturnsandcorporate
excellence.JournalofBusinessStrategy,6(2),52–62.Jones,K.D.,Critchfield,T.(2005).ConsolidationintheUSbankingindustry:isthelong,
strangetripabouttoend.FDICBankingRev.,17(4),31–61.JuniperResearch.(2020).DigitalBankingUserstoExceed3.6BillionGloballyby2024,

302
as Digital-Only Banks Catalyse Market. Retrieved 1 October 2020, from
https://www.juniperresearch.com/press/press-releases/digital-banking-users-
to-exceed-3-6-billion
Kadiyala, P., Rau, P.R. (2004). Investor reaction to corporate event announcements:
underreactionoroverreaction?TheJournalofBusiness,77(2),357–386.Kalyanaram,G.,Urban,G.L. (1992).Dynamiceffectsof theorderofentryonmarket
share,trialpenetration,andrepeatpurchasesforfrequentlypurchasedconsumer
goods.MarketingScience,11(3),235–250.Kannan,K.,Rees,J.,Sridhar,S.(2007).Marketreactionstoinformationsecuritybreach
announcements: An empirical analysis. International Journal of ElectronicCommerce,12(1),69–91.
Karlberg,L.,Åkesson, J.(2015).TradeFacilitation:BringingKazakhstanClosertothe
EU.Lund:DepartmentofEconomics-LundUniversity.
Kassim, N. M., Ramayah, T. (2015). Perceived risk factors influence on intention to
continueusingInternetbankingamongMalaysians.GlobalBusinessReview,16(3),393–414.
Keim, D. B. (1983). Size-related anomalies and stock return seasonality: Further
empiricalevidence.JournalofFinancialEconomics,12(1),13–32.Keisidou, E., Sarigiannidis, L., Maditinos, D. I., Thalassinos, E. I. (2013). Customer
satisfaction, loyalty and financial performance:A holistic approach of theGreek
bankingsector.InternationalJournalofBankMarketing,31(4),259–288.Kelly,G.(2014).Thedigitalrevolutioninbanking(1sted.).Washington,D.C.:Groupof
Thirty.
Kerin, R. A., Varadarajan, P. R., Peterson, R. A. (1992). First-mover advantage: A
synthesis,conceptualframework,andresearchpropositions.JournalofMarketing,56(4),33–52.
Ketchen, J. D. J., Ireland, R. D., Snow, C. C. (2007). Strategic entrepreneurship,
collaborativeinnovation,andwealthcreation.StrategicEntrepreneurshipJournal,1(3-4),371–385.
Kilenthong,P.,Hultman,C.M.,Hills,G.E.(2016).Entrepreneurialmarketingbehaviours:
impactoffirmage,firmsizeandfirm’sfounder.JournalofResearchinMarketingandEntrepreneurship,18(1),127–145.
Kim,T.H.,Wimble,M.,Sambamurthy,V.(2017).DisaggregationoftheITcapitaleffects
303
on firmperformance:Empiricalevidence froman ITassetportfolioperspective.
EuropeanJournalofInformationSystems,1–23.King,M. R.,Massoud,N., Song, K. (2016).WhoBenefits fromBankTradingActivity:
Shareholders or Employees? The SRRN. Retrieved from
https://papers.ssrn.com/sol3/papers.cfm?abstract_id=2264344
Klapper, L. F., Love, I. (2004). Corporate governance, investor protection, and
performanceinemergingmarkets.JournalofCorporateFinance,10(5),703–728.Kocmanová, A., Hřebíček, J., Dočekalová, M. (2011). Corporate Governance and
Sustainability.Economics&Management,16,543–550.Koellinger, P. (2008). The relationship between technology, innovation, and firm
performance—Empirical evidence from e-business in Europe. Research Policy,37(8),1317–1328.https://doi.org/https://doi.org/10.1016/j.respol.2008.04.024
Koford,K.(2009).TheDigitizationoftheShikshapatri(OxfordSeminar).Retrievedfromhttps://ils.unc.edu/~wildem/Oxford_Seminar_2009/Koford.pdf
Kogut,B.,Zander,U.(1992).Knowledgeofthefirm,combinativecapabilities,andthe
replicationoftechnology.OrganizationScience,3(3),383–397.Kohli,R.,Devaraj,S.(2003).Measuringinformationtechnologypayoff:Ameta-analysis
of structural variables in firm-level empirical research. Information SystemsResearch,14(2),127–145.
Kolari,J.W.,Pynnonen,S.,Tuncez,A.M.(2021).Furtherevidenceonlong-runabnormal
returnsaftercorporateevents.TheQuarterlyReviewofEconomicsandFinance,81,421–439.
Konchitchki,Y.,O’Leary,D.E.(2011).Eventstudymethodologiesininformationsystems
research.InternationalJournalofAccountingInformationSystems,12(2),99–115.Kothari,S.P.,Warner,J.(2007).Econometricsofeventstudies.HandbookofEmpirical
CorporateFinance,1,3–36.Kowalik,M.,Davig,T.,Morris,C.S.,Regehr,K.(2015).Bankconsolidationandmerger
activityfollowingthecrisis.FederalReserveBankofKansasCityEconomicReview,100(1),31–49.
Kraft, R., Hastor, E., Stata, R. (2003). TimeLinks: Exploring the link structure of the
evolvingWeb.InWAW2003SecondWorkshoponAlgorithmsandModelsfortheWeb-Graph.Citeseer.
Krishanan, D., Khin, A. A., Teng, K. L. L., Chinna, K. (2016). Consumers’ perceived
304
interactivity& intention tousemobilebanking in structural equationmodeling.
InternationalReviewofManagementandMarketing,6(4),883–890.Krishnamurthy, S., Spindt, P., Subramaniam, V., Woidtke, T. (2005). Does investor
identity matter in equity issues? Evidence from private placements. Journal ofFinancialIntermediation,14(2),210–238.
Kritzman, M. P. (1994). What practitioners need to know… about event studies.
FinancialAnalystsJournal,50(6),17–20.Kuisma,T.,Laukkanen,T.,Hiltunen,M.(2007).Mappingthereasonsforresistanceto
Internet banking: A means-end approach. International Journal of InformationManagement,27(2),75–85.
Kunc, M. H., Morecroft, J. D. W. (2010). Managerial decision making and firm
performance under a resource-based paradigm. Strategic Management Journal,31(11),1164–1182.
Laforet,S.,Li,X. (2005).Consumers’attitudes towardsonlineandmobilebanking in
China.InternationalJournalofBankMarketing,23(5),362–380.Lahouel,B.Ben,Gaies,B.,Zaied,Y.Ben,Jahmane,A.(2019).Accountingforendogeneity
and the dynamics of corporate social–corporate financial performance
relationship.JournalofCleanerProduction,230,352–364.Lakonishok, J.,Vermaelen,T. (1990).Anomalouspricebehaviouraround repurchase
tenderoffers.TheJournalofFinance,45(2),455–477.Leary,M.T.,Roberts,M.R.(2014).Dopeerfirmsaffectcorporatefinancialpolicy?The
JournalofFinance,69(1),139–178.Lee,H.,Smith,K.G.,Grimm,C.M.,Schomburg,A.(2000).Timing,orderanddurabilityof
newproductadvantageswithimitation.StrategicManagementJournal,21(1),23–30.
Lee,I.H.(1998).Marketcrashesandinformationalavalanches.TheReviewofEconomicStudies,65(4),741–759.
Lee,M.-C.(2009).Factorsinfluencingtheadoptionofinternetbanking:Anintegration
ofTAMandTPBwithperceivedriskandperceivedbenefit.ElectronicCommerceResearchandApplications,8(3),130–141.
Lee,P.M.(2001).What’sinaname.com?:Theeffectsof‘.com’namechangesonstock
pricesandtradingactivity.StrategicManagementJournal,22(8),793–804.Lepetit, L., Nys, E., Rous, P., Tarazi, A. (2008). Bank income structure and risk: An
305
empiricalanalysisofEuropeanbanks.JournalofBanking&Finance,32(8),1452–1467.
Lessambo,F.I.(2018).Auditing,AssuranceServices,andForensics:AComprehensiveApproach.NewBritian,CT,USA:Springer.
Levin,S.G.,Levin,S.L.,Meisel,J.B.(1992).Marketstructure,uncertainty,andintrafirm
diffusion:Thecaseofopticalscannersingrocerystores.TheReviewofEconomicsandStatistics,74(2),345–350.
Levinthal, D. A., March, J. G. (1993). Themyopia of learning. Strategic ManagementJournal,14(S2),95–112.
Levis, M. (1993). The long-run performance of initial public offerings: The UK
experience1980-1988.FinancialManagement,22(1),28–41.Li,Y.,Huang,J.(2012).RiskandreturnofITinvestment:evidencefromSCMandCRM
announcements. International Journal of Networking and Virtual Organisations,11(3/4),290–304.
Liang,Q.,Miao,J.,Li,D.,Chen,Z.(2021).DoeslearningbyobservingmatterforM&As?
Internationalevidencefromtheinsuranceindustry.SpanishJournalofFinanceandAccounting,50(2),162–186.
Lieberman, M. B. (1987). The learning curve, diffusion, and competitive strategy.
StrategicManagementJournal,8(5),441–452.Lieberman,M.B.(2005).Didfirst-moveradvantagesurvivethedot-comcrash(Working
Paper).LosAngeles,CA:AndersonSchoolofManagement,UCLA.
Lieberman, M. B., Montgomery, D. B. (1988). First-mover advantages. StrategicManagementJournal,9(S1),41–58.
Lilien,G.L.,Yoon,E.(1990).Thetimingofcompetitivemarketentry:Anexploratory
studyofnewindustrialproducts.ManagementScience,36(5),568–585.Lin,B.-W.(2007).Informationtechnologycapabilityandvaluecreation:Evidencefrom
theUSbankingindustry.TechnologyinSociety,29(1),93–106.Lin,M.,Lucas,H.C.,Bailey,J.(2011). ’Banking’ontheInternet:DoesInternetBanking
ReallyImproveBankPerformance?Tucson:UniversityofArizona.Lin,Q.(2018).DoWelfareDistributionMethodsChangingfromCashPaymenttoDigital
Transfer Influence Drug Abuse Problem? Retrieved 20 June 2021, from
http://giovanniperi.ucdavis.edu/uploads/5/6/8/2/56826033/qiuyun_final_pape
r.pdf
306
Lin, T.-Y., Yu, J., Lin, C.-Y. (2021). IPO’s Long-Run Performance: Hot Market versus
EarningsManagement.JournalofRiskandFinancialManagement,14(3),132.Lippman, S. A., Rumelt, R. P. (1982). Uncertain imitability: An analysis of interfirm
differencesinefficiencyundercompetition.TheBellJournalofEconomics,13(2),418–438.
Liu,B.,Shilling, J.D.,Sing,T.F.(2020).Largebanksandefficientbanks:howdothey
influence credit supply and default risk? Journal of Financial ServicesResearch,57(1),1–28.
Liu,D.Y.,Chen,S.W.,Chou,T.C.(2011).Resourcefitindigitaltransformation:Lessons
learnedfromtheCBCBankglobale-bankingproject.ManagementDecision,49(10),1728–1742.https://doi.org/10.1108/00251741111183852
Liu,W.,Kolari,J.W.,Tippens,T.K.,Fraser,D.R.(2013).Didcapitalinfusionsenhance
bank recovery from the great recession? Journal of Banking& Finance, 37(12),5048–5061.
Llorente,G.,Michaely,R.,Saar,G.,Wang,J.(2002).Dynamicvolume-returnrelationof
individualstocks.TheReviewofFinancialStudies,15(4),1005–1047.Loh, L., Venkatraman, N. (1992). Stock market reaction to information technology
outsourcing:Aneventstudy(WorkingPaperNo.3499–92BPS).Cambridge,Mass:SchoolofManagement.
López, L. E., Roberts, E. B. (2002). First-mover advantages in regimes of weak
appropriability: the case of financial services innovations. Journal of BusinessResearch,55(12),997–1005.
Loughran, T. (1993). NYSE vs NASDAQ returns: Market microstructure or the poor
performanceofinitialpublicofferings?JournalofFinancialEconomics,33(2),241–260.
Loughran,T.,Ritter,J.(1995).Thenewissuespuzzle.TheJournalofFinance,50(1),23–51.
Lu,Y.,Yang,S.,Chau,P.Y.K.,Cao,Y.(2011).Dynamicsbetweenthetrusttransferprocess
and intentiontousemobilepaymentservices:Across-environmentperspective.
Information&Management,48(8),393–403.Lubatkin, M., Shrieves, R. E. (1986). Towards reconciliation of market performance
measures to strategic management research. Academy of Management Review,11(3),497–512.

307
Lunardi,G.L.,Becker,J.L.,Maçada,A.C.G.,Dolci,P.C.(2014).TheimpactofadoptingIT
governanceonfinancialperformance:AnempiricalanalysisamongBrazilianfirms.
InternationalJournalofAccountingInformationSystems,15(1),66–81.Lüneborg,J.L.,Nielsen,J.F.(2003).Customer-focusedtechnologyandperformancein
smallandlargebanks.EuropeanManagementJournal,21(2),258–269.Luo, Y. (2005). Do insiders learn from outsiders? Evidence from mergers and
acquisitions.TheJournalofFinance,60(4),1951–1982.MacKinlay,A.C.(1997).Eventstudiesineconomicsandfinance.JournalofEconomic
Literature,35(1),13–39.MacPherson, A. D. (1998). Academic-industry linkages and small firm innovation:
evidence from the scientific instruments sector. Entrepreneurship & RegionalDevelopment,10(4),261–276.
Mahajan,V.,Srinivasan,R.,Wind,J.(2002).Thedot.comretailfailuresof2000:were
thereanywinners?JournaloftheAcademyofMarketingScience,30(4),474–486.Malkiel,B.G.(1989).Efficientmarkethypothesis.InJ.Eatwell,M.Milgate,&P.Newman
(Eds.),Finance(1sted.,pp.127–134).London:PalgraveMacmillan.Malkiel,B.G.(2003).Theefficientmarkethypothesisanditscritics.JournalofEconomic
Perspectives,17(1),59–82.Malmendier,U.,Moretti,E.,Peters,F.S.(2018).Winningbylosing:evidenceonthelong-
runeffectsofmergers.TheReviewofFinancialStudies,31(8),3212–3264.Mann, B. J. S., Sahni, S. K. (2011). Inter-relationship of web site interactivity and
customeroutcomes:Buildingtrust in Internetbankingwebsite.GlobalBusinessReview,12(1),99–115.
Mannering, F. L., Shankar, V., Bhat, C. R. (2016). Unobserved heterogeneity and the
statistical analysis of highway accident data. Analytic Methods in AccidentResearch,11,1–16.https://doi.org/https://doi.org/10.1016/j.amar.2016.04.001
Mascarenhas, B. (1992a). Order of entry and performance in internationalmarkets.
StrategicManagementJournal,13(7),499–510.Mascarenhas, B. (1992b). Research notes and communications first-mover effects in
multipledynamicmarkets.StrategicManagementJournal,13(3),237–243.Masli,A.,Richardson,V.J.,Sanchez,J.M.,Smith,R.E.(2011).ReturnstoITexcellence:
Evidence from financial performance around information technology excellence
awards.InternationalJournalofAccountingInformationSystems,12(3),189–205.
308
Mat-Nor,F.,Said,R.M.,Hisham,M.(2006).Financialperformanceandefficiencychanges
ofMalaysian banking institutions inmergers and acquisitions. Banks and BankSystems,1(1),102–108.
Mayur,M. (2018). Investor sentiment and IPOpricing:Market: Evidence from India.
Corp.Ownersh.Control,15,64–72.Mbama, C. I., Ezepue, P. O. (2018). Digital banking, customer experience and bank
financialperformance:UKcustomers’perceptions. International JournalofBankMarketing,36(2),230–255.
McAlister,L.,Sonnier,G.,Shively,T.(2012).Therelationshipbetweenonlinechatterand
firmvalue.MarketingLetters,23(1),1–12.MCKinsey.(2019).RealizingM&AvaluecreationinUSbankingandfintech:Ninesteps
for success. Retrieved 20 September 2021, from
https://www.mckinsey.com/industries/financial-services/our-insights/banking-
matters/realizing-m-and-a-value-creation-in-us-banking-and-fintech-nine-steps-
for-success
McWilliams,A.,Siegel,D.(1997).EventStudiesinManagementResearch:Theoretical
and Empirical Issues. The Academy of Management Journal, 40(3), 626–657.https://doi.org/10.2307/257056
McWilliams, A., Siegel, D. (2000). Corporate social responsibility and financial
performance: correlation or misspecification? Strategic Management Journal,21(5),603–609.
Mei, B., Sun, C. (2007). Impact of mergers and acquisitions on the forest products
industry:aneventstudyofstockmarketreturns.InD.G.Hodges(Ed.),EmergingIssuesinForestEconomics(pp.1–10).Knoxville,TN:TheUniversityofTennessee,NaturalResourcePolicyCenter.
Melville, N., Kraemer, K., Gurbaxani, V. (2004). Information technology and
organizational performance: An integrative model of IT business value. MISQuarterly,28(2),283–322.
Mendenhall,S.(2019).FinancialCompetitionandRegulationsincetheGreatRecession(PhDThesis).Virginia:GeorgeMasonUniversity.
Meng,Z.,Lee,S.-Y.T.(2007).ThevalueofITtofirmsinadevelopingcountryinthecatch-
up process: An empirical comparison of China and the United States. DecisionSupportSystems,43(3),737–745.

309
Meziou,F. (1991).Areasof strengthandweakness in theadoptionof themarketing
concept by small manufacturing firms. Journal of Small Business Management,29(4),72–78.
Miner, A. S., Mezias, S. J. (1996). Ugly duckling no more: Pasts and futures of
organizationallearningresearch.OrganizationScience,7(1),88–99.Mishra,D.P.,Bhabra,H.S.(2001).Assessingtheeconomicworthofnewproductpre-
announcementsignals:Theoryandempiricalevidence.JournalofProduct&BrandManagement.
Mitchell,M. L., Stafford, E. (2000).Managerial Decisions and Long-Term Stock Price
Performance. The Journal of Business, 73(3), 287–329.
https://doi.org/10.1086/209645
Moatti,V.(2009).Learningtoexpandorexpandingtolearn?Theroleofimitationand
experienceinthechoiceamongseveralexpansionmodes.EuropeanManagementJournal,27(1),36–46.
Mols,N.P.(1998).TheInternetandthebanks’strategicdistributionchanneldecisions.
InternetResearch,8(4),331–337.Momparler, A., Lassala, C., Ribeiro, D. (2013). Efficiency in banking services: a
comparativeanalysisofInternet-primaryandbranchingbanksintheUS.ServiceBusiness,7(4),641–663.
Morris,J.J.(2011).Measuringtheimpactofenterpriseresourceplanning(ERP)systems
onshareholdervalue.ReviewofBusinessInformationSystems(RBIS),15(1),31–40.
Moser, C., Saidi, F.,Wirth, B. (2018). The effects of credit supply onwage inequality
between and within firms. Retrieved 10 May 2021, from
https://www.cbs.dk/files/cbs.dk/paper_farzad_saidi_0.pdf
Müller,O.,Fay,M.,VomBrocke,J.(2018).Theeffectofbigdataandanalyticsonfirm
performance: An econometric analysis considering industry characteristics.
JournalofManagementInformationSystems,35(2),488–509.Munoz-Leiva, F., Climent-Climent, S., Liébana-Cabanillas, F. (2017). Determinants of
intentiontousethemobilebankingapps:AnextensionoftheclassicTAMmodel.
SpanishJournalofMarketing-ESIC,21(1),25–38.Nadler,D.A.,Tushman,M.L.(1980).Amodelfordiagnosingorganizationalbehaviour.
OrganizationalDynamics,9(2),35–51.
310
Nadler,D.A.,Tushman,M.L.(1997).Competingbydesign:Thepoweroforganizationalarchitecture.NewYorkandOxford:OxfordUniversityPress.
Naldi, L., Davidsson, P. (2014). Entrepreneurial growth: The role of international
knowledgeacquisitionasmoderatedby firmage. JournalofBusinessVenturing,29(5),687–703.
Nam,H.-J.,An,Y.(2018).Theeffectofinterlockingdirectorsnetworkonfirmvalueand
performance:evidencefromKorean-listedfirms.GlobalEconomicReview,47(2),151–173.
Nath,R.,Schrick,P.,Parzinger,M.(2001).Bankers’perspectivesonInternetbanking.E-Service,1(1),21–36.
National Quality Research Center, University of Michigan, B. S., American Society.
(1995). The American customer satisfaction index (ACSI) methodology report.Milwaukee,WI:AmericanSocietyforQualityControl.
Nätti,S.,Lähteenmäki,I.(2016).TheevolutionofmarketorientationinFinnishretail
banking–fromregulationtovaluecreation.Management&OrganizationalHistory,11(1),28–47.
Neill,J.D.,Pfeiffer,G.M.,Young-Ybarra,C.E.(2001).TechnologyR&Dalliancesandfirm
value.TheJournalofHighTechnologyManagementResearch,12(2),227–237.Neill, S., McKee, D., Rose, G. M. (2007). Developing the organization’s sensemaking
capability: Precursor to an adaptive strategic marketing response. IndustrialMarketing Management, 36(6), 731–744.
https://doi.org/https://doi.org/10.1016/j.indmarman.2006.05.008
Ngai,E.W.T.,Chau,D.C.K.,Chan,T.L.A.(2011).Informationtechnology,operational,
andmanagementcompetenciesforsupplychainagility:Findingsfromcasestudies.
TheJournalofStrategicInformationSystems,20(3),232–249.Nicolaou,A.I.(2004).Firmperformanceeffectsinrelationtotheimplementationand
use of enterprise resource planning systems. Journal of Information Systems,18(2),79–105.
Nielsen,B.B.(2005).Theroleofknowledgeembeddednessinthecreationofsynergies
instrategicalliances.JournalofBusinessResearch,58(9),1194–1204.Nirala, C., Pandey, S. B. B. (2015). Customer Perception on Mobile-Banking in
Chhattisgarh. International Journal of Engineering and Management Research(IJEMR),5(2),729–737.
311
Nonaka, I., Takeuchi, H. (1995). The knowledge-creating company: How Japanesecompaniescreatethedynamicsofinnovation.NewYork:Oxforduniversitypress.
Nooteboom,B. (1994). Innovationanddiffusion in small firms: theoryandevidence.
SmallBusinessEconomics,6(5),327–347.Nooteboom,B.,Vanhaverbeke,W.,Duysters,G.,Gilsing,V.A.,vandenOord,A.(2006).
Optimalcognitivedistanceandabsorptivecapacity.ResearchPolicy,36(7),1016–1034.
Nor,M.K.,Pearson,J.M.,Ahmad,A.(2010).Adoptionofinternetbankingtheoryofthe
diffusionofinnovation.InternationalJournalofManagementStudies(IJMS),17(1),69–85.
Nordhaug, O. (1993). Human capital in organizations: Competence, training, andlearning.Oslo/London:ScandanavianUniversityPress/OxfordUniversityPress.
O’Cass, A., Heirati, N., Ngo, L. V. (2014). Achieving new product success via the
synchronization of exploration and exploitation across multiple levels and
functionalareas.IndustrialMarketingManagement,43(5),862–872.OCC.(2000).SummaryResultsofOCC’sInternetBankingQuestionnaire.Retrievedfrom
https://www.occ.treas.gov/news-issuances/news-releases/2000/nr-occ-2000-
84a.pdf
OCC. (2001). Interpretive Letter #928. Washington, D.C. Retrieved from
https://www.occ.gov/topics/charters-and-licensing/interpretations-and-
actions/2002/int928.pdf
OCC. (2019). Licensing Manual: Charters. Retrieved from
https://www.occ.gov/publications-and-resources/publications/comptrollers-
licensing-manual/files/licensing-booklet-charters.html
Ofek,E.,Richardson,M.(2003).Dotcommania:Theriseandfallofinternetstockprices.
TheJournalofFinance,58(3),1113–1137.Ofek, E., Sarvary, M. (2001). Leveraging the customer base: Creating competitive
advantagethroughknowledgemanagement.ManagementScience,47(11),1441–1456.
Oh, L.-B., Leong, Y.-X., Teo, H.-H. (2007). A model of IT-enabled organizational
integrationandsustainedcompetitiveadvantage.InBLED2007Proceedings(pp.838–851).
Olavarrieta, S., Friedmann, R. (1999). Market-oriented culture, knowledge-related
312
resources,reputationalassetsandsuperiorperformance:aconceptualframework.
JournalofStrategicMarketing,7(4),215–228.Oliveira,D.D. L., Lipke, F.A., Silva, S. R. F. (2016). Internet banking capabilities and
performance of small business: The IT business value from the perspective of
externalcapabilities.BASERevistadeAdministracaoeContabilidadeDaUNISINOS,13(4),265–278.
Oliveira, P., Roth, A. V, Gilland, W. (2002). Achieving competitive capabilities in e-
services.TechnologicalForecastingandSocialChange,69(7),721–739.Oliveira,T.,Martins,M.F.(2011).Literaturereviewofinformationtechnologyadoption
modelsatfirmlevel.ElectronicJournalofInformationSystemsEvaluation,14(1),110–121.
Otchere, I. (2005).Doprivatizedbanks inmiddle-and low-incomecountriesperform
betterthanrivalbanks?Anintra-industryanalysisofbankprivatization.JournalofBanking&Finance,29(8–9),2067–2093.
Ouchi, W. G., Cuchi, W. G. (1981). Theory Z: How American business can meet theJapanesechallenge(Vol.13).Reading,MA:Addison-Wesley.
Pagani,M. (2013).Digitalbusinessstrategyandvaluecreation: framing thedynamic
cycleofcontrolpoints.MisQuarterly,37(2),617–632.Parida,V.,Örtqvist,D.(2015).InteractiveEffectsofNetworkCapability,ICTCapability,
and Financial Slack on Technology-Based Small Firm Innovation Performance.
Journal of Small Business Management, 53(1), 278–298.
https://doi.org/10.1111/jsbm.12191
Park,N.K.,Mezias,J.M.(2005).Beforeandafterthetechnologysectorcrash:Theeffect
ofenvironmentalmunificenceonstockmarketresponsetoalliancesofe-commerce
firms.StrategicManagementJournal,26(11),987–1007.Peak,D.A.,Windsor, J. C., James,C. (2002).Risks andeffectsof IS/IToutsourcing: a
securities market assessment. Journal of Information Technology Case andApplicationResearch,4(1),6–33.
Penrose,E. (1955).Limits to theGrowthandSizeofFirms.TheAmericanEconomicReview,45(2),531–543.
Penrose, E. (2009). The Theory of the Growth of the Firm (4th ed.). Oxford: Oxforduniversitypress.
Peter, J. P., Ryan,M. J. (1976). An investigation of perceived risk at the brand level.

313
JournalofMarketingResearch,13(2),184–188.Peteraf, M. A. (1993). The cornerstones of competitive advantage: a resource-based
view.StrategicManagementJournal,14(3),179–191.Peters, T. J.,Waterman, R.H., Jones, I. (1982). In search of excellence: Lessons from
America’sbest-runcompanies.NewYork:Harper&Row.Petersen, M. A., Rajan, R. G. (2002). Does distance still matter? The information
revolutioninsmallbusinesslending.TheJournalofFinance,57(6),2533–2570.Pigni,F.,Ravarini,A.,Tagliavini,M.,Vitari,C.(2002).Bankstrategiesandtheinternet:
aninterpretationofthebankingindustrybasedontheItalianretailmarket.JournalofInformationTechnologyCaseandApplicationResearch,4(3),8–37.
Pikkarainen,T.,Pikkarainen,K.,Karjaluoto,H.,Pahnila,S.(2004).Consumeracceptance
of online banking: an extension of the technology acceptance model. InternetResearch,14(3),224–235.
Polanyi,M.(1966).Thetacitdimension.London:Routledge&KeganPaul.Poletti,M., Ling, H., Brian, E. (2008). An Empirical Study of LaunchOrder Valuation
BaseduponStockMarketReaction.MarketingManagementJournal,18(1),1–13.Popa, S., Soto-Acosta, P., Perez-Gonzalez, D. (2018). An investigation of the effect of
electronic business on financial performance of Spanish manufacturing SMEs.
TechnologicalForecastingandSocialChange,136,355–362.Porter, M. E. (1981). The contributions of industrial organization to strategic
management.AcademyofManagementReview,6(4),609–620.Porter, M. E. (1990). Why are firms successful. In Fundamental Issues in Strategy
Conference.Napa,CA.Powell,T.C.,Dent-Micallef,A.(1997).Informationtechnologyascompetitiveadvantage:
The role of human, business, and technology resources. Strategic ManagementJournal,18(5),375–405.
Prahalad,C.K.,Hamel,G.(1997).Thecorecompetenceofthecorporation.InD.Hahn&
B. Taylor (Eds.), Strategische Unternehmungsplanung (pp. 969–987). Berlin,Heidelberg:Springer.
Premkumar, G. (2003). A meta-analysis of research on information technology
implementation in small business. Journal of Organizational Computing andElectronicCommerce,13(2),91–121.
Püschel, J., Afonso Mazzon, J., Mauro C. Hernandez, J. (2010). Mobile banking:
314
propositionofanintegratedadoptionintentionframework.InternationalJournalofBankMarketing,28(5),389–409.
Putri, W. H., Nurwiyanta, N., Sungkono, S., Wahyuningsih, T. (2019). The emerging
fintech and financial slack on corporate financial performance. InvestmentManagement&FinancialInnovations,16(2),348–354.
Quah,P.,Young,S.(2005).Post-acquisitionManagement::APhasesApproachforCross-
borderM&As.EuropeanManagementJournal,23(1),65–75.Rai,A.,Patnayakuni,R.,Seth,N.(2006).Firmperformanceimpactsofdigitallyenabled
supplychainintegrationcapabilities.MISQuarterly,30(2),225–246.Rajan,R.,Servaes,H.(1997).Analystfollowingofinitialpublicofferings.TheJournalof
Finance,52(2),507–529.Rakowski,D.,Shirley,S.E.,Stark,J.R.(2021).Twitteractivity,investorattention,and
thediffusionofinformation.FinancialManagement,50(1),3–46.Rappaport,A.(1999).Creatingshareholdervalue:aguideformanagersandinvestors.
NewYork:TheFreePress.
Reed,R.,DeFillippi,R.J.(1990).Causalambiguity,barrierstoimitation,andsustainable
competitiveadvantage.AcademyofManagementReview,15(1),88–102.Regehr,K.,Sengupta,R.(2016).Hastherelationshipbetweenbanksizeandprofitability
changed?EconomicReview,101(2),49–72.Reibstein,D.J.(2002).Whatattractscustomerstoonlinestores,andwhatkeepsthem
comingback?JournaloftheAcademyofMarketingScience,30(4),465–473.Reichheld,F.F.,Sasser,W.E.(1990).Zerodefeofions:Quoliiycomestoservices.Harvard
BusinessReview,68(5),105–111.Reimann, B. C. (1987). Stock Price and Business Success: What is the relationship?
JournalofBusinessStrategy,8,38–49.Reinganum,M.R.(1981).Misspecificationofcapitalassetpricing:Empiricalanomalies
basedonearnings’yieldsandmarketvalues.JournalofFinancialEconomics,9(1),19–46.
Reinganum,M. R. (1983). The anomalous stockmarket behaviour of small firms in
January:Empiricaltestsfortax-losssellingeffects.JournalofFinancialEconomics,12(1),89–104.
Reinganum,M.R.,Smith,J.K.(1983).Investorpreferenceforlargefirms:newevidence
oneconomiesofsize.TheJournalofIndustrialEconomics,32(2),213–227.

315
Rhoades,S.A.(2000).BankmergersandbankingstructureintheUnitedStates,1980-98(StaffStudy174).Washington,DC:BoardofGovernorsoftheFederalReserveSystem(US).
Rhyne, L. C. (1986). The relationship of strategic planning to financial performance.
StrategicManagementJournal,7(5),423–436.Riedl, C., Seidel, V. P. (2018). Learning from mixed signals in online innovation
communities.OrganizationScience,29(6),1010–1032.Ritter,J.R.(1984).The"hotissue"marketof1980.JournalofBusiness,57(2),215–240.Ritter,J.R.(1991).Thelong-runperformanceofinitialpublicofferings.TheJournalof
Finance,46(1),3–27.Riziki,M. (2015). Bank Charges and Performance of Commercial Banks in Tanzania
(UniversityofDaresSalaamBusinessSchoolWorkingPaper).
Roberts,M.R.,Whited,T.M.(2013).Endogeneityinempiricalcorporatefinance.InG.
Constantinides,R.Stulz,&M.Harris(Eds.),HandbookoftheEconomicsofFinance(Vol.2,pp.493–572).Amsterdam:Elsevier.
Rohleder, M., Scholz, H., Wilkens, M. (2011). Survivorship bias and mutual fund
performance: Relevance, significance, and methodical differences. Review ofFinance,15(2),441–474.
Roll, R. (1983).On computingmean returns and the small firmpremium. Journal ofFinancialEconomics,12(3),371–386.
Rosati,P.,Cummins,M.,Deeney,P.,Gogolin,F.,vanderWerff,L.,Lynn,T.(2017).The
effectofdatabreachannouncementsbeyondthestockprice:Empiricalevidenceon
marketactivity.InternationalReviewofFinancialAnalysis,49,146–154.Rosen,R.J.(1991).Researchanddevelopmentwithasymmetricfirmsizes.TheRAND
JournalofEconomics,22(3),411–429.Rothwell, R., Dodgson, M. (1994). Innovation and size of firm. In M. Dodgson & R.
Rothwell (Eds.), The handbook of industrial innovation (Vol. 324). Cornwall:EdwardElgarCheltenham.
Rouwenhorst,K.G.(1998).Internationalmomentumstrategies.TheJournalofFinance,53(1),267–284.
Roy,S.K.,Balaji,M.S.,Kesharwani,A.,Sekhon,H.(2017).PredictingInternetbanking
adoption in India: A perceived risk perspective. Journal of Strategic Marketing,25(5–6),418–438.
316
Roztocki,N.,Weistroffer,H.R.(2011).Eventstudiesininformationsystemsresearch:
past,presentandfuture.InECIS2011Proceedings(p.235).Ruivo, P., Mestre, A., Johansson, B., Oliveira, T. (2014). Defining the ERP and CRM
integrativevalue.ProcediaTechnology,16,704–709.Rumelt, R. P. (1984). Toward a Strategic Theory of the Firm. Resources Firms and
Strategic. Editado porNicolai J. Foss. Competitive StrategicManagement, 26(3),556–570.
Rumelt,R.P.,Lamb,R.(1984).Competitivestrategicmanagement.TowardaStrategicTheoryoftheFirm,26(1),556–570.
Rumelt,R.P., Lamb,R. (1997).Towardsa strategic theoryof the firm. InResources,firms,andstrategies:Areader intheresource-basedperspective(pp.131–145).Oxford:OxfordUniversityPress.
Ryan,P.,Taffler,R.J.(2006).Dobrokeragehousesaddvalue?ThemarketimpactofUK
sell-sideanalystrecommendationchanges.TheBritishAccountingReview,38(4),371–386.https://doi.org/https://doi.org/10.1016/j.bar.2006.07.015
Sabherwal,R.,Jeyaraj,A.(2015).InformationTechnologyImpactsonFirmPerformance:
AnExtensionofKohliandDevaraj(2003).MISQuarterly,39(4),809–836.Sabherwal, R., Sabherwal, S. (2005). Knowledge management using information
technology:Determinantsofshort-termimpacton firmvalue.DecisionSciences,36(4),531–567.
Saksonova,S.(2014).Theroleofnetinterestmargininimprovingbanks’assetstructure
andassessingthestabilityandefficiencyoftheiroperations.Procedia-SocialandBehaviouralSciences,150,132–141.
Samuelson,P.A.(2016).Proofthatproperlyanticipatedpricesfluctuaterandomly.In
TheWorldScientificHandbookofFuturesMarkets(pp.25–38).NewJersey:WorldScientific.
Sarkar, S. K., de Jong, P. J. (2006). Market response to FDA announcements. TheQuarterlyReviewofEconomicsandFinance,46(4),586–597.
Savor,P.G.,Lu,Q.(2009).DoStockMergersCreateValueforAcquirers?TheJournalofFinance, 64(3), 1061–1097. Retrieved from
http://www.jstor.org.ezproxy.bangor.ac.uk/stable/20487996
Scherer,F.M.,Ross,D.(1990).Industrialmarketstructureandeconomicperformance(3rded.).Boston:HoughtonMifflin.

317
Schneider, B., Hanges, P. J., Smith, D. B., Salvaggio, A. N. (2003).Which comes first:
employeeattitudesororganizationalfinancialandmarketperformance?JournalofAppliedPsychology,88(5),836–851.
Schultz,P.(1983).Transactioncostsandthesmallfirmeffect:Acomment.JournalofFinancialEconomics,12(1),81–88.
Scott, S. V, Van Reenen, J., Zachariadis, M. (2017). The long-term effect of digital
innovationonbankperformance:AnempiricalstudyofSWIFTadoptioninfinancial
services.ResearchPolicy,46(5),984–1004.Sears, J., Hoetker, G. (2014). Technological overlap, technological capabilities, and
resource recombination in technological acquisitions. Strategic ManagementJournal,35(1),48–67.
Sehgal,S.,Singh,B.(2008).Determinantsofinitialandlong-runperformanceofIPOsin
Indianstockmarket.AsiaPacificBusinessReview,4(4),24–37.Servion. (2018). What Makes Emerging Technologies The Future Of Customer
Experience? Retrieved 1 October 2020, from https://servion.com/blog/what-
emerging-technologies-future-customer-experience/
Setia,P.,Setia,M.,Krishnan,R.,Sambamurthy,V.(2011).Theeffectsoftheassimilation
anduseof ITapplicationson financialperformance inhealthcareorganizations.
JournaloftheAssociationforInformationSystems,12(3),274–298.Setia,P.,Setia,P.,Venkatesh,V.,Joglekar,S.(2013).Leveragingdigitaltechnologies:How
information quality leads to localized capabilities and customer service
performance.MISQuarterly,37(2),565–590.Shaikh, A. A., Karjaluoto, H. (2015). Mobile banking adoption: A literature review.
TelematicsandInformatics,32(1),129–142.Shane,S.(2000).Priorknowledgeandthediscoveryofentrepreneurialopportunities.
OrganizationScience,11(4),448–469.Shankar,V.,Smith,A.K.,Rangaswamy,A.(2003).Customersatisfactionandloyaltyin
onlineandofflineenvironments. International JournalofResearch inMarketing,20(2),153–175.
Shefrin,H.(2002).Beyondgreedandfear:Understandingbehaviouralfinanceandthepsychologyofinvesting.Cambridge,MA:OxfordUniversityPress.
Sheng, M. L. (2017). A dynamic capabilities-based framework of organizational
sensemaking through combinative capabilities towards exploratory and

318
exploitativeproduct innovation in turbulentenvironments. IndustrialMarketingManagement,65,28–38.
Shrestha,S.S.,Goetz,S.J.,Rupasingha,A.(2007).ProprietorshipformationsandUSjob
growth.ReviewofRegionalStudies,37(2),146–168.Sia,S.K.,Soh,C.,Weill,P.(2016).HowDBSBankPursuedaDigitalBusinessStrategy.
MISQuarterlyExecutive,15(2),105–121.Simmonds,P.G.(1990).Thecombineddiversificationbreadthandmodedimensions
and the performance of large diversified firms. Strategic Management Journal,11(5),399–410.
Simpson, W. G., Kohers, T. (2002). The link between corporate social and financial
performance: Evidence from the banking industry. Journal of Business Ethics,35(2),97–109.
Singh,H.,Zollo,M. (1999).Post-acquisitionstrategies, integrationcapability, and theeconomicperformanceof corporateacquisitions (INSEADWorkingPaperSeriesNo.99/42/SM).INSEAD.
Singhania,K.,Girish,G.P.(2015).Impactofmacroeconomiceventsonshanghaistock
exchange.AsianJournalofEmpiricalResearch,5(6),64–76.Sirmon,D. G., Hitt,M. A., Ireland, R. D. (2007).Managing firm resources in dynamic
environments to create value: Looking inside the black box. Academy ofManagementReview,32(1),273–292.
Slade,E.L.,Dwivedi,Y.K.,Piercy,N.C.,Williams,M.D. (2015).Modelingconsumers’
adoptionintentionsofremotemobilepaymentsintheUnitedKingdom:extending
UTAUTwithinnovativeness,risk,andtrust.Psychology&Marketing,32(8),860–873.
Slater, S. F., Narver, J. C. (1995). Market orientation and the learning organization.
JournalofMarketing,59(3),63–74.Slevin, D. P., Covin, J. G. (1997). Strategy formation patterns, performance, and the
significanceofcontext.JournalofManagement,23(2),189–209.Slovin,M.B.,Johnson,S.A.,Glascock,J.L.(1992).Firmsizeandtheinformationcontent
ofbankloanannouncements.JournalofBanking&Finance,16(6),1057–1071.Smith,C.W.(1977).Alternativemethodsforraisingcapital:Rightsversusunderwritten
offerings. Journal of Financial Economics, 5(3), 273–307.
https://doi.org/10.1016/0304-405X(77)90040-X

319
Smith,K.G.,Grimm,C.M.,Gannon,M.J.,Chen,M.-J.(1991).Organizationalinformation
processing, competitive responses, and performance in the US domestic airline
industry.AcademyofManagementJournal,34(1),60–85.Song,H.,Zhao,C.,Zeng, J. (2017).Canenvironmentalmanagement improve financial
performance:AnempiricalstudyofA-shareslistedcompaniesinChina.JournalofCleanerProduction,141,1051–1056.
Sood,A.,Tellis,G.J.(2009).Doinnovationsreallypayoff?Totalstockmarketreturnsto
innovation.MarketingScience,28(3),442–456.Spence,M.(1978). Jobmarketsignaling. InUncertainty inEconomics(pp.281–306).
Cambridge:HarvardUniversityPress.
Spence,M.(2002).Signalinginretrospectandtheinformationalstructureofmarkets.
AmericanEconomicReview,92(3),434–459.Spender, J., Grant, R. M. (1996). Knowledge and the firm: overview. Strategic
ManagementJournal,17(S2),5–9.Spiess, D. K., Affleck-Graves, J. (1995). Underperformance in long-run stock returns
followingseasonedequityofferings. JournalofFinancialEconomics,38(3),243–267.
Srivastav,A.,Armitage,S.,Hagendorff, J.,King,T.(2018).Bettersafethansorry?CEO
insidedebtandrisk-takinginbankacquisitions.JournalofFinancialStability,36,208–224.
Srivastava, R. K., Fahey, L., Christensen, H. K. (2001). The resource-based view and
marketing: The role of market-based assets in gaining competitive advantage.
JournalofManagement,27(6),777–802.Statista.(2020).AppleiPhonesalesrevenue2007-2020.Retrieved1January2020,from
https://www.statista.com/statistics/263402/apples-iphone-revenue-since-3rd-
quarter-2007/
Statista.(2021).Apple’s iPhonerevenuefrom3rdquarter2007to3rdquarter2021.
Retrieved 1 September 2021, from
https://www.statista.com/statistics/263402/apples-iphone-revenue-since-3rd-
quarter-2007/
Sternal, M., Schiereck, D. (2019). Do Digital Giants Create Value by Mergers andAcquisitions? (Working Paper). Darmstad: Darmstadt Technical University,Institute for Business Studies (BWL) 117126, Darmstadt Technical University,

320
DepartmentofBusinessAdministration,EconomicsandLaw,InstituteforBusiness
Studies(BWL).
Stiroh,K.J.,Strahan,P.E.(2003).Competitivedynamicsofderegulation:Evidencefrom
USbanking.JournalofMoney,CreditandBanking,35(5),801–828.Stoll,H.R.,Whaley,R.E.(1983).Transactioncostsandthesmallfirmeffect.Journalof
FinancialEconomics,12(1),57–79.Strader,T.J.,Hendrickson,A.R.(2001).Introductiontothespecialsectiononmarketing
andconsumerbehaviourinelectronicmarkets.E-ServiceJournal,1(1),37–39.Stulz, R. M. (2019). Fintech, bigtech, and the future of banks. Journal of Applied
CorporateFinance,31(4),86–97.Su,C.,Bangassa,K.(2011).Theimpactofunderwriterreputationoninitialreturnsand
long-runperformanceofChineseIPOs.JournalofInternationalFinancialMarkets,InstitutionsandMoney,21(5),760–791.
Suarez, F., Lanzolla, G. (2005). The half-truth of first-mover advantage. HarvardBusinessReview,83(4),121–127.
Subramani,M.,Walden,E.(2002).Employingtheeventstudytoassessreturnstofirmsfrom novel information technologies: An examination of e-commerce initiativeannouncements.Minneapolis:UniversityofMinnesota.
Sudha, S. (2020). Corporate environmental performance–financial performance
relationshipinIndiausingeco-efficiencymetrics.ManagementofEnvironmentalQualityJournal,31(6),1497–1514.
Suganthi,B.(2001).Internetbankingpatronage:anempiricalinvestigationofMalaysia.
JournalofInternetBankingandCommerce,6(1).Sullivan,R.J.(2000).Howhastheadoptionofinternetbankingaffectedperformance
andriskinbanks?FinancialIndustryPerspectives,12(1),1–16.Sullivan,R.J.,Wang,Z.(2013).Internetbanking:anexplorationintechnologydiffusion
andimpact(FRBRichmondWorkingPaperNo.13–10).Richmond:FederalReserveBankofRichmond.
Swacha-Lech,M.(2017).Themainchallengesfacingtheretailbankingindustryinthe
era of digitalisation. Journal of Insurance, Financial Markets and ConsumerProtection,4(26),94–116.
Switzer, L. N., Cao, Y. (2011). Shareholder interests vs board of director members’
interests and company performance: A new look. Review of Accounting and

321
Finance,10(3),228–245.Szutowski,D. (2018).Market reaction toopen innovationannouncements.European
JournalofInnovationManagement,21(1),142–156.Szutowski, D. (2019). Innovation source, advancement stage and company stock
returns.TheServiceIndustriesJournal,39(13–14),925–942.Tanda, A., Schena, C.-M. (2019). Bank Strategies in the Light of the Digitalisation of
FinancialActivities.InPhilip(Ed.),FinTech,BigTechandBanks(pp.51–81).NewYork:PalgravePivot,Cham.
Tarullo, D. K. (2019). Financial regulation: Still unsettled a decade after the crisis.
JournalofEconomicPerspectives,33(1),61–80.Taylor,I.(2012).Goodthingscomeinsmallpackages.SuperfundsMagazine,(374),s14–
s15.
Teece,D.J.(1988).Capturingvaluefromtechnologicalinnovation:Integration,strategic
partnering,andlicensingdecisions.Interfaces,18(3),46–61.Teece,D.J.,Pisano,G.,Shuen,A.(1997).Dynamiccapabilitiesandstrategicmanagement.
StrategicManagementJournal,18(7),509–533.Telang,R.,Wattal,S. (2005). Impactof softwarevulnerabilityannouncementson the
marketvalueofsoftwarevendors-anempiricalinvestigation.IEEETransactionsonSoftwareEngineering,33,544–557.
Terlaak, A., Gong, Y. (2008). Vicarious learning and inferential accuracy in adoption
processes.AcademyofManagementReview,33(4),846–868.Thakor, A. V. (2020). Fintech and banking:What do we know? Journal of Financial
Intermediation,21,1–12.Thakur, R., Srivastava, M. (2014). Adoption readiness, personal innovativeness,
perceived risk andusage intention across customer groups formobile payment
servicesinIndia.InternetResearch,24(3),369–392.Thanos, I. C., Papadakis, V. M. (2012). The use of accounting-based measures in
measuringM&Aperformance:areviewoffivedecadesofresearch.InL.Cooper,C.
&S.Finkelstein(Eds.),Advancesinmergersandacquisitions(pp.103–120).WestYorkshire,England:EmeraldGroupPublishingLimited.
Thavalengal,S.,Corcoran,P.(2016).Userauthenticationonsmartphones:Focusingon
irisbiometrics.IEEEConsumerElectronicsMagazine,5(2),87–93.Tian, J.,Wang,K., Chen,Y., Johansson,B. (2010). From ITdeployment capabilities to

322
competitive advantage: An exploratory study in China. Information SystemsFrontiers,12(3),239–255.
Timmermann,A.,Granger,C.W.J.(2004).Efficientmarkethypothesisandforecasting.
InternationalJournalofForecasting,20(1),15–27.Topf,J.M.,Hiremath,S.(2019).GotCKD?There’sanappforthat!ClinicalJournalofthe
AmericanSocietyofNephrology,14(4),491–492.Tregenna, F. (2009). The fat years: the structure andprofitability of theUSbanking
sectorinthepre-crisisperiod.CambridgeJournalofEconomics,33(4),609–632.Tricker, R. I. B., Tricker, R. I. (2015). Corporate governance: Principles, policies, and
practices.USA:OxfordUniversityPress.Trinks, A., Mulder, M., Scholtens, B. (2020). An efficiency perspective on carbon
emissionsandfinancialperformance.EcologicalEconomics,175,1–12.Tufano,P.(1989).Financialinnovationandfirst-moveradvantages.JournalofFinancial
Economics,25(2),213–240.U.S. Department of Justice. (2018). Herfindahl-Hirschman Index. Retrieved 20
September2021,fromhttps://www.justice.gov/atr/herfindahl-hirschman-index
Uddin,S.M.S.,Suzuki,Y.(2014).The impactofcompetitiononbankperformance in
Bangladesh: an empirical study. International Journal of Financial ServicesManagement2,7(1),73–94.
Unsal,O.,Hassan,M.K.,Hippler,W.(2017).LobbyinginFinanceIndustry:EvidencefromUS Banking System. Terre Haute: Networks Financial Institute, Indiana StateUniversity.
Urban,G.L.,Carter,T.,Gaskin,S.,Mucha,Z.(1986).Marketsharerewardstopioneering
brands: An empirical analysis and strategic implications. Management Science,32(6),645–659.
Utterback,J.(1994).Masteringthedynamicsofinnovation:Howcompaniescanseizeopportunitiesinthefaceoftechnologicalchange.Cambridge,MA:HarvardBusinessSchoolPress.
Varadarajan,R.(2020).Customerinformationresourcesadvantage,marketingstrategy
andbusinessperformance:Amarketresourcesbasedview.IndustrialMarketingManagement,89,89–97.
Venkatraman,S.,Delpachitra, I. (2008).Biometrics inbankingsecurity: a case study.
InformationManagement&ComputerSecurity,16(4),415–430.

323
Veronesi,P.(1999).Stockmarketoverreactionstobadnewsingoodtimes:arational
expectationsequilibriummodel.TheReviewofFinancialStudies,12(5),975–1007.Vithessonthi,C.,Racela,O.C.(2016).Short-andlong-runeffectsofinternationalization
and R&D intensity on firm performance. Journal of Multinational FinancialManagement,34,28–45.
Vives, X. (2016). Competition and stability in banking: The role of regulation andcompetitionpolicy.Princeton,NJ:PrincetonUniversityPress.
Vives,X.(2017).TheimpactofFinTechonbanking.EuropeanEconomy,(2),97–105.Vives,X.(2019).Competitionandstabilityinmodernbanking:Apost-crisisperspective.
InternationalJournalofIndustrialOrganization,64,55–69.Vossen,R.W.(1998).Combiningsmallandlargefirmadvantagesininnovation:Theory
and examples (SOM Research Report No. 98B21). Research School SystemsOrganisationandManagement.
Wade, M., Hulland, J. (2004). The resource-based view and information systems
research:Review,extension,andsuggestions for future research.MISQuarterly,28(1),107–142.
Wadesango, N., Magaya, B. (2020). The impact of digital banking services on
performance of commercial banks. Journal of Management Information andDecisionSciences,23,343–353.
Walden, E., Browne, G. J. (2008). Rational fads in investor reactions to electronic
commerce announcements: An explanation of the Internet bubble. ElectronicCommerceResearchandApplications,7(1),44–54.
Walker,E.W.,Petty,J.W.(1978).Financialdifferencesbetweenlargeandsmallfirms.
FinancialManagement,7(4),61–68.Wang, F., Yan, X., Zheng, L. (2021). Time-series and cross-sectional momentum in
anomalyreturns.EuropeanFinancialManagement,27(4),736–771.Wang,T.,Wang,Y.,McLeod,A.(2018).Dohealthinformationtechnologyinvestments
impacthospital financialperformanceandproductivity? International JournalofAccountingInformationSystems,28,1–13.
Wardhani,P.P.C.(2019).TheSignallingofSustainabilityReportingAwardinIndonesia
andItsEffectsonFinancialPerformanceandFirmValue.InternationalJournalofInnovation,CreativityandChange,9(8),14–32.
Weekenborg,M.(2018).RationalpartisantheoryandotherpartisaneffectsintheEU:
324
aneventstudy(BachelorDissertation).Rotterdam:ErasmusUniversityRotterdam.Weigelt, C., Sarkar, M. B. (2012). Performance implications of outsourcing for
technological innovations: managing the efficiency and adaptability trade-off.
StrategicManagementJournal,33(2),189–216.Weiss,H.M.(1990).Learningtheoryandindustrialandorganizationalpsychology.In
M.D.Dunnette&HoughL.M. (Eds.),Handbookof industrialandorganizationalpsychology(2nded.).PaloAlto,CA:ConsultingPsychologistsPress.
Wernerfelt,B.(1984).Aresource-basedviewofthefirm.StrategicManagementJournal,5(2),171–180.
Williams,M.(2019).Arewethedumbestdevicesintheroom?NewsWeekly,3053,13–26.
Williamson,O. E. (1979).Transaction-cost economics: the governanceof contractual
relations.TheJournalofLawandEconomics,22(2),233–261.Wilson,P.W.(2018).USbankinginthepost-crisisera:Newresultsfromnewmethods.
InNorthAmericanProductivityWorkshop(pp.233–264).Miami,FL:Springer.Winarno,W.A.,Tjahjadi,B., Irwanto,A.(2021).TimeLagEffectsofITInvestmenton
FirmPerformance:EvidenceformIndonesia.JurnalEkonomiMalaysia,55(3),89–101.
Winkelmann, R. (2008). Unobserved Heterogeneity. In R. Winkelmann (Ed.),
Econometric Analysis of Count Data (5th ed., pp. 127–142). Berlin, Heidelberg:SpringerBerlinHeidelberg.https://doi.org/10.1007/978-3-540-78389-3_4
Winter,S.G.(1995).FourRsofprofitability:rents,resources,routines,andreplication.
InM.C.A.(Ed.),Resource-basedandevolutionarytheoriesofthefirm:Towardsasynthesis(pp.147–178).Boston,MA:Springer.
Womack,K.L.(1996).Dobrokerageanalysts’recommendationshaveinvestmentvalue?
TheJournalofFinance,51(1),137–167.Wright, P.M., Snell, S.A. (1998).Towardaunifying framework for exploring fit and
flexibility in strategic human resource management. Academy of ManagementReview,23(4),756–772.
Wyman,O.(2020).WhenVisionandValueCollide.Retrieved1September2020,from
https://www.oliverwyman.com/content/dam/oliver-
wyman/v2/publications/2020/January/Oliver-Wyman-State-of-the-Financial-
Services-Industry-2020.pdf
325
Xia,Y.,Singhal,V.R.,PeterZhang,G.(2016).Productdesignawardsandthemarketvalue
ofthefirm.ProductionandOperationsManagement,25(6),1038–1055.Xu, J. (David), Benbasat, I., Cenfetelli, R. T. (2013). Integrating Service Quality with
SystemandInformationQuality:AnEmpiricalTestintheE-ServiceContext.MISQuarterly, 37(3), 777–794. Retrieved from
http://www.jstor.org/stable/43825999
Xue,M.,Hitt, L.M., Chen,P. (2011).Determinants andoutcomesof internetbanking
adoption.ManagementScience,57(2),291–307.Xue,M.,Hitt,L.M.,Harker,P.T.(2007).Customerefficiency,channelusage,andfirm
performanceinretailbanking.Manufacturing&ServiceOperationsManagement,9(4),535–558.
Yang, H.-D., Lee, J., Park, C., Lee, K. (2014). The adoption of mobile self-service
technologies:Effectsofavailability inalternativemediaandtrustontherelative
importanceofperceivedusefulnessandeaseofuse.InternationalJournalofSmartHome,8(4),165–178.
Yao,L.J.,Liu,C.,Chan,S.H.(2010).Theinfluenceoffirmspecificcontextonrealizing
information technology business value inmanufacturing industry. InternationalJournalofAccountingInformationSystems,11(4),353–362.
Yu,F.,Wang,L.,Li,X.(2020).Theeffectsofgovernmentsubsidiesonnewenergyvehicle
enterprises:Themoderatingroleofintelligenttransformation.EnergyPolicy,141,1–8.
Zach,F.J.,Nicolau,J.L.,Sharma,A.(2020).Disruptiveinnovation,innovationadoption
andincumbentmarketvalue:ThecaseofAirbnb.AnnalsofTourismResearch,80,1–12.https://doi.org/https://doi.org/10.1016/j.annals.2019.102818
Zachariadis, M., Ozcan, P. (2017). The API economy and digital transformation infinancialservices:Thecaseofopenbanking(SWIFTInstituteWorkingPaperNo.2016–001).SWIFTInstitute.
Zantout,Z.,Chaganti,R.(1996).Newproductintroductions,shareholders’wealth,and
first-moveradvantages.JournalofFinancialandStrategicDecisions,9(3),49–61.Zantout, Z., Tsetsekos, G. P. (1994). The wealth effects of announcements of R&D
expenditureincreases.JournalofFinancialResearch,17(2),205–216.Zenger,T.R.(1994).ExplainingorganizationaldiseconomiesofscaleinR&D:Agency
problemsand theallocationof engineering talent, ideas, andeffortby firmsize.

326
ManagementScience,40(6),708–729.Zhou, T. (2011). Examining the critical success factors of mobile website adoption.
OnlineInformationReview,35(4),636–652.

327
APPENDIX
AppendixA-AdditionalAnalysesforModelsinChapter4
Thissectionpresents:
-ResultsofCARpointsusingalternativeestimationperiods.
-ResultsofCARpointsforsub-samplesizegroups,usingalternativeestimationperiods.

328
TableA.4.5CumulativeAbnormalReturnuponWebsite-LaunchingAnnouncements,usingalternativeestimationperiods.
This table reports Cumulative Abnormal Returns to stockholders upon the website launchingannouncements. The sample consists ofwebsite launch announcements of 307US commercial banksbetween 1996 and 2010. Daily Abnormal Return is obtained using themarket model with differentestimationperiods(200daysand300days)anddifferenteventwindows(-1+1window;-2+2window;-3+3window).ThemarketindexusedistheNasdaqIndex.AlldataofMarketIndexandPriceIndicesof307banksarecollecteddailyin3238days(about9years)from05/02/1996to20/7/2010forthe180-dayestimationperiodandseven-dayeventwindow.Thenumberofdailystocksindexwilldifferslightlybetweenthedifferentlengthsofwindowsandestimation.ThesourceofmarketindexandpriceindicesisatthesourceThompsonSecuritiesData.ThestatisticalsignificanceofCARistestedbyusingtheformulaofAmicietal.(2013)andBoehmeretal.(1991),whichisproducedtocapturetheevent-inducedincreaseinreturnvolatility.ThevaluesofsignificanttestsaredisplayedinthesixthcolumnwiththeheadingZ-stat.Thesuperscripts***,**,and*indicateastatisticallysignificantdifferencefromzeroatthe1,5,and10percentlevelsofsignificanceintwo-sidedtests. Mean(%) Std. Min(%) Max(%) Z-score200-dayEstimationPeriod(-20;-219)CAR(-1;+1) 0.135%** 0.029 -11.07% 11.22% 1.769CAR(-2;+2) 0.181%** 0.031 -13.10% 12.03% 1.673CAR(-3;+3) 0.168% 0.037 -14.03% 15.49% 1.200300-dayEstimationPeriod(-20;-319)CAR(-1;+1) 0.119%** 0.029 -11.12% 11.26% 1.645CAR(-2;+2) 0.146%* 0.031 -13.04% 12.58% 1.624CAR(-3;+3) 0.138% 0.037 -13.95% 15.21% 1.131

329
TableA.4.6CAR(%)offirms,whicharesubsampledusingmarketsizearoundthedateofannouncement
This table reports the values of Cumulative Abnormal Returns (displayed in percentage) and theirdescriptivestatisticalcharacteristicstostockholdersuponthewebsitelaunchannouncementofsamplebanksclassifiedintothreesize-basedportfolios.Thesampleconsistsofwebsitelaunchannouncementsof307USbanksbetween1996and2010.DailyAbnormalReturnisobtainedusingthemarketmodelwiththe120-dayestimationperiod(-20;-219)anddifferenteventwindows(-1+1window;-2+2window;-3+3window). Samplebanks fall in the three same sizequantilesbasedon theirmarket values.MV1includesbankswiththesmallestmarketvalue,andMV3includesbankswiththelargestmarketvalue.ThemarketindexusedistheNasdaqIndex.AlldataofMarketIndexandPriceIndicesof307banksarecollected daily during 3238 days (about 9 years) from 05/02/1996 to 20/7/2010 for the 120-dayestimation period and seven-day eventwindow. The number of daily stocks indexwill differ slightlybetweenthedifferentlengthsofwindowsandestimation.ThesourceofmarketindexandpriceindicesisatthesourceThompsonSecuritiesData.ThestatisticalsignificanceofCARistestedbyusingtheformulaofAmicietal.(2013)andBoehmeretal.(1991),whichisproducedtocapturetheevent-inducedincreaseinreturnvolatility.Threesignificanttestshaveproceededindividuallyforthreesize-basedportfolios.ThevaluesofsignificanttestsaredisplayedinthesixthcolumnwiththeheadingZ-statThesuperscripts***,**, and * indicate a statistically significant difference from zero at the 1, 5, and 10 percent levels ofsignificanceintwo-sidedtests.
180-day Mean Std. Min Max Z-test(1;+1) SmallBank 0.04% 0.031 -11.12% 8.62% 0.949 MediumBank 0.03%*** 0.032 -9.94% 11.17% 2.919 LargeBank 0.33%*** 0.026 -6.13% 6.43% 5.745(-2:+2) SmallBank 0.48%*** 0.031 -8.21% 9.37% 5.361 MediumBank -0.13% 0.031 -13.25% 12.24% 0.743 LargeBank 0.15%*** 0.031 -7.74% 7.92% 2.947 SmallBank 0.55%*** 0.042 -11.65% 15.64% 4.975(-3;+3) MediumBank 0.36%*** 0.035 -14.24% 7.98% 4.377 LargeBank -0.48%*** 0.035 -9.28% 8.21% -2.427 200-day Mean Std. Min Max Z-test(1;+1) SmallBank 0.05% 0.031 -11.07% 8.62% 0.891 MediumBank 0.02%*** 0.032 -9.94% 11.22% 2.646 LargeBank 0.33%*** 0.025 -6.04% 6.34% 5.717(-2:+2) SmallBank 0.50%*** 0.031 -8.21% 9.62% 5.392 MediumBank -0.13% 0.031 -13.10% 12.03% 0.420 LargeBank 0.17%*** 0.031 -8.02% 7.84% 3.111 SmallBank 0.58%*** 0.041 -11.53% 15.49% 4.931(-3;+3) MediumBank 0.37%*** 0.035 -14.03% 7.35% 4.165 LargeBank -0.45% 0.035 -8.86% 8.42% -2.130 300-day Mean Std. Min Max Z-test SmallBank 0.02% 0.03 -11.12% 8.62% 0.513(1;+1) MediumBank -0.02%** 0.032 -9.94% 11.26% 2.319 LargeBank 0.36%*** 0.025 -5.21% 6.20% 5.888 SmallBank 0.45%*** 0.031 -8.21% 9.62% 4.791(-2:+2) MediumBank -0.19% 0.031 -13.04% 12.58% 0.397 LargeBank 0.18%*** 0.031 -8.46% 7.89% 3.381 SmallBank 0.51%*** 0.041 -11.68% 15.21% 4.277 MediumBank 0.30%*** 0.035 -13.95% 6.67% 3.825(-3;+3) LargeBank -0.40%** 0.034 -8.31% 9.07% -1.658
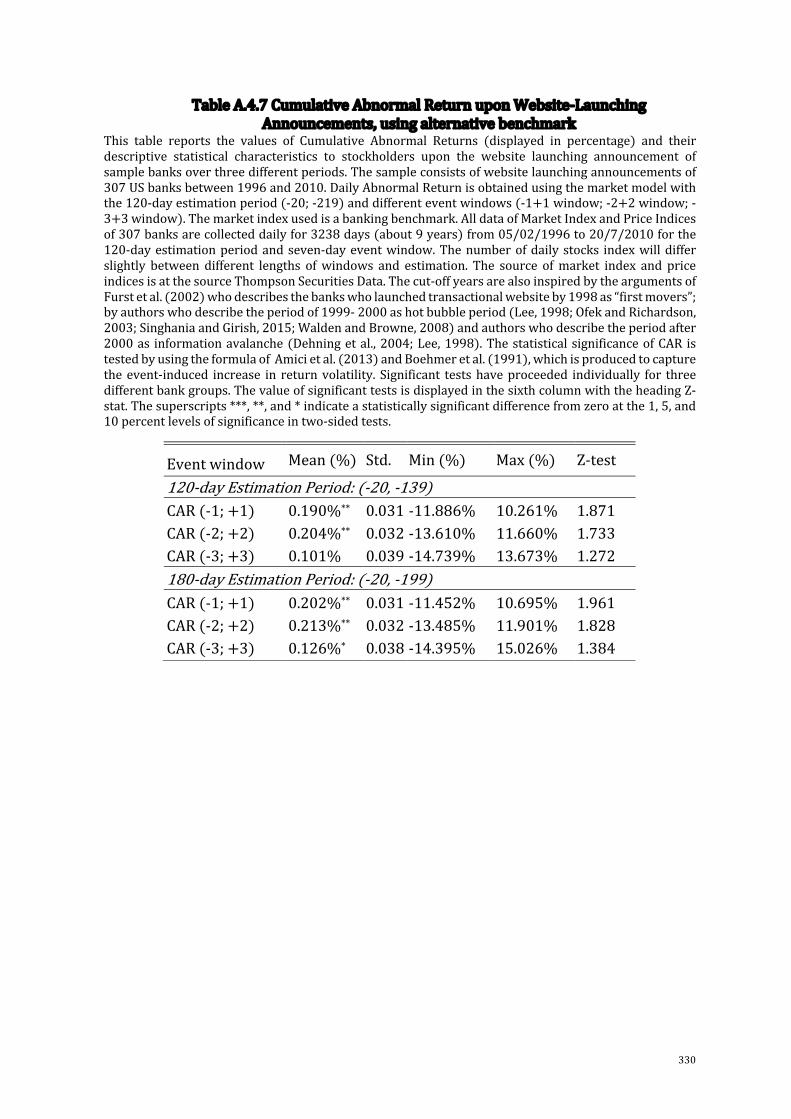
330
TableA.4.7CumulativeAbnormalReturnuponWebsite-LaunchingAnnouncements,usingalternativebenchmark
This table reports the values of Cumulative Abnormal Returns (displayed in percentage) and theirdescriptive statistical characteristics to stockholders upon the website launching announcement ofsamplebanksoverthreedifferentperiods.Thesampleconsistsofwebsitelaunchingannouncementsof307USbanksbetween1996and2010.DailyAbnormalReturnisobtainedusingthemarketmodelwiththe120-dayestimationperiod(-20;-219)anddifferenteventwindows(-1+1window;-2+2window;-3+3window).Themarketindexusedisabankingbenchmark.AlldataofMarketIndexandPriceIndicesof307banksarecollecteddailyfor3238days(about9years)from05/02/1996to20/7/2010forthe120-dayestimationperiodandseven-dayeventwindow.Thenumberofdailystocks indexwilldifferslightly between different lengths ofwindows and estimation. The source ofmarket index and priceindicesisatthesourceThompsonSecuritiesData.Thecut-offyearsarealsoinspiredbytheargumentsofFurstetal.(2002)whodescribesthebankswholaunchedtransactionalwebsiteby1998as“firstmovers”;byauthorswhodescribetheperiodof1999-2000ashotbubbleperiod(Lee,1998;OfekandRichardson,2003;SinghaniaandGirish,2015;WaldenandBrowne,2008)andauthorswhodescribetheperiodafter2000as informationavalanche(Dehningetal.,2004;Lee,1998).ThestatisticalsignificanceofCARistestedbyusingtheformulaofAmicietal.(2013)andBoehmeretal.(1991),whichisproducedtocapturetheevent-induced increase in returnvolatility. Significant testshaveproceeded individually for threedifferentbankgroups.ThevalueofsignificanttestsisdisplayedinthesixthcolumnwiththeheadingZ-stat.Thesuperscripts***,**,and*indicateastatisticallysignificantdifferencefromzeroatthe1,5,and10percentlevelsofsignificanceintwo-sidedtests.
Eventwindow Mean(%) Std. Min(%) Max(%) Z-test120-dayEstimationPeriod:(-20,-139)CAR(-1;+1) 0.190%** 0.031-11.886% 10.261% 1.871CAR(-2;+2) 0.204%** 0.032-13.610% 11.660% 1.733CAR(-3;+3) 0.101% 0.039-14.739% 13.673% 1.272180-dayEstimationPeriod:(-20,-199)CAR(-1;+1) 0.202%** 0.031-11.452% 10.695% 1.961CAR(-2;+2) 0.213%** 0.032-13.485% 11.901% 1.828CAR(-3;+3) 0.126%* 0.038-14.395% 15.026% 1.384
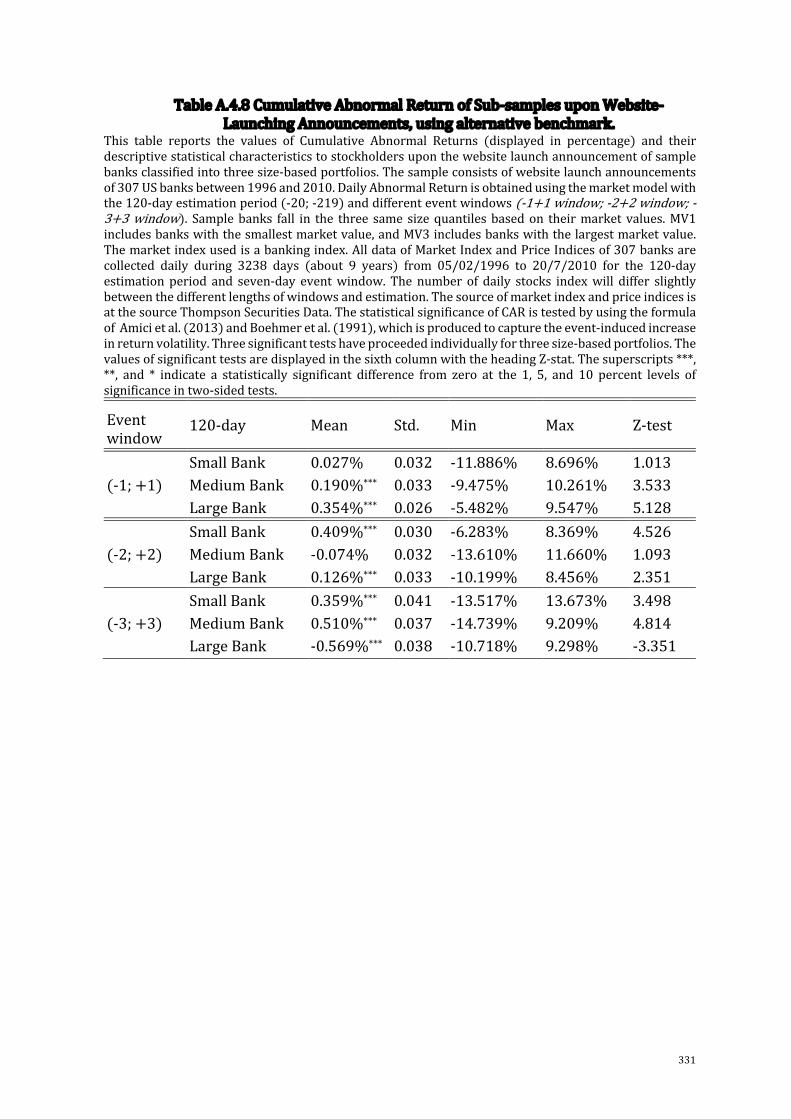
331
TableA.4.8CumulativeAbnormalReturnofSub-samplesuponWebsite-LaunchingAnnouncements,usingalternativebenchmark.
This table reports the values of Cumulative Abnormal Returns (displayed in percentage) and theirdescriptivestatisticalcharacteristicstostockholdersuponthewebsitelaunchannouncementofsamplebanksclassifiedintothreesize-basedportfolios.Thesampleconsistsofwebsitelaunchannouncementsof307USbanksbetween1996and2010.DailyAbnormalReturnisobtainedusingthemarketmodelwiththe120-dayestimationperiod(-20;-219)anddifferenteventwindows(-1+1window;-2+2window;-3+3window). Samplebanks fall in the three same sizequantilesbasedon theirmarket values.MV1includesbankswiththesmallestmarketvalue,andMV3includesbankswiththelargestmarketvalue.Themarketindexusedisabankingindex.AlldataofMarketIndexandPriceIndicesof307banksarecollected daily during 3238 days (about 9 years) from 05/02/1996 to 20/7/2010 for the 120-dayestimation period and seven-day eventwindow. The number of daily stocks indexwill differ slightlybetweenthedifferentlengthsofwindowsandestimation.ThesourceofmarketindexandpriceindicesisatthesourceThompsonSecuritiesData.ThestatisticalsignificanceofCARistestedbyusingtheformulaofAmicietal.(2013)andBoehmeretal.(1991),whichisproducedtocapturetheevent-inducedincreaseinreturnvolatility.Threesignificanttestshaveproceededindividuallyforthreesize-basedportfolios.ThevaluesofsignificanttestsaredisplayedinthesixthcolumnwiththeheadingZ-stat.Thesuperscripts***,**, and * indicate a statistically significant difference from zero at the 1, 5, and 10 percent levels ofsignificanceintwo-sidedtests.
Eventwindow
120-day Mean Std. Min Max Z-test
SmallBank 0.027% 0.032 -11.886% 8.696% 1.013(-1;+1) MediumBank 0.190%*** 0.033 -9.475% 10.261% 3.533 LargeBank 0.354%*** 0.026 -5.482% 9.547% 5.128 SmallBank 0.409%*** 0.030 -6.283% 8.369% 4.526(-2;+2) MediumBank -0.074% 0.032 -13.610% 11.660% 1.093 LargeBank 0.126%*** 0.033 -10.199% 8.456% 2.351 SmallBank 0.359%*** 0.041 -13.517% 13.673% 3.498(-3;+3) MediumBank 0.510%*** 0.037 -14.739% 9.209% 4.814 LargeBank -0.569%*** 0.038 -10.718% 9.298% -3.351

332
TableA.4.9CAR(%)ofCumulativeAbnormalReturnofSub-samplesupon
Website-LaunchingAnnouncements,usingalternativebenchmark.This table reports the values of Cumulative Abnormal Returns (displayed in percentage) and theirdescriptivestatisticalcharacteristicstostockholdersuponthewebsitelaunchannouncementofsamplebanksclassifiedintothreesize-basedportfolios.Thesampleconsistsofwebsitelaunchannouncementsof307USbanksbetween1996and2010.DailyAbnormalReturnisobtainedusingthemarketmodelwiththe120-dayestimationperiod(-20;-219)anddifferenteventwindows(-1+1window;-2+2window;-3+3window).Thecut-offyearsarealsoinspiredbytheargumentsofFurstetal.(2002)whodescribesthebankswholaunchedtransactionalwebsiteby1998as“firstmovers”;byauthorswhodescribetheperiodof1999-2000ashotbubbleperiod(Lee,1998;OfekandRichardson,2003;SinghaniaandGirish,2015; Walden and Browne, 2008) and authors who describe the period after 2000 as informationavalanche(Dehningetal.,2004;Lee,1998).Themarketindexusedisabankingindex.AlldataofMarketIndex and Price Indices of 307 banks are collected daily during 3238 days (about 9 years) from05/02/1996to20/7/2010forthe120-dayestimationperiodandseven-dayeventwindow.Thenumberofdailystocks indexwilldifferslightlybetweenthedifferent lengthsofwindowsandestimation.Thesource of market index and price indices is at the source Thompson Securities Data. The statisticalsignificanceofCARistestedbyusingtheformulaofAmicietal.(2013)andBoehmeretal.(1991),whichis produced to capture the event-induced increase in return volatility. Three significant tests haveproceededindividuallyforthreesize-basedportfolios.Thevaluesofsignificanttestsaredisplayedinthesixthcolumnwith theheadingZ-stat.Thesuperscripts ***, **, and* indicatea statistically significantdifferencefromzeroatthe1,5,and10percentlevelsofsignificanceintwo-sidedtests.
Eventwindow 120-day Mean Std. Min Max Z-test First-mover 0.529%*** 0.0248 -4.538% 8.796% 7.918(-1;+1) Second-mover -0.239% 0.0343 -11.886% 9.547% -1.028 Laggard 0.274%** 0.0320 -8.298% 10.261% 2.279 First-mover 0.252%*** 0.0286 -10.199% 7.878% 4.708(-2;+2) Second-mover 0.177% 0.0338 -13.610% 8.456% 1.194 Laggard 0.184%** 0.0325 -7.567% 11.660% 2.551 First-mover 0.064%* 0.0342 -10.718% 9.209% 1.529(-3;+3) Second-mover 0.079% 0.0452 -14.739% 13.673% 0.293 Laggard 0.268%** 0.0364 -9.997% 10.920% 2.552

333
AppendixB-AdditionalAnalysesforModelsinChapter5
Thissectionpresents:
-Resultsoftransformationinfinancialperformance.
-Resultsofrobustnesstestrelatedtothedynamicimpactsofthetransactionalwebsite
onbanks'performance.
-Resultsoftherobustnesstest,usingthreesizequantiles:small-sized,medium-sizedand
large-sizedgroups.
-Resultsofallmainequations,usingyearandstatesfixedeffect.
-Resultsofallmainequations,usingyear,stateandbank-levelfixedeffect.
-DescriptiveStatisticsofLearningbyObservingbehaviour

334
FigureA.5.4NetInterestMarginforallU.SBanksfrom1986to2020
Source:FederalReserveBankofSt.Louis(FRED),2020.
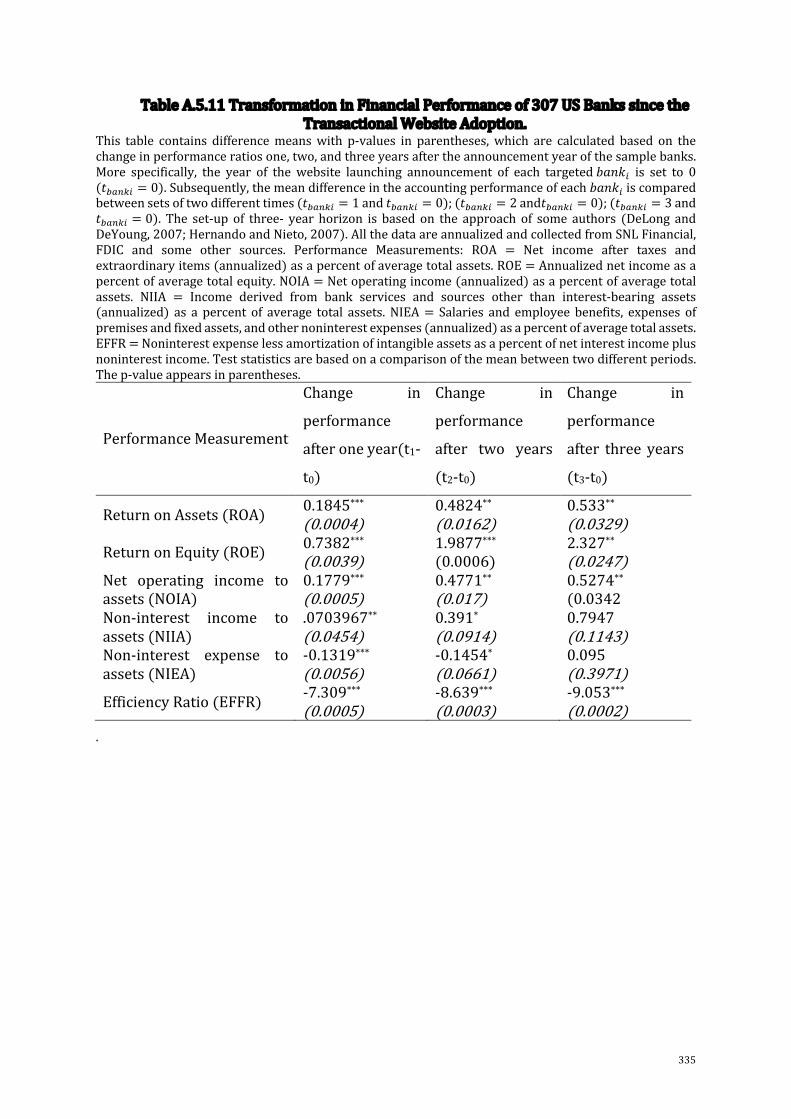
335
TableA.5.11TransformationinFinancialPerformanceof307USBankssincetheTransactionalWebsiteAdoption.
This table contains differencemeanswith p-values in parentheses,which are calculated based on thechangeinperformanceratiosone,two,andthreeyearsaftertheannouncementyearofthesamplebanks.More specifically, the year of the website launching announcement of each targeted=>?@! is set to 0(C"#$%! = 0).Subsequently,themeandifferenceintheaccountingperformanceofeach=>?@!iscomparedbetweensetsoftwodifferenttimes(C"#$%! = 1andC"#$%! = 0);(C"#$%! = 2andC"#$%! = 0);(C"#$%! = 3andC"#$%! = 0). The set-up of three- year horizon is based on the approach of some authors (DeLong andDeYoung,2007;HernandoandNieto,2007).AllthedataareannualizedandcollectedfromSNLFinancial,FDIC and some other sources. Performance Measurements: ROA = Net income after taxes andextraordinaryitems(annualized)asapercentofaveragetotalassets.ROE=Annualizednetincomeasapercentofaveragetotalequity.NOIA=Netoperatingincome(annualized)asapercentofaveragetotalassets. NIIA = Income derived from bank services and sources other than interest-bearing assets(annualized) as a percent of average total assets. NIEA= Salaries and employee benefits, expenses ofpremisesandfixedassets,andothernoninterestexpenses(annualized)asapercentofaveragetotalassets.EFFR=Noninterestexpenselessamortizationofintangibleassetsasapercentofnetinterestincomeplusnoninterestincome.Teststatisticsarebasedonacomparisonofthemeanbetweentwodifferentperiods.Thep-valueappearsinparentheses.
PerformanceMeasurement
Change in
performance
afteroneyear(t1-
t0)
Change in
performance
after two years
(t2-t0)
Change in
performance
after three years
(t3-t0)
ReturnonAssets(ROA) 0.1845***(0.0004)
0.4824**(0.0162)
0.533**(0.0329)
ReturnonEquity(ROE) 0.7382***(0.0039)
1.9877***(0.0006)
2.327**(0.0247)
Net operating income toassets(NOIA)
0.1779***(0.0005)
0.4771**(0.017)
0.5274**(0.0342
Non-interest income toassets(NIIA)
.0703967**(0.0454)
0.391*(0.0914)
0.7947(0.1143)
Non-interest expense toassets(NIEA)
-0.1319***(0.0056)
-0.1454*(0.0661)
0.095(0.3971)
EfficiencyRatio(EFFR) -7.309***(0.0005)
-8.639***(0.0003)
-9.053***(0.0002)
.

336
TableA.5.12DynamicImpactsofTransactionalWebsiteAdoptiononBanks’PerformanceThistablereportstheordinaryleastsquaresregressionresultsforEquation5.8basedonthesampleof307web-launchingannouncementsofpubliclytradedUSbanksduringthe1993-2018period.Ineachregression,thedependentvariableisPERFORMANCE,whichcanbeanyoftheaccountingratiosmentionedinTable5.1;includingROA;ROE;NetInterestMargin;Netoperatingincometoassets;Noninterestincometoassets;Noninterestexpensetoassets;andEfficiencyRatioduring1996-2013 horizon. The main independent variables are Transactional_website_adoption0!,#, Transactional_website_adoption1!,#,Transactional_website_adoption2!,#, Transactional_website_adoption3!,#, Transactional_website_adoption4!,#, Transactional_website_adoption5!,#.Transactional_website_adoption6!,#.Thesetofcontrolvariablesisalsoemployedtocontrolforexogenouscross-sectionaldifferencesinmarketstructuresandbankcharacteristicsandareallobservedannuallyduring the1993-2013period.The sources for this tablearemainly fromFDIC, SNLFinancial,ThomsonFinancialSecuritiesData,theauthor’scalculationsandsomeothersources.Standarderrorsinparentheses.Thesuperscripts***,**,and*indicateastatisticallysignificantdifferencefromzeroatthe1,5,and10percentlevelsofsignificanceintwo-sidedtests.Equation5.8isestimatedwithrobuststandarderrorsclusteredatbankleveltoaccountforserialcorrelationoftheerrorterm.
(1) (2) (3) (4) (5) (6) (7)VARIABLES
ROA ROENetInterestMargin
NetOperatingIncome
Non-interestIncome
Non-interestExpense
Costefficiency
Transactional_website_adoption(0 + 1)!,#
0.554** 2.055** 0.200*** 0.583** 2.167*** 1.510*** -8.612**(0.2592) (0.8600) (0.0742) (0.2626) (0.8052) (0.4884) (4.0777)
Transactional_website_adoption(2 + 3)!,#
1.592* 5.835** 0.270** 1.626* 4.617** 2.764** -17.126***(0.8370) (2.3911) (0.1192) (0.8394) (2.1857) (1.1941) (6.3333)
Transactional_website_adoption(4 + 5)!,#
1.985** 7.582*** 0.383*** 2.019** 5.587** 3.316** -19.247***(0.9608) (2.6486) (0.1386) (0.9634) (2.4520) (1.3340) (7.2717)
Transactional_website_adoption(6andonwards) !,#
2.291** 9.750*** 0.481*** 2.340** 6.737** 4.173*** -21.018**
(0.9494) (2.7073) (0.1807) (0.9522) (2.7149) (1.5978) (8.3882)
Bank_Funding!,# -0.008* -0.017 0.001 -0.008* -0.019 -0.009 0.001 (0.0042) (0.0108) (0.0012) (0.0042) (0.0124) (0.0071) (0.0436)Bank_Leverage!,# 0.173** 0.053 -0.022*** 0.172** 0.725** 0.428** 1.414 (0.0817) (0.1460) (0.0049) (0.0818) (0.2938) (0.1659) (1.0012)Bank_Size!,# 0.066* 0.807*** -0.058** 0.067* 0.098 -0.107 -3.219*** (0.0366) (0.1556) (0.0227) (0.0365) (0.0933) (0.0657) (0.5372)HHI!,# -0.025*** -0.136*** -0.011*** -0.025*** -0.077*** -0.049*** 0.242*** (0.0089) (0.0263) (0.0018) (0.0089) (0.0266) (0.0158) (0.0931)

337
Constant 34.866*** 194.972*** 21.126*** 34.166*** 102.781*** 70.104*** -248.870** (12.3276) (37.1333) (2.5332) (12.3525) (36.0609) (21.3336) (125.7057)Observations 7,597 7,597 7,597 7,597 7,597 7,597 7,597R-squared 0.210 0.161 0.151 0.211 0.381 0.387 0.085YearFixedEffect YES YES YES YES YES YES YES

338
TableA.5.13Themagnitudeeffectintransactionalwebsiteadoption,usingthreesize-basedquantiles.ThistablereportstheordinaryleastsquaresregressionresultsforEquation5.6,basedonthesampleof307web-launchingannouncementsofpubliclytradedUSbanksduringthe1993-2018period.Ineachregression,thedependentvariableisPERFORMANCE,whichcanbeanyoftheaccountingratiosmentionedinTable5.1;includingROA;ROE;NetInterestMargin;Netoperatingincometoassets;Noninterestincometoassets;Noninterestexpensetoassets;andEfficiencyRatioduring1996-2013 horizon. The main independent variables areSmall_Bank!,#and the interaction with the\]^_`^abcd_^e_fgh`cbg_^idjbcd_!,#.Thesetofcontrolvariablesisalsoemployedtocontrolforexogenouscross-sectionaldifferencesinmarketstructuresandbankcharacteristicsandareall observedannuallyduring the1993-2013period.The sources for this tablearemainly fromFDIC, SNLFinancial,ThomsonFinancialSecuritiesData,theauthor’scalculationsandsomeothersources.Standarderrorsinparentheses.Thesuperscripts***,**,and*indicateastatisticallysignificantdifferencefromzeroatthe1,5,and10percentlevelsofsignificanceintwo-sidedtests.Equation5.6isestimatedwithrobuststandarderrorsclusteredatbankleveltoaccountforserialcorrelationoftheerrorterm.VARIABLES (1) (2) (3) (4) (5) (6) (7)
ROA ROE
Net
Interest
Margin
Net
Operating
Income
Non-interest
Income
Non-interest
Expense
Cost
efficiency
Transactional_website_adoption!,#
0.516** 2.224** 0.098 0.542** 1.673*** 0.980** -9.615**
(0.2249) (1.0995) (0.1039) (0.2272) (0.6199) (0.3888) (4.1899)
Small_Bank!,# -1.182*** -6.210*** -0.032 -1.197*** -3.034** -1.305 22.255***
(0.4009) (1.0432) (0.1380) (0.4017) (1.3842) (0.8037) (4.9783)
Medium_Bank!,#
-0.258** -2.255*** -0.000 -0.268** -1.092** -0.586* 0.191
(0.1287) (0.7181) (0.1105) (0.1296) (0.4935) (0.3205) (2.1057)
SmallBank!,#xTransactional_website_adoption!,#
0.925* 2.630** 0.194 0.929* 2.859* 1.851* -11.132**
(0.5160) (1.2658) (0.1182) (0.5174) (1.6863) (0.9673) (5.2994)
MediumBank!,#xTransactional_website_adoption!,#
0.152 0.780 0.082 0.158 0.775 0.673** 5.660***
(0.1471) (0.7579) (0.1020) (0.1481) (0.5253) (0.3271) (2.1419)
Bank_Funding!,# -0.008* -0.020* 0.001 -0.009* -0.021 -0.011 -0.001
(0.0047) (0.0120) (0.0013) (0.0047) (0.0135) (0.0077) (0.0438)
Bank_Leverage!,# 0.172** 0.038 -0.020*** 0.172** 0.722** 0.429** 1.458
(0.0833) (0.1534) (0.0050) (0.0834) (0.2985) (0.1682) (1.0008)
HHI!,# -0.010** -0.057*** -0.009*** -0.009** -0.038*** -0.028*** 0.084
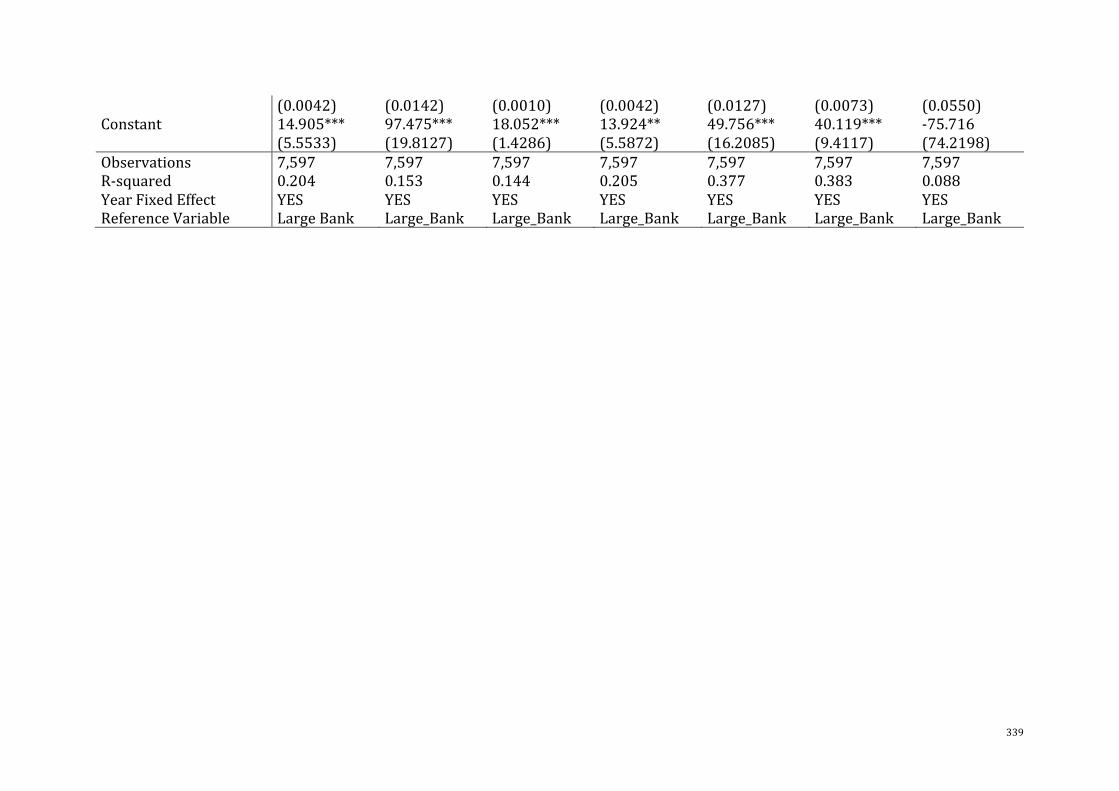
339
(0.0042) (0.0142) (0.0010) (0.0042) (0.0127) (0.0073) (0.0550)
Constant 14.905*** 97.475*** 18.052*** 13.924** 49.756*** 40.119*** -75.716
(5.5533) (19.8127) (1.4286) (5.5872) (16.2085) (9.4117) (74.2198)
Observations 7,597 7,597 7,597 7,597 7,597 7,597 7,597
R-squared 0.204 0.153 0.144 0.205 0.377 0.383 0.088
YearFixedEffect YES YES YES YES YES YES YES
ReferenceVariable LargeBank Large_Bank Large_Bank Large_Bank Large_Bank Large_Bank Large_Bank
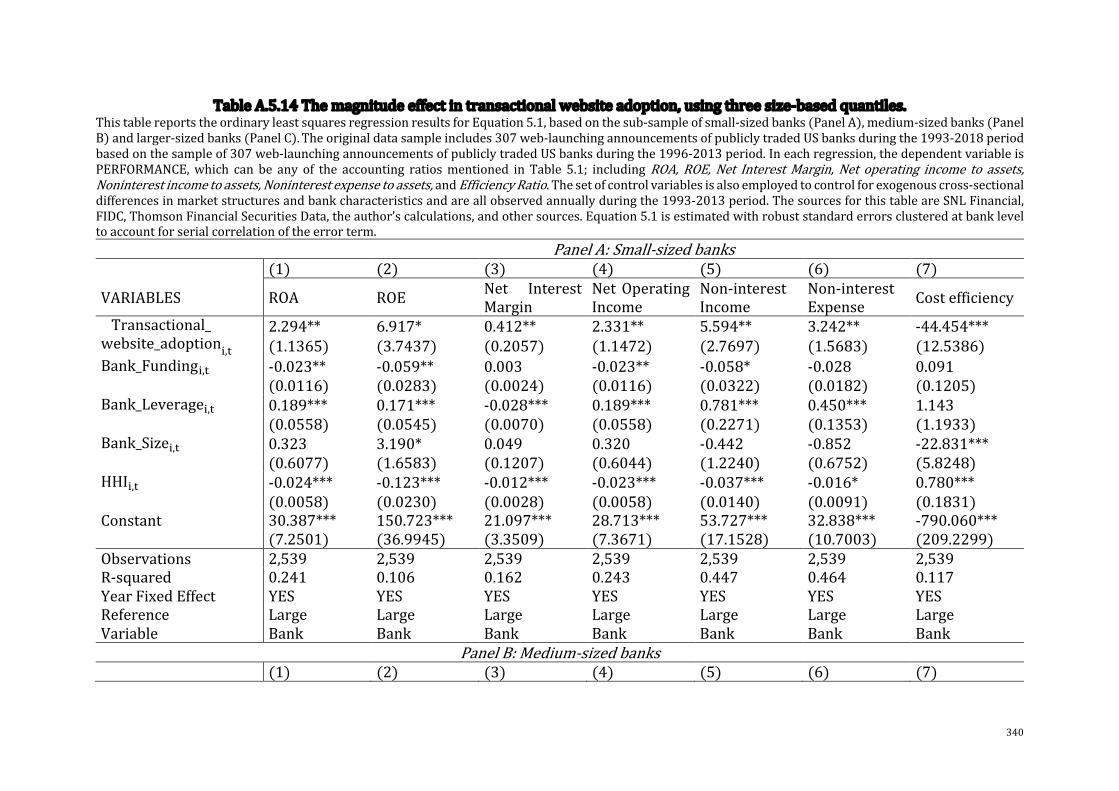
340
TableA.5.14Themagnitudeeffectintransactionalwebsiteadoption,usingthreesize-basedquantiles.ThistablereportstheordinaryleastsquaresregressionresultsforEquation5.1,basedonthesub-sampleofsmall-sizedbanks(PanelA),medium-sizedbanks(PanelB)andlarger-sizedbanks(PanelC).Theoriginaldatasampleincludes307web-launchingannouncementsofpubliclytradedUSbanksduringthe1993-2018periodbasedonthesampleof307web-launchingannouncementsofpubliclytradedUSbanksduringthe1996-2013period.Ineachregression,thedependentvariableisPERFORMANCE,which can be any of the accounting ratiosmentioned in Table 5.1; including ROA, ROE, Net InterestMargin, Net operating income to assets,Noninterestincometoassets,Noninterestexpensetoassets,andEfficiencyRatio.Thesetofcontrolvariablesisalsoemployedtocontrolforexogenouscross-sectionaldifferencesinmarketstructuresandbankcharacteristicsandareallobservedannuallyduringthe1993-2013period.ThesourcesforthistableareSNLFinancial,FIDC,ThomsonFinancialSecuritiesData,theauthor’scalculations,andothersources.Equation5.1isestimatedwithrobuststandarderrorsclusteredatbankleveltoaccountforserialcorrelationoftheerrorterm. PanelA:Small-sizedbanks (1) (2) (3) (4) (5) (6) (7)
VARIABLES ROA ROENet InterestMargin
NetOperatingIncome
Non-interestIncome
Non-interestExpense
Costefficiency
Transactional_website_adoption!,#
2.294** 6.917* 0.412** 2.331** 5.594** 3.242** -44.454***(1.1365) (3.7437) (0.2057) (1.1472) (2.7697) (1.5683) (12.5386)
Bank_Funding!,# -0.023** -0.059** 0.003 -0.023** -0.058* -0.028 0.091 (0.0116) (0.0283) (0.0024) (0.0116) (0.0322) (0.0182) (0.1205)Bank_Leverage!,# 0.189*** 0.171*** -0.028*** 0.189*** 0.781*** 0.450*** 1.143 (0.0558) (0.0545) (0.0070) (0.0558) (0.2271) (0.1353) (1.1933)Bank_Size!,# 0.323 3.190* 0.049 0.320 -0.442 -0.852 -22.831*** (0.6077) (1.6583) (0.1207) (0.6044) (1.2240) (0.6752) (5.8248)HHI!,# -0.024*** -0.123*** -0.012*** -0.023*** -0.037*** -0.016* 0.780*** (0.0058) (0.0230) (0.0028) (0.0058) (0.0140) (0.0091) (0.1831)Constant 30.387*** 150.723*** 21.097*** 28.713*** 53.727*** 32.838*** -790.060*** (7.2501) (36.9945) (3.3509) (7.3671) (17.1528) (10.7003) (209.2299)Observations 2,539 2,539 2,539 2,539 2,539 2,539 2,539R-squared 0.241 0.106 0.162 0.243 0.447 0.464 0.117YearFixedEffect YES YES YES YES YES YES YESReferenceVariable
LargeBank
LargeBank
LargeBank
LargeBank
LargeBank
LargeBank
LargeBank
PanelB:Medium-sizedbanks (1) (2) (3) (4) (5) (6) (7)
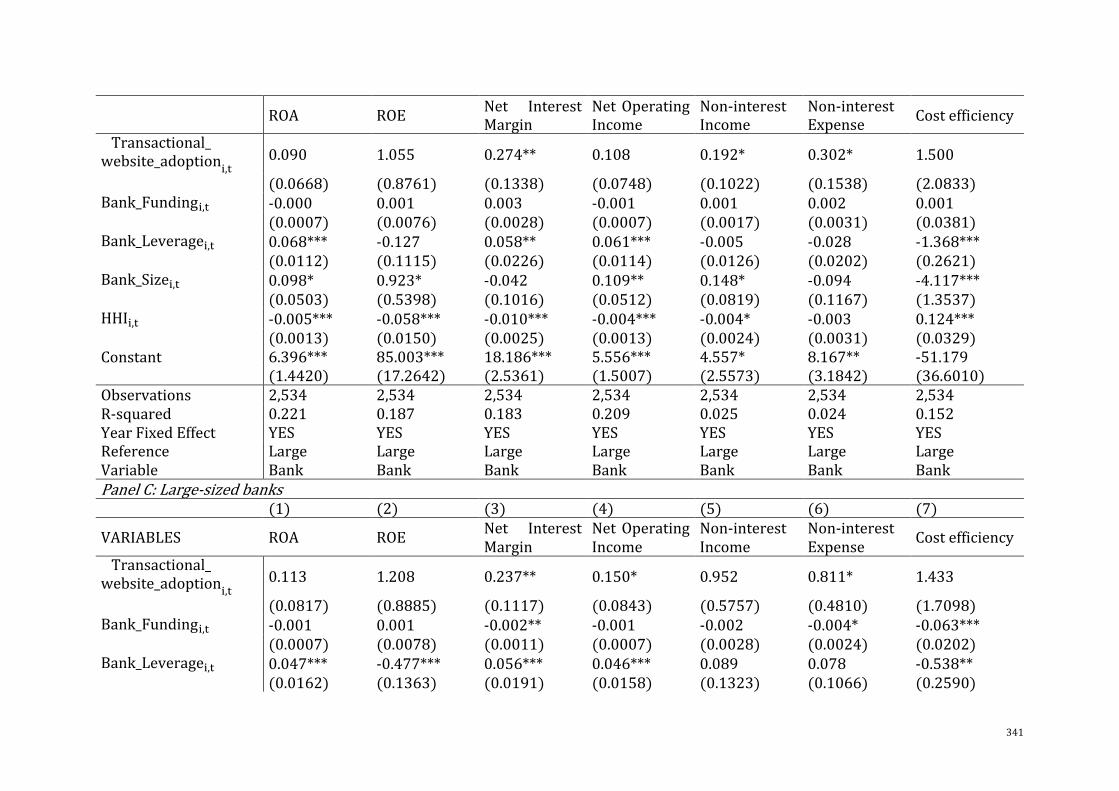
341
ROA ROENet InterestMargin
NetOperatingIncome
Non-interestIncome
Non-interestExpense
Costefficiency
Transactional_website_adoption!,#
0.090 1.055 0.274** 0.108 0.192* 0.302* 1.500
(0.0668) (0.8761) (0.1338) (0.0748) (0.1022) (0.1538) (2.0833)Bank_Funding!,# -0.000 0.001 0.003 -0.001 0.001 0.002 0.001
(0.0007) (0.0076) (0.0028) (0.0007) (0.0017) (0.0031) (0.0381)Bank_Leverage!,# 0.068*** -0.127 0.058** 0.061*** -0.005 -0.028 -1.368***
(0.0112) (0.1115) (0.0226) (0.0114) (0.0126) (0.0202) (0.2621)Bank_Size!,# 0.098* 0.923* -0.042 0.109** 0.148* -0.094 -4.117***
(0.0503) (0.5398) (0.1016) (0.0512) (0.0819) (0.1167) (1.3537)HHI!,# -0.005*** -0.058*** -0.010*** -0.004*** -0.004* -0.003 0.124***
(0.0013) (0.0150) (0.0025) (0.0013) (0.0024) (0.0031) (0.0329)Constant 6.396*** 85.003*** 18.186*** 5.556*** 4.557* 8.167** -51.179 (1.4420) (17.2642) (2.5361) (1.5007) (2.5573) (3.1842) (36.6010)Observations 2,534 2,534 2,534 2,534 2,534 2,534 2,534R-squared 0.221 0.187 0.183 0.209 0.025 0.024 0.152YearFixedEffect YES YES YES YES YES YES YESReferenceVariable
LargeBank
LargeBank
LargeBank
LargeBank
LargeBank
LargeBank
LargeBank
PanelC:Large-sizedbanks (1) (2) (3) (4) (5) (6) (7)
VARIABLES ROA ROE Net InterestMargin
NetOperatingIncome
Non-interestIncome
Non-interestExpense
Costefficiency
Transactional_website_adoption!,#
0.113 1.208 0.237** 0.150* 0.952 0.811* 1.433
(0.0817) (0.8885) (0.1117) (0.0843) (0.5757) (0.4810) (1.7098)Bank_Funding!,# -0.001 0.001 -0.002** -0.001 -0.002 -0.004* -0.063***
(0.0007) (0.0078) (0.0011) (0.0007) (0.0028) (0.0024) (0.0202)Bank_Leverage!,# 0.047*** -0.477*** 0.056*** 0.046*** 0.089 0.078 -0.538**
(0.0162) (0.1363) (0.0191) (0.0158) (0.1323) (0.1066) (0.2590)

342
Bank_Size!,# 0.005 0.138 -0.098*** -0.000 0.222*** 0.076* 0.166 (0.0160) (0.1830) (0.0345) (0.0167) (0.0410) (0.0416) (0.3838)
HHI!,# -0.002 -0.035** -0.012*** -0.002 -0.022* -0.022** -0.026 (0.0015) (0.0161) (0.0018) (0.0016) (0.0122) (0.0099) (0.0280)
Constant 4.187** 66.470*** 21.965*** 3.669* 28.489* 33.346** 104.994*** (2.0492) (22.5750) (2.2974) (2.0537) (15.9215) (12.8957) (36.0571)
Observations 2,524 2,524 2,524 2,524 2,524 2,524 2,524R-squared 0.244 0.274 0.277 0.234 0.070 0.062 0.103YearFixedEffect YES YES YES YES YES YES YESReferenceVariable
LargeBank
LargeBank
LargeBank
LargeBank
LargeBank
LargeBank
LargeBank

343
TableA.5.15Variationin“LearningbyBehaviour”VariableThistabledescribeshowthe"learningbyobservation"proxyvariesoverthestudyperiod,basedontheconstruction ofDeLong andDeYoung (2007). Three “learningby observing” variables- LBOY1, LBOY2,LBOY3areestimated,inturnrepresentingthenumberofbankswhoadoptedtransactionalwebsiteswithinone,twoorthreeyearsbefore.
Eventyear LBOY1 LBOY2 LBOY31996 0 0 01997 29 29 291998 14 43 431999 55 69 982000 32 87 1012001 67 99 1542002 56 123 1552003 25 81 1482004 12 37 932005 8 20 452006 1 9 212008 0 4 52009 2 2 62010 1 3 3

344
TableA.5.16Re-estimationofEquation5.1,usingYearandStateFixedEffectsThis table reports the ordinary least squares regression results for Equation 5.1, using year and state fixed effects. The sample includes 307 web-launchingannouncementsofpubliclytradedUSbanksduringthe1993-2018period.Ineachregression,thedependentvariableisPERFORMANCE,whichcanbeanyoftheaccountingratiosmentionedinTable5.1,includingROA,ROE,NetInterestMargin,Netoperatingincometoassets,Noninterestincometoassets;Noninterestexpensetoassets;andEfficiencyRatioduring1996-2013horizon.IndependentvariablesconsistofthevariableTransactionalwebsiteadoption,whichequals1sincetheyearbanksadopttransactionalwebsitesand0ifotherwise.Thesetofcontrolvariablesisalsoemployedtocontrolforexogenouscross-sectionaldifferencesinmarketstructuresandbankcharacteristicsandareallobservedannuallyduringthe1993-2018period.Thesources forthistablearemainly fromFDIC,SNLFinancial,ThomsonFinancial SecuritiesData, theauthor’s calculationsandsomeother sources. Standarderrors inparentheses.The superscripts ***, **, and* indicateastatisticallysignificantdifferencefromzeroatthe1,5,and10percentlevelsofsignificanceintwo-sidedtests.Equation5.1isestimatedwithrobuststandarderrorsclusteredatbankleveltoaccountforserialcorrelationoftheerrorterm. (1) (2) (3) (4) (5) (6) (7)
VARIABLES ROA ROE NetInterestMargin
NetOperatingIncome
Non-interestIncome
Non-interestExpense
Costefficiency
Transactional_website_adoption!,#
0.791** 2.886** 0.216*** 0.822** 2.576*** 1.682*** -10.527**(0.3527) (1.1168) (0.0749) (0.3559) (0.9779) (0.5708) (4.4696)
Bank_Funding!,# -0.007** -0.019** 0.001 -0.007** -0.015 -0.007 -0.010 (0.0034) (0.0092) (0.0012) (0.0034) (0.0103) (0.0061) (0.0472)Bank_Leverage!,# 0.148** -0.014 -0.025*** 0.148** 0.659*** 0.391*** 1.623* (0.0592) (0.0889) (0.0035) (0.0592) (0.2295) (0.1330) (0.9273)Bank_Size!,# 0.075 0.901*** -0.048** 0.077 0.085 -0.118 -3.648*** (0.0492) (0.1775) (0.0186) (0.0491) (0.1198) (0.0747) (0.6404)HHI!,# -0.010*** -0.068*** -0.009*** -0.010*** -0.035*** -0.024*** 0.140*** (0.0025) (0.0105) (0.0009) (0.0025) (0.0084) (0.0053) (0.0519)Constant 13.312*** 99.271*** 19.408*** 12.380*** 40.716*** 33.968*** -113.931* (3.3335) (15.0637) (1.2278) (3.3624) (10.0785) (6.3680) (66.2903)Observations 7,597 7,597 7,597 7,597 7,597 7,597 7,597R-squared 0.241 0.187 0.336 0.241 0.419 0.426 0.106YearFixedEffect YES YES YES YES YES YES YESStateFixedEffect YES YES YES YES YES YES YESBankFixedEffect NO NO NO NO NO NO NO

345
TableA.5.17Re-estimationofEquation5.2,usingYearandStateFixedEffectThis table reports the ordinary least squares regression results for Equation 5.2, using year and state fix effects. The sample includes 307 web-launchingannouncementsofpubliclytradedUSbanksduringthe1993-2018period.Ineachregression,thedependentvariableisPERFORMANCE,whichcanbeanyoftheaccountingratiosmentionedinTable5.1,includingROA,ROE;NetInterestMargin;Netoperatingincometoassets;Noninterestincometoassets;Noninterestexpensetoassets;andEfficiencyRatioduring1993-2018horizon.Independentvariablesconsistofthevariable“Z[\]^\_`ab]\c_efg^a`f_fhif[af]_f!,#”whichequals0beforeandatthetimethatbanksadopttheirtransactionalwebsitesandequals1,2,3,4…atyear1,2,3,4…afterbankshaveadoptedthetransactionalwebsites.Thesetofcontrolvariablesisalsoemployedtocontrolforexogenouscross-sectionaldifferencesinmarketstructuresandbankcharacteristicsandareallobservedannuallyduringthe1993-2018period.ThesourcesforthistablearemainlyfromFDIC,SNLFinancial,ThomsonFinancialSecuritiesData,theauthor’scalculationsandsomeothersources.Standarderrorsinparentheses.Thesuperscripts***,**,and*indicateastatisticallysignificantdifferencefromzeroatthe1,5,and10percentlevelsofsignificanceintwo-sidedtests.Equation5.2isestimatedwithrobuststandarderrorsclusteredatbankleveltoaccountforserialcorrelationoftheerrorterm.
(1) (2) (3) (4) (5) (6) (7)VARIABLES
ROA ROE Net InterestMargin
NetOperatingIncome
Non-interestIncome
Non-interestExpense
Costefficiency
Transactional_website_experience!,#
0.004** 0.010 0.004*** 0.004** 0.015** 0.011** -0.015(0.0018) (0.0128) (0.0014) (0.0018) (0.0074) (0.0047) (0.0772)
Bank_Funding!,# -0.007** -0.019** 0.001 -0.007** -0.015 -0.007 -0.010 (0.0034) (0.0092) (0.0012) (0.0034) (0.0103) (0.0061) (0.0472)
Bank_Leverage!,# 0.146** -0.020 -0.025*** 0.146** 0.653*** 0.387*** 1.647* (0.0595) (0.0905) (0.0037) (0.0595) (0.2308) (0.1340) (0.9387)
Bank_Size!,# 0.088** 0.951*** -0.045** 0.091** 0.128 -0.091 -3.835*** (0.0439) (0.1668) (0.0185) (0.0439) (0.1089) (0.0701) (0.6475)
HHI!,# -0.003** -0.041*** -0.007*** -0.002 -0.011*** -0.008*** 0.041 (0.0013) (0.0067) (0.0007) (0.0013) (0.0033) (0.0023) (0.0262)
Constant 2.718 60.603*** 16.545*** 1.378 6.261 11.481*** 27.331 (1.9816) (9.3570) (0.8854) (1.9834) (5.6586) (3.5426) (25.8782)
Observations 7,597 7,597 7,597 7,597 7,597 7,597 7,597R-squared 0.236 0.183 0.334 0.237 0.414 0.419 0.103YearFixedEffect YES YES YES YES YES YES YESStateFixedEffect YES YES YES YES YES YES YESBankFixedEffect NO NO NO NO NO NO NO
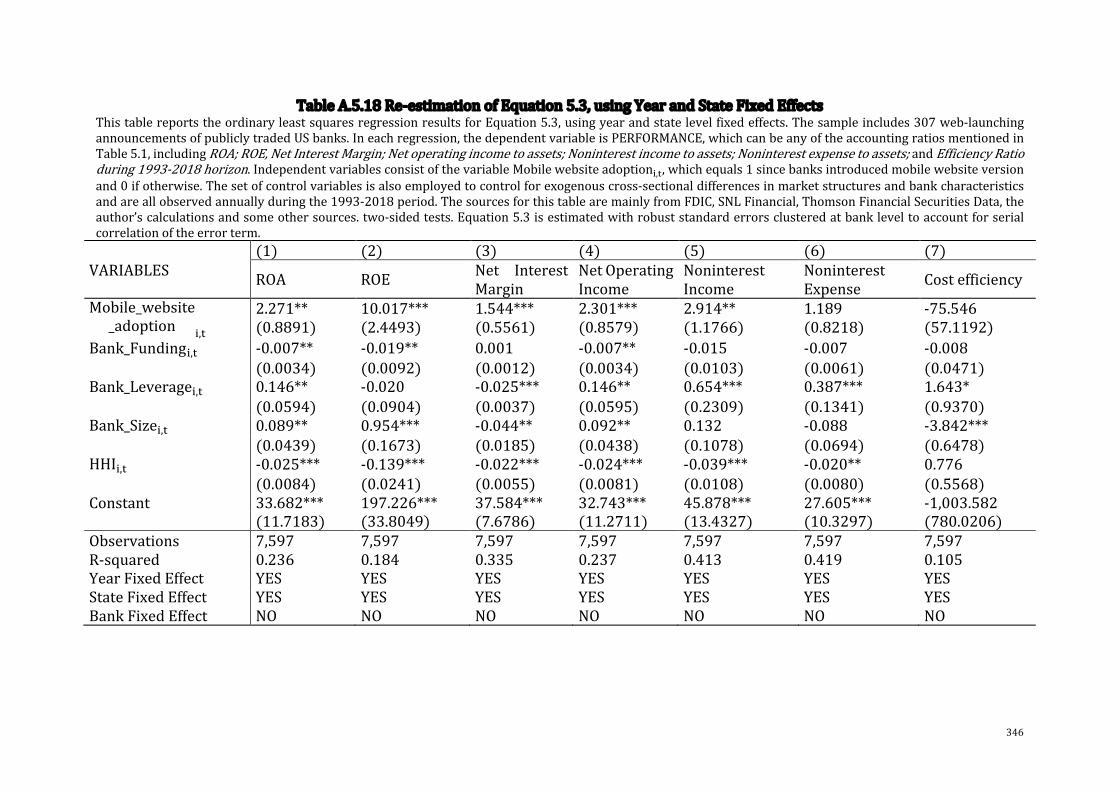
346
TableA.5.18Re-estimationofEquation5.3,usingYearandStateFixedEffectsThistablereportstheordinaryleastsquaresregressionresultsforEquation5.3,usingyearandstatelevelfixedeffects.Thesampleincludes307web-launchingannouncementsofpubliclytradedUSbanks.Ineachregression,thedependentvariableisPERFORMANCE,whichcanbeanyoftheaccountingratiosmentionedinTable5.1,includingROA;ROE,NetInterestMargin;Netoperatingincometoassets;Noninterestincometoassets;Noninterestexpensetoassets;andEfficiencyRatioduring1993-2018horizon.IndependentvariablesconsistofthevariableMobilewebsiteadoption$,%,whichequals1sincebanksintroducedmobilewebsiteversionand0ifotherwise.Thesetofcontrolvariablesisalsoemployedtocontrolforexogenouscross-sectionaldifferencesinmarketstructuresandbankcharacteristicsandareallobservedannuallyduringthe1993-2018period.ThesourcesforthistablearemainlyfromFDIC,SNLFinancial,ThomsonFinancialSecuritiesData,theauthor’scalculationsandsomeothersources.two-sidedtests.Equation5.3isestimatedwithrobuststandarderrorsclusteredatbankleveltoaccountforserialcorrelationoftheerrorterm. (1) (2) (3) (4) (5) (6) (7)VARIABLES ROA ROE Net Interest
MarginNetOperatingIncome
NoninterestIncome
NoninterestExpense Costefficiency
Mobile_website_adoption !,#
2.271** 10.017*** 1.544*** 2.301*** 2.914** 1.189 -75.546(0.8891) (2.4493) (0.5561) (0.8579) (1.1766) (0.8218) (57.1192)
Bank_Funding!,# -0.007** -0.019** 0.001 -0.007** -0.015 -0.007 -0.008 (0.0034) (0.0092) (0.0012) (0.0034) (0.0103) (0.0061) (0.0471)Bank_Leverage!,# 0.146** -0.020 -0.025*** 0.146** 0.654*** 0.387*** 1.643* (0.0594) (0.0904) (0.0037) (0.0595) (0.2309) (0.1341) (0.9370)Bank_Size!,# 0.089** 0.954*** -0.044** 0.092** 0.132 -0.088 -3.842*** (0.0439) (0.1673) (0.0185) (0.0438) (0.1078) (0.0694) (0.6478)HHI!,# -0.025*** -0.139*** -0.022*** -0.024*** -0.039*** -0.020** 0.776 (0.0084) (0.0241) (0.0055) (0.0081) (0.0108) (0.0080) (0.5568)Constant 33.682*** 197.226*** 37.584*** 32.743*** 45.878*** 27.605*** -1,003.582 (11.7183) (33.8049) (7.6786) (11.2711) (13.4327) (10.3297) (780.0206)Observations 7,597 7,597 7,597 7,597 7,597 7,597 7,597R-squared 0.236 0.184 0.335 0.237 0.413 0.419 0.105YearFixedEffect YES YES YES YES YES YES YESStateFixedEffect YES YES YES YES YES YES YESBankFixedEffect NO NO NO NO NO NO NO
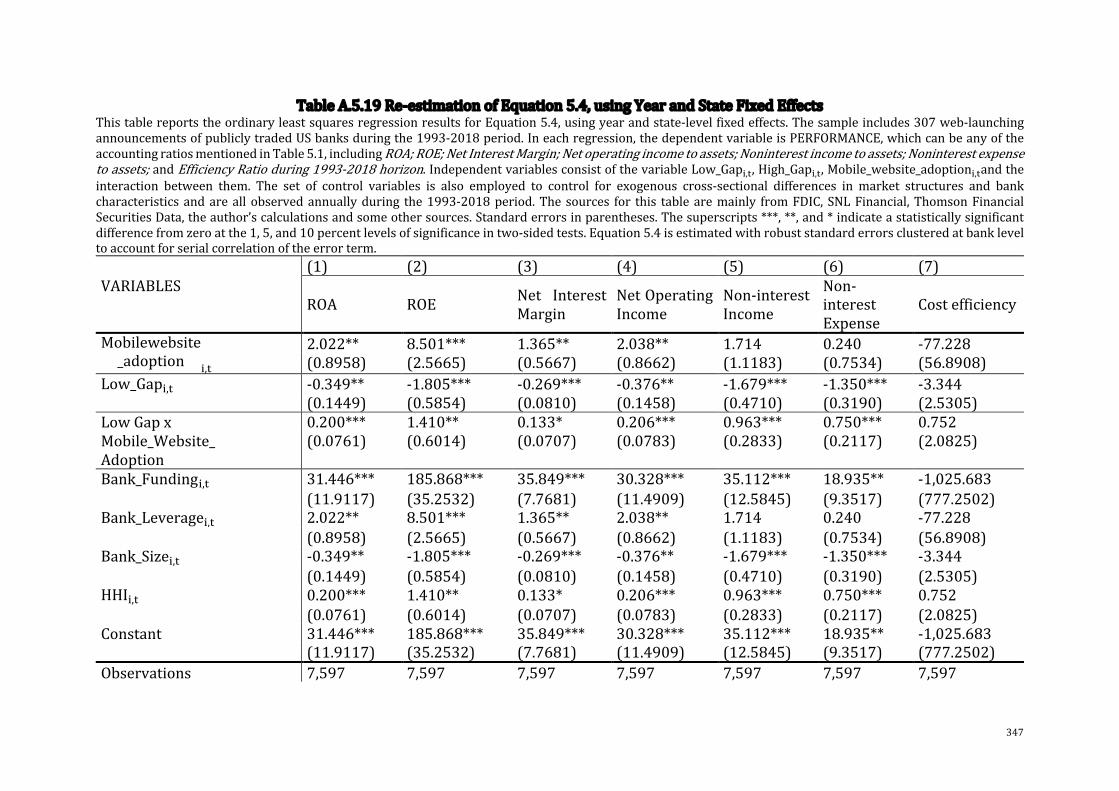
347
TableA.5.19Re-estimationofEquation5.4,usingYearandStateFixedEffectsThistablereportstheordinaryleastsquaresregressionresultsforEquation5.4,usingyearandstate-levelfixedeffects.Thesampleincludes307web-launchingannouncementsofpubliclytradedUSbanksduringthe1993-2018period.Ineachregression,thedependentvariableisPERFORMANCE,whichcanbeanyoftheaccountingratiosmentionedinTable5.1,includingROA;ROE;NetInterestMargin;Netoperatingincometoassets;Noninterestincometoassets;Noninterestexpensetoassets;andEfficiencyRatioduring1993-2018horizon.IndependentvariablesconsistofthevariableLow_Gap$,%,High_Gap$,%,Mobile_website_adoption$,%andtheinteraction between them. The set of control variables is also employed to control for exogenous cross-sectional differences in market structures and bankcharacteristicsandareall observedannuallyduring the1993-2018period.The sources for this tablearemainly fromFDIC, SNLFinancial,ThomsonFinancialSecuritiesData,theauthor’scalculationsandsomeothersources.Standarderrorsinparentheses.Thesuperscripts***,**,and*indicateastatisticallysignificantdifferencefromzeroatthe1,5,and10percentlevelsofsignificanceintwo-sidedtests.Equation5.4isestimatedwithrobuststandarderrorsclusteredatbankleveltoaccountforserialcorrelationoftheerrorterm. (1) (2) (3) (4) (5) (6) (7)VARIABLES
ROA ROE Net InterestMargin
NetOperatingIncome
Non-interestIncome
Non-interestExpense
Costefficiency
Mobilewebsite_adoption !,#
2.022** 8.501*** 1.365** 2.038** 1.714 0.240 -77.228(0.8958) (2.5665) (0.5667) (0.8662) (1.1183) (0.7534) (56.8908)
Low_Gap!,# -0.349** -1.805*** -0.269*** -0.376** -1.679*** -1.350*** -3.344(0.1449) (0.5854) (0.0810) (0.1458) (0.4710) (0.3190) (2.5305)
LowGapxMobile_Website_Adoption
0.200*** 1.410** 0.133* 0.206*** 0.963*** 0.750*** 0.752(0.0761) (0.6014) (0.0707) (0.0783) (0.2833) (0.2117) (2.0825)
Bank_Funding!,# 31.446*** 185.868*** 35.849*** 30.328*** 35.112*** 18.935** -1,025.683 (11.9117) (35.2532) (7.7681) (11.4909) (12.5845) (9.3517) (777.2502)Bank_Leverage!,# 2.022** 8.501*** 1.365** 2.038** 1.714 0.240 -77.228 (0.8958) (2.5665) (0.5667) (0.8662) (1.1183) (0.7534) (56.8908)Bank_Size!,# -0.349** -1.805*** -0.269*** -0.376** -1.679*** -1.350*** -3.344 (0.1449) (0.5854) (0.0810) (0.1458) (0.4710) (0.3190) (2.5305)HHI!,# 0.200*** 1.410** 0.133* 0.206*** 0.963*** 0.750*** 0.752 (0.0761) (0.6014) (0.0707) (0.0783) (0.2833) (0.2117) (2.0825)Constant 31.446*** 185.868*** 35.849*** 30.328*** 35.112*** 18.935** -1,025.683 (11.9117) (35.2532) (7.7681) (11.4909) (12.5845) (9.3517) (777.2502)Observations 7,597 7,597 7,597 7,597 7,597 7,597 7,597
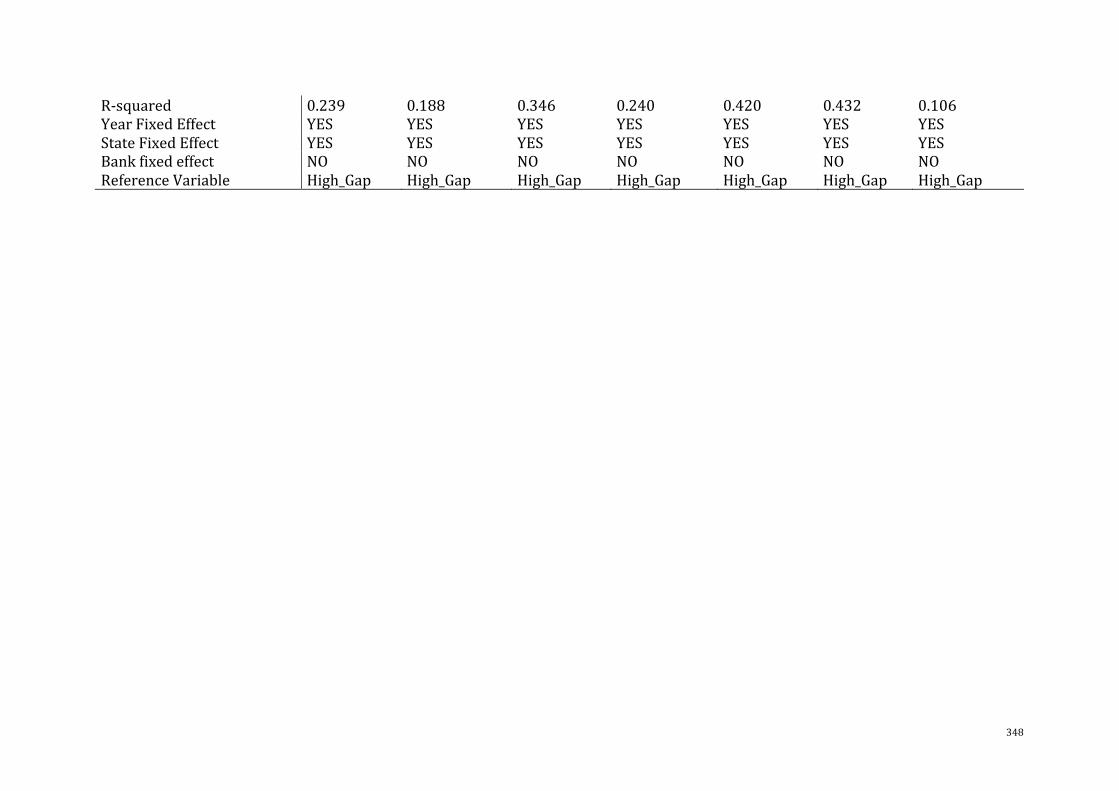
348
R-squared 0.239 0.188 0.346 0.240 0.420 0.432 0.106YearFixedEffect YES YES YES YES YES YES YESStateFixedEffect YES YES YES YES YES YES YESBankfixedeffect NO NO NO NO NO NO NOReferenceVariable High_Gap High_Gap High_Gap High_Gap High_Gap High_Gap High_Gap

349
TableA.5.20Re-estimationofEquation5.5,usingYearandStateFixedEffectsThistablereportstheordinaryleastsquaresregressionresultsforEquation5.5,usingyear,state,andbank-levelfixedeffects.Thesampleincludes307web-launchingannouncementsofpubliclytradedUSbanksduringthe1993-2018period.Ineachregression,thedependentvariableisPERFORMANCE,whichcanbeanyoftheaccountingratiosmentionedinTable5.1,includingROA,ROE;NetInterestMargin;Netoperatingincometoassets;Noninterestincometoassets;Noninterestexpensetoassets;andEfficiencyRatioduring1993-2018horizon.Themainindependentvariableis“Learningbyobserving”(LBOY$,%)whichisestimatedasthenumberofthecumulativenumberofsamplebanksthatadoptedtransactionalwebsitesduringthreeyearsbeforethetransactionalwebsiteofbanki.Thesetofcontrolvariablesisalsoemployedtocontrolforexogenouscross-sectionaldifferencesinmarketstructuresandbankcharacteristicsandareallobservedannuallyduringthe1993-2018period.ThesourcesforthistablearemainlyfromFDIC,SNLFinancial,ThomsonFinancialSecuritiesData,theauthor’scalculationsandsomeothersources.Standarderrorsinparentheses.Thesuperscripts***,**,and*indicateastatisticallysignificantdifferencefromzeroatthe1,5,and10percentlevelsofsignificanceintwo-sidedtests.Equation5.5isestimatedwithrobuststandarderrorsclusteredatbankleveltoaccountforserialcorrelationoftheerrorterm. (1) (2) (3) (4) (5) (6) (7)
VARIABLES ROA ROE NetInterestMargin
NetOperatingIncome
Non-interestIncome
Non-interestExpense
Costefficiency
LBOY!,# -0.004 -0.019 0.001 -0.004 -0.023** -0.017** -0.033 (0.0036) (0.0140) (0.0013) (0.0036) (0.0112) (0.0076) (0.0346)Bank_Funding!,# -0.009** -0.027*** 0.001 -0.009** -0.020* -0.010 0.057* (0.0039) (0.0100) (0.0012) (0.0039) (0.0122) (0.0072) (0.0334)Bank_Leverage!,# 0.227*** 0.103 -0.015** 0.227*** 0.919*** 0.544*** 0.131 (0.0514) (0.0661) (0.0068) (0.0516) (0.2191) (0.1259) (0.2419)Bank_Size!,# 0.036 0.692*** -0.051*** 0.035 -0.062 -0.213** -3.248*** (0.0640) (0.2199) (0.0186) (0.0641) (0.1588) (0.0980) (0.6010)HHI!,# -0.004 0.047 0.011*** -0.005 0.020 0.024 -0.019 (0.0172) (0.0334) (0.0023) (0.0172) (0.0409) (0.0200) (0.0438)Constant 4.583 -68.471 -10.706*** 5.583 -38.794 -35.894 130.379* (26.3800) (52.5610) (3.6348) (26.3711) (61.5000) (30.0124) (69.4742)Observations 5,855 5,855 5,855 5,855 5,855 5,855 5,855R-squared 0.349 0.190 0.307 0.350 0.555 0.568 0.125YearFixedEffect YES YES YES YES YES YES YESStateFixedEffect YES YES YES YES YES YES YESBankFixedEffect NO NO NO NO NO NO NO

350
TableA.5.21Re-estimationofEquation5.6,usingYearandStateFixedEffectsThistablereportstheordinaryleastsquaresregressionresultsforEquation5.6,usingyearandstate-levelfixedeffects.Thesampleincludes307web-launchingannouncementsofpubliclytradedUSbanksduringthe1993-2018period.Ineachregression,thedependentvariableisPERFORMANCE,whichcanbeanyoftheaccountingratiosmentionedinTable5.1;includingROA;ROE;NetInterestMargin;Netoperatingincometoassets;Noninterestincometoassets;Noninterestexpenseto assets; and Efficiency Ratio during 1996-2013 horizon. The main independent variables areSmall_Bank$,%and the interaction with theZ[\]^\_`ab]\c_efg^a`f_\sbi`ab]$,%.Thesetofcontrolvariablesisalsoemployedtocontrolforexogenouscross-sectionaldifferencesinmarketstructuresandbankcharacteristicsandareall observedannuallyduring the1993-2013period.The sources for this tablearemainly fromFDIC, SNLFinancial,ThomsonFinancialSecurities Data, the author’s calculations and some other sources. Please note that the results in this table only display the coefficients ofSmall_Bank$,%andSmall_Bank$,%x Transactional_website_adoption$,%. Large_Bank$,% is treated as a reference category. Therefore, the coefficients shownSmall_Bank$,%andSmall_Bank$,%x Transactional_website_adoption$,%variables present the comparison to Large_Bank$,%andLarge_Bank$,%xTransactional_website_adoption$,%. Thesmall-sized bankgroup comprises 50% of sample banks with the smallest asset values each year, and thelarge-sizedbankgroupincludestheremaining50%ofbankswiththelargestmarketcapitalization.Standarderrorsinparentheses.Thesuperscripts***,**,and*indicateastatisticallysignificantdifferencefromzeroatthe1,5,and10percentlevelsofsignificanceintwo-sidedtests.Equation5.6isestimatedwithrobuststandarderrorsclusteredatbankleveltoaccountforserialcorrelationoftheerrorterm.
(1) (2) (3) (4) (5) (6) (7)
VARIABLES ROA ROENetInterestMargin
NetOperatingIncome
Non-interestIncome
Non-interestExpense
Costefficiency
Transactional_website_adoption!,#
0.366** 1.378 0.127 0.400** 1.238*** 0.846*** -5.471(0.1824) (0.9125) (0.0825) (0.1852) (0.4382) (0.2835) (3.9380)
Small_Bank!,#-0.574** -2.546*** -0.207** -0.584** -1.697* -1.031* 6.833**(0.2907) (0.7354) (0.0985) (0.2910) (0.9275) (0.5348) (3.0121)
Small_Bank!,#xTransactional_website_adoption!,#
0.730** 2.560*** 0.148* 0.723** 2.304** 1.441** -8.681**
Bank_Funding!,# (0.3233) (0.7974) (0.0820) (0.3244) (1.1017) (0.6411) (3.7125) Bank_Leverage!,# -0.007** -0.019** 0.001 -0.007** -0.016 -0.007 -0.009 (0.0034) (0.0091) (0.0012) (0.0034) (0.0103) (0.0061) (0.0470)HHI!,# 0.150** -0.007 -0.024*** 0.150** 0.666*** 0.395*** 1.599* (0.0589) (0.0870) (0.0035) (0.0590) (0.2290) (0.1326) (0.9179)Constant 0.083 0.813*** -0.066** 0.081 0.135 -0.081 -3.740***
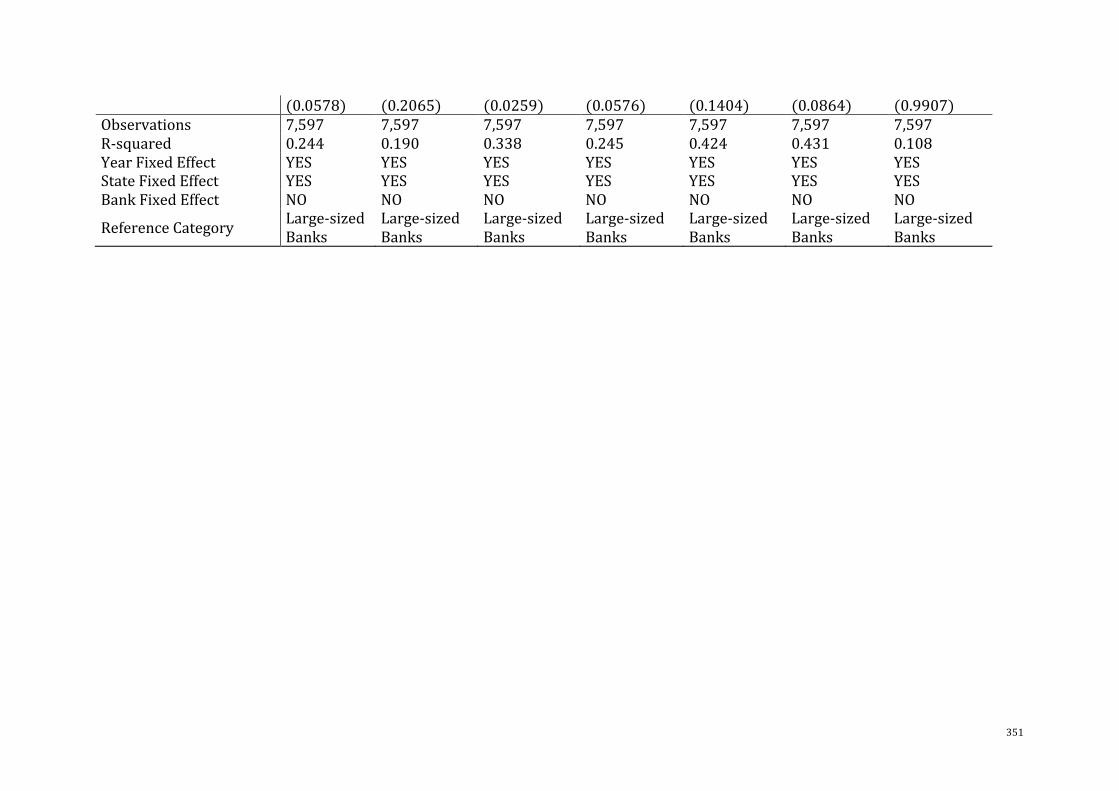
351
(0.0578) (0.2065) (0.0259) (0.0576) (0.1404) (0.0864) (0.9907)Observations 7,597 7,597 7,597 7,597 7,597 7,597 7,597R-squared 0.244 0.190 0.338 0.245 0.424 0.431 0.108YearFixedEffect YES YES YES YES YES YES YESStateFixedEffect YES YES YES YES YES YES YESBankFixedEffect NO NO NO NO NO NO NO
ReferenceCategory Large-sizedBanks
Large-sizedBanks
Large-sizedBanks
Large-sizedBanks
Large-sizedBanks
Large-sizedBanks
Large-sizedBanks
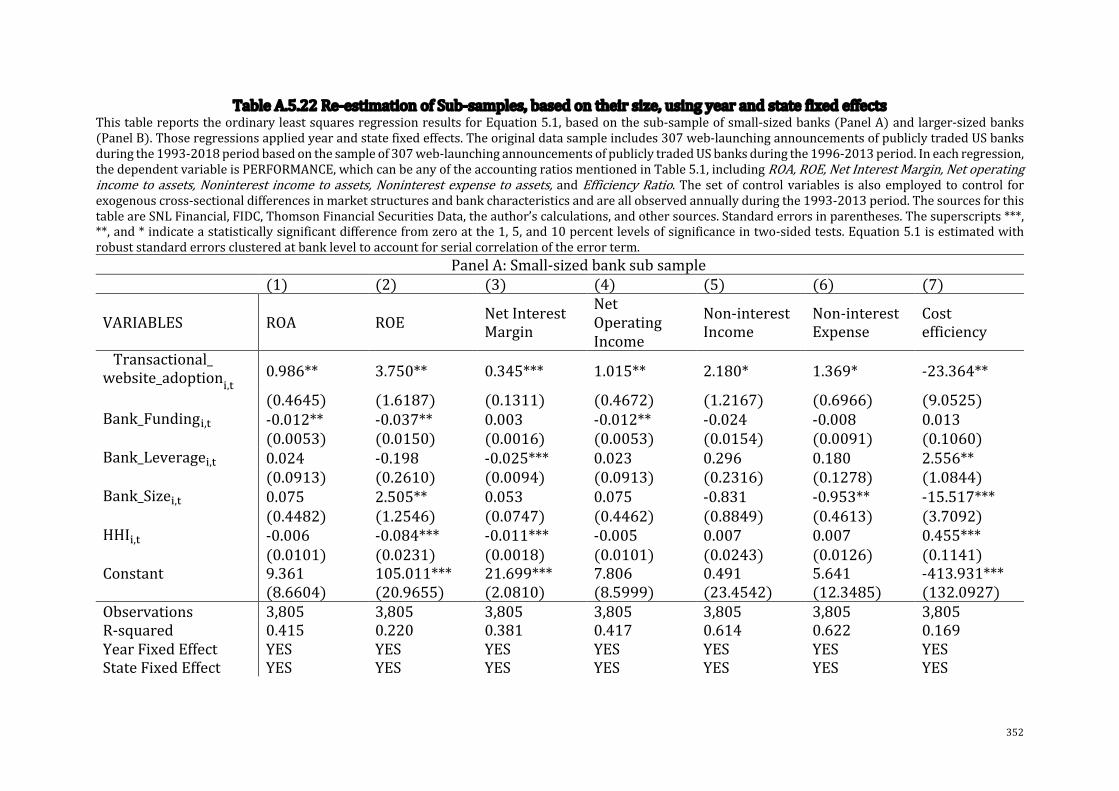
352
TableA.5.22Re-estimationofSub-samples,basedontheirsize,usingyearandstatefixedeffectsThistablereportstheordinaryleastsquaresregressionresultsforEquation5.1,basedonthesub-sampleofsmall-sizedbanks(PanelA)andlarger-sizedbanks(PanelB).Thoseregressionsappliedyearandstatefixedeffects.Theoriginaldatasampleincludes307web-launchingannouncementsofpubliclytradedUSbanksduringthe1993-2018periodbasedonthesampleof307web-launchingannouncementsofpubliclytradedUSbanksduringthe1996-2013period.Ineachregression,thedependentvariableisPERFORMANCE,whichcanbeanyoftheaccountingratiosmentionedinTable5.1,includingROA,ROE,NetInterestMargin,Netoperatingincome toassets,Noninterest income toassets,Noninterestexpense toassets,andEfficiencyRatio.Thesetof controlvariables isalsoemployed tocontrol forexogenouscross-sectionaldifferencesinmarketstructuresandbankcharacteristicsandareallobservedannuallyduringthe1993-2013period.ThesourcesforthistableareSNLFinancial,FIDC,ThomsonFinancialSecuritiesData,theauthor’scalculations,andothersources.Standarderrorsinparentheses.Thesuperscripts***,**,and*indicateastatisticallysignificantdifferencefromzeroatthe1,5,and10percentlevelsofsignificanceintwo-sidedtests.Equation5.1isestimatedwithrobuststandarderrorsclusteredatbankleveltoaccountforserialcorrelationoftheerrorterm.
PanelA:Small-sizedbanksubsample (1) (2) (3) (4) (5) (6) (7)
VARIABLES ROA ROE NetInterestMargin
NetOperatingIncome
Non-interestIncome
Non-interestExpense
Costefficiency
Transactional_website_adoption!,#
0.986** 3.750** 0.345*** 1.015** 2.180* 1.369* -23.364**
(0.4645) (1.6187) (0.1311) (0.4672) (1.2167) (0.6966) (9.0525)Bank_Funding!,# -0.012** -0.037** 0.003 -0.012** -0.024 -0.008 0.013 (0.0053) (0.0150) (0.0016) (0.0053) (0.0154) (0.0091) (0.1060)Bank_Leverage!,# 0.024 -0.198 -0.025*** 0.023 0.296 0.180 2.556** (0.0913) (0.2610) (0.0094) (0.0913) (0.2316) (0.1278) (1.0844)Bank_Size!,# 0.075 2.505** 0.053 0.075 -0.831 -0.953** -15.517*** (0.4482) (1.2546) (0.0747) (0.4462) (0.8849) (0.4613) (3.7092)HHI!,# -0.006 -0.084*** -0.011*** -0.005 0.007 0.007 0.455*** (0.0101) (0.0231) (0.0018) (0.0101) (0.0243) (0.0126) (0.1141)Constant 9.361 105.011*** 21.699*** 7.806 0.491 5.641 -413.931*** (8.6604) (20.9655) (2.0810) (8.5999) (23.4542) (12.3485) (132.0927)Observations 3,805 3,805 3,805 3,805 3,805 3,805 3,805R-squared 0.415 0.220 0.381 0.417 0.614 0.622 0.169YearFixedEffect YES YES YES YES YES YES YESStateFixedEffect YES YES YES YES YES YES YES

353
BankFixedEffect NO NO NO NO NO NO NO
PanelB:Large-sizedbanksubsample
VARIABLES ROA ROENetInterestMargin
NetOperatingIncome
Non-interestIncome
Non-interestExpense
Costefficiency
Transactional_website_adoption!,#
0.047 0.622 0.138* 0.088 0.592 0.523* 1.426
(0.0669) (0.7451) (0.0818) (0.0775) (0.3643) (0.3031) (1.7092)Bank_Funding!,# -0.001 -0.000 0.000 -0.001* -0.000 -0.001 -0.031 (0.0005) (0.0061) (0.0014) (0.0005) (0.0015) (0.0020) (0.0221)Bank_Leverage!,# 0.063*** -0.266** 0.051*** 0.061*** 0.083 0.050 -1.000*** (0.0145) (0.1210) (0.0142) (0.0144) (0.0981) (0.0783) (0.2197)Bank_Size!,# 0.031*** 0.430*** -0.101*** 0.032** 0.172*** -0.011 -1.017** (0.0120) (0.1333) (0.0241) (0.0129) (0.0498) (0.0461) (0.4099)HHI!,# -0.003*** -0.043*** -0.010*** -0.003** -0.015** -0.014** 0.028 (0.0011) (0.0117) (0.0012) (0.0012) (0.0072) (0.0059) (0.0238)Constant 4.467*** 72.262*** 20.795*** 4.198*** 18.907** 23.545*** 49.372 (1.4143) (16.4387) (1.5637) (1.5186) (8.7802) (7.1953) (30.3377)Observations 3,792 3,792 3,792 3,792 3,792 3,792 3,792R-squared 0.272 0.279 0.406 0.265 0.252 0.239 0.201YearFixedEffect YES YES YES YES YES YES YESStateFixedEffect YES YES YES YES YES YES YESBankFixedEffect NO NO NO NO NO NO NO
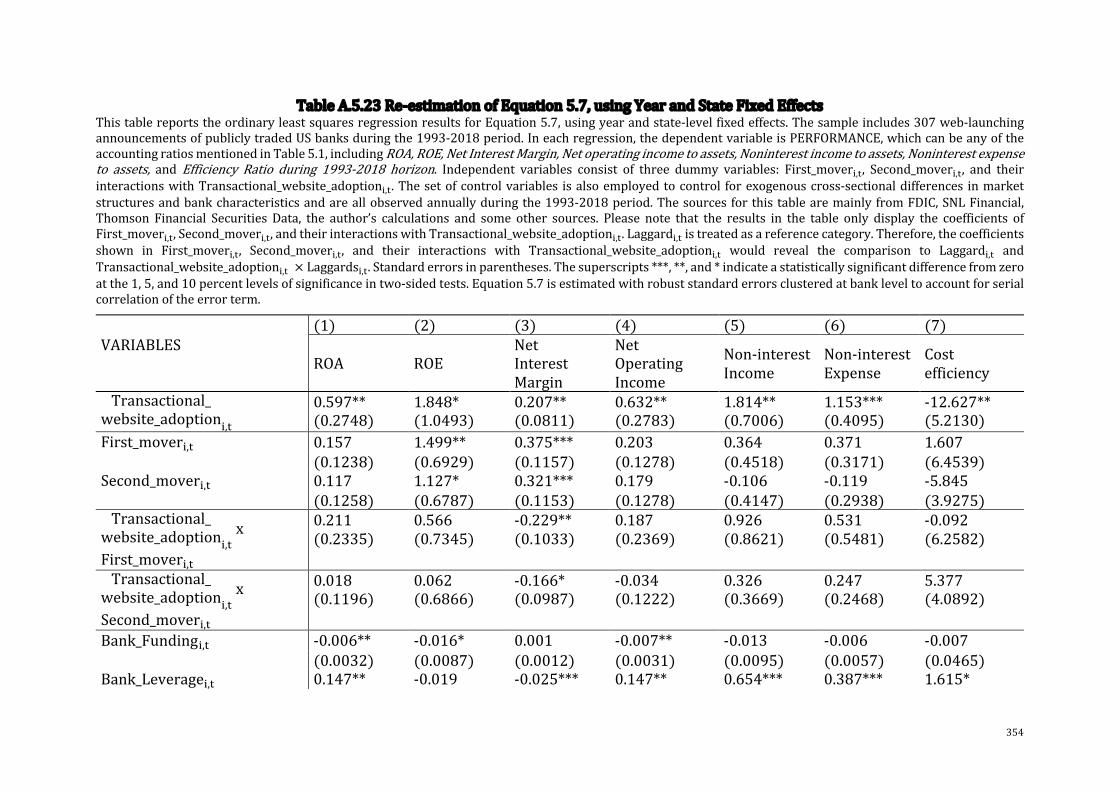
354
TableA.5.23Re-estimationofEquation5.7,usingYearandStateFixedEffectsThistablereportstheordinaryleastsquaresregressionresultsforEquation5.7,usingyearandstate-levelfixedeffects.Thesampleincludes307web-launchingannouncementsofpubliclytradedUSbanksduringthe1993-2018period.Ineachregression,thedependentvariableisPERFORMANCE,whichcanbeanyoftheaccountingratiosmentionedinTable5.1,includingROA,ROE,NetInterestMargin,Netoperatingincometoassets,Noninterestincometoassets,Noninterestexpenseto assets, and Efficiency Ratio during 1993-2018 horizon. Independent variables consist of three dummy variables: First_mover$,%, Second_mover$,%, and theirinteractionswithTransactional_website_adoption$,%.Thesetofcontrolvariables isalsoemployedtocontrol forexogenouscross-sectionaldifferences inmarketstructuresandbankcharacteristicsandareallobservedannuallyduringthe1993-2018period.Thesources forthistablearemainly fromFDIC,SNLFinancial,Thomson Financial Securities Data, the author’s calculations and some other sources. Please note that the results in the table only display the coefficients ofFirst_mover$,%,Second_mover$,%,andtheirinteractionswithTransactional_website_adoption$,%.Laggard$,%istreatedasareferencecategory.Therefore,thecoefficientsshown in First_mover$,%, Second_mover$,%, and their interactions with Transactional_website_adoption$,% would reveal the comparison to Laggard$,% andTransactional_website_adoption$,% × Laggards$,%.Standarderrorsinparentheses.Thesuperscripts***,**,and*indicateastatisticallysignificantdifferencefromzeroatthe1,5,and10percentlevelsofsignificanceintwo-sidedtests.Equation5.7isestimatedwithrobuststandarderrorsclusteredatbankleveltoaccountforserialcorrelationoftheerrorterm.
(1) (2) (3) (4) (5) (6) (7)VARIABLES
ROA ROENetInterestMargin
NetOperatingIncome
Non-interestIncome
Non-interestExpense
Costefficiency
Transactional_website_adoption!,#
0.597** 1.848* 0.207** 0.632** 1.814** 1.153*** -12.627**(0.2748) (1.0493) (0.0811) (0.2783) (0.7006) (0.4095) (5.2130)
First_mover!,# 0.157 1.499** 0.375*** 0.203 0.364 0.371 1.607 (0.1238) (0.6929) (0.1157) (0.1278) (0.4518) (0.3171) (6.4539)Second_mover!,# 0.117 1.127* 0.321*** 0.179 -0.106 -0.119 -5.845 (0.1258) (0.6787) (0.1153) (0.1278) (0.4147) (0.2938) (3.9275)Transactional_website_adoption!,#
x
First_mover!,#
0.211 0.566 -0.229** 0.187 0.926 0.531 -0.092(0.2335) (0.7345) (0.1033) (0.2369) (0.8621) (0.5481) (6.2582)
Transactional_website_adoption!,#
x
Second_mover!,#
0.018 0.062 -0.166* -0.034 0.326 0.247 5.377(0.1196) (0.6866) (0.0987) (0.1222) (0.3669) (0.2468) (4.0892)
Bank_Funding!,# -0.006** -0.016* 0.001 -0.007** -0.013 -0.006 -0.007 (0.0032) (0.0087) (0.0012) (0.0031) (0.0095) (0.0057) (0.0465)Bank_Leverage!,# 0.147** -0.019 -0.025*** 0.147** 0.654*** 0.387*** 1.615*
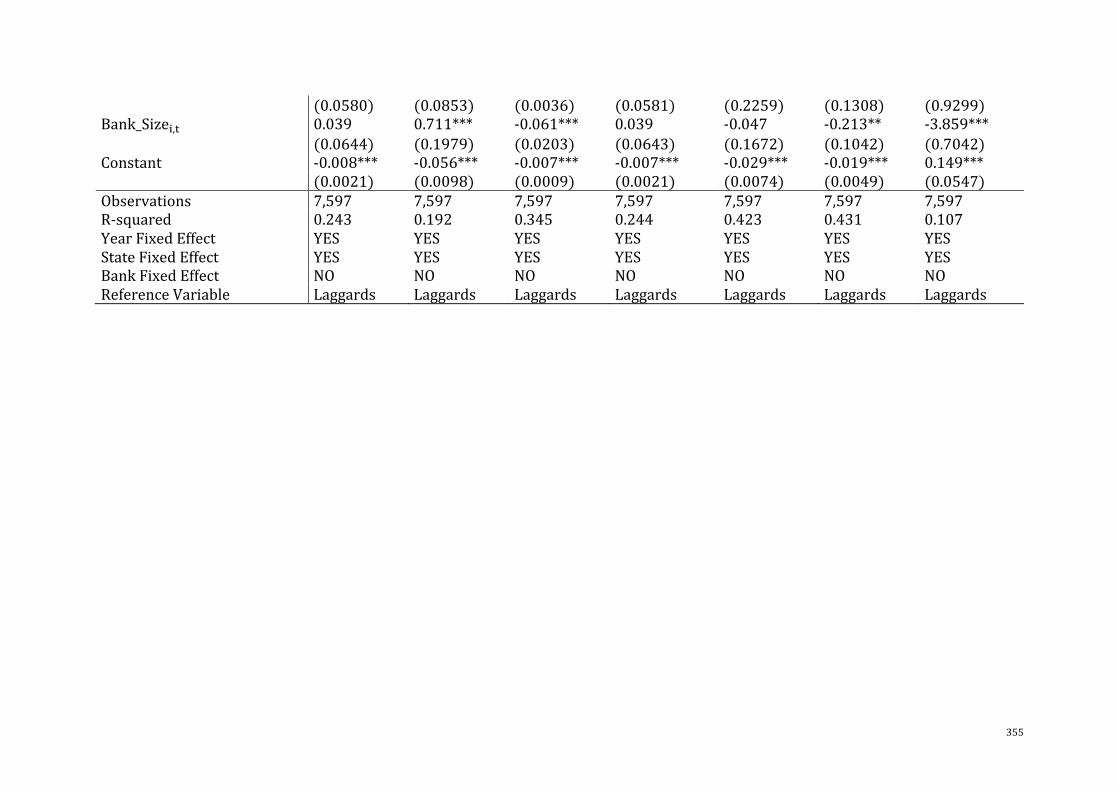
355
(0.0580) (0.0853) (0.0036) (0.0581) (0.2259) (0.1308) (0.9299)Bank_Size!,# 0.039 0.711*** -0.061*** 0.039 -0.047 -0.213** -3.859*** (0.0644) (0.1979) (0.0203) (0.0643) (0.1672) (0.1042) (0.7042)Constant -0.008*** -0.056*** -0.007*** -0.007*** -0.029*** -0.019*** 0.149*** (0.0021) (0.0098) (0.0009) (0.0021) (0.0074) (0.0049) (0.0547)Observations 7,597 7,597 7,597 7,597 7,597 7,597 7,597R-squared 0.243 0.192 0.345 0.244 0.423 0.431 0.107YearFixedEffect YES YES YES YES YES YES YESStateFixedEffect YES YES YES YES YES YES YESBankFixedEffect NO NO NO NO NO NO NOReferenceVariable Laggards Laggards Laggards Laggards Laggards Laggards Laggards
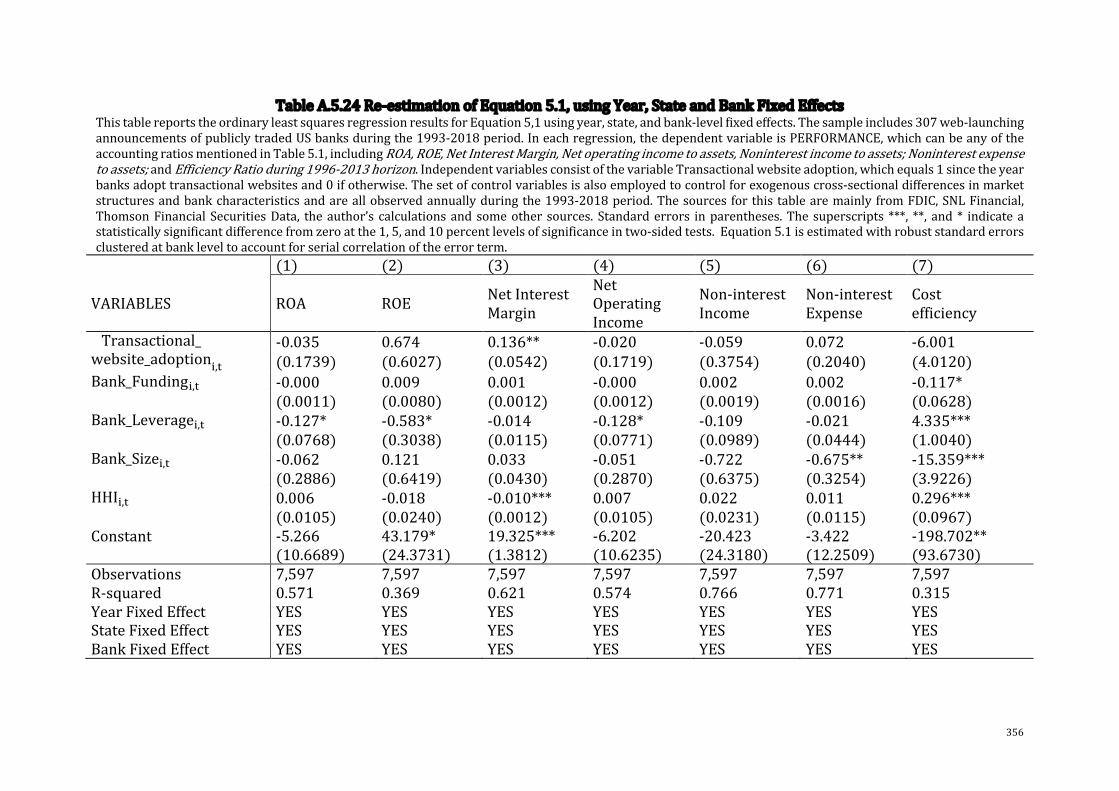
356
TableA.5.24Re-estimationofEquation5.1,usingYear,StateandBankFixedEffectsThistablereportstheordinaryleastsquaresregressionresultsforEquation5,1usingyear,state,andbank-levelfixedeffects.Thesampleincludes307web-launchingannouncementsofpubliclytradedUSbanksduringthe1993-2018period.Ineachregression,thedependentvariableisPERFORMANCE,whichcanbeanyoftheaccountingratiosmentionedinTable5.1,includingROA,ROE,NetInterestMargin,Netoperatingincometoassets,Noninterestincometoassets;Noninterestexpensetoassets;andEfficiencyRatioduring1996-2013horizon.IndependentvariablesconsistofthevariableTransactionalwebsiteadoption,whichequals1sincetheyearbanksadopttransactionalwebsitesand0ifotherwise.Thesetofcontrolvariablesisalsoemployedtocontrolforexogenouscross-sectionaldifferencesinmarketstructuresandbankcharacteristicsandareallobservedannuallyduringthe1993-2018period.Thesources forthistablearemainly fromFDIC,SNLFinancial,ThomsonFinancial SecuritiesData, theauthor’s calculationsandsomeother sources. Standarderrors inparentheses.The superscripts ***, **, and* indicateastatisticallysignificantdifferencefromzeroatthe1,5,and10percentlevelsofsignificanceintwo-sidedtests.Equation5.1isestimatedwithrobuststandarderrorsclusteredatbankleveltoaccountforserialcorrelationoftheerrorterm. (1) (2) (3) (4) (5) (6) (7)
VARIABLES ROA ROE NetInterestMargin
NetOperatingIncome
Non-interestIncome
Non-interestExpense
Costefficiency
Transactional_website_adoption!,#
-0.035 0.674 0.136** -0.020 -0.059 0.072 -6.001(0.1739) (0.6027) (0.0542) (0.1719) (0.3754) (0.2040) (4.0120)
Bank_Funding!,# -0.000 0.009 0.001 -0.000 0.002 0.002 -0.117* (0.0011) (0.0080) (0.0012) (0.0012) (0.0019) (0.0016) (0.0628)Bank_Leverage!,# -0.127* -0.583* -0.014 -0.128* -0.109 -0.021 4.335*** (0.0768) (0.3038) (0.0115) (0.0771) (0.0989) (0.0444) (1.0040)Bank_Size!,# -0.062 0.121 0.033 -0.051 -0.722 -0.675** -15.359*** (0.2886) (0.6419) (0.0430) (0.2870) (0.6375) (0.3254) (3.9226)HHI!,# 0.006 -0.018 -0.010*** 0.007 0.022 0.011 0.296*** (0.0105) (0.0240) (0.0012) (0.0105) (0.0231) (0.0115) (0.0967)Constant -5.266 43.179* 19.325*** -6.202 -20.423 -3.422 -198.702** (10.6689) (24.3731) (1.3812) (10.6235) (24.3180) (12.2509) (93.6730)Observations 7,597 7,597 7,597 7,597 7,597 7,597 7,597R-squared 0.571 0.369 0.621 0.574 0.766 0.771 0.315YearFixedEffect YES YES YES YES YES YES YESStateFixedEffect YES YES YES YES YES YES YESBankFixedEffect YES YES YES YES YES YES YES
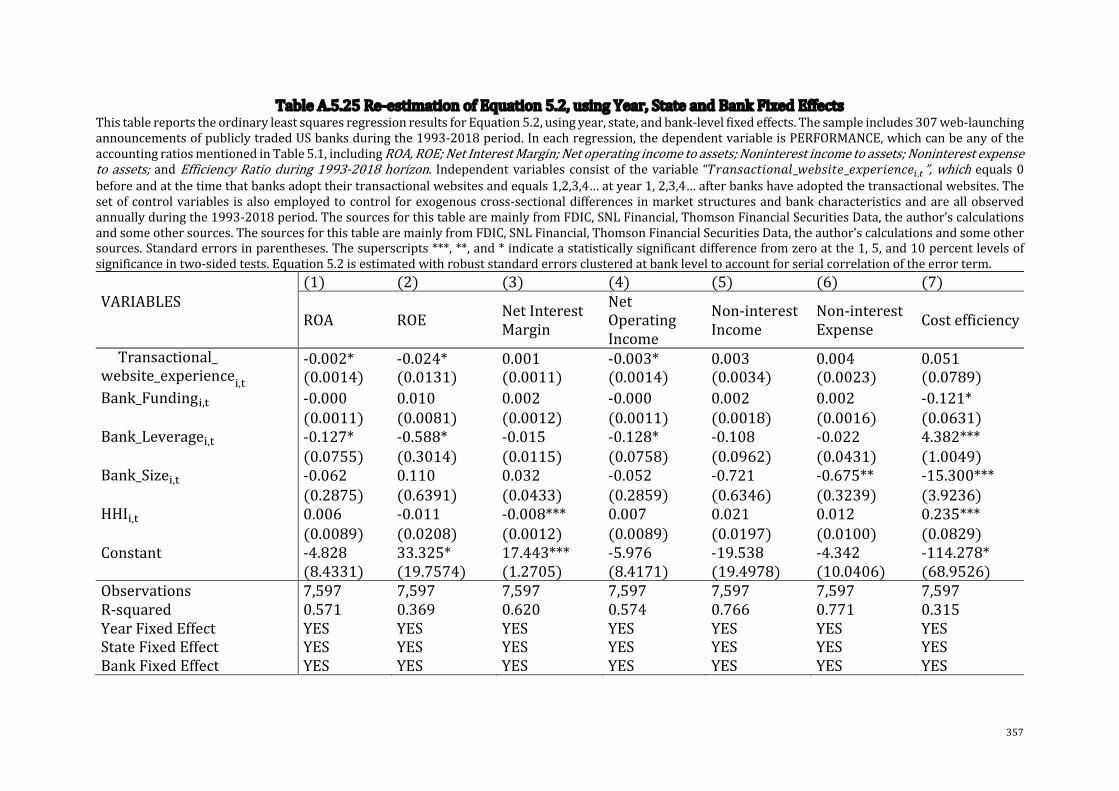
357
TableA.5.25Re-estimationofEquation5.2,usingYear,StateandBankFixedEffectsThistablereportstheordinaryleastsquaresregressionresultsforEquation5.2,usingyear,state,andbank-levelfixedeffects.Thesampleincludes307web-launchingannouncementsofpubliclytradedUSbanksduringthe1993-2018period.Ineachregression,thedependentvariableisPERFORMANCE,whichcanbeanyoftheaccountingratiosmentionedinTable5.1,includingROA,ROE;NetInterestMargin;Netoperatingincometoassets;Noninterestincometoassets;Noninterestexpensetoassets;andEfficiencyRatioduring1993-2018horizon. Independentvariablesconsistof thevariable “Z[\]^\_`ab]\c_efg^a`f_fhif[af]_f!,#”,whichequals0beforeandatthetimethatbanksadopttheirtransactionalwebsitesandequals1,2,3,4…atyear1,2,3,4…afterbankshaveadoptedthetransactionalwebsites.Thesetofcontrolvariablesisalsoemployedtocontrol forexogenouscross-sectionaldifferencesinmarketstructuresandbankcharacteristicsandareallobservedannuallyduringthe1993-2018period.ThesourcesforthistablearemainlyfromFDIC,SNLFinancial,ThomsonFinancialSecuritiesData,theauthor’scalculationsandsomeothersources.ThesourcesforthistablearemainlyfromFDIC,SNLFinancial,ThomsonFinancialSecuritiesData,theauthor’scalculationsandsomeothersources.Standarderrorsinparentheses.Thesuperscripts***,**,and*indicateastatisticallysignificantdifferencefromzeroatthe1,5,and10percentlevelsofsignificanceintwo-sidedtests.Equation5.2isestimatedwithrobuststandarderrorsclusteredatbankleveltoaccountforserialcorrelationoftheerrorterm. (1) (2) (3) (4) (5) (6) (7)VARIABLES
ROA ROE NetInterestMargin
NetOperatingIncome
Non-interestIncome
Non-interestExpense Costefficiency
Transactional_website_experience!,#
-0.002* -0.024* 0.001 -0.003* 0.003 0.004 0.051(0.0014) (0.0131) (0.0011) (0.0014) (0.0034) (0.0023) (0.0789)
Bank_Funding!,# -0.000 0.010 0.002 -0.000 0.002 0.002 -0.121* (0.0011) (0.0081) (0.0012) (0.0011) (0.0018) (0.0016) (0.0631)Bank_Leverage!,# -0.127* -0.588* -0.015 -0.128* -0.108 -0.022 4.382*** (0.0755) (0.3014) (0.0115) (0.0758) (0.0962) (0.0431) (1.0049)Bank_Size!,# -0.062 0.110 0.032 -0.052 -0.721 -0.675** -15.300*** (0.2875) (0.6391) (0.0433) (0.2859) (0.6346) (0.3239) (3.9236)HHI!,# 0.006 -0.011 -0.008*** 0.007 0.021 0.012 0.235*** (0.0089) (0.0208) (0.0012) (0.0089) (0.0197) (0.0100) (0.0829)Constant -4.828 33.325* 17.443*** -5.976 -19.538 -4.342 -114.278* (8.4331) (19.7574) (1.2705) (8.4171) (19.4978) (10.0406) (68.9526)Observations 7,597 7,597 7,597 7,597 7,597 7,597 7,597R-squared 0.571 0.369 0.620 0.574 0.766 0.771 0.315YearFixedEffect YES YES YES YES YES YES YESStateFixedEffect YES YES YES YES YES YES YESBankFixedEffect YES YES YES YES YES YES YES

358
TableA.5.26Re-estimationofEquation5.3,usingYear,StateandBankFixedEffectsThistablereportstheordinaryleastsquaresregressionresultsforEquation5.3,usingyear,state,andbank-levelfixedeffects.Thesampleincludes307web-launchingannouncementsofpubliclytradedUSbanks.Ineachregression,thedependentvariableisPERFORMANCE,whichcanbeanyoftheaccountingratiosmentionedinTable5.1,includingROA;ROE,NetInterestMargin;Netoperatingincometoassets;Noninterestincometoassets;Noninterestexpensetoassets;andEfficiencyRatioduring1993-2018horizon.IndependentvariablesconsistofthevariableMobilewebsiteadoption$,%,whichequals1sincebanksintroducedmobilewebsiteversionand0ifotherwise.Thesetofcontrolvariablesisalsoemployedtocontrolforexogenouscross-sectionaldifferencesinmarketstructuresandbankcharacteristicsandareallobservedannuallyduringthe1993-2018period.ThesourcesforthistablearemainlyfromFDIC,SNLFinancial,ThomsonFinancialSecuritiesData,theauthor’scalculationsandsomeothersources.Standarderrorsinparentheses.Thesuperscripts***,**,and*indicateastatisticallysignificantdifferencefromzeroatthe1,5,and10percentlevelsofsignificanceintwo-sidedtests.Equation5.3isestimatedwithrobuststandarderrorsclusteredatbankleveltoaccountforserialcorrelationoftheerrorterm. (1) (2) (3) (4) (5) (6) (7)VARIABLES
ROA ROENetInterestMargin
NetOperatingIncome
NoninterestIncome
NoninterestExpense Costefficiency
Mobilewebsiteadoption !,#
0.631 3.109 0.124 0.657 -0.310 -1.131*** -56.336(0.6391) (2.2429) (0.5774) (0.6188) (0.2616) (0.3770) (56.5783)
Bank_Funding!,# -0.000 0.009 0.002 -0.000 0.002 0.002 -0.120* (0.0011) (0.0081) (0.0012) (0.0011) (0.0018) (0.0016) (0.0629)Bank_Leverage!,# -0.127* -0.588* -0.015 -0.128* -0.108 -0.022 4.375*** (0.0756) (0.3017) (0.0115) (0.0759) (0.0961) (0.0431) (1.0053)Bank_Size!,# -0.061 0.114 0.032 -0.051 -0.721 -0.675** -15.294*** (0.2874) (0.6391) (0.0433) (0.2857) (0.6351) (0.3242) (3.9334)HHI!,# -0.000 -0.041 -0.010 0.000 0.024 0.023** 0.785 (0.0123) (0.0349) (0.0058) (0.0122) (0.0217) (0.0114) (0.5558)Constant 3.296 75.150* 16.776** 2.497 -24.584 -21.820* -885.380 (13.9747) (42.1702) (8.0437) (13.8016) (22.6544) (12.4507) (775.2592)Observations 7,597 7,597 7,597 7,597 7,597 7,597 7,597R-squared 0.571 0.368 0.620 0.574 0.766 0.771 0.315YearFixedEffect YES YES YES YES YES YES YESStateFixedEffect YES YES YES YES YES YES YESBankFixedEffect YES YES YES YES YES YES YES
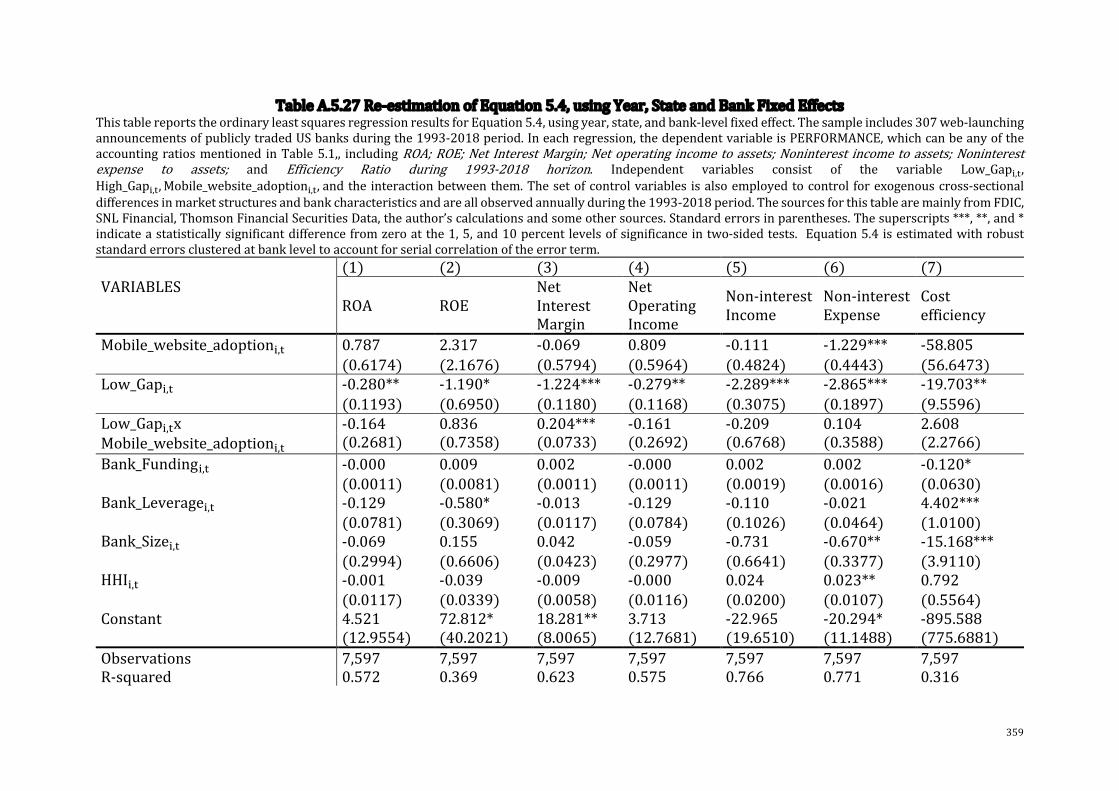
359
TableA.5.27Re-estimationofEquation5.4,usingYear,StateandBankFixedEffectsThistablereportstheordinaryleastsquaresregressionresultsforEquation5.4,usingyear,state,andbank-levelfixedeffect.Thesampleincludes307web-launchingannouncementsofpubliclytradedUSbanksduringthe1993-2018period.Ineachregression,thedependentvariableisPERFORMANCE,whichcanbeanyoftheaccountingratiosmentioned inTable5.1,, includingROA;ROE;Net InterestMargin;Netoperating income toassets;Noninterest income toassets;Noninterestexpense to assets; and Efficiency Ratio during 1993-2018 horizon. Independent variables consist of the variable Low_Gap$,%,High_Gap$,%, Mobile_website_adoption$,%,andthe interactionbetweenthem.Thesetofcontrolvariables isalsoemployedtocontrol forexogenouscross-sectionaldifferencesinmarketstructuresandbankcharacteristicsandareallobservedannuallyduringthe1993-2018period.ThesourcesforthistablearemainlyfromFDIC,SNLFinancial,ThomsonFinancialSecuritiesData,theauthor’scalculationsandsomeothersources.Standarderrorsinparentheses.Thesuperscripts***,**,and*indicateastatisticallysignificantdifferencefromzeroatthe1,5,and10percentlevelsofsignificanceintwo-sidedtests. Equation5.4isestimatedwithrobuststandarderrorsclusteredatbankleveltoaccountforserialcorrelationoftheerrorterm. (1) (2) (3) (4) (5) (6) (7)VARIABLES
ROA ROENetInterestMargin
NetOperatingIncome
Non-interestIncome
Non-interestExpense
Costefficiency
Mobile_website_adoption!,# 0.787 2.317 -0.069 0.809 -0.111 -1.229*** -58.805 (0.6174) (2.1676) (0.5794) (0.5964) (0.4824) (0.4443) (56.6473)Low_Gap!,# -0.280** -1.190* -1.224*** -0.279** -2.289*** -2.865*** -19.703** (0.1193) (0.6950) (0.1180) (0.1168) (0.3075) (0.1897) (9.5596)Low_Gap!,#xMobile_website_adoption!,#
-0.164 0.836 0.204*** -0.161 -0.209 0.104 2.608(0.2681) (0.7358) (0.0733) (0.2692) (0.6768) (0.3588) (2.2766)
Bank_Funding!,# -0.000 0.009 0.002 -0.000 0.002 0.002 -0.120* (0.0011) (0.0081) (0.0011) (0.0011) (0.0019) (0.0016) (0.0630)Bank_Leverage!,# -0.129 -0.580* -0.013 -0.129 -0.110 -0.021 4.402*** (0.0781) (0.3069) (0.0117) (0.0784) (0.1026) (0.0464) (1.0100)Bank_Size!,# -0.069 0.155 0.042 -0.059 -0.731 -0.670** -15.168*** (0.2994) (0.6606) (0.0423) (0.2977) (0.6641) (0.3377) (3.9110)HHI!,# -0.001 -0.039 -0.009 -0.000 0.024 0.023** 0.792 (0.0117) (0.0339) (0.0058) (0.0116) (0.0200) (0.0107) (0.5564)Constant 4.521 72.812* 18.281** 3.713 -22.965 -20.294* -895.588 (12.9554) (40.2021) (8.0065) (12.7681) (19.6510) (11.1488) (775.6881)Observations 7,597 7,597 7,597 7,597 7,597 7,597 7,597R-squared 0.572 0.369 0.623 0.575 0.766 0.771 0.316

360
YearFixedEffect YES YES YES YES YES YES YESStateFixedEffect YES YES YES YES YES YES YESBankfixedeffect YES YES YES YES YES YES YESReferenceVariable High_Gap High_Gap High_Gap High_Gap High_Gap High_Gap High_Gap
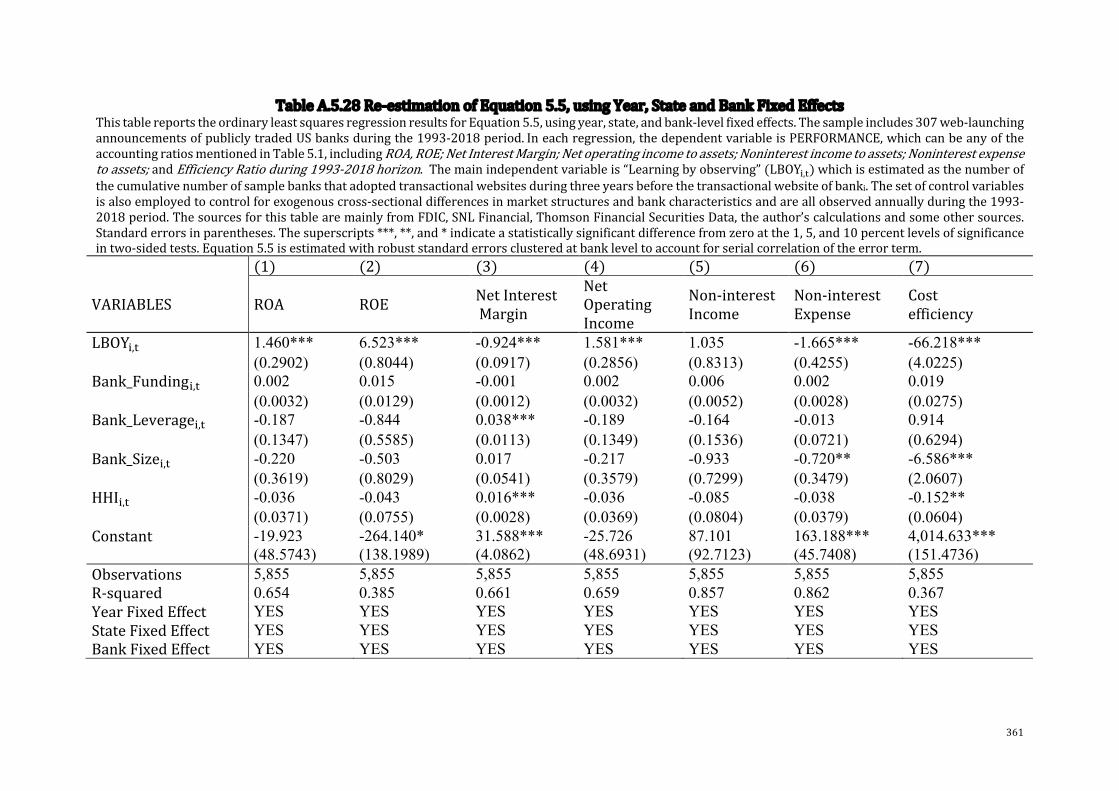
361
TableA.5.28Re-estimationofEquation5.5,usingYear,StateandBankFixedEffectsThistablereportstheordinaryleastsquaresregressionresultsforEquation5.5,usingyear,state,andbank-levelfixedeffects.Thesampleincludes307web-launchingannouncementsofpubliclytradedUSbanksduringthe1993-2018period.Ineachregression,thedependentvariableisPERFORMANCE,whichcanbeanyoftheaccountingratiosmentionedinTable5.1,includingROA,ROE;NetInterestMargin;Netoperatingincometoassets;Noninterestincometoassets;Noninterestexpensetoassets;andEfficiencyRatioduring1993-2018horizon.Themainindependentvariableis“Learningbyobserving”(LBOY$,%)whichisestimatedasthenumberofthecumulativenumberofsamplebanksthatadoptedtransactionalwebsitesduringthreeyearsbeforethetransactionalwebsiteofbanki.Thesetofcontrolvariablesisalsoemployedtocontrolforexogenouscross-sectionaldifferencesinmarketstructuresandbankcharacteristicsandareallobservedannuallyduringthe1993-2018period.ThesourcesforthistablearemainlyfromFDIC,SNLFinancial,ThomsonFinancialSecuritiesData,theauthor’scalculationsandsomeothersources.Standarderrorsinparentheses.Thesuperscripts***,**,and*indicateastatisticallysignificantdifferencefromzeroatthe1,5,and10percentlevelsofsignificanceintwo-sidedtests.Equation5.5isestimatedwithrobuststandarderrorsclusteredatbankleveltoaccountforserialcorrelationoftheerrorterm. (1) (2) (3) (4) (5) (6) (7)
VARIABLES ROA ROE NetInterestMargin
NetOperatingIncome
Non-interestIncome
Non-interestExpense
Costefficiency
LBOY!,# 1.460*** 6.523*** -0.924*** 1.581*** 1.035 -1.665*** -66.218*** (0.2902) (0.8044) (0.0917) (0.2856) (0.8313) (0.4255) (4.0225)Bank_Funding!,# 0.002 0.015 -0.001 0.002 0.006 0.002 0.019 (0.0032) (0.0129) (0.0012) (0.0032) (0.0052) (0.0028) (0.0275)Bank_Leverage!,# -0.187 -0.844 0.038*** -0.189 -0.164 -0.013 0.914 (0.1347) (0.5585) (0.0113) (0.1349) (0.1536) (0.0721) (0.6294)Bank_Size!,# -0.220 -0.503 0.017 -0.217 -0.933 -0.720** -6.586*** (0.3619) (0.8029) (0.0541) (0.3579) (0.7299) (0.3479) (2.0607)HHI!,# -0.036 -0.043 0.016*** -0.036 -0.085 -0.038 -0.152** (0.0371) (0.0755) (0.0028) (0.0369) (0.0804) (0.0379) (0.0604)Constant -19.923 -264.140* 31.588*** -25.726 87.101 163.188*** 4,014.633*** (48.5743) (138.1989) (4.0862) (48.6931) (92.7123) (45.7408) (151.4736)Observations 5,855 5,855 5,855 5,855 5,855 5,855 5,855R-squared 0.654 0.385 0.661 0.659 0.857 0.862 0.367YearFixedEffect YES YES YES YES YES YES YESStateFixedEffect YES YES YES YES YES YES YESBankFixedEffect YES YES YES YES YES YES YES

362
TableA.5.29Re-estimationofEquation5.6,usingYear,StateandBankFixedEffectsThistablereportstheordinaryleastsquaresregressionresultsforEquation5.6,usingyear,state,andbank-levelfixedeffects.Thesampleincludes307web-launchingannouncementsofpubliclytradedUSbanksduringthe1993-2018period.Ineachregression,thedependentvariableisPERFORMANCE,whichcanbeanyoftheaccountingratiosmentionedinTable5.1;includingROA;ROE;NetInterestMargin;Netoperatingincometoassets;Noninterestincometoassets;Noninterestexpenseto assets; and Efficiency Ratio during 1996-2013 horizon. The main independent variables areSmall_Bank$,%and the interaction with theZ[\]^\_`ab]\c_efg^a`f_\sbi`ab]$,%.Thesetofcontrolvariablesisalsoemployedtocontrolforexogenouscross-sectionaldifferencesinmarketstructuresandbankcharacteristicsandareall observedannuallyduring the1993-2013period.The sources for this tablearemainly fromFDIC, SNLFinancial,ThomsonFinancialSecurities Data, the author’s calculations and some other sources. Please note that the results in this table only display the coefficients ofSmall_Bank$,%andSmall_Bank$,%x Transactional_website_adoption$,%. Large_Bank$,% is treated as a reference category. Therefore, the coefficients shownSmall_Bank$,%andSmall_Bank$,%x Transactional_website_adoption$,%variables present the comparison to Large_Bank$,%andLarge_Bank$,%xTransactional_website_adoption$,%. Thesmall-sized bankgroup comprises 50% of sample banks with the smallest asset values each year, and thelarge-sizedbankgroupincludestheremaining50%ofbankswiththelargestmarketcapitalization.Standarderrorsinparentheses.Thesuperscripts***,**,and*indicateastatisticallysignificantdifferencefromzeroatthe1,5,and10percentlevelsofsignificanceintwo-sidedtests.Equation5.6isestimatedwithrobuststandarderrorsclusteredatbankleveltoaccountforserialcorrelationoftheerrorterm. (1) (2) (3) (4) (5) (6) (7)
VARIABLES ROA ROENetInterestMargin
NetOperatingIncome
Non-interestIncome
Non-interestExpense
Costefficiency
Transactional_website_adoption!,#
-0.044 -0.087 -0.005 -0.023 -0.168 -0.094 -3.615(0.1149) (0.5924) (0.0650) (0.1137) (0.4157) (0.2484) (4.0287)
Small_Bank!,#-0.238 -1.620*** -0.213** -0.242 -0.859 -0.630* 0.585(0.1911) (0.5868) (0.0942) (0.1905) (0.6473) (0.3733) (3.8081)
Small_Bank!,#xTransactional_website_adoption!,#
0.013 1.334 0.250*** 0.003 0.184 0.286** -4.245(0.1510) (0.8581) (0.0745) (0.1496) (0.1255) (0.1353) (3.3383)
Bank_Funding!,# -0.000 0.008 0.001 -0.000 0.001 0.001 -0.117* (0.0011) (0.0080) (0.0012) (0.0011) (0.0017) (0.0015) (0.0624)Bank_Leverage!,# -0.128 -0.571* -0.011 -0.129 -0.109 -0.019 4.281*** (0.0790) (0.3135) (0.0114) (0.0792) (0.0998) (0.0445) (1.0050)HHI!,# 0.007 -0.016 -0.010*** 0.008 0.025 0.013 0.311*** (0.0118) (0.0265) (0.0013) (0.0117) (0.0255) (0.0126) (0.0962)Constant -6.470 41.275 17.095*** -7.456 -23.154 -6.377 -210.428**
(11.7718) (26.8169) (1.4454) (11.7168) (26.2308) (13.0926) (94.4053)
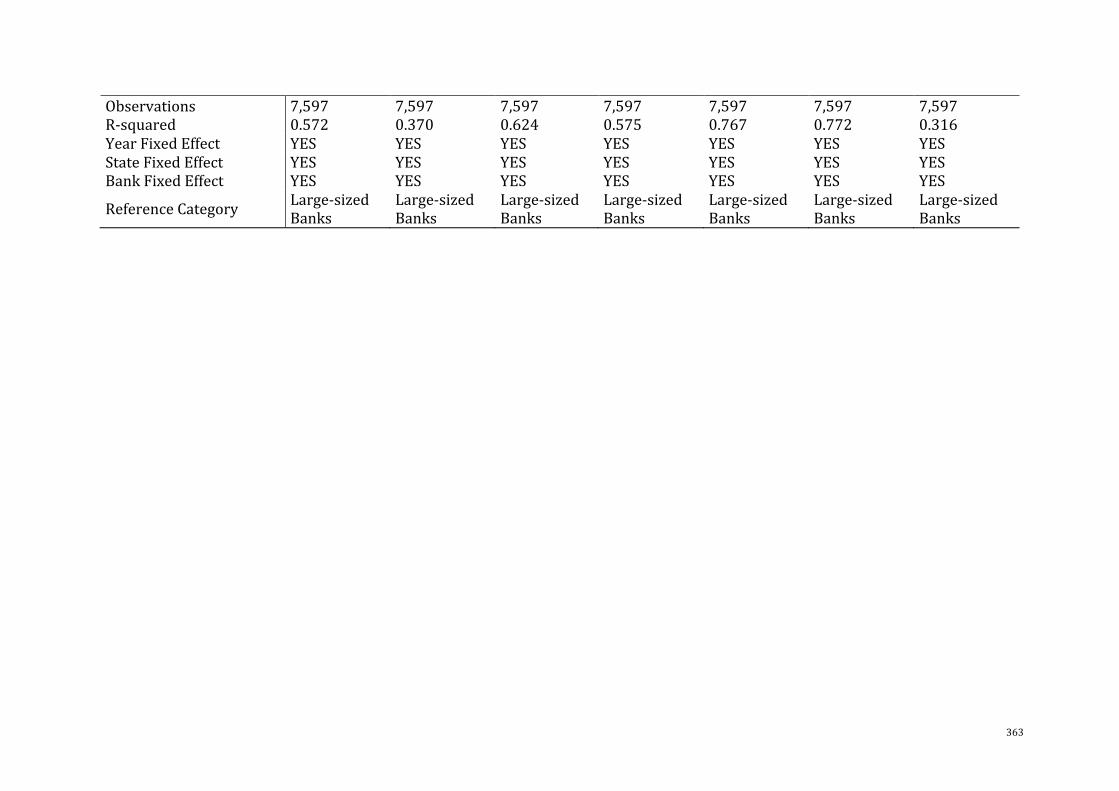
363
Observations 7,597 7,597 7,597 7,597 7,597 7,597 7,597R-squared 0.572 0.370 0.624 0.575 0.767 0.772 0.316YearFixedEffect YES YES YES YES YES YES YESStateFixedEffect YES YES YES YES YES YES YESBankFixedEffect YES YES YES YES YES YES YES
ReferenceCategory Large-sizedBanks
Large-sizedBanks
Large-sizedBanks
Large-sizedBanks
Large-sizedBanks
Large-sizedBanks
Large-sizedBanks
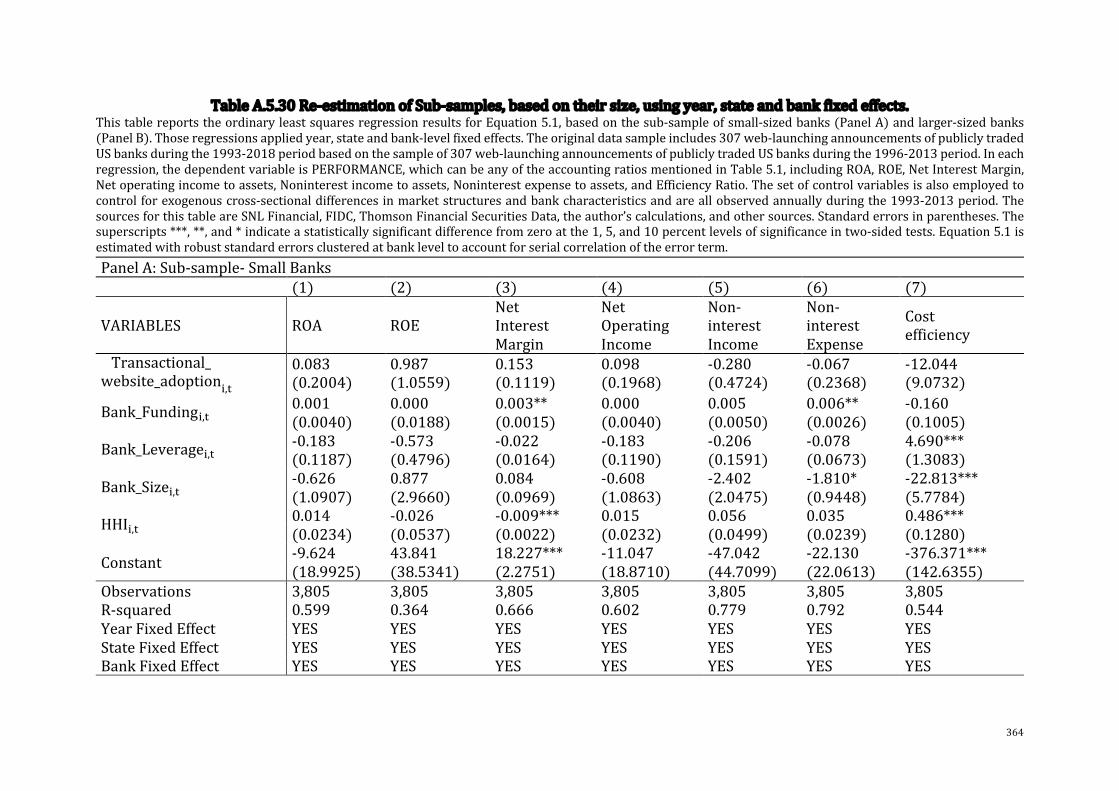
364
TableA.5.30Re-estimationofSub-samples,basedontheirsize,usingyear,stateandbankfixedeffects.ThistablereportstheordinaryleastsquaresregressionresultsforEquation5.1,basedonthesub-sampleofsmall-sizedbanks(PanelA)andlarger-sizedbanks(PanelB).Thoseregressionsappliedyear,stateandbank-levelfixedeffects.Theoriginaldatasampleincludes307web-launchingannouncementsofpubliclytradedUSbanksduringthe1993-2018periodbasedonthesampleof307web-launchingannouncementsofpubliclytradedUSbanksduringthe1996-2013period.Ineachregression,thedependentvariableisPERFORMANCE,whichcanbeanyoftheaccountingratiosmentionedinTable5.1,includingROA,ROE,NetInterestMargin,Netoperatingincometoassets,Noninterestincometoassets,Noninterestexpensetoassets,andEfficiencyRatio.Thesetofcontrolvariablesisalsoemployedtocontrolforexogenouscross-sectionaldifferencesinmarketstructuresandbankcharacteristicsandareallobservedannuallyduringthe1993-2013period.ThesourcesforthistableareSNLFinancial,FIDC,ThomsonFinancialSecuritiesData,theauthor’scalculations,andothersources.Standarderrorsinparentheses.Thesuperscripts***,**,and*indicateastatisticallysignificantdifferencefromzeroatthe1,5,and10percentlevelsofsignificanceintwo-sidedtests.Equation5.1isestimatedwithrobuststandarderrorsclusteredatbankleveltoaccountforserialcorrelationoftheerrorterm.PanelA:Sub-sample-SmallBanks (1) (2) (3) (4) (5) (6) (7)
VARIABLES ROA ROENetInterestMargin
NetOperatingIncome
Non-interestIncome
Non-interestExpense
Costefficiency
Transactional_website_adoption!,#
0.083 0.987 0.153 0.098 -0.280 -0.067 -12.044(0.2004) (1.0559) (0.1119) (0.1968) (0.4724) (0.2368) (9.0732)
Bank_Funding!,#0.001 0.000 0.003** 0.000 0.005 0.006** -0.160(0.0040) (0.0188) (0.0015) (0.0040) (0.0050) (0.0026) (0.1005)
Bank_Leverage!,#-0.183 -0.573 -0.022 -0.183 -0.206 -0.078 4.690***(0.1187) (0.4796) (0.0164) (0.1190) (0.1591) (0.0673) (1.3083)
Bank_Size!,#-0.626 0.877 0.084 -0.608 -2.402 -1.810* -22.813***(1.0907) (2.9660) (0.0969) (1.0863) (2.0475) (0.9448) (5.7784)
HHI!,#0.014 -0.026 -0.009*** 0.015 0.056 0.035 0.486***(0.0234) (0.0537) (0.0022) (0.0232) (0.0499) (0.0239) (0.1280)
Constant -9.624 43.841 18.227*** -11.047 -47.042 -22.130 -376.371***(18.9925) (38.5341) (2.2751) (18.8710) (44.7099) (22.0613) (142.6355)
Observations 3,805 3,805 3,805 3,805 3,805 3,805 3,805R-squared 0.599 0.364 0.666 0.602 0.779 0.792 0.544YearFixedEffect YES YES YES YES YES YES YESStateFixedEffect YES YES YES YES YES YES YESBankFixedEffect YES YES YES YES YES YES YES

365
PanelB:Sub-sample-LargeBanks (1) (2) (3) (4) (5) (6) (7)
VARIABLES ROA ROE NetInterestMargin
NetOperatingIncome
Non-interestIncome
Non-interestExpense
Costefficiency
Transactional_website_adoption!,#
-0.018 0.005 0.094 0.014 0.340 0.316* 1.517(0.0585) (0.7203) (0.0643) (0.0670) (0.2144) (0.1876) (1.4302)
Bank_Funding!,#0.000 0.008 -0.001 0.000 0.001 -0.001 -0.046***(0.0007) (0.0089) (0.0013) (0.0007) (0.0019) (0.0018) (0.0161)
Bank_Leverage!,#0.064*** -0.172 0.074*** 0.062*** 0.109 0.097 -0.434**(0.0180) (0.1520) (0.0190) (0.0180) (0.1064) (0.0848) (0.2089)
Bank_Size!,#-0.070 -0.655 -0.124* -0.066 -0.401 -0.477* -3.510***(0.0544) (0.6075) (0.0669) (0.0528) (0.3189) (0.2579) (1.1111)
HHI!,#0.000 -0.016 -0.010*** 0.000 -0.001 -0.004 0.062**(0.0012) (0.0150) (0.0015) (0.0011) (0.0023) (0.0025) (0.0301)
Constant 1.687 47.572*** 21.693*** 1.286 6.176** 15.014*** 26.099(1.3246) (17.4377) (1.5868) (1.3175) (2.8175) (2.8374) (32.2847)
Observations 3,792 3,792 3,792 3,792 3,792 3,792 3,792R-squared 0.395 0.392 0.665 0.399 0.584 0.597 0.558YearFixedEffect YES YES YES YES YES YES YESStateFixedEffect YES YES YES YES YES YES YESBankFixedEffect YES YES YES YES YES YES YES

366
TableA.5.31Re-estimationofEquation5.7,usingYear,StateandBankFixedEffectsThistablereportstheordinaryleastsquaresregressionresultsforEquation5.7,usingyear,state,andbank-levelfixedeffects.Thesampleincludes307web-launchingannouncementsofpubliclytradedUSbanksduringthe1993-2018period.Ineachregression,thedependentvariableisPERFORMANCE,whichcanbeanyoftheaccountingratiosmentionedinTable5.1,includingROA,ROE,NetInterestMargin,Netoperatingincometoassets,Noninterestincometoassets,Noninterestexpenseto assets, and Efficiency Ratio during 1993-2018 horizon. Independent variables consist of three dummy variables: First_mover$,%, Second_mover$,%, and theirinteractionswithTransactional_website_adoption$,%.Thesetofcontrolvariables isalsoemployedtocontrol forexogenouscross-sectionaldifferences inmarketstructuresandbankcharacteristicsandareallobservedannuallyduringthe1993-2018period.Thesources forthistablearemainly fromFDIC,SNLFinancial,Thomson Financial Securities Data, the author’s calculations and some other sources. Please note that the results in the table only display the coefficients ofFirst_mover$,%,Second_mover$,%,andtheirinteractionswithTransactional_website_adoption$,%.Laggard$,%istreatedasareferencecategory.Therefore,thecoefficientsshown in First_mover$,%, Second_mover$,%, and their interactions with Transactional_website_adoption$,% would reveal the comparison to Laggard$,% andTransactional_website_adoption$,% × Laggards$,%.Standarderrorsinparentheses.Thesuperscripts***,**,and*indicateastatisticallysignificantdifferencefromzeroatthe1,5,and10percentlevelsofsignificanceintwo-sidedtests.Equation5.7isestimatedwithrobuststandarderrorsclusteredatbankleveltoaccountforserialcorrelationoftheerrorterm.
(1) (2) (3) (4) (5) (6) (7)
VARIABLES ROA ROENetInterestMargin
NetOperatingIncome
Non-InterestIncome
Non-interestExpense
Costefficiency
Transactional_website_adoption!,#
-0.031 0.681 0.245*** 0.003 -0.212 -0.035 -9.108*(0.2211) (0.6990) (0.0737) (0.2212) (0.5291) (0.2928) (4.8779)
First_mover!,#-0.157 -1.028 1.115*** -0.128 -0.637 0.293 79.661***(0.3316) (0.8167) (0.1000) (0.3353) (1.0263) (0.6078) (5.7807)
Second_mover!,#1.223*** 3.980*** -1.582*** 1.375*** -1.065 -4.009*** -158.928***(0.3808) (1.1844) (0.1495) (0.3859) (0.8928) (0.5078) (11.9794)
Transactional_website_adoption!,#
x
First_mover!,#
0.226 0.505 -0.316*** 0.203 1.030 0.558 3.045(0.3305) (0.8392) (0.1050) (0.3353) (1.0010) (0.5898) (6.3555)
Transactional_website_adoption!,#
x
Second_mover!,#
-0.160 -0.349 -0.191* -0.212** -0.105 0.028 9.245**(0.0990) (0.6392) (0.0979) (0.1056) (0.1278) (0.1195) (4.1613)
Bank_Funding!,# 0.000 0.009 0.001 0.000 0.003 0.002 -0.116* (0.0013) (0.0081) (0.0012) (0.0013) (0.0023) (0.0018) (0.0646)Bank_Leverage!,# -0.128 -0.586* -0.013 -0.129* -0.112 -0.023 4.343***

367
(0.0779) (0.3059) (0.0116) (0.0782) (0.1020) (0.0462) (1.0047)Bank_Size!,# -0.075 0.092 0.046 -0.064 -0.774 -0.702** -15.404*** (0.3037) (0.6656) (0.0431) (0.3022) (0.6828) (0.3505) (3.7835)Constant 2.395 14.809 7.208*** 2.074 12.403 16.789*** 372.389*** (4.7762) (11.5913) (0.6327) (4.7604) (9.9950) (5.0554) (57.0550)Observations 7,597 7,597 7,597 7,597 7,597 7,597 7,597R-squared 0.572 0.369 0.624 0.575 0.767 0.771 0.317YearFixedEffect YES YES YES YES YES YES YESStateFixedEffect YES YES YES YES YES YES YESBankFixedEffect YES YES YES YES YES YES YESReferenceVariable Laggards Laggards Laggards Laggards Laggards Laggards Laggards

368
AppendixC-AdditionalAnalysesforModelsinChapter6
ThissectionpresentstheresultsoftheRobustnesstestsection,including:
• ResultsofregressionontheimpactoftransactionalwebsiteadoptiononBHARs
overthreeholdingperiods”,usingalternativebenchmarks.
• Resultsofregressionontheimpactof“Learning-by-Observing”BHARssincethe
transactional website adoption, using the alternative "Learning-by-Observing”
variable.
• Resultsofregressionontheimpactofsizeeffectoverbothex-anteandex-post
periodsoftransactionalwebsitelaunchingevents.
• Resultsofregressionontheimpactofthetimingeffectovertheex-postperiodof
transactionalwebsitelaunchevents.
• ResultsofallmainequationsinSection6.4,usingyearfixedeffect
• ResultsofallmainequationsinSection6.4,usingyearandstatefixedeffect
• ResultsofallmainequationsinSection6.4,usingyear,stateandbank-levelfixed
effect
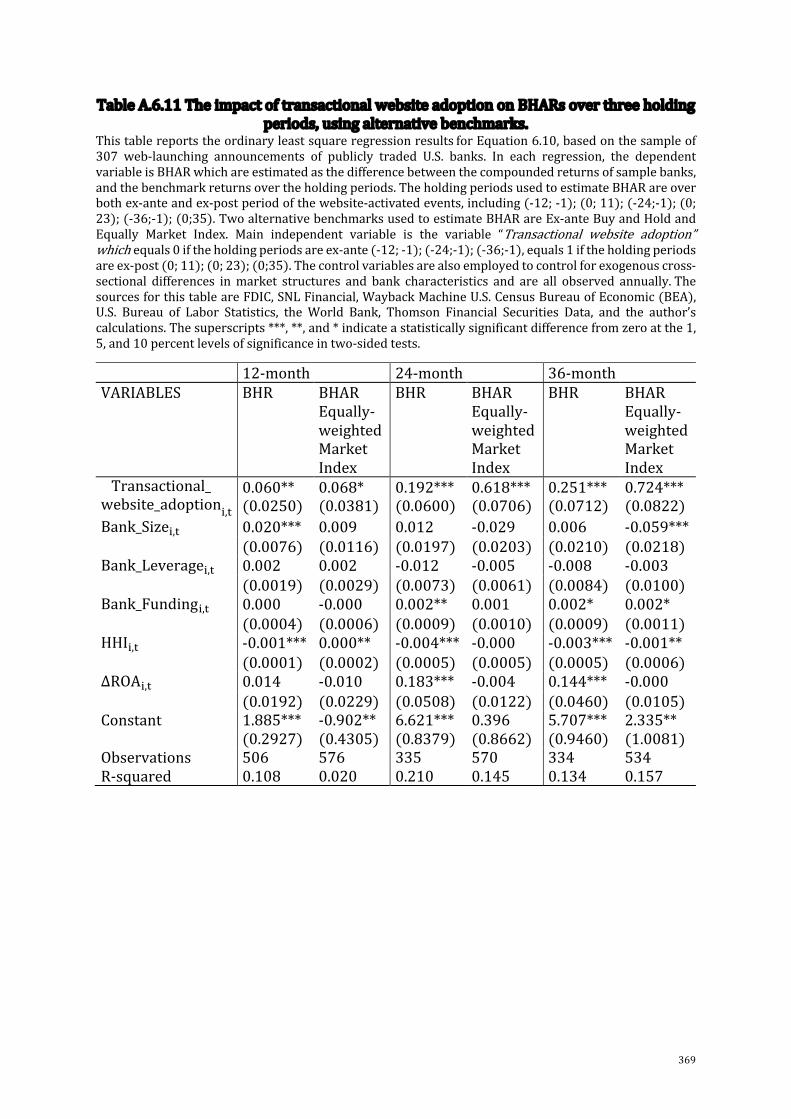
369
TableA.6.11TheimpactoftransactionalwebsiteadoptiononBHARsoverthreeholdingperiods,usingalternativebenchmarks.
ThistablereportstheordinaryleastsquareregressionresultsforEquation6.10,basedonthesampleof307 web-launching announcements of publicly traded U.S. banks. In each regression, the dependentvariableisBHARwhichareestimatedasthedifferencebetweenthecompoundedreturnsofsamplebanks,andthebenchmarkreturnsovertheholdingperiods.TheholdingperiodsusedtoestimateBHARareoverbothex-anteandex-postperiodofthewebsite-activatedevents,including(-12;-1);(0;11);(-24;-1);(0;23);(-36;-1);(0;35).TwoalternativebenchmarksusedtoestimateBHARareEx-anteBuyandHoldandEqually Market Index. Main independent variable is the variable “Transactional website adoption”whichequals0iftheholdingperiodsareex-ante(-12;-1);(-24;-1);(-36;-1),equals1iftheholdingperiodsareex-post(0;11);(0;23);(0;35).Thecontrolvariablesarealsoemployedtocontrolforexogenouscross-sectional differences inmarket structures and bank characteristics and are all observed annually.ThesourcesforthistableareFDIC,SNLFinancial,WaybackMachineU.S.CensusBureauofEconomic(BEA),U.S. Bureau of Labor Statistics, the World Bank, Thomson Financial Securities Data, and the author’scalculations.Thesuperscripts***,**,and*indicateastatisticallysignificantdifferencefromzeroatthe1,5,and10percentlevelsofsignificanceintwo-sidedtests.
12-month 24-month 36-monthVARIABLES BHR BHAR
Equally-weightedMarketIndex
BHR BHAREqually-weightedMarketIndex
BHR BHAREqually-weightedMarketIndex
Transactional_website_adoption!,#
0.060** 0.068* 0.192*** 0.618*** 0.251*** 0.724***(0.0250) (0.0381) (0.0600) (0.0706) (0.0712) (0.0822)
Bank_Size!,# 0.020*** 0.009 0.012 -0.029 0.006 -0.059*** (0.0076) (0.0116) (0.0197) (0.0203) (0.0210) (0.0218)Bank_Leverage!,# 0.002 0.002 -0.012 -0.005 -0.008 -0.003 (0.0019) (0.0029) (0.0073) (0.0061) (0.0084) (0.0100)Bank_Funding!,# 0.000 -0.000 0.002** 0.001 0.002* 0.002* (0.0004) (0.0006) (0.0009) (0.0010) (0.0009) (0.0011)HHI!,# -0.001*** 0.000** -0.004*** -0.000 -0.003*** -0.001** (0.0001) (0.0002) (0.0005) (0.0005) (0.0005) (0.0006)∆ROA!,# 0.014 -0.010 0.183*** -0.004 0.144*** -0.000 (0.0192) (0.0229) (0.0508) (0.0122) (0.0460) (0.0105)Constant 1.885*** -0.902** 6.621*** 0.396 5.707*** 2.335** (0.2927) (0.4305) (0.8379) (0.8662) (0.9460) (1.0081)Observations 506 576 335 570 334 534R-squared 0.108 0.020 0.210 0.145 0.134 0.157
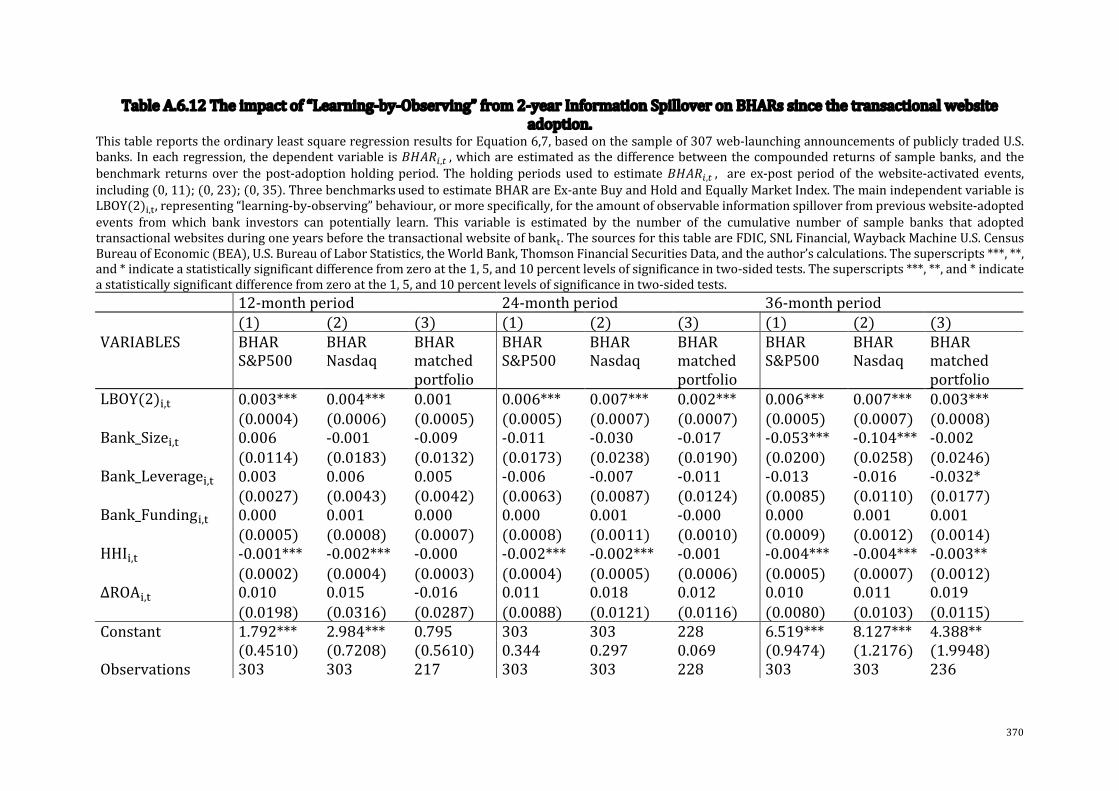
370
TableA.6.12Theimpactof“Learning-by-Observing”from2-yearInformationSpilloveronBHARssincethetransactionalwebsiteadoption.
ThistablereportstheordinaryleastsquareregressionresultsforEquation6,7,basedonthesampleof307web-launchingannouncementsofpubliclytradedU.S.banks. Ineachregression,thedependentvariable isEFGH!,#,whichareestimatedasthedifferencebetweenthecompoundedreturnsofsamplebanks,andthebenchmark returns over thepost-adoptionholdingperiod. Theholdingperiods used to estimateEFGH!,#, are ex-post period of thewebsite-activated events,including(0,11);(0,23);(0,35).ThreebenchmarksusedtoestimateBHARareEx-anteBuyandHoldandEquallyMarketIndex.ThemainindependentvariableisLBOY(2)%,&,representing“learning-by-observing”behaviour,ormorespecifically,fortheamountofobservableinformationspilloverfrompreviouswebsite-adoptedevents from which bank investors can potentially learn. This variable is estimated by the number of the cumulative number of sample banks that adoptedtransactionalwebsitesduringoneyearsbeforethetransactionalwebsiteofbank&.ThesourcesforthistableareFDIC,SNLFinancial,WaybackMachineU.S.CensusBureauofEconomic(BEA),U.S.BureauofLaborStatistics,theWorldBank,ThomsonFinancialSecuritiesData,andtheauthor’scalculations.Thesuperscripts***,**,and*indicateastatisticallysignificantdifferencefromzeroatthe1,5,and10percentlevelsofsignificanceintwo-sidedtests.Thesuperscripts***,**,and*indicateastatisticallysignificantdifferencefromzeroatthe1,5,and10percentlevelsofsignificanceintwo-sidedtests. 12-monthperiod 24-monthperiod 36-monthperiod (1) (2) (3) (1) (2) (3) (1) (2) (3)VARIABLES BHAR
S&P500BHARNasdaq
BHARmatchedportfolio
BHARS&P500
BHARNasdaq
BHARmatchedportfolio
BHARS&P500
BHARNasdaq
BHARmatchedportfolio
LBOY(2)!,# 0.003*** 0.004*** 0.001 0.006*** 0.007*** 0.002*** 0.006*** 0.007*** 0.003*** (0.0004) (0.0006) (0.0005) (0.0005) (0.0007) (0.0007) (0.0005) (0.0007) (0.0008)Bank_Size!,# 0.006 -0.001 -0.009 -0.011 -0.030 -0.017 -0.053*** -0.104*** -0.002 (0.0114) (0.0183) (0.0132) (0.0173) (0.0238) (0.0190) (0.0200) (0.0258) (0.0246)Bank_Leverage!,# 0.003 0.006 0.005 -0.006 -0.007 -0.011 -0.013 -0.016 -0.032* (0.0027) (0.0043) (0.0042) (0.0063) (0.0087) (0.0124) (0.0085) (0.0110) (0.0177)Bank_Funding!,# 0.000 0.001 0.000 0.000 0.001 -0.000 0.000 0.001 0.001 (0.0005) (0.0008) (0.0007) (0.0008) (0.0011) (0.0010) (0.0009) (0.0012) (0.0014)HHI!,# -0.001*** -0.002*** -0.000 -0.002*** -0.002*** -0.001 -0.004*** -0.004*** -0.003** (0.0002) (0.0004) (0.0003) (0.0004) (0.0005) (0.0006) (0.0005) (0.0007) (0.0012)∆ROA!,# 0.010 0.015 -0.016 0.011 0.018 0.012 0.010 0.011 0.019 (0.0198) (0.0316) (0.0287) (0.0088) (0.0121) (0.0116) (0.0080) (0.0103) (0.0115)Constant 1.792*** 2.984*** 0.795 303 303 228 6.519*** 8.127*** 4.388** (0.4510) (0.7208) (0.5610) 0.344 0.297 0.069 (0.9474) (1.2176) (1.9948)Observations 303 303 217 303 303 228 303 303 236
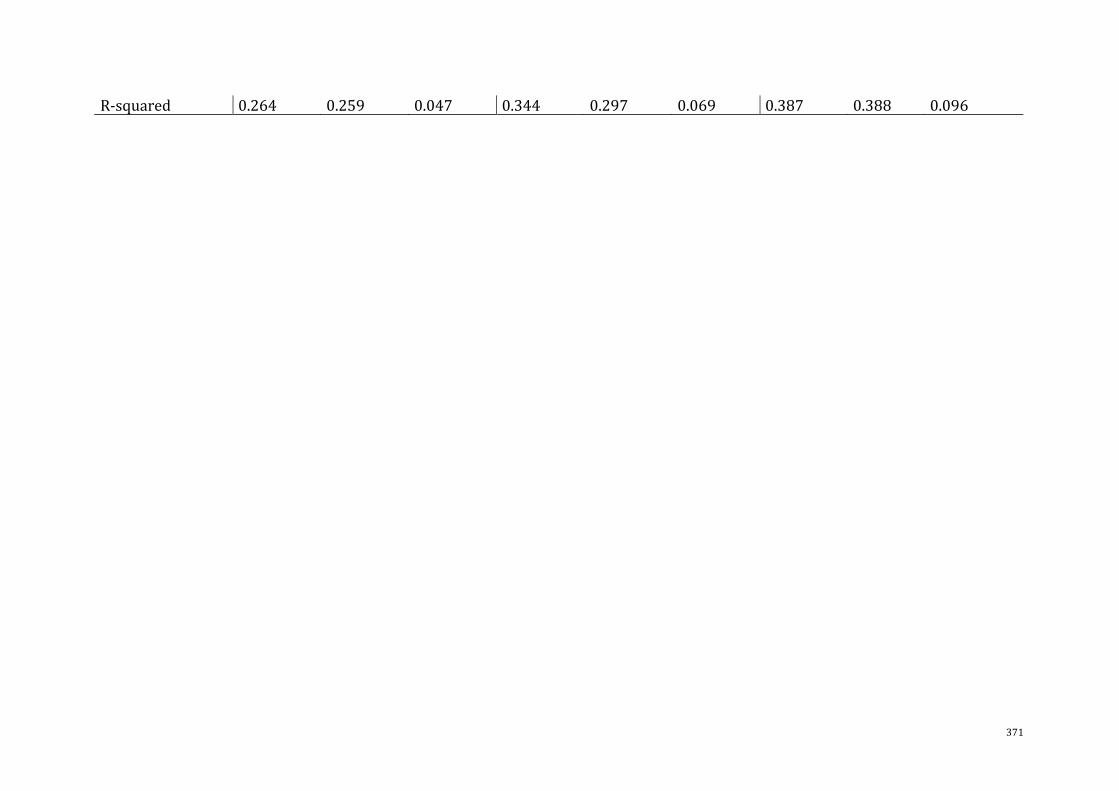
371
R-squared 0.264 0.259 0.047 0.344 0.297 0.069 0.387 0.388 0.096

372
TableA.6.13Theimpactof“Learning-by-Observing”from3-yearInformationSpilloveronBHARssincethetransactionalwebsiteadoption.
ThistablereportstheordinaryleastsquareregressionresultsforEquation6.7,basedonthesampleof307web-launchingannouncementsofpubliclytradedU.S.banks. Ineachregression,thedependentvariable isEFGH!,#,whichareestimatedasthedifferencebetweenthecompoundedreturnsofsamplebanks,andthebenchmarkreturnsoverthepost-adoptionholdingperiod.TheholdingperiodsusedtoestimateEFGH!,#areex-postperiodofthewebsite-activatedevents,including(0;11);(0;23);(0;35).ThreebenchmarksusedtoestimateBHARareEx-anteBuyandHoldandEquallyMarketIndex.ThemainindependentvariableisLBOY(3)%,&,representing“learning-by-observing”behaviour,or, fortheamountofobservable informationspilloverfrompreviouswebsite-adoptedevents fromwhichbankinvestorscanpotentiallylearn.Thisvariableisestimatedbythenumberofthecumulativenumberofsamplebanksthatadoptedtransactionalwebsitesoneyearbeforethetransactionalwebsiteofbcde'.ThesourcesforthistableareFDIC,SNLFinancial,WaybackMachineU.S.CensusBureauofEconomic(BEA),U.S.BureauofLaborStatistics,theWorldBank,ThomsonFinancialSecuritiesData,andtheauthor’scalculations.Thesuperscripts***,**,and*indicateastatisticallysignificantdifferencefromzeroatthe1,5,and10percentlevelsofsignificanceintwo-sidedtests 12-monthperiod 24-monthperiod 36-monthperiod (1) (2) (3) (1) (2) (3) (1) (2) (3)
VARIABLES BHARS&P500
BHARNasdaq
BHARmatchedportfolio
BHARS&P500
BHARNasdaq
BHARmatchedportfolio
BHARS&P500
BHARNasdaq
BHARSize-matchedportfolio
LBOY(3)!,# 0.002*** 0.004*** 0.001* 0.005*** 0.006*** 0.002*** 0.006*** 0.007*** 0.003*** (0.0003) (0.0004) (0.0004) (0.0004) (0.0006) (0.0006) (0.0005) (0.0007) (0.0008)Bank_Size!,# 0.009 0.005 -0.009 -0.016 -0.035 -0.020 -0.053*** -0.104*** -0.002 (0.0112) (0.0177) (0.0132) (0.0171) (0.0235) (0.0191) (0.0200) (0.0258) (0.0246)Bank_Leverage!,# 0.003 0.005 0.005 -0.007 -0.009 -0.012 -0.013 -0.016 -0.032* (0.0026) (0.0042) (0.0042) (0.0063) (0.0087) (0.0126) (0.0085) (0.0110) (0.0177)Bank_Funding!,# 0.000 0.001 0.000 -0.000 0.001 -0.000 0.000 0.001 0.001 (0.0005) (0.0008) (0.0007) (0.0008) (0.0011) (0.0010) (0.0009) (0.0012) (0.0014)HHI!,# -0.001*** -0.002*** -0.000 -0.002*** -0.002*** -0.001 -0.004*** -0.004*** -0.003** (0.0002) (0.0003) (0.0003) (0.0004) (0.0005) (0.0006) (0.0005) (0.0007) (0.0012)∆ROA!,# 0.009 0.014 -0.014 0.012 0.018 0.013 0.010 0.011 0.019 (0.0193) (0.0306) (0.0287) (0.0088) (0.0120) (0.0117) (0.0080) (0.0103) (0.0115)Constant 1.726*** 2.816*** 0.715 3.047*** 3.957*** 1.499 6.519*** 8.127*** 4.388** (0.4404) (0.6982) (0.5639) (0.7195) (0.9874) (1.0498) (0.9474) (1.2176) (1.9948)Observations 303 303 217 303 303 228 303 303 236R-squared 0.294 0.301 0.049 0.353 0.305 0.062 0.387 0.388 0.096

373
TableA.6.14ThemagnitudeeffectonBHARuponex-anteandex-postperiodofthetransactionalwebsiteadoptionThistablereportstheordinaryleastsquareregressionresultsforEquation6.11,basedonthesampleof307web-launchingannouncementsofpubliclytradedU.S.banks.Intheregression,thedependentvariableisBHAR,whichareestimatedasthedifferencebetweenthecompoundedreturnsofsamplebanks,andthebenchmarkreturnsoverthepost-adoptionholdingperiod.TheholdingperiodsusedtoestimateBHARareoverbothex-anteandex-postperiodofthewebsite-activatedevents,including(-12;-1);(0;11);(-24;-1);(0;23);(-36;-1);(0;35).ThreebenchmarksusedtoestimateBHARareS&P500,Nasdaq,andmatched-bankportfolio.ThemainindependentvariablesareSmall-sizedbank,Large-sizedbank,andtheir interactionwiththetransactionalwebsiteadoption.Thecontrolvariablesarealsoemployedtocontrol forexogenouscross-sectionaldifferences inmarket structuresandbankcharacteristicsandareallobservedannually.Thesources for this tableareFDIC,SNLFinancial,WaybackMachineU.S.CensusBureauofEconomic(BEA),U.S.BureauofLaborStatistics,theWorldBank,ThomsonFinancialSecuritiesData,andtheauthor’scalculation.Thesuperscripts***,**,and*indicateastatisticallysignificantdifferencefromzeroatthe1,5,and10percentlevelsofsignificanceintwo-sidedtests. PanelA:12-monthperiod PanelB:24-monthperiod PanelC:36-monthperiod (1) (2) (3) (1) (2) (3) (1) (2) (3)
VARIABLES BHARS&P500
BHARNasdaq
BHARmatchedportfolio
BHARS&P500
BHARNasdaq
BHARmatchedportfolio
BHARS&P500
BHARNasdaq
BHARmatchedportfolio
Transactional_website_adoption!,# 0.072* 0.083 -0.034 0.378*** 0.543*** 0.035 0.740*** 0.958*** 0.098 (0.0436) (0.0653) (0.0533) (0.0680) (0.0934) (0.0781) (0.0916) (0.1214) (0.1130)
Largebank!,#-0.051 -0.088 -0.084 0.000 -0.015 -0.051 -0.003 -0.034 -0.014(0.0452) (0.0677) (0.0526) (0.0672) (0.0924) (0.0714) (0.0882) (0.1170) (0.1005)
Largebank!,#× Transactional_website_adoption!,#
0.003 -0.003 0.051 -0.188** -0.281** -0.031 -0.290** -0.403*** -0.138
(0.0611) (0.0915) (0.0712) (0.0912) (0.1253) (0.0963) (0.1170) (0.1552) (0.1320)Bank_Leverage!,# 0.004 0.004 0.009** 0.001 -0.002 0.003 -0.000 -0.001 0.004 (0.0023) (0.0035) (0.0037) (0.0043) (0.0059) (0.0071) (0.0084) (0.0112) (0.0131)Bank_Funding!,# 0.000 0.001 0.000 0.001 0.001 0.001 0.002* 0.002 0.002 (0.0004) (0.0007) (0.0006) (0.0007) (0.0010) (0.0008) (0.0009) (0.0012) (0.0012)HHI!,# -0.000 0.000 -0.000 -0.000 -0.000 -0.000 -0.001* -0.001* -0.001 (0.0002) (0.0003) (0.0002) (0.0003) (0.0004) (0.0004) (0.0005) (0.0007) (0.0007)∆ROA!,# -0.007 -0.019 0.002 -0.002 0.002 0.001 -0.004 -0.008 0.001 (0.0186) (0.0278) (0.0236) (0.0085) (0.0117) (0.0092) (0.0088) (0.0117) (0.0100)Constant 0.298 -0.071 0.066 0.450 0.198 0.610 0.993 1.465 1.793 (0.2686) (0.4020) (0.3356) (0.4713) (0.6478) (0.6157) (0.7318) (0.9704) (1.1129)Observations 576 576 411 570 570 424 534 534 408
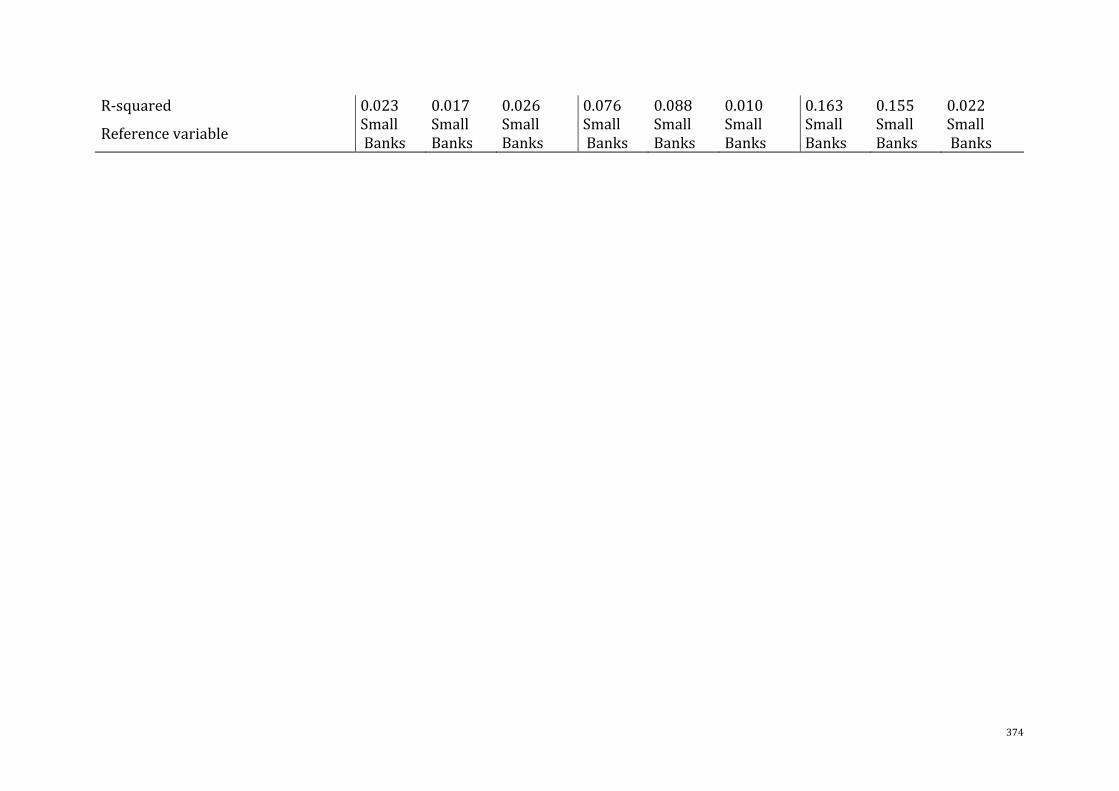
374
R-squared 0.023 0.017 0.026 0.076 0.088 0.010 0.163 0.155 0.022
Referencevariable SmallBanks
SmallBanks
SmallBanks
SmallBanks
SmallBanks
SmallBanks
SmallBanks
SmallBanks
SmallBanks
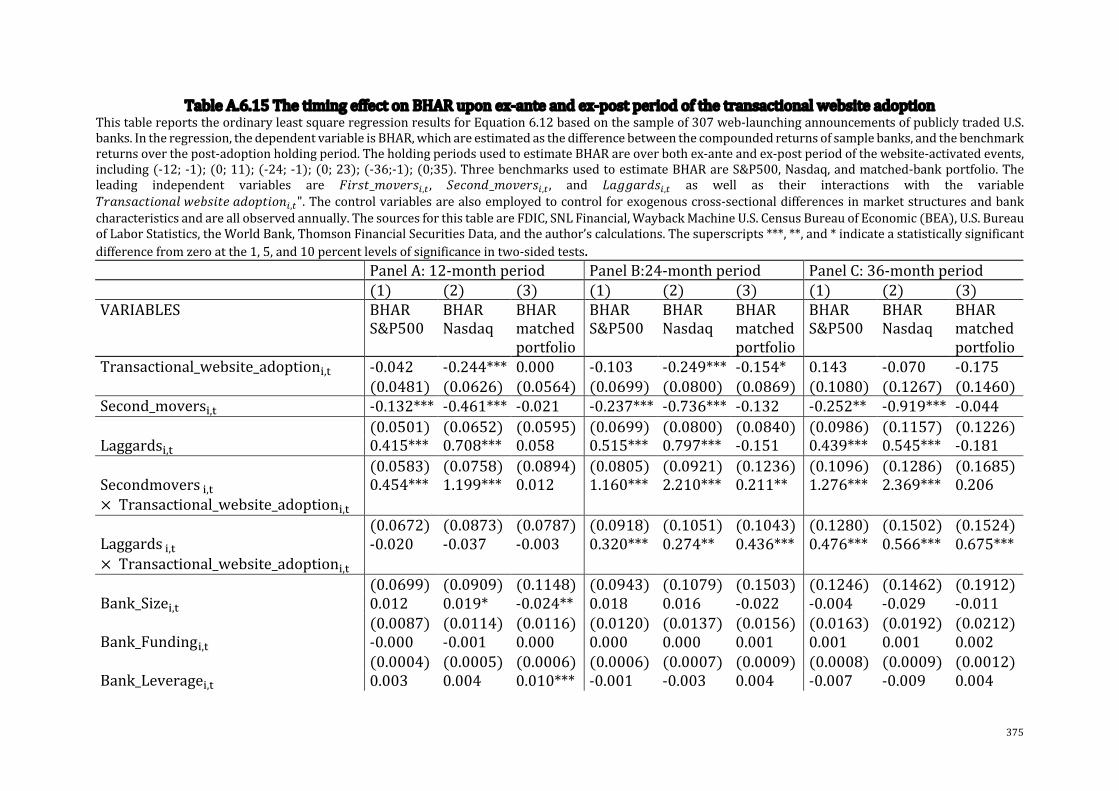
375
TableA.6.15ThetimingeffectonBHARuponex-anteandex-postperiodofthetransactionalwebsiteadoptionThistablereportstheordinaryleastsquareregressionresultsforEquation6.12basedonthesampleof307web-launchingannouncementsofpubliclytradedU.S.banks.Intheregression,thedependentvariableisBHAR,whichareestimatedasthedifferencebetweenthecompoundedreturnsofsamplebanks,andthebenchmarkreturnsoverthepost-adoptionholdingperiod.TheholdingperiodsusedtoestimateBHARareoverbothex-anteandex-postperiodofthewebsite-activatedevents,including(-12;-1);(0;11);(-24;-1);(0;23);(-36;-1);(0;35).ThreebenchmarksusedtoestimateBHARareS&P500,Nasdaq,andmatched-bankportfolio.Theleading independent variables are ijklm_opqrkl!,# , srtpuv_opqrkl!,# , and wxyyxkvl!,# as well as their interactions with the variablezkxulxtmjpux{|r}ljmrxvp~mjpu!,#".Thecontrolvariablesarealsoemployedtocontrolforexogenouscross-sectionaldifferencesinmarketstructuresandbankcharacteristicsandareallobservedannually.ThesourcesforthistableareFDIC,SNLFinancial,WaybackMachineU.S.CensusBureauofEconomic(BEA),U.S.BureauofLaborStatistics,theWorldBank,ThomsonFinancialSecuritiesData,andtheauthor’scalculations.Thesuperscripts***,**,and*indicateastatisticallysignificantdifferencefromzeroatthe1,5,and10percentlevelsofsignificanceintwo-sidedtests. PanelA:12-monthperiod PanelB:24-monthperiod PanelC:36-monthperiod (1) (2) (3) (1) (2) (3) (1) (2) (3)VARIABLES BHAR
S&P500BHARNasdaq
BHARmatchedportfolio
BHARS&P500
BHARNasdaq
BHARmatchedportfolio
BHARS&P500
BHARNasdaq
BHARmatchedportfolio
Transactional_website_adoption!,# -0.042 -0.244*** 0.000 -0.103 -0.249*** -0.154* 0.143 -0.070 -0.175 (0.0481) (0.0626) (0.0564) (0.0699) (0.0800) (0.0869) (0.1080) (0.1267) (0.1460)Second_movers!,# -0.132*** -0.461*** -0.021 -0.237*** -0.736*** -0.132 -0.252** -0.919*** -0.044 (0.0501) (0.0652) (0.0595) (0.0699) (0.0800) (0.0840) (0.0986) (0.1157) (0.1226)Laggards!,# 0.415*** 0.708*** 0.058 0.515*** 0.797*** -0.151 0.439*** 0.545*** -0.181 (0.0583) (0.0758) (0.0894) (0.0805) (0.0921) (0.1236) (0.1096) (0.1286) (0.1685)Secondmovers!,#× Transactional_website_adoption!,#
0.454*** 1.199*** 0.012 1.160*** 2.210*** 0.211** 1.276*** 2.369*** 0.206
(0.0672) (0.0873) (0.0787) (0.0918) (0.1051) (0.1043) (0.1280) (0.1502) (0.1524)Laggards!,#× Transactional_website_adoption!,#
-0.020 -0.037 -0.003 0.320*** 0.274** 0.436*** 0.476*** 0.566*** 0.675***
(0.0699) (0.0909) (0.1148) (0.0943) (0.1079) (0.1503) (0.1246) (0.1462) (0.1912)Bank_Size!,# 0.012 0.019* -0.024** 0.018 0.016 -0.022 -0.004 -0.029 -0.011 (0.0087) (0.0114) (0.0116) (0.0120) (0.0137) (0.0156) (0.0163) (0.0192) (0.0212)Bank_Funding!,# -0.000 -0.001 0.000 0.000 0.000 0.001 0.001 0.001 0.002 (0.0004) (0.0005) (0.0006) (0.0006) (0.0007) (0.0009) (0.0008) (0.0009) (0.0012)Bank_Leverage!,# 0.003 0.004 0.010*** -0.001 -0.003 0.004 -0.007 -0.009 0.004

376
(0.0021) (0.0027) (0.0037) (0.0035) (0.0040) (0.0070) (0.0072) (0.0085) (0.0130)HHI!,# -0.001*** -0.002*** -0.000 -0.002*** -0.003*** -0.000 -0.003*** -0.003*** -0.001 (0.0002) (0.0002) (0.0003) (0.0003) (0.0004) (0.0005) (0.0005) (0.0006) (0.0009)∆ROA!,# 0.005 0.012 -0.005 0.004 0.011 0.002 0.004 0.004 0.002 (0.0166) (0.0216) (0.0239) (0.0069) (0.0079) (0.0091) (0.0076) (0.0089) (0.0099)Constant 1.526*** 2.484*** 0.589 2.954*** 4.367*** 0.691 3.721*** 5.293*** 2.394* (0.3364) (0.4373) (0.4860) (0.5388) (0.6166) (0.8878) (0.8399) (0.9856) (1.4155)Observations 576 576 411 570 570 424 534 534 408R-squared 0.237 0.421 0.034 0.391 0.583 0.046 0.402 0.527 0.066Referencevariable First
MoversFirstMovers
FirstMovers
FirstMovers
FirstMovers
FirstMovers
FirstMovers
FirstMovers
FirstMovers

377
TableA.6.16Re-estimationofEquation6.6,usingfixedeffectsThistablereportstheordinaryleastsquareregressionresultsforEquation6.6,basedonthesampleof307web-launchingannouncementsofpubliclytradedU.S.banks.Ineachregression,thedependentvariableisBHAR,whichisestimatedasthedifferencebetweenthecompoundedreturnsofsamplebanks,andthebenchmarkreturnsovertheholdingperiodsTheholdingperiodsusedtoestimateBHARareoverbothex-anteandex-postperiodofthewebsite-activatedevents,including(-12,-1)and(0,11)-PanelA;(-24,-1)and(0,23)-PanelB;(-36,-1)and(0,35)-PanelC.Ineachpanel,equation5.6isestimatedusingstatefixedeffect;oryearandstatefixedeffects;orstateyearandbank-levelfixedeffects.ThreebenchmarksusedtoestimateBHARareS&P500,Nasdaq,andmatched-bankportfolioThemainindependentvariableisthevariableTransactional_website_adoption!,#whichequals0iftheholdingperiodsareex-ante(-12,-1);(-24,-1);(-36,-1),equals1iftheholdingperiodsareex-post(0;11);(0;23);(0;35).Thecontrolvariablesarealsoemployedtocontrolforexogenouscross-sectionaldifferencesinmarketstructuresandbankcharacteristicsandareallobservedannually.ThesourcesforthistableareFDIC,SNLFinancial,WaybackMachineU.S.CensusBureauofEconomic(BEA),U.S.BureauofLaborStatistics, theWorldBank,ThomsonFinancialSecuritiesData,andtheauthor’scalculations.Standarderrorsinparentheses.Thesuperscripts***,**,and*indicateastatisticallysignificantdifferencefromzeroatthe1,5,and10percentlevelsofsignificanceintwo-sidedtests.PanelA:12-monthperiod A.1Statefixedeffect A.2Stateandyearfixedeffects A.3 State, year, and bank-level fixed
effects (1) (2) (3) (1) (2) (3) (1) (2) (3)VARIABLES BHAR
S&P500BHARNasdaq
BHARmatchedportfolio
BHARS&P500
BHARNasdaq
BHARmatchedportfolio
BHARS&P500
BHARNasdaq
BHARmatchedportfolio
Transactional_website_adoption!,#
0.080** 0.090* 0.003 0.095*** 0.112*** 0.013 0.069** 0.050 0.014(0.0313) (0.0470) (0.0370) (0.0279) (0.0403) (0.0379) (0.0319) (0.0514) (0.0340)
Bank_Size!,# -0.001 -0.002 -0.019 0.007 0.007 -0.017 -0.002 0.054 -0.055 (0.0102) (0.0153) (0.0120) (0.0099) (0.0142) (0.0129) (0.0482) (0.0776) (0.0411)Bank_Leverage!,# 0.005** 0.006 0.011*** 0.003 0.002 0.009** 0.004 -0.003 0.014 (0.0025) (0.0038) (0.0039) (0.0023) (0.0033) (0.0040) (0.0095) (0.0153) (0.0090)Bank_Funding!,# 0.000 0.000 0.000 -0.000 -0.000 -0.000 0.005** 0.009*** 0.002 (0.0005) (0.0008) (0.0007) (0.0005) (0.0007) (0.0008) (0.0018) (0.0030) (0.0018)HHI!,# -0.000 -0.000 -0.000 -0.001*** -0.001* -0.000 -0.001*** -0.001** -0.000 (0.0002) (0.0003) (0.0002) (0.0002) (0.0003) (0.0003) (0.0002) (0.0004) (0.0002)∆ROA!,# 0.002 -0.008 0.009 0.014 0.013 0.009 -0.032 -0.047 -0.077** (0.0203) (0.0305) (0.0264) (0.0187) (0.0270) (0.0267) (0.0396) (0.0637) (0.0370)Constant 0.352 -0.025 0.009 0.707* 0.710 0.149 -0.018 -1.383 0.987 (0.4167) (0.6259) (0.5022) (0.4051) (0.5845) (0.5258) (0.9815) (1.5800) (0.8402)Observations 576 576 411 576 576 411 576 576 411

378
R-squared 0.086 0.074 0.139 0.296 0.341 0.158 0.589 0.521 0.738StateFixedEffect YES YES YES YES YES YES YES YES YESYearFixedEffect NO NO NO YES YES YES YES YES YESBankFixedEffect NO NO NO NO NO NO YES YES YES

379
PanelB:24-monthperiod
B.1Statefixedeffect B.2StateandyearfixedeffectsB.3State,year,andbank-levelfixedeffects
(1) (2) (3) (1) (2) (3) (1) (2) (3)
VARIABLES BHARS&P500
BHARNasdaq
BHARmatchedportfolio
BHARS&P500
BHARNasdaq
BHARmatchedportfolio
BHARS&P500
BHARNasdaq
BHARmatchedportfolio
Transactional_website_adoption!,#
0.294*** 0.412*** 0.024 0.193*** 0.295*** -0.023 0.555*** 0.727*** 0.324(0.0507) (0.0702) (0.0571) (0.0434) (0.0538) (0.0609) (0.1584) (0.1734) (0.2198)
Bank_Size!,# -0.022 -0.033 -0.028* 0.001 -0.016 -0.022 0.064 0.064 -0.011 (0.0155) (0.0214) (0.0162) (0.0133) (0.0165) (0.0168) (0.0591) (0.0647) (0.0703)Bank_Leverage!,# 0.002 -0.001 0.007 -0.003 -0.006 0.009 -0.015 -0.019 -0.014 (0.0046) (0.0064) (0.0078) (0.0038) (0.0047) (0.0079) (0.0109) (0.0119) (0.0145)Bank_Funding!,# 0.001 0.001 0.001 0.000 0.000 0.001 0.003 0.003 0.006* (0.0009) (0.0012) (0.0010) (0.0007) (0.0009) (0.0010) (0.0023) (0.0025) (0.0032)HHI!,# -0.001 -0.000 -0.001 -0.000 0.001** 0.000 -0.002* -0.003*** -0.000 (0.0003) (0.0005) (0.0004) (0.0005) (0.0006) (0.0007) (0.0011) (0.0012) (0.0014)∆ROA!,# -0.001 0.003 -0.001 0.003 0.006 -0.003 -0.009 -0.010 -0.002 (0.0089) (0.0123) (0.0098) (0.0074) (0.0092) (0.0100) (0.0094) (0.0103) (0.0575)Constant 1.236* 1.208 1.050 0.931 -0.996 0.259 3.075 5.743*** 0.947 (0.7059) (0.9770) (0.8594) (0.7766) (0.9638) (1.1196) (1.9858) (2.1726) (2.4933)Observations 570 570 424 570 570 424 570 570 424R-squared 0.113 0.112 0.115 0.431 0.542 0.146 0.741 0.838 0.605StateFixedEffect YES YES YES YES YES YES YES YES YESYearFixedEffect NO NO NO YES YES YES YES YES YESBankFixedEffect NO NO NO NO NO NO YES YES YES

380
PanelC:36-monthperiod
C.1Statefixedeffect C.2StateandyearfixedeffectsC.3State,year,andbank-levelfixedeffects
36-monthperiod (1) (2) (3) (1) (2) (3) (1) (2) (3)
VARIABLES BHARS&P500
BHARNasdaq
BHARmatchedportfolio
BHARS&P500
BHARNasdaq
BHARmatchedportfolio
BHARS&P500
BHARNasdaq
BHARmatchedportfolio
Transactional_website_adoption!,#
0.641*** 0.845*** 0.023 0.673*** 0.800*** 0.018 1.220*** 1.497*** 0.959**(0.0717) (0.0944) (0.0881) (0.0706) (0.0932) (0.1040) (0.3098) (0.3503) (0.4510)
Bank_Size!,# -0.070*** -0.116*** -0.031 -0.023 -0.059** -0.019 0.071 0.061 0.062 (0.0201) (0.0265) (0.0218) (0.0180) (0.0238) (0.0229) (0.0736) (0.0832) (0.0931)Bank_Leverage!,# -0.002 -0.000 0.002 -0.012 -0.015 0.006 -0.019 -0.023 0.003 (0.0093) (0.0122) (0.0150) (0.0080) (0.0106) (0.0151) (0.0303) (0.0342) (0.0497)Bank_Funding!,# 0.002 0.002 0.004** 0.002 0.001 0.004*** 0.003 0.003 0.008* (0.0011) (0.0015) (0.0014) (0.0010) (0.0013) (0.0014) (0.0029) (0.0032) (0.0044)HHI!,# -0.001** -0.002*** -0.001 -0.005*** -0.005*** -0.002* -0.002 -0.001 -0.003 (0.0005) (0.0007) (0.0008) (0.0009) (0.0012) (0.0013) (0.0022) (0.0025) (0.0030)∆ROA!,# 0.001 -0.002 0.003 0.008 0.005 0.000 0.108* 0.136** 0.125 (0.0096) (0.0127) (0.0109) (0.0084) (0.0111) (0.0112) (0.0563) (0.0637) (0.0756)Constant 2.872*** 4.661*** 1.634 7.233*** 7.843*** 2.887 3.402 3.614 3.560 (0.9652) (1.2705) (1.3178) (1.3980) (1.8445) (1.9063) (3.5482) (4.0117) (4.7936)Observations 534 534 408 534 534 408 534 534 408R-squared 0.212 0.216 0.129 0.449 0.449 0.169 0.786 0.843 0.647StateFixedEffect YES YES YES YES YES YES YES YES YESYearFixedEffect NO NO NO YES YES YES YES YES YESBankFixedEffect NO NO NO NO NO NO YES YES YES

381
TableA.6.17Re-estimationofEquation6.7,usingfixedeffectsThistablereportstheordinaryleastsquareregressionresultsforEquation6.7,basedonthesampleof307web-launchingannouncementsofpubliclytradedU.S.banks. In each regression, the dependent variable is BHAR,which are estimated as the difference between the compounded returns of sample banks, and thebenchmarkreturnsoverthepost-adoptionholdingperiod.TheholdingperiodsusedtoestimateBHARareex-postperiodofthewebsite-activatedevents,including(0,11)-PanelA;(0,23)-PanelB;(0,35)-PanelC.Ineachpanel,Equation6.7isestimatedusingstatefixedeffect;oryearandstatefixedeffects;orstateyearandbank-levelfixedeffects.ThreebenchmarksusedtoestimateBHARareS&P500,Nasdaq,andmatched-bankportfolio.ThemainindependentvariableisLBOY(1)%,&,representing“learning-by-observing”behaviour,or for theamountofobservable informationspillover frompreviouswebsite-adoptedevents fromwhichbankinvestorscanpotentiallylearn.ThisvariableisestimatedbythenumberofthecumulativenumberofsamplebanksthatadoptedtransactionalwebsitesduringoneyearsbeforethetransactionalwebsiteofbanktThesourcesforthisTableareFDIC,SNLFinancial,WaybackMachineU.S.CensusBureauofEconomic(BEA),U.S.BureauofLaborStatistics,theWorldBank,ThomsonFinancialSecuritiesData,andtheauthor’scalculations.Standarderrorsinparentheses.Thesuperscripts***,**,and*indicateastatisticallysignificantdifferencefromzeroatthe1,5,and10percentlevelsofsignificanceintwo-sidedtests.PanelA:12-monthperiod
A.1Statefixedeffect A.2StateandyearfixedeffectsA.3 State, year, andbank-level fixedeffects
(1) (2) (3) (1) (2) (3) (1) (2) (3)VARIABLES
BHARS&P500
BHARNasdaq
BHARmatchedportfolio
BHARS&P500
BHARNasdaq
BHARmatchedportfolio
BHARS&P500
BHARNasdaq
BHARmatchedportfolio
LBOY(1)!,# 0.004*** 0.006*** 0.002** -0.158 -0.163 0.002 0.002 0.006 0.002 (0.0006) (0.0009) (0.0008) (0.3023) (0.3559) (0.0012) (0.0000) (0.0000) (0.0000)Bank_Size!,# 0.014 0.012 0.010 0.014 0.014 0.011 0.271 0.329 -0.158 (0.0125) (0.0200) (0.0146) (0.0107) (0.0126) (0.0148) (0.0000) (0.0000) (0.0000)Bank_Leverage!,# 0.003 0.007 0.005 -0.001 -0.002 0.006 -0.015 -0.036 -0.128 (0.0029) (0.0047) (0.0048) (0.0026) (0.0030) (0.0049) (0.0000) (0.0000) (0.0000)Bank_Funding!,# 0.000 0.001 0.000 0.000 0.000 0.001 0.000 0.006 -0.013 (0.0006) (0.0009) (0.0008) (0.0005) (0.0006) (0.0009) (0.0000) (0.0000) (0.0000)HHI!,# -0.001*** -0.002*** -0.000 0.001 0.001 -0.001 -0.002 -0.000 0.017 (0.0002) (0.0004) (0.0003) (0.0030) (0.0036) (0.0024) (0.0000) (0.0000) (0.0000)∆ROA!,# 0.040* 0.061* -0.001 0.021 0.029 0.009 0.060 0.160 0.068 (0.0224) (0.0358) (0.0380) (0.0198) (0.0234) (0.0389) (0.0000) (0.0000) (0.0000)Constant 1.553*** 2.311** -0.469 -1.565 -1.611 0.725 -1.374 -5.698 -22.062 (0.5702) (0.9112) (0.7188) (4.5897) (5.4031) (3.6251) (0.0000) (0.0000) (0.0000)

382
Observations 303 303 217 303 303 217 303 303 217R-squared 0.383 0.379 0.274 0.584 0.773 0.293 1.000 1.000 1.000StateFixedEffect YES YES YES YES YES YES YES YES YESYearFixedEffect NO NO NO YES YES YES YES YES YESBankFixedEffect NO NO NO NO NO NO YES YES YES
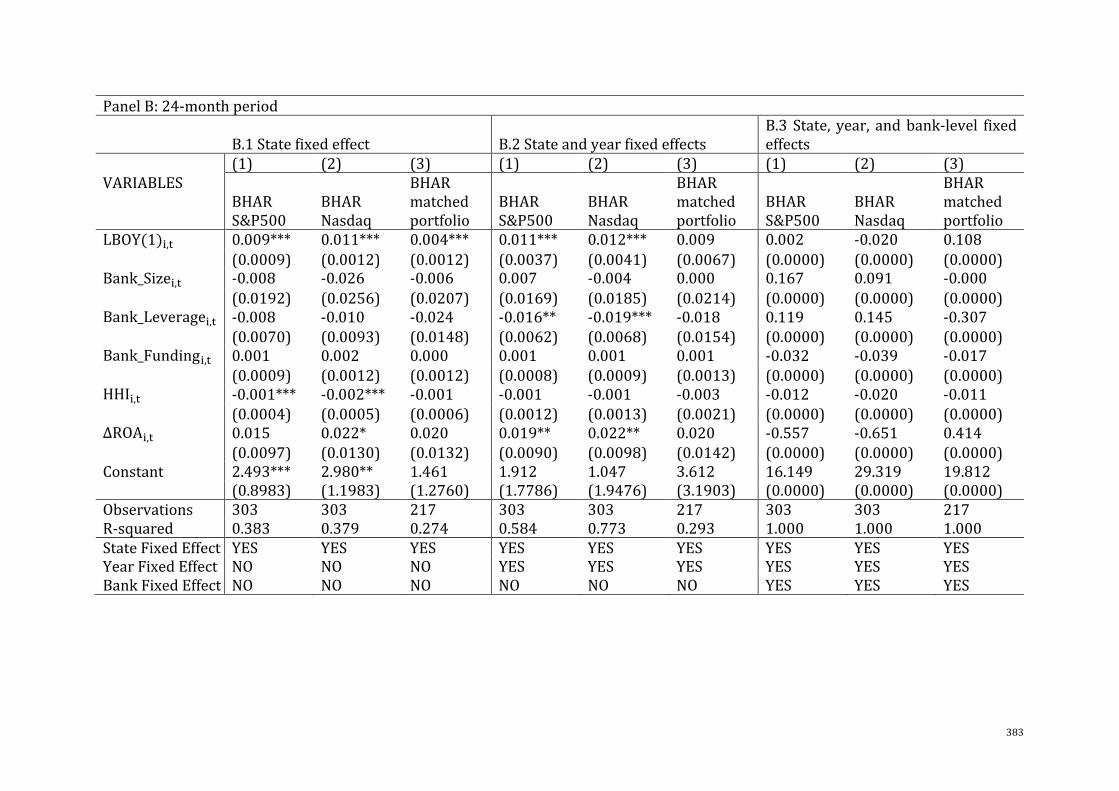
383
PanelB:24-monthperiod
B.1Statefixedeffect B.2StateandyearfixedeffectsB.3 State, year, andbank-level fixedeffects
(1) (2) (3) (1) (2) (3) (1) (2) (3)VARIABLES
BHARS&P500
BHARNasdaq
BHARmatchedportfolio
BHARS&P500
BHARNasdaq
BHARmatchedportfolio
BHARS&P500
BHARNasdaq
BHARmatchedportfolio
LBOY(1)!,# 0.009*** 0.011*** 0.004*** 0.011*** 0.012*** 0.009 0.002 -0.020 0.108 (0.0009) (0.0012) (0.0012) (0.0037) (0.0041) (0.0067) (0.0000) (0.0000) (0.0000)Bank_Size!,# -0.008 -0.026 -0.006 0.007 -0.004 0.000 0.167 0.091 -0.000 (0.0192) (0.0256) (0.0207) (0.0169) (0.0185) (0.0214) (0.0000) (0.0000) (0.0000)Bank_Leverage!,# -0.008 -0.010 -0.024 -0.016** -0.019*** -0.018 0.119 0.145 -0.307 (0.0070) (0.0093) (0.0148) (0.0062) (0.0068) (0.0154) (0.0000) (0.0000) (0.0000)Bank_Funding!,# 0.001 0.002 0.000 0.001 0.001 0.001 -0.032 -0.039 -0.017 (0.0009) (0.0012) (0.0012) (0.0008) (0.0009) (0.0013) (0.0000) (0.0000) (0.0000)HHI!,# -0.001*** -0.002*** -0.001 -0.001 -0.001 -0.003 -0.012 -0.020 -0.011 (0.0004) (0.0005) (0.0006) (0.0012) (0.0013) (0.0021) (0.0000) (0.0000) (0.0000)∆ROA!,# 0.015 0.022* 0.020 0.019** 0.022** 0.020 -0.557 -0.651 0.414 (0.0097) (0.0130) (0.0132) (0.0090) (0.0098) (0.0142) (0.0000) (0.0000) (0.0000)Constant 2.493*** 2.980** 1.461 1.912 1.047 3.612 16.149 29.319 19.812 (0.8983) (1.1983) (1.2760) (1.7786) (1.9476) (3.1903) (0.0000) (0.0000) (0.0000)Observations 303 303 217 303 303 217 303 303 217R-squared 0.383 0.379 0.274 0.584 0.773 0.293 1.000 1.000 1.000StateFixedEffect YES YES YES YES YES YES YES YES YESYearFixedEffect NO NO NO YES YES YES YES YES YESBankFixedEffect NO NO NO NO NO NO YES YES YES
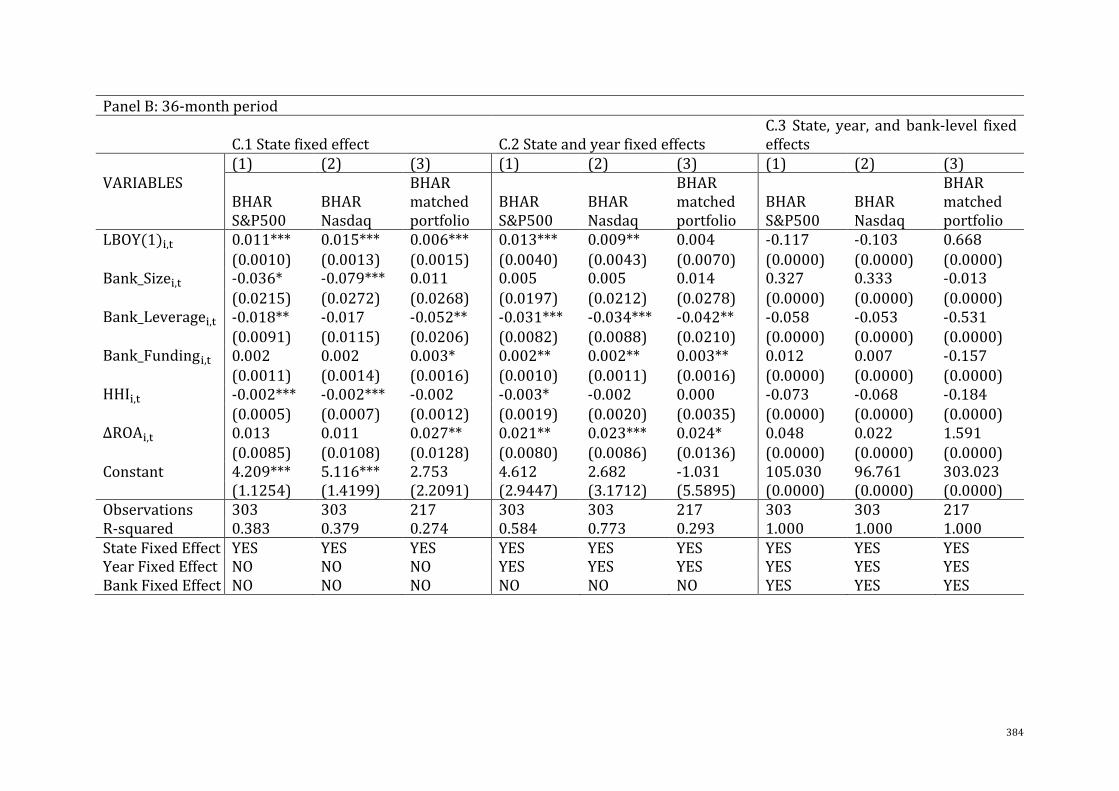
384
PanelB:36-monthperiod
C.1Statefixedeffect C.2StateandyearfixedeffectsC.3 State, year, and bank-level fixedeffects
(1) (2) (3) (1) (2) (3) (1) (2) (3)VARIABLES
BHARS&P500
BHARNasdaq
BHARmatchedportfolio
BHARS&P500
BHARNasdaq
BHARmatchedportfolio
BHARS&P500
BHARNasdaq
BHARmatchedportfolio
LBOY(1)!,# 0.011*** 0.015*** 0.006*** 0.013*** 0.009** 0.004 -0.117 -0.103 0.668 (0.0010) (0.0013) (0.0015) (0.0040) (0.0043) (0.0070) (0.0000) (0.0000) (0.0000)Bank_Size!,# -0.036* -0.079*** 0.011 0.005 0.005 0.014 0.327 0.333 -0.013 (0.0215) (0.0272) (0.0268) (0.0197) (0.0212) (0.0278) (0.0000) (0.0000) (0.0000)Bank_Leverage!,# -0.018** -0.017 -0.052** -0.031*** -0.034*** -0.042** -0.058 -0.053 -0.531 (0.0091) (0.0115) (0.0206) (0.0082) (0.0088) (0.0210) (0.0000) (0.0000) (0.0000)Bank_Funding!,# 0.002 0.002 0.003* 0.002** 0.002** 0.003** 0.012 0.007 -0.157 (0.0011) (0.0014) (0.0016) (0.0010) (0.0011) (0.0016) (0.0000) (0.0000) (0.0000)HHI!,# -0.002*** -0.002*** -0.002 -0.003* -0.002 0.000 -0.073 -0.068 -0.184 (0.0005) (0.0007) (0.0012) (0.0019) (0.0020) (0.0035) (0.0000) (0.0000) (0.0000)∆ROA!,# 0.013 0.011 0.027** 0.021** 0.023*** 0.024* 0.048 0.022 1.591 (0.0085) (0.0108) (0.0128) (0.0080) (0.0086) (0.0136) (0.0000) (0.0000) (0.0000)Constant 4.209*** 5.116*** 2.753 4.612 2.682 -1.031 105.030 96.761 303.023 (1.1254) (1.4199) (2.2091) (2.9447) (3.1712) (5.5895) (0.0000) (0.0000) (0.0000)Observations 303 303 217 303 303 217 303 303 217R-squared 0.383 0.379 0.274 0.584 0.773 0.293 1.000 1.000 1.000StateFixedEffect YES YES YES YES YES YES YES YES YESYearFixedEffect NO NO NO YES YES YES YES YES YESBankFixedEffect NO NO NO NO NO NO YES YES YES

385
TableA.6.18Re-estimationofEquation6.8,usingfixedeffectsThistablereportstheordinaryleastsquareregressionresultsforEquation6.8,basedonthesampleof307web-launchingannouncementsofpubliclytradedU.S.banks.Intheregression,thedependentvariableisBHAR,whichisestimatedasthedifferencebetweenthecompoundedreturnsofsamplebanks,andthebenchmarkreturnsoverthepost-adoptionholdingperiod.TheholdingperiodsusedtoestimateBHARareex-postperiodofthewebsite-activatedevents,including(0,11)-PanelA;(0,23)-PanelB;(0,35)-PanelC.Ineachpanel,Equation6.8isestimatedusingstatefixedeffect;oryearandstatefixedeffects;orstateyearandbank-levelfixedeffects. Three benchmarks used to estimate BHAR are S&P500, Nasdaq, and matched-bank portfolio. The main independent variables are Smallbank%,& andLargebank%,&.Thecontrolvariablesarealsoemployedtocontrolforexogenouscross-sectionaldifferencesinmarketstructuresandbankcharacteristicsandareallobservedannually.ThesourcesforthistableareFDIC,SNLFinancial,WaybackMachineU.S.CensusBureauofEconomic(BEA),U.S.BureauofLaborStatistics,theWorldBank,ThomsonFinancialSecuritiesData,andtheauthor’scalculations.Standarderrorsinparentheses.Thesuperscripts***,**,and*indicateastatisticallysignificantdifferencefromzeroatthe1,5,and10percentlevelsofsignificanceintwo-sidedtests.PanelA:12-monthperiod
A.1Statefixedeffect A.2StateandyearfixedeffectsA.3State,year,andbank-levelfixedeffects
(1) (2) (3) (1) (2) (3) (1) (2) (3)
VARIABLES BHARS&P500
BHARNasdaq
BHARmatchedportfolio
BHARS&P500
BHARNasdaq
BHARmatchedportfolio
BHARS&P500
BHARNasdaq
BHARmatchedportfolio
Largebank!,# -0.083** -0.155** -0.032 0.010 -0.009 0.001 0.324 0.675 -0.834 (0.0419) (0.0673) (0.0476) (0.0345) (0.0398) (0.0509) (0.0000) (0.0000) (0.0000)Bank_Leverage!,# 0.004 0.007 0.005 -0.002 -0.003 0.004 0.028 -0.005 -0.083 (0.0032) (0.0051) (0.0048) (0.0026) (0.0030) (0.0051) (0.0000) (0.0000) (0.0000)Bank_Funding!,# 0.001 0.001 0.000 0.000 0.001 0.000 -0.013 -0.002 -0.017 (0.0006) (0.0010) (0.0008) (0.0005) (0.0006) (0.0008) (0.0000) (0.0000) (0.0000)HHI!,# -0.002*** -0.002*** -0.000 -0.001* -0.000 -0.000 -0.014 -0.005 0.011 (0.0003) (0.0004) (0.0003) (0.0004) (0.0005) (0.0005) (0.0000) (0.0000) (0.0000)∆ROA!,# 0.025 0.038 -0.001 0.023 0.040* 0.007 -0.134 0.087 -0.022 (0.0242) (0.0389) (0.0381) (0.0197) (0.0228) (0.0388) (0.0000) (0.0000) (0.0000)Constant 2.695*** 3.942*** -0.401 1.229* 0.373 -0.012 21.798 8.794 -16.222 (0.4756) (0.7634) (0.6307) (0.6576) (0.7600) (0.8766) (0.0000) (0.0000) (0.0000)Observations 303 303 217 303 303 217 303 303 217R-squared 0.270 0.259 0.250 0.576 0.777 0.291 1.000 1.000 1.000StateFixedEffect YES YES YES YES YES YES YES YES YES
386
YearFixedEffect NO NO NO YES YES YES YES YES YESBankFixedEffect NO NO NO NO NO NO YES YES YES
ReferencevariableSmallBank
SmallBank
SmallBank
SmallBank
SmallBank
SmallBank
SmallBank
SmallBank
SmallBank

387
PanelB:24-monthperiod
B.1Statefixedeffect B.2StateandyearfixedeffectsB.3State,year,andbank-levelfixedeffects
(1) (2) (3) (1) (2) (3) (1) (2) (3)
VARIABLES BHARS&P500
BHARNasdaq
BHARmatchedportfolio
BHARS&P500
BHARNasdaq
BHARmatchedportfolio
BHARS&P500
BHARNasdaq
BHARmatchedportfolio
Largebank!,# -0.213*** -0.332*** -0.060 0.040 0.007 0.024 -0.515 -0.982 -0.000 (0.0719) (0.0934) (0.0695) (0.0556) (0.0610) (0.0745) (0.0000) (0.0000) (0.0000)Bank_Leverage!,# -0.003 -0.003 -0.016 -0.018*** -0.021*** -0.019 0.244 0.289 -0.307 (0.0083) (0.0108) (0.0150) (0.0062) (0.0068) (0.0154) (0.0000) (0.0000) (0.0000)Bank_Funding!,# 0.001 0.001 0.001 0.001 0.001 0.001 -0.065 -0.077 -0.017 (0.0011) (0.0014) (0.0012) (0.0008) (0.0009) (0.0013) (0.0000) (0.0000) (0.0000)HHI!,# -0.002*** -0.002*** 0.000 0.001 0.002* -0.000 -0.032 -0.038 0.024 (0.0005) (0.0006) (0.0006) (0.0010) (0.0010) (0.0012) (0.0000) (0.0000) (0.0000)∆ROA!,# 0.003 0.007 0.014 0.021** 0.025** 0.021 -1.078 -1.291 0.414 (0.0115) (0.0149) (0.0134) (0.0091) (0.0100) (0.0142) (0.0000) (0.0000) (0.0000)Constant 3.550*** 4.012*** 0.029 -1.130 -2.462 -0.016 50.063 57.722 -30.298 (0.8295) (1.0771) (1.1111) (1.4356) (1.5742) (1.8902) (0.0000) (0.0000) (0.0000)Observations 303 303 228 303 303 228 303 303 228R-squared 0.190 0.221 0.225 0.595 0.722 0.288 1.000 1.000 1.000StateFixedEffect YES YES YES YES YES YES YES YES YESYearFixedEffect NO NO NO YES YES YES YES YES YESBankFixedEffect NO NO NO NO NO NO YES YES YES
ReferencevariableSmallBank
SmallBank
SmallBank
SmallBank
SmallBank
SmallBank
SmallBank
SmallBank
SmallBank

388
PanelC:36-monthperiod
C.1Statefixedeffect C.2StateandyearfixedeffectsC.3State,year,andbank-levelfixedeffects
36-monthperiod (1) (2) (3) (1) (2) (3) (1) (2) (3)
VARIABLES BHARS&P500
BHARIndexNasdaq
BHARmatchedportfolio
BHARS&P500
BHARNasdaq
BHARmatchedportfolio
BHARS&P500
BHARNasdaq
BHARmatchedportfolio
Largebank!,# -0.311*** -0.426*** -0.132 -0.002 -0.007 0.017 1.204 1.229 -0.026 (0.0859) (0.1115) (0.0893) (0.0653) (0.0694) (0.0941) (0.0000) (0.0000) (0.0000)Bank_Leverage!,# -0.010 -0.005 -0.037* -0.034*** -0.037*** -0.042** -0.008 -0.001 -0.527 (0.0112) (0.0146) (0.0210) (0.0083) (0.0088) (0.0210) (0.0000) (0.0000) (0.0000)Bank_Funding!,# 0.001 0.001 0.003** 0.002** 0.003** 0.004** -0.001 -0.005 -0.156 (0.0013) (0.0017) (0.0016) (0.0010) (0.0011) (0.0016) (0.0000) (0.0000) (0.0000)HHI!,# -0.003*** -0.003*** -0.001 -0.000 -0.000 0.002 0.073 0.035 0.128 (0.0007) (0.0009) (0.0012) (0.0017) (0.0018) (0.0025) (0.0000) (0.0000) (0.0000)∆ROA!,# 0.002 -0.005 0.019 0.023*** 0.025*** 0.025* 0.011 -0.015 1.585 (0.0104) (0.0135) (0.0130) (0.0081) (0.0086) (0.0135) (0.0000) (0.0000) (0.0000)Constant 5.749*** 6.260*** 1.201 0.355 -0.169 -3.189 -114.703 -55.713 -179.697 (1.1527) (1.4955) (2.1451) (2.6299) (2.7973) (3.9481) (0.0000) (0.0000) (0.0000)Observations 303 303 236 303 303 236 303 303 236R-squared 0.244 0.231 0.245 0.634 0.749 0.331 1.000 1.000 1.000StateFixedEffect YES YES YES YES YES YES YES YES YESYearFixedEffect NO NO NO YES YES YES YES YES YESBankFixedEffect NO NO NO NO NO NO YES YES YES
ReferencevariableSmallBank
SmallBank
SmallBank
SmallBank
SmallBank
SmallBank
SmallBank
SmallBank
SmallBank
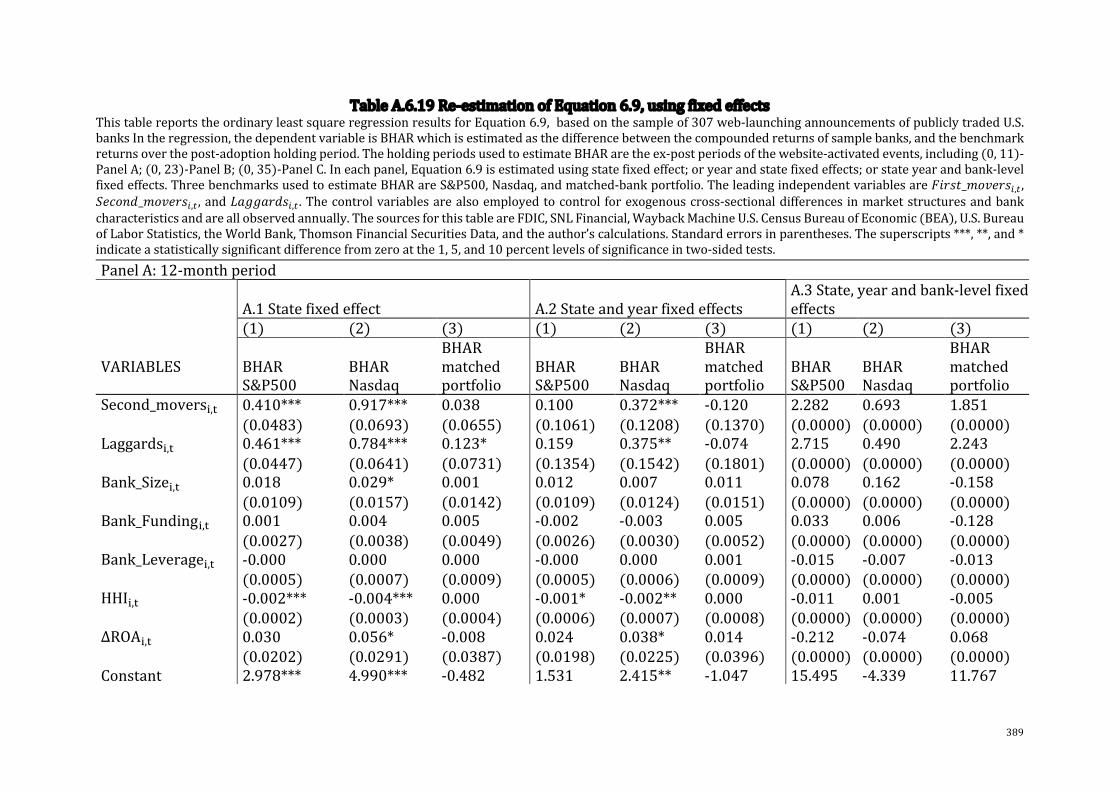
389
TableA.6.19Re-estimationofEquation6.9,usingfixedeffectsThistablereportstheordinaryleastsquareregressionresultsforEquation6.9,basedonthesampleof307web-launchingannouncementsofpubliclytradedU.S.banksIntheregression,thedependentvariableisBHARwhichisestimatedasthedifferencebetweenthecompoundedreturnsofsamplebanks,andthebenchmarkreturnsoverthepost-adoptionholdingperiod.TheholdingperiodsusedtoestimateBHARaretheex-postperiodsofthewebsite-activatedevents,including(0,11)-PanelA;(0,23)-PanelB;(0,35)-PanelC.Ineachpanel,Equation6.9isestimatedusingstatefixedeffect;oryearandstatefixedeffects;orstateyearandbank-levelfixedeffects.ThreebenchmarksusedtoestimateBHARareS&P500,Nasdaq,andmatched-bankportfolio.Theleadingindependentvariablesareijklm_opqrkl!,# ,srtpuv_opqrkl!,# ,andwxyyxkvl!,# .Thecontrolvariablesarealsoemployedtocontrol forexogenouscross-sectionaldifferences inmarketstructuresandbankcharacteristicsandareallobservedannually.ThesourcesforthistableareFDIC,SNLFinancial,WaybackMachineU.S.CensusBureauofEconomic(BEA),U.S.BureauofLaborStatistics,theWorldBank,ThomsonFinancialSecuritiesData,andtheauthor’scalculations.Standarderrorsinparentheses.Thesuperscripts***,**,and*indicateastatisticallysignificantdifferencefromzeroatthe1,5,and10percentlevelsofsignificanceintwo-sidedtests.PanelA:12-monthperiod
A.1Statefixedeffect A.2StateandyearfixedeffectsA.3State,yearandbank-levelfixedeffects
(1) (2) (3) (1) (2) (3) (1) (2) (3)
VARIABLES BHARS&P500
BHARNasdaq
BHARmatchedportfolio
BHARS&P500
BHARNasdaq
BHARmatchedportfolio
BHARS&P500
BHARNasdaq
BHARmatchedportfolio
Second_movers!,# 0.410*** 0.917*** 0.038 0.100 0.372*** -0.120 2.282 0.693 1.851 (0.0483) (0.0693) (0.0655) (0.1061) (0.1208) (0.1370) (0.0000) (0.0000) (0.0000)Laggards!,# 0.461*** 0.784*** 0.123* 0.159 0.375** -0.074 2.715 0.490 2.243 (0.0447) (0.0641) (0.0731) (0.1354) (0.1542) (0.1801) (0.0000) (0.0000) (0.0000)Bank_Size!,# 0.018 0.029* 0.001 0.012 0.007 0.011 0.078 0.162 -0.158 (0.0109) (0.0157) (0.0142) (0.0109) (0.0124) (0.0151) (0.0000) (0.0000) (0.0000)Bank_Funding!,# 0.001 0.004 0.005 -0.002 -0.003 0.005 0.033 0.006 -0.128 (0.0027) (0.0038) (0.0049) (0.0026) (0.0030) (0.0052) (0.0000) (0.0000) (0.0000)Bank_Leverage!,# -0.000 0.000 0.000 -0.000 0.000 0.001 -0.015 -0.007 -0.013 (0.0005) (0.0007) (0.0009) (0.0005) (0.0006) (0.0009) (0.0000) (0.0000) (0.0000)HHI!,# -0.002*** -0.004*** 0.000 -0.001* -0.002** 0.000 -0.011 0.001 -0.005 (0.0002) (0.0003) (0.0004) (0.0006) (0.0007) (0.0008) (0.0000) (0.0000) (0.0000)∆ROA!,# 0.030 0.056* -0.008 0.024 0.038* 0.014 -0.212 -0.074 0.068 (0.0202) (0.0291) (0.0387) (0.0198) (0.0225) (0.0396) (0.0000) (0.0000) (0.0000)Constant 2.978*** 4.990*** -0.482 1.531 2.415** -1.047 15.495 -4.339 11.767
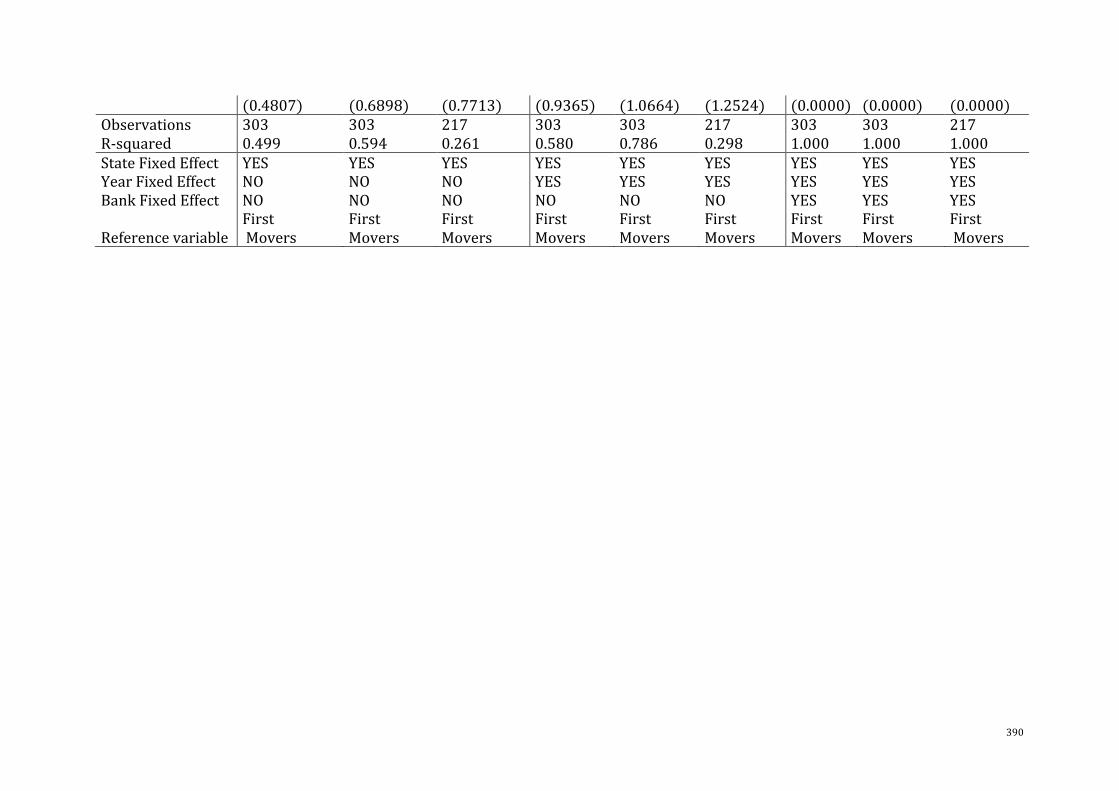
390
(0.4807) (0.6898) (0.7713) (0.9365) (1.0664) (1.2524) (0.0000) (0.0000) (0.0000)Observations 303 303 217 303 303 217 303 303 217R-squared 0.499 0.594 0.261 0.580 0.786 0.298 1.000 1.000 1.000StateFixedEffect YES YES YES YES YES YES YES YES YESYearFixedEffect NO NO NO YES YES YES YES YES YESBankFixedEffect NO NO NO NO NO NO YES YES YES
ReferencevariableFirstMovers
FirstMovers
FirstMovers
FirstMovers
FirstMovers
FirstMovers
FirstMovers
FirstMovers
FirstMovers
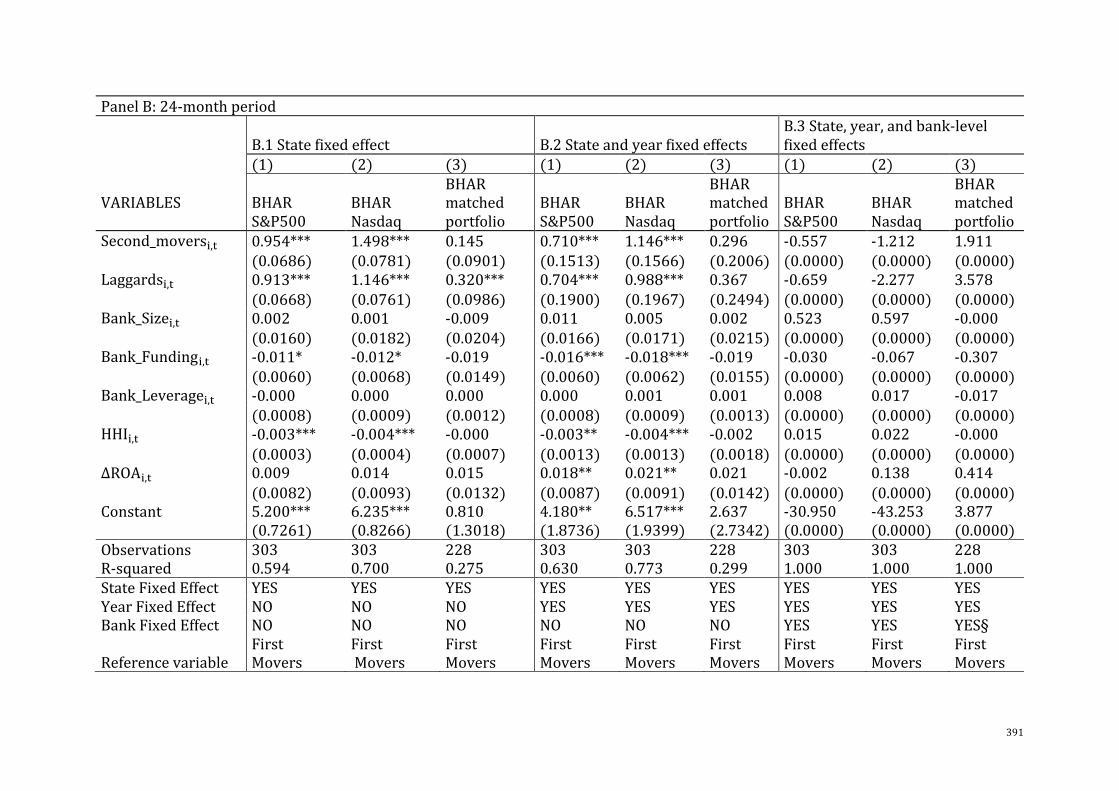
391
PanelB:24-monthperiod
B.1Statefixedeffect B.2StateandyearfixedeffectsB.3State,year,andbank-levelfixedeffects
(1) (2) (3) (1) (2) (3) (1) (2) (3)
VARIABLES BHARS&P500
BHARNasdaq
BHARmatchedportfolio
BHARS&P500
BHARNasdaq
BHARmatchedportfolio
BHARS&P500
BHARNasdaq
BHARmatchedportfolio
Second_movers!,# 0.954*** 1.498*** 0.145 0.710*** 1.146*** 0.296 -0.557 -1.212 1.911 (0.0686) (0.0781) (0.0901) (0.1513) (0.1566) (0.2006) (0.0000) (0.0000) (0.0000)Laggards!,# 0.913*** 1.146*** 0.320*** 0.704*** 0.988*** 0.367 -0.659 -2.277 3.578 (0.0668) (0.0761) (0.0986) (0.1900) (0.1967) (0.2494) (0.0000) (0.0000) (0.0000)Bank_Size!,# 0.002 0.001 -0.009 0.011 0.005 0.002 0.523 0.597 -0.000 (0.0160) (0.0182) (0.0204) (0.0166) (0.0171) (0.0215) (0.0000) (0.0000) (0.0000)Bank_Funding!,# -0.011* -0.012* -0.019 -0.016*** -0.018*** -0.019 -0.030 -0.067 -0.307 (0.0060) (0.0068) (0.0149) (0.0060) (0.0062) (0.0155) (0.0000) (0.0000) (0.0000)Bank_Leverage!,# -0.000 0.000 0.000 0.000 0.001 0.001 0.008 0.017 -0.017 (0.0008) (0.0009) (0.0012) (0.0008) (0.0009) (0.0013) (0.0000) (0.0000) (0.0000)HHI!,# -0.003*** -0.004*** -0.000 -0.003** -0.004*** -0.002 0.015 0.022 -0.000 (0.0003) (0.0004) (0.0007) (0.0013) (0.0013) (0.0018) (0.0000) (0.0000) (0.0000)∆ROA!,# 0.009 0.014 0.015 0.018** 0.021** 0.021 -0.002 0.138 0.414 (0.0082) (0.0093) (0.0132) (0.0087) (0.0091) (0.0142) (0.0000) (0.0000) (0.0000)Constant 5.200*** 6.235*** 0.810 4.180** 6.517*** 2.637 -30.950 -43.253 3.877 (0.7261) (0.8266) (1.3018) (1.8736) (1.9399) (2.7342) (0.0000) (0.0000) (0.0000)Observations 303 303 228 303 303 228 303 303 228R-squared 0.594 0.700 0.275 0.630 0.773 0.299 1.000 1.000 1.000StateFixedEffect YES YES YES YES YES YES YES YES YESYearFixedEffect NO NO NO YES YES YES YES YES YESBankFixedEffect NO NO NO NO NO NO YES YES YES§
ReferencevariableFirstMovers
FirstMovers
FirstMovers
FirstMovers
FirstMovers
FirstMovers
FirstMovers
FirstMovers
FirstMovers
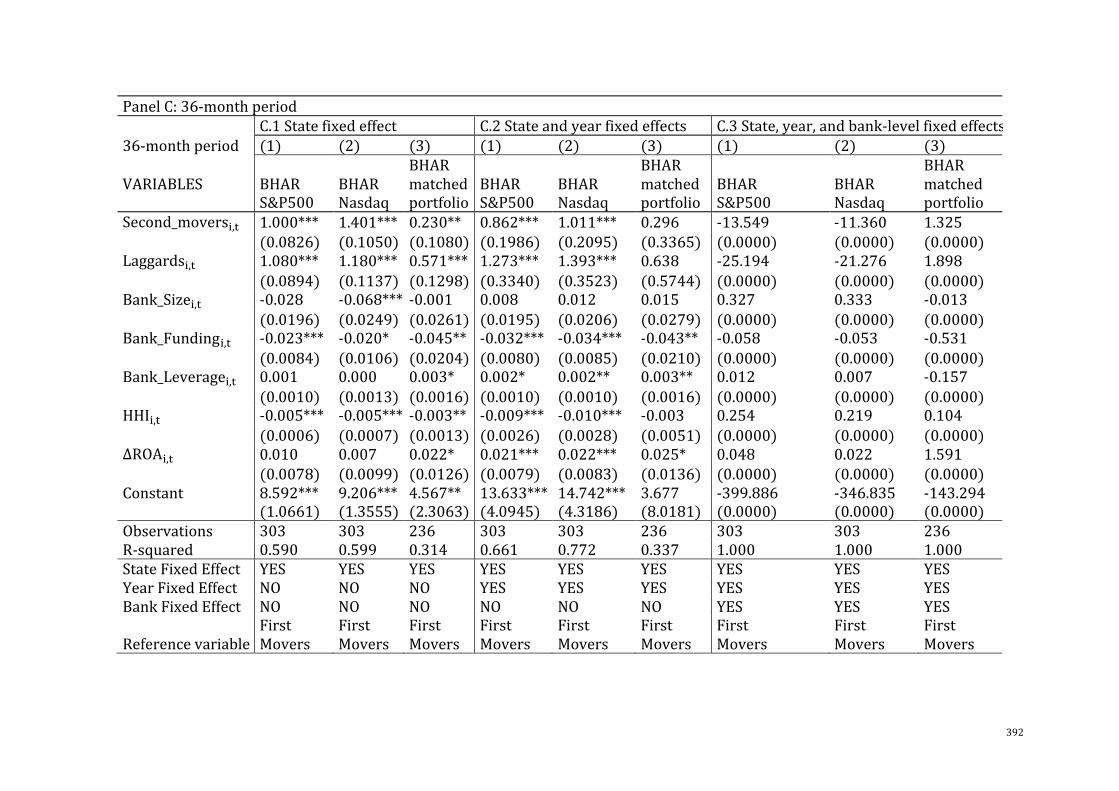
392
PanelC:36-monthperiod C.1Statefixedeffect C.2Stateandyearfixedeffects C.3State,year,andbank-levelfixedeffects36-monthperiod (1) (2) (3) (1) (2) (3) (1) (2) (3)
VARIABLES BHARS&P500
BHARNasdaq
BHARmatchedportfolio
BHARS&P500
BHARNasdaq
BHARmatchedportfolio
BHARS&P500
BHARNasdaq
BHARmatchedportfolio
Second_movers!,# 1.000*** 1.401*** 0.230** 0.862*** 1.011*** 0.296 -13.549 -11.360 1.325 (0.0826) (0.1050) (0.1080) (0.1986) (0.2095) (0.3365) (0.0000) (0.0000) (0.0000)Laggards!,# 1.080*** 1.180*** 0.571*** 1.273*** 1.393*** 0.638 -25.194 -21.276 1.898 (0.0894) (0.1137) (0.1298) (0.3340) (0.3523) (0.5744) (0.0000) (0.0000) (0.0000)Bank_Size!,# -0.028 -0.068*** -0.001 0.008 0.012 0.015 0.327 0.333 -0.013 (0.0196) (0.0249) (0.0261) (0.0195) (0.0206) (0.0279) (0.0000) (0.0000) (0.0000)Bank_Funding!,# -0.023*** -0.020* -0.045** -0.032*** -0.034*** -0.043** -0.058 -0.053 -0.531 (0.0084) (0.0106) (0.0204) (0.0080) (0.0085) (0.0210) (0.0000) (0.0000) (0.0000)Bank_Leverage!,# 0.001 0.000 0.003* 0.002* 0.002** 0.003** 0.012 0.007 -0.157 (0.0010) (0.0013) (0.0016) (0.0010) (0.0010) (0.0016) (0.0000) (0.0000) (0.0000)HHI!,# -0.005*** -0.005*** -0.003** -0.009*** -0.010*** -0.003 0.254 0.219 0.104 (0.0006) (0.0007) (0.0013) (0.0026) (0.0028) (0.0051) (0.0000) (0.0000) (0.0000)∆ROA!,# 0.010 0.007 0.022* 0.021*** 0.022*** 0.025* 0.048 0.022 1.591 (0.0078) (0.0099) (0.0126) (0.0079) (0.0083) (0.0136) (0.0000) (0.0000) (0.0000)Constant 8.592*** 9.206*** 4.567** 13.633*** 14.742*** 3.677 -399.886 -346.835 -143.294 (1.0661) (1.3555) (2.3063) (4.0945) (4.3186) (8.0181) (0.0000) (0.0000) (0.0000)Observations 303 303 236 303 303 236 303 303 236R-squared 0.590 0.599 0.314 0.661 0.772 0.337 1.000 1.000 1.000StateFixedEffect YES YES YES YES YES YES YES YES YESYearFixedEffect NO NO NO YES YES YES YES YES YESBankFixedEffect NO NO NO NO NO NO YES YES YES
ReferencevariableFirstMovers
FirstMovers
FirstMovers
FirstMovers
FirstMovers
FirstMovers
FirstMovers
FirstMovers
FirstMovers

393