School Information System. INSTITUTION - ERIC
23
DOCUMENT RESUME ED 089 684 IR 000 396 AUTHOR Barbadora, Bernard M. TITLE A Description of the Cincinnati Public Schools' School Information System. INSTITUTION Cincinnati Public Schools, Ohio. PUB DATE Apr 74 NOTE 22p.; Paper presented at the American Educational Research Association Annual Meeting (Chicago, Illinois, April 15 through 19, 1974) EDRS PRICE MP-$0.75 HC-$1.50 PLUS POSTAGE DESCRIPTORS Computer Programs; *Decision Making; *Educational Planning; Elementary Schools; Evaluation; *Information Systems; Junior High Schools; *Management Information Systems; Program Descriptions; School Districts; *School Systeme; Senior High Schools IDENTIFIERS Cincinnati Public Schools; *School Information System; SIS Hewlett-Packard 2000C Computer ABSTRACT The Cincinnati Public Schools' Information System (SIS) was established in 1970 and is currently an ongoing mechanism serving almost 100 schools. 'Its overall purpose is to provide data and information to decision-makers in order to optimize decision-making. The system utilizes a Hewlett-Packard 2000C unit and collects data on over 800 variables relating to students, staff, school plants, assignable costs, demographic characteristics, special education, and other matters. Each elementary, junior, and senior high school is provided with 11 reports which describe what the school is doing in relation to these variables and how these variables relate to educational achievement. Four years' experience with the system indicates that it provides excellent support for educational planning and control processes, for goal setting, Froblem identification and needs analysis, and for product evaluation. In addition, the SIS is an integral part of the educational accountability system and the district's Planning, Programing, and Budgeting System (PPBS). (Author)
-
Upload
khangminh22 -
Category
Documents
-
view
4 -
download
0
Transcript of School Information System. INSTITUTION - ERIC

DOCUMENT RESUME
ED 089 684 IR 000 396
AUTHOR Barbadora, Bernard M.TITLE A Description of the Cincinnati Public Schools'
School Information System.INSTITUTION Cincinnati Public Schools, Ohio.PUB DATE Apr 74NOTE 22p.; Paper presented at the American Educational
Research Association Annual Meeting (Chicago,Illinois, April 15 through 19, 1974)
EDRS PRICE MP-$0.75 HC-$1.50 PLUS POSTAGEDESCRIPTORS Computer Programs; *Decision Making; *Educational
Planning; Elementary Schools; Evaluation;*Information Systems; Junior High Schools;*Management Information Systems; ProgramDescriptions; School Districts; *School Systeme;Senior High Schools
IDENTIFIERS Cincinnati Public Schools; *School InformationSystem; SIS Hewlett-Packard 2000C Computer
ABSTRACTThe Cincinnati Public Schools' Information System
(SIS) was established in 1970 and is currently an ongoing mechanismserving almost 100 schools. 'Its overall purpose is to provide dataand information to decision-makers in order to optimizedecision-making. The system utilizes a Hewlett-Packard 2000C unit andcollects data on over 800 variables relating to students, staff,school plants, assignable costs, demographic characteristics, specialeducation, and other matters. Each elementary, junior, and seniorhigh school is provided with 11 reports which describe what theschool is doing in relation to these variables and how thesevariables relate to educational achievement. Four years' experiencewith the system indicates that it provides excellent support foreducational planning and control processes, for goal setting, Froblemidentification and needs analysis, and for product evaluation. Inaddition, the SIS is an integral part of the educationalaccountability system and the district's Planning, Programing, andBudgeting System (PPBS). (Author)

(=>A Description Of
C:1The Cincinnati Public Schools'
School Information System
U S DEPARTMENT OF HEALTH.EDUCATION &WEL.EARENATIONAL INSTITUTE OF
EDUCATIONti-HS DOCUMENT HAS BEEN REPRODuCED EXACTLY AS RECEIVED' FROMTHE PERSON CR ORGANIZATIONAiING 17 POINTS OF VIEW OR OPINIONSSTATED CO NOT NECESSARILY REPRESENT OFFICIAL NATIONAL INSTITUTE OFEOuEAT,CN POSON CR POLICY
ByBernard M. Barbadora
Manager, The School Information SystemCincinnati Public Schools
230 East Ninth StreetCincinnati, Ohio
Paper Presented At the 1974Annual Meeting Of The American Educational Research Association
April 15-19

A Brief Description Of The Cincinnati Public Schools' School Information System
INTRODUCTION
In May of 1970 the Cincinnati Public Schools, Cincinnati, Ohio, received a Title
III grant for the purpose of developing and implementing a School Information System
(SIS) for the school district. The overarching rationale or strategy for this en-
deavor was the belief that when decision makers are provided with relevant, timely,
'reliable, and valid information; and when it Is presented in an easy to read fashion,
they are better able to make rational decisions than when such information is not
available. The seven basic goals of the system are (1) To develop a school eval-
uation and management model using system concepts. (2) To gather data on school
unit variables "most likely" influthicing the effective operation of the Cincinnati
Public Schools. (3) To construct a longitudinal school unit data bank and informa-
tion system. (4) To analyze data for parsimony, descriptiveness, and prediction of
school output. (5) To report data and information meaningfully to decision makers
so they can more effectively carry out the decision-making process. (6) To develop,
administer, analyze, and report the student, teacher, parent, and administrator
surveys. (7) To provide in- service training sessions for decision makers so they
can tiderstand and utilize this information system.
In the above paragraph an attempt was made to give the reader an idea of the
rationale for the system and what it is endeavoring to accomplish. The remaining
sections of this document will address itself to: (1) Background and Direction of
the School Information System, (2) Hardware Configurations, (3) Data Collection,
(4) Data Resources, Information Reporting, and (6) Evaluation of the System.
MAJOR COMPONENTS OF THE SYSTEM
A. Background and DireCtion of'the System.
At the present time I have a staff of three plus myself. At the outset of the
project I had a staff of six people which included two programmer analysts, one pro-
grammerone evaluator, two statistical clerks and a secretary.
1
With respect to the system, it works within and services the 99 regular schools
comprising the Cincinnati Public School District. In other words, the system services
all seventy-three elementary schools, all eighteen junior high schools, and eight senior
high schools. The entire system's effort is channeled in the direction of the school
as the basic unit of data aggregation. In other words, data and information is de-
lineated, gathered, analyzed, and reported at this organizational level and services
only those decision makers (i.e., principals, supervisors, directors, assistant
superintendents, superintendent, and the Board itself) involved in decisions affecting
school units. Further, the system is in no way attempting to evaluate, manage, collect,
or report data or information relating to particular Students, particular classes of
students, particular teachers, or particular sub-districts of schools in the Cincin-
nati Public School system. The, system's primary focus is toward the school as a whole.
As more is learned about educational management and evaluation systems, their applica-
tion in education, whr:n resources, financial and human, become available, and as this
particular system becomes,operational, however, there is every intention of working
toward and within each of the other levels of the school organization.
Another characteristic of the system should also be made known before continuing.
The primary focus of this system is to deal with and serve as an information founda-
tion to the educational program dimension and not to support the maintenance (e.g.,
budget, salary, scheduling, etc.) dimensions connected with the educational setting.
At the present, we do not see ourselves servicing as a data crib to operationalize a
Planning Program Budgeting System (PPBS), a performance contracting system, or a
cost/effectiveness'system. This will come, but only after this basic system is first
operationalized. To reiterate, we are at the present-- and for the next few years --
interested in serving educational decision makers whose responsibility is to contri-
bute to the running of a school. And further, to assist these individuals by pro-
viding them with relevant, timely, valid, and objective information on those educa-
tional variables that have a significant impact on positively changing the behavior
of students.
2

More specifically, in terms of a system's framework, what the Hystem is endeav-
oring to do is delineate information needs, gather and analyze data to meet these
needs, and to generate and report information to decision makers for planningI
and controlling the educational change process at the school unit level. Operation-
ally speaking, COaccomplish these purposes, SIS is lending itself to identifying,
analyzing, and quantifying the relationships between all inputs going into a school
and educational outcomes (i.e., only those goals or objectives relating to the
educand). Further, SIS is allowing for determining the combination of contributing
factors which will maximize the educational outpilts. Finally,'the system is devel-
oped in such a way that it lends itself to the information reporting task. This is
of necessity in order that local school decision-makers can get the information when
they need It and in a most easily understood manner.
B. Hardware Configurations.
With respect to some of the more salient characteristics of our present hard-
ware configuration, these iiclude the use of an H.P. 2000C unit having a 32K CORE
memory. Storage for the time environment is a 2314 tape disc with 23.5m
bytes. Off-line storage is done on 800 bpi-9 track magnetic tape or punched or
mark sense cards. All reports are produced in a time-shared environment using either
terminal for short reports or line printer for longer reports. Data input is via
terminals and/or cards with the majority of cards either being punched or mark sensed.
C. Data Collection.
The following is a brief alphabetical list of the more than 800 data variables
per school collected and reported by SIS. In general, the SIS reports containing
these vari41 es cover each regular school (under the Cincinnati Board of Education)
from 1965-66 through the most recent academic year. The reader can assume that
absolute numbers are available for all variables--as well as percentages and district
averages wherever appropriate. For detail, see the Definition of Variables Booklet
3

produced by SIS,
I. PUPILS
A. Absence and Attendance(20 variables - by sex, grade) average daily rates
B. Membership(18 variables
C. Mobility(40 variables
D. Promotion(24 variables
- average daily - black)
- by grade, total school)
- total by grade, by sex)
E. Referrals(2 variables - attendance and psychological)
F. Tests - Academic Achievement(110 variables - Metropolitan Achievement, grades 3, 6, 8 reading, math)
G. Tests - Academic Aptitude(15 variables - grades 3, 6, 8)
H. Tests - Physical Achievement(30 variables - by age and physical classification)
I. Student Attitude Survey(30 variables - 6, 9 and 12 graders)
J. Graduate Follow-Up Survey(5 variables given to twelfth graders)
K. Delinquency(4 variables, e.g., physical arrests, drug arrests)
L. Health(2 variables - hearing and seeing)
M. Wealth(2 variables - free lunches and low income families)
N. Foster Homes(1 variable)
II. STAFF - CERTIFICATED
A. Absence and Attendance(10 variables - by school)
-1
Barbadora, Bernard M., Defin:.tion of Variables, Cincinnati Public Schools,Cincinnati, Ohio, Division of Research and Development. September, 1973, pp. 1-20.
4

B. Composition
(7 variables
C. Experience(8 variables
- age, staff turnover)
- average years teaching - B. A. degree, M. A. degree)
D. Pupil/Teacher Ratio(8 variables - by total school and by grade)
E. Teachers Attitude Survey(50 variables - 6 factors by total school)
III. SCHOOL/PLANT
A. Age of school building(1 variable)
B. Play area per student(1 variable)
C. Rooms in use(1 variable)
U. Portable classrooms in use(1 variable)
E. Portable classrooms available(1 variable)
F. Other building data(5 variables - capacity, number of books)
IV. ASSIGNABLE COSTS
A. Per Pupil(7 variables instructional costs, federal)
B. Total School Costs(7 variables - general fund costs - state)
V. DEMOGRAPHIC CHARACTERISTICS
A. Parent Attitude Survey(30 variables - given every parent in Cincinnati Public Schools)
B. Census(100 variableso- by school attendance area, mean income types offamilies - education - income)
Vi. OTHER SURVEY DATA
(100 variables - Administrator Survey - Teacher Survey by race - StudentSurvey by sex, etc.)

VII. SPECIAL EDUCATION
(50 variables - membership, promotion, phyaical achievement)
D. !Mtn Resources.
Very little data with the exception of the Student, Teacher, Parent, and
Administrator Surveys are collected denovo. Therefore, SIS relien on many individ-
uals, departments, and agencies for the "original" collection of data. The following
is a list of both intra-system and outside systems contacted for the inputting of
data into SIS. INTRA-SYSTEM SOURCES: Office of the Clerk-Treasurer; Office of the
Superintendent; Department of Research and Development; Administrative Research
Branch; School-Community Relations Branch; Department of Business Management;
Evaluation Services Branch; Health and Physical Education; Educational Opportunities
Services Branch; Staff Personnel Branch; Elementary and Secondary Schools; Pupil
Adjustment and Attendance Services Branch; Psychological Services Branch; Department
of Human Resources; Food Services Branch; and Department of Facilities Management.
OUTSIDE SYSTEM SOURCES: Hamilton County Board of Elections, Cincinnati Police
Records -- Regional Computer Center, City Planning, Chamber of Commerce, and Ohio-
Kentucky-Indiana Regional Planning Authority.
E. Information Reporting.
In reference to the reporting dimension of SIS, this is perhaps the most important
and novel aspect of the system. Essentially the School Information System produces
ten major reports. By title they are: Exceptional Characteristics Report, Schoolt
Variable, rintout: School Variable Stanine, School Factor Stanine, Student Survey,
Teacher Survey, Parent Survey, Goal Survey, Achievement Forecast Report, and Trend
Report. Specific characteristics and uses of each of these documents will now be
elaborated upon. (OVERHEAD) However, the reader is referred to the appendices given
after each title to get a clearer idea of what the report looks like.
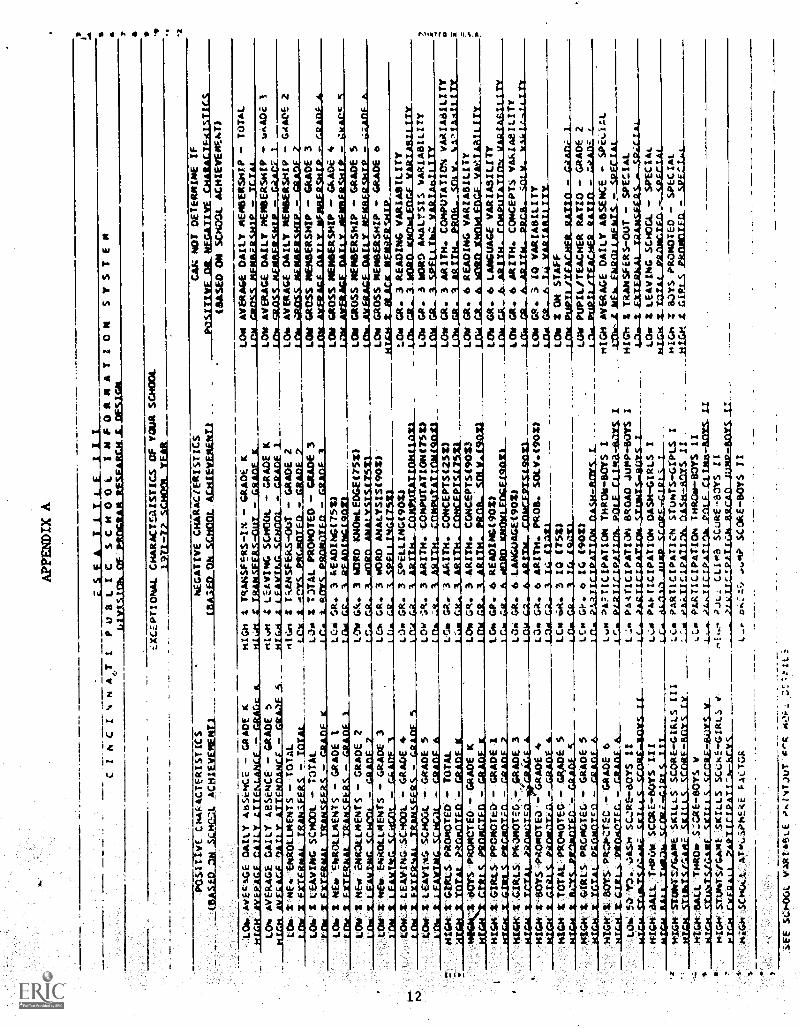
1. Titliv: Exceptional Characteristics (1-5 pages) SO Appendix A
Contents: Positive (i.e., cox-rented positively with student achievement
variables), negative, and neutral data--when they are above or below the middle
6

two-thirds of District schools at the same level. For example, a listing for one of
the 73 elementary schools would mean that school was among the top or bottom dozen
elementary schools on that particular variable.
Uses: As quick identification of major strengths and weaknesses. brief
guideline for goal development or needs assessment, summary of highlights for report
2 (below).
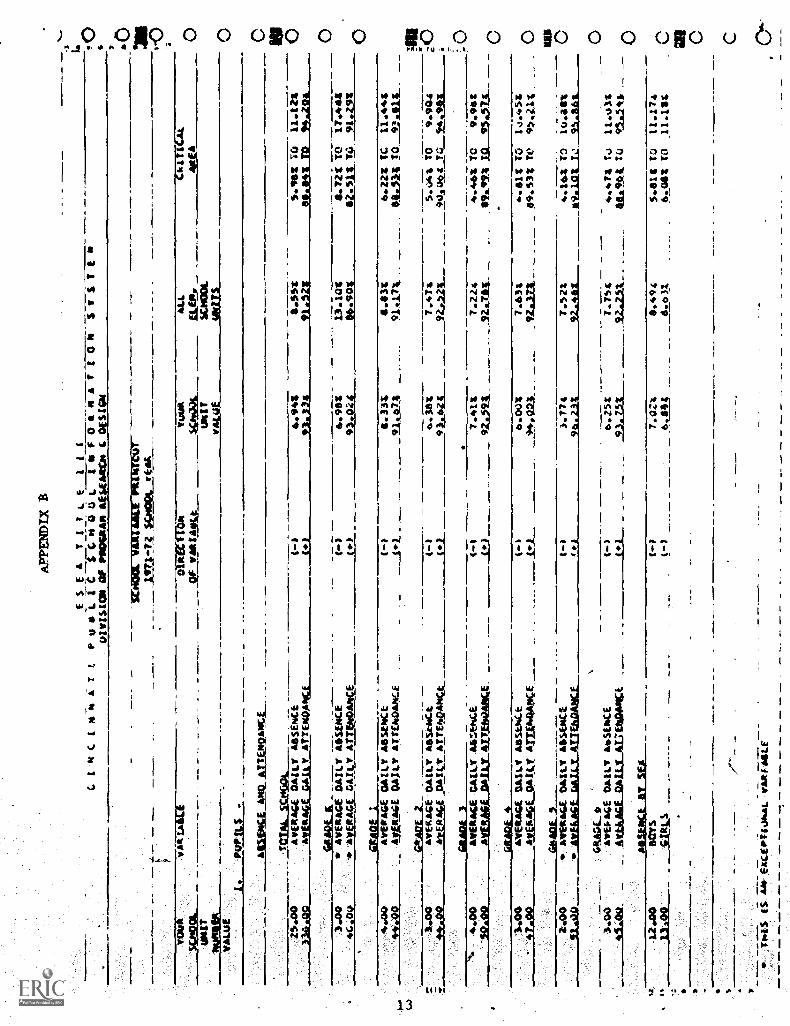
2. Title: Variable Printout (16.pages) See Appendix B
Contents: Variables are printed in raw score, percent, direction, (i.e., +
or - depending on correlation with student achievement), district-wide comparison,
and normal range (one standard deviation) for several hundred variables in the SIS
data bank.A
Uses: Basic data on school's inputs and outputs, backup detail for all
other more abbreviated reports and can be used for both context and product evaluation.
3. Title: Factor Stanine Profile (1 page) See Appendix C
Contents: Twenty major input and output factors (i.e., clusters of variables)
with direction as well as stanine and percentile rankings.
Uses: Global snapshot of a school, summarized version of #4 below:
4. Title: Variable Stanine Profile (16 pages) See Appendix D
Contents: Direction, stanine, and percentile for most of SIS's variables.
Uses: Quick picture of how one school compares with others in the District
backup for report 3.
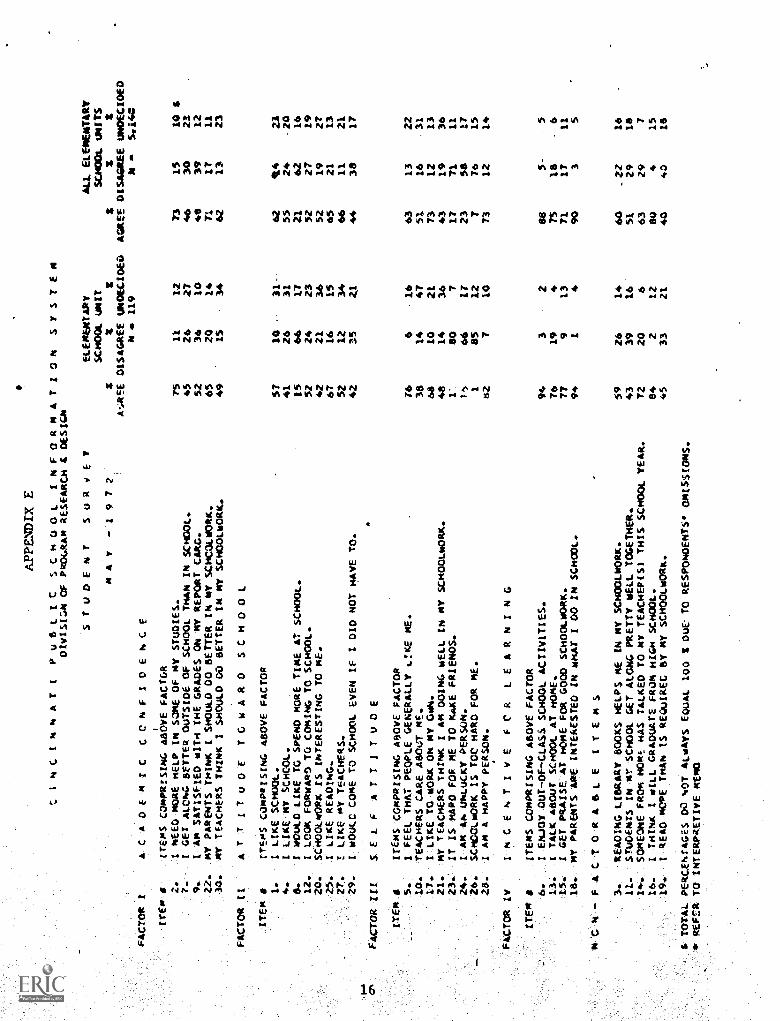
5. Title: Student Survey (1 page) See Appendix E
Contents: Percent of agree, disagree, and undecided responses to 30
qt....1stionnaire items. Taken by all sixth, ninth, and twelfth graders.
Uses: Assessment of student attitudes, confirmation or refutation of other
data on students.
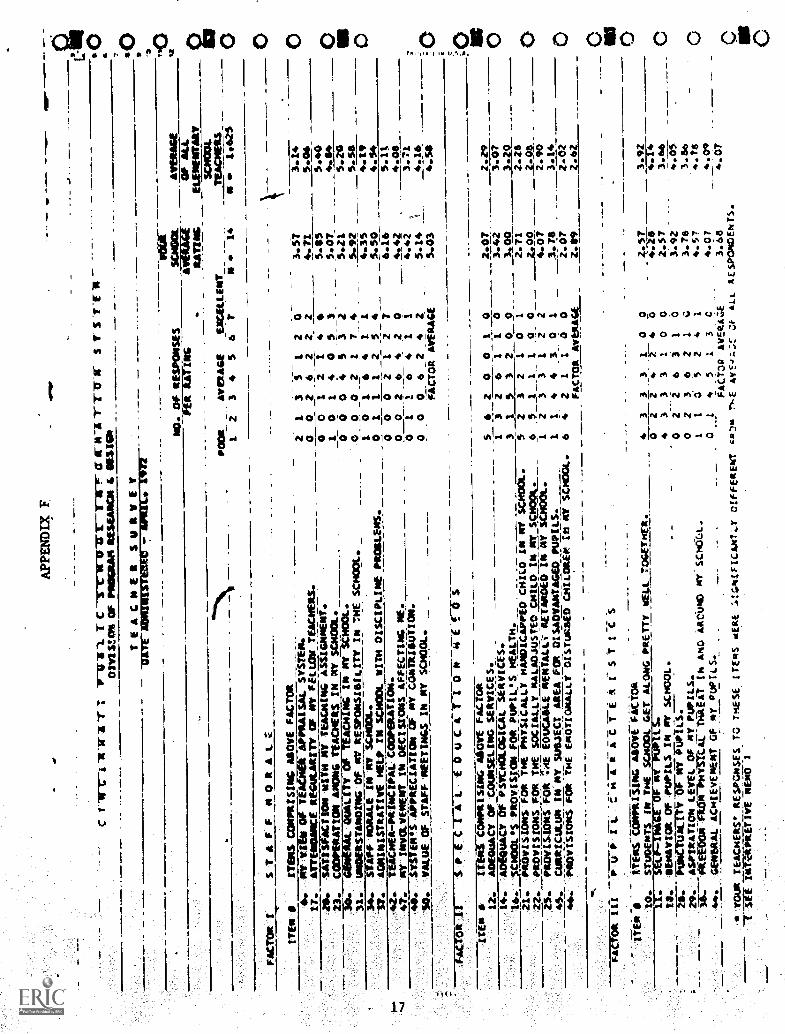
6. Title: Teacher Survey (2 pages) See Appendix F
Contents: Actual and averaged responses to 50 questionnaire items. Taken
by all teachers.
7
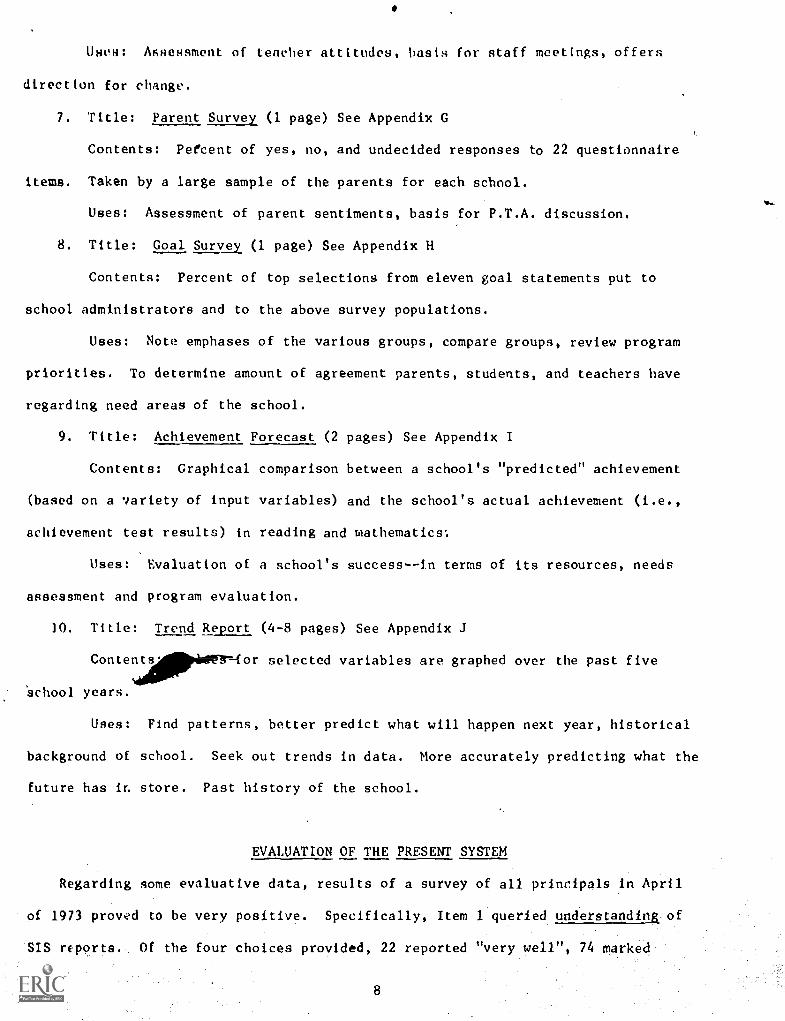
UHVH: Assessment of teacher attitudes, basis for staff meetings, offers
direction for change.
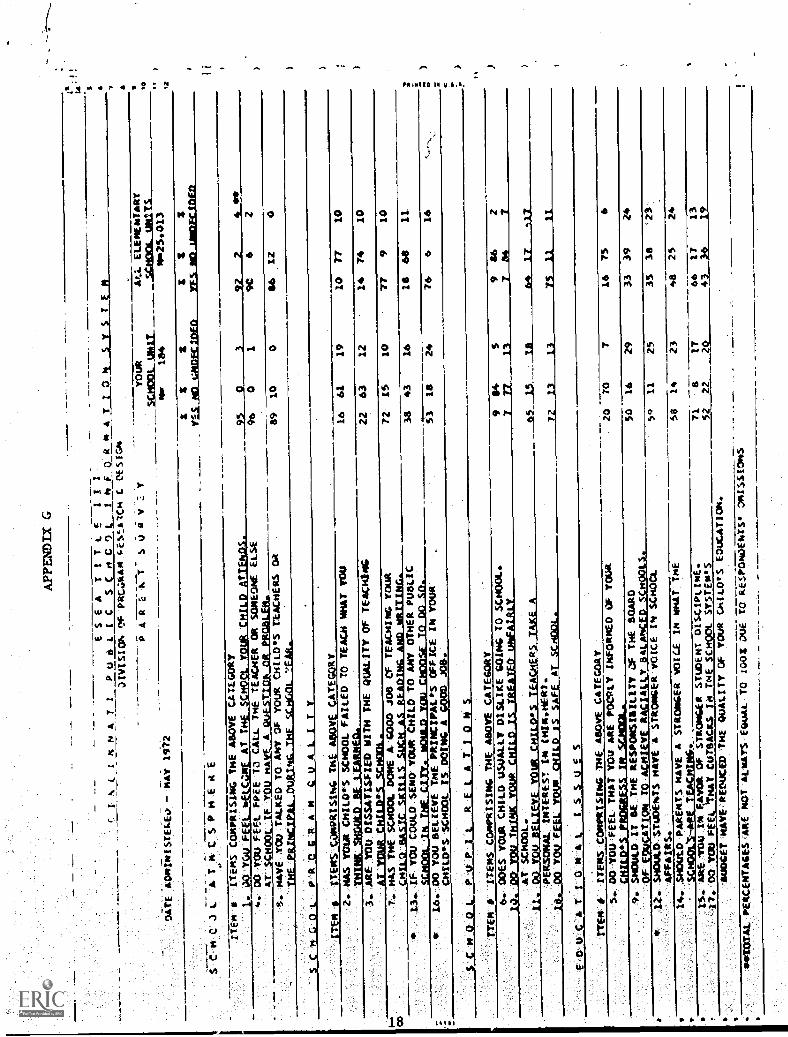
7. Title: Parent Survey (1 page) See Appendix G
Contents: Percent of yes, no, and undecided responses to 22 questionnaire
items. Taken by a large sample of the parents for each school.
Uses: Assessment of parent sentiments, basis for P.T.A. discussion.
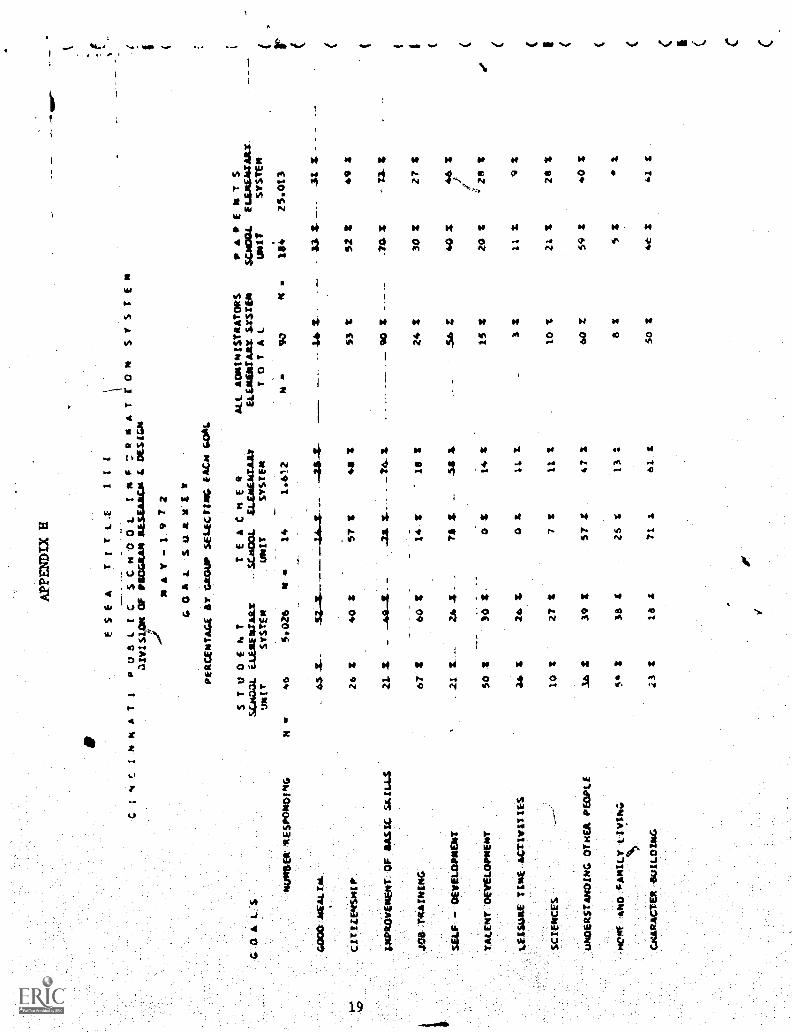
8. Title: Goal Survey (1 page) See Appendix H
Contents: Percent of top selections from eleven goal statements put to
school administrators and to the above survey populations.
Uses: Note emphases of the various groups, compare groups, review program
priorities. To determine amount of agreement parents, students, and teachers have
regarding need areas of the school.
9. Title: Achievement Forecast (2 pages) See Appendix I
Contents: Graphical comparison between a school's "predicted" achievement
(based on a variety of input variables) and the school's actual achievement (i.e.,
achievement test results) in reading and mathematics..
Uses: Evaluation of a school's success--in terms of its resources, needs
assessment and program evaluation.
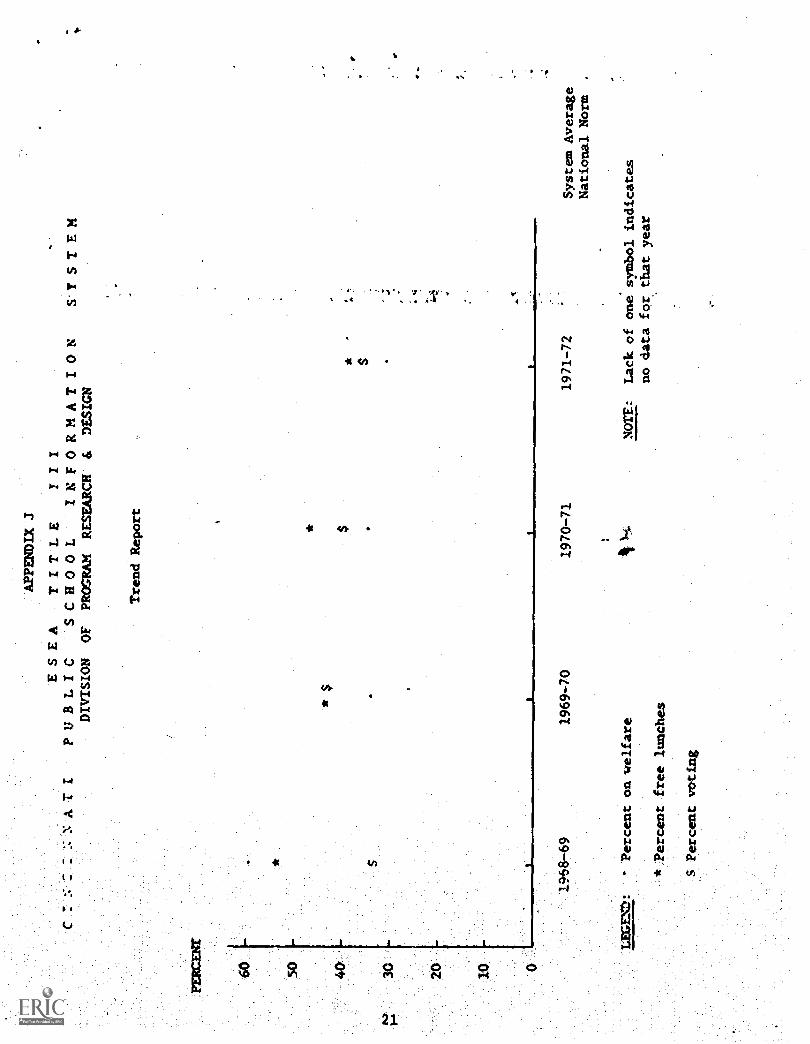
10. Title: Trend Report (4-8 pages) See Appendix J
Contents. '--3-.for selected variables are graphed over the past five
'school years.
Uses: Find patterns, better predict what will happen next year, historical
background of school. Seek out trends in data. More accurately predicting what the
future has in store. Past history of the school.
EVALUATION OF THE PRESENT SYSTEM
Regarding some evaluative data, results of a survey of all principals in April
of 1973 proved to be very positive. Specifically, Item 1 queried understanding of
SIS reports. Of the four choices provided, 22 reported "very well", 74 marked
8
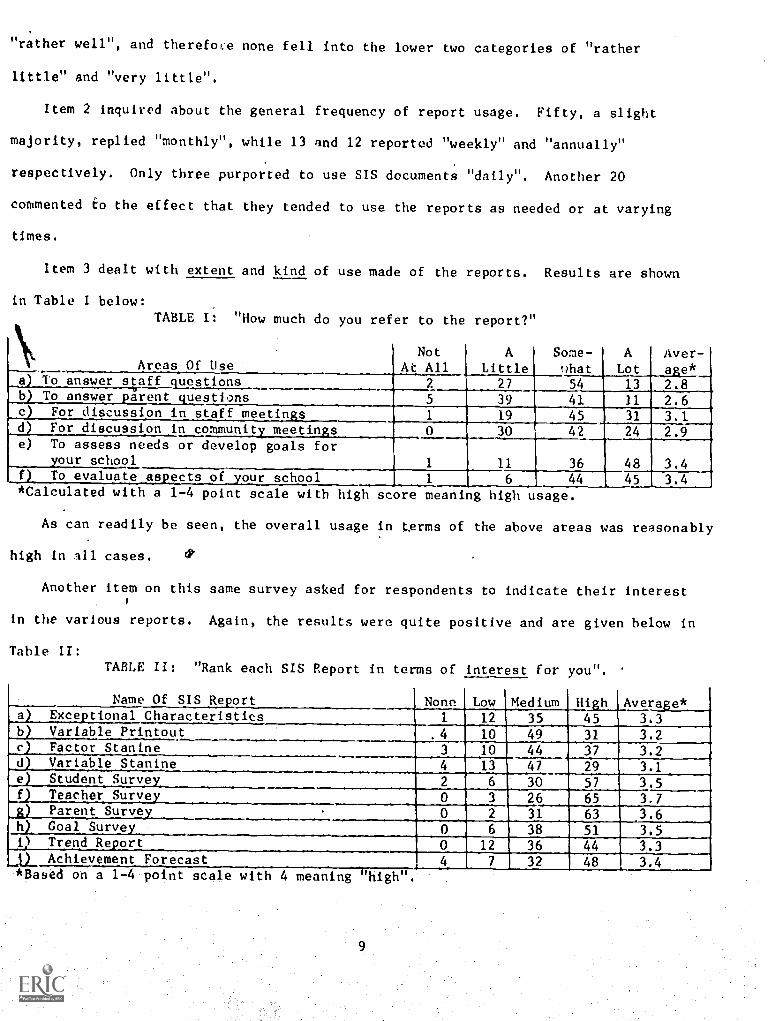
"rather well", and therefore none fell into the lower two categories of "rather
little" and "very little".
Item 2 inquired about the general frequency of report usage. Fifty, a slight
majority, replied "monthly", while 13 and 12 reported "weekly" and "annually"
respectively. Only three purported to use SIS documents "daily". Another 20
commented to the effect that they tended to use the reports as needed or at varying
times.
Item 3 dealt with extent and kind of use made of the reports. Results are shown
in Table I below:
TABLE I: "How much do you refer to the report?"
\h' Areas Of UseNot
At AllA
LittleSome-¶hat
A
LotAver -
age*..2.8a To answer staff uestions 2 27 54 13
b To answer arent uestions 5 39 41 11 2.6c For discussion in staff meetin:s
.._
1 19 45 31 3.1d For discussion in community meetings 0
1
30
11
42
36
24
48
2.9
3.4
e) To assess needs or develop goals forour school
f) To evaluate aspects of your school 1 6 44._
45_.
3.4*Calculated with a 1-4 point scale with high score meaning high usage.
As can readily be seen, the overall usage in terms of the above areas was reasonably
high in 111 cases.
Another item on this same survey asked for respondents to indicate their interest
in the various reports. Again, the results were quite positive and are given below in
TableTABLE II: "Rank each SIS Report in terms of interest for you".
Name Of SIS Report None Low High Average*a) Exceptional Characteristics 1
.Medium12 35 45 3.3
b) Variable Printout .4 10 49 31 3.2r) Factor Stanine 3 10 44 37 3.2
Variable Stanine 4 13 47 29 3.1,_(.1)
e) Student Survey 2 6 30 57 3.5f) Teacher Survey 0 3 26 65 3.7
Parent Survey . 0 2 31 63 3.6,g)
h) Goal Survey 0 6 38 51 3.5i) Trend Report 0 12 36 44 3.3
Achievement Forecast 4 7 , 32 48 3.4*Based on a 1-4 point scale with 4 meaning "high".

In general, one can note the substantial interest of the principals at large in all
the reports. Considering the centers of gravity or average figures, no report fell
below "medium". The four surveys, led by the Teacher Survey, rated above any of the
other six reports.
In conclusion, this is what the School Information System looks like and what
it is endeavoring to accomplish. To date the major problems encountered include:
complete acceptance of the system on the part of all principals, more training on
the part of administrators so that they can more fully understand and utilize the
system, more help needs to be provided in data usage, timeliness of data, and greater
financial support is definitely needed if the system is to fully operationalize a
pupil information system. And last,but certainly not least, is the fact that up toOs.
this year we never had our own computer.
Regarding some of the positive characteristics of the system, the system does
provide for easy access and retrieval of data in order to support the educational
planning and controlling process. It has proved to be an excellent mechanism for
goal setting, problem identification, and needs analysis. It has also proved valuable
in doing product evaluation. To the author's knowledge, this is the only management
and evaluation system serving the educational program dimension as opposed to grade
reporting, scheduling, payroll, etc. Generally speaking, it is seen as a vital
support mechanism for both an educational accountability system as well as a Planning,
Programming, and Budgeting System (PPBS).
SUMMARY
In the above paragraphs, an attempt was made to give a quick overview of the
Cincinnati Public Schools' School Information System. Specifically, it was stated
that the overall goal of the system was to provide data and information to decision
makers for the purpose of more enlightened decision making. The paper addressed Itself
to the taajor components of the system and they were: its hardware configuration;
where what, and how data is Collected and examples of how the data
is reported. Finally a brief evaluative testimonial of the system was given.
10

TABLE OF APPENDICES
The following are exemplavy pages of each of the documents produced
by the Cincinnati Public Schools' School Information System.*
Appendix AExceptional Characteristics of Your School
Appendix B13
School Variable Printout
Appendix C14
Factor Stanine Profile
Appendix D15
Variable Stanine Profile
Appendix EStudent Survey
Appendix FTeaCher Survey
Appendix GParent Survey
Appendix HCoal Survey
Appendix
16
17
18
Achievement Forecast Report
Appendix J . .
Trend Report
19
20
.. . . . .... . ... . .. . . ... 21
*It should be noted that for each of these report,-1e4oto and veryinstructional meMorandimbs are prepared and accompany eaCh'doCiimentwith its
release.
APP
EN
DIX
A
E.SLI
C1AICIsthi6 T1 ;u8LIC SCHOOL INFORmATION SYSTEM
ILLYISICIILIIEPILIGRAILIESEARCILLDFc1Cal
PasiTTTE764ApAcTERIsms
ACktIEMEMERIL
liKUPTIONAL CHARACTCAISTICS OF YOUR SCHOOL
1 3.711-32-SCHOOLIEM.
NEGATIVE CHARAC/ERISTICS
(BASED Oh SCHOOL ACHLEYEALEAT)
,,101.,?AvEcAGE,DALLYA6SNCE - GRADE K
.H/Gti 2VEPAcf_CAILX_LUENrANCr - ARAOr.
rLLCINAVERAGEGAILY ABSENCE - GRADE 5
kticat. AvEs..cf IyT1
AT-m-4:1 Am-
- aRA.IF
--4..0wirreu,:fftROLLMENTS - TOTAL
011L1EIXERNALLIXAUIEEKS- =AL_
LOW:I LEAVING SCHOOL - TOTAL
2-ExrEtrmAt _TrrAkcFicag. - altAnF
LON,2 NEW ShROLLmENTS - GRADE I
raw tlilrismau TRAksFkki - GAAnF 1
LOW/4,14ENROLLPIENTS - GRADE 2
S.
hiGh 1 TRANSFERS -IX - GRADE K
kitar f TRArts.FF_Rc-nuy - GRAnT
Z LEAVING SCHOCH. - GRADE K
HLGAALEAlata...1010m -!GBAGE
JrsIGn Z TCaNSFERS-OUT - GRADE 2
__Lek i "IS Pitc.rtaTFD - CRADE 7
Law Z TOTAL PROMOTED - GRADE 3
ta- I. !arc pporearla
aR2CIF
Les R. 3 READING(251)
Ink ay_ I
Anthatstom
Law Gk. 3 WORD KNOWLEDGE(752)
,1
CAN NOT DETERMINE IF
PaSIMEMIL_NEGATreFEnABAL/EALstiCS___
(BASED ON SCHOOL ACHIEVERNI)
LOs AVERAGE DAILY MEMBERSHIP - TOTAL
Arm AniaS APPIERPRSHIP
54;74.1
LOW AVERAGE DAILY MEMBERSHIP - wUADC
crgsaoss_maisocsau_-_,--
LOW AVERAGE DAILY MEMBERSHIP - GRADE 2
o.
LOW GROSS MEMBERSHIP - GRADE 3
1.011-AVERAGELIALLX-11FmacoSH/P
cRAtLE 4
LOW GROSS MEMBERSHIP - GRAZE 4
LOW GROSS MEMBERSHIP - GRADE 5
LOw2ufw ENROLLMENTS - GRADE 3
fn At 9 LFAvrwa'cris:OL
GRAnF A
,
LOWZLEAvING-SC4001- - GRADE
LONA-1Z-LEAvImG SCHOOL --GRADE 5
HIG)6IGTRLS4oRONOTED - TOTAL
Hr4W2'13i2At PROHDTFO'- G22flf 2
Wiripk2.402S-PRONCTE0--4RACE K
rerGH-2'CT*rt ~RCM) - GRAJDF
HIGH .Z'
- GRADE 1
CakAhc 2
Kick A ,GIRLS.: pk3MOTE6,7vGRAIDE 3
KIGHJASOYSPROPOTED:- GRADE 4
Leu GR. 3 WORD ANALYSIS(90Z) "
III- ay- IL sogLIPIGI75s1
L.:). GR. 3 SPELLING(90Z)
Liv.d Gg
triusour,ALLosuan_
LOW GR. 3 ARITH. CONPUTATIONt750
LC. SR. 3 ARM. CONCEPTS(252)
IWt- A 2RITM- CflitrFPTs17511
LO GR. 3 ARITH. CONCEPTS49023
LO
W1 2- A Anym_ MOB- SDLV 19021
LOw GP. 4 READING(902)
.11
11'd
o.1
.Lau GR. 6 LANGUAGE(902)
HIGH tIOTAL,,PRONOTE0,- GRADE 5
SO
HIGH Z GIRLS, ORCMOTEG- GRADE 5
krak r rt-A-AL rorrtyreft
agADr 4
HIGH I BOYS-PRCPCTEC - GRADE 6
hIGH.2GTPLPPOPIQTFC-
LOW5D,Y,O. QASH SC..:RE-60YS II
SUKAIALLTAPow =SCORE -BOYS /II
LOW GROSS MEMBERSHIP - GRADE 6
MTLN I StACk NEM4FIV,WIP
LOs GR. 3 READING VARIABILITY
LOU GA. 3 WORD AHALrSIS 10A*LABILITY
__LON GR- A StfkkthC 2A2TAbILITY
LOW GR. 3 ARITH. COmPUTATIC% VARIABILITY
S.LOW GR. 6 READING VARIABILITY
'Id'
O
LOW GR. 6 LANGUAGE VARIABILITY
a__A
MY
L ii
iLOW GR. 6 ARITH. CONCEPTS vskiAeurrr
-,
La. Ga. 6 ARITH. PROB. SOLv.(902)
LOA G.1- 3 IQ TIARA
LC., Q4. 3 IO (252)
Lam GP- 3 r4 taa2t
LE0 G-.. o IQ (902) '
'AFTICIPATIUN THROW-BOYS I
kr PLPTICIRAIIM./ftf niffta,lian I
PA4T1CIPATION BROAD JUMP-602S I
LCat PArtICIPATION DASH-GIRLS I
-vrIGH,-,STURETSIGAHE SKILLS SCORE-GIRLS III
rtrotATtsatrArttt tLItUc '5.cr1RF-An.us. Iv
FTGWABALL-.214ROw SCORE -BAYS V
STOW sr:min/c.d.:ft
scLkE-GIRLS +
pciGo scpooLt. ArwPhEkE FACTOR
SEE so.olGt. valletsLE 0.141JuT g-c
L.C PARTICIPATION STUNTS -GrPLS I
Trr
jFJI
I.Y
tLrtAsk-Ant's_ II
,C PAATICIPATION THROH-BOYS II
21.u-ILW4II-ak 2DLE CALwzr-BCIMS-
ZS
CLI03 SCORE -BAYS II
-IT
L-,
...AP SCORE-BOYS II
LON G.R. 3 10 VARIABILITY
Glit__6 T4 VARYARILTYY
LOW Z OM STAFF
LPN PiprtirEAawK2 RATIO -
.n; I
LOW PUPIL/TEACHER RATIO - GRADE 2
HIGH AVERAGE DAILY ABSENCE -
1 12-11tEwfhpalksfATS - SPECIAL
NIGH I TRANSFERS -OUT - SPECIAL
Law Z LEAVING SCHOOL - SPECIAL
bLIGKAL
HIGh S aays oRommeo - sptclAt.
4_GIRLS ixammuILL- sPt-T.A.k
APPENDIX B
E SE TITLE III
PI
INFOitsTION 8TZTEm
DIVISION OF POOGItA8 86$48148* c ofSIQH
STA
OC
IL-I
INO
TE
ICE
-PID
INM
T--
-
L.>
25400
316:,49
3.00
4.00
44.0
0
1400 0
4.00
3.00
-47.00
2.00
3.00
12.00
11300
ALL
MAE'
SCHOOL
miTS
C61TICAL
IKEA
'0 .0 D311 0
I.
PUPIL$ -
TOTAL semot,____
AVERAGE DAILY A85ENCE
AvatAGE GAILY ATTU/Q/04CE
( -I
J1
4.941I
t.1...9311
1.551
9.1.52;
5RAOCk
AVERAGE DAILY ABSENCE
I-)
6.982
13.101
1.:AveltAOf DAILY AM:HOWE
93.0Z8
86.90%
GRADE
AvERAGE °ALLY ABSENCE
(-I
6.331
1.83;
4IIRAGE QAJtv ATITA.0AsCE
Llice%
91,174_
*ODE 2
_1*
.-
AVERAGE GAUT 88SkaCt
4 -1
o.38%
7.476
etpEPAGI malty 6Tro.RAKt_
lo,
9A.4424_
____940.S24_
3_MAD&
AVERAGE GAILY ASZETIGE
(-1
7.41%
7.224
92.991-
awsof
____,
__92,Y13_
AVERAGE CALL/ 8.85L144,t
.00%
7.634
AvERAG.EIDAILT ArILT4QANCE.
94.42.8
?Zan
G4A0L-..1
A9E-86GE DAILY 6ostmc.I
t-t
3.774
7.52%
4.1
9643%
92.14a
AYET.AGE DAILY 665ENCE
6.25
Z_ --
7.75%
AJWIAGEJIAILIJIIIEWANCE
93.751
AllEfta a9 SEA
8071
t-P
0.494
(-)
6.044
8.631
-tIS
EiCEPi
,ow
1.)6.L ?mai MiLE
C
5.981 IC,
11.128
()
/Urea TO
94620
08.72* TO
17.484
82.514 TO
914292
6.22% TC
11.44;
_04014 TO _VALI_
!1)1
5.466 TO
9.904
Z V
INsiAoA.....N21.20/=
04.444 70
9.94Z
_119.4 111_57.1.__ - -
,-.,
6A..81% TO
1.2.45%
09.33% TC
95.2.11.
4.16% TO
14.38*
111.11¢1_11!
-2161
4.474 To
11.131
41ff
atk4
TV
omits
5.811 TO
11.274
0
_8.041% TO J1.184
C C211

APP
EN
DIX
- C
- _
__ _
_ _
_L T
L £
Z L
1. _
_
INC
INN
1I
P'oo
t_ I
C S
CN
CO
I. I
NFO
RR
AT
LO
S SY
ST
EN
2BO
UL
AS.
. 1/E
SLA
IIC
ilA-1
3F-5
4461
--
STA
NIN
F PR
OFI
LE
1471
-7z
,trw
nnk
vtat
ST &
NIN
E
aF-2
1i 3
-4_
-5-
-6-
.1[-
-s1
00c,
-T36
3.72
".lr
Ty
isrs
i3
1.24
Avr
eft L
TV
(-I
7001
-
5552
6
DaP
UI
AT
LO
'4
1-.1
13-1
-4-
c.st
"L
ITZ
Tr.
.trc
fel
173
-
1:72
tE
5-66
Ls
L4
1-C
t
3-2
2 &
I-
&FA
Tits
T.4
1.14
---'
4.1
11.
243
32
Our
Pur
FAC
TC
);
11A
LN
ISV
EM
EN
TC
.F. 3
I25
'12
.AC
P. V
LA
B I
L I
TT
- G
S . 3
t)
it1
J.34
1.?
ME
LT
-1. A
O,.
VA
R /A
BIL
ITY
-2.
32
14C
etli'
VE
":ki
6k. b
(*I
47 IO
.d4
VE
SdA
L:a
C.^
.. SA
AA
A6L
LIT
VG
q. o
a2.44
L6
z 1T
s.V
A-1
' IA
o IL
IT
Y -
GR
. 6(
41.
50
ST4O
Z.1
11C
ON
FI0e
NC
EI.
)
(*)
43 o C
41
..o4
16.
ST %
/GE
N"'
*TT
TtA
0E5.
50
19ST
UO
Es
'SE
LF
AT
T T
UG
E4.
)4.
54
20ST
VC
IEN
TV
E F
OR
LE
AR
NIN
G14
.)Z
3.93

APP
EN
DIX
DN
IP
ESE& TITLE III
crut
rxw
a: T
-1-
su--
-r-c
r-c-
-- a
&Pi A T 1-13 I*
S"C
ST U
VDIVISION-OP PROGRAM BAMAKO. C DESIGN
vAII
CA
BL
E
PUPI
LS
CaS
EN
CE
AND ATTINCIANCE
TOTAL SCHOOL
AvERAGE OAILlt ABSENCE
AVERAGE OBILY
GRADE
IL
AVERAGE DAILY ABSENCE
AVERAGE
TITENDANCE
GRADE 1
AVERAGE DAILY ABSENCE
AVERAGE. DAILY ATTENDANCE
GRADE 2
AVERAGE
DA
ILY
AISSErCi
WERAGE DAIL'? ATTENDANCE
GRADE 3
AVERAGE DAILY ABSENCE
AVERAGE DAILY ATTENDANCE
GRADE 4
AVERAGE DAILY ABSENCE
AVERAGE DAILY ATTENDAsiCr
GAADE S
AV
ER
AG
E ,D
AIL
YABSENCE
AV
ER
AG
Ev
-KT
itTE
TO
AN
CE
CrotA0E
AV
ER
AG
EDAILY ABSENCE
AVECIGE
-OST
O 4
-Ttli
eDA
NC
E
ABSENCE by Stx
SOTS
4111LS
-IM
MO
ILT
-IT
EIT
NE
-MFI
CE
-19
71-7
2 SC
HO
OL
YE
AR
0 "oD
IRE
CT
ION
OV
VIR
IEra
"---
T s
STANINE
PERCENTILE
STEAD*
01
s
C34
4.16
0tI
6$5.
94
(-1
.-
3_ 971.
24C ia C
t16.
7*,
( -I
- *46
4.Ib
04
54
5.20
(-I
374.
1*t1
635.
6*70
4-1
. .60
5.50
tI.
404.
50U
It -
1.
324.
06t1
.-
OA
5.94
2.04
C(-
- .t
.93
I-41 Si 37 30
4.54
5.44
4.34
_3.
96
C C C
4.1
C-1
rW
FACTOR I
APP
EN
DIX
E
CINCtNNATt PuBLIC SCHOOL INFORMATION SYSTEM
DIVISION OF PROGRAM RESEARCH L DESIGN
STUDENT SURVEY
A C A D E N I C CC 4 FIDENCE
N A y
- 2 9 7 2
ITEM w
ITEMS COMPRISING ABOVE FACTOR
2.
I NEED MORE HELP IN SOME OF MY STUDIES.
7.
/ GET ALONG BETTER OUTSIDE OF SCHOOL THAN IN SCHOOL.
9.
I AN SATISFIED WITH THE GRADES ON NY REPORT CARO.
22.
NY PARENTS 11.11111(
I SHOULD 00 BETTER IN MY SCHOOLWORK.
34.
NY TEACHERS THINK I SHOULD DO BETTER tN NY SCHOOLWORK.
FACTOR II
ArT ITUDE TGWARO SCHOOL
ITEM *
ITEMS CONPAPIS[NG ABOVE FACTOR
1.
I,LIKE SCHOOL.
4.
1 LIKE NY SCHOOL.
8.
I WOULD LIKE TO SPEND MORE TINE AT SCHOOL.
12.
1. LOOK FORWAQO TO CONING TO SCHOOL.
20.
SCHOOLWORK IS INTERESTING TO NE.
<25..,1 LIKE READING.
22.
1 LIKE MY TEACHERS.
29.
'1"NOULC CONE TO SCHOOL EVEN IF I DID NOT HAVE TO.
FACTOR III
SELF ATTIToDE
- TrEnAt
. rrEms -COMPRISING ABOVE FACTOR
5.
1.'FEEL THAT PEOPLE GENERALLY LIKE ME.
10. TEACHERS CARE ASCOT NE.
.17.
1 LIKE TO WORK ON NY G.
21.
MY TEACHERS THINK 1 AN DOING WELL IN NY SCHOOLWORK.
23.
IT IS HARD -FOR NE TO KAKE FRIENDS.
24.
1 AN At. UNLUCKY PERSON.
:26. SCHOOLWORK IS TOC HARD FOR ME.
28.
I-AN-A HAPPY PERSON.
FACTOR /V
I4CENTIvE FCR LEARNING
ITEM I
ITEMS COMPRISING ABOVE FACTOR
6.
I,ENJOYOUT-OF-CLASS SCHOOL ACTIVITIES.
23.
1 TALK ABOUT SCHOOL AT HONE.
15.
I GET PRAISE. Aa HONE FOR 0000 SCHOOLWORK.
18.
my PARENTS ARE INTERESTED IN WHAT I 00 IN SCHOOL.
* C4 -FACTORABLE ITEMS
3.
READING LIBRARY BOOKS HELPS ME IN NY SCHOOLWORK.
IL.
STUDENTS IN Par SCHOOL GET ALONG PRETTY WELL TOGETHER.
14.
SOMEONE FROM HONE HAS TALKED TO MY TEACHEP(S) THIS SCHOOL YEAR.
16.
I THINK I WILL GRADUATE FROM HIGH SCHOOL.
19.
I READ MORE THAN IS REOuIREC SY NY SCHOOLWORK.
TOTAL PERCEKTAGES DO NOT ALWAYS EQUAL 100 i DUE- TO RESPONDENTS OMISSIONS.
REFER, TO INTERPRETIVE MEMO
ELEMENTARY
ALL ELEMENTARY
SCHOOL UNIT
SCHOOL UNITS
A.AFE
DISAGREE UNOECIOED
N119
AGREE DISAGREE UNDECIDED
N =
5.14.2
75
11
12
73
IS
10 i
45
26
27
46
30
2i
52
36
10
48
39
12
65
20
14
71
IT
11
49
IS
34
62
13
23
ST
14
31-
62
t4
22
41
26
31
55
24
-20
IS
66
17
21
62
16
52
24
23
52
27
19
42
21
36
52
19
27
6T
16
15
65
21
13
52
12
34
66
11
21
42
35
2A
44
38
17
76
6- 16
63
13
22
38
14
47
52.
16
31
66
10
21
73
12
13
48
14
36
43
19
36
I:.
80
717
71
11
I*,
66
17
23
58
17
185
12
776
15
52
710
73
12
14
94
32
88
5-
-5
76
19
475
18
-6
77
913
71
17
11
94
14
90
35
59
26
14
60
_22
16
43
39
16
51
29
18
72
20
663
29
784
212
80
415
45
33
21
40
40
18
APP
EN
DIR
C1
"WC
&7[
!CZ
'T-I
irvi
rT
-5-C
lirtr
irtT
1111
r- a
m -
a7-1-17
S Y
"E
DIVISIOls OF vuOGRAFI
RE
SEA
RC
H 4
. DE
SIG
N
TEACNER
sway
er-c
rin-
mou
nisr
ene-
--T
-Em
IX 4
L-7
"111
77--
FACTORI
STAFF NORALE
ITER
STENS COMPRISING ABOVE FACTOR
6.
Air
vier
of-rEacmok APPRAISAL SYSTEM.
17.
ATTENDANCE REGULARITY OF NY FELLOm TEACHERS.
26.
SAT
ISFA
CT
ION
WIT
H A
T T
EA
CH
ING
ASS
IGN
ME
NT
.23.
COOPERATION AMONG TEACHERS IN NT SCHOOL.
Clet*At QuaLtir OF TEACHING IN AT-164OOL.
UNDERSTANDING OF MY RESPORSIBIL ITT IN THE SCHOOL.
34.
STAFF MORALE IN MY SCHOOL.
37.
ADMINISTRATIVE HELP IN SCHOOL
tans
DISCIPLINE PROBLEMS.
42.
TEACHER-
PR
INC
IPA
LCOOPERATION.
47.
NY INVOLVEMENT IN DECISIONS AFFECTING ME.
41.
SYSTER'S APPRECIATION OF NY CORTRIbuTION.
50.
VALUE OF STAFF MEETINGS IN MY SCHOOL.
FACTORII
SPECIAL EDuCAT 1 ON
kCT
6S
-NW
No.
OF
RESPONSES
SCH
OO
LA
VE
RA
GE
PER
RA
TIN
GiiiRRUG2r
OF
AL
L_
_ ____
RATING
ELM/START
_____
SCHOOL
POO
RA
verA
GE
EX
CE
LL
EN
T__
TE
AC
HE
RS
12
34
5 6
Tti
n1.
625
21
35
1O
02
62
O 0
1.2
11
01
4 0
O 0 0 4
3O 0
02
10
14
O1
t1
2O
00
21
o6
4o
1I
64
20
22
40
5I
32
7__4
11
5 2T
20
11
O0
0 6
22
FAC
TO
RAVERAGE
ITEPI
1116.
:Clrt"CCVMHOOL0S
PRO Sv1:11:1_087""FoRPUPIL S HEALTH.
31
12.
ADEQUACY OF COUNSELING SERVICES.
56
14.
ADEQUACY OF PSYCH
00------CAL SERVICES.
13
21.
PROvLSIOns FOR THE PHYSICALLY HANDICAPPED
CH
ILO
IN
NY
SCHOOL.
52
22.
PROVISIONS FOR THE SOCIALLY MALADJUSTED CHILD IN MY
SCM
0044
.___
6
25.
PROVISIONS FOR 1.4E EOUCA11.1 MENTALL:- RETARDED IN MY
SCHOOL.
1
45.
CURRICuLUN IN` MY SUBJECT AREA Fat DISADVANTAGED PUPILS.
1
paDvISIOMS FOR THE EMOTIONALLY
ofsr
ugse
oCHILDREN IN NY SCHOOL.
6
FACTOR
Iii
fitPIL. CHARACTERISTICS
1f08
I11M5 COMPRISING MOVE FACTOR
'r
-10.
STUDENTS IN THE SCHOOL GET ALONG PRETTY NELL TOGETHER.
CI. ?MO -IMAGE OF MY PUPILS.
If. BEHAVIOR OF PUPILS IN NY SCHOOL.
WIIECUTRETIV 3 ItY VUPICS.
-ASPIRATION LEVEL OF NY PUPILS.
:W..-
-14(
EE
t5on
fita
x-ik
tiVIT
tiC-t
itEiT
IN A0 ARCuND NY SCHOC:L.
GENERAL ACKEvEmENT OF NY ouPrLs._
YOUR TEACHERS. RESPONSES TC THESE ETERS dERE .1:GNIFICANT0.
717I-almteRPRETIvE MEMO
20
01
02
61
10
53
20
03
Z1
01
5_ 1__1
1_0_ 0_
23
31
22
14
30
14
21
I0
0FACTOR AVERAGE
43
33
10.3
O2
24
74
04
33
3I
00
O2
26
3I
0
O 23 621G
10
s2
41
O1
45
13
0FACTOR AVERR;E
cIFFERENT "DM ^k-E AYS4A;.5
ALL
3.57
3.14
4.71
5.06
5.85
5.40
5.07
4.84
5.21
5.20
5.92
5. S
S4.
354.
195.
504.54
6.16
5.11
_4.42
4.08
--4.42
3.71
5.14
4.16
5.03
4.5s
2.07
2.29
3.42
3.07
300
2.71
2.28
X00
-4.07
2.90
_3.78
3.14
2.07
2.02
2.19
2.57
2.ST
3.92
-
3.78
4.57
4.07
3.68
RESPONDENTS.
3.92
47:171v
3.66
4.05
3.86
4.78
4.09
4.07
Fci 0 0 0 C a C
APPENDIX G
_ESEA TITLE III
$7.1NcLftmATI PudLIC SCHOOL
INFORNATIO K SV,7t04
JIVISIOh IF PRUAAN AE5tAICH L CES[Gft
piTpniiiisrEr4o - MAY 1972
S V R v Z
YOUR
AuL ELENENTARY
WIWI- UNIT
2010(111KIIS
N<
184
NoR25.013
S C14 C'
ATMCSPH'EaE
J:7E
K:s
:y1.
7EA
SCOMPRISING THE ABOVE CATEGORY
1. :90'YOu"FEfL NELCPIE AT THE SCHOOL Y04$CHILD ATTENDS.
4.,.:00ou FEEL EPEE TO CALL THE TEACHER OR SOMEONE
ELSE
ATSCdOOL IF YOU KW A QUESTIO,
.5.-,14AVEiYOU-TALKED 'WANT OF YOUR CHILD'S. TEACHERS Oa
THE :PRINCIPAL
Duu
nifi
_mfs
tilac
tS
CoG
OL
PR
OG
RA
M Q
uALI
TY
ITEM
ITEMS,COMPRISING THE ABOVE CATEGORY
2. HAS YOUR CHILD'S SCHOOL FAILED TO TEACH WHAT
YOU
;MINK SHOULD SE LEARNED.
3. ARE'YOu DISSATISFIED WITH THE QUALITY OFTEACHING
AFT
OU
RSH
ILIP
S SC
HO
OL
.T. HAS THE.SCHOOL DONE A GOOD JOB CF TEACHING YOUR
.000
13. IFTOU:COULD SENO YOUR CHILD TO ANY
OTHER PUBLIC
SCHOOL IN THE CITY, NOULD YOU CbOOSE TO 00 So.
s.
16.400 YOU BELIEVE THE PRINCIPAL'S OFFICE IN YOUR
-
CHILD'S SCHOOL IS DOING A GOOD
HOOL PUPIL REL ATIONS
ITEM 8
ITEMS' CONPRISING THE ABOVE CATEGORY
6.00ESTOuR CHILD USUALLY DISLIKE GOING
TO SCHOOL.
19.'00 YOU %INK YOUR CHILD IS
TREATED UNFAIRLY
AT: SCHOOL.
----
----
11*Q
0 Y
RU
""E
YL
tQU
gC"M
213T
EA
g"gf
tS/A
XE
A:,PERSONAL INTEREST IN CHIR.HER4.
00-TOULFEEL YOUR CHILD IS SAFE AT SCHOOL.
CA
T T
ON
AL
IS$U
ES
!YEW'. ,1TEMS'CONPRISING THE ABOVE CATEGORY
5.:0114.0u:FEEL THAT YOU ARE POCRLY INFORM() OFYOUR
:CHILD0SjyROGRESSIK*9U410L._
9,SHOULD:IT BE THE RESPONSIBILITY OF THE BOARD
OF"EDUCATION TV ACKEVERACIALLY BALANCED SCHOOLS.
12. SHOULD. STUDENTS HAVE A STRONGER VOICE
IN SCHOOL
AFFAIRS.
14. SHOULD' PARENTS HAVE A STRONGER *DICE
IN WHAT THE
.L:.AcimQai TEACHING.
,
if,__
____
____
_.15. AREYou 1M FLAVOR OF STRONGER STUDENT
DISCIPLINE.
17. DO-YOU-FEEL 'MAT CUTBACKS IN THE scrigict
SYSTEM'S
AMMIGET,WAVEAtEOUCED THE QUALITY OF YOUR CHILDIS
EOuCATION.
XS
0 1)
2
I,
95
03
922
96
01
9C6
89
10
086
120
16
61
19
10
77
10
)
22
63
12
14 74
10
)
72
15
10
77
910
38
43
16
18 68
11
2
53
18
24
76
616
1
98472
S13 18
986
LI*
64 1
7
2 7
)
_.7 65 72
_./.5
20
TO
716
75
6
50
16
29
33
39
24
5Q
11
25
35
38
'23';
58
14 822
23 17
20
48
25
24
71
52
66
17
41 16
13
19
v*TOIALAERCENTAGESiARE NOT ALWAYS EQuAL TO 2602 OUE TO
RESPONDENTS" OMISSIONS
C
APP
EN
DIX
H
ESE
4T
ITL
,E_
811
t:I
7* N
AT
I Pu
sLlc
sch
ooL
rosc
;Rsi
AT
rot.
Syst
fmal
vi s
ip/ O
F Pl
OG
RA
N T
ILSE
AA
CIA
L D
ESI
GN
NY
- 1
9 7
2G
OA
L. S
uRN
ER
PER
CE
NT
AG
EG
RO
UP
SEL
EC
TIN
G E
XC
N G
OA
L
STU
DE
NT
TE
AC
NE
RA
LL
AO
NIW
IST
RA
TO
RS
PPE
NT
SSC
46.1
3L. E
-LE
RE
NT
AR
x.-
SC
eUX
tt.ilf
.ilac
tLfa
EL
EN
IEN
TA
RX
- SX
STE
NSC
HO
OL
EL
AIN
EN
TA
TU
r-
%U
N
UN
ITSY
STE
MU
NIT
SYST
EM
T O
T1.
.UNIT
SYST
EM
SER
RE
SPO
ND
ING
N40
5,02
6It
141.
612
9 -
90N
184
25.0
13-
.
....
- 4
5 4-
--5
2-X
---
44-
2--
- 2
2 . -
Z -
_ -
i 4 1
..
- _
.-
-23
L -
-31
4-
--
-G
OO
D N
EA
L. T
N.
C I
T I
ZE
NSN
IP
I-N
PRO
VE
NE
NT
OF
SASI
C S
KIL
LS
J0T
RA
ININ
G
SEL
F -
OE
XE
LO
PRE
NT
TA
LE
P4T
OE
uEL
Opo
sEN
T
LE
ISU
RE
.TIM
E C
TIv
IT
115
SC L
EN
GE
S
uND
ER
S7 M
O L
NG
OT
HE
R. P
EO
PLE
etem
f 'a
tm)
6-A
NIL
Y L
IVIN
G.4
:4)
CN
AR
AC
TE
R W
ILD
ING
26 Z
40 X
57 Z
4111
1 I
53 Z
52 I
49 X
21s
--
- -2
a-
--X
ao s
-_
_TO
X-
TX
- Z
67 X
60 X
14 t
12 t
24 X
30 X
27 X
_.,n
I___
_Z
u 3
_7X
X -
34 Z
._
_St.
Z40
X.
46 Z
1
SO 2
30 2
0 t
14 X
15 2
20 2
j Ze
2
3* X
24 X
.0
XIL
i3
X11
X9
Z
10 2
27 t
7 t
li i
10 X
21 I
26 I
t
le Z
39 X
57 Z
47 X
60 Z
59 X
40 z
5% 2
38 4
25 4
13 :
8 4
5 Z
. I,
23 X
la 4
71 x
61 Z
50 X
46 X
41 X

APP
EC
DIX
I
ESE-A TITLE III
INC INN& T
to.tSL I C SCNOOL I hF^
AT IC,. SYS TE m
)1 yi st oft Of ;.1,0Art RES ACpt
GRADE EQUIVALENCE
7.0
7.S
7.4
7.3
7.2
7.1
7.3
6.9
'S. P
6.7
6.6
6.5
6.4
6.3
6.2
6.1
6.0
5:9
5.8
S.7
5.6
S. S
5.4
5.3
5.2
5.1
5.0
4.9
4.8
4.7
4.6
4.5
4.4
4.3
4.2
4.1
4.0
3.9
3.9
3.7
3.6
Acpc I eVENewt FORECAST
1172-73 SCHOOL YEA*
S IxTm GRADE
EAOI NG
YEAR
70-71
71-72
72-73
SCHOOL SYSTEN AVG
5.1
4.9
NATIONAL NORM
6.3
6.3
LEGEND
PREDICTION AREA
FOR YOUR SCHOOL
YOU* SCHOOL 5
ACTUAL ATTAINMENT
60 40 30 20 10
APP
EN
DIX
J
ESE
AT
ITL
EII
IPU
BL
ICSC
HO
OL
INFO
RM
AT
ION
SYST
EM
DIV
ISIO
N O
F PR
WR
A14
RE
SEA
RC
H &
DE
SIG
N
1%8-
69
Tre
nd R
epor
t
S
1969
-70
1970
-71
LE
GE
O:
Perc
ent o
n w
elfa
re
*Per
cent
fre
e lu
nche
s
S Percent
votin
g
1971
-72
Syst
em A
vera
geN
atio
nal N
orm
.
NO
TE
:L
ack
of o
ne s
ymbo
l ind
icat
esno
dat
a fo
r th
at y
ear