SCRRA Strategic Assessment - Gateway Cities Council of ...
175
SCRRA Strategic Assessment Southern California Regional Rail Authority January 26, 2007
-
Upload
khangminh22 -
Category
Documents
-
view
1 -
download
0
Transcript of SCRRA Strategic Assessment - Gateway Cities Council of ...

SCRRA Strategic Assessment
Southern California Regional Rail Authority January 26, 2007

TABLE OF CONTENTS Executive Summary ES Page 1 1.0 Study Purpose and Methodology 1.1 1.1 Purpose 1.1 1.2 Methodology 1.1 1.2.1 The Current Metrolink System and the Surrounding Environment 1.1 1.2.2 Definition of Future Operating Scenarios 1.2 1.2.3 Identification of Long- Term Direction 1.4 1.2.4 Challenges 1.4 2.0 Current System and Baseline Capacity 2.1 2.1 Formation of Metrolink 2.1 2.2 Current Operations 2.2 2.3 Person Throughput on Metrolink Compared with Freeways 2.4 2.4 Organizational Summary 2.5 2.5 Mission Statement and Management Philosophy 2.5 2.6 The SCRRA Budget 2.7 2.7 SCRRA Operating Formulae 2.7 2.8 Strengths, Weaknesses, Opportunities, Threats, and Unknown Outcomes 2.9 2.9 Constraints on System Growth 2.10 3.0 Metrolink System Safety Program 3.1
3.1 System Safety Program Plan 3.1 3.2 Sealed Corridor Concept 3.2 3.3 Grade Separations 3.5 3.4 Crash Energy Management 3.5

4.0 Public Communications 4.1 4.1 Methods for Determining Customer Communications Needs 4.1 4.1.1 Onboard Surveys 4.1 4.1.2 Rider Panel 4.1 4.1.3 Focus Groups 4.1 4.1.4 Customer Comments 4.1 4.1.5 Industry-wide Research Studies 4.2 4.1.6 Stakeholder Communications 4.2 4.2 Preferences and Expectations for Transit Information 4.2 4.2.1 Printed Materials 4.2 4.2.2 Call Center 4.3 4.2.3 Website 4.3 4.2.4 Station Signage 4.5 a) Static Signage 4.5 b) Dynamic Signage 4.6 4.2.5 In-vehicle information 4.7 4.2.6 Media Relations 4.7 4.3 Short Term Communications Outlook (2006-2015) 4.7 5.0 Demographic Ridership Profiles And Outlook 5.1 5.1 Generational Ridership Segments 5.1 6.0 Growth Elements Controlled by Others 6.1
6.1 Station Access 6.1 6.1.1 Metrolink Station Access 6.1 6.1.2 Station Access Improvement Strategies 6.2 6.2 Station Area Development 6.4 6.2.1 Station Patronage, Access and Parking 6.4 6.2.2 Station Area Development Trends: Transportation and Land Use Planning
6.8 6.3 Extensions and Connections 6.9 7.0 Service Scenarios 7.1 7.1 Scenario Development 7.1 7.2 Weekday Scenarios 7.6

7.3 Weekend Scenarios 7.7 7.4 Equipment Assignment 7.8 8.0 Ridership Forecasts 8.1 8.1 Forecast Methodology 8.1 8.2 Weekday Forecast Results 8.5 8.3 Weekend Forecast Results 8.7 9.0 Operating Costs And Cost Allocation 9.1 9.1 Performance Data 9.1 9.2 Components of the Operating Budget 9.5 9.3 Operating Budget Service Assumptions 9.5 9.4 Summary of Revenues and Expenses by Operating Cost Component 9.6 9.4.1 Revenues 9.6 9.4.2 Expenses 9.8 9.5 Cost Allocation 9.13 10.0 Rehabilitation/Renovation Costs 10.1 10.1 Railroad Infrastructure 10.1 10.1.1 Unit Count 10.2 10.1.2 Service Life 10.2 10.1.3 Unit Cost 10.3 10.1.4 Annual Budgets and Programs 10.3 10.1.5 Allocation to Member Agencies 10.4 10.2 Rehabilitation of Rolling Stock 10.6 10.2.1 Unit Count 10.6 10.2.2 Service Life 10.6 10.2.3 Unit Cost 10.7 10.2.4 Annual Budgets and Programs 10.7 10.2.5 Allocation to Member Agencies 10.7 10.3 Rehabilitation of Non-Revenue Vehicles, On-Rail Equipment, Ticket Vending
Machines (TVMs) and other Equipment 10.9

11.0 Capital Costs 11.1 11.1 Improvements by Scenario 11.1 11.2 Capital Cost Summary 11.10 12.0 Scenario Evaluation 12.1 12.1 Approach 12.1 12.2 Evaluation Criteria 12.1 12.3 Evaluation 12.3 13.0 Implementation Challenges 13.1 APPENDIX A.1 Strategic Assessment Technical Advisory Committee (SATAC) Members A.1.1
A.2 Proposed Priority List for Fiscal Years 2006-2007 By Rank A.2.1
A.3 Trends in Population, Employment and Freeway Travel Times A.3.1 A.3.1 Population Growth A.3.1 A.3.3 Ethnicity A.3.3 A.3.4 Employment A.3.3 A.3.5 Freeway Travel Times A.3.5
A.4 Station Access A.4.1 A.4.1 Station Access for U.S. Commuter Rail Operators A.4.2 A.4.2 Station Access Survey Findings A.4.3 A.4.3 Questions for Large Commuter Rail Agencies on Addressing Ridership Increases
at Stations A.4.6
A.5 Station Development Planning A.5.1 A.5.1 Transit Oriented and Transit Supportive Development A.5.1 A.5.2 Joint Development of Stations A.5.2

A.5.3 Current Station Area Development Activities A.5.3
A.6 MOW by Line A.6.1
A.7 Cost Allocation Formulae A.7.1
A.8 Glossary of Abbreviations A.8.1
FIGURES AND TABLES EXECUTIVE SUMMARY
Table 1: Person Throughput on Metrolink Compared with Parallel Freeways ES 1
Figure 1: The Metrolink System ES 3
Table 2: SWOTU Assessment of SCRRA ES 4
Figure 2: Metrolink Ridership Age Projection ES 6
Figure 3: Weekday Trains through 2030 ES 7
Table 3: Weekday Service Levels for the Strategic Assessment ES 8
Table 4: Weekend Service Levels ES 9
Table 5: Weekday Patronage Summary by Line ES 10
Figure 4: Total Ridership through 2030 ES 10
Table 6: Weekend Patronage Summary by Line ES 11
Table 7: Operating Budget Summary ES 11
Table 8: Comparison of Scenario Costs in Constant Dollars ES 12
Figure 5: Proposed Capital Improvements by Location and Type ES 13
Table 9: Average Scores for Service Scenarios ES 14

Table 2.1: Ridership Comparison 2.1
Figure 2.1: The Metrolink System 2.3
Figure 3.1: Metrolink Grade Crossing Incidents per Million Train Miles 3.3
Figure 4.1: Metrolink Customer Information Channels 4.4
Figure 5.1: Metrolink Ridership Generational Segments 5.1
Table 5.1: Metrolink Ridership Age Projection 5.2
Table 6.1: Average Station Spacing by Route 6.4
Figure 6.1: Distribution of Home to Origin Station Distance for Metrolink Riders 6.6
Figure 6.2: Home Based Trip Purpose: System 6.7
Table 6.2: Parking Deficits by County by Time Period/Alternative 6.8
Table 7.1: Weekday Service Levels for the Strategic Assessment 7.1
Table 7.2: Service Levels by Time of Day and Direction 7.2
Table 7.3: Average Frequency of Trains by Time of Day and Direction 7.4
Table 7.4: Weekend Service Levels 7.8
Table 7.5: Equipment Assignment at Layovers by Period 7.9
Figure 8.1: Ridership Forecasting Methodology Process Flow Chart 8.2
Table 8.1: Capture Rates, LAUS Trips, AM Peak 8.3
Table 8.2: Capture Rates, Non LAUS Trips, AM Peak 8.4
Table 8.3: Weekday Patronage Summary by Line 8.6
Table 8.4: Weekend Patronage Summary by Line 8.7
Figure 9.1: SCRRA Annual Operating Data 9.2
Figure 9.2: SCRRA Annual Operating Data 9.3
Figure 9.3: SCRRA Annual Operating Data 9.4
Table 9.1: Operating Budget Cost Component Summary 9.7
Table 9.2: Projection of Operating Subsidies 2010-2030 9.13

Table 10.1: Track, Bridge and Signal/Communications Rehabilitation/Renovation 10.5
Table 10.2: Rolling Stock and Equipment Rehabilitation/Renovation through 2030 10.8
Table 10.3: Member Agency Shares of Rehabilitation/Renovation 10.9
Table 11.1: Capital Improvements Summary for 2010 11.2
Table 11.2: Capital Improvements Summary for 2015 11.4
Table 11.3: Capital Improvements Summary for 2020A 11.5
Table 11.4: Capital Improvements Summary for 2020B 11.6
Table 11.5: Capital Improvements Summary for 2030A 11.7
Table 11.6: Capital Improvements Summary for 2030B 11.8
Table 11.7: Comparison of Scenario Costs in 2005 Dollars 11.9
Figure 11.1: Proposed Capital Improvements by Location and Type 11.10
Table 12.1: Summary Evaluation 12.4
Table 12.2: Average Scores 12.5
APPENDIX
Table A.3.1 Metrolink Riders County of Residence A.3.1
Table A.3.2 County Shares of Regional Population A.3.1
Table A.3.3 Population A.3.1
Table A.3.4 Fastest Growing Cities, 2005-2030 A.3.2
Table A.3.5 Ethnicity (Population 30-64 yrs) A.3.3
Table A.3.6 Ethnicity (Metrolink riders 30-64 yrs) A.3.3
Table A.3.7 County Employment A.3.4
Table A.3.8 Jobs / Worker Ratio (30-64 year olds) A.3.5
Table A.3.9 Vehicles per Household A.3.5
Figure A.3.1 Metrolink Ventura County Line AM Commute A.3.6
Figure A.3.2 Metrolink Ventura County Line PM Commute A.3.7
Figure A.3.3 Metrolink Antelope Valley Line AM Commute A.3.8
Figure A.3.4 Metrolink Antelope Valley Line PM Commute A.3.9

Figure A.3.5 Metrolink San Bernardino Line AM Commute A.3.10
Figure A.3.6 Metrolink San Bernardino Line PM Commute A.3.11
Figure A.3.7 Metrolink Riverside Line AM Commute A.3.12
Figure A.3.8 Metrolink Riverside Line PM Commute A.3.13
Figure A.3.9 Metrolink Orange County Line AM Commute A.3.14
Figure A.3.10 Metrolink Orange County Line PM Commute A.3.15
Figure A.3.11 Metrolink 91 Line AM Commute A.3.16
Figure A.3.12 Metrolink 91 Line PM Commute A.3.17
Figure A.3.13 Metrolink IEOC Line AM Commute A.3.18
Figure A.3.14 Metrolink IEOC Line PM Commute A.3.19
Table A.5.1 Station Area Development Status Spring 2006 A.5.3
Table A.7.1 History of SCRRA Operating Budget Line Item Allocation A.7.2

Executive Summary Purpose of the Metrolink Commuter Rail Strategic Assessment The Southern California Regional Rail Authority (SCRRA) is the joint powers authority that operates the Metrolink commuter rail system. Metrolink has the highest ridership of any commuter rail operation in California and is the fifth largest in the United States. It is also one of the youngest, having started operations in October 1992. During the last 14 years, Metrolink’s network has grown from three routes to seven. Metrolink trains carry their riders safely and reliably between 54 stations on routes parallel to highways that experience chronic congestion. As Southern California’s population continues to grow, congestion on area highways is growing as well. Metrolink trains are one solution for many who will increasingly find travel by motor vehicle a less attractive travel alternative. And with gasoline prices expected to continue to increase, commuter rail service will continue to be less expensive than single occupant auto travel for trips longer than 10 to 25 miles1. The average trip length on Metrolink is 36 miles. Metrolink service removes vehicles from the parallel freeways and as a result, Metrolink provides a significant improvement to peak period travel on the freeways parallel to the system. Table 1 shows person throughput in the peak hour of each peak period on Metrolink compared with parallel freeways2.
Metrolink Line Peak Segment Distance Parallel(miles) Freeway AM Peak PM Peak
San Bernardino Baldwin Park-LA 18.8 I-10 1.0 1.3Antelope Valley/Ventura Co Burbank-LA 10.8 0.6 0.8Riverside Industry-LA 26.9 SR 60 0.7 0.7Orange County Fullerton-LA 25.8 I-5 0.7 0.8IEOC West Corona-Orange 19.3 SR 91 0.7 0.8
Equivalent Lanes in Peak Hour
Table 1: Person Throughput on Metrolink Compared with Parallel Freeways
Metrolink today is at a crossroads. The future could include a larger Metrolink system, with many more trains, riders, and route miles. However, in becoming larger, Metrolink must deal with three significant constraints on its growth. These constraints are: (1) the capacity of the existing rail network to handle more trains; (2) availability of funding for improvements, capacity expansion and (3) ongoing need for operation and maintenance subsidies. The Metrolink Commuter Rail Strategic Assessment is the first step in documenting these constraints. Its purpose is to capture long-term growth options for Metrolink that balance
1 The range is dependent upon Metrolink ticket and automobile types 2 At free flow, a single freeway lane has a capacity of 2,000 vehicles per hour. Assuming average occupancy of 1.1, each lane carries 2,200 people per hour. For the purposes of the following analysis, free flow is assumed. However, this is not the case on most of the freeways parallel to Metrolink lines and at 30 mph, for example, a freeway lane has an average capacity of only 750 vehicles per hour.
ES Page 1

the demand for growth with the operational and fiscal context in which that growth will occur. The Strategic Assessment is a conceptual plan for the development of the Metrolink commuter rail system through 2030. No commitment is implied for any agency. Projects or service levels may be advanced or delayed depending upon funding availability. Once the Assessment is completed, the analysis becomes a resource for more detailed physical and fiscal planning needed to phase the implementation of the long-term direction selected by the member agencies and the SCRRA Board. Strategic Assessment Technical Advisory Committee Each member agency has appointed representatives to serve on the SCRRA Technical Advisory Committee. These members also served on the Strategic Assessment Technical Advisory Committee (SATAC), which met monthly to guide the development of the Strategic Assessment. Performing the actual analysis were SCRRA staff members and consultants. The work effort began in the spring of 2004 and concluded in early 2006. The Metrolink System Today The Southern California Regional Rail Authority (SCRRA) is the operator of the Metrolink commuter rail system. Members of the Joint Powers Authority (JPA) include Los Angeles County Metropolitan Transportation Authority (LACMTA), Orange County Transportation Authority (OCTA), Riverside County Transportation Commission (RCTC), San Bernardino Associated Governments (SANBAG), and Ventura County Transportation Commission (VCTC). Member agencies contribute to capital improvements within the Metrolink system and provide operating subsidies. Each member agency owns rights-of way over which Metrolink commuter rail services operate. Metrolink also operates over rights-of way owned by the freight railroads. Local jurisdictions, Caltrans and some member agencies own and operate the Metrolink stations. Amtrak long-distance trains and the state-subsidized Pacific Surfliner trains also serve some stations. Executive staff of SCRRA includes a Chief Executive Officer and two Assistant Executive Officers. There are five functional departments. The FY 2006-07 SCRRA Budget includes 205 authorized positions. The employees of the SCRRA administer the Metrolink system and most of the operation is provided by contractors. SCRRA contractors employ an additional 397 staff to operate and maintain the Metrolink system. Metrolink provides service over seven routes to 54 stations. The network includes more than 512 route miles with 145 trains each weekday. As of June 2006, three Metrolink lines have 26 trains on Saturdays and eight trains on Sundays. Average weekday ridership is over 42,000 (one-way trips) and average weekend ridership is about 8,900. Rolling stock in service includes 39 locomotives and 155 commuter rail cars (including one leased locomotive and 16 leased cars). Metrolink’s service area appears in Figure 1 below.
ES Page 2

Figure 1: The Metrolink System
Metrolink’s mission statement and management philosophy are summarized below.
Mission Statement Metrolink is a premier regional rail system, including commuter and other passenger services, linking communities to employment and activity centers. Metrolink provides reliable transportation and mobility for the region, leading toward more livable communities.
Metrolink’s Management Philosophy
As a JPA created by the transportation agencies of five Southern California counties, Metrolink has as its primary purpose the planning, design and construction, and operation of an integrated system of regional passenger rail lines serving communities and work sites in Los Angeles, Orange, Riverside, San Bernardino, Ventura, and northern San Diego Counties. The fundamental responsibility of Metrolink is to assure that its customers arrive at their destination on time and experience safe, comfortable, reliable and friendly service that meets their travel needs.
ES Page 3

As a starting point for the Strategic Assessment, SCRRA developed an internal evaluation of Metrolink’s current strengths, weaknesses, opportunities, threats and elements with unknown outcomes, also known as a SWOTU assessment. Such an assessment is traditional in a strategic planning exercise aimed at building on what an organization does well, while minimizing risks. The results of the SWOTU assessment are included in Table 2 below.
Table 2: SWOTU Assessment of SCRRA 1. Strengths
Safe operations compared to personal auto Comfort, convenience, customer choice on how to use commute time High customer loyalty by highly discretionary riders Respected expertise of staff Uniqueness of product (long trips, commuter dominant)
2. Weaknesses Frequency of service, limited weekend and late night service Lack of integrated technology systems and instability/obsolescence of some (TVM, Oracle/Maximus, Radio system, electronic signage, Universal Customer Care Data Base) Member Agency funding limitations Availability of parking / transit access / rolling stock Weak brand value / confusion with Metro
3. Opportunities Improve communication of delays and other passenger information Improve business practices leading to security of state/federal funding streams Improve safety through Sealed Corridors and Crash Energy Management technology Excessive fuel price increases attract new riders
4. Threats Increasing costs of fuel, insurance & other key drivers outpacing current revenue streams Additional incidents and their operational / financial and image impacts Differences in funding capacity and member agency priorities lead to pressures on Metrolink as a regional rail system Key staff retirements / knowledge transfer
5. Unknown Outcomes Unfunded mandates (Homeland Security, Air Quality, Environmental Justice) Changes in future contractual relationships with freight railroads (e.g. liability, cost of access, capital improvement requirements, railroad share) State and federal interest in restructuring Amtrak and Intercity passenger rail services and State interest in a regional rail system Outcome of audit findings (previous, current and future)
ES Page 4

The assessment revealed that the principal strengths include safe operations and high customer loyalty. Key weaknesses include limited off-peak and weekend service and funding limitations of member agencies. Opportunities for Metrolink include improvement in business practices leading to a more secure funding base, and improvement in safety by implementation of Sealed Corridors (preventing train-motor vehicle collisions at grade crossings) and Crash Energy Management technology (enhancing the safety of Metrolink rolling stock for riders). Threats include increasing costs of fuel, and the differences of funding capacities of the member agencies that limit the ability of Metrolink to serve the growing and expanding region. The key unknown outcome is SCRRA’s ability to grow its services on the freight railroads, over which Metrolink operates. These are the Burlington Northern and Santa Fe Railway (BNSF) and the Union Pacific Railroad (UP) serving the Ports of Los Angeles and Long Beach. On the basis of this assessment, SCRRA management determined that the Metrolink Strategic Assessment should focus on Metrolink’s strength as a safe and growing commuter rail operator. Specifically, the effort was to determine how best to ramp up service levels, including off-peak and weekend trains, over the next 24 years. Metrolink System Safety Program Safety is a primary concern of the SCRRA. For purposes of the Strategic Assessment, three important programs are discussed. First is the System Safety Program Plan (SSPP), which examines all elements of the Metrolink system in order to identify and address hazards associated with the Metrolink system. SCRRA has identified two regional strategies to reduce risk: Crash avoidance through comprehensive safety improvements in a Sealed Corridor and modifications to rolling stock to incorporate Crash Energy Management technologies to enhance crashworthiness. Public Communications Metrolink’s public communications efforts encompass multiple delivery channels. SCRRA uses market research to determine passenger and stakeholder preferences for delivery of information. As rider expectations change over the next 20-30 years, Metrolink will need to increase the availability and immediacy of information for a larger audience that would likely overwhelm current communication technology. Metrolink anticipates more of its information will be communicated to the public via electronic formats. Metrolink’s Demographic Ridership Profiles Metrolink surveys its riders every two years. The surveys provide a wealth of information on the trip purpose, where riders live, where they work, and their typical travel characteristics. The 2004 survey revealed that almost 90% of riders use Metrolink for their work commutes. Also, it showed that more than 80% of riders are between 30 and 64 years old, and that 48% of riders – almost half – are 45 years old and older.
ES Page 5

Over time, subtle changes can be expected. With increased service at all times of the day, and on weekends, the proportion of non-work related trips will increase. Also, Metrolink can expect the proportion of riders eligible for senior discounts to grow from 2% of current ridership to 5.3% in 2030. That noted, riders between 35 and 64 years old will account for about the same proportion of riders in 2030 as they do today – around 72%. The age composition of Metrolink riders appears in Figure 2.
Figure 2: Metrolink Ridership Age Projection
Metrolink Ridership Age Pyramid
0.0%
0.5%
1.0%
1.5%
2.0%
2.5%
3.0%
3.5%
7 11 14 17 20 23 26 29 32 35 38 41 44 47 50 53 56 59 62 65 68 71 74 77 80 83 86 90 100
Age (2004)
Swing Generation
GI Generation
Baby Boomers
Generation X
Generation Y
Source: Metrolink Rider Survey 2004 The total one-way travel distance between home and work for the average Metrolink rider is 42.1 miles, with 36 of those miles taken on the train. Put another way, Metrolink serves well many people who commute long distances to work. By riding the train, they can avoid often-congested freeways and arrive at their destination reliably. Year 2000 U.S. Census data shows that the number of Americans making commutes longer than 45 minutes each way has grown steadily to one in six, up from one in eight in 1990. Metrolink expects this trend will continue and will translate into future growing demand for Metrolink services. Growth Elements Controlled by Others: Parking, Extensions and Connections While Metrolink does not own or operate parking at stations, improved station access and parking expansion are essential to continued growth in ridership. There are 21,955 parking spaces system-wide. As of October 2005, 20 stations operated at greater than 90% of parking capacity on a weekday basis, and an additional seven operated between 80% and 90% of their capacity. As ridership increases in the future, capacity will only be further strained. Potential improvement strategies that might be employed by local agencies include the following:
o Review existing parking facilities to identify more efficient layouts.
ES Page 6

o Add parking where feasible. o At stations in areas with development potential, work with local jurisdictions to
have developers provide parking. o Encourage transit oriented development at stations o Institute parking fees at stations. o Set up parking permitting across multiple jurisdictions. o Institute valet parking.
Numerous transit projects, in various stages of development or conceptualization, may serve to expand the reach of the Metrolink system. Some of the projects involve potential Metrolink service on new lines. Others would be new connecting light rail transit or Diesel Multiple Unit (DMU) self-propelled rail car services or connecting Bus Rapid Transit (BRT). The Strategic Assessment identified twelve different projects in the SCRRA member agencies’ long range plans that may come on line by 2030. The projects may appear to serve primarily a local constituency. However, taken together and with links to Metrolink, they could significantly contribute to Metrolink’s ridership and revenue growth. Future Service Scenarios The analytical portion of the Metrolink Strategic Assessment began with the development of six Service Scenarios. These Scenarios were evaluated in an effort to identify a potential long-term direction for SCRRA. Service levels, ridership and costs were projected for the years 2010, 2015, 2020 and 2030. There were two alternative Scenarios for each of 2020 and 2030. Scenario development focused on determining weekday and weekend service levels for each of Metrolink’s lines over time. Once the service levels were identified for each scenario, the SATAC evaluated ridership and costs. The SATAC calculated the costs and benefits of weekend services levels as well. Weekday service levels could grow to 362 trains as shown in Figure 3.
Figure 3: Weekday Trains through 2030
050
100150200250300350400
2006 2010 2015 2020 2030
Wee
kday
Tra
ins
ES Page 7

The selected weekday service levels by line are shown in Table 3. Service levels for 2005 appear in the table for comparative purposes. In addition the service levels assumed by OCTA in their Strategic Assessment for 2010 are included for comparison as they are not identical to the levels assumed in the SCRRA Strategic Assessment. The table identifies the increase in train service over 2005 for each Scenario, as well as the increase over the preceding period.
Table 3: Weekday Service Levels for the Strategic Assessment
Lines 2005 2010 OCTA 2010 2015 2020 2030
Ventura County 18 18 28 34 42
Antelope Valley 24 24 32 42 46
San Bernardino 34 34 48 56 88
Riverside 12 12 22 40 46
91 Line: LA-Riverside 9 0 0 4
91 Line: LA-Perris 13 10 16 24 40
LAUS-Oceanside 10 10 10 10 10 14
LAUS-Laguna Niguel/SJCap/Irvine 9 15 16 16 18 38
Fullerton-Laguna Niguel 0 20 20 20 20
IEOC 12 18 20 24 26 40
Burbank Turn 12 12 12 8 8
TOTAL 140 176 232 278 362
Increase over 2005 26% 66% 99% 159%
Increase over prior period 32% 20% 30%
2010 represents current service levels except on IEOC and OC shuttles and Perris Valley and one train on the 91 LineNo Amtrak trains are included in the table. Only the ultimately chosen scenarios are shown for 2020 and 2030.
Weekend service levels are shown in Table 4.
ES Page 8

Table 4: Weekend Service Levels
Lines 2005 2010 2015 2020 2030
Antelope Valley Sat 8 8 12 16 36
Sun 0 0 8 12 20
San Bernardino Sat 16 16 36 36 36
Sun 8 8 20 20 20
LAUS-Oceanside Sat 0 0 0 0 0
Sun 0 0 0 0 0
LAUS-Laguna Niguel/SJCap/Irvine Sat 0 0 0 0 52
Sun 0 0 0 0 52
Fullerton-Laguna Niguel Sat 0 52 52 52 0
Sun 0 52 52 52 0
IEOC Sat 6 summer 6 6 12 12Sun 6 summer 6 6 12 12
TOTAL SATURDAY 24+6 Summer 82 106 116 136
TOTAL SUNDAY 8+6 Summer 66 86 96 104
Increase over 2005 (excludes summer) Saturday 242% 342% 383% 467%
Increase over 2005 (excludes summer) Sunday 725% 975% 1100% 1200%
Increase over Prior Period Saturday 29% 9% 17%Increase over Prior Period Sunday 30% 12% 8%
Note that in 2006, additional weekend service was added on the San Bernardino Line, weekend service was added on the Orange County Line and the IEOC summer service became year-round. This service is not included in the 2010 scenario. Ridership Forecasts Ridership forecasts for the selected scenarios appear in Tables 5 and Figure 4 for weekdays and Table 6 for weekends. The forecasts show ridership by each Metrolink Line. Ridership for the Burbank Turns is incorporated as part of the Ventura County Line and Antelope Valley Line totals. Ridership for 2030 is projected to be 157,000 riders. Of these, 130,000 would be peak period riders. The table shows total passenger trips. One rider making a morning and an evening peak period commute trip on Metrolink would generate two passenger trips in one day. Riders making transfers between lines are counted on each link.
ES Page 9

Table 5: Weekday Patronage Summary by Line
Peak Period Trips 2010 2015 2020 2030 Ventura Line 4,259 5,009 6,112 9,651 Antelope Valley Line 8,424 14,548 19,334 27,554 San Bernardino Line 11,674 16,544 20,047 33,237 Riverside Line 4,687 9,536 12,492 18,350 Orange County Line 7,920 10,453 10,759 21,308 Inland-Orange Line 4,870 5,281 5,358 9,895 91-Perris Valley Line 3,300 4,687 6,575 9,844 System Total 45,132 66,058 80,677 129,838 Total Weekday Trips Ventura Line 4,642 5,760 7,274 11,485 Antelope Valley Line 9,603 16,730 23,008 32,789 San Bernardino Line 13,775 20,349 25,058 41,546 Riverside Line 4,921 10,394 14,866 21,836 Orange County Line 9,583 13,066 12,803 25,356 Inland-Orange Line 5,356 5,914 5,953 11,776 91-Perris Valley Line 3,465 4,922 7,827 11,714 System Total 51,345 77,136 96,788 156,502
Figure 4: Total Ridership through 2030.
0
50,000
100,000
150,000
200,000
2006 2010 2015 2020 2025 2030
Wee
kday
Trip
s
ES Page 10

In 2030, weekend riders could total nearly 61,000 weekend passenger trips, as shown in Table 6 below.
Table 6: Weekend Patronage Summary by Line
2010 2015 2020 2030 San Bernardino Line
Saturday 4,214 6,349 8,470 14,301 Sunday 2,269 3,419 4,561 7,700
Antelope Valley Line Saturday 3,389 6,692 9,663 16,194
Orange County Local Weekend 1,018 1,223 1,724 17,901
Inland Empire-Orange County Line
Weekend 2,157 2,129 3,572 4,769
System Total
13,047
19,812
27,990
60,866
Expenses and Revenues The Metrolink Operating Budget consists of expenses (operating costs), revenues, and net local subsidy. Expenses include operating costs for train operations and services, including maintenance of equipment; maintenance-of-way; administration; insurance; and various contingencies. Revenues include farebox revenue from ticket and pass sales; fees received from freight railroads for dispatching their trains on Metrolink-controlled lines; and contributions to maintenance-of-way costs received from freight railroads. The difference between the operating costs and the revenues is the net local subsidy, which is provided by the Metrolink member agencies. Table 7 identifies the operating costs, revenues and local subsidies forecasted for the selected scenarios. The table includes a 4% annual cost escalation and a 3.5% annual revenue escalation. Expenses for 2030 reflect an escalation factor of 2.2 between 2010 and 2030, while service increases by a factor of 2 from 2010 to 2030. Weekday ridership is projected to increase by a factor of 3 from 2010 to 2030 and escalation factor on fare revenues for this period is 2.
Table 7: Operating Budget Summary ($000s)
2010 2015 2020 2030 Expenses $166,869 264,209 376,109 716,637 Revenues $91,690 155,941 228,567 507,799 Net Local Subsidy $75,178 108,268 147,542 208,838
ES Page 11

ES Page 12
Rehabilitation/Renovation Rehabilitation/renovation projects are those projects that replace worn out assets with like or improved assets and thus preserve and extend the useful life of the infrastructure assets (the physical plant and the rolling stock). Rehabilitation/renovation project prioritization recommendations are based upon tolerating only the most minimal and manageable risk of failure. Annual costs grow as the system expands and are projected through 2030. Projections are based on the useful life of each component of the infrastructure and annual amounts are a guideline only. Projects may be deferred to allow for the efficiency of a larger replacement project. Capital Costs
Category 2006 to 2010 2011 to 2015 2016 to Track and Structure 113.9$ 557.6$ $ Support Facilities 9.0$ 42.5$ 3$ Stations 64.8$ 32.5$ 2$ Sealed Corridor 50.0$ 50.0$ 5$ Parking 173.4$ 108.0$ 8$ Other 55.2$ -$ $ Subtotal Infrastructure 466.
2020 2021 to 2030263.4 802.5$
2.8 4.7$ 0.0 -$ 0.0 -$ 5.8 259.1$ - -$
3$ 790.6$ $ 452.0 1,066.3$ 241.5 294.5$ 275.1 334.1$ 693.5 1,360.8$ 727.1 1,400.4$
Equipment (5-car Sets) -$ 219.6$ $ Equipment (6-car Sets) -$ 358.5$ $ Total (5-car Sets) -$ 1,010.2$ $ Total (6-car Sets) -$ 1,149.1$ $
Figure 5 shows all the proposed capital projects (excluding rolling stock and other equipment) by location and type throughout the Metrolink system.
Capital costs include the physical assets and improvements required to support train operations. The costs of infrastructure and equipment required to operate each of the Service Scenarios were determined. For comparative purposes, Table 8 summarizes capital costs by category for the selected scenarios in 2005 dollars. The table shows the real increases in costs of incremental improvements, with inflation having been removed from the calculations. The largest cost categories are track and structures, rolling stock (6-car train sets), and parking and are highlighted in yellow. Rolling stock costs are calculated on the basis of 5-car and 6-car train sets.
Table 8: Comparison of Scenario Costs in Constant Dollars ($millions)

ES Page 13
Figure 5: Proposed Capital Projects by Location and Type

Evaluation With ridership, revenue, expenses, and capital improvements identified for each Service Scenario, the Scenarios were evaluated on the basis of 10 different criteria selected by the SATAC, at follows:
1. How well does the Scenario improve mobility within each corridor? 2. How well does the Scenario reduce the potential for accidents and fatalities? 3. What is the operations and maintenance (O&M) cost of the Scenario? 4. What are the total costs of the Scenario? 5. How does the Scenario reduce congestion and improve air quality? 6. What is the farebox recovery of the Scenario? 7. How well does the Scenario serve employment demand? 8. What kind of increase in service frequency does the Scenario provide? 9. How many more riders does the Scenario anticipate? 10. How easily can the Scenario be implemented?
Each Scenario was given a score of 1 to 5 (with 5 being best), depending on how that Scenario performed. For example, as to how well a Scenario improves mobility within each corridor, the evaluation score related to the increase in the number of trains. That is, more trains mean more mobility. Scores for the other criteria were calculated in a similar fashion. Scores for each evaluation criteria were then averaged to determine an average score. These average scores appear in Table 9.
Table 9: Average Scores for Service Scenarios
Scenario Score
2010 2.3
2015 2.8
2020A 3.1
2020B 3.1
2030A 2.4
2030B 2.7
Of the later year alternatives, 2020A and 2030B scored better. Accordingly, the SATAC recommended that the preferred long-term direction for Metrolink would consist of implementation of service levels in accordance with Scenarios for 2010, 2015, 2020A and 2030B.
ES Page 14

Implementation Challenges The Strategic Assessment outlines an aggressive growth option for Metrolink’s commuter rail expansion through 2030. No commitment is implied for any agency. Projects or service levels may be advanced or delayed depending upon funding availability. Member agencies will need to continue to use their federal formula and/or local sales tax funds to allow current service levels to be sustained. However, the growth options cannot be implemented without new revenue sources. All of the lines, with the exception of the Antelope Valley Line, require commitments from more than one member agency. Growth can occur on a line only if all affected members agree to their projected levels of subsidy and capital improvements. In addition, local jurisdictions and other station owners and transit agencies must invest in growth to assure continued station access. Metrolink operates over rights of way owned by the freight railroads. Segments of the Orange County, Ventura County, Riverside, IEOC and 91 Lines all operate over freight railroads, and securing agreement with either BNSF or UP to increase service operating over their ROW. Coming to agreement on what capital improvements might be required to accommodate passenger and freight rail growth will be a significant challenge.
ES Page 15

SCRRA Strategic Assessment, 1-26-07
1.0 Study Purpose and Methodology 1.1 Purpose Consistent with traditional strategic planning studies, the purpose of the Metrolink Commuter Rail Strategic Assessment has been to identify a long-term guide for the growth of the Metrolink system. With this direction identified, the Southern California Regional Rail Authority (SCRRA) and its member agencies can plan for the capital funding and operating subsidies necessary to respond to demand for expanded commuter rail services. There is no commitment to operate any of the proposed service or fund any of the capital improvements in the periods selected. Service and/or projects may be moved forward or out depending upon availability of funding. This Strategic Assessment was prepared over a two-year period by staff from SCRRA, SCRRA member agencies, and technical consultants. The analysis progressed from an assessment of the current Metrolink system and the environment in which it operates to the evaluation of potential future Service Scenarios. Operating subsidies and capital requirements were developed for the Scenarios. Ultimately, an evaluation of the costs and benefits of each Scenario resulted in the identification of the preferred long-term alternative. The effort concluded with a summary of the likely challenges to be overcome in implementing that long-term strategy. A Strategic Assessment Technical Advisory Committee (SATAC) guided the analysis, whose methodology is outlined below. All member agencies – Los Angeles County Metropolitan Transportation Authority (LACMTA), Orange County Transportation Authority (OCTA), Riverside County Transportation Commission (RCTC), San Bernardino Associated Governments (SANBAG), and Ventura County Transportation Commission (VCTC) – assigned representatives to the SATAC. Senior staff from SCRRA led the study team. They were supported by technical consultants from Wilbur Smith Associates and SYSTRA Consulting. A listing of SATAC participants – agency representatives and study team members appears in Appendix A.1. 1.2 Methodology
1.2.1 The Current Metrolink System and the Surrounding Environment The starting point for the analysis was an assessment of the current Metrolink system. The SATAC study team estimated the current capacity of the system. To begin, the team performed a classic strategic planning SWOT (strengths, weaknesses, opportunities and threats) analysis of the system. A fifth category was added to the analysis to account for elements with unknown impact, so the team called this analysis SWOTU. It also defined SCRRA’s management philosophy, which established the context for the planning of the organization to date. A description of the analysis of the current system appears in Chapter 2.
1.1

SCRRA Strategic Assessment, 1-26-07
A key element of current operations is SCRRA’s focus on safety. Although SCRRA complies with all applicable federal and state safety laws and regulations, over the next several years, SCRRA plans on allocating significant capital resources to enhance safety. One initiative will be the Sealed Corridor concept – a program to reduce the potential for train / motor vehicle collisions at grade crossings and along the railroad right-of-way. Another initiative is emerging opportunities to enhance the safety of rail vehicles through Crash Energy Management designs. Accordingly, the current Metrolink System Safety Program and plans for the future are included in Chapter 3 of this Strategic Assessment. Metrolink’s public communications efforts encompass multiple delivery channels and are focused on passenger and stakeholder information. As discussed in Chapter 4, technology used currently is mainly what has been used since the beginning of the agency with the addition of some electronic communications technology in the form of a website, e-mail, SMS (text messaging) and downloadable electronic formats. As ridership increases and the Gen Y1 expectations change over the next 20-30 years Metrolink will need to increase the availability and immediacy of information to a larger audience that would likely overwhelm current communications technology. Every two years, SCRRA has conducted on-board surveys to learn more about our riders – where they come from, where they are going beyond stations, how they arrive at stations, how they complete their trips to their workplaces. These surveys have also included among other things a range of questions exploring customer satisfaction and loyalty and have yielded a wealth of information about current ridership trends. They also allowed SCRRA staff to identify likely future trends, such as increases in reverse peak commuting and off-peak ridership. These findings appear in Chapter 5. There are several essential elements of the Metrolink system that are controlled by others. These include station access through parking and transit, the demographic outlook for the region, local plans for station area development, and planned extensions and connections to the Metrolink system. These elements are summarized in Chapter 6 and detailed in the Appendices A.3 through A.5. 1.2.2 Definition of Future Operating Scenarios As a second step in the analysis of potential future Metrolink operations, the SATAC quantified increased service levels of commuter trains on all seven lines for 2010, 2015, 2020 and 2030. The Service Scenario for 2010 would be mostly the same as current operations, with a few exceptions – most notably the implementation of Intra-Orange County Service, running with half-hour headways all day between Fullerton and Laguna Niguel/Mission Viejo, implementation of the Perris Valley Line as an extension of the 91 Line, and extension of the San Bernardino and Inland Empire-
1 Gen Y was originally coined “the thirteenth generation” as represented by those born between 1977 and 1994 (Strauss and Howe: Generations, 1994). Today it is also widely known as Echo Boomers, or the Millennial Generation.
1.2

SCRRA Strategic Assessment, 1-26-07
Orange County (IEOC) Lines to E Street in downtown San Bernardino. The 2015 Scenario would see added service on all lines, as would Scenarios for 2020 and 2030. The SATAC defined two alternatives (an “A”, assuming a lower service level, and a “B”, assuming a higher service level) for 2020, and two more (an “A” and a “B”) for 2030. Descriptions for all Scenarios appear in Chapter 7. With the Scenarios defined, the study team forecasted ridership for each of them. The team developed a ridership forecasting model based on observations of ridership patterns evident from the 2002 on-board ridership survey and on SCAG work trip projections. The forecasting methodology assumed commuters are more likely to use a commuter rail service for longer trips than for shorter trips. Also, commuters are more likely to take trains as traffic congestion and the length of time their car trips take increase. The weekday and weekend forecasts for all Service Scenarios appear in Chapter 8. With train volume and forecasted ridership identified, the study team calculated the operating costs and required operating subsidies for all Scenarios. These were based on extrapolations from current cost data and on estimates of future fare revenue. Net costs were allocated to SCRRA member agencies per alternative formulae. The operating costs and allocations appear in Chapter 9. Rehabilitation and renovation projects are those projects that replace worn out capital assets with like or improved assets and thus preserve and extend their useful life. Railroad infrastructure and equipment deteriorate due to age, weather, and normal wear. At a minimum, an ongoing rehabilitation and renovation program is required to recover from this deterioration and maintain a high level of service reliability and safety. The Governmental Accounting Standards Board Statement 34 (GASB-34) also requires a process to document our continuing maintenance of the infrastructure. SCRRA’s program encompasses track, signals, communications, structures, equipment, and rolling stock. A description of the program appears in Chapter 10. Capital improvements to support all future Scenarios involve enhancements to track and structures, signal and communications systems, support facilities, stations, the locomotive and car fleets, and passenger communications. To identify high-priority track improvements, the study team estimated the capacity required to support future commuter and freight volumes on all lines. All other improvements were focused to deliver reliable service that meets the travel demands identified in the future Scenarios. The team used the most current unit costs available to estimate total expenses, and applied appropriate contingencies and agency overhead cost factors. Costs were then escalated to the Scenario year, and allocated to SCRRA member agencies. The capital costs and allocations appear in Chapter 11.
1.3

SCRRA Strategic Assessment, 1-26-07
1.2.3 Identification of Long-Term Direction The ridership forecasts, along with operating and capital cost calculations, allowed the SATAC to review the Service Scenarios in terms of specific evaluation criteria. These primary criteria included mobility measures derived from ridership and financial measures based upon revenue and costs. The SATAC applied the criteria to the Scenarios and developed a ranking. All criteria were considered equally important to the alternative Scenarios for 2020 and 2030. The results of the evaluation pointed to a long-term direction for Metrolink commuter rail services. The evaluation results appear in Chapter 12.
1.2.4 Challenges The SCRRA faces major challenges inherent in expanding the Metrolink commuter rail system. The principal challenges focus on securing federal, state and local funding for the requisite capital improvements and operating subsidies, and securing agreement to increase service operating over the freight railroads. These challenges are outlined in Chapter 13.
1.4

SCRRA Strategic Assessment, 1-26-07
2.0 Current System and Baseline Capacity 2.1 Formation of Metrolink In June 1990, the California Legislature enacted Senate Bill 1402, Chapter 4 of Division 12 of the Public Utilities Code introduced by Senator Robert Presley. This bill required the county transportation commissions of Los Angeles, Orange, Riverside and San Bernardino to jointly develop a plan for regional transit services within the multi-county region. In June 1991, following an eight-month cooperative planning effort, these four transportation commissions combined with the Ventura County Transportation Commission, the Los Angeles-San Diego Rail Corridor Agency, and the Southern California Association of Governments to produce a report entitled "Southern California Commuter Rail, 1991 Regional System Plan" or the SB 1402 Plan. The report outlined plans for a system to connect Southern California with six commuter rail lines comprised of more than 400 miles of track and 60 stations by 1995. Table 2.1 shows the ridership projected in the 1402 Plan as compared with average weekday ridership for the first two months of 2006. Note that the SB 1402 Plan did not include the Riverside Line and service levels on the 91 Line are not yet sufficient to meet potential ridership.
Table 2.1 Ridership Comparisons
Line SB 1402 Goal 2006 Average
Weekday Weekday Ridership
Ridership through 2/06
Ventura 3,400 4,162
Lancaster 2,690 7,191
Orange County 4,470 6,238
IEOC 3,180 4,428
San Bernardino 4,490 12,235
Riverside N/A 3,815
91 3,600 2,237
Total 21,830 40,306
2.1

SCRRA Strategic Assessment, 1-26-07
In August 1991, the SCRRA was formed as a regional Joint Powers Authority (JPA). The purpose of the newly formed SCRRA was to plan, design, construct, and administer the operation of regional passenger rail lines serving the counties of Los Angeles, Orange, Riverside, San Bernardino, and Ventura. The SCRRA named the regional commuter rail system "Metrolink." The first three lines - San Bernardino, Santa Clarita (now Antelope Valley), and Ventura County - started service in October 1992. The Riverside Line was added in June of 1993, and the Orange County Line, which extends 19 miles into northern San Diego County, was added April 1994. The sixth line, which was the first suburb-to-suburb commuter rail line in the country, the Inland Empire-Orange County Line, was added in October 1995. The seventh line from Riverside to Los Angeles via Fullerton, the 91 Line, was added in 2002. 2.2 Current Operations Over its fourteen years of operations through October 2006, SCRRA has been building the Metrolink commuter rail system in order to ensure safe, high quality, efficient services to meet the growing needs of our region. As of September 2006, Metrolink provides service over seven routes to 54 stations over 512 route miles (388 miles excluding shared miles2) with 145 trains each weekday, and an average weekday ridership of over 41,000 (one-way trips). Weekday service starts as early as 4:13 a.m., arriving in Los Angeles by 5:30 a.m. and operates as late as 10:52 p.m. with the last train leaving Los Angeles at 9:00 p.m. Weekend service is provided on four lines with 40 trains on Saturdays and 22 trains on Sundays. Average weekend ridership is almost 11,000. Weekend service starts as early as 6:30 a.m., arriving in Los Angeles by 8:40 a.m. and operates as late as 12:45 p.m. with the last train leaving Los Angeles at 11:15 p.m. Rolling stock in service includes 39 locomotives (including one leased from Sound Transit in September 2004) and 155 commuter rail cars (including 12 cars leased from Sound Transit in September 2004 and four cars leased from Altamont Commuter Express in January 2006). The following map in Figure 2.1 shows the Metrolink system as of 2006.
2 A count of shared miles counts only one time those miles that are shared by two or more lines.
2.2

SCRRA Strategic Assessment, 1-26-07
Figure 2.1: The Metrolink System
Since September 1, 2002, the Rail 2 Rail Program – an agreement between Amtrak, Caltrans and SCRRA - allows Metrolink monthly passholders to ride any Amtrak or Metrolink train within the limits of their ticket and all Amtrak ticketholders to ride any Amtrak or Metrolink train within the limits of their ticket. On November 17, 2004 Amtrak, Metrolink and Caltrans implemented two shared service trains operating as Amtrak 768 and 799 and Metrolink 108 and 103 in order to allow Amtrak/Caltrans to occupy one of Metrolink’s limited capacity train slots. All Metrolink fare media is accepted on these shared service trains, which stop at all Metrolink stations between Los Angeles and Oxnard. All Metrolink fare media are also valid on connecting local transit at no additional fare. In Los Angeles County, Metrolink fare media are included in the EZ transit pass program and is valid for travel on 20 transit operators around the county.
In addition to operating commuter rail service, SCRRA dispatches and maintains in excess of 60% of the territory over which it operates. On a weekday basis in September 2006, SCRRA currently dispatches 145 Metrolink trains, up to 36 Amtrak intercity trains between Moorpark and San Diego, 22 North County Transit District (NCTD) operated Coaster trains, and between 70 and 80 freight trains. SCRRA is also responsible for the
2.3

SCRRA Strategic Assessment, 1-26-07
maintenance of right-of-way owned by SCRRA member agencies that extends over 337 track-miles. SCRRA’s Capital Program includes ongoing rehabilitation/renovation of this right-of-way, facilities, equipment, and rolling stock, as well as expansion of the system through the acquisition and construction of new assets. Metrolink stations are developed, owned and operated by the local jurisdictions or SCRRA member agencies. 2.3 Person Throughput on Metrolink Compared with Freeways At free flow, a single freeway lane has a capacity of 2,000 vehicles per hour. Assuming average occupancy of 1.1, each lane carries 2,200 people per hour. For the purposes of the following analysis, free flow is assumed. However, this is not the case on most of the freeways parallel to Metrolink lines and at 30 mph, for example, a freeway lane has an average capacity of only 750 vehicles per hour. On the San Bernardino Line, which parallels the I-10 freeway, between Baldwin Park and downtown Los Angeles (18.8 miles), on average, Metrolink carries the equivalent of one freeway lane in the peak hour of the morning peak period, and the equivalent of about 1.3 lanes in the peak hour of the afternoon peak. Going north out of downtown Los Angeles to Burbank (10.8 miles), on average, Metrolink carries the equivalent of about 60% of a freeway lane in the peak hour of the morning peak and about 80% of a freeway lane in the peak hour of the afternoon peak. On the Riverside Line, which parallels SR 60, between downtown Los Angeles and Industry (26.9 miles), on average, Metrolink carries the equivalent of about 70% of a freeway lane in the peak hour of both the morning and afternoon peak periods. On the Orange County Line, which parallels the I-5 freeway, between downtown Los Angeles and Fullerton (25.8 miles), on average, Metrolink carries the equivalent of about 70% of a freeway lane in the peak hour of the morning peak period and about 80% of a freeway lane in the peak hour of the afternoon peak period. On the IEOC, which parallels SR 91, between West Corona and Orange (19.3 miles), on average, Metrolink carries the equivalent of about 70% of a freeway lane in the peak hour of the morning peak and almost 80% of a freeway lane in the peak hour of the afternoon peak. In summary, Metrolink provides a significant improvement to peak period travel on the freeways parallel to the system.
2.4

SCRRA Strategic Assessment, 1-26-07
2.4 Organizational Summary The SCRRA Board of Directors consists of 11 voting members and three ex-officio members. Voting members with their respective number of votes are: Los Angeles County Metropolitan Transportation Authority (LACMTA), four votes; Orange County Transportation Authority (OCTA), two votes; Riverside County Transportation Commission (RCTC), two votes; San Bernardino Associated Governments (SANBAG), two votes; and Ventura County Transportation Commission (VCTC), one vote. Ex-officio members of the SCRRA include the Southern California Association of Governments (SCAG), the San Diego Association of Governments (SANDAG) and an appointee of the Governor of California (preferably from the California Department of Transportation (Caltrans)). As of October 2006, SCRRA staff is organized with an Executive Office, and five departments as identified below: Executive Office:
David Solow, Chief Executive Officer Steve Wylie, Assistant Executive Officer, Finance and Administration Harold Watson, Assistant Executive Officer, Operating Services
Departments:
Communications and Development Department, Stephen Lantz, Director Engineering and Construction Department, Darrell J. Maxey, Director Equipment Department, William X. Lydon Jr., Director Finance Department, Patricia Kataura, Controller/Treasurer Operations Department, Ed Quicksall, Acting Director
The FY 2006-07 Budget of the SCRRA includes 205 authorized positions. SCRRA contracts for most of the day-to-day service. SCRRA contractors employ an additional 397 staff to operate and maintain the Metrolink system. 2.5 Mission Statement and Management Philosophy This section outlines the SCRRA Mission Statement and Metrolink’s management philosophy.
Mission Statement Metrolink is a premier regional rail system, including commuter and other passenger services, linking communities to employment and activity centers. Metrolink provides reliable transportation and mobility for the region, leading toward more livable communities.
2.5

SCRRA Strategic Assessment, 1-26-07
Metrolink’s Management Philosophy
As a JPA created by the transportation agencies of five Southern California counties, Metrolink’s primary purpose is to plan, design and construct, operate and maintain an integrated system of regional passenger rail lines serving the counties of Los Angeles, Orange, Riverside, San Bernardino, and Ventura.
The fundamental responsibility of Metrolink is to assure that our customers arrive at their destination on time and experience safe, comfortable, reliable and friendly service that meets their travel needs.
We realize that Metrolink’s core commuter rail services provide an essential component of the complex, productive and satisfying work life of many customers. We also serve a growing number of customers that use Metrolink to connect their community to activity centers, friends and family across the vast Southern California region. Our future is dependent on attracting new customers and providing service worthy of customer loyalty. To flourish, Metrolink strives to lead the commuter rail industry with innovative programs that:
• Continuously improve the safety and security of Metrolink’s services by incorporating technically superior safety features on our equipment, on our routes and at our facilities
• Ensure clean, comfortable and reliable equipment is available for every Metrolink trip
• Grow service, improve access, and attract new riders with added frequency, new stations and line extensions
• Preserve the core asset of the SCRRA: the railroad right-of-way, by funding and performing life-cycle maintenance of the infrastructure to keep it in a state of good repair and high reliability
• Preserve, control and limit use of the right-of-way to those public purposes that do not compromise present or future rail transportation utility
• Operate efficiently with a minimally-sized staff to manage private contractors that must periodically compete to provide Metrolink services
• Leverage public resources by integrating Metrolink train service with our partners’ services in a shared responsibility for the customer’s entire multi-modal trip
• Support continued growth of employer subsidies by providing responsive services • Strengthen Metrolink’s brand value by improving customer communications,
integrating fare policies with our mobility partners and implementing programs to improve equity and add value for loyal Metrolink riders
• Improve environmental benefits with clean diesel technology, an expanding ridership, and policies that support the development of livable communities with “best of class” commute services
• Recruit, train and motivate staff and contractors of the highest personal and professional integrity who dedicate themselves to anticipating and delivering what is required to satisfy our customers, achieving managerial effectiveness, and
2.6

SCRRA Strategic Assessment, 1-26-07
efficiently utilizing scarce resources by applying creativity, reasoned judgment and strategic vision
• Create a workplace permeated by mutual trust and a candid exchange of views to allow us to leverage experience and wisdom, to learn from our mistakes, hold each employee and contractor responsible and accountable, reward excellent performance, and support continuous employee development.
2.6 The SCRRA Budget The SCRRA Budget has two components: the Operating Budget and the Capital Budget. The Operating Budget details both operating revenues (such as fare revenue, maintenance-of-way (MOW) revenue, member agency contributions, etc.) and operating expenses. The Operating Budget consists of Operations and Maintenance-of-Way:
• The Operations portion of the Operating Budget includes expenses required to
operate the Metrolink system including train operations, maintenance of equipment, fuel, security, utilities, transfer payments to other transit operators, revenue collection, payments to freight railroads for dispatching, station maintenance, marketing and communications, passenger services, general and administrative expenses, professional services, and insurance.
• The Maintenance-of-Way portion of the Operating Budget includes ordinary maintenance of the rights-of-way owned by SCRRA member agencies. It involves routine inspection and repair of track, signals, and structures.
The Capital Budget is comprised of the following two major components:
• Rehabilitation and Renovation projects – These are projects that extend the useful life of existing capital assets through activities such as the replacement of worn ties and rail, replacement of outdated signal system components, rehabilitation of tunnels and bridges, and the programmed replacement and rehabilitation of the following rolling stock components: car door operators; wheel trucks; heating/ventilation/air conditioning (HVAC); traction motors; and head end power engines.
• New Capital projects – These are capital projects that expand the system such as sidings, double or triple main track, installation of new signal system components, new rolling stock, and passenger information systems.
2.7 SCRRA Operating Formulae Under the terms of the JPA governing the actions of the SCRRA, each Member Agency must approve its individual Operating and Capital contributions prior to the beginning of the fiscal year (July 1). As a result of its structure as a JPA, the SCRRA utilizes a number of formulae for the purposes of allocating costs to its member agencies.
2.7

SCRRA Strategic Assessment, 1-26-07
Through the process of the Strategic Assessment, a new set of cost allocation formulae was approved for the Operating Budget. It is expected that the new allocation plan will apply beginning FY 2007-08 and beyond.
2.8

SCRRA Strategic Assessment, 1-26-07
2.8 Strengths, Weaknesses, Opportunities, Threats, and Unknown Outcomes In an effort to improve the SCRRA by building on our strengths and opportunities and addressing weaknesses and threats, SCRRA senior staff reviewed an extensive list of strengths, weaknesses, opportunities, threats and unknown outcomes (SWOTU) for SCRRA through 2010 and selected the following key driving factors in each area: 1. Strengths
Safe operations compared to personal auto Comfort, convenience, customer choice on how to use commute time High customer loyalty by highly discretionary riders Respected expertise of staff Uniqueness of product (long trips, commuter dominant)
2. Weaknesses Frequency of service, limited weekend and late night service Lack of integrated technology systems and instability/obsolescence of some (TVM, Oracle/Maximus, Radio system, electronic signage, Universal Customer Care Data Base) Member Agency funding limitations Availability of parking / transit access / rolling stock Weak brand value / confusion with Metro
3. Opportunities Improve communication of delays and other passenger information Improve business practices leading to security of state/federal funding streams Improve safety through Sealed Corridors and Crash Energy Management technology Excessive fuel price increases attract new riders
4. Threats Increasing costs of fuel, insurance and other key drivers outpacing current revenue streams Additional incidents and their operational / financial and image impacts Differences in funding capacity and member agency priorities lead to pressures on Metrolink as a regional rail system Key staff retirements / knowledge transfer
5. Unknown Outcomes Unfunded mandates (Homeland Security, Air Quality, Environmental Justice) Changes in future contractual relationships with freight railroads (e.g. liability, cost of access, capital improvement requirements, railroad share) State and federal interest in restructuring Amtrak and Intercity passenger rail services and State interest in a regional rail system Outcome of audit findings (previous, current and future)
2.9

SCRRA Strategic Assessment, 1-26-07
2.9 Constraints on System Growth In FY 2006-07 SCRRA has funding to rehabilitate 11 locomotives and the agency awarded a contract for up to 107 rail cars in April 2006. Metrolink is currently operating all the available equipment. In April 2006, 13 trains were operating at peak load factors over 90%, and of these 5 were operating at peak load factors over 100%. SCRRA is leasing 12 cars and one locomotive from Sound Transit. In January 2006, four additional cars were leased from Altamont Commute Express. Two of these cars are to be used to relieve overcrowded trains and the other two will allow SCRRA to continue with the rolling stock rehabilitation program, which has been temporarily interrupted due to the growing demand for equipment in revenue service. The first of the new cars will not be available for operations until 2009 at the earliest, limiting the opportunity to expand service. In addition to equipment constraints, parking capacity at stations also limits SCRRA’s ability to increase service and ridership. SCRRA does not own the stations. The local jurisdictions, the Riverside County Transportation Commission in Riverside County or Caltrans own the stations. This Strategic Assessment highlights demand for parking expansion, which will be the responsibility of either the local jurisdictions or the SCRRA member agencies. Metrolink operates over 213 miles of single track (55% of the route miles), 150 miles of double track (39% of the route miles), 25 miles of triple or quadruple track (6% of the route miles), and the system has 41 miles of siding or passing track (11% of the route miles). Significant capital improvements, including sidings and double or triple track, will be required to add more service. Significant funding will be required for these improvements. This will require coordination of priorities among the member agencies. In the early 1990s, SCRRA’s member agencies invested over $705 million to purchase the rail rights-of-way for commuter rail service. The Strategic Assessment outlines capital improvements in the rail rights-of-way through 2030. SCRRA will need to be vigilant throughout that period to protect the rights-of-way from encroachment and allow for only interim use until the right-of-way is needed for planned projects. Metrolink operates over right-of-way (ROW) owned by the freight railroads. The Orange County, Ventura County, Riverside, IEOC and 91 Lines all operate over freight railroads, and securing agreement with either Burlington Northern and Santa Fe Railway Company (BNSF) or Union Pacific Railroad (UP) to increase service operating over their ROW and coming to agreement on what capital improvements might be required will be a significant challenge.
2.10

SCRRA Strategic Assessment, 1-26-07
3.0 Metrolink System Safety Program Safety is the primary concern of the SCRRA. It is a central element in planning and service delivery. It is integrated into daily operations, as well as SCRRA’s planning activities. For purposes of this Strategic Assessment, an overview of three important safety programs is provided. This chapter addresses the Metrolink System Safety Planning process, the Sealed Corridor program and emerging opportunities to enhance the safety of rail vehicles through Crash Energy Management designs. 3.1 System Safety Program Plan SCRRA has developed the System Safety Program Plan (SSPP) as a means of integrating safety into all facets of service and capital planning and daily operations. Through the use of the procedures contained in the SSPP, SCRRA achieves an optimal level of safety. The SSPP establishes mechanisms for identifying and addressing hazards associated with the Metrolink commuter rail system. It also produces a means of ensuring that proposed modifications are implemented with thorough evaluation of their potential effect on safety. System safety is the application of technical and managerial skills to promote systematic, forward-looking identification and control of hazards throughout a system. It involves examining all elements of the system to identify components with “accident potential.” The basic premise behind system safety is that fixing hazards before they become problems saves more lives and money. System safety principles were developed in the military aviation industry, which follows a strict process that includes a classification matrix known as Military Specification 882(D). In its process, the military classifies hazards into risk categories, performs a statistical analysis of the likelihood of particular problems occurring, and then determines the best resolution for each hazard. The system safety methodologies used in other types of systems vary widely. In the commuter rail industry, a systems approach to safety is a relatively new program. With the aid of the American Public Transportation Association (APTA), and the participation of the Federal Railroad Administration (FRA), the industry continues to develop a body of information and methodologies to meet its demands. The approach to developing SCRRA’s system safety program includes:
• Identifying what we already do effectively; • Showing how our current practices already combine to form the elements of a
system safety program by examining them against hazard identification standards to see how well they contribute to proactive prevention;
• Examining our existing safety procedures for opportunities for improvement and developing system safety processes for those areas.
3.1

SCRRA Strategic Assessment, 1-26-07
Each operating department has responsibilities under the SSPP and supports its implementation. Departments provide the ongoing support necessary for compliance with the SSPP. SCRRA staff and contractor employees have responsibilities under the SSPP, and supervisors and contract managers must enforce the safety requirements pertaining to their employees and/or contractor employees. A key to success of the SSPP is for employees and contractors to be aware that they are accountable for meeting the safety requirements of the SSPP. Beyond this, however, success depends on all employees and contractors actively identifying potential hazards and taking into consideration the safety of all. Day to day guidance for the implementation of the SSPP is provided by a set of 17 Standard Operating Procedures, which are updated continuously as the need arises, and are available to all employees in printed and electronic versions on the SCRRA Intranet. 3.2 Sealed Corridor Concept There are 441 at-grade rail-highway crossings in the 388 route-miles covered by the Metrolink system and shared with freight railroads. At some crossings, total passenger and freight train volume approaches 120 times per day. Systemwide, there are currently approximately 20,300 weekday passages (one train at one highway-rail grade crossing) of trains over highway-rail grade crossings in the Metrolink system. There are 346 grade-separated crossings in the Metrolink system. Although the ideal system would be totally grade separated, at a cost ranging from $15-80 million per crossing separation project, there is insufficient regional, state, federal and private funding to accomplish this vision by 2030. Very few of the SCRRA grade crossings have received funding for grade separation, and these crossings have not received high priority on the California Public Utilities Commission (CPUC) grade separation priority list, since no distinction is made based upon the type of train volumes (passenger versus freight) and the priority grade separations are on the high volume freight railroad routes. Although SCRRA benefits from operating over grade separations built on freight lines, there is simply not enough funding to grade separate the entire system. Over the last 14 years, SCRRA, as have the freight railroads, has been incrementally improving the Metrolink commuter rail system in order to ensure quality, safe, and efficient services into the next century. One important aspect of ensuring a safe, efficient and reliable commuter rail service has been to develop good working relationships with local agencies to enhance the safety at existing rail-highway grade crossings. Since the early 1990s, SCRRA staff has worked closely with local agencies and the CPUC to greatly improve the safety of the numerous crossings on the Metrolink system. Some of these safety enhancements include installation of an upgraded railroad signal system, enhanced control circuits, installation of raised median islands, improved signage and striping in the vicinity of the rail crossings, improved traffic engineering, and improved roadway geometry approaching the existing crossings. In addition, seven public and 22 private crossings have been closed, three public and two private crossings have been replaced with grade separations, and seven new grade separated highway crossings have
3.2

SCRRA Strategic Assessment, 1-26-07
been built since the start up of Metrolink service. Figure 3.1 shows how grade crossing incidents per million train miles have decreased from FY 1995-96 through FY 2004-05.
Figure 3:1 Metrolink Grade Crossing Incidents per Million Train Miles
13.79
11.64
8.68
6.38
7.54
6.43
7.27
6.50 6.44
4.98
0.00
2.00
4.00
6.00
8.00
10.00
12.00
14.00
16.00
95/96 96/97 97/98 98/99 99/00 00/01 01/02 02/03 03/04 04/05
Source: SCRRA Safety Department Restricting access to the railroad tracks and property is one way to help avoid future collisions from occurring and is commonly known as crash avoidance. Since its inception, Metrolink has pursued an aggressive rail crossing and trespasser safety improvement program that has invested millions of dollars for installation of improved signal systems and gate arm mechanisms, additional flashing lights with new Light Emitting Diode (LED) technology, pavement markings, signage, median separators, grade separated crossings, crossing closures, right-of-way fencing and right-of-way access gates along the commuter rail system. This program will continue and go beyond previous safety efforts by implementing the techniques of the sealed corridor concept. Metrolink and its member agencies have continuously implemented grade crossing improvements, crossing closures, and aggressive education programs since 1991, and all crossings meet or exceed state and federal regulatory requirements. However, there has never been sufficient funding for a coordinated corridor-wide approach to improve
3.3

SCRRA Strategic Assessment, 1-26-07
crossings within a continuous segment of tracks. A sealed corridor program will build upon the success demonstrated in North Carolina and complement the 14 years of safety enhancements funded by SCRRA and its member agencies, Amtrak, the State of California, and the Federal Transit Administration. The North Carolina Department of Transportation worked closely with communities and the railroads to undertake comprehensive traffic separation studies, designed to close redundant or unsafe crossings, and to improve the remaining crossings with all of the technological tools available. These tools include four quadrant gates, median separators, photo enforcement, improved signage, and improved crossing geometry. The North Carolina approach involved significant outreach to community leaders and affected stakeholders, working together to devise the best alternatives at the community (sub-corridor) level. The effectiveness of each strategy was evaluated and documented so that a menu of options could be considered. The SCRRA Sealed Corridor analysis and outreach will also be made at the sub-corridor level due to a similar need for close collaboration among stakeholders. This holistic approach provides an opportunity for better planning than typical single crossing analyses allow. Also, the level of investment required for comprehensive improvements at the corridor or sub-corridor level dictates involvement of policy, technical, and community leaders at the highest level.
Phase I of the program has begun with the Los Angeles to Sylmar (26.5 miles) segment on the Antelope Valley line and the Los Angeles to Chatsworth (32 miles) segment on the Ventura County line. Subsequent phases will address the San Bernardino Line and the Perris Valley Line. OCTA has initiated a $20 million grade crossing safety enhancement program for 55 grade crossings in Orange County and is working with the cities and Metrolink to define the safety enhancement scope of work.
The two corridors in Phase I will be treated as one sealed corridor program, with treatments at individual crossings considered subcomponents of the sealed corridor. Devices to be installed for particular crossings will be based upon intersection geometries, road width, traffic volume, and other local conditions evaluated on a crossing-by-crossing basis. The sealed corridor concept uses a combination of several types of physical or technological improvements at the highway-rail grade crossings to enhance safety. Among these are:
• Four-quadrant gates • Extended gate arms • Median separators or raised islands • New signs and pavement markings • Crossing signal “health monitoring” systems • Locked gates and other barriers to limit access to the right-of-way • Crossing consolidation or permanent closures • Traffic signal improvements to enhance vehicle movements during preemption • Pre-signals to stop vehicles ahead of the grade crossing • Fencing of right-of-way to deter trespassing
3.4

SCRRA Strategic Assessment, 1-26-07
• Grade Separation All of the crossings in the study area will be evaluated for at least the following criteria:
• Crossing Inventory – All crossings will be inventoried using the United States Department of Transportation (U.S. DOT) approved Crossing Inventory Form (Form FRAF 6180.71) for the highway-rail grade crossings.
• Accident History – All crossings will be inventoried using FRA’s database for accident inventory for the entire country.
• Vehicle Traffic – Existing and projected traffic volume will be obtained from local agencies.
• Train Traffic – Existing and projected train traffic. • Truck traffic – Volume of truck traffic and designated truck reroutes. • Sight obstructions • Hump in crossings • Queue Distance • Roadway classifications • Adjacent land use • School bus route • Emergency response route • Feasibility of grade separation or closure • Roadway improvements
Upgrades will address safety elements for motorists, pedestrians and bicyclists and methods of restricting access to the rail rights-of-way. 3.3 Grade Separations
Although SCRRA supports all grade separations, funding is very limited. Local jurisdictions have the primary responsibility for grade separations. The CPUC has established an FY 2006-07 prioritized list for funding grade separations as provided in Appendix A.2. This list of 71 crossings statewide has 24 crossings over which Metrolink operates. The cost to grade separate all of the crossings would be about $1 billion. The State of California funds only $15 million each year statewide towards new grade separations with up to $5 million per project.
3.4 Crash Energy Management SCRRA has consistently been on the leading edge of passenger rail safety. We have participated for several years as an active member of the American Public Transportation Association’s Passenger Rail Equipment Safety Standards (PRESS) Task Force. Two of this task force’s goals are to develop and maintain practices and standards for passenger rail equipment; and to foster cooperation through all commuter railroads in the
3.5
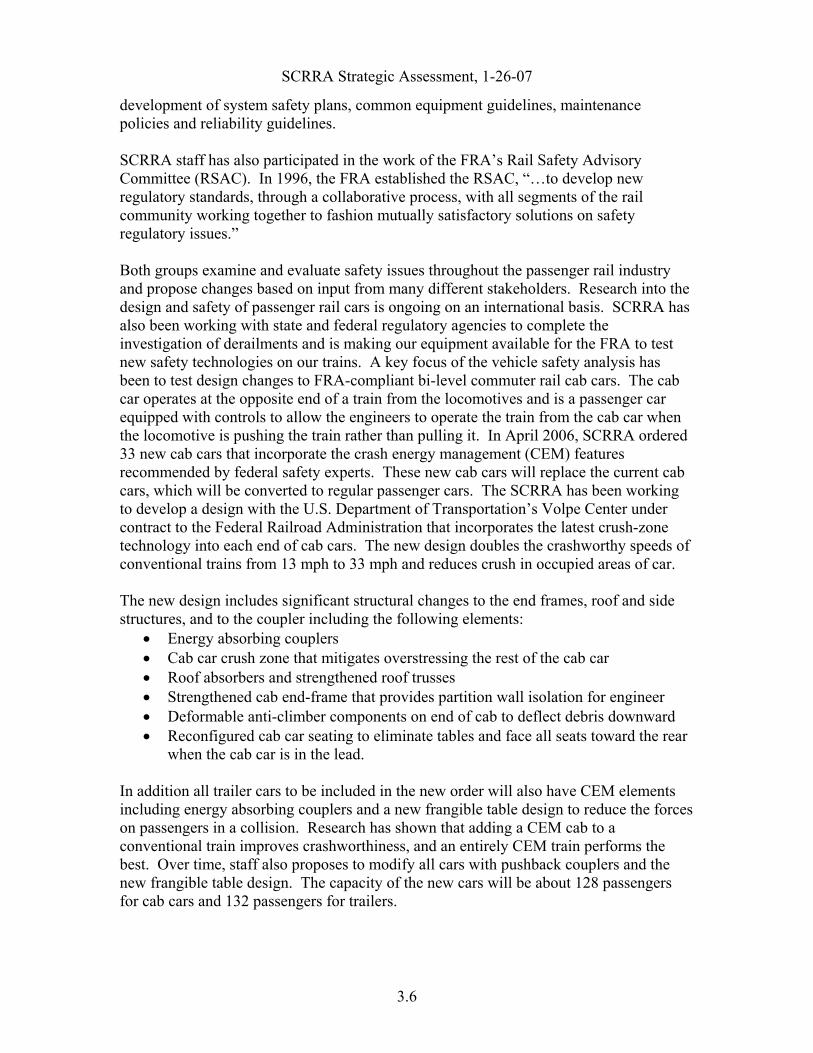
SCRRA Strategic Assessment, 1-26-07
development of system safety plans, common equipment guidelines, maintenance policies and reliability guidelines. SCRRA staff has also participated in the work of the FRA’s Rail Safety Advisory Committee (RSAC). In 1996, the FRA established the RSAC, “…to develop new regulatory standards, through a collaborative process, with all segments of the rail community working together to fashion mutually satisfactory solutions on safety regulatory issues.” Both groups examine and evaluate safety issues throughout the passenger rail industry and propose changes based on input from many different stakeholders. Research into the design and safety of passenger rail cars is ongoing on an international basis. SCRRA has also been working with state and federal regulatory agencies to complete the investigation of derailments and is making our equipment available for the FRA to test new safety technologies on our trains. A key focus of the vehicle safety analysis has been to test design changes to FRA-compliant bi-level commuter rail cab cars. The cab car operates at the opposite end of a train from the locomotives and is a passenger car equipped with controls to allow the engineers to operate the train from the cab car when the locomotive is pushing the train rather than pulling it. In April 2006, SCRRA ordered 33 new cab cars that incorporate the crash energy management (CEM) features recommended by federal safety experts. These new cab cars will replace the current cab cars, which will be converted to regular passenger cars. The SCRRA has been working to develop a design with the U.S. Department of Transportation’s Volpe Center under contract to the Federal Railroad Administration that incorporates the latest crush-zone technology into each end of cab cars. The new design doubles the crashworthy speeds of conventional trains from 13 mph to 33 mph and reduces crush in occupied areas of car. The new design includes significant structural changes to the end frames, roof and side structures, and to the coupler including the following elements:
• Energy absorbing couplers • Cab car crush zone that mitigates overstressing the rest of the cab car • Roof absorbers and strengthened roof trusses • Strengthened cab end-frame that provides partition wall isolation for engineer • Deformable anti-climber components on end of cab to deflect debris downward • Reconfigured cab car seating to eliminate tables and face all seats toward the rear
when the cab car is in the lead. In addition all trailer cars to be included in the new order will also have CEM elements including energy absorbing couplers and a new frangible table design to reduce the forces on passengers in a collision. Research has shown that adding a CEM cab to a conventional train improves crashworthiness, and an entirely CEM train performs the best. Over time, staff also proposes to modify all cars with pushback couplers and the new frangible table design. The capacity of the new cars will be about 128 passengers for cab cars and 132 passengers for trailers.
3.6

SCRRA Strategic Assessment, 1-26-07
4.0 Public Communications SCRRA’s public communications efforts encompass multiple delivery channels and are focused on passenger and stakeholder information. Current technology has been used since the beginning of the agency with the addition of some electronic communications technology in the form of a website, e-mail, SMS (text messaging) and downloadable electronic formats. As the Gen Y expectations change over the next 20-30 years, SCRRA will need to increase the availability and immediacy of information to a larger audience that would likely overwhelm current communications technology. With ridership projected to increase 200 – 300% over that period, continued dependence on printed materials will become more and more expensive and cumbersome. The amounts of printed material that will need to be made available on trains or at stations will be significantly greater than currently budgeted or produced. 4.1 Methods for Determining Customer Communications Needs SCRRA is not only a provider of transportation services, it is also a provider of information. The types of information Metrolink provides have to meet the needs of each group of users: regular commuters have different information needs than infrequent riders, and tenured riders require different information than new or potential riders. Also, the preferred content and method of information delivery differ depending on whether the customer needs trip-planning information or information about train delays. External stakeholders such as station city staff, local, state and federal regulators and elected officials require a totally different type of information than customers. SCRRA uses market research to the largest extent feasible to identify customer and stakeholder preferences and to help design a full-service integrated public communications strategy.
4.1.1 Onboard Surveys SCRRA’s biennial Onboard Survey is the primary source of data for determining the importance of customer communications, rider satisfaction with perceived performance, and the effect on rider loyalty. 4.1.2 Rider Panel For over five years, SCRRA has been maintaining a customer panel composed of Metrolink riders proportionally representative of total ridership (“The Metrolink Rider Poll”). Through periodic surveys, SCRRA tests messages/initiatives and tracks the level of satisfaction with customer communications and conducts in depth studies of communications issues. 4.1.3 Focus Groups SCRRA periodically conducts focus group studies with riders and non-riders to explore various aspects of customer communications, including timetable design, station signage, and marketing pamphlets. 4.1.4 Customer Comments Every month, SCRRA records hundreds of calls and e-mails with questions, complaints, and comments from both riders and the general
4.1

SCRRA Strategic Assessment, 1-26-07
public. This information is analyzed to obtain additional insight in customer communications needs. 4.1.5 Industry-wide Research Studies There are numerous transportation research studies and reports dealing with communications that are being released each year. SCRRA utilizes the findings of these studies, and actively participates at the committee level of the Transportation Research Board and in project oversight panels of the Transit Cooperative Research Program. 4.1.6 Stakeholder Communications SCRRA uses a number of vehicles to communicate with stakeholders. A monthly newsletter distributed onboard all trains reaches passengers on a monthly basis. This four to six-page publication is the agency's main method to communicate with riders. Intermittently, flyers placed on the seats of trains are used to communicate with passengers as well. E-mail communications are used to reach external stakeholders such as station city staff, local, state and federal regulators and elected officials. In areas where the agency has construction or maintenance activity, flyers are distributed door-to-door to affected residents and businesses. The agency website also serves as an important communications tool for all stakeholders as it can reach them with information made available almost in real time. Stakeholders in the print and electronic media also receive specific media releases and advisories on an as-needed basis informing them of agency press events.
4.2 Preferences and Expectations for Transit Information In 2005, SCRRA received approximately 300,000 customer communications per month. They include requests for information, complaints, commendations, and calls for “lost and found.” As the number of customers continues to increase with each year, so do customer expectations for fast and accurate information. And as the public’s reliance on the Internet has matured, electronic communications have greatly increased the volume of communications and the expectation of immediate personalized responses from SCRRA.
4.2.1 Printed Materials SCRRA currently provides passengers with a variety of printed materials to inform them of various aspects of commuter train service:
• Printed timetables – These timetables are printed on a line-by-line basis, with schedules for one, two or three lines in the same brochure. A systemwide timetable booklet (known as the “Metrolink mini-t”) is also printed in a pocket size for ease of storage. Large format versions of the printed schedule grids are also available on request for vision-impaired users. Printed timetables are delivered by regular mail and bulk shipping, and are made available at stations and onboard trains in display racks. Approximately 800,000 individual line timetables are printed twice a year, and over 100,000 mini t’s providing schedules of all Metrolink lines are printed annually.
• How to Ride Guide – This large booklet provides the reader with basic information on how to navigate the Metrolink system. Sections on tickets,
4.2

SCRRA Strategic Assessment, 1-26-07
fares, safety, rider benefits and other areas especially benefit new riders. How to Ride Guides are distributed mainly by mail or bulk shipping. A downloadable version is also available on the metrolinktrains.com website. Approximately 35,000 are printed at least once a year.
• System Map – The Metrolink system map shows the Metrolink routes and stations overlaid on a map of Southern California showing major highways and county borders. Also included are shared Amtrak stations and Metro rail services (Blue, Red, Green and Gold Lines). It also includes listings and locations of each station on each route on the back. System maps are distributed by mail or bulk shipping. A version also appears in an interactive format on the metrolinktrains.com website home page. 50,000 are printed at least once per year.
• Metrolink Matters – This monthly onboard newsletter is the primary communication medium for reaching passengers. The publication is four or six pages long, and is published 11 times a year (December and January issues are combined) in full color. Distribution is onboard all trains in display racks with mailings of a limited number upon request. A copy of each issue is also posted on the metrolinktrains.com website. 28,000 copies of each issue are printed.
• Seat drops – The distribution of flyers on the seats of trains is an important tool for reaching riders. The one or two-sided flyers are used to communicate information of a more urgent nature or information that cannot wait until the publication of the next Metrolink Matters monthly newsletter. Seat drops are distributed on the trains as well as e-mailed to certain stakeholders and posted on the metrolinktrains.com website. Seat drop print runs vary depending on distribution. For a systemwide seat drop, approximately 13,000 copies are printed.
4.2.2 Call Center Metrolink’s call center (1-800-371-LINK) is an important source of information for many Metrolink riders. It is of particular importance for new riders and certain ethnic groups.
With ridership numbers increasing, Metrolink’s call center is also fielding a growing number of operator-assisted calls. Caller wait times are the most frequently cited problem, which is also reflected in call abandonment rates. Metrolink carefully monitors these indicators and adjusts staffing accordingly. But as not all calls require operator assistance, intelligent voice response (IVR) systems have become an important tool to reduce wait times and to more effectively serve a growing number of callers. Each month, the call center receives about 110,000 calls. Roughly 30,000 of these callers request operator assistance, and about 80,000 choose the automated IVR system. Even during the launch of the IVR system, almost 80% of users were comfortable using IVR and indicated that they would use it again (Rider Poll, 2005). 4.2.3 Website The Metrolink website has rapidly become the most popular source for Metrolink information. The site provides a complete spectrum of information from train schedules to board agendas.
4.3

SCRRA Strategic Assessment, 1-26-07
Almost 70% of Metrolink riders have used Metrolink’s website (metrolinktrains.com) to obtain information; one in four riders visits the website at least once per month. According to the 2005 Metrolink Onboard Survey, it is one of the most important communications channels for Metrolink information. Today, the website accounts for three out of four customers who contact Metrolink with comments or requests for information. It reflects the success of the self-service business model for information providers.
Figure 4.1: Metrolink Customer Information Channels
Website73%
IVR16%
Operator Assisted Calls
11%
The Metrolink website not only represents a cost-effective communications channel, it is also one that is accessible on demand, 24 hours a day, seven days a week. It provides timely information, and has the potential for personalized and highly relevant content. Metrolink customers, who are among the most technologically inclined consumers, measure functionality and convenience of the Metrolink website against those of other industry leaders. Already, the website is among the top 10 service aspects that generate customers comments. In 2005, Metrolink received more customer comments in response to the website than comments about any of train crowding, equipment, fares, or stations. This communications volume illustrates that the website is emerging as a critical communications channel and represents an important service offered by Metrolink. To meet rising customer expectations, performance measures will help ensure consistent quality of service, similar to those that exist for the call center. The majority of visitors to Metrolink’s website look for schedule information. Together with maps and fare information, schedules are the most fundamental contents for transit websites, followed by trip planners as the second most important element.3 Since both transit and non-transit users routinely rely on websites for driving directions and airline itinerary builders, they increasingly expect the same capabilities at transit websites. Dynamic on-line mapping applications are particularly popular and difficult to implement. SCRRA provides links to Metro’s Trip Planning system
3 TCRP Synthesis 43: Effective Use of Transit Websites, Transportation Research Board, 2002
4.4

SCRRA Strategic Assessment, 1-26-07
and OCTA’s Trip Planner. Opportunities for public-private partnerships may exist in the near future with Google and Yahoo to provide intermodal mapping and point-to-point trip planning services.4 Such collaborations can bring transit information to an even wider audience. Metrolink riders tend to be choice riders as on the whole, they are not transit dependent. The Transportation Research Board also cites evidence that innovations in providing transit information are most appealing to choice riders.5 It suggests that the integration of real-time commuter rail information with freeway traffic reports, either on radio, TV, or Internet holds the promise of attracting non-transit riders.6
Another major feature of web-based information platforms is the ability for active and passive distribution of information. Alerts and service updates can be posted on the website, but they can also be “pushed” out to subscribers as soon as they become available. There is significant interest among Metrolink riders in subscribing to e-mail and SMS updates.7 Personalized interactive web pages (MyMetrolink.com) will allow users to select information content and services tailored to their specific needs. Such web pages represent an example of CRM (Customer Relationship Management). Electronic versions of the printed schedule grids can also be viewed and downloaded in html or pdf format from the Metrolink website, and can be sent by e-mail. In addition, downloadable versions in Windows Pocket PC and Palm handheld versions are available for viewing on the user’s Personal Digital Assistant (PDA). Metrolink riders make more than 85,000 visits per month to the website for schedule-related information. In an average month during 2005, they downloaded 8,500 printable schedules and 3,200 schedules for their Palm and Windows based PDAs. In addition, the Schedules Download Tutorial site was visited an average of 5,800 times per month. Every few years, Metrolink conducts an upgrade of its website in an effort to meet changing customer expectations. Growing numbers of riders express an interest in purchasing their fares on-line. Implementation of on-line ticket sales and other E-commerce applications represent the next step in Customer Relationship Management and enabling individualized marketing offers.
4.2.4 Station Signage a) Static Signage Informative – Each station is currently equipped with one or more fixed, station-specific information display cases that feature information signs. The display cases are freestanding or wall mounted and each case contains basic information geared to the new user as well as specific information about tickets, fares, station location, station owner contact information, connecting transit and hours and days of train service. In addition, a station-specific schedule sign is provided that shows all train
Both Google and Yahoo have identified transit applications as part of their long-term business strategy. For an example see: http://www.google.com/transit
5 TCRP Synthesis 92: Strategies for Improved Traveler Information, Transportation Research Board, 2003 6 http://www.smartraveler.com/scripts/phltrans2.asp?index=36&city=phl 7 Metrolink Rider Panel, 2004, 2005.
4.5

SCRRA Strategic Assessment, 1-26-07
departure times from that station including platform boarding number. Directional/identification – This signage is used at each station to provide directional instructions to passengers (platform location) and to identify the station. Signs are located at the station entrance as well as near the platforms. Platform identification signage is on the platforms and is complemented by fixed signage listing the platform assignment for each train. Pathfinder signs are installed just before freeway exits and on approach routes in the vicinity of Metrolink stations to help passengers find the station.
b) Dynamic Signage Real time information is an attractive feature for websites, but it is an absolute necessity for riders at a Metrolink station. Electronic changeable message signs are located on the platforms of 40 of the 54 stations. These provide limited real-time information on the status of train service. Changeable message sign content is managed by staff at the Metrolink Operations Center. Eighty-two percent of Metrolink riders rely on the electronic message signs at the station. The signs are of particular importance for new riders.8 Research shows that real-time information makes wait times more acceptable and allows actual service to be perceived as more reliable.9 Of course, the availability of such real-time information is most critical in the event of delays and service disruptions. Thus, it will address the primary source of rider dissatisfaction. Metrolink riders frequently identify communication of delays as one of the most important service aspects. Unfortunately, research shows that communication of delays has the largest gap between what customers expect and how Metrolink performs. Importance of delay information is not unique to Metrolink customers. A report by the Transportation Research Board mentions that public transit users are no different from air travelers in their need for timely and honest delay information:
Passengers can understand such things as weather-related problems, equipment problems, traffic-control problems, and even crew scheduling problems. To varying degrees, they may be somewhat tolerant of these situations. However, they find it much harder to understand and forgive information deficiencies in these circumstances.10
Early in 2006 Metrolink decided to implement an internet-based passenger information system, which allows the delivery of real-time information with the greatest degree of compatibility to various end user devices, such as dynamic message signs, kiosks, the Internet, and personal electronic devices. The use of XML coding language will allow text-to-voice conversion for vision-impaired riders.
8 Metrolink Rider Panel, 2002 9 TCRP Synthesis 92: Strategies for Improved Traveler Information, Transportation Research Board, 2003 10 Ibid.
4.6

SCRRA Strategic Assessment, 1-26-07
4.2.5 In-vehicle information Rail riders rate information they are receiving while traveling more highly than pre-trip information.11 This includes information about the next station, delays, and transfer connections. Generally, Metrolink conductors are the only source of this type of information. In the future, greater use of electronic information will allow dissemination of real time travel information directly to riders and staff through the customers’ wireless communication devices.
4.2.6 Media Relations SCRRA’s media relations staff provide information to print and electronic media with press releases distributed by email or through postings on the Metrolink website. The balance of media communications takes place in person or by phone. A subcategory of media relations is incident-related or crisis communications. The majority of this type of communications takes place in person or by phone, with an electronic component using text messaging and the Metrolink website.
4.3 Short Term Communications Outlook (2006-2015) With ridership projected to increase over 80% during this period, a much larger passenger audience will need to be served. New technologies not currently in use by SCRRA will need to be implemented in order to streamline the flow and availability of information to customers and stakeholders. It is anticipated that SCRRA will be able to further leverage the technological sophistication of its rider pool to implement more customized communications solutions for reaching its audience. In addition, the integration of a marketing customer relationship management program combined with emerging technologies allowing implementation of finely targeted marketing and retention programs (down to specific individuals) will require greater coordination between the customer database and information distribution databases. All of these technologies also can be used to enhance the distribution of information to outside stakeholders including the media. The following communications technologies will need to be developed and implemented:
• RSS feeds – “Really Simple Syndication” (RSS) allowing Internet users to subscribe to web pages, websites or blogs. This is a “pull” technology where the user pulls the specific information they want rather than the information provider “pushing” it to them.
• Push technology – Users subscribe to frequent updates, e-newsletters, special offers and promotions, etc. by submitting their desired reception channel (web- enabled PDA, web/SMS [text message enabled cellular phone]), e-mail address and selecting the information they would like to receive. Information could be fully customized and could include everything from reminders to purchase a monthly pass to real-time updates on train status.
• Website personalization – Users would register and customize their website experience. Only information relevant to them would appear on their home page.
11 Ibid.
4.7

SCRRA Strategic Assessment, 1-26-07
For example, only fare and schedule information for their usual station pair may appear.
• Station signage – The Electronic Passenger Information Signage (EPIS) project is designed to integrate several information sources, including train location information from the GeoFocus system described below, and present them to several channels at once. In 2005 it was determined that SCRRA’s existing communication network – the Advanced Train Control System (ATCS) – does not have sufficient capacity to carry both GPS (real-time location information) and signal data at the same time. On 11/8/05, it was recommended that a VHS and fiber optic system be installed. Until that system is installed, work is progressing on the EPIS software, which will be able to provide exception-based traveler information based on the information available from Metrolink’s train dispatching system via the Internet to station signage, e-mail, cell phones, etc. The EPIS project, already in the development stages in 2006, would be most visible to passengers in the form of Liquid Crystal Display (LCD) flat screens at stations with real-time information on train status. The project uses arrival/departure signs at airports as the conceptual model. The same information would be presented on the Metrolink website, and could be pushed to other subscribers using the electronic channel of their choice. In addition, a transition from only providing end point information (at stations) to providing transit information in route as well as in the early pre-trip stage is underway. EPIS is capable of providing real-time trip information to passengers en route using personal electronic devices or on-board electronic signage.
• GeoFocus – In 2000, SCRRA awarded a contract to GeoFocus to develop a Global Positioning System (GPS) system designed to provide real-time information to passengers regarding the estimated time of arrival (ETA) of trains scheduled to arrive at Metrolink stations. The server has been installed and software has been loaded. The locomotive radios have been certified Federal Communications Commission (FCC) compliant, and radio compliance testing continues annually. A solution to the graphics software problem related to the train identification process was achieved in June 2004. Keypads were installed in all locomotives during July 2004, in order to implement the solution on all trains. SCRRA’s existing communication network – the Advanced Train Control System (ATCS) – does not have sufficient capacity to convey GPS real-time location information; other options to perform this function are under investigation.
• Timetables – While complete independence from printed materials is unlikely at this stage, a significant reduction in the numbers of timetables printed and distributed is very possible. Enhancements to the website and customization of the user experience can include providing a personalized timetable for any station pair that could be printed out or downloaded to a PDA or cell phone.
• Call Center - Although call centers represent one of the most traditional elements of customer service, they remain an essential part of business. They will maintain their primary role for a large segment of the new and potential rider market. However, the growing need to control costs will force SCRRA to rely increasingly on automation. Rising public expectations for dynamic and on-
4.8

SCRRA Strategic Assessment, 1-26-07
demand customer information will call for the combination of call center and web-presence into integrated CRM.12
• On-Line Ticket Purchasing – This would be possible using the movie ticketing model. Customers would use a credit/debit card to order their ticket and then use the ticket vending machine (TVM) at their station as a “will call” device to receive the ticket previously ordered simply by inserting the same credit/debit card into the TVM.
12 There has been no evidence that upgrades to the functionality of transit websites have reduced call volumes at the agencies’ call centers. However, some call centers reported a change in the nature of calls, reduced wait times, and fewer dropped calls (TCRP Report 84, Transportation Research Board, 2004).
4.9

SCRRA Strategic Assessment, 1-26-07
5.0 Demographic Ridership Profiles And Outlook
The outlook for Metrolink ridership trends is directly influenced by changes in regional demographic and economic trends. Projections indicate that Metrolink will continue to enjoy a growing demand for long distance commute trips. But Metrolink’s continuing success in coming decades will also depend on its ability to adapt to new travel demand patterns due to changes in the spatial distribution of residential and economic activity and to changes in customer expectations, as Metrolink’s current core ridership segment, Baby Boomers13, are being replaced by younger generations of riders. 5.1 Generational Ridership Segments As a commuter railroad, Metrolink primarily serves the regular weekday work commute market: almost 90% of trips taken on Metrolink are work-related. It is also reflected in the age distribution of Metrolink ridership: 82% of Metrolink’s riders are commuters between the ages of 30 and 64. As many as half of all Metrolink commuters are over the age of 45, which is shown below with data from the 2004 Metrolink Onboard Survey (Figure 5.1). This ridership composition makes Baby Boomers (1946-1964) the largest ridership segment: over half of all Metrolink riders (53%) belong to this generational segment, compared to just 28% of the general population.
Figure 5.1 Metrolink Ridership Generational Segments
Metrolink Ridership Age Pyramid
0.0%
0.5%
1.0%
1.5%
2.0%
2.5%
3.0%
3.5%
7 11 14 17 20 23 26 29 32 35 38 41 44 47 50 53 56 59 62 65 68 71 74 77 80 83 86 90 100
Age (2004)
Swing Generation
GI Generation
Baby Boomers
Generation X
Generation Y
Source: Metrolink 2004
13 The terminology used in this report to describe age segments is widely used in social sciences and demographics. Smith and Clurman of Yankelovich Partners, Inc (Rocking the Ages: The Yankelovich Report on Generational Marketing, 1998) are the researchers most closely associated with profiling the generational segments based on unique traits and lifestyle characteristics.
5.1

SCRRA Strategic Assessment, 1-26-07
As the Baby Boomer “bubble” moves towards retirement the average age of Metrolink riders will shift. With retirement trends likely to change due to changes in retirement and medical benefits and the unavailability of younger replacement workers, SCRRA could expect the proportion of riders eligible for senior discounts to grow from 2% of current ridership to more than 5.3% by 2030. Metrolink projects that the proportion of riders 55 years or older will increase by almost 10 percentage points, from 18.4% to 27.7% in 2030. At the same time, the proportion of riders under the age of 35 will decrease from 25.2% to 21.3% in 2030 (Table 5.1).
Table 5.1 Metrolink Ridership Age Projection
Age Composition of Ridership
2,004 2,010 2,020 2,030
< 20 yrs 2.7% 2.4% 2.3% 2.4% 20-34 22.5% 19.7% 19.9% 18.9% 35-44 26.8% 23.2% 20.5% 22.8% 45-54 29.6% 32.7% 30.6% 28.3% 55-64 15.2% 17.8% 21.1% 20.6% 65-69 2.0% 3.1% 4.4% 5.3% 70+ 1.2% 1.3% 1.5% 2.0%
Note: Projections reflect a 3% increase in labor force participation for 65-69 year olds per decade Source: California Department of Finance 2004; Metrolink 2004, Bureau of Labor Statistics 2004
Of particular interest for Metrolink will be the growth in the number of residents between the ages of 30-64 years and the geographic distribution of individuals of this working age in the future years. These two factors will determine the pattern of demand for Metrolink services. To counteract this aging of the Metrolink ridership base, new riders need to be recruited from subsequent generations with significantly different satisfaction factors. The second largest age segment, Generation X (1965-1976), currently accounts for one in four Metrolink riders. Because Gen X riders have not been in the work force as long as Baby Boomers, their household income is lower. Although 62% of Generation X riders are monthly pass riders, Generation Xers have the same car ownership rate as Baby Boomers. Generation X is one of the most diverse ridership segments: almost two in three Generation X riders are Non-Caucasian, with Hispanics representing the largest ethnic group (31%). Gen Y riders, or Echo Boomers (1977-1994),14 currently represent just 12% of Metrolink ridership, but their attitudes and preferences as consumers will shape the nature of Metrolink’s customer base during the decades to come. Over 70% of current Echo 14 Gen Y was originally coined “the thirteenth generation” as represented by those born between 1977 and 1994 (Strauss and Howe: Generations, 1994). Today it is also widely known as Echo Boomers, or the Millennial Generation.
5.2

SCRRA Strategic Assessment, 1-26-07
Boomers among Metrolink’s riders are Non-Caucasian. Of those that are full-time employed, one in four works for a small firm with less than 25 employees, the highest rate of any age group. Whereas Baby Boomers were the driving force behind the region’s suburbanization, Echo Boomers prefer densely populated urban locations, such as the downtown areas of Los Angeles and Fullerton. Because Echo Boomers value their time, they are willing to sacrifice lot size for convenience and choose homes close to work. Recognition of this generational difference is driving the growing interest in transit-oriented developments. The Congress for New Urbanism predicts the demand for housing within walking distance of transit to more than double by 2025. This demand will be driven by Echo Boomers as well as retiring Baby Boomers. 15
Echo Boomers will also have different expectations for commuter rail than their Baby Boomer parents. They expect companies to provide them with custom solutions to meet their demands. Flexible work schedules and telecommuting will be their distinguishing work place characteristic.16 Since Echo Boomers value their time and need to be in control, planning their life around a train schedule will be less acceptable to them. Metrolink will be challenged to help them make their time on the train more aligned with their lifestyle objectives. Customized electronic travel information can help them stay in control. They will expect their needs to be met through the same technology they depend on for multitasking and to stay connected. According to a recent Pew Internet study (Pew Internet and American Life Project, 2005), three quarters of on-line teens use instant messaging. Wireless Internet access and technological developments in mobile communications technologies may help Echo Boomers make their train commute an extension of their personal life. Already, Southern California commuters have some of the longest commutes in the nation. Some writers predict that worsening traffic congestion and demographic changes will lead to a reversal of current trends and resurging demand for higher density urban housing and transit-oriented developments. However, in an interview by Business Week (October 17, 2005) urban planner and author Joel Kotkin said that he believes the exurbs17 are here to stay, no matter how high the energy prices rise. Exurbanites may "get smaller cars," he said. "But they are not going to pack up and move to the city." Instead, the city may move out to them, as “many exurbs are fast moving beyond the inefficient model of bedroom towns and fulfill the original purpose of a more traditional city, with high-quality jobs and cultural amenities.” According to the Business Week article of October 17, 2005, transportation consultant Alan E. Pisarski notes, “a two-decade stretch of extremely low-cost transportation has 15 Center for Transit-Oriented Development: Hidden in Plain Sight: Capturing The Demand For Housing Near Transit, 2004. 16 Descriptions of work and time management characteristics are taken from Zemke, Filipczak, Raines: Generations at Work: Managing the Clash of Veterans, Boomers, Xers, and Nexters. 1999 17 The expression "Exurbs" was coined in the 1950s to describe the ring of prosperous rural communities beyond the suburbs that, due to availability via the new high-speed limited-access highways or commuter rail, were becoming dormitory communities for an urban area.
5.3

SCRRA Strategic Assessment, 1-26-07
conditioned commuters to accept longer drives. For the time being, even extreme commuters who spend a total of four hours each day going back and forth to work will probably try to avoid moving closer to town.” Fifteen percent of Southern California commuters work in a different county than the county they live in. For Metrolink commuters that rate is 60%. Whereas the average Southern California commuter travels 13.3 miles each way to work, the total one-way travel distance between home and work for the average Metrolink commuter is 42.1 miles, with 36 of those miles taken on the train. Metrolink serves its niche travel markets by carrying a disproportionate share of the long distance commute market. This fact illustrates how the creation of Metrolink coincided with the still relatively new phenomenon of extreme commuting, defined as those who commute more than 45 minutes one way. The US Census Bureau defines extreme commuters as someone who spends more than a month of every year driving to work. Since 1990, the number of extreme commuters has nearly doubled. According to USA Today, November 29, 2004, “Surveys long ago established that 45 minutes is the threshold most commuters were willing to drive one way to work. But the number of Americans making commutes longer than 45 minutes each way has grown steadily to more than 19 million, according to the Census. That's one in six commuters, up from one in eight in 1990.” It is expected that the number of these extreme commuters will continue to grow, which translates into future demand for Metrolink. Even recent surges in gasoline prices have not deterred people from driving longer distances to drive to work. Choosing a fuel-efficient car is an easier choice than giving up the affordable dream home. When a family earning the median income in L.A. County or Orange County cannot afford 94% of the areas’ homes and until the job/housing imbalance is resolved, extreme commuting will continue to be a rational choice for young families. Interviewed in Business Week, February 21, 2005, Pisarski said, “For many, the mega-commute is about the ever-broadening search for affordable housing, with more and more people ‘driving until they qualify’ for cheaper houses and better schools.” Contributing to the trend in extreme commuters is the growth in dual-income households. According to a Business Week, February 21, 2005 article, “Fully 70% of households now have more than one worker. It might be possible to live near one person's job. But typically people can't live near both.” Detail on future trends in population, employment, and freeway travel times in the five-county region is provided in Appendix A.3.
5.4

SCRRA Strategic Assessment, 1-26-07
6.0 Growth Elements Controlled by Others
There are several essential elements of the Metrolink system that are controlled by others. These include station access through parking and transit, local plans for station area development, and planned extensions and connections to the Metrolink system. These elements are summarized below and detailed in Appendices A.2, A.3 and A.4 respectively.
6.1 Station Access Although SCRRA does not own or operate parking at the stations, improved station access and parking expansion are essential to continued growth in ridership. This chapter provides a resource to member agencies and local jurisdictions as they explore the options at stations in their community.
Accommodating new riders via parking is a growing challenge to station operators as they face high construction costs and restricted land areas around stations. To explore alternative modes of access and innovative ways to expand parking, a telephone survey of six commuter rail operators in the U.S. was conducted in the summer of 2005. The survey results are included in Appendix A.4.
6.1.1 Metrolink Station Access Local municipalities own and operate all but seven of the 54 stations throughout the Metrolink system. The RCTC owns and operates the five stations in Riverside County, Caltrans owns and operates the Montclair Station, and the Union Pacific Railroad owns the Burbank Bob Hope Airport Station property and the platform at this station is owned and operated by Caltrans. There are 21,955 parking spaces systemwide. As of October 2005, 20 stations operate at greater than 90% of parking capacity on a weekday basis, and an additional seven operate between 80% and 89% of their capacity. This equates to 45% of system stations operating at or just below parking capacity. There are plans to increase parking capacity at 12 stations in the next three or four years, to provide an additional 7,161 spaces (total of 29,116 spaces). Parking is mostly free systemwide with the exception of six stations that offer park-and-ride programs that are typically managed through daily, monthly or annual permitting processes with fees relative to the facility’s operational and maintenance costs. These stations are Baldwin Park, Covina, and Norwalk/Santa Fe Springs in Los Angeles County, Union Station in the City of Los Angeles and San Clemente and San Juan Capistrano in Orange County.
Nearly 70% of passengers access their Metrolink home station by single-occupant vehicle, as reported in the 2004 SCRRA On-Board Rail Survey. Almost 20% of passengers are dropped off and picked up at Metrolink stations by other vehicles. Only 4-5% of riders carpool to and from the stations. There are designated carpool spots at some stations.
6.1

SCRRA Strategic Assessment, 1-26-07
Metrolink fare media include free transit connections with city buses, shuttle buses, and light rail and subway lines. Approximately 6% of Metrolink passengers use transit systems to access Metrolink home stations. However, 30-50% connect to other transit systems from Metrolink to complete their trip to a final destination. Connecting systems include Metro, L.A. City DASH and other EZ transit pass system operators (L.A. County), Omnitrans (San Bernardino County), OCTA and StationLink (Orange County), and Riverside Transit (Riverside County). Very few patrons walk to the train station from home. However, 13% of passengers walk to their final destination. From 1-2% of passengers bicycle to/from stations. Metrolink trains allow two bicycles per rail car.
6.1.2 Station Access Improvement Strategies
There are various strategies station owners might consider to manage parking and access to stations to increase station capacity as follows: Review existing parking facilities to identify more efficient layouts. The low turnover of commuter spaces, combined with little luggage, allows for stall widths of 8.5 feet, as opposed to typical building ordinances, which require 9-foot wide stalls. The low turnover, combined with normally one-way flows in peak periods, also allows for in-filling parking stalls on circulation drives. The need for additional spaces begins to outweigh the need for separated circulation, as usage continually exceeds capacity. In general, separated circulation drives induce higher speeds. Conversion of drive lanes to parking many times has a traffic-calming effect, which actually makes the parking facility safer. Add parking where feasible, where the local jurisdiction or Metrolink member agencies can find property. This could be:
o Design-bid-build – where another party will be operator. o Design-build – where another party will be operator. This is typically done for
parking structures. o Design-build-operate-maintain (DBOM) – this is advantageous in areas where
a fee can be charged. The builder/operator would have a lease of at least 10 years, and possibly could pay back all or a portion of the capital costs from parking revenues (making the procurement a design-build-operate-maintain-finance ( DBOMF)). A fee of at least $3 per day starts to allow for the repayment of capital. Even without the ability to repay capital from parking fees, there would be an obligation to establish, and then enforce, performance and quality specifications. The procurement would be set up as a pre-qualified invitation for bid (IFB), with the bidder seeking the least amount of capital as the lowest bid.
At stations in areas with especially promising development potential, work with local jurisdictions to have developers provide parking. Shared parking need not cost Metrolink or the local jurisdiction anything, if the need for station parking is established in zoning, and a good shared use can be implemented. However, there could be mitigating considerations, such as zoning bonuses or a waiver of the
6.2

SCRRA Strategic Assessment, 1-26-07
developer’s obligation to provide roadway infrastructure, in order to entice “burdened” development around the station. If the developer is asked to provide commuter parking that would cut into what the developer is allowed to build, the developer will lose the ability to fully utilize the site for private development. In this event, it is reasonable for the developer to be paid back at least half of the capital cost. A range of land uses will lend themselves to shared parking. Best land uses are entertainment such as movie theaters and places of worship. Also good are certain retail types such as outlet malls. Parking at supermarkets also tends to peak on weekends, and so a measured amount of weekday spaces could be devoted to commuters. Parking ratios near transit services are being documented throughout the country, as benefits to both the developer (through less capital and land devoted to parking) and to the local jurisdiction (additional development yields more tax revenue, and fewer parking spaces mean fewer vehicles driven). Agencies are only beginning to implement shared parking arrangements, which historically have been considered risky by local jurisdictions. As research provides more actual data supporting reduced parking ratios, Metrolink’s station owners should be positioned to take advantage. Dedicated parking for the station, without the prospect of sharing parking, on property owned by the developer, could take the form of a DBOM or a DBOMF, as stated in 6.1.2 above. Usually, both the developer and local jurisdiction are counting on the development of the subject property, so to use it for commuter parking would require initiative by the local jurisdiction.
Institute fees at more stations. The fees could be used in the following ways: • Create incentives to utilize non-parking modes. At stations with full parking
utilization, there may be a market for shuttles or more shuttles where such services already exist (e.g. Orange County StationLink).
• Cover the cost of operating, maintaining and securing the lot (typically $1 - $1.50 per day for a surface lot, and $2 to $3 for structured parking).
• Provide premium spaces that are close to platforms. The choice of pay or free parking should mute negative reactions to charging parking fees.
Set up permitting across multiple stations. This decreases administrative fees to individual jurisdictions and can balance usage across stations through pricing. Riders would be then encouraged to go to their second choice station. A review of the area roadway networks and station draw areas must be undertaken so that the pricing is market-sensitive. The Metrolink fares will need to be addressed as the distance-based fare structure does not always allow for riders to move between stations. Institute valet parking. This allows operators to park more vehicles per square foot. An attendant must be on premises at all times, and so a higher fee typically would be required. However, the higher quality service would justify the higher fee. Also, it is possible to have both self-park and valet parking in one location, with separate fees. However, the costs of an all-day attendant would then be spread over fewer vehicles, and so would be less lucrative to prospective operators.
6.3

SCRRA Strategic Assessment, 1-26-07
6.2 Station Area Development There are currently 54 stations in operation and one under construction in the Metrolink system. For the existing network, station site selection was made as part of the development of the Metrolink system, in conjunction with cities and the county transportation agencies. While all of the stations are served by Metrolink commuter rail, the commonalities end there. Metrolink and Amtrak passenger trains along with freight trains operate through some, but not all stations. In reality, each station is unique to the community in which it is located. Some stations represent a revitalization of historic train depots. Others link nascent Edge Cities to the urban core; others still serve key employment centers and industrial areas. Most are strictly origin stations, drawing commuters from large catchments, and providing ample parking and limited station amenities. A handful are primarily destination stations serving large employment areas; and, as the jobs and housing balance evolves region-wide, a growing number serve as both an origin and destination station. From Metrolink’s early planning stages, rail station sites were selected based on general guidelines for station spacing, services, and parking. The original Metrolink Station Design Manual recommended a minimum preferred station spacing of five miles although this recommendation has been removed from current guidelines. Within the Metrolink network, the spacing generally follows this guideline. Table 6.1 depicts the average station spacing by route.
Table 6.1 Line Average Miles
Between Stations San Bernardino 4.7 Ventura County 6.4 Orange County 7.3
IEOC 7.2 91 8.8
Riverside 9.8 Antelope Valley 7.7
Metrolink station development guidelines also recommend a minimum of 500 parking spaces at each station, although this is simply a guideline. Many stations have significantly more parking, such as Industry and Rancho Cucamonga stations with 1,500 and 1,000 spaces respectively. The general station development, construction, ownership and maintenance falls within the purview of the cities in which stations are located, and the RCTC for stations within Riverside County.
6.2.1 Station Patronage, Access and Parking As the Metrolink system matures, travel paths and development patterns continue to evolve in response to changing socio-economic, demographic and economic factors. The discussion of shifting land use planning and station-area development must first address the overarching elements of station usage and parking.
6.4

SCRRA Strategic Assessment, 1-26-07
Individual operating policies are established by the station owners for paid parking, overnight parking, security, station amenities (restrooms, food service, office space, etc.). At its inception, SCRRA established guidelines for parking capacity and infrastructure necessary for train operations such as communications, ticket vending machines and validators, platforms, canopies, and passenger information signage. By and large, parking is free and overnight parking allowed with some exceptions: five Metrolink station cities and Union Station charge for parking. The two stations in Orange County that charge for parking serve dual purposes – sharing the parking with train commuters and other popular visitor/tourist destinations in the cities. Two others more recently implemented a paid parking program when security guards were added to the stations. However, the fees collected from the parking do not cover the full cost of the enhanced security. As part of a station parking study commissioned by SANBAG, the San Bernardino County stations are considering options to charge for parking, although for now, parking remains free. The parking rates vary by station: San Clemente: Parking rates are $1 per day for commuters or $50 for a resident annual parking pass and $65 for a non-resident annual pass. The station is at the beach and the parking lot doubles as beach parking. The spaces in the lot are metered, as are all beach parking spaces city-wide, and the meters are programmed to allow $1 for all day parking with arrival between 4 a.m. and 9 a.m. for Metrolink commuters. During the day and on the weekends, the parking is used by beach-goers; the parking rate is $1 per hour. San Juan Capistrano: Parking rates are $2 a day or $400 for a resident annual pass in the parking structure. The paid parking structure is adjacent to the train station and jointly serves the historic downtown area. Commuter parking is limited at this station. As the station is in the historic district, there are also other lots and street parking available for visitors and some free parking areas for commuters. Baldwin Park: The station has two Metrolink parking lots. Parking rates are $10 per month for residents and $30 per month for non-residents in the station adjacent parking lot. The daily parking fee is $3. The station also has a park-and-ride lot across the street. The park-and-ride fees are $10 per month for residents and $20 per month for non-residents. The daily parking fee is $1. Daily use tickets are dispensed from parking meter kiosks at the station. Covina: Similar to Baldwin Park, Covina has two Metrolink parking lots. Parking rates are $10 per month for residents, $20 per month for non-residents, or $1 per day in the Metrolink parking structure’s 655 spaces (beginning April 2006). The structure is a shared-parking facility for the station and the downtown area. Fees for the Metrolink station lot’s 242 spaces (next to the platforms) are $20 per month for residents and $45 per month for non-residents spaces. Norwalk/Santa Fe Springs: Station parking charge at the Transportation Center is $20 per month. Parking passes must be purchased in advance. Free parking is offered off-site at the Norwalk City Hall parking structure approximately one mile away, with shuttle bus connections to and from the station. Union Station: Union Station in downtown Los Angeles also charges for parking with monthly rates at $65 and daily rates at $6.
6.5

SCRRA Strategic Assessment, 1-26-07
Access to parking is a key factor in sustaining Metrolink growth, as the car remains the dominant means of travel to and from stations, in much the same way for commuter rail systems nationwide. (See Appendix A.4 for a survey of parking supply and station access characteristics for other commuter rail services.) Most customers drive to their origin station, and a small portion leave “station cars” at their destination station, which they use to get to and from work. Data from the 2004 on-board survey reveals that 69% of riders drove alone to their origin station, up from 65% in 2002. Other modes for system-level station access from home include “dropped off at the station” (17%), “carpooled” (4%), “rode Metro” and “rode a different bus” (3% each), and “walked” (2%). This preponderance of car usage is not surprising considering, on average, a Metrolink customer lives about five miles from his or her origin station, with some living nearly 40 miles away (Figure 6.1). Figure 6.1: Distribution of Home to Origin Station Distance
for Metrolink Riders
706050403020 100 Home to Station Distance Miles
6000
5000
4000
3000
2000
1000
0
Frequency
Mean =4.8724
Std. Dev. =5.49567
N =30,747
Additionally, the overwhelming majority (80%) of Metrolink’s customer base are commuters using the train to get to and from work (Figure 6.2).
6.6

SCRRA Strategic Assessment, 1-26-07
Figure 6.2
HOME BASED TRIP PURPOSE: SYSTEM
SCHOOL3%
PERSAPPT
2%BUSINESS APPT
1%HOME
2%
OTHER1%
NON-HOME TRIP7%
LEISURE4%
WORK80%
Source: 2004 SCRRA On-Board Survey Los Angeles Union Station is a key destination station and the majority of Metrolink riders use Metro Rail or Metro Bus to get from the station to work. However, from 2002 to 2004, there was a four percentage point decrease in those who continue on Metro from Metrolink, and a corresponding three percentage point increase in those driving alone to work from the Metrolink station in cars they park at their destination station. For other destination stations, there is a more varied mix of egress modes. On the Inland Empire-Orange County Line, 43% of the riders transfer to OCTA’s Station Link bus network, and a large percentage of riders drive alone (25%) to the office from their destination station. The Burbank station also shows variation from the system-level pattern, with 33% using public transit bus service provided by Burbank Bus, connecting large employment centers in the city with the station. If a station owner is contemplating paid parking, it is industry practice that the station should allow for daily paid parking as well as monthly paid parking. Without accommodations for daily paid parking, the ability to attract new riders is significantly diminished as monthly paid parking only acts as a barrier to use. SCRRA strongly encourages station cities to offer free parking or a variety of paid parking options for commuters. Table 6.2 shows the projected increasing demand for station parking with the service level growth outlined in the Strategic Assessment. If the strong ridership growth that was seen in FY 2005-06 continues, the parking deficits by county will have a corresponding increase over time. The integration of transportation and near-station land use planning could offer some relief to parking needs at some stations, if the potential for more pedestrian access increases.
6.7

SCRRA Strategic Assessment, 1-26-07
Table 6.2: Parking Deficits by County by Time Period/Alternative
County 2010 2015 2020A 2020B 2030A 2030B
Ventura (55) (1) (32) (81) (203) (275)
Los Angeles (1,850) (5,569) (4,374) (5,649) (7,891) (10,179)
Riverside (149) (404) (380) (581) (375) (1,789)
San Bernardino (991) (645) (194) (396) (2,007) (2,292)
Orange (300) (133) (382) (508) (1,092) (1,657)
TOTAL DEFICITS (3,345) (6,752) (5,361) (7,214) (11,568) (16,191)
Expense 2005 $ mill (1) $53.5 $108.0 $85.8 $115.4 $185.1 $259.1
(1) Assume $12,000/space for at grade and $20,000/space for structure and average of $16,000
6.2.2 Station Area Development Trends: Transportation and Land Use Planning Station patronage has evolved over time with the advent of new Metrolink routes and expanding rail feeder transit services. This evolution is changing the usage patterns, as stations become more of a focal point and serve as both an origin and a destination station. Correspondingly, the adjacent properties are transitioning from the freight railroad past to a passenger rail network. Within this dynamic, station cities are re-assessing the historical land use patterns surrounding the stations, and the amenities offered at each facility, to better leverage the transportation connections. While ample parking is still paramount for Metrolink growth, the focus is now on intensifying land uses around station areas and creating a more transit supportive construct. The focus on transit supportive development is occurring nationwide. Benefits of transit supportive development include: reduced trip length, travel time, and emissions; increasing densities supporting multiple uses surrounding stations; less need for single-use parking; better efficiencies for connecting transit; critical mass attainment for the employment and residential base; ability to support intensifying land uses; and efficient consolidated use of public resources. In many instances, parking demand can be shared among a variety of uses. While the benefits are common characteristics of good transportation and land use planning, there remains uniqueness to each community served. Within the Metrolink network, there are myriad of development patterns from urban core (Union Station and downtown Los Angeles) to new suburban (Rancho Cucamonga), Edge City (Irvine), and historical traditional neighborhood design town centers (Claremont, Fullerton). Cities across the region are engaged in updates to General Plans, Land Use elements
6.8
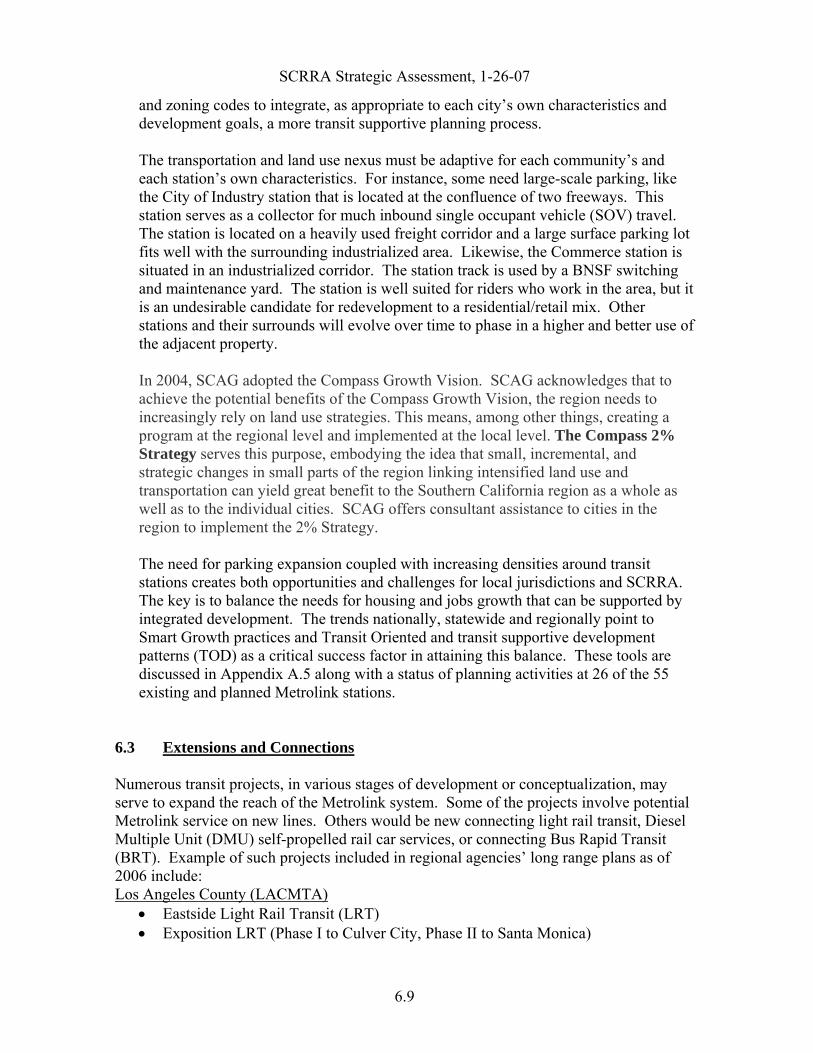
SCRRA Strategic Assessment, 1-26-07
and zoning codes to integrate, as appropriate to each city’s own characteristics and development goals, a more transit supportive planning process. The transportation and land use nexus must be adaptive for each community’s and each station’s own characteristics. For instance, some need large-scale parking, like the City of Industry station that is located at the confluence of two freeways. This station serves as a collector for much inbound single occupant vehicle (SOV) travel. The station is located on a heavily used freight corridor and a large surface parking lot fits well with the surrounding industrialized area. Likewise, the Commerce station is situated in an industrialized corridor. The station track is used by a BNSF switching and maintenance yard. The station is well suited for riders who work in the area, but it is an undesirable candidate for redevelopment to a residential/retail mix. Other stations and their surrounds will evolve over time to phase in a higher and better use of the adjacent property. In 2004, SCAG adopted the Compass Growth Vision. SCAG acknowledges that to achieve the potential benefits of the Compass Growth Vision, the region needs to increasingly rely on land use strategies. This means, among other things, creating a program at the regional level and implemented at the local level. The Compass 2% Strategy serves this purpose, embodying the idea that small, incremental, and strategic changes in small parts of the region linking intensified land use and transportation can yield great benefit to the Southern California region as a whole as well as to the individual cities. SCAG offers consultant assistance to cities in the region to implement the 2% Strategy. The need for parking expansion coupled with increasing densities around transit stations creates both opportunities and challenges for local jurisdictions and SCRRA. The key is to balance the needs for housing and jobs growth that can be supported by integrated development. The trends nationally, statewide and regionally point to Smart Growth practices and Transit Oriented and transit supportive development patterns (TOD) as a critical success factor in attaining this balance. These tools are discussed in Appendix A.5 along with a status of planning activities at 26 of the 55 existing and planned Metrolink stations.
6.3 Extensions and Connections Numerous transit projects, in various stages of development or conceptualization, may serve to expand the reach of the Metrolink system. Some of the projects involve potential Metrolink service on new lines. Others would be new connecting light rail transit, Diesel Multiple Unit (DMU) self-propelled rail car services, or connecting Bus Rapid Transit (BRT). Example of such projects included in regional agencies’ long range plans as of 2006 include: Los Angeles County (LACMTA)
• Eastside Light Rail Transit (LRT) • Exposition LRT (Phase I to Culver City, Phase II to Santa Monica)
6.9

SCRRA Strategic Assessment, 1-26-07
• Wilshire Boulevard Bus Rapid Transit (BRT) • San Fernando Valley North/South BRT
Orange County (OCTA) • Bus Rapid Transit
Riverside County (RCTC) • Perris Valley Line (Metrolink service on the Perris Valley Line is included in the
Strategic Assessment service) • Recommendations from the 2005 RCTC Commuter Rail Feasibility Study of
future service between Perris and San Jacinto and between Perris and Temecula along the I-215.
• Potential recommendations from the 2006-07 I-15 Commuter Rail Feasibility Study regarding service between Corona, Temecula and San Diego along the I-15.
• RCTC support of the California State Rail Plan with Amtrak Intercity Service between Los Angeles and Indio.
San Bernardino County (SANBAG) • Redlands Service (Metrolink service to “E” Street on the Redlands Branch is
included in the Strategic Assessment service) • Omnitrans BRT “E” Street • Gold Line Extension to Montclair
Ventura County (VCTC) • Santa Paula Branch Line
San Diego County (North County Transit District (NCTD)• Sprinter DMU Service from Escondido to Oceanside
6.10

SCRRA Strategic Assessment, 1-26-07
7.1
Lines 2005 2010 2010 2015OCTA A
Ventura County 18 18 28 3Antelope Valley 24 24 32 4San Bernardino 34 34 48 56Riverside 12 12 22 491 Line: LA-Riverside 9 0 0 4 091 Line: LA-Perris 13 10 16 2LAUS-Oceanside 10 10 10 10 10LAUS-Laguna Niguel/SJCap/Irvine 9 15 16 16 18Fullerton-Laguna Niguel 0 20 20 20 20IEOC 12 18 20 24 26Burbank Turn 12 12 12TOTA
B A B4 36 42 422 42 46 46
56 72 880 44 46 46
14 0 04 26 20 40
10 14 1438 38 380 0 040 28 40
8 8 8 8L 140 76 176 232 278 314 314 362
124% 124% 159%35% 13% 15%
107,000 133,943 156,502161% 227% 282%108% 38% 46%
Increase over 2005 26% 66% 99%Increase over prior period 32% 20%Ridership 41,000 51,345 77,136 96,788Increase over October 2005 25% 88% 136%Increase over prior period 89%The Strategic Assessment is a conceptual program. No commitment is implied for any agency.2020 and 2030 service levels are not the same as the levels proposed in the OCTA Strategic Assessment.2010 represents current service levels except on IEOC and OC shuttles and Perris Valley and one train on t
Table 7.1: Weekday Service Levels for the Strategic Assessment2020
he 91 Line
2030
7.0 Service Scenarios
7.1 Scenario Development The analytical portion of the Metrolink Strategic Assessment began with the development of six Service Scenarios. These scenarios ultimately were evaluated (see Chapter 12) in an effort to identify a potential long-term direction for SCRRA. They cover the years 2010, 2015, 2020 and 2030. There are two alternative scenarios for each of 2020 and 2030. Scenario development focused on determining weekday and weekend service levels for each Metrolink line over time. The particulars of each Service Scenario are discussed below. Once the Scenario service levels were identified, the Strategic Assessment Technical Advisory Committee (SATAC) moved on to the evaluation of ridership and costs (see Chapters 8 through 11). The scenario weekday service levels are shown in Table 7.1 in terms of total trains. Service levels adopted by the OCTA Board for implementation by 2010 of the OCTA Strategic Assessment are included for comparison. The 2020 and 2030 levels are also different from the OCTA Strategic Assessment. Table 7.2 provides the weekday service levels by time of day and by direction and Table 7.3 shows the average frequency of service by time of day and direction. Weekend service levels appear in Table 7.4. Service levels for 2005 are also shown in the table for comparative purposes. It should be noted that weekend service proposed for the Orange County and San Bernardino Lines in 2006 is not included in the 2010 weekend service levels.

SCRRA Strategic Assessment, 1-26-07
7.2
Lines 2005 2010 2015 2020A 2020B 2030A 2030BVentura AM Peak Inbound 5 5 6 6 7 7 7
AM Peak Outbound 1 1 3 4 4 7 7PM Peak Inbound 1 1 3 4 4 7 7PM Peak Outbound 5 5 6 6 7 7 7Off-peak Inbound 3 3 5 7 7 7 7Off-peak Outbound 3 3 5 7 7 7 7
Antelope Valley AM Peak Inbound 5 5 8 10 10 10 10AM Peak Outbound 2 2 3 4 4 6 6PM Peak Inbound 3 3 3 4 4 6 6PM Peak Outbound 5 5 8 10 10 10 10Off-peak Inbound 4 4 5 7 7 7 7Off-peak Outbound 5 5 5 7 7 7 7
San Bernardino AM Peak Inbound 8 8 10 11 11 11 15AM Peak Outbound 1 1 4 7 7 11 15PM Peak Inbound 4 4 4 7 7 11 15PM Peak Outbound 8 8 10 11 11 11 15Off-peak Inbound 5 5 10 10 10 14 14Off-peak Outbound 8 8 10 10 10 14 14
Riverside AM Peak Inbound 4 4 8 10 10 10 10AM Peak Outbound 0 0 0 3 5 6 6PM Peak Inbound 1 1 0 3 5 6 6PM Peak Outbound 5 5 8 10 10 10 10Off-peak Inbound 1 1 3 7 7 7 7Off-peak Outbound 1 1 3 7 7 7 7
91 Line -LA-Riverside AM Peak Inbound 2 2 3AM Peak Outbound 2PM Peak Inbound 1PM Peak Outbound 2 2 3Off-peak Inbound 1 4Off-peak Outbound 1 4
91 Line to Perris Valley AM Peak Inbound 3 3 5 5 5 8AM Peak Outbound 0 3 5 5 2 5PM Peak Inbound 0 3 5 5 2 5PM Peak Outbound 3 3 5 5 5 8Off-peak Inbound 2 2 2 3 3 7Off-peak Outbound 2 2 2 3 3 7
Table 7.2 Service Levels by Time of Day and Direction

SCRRA Strategic Assessment, 1-26-07
Lines 2005 2010 2015 2020A 2020B 2030A 2030BLAUS-Oceanside AM Peak Inbound 4 4 4 4 4 5 5
AM Peak Outbound 1 1 1 1 1 2 2PM Peak Inbound 1 1 1 1 1 2 2PM Peak Outbound 4 4 4 4 4 5 5Off-peak Inbound 0 0 0 0 0 0 0Off-peak Outbound 0 0 0 0 0 0 0
LAUS-Laguna Niguel AM Peak Inbound 3 3 3 3 6 6 6AM Peak Outbound 1 2 2 2 6 6 6PM Peak Inbound 1 2 2 2 6 6 6PM Peak Outbound 2 3 3 3 6 6 6Off-peak Inbound 1 3 3 4 7 7 7Off-peak Outbound 1 3 3 4 7 7 7
Fullerton-Laguna Niguel AM Peak Inbound 0 0 5 0 0 0AM Peak Outbound 1 1 5 0 0 0PM Peak Inbound 2 2 5 0 0 0PM Peak Outbound 1 1 5 0 0 0Off-peak Inbound 8 8 0 0 0 0Off-peak Outbound 8 8 0 0 0 0
IEOC AM Peak Inbound 4 5 5 6 8 6 8AM Peak Outbound 1 3 3 5 3 5PM Peak Inbound 1 1 3 3 5 3 5PM Peak Outbound 4 6 6 6 8 6 8Off-peak Inbound 1 4 4 4 7 5 7Off-peak Outbound 2 3 3 4 7 5 7
Burbank Turn AM Peak Inbound 2 2 2 1 1 1 1AM Peak Outbound 4 4 4 3 3 3 3PM Peak Inbound 4 4 4 3 3 3 3PM Peak Outbound 2 2 2 1 1 1 1Off-peak Inbound 0 0 0 0 0 0 0Off-peak Outbound 0 0 0 0 0 0 0
Notes:For the most part, a.m. peak frequencies reflect arrivals at train terminus by around 9 a.m.Orange County a.m. frequencies reflect arrivals at major Orange County work centers by or around 9 a.m.For the most part, trains departing arriving at terminus after 9 a.m. and departing from origin after 7 p.m. are off-peak. For inbound 91 Line trains, arrivals at Fullerton before 9 a.m. are counted as peak trains.After 2010, trains on all lines run from end to end with no turnbacks mid-route except Orange Co LineFullerton-Laguna Niguel and Los Angeles-Laguna Niguel services are lines for this train count. IEOC Line trains operate between San Bernardino and Laguna Niguel.No Amtrak trains are included in the table.
Table 7.2 continued: Service Levels by Time of Day and Direction
7.3

SCRRA Strategic Assessment, 1-26-07
7.4
Lines 2010 2015 2020A 2020B 2030A 2030BVentura AM Peak Inbound 40-60 30-40 30-40 30 30 30
AM Peak Outbound NA 90 60 60 30 30PM Peak Inbound NA 90 60 60 30 30PM Peak Outbound 40-60 30-40 30-40 30 30 30Off-peak Inbound 180 90 60 60 60 60Off-peak Outbound 180 90 60 60 60 60
Antelope Valley AM Peak Inbound 40-60 20-30 20 20 20 20AM Peak Outbound NA 90 60 60 30-40 30-40PM Peak Inbound 90 90 60 60 30-40 30-40PM Peak Outbound 40-60 20-30 20 20 20 20Off-peak Inbound 120 90 60 60 60 60Off-peak Outbound 90 90 60 60 60 60
San Bernardino AM Peak Inbound 20-30 20 15-20 15-20 15-20 10-15AM Peak Outbound NA 60 30 30 15-20 10-15PM Peak Inbound 60 60 30 30 15-20 10-15PM Peak Outbound 20-30 20 15-20 15-20 15-20 10-15Off-peak Inbound 40-60 40 40 40 30 30Off-peak Outbound 90 40 40 40 30 30
Riverside AM Peak Inbound 60 20-30 20 20 20 20AM Peak Outbound NA NA 90 40-60 30-40 30-40PM Peak Inbound NA NA 90 40-60 30-40 30-40PM Peak Outbound 40-60 20-30 20 20 20 20Off-peak Inbound NA 180 60 60 60 60Off-peak Outbound NA 180 60 60 60 60
91 Line -LA-Riverside AM Peak Inbound NA NA NA 90 NA NAAM Peak Outbound NA NA NA NA NA NAPM Peak Inbound NA NA NA NA NA NAPM Peak Outbound NA NA NA 90 NA NAOff-peak Inbound NA NA NA 120 NA NAOff-peak Outbound NA NA NA 120 NA NA
91 Line to Perris Valley AM Peak Inbound 90 90 40-60 40-60 40-60 20-30AM Peak Outbound NA 90 40-60 40-60 NA 40-60PM Peak Inbound NA 90 40-60 40-60 NA 40-60PM Peak Outbound 90 90 40-60 40-60 40-60 20-30Off-peak Inbound NA NA NA 180 180 60Off-peak Outbound NA NA NA 180 180 60
Table 7.3 Average Frequency of Trains by Time of Day and Direction (minutes)

SCRRA Strategic Assessment, 1-26-07
7.5
Lines 2010 2015 2020A 2020B 2030A 2030BLAUS-Oceanside AM Peak Inbound 60 60 60 60 40-60 40-60
AM Peak Outbound NA NA NA NA NA NAPM Peak Inbound NA NA NA NA NA NAPM Peak Outbound 60 60 60 60 40-60 40-60Off-peak Inbound NA NA NA NA NA NAOff-peak Outbound NA NA NA NA NA NA
LAUS-Laguna Niguel AM Peak Inbound 30 30 30 20 15-20 15-20These headways consider AM Peak Outbound 90 90 90 30 20-30 20-30trains from LA-Lag Niguel PM Peak Inbound 90 90 90 30 20-30 20-30and LA to Oceanside PM Peak Outbound 30 30 30 20 15-20 15-20
Off-peak Inbound 180 180 120 60 60 60Off-peak Outbound 180 180 120 60 60 60
Fullerton-Laguna Niguel AM Peak Inbound 20-30 20 10-15 10-15 10-15 10-15These headways are AM Peak Outbound 20-25 20-25 10-15 10-15 10-15 10-15improved by LA-Oceanside, PM Peak Inbound 15-20 15-20 10-15 10-15 10-15 10-15LA-Laguna Niguel and PM Peak Outbound 20-25 15-20 10-15 10-15 10-15 10-15to a limited extent by IEOC Off-peak Inbound 30 30 50 30 30-40 30
Off-peak Outbound 30 30 50 30 30-40 30IEOC AM Peak Inbound 40-60 40-60 30-40 20-30 30-40 20-30
AM Peak Outbound NA 90 90 40-60 90 40-60PM Peak Inbound NA 90 90 40-60 90 40-60PM Peak Outbound 30-40 30-40 30-40 20-30 30-40 20-30Off-peak Inbound 120 120 120 60 90 60Off-peak Outbound 90 90 120 60 90 60
Burbank Turn AM Peak Inbound NA NA NA NA NA NAnote that frequencies AM Peak Outbound 60 60 90 90 90 90could be combined with PM Peak Inbound 60 60 90 90 90 90the Ventura County and PM Peak Outbound NA NA NA NA NA NAAntelope Valley Line to Off-peak Inbound NA NA NA NA NA NAgive actual headways Off-peak Outbound NA NA NA NA NA NA
Notes:NA means there are 2 or less trains in a time period.No Amtrak trains are included in the table. They will improve frequencies for monthly passholders on the OC and VC Linesand between LA and Burbank Airport Station for all Metrolink ticket or passholders.
Table 7.3 Continued: Average Frequency of Trains by Time of Day and Direction (minutes)

SCRRA Strategic Assessment, 1-26-07
7.2 Weekday Scenarios Scenario 2010 At the request of LACMTA, 2010 was constrained to funding levels previously programmed by LACMTA. As a result, service in Los Angeles County was generally constrained to the 2005 levels through 2010. Increases in train set size will serve to accommodate growth in Los Angeles County. However, the 2010 Scenario does assume three significant changes. First, 91 Line trains to Riverside will increase by one, for a total of 10 trains or five round trips. Also, with the implementation of the Perris Valley Line, the eastern terminus for these trains will be in South Perris rather than Riverside, as today. Second, Orange County Line service between Los Angeles Union Station (LAUS) and the Orange County destinations of Laguna Niguel, San Juan Capistrano, and Irvine will increase by seven trains. Third, Orange County Local service grows to half-hour headways all day in both directions between Fullerton and Laguna Niguel beginning by 2010. In all, the 2010 Scenario requires 176 weekday trains as compared with 140 in 2005, an increase of 26% during the intervening five years. Note that in October 2006, Metrolink operated 145 weekday trains. After 2010, trains on all lines will run from end to end, with the exception of the Burbank Turns and Fullerton-Laguna Niguel trains on the Orange County Line, there are no turnbacks mid-route. In 2010, San Bernardino and IEOC trains are tentatively planned to start their westbound runs at Rialto Avenue and E Street in San Bernardino, one mile east of the current terminus. IEOC trains will operate between San Bernardino and Laguna Niguel. Scenario 2015
This Scenario shows major changes on six lines over 2010. Increases occur on all lines except the Orange County Line. 91 Line service has trains originating and terminating at both Riverside and Perris. Overall, this scenario represents a 66% increase in trains from 2005, and a 32% increase in trains from 2010. Scenario 2020A This is the first of two alternative Scenarios for 2020. The scenarios differ in their assumptions of service levels: 2020A has fewer trains than 2020B. Increases over 2015 service levels occur on all lines. All 91 Line trains originate or terminate in Perris; none in Riverside. There is no increase in either LAUS-Oceanside trains or in Orange County Local (Fullerton-Laguna Niguel) trains. Burbank Turns, operating solely between LAUS and the Burbank Airport Station, decline as they are extended to create more Ventura County Line trains. Overall, this Scenario represents a 99% increase in trains from 2005, and a 20% increase in trains from 2015.
7.6

SCRRA Strategic Assessment, 1-26-07
Scenario 2020B This Scenario has more trains on most lines than the 2020A Scenario. Increases above 2020A trains occur on the Ventura County Line, the Riverside Line, the 91 Line, and the IEOC Line. The 91 Line has trains originating and terminating in both Perris and Riverside. Orange County Local trains are extended from Fullerton to Los Angeles. Overall, this Scenario represents a 124% increase in trains from 2005, and a 35% increase in trains from 2015. Scenario 2030A This is the first of two alternative Scenarios for 2030. The Scenarios differ in their assumptions of service levels: 2030A has fewer trains than 2030B. 2030A train increases over 2020A trains occur on the Ventura County Line, the Antelope Valley Line, the San Bernardino Line, the Riverside Line, and the Orange County Line (four more trains between LAUS and Oceanside, and extension of Orange County Local trains to LAUS from Fullerton). Riverside Line trains originate and terminate in Perris; none in Riverside. Overall, this Scenario represents a 124% increase in trains from 2005, and a 13% increase in trains from 2020A. Scenario 2030B This Scenario has more trains on some lines than does 2030A. Train increases above 2030A service levels occur on the San Bernardino Line, the 91 Line, and the IEOC Line. As in 2030A, Riverside Line trains originate and terminate in Perris; none in Riverside. Overall, this Scenario represents a 159% increase in trains from 2005, and a 15% increase in trains from 2020B. 7.3 Weekend Scenarios Assumptions for weekend service on Metrolink lines appear in Table 7.4. Weekend trains are shown for the Antelope Valley Line, the San Bernardino Line, the Orange County Line, and the IEOC Line. 2010 weekend service levels are the same as 2005 levels, with the following exceptions: (1) the Orange County Local Service, which would start operating 52 trains between Fullerton and Laguna Niguel in that year on both Saturdays and Sundays; and (2) the IEOC Line Service, which would convert summer-only trains to year-round trains in that year. In addition, the weekend service levels do not include the Orange County Line weekend service of three round trips between Oceanside/San Juan Capistrano and Los Angeles on both weekend days and two round trips on the San Bernardino Lines on both weekend days starting in 2006. Antelope Valley Line weekend service-level Scenarios increase over time after 2010. San Bernardino Line service levels remain constant after 2015. IEOC Line service-level Scenarios remain constant from 2020. In 2020B, 2030A, and 2030B, the Orange County Local trains are extended to LAUS from Fullerton.
7.7

SCRRA Strategic Assessment, 1-26-07
Lines 2005 2010 2015A B A B
Antelope Valley Sat 8 8 12 16 20 24 36
Sun 0 0 8 12 16 16 20
San Bernardino Sat 16 16 36 36 36 36 36
Sun 8 8 20 20 20 20 20
LAUS-Oceanside Sat 0 0 0 0 0 0 0
Sun 0 0 0 0 0 0 0
LAUS-Laguna Niguel/SJCap/Irvine Sat 0 0 0 0 52 52 52
Sun 0 0 0 0 52 52 52
Fullerton-Laguna Niguel Sat 0 52 52 52 0 0 0
Sun 0 52 52 52 0 0 0
IEOC Sat 6 summer 6 6 12 12 12 12Sun 6 summer 6 6 12 12 12 12
TOTAL SATURDAY 24+6 Summer 82 106 116 120 124 136
TOTAL SUNDAY 8+6 Summer 66 86 96 100 100 104
Increase over 2005 (excludes summer) Saturday 242% 342% 383% 400% 417% 467%
Increase over 2005 (excludes summer) Sunday 725% 975% 1100% 1150% 1150% 1200%
Increase over Prior Period Saturday 29% 9% 13% 7% 13%Increase over Prior Period Sunday 30% 12% 16% 4% 4%
2020 2030
Table 7.4 Weekend Service Levels
Note that no Amtrak trains are included in this table. 7.4 Equipment Assignment Based on preliminary schedules for the weekday trains, a preliminary assignment of equipment to layovers has been developed. Table 7.5 shows the assignment of trains to layovers by Scenario broken down by the line the equipment would serve. As shown in the table, as more reverse service is added over time, more equipment will be stored in the Central Maintenance Facility over night. This data is also used in Chapter 11 to identify capital costs to provide the capacity needed at layovers and rolling stock requirements for each Scenario.
7.8

SCRRA Strategic Assessment, 1-26-07
Layover (Abbreviated Name) Current 2010 2015 2020A 2020B 2030A 2030B
Montalvo (MONT) 3 3 5 6 7 6 6
Moorpark (MPK) 1 1 0 0 0 0 0
Lancaster (LNC) 5 5 6 9 9 9 9
Los Angeles (LAX) 1SNB 1SNB+2LNG2LNC, 1SNB, 3PER, 2LNG
3MONT, 3LNC, 5SNB, 1 RIV, 3PER, 1 OSD, 1LNG
3MONT, 3LNC, 5SNB, 2 RIV, 4PER, 1 OSD, 4LNG
5MONT, 4LNC, 8SNB, 5RIV, 2PER, 2
OSD, 4LNG
5MONT, 4LNC, 11SNB, 5RIV,
4PER, 2 OSD, 4LNG
San Bernardino (SNB) SB Line 8 8 9 10 10 10 13
SNB-IEOC 3 5 5 5 5 6 8
Riverside (RIV) Riv Line (1) 4 4 8 10 10 9 9
RIV-91 Line (2) 2 0 2 0 3 0 0
RIV-IEOC (2) 1 0 0 0 0 0 0
Perris (PER) 0 3 3 5 5 5 7
Oceanside (OSD) 4 4 4 4 4 5 5
Laguna Niguel (LNG) 0 2 2 2 9 9 9
TOTAL 32 38 52 68 84 89 101
Locos 32 38 52 68 84 89 101
Locos+Spares 39 45 60 78 97 102 116
Loco Spare Ratio (3) 22% 18% 15% 15% 15% 15% 15%
cars/train avge 4.3-cars avge 5.3-cars avge 5-cars avge 5-cars avge 5-cars avge 5-cars avge 5-cars
Cars 139 201 260 340 420 445 505
Cars+Spares 151 226 289 377 466 494 561
Spare Ratio (3) 9% 12% 11% 11% 11% 11% 11%
cars/train avge 4.3-cars avge 5.3-cars avge 6-cars avge 6-cars avge 6-cars avge 6-cars avge 6-cars
Cars 139 201 312 408 504 534 606
Cars+Spares 151 226 346 452 559 592 672
Car Spare Ratio (3) 9% 12% 11% 11% 11% 11% 11%
(1) must all be on north side (2) must all be on south side(3) ideal is 15% for cabs and locos and 10% for cars resulting in average spare ratio of 12% with 5.3 cars/train and 11% with 6 cars/train. Note that current spare ratio is less than ideal due to equipment constraints.
Table 7.5: Equipment Assignment at Layovers by Period
7.9

SCRRA Strategic Assessment, 1-26-07
8.0 Ridership Forecasts This chapter presents the forecasts for ridership for the future year service scenarios. The basics of the ridership methodology used in this study originated in the 2004 Orange County Transportation Authority (OCTA) Commuter Rail Strategic Assessment. SCRRA, which was a member of the OCTA study’s Technical Advisory Committee, opted to modify the OCTA methodology for its overall strategic assessment to forecast future commuter rail trips over the entire Metrolink network. The chapter concludes with the presentation of the weekday ridership forecasts for the future years. 8.1 Forecast Methodology The methodology described below was pioneered in the OCTA study and refined during the course of this study. It consisted of several steps. These steps appear in the flowchart, shown as Figure 8.1, on the following page.
Determining station area catchment areas. The Metrolink 2002 On-board Passenger Survey allowed for the identification of AM peak ridership from station to station. The origin and destination addresses provided in the survey were used to define stations more broadly as the catchment areas surrounding the stations. These catchment areas represented the home end and the work end of trips to and from the stations. Any one station thus had two catchment areas: one for the home end of the trip, and one for the work end of the trip. Typically, origin catchment areas were larger than the destination catchment areas, and varied generally from about 3 to 5 miles around a station – a distance that the survey indicated riders were willing to travel from home to a station. At the ends of lines, catchment areas are generally much greater, and stations near freeways often have larger catchment areas.
•
• Identifying the universe of work trips. With the station catchment areas defined, the study team identified the universe of 2000 work trips that could have been attracted to Metrolink by isolating the work trips made between the aggregation of traffic analysis zones (TAZs) at origin stations and the aggregation of TAZs at destination stations during the peak morning commute periods. The Southern California Association of Governments (SCAG) maintains the data on work trips between the TAZs in the study areas with the exception of Oceanside (San Diego County), which is outside the SCAG region.
8.1

SCRRA Strategic Assessment, 1-26-07
Figure 8.1: Ridership Forecasting Methodology Process Flow Chart
8.2

SCRRA Strategic Assessment, 1-26-07
• Determining the commuter rail trips. Comparison of the actual Metrolink peak period ridership between station catchment areas and the universe of work trips between those catchment areas provided an understanding of the commuter rail mode share, i.e. the percentage of all work trips that commuter rail could capture. If, for example, Metrolink carries 100 out of 1,000 work trips between an origin station catchment area and a destination station catchment area during the morning peak period, then Metrolink’s peak AM period service captures 10% of that work trip market.
The analysis of Metrolink data for the OCTA Commuter Rail Strategic Assessment showed a relationship existed between the shares of work trips and both the distance traveled and the frequencies of trains. Metrolink tended to capture more commute trips, if the trips were longer and if Metrolink offered higher service levels. Furthermore, trips heading to Los Angeles tended to have higher mode splits than trains to anywhere else. (This fact appears to be a result of higher parking fees and good transit connections in Downtown Los Angeles.) The study team carried this logic into the Metrolink systemwide study. The capture rates appearing in the tables below were applied to the year 2000 work trips, according to the trip distance and level of service assumed. The result was an estimate of year 2000 AM peak period work trips.
Table 8.1: Capture Rates, LAUS Trips, AM Peak
(Percent) Distance to LA
1 to 2 Trains
3 to 4Trains
5 to 6Trains
7 to 8Trains
9 to 10Trains
11 to 12 Trains
13+ Trains
0 to 4 miles 0.00 0.00 0.00 0.00 0.00 0.00 0.00 5 to 14 miles 0.00 0.50 1.40 2.30 3.20 4.10 5.00 15 to 24 miles
0.50 1.50 4.00 6.50 9.00 12.00 15.00
25 to 34 miles
3.00 9.00 15.00 21.00 25.00 27.50 30.00
35 to 44 miles
6.00 16.50 25.00 30.00 34.00 37.00 40.00
45 plus miles 10.00 22.00 32.00 39.00 43.00 44.00 45.00 Source: Wilbur Smith Associates
8.3

SCRRA Strategic Assessment, 1-26-07
Table 8.2: Capture Rates, Non LAUS Trips, AM Peak
(Percent) Distance
1 to 2 Trains
3 to 4Trains
5 to 6Trains
7 to 8Trains
9 to 10Trains
11 to 12 Trains
13+ Trains
0 to 4 miles 0.00 0.00 0.00 0.00 0.00 0.00 0.00 5 to 14 miles 0.00 0.20 0.50 0.80 1.10 1.40 1.70 15 to 24 miles
0.20 1.00 3.00 5.00 7.00 8.00 9.00
25 to 34 miles
3.00 7.00 10.00 12.00 14.00 15.00 16.00
35 to 44 miles
6.00 10.00 13.00 15.00 17.00 18.00 19.00
45 plus miles 9.00 12.00 15.00 17.00 18.00 19.00 20.00 Source: Wilbur Smith Associates
Calibrating the results. The study team then compared the results for the year 2000 estimate on a line by line basis with what Metrolink actually achieved in 2002, and applied line adjustment factors as needed to bring the two line counts closer together. In some cases, the team tailored adjustments for individual station pair ridership, where the capture rates either understated or overstated the ridership significantly. Various factors can affect ridership at any particular station. One example is the availability of parking. The station specific adjustment, based on the Metrolink survey, accounted for these anomalies. The result of the calibration was a set of capture rates and required adjustments that could be applied to the universe of work trips between almost 3,600 potential station pairs on the Metrolink system in 2010 and 2020. Because the calibration produced a ridership very close to that experienced in 2002 (as intended, so as to conform to the findings of the survey), one last adjustment was required to discount ridership to that experienced in 2000.
•
• Performing the peak period forecast. The capture rates and adjustments were then applied to SCAG projections of work trips between station areas for the 2010 and 2020 Service Scenarios. The team increased the 2020 ridership by 3.5% per year to estimate ridership in 2030. The 3.5% annual increase appeared reasonable given assumptions of service improvements, increasing population and employment, and growing highway congestion throughout the Metrolink service area.
Since Oceanside is not within the SCAG area, and therefore SCAG projections of work trips did not include Oceanside, to estimate Oceanside ridership, the study first identified the existing station-to-station ridership from the 2002 survey, and grew it by the percentage increases forecast of rail trips between San Clemente (closest station to Oceanside in the SCAG area) and other Metrolink stations. This did not take into account the Escondido to Oceanside rail service expected to open in December 2007. As the future Perris Valley Line stations are within the SCAG area, the ridership to and from these stations was estimated in the same way as with other Metrolink stations.
8.4

SCRRA Strategic Assessment, 1-26-07
Accounting for Amtrak and trips through Los Angeles Union Station. The future Service Scenarios outlined in Chapter 7 differ from Metrolink service in 2000 in two ways other than simply more trains on individual lines. One is a result of the Rail-2-Rail program by which Metrolink monthly ticket holders can ride Amtrak Pacific Surfliner trains for no extra charge. The Rail-2-Rail program began after 2002. Thus, the Pacific Surfliners are included in total train frequencies at specific Orange County Line and Ventura County Line stations in the future years. Also, with more service on all lines, the potential for transfers between lines will increase. Accordingly, the methodology assumed greater frequencies between certain lines that connect in Los Angeles. For example, assumed transfers included those between the Orange County Line and the Ventura County Line. Excluded were transfers between stations on lines that are essentially parallel, where rail travel time would be excessive.
•
•
•
•
•
Estimating the impact of future congestion. Looking to the future, the study team anticipated that as congestion worsens and auto travel times increase, more motorists could be expected to shift their trips to rail. The study team developed ridership adjustment factors based on worsening auto travel times forecasted by SCAG between station areas during the AM peak period. The team then applied these factors to the station-to-station ridership in order to account for gains in ridership due to the higher congestion levels. Finally, in order to show total AM and PM weekday peak period trips, the study team doubled the congestion-adjusted peak AM period ridership.
Forecasting off-peak trips. The study team looked to the current experience of Caltrain, the San Francisco Peninsula commuter rail service, and Metrolink’s San Bernardino Line for insight for forecasting off-peak trips. Observations of the percent of total trips generated by off-peak trains on the two services allowed construction of a curve enabling the team to estimate future off-peak Metrolink ridership per the anticipated number of off-peak trains.
Weekend Ridership. Total weekend ridership is less than 4% of total weekday ridership. It was factored from weekday riders, based on a regression of Metrolink and Caltrain data, to enable the calculation of total revenues.
Forecasting revenue. With ridership by line identified, the study team forecasted revenue. The team assumed the current revenue per rider by line with restructuring and assumed an annual 3.5% fare increase. The revenues were annualized. They appear in the following chapter as part of the operating cost calculations.
8.2 Weekday Forecast Results
The weekday ridership forecast results, inclusive of the foregoing adjustments and assumptions appear in Table 8.3. The results are summarized by Scenario and line.
8.5

SCRRA Strategic Assessment, 1-26-07
Table 8.3: Weekday Patronage Summary by Line Peak Period Trips 2010 2015
2020 Scenario A
2020 Scenario B
2030 Scenario A
2030 Scenario B
Ventura County Line 4,259 5,009 6,112 6,842 9,048 9,651Antelope Valley Line 8,424 14,548 19,334 19,533 27,273 27,554San Bernardino Line 11,674 16,544 20,047 20,404 28,278 33,237Riverside Line 4,687 9,536 12,492 13,008 17,621 18,350Orange County Line 7,920 10,453 10,759 15,105 15,176 21,308Inland-Orange Line 4,870 5,281 5,358 7,015 7,143 9,89591-Perris Valley Line 3,300 4,687 6,575 6,979 7,671 9,844 System Total 45,132 66,058 80,677 88,887 112,210 129,838 Total Weekday Trips Ventura County Line 4,642 5,760 7,274 8,142 10,767 11,485Antelope Valley Line 9,603 16,730 23,008 23,245 32,454 32,789San Bernardino Line 13,775 20,349 25,058 25,505 35,347 41,546Riverside Line 4,921 10,394 14,866 15,480 20,969 21,836Orange County Line 9,583 13,066 12,803 17,975 18,060 25,356Inland-Orange Line 5,356 5,914 5,953 8,348 8,214 11,77691-Perris Valley Line 3,465 4,922 7,827 8,304 8,131 11,714 System Total 51,345 77,136 96,788 107,000 133,943 156,502 Note: Unlinked trips reflect total ridership by line; trips requiring a transfer are counted twice, once for each line.
It should be noted that ridership on both the Riverside and Ventura County Lines in 2006 already approaches the projections for 2010.
8.6
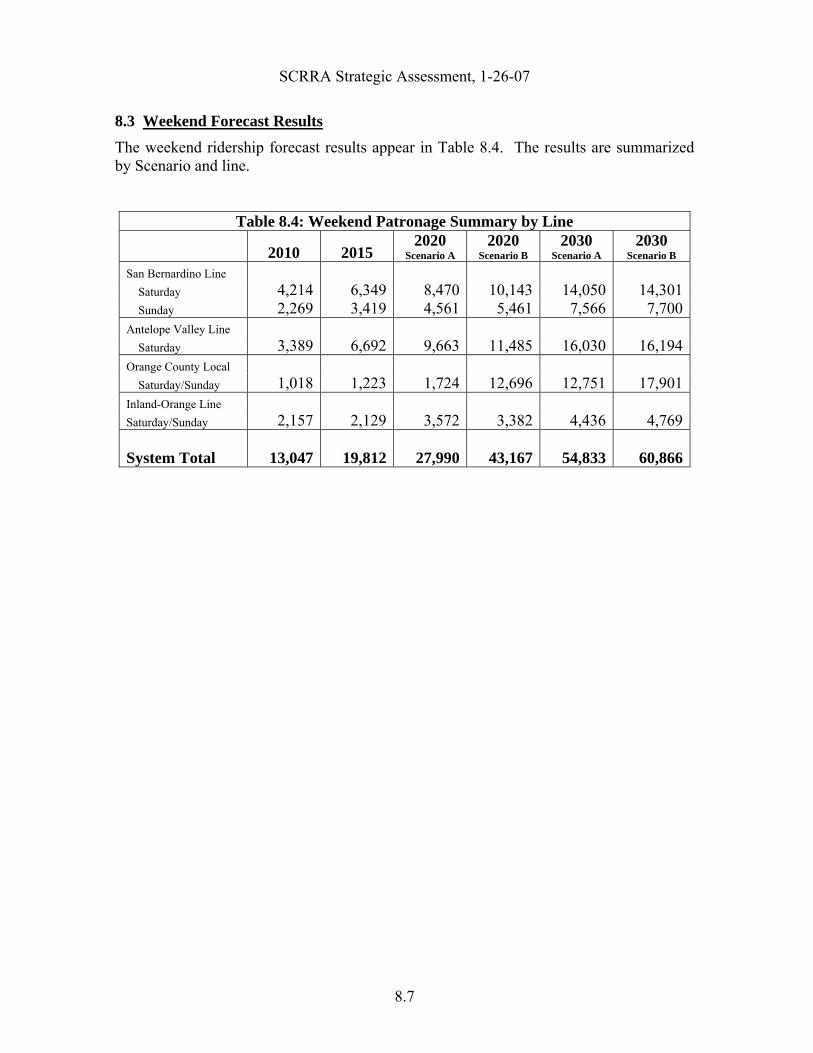
SCRRA Strategic Assessment, 1-26-07
8.3 Weekend Forecast ResultsThe weekend ridership forecast results appear in Table 8.4. The results are summarized by Scenario and line.
Table 8.4: Weekend Patronage Summary by Line
2010 2015 2020
Scenario A 2020
Scenario B 2030
Scenario A 2030
Scenario B San Bernardino Line
Saturday 4,214 6,349 8,470 10,143 14,050 14,301Sunday 2,269 3,419 4,561 5,461 7,566 7,700
Antelope Valley Line Saturday 3,389 6,692 9,663 11,485 16,030 16,194
Orange County Local Saturday/Sunday 1,018 1,223 1,724 12,696 12,751 17,901
Inland-Orange Line Saturday/Sunday 2,157 2,129 3,572 3,382 4,436 4,769
System Total
13,047
19,812
27,990
43,167
54,833
60,866
8.7

SCRRA Strategic Assessment, 1-26-07
9.0 Operating Costs And Cost Allocation The Operating Budget details both operating revenues (such as fare revenue, maintenance-of-way (MOW) revenue, member agency contributions, etc.) and operating expenses (such as train operations, equipment maintenance, fuel, security, transfers to other operators, maintenance-of-way, salaries and fringe benefits, insurance, etc.) 9.1 Performance DataFigures 9.1 through 9.3 provide a summary of Metrolink performance data projected through 2030 and compared with historical data since FY 1993-94. For illustrative purposes, the charts show values for Service Scenarios 2020A and 2030B, as these were the scenarios identified in Chapter 12 as the preferred options for those years. The charts illustrate the continuing growth and efficiency of Metrolink operations. As shown in Figure 9.1, train miles18 have increased since 1993 at a relatively constant rate until FY 2003-04 when budget and equipment constraints slowed the level of growth. These constraints are assumed through 2010, but by 2015 the same rate of growth is assumed as in the earlier years of Metrolink service. However, ridership has continued to grow at a relatively constant rate. It is assumed to continue at approximately the same rate through 2030. Figure 9.2 shows how operating expenses have increased through FY 2005-06. They are projected to increase as service is added and these expenses are subject to an annual 4% escalation. However, revenues also grow due to ridership increases and the assumption of an annual 3.5% fare increase. As a result, the growth in member agency subsidy is much less than the growth of expenses. Revenue and farebox recovery also grow through 2010 as the service becomes more efficient as the system continues to grow and ridership and revenues continue to increase. Revenue recovery is calculated as the ratio of total operating revenues to total expenses less rolling stock lease and maintenance-of-way extraordinary maintenance costs. Since FY 1996-97, the revenue recovery index has been over 50%. By 2030, revenue recovery is projected to be approximately 71%, and farebox recovery is projected to be about 67%. Figure 9.3 shows operating data in terms of passenger miles19 and train miles. Operating expense per passenger-mile in year-of-expenditure dollars has fluctuated between $0.30 and $0.34 since FY 1995-96. It is projected to grow to $0.49 by 2030. At the same time revenues per passenger mile in year-of-expenditure dollars are projected to be between $0.15 and $0.22 through 2015 but after that period, grow to $0.35 by 2030. The operating subsidy per passenger mile in year-of-expenditure dollars should stay relatively constant between $0.13 and $0.16 through 2020 and drop to $0.14 by 2030.
18 Total service miles traveled by Metrolink trains in a particular year. 19 Total miles traveled on Metrolink trains by all passengers in a particular year.
9.1

SCRRA Strategic Assessment, 1-26-07
9.2
FIGURE 9.1SOUTHERN CALIFORNIA REGIONAL RAIL AUTHORITY
ANNUAL OPERATING DATA
TRAIN MILES (Thousands)
-
500
1,000
1,500
2,000
2,500
3,000
3,500
4,000
4,500
5,000
5,500
6,000
6,500
7,000
FY 93-94
FY 95-96
FY 97-98
FY 99-00
FY 01-02
FY03-04
FY05-06
FY07-08
FY09-10
FY11-12
FY13-14
FY15-16
FY17-18
FY19-20
FY21-22
FY23-24
FY25-26
FY27-28
FY29-30
AVERAGE WEEKDAY RIDERSHIP
-
20,000
40,000
60,000
80,000
100,000
120,000
140,000
160,000
FY 93-94
FY 95-96
FY 97-98
FY 99-00
FY 01-02
FY03-04
FY05-06
FY07-08
FY09-10
FY11-12
FY13-14
FY15-16
FY17-18
FY19-20
FY21-22
FY23-24
FY25-26
FY27-28
FY29-30

SCRRA Strategic Assessment, 1-26-07
FIGURE 9.2SOUTHERN CALIFORNIA REGIONAL RAIL AUTHORITY
ANNUAL OPERATING DATA
Revenue Recovery = Operating Revenues/Operating Expenses Net of Rolling Stock Lease PaymentsFarebox Recovery = Farebox Revenue/Operating Expenses Net of Rolling Stock Lease Payments
REVENUE AND FAREBOX RECOVERY
10%
20%
30%
40%
50%
60%
70%
80%
FY 93-94
FY 95-96
FY 97-98
FY 99-00
FY 01-02
FY03-04
FY05-06
FY07-08
FY09-10
FY11-12
FY13-14
FY15-16
FY17-18
FY19-20
FY21-22
FY23-24
FY25-26
FY27-28
FY29-30
Revenue Recovery Farebox Recovery
OPERATING EXPENSES AND REVENUES ($Millions)
OPERATING EXPENSE ($Millions)
REVENUES ($Millions)
$-
$50
$100
$150
$200
$250
$300
$350
$400
$450
$500
$550
$600
$650
$700
$750
FY 93-94
FY 95-96
FY 97-98
FY 99-00
FY 01-02
FY03-04
FY05-06
FY07-08
FY09-10
FY11-12
FY13-14
FY15-16
FY17-18
FY19-20
FY21-22
FY23-24
FY25-26
FY27-28
FY29-30
SUBSIDY ($Millions)
9.3

SCRRA Strategic Assessment, 1-26-07
ANNUAL OPERATING DATA
SOUTHERN CALIFORNIA REGIONAL RAIL AUTHORITYFIGURE 9.3
EXPENSES AND REVENUES PER TRAIN MILE
EXPENSE/TRAIN MILE
REVENUES/TRAIN MILE
$-
$10
$20
$30
$40
$50
$60
$70
$80
$90
$100
$110
FY 94-95
FY 96-97
FY 98-99
FY 00-01
FY 02-03
FY04-05
FY06-07
FY08-09
FY10-11
FY12-13
FY14-15
FY16-17
FY18-19
FY20-21
FY22-23
FY24-25
FY26-27
FY28-29
SUBSIDY/TRAIN MILE
EXPENSES AND REVENUES PER PASSENGER MILE
REVENUES/PASSENGER MILE
$-
$0.10
$0.20
$0.30
$0.40
$0.50
$0.60
FY 94-95
FY 96-97
FY 98-99
FY 00-01
FY 02-03
FY04-05
FY06-07
FY08-09
FY10-11
FY12-13
FY14-15
FY16-17
FY18-19
FY20-21
FY22-23
FY24-25
FY26-27
FY28-29
SUBSIDY/PASSENGER MILE
EXPENSE/PASSENGER MILE
9.4

SCRRA Strategic Assessment, 1-26-07
9.2 Components of the Operating Budget The two components of the Operating Budget – Operations and Maintenance-of-Way, have multiple sub-components of both expenses and revenues, which permit allocation to line and to member agencies. • Operations – This portion of the Operating Budget includes expenses required to
operate the Metrolink system including train operations, maintenance of equipment, fuel, security, utilities, transfer payments to other transit operators, revenue collection, payments to freight railroads for dispatching, station maintenance, passenger services, general and administrative expenses, professional services, and insurance.
• Maintenance-of-Way – This portion of the Operating Budget represents ordinary maintenance of the rights-of-way owned by SCRRA member agencies, and includes routine inspection of track, signals, structures and repairs as needed.
9.3 Operating Budget Service Assumptions In FY 2005-06 when service level scenarios for future years were developed, SCRRA operated 141 to 145 weekday trains on seven lines; 24 regular Saturday trains operating on two lines, the Antelope Valley and San Bernardino lines; 8 regular Sunday trains operating on the San Bernardino Line; and 12 summer-only weekend trains operated on the IEOC line. Weekend service has since been added on the Orange County, IEOC and San Bernardino Lines20. However, when the weekend service levels for 2010 were defined the added weekend service on the Orange County and San Bernardino Lines was not included. Total revenue train miles are expected to equal 2.2 million miles in FY 2005-06. The various scenarios for 2010 through 2030 assume service levels from 176 weekday trains to 362 weekday trains. With the exception of one additional 91 Line train, no additional services are planned through 2010 on any line serving Los Angeles County due to constrained Metro funding. Service is also constrained by availability of equipment. SCRRA is in the process of a rail car procurement. However, the first cars will not be delivered before FY 2008-09. Additional capacity is provided by the “Rail 2 Rail” program. On those lines where complementary service exists, SCRRA, Amtrak and Caltrans have an agreement to allow passengers, holding valid Metrolink monthly passes or Amtrak tickets, to choose the service provider most convenient to their travel needs. This allows Metrolink to serve more riders using available seats on Amtrak. In FY 2005-06, the service is estimated to add over 1,400 weekday riders on the overlapping service. 20 In June 2006, 6 weekend trains were added on Saturdays on the Orange County Line and 6 weekend trains were added on Sundays on the Orange County Line in July 2006. In addition, three round trips each Saturday and two round trips each Sunday were added on the IEOC between Oceanside and San Bernardino starting July 15; and two round trips each Saturday and Sunday on the San Bernardino Line were added September 6, 2006.
9.5

SCRRA Strategic Assessment, 1-26-07
Table 7.1 in Chapter 7 provides the service assumptions projected through 2030 for weekday service. Service levels adopted by the OCTA Board for implementation by 2010 of the OCTA Commuter Rail Strategic Assessment of 2004 are included for comparison. The 2020 and 2030 service levels are also not the same as those in OCTA’s Strategic Assessment. Table 7.4 in Chapter 7 provides weekend service assumptions. OCTA weekend service levels for 2010 are the same as the SCRRA levels. 9.4 Summary of Revenues and Expenses by Operating Cost Component Table 9.1 shows revenues and expenses by operating cost component of the Operating Budget through 2030.
Operating revenues include farebox revenues, dispatching and other revenues as well as maintenance-of-way revenues. Operations expenses include expenses required to operate the Metrolink system including train operations, maintenance of equipment, fuel, security, utilities, transfer payments to other transit operators, revenue collection, payments to freight railroads for dispatching, station maintenance, passenger services, general and administrative expenses, professional services, and insurance. In projecting operating expenses, cost of living or labor agreement-related increases are assumed at an annual rate of 4% through 2030. In addition, many items will also increase with the service provided. Operations expenses are allocated to each line (and subsequently to member agencies) based on several formulae. The various formulae are described in Appendix A.7. Items such as direct train operations expenses and fuel are distributed based on train miles. Payments to freight railroads are charged directly to lines and then distributed to member agencies on the basis of train miles. Maintenance-of-way expenses are developed by SCRRA to ensure that the level of ordinary maintenance is sufficient to prevent any loss of service quality. Levels of maintenance required on individual lines depend upon several factors including the condition of the infrastructure, levels of commuter and freight train traffic, the number of road crossings, the number of curves, and exposure to storm damage. The following are the elements of the Operating Budget.
9.4.1 Revenues Farebox revenues are projected from estimates of ridership developed in coordination with member agency staff. Through 2030, an annual 3.5% systemwide average fare increase is assumed. Fare restructuring, which was first effective July 1, 2005, is assumed to continue through 2015. In projecting fare revenues, the current distribution of trip lengths and ticket types was assumed. No correction was made for the potential effects of changing demographics and fare revenues as Baby-Boomers are deferring retirement and becoming eligible for senior fares. The projected total
9.6

SCRRA Strategic Assessment, 1-26-07
FY 05-06 OCTA Budget 2010 2010 2015 2020A 2020B 2030A 2030B
Revenue Train Miles (Thousands) 2,204.2 2,906.1 2,891.6 4,150.1 5,096.0 5,997.9 5,815.2 6,932.6 Farebox Recovery 43.2% 45.9% 46.2% 52.5% 55.3% 53.5% 63.8% 66.8% Revenue Recovery 54.9% 54.6% 54.9% 59.0% 60.8% 58.3% 68.3% 70.9%EXPENSES 120,825 167,139 166,869 264,209 376,109 434,610 642,630 716,637 REVENUES 65,738 91,324 91,690 155,941 228,567 253,184 439,105 507,799 NET LOCAL SUBSIDY 55,087 75,815 75,178 108,268 147,542 181,426 203,525 208,838 Revenues
Farebox Revenue 51,786 76,767 77,134 138,652 208,034 232,650 410,140 478,835 Dispatching 2,863 3,285 3,285 3,902 4,634 4,634 6,537 6,537 Other Revenues 2,243 1,120 1,120 1,331 1,580 1,580 2,229 2,229 MOW Revenues 8,846 10,151 10,151 12,056 14,319 14,319 20,198 20,198 Member Agency Revenues 55,087 75,815 75,178 108,268 147,542 181,426 203,525 208,838
Total Revenues $120,825 $167,139 $166,869 $264,209 $376,109 $434,610 $642,630 $716,637Operations & Services
TD Train Operations 23,287 31,087 31,087 48,522 71,464 80,591 122,859 139,631 B Equipment Maintenance 17,465 24,327 24,327 51,201 79,743 102,780 161,595 182,576
TB Contingency (Train Ops) 150 175 175 213 260 260 384 384 T Fuel 9,659 21,894 21,786 41,633 63,865 75,139 94,711 112,869 B Non-Scheduled Rolling Stock Repairs 300 351 351 427 520 520 769 769 B Operating Facilities Maintenance 651 820 820 998 1,214 1,214 1,797 1,797 B Other Operating Train Services 142 166 166 202 246 246 364 364 D Rolling Stock Lease 978 - - - - - - - B Security - Sheriff 3,109 5,486 5,486 6,675 6,675 8,934 6,675 6,675 B Security - Guards 852 1,621 1,621 1,844 1,844 2,244 1,844 1,844 D Supplemental Additional Security 374 576 579 1,040 1,560 1,745 3,076 3,591 B Public Safety Program 910 468 468 569 693 693 1,025 1,025 B Passenger Relations 1,197 1,400 1,400 1,703 2,072 2,072 3,068 3,068 B Holiday Trains 151 177 177 215 262 262 388 388 B TVM Maintenance/Revenue Collection 2,917 3,413 3,413 4,152 5,051 5,051 7,477 7,477 B Marketing 882 1,032 1,032 1,255 1,527 1,527 2,261 2,261 B Media & External Communications 615 719 719 719 1,065 1,065 1,576 1,576 B Utilities/Leases 1,834 2,146 2,146 2,611 3,177 3,177 4,702 4,702 D Transfers to Other Operators 3,851 5,580 5,580 10,854 16,824 18,670 33,834 40,274 D Amtrak Transfers 800 1,329 1,329 2,183 2,733 3,776 5,928 7,885 B Station Maintenance 707 827 827 1,007 1,225 1,225 1,813 1,813 D Rail Agreements 3,187 5,100 4,936 11,949 20,307 29,638 37,409 46,594
Subtotal Operations & Services 74,018 108,696 108,426 189,974 282,327 340,828 493,556 567,563 Maintenance-of-Way
D MoW - Line Segments 20,355 24,749 24,749 30,111 36,634 36,634 54,227 54,227 D MoW - Extra-Ordinary Maintenance 500 877 877 1,067 1,299 1,299 1,922 1,922
Subtotal Maintenance-of-Way 20,855 25,626 25,626 31,178 37,933 37,933 56,150 56,150 Administration & Services
StaffB Salaries & Fringe Benefits 7,295 9,587 9,587 12,376 15,923 15,923 26,134 26,134 B Non-Labor Expenses 714 1,070 1,070 1,657 2,449 2,449 4,907 4,907 B Indirect Administrative Expenses 6,332 7,641 7,641 9,653 12,177 12,177 19,307 19,307
Subtotal Staff 14,342 18,298 18,298 23,686 30,549 30,549 50,347 50,347 Services
B Professional Services 570 667 667 811 987 987 1,461 1,461 Subtotal Administration & Services 14,912 18,965 18,965 24,498 31,537 31,537 51,809 51,809
B Contingency (Non-Train Ops) 650 760 760 925 1,126 1,126 1,666 1,666 B InsuranceB Liability/Property/Auto 6,590 8,177 8,177 10,661 13,836 13,836 23,044 23,044 B Claims 2,500 3,393 3,393 5,124 7,100 7,100 13,073 13,073
Claims 2,000 2,808 2,808 4,128 5,888 5,888 11,279 11,279 Increase Reserve 500 585 585 996 1,212 1,212 1,794 1,794
B Claims Administration 1,300 1,521 1,521 1,850 2,251 2,251 3,332 3,332 B Subtotal Insurance 10,390 13,091 13,091 17,635 23,187 23,187 39,449 39,449
Total Expenses Including MoW $120,825 $167,139 $166,869 $264,209 $376,109 $434,610 $642,630 $716,637
TABLE 9.1 OPERATING BUDGET COST COMPONENT SUMMARY ($000s)3.5% Annual Revenue Escalation; 4.0% Annual Cost Escalation
9.7

SCRRA Strategic Assessment, 1-26-07
annual ridership growth combined with the assumed fare increases provides for significant growth in fare revenues. Dispatching revenues are estimated based on agreements between the SCRRA and the freight railroads, Amtrak, and NCTD Coaster services. Dispatching revenues from the Union Pacific Railroad and Burlington Northern Santa Fe Railway are increased by the American Association of Railroads (AAR) Railroad Cost Index and Amtrak revenues are based on a formula that includes the movements of trains and certain performance incentives. For a conservative estimate, no increase in freight or Amtrak service on member agency-owned lines was assumed, but fees were assumed to grow at 3.5% annually. Other miscellaneous revenues associated with Amtrak TVM revenues and other minor reimbursements to the agency are assumed to grow at 3.5% from the FY 2005-06 level. Maintenance-of-way revenues are described in Section 9.5.
9.4.2 Expenses The following details expenses shown in Table 9.1. Train Operations - Operating Crews. For each of the years in the Strategic Assessment, SCRRA developed the number of crews needed to operate the projected levels of weekday and weekend service. A new crew is added for every new train set in operation. As is the case in FY 2005-06, crews are assumed to work five days each week. To cover the increased level of weekend service, the extra board is assumed to increase from the FY 2005-06 level of about 35% to 50% by 2030. Train Operations - SCRRA Dispatching. This represents the costs of SCRRA provided dispatching services over the rights-of-way territories owned by the SCRRA’s Member Agencies and is assumed to grow at 4% per annum due to labor and fringe benefit escalation. Equipment Maintenance. In FY 2005-06, the Metrolink fleet of rolling stock consists of 39 locomotives and 155 commuter rail cars including 39 cab cars and 116 passenger coaches. This equipment includes 17 leased pieces of operating equipment including 1 locomotive, 6 cab cars and 10 passenger coaches. No leased equipment is assumed for 2010. By 2010 the system is projected to grow to 48 locomotives and 226 cars. By 2030, Service Scenarios would require up to 116 locomotives and up to 672 cars. The associated maintenance of equipment expense is assumed to grow at a rate commensurate with the acquisition of new equipment. The equipment maintenance budget for FY 2005-06 was $17.5 million; this element grows to $182.6 million by 2030. Both increases in the rolling stock fleet size and an annual 4% escalation result in an annual rate of increase of 10.3%. In FY 2005-06, due to funding constraints and an operating constraint due to reduced levels of equipment, the preventative maintenance cycle for equipment was extended from 92
9.8

SCRRA Strategic Assessment, 1-26-07
to 180 days, but remained in conformance with Federal guidelines. The projection for 2010 through 2030 assumes continuation of the 180-day cycle, although SCRRA is working to return to the 92-day cycle. Contingency (Train Ops). The contingency for train operations including operating crews and equipment maintenance was $150,000 in FY 2005-06. It is increased to $175,500 in 2010 and is assumed to grow 4% per annum thereafter. Fuel. In FY 2005-06, usage of approximately 5.74 million gallons was based on projected consumption levels assumed in the proposed schedule. As service levels increase, fuel consumption increases in proportion to the train miles. The average cost of diesel fuel is estimated to be $3 per gallon in 2010 and to grow to $6.50 per gallon by 2030. Non-Scheduled Rolling Stock Repairs. This item is for repairs to accommodate medium-scaled unforeseen damage to rolling stock. The amount in FY 2005-06 was $300,000. This amount is assumed to grow at 4% per annum through 2030. Operating Facilities Maintenance. This function is responsible for the cleaning, maintenance, and hazardous materials compliance at the Central Maintenance Facility (CMF) in Los Angeles and other outlying SCRRA facilities. The FY 2005-06 budget was $651,000. An additional $50,000 is added for the proposed Eastern Area Maintenance Facility (EAMF) in San Bernardino and the proposed Keller Street Yard in Los Angeles and this amount is assumed to grow at 4% per annum through 2030. Other Operating Train Services. This budget includes a number of miscellaneous items directly related to operating the rail system. Weather data forecast and earthquake reporting services, publications, uniforms, and emergency bus services are items considered in this category. Total expenditures are $141,900 in FY 2005-06. These expenses are assumed to grow at 4% per annum through 2030. Rolling Stock Lease. While the FY 2005-06 Budget included $978,200 for lease of one locomotive and 12 rail cars, no lease costs are assumed from 2010 through 2030. Security - Sheriff. This line item assumes the addition of a satellite office in Riverside/Corona to service the Perris, IEOC and Orange County Local service. Escalation is assumed at 3% through 2010 and 4% thereafter. Security - Guards. This line item covers security at the CMF and layover locations. It is increased for additional guards at Keller Street, EAMF, Laguna Niguel and Perris. An annual escalation of 4% is assumed. Supplemental Additional Security. This program is funded through an increment on fare revenues implemented in FY 2002-03. This increment is approximately 0.75%; it is assumed to continue at that level through 2030. These funds provide for identified operational security needs, special one time upgrades to agency facilities, and
9.9

SCRRA Strategic Assessment, 1-26-07
prevention of and response to external threat incidents. Public Safety Program. This line item was reduced to $268,500 in FY 2005-06 to address the constraints imposed on the development of the FY 2005-06 Budget. It was then increased by $641,100 for Homeland Security grants. Homeland Security grants were not assumed for this Strategic Assessment, but if received, security-related items will be added to the budget and funded by the federal grants. The FY 05-06 level was increased to $400,000 and annual escalation of 4% assumed. Elements of the program include public outreach community events in the five counties, safety presentations, delivery of Operation Lifesaver21 materials to schools and community organizations, and other safety related campaigns. Passenger Relations. This line item includes the Station Call Box operations, the continuation of contracted Passenger Information Services, the Customer Promise program in which the SCRRA will guarantee to passengers the ability to reach their final destination, and other minor customer service related expenses. Annual escalation of 4% is assumed through 2030. Holiday Trains. Decoration and operation of the annual Holiday Train is assumed to continue at the FY 2005-06 level with annual escalation of 4%. The budget includes labor charges by the equipment maintenance contractor for support at the CMF during the decoration of the train, the costs of actual train operations, security, and limited community outreach, support and marketing costs. No offsetting sponsorships are assumed, but SCRRA staff and Member Agencies will continue to seek sponsorships. Ticket Vending Machine Maintenance/Revenue Collection. This item includes TVM and validator maintenance contracts, revenue collection contracts, ticket stock, replacement of destination and ticket type strips in the TVMs, fare/zone change programming, and merchant fees for credit and debit card usage. Included in this item is the expense to vend Amtrak fare media, which is offset by a corresponding revenue contribution from Amtrak. Annual escalation of 4% is assumed. Marketing/Market Research. This line item includes market research and analysis, advertising, promotions, special events, sales, merchandising, and channel marketing. Annual escalation of 4% is assumed. Media/External Relations. This line item includes media and public relations, community relations, web site maintenance and programming, and the production of the agency’s printed schedules and Ride Guides. Also included are outreach activities with station cities including special events and the increased development of partnerships with strategic stakeholders including station city staff, connecting transit agencies, local, state and federal regulators and elected officials. Annual escalation of 4% is assumed.
21 A nationwide, non-profit public information program dedicated to reducing collisions, injuries and fatalities at highway-rail crossings and on railroad rights-of-way.
9.10

SCRRA Strategic Assessment, 1-26-07
Utilities/Leases. Utility and lease costs are estimated at an annual escalation of 4%. Transfers to Other Operators. These transfers represent agreements between the SCRRA and other transit operators to allow Metrolink passengers the convenience of a transfer to connecting transit. Transfers are assumed to grow with ridership growth on each line and an annual escalation of 4%. Amtrak Transfers. The Rail 2 Rail Program – an agreement between Amtrak, Caltrans and SCRRA - allows all Amtrak ticketholders to ride any Amtrak or Metrolink train within the limits of their ticket and Metrolink monthly passholders to ride any Amtrak or Metrolink train within the limits of their ticket. This amount is assumed to grow with ridership on the Orange County and Ventura County Lines. A 4% annual escalation is assumed. On November 17, 2004 Amtrak, Metrolink and Caltrans started operation of two shared service trains operating as Amtrak 768 and 799 and Metrolink 108 and 103. These trains stop at all Metrolink stations between Los Angeles and Oxnard and accept all Metrolink fare media. In FY 2005-06 Metrolink reimbursed Amtrak at the rate of $3.50 per one-way, round trip and 10-trip Metrolink ticket holder carried on these two trains up to a cap of $50,000. This service is assumed to continue with 4% annual escalation. Station Maintenance. This item includes insurance and maintenance for the common areas at Los Angeles Union Station and maintenance of station equipment, signs, display cases, the electronic passenger information system (EPIS), and platform maintenance at all other stations. An annual escalation of 4% is assumed. Rail Agreements. This line item represents payments to freight railroads, the UP and BNSF, for dispatching and other operating related services over property owned by these railroads. The annual amount increases with train-miles operated over this property. An annual escalation of 4% is assumed. Maintenance of Way - Line Segments. The MOW philosophy of SCRRA is to perform ordinary maintenance sufficient to prevent any loss of service quality or schedule reliability, and to budget for rehabilitation/renovation at sufficient intervals to prevent the needed repairs or replacements from overwhelming the ordinary MOW budget. This philosophy is also used to support the agency’s policy of infrastructure preservation under the GASB-34 protocol and is practiced by all of the successful freight railroads on their main routes. In FY 2005-06, the SCRRA has primary responsibility for the maintenance and safety of approximately 337 track-miles within the five-county region. In projecting MOW expenses through 2030, maintenance of the Perris Valley Line is added by 2010 and annual maintenance expenses by line are assumed to increase by 4% each year. Maintenance of Way - Extraordinary Maintenance. Extraordinary maintenance was budgeted at $500,000 in FY 2005-06 to handle unscheduled events such as
9.11

SCRRA Strategic Assessment, 1-26-07
vandalism, crossing gate knockdowns, accidents, derailments, fires, and storm damage. A one-time increase of $250,000 in FY 2005-06 is assumed along with an annual escalation of 4% through 2030. Salaries and Fringe Benefits. Salaries and fringe benefits forecasts are based on the actual salary rate of each position charging directly to the train operations budget. An additive of 55% for fringe benefits is assumed in FY 2005-06. Positions frozen in FY 2005-06 are assumed to be filled by 2010. An amount of $100,000 is added each year through 2030 to allow for new positions. An annual escalation of 4% is assumed for this line item. Direct Non-Labor Costs. Costs included in this line include direct non-allocated management information systems (MIS) expenses including programming and maintenance of the agency’s dispatching system, travel and lodging expenses attributable to operating the train system, and other costs including training, non-revenue vehicle fuel, and additional minor miscellaneous expenses. To allow for increases in this item as the system grows, an amount of $50,000 is added each year. Annual escalation of 4% is assumed for this line item. Indirect Administrative Expenses. Costs allocated to train operations represent this budget’s share of the agency’s general and administrative costs. To allow for increases in this item as the system grows, an amount of $50,000 is added each year. Annual escalation of 4% is assumed for this line item. Professional Services. Professional services includes contracted services for the performance audit of operators, non-capital operating equipment engineering assistance, signage design, government relations, legal services, and other items. Annual escalation of 4% is assumed for this line item. Contingency. This line item was budgeted at $650,000 in FY 2005-06 and assumed to remain at this level for 2010 and 2015. Annual escalation of 4% is assumed for this line item after 2015. This item is utilized under authority of the Chief Executive Officer to deflect any unanticipated increase in expenses so as to avoid unnecessary increases to member agency subsidies in the event of short-term negative expense impacts. Insurance. Insurance includes premiums for operating liability, property damage and auto insurance. Premiums are assumed to increase annually by $100,000 to reflect service and physical plant increases and an additional annual escalation of 4% was assumed. The $2 million included for claims in FY 05-06 is increased annually by $100,000 in addition to annual escalation of 4%. Replenishment of the Self Insurance in FY 05-06 was budgeted at $500,000. In consideration of the actual replenishment need, this amount was increased by $200,000 in addition to annual escalation of 4%. Claims administration is assumed to grow with an annual escalation of 4%.
9.12

SCRRA Strategic Assessment, 1-26-07
9.5 Cost Allocation Over SCRRA’s history, more than 11 different formulae have been developed to allocate expenses and revenues to ensure equitable subsidy shares for the member agencies. These historic formulae are described in Appendix A.7. In 2006, during the Strategic Assessment process, the member agencies approved a new formula that allocated costs to member agencies using the primary cost drivers for each element of the operating budget. Table 9.2 shows how the operating subsidy would be allocated to member agencies based on the assumed service levels through 2030. It should be noted that the SCRRA Strategic Assessment is a conceptual program and no commitment is implied by any agency for operation of the proposed service levels or funding of the subsidy required to deliver the scenarios.
SUBSIDY LACMTA OCTA RCTC SANBAG VCTC TOTAL
2010 29,983.9 22,921.6 10,243.0 6,764.0 5,265.7 75,178.3 2011 31,930.7 24,056.8 11,534.5 7,300.0 6,974.3 81,796.3 2012 33,877.4 25,192.1 12,825.9 7,835.9 8,683.0 88,414.3 2013 35,824.1 26,327.4 14,117.3 8,371.9 10,391.6 95,032.3 2014 37,770.9 27,462.6 15,408.7 8,907.9 12,100.2 101,650.3 2015 39,717.6 28,597.9 16,700.2 9,443.8 13,808.8 108,268.2 2016 42,229.9 30,774.0 18,252.8 9,976.9 14,889.3 116,122.9 2017 44,742.1 32,950.1 19,805.5 10,510.0 15,969.9 123,977.6 2018 47,254.4 35,126.1 21,358.2 11,043.1 17,050.4 131,832.3 2019 49,766.7 37,302.2 22,910.9 11,576.2 18,130.9 139,686.9 2020 52,279.0 39,478.3 24,463.6 12,109.3 19,211.4 147,541.6 2021 53,873.1 40,707.6 26,562.6 12,187.1 20,340.9 153,671.3 2022 55,467.2 41,936.9 28,661.6 12,264.9 21,470.4 159,801.0 2023 57,061.4 43,166.2 30,760.5 12,342.7 22,599.8 165,930.6 2024 58,655.5 44,395.5 32,859.5 12,420.5 23,729.3 172,060.3 2025 60,249.6 45,624.8 34,958.4 12,498.3 24,858.8 178,190.0 2026 61,843.8 46,854.0 37,057.4 12,576.2 25,988.3 184,319.7 2027 63,437.9 48,083.3 39,156.4 12,654.0 27,117.8 190,449.3 2028 65,032.0 49,312.6 41,255.3 12,731.8 28,247.2 196,579.0 2029 66,626.2 50,541.9 43,354.3 12,809.6 29,376.7 202,708.7 2030 68,220.3 51,771.2 45,453.3 12,887.4 30,506.2 208,838.4
The Strategic Assessment is a conceptual program and operating costs are based on assumedservice levels. No commitment for service level or subsidy is implied for any agency.Modeling for 2010, 2015, 2020 and 2030. Interim years estimated from straight line interpolation.
TABLE 9.2: PROJECTION OF OPERATING SUBSIDIES 2010-2030 ($000s)
9.13

SCRRA Strategic Assessment, 1-26-07
10.0 Rehabilitation/Renovation Costs Rehabilitation/renovation projects are those projects that replace worn out assets with like or improved assets and thus preserve and extend the useful life of the infrastructure assets (the physical plant and the rolling stock). Rehabilitation/renovation project prioritization recommendations are based upon tolerating only the most minimal and manageable risk of failure. Railroad infrastructure and equipment deteriorates due to age, weather, and wear. At a minimum, the SCRRA’s rehabilitation/renovation program is required to overcome this deterioration and maintain a steady state of serviceability. The performance of the infrastructure is also expected to improve to match developing needs of the users in the areas of speed and weight capacity. A rehabilitation/renovation program typically incorporates upgrades to deteriorating components with state-of-the-art components to match these higher levels of service, resulting in reduced operating maintenance expense and improved operations. Rehabilitation/renovation is performed when the infrastructure or equipment has worn or deteriorated to a level that does not yet impair serviceability, yet the assets are close to being consumed. In order to extract exactly 100% of the service life of assets, their replacement would be performed on the day of failure, which would require very close inspection procedures, many disruptions to train service, and very labor intensive replacements of small amounts of assets. In lieu of this approach, the railroad industry has adopted a “cycle” of rehabilitation whereby large groups of assets or components of equipment are replaced when they are close to failure using economically large workforces and machines to achieve low unit costs of performing the work and to minimize disruption of train service. 10.1 Railroad Infrastructure In 1994-96 SCRRA developed a set of assumptions for demand for SCRRA’s annual rehabilitation/renovation program to keep the infrastructure at a steady state of good repair and high reliability and safety. This work has also become incorporated into the supporting material behind the GASB-34 process to document SCRRA’s continuing maintenance of the infrastructure. In light of recent considerable increases in construction costs and other obligations (e.g. agency costs), the original estimates have been updated to represent current values. The estimate is compiled by counting the major elements of infrastructure and their estimated service life to obtain an annual replacement rate. Unit prices from recent contract experience are applied to the annual quantity of replacement to determine the annual funding required. The GASB-34 policy requires a triennial inspection and rating of the infrastructure; this becomes the "report card" on whether the assumptions made in this life cycle study and the funding for those forecasted rehabilitation expenses have actually achieved the stated goal of a steady state of infrastructure maintenance.
10.1

SCRRA Strategic Assessment, 1-26-07
10.1.1 Unit Count Units for year 2005 were counted from the infrastructure documents including track charts, crossing records, bridge books, and signal drawings. Units were added for future years to expand the infrastructure as more miles of track and other features are added in support of the service levels22.
Units for track elements are based upon the type of track component. Rail is sorted based on how sharp the curve is, because rail wears out faster on sharp curves, less so on medium curves, and lasts the longest on tangent (“straight”) track. Turnouts are sorted as to size because the larger size ones cost more. Wood ties and concrete ties are counted from SCRRA track charts that provide the layout and properties of the Metrolink system. Ties are counted at the rate of 2,640 concrete ties per mile and 3,250 wood ties per mile (both are the nominal rate of ties per mile, not an actual physical count of ties). Road crossings are counted and normalized to an average 80-foot length; they are counted for each track in a crossing. Signal units are based on examination of signal plans for each line. These plans indicate the devices, housings, and control circuits at each location; these amounts are totaled over each territory on the worksheets. Small bridges are counted as “culverts” and are used to represent the maintenance of the embankment and drainage features of the infrastructure. Large steel bridges are counted on a linear footage basis to budget for periodic painting and corrosion control. Concrete bridges are assumed to have more than 60 years of service life and are not counted at all. The few remaining timber bridges are all planned for conversion to concrete by 2010 and are not counted. 10.1.2 Service Life The service life is an estimate furnished by SCRRA Engineering staff. Some elements are limited by wear and decay (e.g. crossties and rail), and others are limited by obsolescence; manufacturers do not support obsolete communication and signal equipment. Rail life is assigned a number of years, sorted by sharp or medium curve, or tangent track, for a traffic level of about 25 million gross tons (MGT) per year. The current
22 No unit counts (or costs) were included for rehabilitation of any form of Positive Train Control (PTC). Installing PTC, which prevents train-to-train collisions through positive train separation, is a high priority goal of SCRRA and the rail industry as a whole and is included in the 2015 Capital Plan in Chapter 11. Any form of PTC has to meet regulatory and compatibility criteria that are unknown as of this writing. Most forms of PTC under consideration use electronic hardware and still-maturing software that have volatile costs. Because of the unknown time that PTC may be installed and the unknown nature of the hardware, it is too speculative to assume the inclusion of a PTC element to the infrastructure asset. A year 2010 or 2020 version of this document would likely have a PTC component in the rehabilitation/renovation program.
10.2

SCRRA Strategic Assessment, 1-26-07
rate of rail traffic varies between 15 and 25 MGT; but as freight and passenger traffic increase in future decades, this figure will serve for planning purposes. It is intended to forecast a useful life of about 1.5 billion gross tons for tangent track and about 300 MGT on sharp curves. A pro-active rail maintenance program (lubrication and profile grinding) is needed to achieve these service lifespans. Rail grinding is carried as a specific line item in the life cycle costing analysis; lubrication is considered an operating expense. Crosstie life is based on close observation of past experience on the SCRRA territory for wood crossties and on industry-accepted nominal life for concrete ties. Since the oldest concrete ties were installed in 1992, there is no local history on concrete tie life that approaches the industry-assumed 50-year life for them. In some cases the service life is shortened from the nominal life of the asset as a whole in order to represent a partial investment in some of the components during the middle of the service life. For example the concrete crossties are expected to last 60-plus years. However the rubber and nylon fastening elements must be replaced at 10 to 15 years, so the service life is reduced to a lower number (45 years) to allow for planning for more funds for these needs. 10.1.3 Unit Cost Unit costs represent 2005 project experience for replacement of that asset, including the material purchase, contractor installation, support services, and agency costs. Due to the volatility of construction and commodity prices and the changing technologies of both signal and track components, these costs should be reviewed periodically to assure that the gross dollar amounts forecast for rehabilitation continue to yield appropriate units of replacement assets. The unit cost for curve rail includes costs for a mid-life transposition of the rail to extend the service life. 10.1.4 Annual Budgets and Programs Each year the managers of the infrastructure compile rehabilitation programs based on that current year’s need; assets are not replaced based solely on years of service. Asset elements are examined during routine visual inspections. These inspections are supplemented by records of failures and by optical scanning of rail to determine wear in order to compile a recommended list of the most-needed replacement needs. In some years certain elements will be emphasized and others deferred. An example of a prudent change of program is to replace crossties earlier than planned: when the rail line is shut down for other reasons, or before that section of the track will be boxed in between new station platforms. Or a replacement program element may be deferred if it will be eliminated in a near-term capital construction program.
10.3

SCRRA Strategic Assessment, 1-26-07
Over a multi-year term there will be a trend towards uniformity of these levels of rehabilitation/replacement over the whole spectrum of assets and territories. There is a high level of confidence that the annual program review and compilation will result in replacement of only those assets that are nearing the end of their service life and that a reliable stream of rehabilitation funding means that the assets can be left in service until the year that represents the optimum time to replace them. In some cases, annual amounts might be accumulated for several years and a larger replacement project scheduled. However, annual amounts will average to those provided in Table 10.1. For the 25-year period of the Strategic Assessment, annual escalation of 4% is assumed. As track and other infrastructure are added, the unit counts are increased to add these elements into the rehabilitation/renovation program. Operating maintenance will replace those few assets that fail or are damaged before their nominal service life. Operating budgets include an allowance for these exception-based repairs and replacements. The Operating Budget is generally not robust enough to accommodate an ever-increasing amount of asset replacement that would be required if the service life of a whole group of assets were exceeded. Absent rehabilitation/renovation, train service quality and reliability would be impacted and in the end, halted, if timely rehabilitation is not accomplished. 10.1.5 Allocation to Member Agencies Capital rehabilitation/renovation allocations are based principally on the availability of third party (state, federal, other) grants, or are allocated to rehabilitation/ renovation projects based on the physical location or ownership of an asset relative to each member. Systemwide projects such as rolling stock, projects in the River Corridor (parallel to the Los Angeles River) or related to TVMs or Public Address Changeable Message Signs (PACMS) are allocated to all member agencies based on the All Share formula described in Appendix A.7.
Table 10.1 provides the annual rehabilitation/renovation need through 2030 for railroad infrastructure. This study yields an annual requirement of about $31.6 million in FY 2005-06. The SCRRA rehabilitation budget for railroad infrastructure in that year was about $24 million and has been about this level (in constant dollars) for several years. In spite of this rehabilitation funding being at only about 76% of the projected rate, the SCRRA infrastructure is functioning well as evidenced by an absence of delays to service, acceptable ride quality, absence of public complaints, absence of regulatory findings and fines, etc. The primary reason for this lower level of investment is that significant parts of the SCRRA infrastructure are quite young and have not yet reached the state or wear or deterioration that is projected in the life cycle study. For example, the Orange County Line from Fullerton to San Clemente has almost 100% young rail, installed either by the 1988-89 LOSSAN program or the 1994-96 SCRRA second main track projects.
10.4

SCRRA Strategic Assessment, 1-26-07
ASSETNOMINAL
LIFEOBLIGATION
2005-06OBLIGATION
2009-10OBLIGATION
2014-15OBLIGATION
2019-20OBLIGATION
2029-30Tangent Rail 70 2,246,514 2,742,725 3,518,223 4,507,677 7,069,227Moderate Curve Rail (1) 30 913,683 1,068,880 1,331,295 1,777,306 2,791,908Sharp Curve Rail (1) 15 2,305,800 2,697,460 3,281,872 4,035,152 6,056,404Rail Grinding 1 289,483 338,655 412,025 501,291 742,034Wood Crossties (2) 35 3,652,246 4,272,612 5,103,127 6,208,734 9,190,443Concrete Crossties 60 1,545,392 1,970,110 2,729,040 3,733,429 6,174,904Concrete Tie Fasteners 15 494,525 630,435 873,293 1,194,697 1,975,969Ballast Undercutting 50 3,207,960 3,884,153 4,946,122 6,348,118 9,927,369Small Turnouts No. 7 or 8 (3) 30 563,667 926,138 1,388,203 1,820,569 2,824,761Small Turnouts No. 10 20 1,978,250 2,458,165 3,019,912 3,709,684 5,491,238Med. Turnouts No. 14 20 607,500 723,850 800,613 1,032,512 1,557,207Large Turnouts No. 20 20 1,246,000 1,506,778 2,092,268 2,884,973 4,808,759Large Turnouts No. 24 24 150,000 210,575 256,196 311,702 461,395No. 8 Double Slip Switch 20 105,000 122,835 149,448 181,826 269,147No. 10 Double Slip Switch 20 21,000 24,567 29,890 36,365 53,829Crossing Frogs 20 108,000 126,345 153,718 202,606 299,907Road Crossings as 80' 25 2,442,880 2,989,597 3,737,503 4,876,401 7,525,041Culverts 50 301,920 353,204 429,726 522,828 773,913Steel Bridge Painting 30 627,000 733,501 916,975 1,315,300 2,073,891Steel Bridge Replacement 100 837,240 979,452 1,224,447 1,756,336 2,769,291Tunnel Subgrade and Track 30 545,633 638,314 776,606 944,860 1,398,624Hwy-Rail Grade Xing Warning Devices
#8 20 11,066 12,945 15,750 19,162 28,364#9 20 382,854 447,885 544,920 662,979 981,371#8A 20 1,500 1,755 2,135 2,597 3,845#9A 20 282,503 330,489 402,090 489,204 724,142
Hwy-Rail Grade Xing Control EquipmentPREDICTOR, GCP 3000D2 20 576,761 722,660 955,486 1,309,854 2,076,243PREDICTOR, GCP 4000 20 149,926 175,392 213,391 259,622 384,305PREDICTOR, HXP 3R2 20 470,713 560,385 681,794 829,507 1,227,873
Hwy-Rail Grade Xing Batteries 10 298,277 348,942 424,542 516,520 764,576Hwy-Rail Grade Xing Ugrnd Facilities 25 699,519 818,338 995,633 1,211,340 1,793,079CONTROL POINT
CP Switch Machine, Complete 20 687,355 890,882 1,171,873 1,502,831 2,319,624CP Cantilever Signals 40 53,159 62,188 75,661 92,054 142,186CP Ground Signals 30 172,065 210,178 269,770 345,976 519,918CP Control Equipment w/software 20 260,849 313,834 397,663 498,803 735,181CP Batteries 10 140,300 164,131 199,690 242,954 359,631CP Underground Facilties 30 151,051 176,709 214,993 261,572 387,191
Wayside DetectorsHOT BOX DET 20 54,180 63,383 77,115 93,822 138,880DED 20 5,934 6,942 8,446 10,276 15,211HWD 20 1,511 1,768 2,151 2,617 3,873
Relays 20 411,840 481,795 586,177 713,174 1,055,672PTC Wayside Devices 12 0 1,784,034 2,277,299 2,871,697 4,272,174Sealed Corridor 25 0 584,929 1,423,312 2,597,515 3,844,956Base Station Radio Equipment (BCP) 10 67,500 78,965 96,074 116,888 173,023Mobile Communications Package (MCP) 10 44,550 55,276 73,016 94,290 138,418Communications Shelter 30 196,667 230,072 279,918 357,880 529,750Signal Equipment Enclosure 35 2,028,571 2,402,388 2,968,622 3,642,705 5,437,867Standby Generators (MOC, Mission, LAUS) 20 13,500 15,793 19,215 23,378 34,605Fiber Optic Sonet Equipment 20 0 0 0 0 0Fiber Optic Sonet Laser Component 10 0 0 0 0 0Fiber Optic Underground Facilities 30 261,030 305,368 371,527 452,020 669,099Video Camera 6 6,500 7,604 9,252 11,256 16,661Video Equipment 15 13,333 15,598 18,977 23,089 34,177TOTAL 31,632,707 40,668,979 51,946,994 67,157,949 103,047,155
(1) Costs include transposing rail at mid-life. (2) Premium wood ties: air seasoned, borate treated, creosoted hardwood.(3) Life of turnout shortened from 20 to 18 years to account for frog replacement at 10 years.
TABLE 10.1: TRACK, BRIDGE AND SIGNAL/COMMUNICATIONS REHABILITATION/RENOVATIONAssumes annual escalation of 4%
10.5

SCRRA Strategic Assessment, 1-26-07
Other examples of large blocks of SCRRA infrastructure that were funded under original SB 1402 or follow-on grants for service expansion and are far away from reaching their projected service life limits include Union Station leads and turnouts, El Monte to Claremont 100% new track, new rail Glendale-Sylmar, Northridge earthquake line changes, new track Palmdale-Lancaster, second main track Van Nuys, second main and long sidings Pomona to San Bernardino, new CTC system, new grade crossing surfaces and signals, Tunnel 26 subgrade and track replacement, and new ties and turnouts within CMF and IEMF. This lack of immediate need for rehabilitation of new segments varies by line and may represent about 20% of the system assets overall. 10.2 Rehabilitation of Rolling Stock The rolling stock rehabilitation/renovation program is composed of several programs designed to replace and or upgrade components of the rail cars and locomotives. In projecting expenses through 2030, annual escalation of 4% and the equipment required for an average of 5-car train sets are assumed. The elements of the programs are described below:
10.2.1 Unit Count Units for 2005 were counted from the rolling stock inventory. Units are added for future years as more rolling stock is acquired to support the growth of the system.
Units for rail cars include car door operators; truck assemblies; heating/ventilation/air conditioning (HVAC); car paint (pre-2006 cars only), bodywork and decals; carpet, seat cushions and foam; emergency windows; car batteries and installation of pushback couplers. Units for locomotives include four traction motors; locomotive engine; locomotive Head-end power (HEP) engine; locomotive turbochargers; and locomotive HVAC. 10.2.2 Service Life The service life is an estimate furnished by SCRRA Equipment staff. Car door operators are replaced on a four-year cycle; truck assemblies after 400,000 to 500,000 miles; heating/ventilation/air conditioning (HVAC) every four years; car paint (pre-2006 cars only) after 15 years; bodywork and decals as needed; carpet, seat cushions and foam every 10 years; emergency windows and car batteries on the original equipment are scheduled for replacement over the next five years. Traction motors are replaced every 400,000 miles; locomotive engines on a 10 to12 year cycle; locomotive HEP engine on a four-year cycle; and locomotive turbochargers and locomotive HVAC on eight to 10-year cycles.
10.6

SCRRA Strategic Assessment, 1-26-07
10.7
10.2.3 Unit Cost Unit costs are estimated for FY 2006-07 based on FY 2005-06 project experience for replacement of each component, including the material purchase, contractor installation, support services, and agency costs.
10.2.4 Annual Budgets and Programs Each year the Equipment Department compiles a rehabilitation program based on that current year’s need; components are not replaced based solely on years of service. Asset elements are examined during routine visual inspections. These inspections are supplemented by records of failures to determine a recommended list of the most-needed replacement needs. In some years certain elements will be emphasized and others deferred. In FY 2006-07 a new program was added to design and then install pushback couplers on existing rail cars. The pushback coupler is an integral part of Crash Energy Management. Engineering/design is programmed at $550,000 in FY 2006-07. The estimate as of January 2006 is $250,000 for the prototype to be delivered in FY 2007-08. Six cars are scheduled at this unit cost from FY 08-09 each year through 2030. Over a multi-year term there will be a trend towards uniformity of these levels of rehabilitation/replacement over the whole span of components. There is a high confidence that the annual program review and compilation will result in replacement of only those components that are nearing the end of their service life, and that a reliable stream of rehabilitation funding means that the assets can be left in service until the year that represents the optimum time to replace them. For the 25-year period of the Strategic Assessment, annual escalation of 4% is assumed. As rolling stock is added, the unit counts are increased to add these elements into the rehabilitation/renovation program. 10.2.5 Allocation to Member Agencies The rolling stock rehabilitation/renovation program is partially funded by interest on proceeds from the U.S. Leveraged Lease Transaction on SCRRA rolling stock and member agency funds. The remaining funding for this systemwide activity is split among the member agencies using the revised All-Share formula described in Appendix A.7.
Table 10.2 provides annual costs through 2030.

SCRRA Strategic Assessment, 1-26-07
10.8
2006-07 Unit Costs
2006-07 ($mill)
2009-10 ($mill) 2014-15 ($mill) 2019-20
($mill)2029-30 ($mill)
Number of locomotives (excludes leased locomotive) 38 48 60 75 116
Number of cars (excludes leased cars) 139 240 289 361 561
$17,286 $0.622 $0.700 $1.771 $2.823 $6.494
$45,833 $0.275 $0.309 $0.782 $1.247 $2.870
$62,500 $0.375 $0.422 $0.810 $1.293 $2.960
$6,944 $0.250 $0.281 $0.711 $1.134 $2.609
$50,000 $0.000 $1.350 $3.415 $5.444 $12.522
$25,000 $0.000 $0.394 $0.996 $1.588 $3.652
$20,000 $0.000 $0.517 $0.000 $0.000 $0.000
$20,000 $0.000 $0.585 $1.480 $2.359 $5.426
$580,000 $1.160 $1.305 $2.507 $3.999 $9.155
$75,833 $0.455 $0.512 $0.983 $1.569 $3.591
$46,667 $0.280 $0.315 $0.605 $0.965 $2.210
$56,667 $0.340 $0.382 $0.735 $1.172 $2.683
$50,000 $0.200 $0.225 $0.569 $0.907 $2.087
$152,005 $0.304 $0.342 $0.000 $0.000 $0.000
$250,000 $0.550 $1.687 $2.053 $2.620 $3.878
Non-Revenue Vehicles $0.500 $0.675 $0.821 $0.999 $1.479
On-Rail Equipment $1.304 $1.760 $2.142 $2.606 $3.857
$15.000 $20.529 $36.971
$10.000 $13.686 $24.647
$31.615 $11.762 $54.594 $30.725 $127.091
$1.897 $0.706 $3.276 $1.843 $7.625
$33.512 $12.468 $57.869 $32.568 $134.717
PROJECT TITLE & DESCRIPTION
Car HVAC Overhaul (36 cars per year in 06-07)
Locomotive HEP Engine Overhaul (6 locomotives per year in 06-07)
TABLE 10.2: ROLLING STOCK AND EQUIPMENT REHABILITATION/RENOVATION THROUGH 2030Assumes annual escalation of 4% and average of 5-car trains for future years
Locomotive Turbos (6 locomotives per year in 06-07)
Car Trucks Overhaul (6 cars per year in 06-07)Locomotive Traction Motor Overhaul (6 locomotives per year in 06-07)
Car Door Operators Overhaul (36 cars per year in 06-07)
Car Seat Cushion Changeout (7-year cycle, approx 24 cars per year in 07-08)
Car Carpet Changeout (10-year cycle approx 14 cars per year in 07-08)
Car Emergency Window Install (replace first 112 cars at 23 per year)Car Battery Installation (26 per year in 07-08)
Overhaul Loco Main Engine & Trucks, Paint, Bodywork & Decals (2 per year on 06-07)
Pushback Coupler Design in 2006-07 (Prototype in 2007-08 and 6 per year thereafter)
ACE Vehicle Lease (1 cab, 1 coach)
GRAND TOTAL
Locomotive HVAC (6 locomotives per year in 06-07)
Car Paint, Bodywork & Decals (4 cars per year in 06-07)
SUB-TOTAL
SCRRA G&A (Estimate 6% of Total Cost)
Ticket Vending MachinesSignage

SCRRA Strategic Assessment, 1-26-07
10.3 Rehabilitation of Non-Revenue Vehicles, On-Rail Equipment, Ticket Vending
Machines (TVMs) and other Equipment This item is composed of rehabilitation/renovation programs on SCRRA non-revenue vehicles, on-rail equipment, ticket vending machines, validators, and changeable message signs and other similar equipment. The funding for these items is split among the member agencies using the revised All-Share formula described in Appendix A.7. In projecting expenses through 2030, annual escalation of 4% is assumed. The non-revenue vehicles are replaced on an ongoing vehicle replacement cycle. The $500,000 budgeted in FY 06-07 is grown by 20% to allow for added contractors and SCRRA staff and then escalated 4% each year. The On-Rail equipment budget of $1.3 million is grown by 20% and then escalated at 4% each year. The TVMs and other equipment elements of the Metrolink system have been upgraded or replaced starting in 2005. Key components of the TVMs were not replaced when the TVM retrofit program was completed in 2005. This type of equipment has a useful life of about 10 years and the second replacement is programmed for 2015. In FY 2006-07 dollars, equipment replacement is estimated at $15 million for TVMs and another $10 million for signage. In 2015 dollars, the total for equipment replacement is $34.2 million. After the 2015 replacement, the equipment would be scheduled for replacement in about 2025. Since this study looks at 2020 or 2030, the third replacement is programmed in 2030. In 2030 dollars the total for equipment replacement is $61.6 million. Equipment replacement costs are included in Table 10.2. Total Rehabilitation/Renovation costs by member agency through 2030 are included in Table 10.3.
ANNUAL OBLIGATION 2009-10 ANNUAL OBLIGATION 2014-15 ANNUAL OBLIGATION 2019-20 ANNUAL OBLIGATION 2029-30
Track/bridge/signal 40,668,979 51,946,994 67,157,949 103,047,155Equipment 12,467,615 57,869,264 32,568,012 134,716,974TOTAL 53,136,594 109,816,258 99,725,961 237,764,130LACMTA 26,484,436 52,291,336 49,607,358 112,456,142OCTA 11,691,878 23,661,650 20,866,277 49,902,988RCTC 5,490,929 13,615,521 10,709,575 29,730,255SANBAG 6,121,339 13,097,496 12,007,671 30,053,046VCTC 3,494,612 7,328,618 6,752,086 15,942,920
TABLE 10.3: MEMBER AGENCY SHARES OF REHABILITATION/RENOVATIONAssumes annual escalation of 4%
10.9

SCRRA Strategic Assessment, 1-26-07
11.1
11.0 Capital Costs
The purpose of this chapter is to identify the cost of the capital improvements required to support the service levels envisioned in the Service Scenarios through Year 2030. The requirements for each Scenario are specified, along with their costs in current dollars and in the escalated dollars of the future years in which the costs are likely to be incurred. The capital improvements are designed to allow operation of the proposed services while maintaining reliability and preserving the SCRRA on-time performance goal of 95% of all trains arriving at their final destination within five minutes of the scheduled time. Shares of these costs to be borne by the SCRRA member agencies are also identified. It is understood that member agencies may identify state or federal revenues to meet these shares, but the type of funding is not identified. It should also be noted that the capital costs for improvements on the BNSF and UPRR railroads are not based on any formal modeling or negotiations between SCRRA and the freight railroads. The chapter concludes with a comparison of the capital costs of each Scenario. 11.1 Improvements by Scenario Year 2010 This Scenario assumes capital improvements aimed at supporting largely existing service levels. The major service improvement will be the initiation of Orange County Local Service. This improvement will add trains between Fullerton and Laguna Niguel to the extent that 30-minute, bi-directional headways from early morning until late night are achieved. This improvement will be sponsored by OCTA. Costs for this improvement will total $232.4 million in 2005 dollars. These improvements are assumed to occur in 2008, with inflation pushing total costs to $261.4 million in that year23. The specific cost items are cited in Table 11.1. SCRRA anticipates several other capital improvements required to support services by 2010. These include triple tracking the BNSF mainline between Los Angeles and Fullerton, along with other key track capacity improvements; a new Eastern Area Maintenance Facility; a maintenance-of-way (MOW) facility; communications improvements; Sealed Corridor safety improvements; and additional parking. In all, total capital costs amount to $466.3 million in 2005 dollars, and to $524.6 million in inflated 2008 dollars, as shown in Table 11.1. The table also identifies various improvements needed for 2010 operations, which are already funded. These improvements sum to $397.0 million in 2005 dollars; they include rolling stock, maintenance facility, station, grade separation, and other improvements.
23 Capital costs here are inflated at 4% per year. Most costs are assumed to occur two years prior to the implementation of the Scenario. Rolling stock procurement takes three to four years but average cost assumed two years prior to implementation. This assumption is made for the improvements for all Scenarios.

SCRRA Strategic Assessment, 1-26-07
11.2
OCTA 2009 Service Expansion Costs in 2005$ Costs in 2008$ LACMTA OCTA RCTC SBAG VCTC NotesTurnback Facility at Fullerton Station 3,629,800$ 4,083,031$ 4,083,031$ Additional Track La Palma to Fullerton 27,144,050$ 30,533,365$ 30,533,365$ Relief Sidings between Anaheim Stn and La Palma 3,075,860$ 3,459,924$ 3,459,924$ Pedestrian Grade Separation at Orange 4,833,400$ 5,436,918$ 5,436,918$ Relief Sidings between Tustin and Santa Ana Stns 2,154,160$ 2,423,137$ 2,423,137$ Turnback Facility at Lag Niguel/Mission Viejo Stn 9,335,900$ 10,501,618$ 10,501,618$ Fullerton Parking Expansion 10,400,000$ 11,698,586$ 11,698,586$ Station Expansions 60,000,000$ 67,491,840$ 67,491,840$ Orange Parking Expansion 26,506,200$ 29,815,870$ 29,815,870$ Tustin Parking Expansion 7,006,150$ 7,880,966$ 7,880,966$ Laguna Niguel/Mission Viejo Parking Expansion 59,428,000$ 66,848,418$ 66,848,418$ Irvine Parking Expansion 18,875,000$ 21,231,808$ 21,231,808$ Rolling Stock (see below) -$ -$ -$ Subtotal OCTA 232,388,520$ 261,405,480$ 261,405,480$
BNSF mainline LA-Fullerton (assumes 91,IEOC,OC) (1) 30,000,000$ 33,745,920$ 6,549,157$ 18,795,632$ 7,359,611$ 1,041,519$ Estimate from BNSF 10/05MOW Facility 9,000,000$ 10,123,776$ 4,808,794$ 2,004,508$ 1,123,739$ 1,457,824$ 728,912$ 2005 estimate. Allshare splitFiber/Communications 55,200,000$ 62,092,493$ 29,493,934$ 12,294,314$ 6,892,267$ 8,941,319$ 4,470,659$ 11/26/05 estimate. Allshare splitOlive Subdivision Siding 11,624,338$ 13,075,799$ 7,676,409$ 4,242,443$ 1,156,947$ IEOC share White (30.3) to San Dimas (27.8) on SB Line 27,000,000$ 30,371,328$ 17,699,195$ 12,672,133$ Sealed Corridor 50,000,000$ 56,243,200$ 26,715,520$ 11,136,154$ 6,242,995$ 8,099,021$ 4,049,510$ Systemwide improvements-AllshareParking Requirement 51,128,000$ 57,512,047$ 33,295,974$ 5,399,347$ -$ 17,826,845$ 989,880$
TOTAL 466,340,858$ 524,570,043$ 118,562,574$ 318,711,844$ 25,861,055$ 51,195,607$ 10,238,962$
Needed Improvements Already FundedCars 108,176,000$ Available for Base OrderLocomotives 13,276,873$ Available for rehab of locosOCTA Rolling Stock 150,100,000$ 7 locos, 7 cabs and 42 cars5th Lead 7,466,047$ TCRPKeller Street 5,000,000$ OCTA CMAQPlatform and Track 13 at LAUS 3,000,000$ OCTA CMAQEAMF Phase I 19,969,265$ Funded by MTA,OCTA,RCTC,SBAGTriple Track LA-Full+Valley View Grade sep 87,000,000$ Caltrans' TCRP projectEPIS 2,964,000$ Funded in 2006 BudgetTOTAL FUNDED PROJECTS 396,952,185$
Notes:Costs expressed in 2008 dollars, when costs for improvements are likely to be incurred (1) Full share included here. Actual splits with State/locals TBDOn average, improvements supporting 2010 operations will begin in 2008 Escalation factor from 2005 to 2008 at 4% per annum 1.125
Table 11.1: Capital Improvements Needed for 2010
Member Agency Shares Expenses in YOE $s (using 2010 train miles)

SCRRA Strategic Assessment, 1-26-07
11.3
Year 2015 This Scenario sees service improvements on most lines. The increasing service levels in turn trigger needs for layover facility, station, track capacity, and equipment maintenance facility improvements. The five largest improvements will be for stations (including parking and a Phase 1 renovation of LA Union Station24), additional Sealed Corridor improvements, completing the triple tracking of the BNSF mainline between Fullerton and West Riverside, completing the double tracking of the UP mainline between Los Angeles and West Riverside, and additional rolling stock. Assuming average train consist of 6-car train sets, capital costs for implementing this Scenario sum to $1,144.2 million in 2005 dollars, and to $1,566.8 million in inflated 2013 dollars, as shown in Table 11.2. Shares of these costs accruing to individual SCRRA member agencies are cited in the Table in 2013 dollars. Year 2020A This is the first of two Scenarios, which envision different service levels on Metrolink lines in 2020. The major capital costs differences relate to these service level differences. 2020A has the lesser train volumes than 2020B, and thus has the lower capital costs. Both 2020A and 2020B assume the same level of track capacity improvements. The costs for improvements supporting 2020A appear in Table 11.3. These total to $725.2 million in 2005 dollars, assuming 6-car train sets. These costs inflate to $1,207.6 million in 2018 dollars. Year 2020B This Scenario has the greater train volume of the 2020 Scenarios, and thus has the greater capital costs. This is because, with more trains, there will be more riders, who trigger more parking improvements. Also, more trains will trigger more layover facility improvements and rolling stock. The costs for improvements supporting this 2020B appear in Table 11.4. These total to $1,166.6 million in 2005 dollars, assuming 6-car train sets. These costs inflate to $1,942.5 million in 2018 dollars. Years 2030A and 2030B It is important to note here that 2030A and 2030B will likely require additional capital improvements on the BNSF such as a 4th main track between Los Angeles and Fullerton. However there has been no formal modeling or discussions between SCRRA and the BNSF for this level of trains and at this time there is no estimate for the cost of this or any other such project that might be needed for 2030 service on the Orange County, IEOC and 91 Lines. As with the 2020 Scenarios, these assume different service levels. 2030A has fewer trains than 2030B. Improvements for both 2030A and 2030B are incremental to 2020A. 2030B does have higher parking improvement costs than 2030A, as the 2030B attracts more riders. The same track capacity improvements are required for both 2030 Scenarios. Total capital costs for 2030A appear in Table 11.5, and those for 2030B appear in Table 11.6.
24 LAUS will be renovated in two phases – initially to provide for more track space, and ultimately to provide for increased passenger circulation needs.

SCRRA Strategic Assessment, 1-26-07
11.4
Line(s)Capital Improvements 2005 2013 LACMTA OCTA RCTC SBAG VCTC Benefited
4%Layover Facilities Montalvo 3,475,800$ 4,756,872$ 2,146,966$ 2,609,906$ Ven Co Lancaster 1,751,000$ 2,396,364$ 2,396,364$ AV South Riverside (N. of Station) 2,014,000$ 2,756,298$ 350,433$ 1,165,232$ 1,105,774$ 134,859$ 91 and IEOC North Riverside (S. of Station) 3,247,000$ 4,443,744$ 2,676,778$ 1,045,124$ 721,842$ Riv (UP) Subtotal 10,487,800$ 14,353,278$ 7,570,542$ 1,165,232$ 2,150,899$ 856,700$ 2,609,906$
Station Improvements Vincent 2nd Platform 2,504,000$ 3,426,897$ 3,426,897$ AV
LAUS Renovation/Expansion Phase I (1) 30,000,000$ 41,057,072$ 17,609,212$ 8,902,458$ 6,547,967$ 5,174,413$ 2,823,022$ All Subtotal 32,504,000$ 44,483,968$ 21,036,109$ 8,902,458$ 6,547,967$ 5,174,413$ 2,823,022$
Relief Sidings on AV Line Btwn Lang and Ravenna Sidings 2,603,324$ 3,562,828$ 3,562,828$ AV Btwn Vincent and Lancaster Sidings 2,603,324$ 3,562,828$ 3,562,828$ AV Subtotal 5,206,648$ 7,125,657$ 7,125,657$
Upgrade 7 existing sidings on AV Line to 40 mph 7,700,000$ 10,537,982$ 10,537,982$ AV
Lancaster Power Crossover 3,179,774$ 4,351,740$ 4,351,740$ AV
Ventura County Line2nd Platform at Van Nuys Station 13,000,000$ 17,791,398$ 8,029,968$ 9,761,430$ Ven CoDouble Track Raymer to De Soto 37,000,000$ 50,637,055$ 22,854,524$ 27,782,531$ Ven Co
Subtotal 50,000,000$ 68,428,453$ 30,884,492$ 37,543,961$
Riverside Line Double tracking various segments 88,500,000$ 121,118,361$ 72,958,067$ 28,485,827$ 19,674,467$ Riv (UP) Sn. Gab. Rvr. bridge improvements 15,000,000$ 20,528,536$ 12,365,774$ 4,828,106$ 3,334,655$ Riv (UP) Sta. Ana Rvr. bridge improvements 18,000,000$ 24,634,243$ 14,838,929$ 5,793,728$ 4,001,586$ Riv (UP) SR 91 bridge improvements 30,000,000$ 41,057,072$ 24,731,548$ 9,656,213$ 6,669,311$ Riv (UP) Subtotal 151,500,000$ $207,338,211 124,894,318$ 48,763,874$ 33,680,019$
San Bernardino LineDouble Track Beech (47.6) to Locust (50.7) 22,200,000$ 30,382,233$ 17,705,550$ 12,676,683$ SB
EAMF Phase II 32,000,000$ 43,794,210$ 18,783,160$ 9,495,956$ 6,984,498$ 5,519,374$ 3,011,223$ All
Positive Train Control (estimate only) 15,762,000$ 21,571,385$ 9,251,880$ 4,677,352$ 3,440,302$ 2,718,636$ 1,483,216$ All
Sealed Corridor 50,000,000$ 68,428,453$ 29,348,687$ 14,837,431$ 10,913,278$ 8,624,021$ 4,705,036$ All
BNSF (conceptual) (1) Triple Track East of Fullerton 302,000,000$ 413,307,853$ 52,547,576$ 174,726,916$ 165,811,261$ 20,222,100$ 91 and IEOC
Rolling Stock 5-car Train Sets 219,600,000$ 300,537,763$ 128,899,433$ 65,165,996$ 47,931,115$ 37,876,701$ 20,664,519$ All 6-car Train Sets 358,500,000$ 490,632,005$ 210,430,085$ 106,384,378$ 78,248,200$ 61,834,232$ 33,735,109$ All
TOTALS 5-car Train Sets 902,140,221$ 1,234,641,186$ 462,937,125$ 278,971,340$ 292,543,192$ 127,348,648$ 72,840,882$ All 6-car Train Sets 1,041,040,221$ 1,424,735,427$ 544,467,777$ 320,189,722$ 322,860,277$ 151,306,178$ 85,911,472$ All
Parking Expansion 108,024,000$ 147,838,303$ 121,944,977$ 2,912,315$ 8,835,482$ 14,123,633$ 21,897$ All
Notes:The Strategic Assessment is a conceptual program. No commitment is implied for any agency. Projects may be advanced or delayed depending upon funding availability(1) Full share included here. Actual splits with State/locals TBD Costs expressed in 2013 dollars, when costs for improvements are, on average, likely to be incurred
Escalation factor from 2005 to 2013 at 4% per annum 1.3686
Member Agency Shares Expenses in YOE $s (uses train m iles & Allshare for systemwide)Table 11.2: Capital Improvements Summary for 2015

SCRRA Strategic Assessment, 1-26-07
11.5
Line(s)2005 2018 LACMTA OCTA RCTC SBAG VCTC Benefited
4%Layover Facilities Lancaster 1,090,000$ 1,814,930$ 1,814,930$ AV North Riverside (N. of North Platform) 315,000$ 524,498$ 315,942$ 123,357$ 85,199$ Riv (UP) Perris 1,357,000$ 2,259,505$ 575,097$ 539,665$ 1,139,292$ 5,451$ 91 Subtotal 2,762,000$ 4,598,933$ 2,705,969$ 539,665$ 1,262,649$ 90,651$ -$
Ventura County Line Oxnard Improvements 20,560,000$ 34,233,911$ 15,451,131$ 18,782,781$ Ven Leesdale Siding 6,003,242$ 9,995,839$ 4,511,521$ 5,484,318$ Ven Santa Susana Siding 5,000,000$ 8,325,368$ 3,757,571$ 4,567,797$ Ven Subtotal 31,563,242$ 52,555,117$ 23,720,222$ -$ -$ -$ 28,834,895$
Antelope Valley Line Santa Clarita Curve Straightening 5,000,000$ 8,325,368$ 8,325,368$ AV Three sidings 45,000,000$ 74,928,308$ 74,928,308$ AV Subtotal 50,000,000$ 83,253,675$ 83,253,675$
San Bernardino Line Rancho (55.3) to Lilac (52.4) 28,400,000$ 47,288,088$ 27,557,606$ 19,730,482$ SB Irwin (20.4) to Baldwin Park (18.8) 20,000,000$ 33,301,470$ 19,406,765$ 13,894,705$ SB Archibald (40.2) west for 2 miles (38.2) 20,000,000$ 33,301,470$ 19,406,765$ 13,894,705$ SB El Monte (12.6) east to Flyover (14.3) 17,000,000$ 28,306,250$ 16,495,750$ 11,810,500$ SB Subtotal 85,400,000$ 142,197,278$ 82,866,885$ -$ -$ 59,330,392$ -$
Other Projects Sealed Corridor 50,000,000$ 83,253,675$ 35,707,165$ 18,052,003$ 13,277,671$ 10,492,440$ 5,724,396$ All LAUS Renovation/Expansion Phase II (1) 20,000,000$ 33,301,470$ 14,282,866$ 7,220,801$ 5,311,068$ 4,196,976$ 2,289,758$ All EAMF Phase III 30,000,000$ 49,952,205$ 21,424,299$ 10,831,202$ 7,966,603$ 6,295,464$ 3,434,638$ All Bridge across LA River 90,000,000$ 149,856,616$ 64,272,897$ 32,493,606$ 23,899,808$ 18,886,393$ 10,303,913$ All Shortway Second Track 6,427,597$ 10,702,422$ 4,590,225$ 2,320,620$ 1,706,870$ 1,348,824$ 735,882$ All Subtotal 196,427,597$ 327,066,388$ 140,277,453$ 70,918,232$ 52,162,020$ 41,220,097$ 22,488,586$
Rolling Stock 5-car Train Sets 241,500,000$ 402,115,252$ 172,465,608$ 87,191,175$ 64,131,150$ 50,678,487$ 27,648,832$ All 6-car Train Sets 275,100,000$ 458,061,722$ 196,460,823$ 99,322,121$ 73,053,745$ 57,729,407$ 31,495,626$ All
TOTALS 5-car Train Sets 607,652,839$ 1,011,786,643$ 505,289,813$ 158,649,072$ 117,555,818$ 151,319,627$ 78,972,314$ All 6-car Train Sets 641,252,839$ 1,067,733,113$ 529,285,028$ 170,780,018$ 126,478,413$ 158,370,547$ 82,819,108$ All
Parking 85,768,000$ 142,810,025$ 116,515,184$ 10,176,929$ 10,110,326$ 5,155,068$ 852,518$ All
Notes:The Strategic Assessment is a conceptual program. No commitment is implied for any agency. Projects may be advanced or delayed depending upon funding availability(1) Full share included here. Actual splits with State/locals TBD Costs expressed in 2018 dollars, when costs for improvements are, on average, likely to be incurred
Escalation factor from 2005 to 2018 at 4% per annum 1.6651
Member Agency Shares Expenses in YOE $s (uses train miles & Allshare for systemwide)Table 11.3: Capital Improvements Summary for 2020A

SCRRA Strategic Assessment, 1-26-07
11.6
Line(s)2005 2018 LACMTA OCTA RCTC SBAG VCTC Benefited
4%Layover Facilities Montalvo 513,000$ 854,183$ 385,527$ 468,656$ Ven Lancaster 1,090,000$ 1,814,930$ 1,814,930$ AV South Riverside (N. of Station) 640,000$ 1,065,647$ 600,615$ 365,382$ 99,650$ IEOC North Riverside (N. of North Platform) 315,000$ 524,498$ 315,942$ 123,357$ 85,199$ Riv (UP) Perris 1,404,000$ 2,337,763$ 653,811$ 613,529$ 1,064,225$ 6,197$ 91 Laguna Niguel 4,165,800$ 6,936,363$ 6,936,363$ OC shuttles Subtotal 8,127,800$ 13,533,384$ 3,170,210$ 8,150,508$ 1,552,964$ 191,046$ 468,656$
Ventura County Line Oxnard Improvements 20,560,000$ 34,233,911$ 15,451,131$ 18,782,781$ Ven Leesdale Siding 6,003,242$ 9,995,839$ 4,511,521$ 5,484,318$ Ven Santa Susana Siding 5,000,000$ 8,325,368$ 3,757,571$ 4,567,797$ Ven Subtotal 31,563,242$ 52,555,117$ 23,720,222$ -$ -$ -$ 28,834,895$
Antelope Valley Line Santa Clarita Curve Straightening 5,000,000$ 8,325,368$ 8,325,368$ AV Three sidings 45,000,000$ 74,928,308$ 74,928,308$ AV Subtotal 50,000,000$ 83,253,675$ 83,253,675$ -$ -$ -$ -$
San Bernardino Line Rancho (55.3) to Lilac (52.4) 28,400,000$ 47,288,088$ 27,557,606$ 19,730,482$ SB Irwin (20.4) to Baldwin Park (18.8) 20,000,000$ 33,301,470$ 19,406,765$ 13,894,705$ SB Archibald (40.2) west for 2 miles (38.2) 20,000,000$ 33,301,470$ 19,406,765$ 13,894,705$ SB El Monte (12.6) east to Flyover (14.3) 17,000,000$ 28,306,250$ 16,495,750$ 11,810,500$ SB Subtotal 85,400,000$ 142,197,278$ 82,866,885$ -$ -$ 59,330,392$ -$
Other Projects Sealed Corridor 50,000,000$ 83,253,675$ 35,707,165$ 18,052,003$ 13,277,671$ 10,492,440$ 5,724,396$ All LAUS Renovation/Expansion Phase II (1) 20,000,000$ 33,301,470$ 14,282,866$ 7,220,801$ 5,311,068$ 4,196,976$ 2,289,758$ All EAMF Phase III 30,000,000$ 49,952,205$ 21,424,299$ 10,831,202$ 7,966,603$ 6,295,464$ 3,434,638$ All Bridge across LA River 90,000,000$ 149,856,616$ 64,272,897$ 32,493,606$ 23,899,808$ 18,886,393$ 10,303,913$ All Shortway Second Track 6,427,597$ 10,702,422$ 4,590,225$ 2,320,620$ 1,706,870$ 1,348,824$ 735,882$ All Subtotal 196,427,597$ 327,066,388$ 140,277,453$ 70,918,232$ 52,162,020$ 41,220,097$ 22,488,586$
Rolling Stock 5-car Train Sets 594,400,000$ 989,719,693$ 424,486,779$ 214,602,213$ 157,844,951$ 124,734,132$ 68,051,618$ All 6-car Train Sets 680,800,000$ 1,133,582,044$ 486,188,760$ 245,796,075$ 180,788,766$ 142,865,069$ 77,943,374$ All
TOTALS 5-car Train Sets 965,918,639$ 1,608,325,536$ 757,775,225$ 293,670,953$ 211,559,935$ 225,475,667$ 119,843,756$ All 6-car Train Sets 1,052,318,639$ 1,752,187,887$ 819,477,207$ 324,864,814$ 234,503,750$ 243,606,604$ 129,735,512$ All
Parking 115,416,000$ 192,176,124$ 150,482,683$ 13,520,397$ 15,478,523$ 10,536,585$ 2,157,935$ All
Notes:The Strategic Assessment is a conceptual program. No commitment is implied for any agency. Projects may be advanced or delayed depending upon funding availability(1) Full share included here. Actual splits with State/locals TBD Costs expressed in 2018 dollars, when costs for improvements are, on average, likely to be incurred
Escalation factor from 2005 to 2018 at 4% per annum 1.6651
Member Agency Shares Expenses in YOE $s (uses train miles & Allshare for systemwide)Table 11.4: Capital Improvements Summary for 2020B

SCRRA Strategic Assessment, 1-26-07
Line(s)2005 2028 LACMTA OCTA RCTC SBAG VCTC Benefited
4%Layover Facilities Laguna Niguel 4,165,800$ 10,267,512$ 10,267,512$ OC Shuttles Subtotal 4,165,800$ 10,267,512$ -$ 10,267,512$ -$ -$
San Bernardino Line Marengo (2.4) to Fremont (6.0) 216,000,000$ 532,378,557$ 310,248,928$ 222,129,629$ SB Jordan (6.3) to Honda (12.5) 372,000,000$ 916,874,182$ 534,317,598$ 382,556,584$ SB Bridge (14.0) over Sn. Gab. Rvr. (14.8) 30,000,000$ 73,941,466$ 43,090,129$ 30,851,337$ SB Bassett (14.8) or Baldwin Park (18.8) 82,500,000$ 203,339,032$ 118,497,854$ 84,841,178$ SB Central (34.6) to MP 38.2 52,500,000$ 129,397,566$ 75,407,726$ 53,989,840$ SB Rochester (42.3) to Nolan 19,500,000$ 48,061,953$ 28,008,584$ 20,053,369$ SB Rancho (55.2) to San Bernardino (56.1) 30,000,000$ 73,941,466$ 43,090,129$ 30,851,337$ SB Subtotal 802,500,000$ 1,977,934,223$ 1,152,660,948$ 825,273,275$
Rolling Stock 5-car Train Sets 414,100,000$ 1,020,638,706$ 437,747,819$ 221,306,423$ 162,776,054$ 128,630,847$ 70,177,562$ All 6-car Train Sets 473,500,000$ 1,167,042,810$ 500,539,948$ 253,051,416$ 186,125,240$ 147,082,121$ 80,244,085$ All
TOTALS 5-car Train Sets 1,220,765,800$ 3,008,840,442$ 1,590,408,767$ 231,573,935$ 162,776,054$ 953,904,123$ 70,177,562$ All 6-car Train Sets 1,280,165,800$ 3,155,244,545$ 1,653,200,896$ 263,318,928$ 186,125,240$ 972,355,396$ 80,244,085$ All
Parking 185,072,000$ 456,149,835$ 311,185,126$ 43,043,792$ 14,768,576$ 79,146,946$ 8,005,396$ All
Notes:The Strategic Assessment is a conceptual program. No commitment is implied for any agency. Projects may be advanced or delayed depending upon funding availabilityCosts expressed in 2028 dollars, when costs for improvements are likely, on average, to be incurredEscalation factor 2005 to 2028 at 4% per annum 2.4647
Member Agency Shares Expenses in YOE $s (uses train miles & Allshare for systemwide)Table 11.5: Capital Improvements Summary for 2030A (Excludes any Potential BNSF Improvements)
11.7

SCRRA Strategic Assessment, 1-26-07
11.8
Line(s)2005 2028 LACMTA OCTA RCTC SBAG VCTC Benefited
4%Layover Facilities Laguna Niguel 4,165,800$ 10,267,512 10,267,512 Perris 536,000$ 1,321,088$ 336,243$ 315,529$ 666,119$ 3,184$ 91 Subtotal 4,701,800$ 11,588,600$ 336,243$ 10,583,041$ 666,119$ 3,184$
San Bernardino Line Marengo (2.4) to Fremont (6.0) 216,000,000$ 532,378,557$ 310,248,928$ 222,129,629$ SB Jordan (6.3) to Honda (12.5) 372,000,000$ 916,874,182$ 534,317,598$ 382,556,584$ SB Bridge (14.0) over Sn. Gab. Rvr. (14.8) 30,000,000$ 73,941,466$ 43,090,129$ 30,851,337$ SB Bassett (14.8) or Baldwin Park (18.8) 82,500,000$ 203,339,032$ 118,497,854$ 84,841,178$ SB Central (34.6) to MP 38.2 52,500,000$ 129,397,566$ 75,407,726$ 53,989,840$ SB Rochester (42.3) to Nolan 19,500,000$ 48,061,953$ 28,008,584$ 20,053,369$ SB Rancho (55.2) to San Bernardino (56.1) 30,000,000$ 73,941,466$ 43,090,129$ 30,851,337$ SB Subtotal 802,500,000$ 1,977,934,223$ 1,152,660,948$ 825,273,275$
Rolling Stock 5-car Train Sets 624,000,000$ 1,537,982,499$ 659,634,482$ 333,482,753$ 245,284,371$ 193,831,559$ 105,749,333$ All 6-car Train Sets 712,000,000$ 1,754,877,467$ 752,659,858$ 380,512,372$ 279,875,756$ 221,166,779$ 120,662,701$ All
TOTALS 5-car Train Sets 1,431,201,800$ 3,527,505,322$ 1,812,631,673$ 344,065,794$ 245,950,490$ 1,019,108,019$ 105,749,333$ All 6-car Train Sets 1,519,201,800$ 3,744,400,290$ 1,905,657,049$ 391,095,413$ 280,541,875$ 1,046,443,239$ 120,662,701$ All
Parking 259,056,000$ 638,499,350$ 401,393,714$ 65,344,538$ 70,550,018$ 90,366,331$ 10,844,748$ All
Notes:The Strategic Assessment is a conceptual program. No commitment is implied for any agency. Projects may be advanced or delayed depending upon funding availabilityCosts expressed in 2028 dollars, when costs for improvements are likely, on average, to be incurredEscalation factor 2005 to 2028 at 4% per annum 2.4647
Member Agency Shares Expenses in YOE $s (uses train miles & Allshare for systemwide)Table 11.6: Capital Improvements Summary for 2030B (Excludes any Potential BNSF Improvements)

SCRRA Strategic Assessment, 1-26-07
11.9
11.2 Capital Cost Summary For comparative purposes, Table 11.7 summarizes capital costs by category for all the Service Scenarios in 2005 dollars. The table shows the real increases in costs of incremental improvements, with inflation having been removed from the calculations. The largest cost categories year over year are track and structures, rolling stock (6-car train sets), and parking, as highlighted.
Category 2010 2015 2020A 2020B 2030A 2030BTrack and Structure 113.9$ 557.6$ 263.4$ 263.4$ 802.5$ 802.5$ Support Facilities 38.1$ 4.2$ 4.7$ Stations 20.0$ -$ -$ Sealed Corridor 50.0$ -$ -$ Parking 115.4$ 185.1$ 259.1$ Other -$ -$ -$ Equipment (5-car Sets 594.4$ 414.1$ 294.5$ Equipment (6-car Sets 680.8$ 473.5$ 334.1$ Total (5-car Sets) 1,081.3$ 1,405.9$ 1,360.8$ Total (6-car Sets) 1,167.7$ 1,465.3$ 1,400.4$ Total -$ -$ -$
Table 11.7: Comparison of Scenario Costs in 2005 Dollars
9.0$ 42.5$ 32.8$ 64.8$ 32.5$ 20.0$ 50.0$ 50.0$ 50.0$
173.4$ 108.0$ 85.8$ 55.2$ -$ -$
) -$ 219.6$ 241.5$ ) -$ 358.5$ 275.1$
-$ 1,010.2$ 693.5$ -$ 1,149.1$ 727.1$
466.3$ -$ -$
Figure 11.1 shows all the proposed capital projects by location and type throughout the Metrolink system.

SCRRA Strategic Assessment, 1-26-07
11.10
Figure 11.1: Proposed Capital Projects by Location and Type

SCRRA Strategic Assessment, 1-26-07
12.0 Scenario Evaluation 12.1 Approach This chapter presents the evaluation of the six Service Scenarios developed for the Metrolink Commuter Rail Strategic Assessment. The Strategic Assessment Technical Advisory Committee (SATAC) evaluated all Scenarios against a set of evaluation criteria. The SATAC considered evaluation criteria employed by various public agencies when looking at large capital investments and developed a list of over 20 possible criteria. In particular, the SATAC referred to the 14 performance measures proposed by the California Transportation Commission (CTC) in 2005. Ultimately, the SATAC settled on 10 criteria, which were measurable with available data, were not duplicative, and were consistent with the CTC performance measures and considered appropriate for judging the relative merits of the Service Scenarios. With the criteria identified, the SATAC specifically defined performance measures for each evaluation criterion. Performance was scored on a scale from a low of 1 to a high of 5. For example, farebox recovery (the percentage of operating costs covered by fare revenue) was identified as one of the 10 criteria. Scenarios having the highest farebox recovery ratios received a score closer to 5, while those with low ratios received a score closer to 1. In this way, scores were determined for each criterion for each Scenario. The SATAC assigned the range for each criterion that resulted in the widest variation among the criteria. The SATAC assigned the same importance or weight to each evaluation criterion. The scores earned by each Scenario for each evaluation criterion were then averaged to reveal an overall Scenario average score. 12.2 Evaluation Criteria The ten evaluation criteria selected by the SATAC are listed below. Measures are mostly either related to mobility enhancement or to cost effectiveness.
o How well does the Scenario improve mobility within each corridor? Measure: the increase in weekday trains from 2005. This is a mobility measure. An increase in the number of trains means that more people have the opportunity to take trains, and thus gain a mobility improvement.
o How well does the Scenario reduce the potential for accidents and fatalities?
Measure: millions of inflation adjusted dollars invested for safety improvement. Investments are for grade crossing safety improvements, i.e. the Sealed Corridor improvements (see Chapter 3). More investment means less potential for accidents or driver suicides at grade crossings. Thus, the more investment in safety, the better.
o What is the operations and maintenance (O&M) cost of the Scenario?
Measure: O&M cost per passenger mile. This is a cost effectiveness measure.
12.1

SCRRA Strategic Assessment, 1-26-07
One passenger traveling one mile is one passenger mile. A lower operating cost per passenger mile is an indication of greater efficiency and thus is superior.
o What are the total costs of the Scenario? Measure: O&M plus annualized capital
cost per new passenger. This is a cost effectiveness measure. Capital costs are prorated over the asset’s useful life (assumed to be an average of 40 years); the cumulative annualized capital cost is added to the annual O&M cost, and the sum is divided by the ridership increase from 2005. Lower costs are superior.
o How does the Scenario reduce congestion and improve air quality? Measure:
millions of passenger miles increased over 2005. This is basically a mobility improvement measure. Increased passenger miles mean more people are taking trains and avoiding highways for their trips. More passenger miles mean less congestion on highways and fewer auto emissions. Thus, the more passenger miles, the better.
o What is the farebox recovery of the Scenario? Measure: percent of O&M costs
covered by fare revenue. This is a cost effectiveness measure. A higher ratio is superior, since more of operating costs will be covered by fare revenue and less operating subsidy will be required.
o How well does the Scenario serve employment demand? Measure: overall
increase in jobs from 2005 in the Metrolink service area per thousand dollars invested. This is a cost effectiveness measure. A higher result is superior, with more employment served for the investment.
o What kind of increase in service frequency does the Scenario provide?
Measure: increase in the number of weekday trains from 2005 per thousand dollars invested. This is a cost effectiveness measure. A higher result is superior, with more trains deployed for the investment.
o How many more riders does the Scenario anticipate? Measure: increase in the
number of passenger miles from 2005 per thousand dollars invested. This is a cost effectiveness measure. A higher result is superior, with more passenger miles generated for the investment.
o How easily can the Scenario be implemented? Measure: subjective assessment,
considering the availability of funding, freight railroad cooperation required, the need to make improvements outside of the rail right-of-way, triggering the need for an extensive environmental document. The higher this measure, the more feasible the Scenario.
12.2

SCRRA Strategic Assessment, 1-26-07
12.3
12.3 Evaluation Table 12.1 shows the summary evaluation per each of the evaluation criteria for the six Service Scenarios. The calculated evaluation measures appear in the top portion of the table. The SATAC-determined range of scores appears in the middle. Lastly, the scoring of the Scenarios per the evaluation criteria appears in the bottom-most portion of the table. In ranking mobility by the number of trains those scenarios with more trains scored higher. For example 2020B has more trains than 2020A so scored 4 compared with 3 for 2020A. In ranking cost-effectiveness, those scenarios with a lower operating cost per passenger mile scored higher. 2020B had a higher operating cost per passenger mile than 2020A so received a score of 2 compared with 3 for 2020A. Table 12.2 shows the average of the assigned evaluation measure scores for each of the Scenarios. Of the later year alternatives, 2020A and 2020B had the same score. Since 2020A has a lower cost, 2020A is selected as the preferred alternative. Of the two 2030 Scenarios, 2020B scored better and was chosen as the preferred alternative. Accordingly, the preferred long-term direction for Metrolink would consist of implementation of service levels in accordance with Scenarios for 2010, 2015, 2020A and 2030B, as highlighted below.

SCRRA Strategic Assessment, 1-26-07
12.4
2005 0.32$ 43.20%2010 35 $56.2 0.35$ 60.74$ 109 46.20% 1.00 0.0380 118.742015 91 $68.4 0.36$ 31.70$ 352 52.50% 0.68 0.0396 153.19
2020A 137 $83.3 0.40$ 29.18$ 549 55.30% 0.52 0.0397 159.102020B 173 $83.3 0.42$ 28.16$ 661 53.50% 0.44 0.0422 161.372030A 173 0.49$ 30.60$ 923 63.80% 0.34 0.0250 133.302030B 221 0.47$ 28.20$ 1,135 66.80% 0.28 0.0267 137.23
Score1 0≤50 $0≤20 $.46≤.5 $50≤65 100≤300 42≤47% .3≤.5 .025≤.03 110≤125 Subjective (1)2 50≤100 $20≤40 $.42≤.46 $40≤50 300≤500 47≤52% .5≤.7 .03≤.035 125≤140 Subjective (1)3 100≤150 $40≤60 $.38≤.42 $30≤40 500≤700 52≤57% .7≤.9 .035≤.04 140≤155 Subjective (1)4 150≤200 $60≤80 $.34≤.38 $20≤30 700≤900 57≤62% .9≤.1.1 .04≤.045 155≤170 Subjective (1)5 200≤250 $80≤100 $.3≤.34 $10≤20 900≤1200 62≤67% 1.1≤1.3 .045≤.05 170≤185 Subjective (1)
2010 1 3 4 1 1 1 4 3 1 42015 2 4 4 3 2 3 2 3 3 2
2020A 3 5 3 4 3 3 2 3 4 12020B 4 5 2 4 3 3 1 4 4 12030A 4 1 1 3 4 5 1 1 2 22030B 5 1 1 4 5 5 1 1 2 2
(1) Institutional feasibility rated lower if the more freight railroad involvement is required and if capital improvements are outside rail ROW.
Incr
ease
d se
rvic
e fr
eque
ncy
(No
of d
aily
trai
ns)
per d
olla
r inv
este
d
Scenario How
doe
s the
Sce
nari
o in
crea
se p
asse
nger
m
iles c
arri
ed a
nd th
ereb
y re
duce
con
gest
ion
and
impr
ove
air q
ualit
y (m
illio
ns)
OPE
RA
TIO
NS
AN
D M
AIN
TEN
AN
CE
CO
ST+
AN
NU
ALI
ZED
CA
PITA
L C
OST
-PER
-PA
SSEN
GER
Incr
ease
in e
mpl
oym
ent s
erve
d pe
r tho
usan
d do
llar i
nves
ted
Evaluation Criteria and Performance MeasuresTABLE 12.1: SUMMARY EVALUATION
Assigned Score
Recommended Range for Scores
How
wel
l doe
s the
Sce
nario
impr
ove
MO
BIL
ITY
with
in e
ach
corr
idor
(IN
CR
EASE
IN
# T
RA
INS)
How
wel
l doe
s the
Sce
nari
o re
duce
the
pote
ntia
l for
acc
iden
ts a
nd fa
talit
ies (
$mill
s in
vest
ed fo
r saf
ety)
OPE
RA
TIO
NS
AN
D M
AIN
TEN
AN
CE
CO
ST-
PER
-PA
SSEN
GER
MIL
E
Incr
ease
pas
seng
er m
iles c
arri
ed p
er th
ousa
nd
dolla
r inv
este
d
INST
ITU
TIO
NA
L FE
ASI
BIL
ITY
FAR
EBO
X R
ECO
VER
Y R
ATI
O

SCRRA Strategic Assessment, 1-26-07
Scenario Score
2010 2.3
2015 2.8
2020A 3.1
2020B 3.1
2030A 2.4
2030B 2.7
T able 12.2: Average Scores
12.5

SCRRA Strategic Assessment, 1-26-07
13.0 Implementation Challenges During the late 1980’s, several agencies conducted studies and developed plans for commuter rail transportation in the Southern California region. These efforts gained momentum with the passage of local sales tax measures for transportation in Riverside and San Bernardino counties, and in 1990, in Los Angeles and Orange counties. In June 1990, at the request of local officials, the California Legislature enacted Senate Bill 1402, Chapter 4 of Division 12 of the Public Utilities Code introduced by Senator Presley. This bill required the county transportation commissions of Los Angeles, Orange, Riverside and San Bernardino to jointly develop a plan for regional transit services within the multi-county region. Many of the supporters of commuter rail worked for state rail bond measures that passed in November 1990 and which, combined with local sources and other state funds, provided for the purchase of rail rights-of-way and construction of what was to become the Metrolink system. In June 1991, following an eight-month cooperative planning effort, the four transportation commissions combined with VCTC, the Los Angeles-San Diego Rail Corridor Agency (LOSSAN), and the SCAG to produce a report entitled "Southern California Commuter Rail, 1991 Regional System Plan." The report outlined plans for a system to connect Southern California with six commuter rail lines comprised of more than 400 miles of track and 60 stations by 1995. This ambitious plan would represent the nation's sixth largest commuter rail system. The development of the Metrolink system was made possible by the availability of the state rail bonds and local sales taxes. Since 1991, the agencies have invested $722.5 million to purchase rail rights-of-way for commuter rail, and over $1.7 billion has been committed for capital improvements, rolling stock, equipment and rehabilitation/ renovation as follows:
• $1.15 billion (47.1%) in local funds • $1.11 billion (45.6%) in state rail bonds, public transit account (PTA) and State
Transportation Improvement Program (STIP) funds • $168 million (6.9%) in federal formula funds • $11 million (0.4%) in federal discretionary funds from the Federal Transit
Administration (FTA) and the Federal Railroad Administration (FRA). This amount does not include the cost to build the existing 54 stations, as stations are built and owned by the local jurisdictions. Similarly the costs of grade separations and grade crossing improvements by local jurisdictions are not included. In addition, annual operating subsidies to Metrolink since 1992 have amounted to $515 million in local funds and fares, and other operating revenues have amounted to $570 million. The Strategic Assessment outlines an aggressive growth option for expansion through 2030. No commitment is implied for any agency. Projects or service levels may be
13.1

SCRRA Strategic Assessment, 1-26-07
advanced or delayed depending upon funding availability. Member agencies will need to continue to use their federal formula and/or local sales tax funds to allow current service levels to be sustained. However, the growth options cannot be implemented without new revenue sources. All of the lines with the exception of the Antelope Valley Line require commitments from more than one member agency. Growth can occur on a line only if all members agree to their projected levels of subsidy and capital improvements. In addition, local jurisdictions and other station owners and transit agencies must invest in growth to assure continued station access. Metrolink operates over ROW owned by the freight railroads. The Orange County, Ventura County, Riverside, IEOC and 91 Lines all operate over freight railroads, and securing agreement with either BNSF or UP to increase service operating over their ROW and coming to agreement on what capital improvements might be required will be a significant challenge.
13.2

SCRRA Strategic Assessment, 1-26-07

Appendix A.1. Strategic Assessment Technical Advisory Committee (SATAC) Members
Los Angeles County Metropolitan Transportation Authority: Patricia Chen, Nalini Ahuja, Frank Flores, Carol Inge Orange County Transportation Authority: Abbe McClenahan, Darrell Johnson Riverside County Transportation Commission: Stephanie Wiggins, Sheldon Peterson San Bernardino Associated Governments: Mike Bair, Victoria Baker Ventura County Transportation Commission: Mary Travis Carl Schiermeyer representing Riverside County Transportation Commission and San Bernardino Associated Governments Dennis Kuklis representing Orange County Transportation Authority Wilbur Smith and Associates: Justin Fox, Bob Glover, Gary Stevens SYSTRA Consulting: Michele DiFrancia, Paul Sullivan SCRRA staff: David Solow, Harold Watson, Steve Wylie, Steve Lantz, Mike McGinley, John Kerins, Bill Lydon, Pat Kataura, Joanna Capelle, Bob Berger, Henning Eichler, Greg Wong, Drew Phillips, Scott Ranger, Elizabeth Mahoney, Francisco Oaxaca, Art Mallette, Darrell Maxey, Karen Sakoda, Edward Enriquez, Deadra Knox, Gray Crary, Tom Crowell, Mike Ridens, Dan Guerrero, Naresh Patel, Ron Mathieu.
A.1.1

A.2.1

A.2.2

A.2.3

A.2.4

A.2.5

A.2.6

Appendix A.3. Trends in Population, Employment and Freeway Travel Times A.3.1 Population Growth In 2004, more than 41% of 30-64 year old Metrolink riders lived in Los Angeles County, another 38% lived in the Inland Empire (Table A.3.1). Projections of the California Department of Finance show that by 2030, Los Angeles County’s population share of the region’s core commuter age population, 30-64 year olds, will decline significantly, whereas the Inland Empire’s share of this population segment will grow (Table A.3.2). SCRRA attracts a disproportionate share of the Inland Empire’s population: although the Inland Empire accounts for just 17% of the region’s 30-64 year olds, they represent 38% of Metrolink riders. By 2030, the majority of Metrolink riders are projected to live in the Inland Empire. Taken as a whole, the number of Southern California residents 30-64 years of age will grow by 28%, ranging from 10% for L.A. County to 93% for Riverside County (Table A.3.3). Similar growth rates are only found in the Antelope Valley. Although Northern Los Angeles County represents just 3% of the regional population, the number of residents in that part of the county is expected to more than double by 2030.
Table A.3.1 Metrolink Riders County of Residence (30-64 yrs)
County of Residence Percent of
riders Los Angeles County 41.7%Orange County 14.2%Riverside County 16.3%San Bernardino County 21.6%San Diego County 1.9%Ventura County 4.3% Source: Metrolink 2004 Onboard Survey
Table A.3.3 Population (30-64 yrs)
County 2000 2010
Los Angeles 4,273,912 4,841,471 Orange 1,340,643 1,547,842 Riverside 659,262 904,511 San Bernardino 734,527 926,796 San Diego 1,269,130 1,568,511 Ventura 355,682 411,113
Total 8,633,156 10,200,244
Source: California Department of Finance 2004
A.3.1
Table A.3.2 County Shares of Regional Population (30-64 yrs)
County of Residence Regional Share
2000 2030 Los Angeles County 50% 43% Orange County 16% 15% Riverside County 8% 12% San Bernardino County 9% 11% San Diego County 15% 17% Ventura County 4% 4%
Source: California Department of Finance 2004
2020 2030 Percent Change
4,825,553 4,707,164 10% 1,639,509 1,617,723 21% 1,113,368 1,275,532 93% 1,094,357 1,203,288 64% 1,775,531 1,856,821 46% 415,272 397,802 12% 10,863,590 11,058,330 28%

Regional total population growth, and the associated increase in traffic congestion, will continue to be significant for Metrolink’s future ridership growth. Based on estimates by the California Department of Finance, the total population in the five county region is projected to grow from 19.2 million in 2000 to 25.8 million in 2030, an increase of 35%. Only one in four of these new residents will call Los Angeles County their home. Much of this population growth will occur in the Inland Empire: Riverside County’s total population, for instance, is expected to more than double to 3.2 million. Most of the fastest growing cities in Southern California are located in the Inland Empire (Table A.3.4). Between 2005 and 2030, Beaumont (Riverside County) is projected to grow by 377%, or 71,359 new residents, and Hesperia (San Bernardino County) will grow by 129%, or 100,894 new residents. In Los Angeles County, Palmdale will grow by 124% (49,069 new residents), and Lancaster by 91% (38,732 new residents). This population growth will be accompanied by a trend towards smaller households. The largest decrease in household size is projected for Riverside County, whereas only Orange County is projected to experience an increase in household size.
Table A.3.4 Fastest Growing Cities, 2005-2030 Population
change 2005-2030
% Population change 2005-2030
LA County Palmdale city 49,069 124% Lancaster city 38,732 91% Santa Clarita city 27,191 49% San Bernardino County Ontario city 134,357 79% Hesperia city 100,894 129% Fontana city 82,060 52% Victorville city 47,688 63% Riverside County Hemet city 91,077 116% Beaumont city 71,359 377% Murrieta city 64,466 96% Perris city 40,867 85% Lake Elsinore city 34,932 95% Indio city 30,786 59% Temecula city 22,879 29% Banning city 19,222 71% Palm Springs city 16,019 36% San Jacinto city 14,709 52% Ventura County Oxnard city 54,157 29% Simi Valley city 24,245 19% Camarillo city 22,371 35% Orange County Anaheim city 34,495 10% Irvine city 30,625 18% Huntington Beach city 20,485 10% Source: California Department of Finance 2004
A.3.2

A.3.3 Ethnicity As the region’s population continues to grow, it will become more diverse. By 2030, Non-Caucasians will make up 62% of the region’s 30-64 year old population (Table A.3.5). Between 2000 and 2030, the number of Hispanics in this age group will more than double. At the same time the number of Caucasians will decline by half. This demographic shift will also be seen in the composition of Metrolink’s ridership, which tends to be reflective of the ethnic characteristics of its service corridors. Assuming the same demographic trend among Metrolink riders as in the general population, we can expect the proportion of Non-Caucasian riders to increase from 52% in 2004 to 67% by 2030 (Table A.3.6). Hispanic commuters, who tend to have lower household incomes, travel shorter distances, and work in different industries, will represent the fastest growing ridership segment. By 2030, their needs and travel patterns will have become an even more significant factor for Metrolink service.
Table A.3.6 Ethnicity (Metrolink riders 30-64 yrs)
Metrolink
2004 Metrolink
2030*
AFRICAN AMERICAN 12% 13% ASIAN 15% 18% CAUCASIAN 48% 33% HISPANIC 22% 31% OTHER 3% 6% Source: California Dept. of Finance 2004; Metrolink 2004 * projection
Table A.3.5 Ethnicity (Population 30-64 yrs)
Population*
2000 Population*
2030
AFRICAN AMERICAN 7% 7% ASIAN 10% 12% CAUCASIAN 54% 38% HISPANIC 28% 41% OTHER 1% 2% Source: California Dept. of Finance 2004 * Population in the five counties served by Metrolink
A.3.4 Employment Besides the changes in population, the region will also experience significant changes in the geographic distribution of employment with direct impacts on Metrolink ridership trends. According to estimates by the Southern California Association of Governments, employment in Southern California will increase by 39% between 2000 and 2030 (Table A.3.7). Much of that increase will occur in the Inland Empire counties of Riverside and San Bernardino. In Orange County and Los Angeles County, employment will grow by 27%. Los Angeles County alone will account for 35% of all new jobs in the region. That means that Los Angeles County will remain the region’s most employment-rich county, and the primary destination within the Metrolink system. However, the employment growth figures for Los Angeles County hide the fact that the geographic distribution of employment in the county is changing. Employment in downtown Los Angeles, for instance, will grow at just half the rate as the county as a whole. That means that in the future a reduced percentage of Metrolink trips will end at Union Station, with more
A.3.3

riders depending on connecting transit services to take them to employment centers outside the L.A. Central Business District and distribute them throughout the county.
Table A.3.7 County Employment
County 2000 2010 2020 2030 Percent Change
San Bernardino 594,925 770,877 972,255 1,178,889 98% Los Angeles 4,453,449 5,022,181 5,366,831 5,660,991 27% Riverside 526,536 727,724 954,492 1,188,981 126% Orange 1,514,571 1,749,986 1,848,107 1,921,797 27% Ventura 337,240 381,673 424,480 465,474 38% San Diego 1,384,676 1,528,522 1,672,883 1,824,030 32%
Total 8,811,397 10,180,963 11,239,048 11,058,330 39%
Source: SCAG 2004
Job growth in the Inland Empire will also result in changes to the region’s travel patterns, including a growing demand for reverse commute trips. To the degree that the employment growth will take place in low-density suburban areas, it will create challenges for transportation service providers to connect Metrolink stations with dispersed employment sites. There may be more opportunities for personalized transit and car sharing in the coming decades. Regional travel patterns will also be impacted by changes in the jobs-housing balance. Generally, commute trips flow from housing-rich counties to employment-rich counties, as is the case between Riverside and Orange Counties. It is interesting to note that despite the projected employment growth in Riverside County, it will remain an employment-poor county, at 0.9 jobs per 30-64 year old resident in 2030 (Table A.3.8). In 2030 large numbers of Riverside County residents will travel to employment-rich Orange County. There may even be a growing demand for long distance commute trips to Los Angeles County, which posts an employment surplus after 2020. A different picture emerges for Ventura County: by 2030 Ventura County will have grown from an employment-poor to an employment rich county, which may significantly alter travel patterns on the Ventura County Line. There may also be a significant increase in trips from San Diego County, which will experience an employment deficit by 2020. All this may translate into a growing market for long distance commutes, and an increase in Metrolink’s average trip length.
A.3.4

A.3.5
Table A.3.8 Jobs / Worker Ratio (30-64 year olds)
Source: SCAG 2004 Although car availability is not a strong determining factor for Metrolink ridership, it is interesting to note that the number of registered vehicles per household is projected to continue to increase in all counties except for Riverside County (Table A.3.9). By 2020, San Bernardino County will have the most vehicles per household: 2.8 (up from 2.4 in 2000).
Table A.3.9 Vehicles per Household
Source: Caltrans 2004 A.3.5 Freeway Travel Times The significant increase in automobile ownership rates suggests that traffic volumes will increase as well and result in worsening traffic congestion. Projections of future travel demand allow estimates of future freeway traffic speeds during the next several decades. These estimates show that Metrolink will continue to enjoy a growing travel time advantage over comparable freeway travel. As shown on the following maps, travel time for Metrolink will remain largely constant, whereas average speeds on parallel freeways are expected to decrease 11% by 2030. Significant increases in travel times are projected for the freeways paralleling Metrolink’s Antelope Valley, San Bernardino, Riverside, 91, and IEOC Lines.
County 2000 2010 2020 2030 Percent Change
San Bernardino 0.8 0.8 0.9 1.0 21% Los Angeles 1.0 1.0 1.1 1.2 15% Riverside 0.8 0.8 0.9 0.9 17% Orange 1.1 1.1 1.1 1.2 5% Ventura 0.9 0.9 1.0 1.2 23% San Diego 1.1 1.0 0.9 1.0 -10%
Total 1.0 1.0 1.0 1.1 8%
County 2000 2010 2020 Percent Change
San Bernardino 2.39 2.67 2.82 17% Los Angeles 2.07 2.23 2.26 8% Riverside 2.32 2.34 2.29 -1% Orange 2.39 2.45 2.62 9% Ventura 2.68 2.70 2.74 2% San Diego 2.29 2.40 2.58 12%
Total 2.22 2.36 2.43 9%

Figure A.3.1 Metrolink Ventura County Line AM Commute
A.3.6

Figure A.3.2 Metrolink Ventura County Line PM Commute
A.3.7

Figure A.3.3 Metrolink Antelope Valley Line AM Commute
A.3.8

Figure A.3.4 Metrolink Antelope Valley Line PM Commute
A.3.9

Figure A.3.5 Metrolink San Bernardino Line AM Commute
A.3.10

Figure A.3.6 Metrolink San Bernardino Line PM Commute
A.3.11

Figure A.3.7 Metrolink Riverside Line AM Commute
A.3.12

Figure A.3.8 Metrolink Riverside Line PM Commute
A.3.13

Figure A.3.9 Metrolink Orange County Line AM Commute
A.3.14

Figure A.3.10 Metrolink Orange County Line PM Commute
A.3.15

Figure A.3.11 Metrolink 91 Line AM Commute
A.3.16

Figure A.3.12 Metrolink 91 Line PM Commute
A.3.17

Figure A.3.13 Metrolink IEOC Line AM Commute
A.3.18

A.3.19
Figure A.3.14 Metrolink IEOC Line PM Commute

Appendix A.4. Station Access
Although SCRRA does not own or operate parking at the stations, improved station access and parking expansion are essential to continued growth in ridership. This section provides a resource to member agencies and local jurisdictions as they explore the options at stations in their community. Accommodating new riders via parking is a growing challenge to operators as they face high construction costs and restricted land areas around stations. To explore alternative modes of access and innovative ways to expand parking, a telephone survey of commuter rail operators in the U.S. was conducted in the summer of 2005. This section provides an overview of Metrolink station access and a summary of survey responses to station access and parking policies. Survey participants included:
• Long Island Railroad • Massachusetts Bay Transportation Authority • Metro North Railroad • New Jersey Transit • Peninsula Corridor Joint Powers Board/Caltrain • Virginia Railway Express
The survey was organized by station mode of access, as follows:
• Walking/Biking • Transit
o Regular routes o Timed-transfer routes o Jitneys or shuttles o Amenities at station
• Drop-off/Pick-up o Taxi o Private autos
• Carpooling o Origin end o Destination end
• Driving SOV o Managing parking supply o Adding to parking supply
The surveys are summarized in this section.
A.4.1

A.4.1 Station Access for U.S. Commuter Rail Operators Long Island Railroad (LIRR) is the largest operation in terms of parking. There are 65,000 parking spaces system-wide, of which LIRR owns 15,000. If LIRR pays for a parking project, then municipalities (or the project sponsor) cannot restrict the parking to residents; it is considered a public parking lot. The LIRR is then entitled to 50% of the net revenue for 30 years. LIRR typically covers the capital expenses, and municipalities cover the operating expenses. LIRR does not charge for parking. Municipalities charge anywhere from nothing to $3 to $5 per day and up to $325 per year for a non-resident. Massachusetts Bay Transportation Authority (MBTA) owns and maintains most of the 125 stations on the system. There are a handful of stations that are jointly owned and staffed by the subway system. There is one station that is operated by Amtrak. Generally speaking, MBTA stations are low-tech and are not staffed. Parking charges are $2 per day; there is one station with a parking garage that costs $3 day. Metro North Railroad (MNR) has 36,839 parking spaces along its system, of which 34% are owned and operated by the MNR, 60% are owned or operated by the community, and 6% are managed by the community and leased from the MNR. Parking fees vary along the system, and typically range from $3 for 16 hours to $4 for 24 hours. Parking is metered. There are also parking passes: monthly ($31), quarterly ($85), semi-annual ($157), and annual ($270). New Jersey Transit (NJT) has 53,877 rail parking spaces system-wide that are owned by NJT, municipalities or private parties. Of those spaces, 79% (42,611) are used. NJT-owned lots cannot have resident-only restrictions. Free lots are maintained by NJT. NJT-owned pay lots are maintained by a municipality or private contractor. Free parking occurs typically at lower ridership stations. Pay parking averages $3 per day. Towns provide discounts for residents on town-owned lots. The Peninsula Corridor Joint Powers Board (JPB)/Caltrain owns 22 out of a total of 30 parking lots along the 77-mile corridor. The other lots are owned by the JPB’s partner agencies (Santa Clara Valley Transportation Authority (VTA), and San Francisco Municipal Railway (MUNI)). There are 7,200 parking spaces system-wide. Caltrain charges $1.50 for daily parking and $15 for monthly parking. Lots not owned by Caltrain do not charge parking fees. Virginia Railway Express (VRE) owns its stations. However, nearly all of the parking lots are owned or operated by local jurisdictions or private entities. There are 6,500 parking spaces system-wide; 98% of parking is occupied. Parking expansions are primarily paid for and managed by the local jurisdictions. Parking is free at all stations. VRE planned to undertake an Access Study in 2005 in which some of the issues highlighted in this survey, e.g. parking charges and alternative modes of access, would be explored.
A.4.2

A.4.2 Station Access Survey Findings Walking/Biking Some agencies do very little when it comes to dedicating capital resources for walking/biking improvements at stations, while others have more sophisticated programs such as inventorying bike rack/locker usage or coordinating programs on transit-oriented development. Capital improvements typically involve installing bike racks, bike lockers, sidewalks and crosswalks. Usually municipalities and/or adjacent property owners along the system are involved in pedestrian access improvements because they requested it or because they are the owner/operator of the station. VRE does not make improvements to sidewalks, although it recently started getting more involved with adjacent property owners for these sorts of improvements. The outreach works both ways, with local developers and jurisdictions reaching out to VRE for improvements and VRE reaching out to them. Caltrain is also becoming more involved in outreach, which is usually done through its Real Estate or Public Outreach department. Transit Since bus service tends to be provided by an outside operator (with the exception of NJT and Caltrain), rail and bus schedules are not typically coordinated (even between NJT rail and bus). There normally are not many passengers that make the rail-to-bus transfer. For LIRR, only 12 stations out of 124 offer bus service. Jitneys or shuttles are provided at all of the properties surveyed. Outside contractors provide the service (for employers and shopping centers). Caltrain has a fairly successful shuttle program, particularly with shuttles serving the tech sector. VRE, through the lead of a local municipality, provides a shuttle program at one of its stations that includes a discounted VRE ticket for those using the shuttles, which are free of charge. NJT has a jitney program that is open to any community that meets certain ridership and residential density standards. The jitney serves areas of high residential density in the most efficient routing possible. Local officials need to request the service from NJT, which will then provide technical support to get it up and running. NJT will subsidize the service over five years, with subsidies diminishing each year. NJT will also provide the shuttle vehicle. As with other commuter rail operators, there is no cross-subsidization with parking fees. All operators provide station amenities such as waiting areas, posted schedules, train announcements for late arrivals, variable message signs, and directional signage. These amenities vary by station. Caltrain provides real-time information for delays greater than five minutes. The other operators do not provide real-time information as of mid-2005. Drop-off/Pick-up Most of the operators have taxi licensing, but they do not manage or control the licensing. Licenses are managed by agencies (e.g. N.Y. MTA Real Estate), local jurisdictions, or outside entities. There are usually no service quality conditions associated with the taxi licenses. There are no taxis allowed on Caltrain station property; taxis are discouraged.
A.4.3

At larger, busier stations, there are designated areas for kiss-and-ride or passenger pick-up. At other stations, there is curbside pick-up or pick-ups in the parking lot aisles. At newer stations for VRE, these designated areas are being incorporated into the station design. Carpooling Most operators do not provide carpooling incentives at stations (e.g. carpooling set-asides). There is one station on the NJT system where the local Transportation Management Association (TMA) initiated a carpooling program. There is a person at the station in the morning, and there is much work involved in matching riders. The low parking charges or lack thereof for Caltrain and VRE discourages carpooling. Since there are 24-hour meters at MNR stations, overnight parking is allowed, e.g. for employer vehicles for the reverse commuter service. However, there is no promotion with nearby employers. Caltrain has a parking permit program called “Station Cars” that is offered to monthly ticket holders, and allows them to park overnight at Caltrain stations. There are approximately 20 people registered in this program. Driving SOV Managing Parking Supply: Most of the stations at LIRR, MNR and VRE are controlled or operated by municipalities. Therefore, parking charges are determined by them and are not so much based on demand as they are on political expediency or operating cost recovery (VRE parking is free). Municipalities do restrict some of their parking to residents, while the parking controlled by the commuter rail operators is not restricted to residents. Parking fees revenue collected by all of the operators becomes general revenue to the operator or local municipality. Permits are not valid for multiple stations for LIRR, MNR and NJT. Permits are good for multiple stations at Caltrain, but they are considering station-specific permits. Shared parking is not successful at LIRR, especially with regards to churches, since the LIRR would need to charge for parking if any improvement is done to the shared lot. This may complicate the non-profit status of churches. MNR does have shared parking at some of its stations, and the shared-use arrangement also allows nearby businesses to use the station lot. Caltrain has shared-use arrangements with a mixed-use, condominium project, and with two cities (Palo Alto and Redwood City) that use lots for nighttime parking (at a $3 evening fee). NJT has a similar situation to the other operators, in that NJT owns and operates its own lots, paid with state and federal funding, while local municipalities also have their own parking on the system, which they paid to build. Local municipalities also manage some lots owned by NJT. There is a mix of local and NJT control, even at the same station. Most stations have paid parking, and the price of parking is related to the demand at the station, the quality of rail service, and competition by other modes from the stations to key destinations. In ways similar to the other operators, parking revenue at NJT-owned parking lots goes back to NJT as general revenue. It generally does not stay local, although in certain circumstances some of the parking revenue may be given to the municipality for facility maintenance. Permit and daily rates are provided at most paid parking stations. Locally-owned park and ride lots at train
A.4.4

stations have resident-only parking, which NJT tolerates. Permits are good only for a particular station at this time. No plans have been proposed to share permits at more than one station. Allocation of post-AM spaces is done at some MNR stations and at some NJT stations where on-site operators manage parking facilities. At stations with smart meters (that have a clock), unused permit spaces can be used by anyone after the AM rush. Shared parking is encouraged, especially where NJT wants to add parking and there are other needs for parking that must be satisfied for adjacent properties or downtowns. In a couple of places, unused commuter parking converts to hourly parking for downtown shoppers at 10 AM. Also, there are deals with churches, bowling alleys and movie theaters to take advantage of different time-of-day peak demand. At some stations, adjacent property owners such as gas stations and restaurants allow commuters to use their parking lots. This may be in violation of local zoning ordinances. Adding to Parking Supply: Parking demand is assessed by the MNR by using a parking demand model; NJT employs regional trip models or conducts its own parking assessment; VRE uses consultants. There is not much land for parking expansion along the systems for LIRR and MNR, especially at the closer-in stations. Minimum improvements like reconfiguring and restriping the lots are usually first sought, but at NJT most of these improvements have already been done. For MNR, shuttle and ferry services also help alleviate the need for more parking. Walking also plays a prominent role in station access. Auto/parking is seen as the primary mode of station access at both NJT and LIRR. As LIRR stated, “you can’t build parking fast enough...they are putting 110,000 people into 65,000 parking spaces daily.” Caltrain responded with “build it and they will come”, in that there is always a demand for more parking, but land is not cheap. The surveyed properties are looking to be more creative with parking expansion, as they face limited (or nonexistent) capital budgets, and available land is severely restricted. Alternative approaches such as shared-use parking are increasingly being sought, while traditional approaches still play a prominent role at some properties. LIRR fronts the capital for shared parking projects; the developer then takes over operations; and the LIRR receives 50% of the parking revenue. LIRR looks at all public property along the system, and works with communities to rehabilitate parking. At MNR, shared parking developments are starting to happen. There is a shopping center development that added one floor of parking in the structure for MNR, for which MNR paid the additional expense. Caltrain takes a mix of the two positions: adding more parking where feasible, while promoting alternative modes of access. There is a San Carlos mixed-use development proposed adjacent to the Caltrain station. Presumably, parking there will be shared with Caltrain.
A.4.5

VRE works with local jurisdictions to secure funding to develop parking expansions. VRE has partnerships with developers and/or jurisdictions at five of 13 stations where they are working to expand parking. There is one example of a mixed-use development, where VRE got parking in exchange for a density waiver. The project has been successful with increasing walking as an access mode, but not so successful with adding more riders to the system. An “Access Study” was to be conducted in 2005 to help VRE determine the best options/alternatives to meet growing parking demand. As NJT wants to add parking in difficult-to-build areas like built-up downtowns. Mixed-use, multiple purpose parking is being pursued (Rutherford Station is the best example). Local officials get involved because of the special nature of the development, and the potential impact on the downtown environment. The Rutherford project is a condominium arrangement for three uses (commuter, office and residential). NJT contributed planning services to assist in the development of this project. In Rahway, NJT contributed $3 million in funding toward a $10 million shared-use parking deck. The NJT is funding an advanced lease of up to 300 spaces for commuter use. In other instances, the developer builds and operates the parking, and NJT has no ownership interest. However, this arrangement usually places the parking “at-risk”, or in danger of the owner giving it to another use without NJT having any power to stop it. Once in a while, conditions are placed on private development to provide the commuter parking. Local officials like this arrangement because it provides a way to give the developer the right for bonus (above what zoning will allow) development on the site, which create more tax “ratables”. It also serves to satisfy local commuter parking demand. Without NJT involvement, commuter parking can be resident-restricted. NJT does use parking revenue to support construction of new parking. At Hamilton Station, the market is expected to allow a $6/day daily fee. NJT is engaging a developer to design, build, operate, maintain and finance (DBOMF) the parking expansion project (decked parking) through parking revenues. This is a special market, and a DBOMF contract could only occur here. This has also been done at the Trenton train station. A.4.3 Questions for Large Commuter Rail Agencies on Addressing Ridership Increases at Stations
Walking/Biking To what extent do you make capital improvements for walking/biking to stations? What criteria do you use to determine what is a worthwhile investment? How much of these expenditures are from your own capital budget, and how much from external sources such as Transportation Enhancements? Do you negotiate with adjacent property owners to provide direct access to and/or through their developments? Is there an organized way to reach out to adjacent owners? Do you coordinate with local planning/zoning jurisdictions?
A.4.6

Transit Regular Routes: Do you coordinate regular route bus service, either by bringing the route close to the rail station, and/or by timing routes for good bus-rail connections? Under what circumstances would you consider route realignment and/or timing? (How many rail riders would make this worthwhile? How many impacted bus riders is too many? How much time can be added to the bus route?) Timed-transfer Routes: Do you provide bus service that starts and ends at rail stations, so that the schedules are fully timed with rail service? What are the conditions under which you would provide this type of service? (e.g., residential density, local interest, ridership volumes, unmet parking demand) Jitneys or Shuttles (dedicated to rail riders):Do you have this type of service at any of your stations? Who supplies it? How is it determined which stations get this service? (Same as above - e.g., residential density, local interest, ridership volumes, unmet parking demand.) Who pays for it? Is there any cross-subsidization with parking fees? Amenities at Station (for any of the above):Do your stations have physical amenities for waiting rail-bus transfers – waiting area, lighting, canopy, climate control? Do they have communications amenities – schedules, Next Bus (real time info.)? Drop-off/Pick-up Taxi: Do you have formal taxi licensing situations at any of your stations? Do you control the licensing or is it by local jurisdictions? Do you have any service quality conditions associated with the licenses (e.g., one or more standing taxis to meet every train?) Private Autos:Do you design for designated areas for kiss-and-ride or for private autos to wait to pick up train riders. Carpooling Origin End: Do you have any incentives for informal carpooling? (e.g., break on parking fees, closer spots) How do you enforce this? Do you coordinate with residential associations that may want to provide their own jitney? Destination End: Do you allow employer vehicles to park overnight, for reverse commuter service? How much do you promote this with nearby employers?
A.4.7

Driving SOV Managing Parking Supply:Do you control your parking? Do other jurisdictions control parking? Do you have paid parking? Do you increase fees as demand goes up? Are parking fees considered general revenue for the system, or does it stay with the station? Do you have permit and daily fees? Can permits be resident-only? Are permits good for multiple stations? Do you allocate post- A.M. peak spaces? Do you allow shared parking with adjacent properties? Do you utilize shared parking provided by adjacent properties? How is the allocation of spaces enforced? Adding to Parking Supply:How do you determine parking demand? Under what conditions would parking capacity be increased (e.g., cost per stall or cost per new rider, local support, unmet parking demand)? Would adding parking be a standard solution, or would it be done only if other means (listed above) would not capture enough ridership, or is it a mix of the two positions? Who sponsors parking projects - your agency, State DOT, County or local-level jurisdictions? Where does funding come from? Are parking revenues used for capital projects? Does the development community get involved, for parking alone, or as part of adjacent development? Do you have shared parking projects? If so, what are the terms - lease, condominium, lease/purchase, etc.? How much coordination is there with local jurisdictions? Do you have projects that help both transit and local governments (e.g., downtowns)?
A.4.8

Appendix A.5. Station Development Planning
A.5.1 Transit Oriented and Transit Supportive Development Transit Oriented Developments (TODs) are location efficient, mixed-use, pedestrian friendly, compact land use pattern clustered in ¼ to ½ mile radius of a transit station, and in some cases, up to 1-mile radius. TODs typically have the most intensive land uses surrounding the transit facility, with decreasing densities further from the station. Mixed-uses are typified by residential, retail, office/medical, and other public services/uses. TODs encourage the development of denser, mixed-use, pedestrian oriented areas where frequently visited services, jobs, housing and transit are all accessible, with a goal of reducing the reliance on the car and need for additional parking facilities. TOD characteristics:
• Mix of use • Higher intensity development in the TOD core, with diminishing density in
the TOD periphery • Public and civic spaces near the station • Interconnected vehicular circulation • Parking management • Pedestrian connections • Pedestrian friendly streets, sidewalk widths, traffic buffers, street trees,
signage, lighting • Incorporate bike design for bike paths, lanes and parking,
By way of illustration, the city of Palmdale has developed a Transit Village Plan for the 100 acres surrounding the recently opened transportation center and Metrolink station. A long-term strategy for the city, the transit village will incorporate key elements of TOD into the land use planning. Palmdale’s goal is to create: a development pattern characterized by a mix of uses surrounding a transit facility where streets have a high level of connectivity, blocks are relatively small, and streetscapes, buildings and uses cater to the pedestrian. TOD brings several benefits that would otherwise be lost with conventional planning: TOD can support increased transit ridership, help relieve congestion and ultimately contribute to improving air quality by reducing automobile reliance. TOD can also create a sense of place by providing a focus for the community and offering residents a wide range of centrally located services. For the Palmdale Transit Village, the pedestrian-oriented aspects of TOD can also improve access for existing residents in the area, as many of them already walk and take transit for many of their daily trips. Excerpts from Palmdale Plan provide some additional detail:
A.5.1

• The land use standards provide a level of flexibility that will allow incremental development of the Plan to address the changing demands and needs of the real estate market.
• TOD principles in that they maximize the efficiency of land surround the
Transportation Center while also promoting new development, open spaces and streets that are attractive, vibrant and safe for all users. The Specific Plan’s implementation measures provide a strategy for the development phasing, the funding and construction of capital public improvements, and the provision of on-going public services to the Plan’s residents and workers.
• Growing population with a diversity of uses will promote economic growth.
Land uses also take advantage of the Specific Plan area’s unique condition of being well-served by regional transit systems; and the urban in-fill nature of the site reduces development pressure on existing agricultural lands. The Community Character envisions new development within the Specific Plan area to be attractive, safe, well-designed, and
• Well-integrated with adjacent neighborhoods. The Circulation Element
provides for an attractive well-connected street system that accommodates the needs of all users including pedestrian and cyclists, and connects to the Transportation Center thereby reducing the number of vehicle miles driven in the plan area.
The TOD principles can be applied to many Metrolink station sites. In the Palmdale example, the plan offers phasing of surface to structured parking as the development progresses. Promotion of pedestrian access to and from stations is commendable, and should be an integral part of the Metrolink ridership growth, but because the service area of Metrolink stations is so large, parking is still paramount in TOD design for commuter rail in Southern California. A.5.2 Joint Development of Stations Similar to the TOD principles forwarded in the City of Palmdale’s transit village concept,
A.5.2

joint-development promotes the further integration of transit in economic growth with a public-agency property owner a primary financial beneficiary of the development project. For Metrolink’s station owner partners, joint-development offers the opportunity to create a long-term source of revenue and participate in the increase in value of its real estate assets over time. Typically, a joint-development project will encompass only the publicly-owned real property, and can be integrated into the larger TOD development footprint. For example, the Riverside County Transportation Commission (RCTC) is actively pursuing joint-development opportunities for their current Metrolink stations and for the future Perris Valley Line, working jointly with the local cities on station site selection and project development. Excerpts from the RCTC joint-development guidelines describe the program’s goals and policies:
GOALS a. Promote and enhance rail transit ridership b. Enhance and protect the transportation station and corridor c. Encourage comprehensive and complementary planning and development around
RCTC-owned station sites d. Reduce auto use and congestion through encouragement of rail transit-linked
development, consistent with Commission policy to pursue transportation alternatives that enhance or complement economic development.
e. Demonstrate a fiscal benefit to the Commission based on a fair market return on public investment
POLICIES
The basic construct of joint development guidelines encourages comprehensive planning of station-area development. To facilitate coordinated transportation and land use decisions, RCTC will:
1. Consult and work cooperatively with local jurisdictions, redevelopment agencies,
developers, and other public and private sector entities to promote land use policies and plans which encourage intensive, high quality development at current and planned RCTC-owned stations and surrounding properties.
2. In consultation with local jurisdictions, prepare conceptual development strategies specific to each joint development site that articulate the intensity and type of land uses that the RCTC envisions for that site as well as any of the desired transit facility features.
3. Encourage transit compatible land use plans that enhance RCTC’s regional mobility, air quality, economic development, ridership and revenue goals.
4. Consider joint development opportunities in the acquisition of property, location of new station sites for future rail corridors, and construction of station facilities.
5. Actively encourage and allow surrounding property owners/developers, at their expense, to construct direct connections to stations from their property/buildings,
A.5.1

in particular, pedestrian connections, which enhance the overall pedestrian flow of the project area.
The direct financial benefits of joint-development at station sites offer a new revenue source for public agencies. In most cases, the reinvestment of the new funds back into the transportation infrastructure and services fortifies the sustainability of the development and the transit linkages. A.5.3 Current Station Area Development Activities Many station cities and transportation commissions are engaged in various stages of planning for and implementing mixed-use transit-supportive and transit oriented development projects to leverage the existing rail station infrastructure and fully integrate the train service into the revitalization and development plans. 26 of 55 stations currently have station-area development activities occurring; these are summarized in Table A.5.1 Table A.5.1 Station Area Development Status Spring 2006 Los Angeles Union Station: Projects currently underway include an office building along Alameda Street, and 281 for sale residential dwelling units (du) along Cesar Chavez Blvd. and Alameda Street along with 400 parking spaces (replacement and new), estimated opening date mid-2006. Additionally, three new office buildings are planned/under construction around the station area. Anaheim Stadium Station: Located in the parking lot of Angel Stadium. City introducing a mixed-use overlay zone in the recently adopted General Plan update (May 2004) to encompass the Platinum Triangle. The Platinum Triangle is envisioned by the General Plan as a vibrant 24-hour, high density, mixed-use, urban environment that could include up to 9,175 dwelling units, 5 million square feet of office space and over 2 million square feet of commercial uses and entertainment venues over the 800 acre planning area. Buena Park: Construction of this new station is underway. The Olson Company, a residential developer, is working on a transit-oriented medium density residential project on the west side of the station site. The project redevelops a commercial/light industrial site to include approximately 200 dwelling units. Burbank Downtown: Downtown revitalization plans include construction of new mixed-use (residential/retail), office, entertainment projects. Currently under construction: Burbank Village Walk 140 du for sale residential and retail complex. Also under discussion, a joint-development on the station site for residential/office uses with an additional link across the I-5 to the downtown village and mall districts. Chatsworth: Station currently includes a day care center and some limited office space. Currently, discussions are underway with a developer interested in a joint-development to build housing on the station site, while retaining the current day-care and office uses. Claremont: The station is located in the village center. The city has developed a Specific Plan for expansion of the village that extends the station-area development to the west. The Village Expansion Specific Plan includes mixed-use retail/commercial, residential, entertainment, hotel, office space, and a parking structure. Currently underway: Medium density residential (12-15 du/ac) 106 for sale units, pedestrian and street access improvements.
A.5.2

Covina: The city is in the process of developing a Town Center Specific Plan for the 114 acre area of the city anchored by the Covina Metrolink station to the north. The goal of the Specific Plan is to facilitate revitalization of the downtown by increasing the number and variety of retail, office professional, and other commercial development, increasing the number of housing units, stimulating development on vacant and underutilized parcels through infill and mixed-use developments and capturing all potential benefits of the Metrolink commuter rail station. Downtown Pomona: City is amending the Downtown Specific Plan adopted in 1994 encompassing 340 acres of the civic center/downtown area to intensify the residential uses in the core area by modifying the mixed-use designation. Five new mixed-use zone districts have been created, with the core are of the specific plan (which encompasses the Metrolink train station) that allow more flexibility in mixing residential uses with retail, entertainment, office, light industrial, educational and parking uses. Development standards in these five districts include residential between 50 – 80 du/acre. The first mixed-use project, retail, office and 26 residential for sale units opened in 2004. El Monte: The city is in discussions for redevelopment of the area surrounding the existing station. The project would include a retail center, with some office and multifamily residential in the area bounded by Santa Anita on the west side to Tyler on the east, the railroad tracks to the north and Valley to the south. The project would relocate the bus loop to a parking structure built on the west side of the current station parking lot. There is also transit-adjacent development (new residential) occurring in close proximity to the current station site. Fontana: The city is currently in negotiations with a project developer for a TO mixed-use development in the area surrounding the transit center, which includes Metrolink train and bus service. The project area currently ranges from 21 to 45 acres. City looking to attract the professional office/residential demographic to a revitalized downtown area. Senior housing currently under construction (95 units) and completed (109 units), just south of station. Fullerton: Located in the heart of the now thriving historic downtown district in a designated redevelopment area. Revitalization efforts include adding medium-high density residential, mixed-use, and additional parking. In the past year, two for rent developments opened with 275 units; new station-adjacent for sale live/work lofts (120 du) underway for 2006 opening. Glendale: City recently approved zoning changes and General Plan amendment to allow for greater flexibility along the San Fernando corridor, encompassing the Metrolink/Amtrak station to create districts that mix residential and commercial land uses. Irvine: Adjacent to the former El Toro Marine Corp Air Station. The city plans, as part of the base re-use, to create a 210-acre TOD concentrating residential (1,500 du), office (120,000 sf), retail developments (30,000 sf) around the Irvine Transportation Center and on the periphery of the Great Park. Laguna Niguel/Mission Viejo: City of Laguna Niguel recently commissioned a study to explore TOD and residential uses in the current commercial/light industrial area – also known as the Gateway. Lancaster: The North Downtown Neighborhood Revitalization Transit Village Plan is in the development stages. The redevelopment area approved two years ago includes 110 acres surrounding the Metrolink station, with a phased implementation of new multi-family and single-family housing, senior housing, (387 total units)retail shops, park space, services for the indigent and two schools.
A.5.3

Montclair: This very large transit center is co-owned by the city and Caltrans – offering both bus and Metrolink train service. The city has a transit-oriented concept plan to redevelop the area from the station (northern boundary) to the south, encompassing the Montclair Plaza mall to the south. The concept plan includes a town center with mixed-use/ retail 20 – 40 du/ac, corridor residential at 20 – 40 du/ac and neighborhood residential at 15 – 30 du/ac. The plan would develop the mixed-use transit village in the second phase (5-10 year) time horizon. Newhall: Project planning for the Downtown Newhall Specific Plan was just completed by the City of Santa Clarita. The concept plan in development includes a TOD for the downtown area encompassing the Metrolink train station, revising zoning codes, land use designations, and design standards to redevelop the project area. The project would also include mixed-uses, parking structures. Norwalk/Santa Fe Springs: The station serves as a Metrolink stop and transit center for Norwalk and Santa Fe Springs bus service – also providing a bus connection to the Green Line. Working with Los Angeles World Airports (LAWA) on potential future Los Angeles International Airport (LAX) fly-away park and ride. Orange: Located in the historic downtown Orange (National Register), the station serves as both an origin and destination station, well served by connecting StationLink shuttle buses to/from nearby employment centers. The city has started the General Plan update, and is evaluating opportunities for intensifying land uses around the station/station parking areas. Chapman University has acquired many station-adjacent parcels on the east side of the station, and new higher density residential projects are planned for the station’s west side. Palmdale: The new station opened in April 2005 and includes Metrolink train and Antelope Valley Transit bus service at the transit center. The city is working on the Palmdale Transit Village Plan to create a mixed-use village in the 100 acres surrounding the transit center. A multi-year phased approach would introduce higher density, multi-family and single-family for sale and for rent residential (700 – 900 du), neighborhood serving retail (mixed-use and stand-alone: 49k s.f.), and future office space (446k s.f.) on the currently blighted project area. Included in the plan are street improvements, pedestrian walkway enhancements. Pomona North: As part of the Gold Line Foothill extension project, a station-concept plan includes co-locating a Gold Line and Metrolink San Bernardino Line station at the Fairplex. This station site would provide connectivity between light rail and commuter rail services, the Fairplex grounds, and downtown La Verne and the University of La Verne campus. Riverside Downtown: The station is served by three Metrolink routes with connections to Los Angeles and Orange Counties. RCTC, the station owner, and the city are exploring station-area development possibilities primarily commercial/office space in nature. The station area has seen recent revitalization including the renovation of the historic Santa Fe depot nearby, and the Old Iron Works building adjacent to the station. Riverside La Sierra: A viable site for joint-development, RCTC as the station owner, working with the city on planning for new development. RCTC is in the process of selecting a potential developer for the station site. A new 402 du sf residential development is planned for the 99 acre parcel across Indiana Avenue from the station. Currently in entitlement stage with the city. San Bernardino: Long-term redevelopment plans are in the works for the station area, beginning with the newly renovated and recently re-opened historic Depot building, now home of the San Bernardino Associated Governments (SANBAG) administrative offices.
A.5.4

Santa Ana: The depot is a transportation hub in Orange County, with Metrolink, Amtrak, Greyhound, OCTA bus and international bus service to Mexico serving the station. The depot includes office space, parking, and a banquet hall. Short-term projects include new construction of 108 live/work lofts on a station-adjacent parcel. Tustin: The station is located directly across the street from the former Tustin Marine Base. The base re-use plan calls for up to 4,600 dus, office/commercial, educational, recreational and other uses. New vehicular and pedestrian circulation plans will improve access from the base re-development to the Metrolink station. Additionally, new for-sale attached residential project currently under construction just south of the station adds 350 dus to the ¼ mile radius around the station. To date, these developments focus more on housing and neighborhood-serving retail projects (with the exception of Tustin and Irvine, with base re-use plans incorporating commercial/office properties). For Metrolink, the mix of jobs and housing in station areas is a critical success factor (Orange, Burbank, Glendale and downtown Riverside future and Palmdale future as employment centers) for TOD. TOD can be all jobs or all housing, or a mix of both, depending on the station area characteristics. As a commuter rail service taking people to and from work, co-locating employment based office/ service industry developments within TODs stations areas is desirable. The emergence of the Perris Valley Line and Redlands extensions are ideal opportunities to strengthen the nexus of transportation and land use planning. In fact, as RCTC and SANBAG consider federal financing options for the lines, the Federal Transit Administration is looking closely at how transportation and land use are integrated. Draft guidelines and project evaluation criteria for New Starts and Small Starts competitive funding programs propose to use this nexus in project evaluations. A well-integrated transit supportive development plan may improve project readiness, reinforce collaboration with local jurisdictions, and increase project ranking and scoring. Metrolink is the T in TOD. The SCRRA Strategic Assessment outlines future growth of the Metrolink train operations. The increased frequencies, increased bi-directional and weekend services are critical success factors in the implementation and sustainability of TOD and joint developments. The combination of expanding transit connections, improving pedestrian access, increase train service, and intensifying and broadening land uses around station areas offers viable transportation alternatives for commuters throughout the region.
A.5.5

Appendix A.6. MOW by Line
The average MOW cost per track-mile is calculated excluding Extraordinary Maintenance and Agency Costs. For FY 2005-06, the average annual MOW cost is projected to be $47,294 per track-mile. MOW is kept to a minimum with the improved maintenance condition of the property as a result of the agency’s Renovation and Rehabilitation program. The features that make some lines higher or lower in cost than the SCRRA averages are summarized in the following list. The figures (+) and (-) show factors that drive the maintenance budget higher or lower.
Los Angeles - San Bernardino Line. The budget represents the crews for basic inspection and repair plus a surfacing cycle. Factors that affect MOW costs are: + Very high density of passenger train traffic + High density of road crossings + Some unresolved drainage issues - Significant capital rehabilitation completed - Light freight traffic Los Angeles - Ventura County Line. Factors that affect MOW costs are: + High density of passenger train traffic (including weekends) + High density of road crossings + Moderately heavy freight traffic (affects curve rail) + Tunnels with lights and drain pumps + Poor ballast condition, embankment retains moisture - Signal system is new - Light to moderate curves and grades - Extensive Rehabilitation work has upgraded many turnouts and crossings. Los Angeles – Antelope Valley Line. This is a mountain freight railroad, which means that great care is required to inspect and control track geometry, curve rail wear, embankment stability (landslides and washouts), and safety detectors. Also includes Tunnel 25 in Sylmar. Factors affecting MOW costs are: + High curve and grade territory + Tunnel 25 subgrade is very poor + Frequent trains (below Via Princessa) + Some heavy freight traffic (affects curve rail) + Exposed to flood damage (requires extra inspections) + Poor ballast condition, embankment retains moisture - Most of line has good rail, ties, and crossings
- Relatively fewer road crossings Fullerton - San Diego County Line. This line is in good to excellent condition. The budget has historically been the lowest per mile. However, due to heavy service levels, a significant portion of the work on this line must be done on an overtime/night basis. Factors that affect MOW costs are: + Frequent trains
A.6.1

+ Exposed to flood and ocean damage - Very little significant curvature - New track and signal system Olive Subdivision. As a practical matter crews and resources are pooled with the Orange County line and the division of costs between these lines is somewhat arbitrary. Factors that affect MOW costs are: + Narrow embankment + Several Industrial Spurs - No significant curvature or grade Riverside Layover Facility. This segment has good track, but is requiring a four-man track gang to inspect the facility once per month. Factors that affect MOW costs are: + Small segment requires travel time - Good Condition River Corridor. This segment includes all of the tracks on both sides of the Los Angeles River from Redondo Junction on the south to CP Taylor on the north. It carries heavy freight and passenger traffic, including all SCRRA non-revenue movements in and out of the Central Maintenance Facility (CMF). Past capital programs have upgraded most of the track and signals. Even with these improvements, the track and bridges need continual maintenance. Parts of this line segment receive significant freight revenues under pre-SCRRA joint facility agreements that offset MOW expense. Factors that affect MOW costs are: + Heavy freight tonnage + Frequent trains + Many turnouts + Complex trackwork: crossing diamonds and double slip switches + Some locations of severe curvature - Few road crossings Sierra Madre - Claremont (Pasadena Subdivision). SCRRA is maintaining this property for the Pasadena Gold Line (PGL) Construction Authority under their agreement with the LACMTA. The maintenance goal for this line is to preserve it in operable condition until it is relocated and reconstructed when the PGL is extended to Montclair. The line has jointed rail and wooden crossties in an adequate condition to carry the small amount of freight traffic now on the line. Some road crossings are being improved within the maintenance budget with the cooperation of community street departments. Some of the crossing warning systems are also being upgraded to reduce trouble calls while in freight operation. The construction plan for the PGL includes relocation of this track (using the same basic track materials) so that there will be a separate track for freight trains and two new tracks for light rail transit. Under this scenario the SCRRA will continue to maintain the freight track and the PGL would maintain the LRT track. This separation follows the regulatory environment; the FRA regulates the SCRRA and all freight and commuter rail while the
A.6.2

FTA regulates the MTA on all of the rail transit lines. During the construction of the PGL and the relocation of this track the SCRRA will support the PGL with work orders; these tasks will be at the PGL’s cost and should have no effect on the operating budget. Factors that affect MOW costs are: + Jointed Rail + Poor tie and ballast conditions + Some poor road crossings + Many road crossings + Obsolete open-wire signal system - Low freight traffic levels and no passenger services. - Light curvature and grade Rialto Subdivision (Baldwin Park Branch). This line is a very lightly used UP freight line with small rail and old wooden ties. The forecast is an estimate of the time to inspect and make nominal repairs only. Factors that affect MOW costs are: + Poor track and crossing conditions + Small segment requires specific maintenance assignments - Very few freight trains and no passenger service There are no plans to operate SCRRA passenger trains on this line. The short-term goal of SANBAG and SCRRA is to relocate the one remaining freight customer on this line and to then cease all operations and therefore eliminate this segment of the MOW budget. The long-term goal of SANBAG is to preserve this right of way for future transportation use; it extends continuously westward to Montclair.
Redlands Subdivision. This line is owned by SANBAG, the only operation on the line is local BNSF freight and the BNSF performs all maintenance. The first mile of this line was completely reconstructed in 2001. When SANBAG begins passenger operation from the depot to downtown (E Street) the SCRRA will assume maintenance responsibility for the first mile segment. Factors affecting the MOW costs are: + High density of road crossings - Very new, strong track structure
- Modern crossing controllers - Very light freight traffic The portion of the line not used for passenger operation is maintained by the BNSF. As SANBAG extends passenger service eastward from downtown San Bernardino the remaining 8+ miles toward Redlands, that track will become an SCRRA maintenance responsibility. It must be upgraded before passenger service can be operated. In this case the SCRRA will assume MOW responsibility on the date that reconstruction by SANBAG/SCRRA begins, probably a year before passenger operation can begin. If the reconstruction of the remainder of the line matches that done on the first mile it will also have a generally low maintenance cost except for the higher than average density of crossings.
A.6.3

Perris Valley Line Although this 24-mile line is owned by RCTC, the only operation on the line is local BNSF freight and the BNSF performs all maintenance. When RCTC/SCRRA begins reconstruction, the maintenance will transfer to SCRRA. Before reconstruction is complete, the factors affecting MOW cost will probably be: + Generally weak rail, crossing, turnout and tie condition + Some areas of sharp curves and steep grades + Localized areas of poor drainage + Obsolete crossing signal devices + Moderately heavy freight trains - Relatively few road crossings The line must be reconstructed and train signals installed before operation of passenger trains can begin. If the reconstruction matches that done for other SCRRA lines, then the factors affecting the MOW budget will probably be: + Some areas of sharp curves and steep grades - Relatively few road crossings - Good condition rail, ties, subgrade, turnouts, crossings, and signals
A.6.4

A.7.1
Appendix A.7. Cost Allocation Formulae Over SCRRA’s history, more than eleven different formulae or allocation methods have been developed to allocate expenses and revenues to the member agencies. These formulae are described below to illustrate the collaborative commitment each member agency has brought to SCRRA’s growth since the agency’s inception in 1991. The evolution of the formulae is illustrated in Table A.7.1.
Allocation of Revenues - Farebox revenues are received by each operating line and allocated to member agencies (counties) on the basis of train-miles for each line or county. Revenues described as Dispatching/Other are allocated directly to those line segments in accordance with agreements with each freight railroad and Amtrak. These revenues are allocated to the counties that own the particular segments, and to the lines that are made up of these segments. At the end of each fiscal year, the interest on fares and other funds received for operations and capital projects are assigned to counties based upon a calculation of interest-earning funds from each member agency. Allshare - The original All-Share formula was developed to calculate county shares of systemwide projects such as the central maintenance facility and used data developed in the Southern California Commuter Rail: 1991 Regional System Plan as required by SB-1402. The formula was calculated as 1/3 unduplicated route miles of the proposed system at buildout; 1/3 proposed unduplicated stations and 1/3 projected boardings and alightings after a year of service. This formula was also used to justify the number of votes each county had on the SCRRA Board. In 1993, the formula was adjusted to add the Riverside (UP) Line, and in 1998, the formula was adjusted to allow for the extensions to Lancaster and Oxnard. This revised formula is also used for systemwide projects such as those in the River Corridor. For the purposes of the Strategic Assessment, the formula was adjusted to reflect 2010 data assuming the extension to Perris and E Street in San Bernardino as well as projected ridership for 2010. Train-Miles -Those costs that change with the number of trains operated, such as train crews and fuel, are allocated on the basis of train-miles. This formula changes each year with the service assumptions adopted for that year. Route-Miles Dispatched - Dispatching expenses are allocated based on route miles owned and dispatched by SCRRA. Route-Miles Owned - The Maintenance-of-Way (MOW) Budget allocates the subsidies for Extraordinary Maintenance for storm damage, gate knockdowns and vandalism using the formula representing route-miles owned by county. Track-Miles Owned - The MOW Budget allocates the net subsidies for maintenance-of-way on lines owned by more than one county by the formula representing track-miles owned by county. Direct Allocation - Other costs that change with the number of trains operated on particular line segments, such as payments for rail agreements for dispatching and MOW, are allocated directly to those line segments rather than by a formula.

TABLE A.7.1: HISTORY OF SCRRA OPERATING BUDGET LINE ITEM ALLOCATION
1996-1999 1999-2005 2005-2007 2007-2008Train Mile Allocation
Train Operations Train Miles- Current Train Miles- Current Train Miles- Current Train Miles- CurrentFuel Train Miles- Current Train Miles- Current Train Miles- Current Train Miles- CurrentOperating Contingency Train Miles- Current Train Miles- Current Train Miles- Current Train Miles- Current
Direct to Line Segments/TerritoriesRail Agreements Direct To Lines/Then to Members Direct To Lines/Then to Members Direct To Lines/Then to Members Direct To Lines/Then to MembersMoW - Line Segments Direct To Lines/Then to Members Direct To Lines/Then to Members Direct To Lines/Then to Members Train Miles of Service on TerritoryMoW - Extraordinary Maintenance Direct To Lines/Then to Members Direct To Lines/Then to Members Direct To Lines/Then to Members Train Miles of Service on TerritoryHoliday Trains Direct To Lines/Then to Members Direct To Lines/Then to Members Direct To Lines/Then to Members Direct To Lines/Then to MembersAmtrak Transfers Direct To Lines/Then to Members Direct To Lines/Then to Members Direct To Lines/Then to Members Direct To Lines/Then to Members
Route Miles DispatchedDispatching Train Miles Train Miles Train Miles Route Miles Dispatched
Ridership/Revenue DistributionsTransfers to Other Operators Ridership/Revenue Distribution Ridership/Revenue Distribution Ridership/Revenue Distribution Ridership/Revenue DistributionSupplemental Additional Security Ridership/Revenue Distribution Ridership/Revenue Distribution Ridership/Revenue Distribution Ridership/Revenue Distribution
Base AllocationEquipment Maintenance Train Miles Base Formula 50% Original Base Formula/50% Train Miles Lagged (2) 75% Train Miles - Lagged/25% Undup StationsOperating Contingency (Bombardier) Train Miles Base Formula 50% Original Base Formula/50% Train Miles Lagged Train Miles - LaggedNon-Scheduled Rolling Stock Repairs Point-in-Time (1) Base Formula 50% Original Base Formula/50% Train Miles Lagged Train Miles - LaggedOperating Facilities Maintenance Point-in-Time Base Formula 50% Original Base Formula/50% Train Miles Lagged Train Miles - LaggedOther Operating Train Services Point-in-Time/Direct Base Formula 50% Original Base Formula/50% Train Miles Lagged Unduplicated Route Miles (Excl SD Co)Security - Sheriff Point-in-Time Base Formula 50% Original Base Formula/50% Train Miles Lagged Train Miles - LaggedSecurity - Guards Even Split to Operating Lines Base Formula 50% Original Base Formula/50% Train Miles Lagged Unduplicated Route Miles (Excl SD Co)Public Safety Program Point-in-Time Base Formula 50% Original Base Formula/50% Train Miles Lagged Unduplicated Route Miles (Excl SD Co)Utilities/Leases Point-in-Time Base Formula 50% Original Base Formula/50% Train Miles Lagged Unduplicated Route Miles (Excl SD Co)Passenger Relations - Call Boxes Point-in-Time Base Formula 50% Original Base Formula/50% Train Miles Lagged Unduplicated StationsContingency (Non-Train Operating) Point-in-Time Base Formula 50% Original Base Formula/50% Train Miles Lagged Unduplicated Route Miles (Excl SD Co)TVM Maintenance/Revenue Collection Point-in-Time Base Formula 50% Original Base Formula/50% Train Miles Lagged TVMsStation Maintenance - Non-Union Station Direct Base Formula 50% Original Base Formula/50% Train Miles Lagged Unduplicated StationsStation Maintenance - Union Station Revenue Moves through LAUS Base Formula 50% Original Base Formula/50% Train Miles Lagged Revenue Moves thru LAUSPassenger Service Representatives Direct Base Formula 50% Original Base Formula/50% Train Miles Lagged Unduplicated Route Miles (Excl SD Co)Passenger Relations - Call Center/Other Point-in-Time Base Formula 50% Original Base Formula/50% Train Miles Lagged Ridership Distribution - LaggedMarketing/Market Research Point-in-Time Base Formula 50% Original Base Formula/50% Train Miles Lagged Ridership Distribution - LaggedMedia & External Communications Point-in-Time Base Formula 50% Original Base Formula/50% Train Miles Lagged Unduplicated Route Miles (Excl SD Co)Liability/Property/Auto Point-in-Time Base Formula 50% Original Base Formula/50% Undup Rte Miles (exc SD County) Train Miles - LaggedClaims Point-in-Time Base Formula 50% Original Base Formula/50% Undup Rte Miles (exc SD County) Train Miles - LaggedClaims Administration Point-in-Time Base Formula 50% Original Base Formula/50% Undup Rte Miles (exc SD County) Train Miles - LaggedSalaries & Fringe Benefits Point-in-Time Base Formula 50% Original Base Formula/50% Undup Rte Miles (exc SD County) Unduplicated Route Miles (Excl SD Co)Non-Labor Costs Point-in-Time Base Formula 50% Original Base Formula/50% Undup Rte Miles (exc SD County) Unduplicated Route Miles (Excl SD Co)Allocated Overhead Point-in-Time Base Formula 50% Original Base Formula/50% Undup Rte Miles (exc SD County) Unduplicated Route Miles (Excl SD Co)Services Point-in-Time/Direct Base Formula 50% Original Base Formula/50% Undup Rte Miles (exc SD County) Unduplicated Route Miles (Excl SD Co)
(1) Point-In-Time is a weighted average of 25% Unduplicated Route Miles (exc SD County); 25% Unduplicated Stations; 50% Actual Train Miles - Lagged(2) The Base Formula was developed from a weighted average of the two prior years of the expenses included in the "Base Allocation" category.
Budget Item
A.7.2

Allocation of MOW Expenses – Starting in FY 05-06, the method for allocating MOW (track, signals, bridges) expenses was changed from Route-Miles Owned to a service-based (train-mile) methodology. This new methodology has the effect of distributing costs to all members who derive the benefit of any particular line segment, regardless of its ownership. The MOW expenditures related to the Riverside Layover Facility are allocated to the counties through which the Riverside Line runs on the basis of route miles. Since the River Corridor is shared by all lines, the net MOW expenditures on this segment are split to lines and counties on the basis of the “Allshare” formula. Extraordinary Maintenance expenses for derailments ($100,000) are split on the Allshare formula. Point-in Time Formula - Through FY 1996-97, the Point-in-Time formula was used to allocate certain operating costs which did not change with service levels. The Point-in Time formula was calculated as 1/6 unduplicated route miles; 1/6 proposed unduplicated stations; 1/6 projected boardings and alightings; and 1/2 projected source train-miles. Source trains were defined as peak trains starting out of layover facilities. In FY 1998-99, boardings and alightings were removed from the formula since stations provide similar weighting. The formula was also changed to 1/4 unduplicated route miles; 1/4 unduplicated stations; and 1/2 projected source train-miles. Base Service – In an effort to simplify analysis of budget alternatives, a new formula was developed for the FY 1999-00 Operating Budget, which took all services that do not change with the number of trains operated (“base” services) and analyzed how they had been allocated as a group over the prior years. These items had been allocated by a combination of the Point-in-Time formula, even split, and direct allocation to lines. The resulting formula represents an average of the allocation of these “base” services over the prior two years and replaced the Point-in-Time formula. FY 2005-06 Allocation – Since the Base formula had not changed since 1999-00 but significant service had been added, during the fiscal year FY 2003-04, SCRRA and Member Agency staff initiated a process to review, and potentially revise, the methodology under which the agency attributes costs to operating line segments and Member Agencies for the purpose of calculating the distribution of their annual operating budget contribution. Given the complicated nature of this effort, and the expected completion of the Strategic Assessment before the FY 07-08 budget cycle, the Member Agencies agreed to an interim solution for three fiscal years covering the periods FY 2004-05 through FY 2006-07. Members agreed to increase their net subsidy contribution in FY 2004-05 by a fixed amount of 2.37% across the board, and for the years FY 2005-06 and FY 2006-07, a revised interim allocation formula, based on a weighted average of a number of service variables, would be used to calculate each agency’s contribution for the fiscal year. During the Strategic Assessment process, several formula options were evaluated. It was agreed that any operating variables included for formula purposes, wherever practical, would lag from the most recently completed previous fiscal year. In this way, any new services which would otherwise be affected by, or contribute to, the distribution of costs, would operate for some extended period on a marginal cost basis to establish a corresponding operating basis. It was agreed that any operating variables included for
A.7.4

formula purposes, wherever practical, would lag from the most recently completed previous fiscal year. In this way, any new services that would otherwise be, would operate for some extended period on a marginal cost basis to establish a corresponding operating basis. The FY 2007-08 Formula – To more accurately reflect cost drivers, those cost elements of the SCRRA Operating Budget previously allocated through the Base Allocation Formula were sub-divided into six distinct groupings. Wherever possible, cost generating functions of a like nature were grouped together. In the first group, those items more closely related to long-term service levels would be allocated using train miles lagged to represent the average of actual train-miles for the prior two years. The second grouping, SCRRA costs associated with the operating and maintenance of station platforms, were allocated by unduplicated station location. Los Angeles Union Station- related costs were attributed to those lines that utilize the terminal and subsequently to the members participating in those line segments. Passenger Services and Marketing related costs were allocated based on the ridership characteristics of the system lagged to represent the average of actual ridership for the prior two years. Ticket Vending Machine (TVM) maintenance was allocated based on the number of TVMs at the stations in each county. Finally, costs that exhibit the least level of variability to current operating levels were allocated on the basis of route mileage of the system as representative of a larger ownership function that the SCRRA serves on behalf of its members. Maintenance of Equipment is allocated 75% train miles and 25% unduplicated stations to reflect the fact that this activity is driven by both these elements.
A.7.5

Appendix A.8. Glossary of Abbreviations
AAR - American Association of Railroads
APTA - American Public Transportation Association
ATCS - Advanced Train Control System
AV - Antelope Valley
BNSF - Burlington Northern and Santa Fe Railway Company
BRT - Bus Rapid Transit
Caltrans - California Department of Transportation
CEM - Crash Energy Management
CMF - Central Maintenance Facility
CP - Control Point
CPUC - California Public Utilities Commission
CRM - Customer Relationship Management
CTC - California Transportation Commission
DBOM - Design-build-operate-maintain
DBOMF - Design-build-operate-maintain-finance
DMU - Diesel Multiple Unit
DOT - United States Department of Transportation
EAMF - Eastern Area Maintenance Facility
EPIS - Electronic Passenger Information Signage
ETA - Estimated Time of Arrival
FCC - Federal Communications Commission
FEMA - Federal Emergency Management Agency
FRA - Federal Railroad Administration
FTA - Federal Transit Administration
GASB-34 - Governmental Accounting Standards Board Statement 34
GPS - Global Positioning System
HEP - Head-end power
HVAC - heating/ventilation/air conditioning
IEOC - Inland Empire-Orange County
A.8.1

IFB - Invitation for Bid
IVR - Intelligent Voice Response
JPA - Joint Powers Authority
JPB - Peninsula Corridor Joint Powers Board
LACMTA - Los Angeles County Metropolitan Transportation Authority
LAUS - Los Angeles Union Station
LAWA - Los Angeles World Airports
LAX - Los Angeles International Airport
LCD - Liquid Crystal Display
LED - Light Emitting Diode
LIRR - Long Island Railroad
LOSSAN - Los Angeles-San Diego Rail Corridor Agency
LRT - Light Rail Transit
MBTA - Massachusetts Bay Transportation Authority
Metro - Service operated by Los Angeles County Metropolitan Transportation
Authority
MGT - million gross tons
MIS - Management Information Systems
MNR - Metro North Railroad
MOW - Maintenance-Of-Way
MUNI - San Francisco Municipal Railway
NCTD - North County Transit District
NJT - New Jersey Transit
O&M - Operations and Maintenance
OC - Orange County
OCTA - Orange County Transportation Authority
PACMS - Public Address Changeable Message Signs
PDA - Personal Digital Assistant
PGL - Pasadena Gold Line
PRESS - Passenger Rail Equipment Safety Standards
PTA - Public Transit Account
A.8.2

PTC - Positive Train Control
RCTC - Riverside County Transportation Commission
ROW - Right-of-Way
RSAC - Rail Safety Advisory Committee
RSS - Really Simple Syndication
SANBAG - San Bernardino Associated Governments
SANDAG - San Diego Association of Governments
SATAC - Strategic Assessment Technical Advisory Committee
SB - San Bernardino
SCAG - Southern California Association of Governments
SCRRA - Southern California Regional Rail Authority
SMS - Short Message Service (text messaging)
SOV - Single Occupant Vehicle
SSPP - System Safety Program Plan
STIP - State Transportation Improvement Program
SWOT - strengths, weaknesses, opportunities and threats
SWOTU - strengths, weaknesses, opportunities, threats and unknown outcomes
TAZs - Traffic Analysis Zones
TBD - To be determined
TMA - Transportation Management Association
TOD - Transit Oriented Development
TVM - Ticket Vending Machine
UP - Union Pacific Railroad
UPRR - Union Pacific Railroad
U.S. DOT - United States Department of Transportation
VCTC - Ventura County Transportation Commission
VRE - Virginia Railway Express
YOE$ - Year of Expenditure Dollars
A.8.3