![[Automation, Electrification, and Shared Mobility in Freight]](https://static.fdokumen.com/doc/165x107/632813a2e491bcb36c0b98fc/automation-electrification-and-shared-mobility-in-freight.jpg)
[Automation, Electrification, and Shared Mobility in Freight]
Upload
independentCategory
view
4download
0
Page | 1
Scottish Logistics Report
Report prepared for the Freight Transport Association
Professor Alan McKinnon
Kühne Logistics University, Hamburg Heriot-Watt University, Edinburgh
Dr Maja Piecyk
Heriot-Watt University, Edinburgh
September 2012
Page | 2
Contents
1. Importance of Logistics in a National Economy 3
1.1 National Expenditure on Freight Transport and Logistics 3
1.2 Employment in Logistics 4
1.3 Contribution to Business Competitiveness 5
2. Scottish Freight Transport Trends 7
2.1 Measurement of Freight Activity 7
2.2 Trends in Total Freight Tonnage 8
2.3 Trends in Total Tonne-kms 11
3. Road Freight Sector 13
3.1 Road Freight Activity and GDP 13
3.2 Pattern of Scottish Road Freight Flow 16
3.3 Utilisation of HGV Capacity 18
3.4 HGV and Van Traffic Levels 19
3.5 Scottish HGV Fleet 21
3.6 Number of HGV Operators in Scotland 22
4. Rail Freight Traffic 25
5. Container Shipping and RoRo Ferry Trafic 28
6. Air Freight Traffic 32
7. Distribution Centre Development in Scotland 35
8. Carbon Emissions from Freight Traffic Originating in Scotland 39
9. Involvement of Freight Vehicles in Traffic Accidents 42
10. Conclusions 43
References 46

Page | 3
1. The Importance of Logistics to a National Economy
1.1 National Expenditure on Freight Transport and Logistics
Scotland’s first freight strategy document published in 2006 declared that ‘The efficient and
competitive movement of goods through the entire supply chain is a key element in meeting
consumer demand and supporting and enabling economic growth’ (Scottish Government, 2006).
Last year, the UK government’s Logistics Growth Review asserted that ‘The logistics sector is a
hugely important part of the UK economy’ (Department of Transport, 2011a). There is recognition,
therefore, in government circles that the business of distributing goods, so often taken for granted
by the public, is vital to our economic well-being. It can be difficult, however, to quantify its
importance.
The main way in which economists have assessed its importance is by estimating total national
expenditure on logistics and expressing this figure as a percentage of gross domestic product (GDP)
or gross value added (GVA). In a recent study conducted for International Transport Forum, Rantasila
and Ojala (2012) discuss methodological and analytical challenges in making accurate logistics cost
calculations at the national, regional and global levels. They note that markedly different
approaches have been used in different countries and question the comparability of the resulting
estimates. One study, by Rodrigues at al. (2005), used the same method to estimate the level of
logistics costs in a large sample of countries and extrapolated on this basis to arrive at the first
estimate of global logistics spend. This suggested that US$ 6,732 billion was spent worldwide on
logistics in 2002, equivalent to 13.8% of the world's GDP that year. The corresponding figure for the
UK was calculated to be US$ 174 billion, accounting for 11.3% of the UK's GDP in 2002. This is very
close to the UK government estimate of 9% of GVA in 2011 (Department of Transport, 2011a).
No comparable calculation has yet been done for Scotland, combining estimates of expenditure on
freight transport, warehousing and inventory. An attempt was made in 2006, however, to estimate
the total value of freight transport to the Scottish economy (Steer Davies Gleave, 2006). This arrived
at a figure of just under £4.6 billion in 2005 prices, representing 5.5% of the total Scottish GVA
(estimated at £82.57 billion at 2005 prices). Data from the main European survey of logistics costs
(A.T.Kearney, 2009) suggests that freight transport typically constitutes 40-50% of total logistics
costs. If this were the case in Scotland, the 5.5% figure for freight expenditure would be consistent
with the 9% GVA figure for logistics reported for the UK as whole.

Page | 4
Gross Value Added £ billions
(2005 prices)
Road freight intra-Scotland 2.296
Road freight between Scotland & rest of UK 1.870
Islands movements 0.022
Other sea freight 0.130
Rail freight 0.162
Air freight 0.092
Total 4.572
Table 1.1. Value of freight transport sector to Scotland's economy
Source: Steer Davies Gleave, 2006.
According to the Steer, Davies, Gleave study road haulage, railfreight, seafreight (excluding island
services) and airfreight contributed, respectively, 91%, 3.5%, 2.8% and 2% of the total value of
freight transport in Scotland. Movements of freight between the Scottish mainland and the islands
and within the islands accounted for only 0.5% of expenditure.
Cost is not the only metric against which the importance of freight transport and logistics can be
measured. Their contribution to the Scottish economy can also be considered in the other ways.
1.2 Employment in Logistics
According to Skills for Logistics (2010), there were 192,735 companies operating in the UK logistics
sector in 2010, 12,310 (6%) of which were based in Scotland. This does not include companies
primarily classified in other sectors, such as retail or manufacturing, many of which will perform at
least some logistics functions. The logistics sector offers a range of occupations including Heavy
Goods Vehicles (HGV) and van drivers, transport-, purchasing- and warehouse-managers and
supervisors, operators of handling equipment, warehouse staff, employees in rail-,sea- and air-
freight operations and a range of related office jobs.
It has been estimated that, across Scotland, 113,200 people work in the logistics sector (as defined
by the Standard Industrial Classification [SIC]). This accounts for roughly 5% of the Scottish
workforce. Including those who work in key logistics roles in other sectors, the number increases to
163,100 people or 7% of Scotland's workforce (Table 1.2). 53,200 people (33% of the total logistics
workforce in Scotland) are employed in freight transport-related jobs (excluding couriers).

Page | 5
Employment in logistics
occupations
Total in Logistics
Sector
Logistics
Sector (SIC)
Other
Sectors Number %
Purchasing managers * 2,300 2,300 1%
Transport and distribution managers 2,500 3,500 6,000 4%
Storage and warehouse managers 2,000 3,600 5,600 3%
Importers, exporters 400 100 500 0.3%
Transport and distribution clerks 2,300 2,900 5,100 3%
HGV drivers (driving vehicles over 7.5 tonnes) 13,800 9,600 23,300 14%
Van drivers (driving vehicles up to 7.5 tonnes) 5,500 10,600 16,100 10%
Transport operative 1,300 1,500 2,700 2%
Stevedores, dockers and slingers 400 200 600 0.4%
Other goods handling and storage
occupations 7,600 13,600 21,200 13%
Post worker, mail sorter or courier 12,800 2,100 14,900 9%
Other occupations, including marketing and
sales managers, accountants, etc. 64,700 64,700 40%
Total 113,200 49,900 163,100
Table 1.2 Logistics-related employment in Scotland (numbers rounded up to the nearest 100)
Source: Skills for Logistics, 2010
1.3 Contribution to Business Competitiveness
The efficiency with which companies move, handle and store their products is a key determinant of
their competitiveness and profitability. Logistics not only affects the cost side of the balance sheet,
however. By providing customers with faster and more reliable services, it is possible to win
additional sales and secure greater customer loyalty. Market research studies show that in the
ranking of industrial purchasing criteria, speed and reliability of delivery usually come a close second
to product design and quality in influencing the choice of supplier. Over the past thirty years just-in-
time scheduling has become tighter and more widely diffused across the economy increasing the
vulnerability of production and distribution systems to delay. For companies based in a peripheral
country like Scotland, at the beginning or end of long supply chains, this presents a major challenge.

Page | 6
The available benchmark data suggests that the UK as a whole has a strong logistics capability by
comparison with other countries. It was rated 10th out of 155 countries in the latest Logistics
Performance Indicator (LPI) survey conducted by the World Bank (2012). In the World Economic
Forum's (2012) Enabling Trade Index report, the UK was rated 11th out of 132 countries. In terms of
the sub-indices of ‘availability and quality of transport infrastructure’ and ‘availability and quality of
transport services’ it achieved 9th and 7th positions, respectively. DHL (2011) has also compared
countries in terms of their ‘ global connectedness’, defined as ‘the depth and breadth of a country's
integration with the rest of the world as manifest by its participation in international flows of
products and services, capital, information, and people’ (p.16). The UK performed even better in
this survey gaining 6th place out of the 125 countries analysed in the report. While the
connectedness index is not solely logistics-oriented, one of its key components is physical trade flow
(35% of the final score). Freight transport and logistics are the key enablers of this flow and thus
indirectly contribute to the UK's high ranking.
If Scotland were separately evaluated by these benchmark surveys, where would it be positioned
relative to the UK? The lack of direct deep-sea shipping and airfreight services would weaken its
relative standing, though road congestion levels in Scotland are relatively low and customs clearance
times often shorter than in the major English ports and airports. The Scottish Government should
consider conducting an LPI-type survey of Scotland’s logistical capabilities to allow them to be
compared with those of the countries rated by the World Bank study.
Kim and Min (2011) investigate whether some countries achieve logistical efficiency at the cost of
the environmental performance. They propose a Green Logistics Performance Index (GLPI), a
combination of the World Bank’s Logistics Performance Index (LPI) and the World Economic Forum’s
Environmental Performance Index (EPI). The GLPI is suggested as an indicator of a country’s green
logistics efficiency, reflecting the impact of logistics competitiveness on the environment. The UK
was ranked 14th out of 146 countries for which both the 2010 LPI and EPI data were available. The
UK’s consistently high LPI (10th) and GLPI (14th) scores demonstrate high logistics service standards
that do not seriously compromise the environmental performance of the economy.

Page | 7
Section 2 Scottish Freight Transport Trends
2.1 Measurement of Freight Activity
Generally speaking, the amount of freight transport activity can be measured in three ways:
Tonnes-lifted: this is a measure of the weight of goods loaded onto vehicles, rail-wagons, ships
or planes at the start of a journey. It takes no account of the distance they are transported. As
the movement of products from their first point of production to their final point of sale
comprises several journeys there is multiple counting of the goods as they pass along the
supply chain. The final tonnes-lifted figure is therefore much larger than the physical quantity
of goods produced and consumed in the country. Indeed the ratio of tonnes-lifted to weight
of goods produced or consumed is often used as a crude measure of the number of links in a
supply chain (known as the ‘handling factor’).
It is important to bear this in mind when interpreting the tonnes-lifted statistic, because it is
partly dependent on the amount of a product’s supply chain that passes through the country.
For example, in the case of whisky most of the upstream stream supply chain is confined to
Scotland: e.g. grain from East Lothian to a Highland distillery to a bonded warehouse for long
term storage to a bottling plant in the Central Belt to a port or rail terminal for outbound
distribution – a total of five links and five nodes at which the tonnes-lifted would be recorded.
On the other hand, the inbound distribution of, say, a television manufactured in China might
involve delivery via a distribution centre (DC) in Scotland to the shop (1 node and 1 internal
Scottish link). It could possibly travel directly to a Scottish shop from a DC in England in which
case the weight of the television would not be recorded at all in the Scottish tonnes-lifted
figure.
So the tonnes-lifted figure is not simply a function of the total mass of goods in the Scottish
economy. Changes in the country’s production and distribution systems and the
reconfiguration of companies’ supply chains can significantly distort this relationship in the
longer term. In the short to medium term, however, the tonnes-lifted statistic is quite a good
barometer of changes in the level of economic activity.
Tonne-kms: this is a composite measure that takes account of both the weight transported
and the distance moved. Like the tonnes-lifted statistic it is subject to multiple counting.
Page | 8
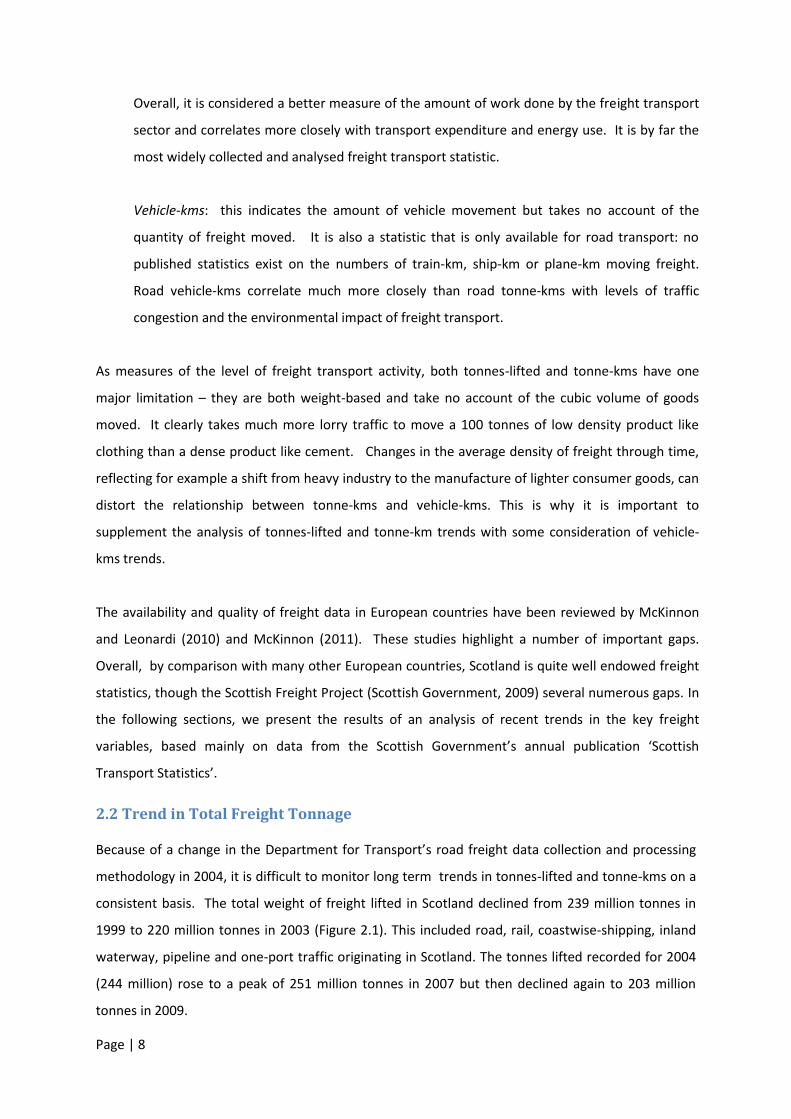
Overall, it is considered a better measure of the amount of work done by the freight transport
sector and correlates more closely with transport expenditure and energy use. It is by far the
most widely collected and analysed freight transport statistic.
Vehicle-kms: this indicates the amount of vehicle movement but takes no account of the
quantity of freight moved. It is also a statistic that is only available for road transport: no
published statistics exist on the numbers of train-km, ship-km or plane-km moving freight.
Road vehicle-kms correlate much more closely than road tonne-kms with levels of traffic
congestion and the environmental impact of freight transport.
As measures of the level of freight transport activity, both tonnes-lifted and tonne-kms have one
major limitation – they are both weight-based and take no account of the cubic volume of goods
moved. It clearly takes much more lorry traffic to move a 100 tonnes of low density product like
clothing than a dense product like cement. Changes in the average density of freight through time,
reflecting for example a shift from heavy industry to the manufacture of lighter consumer goods, can
distort the relationship between tonne-kms and vehicle-kms. This is why it is important to
supplement the analysis of tonnes-lifted and tonne-km trends with some consideration of vehicle-
kms trends.
The availability and quality of freight data in European countries have been reviewed by McKinnon
and Leonardi (2010) and McKinnon (2011). These studies highlight a number of important gaps.
Overall, by comparison with many other European countries, Scotland is quite well endowed freight
statistics, though the Scottish Freight Project (Scottish Government, 2009) several numerous gaps. In
the following sections, we present the results of an analysis of recent trends in the key freight
variables, based mainly on data from the Scottish Government’s annual publication ‘Scottish
Transport Statistics’.
2.2 Trend in Total Freight Tonnage Because of a change in the Department for Transport’s road freight data collection and processing
methodology in 2004, it is difficult to monitor long term trends in tonnes-lifted and tonne-kms on a
consistent basis. The total weight of freight lifted in Scotland declined from 239 million tonnes in
1999 to 220 million tonnes in 2003 (Figure 2.1). This included road, rail, coastwise-shipping, inland
waterway, pipeline and one-port traffic originating in Scotland. The tonnes lifted recorded for 2004
(244 million) rose to a peak of 251 million tonnes in 2007 but then declined again to 203 million
tonnes in 2009.

Page | 9
Figure 2.1: Freight Lifted in Scotland
Source: Transport Scotland , 2011a
Even after the recent decline in freight tonnage, Scotland generates substantially more freight per
capita than Great Britain as a whole (Table 2.1), 42% more in 2009 and an average of 34% more
between 2000 and 2009. This can be largely attributed to the large quantities of North Sea oil
transported to and across Scotland. Scottish coast-wise tonnage per capita is 322% above the UK
average and pipeline tonnage per capita 489% above it. Even road freight tonnage per capita,
however, was around 12% above the GB average in 2009.
Scotland Great Britain
Road 25.4 22.7
Rail 1.9 1.5
Coastwise traffic 4.5 1
Pipeline 5.3 0.9
Total 37.1 26.1
Table 2.1: Tonnes of Freight per Capita in Scotland and Great Britain in 2009
Source: Transport Scotland , 2011a
In 2009 the road network carried 65% of the tonnage lifted in Scotland, with pipelines, coastwise
shipping, inland waterways and rail transporting, handling respectively, 14%, 10%, 5% and 5%
0
50
100
150
200
250
300m
illio
n t
on
ne
s
Road
Rail
Coastwise shipping
Inland waterway
Pipeline
One port traffic
Total

Page | 10
(Figure 2.2). It is worth noting that despite the great prominence given to the railfreight sector in
government policy statements, its share of the Scottish freight market is around only around a third
that of pipelines. The Scottish freight modal split, measured in tonnes-lifted, has changed little of the
past decade, despite the efforts of government policy-makers to promote a major shift to rail and
water-based modes (Figure 2.3).
Figure 2.2: Scottish Freight Modal Split (by tonnes-lifted) 2009
Source: Transport Scotland , 2011
Figure 2.3 Variation in Scottish Freight Modal Split (% of tonnes-lifted): 1999-2009
Source: Transport Scotland , 2011a
Road 65.1%
Rail 4.8%
Coastwise shipping
9.8%
Inland waterway 5.0%
Pipeline 13.6%
One port traffic 1.8%
0%
10%
20%
30%
40%
50%
60%
70%
80%
90%
100%
1999 2000 2001 2002 2003 2004 2005 2006 2007 2008 2009
Road Rail Coastwise shipping Inland waterway Pipeline One port traffic

Page | 11
2.3 Trend in Total Tonne-kms
Total tonne-kms dropped steeply at the beginning of the decade but thereafter remained fairly
stable until the 2009 recession (Figure 2.4). Over the period 2000-2009, there was pronounced
decoupling of the total tonne-kms and GDP trends, with the latter rising steadily until 2007-8 and the
tonne-km statistics remaining fairly flat. Similar decoupling has been observed at a UK level and in
other countries such as Denmark and Finland. It can be attributed to numerous factors, such as the
offshoring of manufacturing to low labour cost countries (as happened to the Scottish electronics
industry) and the service sector increasing its share of GDP.
Figure 2.4: Total Freight Tonne-km and GDP Trends in Scotland 2000-2009.
Sources: Transport Scotland , 2011a, The Scottish Government, 2012
Disaggregating the data by transport mode reveals that the sharp decline in tonne-kms between
1998 and 2001 was attributed to a single mode, coast-wise shipping, and a drop in off-shore oil
traffic over this period (Figure 2.5). The tonne-km trends for the other freight transport modes were
remarkably stable between 1998 and 2009. This shows that over this period Scotland’s freight
modal split was not only fairly stable when measured by tonnes-lifted, as observed earlier; in terms
of tonne-kms it also changed little over these eleven years.
50
60
70
80
90
100
110
120
130
GDP total tonne-kms

Page | 12
Figure 2.5: Freight Moved in Scotland – tonne-kms (freight lifted in Scotland)1
Source: Transport Scotland , 2011a
As road is by far the dominant freight transport mode in Scotland, we will examine the road
freight trends in greater detail in the next section.
1 Due to changes in methodology there are two breaks in data series: figures for coastwise shipping from 2000
onwards and for road freight from 2004 onwards are not directly comparable with statistics for previous years.
0
10
20
30
40
50
60
Road
Rail
Coastwise shipping
Inland waterway
Pipeline
Total
bill
ion
to
nn
e-k
ms

Page | 13
3. Road Freight Sector
3.1 Road Freight Activity and GDP
Historically, the growth of road tonne-kms has closely paralleled general economic growth measured
by GDP. There has been much debate about the possibility of decoupling these trends, allowing the
economy to continue expanding without exacerbating the environmental and congestion problems
associated with freight traffic growth. When, after 1998, the two trends began to diverge at both
UK and Scottish levels (Figure 3.1), some transport analysts suggested that this could represent the
start of a longer term decoupling of these trends (McKinnon, 2006). Although the road tonne-km
trend has become fairly erratic since 2003, the road freight intensity of the Scottish economy has
been steadily diminishing. The 2008-2009 recession reinforced the decoupling trend, with road
tonne-kms plunging by around 20% from its 2007 peak and GDP dropping by only around 4% in real
terms.
Figure 3.1 Relationship between Economic Growth and Road Freight Transport in Scotland
Source: Transport Scotland 2011a, The Scottish Government, 2012
As explained earlier, freight traffic growth is not simply the result of an increase in the physical mass
of goods being produced and consumed. Of much greater importance are changes in business
processes and logistics practices. This can be shown by breaking down the relationship between
GDP and road freight tonne-kms into a series of statistical aggregates and ratios (Figure 3.2). The
value-density ratio translates the monetary value of economic output into a physical measure of the
50
60
70
80
90
100
110
120
130
road tonne-kms
GDP
road freight intensity
Ind
ex 2
00
0 =
10
0

Page | 14
weight of goods produced (and imported), the handling factor ratio converts this weight into freight
tonnes-lifted and the average length of haul converts the tonnes-lifted figure into tonne-kms.
Figure 3.2 lists some of the major business processes which have been influencing these ratios. The
nature and strength of these trends varies from sector to sector and country to country.
Figure 3.2 Key Components in the GDP – Road Tonne-km Relationship
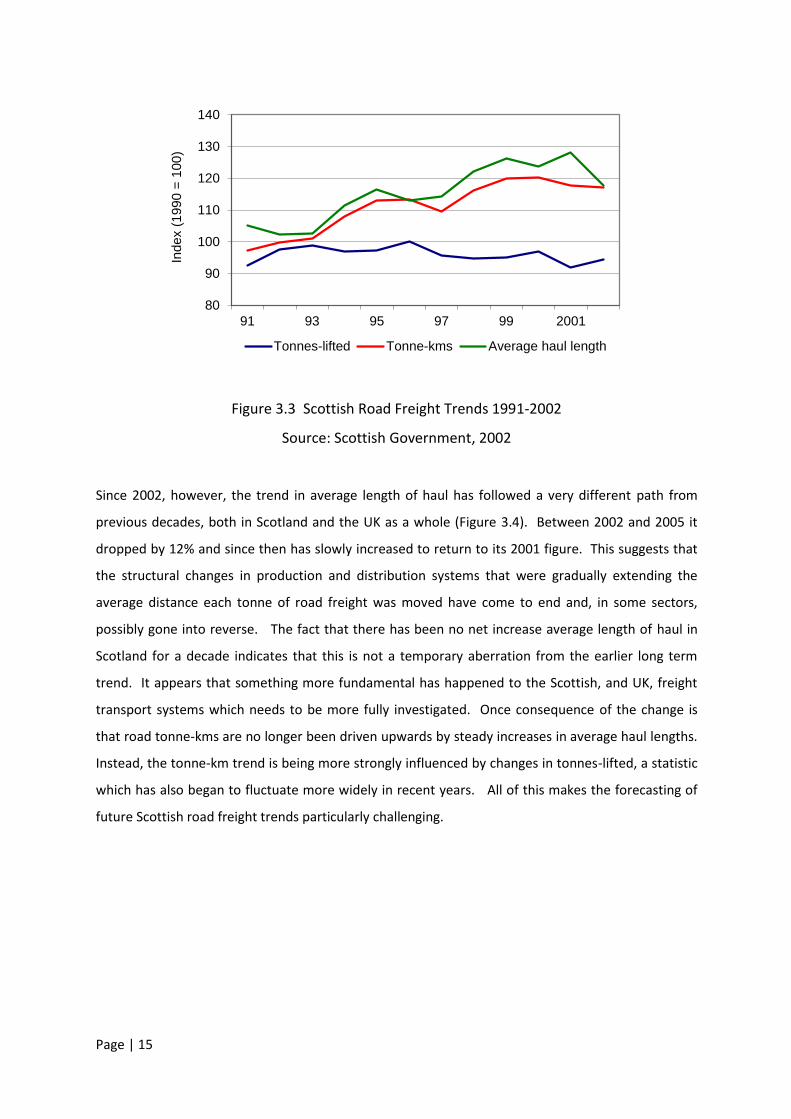
For several decades up until the early 2000s, both in the UK and within Scotland, the main driver of
freight traffic growth was an increase in the average length of haul (Figure 3.3). Between 1990 and
2002, for example, the average distance moved by road freight consignments in Scotland increased
by 24% from 45.9 km to 56.8 kms. The tonnage of freight carried actually declined by 6% over this
period. These trends closely mirrored the situation across the UK as a whole. The increase in
average haul lengths indicated that the Scottish economy, like that of other countries and regions,
was generating more tonne-kms of freight movement for every tonne of goods produced and
consumed. This seemed to be occurring primarily as a result of two major logistical trends:
the centralisation of economic activity in larger, more efficient factories, warehouses, terminals
and shops.
the wider sourcing of supplies at different levels of the supply chain
Both of these processes have been intrinsic to economic development over the past forty years.
Value of goods
produced /consumed
Weight of goods
transported
Tonnes-lifted
Tonne-kilometres
Value Density
Handling Factor
Average Length
of Haul
Contracting out productionprocesses
Growth of direct shipment
Wider sourcing
Inventory centralisation
Concentration of production
Miniaturisation
Increased packaging
Substitution of light for heavymaterials
Aggregates Key Ratios Business Processes
Page | 15
Figure 3.3 Scottish Road Freight Trends 1991-2002
Source: Scottish Government, 2002
Since 2002, however, the trend in average length of haul has followed a very different path from
previous decades, both in Scotland and the UK as a whole (Figure 3.4). Between 2002 and 2005 it
dropped by 12% and since then has slowly increased to return to its 2001 figure. This suggests that
the structural changes in production and distribution systems that were gradually extending the
average distance each tonne of road freight was moved have come to end and, in some sectors,
possibly gone into reverse. The fact that there has been no net increase average length of haul in
Scotland for a decade indicates that this is not a temporary aberration from the earlier long term
trend. It appears that something more fundamental has happened to the Scottish, and UK, freight
transport systems which needs to be more fully investigated. Once consequence of the change is
that road tonne-kms are no longer been driven upwards by steady increases in average haul lengths.
Instead, the tonne-km trend is being more strongly influenced by changes in tonnes-lifted, a statistic
which has also began to fluctuate more widely in recent years. All of this makes the forecasting of
future Scottish road freight trends particularly challenging.
80
90
100
110
120
130
140
91 93 95 97 99 2001
Index (
1990 =
100)
Tonnes-lifted Tonne-kms Average haul length

Page | 16
Figure 3.4 Scottish Road Freight Transport Trends 2000-2010 Source: Transport Scotland 2011a
3.2 Pattern of Scottish Road Freight Flows
Government statistics indicate that, in 2008, around 92% of freight tonnage collected by trucks in
Scotland was destined for locations within this country. This is much higher than the corresponding
figure for the English regions, which averages 65%, and Wales (67%) (Department for Transport,
2009). It suggests that the Scottish economy is more self-sufficient than other UK regions and has
stronger internal linkages. The statistics also suggest that most of the freight travelling to and from
Scotland moves relatively short distances to and from locations in the north of England. 80% of road
freight lifted for destinations outside Scotland travels to the North East and North West of England.
One must exercise caution, however, in interpreting the results of the government’s road freight
surveys. They shed very little light on the length and complexity of Scottish companies’ supply
chains. This is because the freight data is collected for individual journeys and no attempt is made to
track consignments across all the journeys they make between raw material source and final point of
sale. Many of the road journeys that appear to be internal to Scotland in fact move goods from a
factory to a port, airport or railhead from which they are despatched to distant locations.
This is not to deny, however, that the volumes of freight traffic moving directly between Scotland
and other countries are relatively modest. For example, in 2010, only 0.3% of road freight originating
in Scotland, around 400,000 tonnes per annum, was distributed directly to other countries. This
partly reflects the size of Scotland’s industrial base and population. It is also a consequence of the
high value-density of its main export, whisky, which (with duty paid) generates relatively few loads
80
90
100
110
120
2000 2001 2002 2003 2004 2005 2006 2007 2008 2009 2010
20
00
=10
0
Road tonne-kms Road tonnes lifted Average length of haul

Page | 17
per £ million of sales. The present volume of international traffic, nevertheless, supports a healthy
range of transport options for exporters, with service frequencies and transit times that generally
allow them to compete effectively in foreign markets.
Operators of freight services to and from Scotland, nevertheless, face a perennial problem of
achieving balanced loading of vehicles, vessels and rolling stock. There are, for example, pronounced
imbalances in road freight flows both between Scotland and England and Scotland and mainland
Europe. Rather curiously, these imbalances are in the opposite direction (Table 3.1). In the case of
Scotland's links with England, for every tonne 'exported' to England in 2010, 1.2 tonnes were
'imported'. This ratio has declined from 1: 1.3 over the past decade and this should have made it
slightly easier for transport operators to obtain backloads. In the case of Scotland's direct road
services with mainland Europe, flows are much more skewed, with Scotland 'exporting' 2 tonnes for
every 1 tonne received. The available data suggest that this ratio has fluctuated quite widely but has
been following an underlying downward trend.
Scotland to Rest of UK
Rest of UK to Scotland
Scotland to Other Countries
Other countries to Scotland
2000 1 1.3 1 0.4
2010 1 1.2 1 0.5
Table 3.1 Road Freight Traffic Imbalances to and from Scotland, 2000 and 2010
Source: Transport Scotland, 2011a
These traffic imbalances can be attributed to several factors:
1. Whisky, the main export flow in terms of tonnage, is produced using mainly indigenous products.
Outbound deliveries are not, therefore, balanced by inbound flows of raw materials.
2. A large proportion of the products imported into Scotland are channelled through warehouses
and factories in England. The last leg of their journey into Scotland is therefore a domestic haul.
3. In terms of physical freight volumes, there is a ‘trade-imbalance’ between Scotland and the rest
of the UK.
As the domestic and international traffic imbalances are in opposite directions, it is possible for
international carriers to improve vehicle load factors by engaging in a practice called ‘triangulation’.
This often involves routing vehicles directly to mainland European customers on North Sea ferry
routes and bringing them back via the south of England to pick up a return load. This allows hauliers

Page | 18
to achieve more balanced loading, but exacerbates the backhaul problem for shipping companies
providing Scotland with direct maritime links to the European mainland.
The cross-border traffic imbalance results in southbound freight rates to England being significantly
lower than those for inbound services. This works to the advantage of companies distributing to
England from a base in Scotland. When combined with other locational advantages, such as lower
labour costs, lower labour turnover, lower property prices and the availability of government
regional assistance, these lower transport costs can make Scotland an attractive place in which to
establish a distribution centre (DC), as illustrated by Amazon’s recent decision to locate its largest
European DC in Fife.
3.3 Utilisation of HGV Capacity
As explained earlier, the growth in road tonne-kms does not translate directly into an increase in the
amount of lorry traffic on the ground. Its impact on lorry traffic levels depends on the loading of the
vehicles and the distance they run empty. No published statistics are available on the average
payload weight of lorries running on Scottish roads or the proportion of lorry-kms run empty. Across
the UK as a whole, the so-called ‘lading factor’ of trucks (defined as the proportion of the available
capacity in the truck fleet to move tonne-kms that is actually used) has followed a U-shaped trend
over the past decade, dropping from 0.60 to 0.56 between 2000 and 2006 and gradually recovering
to 0.59 by 2010 (Figure 3.5). The trend in the empty running of lorries, which between 1973 and the
early 2000s was almost steadily downwards has ‘rebounded’ since 2003, rising from 26.6% to almost
29% in 2010 (Figure 3.6). If road freight transport in Scotland has followed the UK trends in these
truck utilisation variables, its efficiency may have declined and the number of vehicle-kms required
to move a given number of tonne-km may have increased. Further research would be required,
possibly using unpublished data from the Dept of Transport’s ‘Continuing Survey of Road Goods
Transport’, to provide a Scottish perspective on lorry utilisation. It is important to note, however,
that the lading factor is a weight-based measure that sheds no light on the cube utilisation of road
vehicles. Between 1997 and 2009, a series of UK-government-funded surveys collected data on the
volumetric, as well as weight-based, utilisation of lorries in particular sectors, such as food and drink
and parcels (McKinnon, 2009a). Regrettably these surveys and wider Freight Best Programme of
which they were a part have been discontinued both at a UK level and by the Scottish Government.

Page | 19
Figure 3.5 Average Lading Factor for HGVs in Great Britain 2000-2010 Source: Department for Transport, 2011b
Figure 3.6: % of HGV-kms Run Empty in Great Britain 2000-2010 Source: Department for Transport, 2011b
3.4 HGV and Van Traffic Levels Between 2000 and 2010 the amount of HGV traffic on Scottish roads remained fairly stable,
fluctuating around 2.6 billion vehicle-kms (Figure 3.7). As a % of total traffic it declined slightly
between 2000 and 2010 from 6.2% to 5.9%. Dividing HGV tonne-kms by HGV lorry-kms yields a
crude measure of the average payload weight carried by lorries. This average weight dropped quite
steadily over the decade from 6.1 to 5.0 tonnes. This suggests that around a fifth more lorry traffic
was required in 2010 to move the same tonnage of freight as in 2000. It does not necessarily mean
that the haulage industry was less efficient in 2010, as it could partly reflect a reduction in average
54%
56%
58%
60%
62%
2000 2001 2002 2003 2004 2005 2006 2007 2008 2009 2010
25%
26%
26%
27%
27%
28%
28%
29%
29%
30%
2000 2001 2002 2003 2004 2005 2006 2007 2008 2009 2010

Page | 20
load density and greater directional imbalances in road traffic flows causing an increase in empty
running. The actual causes of this decline in average payload weight warrants investigation.
Figure 3.7 Trends in Lorry and Van Traffic on the Scottish Road Network: 2000 – 2010
Source: Transport Scotland, 2011a
In contrast to the level of HGV traffic which remained relatively stable, van traffic grew by a third
between 2000 and 2010 making it by far the fastest growing category of traffic on the Scottish road
network. Vans also increased their share of total traffic from 11.6% to 14% over this period. It must
be emphasised, however, that vans are not simply freight vehicles (Figure 3.8). The Van Activity
Survey of the Department of Transport (2004) has revealed that, across the UK, company vans run as
much of their annual mileage for commuting purposes as for transporting freight (in each case
around a third of vehicle-kms). They are also extensively used by tradesmen for transporting
equipment, which is not normally defined as freight. The huge growth in van traffic is associated
mainly with the growth of the service sector and expansion of home delivery driven primarily by
online retailing.
0.0
1.0
2.0
3.0
4.0
5.0
6.0
7.0
2000 2001 2002 2003 2004 2005 2006 2007 2008 2009 2010
HGV
vans
bn
veh
icle
-km

Page | 21
Figure 3.8 HGV and Van Traffic as a % of Total Traffic on the Scottish Road Network.
Source: Transport Scotland, 2011a
3.5 Scottish HGV Fleet
Between 2000 and 2010 there was a 1% reduction in the number of registered HGVs in
Scotland (Table 3.2). It is not possible to relate this reduction in total fleet size to the
amounts of freight moved on Scottish road because much of the freight moved in Scotland is
carried by vehicles registered elsewhere in the UK or abroad. Also, Scottish-registered
vehicles, especially the heavier long haul trucks, run much of their annual mileage outside
the country. The slight reduction in HGV numbers may be the result of several factors:
Gross weight (tonnes)
2000 2010 % change Number of HGVs
(thousands) % of year
total Number of HGVs
(thousands) % of year
total
3.5 - 7.5 9.9 32% 8.9 29% -10%
7.51 - 12 1.1 3% 0.7 2% -32%
12.1 - 16 1.4 5% 1.2 4% -16%
16.1 - 20 5.2 17% 4.4 14% -15%
20.1 - 24 0.9 3% 1.0 3% 13%
24.1 - 28 3.1 10% 4.0 13% 29%
28.1 - 32 1.7 5% 2.7 9% 60%
32.1 - 38 3.6 12% 0.7 2% -80%
over 38 3.8 12% 6.7 22% 76%
Total 30.7 30.4 -1%
Table 3.2 Heavy goods vehicles licensed in Scotland at 31 December 2000 and 2010
Source: Transport Scotland , 2011a
0.0%
2.0%
4.0%
6.0%
8.0%
10.0%
12.0%
14.0%
16.0%
2000 2001 2002 2003 2004 2005 2006 2007 2008 2009 2010
HGV
vans

Page | 22
Increase in maximum lorry weight: Companies have taken advantage of the increases in maximum
gross lorry weight in 2001 (from 41 to 44 tonnes for 6-axle vehicles). By the end of 2010, 22% of all
the lorries licensed in Scotland were plated at the heaviest weight.
Operation of fleets more intensively over the twenty-four cycle: Across the UK road network
as a whole the proportion of lorry-kms run between 8 pm and 6 am increased from 8.5% in
1985 to almost 20% in 2005, taking advantage of the move to 24 hour operation at industrial
and commercial premises. This trend not only makes better use of the vehicle asset, it also
minimises exposure to day-time traffic congestion and relieves pressure on the road
infrastructure at peak times.
Contraction of the Scottish road haulage industry: as discussed in the next section there has
been a significant reduction in the number of businesses in Scotland registered to operate
HGVs over the past decade.
3.6 Number of HGV Operators in Scotland
To operate an HGV (defined as a lorry with a gross weight in excess of 3.5 tonnes), a business must
obtain one of three types of license:
Restricted licenses authorise operators to carry their own goods in the course of their trade or
business in Great Britain and on international journeys.
Standard National licenses authorise operators to carry both their trade and business and
goods for other people for hire and reward in Great Britain.
Standard International licenses are like Standard National licenses but operators are also
allowed to carry goods for themselves and other people to countries outside Great Britain.
The number of licenses ‘in issue’ to goods vehicle operators has been declining continuously over the
past decade, both in Scotland and across the UK as a whole (Figure 3.9). Overall, there were 1897
fewer licensed HGV operators in Scotland in 2010-11 than in 1999-2000, a drop of 20% since 1999.
Over this period, the number of Restricted licenses in issue fell by 18%, Standard National licenses by
20% and Standard International by 31%. Just as at UK level, the largest decline in the number of
registered operators in Scotland has been in the international category, reflecting the fact that UK
hauliers have found it increasingly difficult to compete on the European market. This trend may also

Page | 23
likely to be related to the decline in exports to other European countries, as exporters tend to use
their local hauliers for international distribution to foreign markets. The proportions of Scottish HGV
licences in the three categories have, nevertheless, changed little over the past decade (Figure 3.10)
Figure 3.9 Goods Vehicle Operators Registered in Scotland: 1999-2011
Source: Office of the Traffic Commissioners, 2000-2011
Figure 3.10 Proportion of Restricted, Standard National and Standard International Licenses
held by Scottish-registered Operators.
Source: Office of the Traffic Commissioners, 2000-2011
0
1000
2000
3000
4000
5000
6000
7000
8000
9000
10000
Restricted Standard National Standard International
46% 47% 44% 44%
10% 9%
0%
10%
20%
30%
40%
50%
1999-00 2010-11
Restricted Standard National Standard International

Page | 24
Average fleet size varies widely between operators on the different types of license. Own account
operators with restricted licences typically have much smaller fleets than ‘hire-and-reward’ hauliers
operating in the UK and internationally. In 2010-11 these hauliers held 53% of the licences in
Scotland but operated 68% of the HGVs (Figure 3.11) . Across the entire population of Scottish HGV
operators the average fleet size increased between 1999 and 2011, but only marginally from 3.8 to
4.5 vehicles. The road haulage industry in Scotland, like its counterparts in virtually every other
country in the world, remains highly fragmented.
Figure 3.11 Goods Vehicle Operators – Proportion of Specified Vehicles on Restricted, Standard
National and Standard International Licenses 1999-00 and 2010-11
Source: Office of the Traffic Commissioners, 2000-2011
22% 22%
59% 61%
19% 17%
0%
10%
20%
30%
40%
50%
60%
70%
1999-00 2010-11
Restricted Standard National Standard International

Page | 25
4. Rail Freight Traffic
In the years following its privatisation in 1996, the UK railfreight sector enjoyed a healthy growth in
traffic volumes. This growth slacked in the early 2000s both across the UK and in Scotland.
Maintenance work on the rail network after the Hatfield rail crash in October 2000 was highly
disruptive to rail freight operations and resulted in an erosion of traffic to other modes. For
example, container services between Freightliner’s Scottish terminal in Coatbridge and the English
deep-sea ports suffered a major loss of traffic which it has proved extremely difficult to regain.
Railfreight operations in Scotland experienced a sharp increase in tonnes-lifted between 2002 and
2005 (Figure 4.1) mainly as a result of the growth in coal import through Hunterston and their
movement by rail to English power stations. Total tonnes-lifted then declined between 2005 and
2009, partly as a result of this coal traffic diminishing. Between 2000 and 2009, rail tonnes-lifted in
Scotland rose by 17% while across the UK as a whole they dropped by 9%. Over the past 5-6 years
there has also been an increase in inbound railfreight flows partly as a result of major retail chains,
such as Tesco and ASDA, switching some of the Anglo-Scottish deliveries to rail.
Figure 4.1 Flows of Rail Freight Tonnage into and out of Scotland
Source: Transport Scotland, 2011a
As shown in Figure 4.1, Scotland has been generating more outbound railfreight tonnage than
inbound, though these trends have been converging. Allowance must also be made for differences
in the average density of freight moved by rail in the different directions. A wagonload of coal or
whisky, for example, weighs much more than a wagonload of groceries.
0
5
10
15
20
25
1999 2000 2001 2002 2003 2004 2005 2006 2007 2008 2009
outbound
inbound
total
mill
ion
to
nn
es-l
ifte
d

Page | 26
Load density has wider implication for the analysis of railfreight trends and the derivation of
government targets for increasing rail’s share of the freight market. In recent years the rail freight
commodity mix has been changing, with a decline in the movement of heavy primary products like
coal and steel and a growth in lighter consumer goods. As official railfreight statistics measure
traffic solely in terms of weight, no account is taken of this trend and the rail sector not given
sufficient credit for its success in winning increasing volumes of lower-density, higher-value goods
(Woodburn, 2007).
Analysis of the destinations of railfreight tonnage originating in Scotland reveals markedly different
trends (Figure 4.2). For much of the past decade, there has been a steady growth in the internal
movement of freight by rail in Scotland. Railfreight tonnage moving to other UK locations
experienced a major ‘spike’ around the middle of the decade (due mainly to coal imports through
Hunterston) but returned to their 2000 level by 2009 and are now substantially below the internal
Scottish tonnage. Direct international rail flows from Scotland are very small, beginning the decade
at 0.9 million tonnes and dropping fairly steadily to 0.36 million by 2009. Channel Tunnel railfreight
services have been afflicted with a series of operational and financial problems and this has seriously
undermined their competitiveness. As rail has a comparative advantage over longer distance it may
seem strange that 62% of railfreight tonnage lifted in Scotland in 2009 remained within the country.
The average length of haul for this rail tonnage was 218 km, significantly lower than for tonnage
moved by rail to other parts of the UK (299km), though still long enough for rail to provide a
competitive offering. Indeed, there are examples of commercially successful rail hauls in Scotland
over distances of around 60 kms.
Figure 4.2 Flows of Rail Freight Traffic Originating within Scotland (million tonnes-lifted)
Source: Transport Scotland, 2011a
0
1
2
3
4
5
6
7
8
9
10
1999 2000 2001 2002 2003 2004 2005 2006 2007 2008 2009
within Scotland
rest of UK
outwith UK

Page | 27
For longer haul traffic, rail is competing with shipping as well as road. Whisky companies for
example have the option of despatching their export containers by short-sea feeder services to
deep-sea ports such as Rotterdam, Antwerp or Felixstowe rather than sending them by rail to English
deep-sea ports. This creates a very competitive market for outbound freight services from Scotland
and is clearly beneficial to exporters.
Reference was made earlier to geographical imbalances in the flow of freight by road to and from
Scotland. The railfreight sector suffers from a similar imbalance problem, particularly on services
between Scotland and the rest of the UK. As shown in Table 4.1 , for every tonne of freight Scotland
receives by rail from elsewhere in the UK it sends out 2.5 tonnes. The directional imbalance is
therefore in the opposition direction to that of road haulage. There was little change in this rail
imbalance between 2000 and 2009, though the continuing decline in outbound coal movements
from Scotland and steady increase in the inbound delivery of supermarket supplies by rail should
have helped to redress the balance in recent years. Direct railfreight flows between Scotland and
other countries are quite balanced. Between 2000 and 2009 the ratio fluctuated around a mean of
1:1 within the range 1: 0.8- 1:1.3. The total quantities of freight moving in both directions by rail,
however, are relatively small.
Rail Scotland to Rest of UK
Rest of UK to Scotland
Scotland to Other Countries
Other countries to Scotland
2000 1 0.4 1 0.9
2009 1 0.4 1 1
Table 4.1 Rail Freight Traffic Imbalances to and from Scotland, 2000 and 2009
(Ratio of tonnes-lifted: Scottish outbound flow = 1)
Source: Transport Scotland, 2011a
Over the past four decades, companies have been incentivised by the government’s Freight Facilities
Grant Scheme to send goods by rail, where it can be demonstrated that this yields environmental
benefits. Since 2000, FFGs with a total value of around £28 million have been awarded in Scotland to
encourage a modal shift from road to rail (Transport Scotland, 2011b). It was estimated at the time
of application that the twenty-eight schemes funded would remove just over 13 million lorry-kms
from the road network. If the forecast reductions in lorry traffic were achieved, this would represent
a state subsidy of roughly £2.20 for every lorry-km saved.

Page | 28
5. Container Shipping and RoRo Ferry Traffic
This section will focus on the external movement of unitised freight by sea to and from Scotland in
containers or road trailers. This includes deep-sea traffic and short-sea services to mainland Europe
and Northern Ireland. A more comprehensive review of Scottish maritime services, covering bulk,
coast-wise and one-port (off-shore oil) traffic can be found in the report of the Freight Statistics
Project (Scottish Government, 2009) and Scottish Transport Statistics (Transport Scotland, 2011a).
The total volumes of international container (lo-lo) and trailer (ro-ro) traffic moving to and from
Scottish ports have followed similar trends over the past ten years, rising over the first five years,
stabilising around the middle of the decade and then declining in 2008 and 2009 during the recession
(Figure 5.1). Containerised traffic recovered during 2010, though the number of ro-ro units
continued to drop. In tonnage terms, container traffic grew even more steeply in the early years of
the decade, mainly because of the diversion of whisky exports from rail to short-sea feeder services
during the period of railfreight disruption following the Hatfield rail crash. This may partly explain
the increase in average container weight from 8-9 tonnes to 11-12 tonnes after 2001-2.
Figure 5.1 Volumes of Container and RoRo Units Handled by Scottish Ports
Scotland’s external unitised port traffic basically falls into three categories:
(i) Containers transhipped through Scottish ports on feeder services connecting Scotland with deep-
sea ports, mainly Rotterdam, Antwerp, Felixstowe, Tilbury and Southampton. Scotland lost its last
0
1000
2000
3000
4000
5000
6000
containers ro-ro units
'00
0

Page | 29
direct deep-sea container service (which called at the Clydeport Ocean Terminal) many years ago
and there is little prospect of it regaining one. Efforts several years ago to promote Hunterston and
Scapa Flow as new deep-sea ports proved unsuccessful. The feasibility of these proposals was
discussed by Scottish Parliament’s Local Government and Transport Committee (2006). While it
recognised that these port developments could be beneficial for Scotland, it questioned where there
would be sufficient traffic to justify them and whether they would be able to attract a major deep-
sea container line. Shipping lines are increasing concentrating their container services on small
numbers of major hub ports capable of generating large traffic volumes and able to accommodate
their ever-expanding vessels.
Feeder links, mainly operating out of Grangemouth, though supplemented by a few from Greenock,
currently provide Scottish exporters and importers with competitive access to a range of deep-sea
services at European mainland or southern English ports. The amount of traffic on these links has
substantially increased. Grangemouth has more than doubled the number of containers handled
since 2006, largely benefitting from the boom in Scotch whisky exports in recent years. Forth Ports
estimates that Grangemouth has the capacity to handle twice the current volume of just over
200,000 containers per annum. Although it is tidal and well upstream, it has ‘the advantages of a
central location, good road and rail links and adequate land for development’ (Local Government
and Transport Committee, 2006). Given the recent growth rate for container traffic and available
capacity at Grangemouth, serious doubts must be raised over the need for another large container
port on the Forth at Rosyth. The proposal to build such a port seems to be driven by property
development goals and not based on a realistic appraisal of the future Scottish market for container
shipping services.
Grangemouth has also been trying to pursue a ‘port centric logistics’ strategy by offering a range of
value-adding logistics services at warehouses built on the port site. Despite much discussion of port
centric logistics in the UK in recent years (Mangan and Lalwani, 2007), there has still been limited
development of distribution centres at UK ports. The opening of the new London Gateway port in
2014 with an adjacent 11 hectare logistics park will strongly promote the concept of PCL. While this
will encourage some major retailers to reconfigure their inbound supply chains, it is unlikely to have
much impact on Scotland as most of their imported supplies bound for Scottish shops already enter
the UK through southern English ports and are routed through DCs south of the border.

Page | 30
2. Direct Ro-ro service between Scotland and mainland Europe: The Rosyth and Zeebrugge service,
which since December 2010 has been freight-only, has seen a reduction in its frequency of service
over the past year to three sailings in each direction per week. Since the inception of the service, the
average vessel speed has also been reduced by around 30% to economise on fuel, increasing the
crossing time from 18 to 23 hours. The volume of ro-ro traffic on this route is now well below its
peak of 42,000 trailers in 2003-4 and the service is reported to be loss-making. The Rosyth
hinterland is relatively small by comparison with the competing ro-ro ports of Teesport ad Hull, and
there is a lack of loaded vehicles in the Zeebrugge-Rosyth direction. As discussed earlier, the
routing of imported Scottish retail supplies through English DCs causes a serious traffic imbalance on
direct international shipping services, both containerised and ro-ro. In the absence of a significant
uplift in traffic volumes and revenues over the next few years, Scotland may lose this one direct ro-
ro freight service that it has to the continent. It is likely that when the North Sea becomes a SOx
Emissions Control Area (SECA) in 2014, the costs of switching to cleaner fuel will force shipping lines
to cull their marginal short-sea services. The Rosyth-Zeebrugge service may not survive this cull.
3. Ro-Ro services to Northern Ireland: There is intense competition on the Irish sea routes both
within Scotland and with ferry connections between Liverpool and Holyhead to the Irish Republic.
The Scotland–Northern Ireland ro-ro freight market has been dominated by services out of
Cairnryan. In 2010, the Cairnryan-Larne service in fact handled a very similar tonnage of unitised
freight as Grangemouth and Rosyth combined (Figure 5.2). Freight volumes on the Stranraer –
Larne steadily declined between 2000 and 2010 and Stranraer ferry terminal closed in 2011 when
Stena Line transferred its operations to a new terminal in Loch Ryan. No statistics are yet available
on the effect this new £200 million investment in port facilities and vessels on the routing of unitised
freight between Scotland and Northern Ireland. By comparison with the volumes of freight moving
through the Cairnryan and Loch Ryan terminals, the Troon-Larne service handles relatively modest
flows though has been popular with large retailers serving their Northern Irish shops from DCs
located in Scotland (Scottish Government, 2009).

Page | 31
Figure 5.2 Containerised and Ro-Ro Freight Tonnage Handled by Major Port Areas
Source: Transport Scotland, 2011a
0
500
1000
1500
2000
2500
3000
3500
Forth
Clyde
Stranraer
Cairnryan
'00
0

Page | 32
6. Air Freight Traffic
In 2010, Scotland’s airports handled 47,600 tonnes of air cargo. This represented only around 0.02%
of the total tonnes-lifted by all transport modes in Scotland. Measuring air freight in tonnage terms,
however, grossly undervalues its contribution to the economy. As almost all airfreight is
internationally traded, it is worth comparing its average value density with that of maritime
shipments. In 2007, this average value to weight ratio for UK international airfreight flows was
roughly 75 times that of sea trade, in the case of exports £90.1 per tonne as opposed to £1.20 per
tonne. Air cargo is essentially a niche market catering mainly for small, high value, time-critical
consignments. This market basically comprises three subsectors:
Movement of freight in the ‘bellyholds’ of passenger aircraft: as air passenger services have
expanded so too has the capacity to carry freight, particularly on long haul flights in wide-bodied
aircraft. (Very little freight, however, is carried by low-cost airlines as their short turnaround times
and general business models are unsuited to the movement of cargo).
Conventional air cargo services using dedicated, all-cargo aircraft: these mainly handle the bulk
movement of freight on inter-continental routes.
Integrated, express services: they too employ dedicated freight aircraft but differ from 2 in providing
a door-to-door service and guaranteeing rapid delivery.
The Scottish air freight market has undergone a major transformation over the past twenty years,
partly in terms of the relative importance of the three types of service, but also in the distribution of
air freight traffic among Scotland’s airports. This transformation has been driven by global trends in
the air cargo market, changes in Scotland’s industrial structure and the expansion of its air passenger
route network. During the 1990s, the expansion of the electronics industry spurred the growth in
the demand for airfreight services, with much of its traffic handled by airfreighters using Prestwick
Airport, but significant volumes moving in the bellyholds of long haul jets flying to and from Glasgow.
The total airfreight tonnage handled by Scottish airports plateaued between the late 1990s and mid-
2000s and since then has dropped sharply mainly as a result of the exodus of the electronics industry
to low labour cost countries. By 2010, this tonnage was 42% below its peak of 83,000 tonnes in 2006
(Figure 6.1). Having grown at an average annual rate of 9% for over a decade, the global airfreight
market plunged by 22% during 2008, though recovered from this slump in just over a year. Scottish
airfreight tonnage also dropped by 24% in 2008, but has not rebounded. On the contrary, there was

Page | 33
a further contraction in 2010. There has also been a dramatic change in the composition of Scottish
airfreight over the past decade. The proportion classified as mail rose from 35% in 2000 to 57% in
2010, while the share of other forms of air cargo dropped from 65% to 43% (Table 6.1).
Figure 6.1 Freight Tonnage Handled by Scottish Airports Source: Civil Aviation Authority, 2011
2000 2010
Cargo Mail Cargo Mail
Edinburgh 18281 34849 20357 47451
Glasgow 8799 2846 2914 45
Prestwick 41460 0 12163 0
total 68540 37695 35434 47496
65% 35% 43% 57%
Table 6.1: Air Cargo and Mail Volumes Handled by the Three Main Scottish Airports
Source: Civil Aviation Authority
This major change in the mail : cargo split has radically altered the distribution of airfreight tonnage
among Scotland’s main airports. Prestwick has specialised in air cargo and lacked mail services.
Glasgow’s airfreight was predominantly intercontinental bellyhold traffic, though it had an express
mail operation until the mid 2000s when it transferred to Edinburgh. Edinburgh Airport is far and
away Scotland’s main express mail hub and has therefore greatly benefitted from the tilting of the
airfreight balance from cargo to mail. This express mail business is very sensitive to economic
conditions, however, as illustrated by the sharp contraction of Edinburgh’s air freight volumes in
2007 and 2008.
0
10
20
30
40
50
60
70
80
90
2000 2001 2002 2003 2004 2005 2006 2007 2008 2009 2010
Tho
usa
nd
to
nn
es
Prestwick Edinburgh Glasgow Aberdeen Others

Page | 34
Another important aspect of the transformation of Scottish airfreight has been the switch from the
use of bellyhold capacity on passenger planes to services employing dedicated cargo aircraft. The
percentage of the airfreight tonnage handled by the latter aircraft (at Prestwick, Edinburgh and
Glasgow) rose from 72% in 1990 to 91% in 2010 (Table 6.2). Over this period, however, markedly
different trends have been observed at different airports. Virtually all Glasgow’s freight now moves
in passenger aircraft while almost all Edinburgh and Prestwick’s freight flies on dedicated freight
services. Glasgow’s air cargo business is therefore closely linked to the fortunes of its air passenger
services, whereas airfreight operations in the other two airports are now essentially free-standing.
1990 2000 2010
Passenger Aircraft
Cargo Aircraft
Passenger Aircraft
Cargo Aircraft
Passenger Aircraft
Cargo Aircraft
Prestwick 7% 93% 1% 99% 0% 100%
Edinburgh 79% 21% 12% 88% 2% 98%
Glasgow 40% 60% 95% 5% 95% 5%
total 28% 72% 16% 84% 9% 91%
Table 6.2 Proportion of Freight in Bellyhold and Cargo Aircraft
Source: Civil Aviation Authority, 2011
Much of the airfreight travelling to and from Scotland does not fly in or out of Scottish airports. Even
airfreight carrying an airway bill from a Scottish airport and undergoing customs clearance there may
fly in or out of an airport south of the border. For example, it has been estimated that between 2004
and 2007 approximately 8% of the airfreight tonnage handled by Heathrow had an origin or
destination in Scotland (Department of Transport, 2009). The same study observed that there was
a ‘substantial cluster of businesses around Glasgow and Edinburgh’ using express air integrators
based an East Midlands airport, the UK’s second largest airfreight hub. Feeding airfreight by road
through the main English airports gives Scottish businesses access to a much broader range and
greater frequency of direct services. This ‘leakage’ of Scottish airfreight through English airports is
likely to have increased in recent years as the number of direct airfreighter services to/from Scottish
airports has diminished. There are no published statistics available to monitor this trend. It is,
nevertheless, significant not just for the commercial prospects of Scotland’s airports but airfreight
users, but also for the overland movement of air cargo by other modes.

Page | 35
7. Distribution Centre Development in Scotland
Using a dataset compiled by Jones Lang Lasalle2 it has been possible to examine the development of
large distribution centres (DCs) in Scotland since 1995. These DCs are defined as warehouses with
floorspace in excess of 100,000 square feet (9290 square metres). Between 1995 and 2011,
eighteen of these large DCs were set up in Scotland with a total floor area of just under half a million
square metres. Much of the new capacity was added in just three years, 1995, 2001 and 2006
(Figure 7.1) This new warehousing space represented only 3% of the additional DC capacity
established across the UK as a whole between 1995 and 2011. This percentage may seem low
relative to Scotland’s 9-10% share of the UK’s population and economic activity, though it can be
explained, mainly in two ways:
Figure 7.1 Growth of Floorspace in New Distribution Centres of over 10,000 m2 in Scotland
Data source: Jones Lang LaSalle
1. Over the past forty years there has been a pronounced centralisation of warehousing
within the UK as many companies have closed regional depots and begun to supply
the whole country from a few major DCs or, in some cases, a single hub (McKinnon,
2010). This has allowed them to exploit the so-called ‘square root law of inventory’
which basically states that the more you centralise your inventory the less inventory
you need to hold, other things being equal. There are also economics of scale in
building and operating larger warehouses and these have been increased as a result
2 We are grateful to Jones Lang LaSalle for permission to use their distribution centre property data in this study.
0
100
200
300
400
500
600
'00
0 s
qu
are
met
res

Page | 36
of advances in construction techniques, computing and materials handling. The
development of the motorway network has also facilitated the process of
centralisation by enabling companies to serve wider areas with the daily driving
constraints. New warehousing capacity has gravitated to central locations, mainly in
the English midlands and M1 corridor though also to several other regional clusters
(Figure 7.2). Many businesses are able to serve the Scottish market directly from
these English DCs and hence do not require warehousing in Scotland. They may
require facilities for break-bulk / transhipment operations, but small depots can
serve this purpose and they are excluded from the survey of large DCs. Because of
its peripherality within the UK, Scotland is unlikely to attract many of the large DCs
serving much or all of the UK. There are, nevertheless, exemptions, such as the new
Amazon DC north of Dunfermline which was discussed earlier.
Figure 7.2 Locations of Large New DCs Opened in the UK between 1995 and 2011.
Source: Bubenzer, 2011 and Jones Lang LaSalle
Page | 37
2. Companies that require warehousing space within Scotland to serve the Scottish
(and possibly Northern Ireland) market, seldom require DCs with more than 100,000
square feet of floor area. Given the size of the local market, much smaller DCs would
suffice for most companies and they do not appear in these statistics.
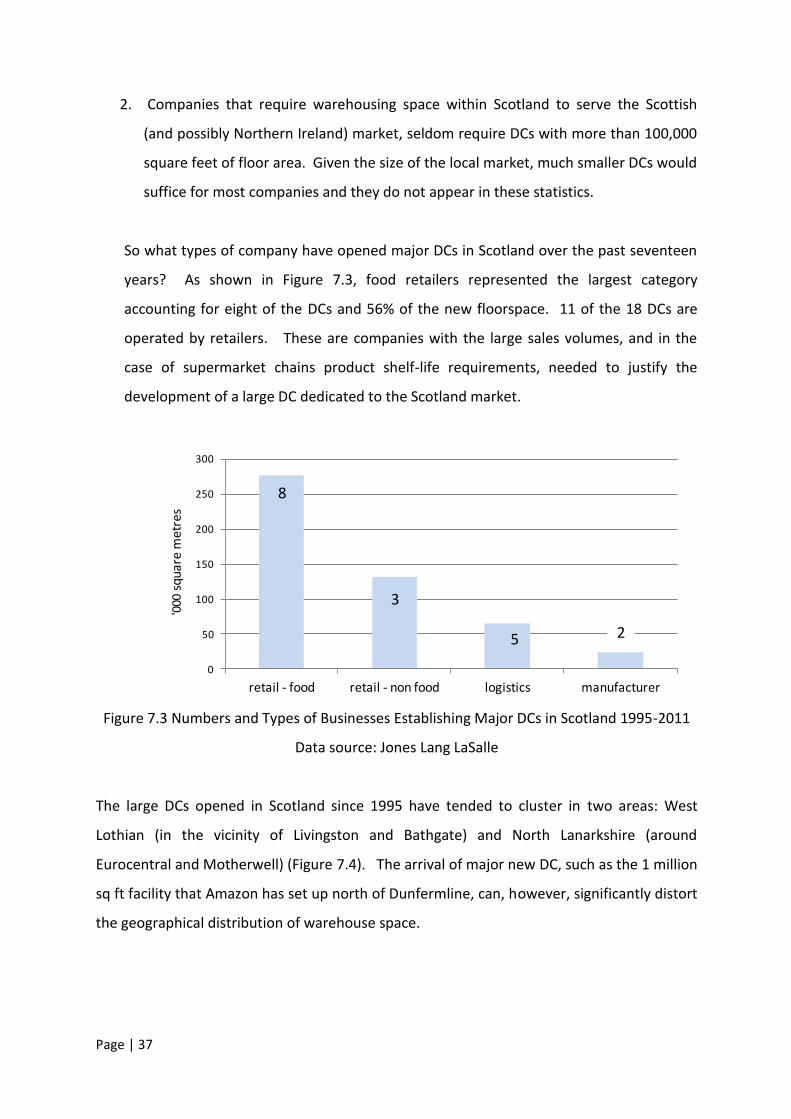
So what types of company have opened major DCs in Scotland over the past seventeen
years? As shown in Figure 7.3, food retailers represented the largest category
accounting for eight of the DCs and 56% of the new floorspace. 11 of the 18 DCs are
operated by retailers. These are companies with the large sales volumes, and in the
case of supermarket chains product shelf-life requirements, needed to justify the
development of a large DC dedicated to the Scotland market.
Figure 7.3 Numbers and Types of Businesses Establishing Major DCs in Scotland 1995-2011
Data source: Jones Lang LaSalle
The large DCs opened in Scotland since 1995 have tended to cluster in two areas: West
Lothian (in the vicinity of Livingston and Bathgate) and North Lanarkshire (around
Eurocentral and Motherwell) (Figure 7.4). The arrival of major new DC, such as the 1 million
sq ft facility that Amazon has set up north of Dunfermline, can, however, significantly distort
the geographical distribution of warehouse space.
0
50
100
150
200
250
300
retail - food retail - non food logistics manufacturer
'000
squ
are
met
res
8
3
5 2

Page | 38
Figure 7.4 Location of New DC Capacity Established in Scotland: 1995-2011
Data source: Jones Lang LaSalle
0
20
40
60
80
100
120
140
160
'000
squ
are
me
tre
s

Page | 39
8. Carbon Emissions from Freight Transport in Scotland
Of the numerous environmental effects of freight transport, CO2 emissions have become a major
focus of attention in recent years as concern about global warming has mounted. Both the UK and
Scottish governments have passed climate change legislation containing commitments to reduce
carbon emissions by 80% by 2050 against a 1990 base line. In an earlier study (McKinnon and
Piecyk, 2009), we constructed a series of scenarios to show what the road freight sector would have
to do by 2050 to meet these national carbon reduction targets. Figure 8.1 summarises one of these
scenarios at a UK level and indicates the changes that would have to be made to a series of key
freight transport parameters in combination to achieve the desired target (76% reduction against a
2007 baseline). Even over forty years, it may prove difficult to make these changes, especially as
the underlying demand for freight movement is forecast to grow significantly over this period. It is
important that the logistics sector as soon as possible gets onto a carbon reduction pathway that will
lead to an 80% cut in emissions by 2050, because ‘the longer it takes, the harder it gets’. At a UK
level, the Logistics Carbon Reduction Scheme, initiated and managed by the FTA, is strongly
encouraging companies to ‘record, report and reduce’ carbon emissions from logistical activities. In
2011 it set a voluntary target for LCRS member companies to reduce the carbon intensity of their
freight transport operations by 8% between 2010 and 2015 (Freight Transport Association, 2011).
This has been endorsed by the UK government. Relatively few Scottish-based businesses have so
far joined the LCRS, though many of the current members have UK-wide operations which include
the movement of freight, and in some cases warehousing operations, in Scotland.
Figure 8.1 Combination of Road Freight Trends Required to Achieve Target CO2 Reduction by 2050
Source: McKinnon and Piecyk, 2010
Total tonne-kms stable at 2007 level
Road share of freight tonne-kms reduced from 64% to 50%
% of truck kilometres run empty reduced from 27% to 17%
Average weight-based load factor up from 59% to 70%
40% improvement in energy efficiency
30% reduction in the carbon content of the energy
76% reduction in CO2 emissions
Page | 40
An attempt has been made to carbon footprint the movement of freight lifted in Scotland by all
modes over the period 2000 – 2009. As we discuss in earlier papers, emissions from freight
transport can be measured in different ways, yielding widely varying estimates (McKinnon and
Piecyk 2009 and 2010). It is important therefore that the methodology is transparent and that the
assumptions and limitations are clearly stated. We have adopted the so-called ‘activity-based’
approach which involves multiplying the tonne-kms carried by each mode by an average CO2
intensity value for each mode expressed as g CO2 per tonne-km. The tonne-kms figures were
obtained from Transport Scotland (2012) and the emission intensity values from DEFRA / DECC
(2012) for HGVs and railfreight and from a Cefic study (McKinnon and Piecyk, 2010) for coastal
shipping, inland waterways and pipeline. No allowance was made for the movement of freight in
vans. The tonne-km figures only related to freight lifted in Scotland and excluded tonne-kms
generated by freight originating outside Scotland but destined for locations within the country. This
means that the CO2 emissions are not ‘territorial’ in the sense that they only come from vehicles
operated within the Scottish landmass and surrounding seas. For example, a truck picking up a load
in Edinburgh and moving it to Birmingham would have all its emissions on this journey recorded and
not simply those emitted as far as the Scottish border. The use of average modal emission factors
derived from UK and international sources is also fairly crude. It would be preferable to develop
specific factors for the Scottish freight transport system, reflecting the countries’ topography, the
age and energy efficiency of its vehicle fleets, its energy mix etc. Such factors do not currently exist.
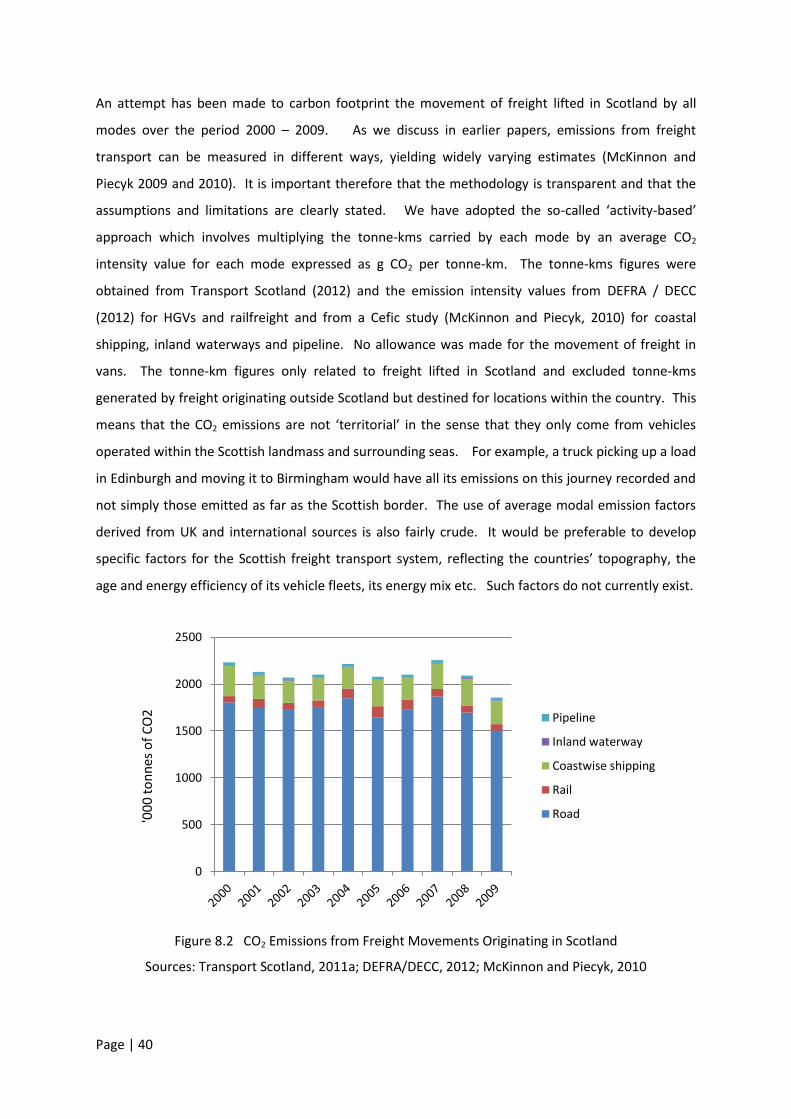
Figure 8.2 CO2 Emissions from Freight Movements Originating in Scotland
Sources: Transport Scotland, 2011a; DEFRA/DECC, 2012; McKinnon and Piecyk, 2010
0
500
1000
1500
2000
2500
Pipeline
Inland waterway
Coastwise shipping
Rail
Road'00
0 t
on
nes
of
CO
2
Page | 41
This analysis reveals that between 2000 and 2008 total annual CO2 emissions from freight lifted in
Scotland fluctuated around 2.1 million tonnes (Figure 8.2). It dropped to 1.8 million tonnes in 2009,
the last year for which we have data, mainly as a result of the decline in the level of freight activity
during the recession.
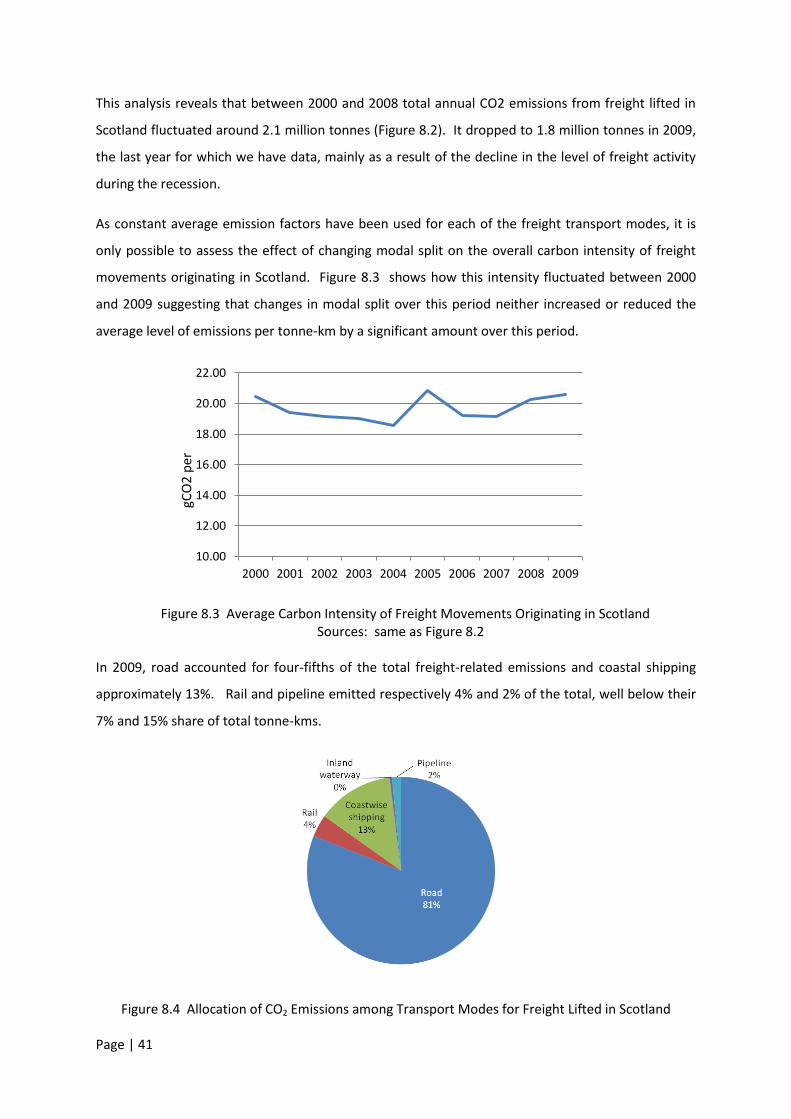
As constant average emission factors have been used for each of the freight transport modes, it is
only possible to assess the effect of changing modal split on the overall carbon intensity of freight
movements originating in Scotland. Figure 8.3 shows how this intensity fluctuated between 2000
and 2009 suggesting that changes in modal split over this period neither increased or reduced the
average level of emissions per tonne-km by a significant amount over this period.
Figure 8.3 Average Carbon Intensity of Freight Movements Originating in Scotland Sources: same as Figure 8.2
In 2009, road accounted for four-fifths of the total freight-related emissions and coastal shipping
approximately 13%. Rail and pipeline emitted respectively 4% and 2% of the total, well below their
7% and 15% share of total tonne-kms.
Figure 8.4 Allocation of CO2 Emissions among Transport Modes for Freight Lifted in Scotland
10.00
12.00
14.00
16.00
18.00
20.00
22.00
2000 2001 2002 2003 2004 2005 2006 2007 2008 2009
gCO
2 p
er

Page | 42
9. Involvement of Freight Vehicles in Traffic Accidents
Another important external effect of logistics is the involvement of freight vehicles in road traffic
accidents. The annual number of HGVs involved in accidents on Scottish roads rose slightly at the
start of the decade but since 2001 has dropped fairly consistently from 1013 to 546 (Figure 9.1). The
number of vans involved in accidents has also declined over the past decade though by a smaller
margin. These reductions in the level of accident involvement have been achieved despite significant
increase in the volume of HGV and van traffic. Between 2000 and 2010 accident involvement per
million vehicle-kms dropped from 0.38 to 0.21 for lorries and from 0.21 to 0.12 for vans.
Figure 9.1 Annual Number of HGVs and Vans Involved in Traffic Accidents on Scottish Roads. Source: Transport Scotland, 2012
The reduction in accident involvement has been paralleled by a steep reduction in the number of
casualties in accidents involving HGVs or vans on Scottish roads over the past decade (Figure 9.2 ). It
should be noted too that accident involvement does not necessarily mean that the freight vehicle
was to blame for the accident.
Figure 9.2 Number of Casualties of Varying Severity in Accidents Involving HGVs and Vans.
Source: Transport Scotland, 2012
0
200
400
600
800
1000
1200
2000 2001 2002 2003 2004 2005 2006 2007 2008 2009 2010
vans
HGVs
0
200
400
600
800
1000
slightly injured
serious injured
fatalities

Page | 43
10. Conclusions
This study has reviewed the available data on many aspects of Scotland’s logistical system. Most of
the data relate to freight traffic levels and services, though it has also been possible to examine the
recent development of distribution centres. It has not been possible, on the basis of published
statistics, to express total expenditure on logistical activities as a percentage of GDP. Increasing
numbers of countries are now making regular macro-economic assessments of logistics and this is
something that the Scottish government should consider. A strong case can also be made for
conducting a study of Scotland’s logistical performance using a similar set of criteria to those
adopted by the World Bank’s tri-ennial ‘Logistics Performance Indicator’ surveys. This would allow
Scotland to benchmark its logistical capability, particularly on external links, with other countries and
not simply be subsumed within the UK’s LPI rating.
This study has taken a 10-year perspective on all the main freight transport trends. Several notable
developments have occurred over this period:
There has been significant decoupling of the economic growth and freight tonne-km trends,
suggesting that the freight transport intensity of the Scottish economy is diminishing.
Evidence of decoupling is particularly strong in the case of road freight movement.
Despite government efforts to promote the use of rail and waterborne services, Scotland’s
freight modal split changed only marginally between 1999 and 2009, with road handling
roughly two-thirds of tonnes-lifted at the beginning and end of this period.
Over the decade, HGV’s share of Scotland’s road traffic remained fairly stable at 6%,
whereas van traffic increased its share from 12% to 14%. It is estimated, however, that only
around a third of van-kms involve the delivery of freight.
There has been a sharp increase in the amounts of containerised and ro-ro freight passing
through Scottish ports, partly as a result of deep-sea containers being diverted from rail but
also in response to the boom in Scotch whisky exports. The growth in RoRo traffic has been
mainly on the Northern Irish routes. The volumes of RoRo traffic on the Rosyth-Zeebrugge
are well below their peak and below the levels required for long term viability.
The amount of airfreight tonnage handled by Scottish airports has dropped sharply, mainly
as a result of the off-shoring of the electronics industry. The composition of Scotland’s
airfreight has also radically altered with the proportion of mail rising from 35% to 57% in a
decade. This has worked to the advantage of Edinburgh, where air express services are

Page | 44
concentrated, and caused the focus of Scotland’s airfreight activities to shift from west to
east.
The traffic imbalance problem which has afflicted operators of freight services to and from
Scotland for many years remains as serious as ever. It adversely affects all modes, can only
be partially relieved by triangulation and undoubtedly inhibits the development of direct
freight services to and from Scotland.
Scotland attracted only around 3% of the new UK floorspace in distribution centres of over
10,000 sq metres between 1995 and 2011. This can be largely explained by the country’s
relative peripherality and small market size. The recent decision by Amazon to locate its
largest European DC in Scotland suggests that the country could do more to exploit its
locational advantages as a base for distribution operations.
CO2 emissions from freight movements originating in Scotland fluctuated around a fairly
stable mean between 2000 and 2009 when the recession reduced the level of freight
transport activity and cut emissions by around 14%.
There have been steep reductions in the involvement of HGVs and vans in road accidents
and in the number of related casualties.
Data limitations have constrained the analysis in several ways: for example,
It was not possible to analyse changes in the utilisation of vehicle capacity and fuel efficiency
across the Scottish freight transport system. As these are key determinants of the cost and
environmental impact of the system, this is an important omission. Access to this
information would also permit the derivation of carbon emissions factors specific to Scottish
freight operations and reduce the reliance on average UK and international indices.
The repositioning of empty containers is a ‘hot topic’ in Scottish logistics as whisky
companies frequently complain that they are unable to get enough containers of the right
types when they need them. Rationalisation of empty container movements within port
hinterlands could also yield economic and carbon benefits. No government statistics are
available, however, to analyse the scale of this problem or the potential solutions.
The collection of freight data on an individual journey basis makes it very difficult to trace
the door-to-door movement of consignments and to monitor the changing structure of
companies’ supply chains. There is a need for greater understanding of how major supply

Page | 45
chains starting and / or ending in Scotland are configured, how their logistical requirements
are changing and how vulnerable they are to potential disruptions.
A truly comprehensive logistics study would also investigate warehousing and materials
handling operations, the return flows of packaging and end-of-life products (so-called
‘reverse logistics’) and the management of inventory by Scottish-based businesses. It is to
be hoped that future studies of this type may be able to access data on these other logistical
activities.
Although, relative to many other countries, Scotland is quite well endowed with freight data, there is
still room for improvement. Without detailed and accurate freight data, it is very difficult to
forecast the future demand for logistics services and freight-related infrastructure. If future
business and public-policy decisions are based on inadequate data and limited understanding of the
complexity of modern supply chains, there is a danger that resources will be squandered and the
real logistics challenges will not be properly addressed.
Page | 46
References:
A.T.Kearney (2010), Supply Chain Excellence Amidst Global Economic Crisis: 6th European A T
Kearney / ELA Logistics Survey 2008/2009. European Logistics Association, Brussels.
Bubenzer, J. (2011), The Development of Large Distribution Centres in the UK: An Analysis of
Trends between 1995 and 2011. MSc Dissertation, Heriot-Watt University, Edinburgh.
Civil Aviation Authority (2011), UK Airport Statistics 2010, Civil Aviation Authority, London (plus
earlier years).
DEFRA / DECC (2012), 2012 Guidelines to Defra / DECC's GHG Conversion Factors for Company
Reporting. London
Department of Transport (2004), Transport Statistics Bulletin: Survey of Van Activity 2004.
London.
Department for Transport (2009), Road Freight Statistics 2008. London.
Department for Transport (2009) The Air Freight End-to-End Journey: An Analysis of the Journey
of Air Freight through UK International Gateways. London.
Department for Transport (2011a), Logistics Growth Review: Connecting People with Goods.
London.
Department for Transport (2011b), Road Freight Statistics 2010, Department for Transport,
London.
DHL (2011), DHL Global Connectedness Index 2011, Deutsche Post AG, Bonn.
European Commission (2011), White Paper. Roadmap to a Single European Transport Area –
Towards a Competitive and Resource Efficient Transport System, European Commission,
Brussels.
Freight Transport Association (2011) ‘Logistics Carbon Reduction Scheme: First Annual Report’
Tunbridge Wells.
Kim, I and Min, H. (2011) ‘Measuring Supply Chain Efficiency from a Green Perspective’
Management Research Review, vol 34, no. 11.
Local Government and Transport Committee (2006) ‘Report on Inquiry into Freight Transport in
Scotland’ 10th Report 2006 (Session 2), Scottish Parliament, Edinburgh.
Mangan, J., Lalwani, C. and Fynes, B. (2008) ‘Port-centric Logistics’, International Journal of
Logistics Management, vol. 19, no.1.
McKinnon, A.C. (2007) ‘The Decoupling of Road Freight Transport and Economic Growth Trends
in the UK: An Exploratory Analysis’ Transport Reviews, vol. 27, no. 1.

Page | 47
McKinnon, A.C. (2009a) ‘Benchmarking Road Freight Transport: Review of a Government-sponsored
Programme’ Benchmarking: an International Journal, vol 16, no 5.
McKinnon, A.C. (2009b) ‘The Present and Future Land Requirements of Logistical Activities’ Land
Use Policy, 26S, s293-s301
McKinnon, A.C. (2010) ‘European Freight Transport Statistics: Limitations, Misinterpretations
and Aspirations’ ACEA, Brussels
McKinnon, A.C. and Leonardi, J. (2009) ‘The Collection of Long Distance Road Freight Data in
Europe’ in Bonnel, P., M. Lee-Gosselin, J. Zmud and J.-L. Madre (eds) ‘Transport Survey
Methods: Keeping up with a Changing World, Emerald, Bingley.
McKinnon, A.C. and Piecyk, M. (2009a) ‘Measurement of CO2 Emissions from Road Freight
Transport : A Review of UK Experience.’ Energy Policy, vol. 37, no. 10
McKinnon, A.C. and Piecyk, M. (2009b) ‘Logistics 2050: Moving Goods by Road in a Very Low
Carbon World’ in Sweeney, E. (ed.) ‘Supply Chain Management in a Volatile World’ Blackrock
Publishing, Dublin
McKinnon, A.C. and Piecyk, M. (2010) ‘Measuring and Managing CO2 Emissions in European
Chemical Transport’ Cefic, Brussels
Office of the Traffic Commissioners (2011), Traffic Commissioners’ Annual Reports 2010-11,
Office of the Traffic Commissioners, Leeds (also reports for earlier years)
Rantasila K. and Ojala L. (2012), Measurement of National-Level Logistics Costs and Performance,
Discussion Paper 2012.04, International Transport Forum, Paris.
Rodrigues A., Bowersox D. and Calantone R. (2005), Estimation of Global and National Logistics
Expenditures: 2002 Data Update, Journal of Business Logistics, Vol.24, no.2.
Skills for Logistics (2010), Scotland: Sector Skills Assessment, Skills for Logistics, Milton Keynes.
Steer Davies Gleave (2006), Measuring the Value of the Freight Transport Sector to the Scottish
Economy, The Scottish Executive, Edinburgh.
Scottish Government (2002), Scottish Transport Statistics 2001. Edinburgh.
Scottish Government (2006), Freight Action Plan for Scotland. Scottish Government.
Scottish Government (2009) ‘Freight Statistics Project’ Edinburgh.
Scottish Government (2012), Gross Domestic Product, A National Statistics Publication for
Scotland, accessed on 24 August 2012 at:
http://www.scotland.gov.uk/Topics/Statistics/Browse/Economy/GDP2012Q1XLS
Transport Scotland (2011a), Scottish Transport Statistics: 2011 Edition, Scottish Government,
Edinburgh.

Page | 48
Transport Scotland (2011b), Freight Facilities Grants (FFG) Awarded to Projects in Scotland since
August 1997. Edinburgh
Transport Scotland (2012), Key Reported Road Casualty Statistics Scotland 2011. Scottish
Government, Edinburgh.
Woodburn, A. (2007), Appropriate Indicators of Rail Freight Activity and Market Share: A Review
of UK Practice and Recommendations for Change, Transport Policy, vol 14, no. 1.
World Bank (2012), Connecting to Compete 2012. Trade Logistics in the Global Economy. The
Logistics Performance Index and Its Indicators, The International Bank for Reconstruction and
Development / The World Bank, Washington DC.
World Economic Forum (2012), The Global Enabling Trade Report 2012. Reducing Supply Chain
Barriers, World Economic Forum, Geneva.
Copyright © 2022 FDOKUMEN