Schmidt-Heydt M., Parra R., Geisen R., and Magan N (2011) Modelling the relationship between...
10
Modelling the relationship between environmental factors, transcriptional genes and deoxynivalenol mycotoxin production by strains of two Fusarium species M. Schmidt-Heydt 1,2 , R. Parra 1,2,† , R. Geisen 1,2 and N. Magan 1,2, * 1 Applied Mycology Group, Cranfield Health, Cranfield University, Bedford MK43 0AL, UK 2 Max-Rubner Institute, Karlsruhe, Germany The effect of changes in temperature/water activity (a w ) on growth, deoxynivalenol (DON) production and trichothecene gene cluster expression (18 genes) for strains of Fusarium cul- morum and Fusarium graminearum was studied. The expression data for six key transcription genes (TRI4, TRI5, TRI6, TRI10, TRI12 and TRI13) were analysed using multiple regression analyses to model the relationship between these various factors for the first time. Changes in a w and temperature significantly ( p ¼ 0.05) affected growth and DON. Microarray data on expression of these genes were significantly related to DON pro- duction for both strains. Multi-regression analysis was done and polynomial models found to best fit the relationship between actual/predicted DON production relative to the expression of these TRI genes and environmental factors. This allowed prediction of the amounts of DON produced in two-dimensional contour maps to relate expression of these genes to either a w or temperature. These results suggest complex interactions between gene expression (TRI genes), environmental factors and mycotoxin production. This is a powerful tool for understanding the role of these genes in relation to environmental factors and enables more effective targeted control strategies to be developed. Keywords: environmental factors; temperature; trichothecene genes; microarray; deoxynivalenol; multiple regression analyses 1. INTRODUCTION Fusarium culmorum (W.G.Sm.) Sacc. and Fusarium gra- minearum Schw. Giberella zeae (Schein.) Petch are the two most important fusaria responsible for wheat scab in Europe and North America and are responsible for the contamination of cereal grain with trichothecenes, especially deoxynivalenol (DON). This has resulted in leg- islative limits being set in raw and processed cereals for human food and animal feed for DON in many countries. Thus, significant effort has gone into the development of prevention strategies for minimizing contamination of such commodities with DON [1]. The key environmental factors that influence germi- nation, growth and the biosynthesis of DON and other trichothecenes have been demonstrated to include water availability and temperature [2]. Indeed, detailed profiles have been developed for the effect of a w , temp- erature and time on both DON and nivalenol (NIV) production by strains of these species [3,4]. The biochemical and genetic control of the biosynthetic pathways for these trichothecenes has been studied [5,6]. This suggests that some of the key regulatory and transcriptional genes involved in trichothecene bio- synthesis include TRI4 (a cytochrome P450 multi- functional monooxygenase that catalyses four steps in the conversion of trichodiene to isotrichodermin and tri- chothecene), TRI5 (trichodiene synthase, which catalyses isomerization of farnesyl pyrophosphate to form trichodiene), TRI6 (a zinc finger protein which is a transcription factor and positive regulator of the tri- chothecene pathway genes), TRI10 (regulates transcription of TRI6), TRI12 (trichothecene efflux pump which transports the metabolites out of the cell) and TRI13 (a cytochrome P450 oxygenase). While a significant amount of work has been done on examining the TRI5 gene in relation to biotic and abio- tic factors [5], practically no information is available on the effect of environmental stress on these other key genes in F. culmorum and F. graminaerum. A systems approach to try and relate the different parameters from a molecular to a phenotypic production of the sec- ondary metabolite in relation to environmental factors has not been previously attempted. † Present address: Centro del Agua para America Latina y el Caribe (CAALCA), Escuela de Ingenierı ´a y Tecnologı ´as de Informacio ´n, ITESM Campus Monterrey, NL 64849, Mexico. *Author for correspondence (n.magan@cranfield.ac.uk). J. R. Soc. Interface (2011) 8, 117–126 doi:10.1098/rsif.2010.0131 Published online 12 May 2010 Received 4 March 2010 Accepted 22 April 2010 117 This journal is q 2010 The Royal Society on February 25, 2015 http://rsif.royalsocietypublishing.org/ Downloaded from
Transcript of Schmidt-Heydt M., Parra R., Geisen R., and Magan N (2011) Modelling the relationship between...

J. R. Soc. Interface (2011) 8, 117–126
on February 25, 2015http://rsif.royalsocietypublishing.org/Downloaded from
†Present addr(CAALCA),ITESM Camp*Author for c
doi:10.1098/rsif.2010.0131Published online 12 May 2010
Received 4 MAccepted 22 A
Modelling the relationship betweenenvironmental factors, transcriptionalgenes and deoxynivalenol mycotoxinproduction by strains of two Fusarium
speciesM. Schmidt-Heydt1,2, R. Parra1,2,†, R. Geisen1,2 and N. Magan1,2,*1Applied Mycology Group, Cranfield Health, Cranfield University, Bedford MK43 0AL, UK
2Max-Rubner Institute, Karlsruhe, Germany
The effect of changes in temperature/water activity (aw) on growth, deoxynivalenol (DON)production and trichothecene gene cluster expression (18 genes) for strains of Fusarium cul-morum and Fusarium graminearum was studied. The expression data for six keytranscription genes (TRI4, TRI5, TRI6, TRI10, TRI12 and TRI13) were analysed usingmultiple regression analyses to model the relationship between these various factors for thefirst time. Changes in aw and temperature significantly ( p ¼ 0.05) affected growth andDON. Microarray data on expression of these genes were significantly related to DON pro-duction for both strains. Multi-regression analysis was done and polynomial models foundto best fit the relationship between actual/predicted DON production relative to theexpression of these TRI genes and environmental factors. This allowed prediction of theamounts of DON produced in two-dimensional contour maps to relate expression of thesegenes to either aw or temperature. These results suggest complex interactions between geneexpression (TRI genes), environmental factors and mycotoxin production. This is a powerfultool for understanding the role of these genes in relation to environmental factors and enablesmore effective targeted control strategies to be developed.
Keywords: environmental factors; temperature; trichothecene genes; microarray;deoxynivalenol; multiple regression analyses
1. INTRODUCTION
Fusarium culmorum (W.G.Sm.) Sacc. and Fusarium gra-minearum Schw. Giberella zeae (Schein.) Petch are thetwo most important fusaria responsible for wheat scabin Europe and North America and are responsible forthe contamination of cereal grain with trichothecenes,especially deoxynivalenol (DON). This has resulted in leg-islative limits being set in raw and processed cereals forhuman food and animal feed for DON in many countries.Thus, significant effort has gone into the development ofprevention strategies for minimizing contamination ofsuch commodities with DON [1].
The key environmental factors that influence germi-nation, growth and the biosynthesis of DON andother trichothecenes have been demonstrated to includewater availability and temperature [2]. Indeed, detailedprofiles have been developed for the effect of aw, temp-erature and time on both DON and nivalenol (NIV)production by strains of these species [3,4]. The
ess: Centro del Agua para America Latina y el CaribeEscuela de Ingenierıa y Tecnologıas de Informacion,us Monterrey, NL 64849, Mexico.orrespondence ([email protected]).
arch 2010pril 2010 117
biochemical and genetic control of the biosyntheticpathways for these trichothecenes has been studied[5,6]. This suggests that some of the key regulatoryand transcriptional genes involved in trichothecene bio-synthesis include TRI4 (a cytochrome P450 multi-functional monooxygenase that catalyses four steps inthe conversion of trichodiene to isotrichodermin and tri-chothecene), TRI5 (trichodiene synthase, whichcatalyses isomerization of farnesyl pyrophosphate toform trichodiene), TRI6 (a zinc finger protein whichis a transcription factor and positive regulator of the tri-chothecene pathway genes), TRI10 (regulatestranscription of TRI6), TRI12 (trichothecene effluxpump which transports the metabolites out of thecell) and TRI13 (a cytochrome P450 oxygenase).While a significant amount of work has been done onexamining the TRI5 gene in relation to biotic and abio-tic factors [5], practically no information is available onthe effect of environmental stress on these other keygenes in F. culmorum and F. graminaerum. A systemsapproach to try and relate the different parametersfrom a molecular to a phenotypic production of the sec-ondary metabolite in relation to environmental factorshas not been previously attempted.
This journal is q 2010 The Royal Society

118 Fusarium toxin gene expression models M. Schmidt-Heydt et al.
on February 25, 2015http://rsif.royalsocietypublishing.org/Downloaded from
A few studies have examined the influence of someabiotic stress factors in relation to the actual biosyn-thetic genes involved in mycotoxin biosynthesis[7–13]. These studies have confirmed that environ-mental factors do have an influence on gene activationand transcription. Complex relationships occur betweensuch abiotic environmental factors and mycotoxin bio-synthesis at the transcriptional level and thatobtained when phenotypic mycotoxin production isquantified.
The recent development of a microarray that hassubarrays for the gene clusters of key mycotoxigenicfungi has provided an excellent tool for examining inmore detail the impact that changes in interactingenvironmental factors may have on the relativeexpression of these gene clusters and relating this tophenotypic mycotoxin production [14,15]. Thus, theobjectives of this study were to (i) examine the effectof aw � temperature interactions on growth, DON pro-duction and relative gene expression of six key genes(TRI4, TRI5, TRI6, TRI10, TRI12, TRI13) in theTRI gene cluster using a mycotoxin gene microarrayand (ii) attempt to model the relationship betweenthese TRI genes, environmental factors and DON pro-duction for representative strains of two species, F.culmorum and F. graminearum.
2. MATERIAL AND METHODS
2.1. Fungal strains
The strains used were from the culture collection of theMax Rubner-Institute, Karlsruhe, Germany. Fusariumculmorum strain BFE928 produces both DON andNIV and a strain of F. graminearum BFE1006 is aDON producer. They were both isolated from infectedwheat grain. These were routinely maintained on a con-ducive yeast extract sucrose (YES) medium (20 g yeastextract l21, 150 g sucrose l2l, 15 g agar l21 in water)and incubated at 258C for 7 days before use inexperiments.
2.2. Modification of water activity of media,incubation and growth assessment
The YES medium (0.995 aw) was modified with gly-cerol/water solutions to different water activity levels(%w/v of YES medium: 0.98/13.1; 0.95/19.9; 0.93/24.5). The media were prepared in 9 cm Petri platesand allowed to cool. All treatments and replicate agarmedia were overlayered with sterile cellophane sheets(8.5 cm, P400, Cannings Ltd, Bristol, UK) before inocu-lation with a 3 mm agar disc from the growing marginof 7 day old cultures of each species. This facilitatedboth growth measurements and removal of the fungalbiomass for RNA extractions.
For measurement of the diametric mycelial growthrate, the diameter of the colony was measured in twodirections at right angles to each other. The temporalincrease in colony radius was plotted and the linearregression lines for the linear phase were used toobtain the relative growth rates (mm d21).
J. R. Soc. Interface (2011)
The plates were incubated at 15, 20, 25 and 308C for9 days, and the experiment consisted of a fully repli-cated set of treatments with three or four replicatesper treatment. The experiments were carried outtwice to confirm results and also to ensure thatenough biomass was available for RNA extraction andmicroarray analyses.
2.3. Isolation of RNA from samples
To perform microarray and real-time PCR experiments,RNA was isolated using the RNAeasy Plant Mini kit(Qiagen, Hilden, Germany). An amount of 1 g of themycelium was ground with a mortar and pestle inliquid nitrogen. About 250 mg of the resulting powderwas used for isolation of total RNA. The powder wasresuspended in 750 ml lysis buffer, mixed with 7.5 mlb-mercaptoethanol and 10 glass beads with a diameterof 1 mm (B. Braun Biotech International GmbH, Mel-sungen, Germany) in a 2 ml RNase-free micro-reactiontube. The extracts were mixed thoroughly and incu-bated for 15 min at 558C and 42 kHz in an S10Hultrasonic bath (Elma, Singen, Germany). All furtherprocedures were essentially the same as suggested bythe manufacturer of the kit.
2.3.1. cDNA synthesis. For cDNA synthesis, 12 ml of theDNase I-treated total RNA was used along with theOmniscript Reverse Transcription kit (Qiagen). Thereaction mixture was essentially as described by themanufacturer (Qiagen) and incubated at 378C for 1 h.The cDNA was stored at 2208C.
2.3.2. Microarray experiments. The microarray used inthis study has the mycotoxin genes for a number offungi and includes two subarrays with the TRI genesfor Gibberella zeae and F. sporotrichoides. This hasbeen recently described in detail by Schmidt-Heydt &Geisen [14]. For labelling of cDNA, an amount of10–50 mg of the DNase I-treated total RNA was usedaccording to the specifications of the manufacturer ofthe Micromax cDNA Direct Labelling kit (PerkinElmer Life and Analytical Sciences, Inc., Boston, MA,USA). After cDNA synthesis and labelling, the cDNAwas purified with a QiaQuick MinElute-97 kit(Qiagen). The labelled and purified cDNA was broughtto dryness in a Speed Vac concentrator (Savant Instru-ments, Farmingdale, NY, USA), suspended in 60 mlhybridization buffer (Scienion, Berlin, Germany),heated for 2 min at 958C and hybridized for 18 h at428C to the microarray by using an automatic hybridiz-ation station (Perkin Elmer). After hybridization, thearray was scanned with a confocal laser scanner system(Scanarray Lite, Perkin Elmer) at a resolution of 5 mm.The analysis of the results was performed using the Sca-narray software (Perkin Elmer). The results werenormalized using the Lowess algorithm (locally weightedscatter-plot smoothing) and the subtraction of the back-ground signal intensity. As control, the constitutivelyexpressed b-tubulin gene was used.

Fusarium toxin gene expression models M. Schmidt-Heydt et al. 119
on February 25, 2015http://rsif.royalsocietypublishing.org/Downloaded from
2.4. Quantitative determination of DON byHPLC
Mycotoxin extraction and analyses were performedusing a modified method of Cooney et al. [16]. Eachsample (10 g) was homogenized and mixed well. Thesample was extracted by mixing with acetonitrile/methanol (14 : 1; 40 ml) shaken for 2 h and then filteredthrough Whatman no. 1 (Whatman International Ltd,Maidstone, UK) filter paper. For analysis, a 2 ml ali-quot was passed through a clean-up cartridgeconsisting of a 2 ml syringe (Fisher Ltd, Loughborough,UK) packed with a disc of Whatman filter paper no. 1,a 5 ml luger of glass wool and 300 mg of alumina–acti-vated carbon (20 : 1; 500 mg). The column was washedwith acetonitrile/methanol/water (80 : 5 : 15; 500 ml), andthe combined eluate was evaporated (compressed air,508C) to dryness and then resuspended in methanol/water (5 : 95; 500 ml).
Quantification of DON was performed using a LunaC18 reversed-phase column (100 � 4.6 mm; 5 mm par-ticle size; Phenomenex, Macclesfield, UK) connected toa guard column SecurityGuard (4 � 3 mm) filled withthe same stationary phase. Separation was achievedusing an isocratic mobile phase of methanol/water (12 :88; v/v) at a flow rate of 1.5 ml min21). Eluates (injec-tion volume of 50 ml) were detected using a UVdetector (Gilson 117, Anachem, Luton, UK) set at220 nm with an attenuation of 0.01 AUFS. The retentiontime for DON was 13.3 min. Quantification was relativeto external standards of 1–8 mg ml21 in methanol/water(5 : 95). The quantification limit was 5 ng g21.
2.5. Multiple regression analyses and statisticalanalyses
The analysis was performed using a multiple regressionanalysis for the expression of six key TRI genes that areinvolved in the trichothecene biosynthetic pathway(TRI6, TRI10, TRI4, TRI5, TRI12 and TRI13), temp-erature and aw conditions, with DON concentrationconsidered as the selected dependent variable. Themicroarray expression data for each gene were used toobtain a normalized relative expression value by divid-ing the actual copy number by the maximum recordedexpression values for a particular gene (e.g. normalizedTRI4 expression ¼ actual TRI4/maximum TRI4 overall conditions).
These were used to examine the relationship betweenseveral independent or predictor variables and thedependent variable; in this case, DON concentration.The analysis, which was applied to predict DON con-centration based on the independent factors, was agood tool to obtain vectors showing the significance ofeach factor on the independent variables. The modelwas used to predict the dependent Y-variable orresponse as a function of n . 1 independent of X-vari-ables or predictors. STATISTICA software (v. 6.0,StatSoft Inc., Tulsa, OK, USA) was used for responsesurface regression of the data obtained. The statisticalanalysis of the model was performed in the form of ananalysis of variance (ANOVA). This analysis includedFisher’s test (overall model significance), its associated
J. R. Soc. Interface (2011)
probability P(F), correlation coefficient R and determi-nation of the R2 coefficient measure of the goodness-of-fit of the regression model. It also included the t-valuefor the estimated coefficients and associated probabil-ities. Nonlinear models were examined but they didnot provide a good fit to the data. The use of fewer par-ameters, e.g. two to five sets of gene expression data,was also evaluated, which gave a worse fit.
3. RESULTS
3.1. Effect of water activity and temperature ongrowth
Figure 1 shows the effect of aw on relative growth ratesof F. culmorum (BFE928) and F. graminearum(BFE1006) strains on a conducive YES medium modi-fied with the non-ionic solute glycerol. Overall, thehighest growth was observed at 308C and 0.98 aw forF. culmorum and 0.995 for F. graminearum. Similargrowth was observed at 0.995 aw, but only for F. cul-morum at 258C. A significantly slower growth wasobserved at 158C for both strains over the aw spectrumtested. At 308C, the optimum aw was 0.98, while at allother temperatures for both species this occurred whenwater was freely available (0.995 aw). The limits forgrowth varied with temperature, but were between0.93 and 0.95 aw. For both strains, some growth wasobserved at 0.93 aw and temperatures greater than158C, but not at 0.90 aw over the experimental period.
3.2. Phenotypic DON production andenvironmental factors
The effect of aw � temperature conditions on DON pro-duction showed that there were differences between thetwo strains over the 9 day time scale (figure 2). Fusar-ium culmorum produced no DON at 158C during thisperiod, but, overall, this strain produced significantlymore than the F. graminearum strain used. For thelatter species, although less DON was produced, thetoxin was produced at 158C and 0.995 aw. OptimumDON production was at 20 and 258C for F. culmorumand F. graminearum, respectively. This was differentfrom that for growth.
3.3. TRI gene expression in relation toenvironmental factors
Figure 3 summarizes the relative expression of the sixgenes (TRI4, TRI5, TRI6, TRI10, TRI12 andTRI13) under the different environmental treatmentsused. This shows that there were different patterns ofgene expression depending on abiotic conditions andspecies. Furthermore, the expression data for thestrain of F. culmorum were relatively much higherthan for the F. graminearum one, reflecting the lowerDON levels produced by the latter strain. The TRI5gene, a key one in the biosynthetic pathway of tri-chothecenes, was expressed over all the conditionsexamined. The expression data for all six key genes(TRI4, TRI5, TRI6, TRI10, TRI12 and TRI13) wereused for modelling the impact of environmentalinteractions on phenotypic DON production.

(a)
diam
etri
c gr
owth
rat
e (m
m d
–1)
diam
etri
c gr
owth
rat
e (m
m d
–1)
0
5
10
15
20
25
0.88 0.90 0.92 0.94 0.96 0.98 1.000
5
10
15
20
25
water activity
(b)
Figure 1. Effect of water activity and temperature on growth rates (mm d21) of (a) F. culmorum and (b) F. graminearum strainson yeast extract sucrose (YES) medium. Bars indicate least significant differences (p ¼ 0.05). Filled diamonds, 158C; filledsquares, 208C; filled triangles, 258C; crosses, 308C.
(a)
0
10
20
30
40
50
60
70
ND ND ND NDNDND
00.995 0.980 0.950 0.930
2
4
6
8
10
12
14(b)
water activity
deox
yniv
alen
ol (
µg g
–1)
deox
yniv
alen
ol (
µg g
–1)
NDNDNDNDND
Figure 2. Bar chart of the effect of different water activity and temperature levels on deoxynivalenol (DON) production (mg g21)by (a) F. culmorum and (b) F. graminearum on a conducive YES medium after 9 days’ growth. Bars indicate least significantdifference ( p ¼ 0.05). ND, not detected. (a) Bars with dots, 158C; bars with crosses, 208C; bars with slant lines, 258C; barswith horizontal lines, 308C.
120 Fusarium toxin gene expression models M. Schmidt-Heydt et al.
J. R. Soc. Interface (2011)
on February 25, 2015http://rsif.royalsocietypublishing.org/Downloaded from

rela
tive
expr
essi
on
15
(a)
TRI4 TRI5 TRI6 TRI10 TRI12 TRI13
0
1000
2000
3000
4000
5000
6000
TRI genes
30
0.995
0.980
0.950
0.930
0.995
0.995
0.995
0.980
0.980
0.980
0.950
0.950
0.950
0.930
0.930
25
20water activity–
temperature (°C)
TRI4 TRI5 TRI6 TRI10 TRI12 TRI13
0
200
400
600
800
1000
1200
1400
1600
1800
2000
TRI genes
rela
tive
expr
essi
on
(b)
15
30
0.995
0.980
0.950
0.930
0.995
0.995
0.995
0.980
0.980
0.980
0.950
0.950
0.950
0.930
0.930
25
20water activity–
temperature (°C)
Figure 3. Relative TRI gene expression of the six genes analysed in relation to water activity and temperature treatments for (a) F.culmorum and (b) F. graminearum grown on YES medium for 9 days. The data are relative to the house-keeping b-tubulin gene.
Fusarium toxin gene expression models M. Schmidt-Heydt et al. 121
on February 25, 2015http://rsif.royalsocietypublishing.org/Downloaded from
3.4. Modelling of the relationship between geneexpression and DON production
3.4.1. Fusarium culmorum strain. In order to find thestatistically significant interactions between factors, amodel based on a polynomial equation fitting the exper-imental data for DON production in relation to theexpression of the six TRI genes and the environmentalparameters was developed. The determinationcoefficient (R2) was 0.9709. The regressed model is
DONðmgg�1Þ¼ 5:85þ0:216Xaw�1:1XðTðWCÞÞ �2:5XTRI6
þ4:03XTRI10þ3:16XTRI4�2:01XTRI5
�10:8XTRI12�6:42XTRI13; ð3:1Þ
where X is the coded factor and the subscript name thefactor in each term of the model. For the gene expression,a standardized value was used, defined as Xgen¼
J. R. Soc. Interface (2011)
actual_value/maximum_value; therefore, the geneexpression will be in the range of 0 , X , 1. The codedvalues for temperature and water activity are the codedlevels tested from the lowest (1) to the highest (4) values.
3.4.2. Fusarium graminearum strain. The geneexpression data for this species were also used for thedevelopment of a model based on a polynomial equationthat fitted the experimental data for DON productionby F. graminearum. This had a multiple correlationcoefficient (R2) of 0.9542. The regressed model is
DONðmgg�1Þ ¼�5:16þ 1:262Xaw þ 1:054XðTðWCÞÞ
þ 0:283XTRI6� 7:8XTRI10þ 11:28XTRI4
þ 11:0XTRI5� 2:35XTRI12� 8:22XTRI13:
ð3:2Þ

(a)
(b)
80
70
60
50
obse
rved
DO
N c
once
ntra
tions
(mg
g–1
)ob
serv
ed D
ON
con
cent
ratio
ns (
mg g
–1)
predicted DON concentrations (mg g–1)
40
30
20
10
0
–10
14
12
10
8
6
4
2
0
–2
–10 0
0 2 4 6 8 10 12 14–2
10 20 30 40 50 60 70 80
Figure 4. The correlations between the observed and predictedvalues based on the models developed for DON (mg g21) (a) F.culmorum and (b) F. graminearum. The broken lines indicatethe 95% confidence limits. Points above or below the diagonalline represent areas of over- or under-prediction.
122 Fusarium toxin gene expression models M. Schmidt-Heydt et al.
on February 25, 2015http://rsif.royalsocietypublishing.org/Downloaded from
Using these models, the observed versus predictedDON concentrations in relation to the expression ofthe six genes and aw and temperature are shown infigure 4a,b. This figure indicates that, while there issome under and over-prediction, the model does gener-ally fit the experimental data, especially with the F.culmorum strain.
Table 1 shows the overall statistical fit of the modeland the significance of the factors (TRI genes, aw, temp-erature) in relation to DON production for the F.culmorum strain. This table shows that DON pro-duction was statistically related to the expression of anumber of TRI genes (e.g. TRI5, TRI12, TRI13). Forthe F. graminearum strain, there appeared to be amuch more coordinated expression of these TRI geneswith both aw and temperature, and expression ofTRI4, TRI5, TRI10 and TRI13 all being statisticallysignificant factors (table 2).
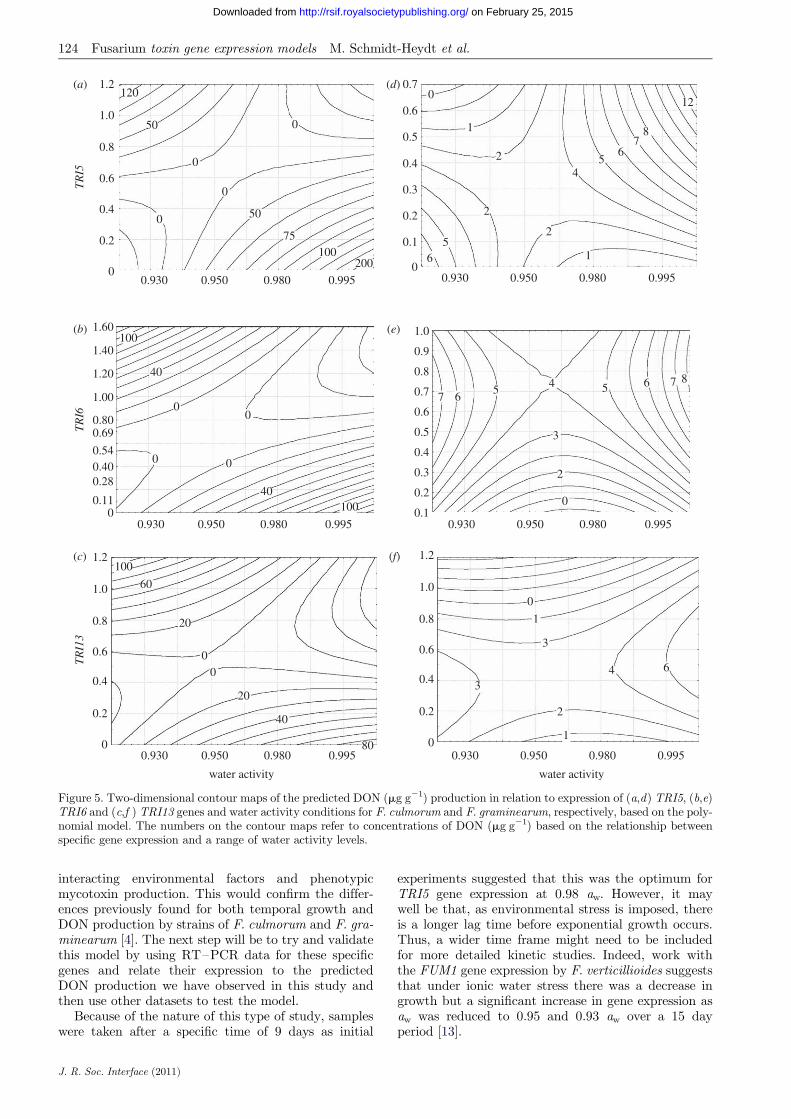
Figure 5 shows examples of two-dimensional contourplots relating specific gene expression and aw levels forboth species to predicted DON production for TRI5,TRI6 and TRI13 as examples using the developedmodels. This shows clearly that under both aw optimaand minima there is an increased expression of thesegenes, and this can be related directly to predictedDON production levels. This shows that environmentalstress can result in increased gene expression, which inturn relates to phenotypic secondary metabolite pro-duction. For the F. culmorum strain (figure 5a–c)this is clear whereas for the F. graminearum strain(figure 5d– f ) it is less so, although there is a patternfor conditions conducive and non-conducive to DONproduction. The lower DON production by the strainof F. graminearum used in our experiments is reflectedin the relationship between the expression of these threegenes used as examples and the predicted DON pro-duction. Similar patterns were obtained with regardto the other TRI genes and for temperature (data notshown).
Figure 6 shows the predicted contour maps for rela-tive DON production based on the available data andthe model in relation to the key environmental factorsof temperature and aw. For both strains, the optimumtemperature was at 20–258C and greater than 0.98 aw.
4. DISCUSSION
This study is one of the first to attempt to relate pheno-typic mycotoxin production to key TRI cluster geneexpression in relation to a matrix of interacting environ-mental factors for strains of mycotoxigenic fungi. Thegrowth of both strains was shown to be optimum at308C and between 0.98 and 0.995 aw. However, DONproduction was optimum at 20–258C over the 9 dayexperimental period. This is consistent with some ofthe previous studies relating aw � temperature effectsto growth and DON production for F. culmorum andF. graminearum strains from Europe and Argentina[3,4,17]. Marin et al. [18] showed that thetemperature � aw profiles for germination, growth andphenotypic fumonisin production by strains of F. verti-cillioides and F. proliferatum were also different.
J. R. Soc. Interface (2011)
Similarly, for mycotoxigenic fungi such as Aspergilluscarbonarius, ochratoxin A production differences wereobserved with optimum growth at 30–358C and 0.98aw while toxin production was optimum at 15–208Cand 0.98–0.95 aw [19,20]. However, none of these pre-vious studies attempted to relate specific expressionprofiles of key genes involved in the biosynthesis ofthe toxins to growth or phenotypic mycotoxin pro-duction. The only studies of this type were thoserecently reported for the effects of osmotic and matricpotential on the kinetics of FUM1 gene expression byF. verticillioides [13], on otapksPV expression by Peni-cillium verrucosum in relation to suboptimalpreservatives and environmental factors [11] and therecent study that showed the effect of aw � temperatureconditions on mycotoxin gene cluster activities for P.nordicum, F. culmorum and A. parasiticus using themicroarray used in the present study [12].
This study has shown that some of the key genes inthe biosynthetic pathway for trichothecene production(TRI4, TRI5, TRI6, TRI10, TRI12 and TRI13) aremarkedly increased and influenced by interactingenvironmental conditions of temperature � aw. The

Table 1. Regression analysis summary of (a) model fit and (b) statistically significant effect of interactions with DON as thedependent variable and the individual six genes and the two environmental factors for F. culmorum. The numbers in boldrepresent significant factors.
(a) sum of squares d.f. mean F p-value
regression 21.02170 8 2.627712 16.47913 0.000326residual 1.27566 18 0.159457total 22.29735
(b) B (regressed model coefficient) s.e. p-value
intercept 5.8499 1.181035 0.001116water activity 0.216 0.143956 0.172016temperature (8C) 21.0774 0.301641 0.007276TRI6 22.5075 0.787163 0.012891TRI10 4.0330 1.263693 0.012775TRI4 3.1598 1.066495 0.018068TRI5 22.0096 0.576268 0.008232TRI12 210.8186 1.657092 0.000183TRI13 6.4161 0.914918 0.000111
Table 2. The regression analysis summary of (a) model fit and (b) the statistically significant effect of interactions with DONas the dependent variable and the individual genes and the two environmental conditions for F. graminearum. Numbers inbold are statistically significant.
(a) sum of squares d.f. mean F p-level
regression 232.8808 8 29.11010 22.89857 0.00033residual 22.8827 18 1.27126total 225.7636
(b) B (regressed model coefficient) s.e. p-value
intercept 25.15931 0.990765 0.000059water activity 1.262 0.313627 0.000798temperature (8C) 1.05426 0.323034 0.004314TRI6 0.28255 1.872558 0.881742TRI10 27.79699 1.425399 0.000034TRI4 11.27672 1.387046 0.000000TRI5 11.00253 2.094076 0.000054TRI12 22.34974 1.179510 0.061748TRI13 28.21629 1.378790 0.000012
Fusarium toxin gene expression models M. Schmidt-Heydt et al. 123
on February 25, 2015http://rsif.royalsocietypublishing.org/Downloaded from
increased activity of TRI5 (sesquiterpene cyclase) andTRI4 (cytochrome P450) is particularly important asthey are key genes involved in the initial biosyntheticpathway for trichodiene synthase and trichodiene oxy-genase. Other important genes downstream from theseare those involved in regulation and transport (e.g.TRI6 transcription factor, TRI12 superfamily transpor-ter, TRI10 regulatory gene) in both species [5]. Indeed,studies by Peplow et al. [21] showed that the TRI10 is aregulatory gene for four trichothecene pathway-specificgenes in F. sporotrichioides. This may also be relevantto the F. culmorum strain used in our study as it alsoproduces NIV.
In the present study, we have focused only on thesesix genes, although the data for all the TRI geneswere obtained using the microarray (data not shown).However, there are complex interactions between geneexpression and phenotypic mycotoxin productionwhen one considers the whole cluster of genes involved.A lack of correlation between relative gene expressionand toxin production for some genes has been observed
J. R. Soc. Interface (2011)
previously. For example, this has been found with therelationship for some genes involved in aflatoxin pro-duction [22]. They showed that expression of only asmall number of aflatoxin biosynthetic pathway geneswas directly coupled with aflatoxin biosynthesis. Thiscomplexity was recently demonstrated in work with amycotoxin microarray [23] which showed that thereare two clusters of genes that were expressed in clusters,and this was influenced by water availability. However,in the studies by Scherm et al. [22], the effect ofenvironmental factors was not considered.
The polynomial models were useful tools to try andunravel the complex correlations between these specificgenes in the cluster and the range of interactingenvironmental parameters studied. The analysisshowed that models can be developed to relate geneexpression to secondary metabolite production and sub-sequently used to successfully predict DON production.Moreover, the models show that there may well bestrain and perhaps species differences in terms of thepatterns of expression of these six genes in relation to
1.2(a) (d)
(b)
(c)
(e)
(f)
0.7
0.6
0.5
0.4
0.3
0.2
0.1
0.5
0.6
0.7
0.8
0.9
1.0
0.4
0.3
0.2
0.1
0
1.0
0.8
0.6
TR
I5T
RI6
TR
I13
0.4
0.2
0
1.60
1.40
1.20
1.00
0.800.69
0.540.400.28
0.11
1.2
1.0
0.8
0.6
0.4
0.2
0
1.2
1.0
0.8
0.6
0.4
0.2
0
0
0.930 0.950 0.980
water activity water activity
0.995 0.930 0.950 0.980 0.995
0.930 0.950 0.980 0.995
0.930 0.950 0.980 0.995
0.930 0.950 0.980 0.995
0.930 0.950 0.980 0.995
0
0
0
0
1
2
2
25
6 1
45
67
8
12
50
120
0
0
0 0
40
60
20
20
40
80
00
100
100
0
0
0
2
3
3
3
1
1
2
4 6
456
67
7 85
40
100
50
75100
200
Figure 5. Two-dimensional contour maps of the predicted DON (mg g21) production in relation to expression of (a,d) TRI5, (b,e)TRI6 and (c,f ) TRI13 genes and water activity conditions for F. culmorum and F. graminearum, respectively, based on the poly-nomial model. The numbers on the contour maps refer to concentrations of DON (mg g21) based on the relationship betweenspecific gene expression and a range of water activity levels.
124 Fusarium toxin gene expression models M. Schmidt-Heydt et al.
on February 25, 2015http://rsif.royalsocietypublishing.org/Downloaded from
interacting environmental factors and phenotypicmycotoxin production. This would confirm the differ-ences previously found for both temporal growth andDON production by strains of F. culmorum and F. gra-minearum [4]. The next step will be to try and validatethis model by using RT–PCR data for these specificgenes and relate their expression to the predictedDON production we have observed in this study andthen use other datasets to test the model.
Because of the nature of this type of study, sampleswere taken after a specific time of 9 days as initial
J. R. Soc. Interface (2011)
experiments suggested that this was the optimum forTRI5 gene expression at 0.98 aw. However, it maywell be that, as environmental stress is imposed, thereis a longer lag time before exponential growth occurs.Thus, a wider time frame might need to be includedfor more detailed kinetic studies. Indeed, work withthe FUM1 gene expression by F. verticillioides suggeststhat under ionic water stress there was a decrease ingrowth but a significant increase in gene expression asaw was reduced to 0.95 and 0.93 aw over a 15 dayperiod [13].

30
(a)
(b)
25
0 2
2
2
6
66
4
4
2
0
4 8 12 16 20 24 28 32 36 4020
tem
pera
ture
(°C
)
15
30
25
20
tem
pera
ture
(°C
)
15
0.93 0.95 0.98
water activity
0.995
Figure 6. Predicted DON (mg g21) contour maps of pro-duction in relation to temperature and water activity by (a)F. culmorum and (b) F. graminearum based on the poly-nomial model developed in this study. Numbers on thecontour lines refer to predicted DON concentrations.
Fusarium toxin gene expression models M. Schmidt-Heydt et al. 125
on February 25, 2015http://rsif.royalsocietypublishing.org/Downloaded from
We believe that a systems approach by integratingrelated molecular, ecological and secondary metabolitedata can be a powerful tool for more targeted functionalstudies on the relationship between gene expression andphenotypic mycotoxin production in relation to inter-acting environmental conditions. Furthermore, it mayenable more rapid studies to be carried out in identify-ing anti-fungal compounds that may inhibit specific keybiosynthetic and regulatory genes in these clusters thatcan be used for the development of improved preventionstrategies to minimize mycotoxins in the food chain.
We are grateful to Mrs E. S. Baxter for technical assistance.
REFERENCES
1 Aldred, D. & Magan, N. 2004 Prevention strategies for tri-cothecenes. Toxicol. Lett. 153, 165–171. (doi:10.1016/j.toxlet.2004.04.031)
2 Magan, N., Hope, R. & Aldred, D. 2006 Ecophysiology ofFusarium culmorum and mycotoxin production. In Advancesin foodmycology (edsA.D.Hocking, J. I.Pitt,R.A.Samson&U. Thrane), pp. 123–136. Berlin, Germany: Springer.
3 Hope, R. & Magan, N. 2003 Two dimensional environ-mental profiles of growth, deoxynivalenol and nivalenolproduction by Fusarium culmorum on a wheat-based sub-strate. Lett. Appl. Microbiol. 37, 70–74. (doi:10.1046/j.1472-765X.2003.01358.x)
J. R. Soc. Interface (2011)
4 Hope, R., Aldred, D. & Magan, N. 2005 Comparison of theeffect of environmental factors on deoxynivalenol pro-duction by F. culmorum and F. graminearum on wheatgrain. Lett. Appl. Microbiol. 40, 295–300. (doi:10.1111/j.1472-765X.2005.01674.x)
5 Desjardins, A. E. 2007 Fusarium mycotoxins: chemistry,genetics and biology, pp. 260. Saint Paul, MN: APS Press.
6 Alexander, N. J., Proctor, R. H. & McCormick, S. P. 2009Genes, gene clusters, and biosynthesis of trichothecenesand fumonisins in Fusarium. Toxins Rev. 28, 198–215.(doi:10.1080/15569540903092142)
7 Feng, G. H. & Leonhard, T. J. 1998 Culture conditionscontrol expression of the genes for aflatoxin and sterigma-tocystin biosynthesis in Aspergillus parasiticus and A.nidulans. Appl. Environ. Microbiol. 64, 2275–2277.
8 Geisen, R. 2004 Molecular monitoring of environmentalconditions influencing the induction of ochratoxin A bio-synthesis genes in Penicillium nordicum. Mol. Nutr.Food Res. 48, 532–540. (doi:10.1002/mnfr.200400036)
9 Llorens, A., Mateo, R., Hinojo, M. J., Valle-Algarra, F. M. &Jimenez, M. 2004 Influence of environmental factors on thebiosynthesis of type B trichothecenes by isolates of Fusariumspp. from Spanish crops. Int. J. Food Microbiol. 94, 43–54.(doi:10.1016/j.ijfoodmicro.2003.12.017)
10 O’Brian, G. R., Georgianna, D. R., Wilkinson, J. R., Yu,J., Abbas, H. K., Bhatnagar, D., Cleveland, T. E., Nier-man, W. & Payne, G. A. 2007 The effect of elevatedtemperature on gene transcription and aflatoxin biosyn-thesis. Mycologia 99, 232–239. (doi:10.3852/mycologia.99.2.232)
11 Schmidt-Heydt, M., Baxter, E. S., Geisen, R. & Magan, N.2007 Physiological relationship between food preserva-tives, environmental factors, ochratoxin and otapksPvgene expression by Penicillium verrucosum. Int. J. FoodMicrobiol. 119, 277–283.
12 Schmidt-Heydt, M., Magan, N. & Geisen, R. 2008 Stressinduction of mycotoxin biosynthesis genes in relation toabiotic factors. FEMS Microbiol. Lett. 284, 142–149.(doi:10.1111/j.1574-6968.2008.01182.x)
13 Jurado, M., Marın, P., Magan, N. & Gonzalez-Jaen, M. T.2008 Relationship between solute and matric potentialstress, temperature, growth and FUM1 gene expression intwo Fusarium verticillioides strains from Spain. Appl.Environ. Microbiol. 74, 2032–2036. (doi:10.1128/AEM.02337-07)
14 Schmidt-Heydt, M. & Geisen, R. 2007 A microarray formonitoring the production of mycotoxins in food.Int. J. Food Microbiol. 117, 131–140.
15 Gardiner, D. M., Kazan, K. & Manners, J. M. 2009 Nutri-ent profiling reveals potent inducers of trichothecenebiosynthesis in Fusarium graminearum. Fungal Gen.Biol. 46, 604–613. (doi:10.1016/j.fgb.2009.04.004)
16 Cooney, J. M., Lauren, D. R. & di Menna, M. E. 2001Impact of competitive fungi on trichothecene productionby Fusarium graminearum. J. Agric. Food Chem. 49,522–526. (doi:10.1021/jf0006372)
17 Ramirez, M. L., Chulze, S. & Magan, N. 2006 Interactingenvironmental factors, growth and temporaldeoxynivalenol production by strains of Fusariumgraminearum from Argentina on wheat grain.Int. J. Food Microbiol. 106, 291–296. (doi:10.1016/j.ijfoodmicro.2005.09.004)
18 Marin, S., Magan, N., Ramos, A. J. & Sanchis, V. 2004Fumonisin-producing strains of Fusarium: a review oftheir ecophysiology. J. Food Prot. 67, 1792–1805.
19 Belli, N., Marin, S., Sanchis, V. & Ramos, A. J. 2004 Influ-ence of water activity and temperature on growth ofisolates of Aspergillus section Nigri obtained from

126 Fusarium toxin gene expression models M. Schmidt-Heydt et al.
on February 25, 2015http://rsif.royalsocietypublishing.org/Downloaded from
grapes. Int. J. Food Microbiol. 96, 19–27. (doi:10.1016/j.ijfoodmicro.2004.03.004)
20 Mitchell, D., Parra, R., Aldred, D. & Magan, N. 2004Water and temperature relations of growth and ochratoxinA production by Aspergillus carbonarius strains fromgrapes in Europe and Israel. J. Appl. Microbiol. 97,439–445. (doi:10.1111/j.1365-2672.2004.02321.x)
21 Peplow, A. W., Tag, A. G., Garifullina, G. F. & Boremand,M. N. 2003 Identification of new genespositively regulated by Tri10 and a regulatory networkfor trichothecene mycotoxin production. Appl. Environ.Microbiol. 69, 2731–2736. (doi:10.1128/AEM.69.5.2731-2736.2003)
J. R. Soc. Interface (2011)
22 Scherm, B., Palomba, M., Serra, D., Marcello, A. &Migheli, Q. 2005 Detection of transcripts of the aflatoxingenes aflD, aflO and aflP by reversed-transcription-poly-merase chain reaction allows differentiation of aflatoxinproducing and non-producing isolates of Aspergillusflavus and Aspergillus parasiticus. Int. J. Food Microbiol.98, 201–210. (doi:10.1016/j.ijfoodmicro.2004.06.004)
23 Schmidt-Heydt, M., Abdel-Hadi, A., Magan, N. & Geisen,R. 2009 Complex regulation of the aflatoxin biosynthesisgene cluster of A. flavus in relation to various combi-nations of water activity and temperature. Int. J. FoodMicrobiol. 135, 231–237. (doi:10.1016/j.ijfoodmicro.2009.07.026)