Detection of cortical laminar architecture using manganese-enhanced MRI
Upload
independentCategory
view
1download
0
Scanning probe microscopy characterizationof gold-chemisorbed poplar plastocyanin mutants
L. Andolfi a,b, B. Bonanni a, G.W. Canters b, M.Ph. Verbeet b, S. Cannistraro a,*
a Unita INFM, Dipartimento di Scienze Ambientali, Universit�aa della Tuscia, Largo dell�Universita, I-01100 Viterbo, Italyb Leiden Institute of Chemistry, Gorlaeus Laboratoria, Leiden University, The Netherlands
Received 14 February 2003; accepted for publication 7 March 2003
Abstract
Two poplar plastocyanin mutants adsorbed onto gold electrodes have been characterized at single molecule level by
scanning probe microscopy. Immobilization of the two redox metalloprotein mutants on Au(1 1 1) surface was achieved
by either a disulphide bridge (PCSS) or a single thiol (PCSH), both the anchoring groups having been introduced by
site-directed mutagenesis. Scanning tunneling microscopy (STM) and atomic force microscopy (AFM) analysis gives
evidence of a stable and robust binding of both mutants to gold. The lateral dimensions, as estimated by STM, and the
height above the gold substrate, as evaluated by AFM, of the two mutants well agree with crystallographic sizes. A
narrower height distribution is observed for PCSS compared to PCSH, corresponding to a more homogeneous ori-
entation of the former mutant adsorbed onto gold. Major differences between the mutants are observed by electro-
chemical STM. In particular, the image contrast of adsorbed PCSS is affected by tuning the external electrochemical
potential to the redox levels of the mutant, consistent with some involvement of copper active site in the tunneling
process. On the contrary, no contrast variation is observed in electrochemical STM of adsorbed PCSH. Moreover,
scanning tunneling spectroscopy experiments reveal asymmetric I–V characteristics for single PCSS proteins, remi-niscent of a rectifying-like behaviour, whereas an almost symmetric I–V relation is observed for PCSH.� 2003 Elsevier Science B.V. All rights reserved.
Keywords: Biological molecules – proteins; Scanning tunneling microscopy; Scanning tunneling spectroscopies; Atomic force
microscopy; Self-assembly
1. Introduction
The characterization of redox metalloproteins
chemisorbed onto metal electrodes is gaininggreat interest in the progressing interdisciplinary
research field of bioelectronics that involves the
integration of biomaterials with electronic trans-
ducers, such as electrodes, field-effect-transistors
and piezoelectric crystals [1,2]. Copper proteins
and their localized redox centres, which are re-sponsible for the electron transfer (ET) function,
have been extensively characterised structurally in
recent years [3]. The ET mechanism of such pro-
teins is very efficient. In general they are part of ET
chains where the conduction through the biomol-
ecule occurs at the level of the single electron [4,5].
This feature renders copper proteins promising
*Corresponding author. Tel.: +39-0761-357136; fax: +39-
0761-357179.
E-mail address: [email protected] (S. Cannistraro).
0039-6028/03/$ - see front matter � 2003 Elsevier Science B.V. All rights reserved.doi:10.1016/S0039-6028(03)00443-6
Surface Science 530 (2003) 181–194
www.elsevier.com/locate/susc

candidate for the construction of low dissipation,
highly sensitive hybrid mono-molecular devices.
The ability to obtain functional and oriented me-
talloprotein adlayers is an important route toward
this goal. Furthermore, covalent bonding of a
molecule to a conductor is a key requirement forefficient conduction through a single molecule to-
wards the electrode. In this perspective, the high
affinity of disulphides and thiols for gold electro-
des has been amply investigated [6]. Experimental
and theoretical studies showed that dissociative
reduction of a disulphide with subsequent forma-
tion of strongly bound thiolates can be achieved
[7,8], whereas the binding of thiolates resultingfrom S–H bond cleavage in thiols is accompanied
by the development of molecular hydrogen [8].
Native disulphide and thiols have been esten-
sively exploited to achieve protein–metal adsorp-
tion [9–13].
Thus copper proteins fulfill the basic require-
ments for integration in nanobiodevices thanks
also to the possibility of tuning their redox po-tential. In the present work, we focus on poplar
plastocyanin (PC). PC is a small blue copper
protein (10.5 KDa) acting as an electron carrier
between cytochrome f and P700 in the photosyn-thetic ET chain. Its structural features include a
distorted tetrahedral copper site at one end of an
eight-stranded antiparallel b barrel [14]. The tet-rahedral geometry of the copper site facilitates theET that results from a transition from the oxidized
to the reduced state with a characteristic redox
potential [14]. To make poplar PC suitable for
stable and specific self-assembly onto gold, we
designed two mutants bearing anchoring groups
that carry sulphur atoms. In the first mutant
(PCSS), a disulphide bridge was inserted within
the protein, while in the second one (PCSH) aresidue tail, containing among others a cysteine,
was added as C-terminal extension. Both groups
(S–S and S–H) are located in a region of the pro-
tein opposite to the copper active site and easily
available for chemisorption onto a gold electrode,
as schematically represented in Fig. 1. By the in-
troduction of the anchoring groups, it should be
possible to both create well-defined molecular ad-layers of high stability and, more importantly, to
control the electronic coupling between the me-
talloprotein (including the copper containing ac-
tive site) and the underlying gold electrode surface.Due to the diverse locations of the anchoring
groups we expect different effects on both topo-
graphical and conductive properties of adsorbed
PC mutants when immobilizing via either the SH
and the S–S moiety.
To compare the two linkages and to investigate
possible influences on the conformational and
conducting properties of the immobilised proteinsat the single molecule level, we focus on the
characterisation of the two immobilised mutants
by scanning probe microscopy (SPM). Indeed
SPM, when compared to conventional techniques
to study adsorption of protein monolayers [15–18],
allows the characterisation of adsorbed proteins at
Fig. 1. Visual molecular dynamics graphic representation
showing the two plastocyanin mutants immobilized via the S–S
(a) or S–H group (b) onto an Au(1 1 1) substrate. The copper
atom is indicated by the sphere at the top, the sulfur atoms are
indicated by smaller spheres at the bottom. Coordinates for
PCSS are from X-ray crystallography [29]. The three dimen-
sional structure of PCSH is obtained from the PDB file of wild
type plastocyanin (Brookhaven Protein Database) after adding
the three residue tail at the C-terminal position (see Section 2)
by Swiss PDB Viewer (SPDBV).
182 L. Andolfi et al. / Surface Science 530 (2003) 181–194
concentrations below monolayer coverage [19–21],
thus minimizing protein–protein interaction. In
particular, in the present work the combination of
scanning tunneling microscopy (STM) and atomic
force microscopy (AFM) provides complementary
information on the electronic properties andmorphology of individual proteins, under physio-
logical and ambient conditions. STM measures the
tunneling current and represents a powerful tool to
investigate electronic properties of single mole-
cules [22] with submolecular resolution. Scanning
tunneling spectroscopy (STS) can be performed to
acquire I–V data by selectively positioning the tipover a single protein [23]. AFM provides reliableinformation about molecule height and orientation
above the substrate [19,24,25].
Here we present an extensive characterisation of
PCSS and PCSH monolayers, in which a single
molecule has a lateral size (evaluated by STM) and
a vertical dimension (measured by AFM) in close
agreement with the crystallographic data, al-
though PCSS molecules present a narrower heightdistribution above the substrate. Electrochemical
STM indicates a possible contribution of protein
redox levels in the image contrast formation for
PCSS; such behaviour has not observed for PCSH.
Besides, single molecule STS shows a rectifying-
like behaviour for PCSS, which is not detected in
the PCSH molecule.
2. Materials and methods
2.1. Mutagenesis, expression and purification
Design, expression and purification of PCSS
were carried out as reported previously [26]. PCSH
was designed and expressed as follows: for PCR-mutagenesis the pET-3a plasmid [27], containing
the wild type poplar plastocyanin gene was used as
a template. A mutagenic primer coding for a C-
terminal extension was synthesised. As a result a
sequence encoding three extra C-terminal residues
[Thr–Cys–Gly] was incorporated in the gene. Se-
quence analysis confirmed the mutation. The ex-
pression vector with the mutated gene wasconstructed by using a combination of restriction
sites resulting in a PCSH expressing pET-3 pla-
smid [26]. The PCSH mutant was over-expressed
in the cytoplasm of E. coli HMS174 (DE3) and
grown at 37 �C in 2�YT medium supplementedwith 100 lg/ml of carbenicillin and 0.1 mM coppercitrate. Protein expression was induced by addition
of 0.2 mM IPTG. The PCSH mutant variant wasisolated from bacteria by the freeze/thaw method
[28]. Subsequently, the protein was purified by
anion-exchange chromatography (DEAE Sefha-
rose fast flow) and Superdex G-75 size exclusion
column chromatography in a Pharmacia FPLC
setup [26]. The N-terminal sequence and the mass
(by electron spray mass spectroscopy) were deter-
mined at the Protein sequencing facility, LUMC,Leiden. In the mass spectra a dominant form,
corresponding to a PCSH glutathione extension,
was revealed.
The protein integrity and the copper site prop-
erties for PCSS was assessed by extensive spectro-
scopic and structural characterization as described
elsewhere [26,29]. Similar spectroscopic techniques
have been used to characterise PCSH showingprotein integrity and properties of the copper site
closely resembling those of the wild type protein.
Optical spectroscopy on both mutants provided a
value of 1.1 for the absorbance ratio A280=A597,indicating similar high purity characteristics for
the two preparations [26]. The redox functionality
of the PCSS and PCSH upon immobilisation onto
a gold electrode was assessed by preliminary cyclicvoltammetry experiments [30].
2.2. STM measurements
STM images were acquired by a Picoscan sys-
tem (Molecular Imaging Co.) equipped with a
Picostat (Molecular Imaging Co.) bipotentiostat.
A 10-lm scanner with a final preamplifier sensi-tivity of 1 nA/V was used for STM measurements.
Images were acquired both in air and in buffer
solution in constant current mode, using electro-
chemically etched Pt/Ir tips purchased from Mo-
lecular Imaging. Gold substrates deposited on
mica (Molecular Imaging) were flame-annealed to
obtain recrystallized terraces. STM analysis (not
shown here) confirmed the presence of atomicallyflat (1 1 1) terraces, a few hundreds of nanometers
in size. The measuring cell for electrochemical
L. Andolfi et al. / Surface Science 530 (2003) 181–194 183
STM consisted of a TeflonTM ring pressed over the
Au(1 1 1) substrate operating as a working elec-
trode. A 0.5 mm Pt wire was used as counter
electrode and a 0.5 mm Ag wire as a quasi-refer-
ence electrode (AgQref). The AgQref potential was
measured vs saturated calomel electrode (SCE). Inwhat follows, the potential is always referred to
SCE.
Current–voltage curves were obtained by set-
ting the gap at a tunneling current of 50 pA and
Vbias of 0.180 V; disengaging the feedback, thetunneling current was monitored as the substrate
potential is swept over �1 V, and every singlesweep was collected in 0.01 s.Protein adsorption onto gold was accomplished
by incubating the Au(1 1 1) annealed substrates
with a 20 lM protein solution (20 mM sodiumphosphate, pH 6.0), at 4 �C for 30 min. After in-cubation, samples were gently rinsed with ultra-
pure water (resistivity 18.2 XMcm), blown drywith a soft jet of pure nitrogen, and immediately
imaged for scanning in ambient conditions, orimmersed in buffer solution for fluid imaging.
2.3. AFM measurements
Topographic images of the surface were taken
with a Nanoscope IIIa/Multimode scanning probe
microscope (Digital Instruments) equipped with a
12-lm scanner (E scannner) operating in tappingmode (TM). In this configuration the tip is kept
oscillating at its resonant frequency; the reduction
in oscillation amplitude (due to tip-surface inter-
action) is used to identify and measure surface
features. In TM the tip just barely ‘‘hits’’ or taps
the sample, drastically reducing frictional forces as
compared to contact-mode AFM. As a result, tip
induced damage over the molecules is minimal andreliable data about the molecular height distribu-
tion over the gold substrate can be obtained.
Oxide-sharpened silicon nitride probes (Digital
Instruments), 100 or 200 lm long and with nom-inal spring constant of 0.15 and 0.57 N/m re-
spectively, were used. All protein imaging was
performed in buffer solution using the fluid cell
without the O-ring seal, in order to minimize thelateral drift that is often caused by O-ring pressure
over the sample. Before engaging, scan size and
offsets were set to zero to minimize sample de-
formation and contamination of the tip. Free
oscillation of the cantilever was set to have a root-
mean-square amplitude corresponding to �1.5 V.Before scanning the sample, the set point was ad-
justed to minimal forces.The quality of the annealed gold substrates was
controlled by contact mode AFM measurements
in air. High quality Au(1 1 1) recrystallized terraces
show a roughness of about 0.1 nm. The substrates
were incubated at 4 �C with 7 lM protein solutionin 20 mM sodium phosphate buffer, pH 6.0, for
periods ranging from 30 min to 12 h. After incu-
bation, samples were gently rinsed with ultrapurewater to remove weakly adsorbed proteins and
readily covered with 35 ll of buffer solution forimmediate fluid imaging. As a control, Au(1 1 1)
substrates were treated in similar way but without
the addition of proteins. They were scanned under
identical conditions to ensure that no spurious
images would be obtained.
3. Results and discussion
3.1. STM characterization
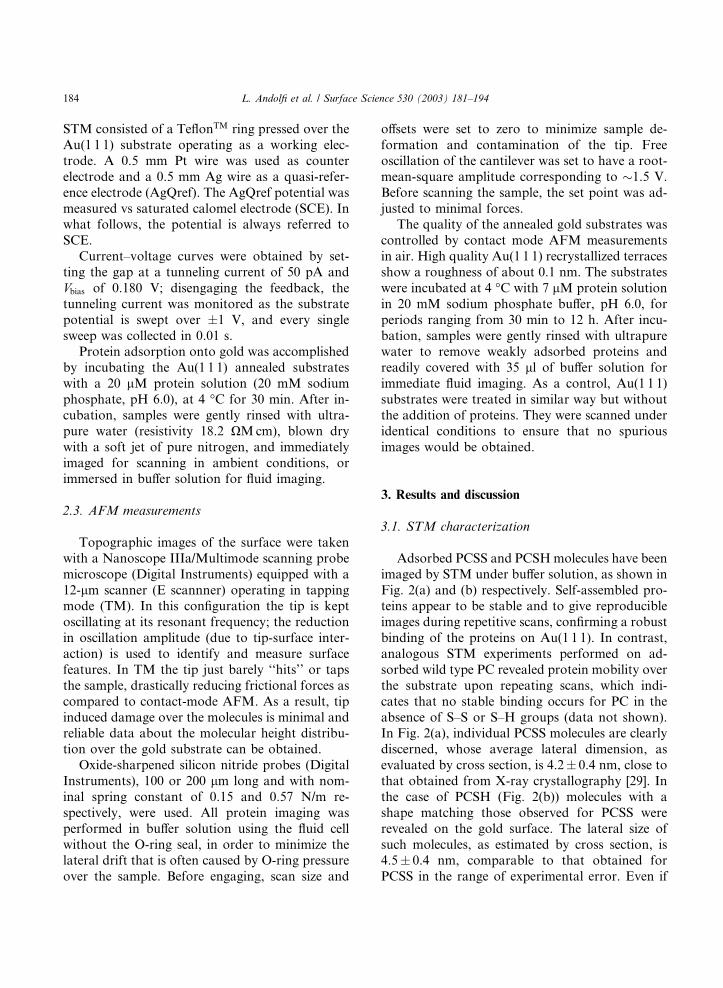
Adsorbed PCSS and PCSHmolecules have been
imaged by STM under buffer solution, as shown in
Fig. 2(a) and (b) respectively. Self-assembled pro-teins appear to be stable and to give reproducible
images during repetitive scans, confirming a robust
binding of the proteins on Au(1 1 1). In contrast,
analogous STM experiments performed on ad-
sorbed wild type PC revealed protein mobility over
the substrate upon repeating scans, which indi-
cates that no stable binding occurs for PC in the
absence of S–S or S–H groups (data not shown).In Fig. 2(a), individual PCSS molecules are clearly
discerned, whose average lateral dimension, as
evaluated by cross section, is 4.2� 0.4 nm, close tothat obtained from X-ray crystallography [29]. In
the case of PCSH (Fig. 2(b)) molecules with a
shape matching those observed for PCSS were
revealed on the gold surface. The lateral size of
such molecules, as estimated by cross section, is4.5� 0.4 nm, comparable to that obtained forPCSS in the range of experimental error. Even if
184 L. Andolfi et al. / Surface Science 530 (2003) 181–194
the X-ray structure for PCSH in not available,lateral sizes of immobilised proteins well compare
to those evaluated from the three-dimensional
model structure represented in Fig. 1, and ob-
tained as described in the corresponding caption.
The estimated vertical size of PCSS and PCSH,
as shown in the cross section of Fig. 2, appears to
be in the range of 0.5–0.7 nm. Comparing such
dimensions with crystallographic data [29] we ob-serve that the vertical size of the molecules above
the substrate is significantly smaller than the value
expected for PC anchored to gold via the disul-
phide bridge (PCSS) or via the single thiol
(PCSH). With reference to graphical representa-
tions of the PC mutants with the anchoring groups
assumed to be �face down� for covalent binding togold (see Fig. 1), one expects a vertical size ofabout 3 nm. Indeed, the considerable height re-
duction of biological materials in STM imaging
was already observed in numerous previous in-
vestigations [10,13,31–33] and only in few cases the
physical height of the biomolecules has been re-
ported [34,35]. Such a discrepancy is still a con-troversial aspect in the interpretation of STM
images. Although a number of groups have re-
ported successful STM imaging of biomolecules,
the origin of the contrast in protein molecules is
not understood. Proteins are a class of insulators/
quasi conductors and the concept of vacuum
tunneling cannot explain the tunneling through a
molecular medium. In some reports it has beenproposed that the STM contrast of adsorbates on
metallic surface arises from modification of me-
tallic states at the Fermi energy caused by the in-
teraction of the molecule with the metal surface
[22]. Other STM reports pointed out that the ionic
conductivity through a surface water film plays an
important role in tunneling between the STM tips
and the sample surface [36]. For high vacuumSTM of biological molecules an electric field-
induced mechanism for conduction of electrons
through the molecule was suggested [34]. In the
case of metalloproteins, the redox centre (the
copper containing active site for PC) was proposed
Fig. 2. Constant current STM images of PCSS (a) and PCSH (b) molecules on Au(1 1 1) in 50 mM ammonium acetate, pH 4.6. Scan
area: 130� 130 nm2. Tunneling current 50 pA, bias voltage 0.180 V (tip positive), scan rate 4 Hz. Representative cross section profilesfor adsorbed molecules are shown in lower panels; molecular height and lateral size can be evaluated from maximum vertical size and
from full width half maximum, respectively.
L. Andolfi et al. / Surface Science 530 (2003) 181–194 185
to mediate the tunneling current [9,13,37]. This has
been interpreted in the framework of two theo-
retical models. One model takes into account the
effect of the coupling between adsorbate redox
levels and the substrate Fermi level. In this model
[37] electrons tunnel from tip to substrate (or vice-versa) by a resonant tunneling process through the
molecular unoccupied states (oxidised states) when
they are brought to align with the substrate or tip
Fermi level. In a second model a strong coupling
of molecular electronic states with the nuclear
fluctuations is considered. In this case the ETs to
the protein and reduces the copper site, which
begins to relax vibrationally; this relaxation allowsthe molecule to transfer the electron to the other
electrode and to return to its oxidised state [9,38].
Even if the physical mechanism governing the STM
process through a redox molecule has not been
fully established, it is commonly accepted that
STM images are a complex convolution of topo-
graphic and electronic contributions and the
height of biomolecules as measured by STM maydeviate significantly from the purely topographic
one.
With the aim to investigate the ET capabilities
of the adsorbed mutants, as well as the role of the
copper atom in the tunneling mechanism, we have
performed STM imaging under electrochemical
control. This condition offers the possibility to
tune the electrochemical potential of the working
electrodes to the protein redox midpoint potential
[9,11,13], allowing the investigation of image
contrast in relation to the ET properties of themolecule. By using a bipotentiostat, the electro-
chemical potential of the two working electrodes
(substrate and tip) was tuned in a wide range
around the redox midpoint potential (+106 mV,
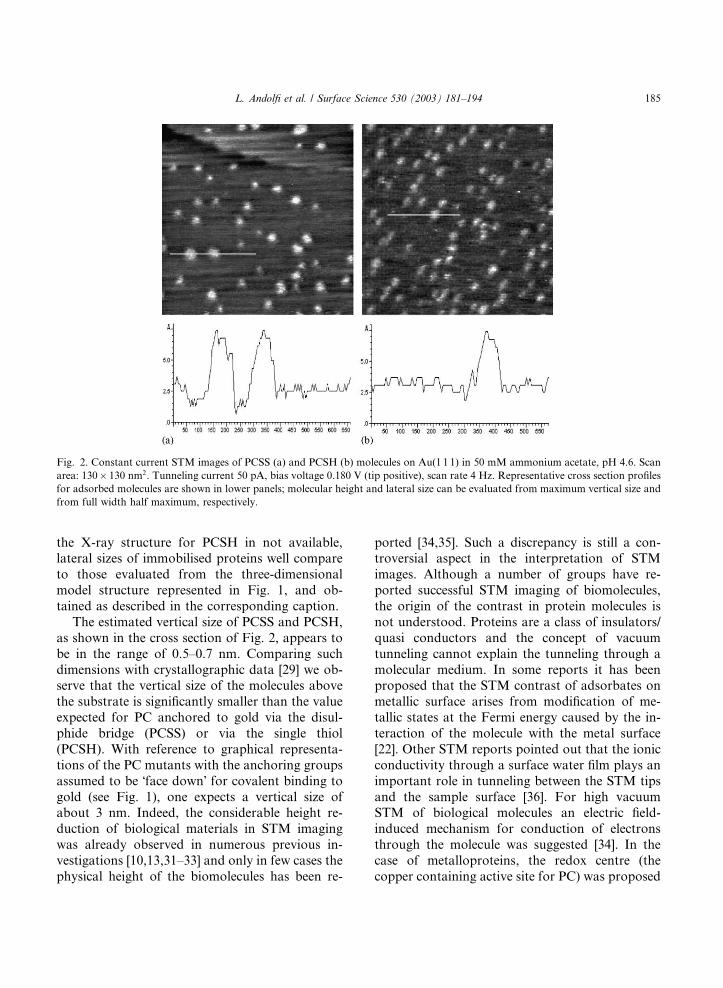
[26]). In Fig. 3 we show a sequence of in situ STM
images of PCSS adsorbed on Au(1 1 1) for three
of the several substrate electrochemical potentials
investigated, ranging between )222 and +28 mV vsSCE. The molecular features are clearly visible for
substrate potentials close to the midpoint potential
(Fig. 3(a)), the image contrast is weaker when the
potential is far from this value (Fig. 3(b)) and it is
recovered once the initial potential is re-estab-
lished (Fig. 3(c)). This effect is also reflected in
slight changes of height in the cross sections. Such
results seem to be consistent with previous studieson azurin in which a full bleaching was observed
[13]. They support, as already predicted by theo-
retical models [37,38], that the copper site repre-
sents a preferential way for the tunneling process
through the protein, once its redox levels are
Fig. 3. STM imaging under electrochemical control in constant current mode of PCSS molecules in 50 mM ammonium acetate, pH
4.6. Scan area: 120� 120 nm2. Tunneling current 50 pA; Vbias 0.180 V (tip positive), scan rate 4 Hz. Substrate potential is +28 mV vsSCE (a), )222 mV vs SCE (b), +28 mV vs SCE (c). Single molecule cross section profiles are shown in the lower panel.
186 L. Andolfi et al. / Surface Science 530 (2003) 181–194
properly aligned with the substrate and tip Fermi
levels. These findings are also consistent with a
recent voltammetric analysis, which shows that the
plastocyanin mutant adsorbed on a gold electrode
preserves its redox functionality [30].
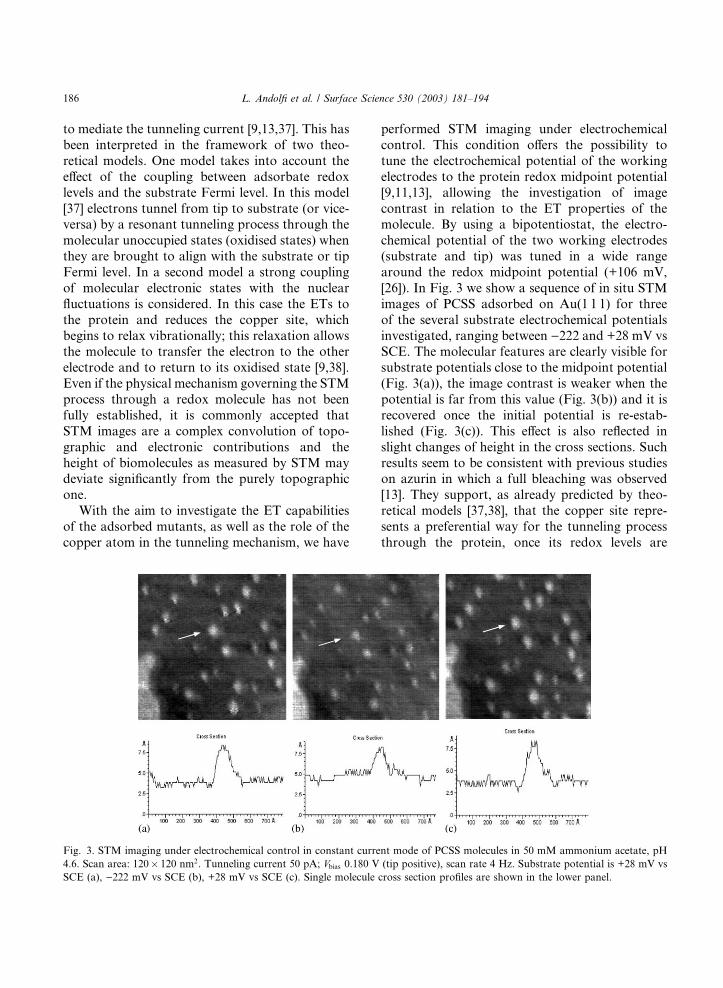
Similar STM experiments under electrochemi-cal control were performed for the PCSH mutant.
In Fig. 4(a)–(c) a sequence of electrochemical STM
images is shown for substrate electrochemical po-
tentials ranging from )222 to +28 mV vs SCE. Norelevant contrast variation is observed upon
sweeping substrate potential, as is also evident
from the unchanged height in the cross sections.
On the other hand, the redox functionality of ad-sorbed PCSH seems to be retained upon prelimi-
nary cyclic voltammetry experiments (data not
shown). Therefore, we can hypothesize that the
higher protein flexibility resulting from immobili-
sation via external S–H may result in an unfa-
vourable alignment of molecular redox levels with
tip and substrate Fermi levels [9,13,39].
Taking also into account the different electro-chemical STM features of the two mutants, im-
mobilised PCSS and PCSH have been further
investigated by STS experiments under ambient
conditions, in order to obtain additional infor-
mation about their electronic properties.
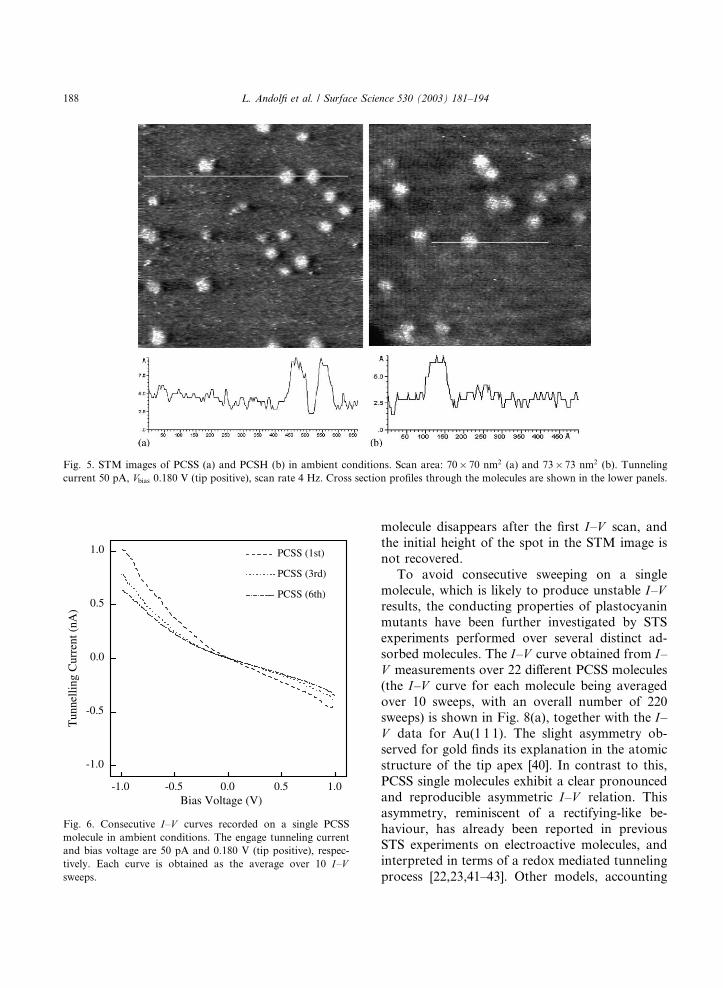
Before recording biomolecule current–voltage
curves, preliminary STM imaging of both mutants
adsorbed onto gold has been performed in ambi-
ent conditions. Representative STM images for
PCSS and PCSH are shown in Fig. 5(a) and (b)
respectively. Even in ambient conditions, imageswere stable and reproducible revealing globular
structures of lateral size comparable with the crys-
tallographic one and vertical dimensions smaller
than the expected values, as evident from a cross
section analysis. For STS ambient experiments, the
tip has been positioned over the central brighter
area of the molecules. In Fig. 6 consecutive I–Vcurves (each averaged over 10 sweeps) acquired fora single PCSS molecule are shown. We observe a
progressive decrease in the current response of
PCSS. The conductivity measured in the first curve
is not recovered after repeated scans, although the
I–V curves preserve a characteristic asymmetry,when comparing data for positive and negative
bias. Changes in conductive response after con-
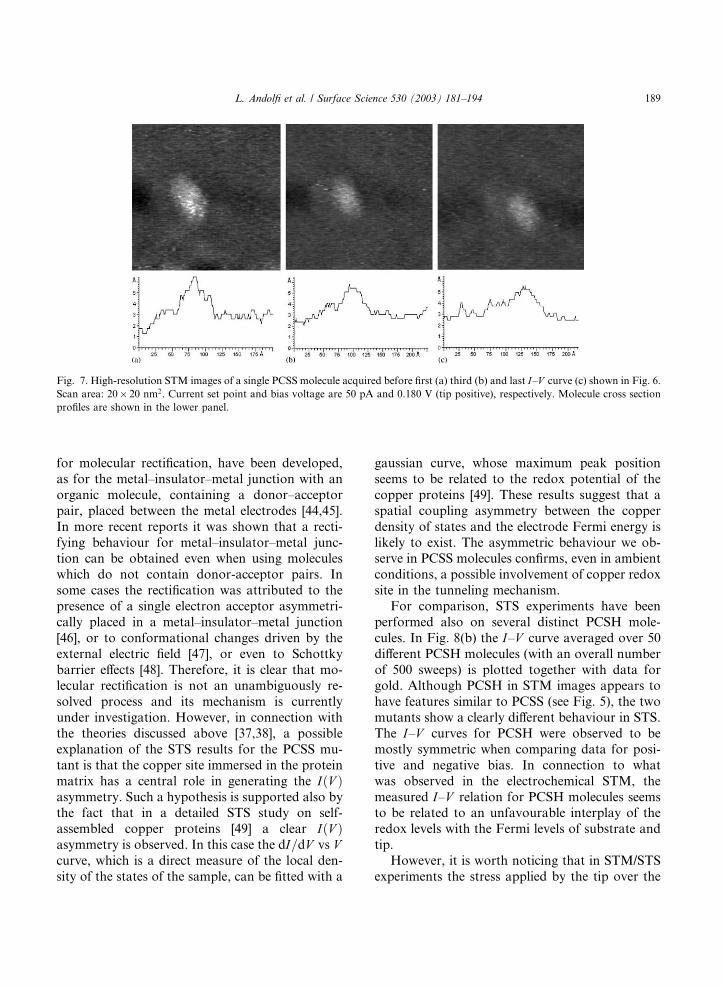
secutive I–V measurements are also reflected inSTM imaging. Fig. 7 shows a sequence of high-
resolution STM images of single molecules, each
image was acquired before the I–V scans reportedin Fig. 6. A progressive decrease of STM contrast
is clearly observed: the bright central area of the
Fig. 4. STM imaging under electrochemical control in constant current mode of PCSH molecules in 50 mM ammonium acetate, pH
4.6. Scan area: 140� 140 nm2. Tunneling current 50 pA, Vbias 0.180 V (tip positive), scan rate 4 Hz. Substrate potential is +28 mV vsSCE (a), )222 mV vs SCE (b), +28 mV vs SCE (c). Single molecule cross section profiles are shown in the lower panel.
L. Andolfi et al. / Surface Science 530 (2003) 181–194 187
molecule disappears after the first I–V scan, andthe initial height of the spot in the STM image is
not recovered.
To avoid consecutive sweeping on a singlemolecule, which is likely to produce unstable I–Vresults, the conducting properties of plastocyanin
mutants have been further investigated by STS
experiments performed over several distinct ad-
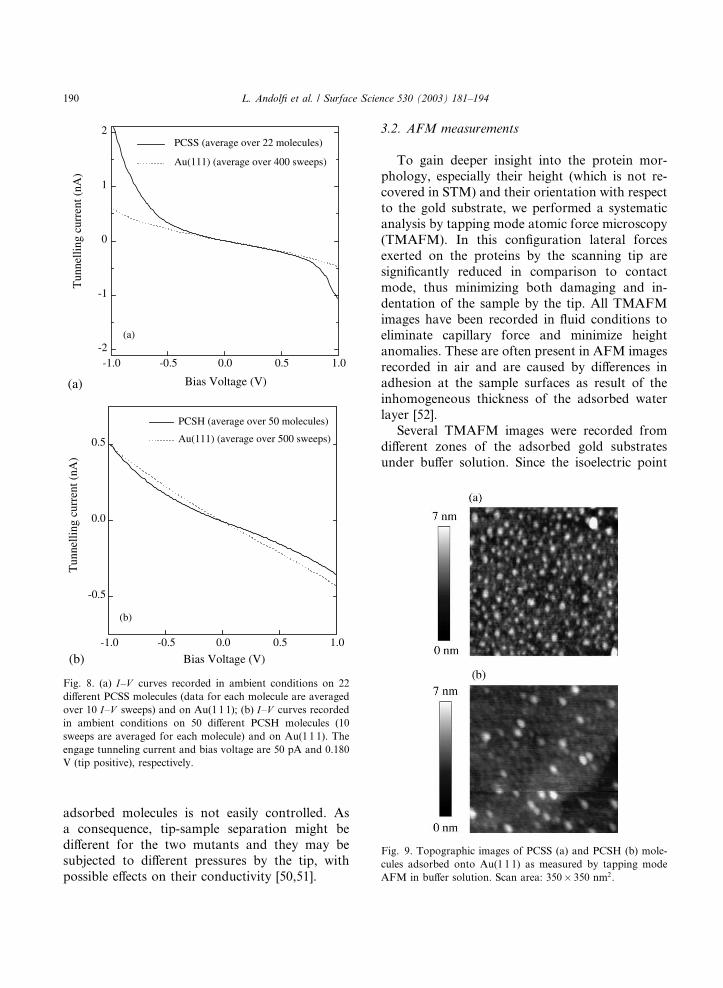
sorbed molecules. The I–V curve obtained from I–V measurements over 22 different PCSS molecules(the I–V curve for each molecule being averagedover 10 sweeps, with an overall number of 220sweeps) is shown in Fig. 8(a), together with the I–V data for Au(1 1 1). The slight asymmetry ob-served for gold finds its explanation in the atomic
structure of the tip apex [40]. In contrast to this,
PCSS single molecules exhibit a clear pronounced
and reproducible asymmetric I–V relation. Thisasymmetry, reminiscent of a rectifying-like be-
haviour, has already been reported in previousSTS experiments on electroactive molecules, and
interpreted in terms of a redox mediated tunneling
process [22,23,41–43]. Other models, accounting
-1.0 -0.5 0.0 0.5 1.0
-1.0
-0.5
0.0
0.5
1.0 PCSS (1st)
PCSS (3rd)
PCSS (6th)
Tun
nelli
ng C
urre
nt (
nA)
Bias Voltage (V)
Fig. 6. Consecutive I–V curves recorded on a single PCSSmolecule in ambient conditions. The engage tunneling current
and bias voltage are 50 pA and 0.180 V (tip positive), respec-
tively. Each curve is obtained as the average over 10 I–Vsweeps.
Fig. 5. STM images of PCSS (a) and PCSH (b) in ambient conditions. Scan area: 70� 70 nm2 (a) and 73� 73 nm2 (b). Tunnelingcurrent 50 pA, Vbias 0.180 V (tip positive), scan rate 4 Hz. Cross section profiles through the molecules are shown in the lower panels.
188 L. Andolfi et al. / Surface Science 530 (2003) 181–194
for molecular rectification, have been developed,
as for the metal–insulator–metal junction with an
organic molecule, containing a donor–acceptor
pair, placed between the metal electrodes [44,45].
In more recent reports it was shown that a recti-
fying behaviour for metal–insulator–metal junc-tion can be obtained even when using molecules
which do not contain donor-acceptor pairs. In
some cases the rectification was attributed to the
presence of a single electron acceptor asymmetri-
cally placed in a metal–insulator–metal junction
[46], or to conformational changes driven by the
external electric field [47], or even to Schottky
barrier effects [48]. Therefore, it is clear that mo-lecular rectification is not an unambiguously re-
solved process and its mechanism is currently
under investigation. However, in connection with
the theories discussed above [37,38], a possible
explanation of the STS results for the PCSS mu-
tant is that the copper site immersed in the protein
matrix has a central role in generating the IðV Þasymmetry. Such a hypothesis is supported also bythe fact that in a detailed STS study on self-
assembled copper proteins [49] a clear IðV Þasymmetry is observed. In this case the dI=dV vs Vcurve, which is a direct measure of the local den-
sity of the states of the sample, can be fitted with a
gaussian curve, whose maximum peak position
seems to be related to the redox potential of the
copper proteins [49]. These results suggest that a
spatial coupling asymmetry between the copper
density of states and the electrode Fermi energy is
likely to exist. The asymmetric behaviour we ob-serve in PCSS molecules confirms, even in ambient
conditions, a possible involvement of copper redox
site in the tunneling mechanism.
For comparison, STS experiments have been
performed also on several distinct PCSH mole-
cules. In Fig. 8(b) the I–V curve averaged over 50different PCSH molecules (with an overall number
of 500 sweeps) is plotted together with data forgold. Although PCSH in STM images appears to
have features similar to PCSS (see Fig. 5), the two
mutants show a clearly different behaviour in STS.
The I–V curves for PCSH were observed to bemostly symmetric when comparing data for posi-
tive and negative bias. In connection to what
was observed in the electrochemical STM, the
measured I–V relation for PCSH molecules seemsto be related to an unfavourable interplay of the
redox levels with the Fermi levels of substrate and
tip.
However, it is worth noticing that in STM/STS
experiments the stress applied by the tip over the
Fig. 7. High-resolution STM images of a single PCSS molecule acquired before first (a) third (b) and last I–V curve (c) shown in Fig. 6.Scan area: 20� 20 nm2. Current set point and bias voltage are 50 pA and 0.180 V (tip positive), respectively. Molecule cross sectionprofiles are shown in the lower panel.
L. Andolfi et al. / Surface Science 530 (2003) 181–194 189
adsorbed molecules is not easily controlled. As
a consequence, tip-sample separation might be
different for the two mutants and they may besubjected to different pressures by the tip, with
possible effects on their conductivity [50,51].
3.2. AFM measurements
To gain deeper insight into the protein mor-
phology, especially their height (which is not re-
covered in STM) and their orientation with respectto the gold substrate, we performed a systematic
analysis by tapping mode atomic force microscopy
(TMAFM). In this configuration lateral forces
exerted on the proteins by the scanning tip are
significantly reduced in comparison to contact
mode, thus minimizing both damaging and in-
dentation of the sample by the tip. All TMAFM
images have been recorded in fluid conditions toeliminate capillary force and minimize height
anomalies. These are often present in AFM images
recorded in air and are caused by differences in
adhesion at the sample surfaces as result of the
inhomogeneous thickness of the adsorbed water
layer [52].
Several TMAFM images were recorded from
different zones of the adsorbed gold substratesunder buffer solution. Since the isoelectric point
Fig. 9. Topographic images of PCSS (a) and PCSH (b) mole-
cules adsorbed onto Au(1 1 1) as measured by tapping mode
AFM in buffer solution. Scan area: 350� 350 nm2.
-1.0 -0.5 0.0 0.5 1.0
-0.5
0.0
0.5
(b)
PCSH (average over 50 molecules)
Au(111) (average over 500 sweeps)
Tun
nelli
ng c
urre
nt (
nA)
Bias Voltage (V)
-1.0 -0.5 0.0 0.5 1.0-2
-1
0
1
2
(a)
PCSS (average over 22 molecules)
Au(111) (average over 400 sweeps)
Tun
nelli
ng c
urre
nt (
nA)
Bias Voltage (V)(a)
(b)
Fig. 8. (a) I–V curves recorded in ambient conditions on 22different PCSS molecules (data for each molecule are averaged
over 10 I–V sweeps) and on Au(1 1 1); (b) I–V curves recordedin ambient conditions on 50 different PCSH molecules (10
sweeps are averaged for each molecule) and on Au(1 1 1). The
engage tunneling current and bias voltage are 50 pA and 0.180
V (tip positive), respectively.
190 L. Andolfi et al. / Surface Science 530 (2003) 181–194
for silicon nitride tips has a value close to 6 [53], we
chose a buffer solution with such pH value with
further minimization of tip-sample interactions.
Fig. 9 shows representative topographs of mole-
cules of PCSS (a) and PCSH (b) adsorbed onto
Au(1 1 1). Both mutants appear homogeneouslydistributed over the substrate and strongly bound
to gold, as evidenced by high quality images even
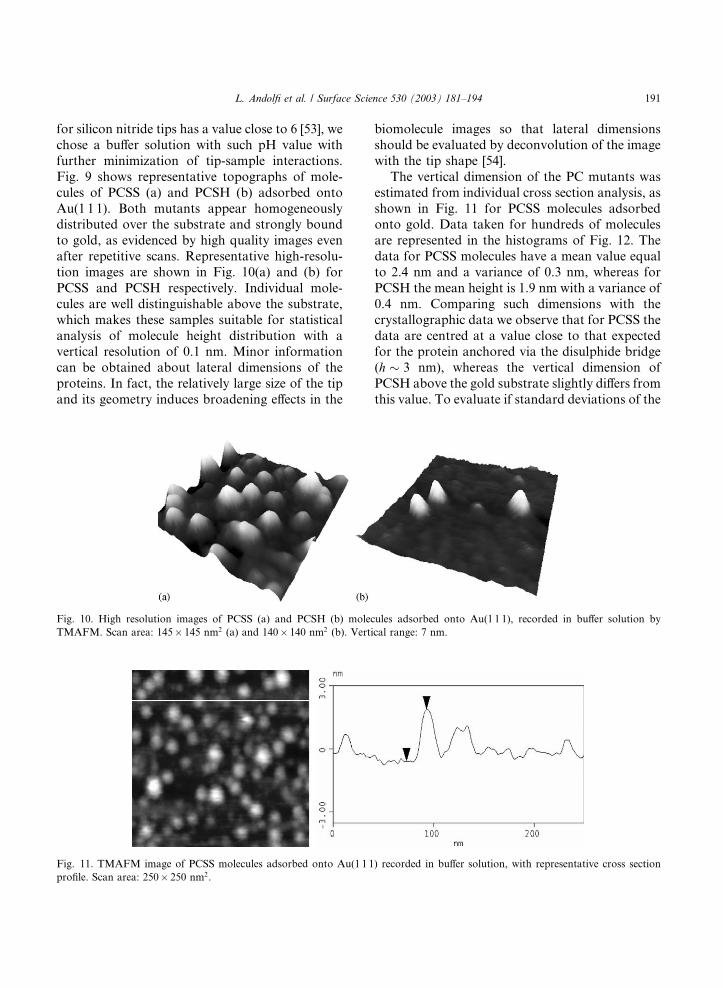
after repetitive scans. Representative high-resolu-
tion images are shown in Fig. 10(a) and (b) for
PCSS and PCSH respectively. Individual mole-
cules are well distinguishable above the substrate,
which makes these samples suitable for statistical
analysis of molecule height distribution with avertical resolution of 0.1 nm. Minor information
can be obtained about lateral dimensions of the
proteins. In fact, the relatively large size of the tip
and its geometry induces broadening effects in the
biomolecule images so that lateral dimensions
should be evaluated by deconvolution of the image
with the tip shape [54].
The vertical dimension of the PC mutants was
estimated from individual cross section analysis, as
shown in Fig. 11 for PCSS molecules adsorbedonto gold. Data taken for hundreds of molecules
are represented in the histograms of Fig. 12. The
data for PCSS molecules have a mean value equal
to 2.4 nm and a variance of 0.3 nm, whereas for
PCSH the mean height is 1.9 nm with a variance of
0.4 nm. Comparing such dimensions with the
crystallographic data we observe that for PCSS the
data are centred at a value close to that expectedfor the protein anchored via the disulphide bridge
(h � 3 nm), whereas the vertical dimension ofPCSH above the gold substrate slightly differs from
this value. To evaluate if standard deviations of the
Fig. 10. High resolution images of PCSS (a) and PCSH (b) molecules adsorbed onto Au(1 1 1), recorded in buffer solution by
TMAFM. Scan area: 145� 145 nm2 (a) and 140� 140 nm2 (b). Vertical range: 7 nm.
Fig. 11. TMAFM image of PCSS molecules adsorbed onto Au(1 1 1) recorded in buffer solution, with representative cross section
profile. Scan area: 250� 250 nm2.
L. Andolfi et al. / Surface Science 530 (2003) 181–194 191
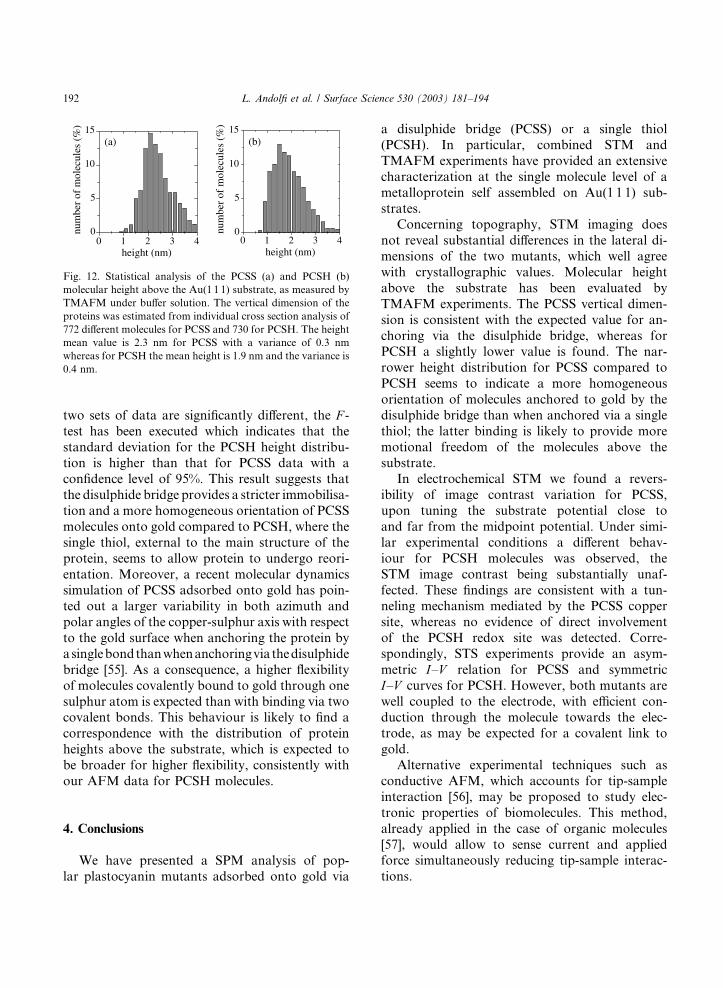
two sets of data are significantly different, the F -test has been executed which indicates that the
standard deviation for the PCSH height distribu-tion is higher than that for PCSS data with a
confidence level of 95%. This result suggests that
the disulphide bridge provides a stricter immobilisa-
tion and a more homogeneous orientation of PCSS
molecules onto gold compared to PCSH, where the
single thiol, external to the main structure of the
protein, seems to allow protein to undergo reori-
entation. Moreover, a recent molecular dynamicssimulation of PCSS adsorbed onto gold has poin-
ted out a larger variability in both azimuth and
polar angles of the copper-sulphur axis with respect
to the gold surface when anchoring the protein by
asinglebondthanwhenanchoringvia thedisulphide
bridge [55]. As a consequence, a higher flexibility
of molecules covalently bound to gold through one
sulphur atom is expected than with binding via twocovalent bonds. This behaviour is likely to find a
correspondence with the distribution of protein
heights above the substrate, which is expected to
be broader for higher flexibility, consistently with
our AFM data for PCSH molecules.
4. Conclusions
We have presented a SPM analysis of pop-
lar plastocyanin mutants adsorbed onto gold via
a disulphide bridge (PCSS) or a single thiol
(PCSH). In particular, combined STM and
TMAFM experiments have provided an extensive
characterization at the single molecule level of a
metalloprotein self assembled on Au(1 1 1) sub-
strates.Concerning topography, STM imaging does
not reveal substantial differences in the lateral di-
mensions of the two mutants, which well agree
with crystallographic values. Molecular height
above the substrate has been evaluated by
TMAFM experiments. The PCSS vertical dimen-
sion is consistent with the expected value for an-
choring via the disulphide bridge, whereas forPCSH a slightly lower value is found. The nar-
rower height distribution for PCSS compared to
PCSH seems to indicate a more homogeneous
orientation of molecules anchored to gold by the
disulphide bridge than when anchored via a single
thiol; the latter binding is likely to provide more
motional freedom of the molecules above the
substrate.In electrochemical STM we found a revers-
ibility of image contrast variation for PCSS,
upon tuning the substrate potential close to
and far from the midpoint potential. Under simi-
lar experimental conditions a different behav-
iour for PCSH molecules was observed, the
STM image contrast being substantially unaf-
fected. These findings are consistent with a tun-neling mechanism mediated by the PCSS copper
site, whereas no evidence of direct involvement
of the PCSH redox site was detected. Corre-
spondingly, STS experiments provide an asym-
metric I–V relation for PCSS and symmetric
I–V curves for PCSH. However, both mutants arewell coupled to the electrode, with efficient con-
duction through the molecule towards the elec-trode, as may be expected for a covalent link to
gold.
Alternative experimental techniques such as
conductive AFM, which accounts for tip-sample
interaction [56], may be proposed to study elec-
tronic properties of biomolecules. This method,
already applied in the case of organic molecules
[57], would allow to sense current and appliedforce simultaneously reducing tip-sample interac-
tions.
0 1 2 3 40
5
10
15(b)
height (nm)
num
ber
of m
olec
ules
(%
)
0 1 2 3 40
5
10
15(a)
num
ber
of m
olec
ules
(%
)
height (nm)
Fig. 12. Statistical analysis of the PCSS (a) and PCSH (b)
molecular height above the Au(1 1 1) substrate, as measured by
TMAFM under buffer solution. The vertical dimension of the
proteins was estimated from individual cross section analysis of
772 different molecules for PCSS and 730 for PCSH. The height
mean value is 2.3 nm for PCSS with a variance of 0.3 nm
whereas for PCSH the mean height is 1.9 nm and the variance is
0.4 nm.
192 L. Andolfi et al. / Surface Science 530 (2003) 181–194
Acknowledgements
This work has been partially supported by a
PRIN MURST project and by the EC Project
SAMBA (V Frame FET). Thanks are due to Dr.G. Costantini for help in generating Fig. 1 and to
Prof. A. Rita Bizzarri and Dr. D. Alliata for dis-
cussions.
References
[1] C. Joachim, J.K. Gimzewski, A. Aviram, Nature 408
(2000) 541.
[2] I. Willner, B. Willner, Trends Biotech. 19 (2001) 222.
[3] H.C. Freeman, J.M. Guss, in: A. Messerschmidt, R.
Huber, K. Wieghardt, T. Poulos (Eds.), Handbook of
Metalloproteins, Wiley, 2001.
[4] K. Sigfridsson, M. Ejdeback, M. Sundahl, €OO. Hasson,
Arch. Biochem. Biophys. 351 (1998) 197.
[5] W. Haehnel, T. Jansen, K. Gause, R.B. Kl€oosgen, B. Stahl,
D. Michl, B. Huvermann, M. Karas, R.G. Herrmann,
EMBO J. 13 (1994) 1028.
[6] A. Ulman, Chem. Rev. 96 (1996) 1533.
[7] R.G. Nuzzo, B.R. Zegarski, L.H. Dubois, J. Am. Chem.
Soc. 109 (1987) 733.
[8] H. Gr€oonbeck, A. Curioni, W. Andreoni, J. Am. Chem.
Soc. 122 (2000) 3839.
[9] E.P. Friis, J.E.T. Andersen, Y.I. Kharkats, A.M. Kuznes-
tov, R.J. Nichols, J.-D. Zhang, J. Ulstrup, Proc. Nat.
Acad. Sci. USA 96 (1999) 1379.
[10] Q. Chi, J. Zhang, J.U. Nielsen, E.P. Friis, I. Chorkendorff,
G.W. Canters, J.E.T. Andersen, J. Ulstrup, J. Am. Chem.
Soc. 122 (2000) 4047.
[11] J.J. Davis, H.A.O. Hill, A.M. Bond, Coord. Chem. Rev.
200–202 (2000) 411.
[12] I. Willner, E. Katz, Angew. Chem., Int. Ed. Engl. 39 (2000)
1180.
[13] P. Facci, D. Alliata, S. Cannistraro, Ultramicroscopy 89
(2001) 291.
[14] M.R. Redinbo, T.O. Yeates, S. Merchant, J. Bioenerg.
Biomemb. 26 (1994) 49.
[15] B.A. Ivarsson, P.O. Hegg, I. Lundstrom, U. Jonsson, J.
Colloid Interface Sci. 13 (1985) 169.
[16] M. Mrksich, G.B. Sigal, G.M. Whitesides, Langmuir 11
(1995) 4383.
[17] D. Kowalczyk, S. Slomkowski, J. Bioact. Compat. Polym.
9 (1994) 282.
[18] J.R. Lu, T.J. Su, P.N. Thirtle, R.K. Thomas, A.R. Rennie,
R. Cubitt, Colloid Interface Sci. 206 (1998) 212.
[19] J.J. Davis, H.A.O. Hill, Chem. Commun. (2002) 393.
[20] S. Scheuring, D. Fotiadis, C. M€ooller, S.A. M€uuller, A.
Engel, D.J. M€uuller, Single Molecules 2 (2001) 59.
[21] T.H. Bayburt, S.G. Sligar, Proc. Natl. Acad. Sci. 99 (2002)
6725.
[22] W. Han, E.N. Durantini, T.A. Moore, A.L. Moore, D.
Gust, P. Rez, G. Leatherman, G.R. Seely, N. Tao, S.M.
Lindsay, J. Phys. Chem. B 101 (1997) 10719, and references
therein.
[23] G.B. Khomutov, L.V. Belovolova, S.P. Gubin, V.V.
Khanin, A.Yu. Obydenov, A.N. Sergeev-Cherenkov, E.S.
Soldatov, A.S. Trifonov, Bioelectrochemistry 55 (2002) 177.
[24] Gang-Yu Liu, Nabil A. Amro, Proc. Nat. Acad. Sci. 99
(2002) 5165.
[25] M. Bergkvist, J. Carlsson, S. Oscarsson, J. Phys. Chem. B
105 (2001) 2062.
[26] L. Andolfi, S. Cannistraro, G.W. Canters, P. Facci, A.G.
Ficca, I.M.C. van Amsterdam, M.Ph. Verbeet, Arch.
Biochem. Biophys. 399 (2002) 81.
[27] J.A. Ybe, M.H. Hecht, Protein Express Purif. 5 (1994) 317.
[28] B.H. Johnson, M.H. Hecht, Biotechnology 12 (1994) 1357.
[29] M. Milani, L. Andolfi, S. Cannistraro, M.Ph. Verbeet, M.
Bolognesi, Acta Cryst. D 57 (2001) 1735.
[30] L. Andolfi, D. Bruce, S. Cannistraro, G.W. Canters, J.J.
Davis, H.A.O. Hill, J. Crozier, M.Ph. Verbeet, C.W.
Wrathmell, J. Electroanal. Chem., submitted for publica-
tion.
[31] J.J. Davis, C.M. Halliwell, H.A.O. Hill, G.W. Canters,
M.C. van Amsterdam, M.Ph. Verbeet, New J. Chem.
(1998) 1119.
[32] E.P. Friis, J.E.T. Andersen, L.L. Madsen, P. Møller, J.
Ulstrup, J. Electroanal. Chem. 431 (1997) 35.
[33] J.J. Davis, D. Djuricic, K.K.W. Lo, E.N.K. Wallace, L.L.
Wong, H.A.O. Hill, Faraday Discuss. 116 (2000) 15.
[34] S.L. Tang, A.J. McGhie, Langmuir 12 (1996) 1088.
[35] A. Bertazzon, B.M. Conti-Tronconi, M.A. Raftery, Proc.
Nat. Acad. Sci. USA 89 (1992) 9632.
[36] M. Heim, R. Steigerwald, R. Guckenberger, J. Struct. Biol.
119 (1997) 212.
[37] W. Schmickler, J. Electroanal. Chem. 296 (1990) 283.
[38] A.M. Kuznetsov, J. Ulstrup, J. Phys. Chem. A 104 (2000)
11531.
[39] J. Zhang, Q. Chi, A.M. Kuznetsov, A.G. Hansen, H.
Wackerbarth, H.E.M. Christensen, J.E.T. Andersen, J.
Ulstrup, J. Phys. Chem. B 106 (2002) 1131.
[40] A.I. Onipko, K.-F. Berggren, Yu.O. Klymenko, L.I.
Malysheva, J.J.W.M. Rosink, L.J. Geerlins, E. van der
Drift, S. Radelaar, Phys. Rev. B 61 (2000) 11118.
[41] U. Mazur, K.W. Hipps, J. Phys. Chem. B 103 (1999) 9721.
[42] L. Scudiero, D.E. Barlow, U. Mazur, K.W. Hipps, J. Am.
Chem. Soc. 123 (2001) 4073.
[43] K.W. Hipps, D.E. Barlow, U. Mazur, J. Phys. Chem. B
104 (2000) 2444.
[44] A. Aviram, M.A. Ratner, Chem. Phys. Lett. 29 (1974) 277.
[45] R.M. Metzger, Acc. Chem. Res. 32 (1999) 95.
[46] M.L. Chabinyc, X. Chen, R.E. Holmlin, H. Jacobs, H.
Skulason, C.D. Frisbie, V. Mujica, M.A. Ratner, M.A.
Rampi, G.M. Whitesides, J. Am. Chem. Soc. 124 (2002)
11730.
[47] A. Troisi, M. Ratner, J. Am. Chem. Soc. 124 (2002) 14528.
[48] A.J. Ikushima, T. Kanno, S. Yoshida, A. Maeda, Thin
Solid Films 273 (1996) 35.
L. Andolfi et al. / Surface Science 530 (2003) 181–194 193

[49] L. Andolfi, S. Cannistraro, G.W. Canters, J.J. Davis,
M.Ph. Verbeet, H.A.O. Hill, in preparation.
[50] U. D€uurig, O. Z€uuger, B. Michel, L. H€aausslinh, H. Rings-dorf, Phys. Rev. B 48 (1993) 1711.
[51] K.W. Hipps, Science 294 (2001) 536.
[52] S. John, T. Van Noort, K.O. Van der Werf, B.G. De
Grooth, N.F. Van Hulst, J. Greve, Ultramicroscopy 69
(1997) 117.
[53] X.Y. Lin, F. Creuzet, H. Arribart, J. Phys. Chem. 97 (1993)
7272.
[54] P. Markiewicz, M.C. Goh, J. Vac. Sci. Technol. B 13
(1995) 1115.
[55] G. Costantini, A.R. Bizzarri, S. Cannistraro, J. Phys.
Chem. B, submitted for publication.
[56] G. Leatherman, E.N. Durantini, D. Gust, T.A. Moore,
A.L. Moore, S. Stone, Z. Zhou, P. Rez, Y.Z. Liu, S.M.
Lindsay, J. Phys. Chem. B 103 (1999) 4006.
[57] X.C. Cui, A. Primak, X. Zarate, J. Tomfohr, O.F. Sankey,
A.L. Moore, T.A. Moore, D. Gust, G. Harris, S.M.
Lindsay, Science 294 (2001) 571.
194 L. Andolfi et al. / Surface Science 530 (2003) 181–194
Copyright © 2022 FDOKUMEN