
Detection of cortical laminar architecture using manganese-enhanced MRI
22
Detection of Cortical Laminar Architecture Using Manganese- Enhanced MRI Afonso C. Silva, Junghee Lee 1 , Carolyn W.-H. Wu, Jason Tucciarone, Galit Pelled, Ichio Aoki 2 , and Alan P. Koretsky Laboratory of Functional and Molecular Imaging, National Institute of Neurological Disorders and Stroke, National Institutes of Health, Bethesda, Maryland 20892 Abstract Changes in Manganese-Enhanced MRI (MEMRI) contrast across the rodent somatosensory cortex were compared to the cortical laminae as identified by tissue histology and administration of an anatomical tracer to cortex and thalamus. Across the cortical thickness, MEMRI signal intensity was low in layer I, increased in layer II, decreased in layer III until mid-layer IV, and increased again, peaking in layer V, before decreasing through layer VI. The reeler mouse mutant was used to confirm that the cortical alternation in MEMRI contrast was related to laminar architecture. Unlike in wild- type mice, the reeler cortex showed no appreciable changes in MEMRI signal, consistent[ACS1] with absence of cortical laminae in histological slides. The tract-tracing ability of MEMRI was used to further confirm assignments and demonstrate laminar specificity. Twelve to sixteen hours after stereotaxic injections of MnCl 2 to the ventroposterior thalamic nuclei, an overall increase in signal intensity was detected in primary somatosensory cortex compared to other brain regions. Maximum intensity projection images revealed a distinctly bright stripe located 600 − 700 μm below the pial surface, in layer IV. The data show that both systemic and tract-tracing forms of MEMRI are useful for studying laminar architecture in the brain. Keywords brain; cortical layers; neuroarchitecture; neuronal tract tracing; somatosensory cortex Introduction There is growing interest in using MRI to obtain information about brain structure and function at spatial resolutions suitable for studying sub-regions in the brain. Functional MRI (fMRI) has been increasingly used to map areas of activation with high spatial and temporal resolution. Since its beginning, fMRI has been able to distinguish major areas of the cortex (Belliveau, Kennedy, Jr. et al., 1991;Kim, Ashe et al., 1993;Hinke, Hu et al., 1993;Rao, Binder et al., 1993;Rueckert, Appollonio et al., 1994). Recently, a significant push for improving the spatial resolution of fMRI has allowed mapping of elemental functional units in the cortex, such as Correspondence to: Afonso C. Silva, Ph.D. Head, Cerebral Microcirculation Unit Laboratory of Functional and Molecular Imaging 10 Center Drive, 10/B1D118 Bethesda, MD 20892−1065 USA Tel: 301−402−9703 Fax: 301−480−2558 E-Mail: [email protected]. 1 At present address: Department of Radiology Samsung Medical Center Sungkyunkwan University School of Medicine 50 Ilwon-Dong Kangnam-Gu Seoul 137−200, Korea Tel: +82−02−3410−6459 Fax: +82−010−9933−6459 E-Mail: [email protected] 2 At present address: Molecular Imaging Center National Institute of Radiological Sciences Anagawa 4−9−1, Inage, Chiba, 263−8555 Japan Tel: +81−43−206−4716 Fax: +81−43−206−4079 E-Mail: [email protected] Publisher's Disclaimer: This is a PDF file of an unedited manuscript that has been accepted for publication. As a service to our customers we are providing this early version of the manuscript. The manuscript will undergo copyediting, typesetting, and review of the resulting proof before it is published in its final citable form. Please note that during the production process errors may be discovered which could affect the content, and all legal disclaimers that apply to the journal pertain. NIH Public Access Author Manuscript J Neurosci Methods. Author manuscript; available in PMC 2009 January 30. Published in final edited form as: J Neurosci Methods. 2008 January 30; 167(2): 246–257. NIH-PA Author Manuscript NIH-PA Author Manuscript NIH-PA Author Manuscript
-
Upload
independent -
Category
Documents
-
view
0 -
download
0
Transcript of Detection of cortical laminar architecture using manganese-enhanced MRI
Detection of Cortical Laminar Architecture Using Manganese-Enhanced MRI
Afonso C. Silva, Junghee Lee1, Carolyn W.-H. Wu, Jason Tucciarone, Galit Pelled, IchioAoki2, and Alan P. KoretskyLaboratory of Functional and Molecular Imaging, National Institute of Neurological Disorders andStroke, National Institutes of Health, Bethesda, Maryland 20892
AbstractChanges in Manganese-Enhanced MRI (MEMRI) contrast across the rodent somatosensory cortexwere compared to the cortical laminae as identified by tissue histology and administration of ananatomical tracer to cortex and thalamus. Across the cortical thickness, MEMRI signal intensity waslow in layer I, increased in layer II, decreased in layer III until mid-layer IV, and increased again,peaking in layer V, before decreasing through layer VI. The reeler mouse mutant was used to confirmthat the cortical alternation in MEMRI contrast was related to laminar architecture. Unlike in wild-type mice, the reeler cortex showed no appreciable changes in MEMRI signal, consistent[ACS1]with absence of cortical laminae in histological slides. The tract-tracing ability of MEMRI was usedto further confirm assignments and demonstrate laminar specificity. Twelve to sixteen hours afterstereotaxic injections of MnCl2 to the ventroposterior thalamic nuclei, an overall increase in signalintensity was detected in primary somatosensory cortex compared to other brain regions. Maximumintensity projection images revealed a distinctly bright stripe located 600 − 700 μm below the pialsurface, in layer IV. The data show that both systemic and tract-tracing forms of MEMRI are usefulfor studying laminar architecture in the brain.
Keywordsbrain; cortical layers; neuroarchitecture; neuronal tract tracing; somatosensory cortex
IntroductionThere is growing interest in using MRI to obtain information about brain structure and functionat spatial resolutions suitable for studying sub-regions in the brain. Functional MRI (fMRI)has been increasingly used to map areas of activation with high spatial and temporal resolution.Since its beginning, fMRI has been able to distinguish major areas of the cortex (Belliveau,Kennedy, Jr. et al., 1991;Kim, Ashe et al., 1993;Hinke, Hu et al., 1993;Rao, Binder et al.,1993;Rueckert, Appollonio et al., 1994). Recently, a significant push for improving the spatialresolution of fMRI has allowed mapping of elemental functional units in the cortex, such as
Correspondence to: Afonso C. Silva, Ph.D. Head, Cerebral Microcirculation Unit Laboratory of Functional and Molecular Imaging 10Center Drive, 10/B1D118 Bethesda, MD 20892−1065 USA Tel: 301−402−9703 Fax: 301−480−2558 E-Mail: [email protected] present address: Department of Radiology Samsung Medical Center Sungkyunkwan University School of Medicine 50 Ilwon-DongKangnam-Gu Seoul 137−200, Korea Tel: +82−02−3410−6459 Fax: +82−010−9933−6459 E-Mail: [email protected] present address: Molecular Imaging Center National Institute of Radiological Sciences Anagawa 4−9−1, Inage, Chiba, 263−8555Japan Tel: +81−43−206−4716 Fax: +81−43−206−4079 E-Mail: [email protected]'s Disclaimer: This is a PDF file of an unedited manuscript that has been accepted for publication. As a service to our customerswe are providing this early version of the manuscript. The manuscript will undergo copyediting, typesetting, and review of the resultingproof before it is published in its final citable form. Please note that during the production process errors may be discovered which couldaffect the content, and all legal disclaimers that apply to the journal pertain.
NIH Public AccessAuthor ManuscriptJ Neurosci Methods. Author manuscript; available in PMC 2009 January 30.
Published in final edited form as:J Neurosci Methods. 2008 January 30; 167(2): 246–257.
NIH
-PA Author Manuscript
NIH
-PA Author Manuscript
NIH
-PA Author Manuscript
individual digits in motor/somatosensory cortex (Kurth, Villringer et al., 2000), oculardominance columns in the visual cortex (Kim, Duong et al., 2000;Goodyear and Menon,2001;Cheng, Waggoner et al., 2001), individual whisker barrels (Yang, Hyder et al., 1996),and laminae of the olfactory bulb (Kida, Xu et al., 2002) and somatosensory cortex (Silva andKoretsky, 2002) in rodents. In addition to fMRI, anatomical MRI techniques have also beenused to obtain architectural information in the brain. For example, diffusion tensor imaginghas provided probabilistic maps of cortical areas based on connections from the thalamus(Wiegell, Tuch et al., 2003). Direct detection of cortical myelin using MRI has beendemonstrated in humans and non-human primates (Barbier, Marrett et al., 2002;Walters, Eganet al., 2003) and is proving useful for classical myeloarchitectural approaches to delineateboundaries between cortical regions non-invasively. Increasing the number of anatomical MRItools that enable detection of cytoarchitectural boundaries would be very important for furtherincreasing the specificity of MRI as well as comparing anatomical to functional boundariesunder various conditions.
The manganese ion has been shown to be a very useful MRI contrast agent for studying thebrain – for a review see (Lee and Koretsky, 2004;Silva, Lee et al., 2004;Pautler, 2006;Bockand Silva, 2007). Due to the ability of Mn2+ to enter cells through voltage-gated calciumchannels, manganese-enhanced MRI (MEMRI) can be used to demarcate active regions of thebrain (Lin and Koretsky, 1997;Duong, Silva et al., 2000;Aoki, Tanaka et al., 2002;Yu,Wadghiri et al., 2005;Yu, Sanes et al., 2007;Weng, Chen et al., 2007). Further, when injectedto a specific brain region, Mn2+ will move along appropriate neuronal pathways in ananterograde fashion, thus enabling MEMRI to be used to trace neuronal connections in theliving brain directly (Pautler, Silva et al., 1998;Saleem, Pauls et al., 2002;Van der, Verhoye etal., 2002;Pautler, Mongeau et al., 2003). Combining the activity-based accumulation ofMn2+ with its tract-tracing properties enables unique mapping of functional connectivity withMEMRI (Pautler and Koretsky, 2002). Furthermore, systemic administration of Mn2+ hasopened up new MRI-based strategies for enhancement of the brain neuroarchitecture (Natt,Watanabe et al., 2002;Watanabe, Natt et al., 2002;Aoki, Wu et al., 2004;Wadghiri, Blind etal., 2004;Watanabe, Frahm et al., 2004;Lee, Silva et al., 2005). Systemic administration ofMn2+ leads to unique MRI enhancement in specific areas of the brain. In particular, MEMRIhas been shown to be sensitive to cytoarchitecture, such as lamination in hippocampus,cerebellum, olfactory bulb, retina, and cortex (Watanabe, Natt et al., 2002;Aoki, Wu et al.,2004;Lee, Silva et al., 2005). The ability to detect cortical and cerebellar laminae has been usedto analyze changes that occur in cerebral architecture due to specific mutations in the mousebrain (Wadghiri, Blind et al., 2004;Angenstein, Niessen et al., 2006). In most brain regions,lamination detected by MEMRI could be readily assigned by visual inspection. However, incerebral cortex, a rigorous assignment of the laminae has proven difficult due to the subtleMEMRI contrast in cortex and due to the stringent requirements for high-resolution imaging.
The overall goal of the present work was to investigate the potential of MEMRI in the studyof cortical cytoarchitectonics. While cortical cytoarchitecture has been widely studied via postmortem histology, in situ imaging of cortical cytoarchitecture would allow dynamic trackingof neuroarchitectonical changes and hence enable longitudinal investigation of such changesduring development, learning, and plasticity. To investigate whether the variation in cellulardensity, size and activity in cortical laminae dictate MEMRI contrast, high-resolution MEMRIof the rodent brain were obtained and compared to conventional tissue histology, as well tohistology from tracing intrinsic cortico-cortical and cortico-thalamic projecting neurons.Furthermore, to probe whether lack of lamination leads to no MEMRI contrast in cortex,MEMRI of the reeler mouse, a well studied mutant which lacks normal cortical lamination,was obtained and compared to MEMRI contrast in control wild-type mice. Finally, to testwhether tracing of functional neuronal tracts leads to spatial variation in the MEMRI signal,cortex was imaged after Mn2+ injection in the ventroposterior nucleus of thalamus. The results
Silva et al. Page 2
J Neurosci Methods. Author manuscript; available in PMC 2009 January 30.
NIH
-PA Author Manuscript
NIH
-PA Author Manuscript
NIH
-PA Author Manuscript
indicate that MEMRI contrast is driven by the spatial variations in cellular density, size, andactivity so that MEMRI may thus be used as a highly sensitive in vivo technique for trackingcortical cytoarchitectonics.
MethodsAll experiments were carried out in accordance with the National Institutes of Health Guidefor the Care and Use of Laboratory Animals, and approved by the NINDS/NIDCD ACUC.The experiments portrayed in the present work consisted of three distinct protocols performedin different cohorts of animals, described below:
Systemic MnCl2 AdministrationFor systemic infusions of MnCl2, nine adult male Sprague-Dawley rats (175 − 200 g), ten adultfemale reeler mice (17 − 23 g) and ten age- and sex-matched control mice (25 − 28 g) wereutilized. An isotonic solution of MnCl2·4H2O (Sigma-Aldrich, St. Louis, MO) was preparedin distilled water at a concentration of 120 mM, as previously described (Silva, Lee et al.,2004). Twenty-four hours prior to MRI, the animals were anesthetized by breathing 2 %isoflurane into oxygen-enriched air. The rectal temperature was carefully monitored andmaintained at 37 °C. For rats, a 27 gauge butterfly needle was carefully inserted in the lateraltail vein and checked for patency. In mice, a 30 gauge needle, connected to PE-10 tubing wasutilized. MnCl2 was administered through a tail vein line at a dose of 175 mg/kg (884.3 μmol/kg), which has previously been demonstrated to be well-tolerated by rats (Aoki, Wu et al.,2004) and mice (Lee, Silva et al., 2005) with minimal side-effects. The solution was infusedat a rate of 1.8 mL/hr for rats, and 250 μL/hr for mice (Silva, Lee et al., 2004). The animalswere recovered by breathing room air and returned to their cage, with free access to food andwater. The animals were re-anesthetized 24 hours later and set into an MR-compatible cradlefor MRI.
Stereotaxic injections of anatomical tracer into brain and MnCl2 into VentricleThree adult male Sprague-Dawley rats (175 − 200 g) were anesthetized with 2% isoflurane.Their heads were carefully secured to a stereotaxic frame (Kopf Instruments), the scalp wasremoved and the skull exposed. In two animals, a 1 mm drill bit was used to make a small burrhole over the forepaw region of primary somatosensory cortex (S1FL) at 0.0 mm anterior and3 mm lateral to bregma. Biotin-conjugated dextran amine (BDA, 10% in distilled water), ananterograde neuronal tracer (Brandt and Apkarian, 1992;Veenman, Reiner et al., 1992), wasinjected under pressure using a 2.5 μL Hamilton microsyringe at approximately 0.05 μL/mininto S1FL (2.3 mm ventral to bregma) without any manganese added to the solution.[ACS2]In another animal, 0.5 μL BDA was injected into the orofacial representation of thesomatosensory pathway, the VPM nucleus of thalamus (coordinates: −3.1 mm anterior, 3.0mm lateral, 6.0 mm ventral to bregma (Paxinos and Watson, 1998)). To ensure fast uptake ofmanganese into the brain following tracer injection, 15 μL of a 30 mM solution of MnCl2 wasdirectly, but slowly infused into the 3rd ventricle (coordinates: −4.2 mm anterior, 0.0 mmlateral, 5.0 mm ventral to bregma (Paxinos and Watson, 1998)) at 15 μL/hr (total infusion timewas 1 hour). After injections, all openings in the skull were sealed with bone wax and the scalpwas sutured back in place. Isoflurane was discontinued and the animals were given anintramuscular injection of ketoprofen (5 mg/kg) and were carefully monitored during recoveryfrom anesthesia and throughout the survival time. In these animals, MEMRI was performed 3− 4 days after injection of BDA and MnCl2, to allow BDA, a slow anterograde tracer (Bilgen,Dancause et al., 2005), to travel from the injection site, either in VPM or in S1FL, to the targetsite in S1FL.[ACS3]
Silva et al. Page 3
J Neurosci Methods. Author manuscript; available in PMC 2009 January 30.
NIH
-PA Author Manuscript
NIH
-PA Author Manuscript
NIH
-PA Author Manuscript

Stereotaxic injections of MnCl2 into ThalamusFifteen adult male Sprague-Dawley rats (175 − 200 g) were anesthetized with 2 % isoflurane,orally intubated and mechanically ventilated. Their heads were carefully secured to astereotaxic frame (Kopf Instruments), the scalp was removed and the skull exposed. A 1 mmdrill bit was used to make two small burr holes 3 mm posterior and ± 3 mm lateral to bregma.A 300 μm infusion cannula was lowered 6 mm into the brain, and 200 nL of 10 − 60 mMisotonic MnCl2 solution was delivered into the expected location of the ventroposteromedial(VPM) and ventroposterolateral (VPL) nuclei of thalamus. The infusion cannula was slowlyremoved and the burr holes were sealed with bone wax. The animals were allowed to recoverfrom the isoflurane anesthesia and returned to their cages. Twelve to sixteen hours followingthe intra-thalamic injection of MnCl2, the animals were re-anesthetized with isoflurane and setinto an MR-compatible cradle for MRI.
MEMRIAll MRI experiments were performed in a horizontal 11.7T/31 cm magnet (Magnex Scientific,Ltd., Oxford, UK), equipped with a 9 cm actively shielded gradient capable of generating 30G/cm in 80 μs (Resonance Research Inc, Billerica, MA), and interfaced to a Bruker AvanceMRI console (Bruker-Biospin, Billerica, MA). Animals were anesthetized under 2% isofluranemixed in their breathing air, and set in an MR-compatible cradle. Their heads were secured ina custom-made stereotaxic frame consisting of ear pieces and a bite bar. Rectal temperaturewas monitored and maintained at 37.5 °C by means of a heated water blanket. A standardinversion-recovery, multi-slice T1-weighted spin-echo sequence (TR/TE/TI=4000/7.68/1100ms, in-plane resolution: 100 × 100 μm2, slice thickness: 1000μm) was used to evaluate contrastand identify regions enhanced by Mn2+. High-resolution 3D-MEMRI, spin-echo T1-weighted(TR/TE=300/8.8 ms, 100 μm isotropic resolution for mice and 200 μm for rats) was used tofollow Mn2+ in the somatosensory cortex. T1 maps were obtained using a Look-Lockersequence as previously reported (Chuang and Koretsky, 2006).
Tissue HistologyAfter the MEMRI scans were performed, the animals were sacrificed and perfusedtranscardially with phosphate buffered saline wash (pH 7.4), followed by 4%paraformaldehyde fix. The brains were carefully removed from the skull, stored overnight at4 °C and sent for histological sectioning and processing (American Histo Labs, Gaithersburg,MD). Serial 15 μm[ACS4]-thick coronal slices comprising the area rostral of the posteriorcommissure (rats: ∼5 mm caudal to bregma; mice: ∼3 mm caudal to bregma) to the middle ofthe anterior commissure (rats and mice: ∼0 mm caudal to bregma) were stained withhematoxylin-eosin (H&E). The sections were mounted on glass slides and digitized intoTagged Image Format (TIF) files using a calibrated microscope (MZ FL III, Leica, Germany).
For visualizing the location of cortical neurons and associated terminal processes, BDA wasinjected in three animals as explained above. After MEMRI, these animals were given a lethaldose of halothane and perfused transcardially with PBS (pH 7.4), followed by 4 %paraformaldehyde in PBS, and then followed by the fixative solution with 10% sucrose. Brainswere stored in 20% sucrose in PBS overnight before sectioning and then were cut frozen on acryostat at 40 μm thickness. Alternate series of brain sections were processed for Nisslsubstance, treated with Avidin-biotin-peroxidase (ABC-kit, Vectastain, Vector, Burlingame,CA) to reveal neurons and associated terminal processes stained by BDA.
BDA reacted sections were viewed under high magnification to identify the location of labelednerve terminals and neurons. Once the transported label was identified, the laminar positionof the transported label was identified in the adjacent Nissl stained sections. Brain sectionswere imaged by using a digital scanning camera (Hamamatsu, C4742−95) mounted on a Leica
Silva et al. Page 4
J Neurosci Methods. Author manuscript; available in PMC 2009 January 30.
NIH
-PA Author Manuscript
NIH
-PA Author Manuscript
NIH
-PA Author Manuscript

microscope (MZ FL III) and scanned with Q-capture v2.68 software (QImaging, Burnaby,Canada). Digital images were adjusted for brightness and contrast using Photoshop Elementsv2.0 software (Adobe, San Jose, CA).
Data AnalysisFor each animal, MEMRI and histological images were imported into ImageJ (NationalInstitutes of Health). Equivalent MRI and histological slices were chosen by visual inspectionusing the major outline of the brain and of internal structures such as the corpus callossum, thelateral ventricles, the interpeduncular nucleus and the hippocampus as guiding features. Oncea pair of equivalent MRI and histological slices was obtained, MRI intensity profiles acrossthe primary somatosensory (S1) cortex were computed from lines drawn perpendicular to S1at several locations (minimum of four, but typically ten profiles per cortical hemisphere peranimal) as a function of the absolute cortical thickness, measured from the beginning of thepial surface to the border between gray and white matter. The locations of the different corticallaminae were determined in the same cortical area from the corresponding histological sections.For this, the colored H&E images were converted to gray-scale, and intensity profiles wereplotted. The locations of the cortical laminae in each slice were determined by recording thecortical depth showing transitions in cell density or shape. To circumvent the effects of tissueshrinkage on the histological slices, the relative position of the cortical layers was computedwith respect to the pial surface, as well as the grey-matter to white-matter borders of the cortex,thus providing two independent reference points for the laminar position, and allowing theexpression of those distances in proportion to the cortical thickness.
Statistical data analysis was performed using non-parametric uni- and multi-variate analysisof variance (ANOVA) with repeated measures, followed by post-hoc Bonferroni correctionsfor multiple comparisons. Statistical significance was set at P < 0.05.
ResultsFigure 1 shows typical sagittal, horizontal and coronal views from 3-D T1-weighted data setsof a wild-type mouse (Fig. 1A) and of a rat (Fig. 1B), 24 hours following a systemic injectionof MnCl2. The manganese-enhanced structures are well visualized in all 3D orientations. Bothin mouse as well as in rat, the contrast enhancement of the brain anatomy is evident, and showsdetails of the neuroarchitecture due to the presence of Mn2+ in many regions of the rodentbrain, such as the hippocampus and its sub-regions CA1, CA2, CA3, dentate gyrus (DG) andthe fimbria (fi); pituitary gland (Pit); cerebellum (CEB); interpeduncular nucleus (IP); thehabenula (Hb); and olfactory bulb (OB), in agreement with previous studies (Watanabe, Nattet al., 2002;Aoki, Wu et al., 2004;Lee, Silva et al., 2005). In the sagittal view, the CEB showsexcellent gray-white matter contrast, together with Pit and DG. The horizontal sections showenhancement of periventricular zones, the CA1, CA2, CA3 and fi, the arrowhead of DG, andlayers of OB. In the coronal view, the hippocampus is enhanced with clear delineation of theCA3 and the DG regions. The sagittal and horizontal views show enhanced contrast in DG andCA3, but lesser contrast in CA1, in agreement with previous reports (Watanabe, Radulovic etal., 2004;Aoki, Naruse et al., 2004). The Pit is well depicted both on the coronal as well as onthe sagittal views, and Mn2+ allows clear separation of the posterior (PPit), intermediate (IPit),and anterior (APit) lobes.
Figure 2 shows multi-slice T1-weighted MRI along three orthogonal views of the rat brain.Images were acquired at 100 × 100 × 1000 μm3 spatial resolution. As previously reported(Aoki, Wu et al., 2004), enhancement of the cortex 1 day after administration of MnCl2 is quiteheterogeneous. In all three views, bright stripes can be observed along the cortex, indicatingthe higher accumulation of Mn2+ along a laminar pattern running throughout the entire lengthof the cortex. In control animals that did not receive MnCl2, no evidence of such lamination
Silva et al. Page 5
J Neurosci Methods. Author manuscript; available in PMC 2009 January 30.
NIH
-PA Author Manuscript
NIH
-PA Author Manuscript
NIH
-PA Author Manuscript

could be observed (data not shown). Usually two main bright stripes could be seen runningalong the cortex, as indicated by the arrows in Fig. 2. Interestingly, the thickness and contrastof such stripes varied according to the rostro-caudal and midline-lateral coordinates of thecortex. In the rostro-caudal direction, the stripes were brighter and thinner 3−5 mm caudal tobregma, but thicker yet fainter 1−3 mm rostral to bregma (see panels in Fig. 2A, but alsocompare two leftmost to two rightmost panels in Fig. 2C). In the midline-lateral direction, thestripes were thinner close to midline and thicker 3−5 mm lateral from midline (Fig. 2C). In thethree rightmost panels in Fig. 2C, there was a transition from the thick stripes to the thinnerstripes at what seems to be the border between S1 and M1 (dashed lines). This was a consistentfinding across all nine rats studied. In addition to the two major bright stripes in the cortex, athird thin stripe of elevated signal intensity could also be observed next to the corpus-callossum,the major white matter track. Detection of this third stripe of contrast was more apparent in thecoronal views (Fig.2C, arrowheads) than in the sagittal or the horizontal views.
To establish the anatomical location of the MRI bright stripes with respect to the corticalanatomy, a comparison with tissue histology was performed. The pyramidal cells in layer Vof primary somatosensory cortex (S1) were labeled with BDA in a subset of rats, whileMn2+ was injected into the 3rd ventricle. MEMRI images were acquired 3−4 days later. BDAis an anterograde tracer that has been shown to be readily transported over long distances inthe brain, allowing a detailed visualization of labeled axons and axonal terminals (Brandt andApkarian, 1992;Veenman, Reiner et al., 1992). Figure 3 shows the location of BDA-labeledneurons in the orofacial cortex of S1 (Fig. 3A). The injection site is not visible in Fig. 3. TheBDA-stained neurons were identified and circled at high magnification (Fig. 3B), and theirrelative position was overlaid on the corresponding 2D coronal view from a 3D MEMRI image(Fig. 3C). The location of the BDA-labeled neurons that send out cortico-cortical intrinsic,horizontal connections in layer V matched the high MEMRI contrast in the middle of the cortex.An additional experiment was performed in a separate animal, in which the VPM nucleus ofthalamus was injected with BDA. Figure 4 shows the results of this experiment. In addition tolabeling cell bodies of cortico-thalamic projecting neurons in the bottom of layer V and top oflayer VI (Fig. 4B, middle, arrowheads), BDA stained thalamo-cortical terminals in layers III-IV (Fig. 4B, middle, arrow). Comparison of the BDA histological slice (Fig. 4B, middle) withthe MEMRI image (Fig. 4B, right) shows that the thalamo-cortical terminals at the borderbetween layers III/IV corresponded to a dark band in the MEMRI image, while the cortico-thalamic projecting neurons at the border between layers V/VI also corresponded to the darkregion between the bright middle and bottom stripes in the MEMRI image.
To establish a more formal relationship between the laminated MEMRI contrast and the corticallaminae, H&E slices obtained post-mortem in 9 rats were compared to their correspondingMEMRI after systemic administration of MnCl2, as shown in Fig. 5. Based on H&E histology,the location of the cortical laminae over primary somatosensory cortex (S1) was determinedin each animal (Fig. 5A). Line profiles perpendicular to S1 were obtained from correspondingcoronal MEMRI (Fig. 5B), and plotted as a function of the absolute cortical depth. Fig.5Cshows the average signal intensity profile from MEMRI across the cortex as a function ofcortical depth (n=9 rats, 10 profiles per rat). The horizontal axis in Fig. 5C shows the absolutecortical depth measured from the MEMRI. There was little inter-subject variation in corticalthickness. The hatched bars indicate the mean histological location of the cortical laminae,averaged across the different rats. There was a significant effect of the absolute cortical depthon the MEMRI signal intensity in S1 (F[21, 176] = 82.01, P < 0.001). The signal intensity inlayer I was significantly lower than in all the other layers (P < 0.001). When data from layer Iis removed from the analysis, the MEMRI signal intensity in layers II-VI still variedsignificantly as a function of the cortical depth (F[19, 160] = 18.924, P < 0.001). The signalintensity profile shows the two major cortical bands of increased contrast are located in layerII (peak cortical depth 300 μm) and in the transition between layers IV and V (peak cortical
Silva et al. Page 6
J Neurosci Methods. Author manuscript; available in PMC 2009 January 30.
NIH
-PA Author Manuscript
NIH
-PA Author Manuscript
NIH
-PA Author Manuscript
depth 1100 μm), P < 0.005 versus the other cortical depths. The signal intensity profile alsoshowed a trend towards a third peak at cortical depth 1900 μm corresponding to cortical layerV1b. However, the intensity was not significantly different than that at depth 600 μm or atdepth 1500 μm (P > 0.2), possibly because this third peak was narrow (usually only 1 pixelwide). This is consistent with the observation that it could only be qualitatively detected incoronal views.
To provide additional support that Mn2+ is marking cortical laminae, systemic Mn2+ was usedfor MEMRI in reeler mice (rl/rl), a spontaneous mutant mouse that shows abnormal corticalorganization and lamination (Caviness, Jr., 1976). Figure 6 shows coronal T1-weighted imagesfrom a reeler mouse (bottom row) and from a control mouse with the same genetic background(top row). Cortical laminae are clearly visible in the control mouse (arrows), but not in thereeler mouse, even though Mn2+ was clearly present in the brain, as seen in the hippocampusand pituitary of the reeler mouse. Figure 7 shows the H&E histology (Fig. 7A) and the MEMRIlaminar profile for an individual control mouse (Fig. 7B). Normal cortical lamination is evidentin the form of different cellular densities in the H&E histological section, and in the form ofalterations in contrast through the cortical depth in the MEMRI image. Figure 7C shows a plotof the mean cortical MEMRI signal intensity profile versus the absolute cortical depth, withhashed bars corresponding to cortical layers as detected by the H&E histological sections. Asin the MEMRI profile shown for the rat in Fig. 5C, there was a significant effect of the absolutecortical depth on the MEMRI signal intensity in S1 (F[18, 35] = 17.324, P < 0.001). The signalintensity in layer I was significantly lower than in all the other layers (P < 0.001). When datafrom layer I is removed from the analysis, the MEMRI signal intensity in layers II-VI stillvaried significantly as a function of the cortical depth (F[14, 30] = 4.054, P < 0.001), andsignificant peaks were detected in layers II-III (peak cortical depth 225 μm) and IV-V (peakcortical depths 525 − 675 μm), P < 0.01 versus the other cortical depths. Furthermore, therewas a trend to decreased average MRI signal intensity in wild-type mouse cortex duringprogression from layer II to VI (Fig. 7C), similar to the trend shown for rats in Fig. 5C.
Figure 8 shows data obtained from reeler mice. In the histology (Fig. 8A), the reeler cortexclearly lacks laminar differentiation in cellular density, as it has been well established in thismodel (Caviness, Jr., 1976;Silva, Gutnick et al., 1991). Accordingly, MEMRI of the reelermouse showed no contrast in cortex (Fig. 8B). Figure 8C shows a plot of the mean MEMRIsignal intensity across S1 of reeler mice as a function of the absolute cortical thickness.Interestingly, the cortical thickness in reeler mice was not different than in the control mice.The overall signal enhancement in the cortex of reeler mice was not statistically different thanin the control mice (F[1, 92] = 0.308, P > 0. 58). However, in reeler mice the contrast below75 μm was flat with no significant peaks or valleys (F[14, 45] = 1.216, P > 0.3, Fig. 8C). Thisprovides strong evidence suggesting the contrast variation in cortical areas is related to laminae-specific differences in cortex of normal rats and mice, because these variations are not presentin the abnormally formed cortex of reeler mice. Interestingly, contrary to the plots shown inFigs. 5C and 7C, in reeler mice there was no trend to decreased signal intensity duringprogression from the pial surface to deep in the cortex (Fig. 8C), and the signal enhancementdeep in the cortex of reeler remained elevated as compared to wild-type (F[1, 75] = 8.191, P< 0.005).
The above results enabled assignment of the contrast detected with systemic injections ofMnCl2, and indicate that MEMRI can be used to identify cortical laminae. To test whetherneuronal tract tracing with MEMRI also shows specificity with respect to cortical laminae,stereotaxic MnCl2 injections were performed into thalamus. It has been established that themajority of projections from thalamus to somatosensory cortex are into layer IV (Wise andJones, 1978;Herkenham, 1980). Local application of MnCl2 has been used by a number ofgroups to trace neuronal networks in a variety of systems (Pautler, Silva et al., 1998;Pautler
Silva et al. Page 7
J Neurosci Methods. Author manuscript; available in PMC 2009 January 30.
NIH
-PA Author Manuscript
NIH
-PA Author Manuscript
NIH
-PA Author Manuscript
and Koretsky, 2002;Saleem, Pauls et al., 2002;Van der, Verhoye et al., 2002;Pautler, Mongeauet al., 2003;Murayama, Weber et al., 2006). Thus, it was hypothesized that Mn2+ injected intothe ventro-posterior-lateral (VPL) nucleus of thalamus would enhance primarily cortical layerIV. Figure 9A shows consecutive coronal T1-weighted images of a rat that was injected with200 nL of 60 mM MnCl2 into the left VPL. Enhancement of the thalamo-cortical pathway isclearly visible, in the form of hyper-enhancement of the injection site (thick arrow in left-mostpanel in Fig. 9A). This enhanced signal slowly dilutes into the corpus callossum and enhancesthe mid-laminae in somatosensory cortex. Fig. 9B shows the corresponding T1 maps obtainedfrom the same rat. Contrary to the T1-weighted images in Fig. 9A, areas rich in Mn2+ appeardark in the T1 maps due to the shortening of the relaxation time. Cortical enhancement due tothe tracing of thalamo-cortical connections by Mn2+ could be better observed in the T1 mapimages (Fig. 9B, arrows), where a thin band of shortened T1 could be detected at a depth of600 − 700 μm bellow the pial surface, at the expected anatomical location for lamina IV. In afew animals, tracing to the amygdala were visible as well (data not shown).
DiscussionThere is increasing interest in using MEMRI to analyze anatomy, function, and connectivityin vivo in the brain of a variety of animal models (Lin and Koretsky, 1997;Pautler, Silva et al.,1998;Duong, Silva et al., 2000;Saleem, Pauls et al., 2002;Van der, Verhoye et al., 2002;Aoki,Wu et al., 2004;Lee, Silva et al., 2005;Yu, Wadghiri et al., 2005;Chuang and Koretsky,2006;Yu, Sanes et al., 2007;Weng, Chen et al., 2007). These experiments rely on the interestingbiological properties of manganese to enter excitable cells in an activity dependent manner, tobe transported in an anterograde direction along appropriate neural pathways in the brain, andto eventually equilibrate in brain regions in a way that leads to unique anatomical contrast withMRI. The ability to use MEMRI to measure regional activity in the brain, regional connectivityin the brain and a large amount of anatomical information has helped to expand the scope ofMRI and established manganese as very useful molecular imaging agent. The major advantagesof MEMRI over other MRI techniques aimed at enhancing the brain cytoarchitecture are theimproved positive contrast associated with regions of high cellular density and/or highfunctional activity. However, it is not yet clear to what level of organization in the brain thatdata from MEMRI will be specific. There is evidence that the activity-dependent properties ofMEMRI is specific for major brain areas (Lin and Koretsky, 1997;Duong, Silva et al.,2000;Aoki, Tanaka et al., 2002) and there is preliminary evidence that MEMRI can detectspecific columns in rodent sub-cortical and cortical areas (Yu, Wadghiri et al., 2005;Yu, Saneset al., 2007), as well as specific glomeruli in the olfactory bulb (Chuang, Lee et al., 2006) andlayers in the retina (Berkowitz, Roberts et al., 2006).
Recently, it has been demonstrated that systemic MEMRI has specificity for layers in differentbrain regions. Indeed, layers have been detected with MEMRI in olfactory bulb, hippocampus,cerebellum, retina, and cortex (Watanabe, Natt et al., 2002;Aoki, Wu et al., 2004;Lee, Silva etal., 2005;Berkowitz, Roberts et al., 2006). In most of these regions, it was straightforward toassign contrast to specific layers, by comparing MEMRI contrast to an atlas. Invariably, suchcomparison has shown that MEMRI contrast follows standard histochemical and anatomicalboundaries. However, this was not the case for laminar contrast detected in the rodent cortex.In the present work, contrast variation in the cortex was directly compared to cortical laminaeas assigned from the histological markers (Nissl and BDA) used. Our data indicate that thelocation of the two cortical bands with highest MEMRI signal intensity coincided with mid-layer II and the transition zone from mid-layer IV to mid-layer V. While not statisticallysignificant, there was trend to a third increase in intensity in layer VIb. Thus, at least insomatosensory cortex, there is no direct correspondence between contrast detected fromMEMRI and a histochemical definition of cortical layers, indicating the nature of the MEMRIcontrast is not fully dictated by cellular density alone. One shortcoming of the comparison was
Silva et al. Page 8
J Neurosci Methods. Author manuscript; available in PMC 2009 January 30.
NIH
-PA Author Manuscript
NIH
-PA Author Manuscript
NIH
-PA Author Manuscript

that it was assumed that any anatomical distortion that occurred due to fixation of the brainoccurred uniformly throughout the cortex.
It is not clear why the contrast in MRI after systemic application of manganese leads to suchinteresting anatomical information. In the case of changes in contrast along the cortex thiscould be due to differences in cell density, differences in activity, or differences in connectivity.All of these factors could affect manganese distribution and all of these vary with cortical depth.Manganese can be transported like – and has affinity for – calcium, iron, and zinc sites(Aschner, 2006;Aschner and Dorman, 2006), which means the manganese distribution may bereporting on the affinity of these ions for different brain regions. Finally, specific manganesetransport processes are beginning to be identified which may dictate the distribution found insystemic MEMRI experiments.
Proof that the distribution of contrast in MEMRI across the cortex is dependent on normalcortical architecture comes from the results on reeler mutant mice. Reeler has been well studiedand is known to have a disorganized cortical structure (Caviness, Jr., 1976). Indeed there isevidence of inversion of some cell types in the reeler cortex (Caviness, Jr., 1976). Interestingly,the signal enhancement deep in the cortex of reeler remained elevated (Fig. 8C) as comparedto wild-type (Fig. 7C), which is consistent with an inversion of the cortical laminae. However,the major feature of the reeler cortex is the lack of well-defined lamination, as can be clearlyseen in the histology in Figure 8A. This genetic disorganization of cortical laminar structurewas reflected in the MEMRI. In contrast with the intensity profiles shown in rat cortex in Fig.5C and in wild-type control mice in Fig. 7C, the MEMRI profile in reeler mutants showed nosignificant peaks in signal intensity (Fig. 8C). The ability of systemic MEMRI to rapidly assesscortical architecture should be useful in analyzing other mouse mutants. Recently, MEMRIapplied to the bassoon mouse mutant also detected an increase in contrast deep in cortex, whichwas related to cortical structural changes in this mouse mutant (Angenstein, Niessen et al.,2006), however, no attempt to assign the contrast to specific layers was made in this mutant.
One drawback of the use of MEMRI to reveal the fine details of the brain cytoarchitecture isthat the transport of Mn2+ across the blood-brain barrier is significantly limited compared totransport across the choroid plexus (Murphy, Wadhwani et al., 1991), forcing the use ofsignificantly high doses in order to cause appreciable amounts of Mn2+ to accumulate in thecortex. This raises the concern of toxicity effects (Silva, Lee et al., 2004;Bock and Silva,2007) that may detract from the usefulness of the technique. Previously, we demonstrated thatcortical lamination of the rodent cortex with MEMRI could only be detected at doses of 88mg/kg, and improved with the doses of 175 mg/kg used in the present work (Lee, Silva et al.,2005), the maximum single dose tested by us thus far (Aoki, Wu et al., 2004;Lee, Silva et al.,2005). We are currently working on alternative ways to deliver Mn2+ systemically to improvecontrast in the brain, while minimizing the toxic effects of acute exposure.
The ability of systemic MEMRI to distinguish layers in cortex as well as in olfactory bulb,hippocampus, and cerebellum indicates that MEMRI is likely to be specific to layers as wellwhen used to probe brain activity or to trace neuronal tracts. Preliminary evidence indicatesthat during the time when manganese is entering olfactory bulb, there is a layer-specificincrease in contrast that evolves over time (Lee, Silva et al., 2005). In the present work, tracingfrom the thalamus to the cortex occurred in a layer-specific and appropriate manner. Themajority of connections from thalamus to somatosensory cortex enter in layer IV (Wise andJones, 1978;Herkenham, 1980). A thin band of contrast in layer IV could be detected atapproximately 12−16 hours after stereotaxic injection of manganese into thalamus (Fig. 9).This result, combined with the earlier work in olfactory bulb, indicates tracing of neuralconnections can be done with laminar specificity as long as care is taken to image at appropriatetimes during the tracing experiments. We are currently working on optimizing the imaging
Silva et al. Page 9
J Neurosci Methods. Author manuscript; available in PMC 2009 January 30.
NIH
-PA Author Manuscript
NIH
-PA Author Manuscript
NIH
-PA Author Manuscript

timing following MnCl2 injections to detect the progressive enhancement of the laminararchitecture.
One of the most interesting aspects of using MEMRI to detect cytoarchitecture will be indelineating anatomical boundaries in individual animals to enable studying changes, in vivoand longitudinally, that might occur due to development, learning, and plasticity. Furthermore,it will be important to compare anatomical to functional boundaries in these various models.An important way to distinguish anatomical boundaries using histology is to look for transitionsin cortical layer thickness (for a review, see (Jones, 1990)). It is clear from looking at MEMRIimages from the rat brain (Fig. 2), that there are transitions in cortical contrast. There is aneasily discernible transition between somatosensory cortex and motor cortex, where it is knownthat there is a shift up in the position of layer V to a more superficial location in the motorcortex due to an increased thickness of layer V (Donoghue and Wise, 1982;Broadmann andGarey, 2005). Precise comparison of the changes in MEMRI contrast in different corticalregions with histology should enable determining which regions can be characterized usingMEMRI based laminar cytoarchitecture. As well, systemic MEMRI may be useful in detectingthe changes in cytoarchitecture elicited by specific insults to the brain, such as the selectiveneuronal damage in the fragile CA1 and CA4 regions of hippocampus following resuscitationfrom cardiac arrest (White, Grossman et al., 1996). We are currently working on developinga rat model of cardiac arrest, in which we will use MEMRI to follow both the morphologicaland functional changes in hippocampus and cortex in the intact brain in vivo (Aoki, Mori etal., 2004).
In conclusion, variations in contrast through the depth of the rodent cortex after systemicadministration of manganese can be assigned to specific cortical layers. Two major peaks insignal intensity occur in somatosensory cortex, which correspond to mid-layer II and thetransition between layers IV and V. These variations in contrast are eliminated in the reelermutant mouse, which is known to have abnormal cortical organization. Finally, specificcontrast representing the input from thalamus into layer IV of somatosensory cortex can bedetected after stereotaxic injection into thalamus. These results indicate that MEMRI will bespecific for cortical laminar cytoarchitecture, making it useful for getting histologicalinformation non-invasively in individual animals.
Acknowledgements
The authors would like to acknowledge the skillful technical assistance of Ms. Torri Wilson, and the invaluablecomments and advice of Dr. Steve P. Wise. This research was supported by the Intramural Research Program of theNIH, NINDS.
ReferencesAngenstein F, Niessen HG, Goldschmidt J, Lison H, Altrock WD, Gundelfinger ED, Scheich H.
Manganese-Enhanced MRI Reveals Structural and Functional Changes in the Cortex of BassoonMutant Mice. Cereb Cortex. 2006
Aoki, I.; Mori, Y.; Umeda, M.; Ebisu, T.; Fukunaga, M.; Naruse, S.; Tanaka, C. Detection of neuraldamage in the hippocampus CA1 region using manganese-enhanced MRI (MEMRI) in a cardiac arrestmodel; Proceedings of the ISMRM Eleventh Scientific Meeting and Exhibition; Kyoto, Japan. 2004;p. 22
Aoki I, Naruse S, Tanaka C. Manganese-enhanced magnetic resonance imaging (MEMRI) of brainactivity and applications to early detection of brain ischemia. NMR Biomed 2004;17:569–80.[PubMed: 15617055]
Aoki I, Tanaka C, Takegami T, Ebisu T, Umeda M, Fukunaga M, Fukuda K, Silva AC, Koretsky AP,Naruse S. Dynamic activity-induced manganese-dependent contrast magnetic resonance imaging(DAIM MRI). Magn. Reson. Med 2002;48:927–33. [PubMed: 12465100]
Silva et al. Page 10
J Neurosci Methods. Author manuscript; available in PMC 2009 January 30.
NIH
-PA Author Manuscript
NIH
-PA Author Manuscript
NIH
-PA Author Manuscript

Aoki I, Wu YJ, Silva AC, Lynch RM, Koretsky AP. In vivo detection of neuroarchitecture in the rodentbrain using manganese-enhanced MRI. Neuroimage 2004;22:1046–59. [PubMed: 15219577]
Aschner M. The transport of manganese across the blood-brain barrier. Neurotoxicology 2006;27:311–4. [PubMed: 16460806]
Aschner M, Dorman DC. Manganese : pharmacokinetics and molecular mechanisms of brain uptake.Toxicol Rev 2006;25:147–54. [PubMed: 17192121]
Barbier EL, Marrett S, Danek A, Vortmeyer A, van Gelderen P, Duyn J, Bandettini P, Grafman J, KoretskyAP. Imaging cortical anatomy by high-resolution MR at 3.0T: detection of the stripe of Gennari invisual area 17. Magn Reson. Med 2002;48:735–8. [PubMed: 12353293]
Belliveau JW, Kennedy DN, Jr. McKinstry RC, Buchbinder BR, Weisskoff RM, Cohen MS, Vevea JM,Brady TJ, Rosen BR. Functional mapping of the human visual cortex by magnetic resonance imaging.Science 1991;254:716–9. [PubMed: 1948051]
Berkowitz BA, Roberts R, Goebel DJ, Luan H. Noninvasive and simultaneous imaging of layer-specificretinal functional adaptation by manganese-enhanced MRI. Invest Ophthalmol. Vis. Sci2006;47:2668–74. [PubMed: 16723485]
Bilgen M, Dancause N, Al-Hafez B, He YY, Malone TM. Manganese-enhanced MRI of rat spinal cordinjury. Magn Reson Imaging 2005;23:829–32. [PubMed: 16214614]
Bock NA, Silva AC. Manganese: a unique neuroimaging contrast agent. Future Neurology 2007;2:297–395.
Brandt HM, Apkarian AV. Biotin-dextran: a sensitive anterograde tracer for neuroanatomic studies inrat and monkey. J Neurosci Methods 1992;45:35–40. [PubMed: 1283432]
Broadmann, K.; Garey, L. 3 ed.. Imperial College Press; London: 2005. Localisation in the cerebralcortex; p. 298
Caviness VS, Jr. Patterns of cell and fiber distribution in the neocortex of the reeler mutant mouse. JComp Neurol 1976;170:435–47. [PubMed: 1002868]
Cheng K, Waggoner RA, Tanaka K. Human ocular dominance columns as revealed by high-fieldfunctional magnetic resonance imaging. Neuron 2001;32:359–74. [PubMed: 11684004]
Chuang KH, Koretsky A. Improved neuronal tract tracing using manganese enhanced magnetic resonanceimaging with fast T(1) mapping. Magn Reson Med 2006;55:604–11. [PubMed: 16470592]
Chuang, KH.; Lee, JH.; Silva, AC.; Belluscio, L.; Koretsky, AP. Using Manganese-Enhanced MRI toreveal active olfactory circuitry in response to odorant stimuli; Proceedings of the ISMRM FourteenthScientific Meeting and Exhibition; Seattle, WA. 5−9−2006; p. 228
Donoghue JP, Wise SP. The motor cortex of the rat: cytoarchitecture and microstimulation mapping. JComp Neurol 1982;212:76–88. [PubMed: 6294151]
Duong TQ, Silva AC, Lee SP, Kim SG. Functional MRI of calcium-dependent synaptic activity: crosscorrelation with CBF and BOLD measurements. Magn. Reson. Med 2000;43:383–92. [PubMed:10725881]
Goodyear BG, Menon RS. Brief visual stimulation allows mapping of ocular dominance in visual cortexusing fMRI. Hum Brain Mapp 2001;14:210–7. [PubMed: 11668652]
Herkenham M. Laminar organization of thalamic projections to the rat neocortex. Science 1980;207:532–5. [PubMed: 7352263]
Hinke RM, Hu X, Stillman AE, Kim SG, Merkle H, Salmi R, Ugurbil K. Functional magnetic resonanceimaging of Broca's area during internal speech. Neuroreport 1993;4:675–8. [PubMed: 8347806]
Jones, EG. Determinants of the cytoarchitecture of the cerebral cortex.. In: Edelman, GM.; Gall, WE.;Cowan, WM., editors. NSI Symposium - signal and sense. Wiley-Liss, Inc.; New York: 1990. p.43-9.
Kida I, Xu F, Shulman RG, Hyder F. Mapping at glomerular resolution: fMRI of rat olfactory bulb. MagnReson. Med 2002;48:570–6. [PubMed: 12210928]
Kim DS, Duong TQ, Kim SG. Reply to “Can current fMRI techniques reveal the micro-architecture ofcortex?”. Nat. Neurosci 2000;3:414. [PubMed: 10769372]
Kim SG, Ashe J, Hendrich K, Ellermann JM, Merkle H, Ugurbil K, Georgopoulos AP. Functionalmagnetic resonance imaging of motor cortex: hemispheric asymmetry and handedness. Science1993;261:615–7. [PubMed: 8342027]
Silva et al. Page 11
J Neurosci Methods. Author manuscript; available in PMC 2009 January 30.
NIH
-PA Author Manuscript
NIH
-PA Author Manuscript
NIH
-PA Author Manuscript

Kurth R, Villringer K, Curio G, Wolf KJ, Krause T, Repenthin J, Schwiemann J, Deuchert M, VillringerA. fMRI shows multiple somatotopic digit representations in human primary somatosensory cortex.Neuroreport 2000;11:1487–91. [PubMed: 10841363]
Lee JH, Koretsky AP. Manganese enhanced magnetic resonance imaging. Curr. Pharm. Biotechnol2004;5:529–37. [PubMed: 15579042]
Lee JH, Silva AC, Merkle H, Koretsky AP. Manganese-enhanced magnetic resonance imaging of mousebrain after systemic administration of MnCl2: dose-dependent and temporal evolution of T1 contrast.Magn Reson. Med 2005;53:640–8. [PubMed: 15723400]
Lin YJ, Koretsky AP. Manganese ion enhances T1-weighted MRI during brain activation: an approachto direct imaging of brain function. Magn Reson. Med 1997;38:378–88. [PubMed: 9339438]
Murayama Y, Weber B, Saleem KS, Augath M, Logothetis NK. Tracing neural circuits in vivo with Mn-enhanced MRI. Magn Reson Imaging 2006;24:349–58. [PubMed: 16677940]
Murphy VA, Wadhwani KC, Smith QR, Rapoport SI. Saturable transport of manganese(II) across therat blood-brain barrier. J. Neurochem 1991;57:948–54. [PubMed: 1861159]
Natt O, Watanabe T, Boretius S, Radulovic J, Frahm J, Michaelis T. High-resolution 3D MRI of mousebrain reveals small cerebral structures in vivo. J. Neurosci. Methods 2002;120:203–9. [PubMed:12385770]
Pautler RG. Biological applications of manganese-enhanced magnetic resonance imaging. Methods MolMed 2006;124:365–86. [PubMed: 16506430]
Pautler RG, Koretsky AP. Tracing odor-induced activation in the olfactory bulbs of mice usingmanganese-enhanced magnetic resonance imaging. Neuroimage 2002;16:441–8. [PubMed:12030829]
Pautler RG, Mongeau R, Jacobs RE. In vivo trans-synaptic tract tracing from the murine striatum andamygdala utilizing manganese enhanced MRI (MEMRI). Magn Reson. Med 2003;50:33–9.[PubMed: 12815676]
Pautler RG, Silva AC, Koretsky AP. In vivo neuronal tract tracing using manganese-enhanced magneticresonance imaging. Magn. Reson. Med 1998;40:740–8. [PubMed: 9797158]
Paxinos, G.; Watson, C. The rat brain in stereotaxic coordinates. Fourth Edition ed.. Academic Press;San Diego, CA: 1998. p. ix-117.
Rao SM, Binder JR, Bandettini PA, Hammeke TA, Yetkin FZ, Jesmanowicz A, Lisk LM, Morris GL,Mueller WM, Estkowski LD. Functional magnetic resonance imaging of complex humanmovements. Neurology 1993;43:2311–8. [PubMed: 8232948]
Rueckert L, Appollonio I, Grafman J, Jezzard P, Johnson R, Jr. Le Bihan D, Turner R. Magnetic resonanceimaging functional activation of left frontal cortex during covert word production. J Neuroimaging1994;4:67–70. [PubMed: 8186531]
Saleem KS, Pauls JM, Augath M, Trinath T, Prause BA, Hashikawa T, Logothetis NK. Magneticresonance imaging of neuronal connections in the macaque monkey. Neuron 2002;34:685–700.[PubMed: 12062017]
Silva AC, Koretsky AP. Laminar specificity of functional MRI onset times during somatosensorystimulation in rat. Proc. Natl. Acad. Sci. U. S. A 2002;99:15182–7. [PubMed: 12407177]
Silva AC, Lee JH, Aoki I, Koretsky AP. Manganese-enhanced magnetic resonance imaging (MEMRI):methodological and practical considerations. NMR Biomed 2004;17:532–43. [PubMed: 15617052]
Silva LR, Gutnick MJ, Connors BW. Laminar distribution of neuronal membrane properties in neocortexof normal and reeler mouse. J Neurophysiol Dec;1991 66(6):2034–40. [PubMed: 1812234]1991; 66
Van der LA, Verhoye M, Van M, V, Tindemans I, Eens M, Absil P, Balthazart J. In vivo manganese-enhanced magnetic resonance imaging reveals connections and functional properties of the songbirdvocal control system. Neuroscience 2002;112:467–74. [PubMed: 12044464]
Veenman CL, Reiner A, Honig MG. Biotinylated dextran amine as an anterograde tracer for single- anddouble-labeling studies. J Neurosci Methods 1992;41:239–54. [PubMed: 1381034]
Wadghiri YZ, Blind JA, Duan X, Moreno C, Yu X, Joyner AL, Turnbull DH. Manganese-enhancedmagnetic resonance imaging (MEMRI) of mouse brain development. NMR Biomed 2004;17:613–9. [PubMed: 15761950]
Silva et al. Page 12
J Neurosci Methods. Author manuscript; available in PMC 2009 January 30.
NIH
-PA Author Manuscript
NIH
-PA Author Manuscript
NIH
-PA Author Manuscript
Walters NB, Egan GF, Kril JJ, Kean M, Waley P, Jenkinson M, Watson JD. In vivo identification ofhuman cortical areas using high-resolution MRI: an approach to cerebral structure-functioncorrelation. Proc. Natl. Acad. Sci. U. S. A 2003;100:2981–6. [PubMed: 12601170]
Watanabe T, Frahm J, Michaelis T. Functional mapping of neural pathways in rodent brain in vivo usingmanganese-enhanced three-dimensional magnetic resonance imaging. NMR Biomed 2004;17:554–68. [PubMed: 15617054]
Watanabe T, Natt O, Boretius S, Frahm J, Michaelis T. In vivo 3D MRI staining of mouse brain aftersubcutaneous application of MnCl2. Magn Reson. Med 2002;48:852–9. [PubMed: 12418000]
Watanabe T, Radulovic J, Spiess J, Natt O, Boretius S, Frahm J, Michaelis T. In vivo 3D MRI stainingof the mouse hippocampal system using intracerebral injection of MnCl2. Neuroimage 2004;22:860–7. [PubMed: 15193616]
Weng JC, Chen JH, Yang PF, Tseng WY. Functional mapping of rat barrel activation following whiskerstimulation using activity-induced manganese-dependent contrast. Neuroimage 2007;36:1179–88.[PubMed: 17537649]
White BC, Grossman LI, O'Neil BJ, DeGracia DJ, Neumar RW, Rafols JA, Krause GS. Global brainischemia and reperfusion. Ann Emerg Med 1996;27:588–94. [PubMed: 8629779]
Wiegell MR, Tuch DS, Larsson HB, Wedeen VJ. Automatic segmentation of thalamic nuclei fromdiffusion tensor magnetic resonance imaging. Neuroimage 2003;19:391–401. [PubMed: 12814588]
Wise SP, Jones EG. Developmental studies of thalamocortical and commissural connections in the ratsomatic sensory cortex. J Comp Neurol Mar 15;1978 178(2):187–208. [PubMed: 627623]187-, 1978;178
Yang X, Hyder F, Shulman RG. Activation of single whisker barrel in rat brain localized by functionalmagnetic resonance imaging. Proc. Natl. Acad. Sci. U. S. A 1996;93:475–8. [PubMed: 8552664]
Yu X, Sanes DH, Aristizabal O, Wadghiri YZ, Turnbull DH. Large-scale reorganization of the tonotopicmap in mouse auditory midbrain revealed by MRI. Proc Natl Acad Sci U S A. 2007
Yu X, Wadghiri YZ, Sanes DH, Turnbull DH. In vivo auditory brain mapping in mice with Mn-enhancedMRI. Nat. Neurosci 2005;8:961–8. [PubMed: 15924136]
Silva et al. Page 13
J Neurosci Methods. Author manuscript; available in PMC 2009 January 30.
NIH
-PA Author Manuscript
NIH
-PA Author Manuscript
NIH
-PA Author Manuscript

Figure 1.High-resolution (100 × 100 × 100 μm3), T1-weighted 3-D MRI of the rodent brain 24 hoursfollowing systemic application of MnCl2. (A) Sagittal (left), horizontal (middle) and coronal(right) views of a mouse brain, showing excellent cyto-architectonic contrast due to thepresence of Mn2+ in regions such as the hippocampus (fi, CA3 and DG), habenula (Hb)pituitary gland (Pit) and its major lobes (APit, IPit, PPit), interpeduncular nucleus (IP),cerebellum (CEB) and olfactory bulb (OB). Bars = 2 mm. (B) Corresponding views of a ratbrain. Bars = 4 mm.
Silva et al. Page 14
J Neurosci Methods. Author manuscript; available in PMC 2009 January 30.
NIH
-PA Author Manuscript
NIH
-PA Author Manuscript
NIH
-PA Author Manuscript

Figure 2.High-resolution (100 × 100 × 1000 μm3), T1-weighted multi-slice MRI of the rat brain,obtained 24 hours following systemic application of MnCl2. (A) Sagittal (B) horizontal and(C) coronal slices show bright stripes oriented along the cortex (arrows), suggesting Mn2+
differentiates cortical cells in a layer-specific manner. In the coronal view, there is a noticeabletransition from the thick stripes to the thinner stripes at what seems to be the border betweenS1 and M1 (dashed lines), as well as a third thin cortical stripe of elevated signal intensity nextto the corpus-callossum (arrowheads). Bars = 4 mm.
Silva et al. Page 15
J Neurosci Methods. Author manuscript; available in PMC 2009 January 30.
NIH
-PA Author Manuscript
NIH
-PA Author Manuscript
NIH
-PA Author Manuscript

Figure 3.(A) BDA-labeled cortico-thalamic projecting neurons in the orofacial cortex of S1. Bar = 2mm. (B) The BDA-stained neurons in the rectangular area in (A) were identified and circledat high magnification. Bar = 500 μm. (C) The relative position of the BDA-labeled neuronswas overlaid on the corresponding 2D coronal view obtained from a 3D MEMRI image. Bar= 2 mm. (D) Magnification of the rectangular area in (C) showing the correspondence betweenthe location of the BDA-labeled neurons and the higher contrast in MEMRI. Bar = 500 μm.
Silva et al. Page 16
J Neurosci Methods. Author manuscript; available in PMC 2009 January 30.
NIH
-PA Author Manuscript
NIH
-PA Author Manuscript
NIH
-PA Author Manuscript
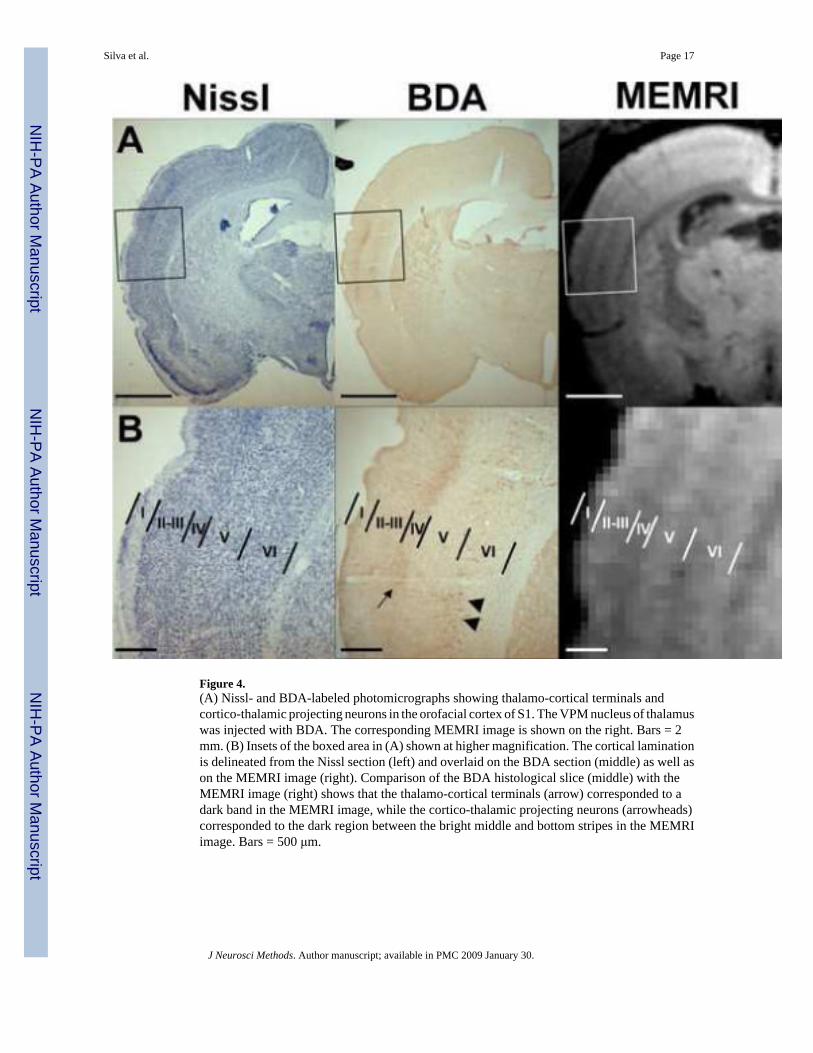
Figure 4.(A) Nissl- and BDA-labeled photomicrographs showing thalamo-cortical terminals andcortico-thalamic projecting neurons in the orofacial cortex of S1. The VPM nucleus of thalamuswas injected with BDA. The corresponding MEMRI image is shown on the right. Bars = 2mm. (B) Insets of the boxed area in (A) shown at higher magnification. The cortical laminationis delineated from the Nissl section (left) and overlaid on the BDA section (middle) as well ason the MEMRI image (right). Comparison of the BDA histological slice (middle) with theMEMRI image (right) shows that the thalamo-cortical terminals (arrow) corresponded to adark band in the MEMRI image, while the cortico-thalamic projecting neurons (arrowheads)corresponded to the dark region between the bright middle and bottom stripes in the MEMRIimage. Bars = 500 μm.
Silva et al. Page 17
J Neurosci Methods. Author manuscript; available in PMC 2009 January 30.
NIH
-PA Author Manuscript
NIH
-PA Author Manuscript
NIH
-PA Author Manuscript

Figure 5.(A) Hematocylin and Eosin histological stain of a coronal slice of a rat brain (inset, inset bar= 1 mm), showing the location of laminae over primary somatosensory cortex. Bar = 500 μm.(B) Corresponding MEMRI of the same animal, showing significant tissue enhancement in thepituitary gland, hippocampus, and cortical laminae. Bar = 500 μm. (C) MEMRI average signalintensity profile across the cortex as a function of the absolute cortical depth for n=9 rats. Thehatched bars indicate the histological location of the cortical laminae (Mean Location ± 1 SD).Two major significant Mn2+-enhanced stripes are located in layer II and in the transitionbetween layers IV and V. (* = P < 0.001, error bars = ± 1 SEM).
Silva et al. Page 18
J Neurosci Methods. Author manuscript; available in PMC 2009 January 30.
NIH
-PA Author Manuscript
NIH
-PA Author Manuscript
NIH
-PA Author Manuscript

Figure 6.Spin-echo T1-weighted coronal MR images of a control mouse brain (A), and of a reeler mousebrain (B), showing the presence of laminar enhancement in the wild-type brain (arrows), butthe absence of cortical laminae in the reeler mouse. Notice the strong uptake of Mn2+ in thepituitary gland in both mice. Bars = 2 mm.
Silva et al. Page 19
J Neurosci Methods. Author manuscript; available in PMC 2009 January 30.
NIH
-PA Author Manuscript
NIH
-PA Author Manuscript
NIH
-PA Author Manuscript

Figure 7.(A) Hematocylin and Eosin histological stain of a coronal slice of a control mouse brain (inset,inset bar = 1 mm), showing the location of laminae over primary somatosensory cortex. Bar =500 μm. (B) Corresponding MEMRI of the same animal, showing significant tissueenhancement in the hippocampus and cortical laminae. Bar = 500 μm. (C) MEMRI averagesignal intensity profile across the cortex as a function of cortical depth for n=10 mice. Thehatched bars indicate the histological location of the cortical laminae (Mean Location ± 1 SD).Two major significant Mn2+-enhanced stripes are located in layer II and in the transitionbetween layers IV and V. (* = P < 0.001, error bars = ± 1 SEM).
Silva et al. Page 20
J Neurosci Methods. Author manuscript; available in PMC 2009 January 30.
NIH
-PA Author Manuscript
NIH
-PA Author Manuscript
NIH
-PA Author Manuscript

Figure 8.(A) Hematocylin and Eosin histological stain of a coronal slice of a reeler mouse brain (inset,inset bar = 1 mm), showing absence of cortical laminae. Bar = 500 μm. (B) CorrespondingMEMRI of the same animal, showing significant tissue enhancement in hippocampus, but notin cortex. Bar = 500 μm. (C) MEMRI average signal intensity profile across the cortex as afunction of cortical depth for n=10 mice. No differences in signal intensity were observedacross the cortex.
Silva et al. Page 21
J Neurosci Methods. Author manuscript; available in PMC 2009 January 30.
NIH
-PA Author Manuscript
NIH
-PA Author Manuscript
NIH
-PA Author Manuscript

Figure 9.(A) Four consecutive MRI coronal slices of a rat brain (spatial resolution 100 × 100 × 1000μm3), showing enhancement of the thalamo-cortical pathway in primary somatosensory cortex,following injection of MnCl2 into the ventro-postero-lateral (VPL) nucleus of thalamus. Hyper-enhancement of the injection site (bregma – 3 mm, thick arrow) slowly dilutes into the corpuscallossum and enhances the mid laminae in somatosensory cortex. The longitudinal coordinatewith respect to bregma is shown in each slice. Bar = 2 mm. (B) Corresponding T1-maps (spatialresolution 200 × 200 × 1000 μm3) show a substantial reduction in the apparent waterlongitudinal relaxation time due to the presence of Mn2+, and a distinct dark cortical stripe(arrows) located 600−700 μm bellow the pial surface, at the expected anatomical location forlamina IV.
Silva et al. Page 22
J Neurosci Methods. Author manuscript; available in PMC 2009 January 30.
NIH
-PA Author Manuscript
NIH
-PA Author Manuscript
NIH
-PA Author Manuscript