Aircraft field degradation and electromagnetic compatibility
Upload
khangminh22Category
view
0download
0
UDR-TR-03-00044
Final Report - LaboratoryScale Thermal Degradation of Perfluoro-Octanyl Sulfonate and Related Precursors
May 2003
BUSINESS PROPRIETARY; DISTRIBUTION LIMITED WITHOUT WRITTEN CONSENT OF SPONSOR

Final Report
Laboratory-Scale Thermal Degradation of Perfluoro-Octanyl Sulfonate and Related Precursors
This report covers the efforts perfonned by the University of Dayton Research
Institute (UDRI), Environmental Science and Engineering Group, Dayton, OH 45469-
0132, during the period from March 2001 to December 2002. The work was conducted
under a Letter of Agreement dated March 20, 2001. The work was administered under
the direction of the 3M Environmental Lab, ET&SS, and the Project Monitor was Eric A.
Reiner and Dan C. Hakes.
The UDRI Program Monitors were Philip Taylor and Tak Yamada.
Dr. Philip Taylor Date , ~ &c.. % . ---c- C" h..v~
Dr. Tak Yamada Date

SECTION
1
2
3
4
5
TABLE OF CONTENTS
Executive Summary
Background
Phase I: Objectives and Test Protocol
Phase II: Method Development
Phase III: Revised Test Protocol
Experimental Results
5.1
5.2
5.3
5.4
S02 Transfer Efficiency Test
Laboratory Spike Analysis for PFOS
Heated Blank Combustion Analysis 5.3.1 In-line GC/MS Analysis 5.3.2 Off-line GCIMS Analysis 5.3.3 Reactor/Transfer Line Extraction
and LC-MS Analysis
Combustion Tests 5.4.1 PFOS Combustion Tests
5.4.1.1 In-line GCIMS Analysis 5.4.1.2 Off-line GC/MS Analysis 5.4.1.3 LC-MS Analysis of Extracts 5.4.1.4 LC-MS Analysis ofPUF Cartridges
5.4.2 FC-1395 Combustion Test 5.4.2.1 In-line GC/MS Analysis 5.4.2.2 Off-line GCIMS Analysis 5.4.2.3. LC-MS Analysis of Extracts 5.4.2.4. LC-MS Analysis ofPUF
5.4.3 FC-807A Combustion Test 5.4.3.1. In-line GCIMS Analysis 5.4.3.2. Off-line GCIMS Analysis 5.4.3.3. LC-MS Analysis of Extracts 5.4.3.4. LC-MS Analysis ofPUF
PAGE
viii
1
3
6
8
9
9
9
9 10 11 12
13 13 15 16 17 18 18 19 20 21 21 22 23 24 25 25

TABLE OF CONTENTS (continued)
SECTION PAGE
5.5 2nd Heated Blank Combustion Analysis 26 5.5.l. In-line GCIMS Analysis 26 5.5.2. Off-line GC/MS Analysis 27 5.5.3. LC-MS Analysis ofPUF Cartridges 28
5.6 Transport Efficiency Tests for PFOS 28 5.6.1 1 st Transport Efficiency Test 28 5.6.2 2nd Transfer Efficiency Test 29 5.6.3 3,d Transfer Efficiency Test 30
5.7 Sulfur Recovery Rate as S02, SOF2, and S02F2 32
5.8 Extracted Ion Analysis 34
6 Discussion 38
7 Conclusions 41
8 References 42
APPENDICES
ii

LIST OF FIGURES
FIGURE PAGE
2.1. Schematic of the System for Thermal Diagnostic Studies 4
5.3.1. In-line GC/MS Ion Chromatogram for Heated Blank at 600°C 11
5.3.2. In-line GC/MS Ion Chromatogram for Heated Blank at 900°C 11
5.3.3. Off-line GCIMS Ion Chromatogram for Heated Blank at 600°C 12
5.3.4. Off-line GCIMS Ion Chromatogram for Heated Blank at 900°C 12
5.4.1.1. In-line GCIMS Ion Chromatogram for PFOS at 600°C 16
5.4.1.2. In-line GC/MS Ion Chromatogram for PFOS at 900°C 16
5.4.1.3. Off-line GC/MS Ion Chromatogram for PFOS at 600°C 17
5.4.1.4. Off-line GCIMS Ion Chromatogram for PFOS at 900°C 17
5.4.2.1. In-line GCIMS Ion Chromatogram for FC-1395 at 600°C 20
5.4.2.2. In-line GCIMS Ion Chromatogram for FC-1395 at 900°C 20
5.4.2.3. Off-line GCIMS Ion Chromatogram for FC-1395 at 600°C 21
5.4.2.4. Off-line GCIMS Ion Chromatogram for FC-1395 at 900°C 21
5.4.3.1. In-line GCIMS Ion Chromatogram for FC-807 A at 600°C 24
5.4.3.2. In-line GC/MS Ion Chromatogram for FC-807 A at 900°C 24
5.4.3.3. Off-line GCIMS Ion Chromatogram for FC-807 A at 600°C 25
5.4.3.4. Off-line GC/MS Ion Chromatogram for FC-807A at 900°C 25
5.5.1. In-line GC/MS Ion Chromatogram for Heated Blank at 600°C 27
5.5.2. In-line GC/MS Ion Chromatogram for Heated Blank at 900°C 27
5.5.3. Off-line GC/MS Ion Chromatogram for Heated Blank at 600°C 27
iii

LIST OF FIGURES (continued)
FIGURE PAGE
5.5.4. Off-line GC/MS Ion Chromatogram for Heated Blank at 900°C 28
5.7.l. S02 Calibration Curve (Molar Number vs. Peak Area) 33
5.8.1. Total Ion Chromatogram and Corresponding HFID Signal for 35 Combustion ofPFXS at 600°C (off-line sample)
5.8.2. Extracted Ions (CF2H-51, SOF-67, CF3-69, CF2CF2H-I0l, 36 and C2F 5-119) and Corresponding HFID Signal for Combustion ofPFXS at 600°C (off-line sample)
5.8.3. HFID Signal for PFOS Combustion at 600°C (off-line sample) 37
5.8.4. HFID Signal for PFOS at 900°C (off-line sample) 37
iv
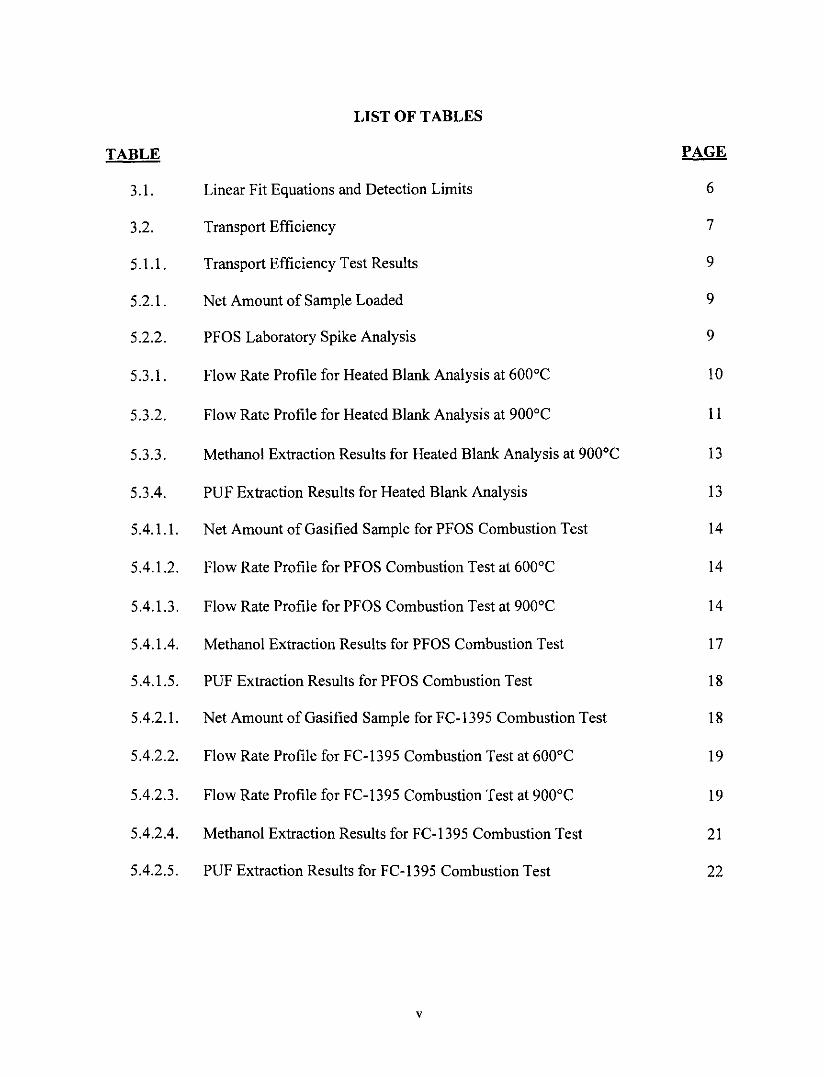
LIST OF TABLES
TABLE PAGE
3.1. Linear Fit Equations and Detection Limits 6
3.2. Transport Efficiency 7
5.1.!. Transport Efficiency Test Results 9
5.2.!' Net Amount of Sample Loaded 9
5.2.2. PFOS Laboratory Spike Analysis 9
5.3.1. Flow Rate Profile for Heated Blank Analysis at 600 DC 10
5.3.2. Flow Rate Profile for Heated Blank Analysis at 900DC 11
5.3.3. Methanol Extraction Results for Heated Blank Analysis at 900DC 13
5.3.4. PUF Extraction Results for Heated Blank Analysis 13
5.4.1.1. Net Amount of Gasified Sample for PFOS Combustion Test 14
5.4.1.2. Flow Rate Profile for PFOS Combustion Test at 600D C 14
5.4.1.3. Flow Rate Profile for PFOS Combustion Test at 900DC 14
5.4.1.4. Methanol Extraction Results for PFOS Combustion Test 17
5.4.l.5. PUF Extraction Results for PFOS Combustion Test 18
5.4.2.1. Net Amount of Gasified Sample for FC-1395 Combustion Test 18
5.4.2.2. Flow Rate Profile for FC-1395 Combustion Test at 600DC 19
5.4.2.3. Flow Rate Profile for FC-1395 Combustion Test at 900DC 19
5.4.2.4. Methanol Extraction Results for FC-1395 Combustion Test 21
5.4.2.5. PUF Extraction Results for FC-1395 Combustion Test 22
v

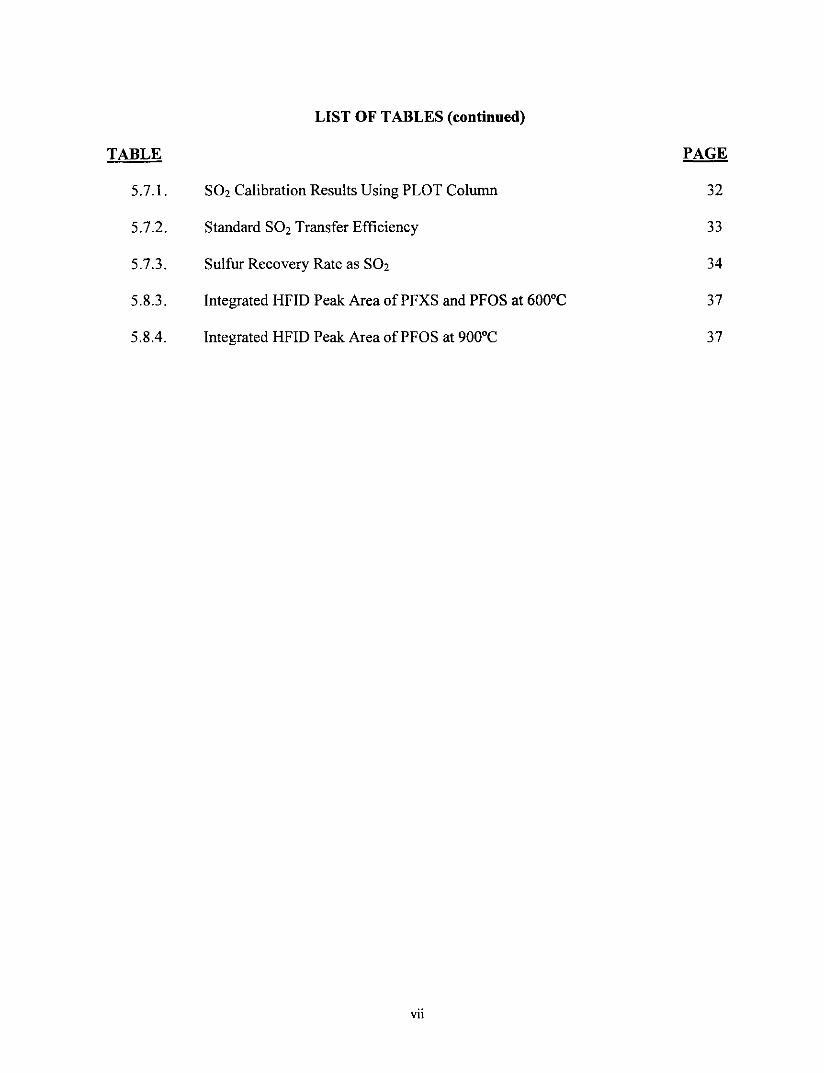
LIST OF TABLES (continued)
TABLE PAGE
5.4.3.!. Net Amount of Gasified Sample for FC-807 A Combustion Test 22
5.4.3.2. Flow Rate Profile for FC-807 A Combustion Test at 600°C 22
5.4.3.3. Flow Rate Profile for FC-807 A Combustion Test at 900°C 23
5.4.3.4. Flow Rate Profile for Blank Analysis between 600 and 900°C 23
5.4.3.5. Methanol Extraction Results for FC-807A Combustion Test 25
5.4.3.6. PUF Extraction Results for FC-807 A Combustion Test 26
5.5.1. Flow Rate Profile for Heated Blank Analysis at 600°C 26
5.5.2. Flow Rate Profile for Heated Blank Analysis at 900°C 26
5.5.3. PUF Extraction Results for Heated Blank Analysis 28
5.6.1.!. Net Amount of Gasified Sample for 1 st Transfer Efficiency Test 28
5.6.1.2. Flow Rate Profile for 1 st Transfer Efficiency Test 29
5.6.1.3. PUF Extraction Results for 1 st Transfer Efficiency Test 29
5.6.2.!' Net Amount of Gasified Sample for 2nd Transfer Efficiency Test 29
5.6.2.2. Flow Rate Profile for 2nd Transfer Efficiency Test 30
5.6.2.3. Methanol Extraction Results for 2nd Transfer Efficiency Test 30
5.6.2.4. PUF Extraction Results for 2nd Transfer Efficiency Test 30
5.6.3.!. Net Amount of Gasified Sample for PUF Collection 31
5.6.3.2. Flow Rate Profile for PUF Collection (PFOS Gasification with Air) 31
5.6.3.3. Flow Rate Profile for PUF Collection (PFOS Gasification with He) 31
5.6.3.4. ReactorN alve Transfer Line Extraction Results 31
5.6.3.5. PUF Extraction Results 32
vi
LIST OF TABLES (continued)
TABLE PAGE
5.7.1. S02 Calibration Results Using PLOT Column 32
5.7.2. Standard S02 Transfer Efficiency 33
5.7.3. Sulfur Recovery Rate as S02 34
5.8.3. Integrated HFID Peak Area of PFXS and PFOS at 600°C 37
5.8.4. Integrated HFID Peak Area of PFOS at 900°C 37
vii

EXECUTIVE SUMMARY
3M requested that the Environmental Sciences and Engineering Group at UDRI evaluate the incineration of CgF 17S03 X+ (PFOS) and two Cg perfluorosulfonamides (FC-1395 and FC-807 A), potential sources ofPFOS to the environment upon incineration. The overall goal of this study was to determine if incineration is a potential source of perfluoroalkyl sulfonates, e.g., perfluorooctanyl sulfonates (PFOS), which has been found in a number of wildlife tissue samples (Giesy, et aI., 2001; Kannan, et aI., 2001).
A laboratory-scale study simulating a full-scale hazardous waste incinerator was envisioned. Based on prior experience with halogenated compounds, initial plans were to use relatively modest conditions in the primary combustion zone (ca. 400°C) to gasifY the materials with more severe high-temperature (600 - 900°C), oxidative conditions representing a secondary combustion zone. TGAs of the active ingredient indicated that higher temperatures (ca. 600°C) were necessary to gasify this material. The sponsor also requested that the experiment be designed to detect low-levels (0.\%) ofPFOS in the exhaust gases. These factors necessitated the use oflarge amounts of material (milligram quantities) and high-temperature, long duration exposures (ca. 1250°C, 40 sec) in a specially designed pyroprobe to fully gasifY the material. These conditions, while representing quite severe conditions in the primary zone of an incinerator, e.g., a rotary kiln, are representative of the range of conditions that occur in a fullscale system. As such, the approach employed in the laboratory-scale combustion study is a reasonable extrapolation of a full-scale incineration study ofPFOS.
Combustion tests for PFOS, FC-1395, and FC-807A were completed as requested by the sponsor. In-line and off-line GC/MS analyses, reactor effluent sample collection using PUF cartridges followed by LC-MS analysis, and chemical extraction of various transfer lines throughout the reactor system including the reactor itselffollowed by LC-MS analysis were conducted to investigate the following: I) the extent of conversion of the active ingredients, 2) the formation of fluorinated organic incomplete combustion byproducts, and 3) the extent of conversion of the sulfur to sulfur oxides.
The data presented herein clearly show that incineration of FC-1395 and FC-807 A does not release PFOS to the environment. This conclusion is based mainly on the LCIMS measurements, but was substantiated by the extracted ion analysis that showed negligible 67-S0F ion indicating negligible amounts of volatile sulfonate-containing degradation products. Sulfur recoveries were quite good, 100±25%. The dominant sink for sulfur was S02. GC/MS analysis of perfluorinated alkyl sulfonate precursors indicated that such precursors were not present in the reactor effluent. This fmding is consistent with the LC/MS measurements, and strongly suggests that the C-S bond was completely destroyed (and did not reform) in the combustion tests.
High levels of conversion ofthe PFOS were observed from the incineration tests. This conclusion was based on LC/MS measurements of the reactor effluent and a thorough analysis of the transport of the material through the combustion system. Sulfur recoveries varied from 50 to 60%, depending on the reactor temperature. The dominant sink for sulfur was S02. GCIMS analysis of perfluorinated alkyl sulfonate precursors indicated that such precursors were not present in the reactor effluent. This finding is consistent with the LCIMS measurements, and
viii
strongly suggests that the C-S bond was completely destroyed (and did not reform) in the combustion tests.
Fluorinated organic intermediates were observed in the reactor effluent. These compounds were limited to fluorobenzene (FC-J395 and FC-807A only), C1 or C2 fluoroalkanes (likely products are either CHF3, CF4, or C2F6), l,l-difluoroethene (PFOS only), and 1,2-difluoroethene (FC-1395 only). Higher molecular weight fluorinated polycyclic aromatic hydrocarbons were not observed.
The data from this laboratory-scale incineration study indicates that properly operating full-scale incineration systems can adequately dispose ofPFOS and the Cs perfluorosulfonamides. Incineration ofthese fluorinated compounds is not likely to be a significant source of PFOS into the environment. With the exception of stable C1 and C2 fluorocarbons, fluorinated organic intermediates are also unlikely to be emitted from these facilities during the incineration of these materials.
ix

5/3112003
Laboratory-Scale Thermal Degradation ofPerfluoro-Octanyl Sulfonate and Related Precursors
Final Report Prepared by:
Takahiro Yamada and Philip H. Taylor Environmental Sciences and Engineering Group
University of Dayton Research Institute 300 College Park
Dayton,OH 45469-0132
In response to a verbal and written request from:
Eric A. Reiner and Dan C. Hakes 3M Environmental Lab, ET&SS
US-MNSP02,0002-03-E-09 P.O. Box 33331
St. Paul, MN 55133-3331

1. Background
The destruction efficiency (DE) of principal organic hazardous constituents (POHCs) is dominated by the temperature, time, fuel (waste)lair mixing, and fuel/air stoichiometry (excess air) experienced by the POHCs in the high temperature zones of incinerators (Dellinger, et aI., 1991). Numerous calculations and experiments have shown that emissions of un destroyed, residual POHCs are kinetically, not thermodynamically controlled (Tsang and Shaub, 1982; Trenholm, et aI., 1984; Dellinger, et al. 1991). As a result, accurate assessment ofPOHC emissions require thermal stability testing and cannot be accurately modeled based on thermodynamic equilibrium calculations.
Simple conceptual and more complex computer models indicate that gas-phase residence time and temperature in the post-flame zones of incinerators control the relative emissions of most POHCs (Clark, et aI., 1984; Dellinger, et aI., 1986; Dellinger, et al. 1991). This is because all molecules entering the flame zone of an incinerator are destroyed completely to thermodynamic endproducts and only the minute fraction escaping the flame zone is actually emitted from the facility. Once in the post-flame zone, gas-phase thermal decomposition reactivity in the presence of the major gas-phase constituents of this zone control the rate ofPOHC destruction and formation and destruction of products of incomplete combustion (PICs).
If all POHCs in a given waste stream are volatilized at approximately the same rate, they will experience the same post-flame gas-phase residence time, temperature, and stoichiometry history (relative concentrations ofPOHC, oxygen, and other major gas-phase constituents as the POHCs traverse this zone). This means that gas-phase thermal stability ofPOHCs (as determined under a standardized set of conditions) may be used to predict their relative incinerability. The temperature for 99% destruction at 2.0 seconds gas-phase residence time, [T 99 (2)Cc)] has been used previously to rank the thermal stability of POHCs (Taylor, et aI., 1990). Other residence times or levels of destruction may be used to develop a ranking. However, laboratory data indicate that although absolute POHC DEs are dependent upon time and temperature, relative DEs are largely insensitive to these parameters (Dellinger, et aI., 1984; Graham, et aI., 1986; Taylor and Dellinger, 1988). On the other hand, stoichiometry has been shown to be a significant variable in determining relative stability (Graham, et aI., 1986; Taylor and Dellinger, 1988; Taylor, et aI., 1991).
Experimental and theoretical considerations suggest that various flame zone failure modes exist that may cause residual POHCs to be emitted from a facility. The most prominent of these are thermal quenching and waste/air mixing failure modes. Even though a facility may be operating under nominal excess air conditions, poor waste/air mixing or thermal quenching zones due to poor heat transfer at incinerator surfaces will result in conditions where the rate ofPOHC destruction is low and PIC formation is favored. Consequently, it is believed that gas-phase thermal stability as characterized under oxygen-starved conditions is an effective predictor of POHC relative incinerability.
The UDRI thermal stability-based incinerability ranking was initially published in 1990 with further development published inl991 (Taylor, et al. 1990; Dellinger, et aI., 1991). The US-EPA has evaluated the UDRI gas-phase thermal decomposition kinetic rankings on both the pilot and
I

full-scale as a basis for determining POHC incinerability. Pilot-scale studies (Carroll, et aI., 1992) of an eleven-component hazardous waste mixture under thermal failure and worst-case conditions (encompassing three failure-promoting conditions resulting in lower kiln-exit temperature, larger charge mass, and lower HlCI ratio than the baseline set of conditions) both produced statistically significant correlations between product emission concentrations and their gas-phase thermal stability rankings. For the thermal failure tests, correlations above the 99% confidence interval were observed. Full-scale studies (Dellinger, et aI., 1993) of a sevencomponent hazardous waste mixture indicated that thermal failure and waste/air mixing failures also produced statistically significant correlations. Based on median destruction and removal efficiencies (DREs), the data indicated that both the mixing and thermal failure modes produced statistically significant correlations between product emission concentrations and their gas-phase thermal stability rankings.
3M requested that the Environmental Sciences and Engineering Group at UDRI evaluate the thermal decomposition of the following fluorocarbon-based compounds: FC-80? A and FC 1395 (Cg perfluoroalkyl sulfonamides), and CgF17S03X+ (PFOS). The overall goal of this study was to determine if incineration is a potential source of perfluorooctanyl sulfonates (PFOS), which has been found in a number of wildlife tissue samples (Giesy, et aI., 2001; Kannan, et aI., 2001). This report describes the experimental studies ofPFOS, FC-80? A, and FC-1395.
This report is broken into eight sections. The first four sections describe the background of our experience in incineration research, phase I: the initial test protocol and project objectives, phase II: the method development work, and phase III: the revised test protocol. Sections five and six describe the experimental results followed by an interpretation of the results, respectively. Section seven gives conclusions and recommendations. Section eight provides a list of references. An appendix contains the following auxiliary information that pertains to all experiments conducted in this study including those involving PFOS incineration: 1) a timeline of the phase I, phase II, and phase III studies and the actual dates of the combustion tests, 2) Sample descriptions and Certificate of Analysis (C of A) for PFOS sample, 3) the phase II final report and raw data, 4) the phase III test protocol and addendum, 5) the 3M analytical report and 6) a spreadsheet linking the UDRI combustion tests with the 3M Analytical results.
2

2. Phase I: Objectives and Test Protocol
The objectives of this program were the following:
1. Determine if Cs perfluorosulfonamides form combustion products that either are perfluorooctanyl sulfonate (PFOS) or precursors of perfluoro-octanyl sulfonate.
2. Determine the extent of conversion ofPFOS under conditions representative of hazardous or municipal waste incineration.
3. Identify the major fluorinated combustion products,
4. Determine if the sulfur present in the PFOS is quantitatively converted to sulfur dioxide and/or thionyl fluoride (SOF2) and sulfuryl fluoride (S02F2) at high temperature, fuel-lean combustion conditions.
The development of the test protocol was based on the use of batch-charged continuous flow reactors developed at UDRI to study the thermal stability of organic materials (Rubey and Carnes, 1985, Rubey and Grant, 1988). Briefly, these systems accept a small quantity of material (typically less than 1 mg). The sample and its decomposition products are volatilized, mixed with flowing dry air, transported through a high temperature quartz tubular reactor where the sample vapors are thermally stressed under controlled conditions of time, temperature, and excess air level. The materials surviving this exposure are then passed onto an in-line gas chromatography/mass spectrometry (GCIMS) system for analysis.
Quantification of parent species is based on transport and analysis of known quantities under non-destructive conditions. Typically, products are quantified using the response factor of the parent compound or the major parent compounds if from a complex mixture. In this study, the analytical focus will be identification of stable fluorinated organic intermediates and the quantification of sulfur oxides in an attempt to recover 100% of the initial sulfur in the sample. Sulfur quantification will be performed using a mass selective detector (MSD). Consideration was also given to the use of a sulfur-specific detector that responds only to sulfur atoms. However, due to the universal nature of the MSD, i.e., its ability to detect both sulfur and fluorinated organic compounds, it was decided that the MSD would be satisfactory for these experiments.
Every sample presents its own unique set of challenges. In the case of PFOS, the unknowns in establishing the test protocol centered around the issue oftransportability. Specifically, transporting the sample to the reactor from the sample inlet and the products from the reactor to and through the analytical sub-systems. For example, it is likely that the test sample will decompose rather than evaporate and the central issue becomes whether the products from this decomposition process can be transported under acceptable conditions. Consequently, developing the test protocol for the 3M samples focused on the issues of sample feed and product transport and analysis.
3
The first step in any gas-phase thermal stability analysis is converting the sample into a vapor where it is mixed with the desired carrier gas and transported through the reactor system by the bulk flow of the process stream. When working with a relatively uncharacterized sample, it is common practice to perform a thermogravimetric analysis (TGA) in oxidizing (air) and inert (nitrogen or helium) atmospheres to determine the temperature range needed to gasify the sample. This preliminary information was used to determine if the phase change is simple evaporation or decomposition and to determine if the sample deposits a non-volatile residue.
With the temperature range needed to gasify the sample established, a series of relatively simple tests was performed to determine if the gasification products could be transported under nominal flow reactor conditions. While the sample inlet systems of the UDRI reactors can be routinely heated to 400°C (with transient heating as high as 600°C), the sample transport lines to and from the reactors are typically limited to 2S0-300°C. Experience has shown that under these conditions most organic compounds of interest can be transported without inducing thermal reactions thereby preserving the fidelity of the samples flowing from the inlet system to the reactor and the product stream flowing from the reactor to the analytical sub-systems. A key issue to be evaluated in this study will be the transport of the PFOS from the gasification system to the high-temperature reactor and from the reactor to the analytical sub-systems.
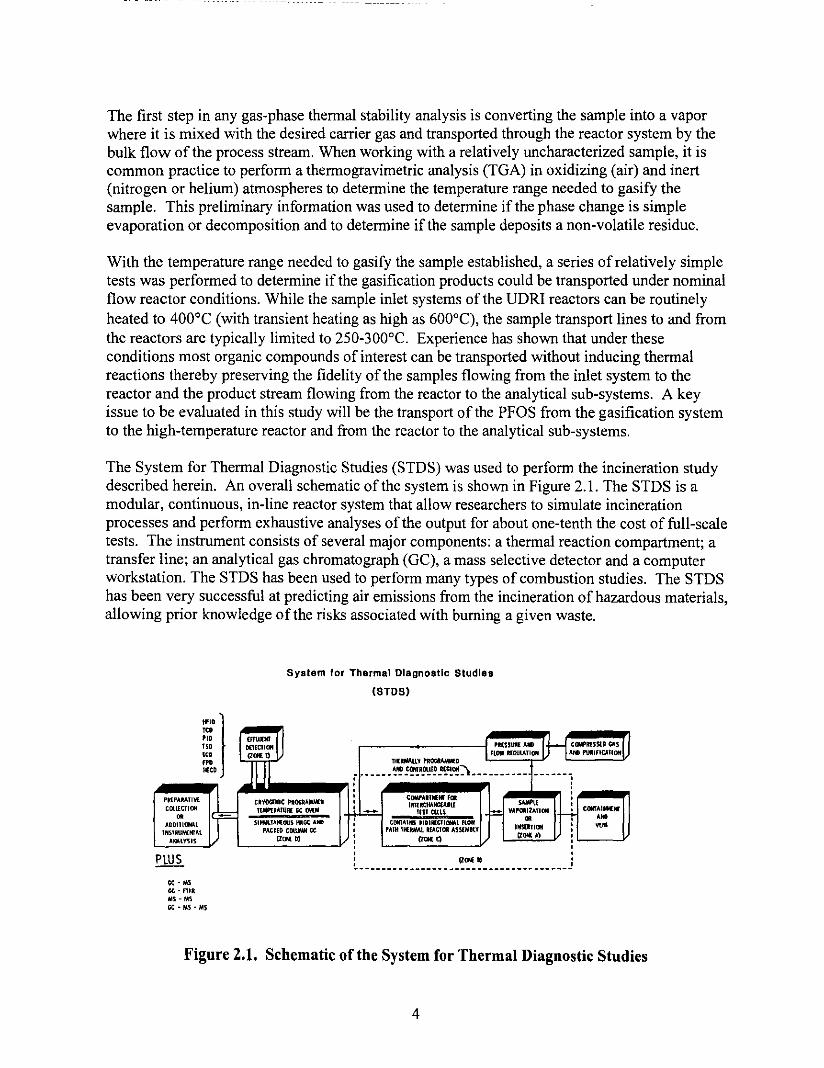
The System for Thermal Diagnostic Studies (STDS) was used to perform the incineration study described herein. An overall schematic of the system is shown in Figure 2.1. The STDS is a modular, continuous, in-line reactor system that allow researchers to simulate incineration processes and perform exhaustive analyses of the output for about one-tenth the cost of full-scale tests. The instrument consists of several major components: a thermal reaction compartment; a transfer line; an analytical gas chromatograph (GC), a mass selective detector and a computer workstation. The STDS has been used to perform many types of combustion studies. The STDS has been very successful at predicting air emissions from the incineration of hazardous materials, allowing prior knowledge of the risks associated with burning a given waste.
It, PI, U, ,." 1
PI!iPA~ATIYf.
COllICT10H .. AIlDllltlMl 1"~TRUM(H1"'l
ANU'I'SIS
GC - M5 Il(;-nlll MS - M5
'" '" "'"
lie -MS-IIIS
Syslem for Thermal Diagnostic Studies
(STDS)
eRVOOElIlC I'IOIlItAMKb Tl1M'EII"IUIIf IOC MM
SIMIIlTAII:005 IIRGt AMI "'C~ED COUJMN Gt
IlON: IlJ
, , (Z0If:1) • ~. ____________________________________ 1
CONI'AIIHII' . .. ft.
Figure 2.1. Schematic of the System for Thermal Diagnostic Studies
4

Initially, the Advanced Thermal Photolytic Reactor System (ATPRS) was selected for this study. To satisfy the analytical requirements for PFOS detection by LCIMS analysis at 3M Environmental Laboratory, we determined that relatively large amounts of sample, 0.5 to several mg, had to be gasified in the actual experiments. This amount of sample was much larger than initially estimated (ca. 10 to I 00 ~g) and could not be gasified with the inlet available with the ATPRS. Preliminary experiments also demonstrated that higher gasification temperatures (> 400°C) were necessary to rapidly gasify the fluorocarbon-based samples. As such, the STDS, equipped with a high-temperature pyroprobe that can gasify milligram quantities of material, was selected for the actual combustion tests.
In the original protocol, we originally planned sample combustion with a liquid hydrocarbon fuel (e.g., n-octane). Subsequently, it was determined that a substitute was necessary because the liquid hydrocarbon fuel originally proposed required a much larger amount of oxygen (air) to obtain stoichiometric oxidation and it was impossible to maintain the required residence time of 1-2 seconds in the reactor under stoichiometric or excess air environments. Methane has the lowest chemical oxygen demand of any hydrocarbon fuel and is a satisfactory replacement. We decided instead to use methane as a fuel if the sample is hydrogen deficient and requires hydrogen source to convert F to HF, otherwise fuel will not be introduced to the reactor.
In the original protocol, we also proposed to conduct combustion tests at three temperatures (600,750, and 900°C). Preliminary combustion tests with several samples indicated that many combustion byproducts were formed at 600°C, but those combustion byproducts were not observed at higher temperature (750 and 900°C) and the GC/MS total ion chromatograms for these higher temperatures were very similar. Therefore it was decided that two temperatures are sufficient to analyze the combustion phenomena of the selected samples (600 and 900°C).
5
3. Phase II: Method Development
The following method development tests were performed in phase II:
1. Verify that PFOS can be gasified and transported through the UDRI thermal instrumentation system.
2. Establish recovery efficiencies and detection limits for stable sulfur compounds and PFOS precursors. The sulfur compounds would include but not be limited to S02, SOF2, and S02F2. PFOS precursors would include but not be limited to perfluoro-octane sulfonyl fluoride (POSF).
3. Establish recovery efficiencies and detection limits for volatile C1-C4 fluorocarbons. 4. Develop a quantitative method of sampling the reactor effluent. ORBO PUF cartridges
(Supelco, Inc.) will be used for sampling PFOS and its precursors from the reactor effluent.
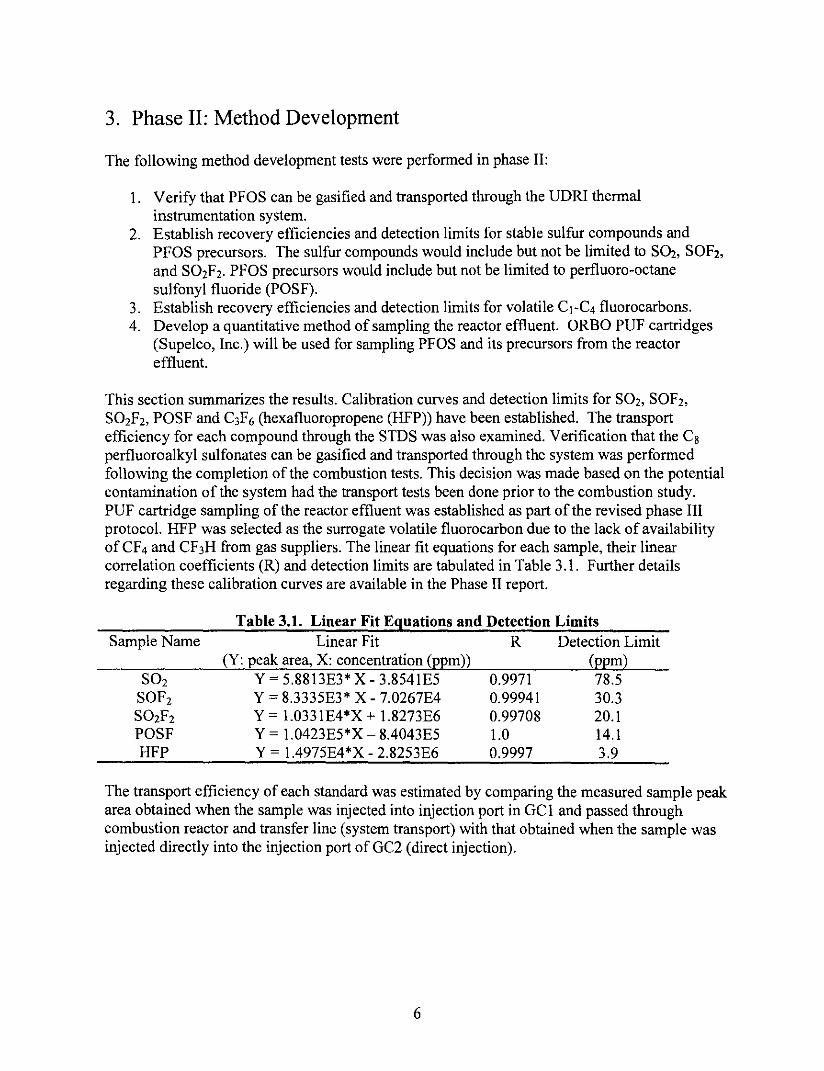
This section summarizes the results. Calibration curves and detection limits for S02, SOF2, S02F2, POSF and C3F6 (hexafluoropropene (HFP)) have been established. The transport efficiency for each compound through the STDS was also examined. Verification that the Cs perfluoroalkyl sulfonates can be gasified and transported through the system was performed following the completion ofthe combustion tests. This decision was made based on the potential contamination of the system had the transport tests been done prior to the combustion study. PUF cartridge sampling of the reactor effluent was established as part of the revised phase III protocol. HFP was selected as the surrogate volatile fluorocarbon due to the lack of availability of CF4 and CF 3H from gas suppliers. The linear fit equations for each sample, their linear correlation coefficients (R) and detection limits are tabulated in Table 3.1. Further details regarding these calibration curves are available in the Phase II report.
Sample Name
S02 SOF2 S02F2 POSF HFP
Table 3.1. Linear Fit Equations and Detection Limits Linear Fit R Detection Limit
(Y: peak area, X: concentration (ppm)) (ppm) Y - S.8813E3* X - 3.8S41ES 0.9971 78.S Y = 8.333SE3* X - 7.0267E4 0.99941 30.3 Y = 1.0331E4*X + 1.8273E6 0.99708 20.1 Y = 1.0423ES*X - 8.4043ES 1.0 14.1 Y = 1.497SE4*X - 2.82S3E6 0.9997 3.9
The transport efficiency of each standard was estimated by comparing the measured sample peak area obtained when the sample was injected into injection port in GC 1 and passed through combustion reactor and transfer line (system transport) with that obtained when the sample was injected directly into the injection port of GC2 (direct injection).
6
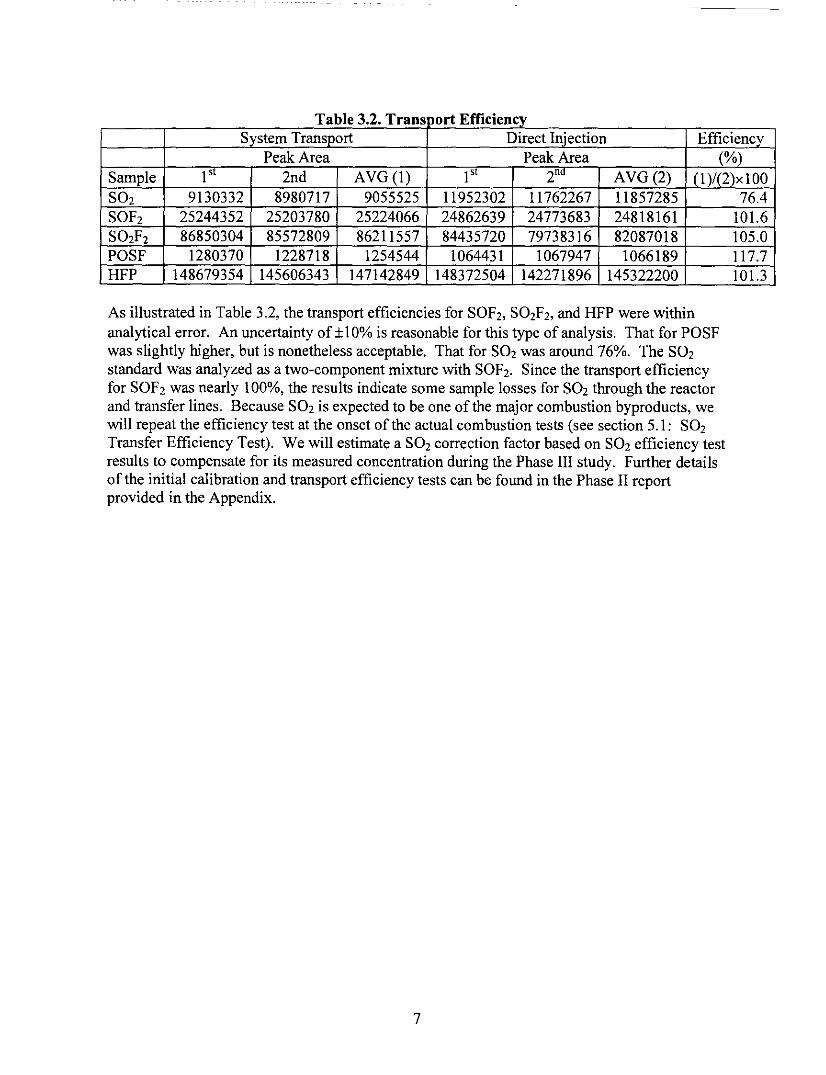
Table 3.2. Transport Efficiency System Transport Direct Injection Efficiency
Peak Area Peak Area (%) Sample 1st 2nd AVG(1) 1st 2na AVG (2) (1 )/(2)x 1 00 S0 2 9130332 8980717 9055525 11952302 11762267 11857285 SOF2 25244352 25203780 25224066 24862639 24773683 24818161 S02F2 86850304 85572809 86211557 84435720 79738316 82087018 POSF 1280370 1228718 1254544 1064431 1067947 1066189 HFP 148679354 145606343 147142849 148372504 142271896 145322200
As illustrated in Table 3.2, the transport efficiencies for SOF2, S02F2, and HFP were within analytical error. An uncertainty of ±IO% is reasonable for this type of analysis. That for POSF was slightly higher, but is nonetheless acceptable. That for S02 was around 76%. The S02 standard was analyzed as a two-component mixture with SOF2. Since the transport efficiency for SOF2 was nearly 100%, the results indicate some sample losses for S02 through the reactor and transfer lines. Because S02 is expected to be one ofthe major combustion byproducts, we will repeat the efficiency test at the onset of the actual combustion tests (see section 5.1: S02 Transfer Efficiency Test). We will estimate a S02 correction factor based on S02 efficiency test results to compensate for its measured concentration during the Phase III study. Further details of the initial calibration and transport efficiency tests can be found in the Phase II report provided in the Appendix.
7
76.4 101.6 105.0 117.7 101.3

4. Phase III: Revised Test Protocol
The combustion tests consisted of 8 separate tests as listed below:
1. S02 Transfer Efficiency Tests, 2. Laboratory Spike Analysis for PFOS, 3. Heated Blank Combustion Test, 4. Combustion Tests for PFOS and two Cs perfluorosulfonamides, 5. Heated Blank Combustion Test (repeat), 6. Transfer Efficiency Test for PFOS, 7. Sulfur Recovery Analysis as S02, 8. Extracted Ion Analysis.
Specific attention was being given to the sampling of PFOS during incineration. In-line and offline GC/MS analysis, PUF (polyurethane foam) collection of the reactor effluent and chemical extraction of the reactor and associated transfer lines were conducted. In the latter two tests, the PUF cartridges and the extracts were delivered to 3M for analysis of PFOS by LC/MS. Prior to the sample combustion analysis, the transfer efficiency for S02 was re-examined and the laboratory spike analysis for PFOS was performed. A heated blank line analysis was performed at the onset of the sample combustion tests. After the combustion tests, another heated blank line analysis was performed. Transfer efficiency tests for PFOS were performed at the conclusion of the combustion tests. Due to resolution issues regarding the in-line sampling approach, the sulfur recovery rate as S02 was re-analyzed using off-line GC/MS analytical results.
Further details are provided in the Phase III test protocol and addendum that are given in an appendix to this report. The 3M analytical report (LIMS Nos. E02-0820, E02-0821, E02-0822, E02-0839, E02-0840, E02-0867, E02-0895, E02-0896, E02-0898, E02-0899, E02-0916, E02-0917, E02-0926, E02-0968, E02-0969, E02-0970, and E02-0971) is also provided in an appendix to this report. It should also be noted that the PFOS data were not corrected for recovery from the PUF cartridges. Spike recoveries for PFOS were ca. 80% with 1 fig addition of these compounds and ca. 90% with 10 fig addition of these compounds.
8

5. Experimental Results
5.1. S02 Transfer Efficiency Test The S02 transfer efficiency tests conducted in Phase II was repeated in Phase III to confinn the Phase II results. The results are shown in Table 5.1.1. The S02 standard was analyzed as a twocomponent mixture with SOF2. S02 transport efficiency was 83.7%, slightly higher than previous results, 76.4%, which gives average value of 80.1 %. The transport efficiency for SOF2 was again nearly 100%.
a e . . T bl 511 T ransj>o rt Effi . lClency es esu s T tR It System Transport Direct Injection Efficiency
Peak Area Peak Area (%) Sample 1" 2"" Average (1) 1" 2"0 Average (2) (1 )/(2)x 1 00
SO, 8300590 8433620 8367105 10134575 9995499 10065037 83.7 SOF, 21346398 20309703 20828051 19612747 20444301 20028524 101.9
5.2. Laboratory Spike Analysis for PFOS PFOS was dissolved with 10 ml methanol (Aldrich, HPLC grade) and I fll of solution was placed into a reactor (4 mm (i.d.) x 6 mm (o.d.) x 7 cm length) and dried by blowing high purity nitrogen. The amount of sample used is shown in Table 5.2.1. After the drying process, the transfer lines were assembled and the samples were extracted using 5.5 ml of methanol that was also used to dissolve the samples.
Sample
PFOS
Net Weight (mg)
10.02
Table 5.2.1. Net Amount of Sample Loaded Solvent Amount Amount Injected Net Amount of Sample
(ml) (fll) Loaded (flg) 10 1.0 1.0
Table 5.2.2 shows the extraction results for PFOS laboratory spike analysis, respectively. The combined first and second extracts recovered 149% of the PFOS.
Table 5.2.2. PFOS Laboratory Spike Analysis Sample Extracts PFOS (pg/fll) PFOS (fig) PFOS 1" Extracts 232 1.6 PFOS 2"d Extracts 40.5 0.28
5.3. Heated Blank Combustion Analysis The heated blank reactorltransfer tubing was analyzed to examine if there was any system contamination (including background levels ofPFOS) for the reactor temperature at 600 and 900°C prior to series of combustion tests. Four analyses, in-line GCIMS analysis, PUF collected off-gas sample analysis, off-line GCIMS analysis using Tedlar bag, and reactor/transfer line system extraction using methanol were conducted. The PUF sample collection and methanol extraction of condensed phase material were prepared and sent to 3M Environmental Laboratory
9
for analyses. The in-line GCIMS was mainly used to analyze compounds equal to or heavier than C6 compounds and off-line GCIMS was used for lighter compounds including S02. PUF sample and methanol extracts were analyzed for PFOS detection. The experimental setup, reactor/transfer-line configuration, and experimental procedure followed the Phase III test protocol. The Phase III test protocol and addendum can be found in the appendix to this report.
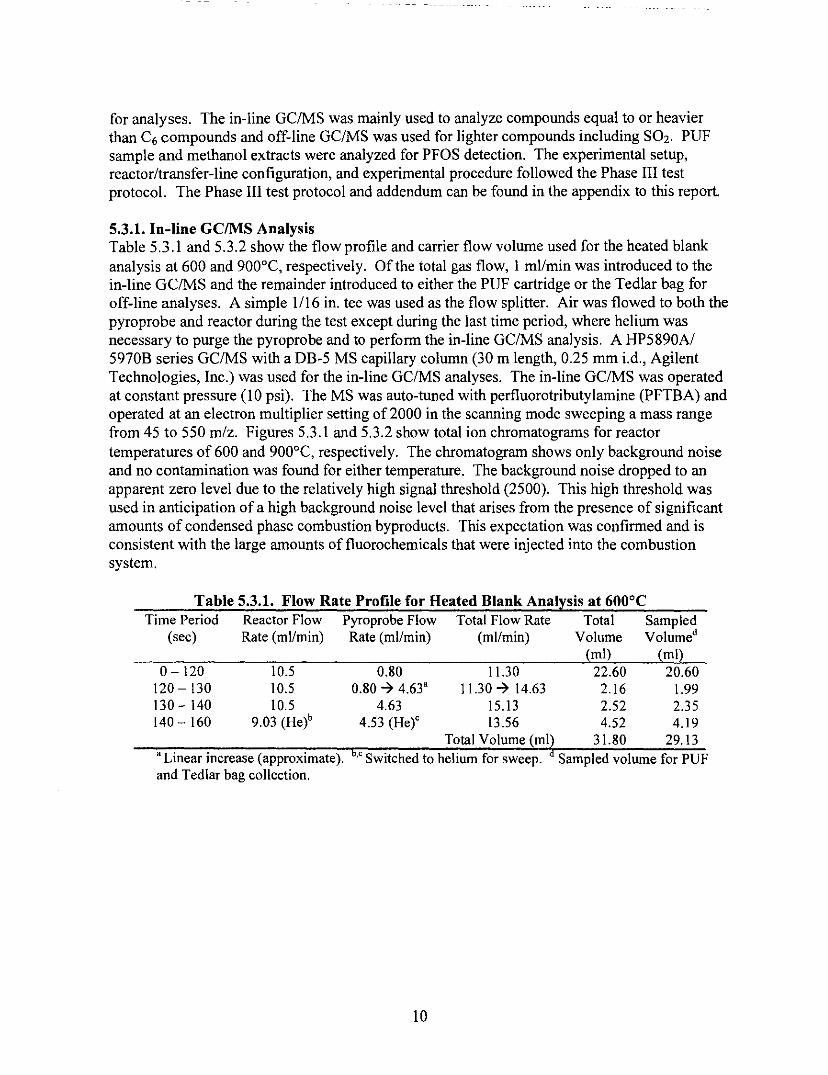
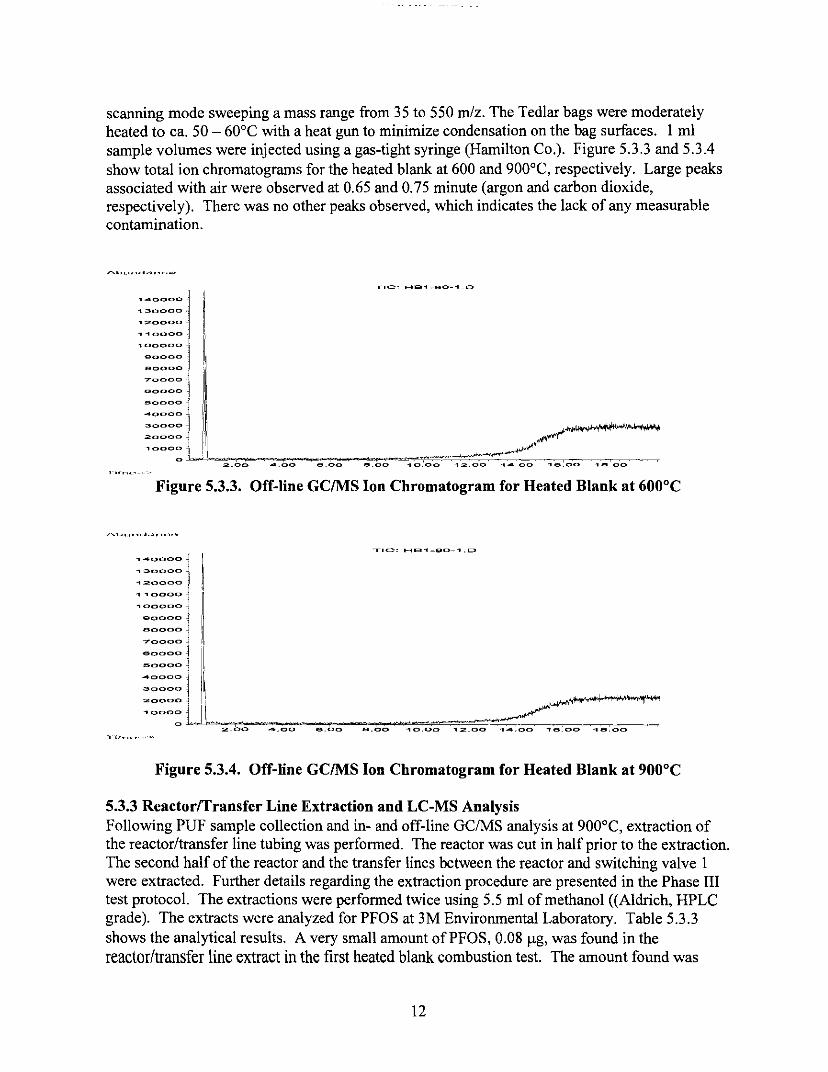
5.3.1. In-line GCIMS Analysis Table 5.3.1 and 5.3.2 show the flow profile and carrier flow volume used for the heated blank analysis at 600 and 900°C, respectively. Of the total gas flow, 1 ml/min was introduced to the in-line GCIMS and the remainder introduced to either the PUF cartridge or the Tedlar bag for off-line analyses. A simple 1/16 in. tee was used as the flow splitter. Air was flowed to both the pyroprobe and reactor during the test except during the last time period, where helium was necessary to purge the pyroprobe and to perform the in-line GC/MS analysis. A HP5890AI 5970B series GC/MS with a DB-5 MS capillary column (30 m length, 0.25 mm i.d., Agilent Technologies, Inc.) was used for the in-line GC/MS analyses. The in-line GCIMS was operated at constant pressure (10 psi). The MS was auto-tuned with perfluorotributylamine (PFTBA) and operated at an electron multiplier setting of 2000 in the scanning mode sweeping a mass range from 45 to 550 mlz. Figures 5.3.1 and 5.3.2 show total ion chromatograms for reactor temperatures of 600 and 900°C, respectively. The chromatogram shows only background noise and no contamination was found for either temperature. The background noise dropped to an apparent zero level due to the relatively high signal threshold (2500). This high threshold was used in anticipation of a high background noise level that arises from the presence of significant amounts of condensed phase combustion byproducts. This expectation was confirmed and is consistent with the large amounts of fluorochemicals that were injected into the combustion system.
Table 5.3.1. Flow Rate Profile for Heated Blank Analysis at 600°C Time Period
(sec)
0-120 120 - 130 130 - 140 140 - 160
Reactor Flow Rate (ml/min)
Pyroprobe Flow Rate (mllmin)
Total Flow Rate (mllmin)
Total Samp led Volume Volumed
(ml) (ml) 10.5 0.80 11.30 22.60 20.60 10.5 0.80 -? 4.63' 11.30 -? 14.63 2.16 1.99 10.5 4.63 15.13 2.52 2.35
9.03 (He)b 4.53 (He)' 13.56 4.52 4.19 Total Volume (ml~ 31.80 29.13
'Linear increase (approximate). 6., Switched to helium for sweep. Sampled volume for PUF and Tedlar bag collection.
10
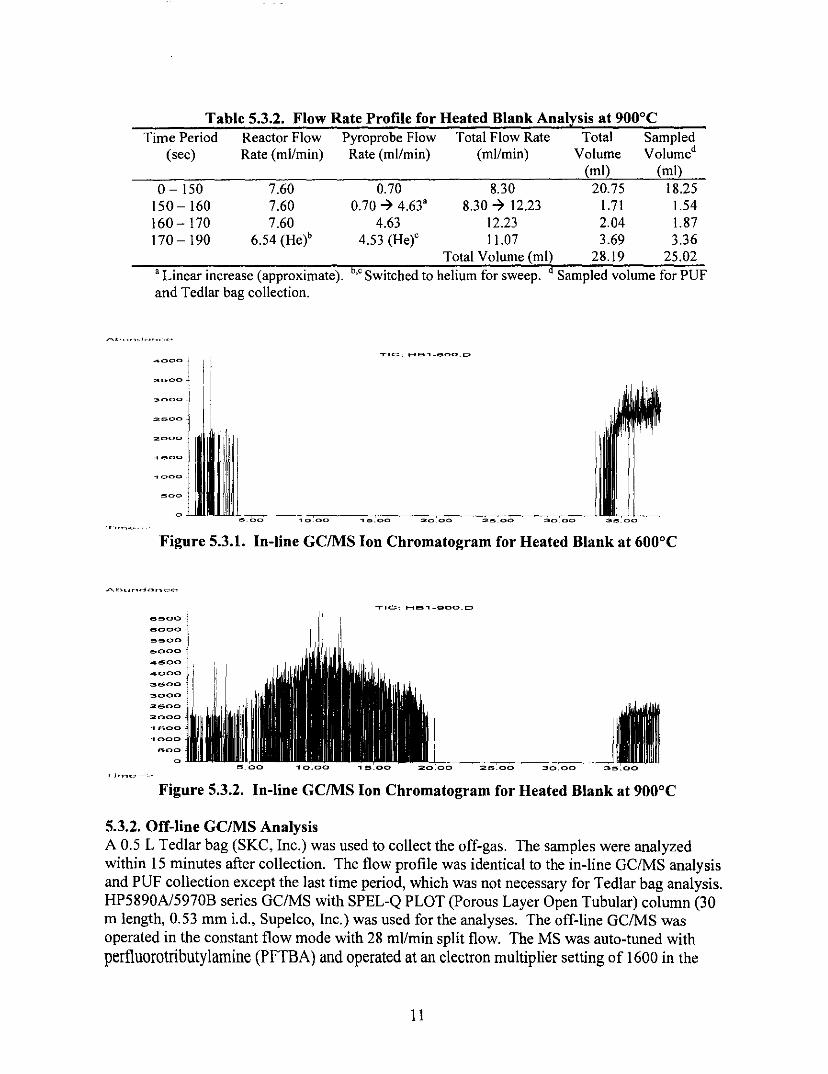
Table 5.3.2. Flow Rate Profile for Heated Blank Analysis at 900°C Time Period Reactor Flow Pyroprobe Flow Total Flow Rate Total Sampled
(sec) Rate (mllmin) Rate (mllmin) (mllmin) Volume Volumed
0-150 150 - 160 160 -170 170-190
7.60 7.60 7.60
6.54 (He)h
0.70 0.70 ~ 4.63'
4.63 4.53 (He)'
(ml) (ml) 8.30 20.75 18.25
8.30 ~ 12.23 1.71 1.54 12.23 2.04 1.87 11.07 3.69 3.36
Total Volume (ml) 28.19 25.02 'Linear increase (approximate). b., Switched to helium for sweep. a Sampled volume for PUF and Tedlar bag collection.
.-,C', HB1_aOO.~
3500 I 3000
2000
, I
1<:500
.. 000_
Figure 5.3.1. In-line GC/MS Ion Chromatogram for Heated Blank at 600°C
EI!50D
BOOc)
5500
5000
4500
4000
3500
3000
2500 I 2000
1500
1000
500
o
'IC, HB1_90D.D
30.
Figure 5.3.2. In-line GC/MS Ion Chromatogram for Heated Blank at 900°C
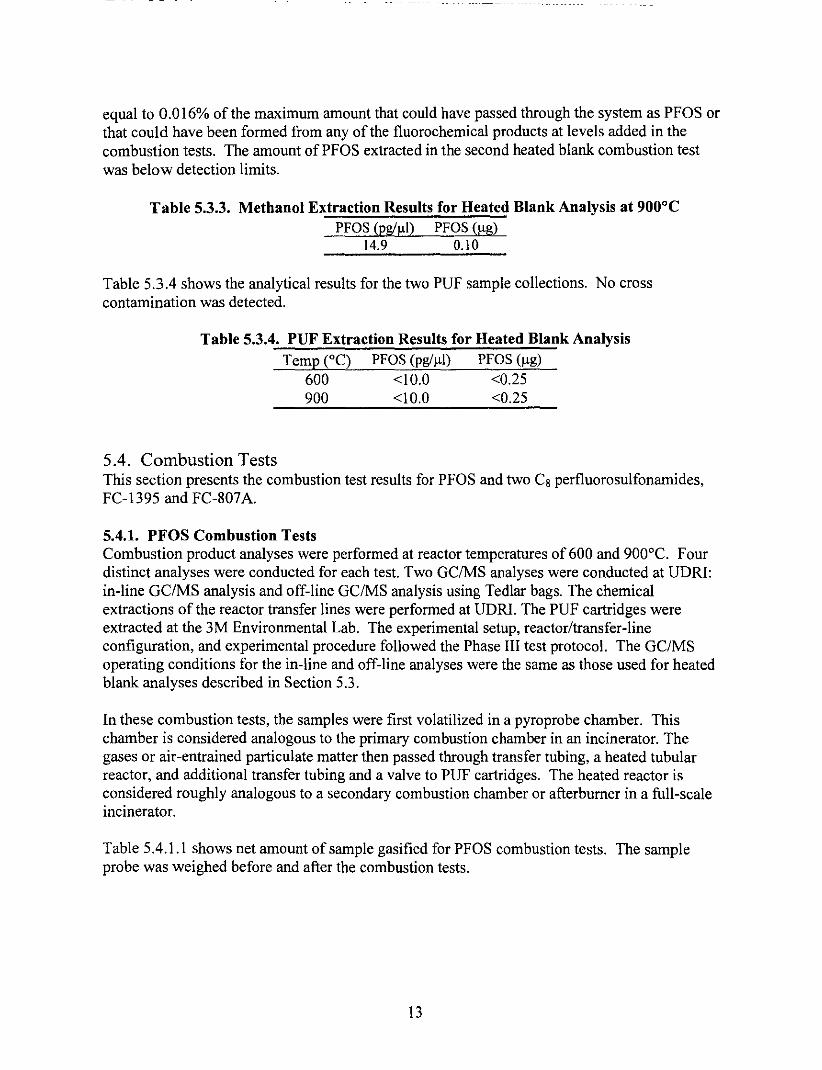
5.3.2. Off-line GC/MS Analysis A 0.5 L Tedlar bag (SKC, Inc.) was used to collect the off-gas. The samples were analyzed within 15 minutes after collection. The flow profile was identical to the in-line GC/MS analysis and PUF collection except the last time period, which was not necessary for Tedlar bag analysis. HP5890Al5970B series GCIMS with SPEL-Q PLOT (Porous Layer Open Tubular) column (30 m length, 0.53 mm i.d., Supelco, Inc.) was used for the analyses. The off-line GCIMS was operated in the constant flow mode with 28 mllmin split flow. The MS was auto-tuned with perfiuorotributylamine (PFTBA) and operated at an electron multiplier setting of 1600 in the
11
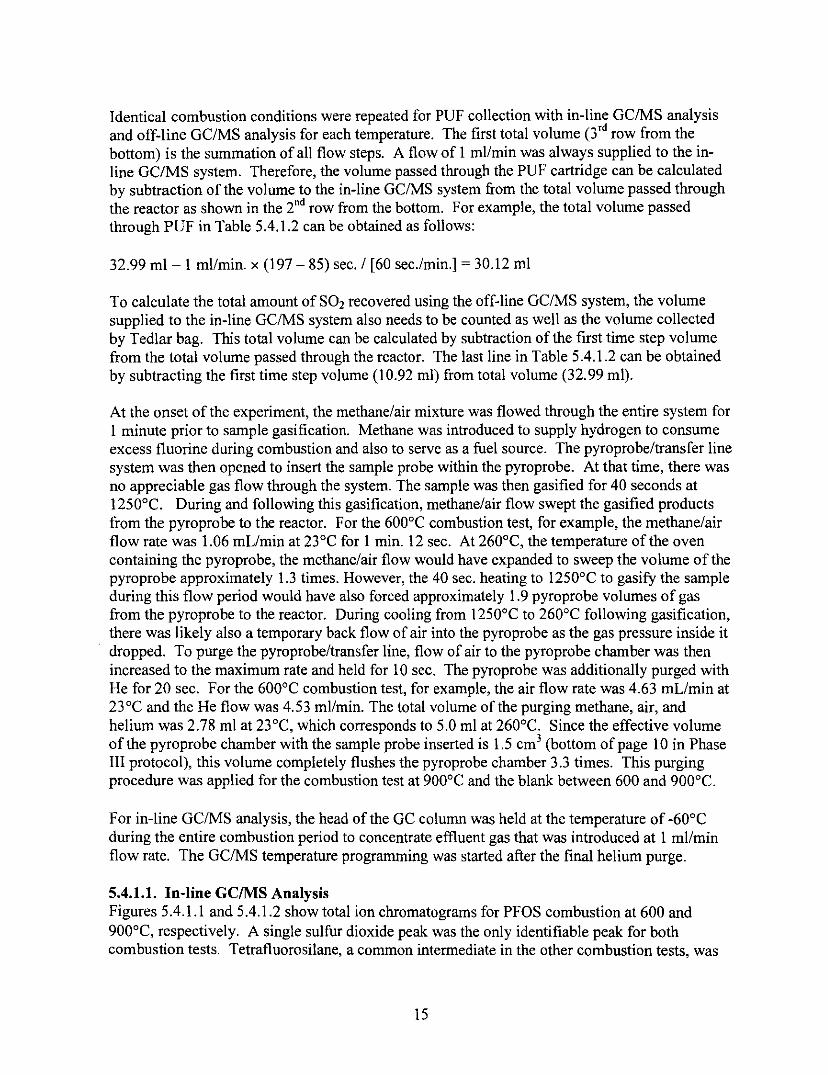
scanning mode sweeping a mass range from 35 to 550 rn/z. The Tedlar bags were moderately heated to ca. 50 - 60°C with a heat gun to minimize condensation on the bag surfaces. I ml sample volumes were injected using a gas-tight syringe (Hamilton Co.). Figure 5.3.3 and 5.3.4 show total ion chromatograms for the heated blank at 600 and 900°C, respectively. Large peaks associated with air were observed at 0.65 and 0.75 minute (argon and carbon dioxide, respectively). There was no other peaks observed, which indicates the lack of any measurable contamination.
Figure 5.3.3. Off-line GC/MS Ion Chromatogram for Heated Blank at 600°C
/>,.b ••••• -J._~,~<_O.,,.
,-,<:::::0: 1-113.,_gO_".~
~::::: 1 1200000
""'0000
'::::: j BOOOO
7'0000
450000 I ~CJoooi
::::: 1 \ :::::. t
·.,il.-"'2""!. 0,-,,0,..-..,_-. 0"'0,........,8'""'. O"-O,-.-s"".""OO"....-,,.,,O"'. 0""0=''''2'''. o",o~,-:_-;:. 0:'0 ., 6_ 00 ... a. 000 I IrT'~"" '-,
Figure 5.3.4. Off-line GC/MS Ion Chromatogram for Heated Blank at 900°C
5.3.3 Reactorffransfer Line Extraction and LC-MS Analysis Following PUF sample collection and in- and off-line GC/MS analysis at 900°C, extraction of the reactor/transfer line tubing was performed. The reactor was cut in half prior to the extraction. The second half of the reactor and the transfer lines between the reactor and switching valve 1 were extracted. Further details regarding the extraction procedure are presented in the Phase III test protocol. The extractions were performed twice using 5.5 ml of methanol «Aldrich, HPLC grade). The extracts were analyzed for PFOS at 3M Environmental Laboratory. Table 5.3.3 shows the analytical results. A very small amount ofPFOS, 0.08 ~g, was found in the reactor/transfer line extract in the first heated blank combustion test. The amount found was
12
equal to 0.016% of the maximum amount that could have passed through the system as PFOS or that could have been formed from any of the fluorochemical products at levels added in the combustion tests. The amount of PFOS extracted in the second heated blank combustion test was below detection limits.
Table 5.3.3. Methanol Extraction Results for Heated Blank Analysis at 900e C PFOS (pg/f.Ll) PFOS (f.Lg)
\4.9 0.\0
Table 5.3.4 shows the analytical results for the two PUF sample collections. No cross contamination was detected.
Table 5.3.4. PUF Extraction Results for Heated Blank Analysis Temp {eq PFOS (pg/f.L\) PFOS (f.Lg)
600 <10.0 <0.25 900 <10.0 <0.25
5.4. Combustion Tests This section presents the combustion test results for PFOS and two Cs perfluorosulfonamides, FC-1395 and FC-807A.
5.4.1. PFOS Combustion Tests Combustion product analyses were performed at reactor temperatures of 600 and 900eC. Four distinct analyses were conducted for each test. Two GC/MS analyses were conducted at UDRI: in-line GC/MS analysis and off-line GC/MS analysis using Tedlar bags. The chemical extractions of the reactor transfer lines were performed at UDRI. The PUF cartridges were extracted at the 3M Environmental Lab. The experimental setup, reactor/transfer-line configuration, and experimental procedure followed the Phase III test protocol. The GC/MS operating conditions for the in-line and off-line analyses were the same as those used for heated blank analyses described in Section 5.3.
In these combustion tests, the samples were first volatilized in a pyroprobe chamber. This chamber is considered analogous to the primary combustion chamber in an incinerator. The gases or air-entrained particulate matter then passed through transfer tubing, a heated tubular reactor, and additional transfer tubing and a valve to PUF cartridges. The heated reactor is considered roughly analogous to a secondary combustion chamber or afterburner in a full-scale incinerator.
Table 5.4.1.1 shows net amount of sample gasified for PFOS combustion tests. The sample probe was weighed before and after the combustion tests.
13

Table 5.4.1.1. Net Amount of Gasified Sample for PFOS Combustion Test Temperature Usage Loaded Remaining Net Amount
(0C) Mass (mg) of Gasified
600
900
PUF" TBb
PUF TB
(mg) Sample
0.47 0.48 0.50 0.50
0.02 0.10 0.00 0.00
(mg) 0.45 0.38 0.50 0.50
'In· line GC/MS analysis and off-gas collection using PUF. b Off-line GCIMS analysis using Tedlar Bag.
Tables 5.4.1.2 and 5.4.1.3 show flow rate profiles used for PFOS combustion tests at 600 and 900°C, respectively.
Table 5.4.1.2. Flow Rate Profile for PFOS Combustion Test at 600°C Time Period
(sec)
0-60 60 - 85' 85 - 157 157 - 167 167 - 177 177 - 197
Reactor Flow Rate (mllmin)
Air 9.86 0.00 9.86 9.86 9.86
8.61 (He)'
Pyroprobe Flow Rate (ml/min)
Total Flow Rate (mllmin)
Volume (ml)
Table 5.4.1.3. Flow Rate Profile for PFOS Combustion Test at 900°C Time Period
(sec)
0-60 60 - 85' 85 - 179 179 - 189 189 - 199 199 - 219
Reactor Flow Rate ( ml/min)
Air 7.12 0.00 7.12 7.12 7.12
6.15 (He)'
Pyroprobe Flow Rate (mllmin)
14
Total Flow Rate (ml/min)
Volume (ml)
Identical combustion conditions were repeated for PUF collection with in-line GCIMS analysis and off-line GC/MS analysis for each temperature. The first total volume (3 rd row from the bottom) is the summation of all flow steps. A flow of I ml/min was always supplied to the inline GC/MS system. Therefore, the volume passed through the PUF cartridge can be calculated by subtraction of the volume to the in-line GC/MS system from the total volume passed through the reactor as shown in the 2nd row from the bottom. For example, the total volume passed through PUF in Table 5.4.1.2 can be obtained as follows:
32.99 ml- I mllmin. x (197 - 85) sec. / [60 sec./min.] = 30.12 ml
To calculate the total amount of S02 recovered using the off-line GC/MS system, the volume supplied to the in-line GCIMS system also needs to be counted as well as the volume collected by Tedlar bag. This total volume can be calculated by subtraction of the first time step volume from the total volume passed through the reactor. The last line in Table 5.4.1.2 can be obtained by subtracting the first time step volume (10.92 ml) from total volume (32.99 ml).
At the onset of the experiment, the methane/air mixture was flowed through the entire system for I minute prior to sample gasification. Methane was introduced to supply hydrogen to consume excess fluorine during combustion and also to serve as a fuel source. The pyroprobe/transfer line system was then opened to insert the sample probe within the pyroprobe. At that time, there was no appreciable gas flow through the system. The sample was then gasified for 40 seconds at 1250°C. During and following this gasification, methane/air flow swept the gasified products from the pyroprobe to the reactor. For the 600°C combustion test, for example, the methane/air flow rate was 1.06 mLimin at 23°C for 1 min. 12 sec. At 260°C, the temperature ofthe oven containing the pyroprobe, the methane/air flow would have expanded to sweep the volume ofthe pyroprobe approximately 1.3 times. However, the 40 sec. heating to 1250°C to gasify the sample during this flow period would have also forced approximately 1.9 pyroprobe volumes of gas from the pyroprobe to the reactor. During cooling from 1250°C to 260°C following gasification, there was likely also a temporary back flow of air into the pyroprobe as the gas pressure inside it dropped. To purge the pyroprobe/transfer line, flow of air to the pyroprobe chamber was then increased to the maximum rate and held for 10 sec. The pyroprobe was additionally purged with He for 20 sec. For the 600°C combustion test, for example, the air flow rate was 4.63 mLimin at 23°C and the He flow was 4.53 ml/min. The total volume of the purging methane, air, and helium was 2.78 ml at 23°C, which corresponds to 5.0 ml at 260°C. Since the effective volume of the pyroprobe chamber with the sample probe inserted is 1.5 cm} (bottom of page 10 in Phase III protocol), this volume completely flushes the pyroprobe chamber 3.3 times. This purging procedure was applied for the combustion test at 900°C and the blank between 600 and 900°C.
For in-line GCIMS analysis, the head of the GC column was held at the temperature of -60°C during the entire combustion period to concentrate effluent gas that was introduced at 1 mllmin flow rate. The GCIMS temperature programming was started after the final helium purge.
5.4.1.1. In-line GCIMS Analysis Figures 5.4.1.1 and 5.4.1.2 show total ion chromatograms for PFOS combustion at 600 and 900°C, respectively. A single sulfur dioxide peak was the only identifiable peak for both combustion tests. Tetrafluorosilane, a common intermediate in the other combustion tests, was
15
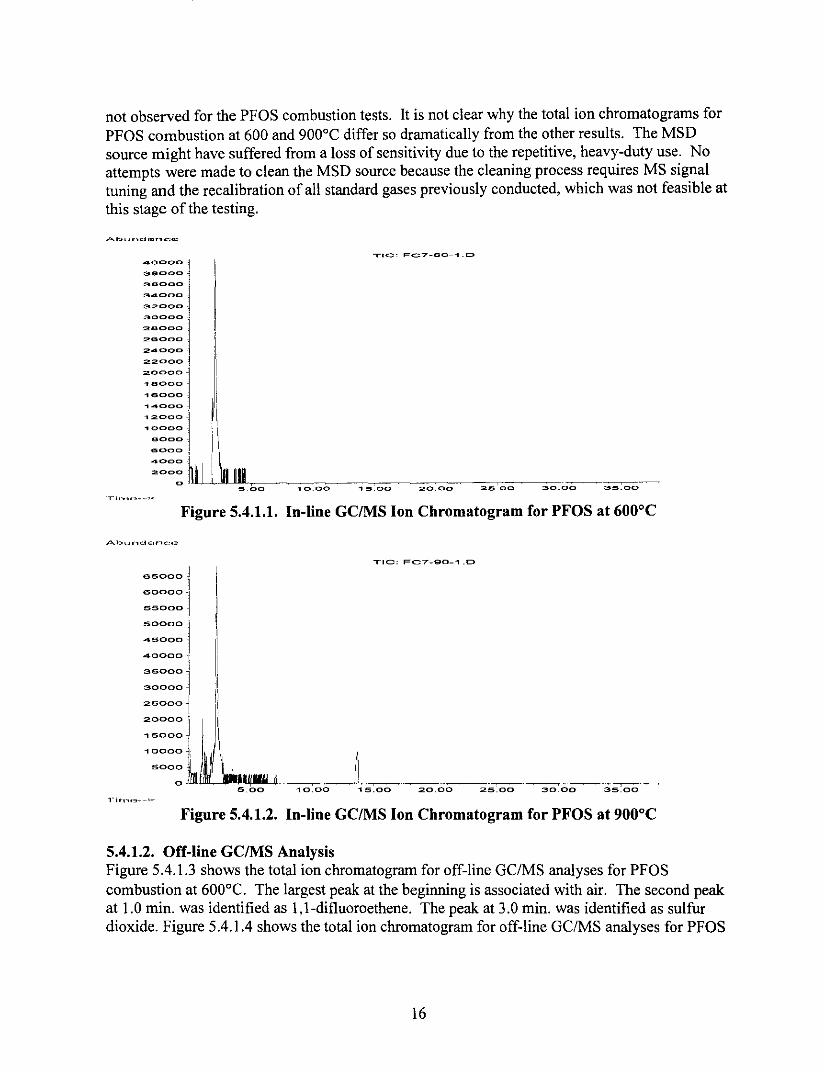
not observed for the PFOS combustion tests. It is not clear why the total ion chromatograms for PFOS combustion at 600 and 900°C differ so dramatically from the other results. The MSD source might have suffered from a loss of sensitivity due to the repetitive, heavy-duty use. No attempts were made to clean the MSD source because the cleaning process requires MS signal tuning and the recalibration of all standard gases previously conducted, which was not feasible at this stage of the testing.
::::: jl 3 .... 000
32000
;:~:: l' 24000-
~~~gll , :::::1· I
"'OIC: FC7_eO_"'I.D
'::~~ , i '\
:~~~~ul~~ ___ -__________ ~. !s.oo "'10.00 "'15:00 20.00 2.~LOO
T.,' .. ·.~,:,_,··"_ ~.--~--
30.00 35.00
Figure 5.4.1.1. In-line GCIMS Ion Chromatogram for PFOS at 600°C
:::::j 55000 l 500001 I ::::: 1 II
::::: 1 !\
::::: l.j/1\i 15000 1 ., 0000 I ~I
500:. I ~ 'l.inll1rrtl H
5.00 10.00 '5.00
Figure 5.4.1.2. In-line GCIMS Ion Chromatogram for PFOS at 900°C
5.4.1.2. Off-line GCIMS Analysis Figure 5.4.1.3 shows the total ion chromatogram for off-line GC/MS analyses for PFOS combustion at 600°C. The largest peak at the beginning is associated with air. The second peak at 1.0 min. was identified as 1,I-difluoroethene. The peak at 3.0 min. was identified as sulfur dioxide. Figure 5.4.1.4 shows the total ion chromatogram for off-line GC/MS analyses for PFOS
16

combustion at 900°C. Similar results were obtained. The largest peak at the beginning is associated with air. The second peak at 3.0 min. corresponds to sulfur dioxide.
-400000
3 .... 0000
:3aC)(:>oo -
3 .... 0000
280000
:260000 .
2200001
:::::: j' ., .... 0000
., .... 0000
.,2000C> l
, ::::: 1" '1
1
::::: :1
20C>C>O~I~d~~-L~~~~~~~~~M~ g.OC> 2_00 .4 00 6.00 "10.00
Figure 5.4.1.3. Off-line GCIMS Ion Chromatogram for PFOS at 600°C
3aoc>oc>
3 .... 0000
340000
320000
300000-
Figure 5.4.1.4. Off-line GCIMS Ion Chromatogram for PFOS at 900°C
5.4.1.3. LC-MS Analysis of Extracts Table 5.4.1.4 shows the analytical results of the reactor/ transfer line extraction samples. Extracts of reactor/transfer line tubing after the 900°C test summed to only about 0.04% of the PFOS added.
Table 5.4.1.4. Methanol Extraction Results for PFOS Combustion Test Extraction PFOS (pg/f!\) PFOS (f!g)
1st 15.4 0.11 2nd 8.61 0.059
17

5.4.1.4. LC-MS Analysis ofPUF Cartridges Table 5.4.1.5 shows the analytical results for the PUF sampling cartridges. The amount ofPFOS captured in the PUF was less than 0.4 % of the PFOS added at 600°C. Only about 0.05% was captured by the PUFs at 900°C. Surprisingly, somewhat larger amounts ofPFOS were extracted from the second PUF in a two-PUF series at both 600°C and 900°e. This suggests that some PFOS could have passed completely through the system, but in the third transfer efficiency tests, much larger amounts of PFOS were captured in the first PUF in the series showing that the first PUF typically collects more. An amount of carryover equivalent to 0.026% of PFOS added in the preceding 600°C tests was extracted from the PUF in the PFOS interim blank.
Table 5.4.1.5. PUF Extraction Results for PFOS Combustion Test Temp Extraction PFOS PFOS (0C) (Pg/fll) (flg) 600 PUF (1 ") 25.1 0.62
PUF (2nd) 64.0 1.6 900 PUF (I'd 4.31 0.11
PUF (2n ) 9.01 0.22
5.4.2. FC-1395 Combustion Test Table 5.4.2.1 shows net amount of sample gasified for FC-1395 combustion tests. The sample probe was weighed before and after the combustion tests.
Table 5.4.2.1. Net Amount of Gasified Sample for FC-1395 Combustion Test Temperature Usage Loaded Dried Remaining Net Amount of
(0C) Mass (mg) Masse (mg) Gasified
600
900
PUF" TBb PUF TB
2.14 2.22 2.20 2.23
(mg) Sample (mg) 0.56 0.04 0.52 0.58 0.06 0.52 0.57 0.02 0.55 0.58 0.15 0.43
• In-line GC/MS analysis and off-gas collection using PUF. b Off-line GCIMS analysis using Tedlar Bag. o Calculated based on the water contents (74%).
Table 5.4.2.2 and 5.4.2.3 shows flow rate profiles used for FC-1395 combustion tests at 600 and 900°C, respectively. The detailed explanation for each value can be found in section 5.4.1.
18
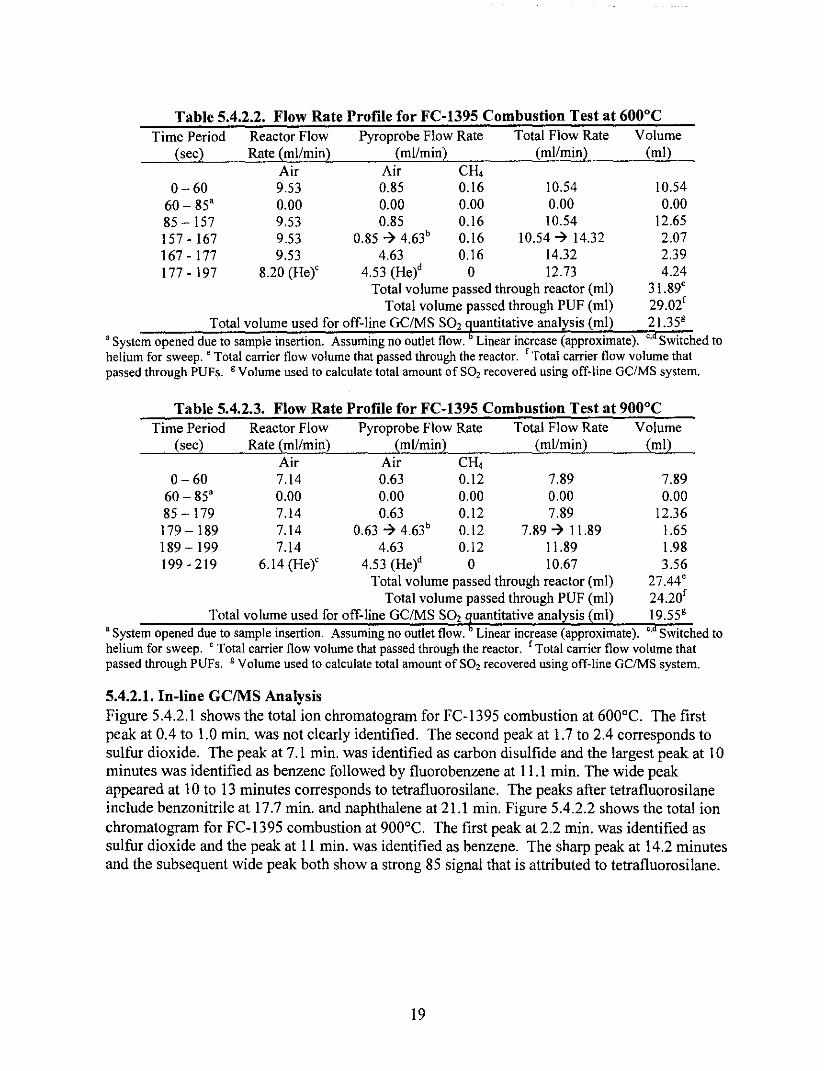
Table 5.4.2.2. Flow Rate Profile for FC-1395 Combustion Test at 600°C Time Period
(sec)
0-60 60 - 85' 85 - 157 157-167 167 -177 177 - 197
Reactor Flow Rate (mllmin)
Air 9.53 0.00 9.53 9.53 9.53
8.20 (He)'
Pyroprobe Flow Rate (mllmin)
Air CH4
Total Flow Rate (mllmin)
Volume (ml)
0.85 0.16 10.54 10.54 0.00 0.00 0.00 0.00 0.85 0.16 10.54 12.65
0.8574.63b 0.16 10.54714.32 2.07 4.63 0.16 14.32 2.39
4.53 (He)d 0 12.73 4.24 Total volume passed through reactor (ml) 31.89'
Total volume passed through PUF (ml) 29.02' Total volume used for off-line GCfMS SO, ~uantitative analysis (ml) 21.35'
Table 5.4.2.3. Flow Rate Profile for FC-1395 Combustion Test at 900°C Time Period
(sec)
0-60 60 - 85' 85 - 179 179 - 189 189 - 199 199 - 219
Reactor Flow Rate (mllmin)
Air 7.14 0.00 7.14 7.14 7.14
6.14 (He)'
5.4.2.1. In-line GC/MS Analysis
Pyroprobe Flow Rate (mllmin)
Total Flow Rate (mllmin)
Volume (ml)
Figure 5.4.2.1 shows the total ion chromatogram for FC-1395 combustion at 600°C. The first peak at 0.4 to 1.0 min. was not clearly identified. The second peak at 1.7 to 2.4 corresponds to sulfur dioxide. The peak at 7.1 min. was identified as carbon disulfide and the largest peak at 10 minutes was identified as benzene followed by fluorobenzene at 11.1 min. The wide peak appeared at 10 to 13 minutes corresponds to tetrafluorosilane. The peaks after tetrafluorosilane include benzonitrile at 17.7 min. and naphthalene at 21.1 min. Figure 5.4.2.2 shows the total ion chromatogram for FC-1395 combustion at 900°C. The first peak at 2.2 min. was identified as sulfur dioxide and the peak at 11 min. was identified as benzene. The sharp peak at 14.2 minutes and the subsequent wide peak both show a strong 85 signal that is attributed to tetrafluorosilane.
19

At:"_.ndar.co
TIC: FC3-60-1.D
2000000
1800000
1600000
1400000
1200000
1000000
800000
Figure 5.4.2.1. In-line GC/MS Ion Chromatogram for FC-1395 at 600°C
::::::1 ~ooooo ~
::::::1 300000 ~ , 2~OOOO
200000
1~OOOO
100000
50000 J a·-A!
5.00
,IC: F<:::3_BO_1.D
u) ~~~ ... ~~~-~~
20.00 25.00 30.00 35.00 10_00 15.00
Figure 5.4.2.2. In-line GC/MS Ion Chromatogram for FC-1395 at 900°C
5.4.2.2. Off-line GC/MS Analysis Figure 5.4.2.3 shows the total ion chromatogram for off-line GC/MS analyses for FC-1395 combustion at 600°C. The large peak at the beginning is associated with air. The next peak at 0.9 min. was identified as 1.2-difluoroethene followed by sulfur dioxide at 3 min., difluorodimethylsilane at 4.8 min., benzene at 9.9 min. and fluorobenzene at 10.1 min. Difluorodimethylsilane also is likely produced during the gasification process. Figure 5.4.2.4 shows the total ion chromatogram for off-line GC/MS analyses for FC-1395 combustion at 900°C. The largest peak is associated with air. Sulfur dioxide at 3 min. was the only identifiable product.
20

..... 00000 -1 !I 380000 i
::::::j' 320000
300000
280000
280000 , :::::: j' :200000
... BOaoe II ... GOoOC> -I
:::::: j'! ':::::u' II
.... 0000 - I aoooC> I 200C>~_~O \!\
Figure 5.4.2.3. Off-line GCIMS Ion Chromatogram for FC-1395 at 600°C
400000 I "',11' 380000 -j
:::::: l' II
300000
:280000 . I 2""'0000 1 .' 2 .... 0000! III
:2:20000 i il :200000 I Ii
I !I 1800001 II -,.,"0000 i II
::::::'1 'I "00000 ,
60000 I
80000~ I ~h""'+ ..... ,
::::;LLI'--;C=:-"'--::;4"'O;;;0c"'--:::--::;;:---;::-,:;o."~=-~~ ~-:,o~::::= 00 's,oo Figure 5.4.2.4. Off-line GCIMS Ion Chromatogram for FC-1395 at 900°C
5.4.2.3. LC-MS Analysis of Extracts Table 5.4 .2.4 shows the analytical results of the reactor! transfer line extractions. No detectable amount of PFOS was found.
Table 5.4.2.4. Methanol Extraction Results for FC-1395 Combustion Test Extraction PFOS(pglfll) PFOS(flg)
1st <5.00 <0.035 2nd <5.00 <0.035
5.4.2.4. LC-MS Analysis of PUF Table 5.4.2.5 shows the analytical results for the PUF sampling cartridges. No detectable amount of PFOS was found.
21
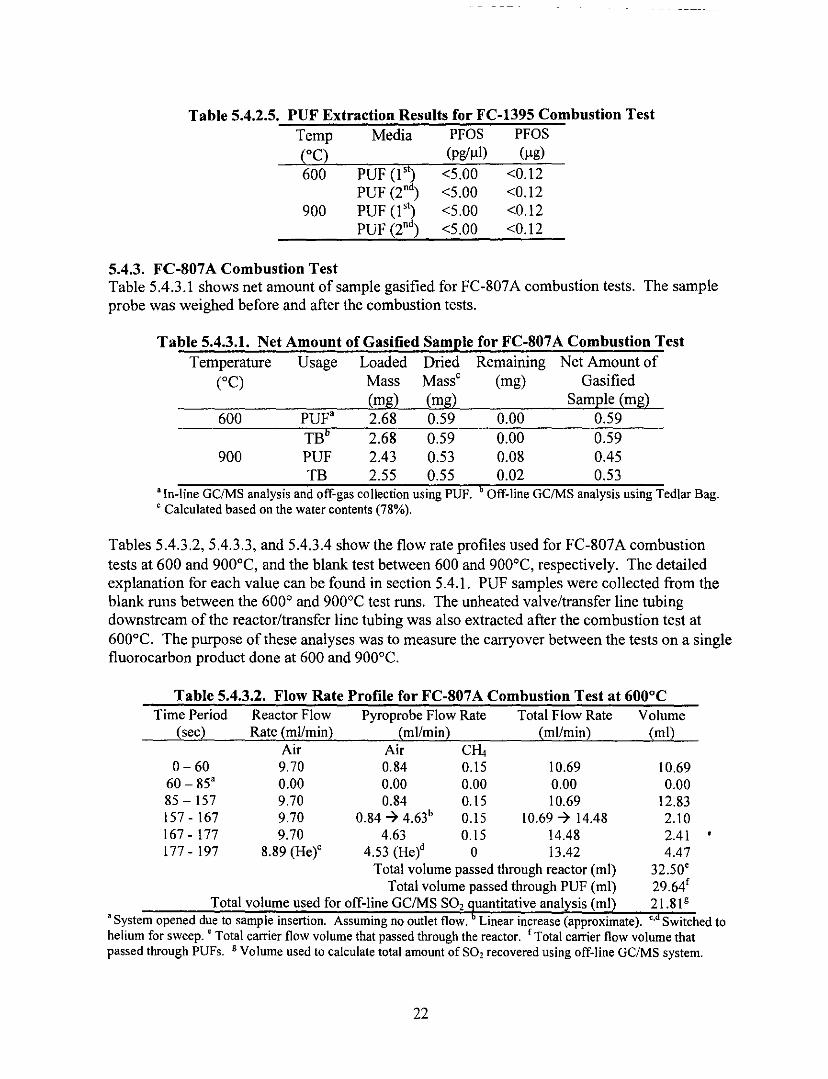
Table 5.4.2.5. PUF Extraction Results for FC-1395 Combustion Test Temp Media PFOS PFOS (0C) (pgl~l) (~g)
600 PUF (l5t) <5.00 <0.12 PUF (2nd
) <5.00 <0.12 900 PUF (l5t) <5.00 <0.12
PUF(2nd) <5.00 <0.12
5.4.3. Fe-S07 A Combustion Test Table 5.4.3.1 shows net amount of sample gasified for FC-807 A combustion tests. The sample probe was weighed before and after the combustion tests.
Table 5.4.3.1. Net Amount of Gasified Sample for FC-S07 A Combustion Test Temperature Usage Loaded Dried Remaining Net Amount of
(0C) Mass Masse (mg) Gasified
600
900
PUF' TBb PUF TB
(mg) (mg) Sample (mg) 2.68 0.59 0.00 0.59 2.68 0.59 0.00 0.59 2.43 0.53 0.08 0.45 2.55 0.55 0.02 0.53
• In-line GClMS analysis and off-gas collection using PUF. b Off-line GCIMS analysis using Tedlar Bag. o Calculated based on the water contents (78%).
Tables 5.4.3.2, 5.4.3.3, and 5.4.3.4 show the flow rate profiles used for FC-807 A combustion tests at 600 and 900°C, and the blank test between 600 and 900°C, respectively. The detailed explanation for each value can be found in section 5.4.1. PUF samples were collected from the blank runs between the 600° and 900°C test runs. The unheated valve/transfer line tubing downstream of the reactor/transfer line tubing was also extracted after the combustion test at 600°C. The purpose of these analyses was to measure the carryover between the tests on a single fluorocarbon product done at 600 and 900°C.
Table 5.4.3.2. Flow Rate Profile for FC-S07 A Combustion Test at 600°C Time Period
(sec)
0- 60 60 - 85' 85 - 157 157 - 167 167 -177 177 - 197
Reactor Flow Rate (ml/min)
Air 9.70 0.00 9.70 9.70 9.70
8.89 (He)'
Pyroprobe Flow Rate (mllmin)
22
Total Flow Rate (mllmin)
Volume (ml)

Table 5.4.3.3. Flow Rate Profile for FC-S07 A Combustion Test at 900°C Time Period
(sec)
0-60 60 - 84' 84 - 178 178-188 188 - 198 198-218
Reactor Flow Rate (ml/min)
Air 7.25 0.00 7.25 7.25 7.25
6.27 (He)'
Pyroprobe Flow Rate (ml/min)
Total Flow Rate (mllmin)
Volume (ml)
Table 5.4.3.4. Flow Rate Profile for Blank Analysis between 600 and 900°C Time Period Reactor Flow
(sec) Rate (mllmin) Air
0-120 9.70 120-130 9.70 130 - 140 9.70 140-160 8.89 (He)b
Pyroprobe Flow Rate (ml/min)
Air CH, 0.84 0.00
0.84 ~ 4.63' 0.00 4.63 0.00
4.53 (He)' 0.00
Total Flow Rate (ml/min)
10.54 I 0.54 ~ 14.33
14.33 13.42
Volume (ml)
21.08 2.07 2.39 4.47
Total Volume (ml) 30.01 'Linear increase ( approximate). b., Switched to helium for sweep
5.4.3.1. In-line GCIMS Analysis Figure 504.3.1 shows the total ion chromatogram for FC-S07 A combustion at 600°C. The first peak at 0.6 to 1.3 min. was not clearly identified. The second peak at 1.9 to 2.4 min. was identified as sulfur dioxide. The peak at 7.1 min. was identified as carbon disulfide. The peak at S.I min. which shows strong spectra at mlz = 69 and 5 I was not clearly identified. Peaks at 10.3 and 11.1 min. were identified as benzene and fluorobenzene, respectively. The wide peak that appeared at 11.2 to 12.6 min and the subsequent background correspond to tetrafluorosilane. The two major peaks after tetrafluorosilane were not clearly identified. Figure 5.4.3.2 shows the total ion chromatogram for FC-S07A combustion at 900°C. The first peak at 2.0 to 2.S min. corresponds to sulfur dioxide. The largest peak at 1504 min. and the subsequent high background correspond to tetrafluorosilane.
23

. '''''-'
7000001 a~oooo -1 6000000
5<500000 !
:::::: 1 .... 000000 J
:::::: j' 250000
200000 j
,~oooo 1 I 100000 I 50000 _ I~ I~ I Ii, I
o .Lll.j~~."-"'.'>~" 0:>_00 10.00
I I I I
30.00 3:>.00
Figure 5.4.3.1. In-line GCIMS Ion Chromatogram for FC-S07A at 600°C
AbundarlO::.;e
800000
700000
600000
500000
4-00000
300000
200000
TIC: FC4-90_1.D
'00000 l IJ\, ~~~ o _A .• ' '--. r
5.00 10.00 15:00 ~
20.00
Figure 5.4.3.2. In-line GCIMS Ion Chromatogram for FC-S07 A at 900°C
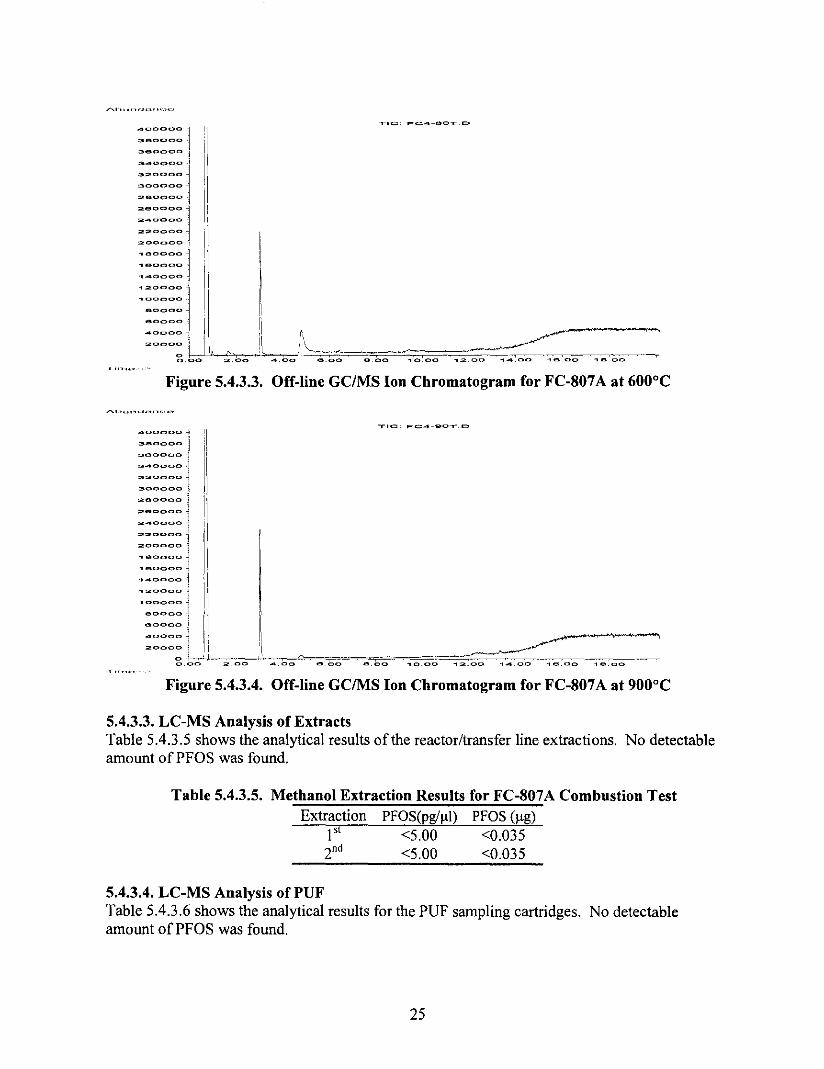
5.4.3.2. Off-line GCIMS Analysis Figure 5.4.3.3 shows the total ion chromatogram for off-line GC/MS analyses for FC-S07 A combustion at 600°C. The largest peak at the beginning is associated with air. The second peak at 3.0 min. and the third peak at 4.S min. were identified as sulfur dioxide and difluorodimethylsilane, respectively. There were no further identifiable peaks. Figure 5.4.3.4 shows the total ion chromatogram for off-line GC/MS analyses for FC-S07 A combustion at 900°C. Similar results were obtained. The largest peak at the beginning is associated with air. The second peak at 3.0 min. and the third peak at 4.S min. correspond to sulfur dioxide and difluorodimethylsilane, respectively.
24
......... ".,-., .... " .. ,.,~.' .. , .... 00000
0 1 !i ",800000 - ,
380000 j i
:::::: j II 2800001 I
:::::: 1 1
2200001 ·11 2000000 '
!I
Figure 5.4.3.3. Off-line GCIMS Ion Chromatogram for FC-807A at 600°C
400000 --l
:::::: 1 "'20000 ~! 300000 j
2BOOOO -lj' 2 ... 0000
240000
:::::: 1 -.$0000
.. aoooo
:::::: ji I -.00000
60000 i I'i :::::~ Ii ~~ 2000: L1J _~---"-~ __ ~~ ..
0,00 --C02-;:.O:OCO--"-_::-.O:::oo:-"=~e~.00 $.00 10.00 ....... 00 ""'.00 C:C'6:C-.0=0C-
Figure 5.4.3.4. Off-line GCIMS Ion Chromatogram for FC-807 A at 900°C
5.4.3.3. LC-MS Analysis of Extracts Table 5.4.3.5 shows the analytical results of the reactor/transfer line extractions. No detectable amount of PFOS was found.
Table 5.4.3.5. Methanol Extraction Results for FC-807A Combustion Test Extraction PFOS(pg/Jll) PFOS (Jlg)
1st <5.00 <0.035 2nd <5.00 <0.035
5.4.3.4. LC-MS Analysis of PUF Table 5.4.3.6 shows the analytical results for the PUF sampling cartridges. No detectable amount ofPFOS was found.
25
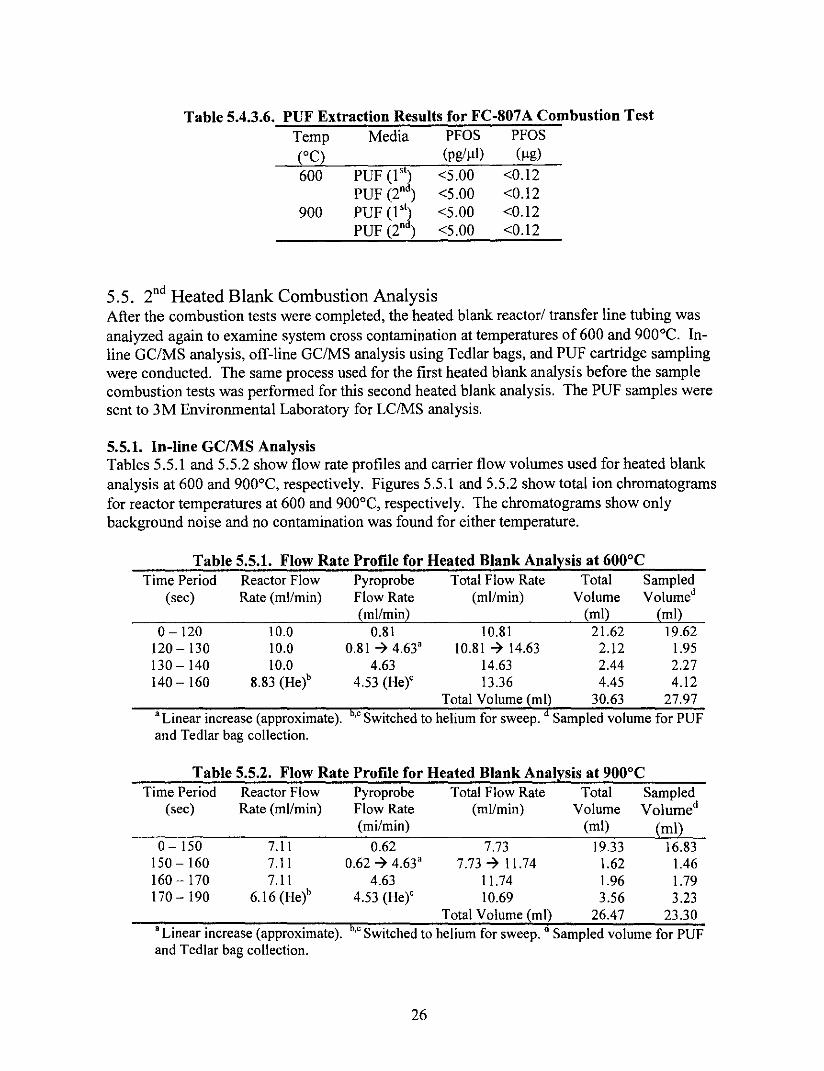
Table 5.4.3.6. PUF Extraction Results for FC-807 A Combustion Test Temp Media PFOS PFOS COC) (pgl,.t1) (J!g)
600 PUF (1st) <5.00 <0.12 PUF (2nd
) <5.00 <0.12 900 PUF(lsJ <5.00 <0.12
PUF (2n ) <5.00 <0.12
5.5. 2nd Heated Blank Combustion Analysis After the combustion tests were completed, the heated blank reactorl transfer line tubing was analyzed again to examine system cross contamination at temperatures of 600 and 900°C. Inline GC/MS analysis, off-line GC/MS analysis using Tedlar bags, and PUF cartridge sampling were conducted. The same process used for the first heated blank analysis before the sample combustion tests was performed for this second heated blank analysis. The PUF samples were sent to 3M Environmental Laboratory for LC/MS analysis.
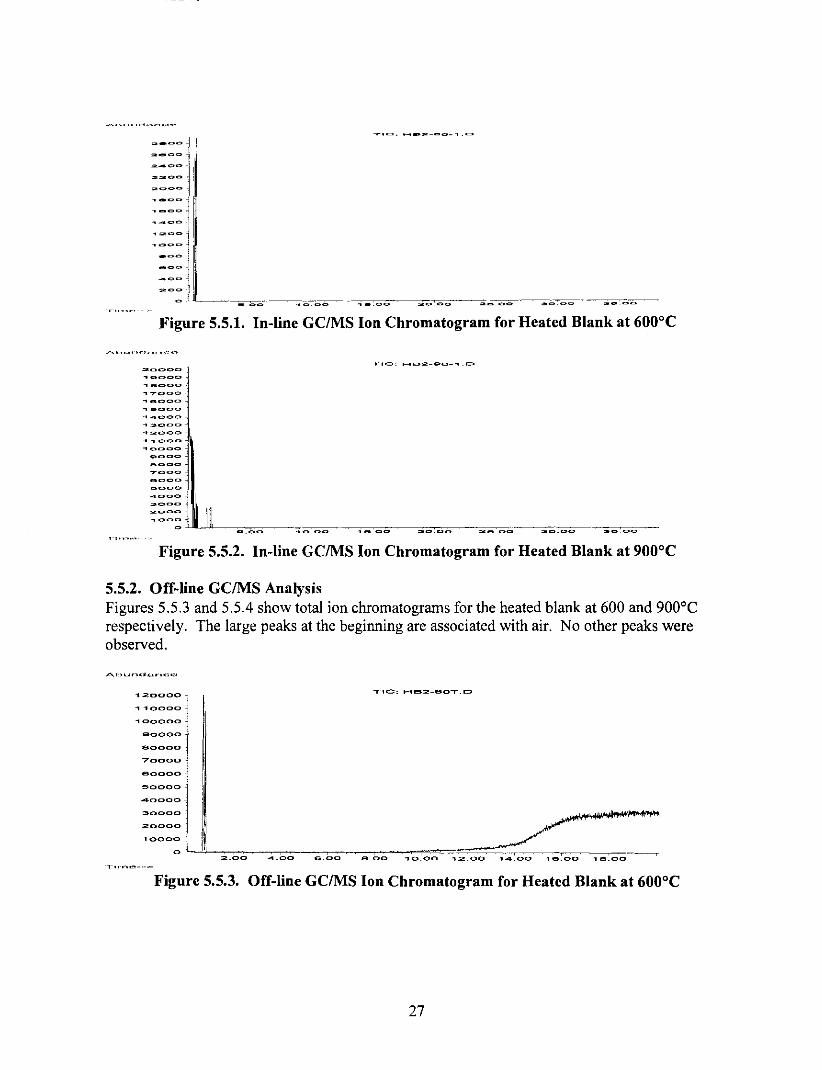
5.5.1. In-line GC/MS Analysis Tables 5.5.1 and 5.5.2 show flow rate profiles and carrier flow volumes used for heated blank analysis at 600 and 900°C, respectively. Figures 5.5.1 and 5.5.2 show total ion chromatograms for reactor temperatures at 600 and 900°C, respectively. The chromatograms show only background noise and no contamination was found for either temperature.
Table 5.5.1. Flow Rate Profile for Heated Blank Analysis at 600°C Time Period Reactor Flow Pyroprobe Total Flow Rate Total Sampled
(sec) Rate (ml/min) Flow Rate (m1!min) Volume Volumed
0-120 120-130 130 - 140 140-160
10.0 10.0 10.0
8.83 (He)b
(mllmin) (ml) (ml) 0.81 10.81 21.62 19.62
0.81 -? 4.63' 10.81 -? 14.63 2.12 1.95 4.63 14.63 2.44 2.27
4.53 (He)' 13.36 4.45 4.12 Total Volume (ml) 30.63 27.97
'Linear increase (approximate). b., Switched to helium for sweep. a Sampled volume for PUF and Tedlar bag collection.
Table 5.5.2. Flow Rate Profile for Heated Blank Analysis at 900°C Time Period Reactor Flow Pyroprobe Total Flow Rate Total Sampled
(sec) Rate (mllmin) Flow Rate (ml/min) Volume Volumed
0-150 150-160 160 - 170 170-190
7.11 7.11 7.11
6.16 (He)b
(mi/min) (ml) (ml) 0.62 7.73 19.33 16.83
0.62 -? 4.63' 7.73 -? 11.74 1.62 1.46 4.63 11.74 1.96 1.79
4.53 (He)' 10.69 3.56 3.23 Total Volume (ml) 26.47 23.30
'Linear increase (approximate). b., Switched to helium for sweep. a Sampled volume for PUF and Tedlar bag collection.
26
, -~~ l' ... ~C>C>
-~~
-~~ J .. _<o>c> .1 ~C>: .1
Figure 5.5.1. In-line GCIMS Ion Chromatogram for Heated Blank at 600°C
Figure 5.5.2. In-line GCIMS Ion Chromatogram for Heated Blank at 900°C
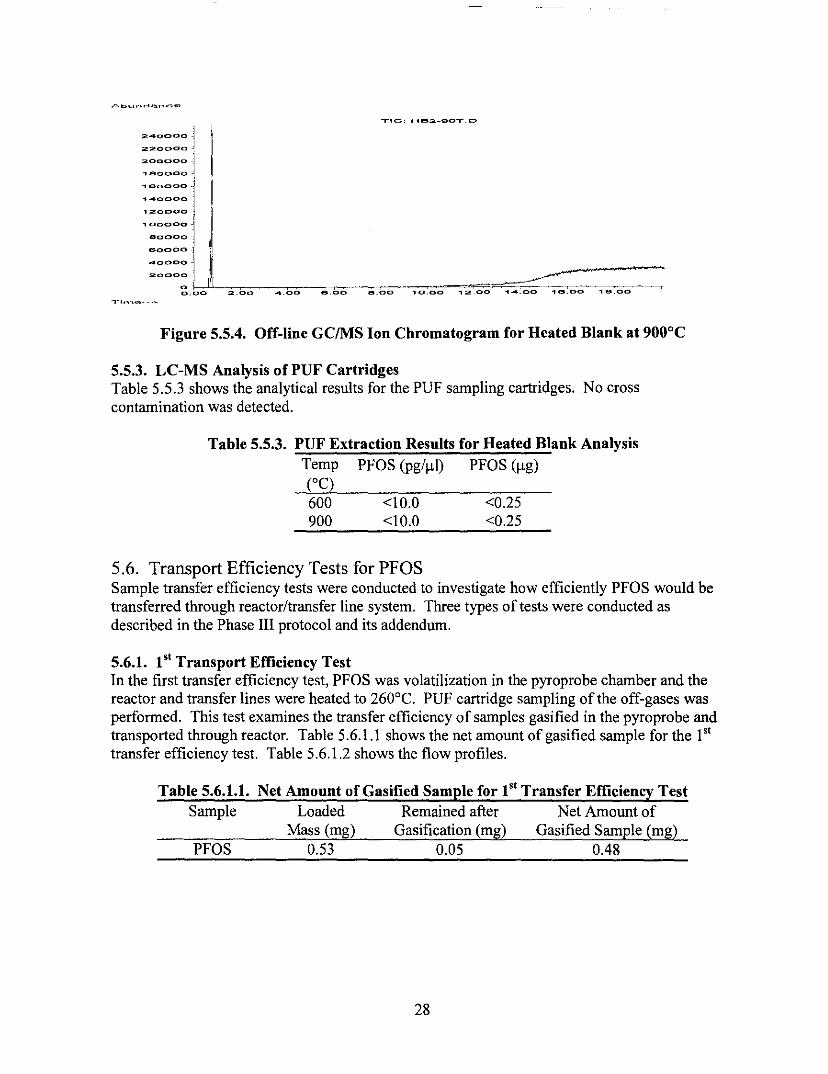
5.5.2. Off-line GCIMS Analysis Figures 5.5.3 and 5.5.4 show total ion chromatograms for the heated blank at 600 and 900°C respectively. The large peaks at the beginning are associated with air. No other peaks were observed.
"'120000 ....c: H62-60'.D
""0000-
.,00000
90COO
80000·
70000
60000-
1" ,,-r."~····~
Figure 5.5.3. Off-line GCIMS Ion Chromatogram for Heated Blank at 600°C
27
2 ..... 0000 1 220000
200000 ]
:::::: '1' "'1 ..... 0000
"'120000
"'1 ::::: -I ',I
60000
,.c::::, Ha2_90,.c>
:::::LL ~,-------0.00 2.00 ...... 00 8.00 a.oo "'10.00 "'12.00 ''''''_00 "'16:00 "'18.00
Figure 5.5.4. Off-line GCIMS Ion Chromatogram for Heated Blank at 900°C
5.5.3. LC-MS Analysis of PUF Cartridges Table 5.5.3 shows the analytical results for the PUF sampling cartridges. No cross contamination was detected.
Table 5.5.3. PUF Extraction Results for Heated Blank Analysis Temp PFOS (pg/Ill) PFOS (Ilg) (Oe)
600 <10.0 <0.25 900 <10.0 <0.25
5.6. Transport Efficiency Tests for PFOS Sample transfer efficiency tests were conducted to investigate how efficiently PFOS would be transferred through reactor/transfer line system. Three types of tests were conducted as described in the Phase III protocol and its addendum.
5.6.1. lSI Transport Efficiency Test In the first transfer efficiency test, PFOS was volatilization in the pyroprobe chamber and the reactor and transfer lines were heated to 260°C. PUF cartridge sampling of the off-gases was performed. This test examines the transfer efficiency of samples gasified in the pyroprobe and transported through reactor. Table 5.6.1.1 shows the net amount of gasified sample for the lSI
transfer efficiency test. Table 5.6.1.2 shows the flow profiles.
Table 5.6.1.1. Net Amount of Gasified Sample for lSI Transfer Efficiency Test Sample Loaded Remained after Net Amount of
Mass (mg) Gasification (mg) Gasified Sample (mg) PFOS 0.53 0,05 0.48
28

Table 5.6.1.2. Flow Rate Profile for 1,t Transfer Efficiency Test" Time Period Reactor Flow Pyroprobe Total Flow Rate Total Sampled
(sec) Rate (mllmin) Flow Rate (mllmin) Volume Volume'
0-60 60-84 84 -156 156-166 166-186
16.0 0.00 16.0 16.0 16.0
(mllmin) (ml) (ml) 0.82 16.82 16.82 15.82 0.00 0.00 0.00 0.82 16.82 20.18 18.98
0.82 ~ 4.53b 16.82 ~ 20.53 3.11 2.95 4.53 20.53 6.84 6.51
Total Volume (ml) 46.95 44.26 'Helium was used for all carrier flow. b Linear increase (approximate).' Sampled volume for PUF collection.
Table 5.6.1.3 shows the PUF cartridge sampling results for PFOS. No sample was recovered from the PUF cartridge. This result indicates that the sample was either thermally dissociated in the pyroprobe chamber or the gasified sample was completely condensed in the pyroprobe/reactor transfer line tubing.
Table 5.6.1.3. PUF Extraction Results for 1,t Transfer Efficiency Test Sample PUF PFOS PFOS
Extracts (Pg/fll) (flg) PFOS 1st <5.00 <0.12
2nd <5.00 <0.12
5.6.2. 2nd Transfer Efficiency Test To investigate the possibility that the sample condensed on the walls of the pyroprobe/reactor transfer line, the sample was collected directly from the pyroprobe upstream of the reactor. PUF sample cartridges were connected to the pyroprobe using the shortest possible transfer line heated to 260°C. The pyroprobe and transfer line were extracted using methanol. Table 5.6.2.1 shows the net amount of gasified sample for 2nd transfer efficiency test. Table 5.6.2.2 shows the flow profiles.
Table 5.6.2.1. Net Amount of Gasified Sample for 2nd Transfer Efficiency Test Sample Loaded Remained after Net Amount of
Mass (mg) Gasification (mg) Gasified Sample (mg) PFOS 0.47 0.00 0.47
29

Table 5.6.2.2. Flow Rate Profile for 2nd Transfer Efficiency Test" Time Period
(sec) 0-60
60 - 82 82 - 176 176-186 186 - 216
Pyroprobe Flow Volume Rate (ml/min) (ml)
0.63 0.63 0.00 0.00 0.63 0.99
0.63 ~ 4.53b 0.43 4.53 2.27
Total Volume (ml) 4.32 "Helium was used for carrier flow. bLinear increase (approximate).
Table 5.6.2.3 shows the analytical results for the extracts. Table 5.6.2.4 shows the analytical results for PUF cartridge samples. This test shows that measurable amounts of PFOS survive pyrolysis conditions of the pyroprobe, and enter the heated transfer lines up to the reactor. However, none of the PFOS survives transit to the PUF sampling cartridge.
Table 5.6.2.3. Methanol Extraction Results for 2nd Transfer Efficiency Test Sample Extracts PFOS PFOS
(pg/gl) (gg) PFOS 1 st 897 21
2nd <10.0 <0.24
Table 5.6.2.4. PUF Extraction Results for 2nd Transfer Efficiency Test Sample PUF PFOS PFOS
Extracts (pg/gl) (gg) PFOS 1 st <10.0 <0.25
2nd <10.0 <0.25
5.6.3. 3rd Transfer Efficiency Test A 3rd transfer efficiency test was conducted to examine how much PFOS can be transferred through the reactor/transfer line tubing and sampled by PUF cartridges if these samples were formed in the reactor. Two methanol extracts were obtained: I) the heated reactor/transfer line tubing and 2) the unheated valve and associated transfer line tubing upstream of the PUF cartridges. Table 5.6.3.1 shows the net amount of gasified sample for each test. The experiments were carried out using both air and helium to compare the results. After a sample was placed in the reactor and the system was closed, the temperature of GC oven was increased to prevent the condensation of gasified sample. When the GC oven temperature reached 260°C, the furnace temperature was set to the temperature shown in Tables 5.6.3.2 and 5.6.3.3. The offgas collection using PUF cartridges was initiated when the GC oven started heating.
30

Table 5.6.3.1. Net Amount of Gasified Sample for PUF Collection Sample Carrier Loaded Remained after Net Amount of
PFOS PFOS
Gas Mass Gasification Gasified Sample
Air He
(mg) (mg) (mg) 0.48 0.00 0.48 0.50 0.04 0.46
Tables 5.6.3.2 and 5.6.3.3 also show flow rate profiles PFOS gasification under oxygen-rich and oxygen-deficient conditions.
Table 5.6.3.2. Flow Rate Profile for PUF Collection (pFOS Gasification with Air) Time Period Temperature Carrier Gas Used Total Volume Sampled Volume'
(sec) Condition ('C) and Flow Rate (mllmin) (ml) (ml) 0-439 GC Oven 25 ~ 260 Air 10.7 78.29 70.97
439 - 637 Furnace 103 ~ 575 Air 10.7 35.31 32.0 I 637 -937 GC ~ 260, Furnace ~ 575 Air 10.7 53.50 48.50 937 - 997 GC ~ 260, Furnace ~ 575 He 8.6 8.60 7.60
Total (m!) 175.70 159.08 • Sampled volume for PUF collection.
Table 5.6.3.3. Flow Rate Profile for PUF Collection (PFOS Gasification with He) Time Period Temperature Carrier Gas Used Total Volume Sampled Volume'
(sec) Condition ('C) and Flow Rate (ml/min) (ml) (ml) 0-410 GC Oven 30 ~ 260 He 10.8 73.80 66.97
410-615 Furnace 140 ~ 575 He 10.8 36.90 33.48 615 -975 GC ~ 260, Furnace ~ 575 He 10.8 64.80 58.80
Total (ml) 175.50 159.25 , Sampled volume for PUF collection.
Tables 5.6.3.4 and 5.6.3.5 show the amount of recovered sample from the extracts and the PUF cartridges, respectively. The 3,d transfer efficiency test showed quite clearly that some measurable PFOS (3.8% air, 11 % He) could pass from the heated reactor where it was volatilized in this test to the PUFs. Larger amounts ofPFOS (4.4% air, 30% He) also accumulated in the reactor/transfer lines upstream ofthe PUF cartridges. The majority ofthe PFOS accumulated in the portion of the transfer line heated to 260°C, suggesting that this compounds could condense, or were in a particulate form, at this temperature.
Table 5.6.3.4. ReactorNalve Transfer Line Extraction Results Sample Gasification Location Extracts PFOS PFOS
(Pg/fLl) (fLg) Reactor 1" 1908 24
Air 2'd 35.4 0.45 Valve I" 696 2.4
PFOS 2'd 22.8 0.079 Reactor I" 13530 171
He 2'd 150 1.9 Valve I" 2218 7.7
2'd 102 0.35
31

Table 5.6.3.5. PUF Extraction Results Sample Carrier Cartridge PFOS PFOS
Gas (E!l/~l) (~!l) PFOS He 1st 2330 58
2"0 44 l.l Air 1 sf 997 25
2"0 <10.0 <0.12
5.7. Sulfur Recovery Rate as S02, SOF2, and S02F2 Based on the in- and off-line GS/MS analyses, sulfur was found mainly as S02. No SOF2 and S02F2 were detected. The sulfur recovery rate as S02 using in-line GCIMS system was not quantitatively repeatable. This was due primarily to the low S02 peak resolution using the cryogenic focusing method at -60°C with a holding time of ca. 4 min. Because the S02 peaks using the off-line GCIMS system were much sharper than S02 peaks observed using in-line GC/MS, we decided to use off-line GCIMS analytical results to quantitatively analyze the sulfur recovery analysis as S02. The detailed operational procedures were described in Section 5.4.
Table 5.7.1 and Figure 5.7.1 show the calibration results. The sulfur recovery rate is reported on a molar basis. The formula obtained from this calibration was:
S02 (Mol) =[Area + 494980]1 [1.7997x 10¹⁴]
Table 5.7.1. S02 Calibration Results Using PLOT Column
Conc. (ppm) Mol. # Area 1 Area 2 Area (Avg) 1000 4.09E-08 7191079 6980771 7085925 700 2.86E-08 4414365 4366705 4390535 400 1.63E-08 2304594 2295497 2300046 100 4.09E-09 425431 416699 421065
32

'" ~ '" '" ~ 0-
8.010'
--y d, -4. 9498e+osl+ 1.7997e+1~X R= 0.99656
7.0 10'
6.0 10'_ ...
5.010'-·
.+;>~r 4.0 10'
3.0 10'
.. ~:~~V,· +1
/! 2.0 10'_···················· 'V··········/············:,··················· .......... , ........................... L ......................... i
1.0 10'
0.0 1 oO+··~····,·· ./ ... -..... ~ ..... , ... +-,-~--r-;--,~--,---ri---,---r-... --;-.--,--r---r--f o
Mol
Figure 5.7.1. S02 Calibration Curve (Molar Number vs. Peak Area)
Prior to the sulfur recovery analysis as S02, a third S02 transfer efficiency test was conducted using the off-line analysis approach. Table 5.7.2 shows the results. Air was flowed through the reactor at 8.85 mllmin for 2 min. 30 sec. while the S02 standard was being injected and the offgas was collected using a Tedlar bag. The average recovery rate was 75.6%. This is very similar to the recovery rates obtained from the in-line analysis, i.e. 83.7 and 76.4%, suggesting that the lack in 100% recovery is due to sample losses in the combustion system and not the sampling and analysis procedures.
Table 5.7.3 shows sulfur recovery rate as S02 for PFOS, FC-J395 and FC-807A. The last column shows the sulfur recovery rate taking into account a transfer efficiency rate of75.6%. Results for the Cg perfluorosulfonamides were quite reasonable, J 00±25%. Results for PFOS were not as good, with recovery rates of only 50--60%.
Volume (ml) 22.13 22.13
Table 5.7.2. Standard S02 Transfer Efficiency Area Calculated Mol. # # of Mol. Used Transfer Efficiency (%)
10591947 1.36E-06 1.63E-06 83.4 8515987 l.ll E-06 1.63E-06 67.8
Average 75.6
33
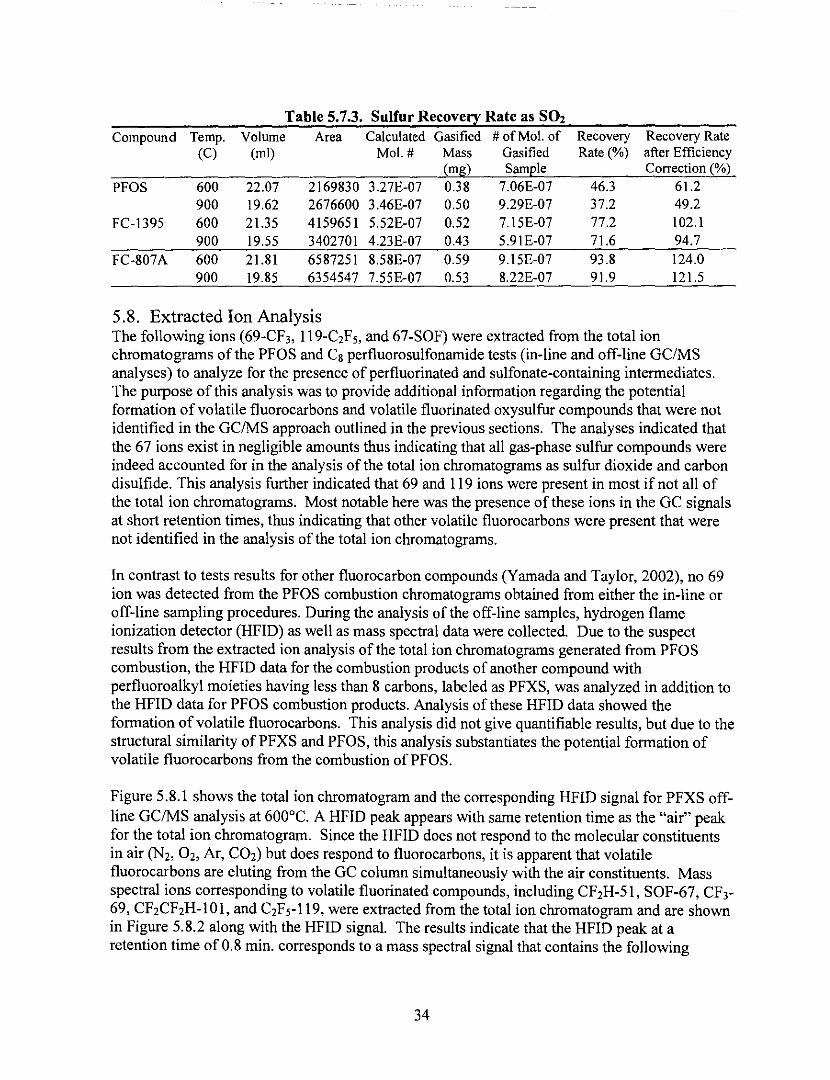
Table 5.7.3. Sulfur Recove!:r Rate as S02 Compound Temp. Volume Area Calculated Gasified # of Mol. of Recovery Recovery Rate
(C) (ml) Mol. # Mass Gasified Rate (%) after Efficiency (mg) Samrle Correction (%)
PFOS 600 22.07 2169830 3.27E-07 0.38 7.06E-07 46.3 61.2 900 19.62 2676600 3.46E-07 0.50 9.29E-07 37.2 49.2
FC-1395 600 21.35 4159651 5.52E-07 0.52 7. 15E-07 77.2 102.1 900 19.55 3402701 4.23E-07 0.43 5.91E-07 71.6 94.7
FC-807A 600 21.81 6587251 8.58E-07 0.59 9.15E-07 93.8 124.0 900 19.85 6354547 7.55£-07 0.53 8.22E-07 91.9 121.5
5.8. Extracted Ion Analysis The following ions (69-CF3, 119-C2Fs, and 67-S0F) were extracted from the total ion chromatograms ofthe PFOS and Cs perfluorosulfonamide tests (in-line and off-line GC/MS analyses) to analyze for the presence of per fluorinated and sulfonate-containing intermediates. The purpose of this analysis was to provide additional information regarding the potential formation of volatile fluorocarbons and volatile fluorinated oxysulfur compounds that were not identified in the GC/MS approach outlined in the previous sections. The analyses indicated that the 67 ions exist in negligible amounts thus indicating that all gas-phase sulfur compounds were indeed accounted for in the analysis of the total ion chromatograms as sulfur dioxide and carbon disulfide. This analysis further indicated that 69 and 119 ions were present in most if not all of the total ion chromatograms. Most notable here was the presence of these ions in the GC signals at short retention times, thus indicating that other volatile fluorocarbons were present that were not identified in the analysis of the total ion chromatograms.
In contrast to tests results for other fluorocarbon compounds (Yamada and Taylor, 2002), no 69 ion was detected from the PFOS combustion chromatograms obtained from either the in-line or off-line sampling procedures. During the analysis of the off-line samples, hydrogen flame ionization detector (HFID) as well as mass spectral data were collected. Due to the suspect results from the extracted ion analysis of the total ion chromatograms generated from PFOS combustion, the HFID data for the combustion products of another compound with perfluoroalkyl moieties having less than 8 carbons, labeled as PFXS, was analyzed in addition to the HFID data for PFOS combustion products. Analysis of these HFID data showed the formation of volatile fluorocarbons. This analysis did not give quantifiable results, but due to the structural similarity ofPFXS and PFOS, this analysis substantiates the potential formation of volatile fluorocarbons from the combustion ofPFOS.
Figure 5.8.1 shows the total ion chromatogram and the corresponding HFID signal for PFXS offline GCIMS analysis at 600°C. A HFID peak appears with same retention time as the "air" peak for the total ion chromatogram. Since the HFID does not respond to the molecular constituents in air (N2, O2, Ar, CO2) but does respond to fluorocarbons, it is apparent that volatile fluorocarbons are eluting from the GC column simultaneously with the air constituents. Mass spectral ions corresponding to volatile fluorinated compounds, including CF2H-51, SOF-67, CF3-69, CF2CF2H-IOI, and C2Fs-119, were extracted from the total ion chromatogram and are shown in Figure 5.8.2 along with the HFID signal. The results indicate that the HFID peak at a retention time of 0.8 min. corresponds to a mass spectral signal that contains the following
34

fluorocarbon ions: S 1,69, and 119. The SI ion occurs near the tail of the HFID signal while the 69 and 119 ions occur near the peak of the FID signal. Likely candidates that can be attributed to the S I and 69 ions are tri- and tetrafluoromethane. Likely candidates for the 119 ion are penta or hexafluoroethane. Pentafluoroethane is detected at longer retention times and also contains a strong 101 ion that is not present in the unknown peak. It is plausible that hexafluoroethane would elute earlier than pentafluoroethane due to its lower boiling point. Thus, the most probable candidates that correspond to the HFID signal at 0.8 min. are tri- and tetrafluoromethane and/or hexafluoroethane.
A.>' __ .... d."'nee
, 000000 j 900000
800000 -
700000
600000 -j 500000-1
400000
TIC:;: FC=5_60T.C>
[, '-_. ~-- -- --~------.,---~ -----------'--
Figure 5.8.1. Total Ion Chromatogram and Corresponding HFID Signal for Combustion of PFXS at 600°C (off-line sample)
3S
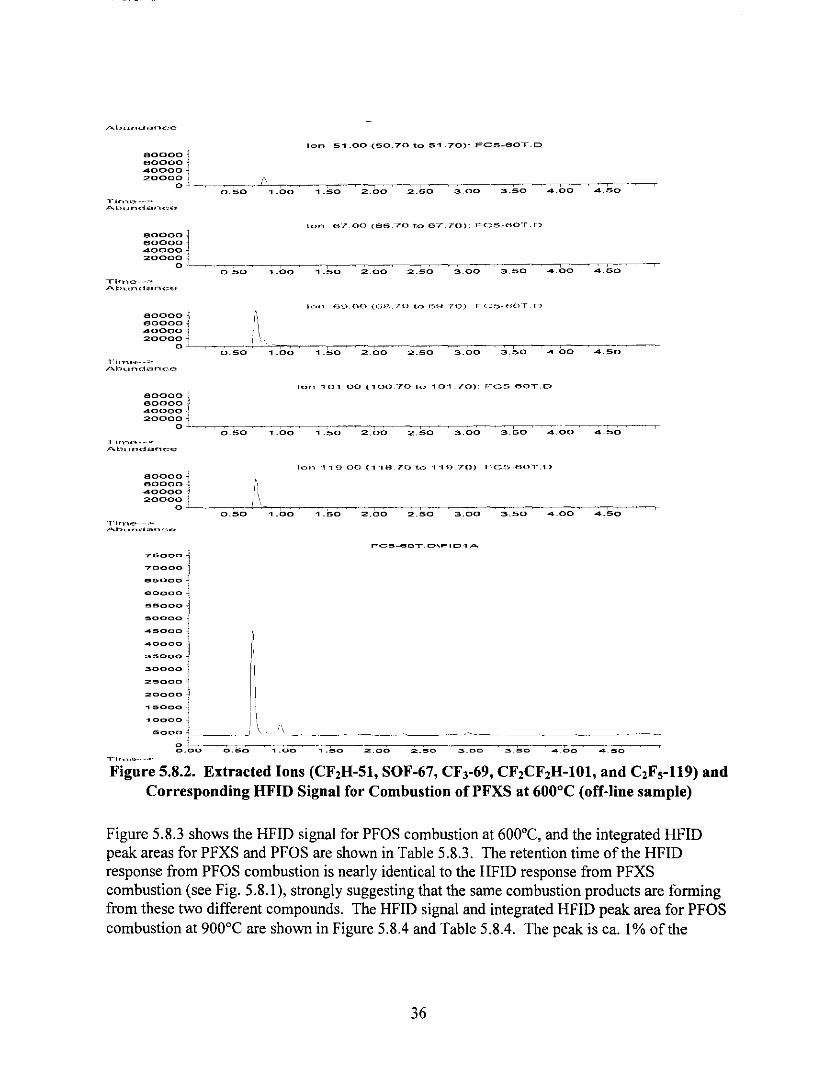
Abu~,d,'~'··'''~''''
l",n',~,.
Ai;) ... ,.,da ... ~".;~
60000-4-0000 20000
80000t
o·~,-~,~~
rir"J"lo--· AI:>,-",<.:I.,.,..c",
40000
0.50 1.00
Ion 51_00 (50.70 to 51.70): FC5_60T.D
lun (-;;'700 (66 70 to fiT. 70): /""<::;5···(-;10""1"' L)
80000 i ","\ 600001
20006 L_~~~~''-'.'··~~-~~-~-~--_~ __ ~_~--;::-=--__ =-c-:-: ~--~ o,~ ,_ '50 2,bo 2,50 3.00 3.50 .bo .~
r~'n.,,·_
,1"bund"-::1nee
80000 .j 60000 l' 40000 20000
a -
I i'n"~·····'-'" Ab'-'nc:fanc~o
80000 -j
0_50
Ion 10'1.00 ('1007'Ot.o 101.70): F'C:;5·-50T.D
.~~.~-~
1.00 1.50 2.00 3.50 4.00 4.50
60000., {" 40000·J \ 2000~il ____ LI~' __ ~ ______ ~~~_' __ -r _____________ ~
'1.50 2.00 2.50 rit ... ·.~,, ___ "'"" r"-hu'~~·.""'''''''"'"''
75000 ~ 700001
035000 i eoooo ~
55000
50000
..... 5000
..... 0000
35000
30000
251000
201000-
15000
10000
0.50 1.00 3.00 3.50 4.00 4.50
(' sao: 11==~~-' \~-.::;::=-=--:::.;=-===:::::.:-::=-=-===~_~~ 0.00 0.50 1.100 .050 2.00 2.50 3.00 3_50 ...... 00 ...... 50
Figure 5.8.2. Extracted Ions (CF2H-Sl, SOF-67, CF3-69, CF2CF2H-IOl, and C2Fs-119) and Corresponding HFID Signal for Combustion ofPFXS at 600°C (off-line sample)
Figure 5.8.3 shows the HFlD signal for PFOS combustion at 600°C, and the integrated HFlD peak areas for PFXS and PFOS are shown in Table 5.8.3. The retention time of the HFlD response from PFOS combustion is nearly identical to the HFlD response from PFXS combustion (see Fig. 5.8.1), strongly suggesting that the same combustion products are forming from these two different compounds. The HFlD signal and integrated HFlD peak area for PFOS combustion at 900°C are shown in Figure 5.8.4 and Table 5.8.4. The peak is ca. 1% of the
36

response obtained at 600°C, thus indicating nearly complete destruction of fluorinated compounds under these conditions.
AI.H.nd"'nc<'"
130000
120000
... '10000
100000
90000
BOODO
70000
60000
50000;
40000 J
30000-
20000
100°:1_ ,p\
0.00 0.50 .... 00
FC7_60T.D\FIP ... A
~=== .... 50 2.00 2.50 3.00 4.50
Figure 5.8.3. HFID Signal for PFOS Combustion at 600°C (off-line sample) Abund<"",n<:~e
160001 "15000
14000
13000
12000
11000
10000-
9000
BOOO
7000
6000 ~
5000~ "0001. J 3000
2000 ~
1000-j
FC7-90T.D\FID1A
J--
g.~-·.oo 4.aC' 0~---=6~.OCO~~B:-.cOCCO~-C'~0~.0~0~-C'~2c.0~0~CC'--:"'.0~0~O-:'C:6:-C.O~O~~'C:B"."'O-=O~~
Figure 5.8.4. HFID Signal for PFOS at 900°C (off-line sample)
Table 5.8.3. Integrated HFID Peak Area of PFXS and PFOS at 600·C Sample Peak Area Net Amount of Gasified
PFXS PFOS
1190193 3547614
Sample (mg) 0.52 0.38
Table 5.8.4. Integrated HFID Peak Area of PFOS at 900°C Sample Peak Area Net Amount of Gasified
Sample (mg) PFOS 39041 0.50
37

6. Discussion
The motivation of this study was to determine the incinerability of per flu oro-oct any I sulfonate (PFOS) and if other perfluoro-octanyl compounds could be transformed to PFOS during the incineration process. A laboratory-scale study simulating a full-scale hazardous waste incinerator was envisioned in the phase I test protocol. Based on prior experience with halogenated compounds, we initially planned to use relatively modest conditions in the primary combustion zone (ca. 400°C) to gasify the materials with more severe high-temperature (600 -900°C), oxidative conditions applying to the secondary combustion zone. TGAs of the active ingredients indicated that higher temperatures (- 600°C) were necessary to gasify these unique materials. The sponsor also requested that the experiment be designed to detect low-level (0.1 %) concentrations of PFOS in the exhaust gases. These factors necessitated the use of large amounts of material (milligram quantities) and high-temperature, long duration exposures (ca. 1250°C, 40 sec) in a specially designed pyroprobe to fully gasify the material. These conditions, while representing quite severe conditions in the primary zone of an incinerator, e.g., a rotary kiln, are representative of the range of conditions that occur in a full-scale system. As such, the approach employed in the laboratory-scale combustion study described in the phase III test protocol is a reasonable extrapolation of a full-scale incineration study of PFOS and its potential precursors.
Combustion tests for PFOS and two Cg perfluorosulfonamides, FC-1395 and FC-807 A, were completed as requested by the sponsor. In-line and off-line GC/MS analyses, reactor effluent sample collection using PUF cartridges followed by LC-MS analysis, and chemical extraction of various transfer lines throughout the reactor system including the reactor itselffollowed LC-MS analysis were conducted to investigate the following: I) the extent of conversion of the active ingredients, 2) the formation of fluorinated intermediate organic products, and 3) the extent of conversion of the sulfur to sulfur oxides.
There was no indication that PFOS was generated from FC-1395 and FC-807 A combustion. No quantifiable amount of PFOS was detectable at a detection limit of ca. 10 ng/ml. During PFOS combustion, small amounts of PFOS were detected in the reactor/transfer line system and the PUF sample cartridges, specifically, 0.04% of gasified sample in the reactor/transfer line system, less than 0.4% in the PUF cartridges at 600°C, and 0.05% in the PUF cartridges at 900°C. High levels of PFOS destruction were thus achieved at temperatures of 900°C.
To validate the experimental results pertaining to the sampling and analysis of PFOS where in many instances the analytical results were below the level of quantitation, a series of transfer efficiency tests were conducted. The goals of the transport (or transfer) efficiency tests were: 1) to see if PFOS could pass through the combustion system under nondestructive conditions and reach the PUF cartridges and, 2) to determine recovery efficiencies and analytical detection limits. In the 1 st transfer efficiency test where the ability of the combustion system to transport PFOS was assessed, analysis of the PUF cartridges indicated the lack of any detectable material. This result indicated that PFOS was either thermally destroyed in the pyroprobe chamber (1250°C) or the gasified sample condensed in the pyroprobe/reactor transfer lines and never reached the PUF sample cartridge. Based on the results of I st transfer efficiency test, a 2nd
transfer efficiency test was conducted to investigate the latter possibility. In these tests,
38

substantial amounts, 3.4% of PFOS gasified, were indeed found in the pyroprobe/transfer line extracts. However, once again, analysis of the PUF cartridges positioned downstream of the pyroprobe/transfer line were negative for PFOS. The 2nd test showed that measurable amounts of PFOS survive pyrolytic conditions in the pyroprobe and the heated (260°C) transfer lines. The unanswered question was how much PFOS was transferred through the reactor/transfer line tubing and sampled by PUF cartridges if this material was formed in the combustion chamber. A 3 rd transfer efficiency test was thus conducted to address this question. In this test, PFOS was placed in the combustion chamber and not into the pyroprobe. The temperature of the combustion chamber and transfer line system was then heated to 260°C. This is the temperature ofthe transfer lines within the oven during the actual combustion tests. At this temperature, TGAs indicated there would be no PFOS volatilization, so there would be no PFOS movement through the system (the TGAs were conducted at UDRI during the Phase I protocol development). The combustion chamber was then heated to 600°C while the transfer lines remained as 260°C. When the combustion chamber was heated, some ofthe PFOS was likely entrained into the gas stream, and a larger proportion was probably destroyed. Nevertheless, a substantial portion of the PFOS was transported through the transfer lines to the PUFs where it was detected. PFOS was also found in the transfer lines. Specifically, results showed that measurable PFOS (3.S% air, 11 % He) passed from the combustion chamber to the PUF sampling cartridges. Results also showed that slightly larger amounts of PFOS (4.4% air, 30% He) accumulated in the reactor/transfer lines upstream of the PUF cartridges. These results demonstrated that if PFOS was formed in the combustion chamber, it would be detected in the PUFs. Therefore, when no PFOS was observed in the transfer lines or PUFs downstream of the combustion chamber in the combustion tests, one could conclude that there must have been very little, if any, PFOS formed during combustion.
A sulfur mass balance was attempted based on the premise that all of the sulfur in the samples would be oxidized to S02, SOF2, and S02F2 under high-temperature oxidative conditions. The GCIMS analyses indicated that the sulfur was recovered as S02 No SOF2 or S02F2 was detected. Recovery rates were variable. Nearly 100% sulfur recovery was obtained from FC-1395. The recovery rate obtained from FC-S07 A was approximately 120%. Recovery rates were 50-60% for PFOS. There are two potential sources of error in the sulfur mass balance. The most likely is the condensation of the active ingredients and their primary degradation products in the pyroprobe and the pyroprobe/reactor transfer lines. The sulfur mass balance does not take into account this potential source of sulfur in the system as these lines were not extracted and analyzed for sulfur compounds. Another potential source of error is the lack of complete quantitative transport ofthe S02. Three S02 transport efficiency tests yielded an efficiency of 7S.6±4 %. The S02 transport efficiency was accounted for in the sulfur mass balance. The high repeatability of these recovery tests suggests that this source of error is small compared to potential condensation of the active ingredients and their primary degradation products including S02 on the wans of the reactor and transfer lines.
GCIMS analysis of the reactor effluent was conducted to assess the formation of combustion intermediates, i.e., products of incomplete combustion. The most abundant combustion byproduct was benzene. Benzene was observed for the all of the samples except PFOS. Fluorobenzene was also observed from the combustion ofFC-1395 and FC S07A. For PFOS, the intermediate in highest concentration at 600°C was a C1 or C2 fluorocarbon alkane, most
39

likely tri- or tetrafluoromethane or hexafluoroethane. At 900°C, the concentration of this compound was much lower in comparison with the 600°C results. The nature of this byproduct and its thermal stability is consistent with other tests we have conducted on fluorinated samples that show that perfluorinated alkanes are stable intermediates and require temperatures in the secondary combustion zone in excess of 900°C for high levels of destruction (Ciba Special Chemicals Corp., 2002). Small amounts of I, I-difluoroethene (PFOS only) and 1,2-difluoroethene (FC-1395 only) were also observed at 600°C. The formation of perfluoroalkanes and alkenes was not unexpected and is consistent with the molecular structure of the starting material, where a Cs saturated fluorocarbon chain is present. There was no evidence to suggest that fluorinated acids were significant combustion products. Fluorinated acids have been observed by GCIMS analysis in combustion studies of other fluorinated materials (Ciba Specialty Chemicals Corp., 2002), but were not observed in this study. The potential formation of fluorinated sulfonic acids could not be ascertained using gas chromatographic techniques. There was no evidence for the formation of more highly fluorinated aromatic compounds, i.e., di- through hexafluorobenzene nor was there evidence to suggest that polyfluorinated biphenyls or dioxins could have formed under these conditions.
Further analytical testing was conducted to verify that the following compounds, potential precursors to PFOS, were not formed during the combustion tests: POSF and CsF 17S02NH2. There was no evidence that these precursors formed during PFOS combustion. Further examination of the total ion chromatograms for the SOF ion also indicated the lack of formation of secondary amine precursors, i.e., N-MeFOSE alcohol (CsF 17S02N(CH3)C2~OH), during the combustion ofPFOS, FC-807A, and FC-1395. A small amount ofundestroyed PFOS was observed in the LC/MS analyses. It is unlikely that PFOS reformed during the combustion process due to the presence of large amounts of methane as the fuel for the combustion process. The presence of excess methane fuel relative to fluorochemical product results in significant concentrations of H atoms that efficiently scavenge F atoms as HF and prevent the reformation of long perfluoroalkyl chains. The hydrocarbon fuel to fluorochemical ratio will likely be even higher under actual incineration conditions, further limiting the reformation of perfluoroalkyl chains. Perfluorinated alkanes, necessary building blocks to the formation of precursors to PFOS, were limited to C1 and C2 compounds, further indicating that reformation of PFOS, requiring Cs perfluoroalkyl chains, did not occur in the combustion system.
40

7. Conclusions
The data presented herein clearly show that incineration of FC-1395 and FC-807 A does not release PFOS to the environment. This conclusion is based mainly on the LCIMS measurements, but was substantiated by the extracted ion analysis that showed negligible 67-S0F ion indicating negligible amounts of volatile sulfonate-containing degradation products. Sulfur recoveries were also quite good, 100±2S%. The dominant sink for sulfur was SOz. GC/MS analysis of perfluorinated alkyl sulfonate precursors indicated that such precursors were not present in the reactor effluent. This finding is consistent with the LCIMS measurements, and strongly suggests that the C-S bond was completely destroyed (and did not reform) in the combustion tests.
High levels of conversion of the PFOS were observed from the incineration tests. This conclusion was based on LC/MS measurements ofthe reactor effluent and a thorough analysis of the transport of the material through the combustion system. Sulfur recoveries varied from 50 to 60%, depending on the reactor temperature. The dominant sink for sulfur was SOz. GCIMS analysis of perfluorinated alkyl sulfonate precursors indicated that such precursors were not present in the reactor effluent. This finding is consistent with the LCIMS measurements, and strongly suggests that the C-S bond was completely destroyed (and did not reform) in the combustion tests.
Fluorinated organic intermediates were observed in the reactor effluent. These compounds were limited to fluorobenzene (FC-1395 and FC-807A only), C1 or Cz fluoroalkanes (likely products are either CHF3, CF4, or CZF6), and l,l-difluoroethene (PFOS only) and 1,2-difluoroethene (FC-1395 only). Higher molecular weight fluorinated polycyclic aromatic hydrocarbons were not observed.
The data from this laboratory-scale incineration study indicates that properly operating full-scale incineration systems can adequately dispose of PFOS and the Cg perfluorosulfonamides. Incineration of these fluorinated compounds is not likely to be a significant source of PFOS into the environment. With the exception of stable C1 and Cz fluorocarbons, fluorinated organic intermediates are also unlikely to be emitted from these facilities during the incineration of these materials.
41

Tsang, W. and Shaub, W., Chemical Processes in the Incineration of Hazardous Materials, Detoxification of Hazardous Wastes, J. Exner, Ed., Ann Arbor, 1982, 41.
43

~U!lS;)lJO S;)WG pUll ;)u!l;)U!!l
1 x!pu;)ddy

P "tT" L" rOJec Ime me Phase I Phase II Phase III
Date 2/1, 2/4, 217,2/15, 2118,2/19,2/24 3/19 -7/29 7/30 8/2 8/8,8/9 8/19, 8/20 8123,8/26 8/27 8/28 8/30 9/3 - 9/5 9/6 9118 - 9/20
March 2001 - October 2001 February 2002 March 2002 - September 2002
Combustion Test Schedule - 2002 Description Standard sample calibration
Combustion test system and method development PFOS extraction Heated blank extraction before combustion test FC-1395 combustion test FC-807 A combustion test PFOS combustion test Heated blank extraction after combustion test PFOS transfer efficiency test PFOS transfer efficiency test Off-line GC/MS S02 calibration Non-heated blank extraction PFOS transfer efficiency test

Appendix 2
Sample descriptions and Certificate of Analysis (C of A) for PFOS sample)

Appendix
Sample descriptions and Certificate of Analysis (C of A) for PFOS sample
3M chemical container descriptions as presented on sample container labels:
ForPFOS
4x4xl1.5 cm (w.xd.xh.) square column shape with 2.2x3.0 cm i.d.xo.d.) circular top made of clear glass with black screw plastic cap
Labeled as:
C8F17S03-K + 98-0211-3916-1 Lot 217
For FC-807A
7.5 cm o.d. x 13.5 cm height circular column shape with 5.2x6.0 cm i.d.xo.d.)circular top made of clear glass with metal screw cap.
Labeled as:
Material FC-807 A 8681 BCAS Time 11:10 Lot No. 30177 Drum T I Step 4 Date 12-22-2K Sampled By C. Senior
For FC-1395
7.5 cm o.d. x 17.5 cm height circular column shape with 1.9x2.5 cm (i.d.xo.d.) circular top made of amber glass with black screw plastic cap.
Labeled as:
Name: FC-1395 Lot#:90086 Date: 1117100
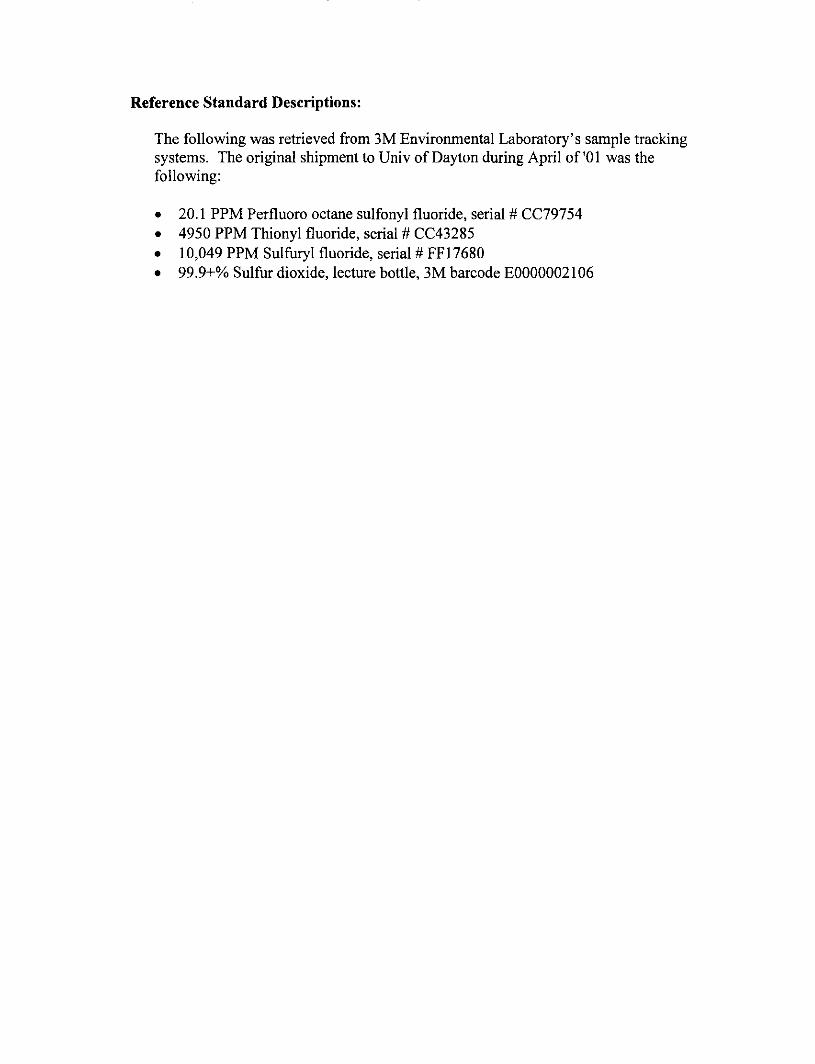
Reference Standard Descriptions:
The following was retrieved from 3M Environmental Laboratory's sample tracking systems. The original shipment to Univ of Dayton during April of'OI was the following:
• 20.1 PPM Perfluoro octane sulfonyl fluoride, serial # CC79754 • 4950 PPM Thionyl fluoride, serial # CC43285 • 10,049 PPM Sulfuryl fluoride, serial # FFI7680 • 99.9+% Sulfur dioxide, lecture bottle, 3M barcode E0000002106

Centre Analytical Laboratories. Inc. 3048 Research Drive Phone: (814) 231·8032
State College, PA 16801 Fax: 1814) 231-1253 or t814) 231·1580
INTER/AI CERTIFICATE OF ANALYSIS Revisio/l 1(9/7/00)
Centre Analytical Laboratories COA Reference #: 023-01SA 3'\1 Product: PFOS, Lot 217
Test Name
j Purity
,~\ppearance
0de-nri fication :'&IR
f\1etals (lCPIMS) : 1. Calcium
2. Magnesium 3. Sodium 4, Potassium' 5. Nickel 6, [ron " Manganese
i fotal 'Yo Impurity (NMR) , Total % Impurity . (LCMS) , Tota! % Impurity i (OeMS)
Related Compounds -POAA Residual Solvents (TOA) Punty by DSC
i Inorgamc Anions (IC) 1. Chloride o Fluoride ], Bromtde 4, Nitrate 5. Nitrite 6. Phosphate 7. Sulfate'
: Organic Acids' (IC) 1. TFA 0 PFPA .. HFBA 4, ?-lFPA
Elemental Analysis': 1, Carbon 2, Hydrogen 3. :'\fitrogen 4, Sulfur , Fluorine
Reference #: SD-018
I. o
3. 4, 5.
Purity: 86.9% Specifications
White Crystailme Powder
Theoretical V"luc = 17,8% Theoretical Value = O(~';l
TheoretIcal Voluc ~ O'.~'o Theoretlcal Value = 5.95% Theoretical Value = 60%1
Result
86.9%
Conforms
1. 0.005 wt. \\'t.%, 2. 0.001 w1.;\\t, %) 3. 1.439 wt./\vt.(~'o 4, 6.849 \vt.!wt.% 5. <O'(Hll \\1,;wl.%
6. 0,005 wuw1,% 7. <0.001 wt.\vt.%
t-ione Detected
"one Detected ,,",Ot Applicable'
1. <0.015 IV!':Wt.'\';,
2. 0.59 \\1'/Wt.%)
], <0.040 IVL'wl.'''o 4 <0.009 WLwt.% 5, <O.O()(i \\,L'WI. % 6, <0.007 wt.!wt.%
8.76 wt,i\Vt.°Al
i. <0.1 \\'t. iWr. ,>:) 2. <0.1 \\'l./\\T(~'()
~. O,lOwt./wt,(% 4. 0.28 \\,!)wt.%
1. 12.48 wt .. \n.I~!(1 0 0,244 wt. Wt.!/()
.. \74IVt. \\"1.°/1)
4. 8,84 \\ t wt. '~'{l 5. 54,\ \\"1. \\"1. %J

Centre Analytical Laboratories, Inc 3048 Research Drive Phone: (814) 231-8032
State College, PA 16801 Fax: (814) 231-1253 or (814) 231-158C
lNTERIM CERTIFlCATE OF ANALYSIS Centre Analytic:!l Laboratories COA Reference #: 023-018A
Date of Last Analysis: 08!31/00
Expiration Date: 08!31/01
Storage Conditions: Frozen :'0-1 ooe
Re-assessment Date: 08i3110 I
I Purity = 100% - (sum of metal impuritie.s, 1.45% +LC/MS impurities, 8.41 %+Inorganic Fluoride, 0.S9%+NMR impurities, 1.93%+organic acid impurities, 0.38%.+POAA. 0.33%)
Total impurity from all tests = 13.09% Purity = 100% - 13.09% = 86.9'%
'Potassium is expected in this salt form and is therefore not considered an impurity.
}Purity by DSC is generally not applicable to materials oflow purity. No endotherm was observed for this sample.
4Sulfur in the sample appears to be converted to S04 and hence detected using the inorganic anion method conditions. The anion result agrees well with the sulfur detemlination in the elemental analysis, lending confidence to this interpretation. Based on the results, the SO. is not considered an impurity.
'TFA HFBA NFPA PFPA
Trifluoroacetic acid Heptafluorobutyric acid Nonofllloropentanoic acid Pentafluoropropanoic acid
"Theoretical value calculations based on the empirical formula, CSF I7SO j 'K+ (MW=538)
This work was conducted under EPA Good Laboratory Practice Standards (40 eFR 160).
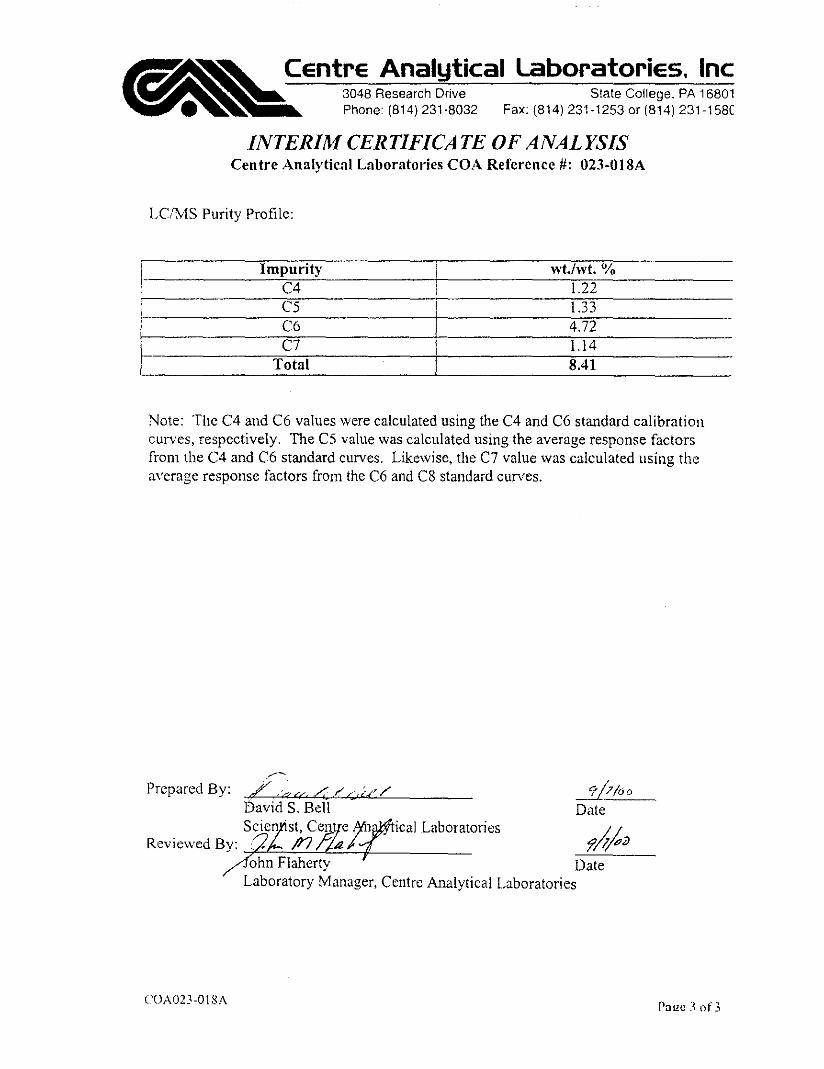
,
Centre Analytical Laboratories. Inc 3048 Research Drive Phone: (814) 231·8032
State College, PA 16801 Fax: (814) 231·1253 or (814) 231-158C
INTERIM CERTIFICATE OF ANALYSIS Cen tre Analytical Laboratories COA Reference #: 023-018A
LC/MS Purity Profile:
Impurity \.-
C4 wt./wt. 'Yo
1.22 i C5 !--
C6 1.33 4.72 ,
i
F C7 Total
1.14 8.41
Note: The C4 and C6 values were calculated using the C4 and C6 standard calibration curves, respectively, The C5 value was calculated using the average response factors from the C4 and C6 standard curves. Likewise, the C7 value was calculated using the average response factors from the C6 and C8 standard curves.
,.---
Prepared By: L'««,o4 / < ',::/' I" David S. Bell
CDA023·018A
ical Laboratories
...2l!/60 Date
Pa!!c 3 of 3
Appendix 3
Phase II Final Report and Raw Data

August 1, 2002
3M Phase II Final Report: Laboratory-Scale Thermal Degradation
of Perfluoro-octanylsulfonate and Cs Perfluoroalkyl Sulfonamides
Summary
Prepared by: Environmental Sciences and Engineering Group
University of Dayton Research Institute
Calibration curves and detection limits for S02, SOF2, S02F2, POSF, and C3F6 (hexafluoropropene (HFP)) have been established. The transport efficiency through the UDRI thermal instrumentation system for each compound was also examined. This report describes experimental setup, operating procedure, analytical methods and their results. The calibration plots, linear fit equations, detection limits, and transport efficiency are provided in this report. Verification that Cg perfluoroalkyl sulfonates can be gasified and transported through the system will be performed following the completion of the phase III tests. This decision was made based on the potential contamination of the system had the transport tests been done prior to the phase III combustion study. HFP was selected as the surrogate volatile fluorocarbon due to the lack of availability of CF4 and CF JH from gas suppliers.
Experimental Setup
Six standards (S02, SOF2, S02F2, POSF and HFP) were injected through the STDS reactor configuration that will be used for the Phase III combustion test. The same samples were also injected directly into the GCIMS system and compared with the earlier tests to derive the transport efficiency for each material. Figure I shows a schematic diagram of reactor and in-line GCIMS system that was used for the Phase II study.
Data Acqui~ition
/ I
MS
Exhaust Line
Switching Valve
Flow Reducer~'-,---'--;-t-:_--' (Pressure Controller)
Injection Port
Furnace
.am Reactor
Split
GC2 GCI
Syringe
Flow
Figure 1. Schematic Diagram of Experimental Setup for the Phase II Study.

August 1, 2002
The system consists oftwo GCs, the first GC (GCI in Figure I) was used to maintain reactor and transfer line at 260°C to transport samples efficiently and the second GC (GC2 in Figure I) was used for sample analysis. The furnace in GCI was also maintained at a temperature of 260°C. Helium (He) was used as carrier flow and flow was set as 21 ± I ml/min using a differential flow controller (Porter Instruments). A flow splitter was installed between reactor and GC column to vent excess gas. A 21 ml/min flow rate was used to define a residence time of I sec in the combustion reactor. The combustion reactor used in tltis study (and the Phase III combustion test) is 4 mm x 6 mm (i.d.xo.d.) witlt an effective length of 5 cm. While the sample was being collected, the switching valve was opened toward exhaust line «I) position in Figure I. The valve was then switched to (2) position to pressurize GC column when sample analysis was started. The pressure was maintained at approximately 6 psi during sample analysis and the pressure was monitored using a pressure gauge. The GCIMS system used in Phase II analysis was a Hewlett Packard 5890Al5970B incorporating a DB-5 MS capillary column (30 m length, 0.25 mm i.d., Agilent Technologies, Inc.).
All samples were diluted in helium (Research Grade, Air Products, Inc.) to establish calibration curves and detection limits. The amount of sample injected was I ml for gas-phase samples (S02, S02F, S02F2, POSF, and HFP). Measurements were performed in duplicate for each sample and concentration.
Operating Procedure
Calibration
Prior to sample injection, the switching valve was set to (I) position to vent excess gas and the second GC oven (GC2) was held at -60°C. After sample injection, the flow was vented for approximately I min. to purge tlte sample from the reactor/transport system. The system was then pressurized by turning the switching valve to the (2) position, and the GC oven temperature programming was started. The GC oven was initially held at -60°C for I min., heated to 50°C at 10°C/min. and held for I min. The GC was heated to 250°C for 10 min after each analysis to flush out any residual material from the column. The MS was auto-tuned with perfluorotributylamine (PFTBA) and operated at EMV (2000V) in the scanning mode sweeping from 45 to 550AMU.
Direct Injection
All conditions, GC oven temperature programming, total flow, split ratio, injection port temperature, and column pressure, were set at the same condition that was used for the calibration study. The temperature programming was started immediately after sample injection.
2

August 1, 2002
Results
Calibration
In most cases, calibrations were made based on four even interval concentrations for each sample. The detection limit was determined using a similar approach to EPA's detection limit criteria for identifYing an unknown (Method 8260B page 23 - 24). In our approach, the masses of the most abundant ions comprised the reference mass spectra. We then chose the most abundant ion (target ion) and major ions whose intensities are greater than ca. 20% of the target ion. The detection limit was then specified as the lowest concentration that has the target ions and all of the major ions whose relative intensity agrees with the reference spectra within ca. ± 20%.
For example, Figure 19 and 20 in the Appendix illustrate the total ion chromatogram and mass spectra for S02F2 (10,049 ppm). The mlz = 83 ion is the most abundant ion (target ion) and mlz = 48,67, and 102 are the major ions (mlz will not be shown thereafter). The ions of 102,83, 67, and 48 correspond to S02F2, S02F, SOF, and SO, respectively and it is reasonable to choose these ions to quantify S02F2. Figures 24 and 25 in the Appendix show the total ion chromatogram and mass spectra for a concentration of 20.1 ppm. The mass spectra still contain the target ion and the 3 major ions and their relative abundance agrees with the reference spectra (Fig. 20). Figures 26 and 27 show the total ion chromatogram and mass spectra for a concentration of 4.0 ppm. The 102 ion is not present at this concentration. Therefore, the detection limit for S02F2 was determined as 20.1 ppm. Similar analysis was conducted for all of standards and the results are briefly discussed below.
Figures 2 to 7 show calibration plots for S02, SOF2, S02F2, POSF, PBSF, and HFP, respectively. The linear fit equations for each sample, their linear correlation coefficients (R) and detection limits are tabulated in Table I.
Sample Name
S02 SOF2 S02F2 POSF HFP
Table 1 Linear Fit Equations and Detection Limits
Linear Fit (Y: peak area, X: concentration (ppm))
Y = 5.8813E3* X - 3.8541E5 Y = 8.3335E3* X - 7.0267E4 Y = 1.0331E4*X + 1.8273E6 Y = 1.0423E5*X - 8.4043E5 Y = 1.4975E4*X - 2.8253E6
R
0.9971 0.99941 0.99708 1.0 0.9997
Detection Limit (ppm) 78.5 30.3 20.1 14.1 3.9
The linear fit for each calibration shows reasonable high correlation coefficients. Because only 2 concentrations could be measured above the detection limit for POSF, the R value is 1.0. Based on the linear fit equation, the detection limit for HFP is 189 ppm. However, the detection limit analysis described above indicates a much smaller value (3.9 ppm). This is due to non-linear GC/MS response throughout the concentration range examined.
The concentration range used to obtain the S02 calibration curve was 1570 to 157 ppm. The detection limit was determined as 78.5 ppm. Figure lOin the Appendix shows the mass spectra
3

August 1, 2002
for S02 (1570 ppm), The ions of 48 (SO) and 64 (S02) were chosen as target ion and major ion, respectively, The ion of64 was not evident at a concentration of 15,7 ppm, The detection limit was thus determined as 78,5 ppm,
502
•
o 1 o°-h~"~-rr~rr~,,...,rrir-r-;--.-r~-rr-rr-r-i o 200 400 600 800 1000 1200 1400 1600
Cone. (ppm)
Figure 2, Calibration Plot for S02
The concentration range used to obtain the SOF2 calibration was 3034 to 303,4 ppm, Figure 9 in the Appendix shows the mass spectra for SOF2, The ion of 67 (SOF) was chosen as target ion and the ions of 86 (SOF2) and 48 (SO) were chosen as major ions, All ions exist at a concentration of 30,3 ppm. At 6.1 ppm, there was no GC/MS response to the sample. Therefore, the detection limit was determined as 30.3 ppm.
4
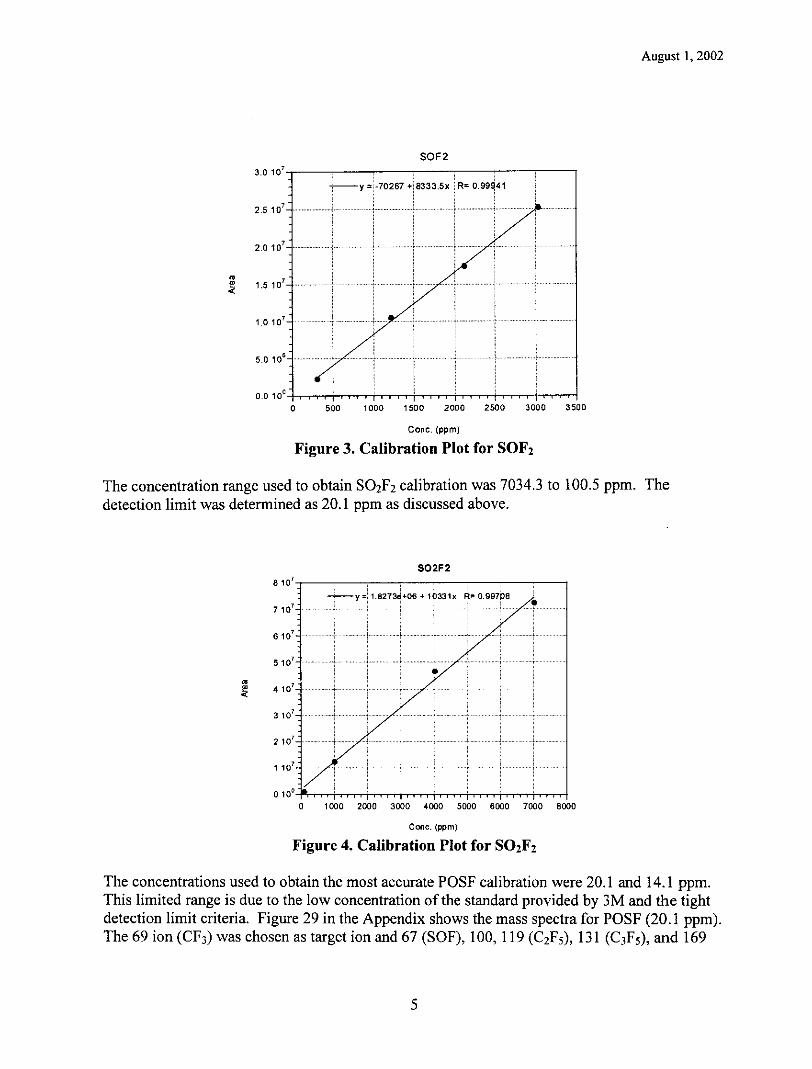
August 1, 2002
SOF2
3.0 107
2.5107
2.0107
~
1.5 107 m .;;:
1.0101
5.0 106
0.010°
0 500 1000 1500 2000 2500 3000 3500
Cone. (ppm)
Figure 3. Calibration Plot for SOF2
The concentration range used to obtain S02F2 calibration was 7034.3 to 100.5 ppm. The detection limit was determined as 20.1 ppm as discussed above.
S02F2 8 101
7107 • -:-y:! .82738"06 + Hl331x R= O.997pa
6107
5 101
~
4107 • «
3 107
2 lOT
1 107
010°
0 1000 2000 3000 4000 5000 6000 7000 8000
Cone. (ppm)
Figure 4. Calibration Plot for S02F 2
The concentrations used to obtain the most accurate POSF calibration were 20.1 and 14.1 ppm. This limited range is due to the low concentration of the standard provided by 3M and the tight detection limit criteria. Figure 29 in the Appendix shows the mass spectra for POSF (20.1 ppm). The 69 ion (CF3) was chosen as target ion and 67 (SOF), 100, 119 (C2FS), 131 (C3FS), and 169
5

August 1, 2002
(C)F7) were chosen as the major ions. The 100 and 131 ions were not present at a concentration of 8 ppm (Fig.33), and the detection limit was determined as 14.1 ppm.
POSF
1.4 106
- iy =.R. + 1 R= 1 :
1.2106
1,0106
8.0105
M
-I /
~ 6.010
5 .......... l
4.0105
2.0105 ,
,
0.010°
o 5 10 15 20 25
Cone. (ppm)
Figure S. Calibration Plot for PO SF
The concentration range used to obtain the HFP calibration was 10,000 to 1,000 ppm. Figure 44 in the Appendix shows mass spectra for HFP (10,000 ppm). The 69 ion (CF) was chosen as target ion and 50 (CF2), 81 (C2F), 100, 131 (C)Fs), and 150 were chosen as major ions. The ion of 81 was not present at a concentration of 1.9 ppm (Fig. 51). The detection limit was thus determined as 3.9 ppm.
6

August 1, 2002
HFP 2 1o·-r------;-----,-----r--~--._-,
I y=-2T~+06+1m5x Ri7 ......._ .l ..... ~/+ .......................... + ..................... j .... -r '7······,
o 1 O°+-.-,--,--j~~-+-~~i-r-.--~t-r :~,--j--.--.-,--t o 2000 4000 6000 8000
CalC. (ppm)
Figure 7. Calibration Plot for HFP
Transport~J7icjency
The transport efficiency of each standard was estimated by comparing the measured sample peak area obtained when the sample was injected into injection port in GC I and passed through combustion reactor and transfer line (system transport) with that obtained when the sample was injected directly into the injection port ofGC2 (direct injection)_
Table 2. Transport Efficiency
System Transport Direct Injection Efficiency Peak Area Peak Area (%)
Sample 1st 2nd AVG(I) 1 st 2"0 AVG (2) (I )/(2)x 1 00 S02 9130332 8980717 9055525 11952302 11762267 11857285 SOF2 25244352 25203780 25224066 24862639 24773683 24818161 S02F2 86850304 85572809 86211557 84435720 79738316 82087018 POSF 1280370 1228718 1254544 1064431 1067947 1066189 HFP 148679354 145606343 147142849 148372504 142271896 145322200
The transport efficiencies for SOF2, S02F2, and HFP were within analytical error. An uncertainty of ± 10 % is reasonable for this type of analysis_ That for POSF was slightly higher, but is nonetheless acceptable_ That for S02 was around 76%_ The S02 standard was analyzed as a two-component mixture with SOF2_ Since the transport efficiency for SOF2 was nearly 100%, the results indicate some sample losses for S02 through the reactor and transfer lines_ Because S02 is expected to be one of the major combustion byproducts, we will repeat the efficiency test
7
76.4 101.6 105.0 117_7 101.3
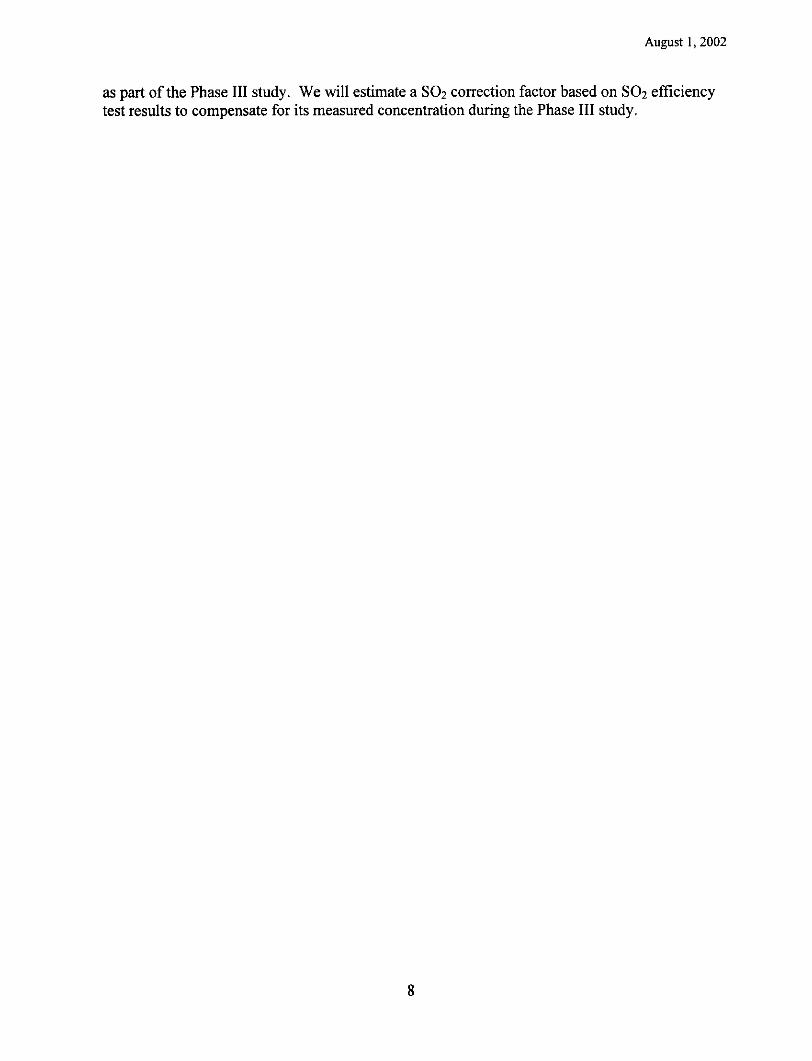
August 1, 2002
as part of the Phase III study. We will estimate a S02 correction factor based on S02 efficiency test results to compensate for its measured concentration during the Phase III study.
8

August 1, 2002
Appendix
(Raw Data for Phase II Report)
The total ion chromatograms ofthe 6 standards (S02, SOF2, S02F2, PO SF and hexafluoropropene (HFP» and the mass spectra corresponding to standard peaks are presented below. Mass spectra are shown for the highest, detection limit, and below detection limit concentrations for each standard.
400000
350000
300000
I 2!50000~
I 200000 -1
I 150000 -J
I 100000
50000
a
TIC: CLSOF3.D
Figure 8. Total Ion Chromatogram for SOF2 (3034 ppm) and S02 (1570 ppm)
Abunc.""nce
220000-
200000
180000
'60000
140000
120000 -J
100000 i BOOOO l 60000-
40000
20000
48
I I
86
I
G9
0, ,~3, f34 I 4~,...., 'i ' ~,~" .. ,B~~~~~ 384042444648505254S6SSe06264SSeS707274767Sa08284SeaSSO929496
Figure 9. Mass Spectra for SOF2 (3034 ppm)
1
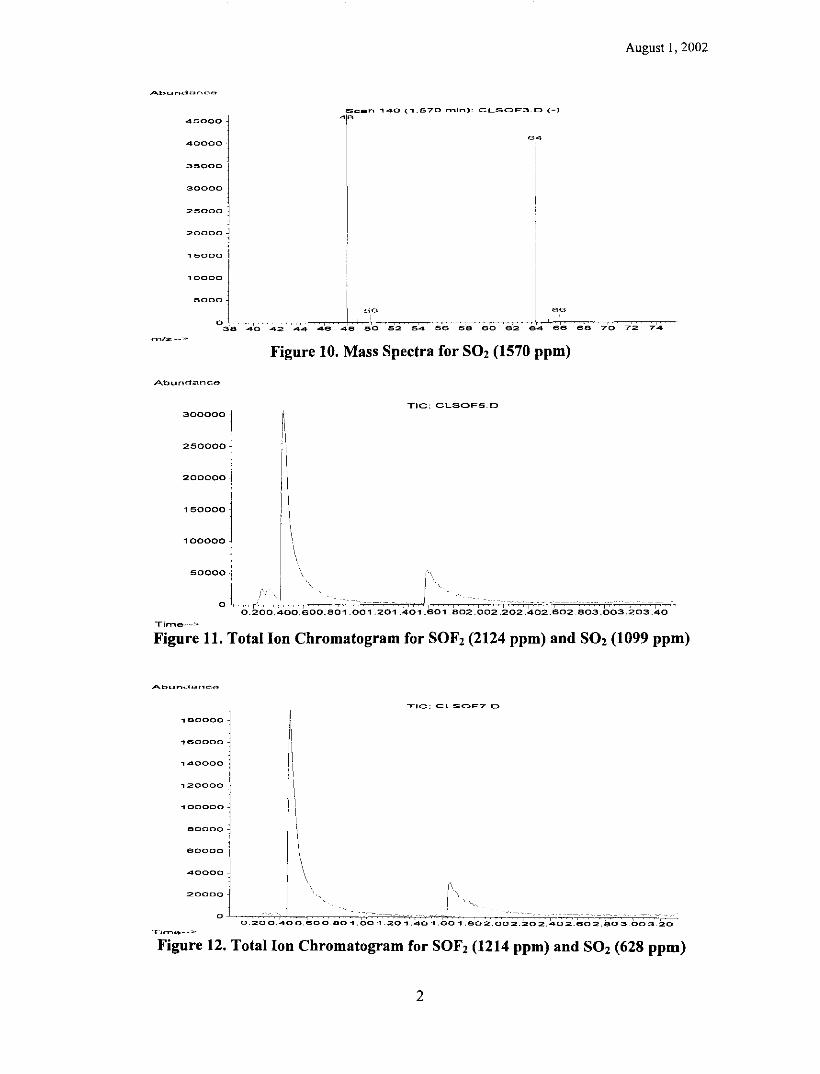
4S000
40000
35000
30000
25000
20000 i j
1S000 I
10000 ~
Sc .... n 140 (1_570 "",In): CLS~F3_0 (-1 4
August I, 2002
5000
0
L ,.,., .... bO '"
3B~4TO~~4T2~~4~4~~4~e~T4~e~T5~O~5~2~5~4~=5C6~=5~e~=e~o~~e~2~~e~4~~e~e=-~e~e~7=CO~~7C2~=7'4~~
Figure 10. Mass Spectra for S02 (1570 ppm)
Abun<.1ance
TIC: CLSOF5.D 300000
250000
200000
I
! 150000 j 100000
500001 ('\
I" I 0.200.400.600.a~~::~~1.201 .401 ):601 B02.002.1:02.402.602_803.603.203.40
Time
Figure 11. Total Ion Chromatogram for SOF2 (2124 ppm) and S02 (1099 ppm)
180000
1aoooo
140000
:::::: 1 60000 -!
, aoooo 1
40000J
2000:L
0.200.40 o.aOO.BO 1 .00 1.20 1.40 1 .eo 1 .602.002.202.402.602.60 3.00 3.20
Figure 12. Total Ion Chromatogram for SOF2 (1214 ppm) and S02 (628 ppm)
2

August 1, 2002
TIC: CLSOF9.D
30000
25000
20000
15000
10000-
5000 /\ I
O '~~~~~~~~T·~·'~/~'"'··'~-r-h-~~~~'~~~~~·'r"~~"'>¥f'.4.;","~+-'-r-!" -'r' ? {" 0.200.400.600.80 1.00 1.20 1.40 1.60 1.802.002.202.402.60 2.BO 3.00
Figure 13. Total Ion Chromatogram for SOF2 (303.4 ppm) and S02 (157 ppm) Abundance
14000
12000-
10000~ 'I
8000. 1
6000-
4000
2000-
o
!\ II Ii , !
II
i \
TIC: CLSOF12.D
I '",~,
1 n I 'V\\ r'~ "~'I~~ '! I' ' .~~, , ,,~, :1, '" AI A
I I ~; ~I I i -"'-/,"" I~"I '01 ~T"T-I Ii 0.200.400.800.801.001.20 1.40 1.601.802.002.202.402.602.803.003.20
Time--->
Figure 14. Total Ion Chromatogram for SOF2 (151.7 ppm) and S02 (78.5 ppm) A.bundo_"n~~.;~
1300
1200
1100
Scan 164 (1.832 min): CLSOF12.D
T T 1000
900· I BOO
700-
B00
1 500
400
300 -1 I 200
1 '00
a ~r~' 3B 40 42 5CCO~~5T2~5~'4'~5~"~~5~'B~60 62 et '~6:C6::-C-CC6::CB::-~7::C0~~7T2~ 44 46 4B
,.."'/ .... _
Figure 15. Mass Spectra for S02 (78.5 ppm)
3
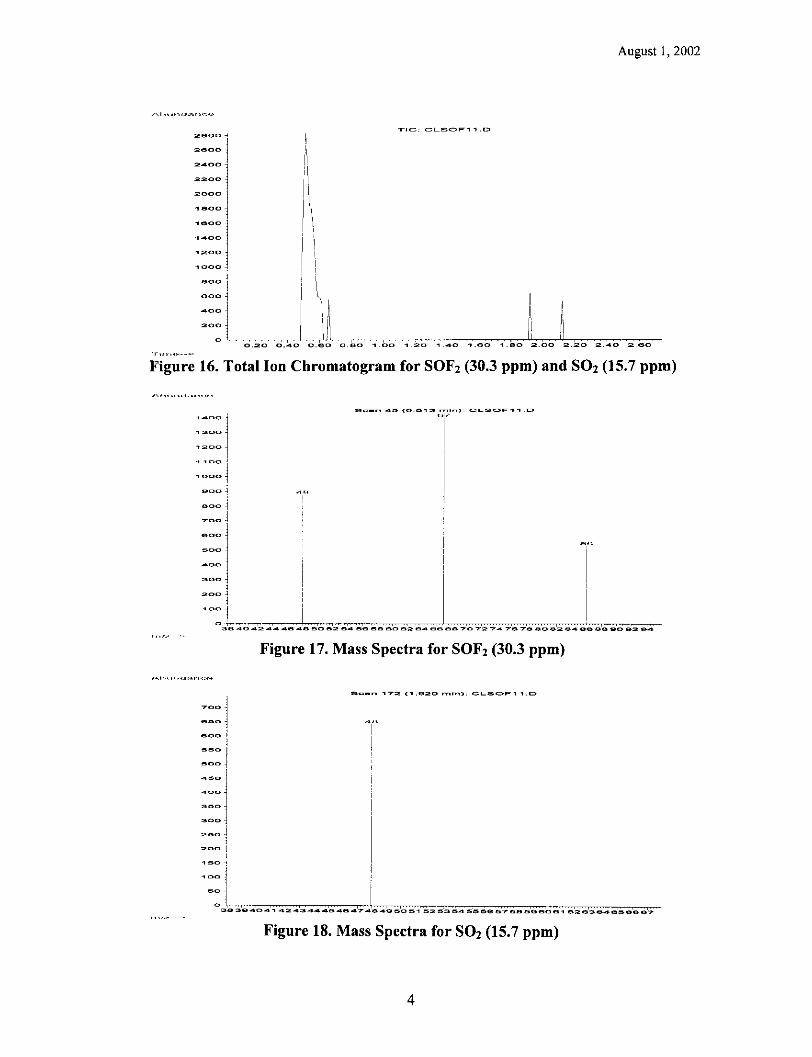
/~I" .. ·",lc .. ,,-,,_,
. r .. "."
::::1 24001 2.2.00
2000
1 180°1 10500
...... 00
1200
August 1, 2002
.,c;; CLSC>F11.D
Figure 16. Total Ion Chromatogram for SOF2 (30.3 ppm) and S02 (15.7 ppm)
_00
300 ~ , 200-1 , .001
700 l e~o 1 0300 1 ....... 0 I
... 00 ~
300-
2 .... 0-1 i
200 -l
." !
s.,._ ........ <5 (0_013 .-ro',,) ='--SCOF., ... OO <>1'-"
I
Figure 17. Mass Spectra for SOF2 (30.3 ppm)
T !
Figure 18. Mass Spectra for S02 (15.7 ppm)
4

August 1, 2002
TIC::, Nc::LSF22 ..... C>
7050000
700000-
6050000
600000
15150000
0500000
..... 050000
3500000
300000 \ \
2000000 \ 11500000 I
100000 i
150000: t~""'-,;;S/C'....,o:-:'"";-""OC-,;;c;;-~,,;;c;~:c-"'~~=;;~=O:O":OOO=7'j;"'~~;;;C"O;,~~ 020 0 ..... 0 o.eo 0.80 1.00 1.20 1 _ .... 0 1.60 1.00 2.00 2;"l200~~2"."4;'0~=~
Abundanc(;'
::::::1 260000
240000
220000~ 200000
180000
160000·
140000
120000
100000
80000
60000-
40000
20000
Figure 19. Total Ion Chromatogram for S02F2 (10049 ppm)
137
40
i
Scan 29 (0 336 min): NCLSF224.D _3
l o L~.~~~~?!--hL~ ~,.J~--,g'!-1_~,-lI4-,'~'"''')~_·'"2e ... ''()'--~_~~~~~_1~'05"2'-c-~-'.,,8,e"·~~T~
90 100 110 120 130 140 150 160 170
700000000
6<5000000
60000000000
<5<500000
500050 l' .... <50000000
.... 000000000
3<50000000 -1
300000001
200000 '1,1
20000000
.. 05000000
,00000 '1 50000
40 eo 70 ao
Figure 20. Mass Spectra for S02F2 (10049 ppm)
TIC: NCLSF223.0
l-~OOOC--~~o--ooC.~eCo~-o~~-CC~·~O'~.2CCO~O'~.4CCo~~~~ "_80 2_20
Figure 21. Total Ion Chromatogram for S02F2 (7034 ppm)
5

e~oooo
600000
1500000
1500000
400000
400000
300000-
300000
2150000
200000
150000
100000
50000
, 170000i
1600001.
150000
1 .... 0000 -1 130000 ~ 120000~ 110000 j 100000-i ,
90000.1· BOOOO-
70000
il 1'1
1\ I' j II
I \ I \ , I I , \ I,
\
,Ie=:: NCLSF217.D
Figure 22. Total Ion Chromatogram for S02F2 (4020 ppm)
,IC: NCLSF21Q.D
60000-j I
August 1, 2002
::::: j "Ii 20000 J
1000: ~l~0~.T2~0-L~oT.~4~0~~0~e~0~~0~BTO-'::'~"I':t"~--~- _-;:~ ""~~~40 "1.60 1.BO 2.00 2 :20~-0~2~.e~0~2~.B~0~~
Figure 23. Total Ion Chromatogram for S02F2 (1005 ppm) ""-h._.r.d, .. ,,_,,_,
,IC: NCLSF228.D 5500
5000 -
4500
.... 000
30500
3000
21500 -
2000
11500
1000
o
Figure 24. Total Ion Chromatogram for S02F2 (20.1 ppm)
6

Abundanct:>
, 2400~
2200 1 2000 1 1800 l
,
:::: 1 1000 J
8001 -1-B
600 ~ !
400 ~ 200 i
O-+----, 40 45 50
Scan 32 (0.373 min): NCLSF226.D 8~1
e;;·7
I
Figure 25. Mass Spectra for S02F2 (20.1 ppm)
eoo i
-==~ =00 ~
102
Figure 26. Total Ion Chromatogram for S02F2 (4.0 ppm)
Figure 27. Mass Spectra for S02F2 (4.0 ppm)
7
August I, 2002

&000°1
"'05000 i ..... ooooi , 3eooo~
30000
2S000
20000
105000
.,0000
eooo
5.00 "".00 "'7.00
Figure 28. Total Ion Chromatogram for PO SF (20.1 ppm)
,......,> ••• "d"".-.~,.>
1S000-
""'000
13000
.. .,000
sOOO
7000
1 8000 1 eooo i ",ooo"j I
August 1, 2002
3000 i :, ",,';" 'I" :::: G~uL~_'LL~-.... .Lc~~~=c---~~~~·~'''>
... 0 00 eo 70 aD 90 .. 00 .. .,0120130 ..... 0.,""0.,eo .. ..,..0 .. 00 .... 02002 .. 0220
Figure 29. Mass Spectra for POSF (20.1 ppm) Ab ... ·.d ... '-'<;~,.
400001 350001
30000-j
2"0001 20000i 15000 i 10000
5000
TIC; NCLPSF4.D
o .,....... ~ ______ ~~ __ ~_~~ ____ ~~~----,--_~~ ___ r 1.00 2.00 3.00 4.00 15.00 6.00 7.00 8.00
l"fn· .. '!t---_
Ii ~~~~ __ "'~J\.'"_.",,~~~~ 9.00 10.00 11.00 12.00
Figure 30. Total Ion Chromatogram for PO SF (14.1 ppm)
8

August 1, 2002
Abund9.nC'.('~
9000"""! Scan 922 (10.235 min): NCLPSF4.D
i 8000!
7000·1
60001 I
I
::::11 2000j 'I'll 1000-
o 1,""" r4l-"~~~~I" ~~~~~~~~~ 40 50 6'0 70
1 '1 9 16;~~ "lOa
~J~ 13". ,
I ! !
, , , "~ eo 90 100 110 120 130 140 150 1eo 170
rnFz-->
Figure 31. Mass Spectra for POSF (14.1 ppm)
Abundance
TIC: NCLPSF6.D
7000
6000
5000,;
4000
3000 I
'1 II
~~~_-rr:"'~~~' ~~ a.oo 9.00 10.00 11.00 12.00
2000
1000~
~.oo 2.00 "-3.00 4.00 5.00 6.00 7.00
Figure 32. Total Ion Chromatogram for POSF (8.0 ppm)
Al:)undnnc,,",
Scan 922 (10.236 rTlln); NCLPSF6.D
3500
3000
2500
2000! I
1500' '
10001 ji' ... I I
500l I L",'"' a j~ I _"~~~ ~~~~~~~~~l--~-
10H
60 70 BO 90 100 '10 120 130 140 150 160 170
'Tl/z-··~-
Figure 33. Mass Spectra for POSF (8.0 ppm)
9

AbundanGl":
2400000
2200000
2000000
1800000-
1600000
1400000
1200000 ~ 1000000 i
800000 i
:::::: 1.
;1 ;1
TIC: PFP1.D
August I, 2002
200000 ]
o ~~~~~~~~~r-~,"~-~-~~~C;-~~"T~~·r·~·~TTTT~rn~C"'~rc~~·on~·~~e~r-~-r~~ 0_kOO_~00.600.h01 .001 .k01 .~01 .601 .a02.002'.ko2.~02.~02.ho3.b03.203.:"'0
T'jrne-----~ ...
Figure 34. Total Ion Chromatogram for Hexafluoropropene (HFP) (10,000 ppm) Abundance
n1/z
900000
800000
700000
600000
500000
400000
300000
200000
100000
0 . 4'0
1500000
1500000
1400000
1300000
1200000
1100000
1000000
900000
800000
700000
1300000
500000-j
4000001
300000~ , 200000-]
100000-1
Scan 36 (0.414 lTlin): PFP1.D
131
100
SO , 81 150
62 H3
I
55 I
74 I 1 12 I
I ....... -,-.,.....,- I 50 60 7'0 BO 90 100 110 120 130 140 150
Figure 35. Mass Spectra for HFP (10,000 ppm)
o L~O-.~2~O-O-.4ro'-.o-.ce-o~0. eO 1-.-0~O~'~.2~O~'~.~4~O~,O=;.6~o~,~.~a~o~2=". O~O~2~.~2~O"-2~~.4r'O~2~. a~o~2~.~a~o"';:r;~-~:~-
Figure 36. Total Ion Chromatogram for HFP (7,000 ppm)
10

Ab'.'rH:lan"",
900000 -,
8500001
800000 j. 750000
700000
650000 j. 600000
550000
500000
450000 ~ , 400000 ;
350000 ~ , 300000 J
250000 ~ 200000 ~ 150000.j
100000 1 50000
[,
II[
[I
August 1, 2002
TIC: PFP5.D
o , , ~~~--.=-
O.~u 1.00 1.50 2.00 2.50 3.00 3.50
Tlr .... ~"
Figure 37. Total Ion Chromatogram for HFP (4,200 ppm)
.. , .. ", ... " ..... " 200000
~90000
1S0000
170000
1 .. 0000
1 .... 0000
130000
120000
1 ~ 0000
~OOOOO
90000
BOOOO
70000
60000
50000 j .... 0000-
30000
20000
10000 ~ 0··
II ,I
Ii , ,
Tr=, PFP7.D
-"-'-
0.20 0 ..... 0 0.80 0.80 , .00 ~ .20 1 2:_00 2:.2:0 2: ..... 0 2.60 2.80 3.00
r·','." ... ··,,·~
_b ... ' ... <"' ..... "~.:,.
aooo
7500
7000
8500
eooo 1 5500 --l , 5000 -1
4500
4000
3500
:::: l' 2000
Figure 38. Total Ion Chromatogram for HFP (1,050 ppm)
TIC: PFP21.0
\ I, 'Ii. ~\
'500 j I, I \ 1000 i\i"l.n " \1\ I,
500 i / J ~ \ i '\'I,/!\IIV. '" , o li.L I" I' I, i ~~tl1~~~.,--~ ___ J .. __ , II -1l~~
0.2:0 0.40 o.eo o.eo 1.00 1.20 1.40 1.ao _0 "1·'lr .... ""'_· __
Figure 39. Total Ion Chromatogram for HFP (3.9 ppm)
11
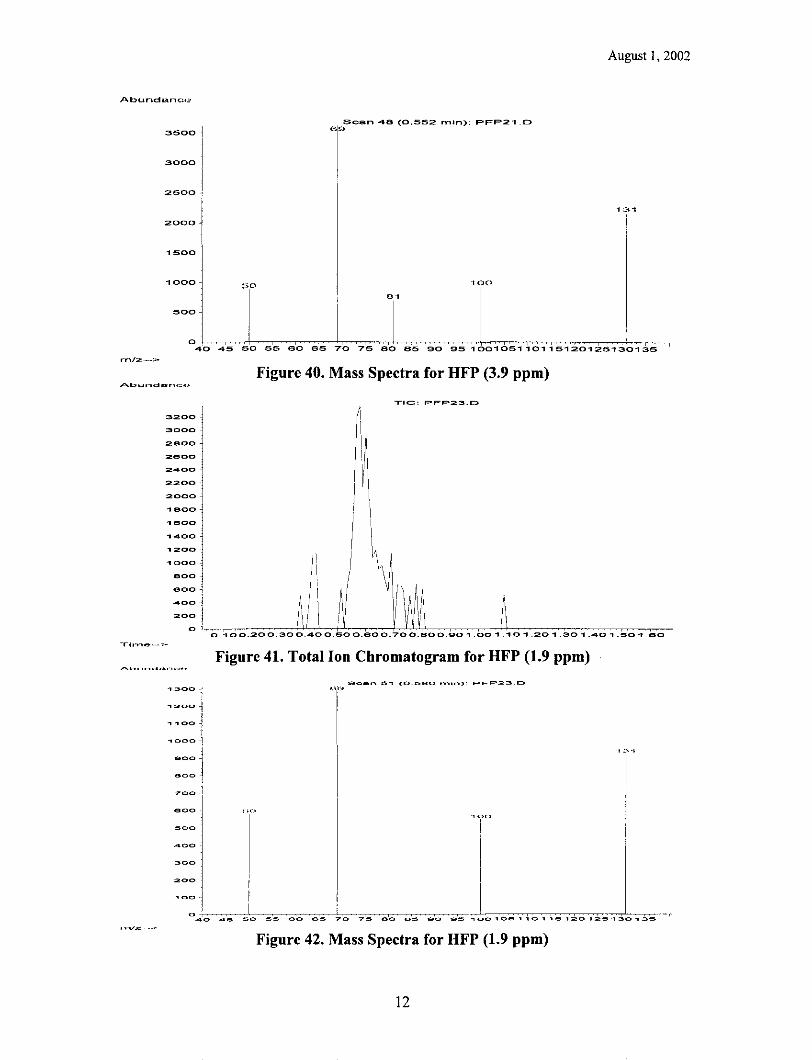
August 1, 2002
Abunc.1unc.::,o
rnf:z,··,· .. ~·
'rscan .. ., (0 552
I
min)- F'FP21 D
3500
3000
2500
131
2000
I 1S00
1000 10el
8-'
500
i a ,....,-+-,-~~...--.-, 4045 50 55 60 65 70 75 ao 65 90 95100105110115120125130135
3200
3000
2800
:zeoo
2400
2200
2000
1800
"leaD
'1400
,:zoo
1300 -,
., :200 ~ 1
., .,00 ~
1 1000-1
QOO j 900,
700
aoo
500
Figure 40. Mass Spectra for HFP (3.9 ppm)
TIC: PFP23.D
Figure 41. Total Ion Chromatogram for HFP (1.9 ppm)
, .0
'TU
:~ .~IO~~4~5~~5~0;C-~5~5~~a~oo:-~e"5~~~-c7'5~~e"0~~e=5~o=0~" J ". , ,. , " ". ,,.J, Figure 42. Mass Spectra for HFP (1.9 ppm)
12

urnpU::lppy PUtllo:)olOld lS::l1 III ::lStlqd
t X1pu::lddy
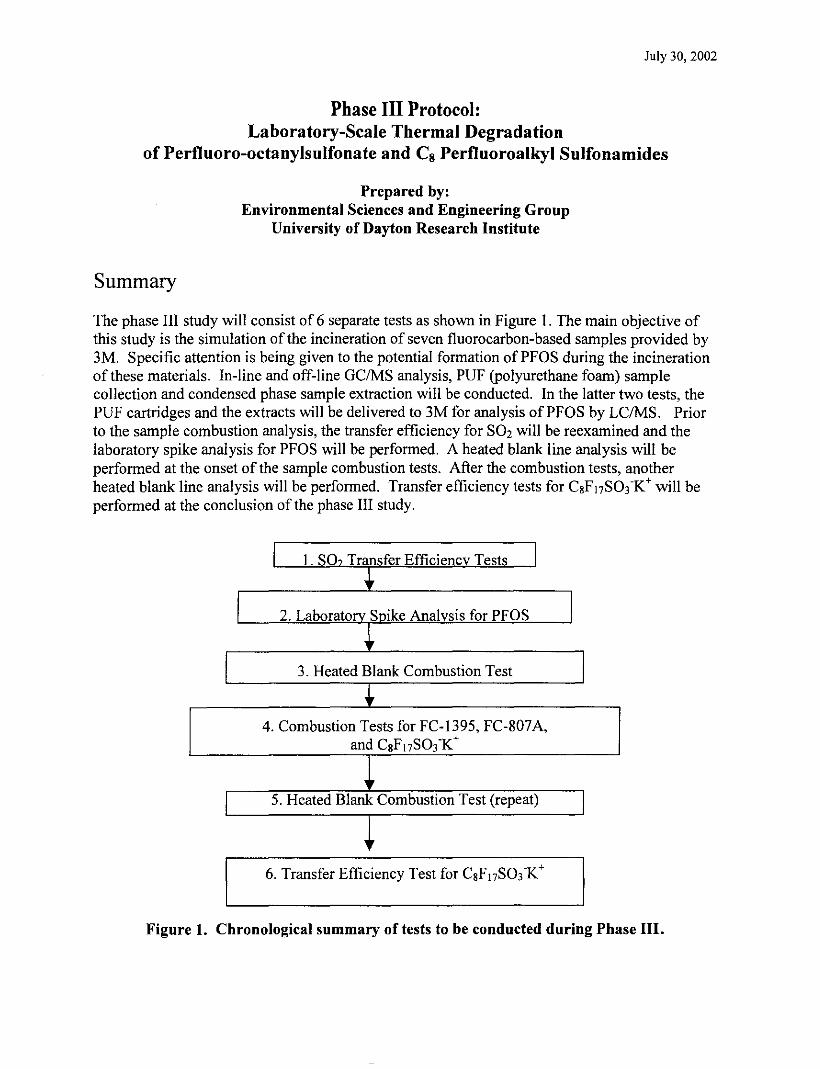
July 30, 2002
Phase III Protocol: Laboratory-Scale Thermal Degradation
of Perfluoro-octanylsulfonate and Cs Perfluoroalkyl Sulfonamides
Summary
Prepared by: Environmental Sciences and Engineering Group
University of Dayton Research Institute
The phase III study will consist of 6 separate tests as shown in Figure 1. The main objective of this study is the simulation of the incineration of seven fluorocarbon-based samples provided by 3M. Specific attention is being given to the potential formation of PFOS during the incineration of these materials. In-line and off-line GCIMS analysis, PUF (polyurethane foam) sample collection and condensed phase sample extraction will be conducted. In the latter two tests, the PUF cartridges and the extracts will be delivered to 3M for analysis ofPFOS by LC/MS. Prior to the sample combustion analysis, the transfer efficiency for S02 will be reexamined and the laboratory spike analysis for PFOS will be performed. A heated blank line analysis will be performed at the onset of the sample combustion tests. After the combustion tests, another heated blank line analysis will be performed. Transfer efficiency tests for C8F 17S03 X+ will be performed at the conclusion ofthe phase III study.
I 1. SO, Transfer Efficiencv Tests I +
I 2. LaboratorY Spike Analysis for PFOS I +
3. Heated Blank Combustion Test
+ 4. Combustion Tests for FC-1395, FC-807A,
and C8F 17S03 X+
~ 5. Heated Blank Combustion Test (repeat)
~ 6. Transfer Efficiency Test for C8F 17S03 X+
Figure 1. Chronological summary of tests to be conducted during Phase III.
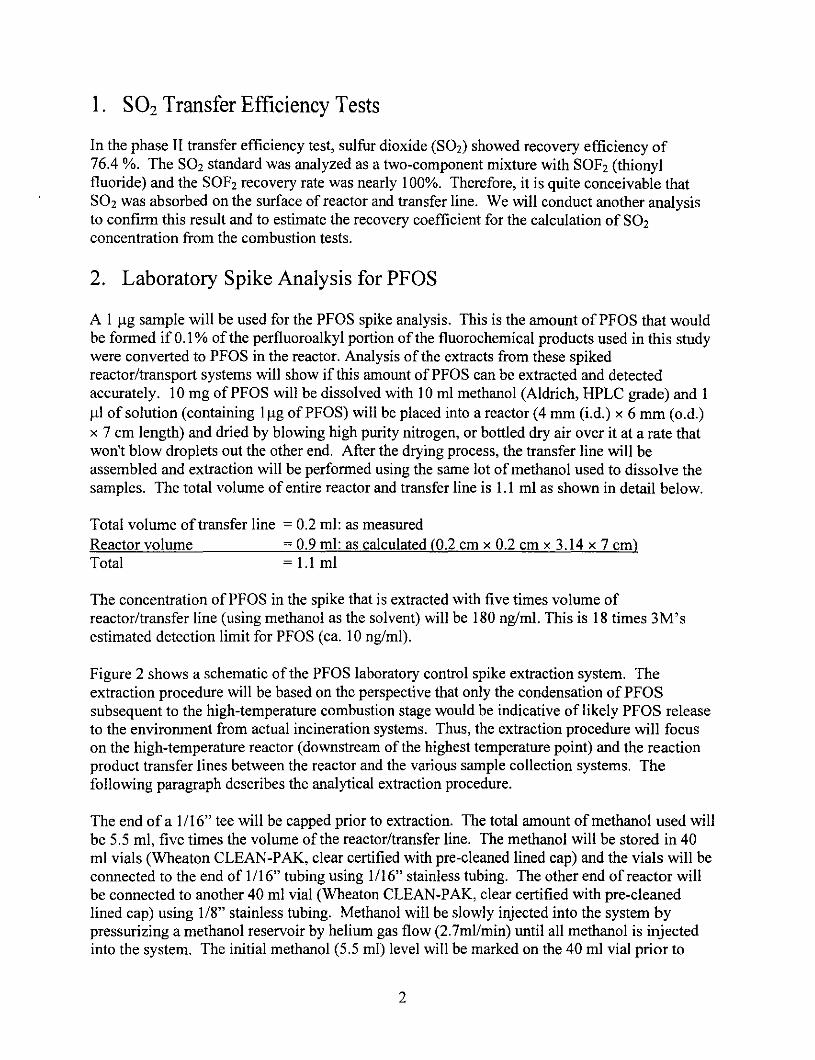
1. S02 Transfer Efficiency Tests
In the phase II transfer efficiency test, sulfur dioxide (SOl) showed recovery efficiency of 76.4 %. The SOl standard was analyzed as a two-component mixture with SOFl (thionyl fluoride) and the SOFl recovery rate was nearly 100%. Therefore, it is quite conceivable that SOl was absorbed on the surface of reactor and transfer line. We will conduct another analysis to confirm this result and to estimate the recovery coefficient for the calculation of SOl concentration from the combustion tests.
2. Laboratory Spike Analysis for PFOS
A I Ilg sample will be used for the PFOS spike analysis. This is the amount of PFOS that would be formed if 0.1 % of the perfluoroalkyl portion of the fluorochemical products used in this study were converted to PFOS in the reactor. Analysis of the extracts from these spiked reactor/transport systems will show if this amount of PFOS can be extracted and detected accurately. 10 mg ofPFOS will be dissolved with 10 ml methanol (Aldrich, HPLC grade) and I III of solution (containing Illg ofPFOS) will be placed into a reactor (4 mm (i.d.) x 6 mm (o.d.) x 7 cm length) and dried by blowing high purity nitrogen, or bottled dry air over it at a rate that won't blow droplets out the other end. After the drying process, the transfer line will be assembled and extraction will be performed using the same lot of methanol used to dissolve the samples. The total volume of entire reactor and transfer line is 1.1 ml as shown in detail below.
Total volume of transfer line = 0.2 ml: as measured Reactor volume = 0.9 ml: as calculated (0.2 cm x 0.2 cm x 3.14 x 7 cm) Total = 1.1 ml
The concentration of PFOS in the spike that is extracted with five times volume of reactor/transfer line (using methanol as the solvent) will be 180 ng/ml. This is 18 times 3M's estimated detection limit for PFOS (ca. 10 ng/ml).
Figure 2 shows a schematic of the PFOS laboratory control spike extraction system. The extraction procedure will be based on the perspective that only the condensation of PFOS subsequent to the high-temperature combustion stage would be indicative of likely PFOS release to the environment from actual incineration systems. Thus, the extraction procedure will focus on the high-temperature reactor (downstream of the highest temperature point) and the reaction product transfer lines between the reactor and the various sample collection systems. The following paragraph describes the analytical extraction procedure.
The end of a 1116" tee will be capped prior to extraction. The total amount of methanol used will be 5.5 ml, five times the volume of the reactor/transfer line. The methanol will be stored in 40 ml vials (Wheaton CLEAN-PAK, clear certified with pre-cleaned lined cap) and the vials will be connected to the end of 1116" tubing using 1116" stainless tubing. The other end of reactor will be connected to another 40 ml vial (Wheaton CLEAN-PAK, clear certified with pre-cleaned lined cap) using 118" stainless tubing. Methanol will be slowly injected into the system by pressurizing a methanol reservoir by helium gas flow (2.7ml/min) until all methanol is injected into the system. The initial methanol (5.5 ml) level will be marked on the 40 ml vial prior to
2

collection and will be used for confirming that all of sample introduced is collected. The extraction will be performed twice for each sample. The collected samples will be secured, labeled, and appropriately packaged for overnight delivery to 3M Environmental Laboratory with one blank vial (40 ml) containing 5.5 ml methanol.
He Line
Methanol Reservoir 1116 Tubing 118 Tubing
~ Reactor 1 ~ (4 x 6mm x 7cm)
Plug~~~-[=~=:::::::::::~::=J-J 1116 T
Vent
Collection Vial
Figure 2. Experimental set up for PFOS laboratory control spike tests.
3. Heated Blank Combustion Analysis
Before and after the sample combustion tests, a heated blank combustion test will be conducted for a reactor temperature at 600 and 900°C to examine system contamination. The sample collection will be performed twice for each temperature (one for the sample collection using polyurethane foam (PUF, (Supelco ORBO PUF Cartridge)) and one for the sample collection using Tedlar sampling bags (0.5L, SKC Inc.). Two GC-MS analyses with different GC columns will be conducted for the heated blank exhaust gas analysis (one with in-line GC-MS analysis and one with off-line GC-MS analysis). After the gas-phase collection and analysis, the reactor will be cut in half and condensed phase product extraction will be performed using the method previously outlined in Section 2.
Figure 3 shows the schematic diagram of the experimental setup to conduct in-line GC/MS analysis and PUF sample collection for the heated blank combustion test. It also shows the detailed dimensions of the reactor/transfer line system. For off-line GC/MS analysis, the PUF shown in Figure 3 will be replaced by a Tedlar bag. Compressed air will be delivered both to the pyroprobe chamber and the reactor. The total air flow rate will be 10.3 and 7.6 mllmin (with 0.8 and 0.7 mllmin to the pyroprobe chamber) for reactor temperatures of 600 and 900°C, respectively. The residence time in the reactor (4 mm i.d. X 6 mm o.d. X 14 em length with 8 cm effective length) will be ca. 2.0 s. The determination of the effective length of the reactor is discussed in Section 4. The flow rate will be controlled within ±I 0 % error. A majority of the
3

effluent will pass through the PUF cartridge for sample collection and I ml/min will be directed into the GC column for in-line analysis.
In-line GC-MS Analvsis: A HPS890AlS970B series GC-MS with DB-S MS capillary column (30 m length, 0.2S mm i.d., Agilent Technologies, Inc.) will be used for the phase III study. The initial temperature of GC2 will be held at -60°C and sample will be concentrated at the head of the column for 2 and 2.S (±S%) min for reactor temperature of 600 and 900°C, respectively. During this time period, PUF combustion effluent sample collection will also take place. Two PUF cartridges will be placed in series as shown in Figure 3. After the sample collection, switching valve I will be turned to (1) position in Figure 3 to pressurize the GC column. As soon as pressurization begins, the temperature programming of GC2 will be started. The initial temperature will be held for I minute and the temperature will be raised at 10°C/min up to 260°C. The final temperature will be held for S minutes. Also after the switching valve 1 is turned to (1) position for the GC column pressurization, the PUF cartridges will be removed from the system. The PUF cartridges will be secured, labeled, and appropriately packaged for next business day delivery to 3M Environmental Laboratory with one blank PUF.
Off-line GC-MS Analysis: After the PUF sampling collection, identical sample collection will be performed using a Tedlar sampling bag. The collected off gas will be sampled within 15 min. of collection and analyzed using HPS890AlS970B series GC-MS with SPEL-Q PLOT (Porous Layer Open Tubular) column (30 m length, 0.S3 mm i.d., SUPELCO). The Tedlar bags will be heated to ca. SO - 60°C to ensure that all of the sulfur compounds that are soluble in the condensed water vapor present in the bag are partitioned into the gas-phase. This column will capture the light compounds «C6) that the DB-S MS capillary column may not effectively retain during in-line gas sampling. The initial temperature will be held at 35°C and I ml of sample will be injected using a 1 ml gas-tight syringe. The initial temperature will be held for 1 minute and the temperature will be raised at I SOC/min up to 245°C. The final temperature will be held for S minutes.
All of reactor/transfer line systems including pyroprobe chamber and sample insert probes used in the Phase III analyses will be appropriately packaged and stored for the future analysis.
4

Data Acquisition
=
L-/ _---'I
MS
22 em
Ventilation Syst m
UF Cartridges
Flow Reducer ~"""'--'-I /1'-, r-(Pressure Controller)
Pyroprobe Chamber
(1)"'- """?' (2) r---------------~
GC2
Furnace
Split
GCI
Pyroprobe Chamber
(7 x 9.5mm x 8cm)
Air
DO Flow Controller
1116 Tubing
~ Reactor
118 Tubing
~8.8cm (4 x 6mm x 14cm)
118 Tee em 2cm
1116 Tee
Figure 3. Experimental setup for heated blank sample analysis and collection. Dimensions of the reactor and transfer lines are also shown in lower drawing.
4. Combustion Tests of Seven Selected Compounds
Combustion tests for the seven selected compounds will be performed after the heated blank analysis. Similar to the heated blank analysis, the sample combustion tests will be conducted for the reactor temperature of 600 and 900°C, and the sample collection will be performed twice for
5
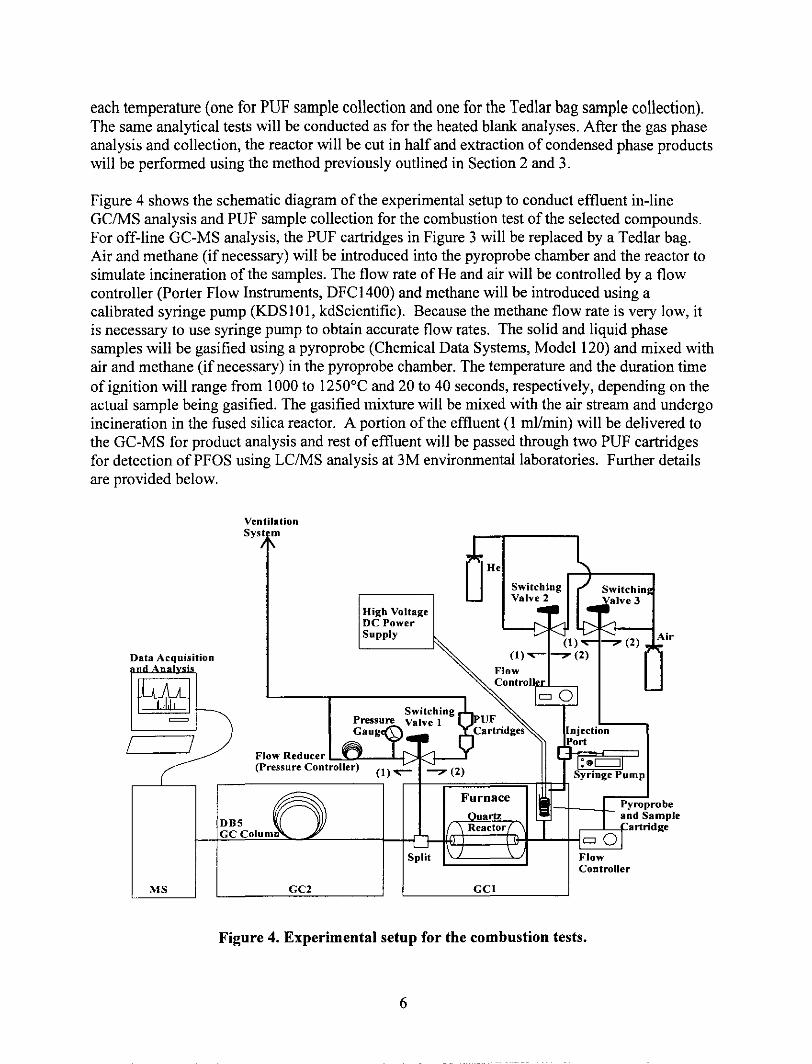
each temperature (one for PUF sample collection and one for the Tedlar bag sample collection). The same analytical tests will be conducted as for the heated blank analyses. After the gas phase analysis and collection, the reactor will be cut in half and extraction of condensed phase products will be performed using the method previously outlined in Section 2 and 3.
Figure 4 shows the schematic diagram ofthe experimental setup to conduct effluent in-line GC/MS analysis and PUF sample collection for the combustion test of the selected compounds. For off-line GC-MS analysis, the PUF cartridges in Figure 3 will be replaced by a Tedlar bag. Air and methane (if necessary) will be introduced into the pyroprobe chamber and the reactor to simulate incineration of the samples. The flow rate of He and air will be controlled by a flow controller (Porter Flow Instruments, DFC 1400) and methane will be introduced using a calibrated syringe pump (KDSlOl, kdScientific). Because the methane flow rate is very low, it is necessary to use syringe pump to obtain accurate flow rates. The solid and liquid phase samples will be gasified using a pyroprobe (Chemical Data Systems, Model 120) and mixed with air and methane (if necessary) in the pyroprobe chamber. The temperature and the duration time of ignition will range from 1000 to 1250°C and 20 to 40 seconds, respectively, depending on the actual sample being gasified. The gasified mixture will be mixed with the air stream and undergo incineration in the fused silica reactor. A portion of the effluent (I mllmin) will be delivered to the GC-MS for product analysis and rest of effluent will be passed through two PUF cartridges for detection ofPFOS using LC/MS analysis at 3M environmental laboratories. Further details are provided below.
Data Acqui~ition
=
,--I _~7
Ventilation Syst m
High Voltage DC Power Supply
Flow Reducer L'LZ---1-[:::K 1------1 (Pressure Controller) (\)..,- --".. (2)
r-----------------,
(\ ) (1)"'- --".. (2)
Injection Port : .. =
Syringe Pump
Air
Furnace -t---.4- Pyroprobe uartz and Sample
f-f.u~~~~E'...-___ ~kS--*rfR:.=.:ct:or~t-.L-+~~2tartridge Split Flow
Controller
MS GC2 GCl
Figure 4. Experimental setup for the combustion tests.
6

1. Stoichiometric Reaction Mechanisms of Seven Samples
Based on the elemental formula of the seven samples provided by 3M, four of which are normalized by carbon, stoichiometric equations were developed and the amount of necessary oxygen was calculated. The results are tabulated in Table I. In the development of the stoichiometric equations, it is assumed that C is converted to CO2, F is converted to HF, N is converted to N2, and S is converted to S02. Phosphorous and potassium were excluded from the equation since the contribution of these elements is very small and their effects on the overall stoichiometry are small enough to be safely ignored. Methane is also introduced for hydrogen deficient samples to supply hydrogen to convert F to HF. In that case, additional oxygen was supplied to convert C in methane to CO2.
T bl 1 C ffi' ts f St . h' t' C b f a e . oe IClen 0 OlC lOme riC om us Ion 0 fSI tdS e ec e I ampleS Stoichiometric
Atomic Contents of Samples Gas Products
Sample C H F N ° P S K 0, CH. CO, H,O HF SO, N,
FC·1395 I 101 121 0.11 0.26 0 0.06 0 0.98 0.05 105 0 1.21 0.06 0.055
FC-807A I 0.985 1.408 0.14 0.36 0.05 0.08 o 0.968 0.106 1068 0 1258 0.08 0.07
PFOS 8 0 17 0 3 0 I I 11.5 4 12 0 16 I 0
From the table above, stoichiometric equations can be derived for all of the samples.
2. Calculation of Necessary Amount of Sample (Equivalent Amount of Fluorine in PFOS)
The amount of sample that will be incinerated was calculated to conserve the same amount of fluorine for each sample and is tabulated in Table 2. All samples have the equivalent amount of fluorine that is contained in 0.50 mg ofPFOS. To facilitate calculations, we define a "pseudomolecular weight" to be the sum of the masses of the elements in the empirical formulation of each product as given in Table 1. The amount of air necessary for stoichiometric incineration for each sample was also calculated and is included in Table 2.
7
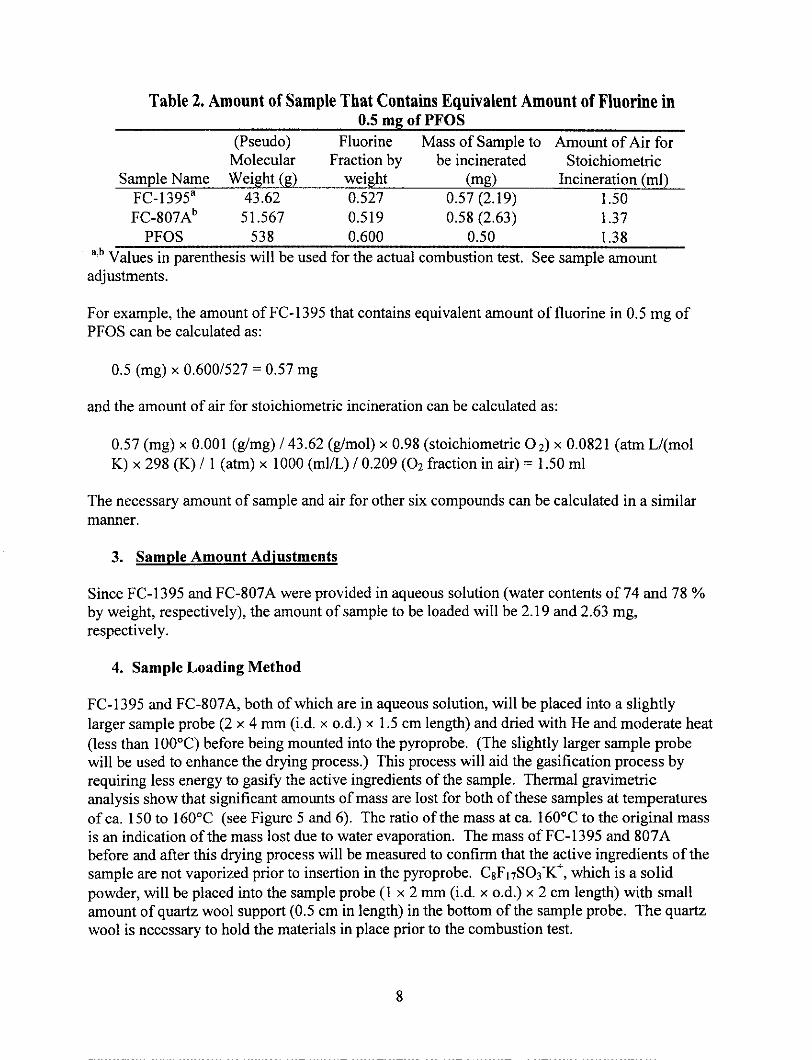
Table 2. Amount of Sample That Contains Equivalent Amount of Fluorine in 0.5 mg of PFOS
Sample Name FC-1395' FC-807Ab
PFOS
(Pseudo) Molecular Weight (g)
43.62 51.567
538
Fluorine Fraction by
weight 0.527 0.519 0.600
Mass of Sample to be incinerated
(mg) 0.57 (2.19) 0.58 (2.63)
0.50
Amount of Air for Stoichiometric
Incineration (ml) 1.50 1.37 1.38
•• b Values in parenthesis will be used for the actual combustion test. See sample amount adjustments.
For example, the amount ofFC-1395 that contains equivalent amount of fluorine in 0.5 mg of PFOS can be calculated as:
0.5 (mg) x 0.6001527 = 0.57 mg
and the amount of air for stoichiometric incineration can be calculated as:
0.57 (mg) x 0.001 (g/mg) 143.62 (glmol) x 0.98 (stoichiometric O 2) x 0.0821 (atm LI(mol K) x 298 (K) I I (atm) x 1000 (milL) I 0.209 (02 fraction in air) = 1.50 ml
The necessary amount of sample and air for other six compounds can be calculated in a similar manner.
3. Sample Amount Adjustments
Since FC-1395 and FC-807A were provided in aqueous solution (water contents of 74 and 78 % by weight, respectively), the amount of sample to be loaded will be 2.19 and 2.63 mg, respectively.
4. Sample Loading Method
FC-1395 and FC-807 A, both of which are in aqueous solution, will be placed into a slightly larger sample probe (2 x 4 mm (i.d. x o.d.) x 1.5 cm length) and dried with He and moderate heat (less than 100°C) before being mounted into the pyroprobe. (The slightly larger sample probe will be used to enhance the drying process.) This process will aid the gasification process by requiring less energy to gasify the active ingredients of the sample. Thermal gravimetric analysis show that significant amounts of mass are lost for both of these samples at temperatures of ca. 150 to 160°C (see Figure 5 and 6). The ratio of the mass at ca. 160°C to the original mass is an indication of the mass lost due to water evaporation. The mass ofFC-1395 and 807A before and after this drying process will be measured to confirm that the active ingredients of the sample are not vaporized prior to insertion in the pyroprobe. CgF 17S03 X+, which is a solid powder, will be placed into the sample probe (I x 2 mm (i.d. x o.d.) x 2 cm length) with small amount of quartz wool support (0.5 cm in length) in the bottom of the sample probe. The quartz wool is necessary to hold the materials in place prior to the combustion test.
8

FC·1395
100 .... -..,'"'
\ 80 \
\
o 100 200 300 400 500 600 Temperature, C
Figure 5. Thermal Gravimetric Analysis (TGA) of FC-1395
FC·B07A
100 --....."'\.
\ \
80 \ ~ c
" \ •• E 60 \ ID
'" \ ;I'. \ E 40
1 20
l _______ ~. ~ ,
\ 0 '-
0 100 200 300 400 500 600 Temperature, C
Figure 6. Thermal Gravimetric Analysis (TGA) of FC-807A
5. Experimental Flow Rate Setting and Calculations
Table 3 and 4 summarize the experimental flow settings at temperatures of 600 and 900D C, respectively. The flow rates for He and Air can be controlled within ± 10 %, and the methane flow rate can be controlled within ± 5 %. Each compound will be incinerated under high excess air condition ranging from ca. 100 to 450 % excess air.
The concentration profile of the gasified sample is not measured directly and assumed to be an average value in the excess air calculations described above. Oxygen and methane-deficient conditions may occur in the reactor during the gasification process for some of the samples while
9

the pyroprobe is heated to high temperatures (1000 to 1250°C) and the volume of the gas expands by a factor of up to 2.5. In other words, during the gasification process, the flow rate of the gasified sample to the reactor may be faster than the calculation shown in Tables 3 and 4.
The calculations shown in Table 3 and 4 are described below with FC-807 A as an example. The calculation can be conducted in a similar manner for the other two compounds. The numbers in Table 3 and 4 are calculated using a spreadsheet program and the numbers are rounded to the appropriate number of significant digits. Therefore, the calculation may not exactly reproduce the numbers shown in Table 3 and 4.
In Table 3, the necessary amount of CH4 for FC-807 A can be calculated as:
0.58 (mg) x 0.00 I (g/mg) I 51.6 (g/mol) x 0.106 (stoichiometric C~ requirement, see Table 1) x 0.0821 (atm L I (mol K) x 298 (K) II (atm) x 1000 (milL) = 0.03 ml
The necessary amount of CH4 was then doubled to provide an excess of hydrogen atoms to scavenge fluorine atoms as HF.
The CH4 flow rate and sweeping time through the pyroprobe were calculated as shown below:
0.06 (ml) I 1.00 (min) = 0.06 (mllmin)
The air flow rate to pyroprobe was added to sweep the sample out of the volume in 1 min. The volume ofpyroprobe is 1.5 ml (0.352 x3.14 (cm2
) x 4.5 cm - 0.2 (cm3). The necessary flow rate
to sweep the sample out of the volume at 260°C is:
1.5 (ml) II (min) x 298 (K) I (260 + 273) (K) = 0.84 mllmin
Since 0.06 mllmin of 0.84 mllmin is provided by CH4, the air flow rate will be 0.84 - 0.06 = 0.78 mllmin.
The necessary air flow rate to the reactor for sample combustion can be calculated by the stoichiometric amount of air for sample and sweeping time:
1.37 (ml) II (min) = 1.37 mllmin
The stoichiometric combustion ratio of methane to air is 1:9.57. Therefore the air flow rate to reactor for CH4 combustion can be calculated as:
0.06 mllmin x 9.57 = 0.57 mllmin
With the additional air flow rate shown in Table 3, the total gas flow rate is calculated as 10.28 mllmin.
The residence time for 0.4 cm i.d. x 8 cm effective length quartz tubing at 600°C is calculated as:
10

o.i x 3.14 x 8 (ml) 1 [10.28 (ml/min) 160 (s/min) x (600 + 273) (K) 1298 (K) = 2.00 s.
The excess air ratio is the ratio of additional air to stoichiometric air. For FC-807A, 7.5 ml/min additional air flow will be introduced while 1.94 mllmin is the air flow rate for stoichiometric combustion (sample + CH4). The excess air ratio is calculated as:
7.5 (mllmin) I 1.94 (mllmin) x 100 = 387 %
6. Effective Length of Reactor
The effective length of the reactor was determined based on measured temperature profiles at 600 and 900°C. The temperatures of reactor wall (outside) were measured by thermocouples (Chromel-Alumel Type K, 304 SS Sheath, OMEGA) wrapped with quartz tape to prevent radiation effects from the heater. For the reactor temperature of 600°C, the temperature was set at 613°C. The effective length of 8 cm was obtained by allowing a deviation from the desired temperature (600°C) by ± 20°C, which is ± 3.3 % of desired temperature. The measured temperatures at the center of the reactor and at a distance of I, 2, 3, 4, and 5 cm from the center are shown in Figure 7. For the reactor temperature of 900°C, temperature was set at 928°C. The 8 cm effective length was obtained by allowing a deviation from the desired temperature (900°C) by ± 30°C, which is also ± 3.3 % of desired temperature. The measured temperatures at the center of the reactor and at a distance of 1,2,3,4, and 5 cm from the center are also shown in Figure 7.
~·-600C
. --"r- 900 C
Reactor Temperature Profile
1000~---------------------------------,
900 '-'- --,;,---------6--:-__
----------/.1.
Q 800
! ~ 700
, -
600 ---- ':+-----------------·--------0
-·'l
500~~~~~~~~~~~~~~~~~~
o 2 3 4 5
Distance from Center (em)
Figure 7. Reactor Temperature Profile for 600 and 900°C. The profiles are roughly symmetrical about the center of the reactor.
11

7. Experimental Procedure (Gas Phase Sample Analysis and Collection)
Helium will be used initially to purge both air and methane lines to the pyroprobe and reactor/transfer line. The experiments start with setting the flow rate of air and methane and the temperatures of OC 1 (260°C), furnace (600 or 900°C), and the OC2 (-60°C). After the temperature is appropriately set, air and methane, if necessary, will be introduced into the pyroprobe, and air will be introduced into the reactor. The exhaust gas will be vented without pressurization by setting the switching valve I to (2) position. The pyroprobe will not be mounted initially in the system, instead the top of pyroprobe chamber will be capped. The sample will be carefully loaded into capillary quartz tubing, 1mrn (i.d.) x 2mrn (o.d.) x 2.0 em (length) or 2mm (i.d.) x 4mm (o.d.) x 1.5 em (length), the net weight of sample measured, and the tubing carefully inserted into the pyroprobe. After the flow rate and temperature are properly set and sample preparation is completed, the system will be held for 1 minutes to allow the flow to stabilize. The cap for the pyroprobe chamber will then be removed and the pyroprobe quickly inserted into its chamber. Immediately afterwards, the pyroprobe will be ignited to gasify the sample. After the appropriate amount of time to sweep the gasified sample from the pyroprobe chamber (1.2 times of sweeping time shown in Table 3 and 4), the air flow for the pyroprobe will be maximized (5 mllmin at room temperature, 8.9 mllmin at 260°C) and held for 10 s. The switching valve for both the pyroprobe and reactor will then be switched to helium. After approximately 20 sec, switching valve 1 will be turned to (I) position to pressurize the OC column. As soon as the column pressurization is started, OC temperature programming and MS analysis will be started. The temperature programming will be identical to that described in Section 3 (Heated Blank Combustion Test). The PUF cartridges will be also removed from the system. The PUF cartridges will be secured, labeled, and appropriately packaged for next business day delivery to 3M Environmental Laboratory with one blank PUF. The same experiment will be repeated for the sample collection using a Tedlar bag. The sampling method and off-line OC-MS analysis will be identical to the heated blank analysis described in Section 3. Since the same reactor will be repeatedly used for two combustion temperatures, the blank analysis will be performed between each analysis to examine any carryover from the previous analysis. The exhaust gas will be vented to a laboratory hood following each test (as shown in Figure 5) to minimize any cross contamination during Phase III study.
8. Experimental Procedure (Condensed Phase Sample Extraction)
After gas-phase and PUF sample collection and analysis are completed, condensed phase sample extraction will be performed. This process will be identical to Section 2 - Laboratory Spike Analysis, as illustrated in Figure 2. The collected samples will be secured, labeled, and appropriately packaged for next business day delivery to 3M Environmental Laboratory with one blank vial (40 ml) containing 5.5 ml methanol. The sample probe (capillary quarts tubing) used for sample loading will be weighed after the combustion test to determine the net amount of sample gasified.
12

5. Transfer Efficiency Test for CsF I7S03X+
Figure 8 shows schematic diagram of transfer efficiency test for CgF17S03X+. The starting materials will be collected using two PUF cartridges in the same manner as described earlier for the combustion tests, however, in these tests, the furnace temperature will be held at 260°C. The helium flow rate will be set as 20 mllmin and the temperature in the GC oven will be set as 260°C. The sample preparation and loading processes are the same as the combustion off-gas collection. The switching valve, which is originally set to (2) position in Figure 8, will be switched to (1) position just before the pyroprobe/sample insertion. The sample will be collected for two minutes after gasification begins. The collected samples will be secured, labeled, and appropriately packaged for next business day delivery to 3M Environmental Laboratory with one blank PUF.
Ventilation
High Voltage DC Power Supply
Switching Valve I
(I)~ -::>"(2)
Figure 8. Transfer Efficiency Test for CSF17S03·K+.
Flow
Gel
6. Cross Contamination Prevention and Examination
He
Extensive precautions will be applied to minimize any PFOS cross-contamination due to the release of these environmentally persistent materials into the immediate laboratory environment
13

I. Significant changes were made to the sample inlet and gasification system. To satisfy the analytical requirements for PFOS detection by LCIMS analysis by 3M, we determined that relatively large amounts of sample, 0.5 to several mg, had to be gasified in the actual experiments. This amount of sample is much larger than initially estimated (ca. 10 to 100 j.lg) and could not be gasified with the inlet available with the Advanced ThermallPhotolytic Reactor System (ATPRS). Preliminary experiments in phase II also demonstrated that higher gasification temperatures (> 400°C) were necessary to rapidly gasify the fluorocarbon-based samples. As such, the System for Thermal Diagnostic Studies (STDS), equipped with a hightemperature pyroprobe that can gasify milligram quantities of material, is proposed for the phase III combustion tests. The STDS is very similar to the ATPRS with regard to its incineration! analytical capabilities and is a satisfactory substitute for the ATPRS.
2. In the approved protocol, we had originally planned sample combustion with hydrocarbon fuels (e.g., n-octane) for all of samples. Subsequently, it was determined that a substitute was need because the liquid hydrocarbon fuels originally proposed require much larger amount of oxygen (air) to obtain stoichiometric oxidation and it is impossible to maintain the residence time of 2 seconds in the reactor under stoichiometric or excess air environments. Methane has the lowest chemical oxygen demand of any hydrocarbon fuel and is a satisfactory replacement. We propose to use methane as a fuel if the sample is hydrogen deficient and requires hydrogen source to convert F to HF, otherwise fuel will not be introduced to the reactor.
3. In the approved protocol, we also proposed to conduct combustion tests at three temperatures (600, 750, and 900°C). Preliminary combustion tests with several samples indicates that many combustion byproducts were formed at 600°C, but those combustion byproducts were not observed at higher temperature (750 and 900°C) and the GC-MS total ion chromatograms for these higher temperatures were very similar. Therefore it is proposed that two temperatures are sufficient to analyze the combustion phenomena of the selected samples (600 and 900°C).
IS

November 4, 2002
Addenda for Phase III Protocol
9. 2nd Transfer Efficiency Test for CgF 17S03-K+ (PFOS)
In addition to the transfer efficiency tests specified in phase III protocol, direct transfer efficiency tests where the gasified samples are collected without passing through the combustion reactor will also be performed. Samples will be collected using two PUF cartridges. Extraction of the entire system (pyroprobe chamber and transfer tubing) will be performed using methanol as the solvent. This additional study will provide information concerning how much PFOS is transported from the pyroprobe through the transfer lines to the reactor entrance. The transfer efficiency tests in the phase III protocol address sample transport from the pyroprobe to the combustion reactor exit.
Figure 9 shows a schematic diagram of the direct transfer efficiency test for PFOS. The gasified samples will be collected using two PUF cartridges in the similar manner as described in Section 5 of the phase III protocol. The PUF cartridges will be directly connected to the pyroprobe chamber by 19.5 cm long, 1/8" o.d. Silcosteel tubing (Silcosteel, Restec, Inc.). The OC oven temperature will be held at 260°C through the entire analysis. The detailed flow profiles are shown in Table 3. Helium will be used as a carrier gas. The flow will be set as 0.63 mllmin and held for one minute before the sample is inserted and gasified. After the sample is placed in the pyroprobe, the flow will remain at 0.63 ml/min for 94 seconds while the sample is gasified at 1250°C for 40 seconds. The flow rate will then be maximized to 4.53 mllmin and held for 30 seconds to purge the sample from the pyroprobe chamber and transfer line. The conditions and operational procedures were determined to simulate gas-phase combustion of PFOS at 600°C.
The calculated entire volume is 3.79 ml as shown the detail below:
Pyroprobe chamber: Transfer line: Total:
(0.35i (cm2) x 3.14 x 8 (cm) (0.108)2 (cm2) x 3.14 x 19.5 (cm)
= 3.08 ml = 0.71 ml
3.79 ml
The system will be extracted with methanol using five times the volume of the pyroprobe and heated transfer lines (19.0 ml). Prior to the extraction, the sample probe and pyroprobe will be removed from the system. The collected samples will be secured, labeled, and appropriately packaged for the delivery to 3M Environmental Laboratory with a methanol solvent blank.
I

Table 3. Flow Rate Profile for Direct Transfer Efficiency Test Time Period Pyroprobe Flow Volume
(sec) Rate (mllmin) (ml) 0-60 0.63 0.63
60 - 85 0.00' 0.00 85 - 179 0.63 0.99 179 - 189 0.63 -74.53b 0.43 189-219 4.53 2.27
Total Volume (ml) 4.32 • No flow due to open system to insert the sample. b Linear increase (approximate)
Ventilation Syst m
High Voltage DC Power Supply
PUF Cartridges
Gel
He
Pyroprobe L-J-- and Sample
Cartridge
Figure 9. Direct Transfer Efficiency Test for PFOS.
2
November 4, 2002

November 4, 2002
10. Additional Extraction Analysis of Unheated Sample Transport Lines
In addition to the extractions specified in the phase III protocol, the unheated sample transport lines downstream of the combustion furnace (switching valve and the transfer line between switching valve and PUF cartridge) will be extracted using methanoL This analysis will be performed for FC-807 A and PFOS after the combustion tests at 600°C. This analysis will determine if PFOS condensation occurs while the effluent is being collected using ambient temperature PUF sampling cartridges.
The method will be similar to other extraction analysis. The measured volume of the unheated transport line is 0.55 mL The line will be extracted with methanol using a volume equal to 5 times the transport line volume (2.75 ml). The collected samples will be secured, labeled, and appropriately packaged for the delivery to 3M Environmental Laboratory with a methanol solvent blank.
11. Blank Combustion Analysis Using Single PUP between 600 and 900°C Combustion Test.
After combustion tests of the first three samples were completed, we decided to perform another blank combustion analysis using a single PUF after the combustion test at 600°C but before the combustion test at 900°C for the rest ofthe samples (FC-807 A and PFOS). The temperature of the GC oven and reactor will be set at 260 and 600°C, respectively. Table 4 shows the flow profile that will be performed for this analysis.
Table 4. Flow Rate Profile for PUF Collection (Blank Analysis between 600 and 900°C) Time Period Reactor Flow
(sec) Rate (ml/min) Air
0-120 9.70 120 - 130 9.70 130 - 140 9.70 140-160 8.89 (He)b
Pyroprobe Flow Rate (ml/min)
Air 0.84
0.84 ~ 4.63' 4.63
4.53 (He)'
Total Flow Rate (mllmin)
10.54 10.54 ~ 14.33
14.33 13.42
Volume (ml)
21.08 2.07 2.39 4.47
Total Volume (m!) 30.01 'Linear increase (approximate). b., Switched to helium for sweep
Air and helium will be used for the sample collection. The flow rate for the reactor and the pyroprobe will be same as the actual combustion test at 600°C. Air will flow for 120 seconds and then increased to the maximum flow rate and held for 10 seconds. Air will be replaced by helium to purge all the air from the system for 20 seconds. The collected samples will be secured, labeled, and appropriately packaged for the delivery to 3M Environmental Laboratory with the other PUFs and methanol extractions.
3
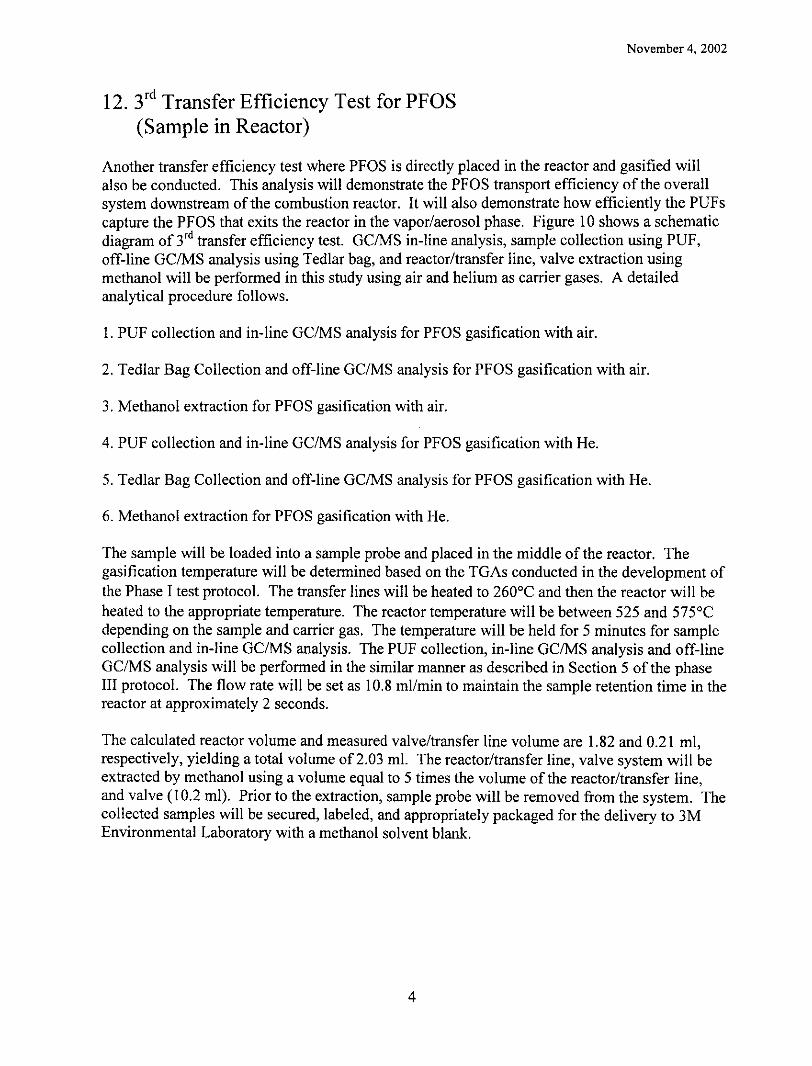
12, 3rd Transfer Efficiency Test for PFOS (Sample in Reactor)
November 4, 2002
Another transfer efficiency test where PFOS is directly placed in the reactor and gasified will also be conducted. This analysis will demonstrate the PFOS transport efficiency of the overall system downstream of the combustion reactor. It will also demonstrate how efficiently the PUFs capture the PFOS that exits the reactor in the vapor/aerosol phase. Figure 10 shows a schematic diagram of 3,d transfer efficiency test. GCIMS in-line analysis, sample collection using PUF, off-line GCIMS analysis using Tedlar bag, and reactor/transfer line, valve extraction using methanol will be performed in this study using air and helium as carrier gases. A detailed analytical procedure follows.
1. PUF collection and in-line GC/MS analysis for PFOS gasification with air.
2. Tedlar Bag Collection and off-line GCIMS analysis for PFOS gasification with air.
3. Methanol extraction for PFOS gasification with air.
4. PUF collection and in-line GC/MS analysis for PFOS gasification with He.
5. Tedlar Bag Collection and off-line GCIMS analysis for PFOS gasification with He.
6. Methanol extraction for PFOS gasification with He.
The sample will be loaded into a sample probe and placed in the middle of the reactor. The gasification temperature will be determined based on the TGAs conducted in the development of the Phase I test protocol. The transfer lines will be heated to 260°C and then the reactor will be heated to the appropriate temperature. The reactor temperature will be between 525 and 575°C depending on the sample and carrier gas. The temperature will be held for 5 minutes for sample collection and in-line GC/MS analysis. The PUF collection, in-line GCIMS analysis and off-line GC/MS analysis will be performed in the similar manner as described in Section 5 of the phase III protocol. The flow rate will be set as 10.8 ml/min to maintain the sample retention time in the reactor at approximately 2 seconds.
The calculated reactor volume and measured valve/transfer line volume are 1.82 and 0.21 ml, respectively, yielding a total volume of2.03 ml. The reactor/transfer line, valve system will be extracted by methanol using a volume equal to 5 times the volume of the reactor/transfer line, and valve (l0.2 ml). Prior to the extraction, sample probe will be removed from the system. The collected samples will be secured, labeled, and appropriately packaged for the delivery to 3M Environmental Laboratory with a methanol solvent blank.
4

Ventilation Syst m
II' Switching Valve 2 ...
Air~ -I> <} !~ He 1)""- ~(2
-
Q~UF Switching
9CartridgeS ~~e I
FloJ::J 0 I Controller
(1)""- -; (2)
Furnace Ouartz Reactor
GC/MS ~/_--+-I l-}-kt=:;:=tB-f----.J Split
Sample Probe
GCI
Figure 10. Schematic Diagram of 3'd Transfer Efficiency Test
5
November 4, 2002

November 4, 2002
13. Sulfur Recovery Analysis
Sulfur recovery rate as S02 using the in-line GC/MS system was not quantitatively repeatable. This was due primarily to the low S02 peak resolution using the cryogenic focusing method at -60°C with a holding time of ca. 4 min. Because the S02 peaks using the off-line GCIMS system were much sharper than those observed using in-line GCIMS, we decided to use off-line GC/MS analytical results to quantitatively analyze the sulfur recovery analysis as S02. This section describes the overall protocol for these tests.
13.1 Calibration Curve Pure sulfur dioxide (Aldrich 99.9+ %) will be diluted to 100,400, 700, 1000 ppm using the Tedlar bag (SKC Inc., 0.5 L) to construct the calibration curve. The column and the GCIMS operating conditions will be same as used for off-line GCIMS analysis of the actual combustion tests. Each concentration will be performed twice and the average will be taken.
13.2 S02 Transfer Efficiency Analysis Known amount of S02 standard will be injected into reactor and collected along with carrier gas (air) flow by 0.5 L Tedlar bag. I ml of collected sample will be injected to off-line GC/MS system and recovery rate will be calculated using the calibration established above.
Figure II shows the schematic diagram of S02 transfer efficiency test. The reactor/transfer line system will be heated at 260°C throughout the S02 transfer efficiency test. Dry air will be used as a carrier flow. The flow rate for the reactor and pyroprobe will be 8.0 and 0.75 ml/min, respectively. After the switching valve is turned to (I) position, I ml of 4.0% concentration S02 will be injected to the reactor. The sample will be collected for 2.5 min, then the switching valve will be turned to (2) position and the bag will be closed. The sampled bag will be brought to offline GC/MS system and I ml of sample will be injected. The total amount of molar number in the Tedlar bag will be calculated based on the calibration curve and the total volume collected. The recovery rate will be estimated based on the total amount of molar number collected over the total amount of molar number injected. The test will be conducted twice and the average will be taken.
6
Analytical Report
Analytical Results for the University of Dayton Research Institute
Study Titled "Laboratory-5cale Thermal Degradation of
Perfluoro-Octanyl Sulfonate and Related Precursors"
Combined Laboratory Report for E02.QS20, E02·0S21,
E02.QS40, E02.QS67, E02.QS95, E02.QS99, E02.Q916
E02.Q917, E02.Q926, E02.Q96S, E02.Q969, and E02.Q971
Testing Laboratory
3M Environmental Technology & Safety SelVices 3M Environmental Laboratory
2·3E-09 935 Bush Avenue, St. Paul, MN 55106
Laboratory Contact
William K. Reagen, Ph.b Bldg. 2-3E-09 P.O. Box 3331
SI. Paul, MN 55133-3331 Phone: (651)77a-6565
FAX: (651) 778-6176
Requester
Eric A. Reiner 3M Environmental Technology & Safety SelVices
Bldg. 2-3E·09 P.O. Box 3331
SI. Paul, MN 55133·3331
Page 10f30

3M Environmental Laboratory University of Dayton Incineration Study
1 Introduction
Solvent extracts and polyurethane foam (PUF) cartridges (Supelco, ORBO"'-1000, 22mm OD PUF Sampler) were submitted to the 3M Environmental lab to detennine at what levels PFOS was present in the samples generated at /he University of Dayton Research Institute, URDI, during the study titled "Laboratory-Scale Thermal Degradation of Per/luoro-Octanyl SuWonate and Related Precursors'. Sample results presented here were generated at 3M using LCIMS instrumentation to detect and quantitate the PFOS anion (C,F17SOi).
Individual study samples and quality control samples are presented in Appendix A, which contains bo/h the measured anion concentrations and the concentration of PFOS uncorrected for purity and the contribution of the potassium cation to /he mass used allowing URDI to calculate percent recoveries. The interpretation of results is beyond the scope of this report and will be completed by URDI study personnel and the 3M requester and presented in /he URDI final report.
2 Sample Receipt
Reported samples were received at /he 3M Environmental Laboratory from URDI between August 20 and September 23,2002 and analyzed between September 13 and October 8, 2002. The samples consisted of methanol extracts and PUF cartridges. All samples were stored at room temperature in sample check-in until analysis. After a sample was analyzed, the remaining extract or sample was stored in a refrigerator at approximately 4'C. Dates of receipt of all samples are documented in the raw data.
Samples E02-0899-43014 and E02-0899-43012 were not located with the associated samples in sample check-in. These samples were associated wi/h the extraction blank and first extraction for the second heated blank combustion. There are no results reported for these samples.
Three sample containers, I-Chem vials, were received not labeled. It is assumed that these samples correspond to the blank, first and second extraction samples (E02-0840-42716, E02-0840-42714, and E02-0840-42715) for the FC-1395 incineration test. since they were received with the other FC-1395 samples. The individual ~Chem vials associated with these samples were consequently labeled as E02-084O-A, B, and C and were identified as such in the raw data and report.
The wipe samples that arrived with each set of samples were not analyzed but are retained for possible future analysis. All study samples collected but not analyzed will be retained until pennission is provided by the requester to discard them in an appropriate manner.
3 Holding Times
Holding times for analysis were not assigned prior to sample receipt. Sampling dates, receipt dates and analysis dates are all documented in the raw data. It is not expected that sample storage conditions at the laboratory would contribute to analyte degradation, especially since study samples were subjected to the thennal degradation study conditions. It is also expected that the fluorochemicals measured are stable in methanol over the time period of this study.
Page 2 0[30

3M Environmental Laboratory University of Dayton Incineration Study
4 Methods. Analytical and Preparatory
Preparatory and analytical methods were not validated for this project but are processed with quality control spikes and blanks to assess method performance. For this project, methanol extracts and polyurethane foam (PUF) cartridges were analyzed via LCiMS. Most of the methanol extracts did not require any further preparation prior to analysis. However, some extracts did require a simple dilution in methanol prior to analysis. These samples (extracts and dilutions) were aliquoted into sample vials and analyzed.
The PUF samples, lab control blanks, and lab control spikes required extraction prior to analysis. In summary, the PUF was extracted by removing the large plastic endcap at the wide end of the cartridge and pushing the PUF with a dean disposable glass pipette until the top was approximately halfway down the cartridge. Then twenty milliliters of methanol was added to the PUF in the cartridge. The large plastic endcap was replaoed and the cartridge was vortex mixed for at least fifteen seconds and then inverted five times to ensure proper mixing. Then the sample was allowed to sit for fifteen minutes to allow for desorption of the analyles of interest. After fifteen minutes, the sample was drained and washed again with the same twenty milliltters an additional four times for a total of five washes. After the fifth wash, the methanol was collected and aliquoted into a sample vial for analysis via LC/MS.
Analysis of samples was conducted based on ETS-8-155.1 "Analysis of Waste Stream, Water Extracts or Other Systems Using HPLC-Electrospray/Mass Spectrometry." This method is not written specifically for the extraction of PUF cartridges, just for the analysis of the analyles of interest via LCIMS. The method was modified (documented as deviations) to strengthen the data quality for these analyses by the following: standard curves are to be injected only prior to the samples, CCVs are injected at least every ten samples, the coefficient of determination is to be greater than 0.990, CCVs must be within ±25%, the system suitability must be <5.0% relative standard deviation (RSD) for area counts and <2.5% RSD for retention times, and the standards should be within 125% (lower limit of quantitation (LLOQ) ±3O%) of their true value. Any deviations from this method are discussed in section 5 of this report.
Samples were analyzed on an Agilent 1100 Series LC/MSD in the negative ion mode. Approximate instrument conditions are presented below. Actual conditions are documented in the raw data.
LC CONDITIONS: Column Flow: 0.300 ml/min Solvent A: 2 mM Ammonium Acetate Injection Volume: 3-5~L Solvent B: Methanol Column Temperature: 30"C Gradient: Column: Betasil CIS Time %A %8 Column Size: 2x50 mm, 5 ~ 0.00 85 15
0.50 85 15 3.00 0 100 5.50 0 100 6.00 85 15 9.00 85 15
Page 3 000

3M Environmental Laboratory University of Dayton Incineration Study
MS CONDITIONS: Mode: Polarity: V Cap:
5 Analysis
SIM Nega~ve
4000 V
5.1 Calibration
PFOS SIM Ion: 499
Calibrations curves were constructed using at least five concentra~ons with quadra~c fitting. All coeflidents of determination were greater than 0.990 and all calibration standards used in the calibration curves were within ±25%, the LOQ within ±30%. Calibra~on standards outside this range that were excluded are documented in the raw data along with technical justifica~on for deactiva~on of curve points. Con~nuing calibration verification standards (CCVs) were analyzed after no more than 10 samples. All CCV recoveries were within ±25'10 as spedfied by the method.
5.2 System Suitability Out of the ten analytical runs all system sullabm~es passed for PFOS except for on 10/04/02. The system suitability was 5.2%, exceeding the 5.0% RSD criterion typically allowed. Since all calibration curves and CCVs all passed for this analysis, the data was accepted.
5.3 Blanks All solvent blanks were less than one haff the area counts of the lower limit of quantitation with two exceptions. On 9/30/02, a methanol blank contained approximately 9.4 pg/~L of PFOS. This methanol blank was followed by E02-089542975 (PFOS-BLK-PUF). which had PFOS levels below the LLOQ «5.00 pg/~L). Since the next sample following the blank was <LLOQ, this one time oocunrence did not affect the data.
A blank PUF cartridge was extracted with each set of samples and analyzed. This analysis showed less than one half the area counts of the lower limit of quantitation for each analyte. thus mee~ng the acceptance criterion for blank sample results.
5.4 Laboratory Control Spikes laboratory Control Spikes (LCS) consisted of PUF cartridges spiked at known levels of 1 ~g and 10 ~g were prepared with each set of PUF samples. Each LCS was spiked by removing the large plastic endcap at the wide end of the cartridge and injecting the appropriate amount of spiking solution just below the surface of the PUF. The LCS was allowed to dry for at least 30 minutes before ~ was extracted as described in section 4 of the report.
The average PUF LCS recoveries for the 1 ~g and 1 0 ~g spikes are 82% and 92% respectively for PFOS. Sample results are not conrected for this recovery information. Summaries of each analysis of the LCSs are presented in Appendix B.
Page 4 000
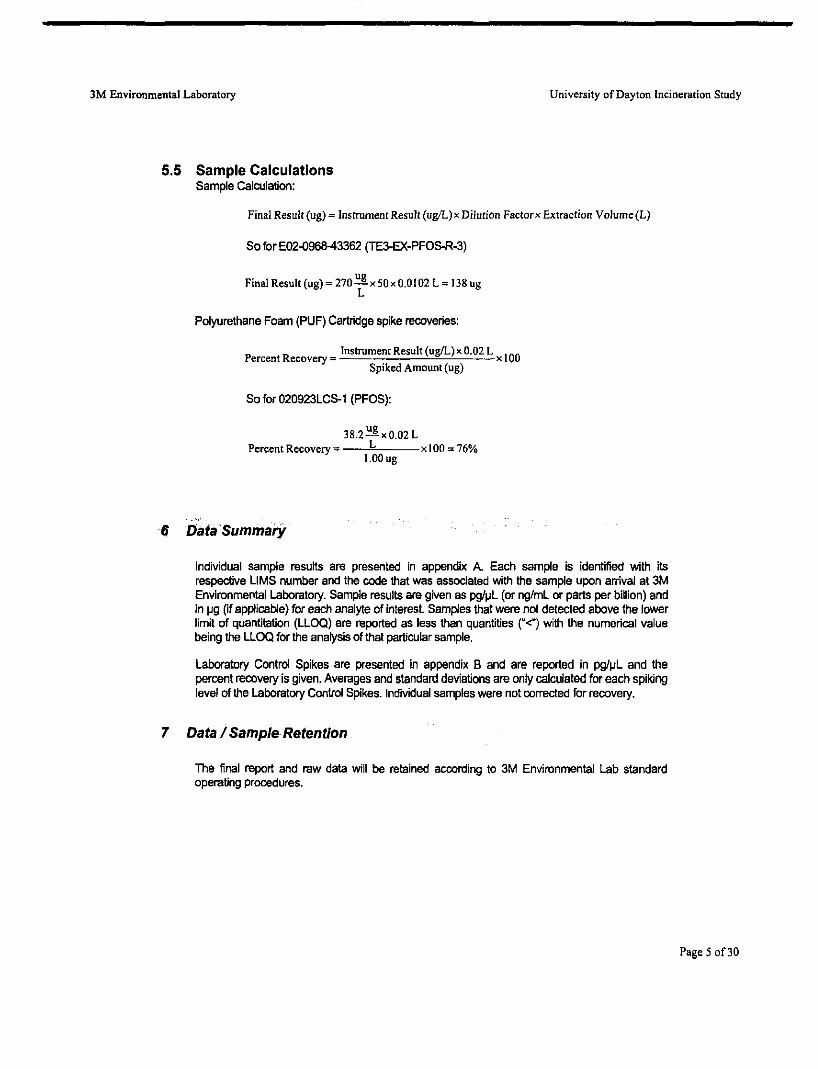
3M Environmental Laboratory University of Dayton Incineration Study
5.5 Sample Calculations Sample calculation:
Final Result (ug) = Instrument Result (uglL)xDilution Factorx Extraction Volume(L)
So for E02'{)968-43362 (TE3-EX-PFOS-R-3)
Final Result (ug) = 270 ug x50xO.0102 L = 138 ug L
Polyurethane Foam (PUF) Cartridge spike recoveries:
P R Instrument Result (ug/L)xO.02 L 100
ercent ecovery = x Spiked AmoUDt (ug)
So for 020923LCS-1 (PFOS):
38.2 ug xO.02 L Percent Recovery = _-:-,;L,:-:-__ x I 00 = 76%
1.00 ug
6 Data Summary
Individual sample results are presented in appendix A. Each sample is identified with its respective LlMS number and the code that was associated with the sample upon arrival at 3M Environmental Laboratory. Sample results are given as pg/~L (or ng/mL or parts per billion) and in ~g (if applicable) for each analyte of inleresl Samples that were not detected above the lower limit of quantitation (LLOQ) are reported as less than quantities ("<") with the numerical value being the LLOQ for the analysis of that particular sample.
Laboratory Control Spikes are presented in appendix B and are reported in pg/~L and the percent recovery is given. Averages and standard deviations are only calculated for each spiking level of the Laboratory Control Spikes. Individual samples were not oorrected for reoovery.
7 Data / Sample Retention
The final report and raw data will be retained acoording to 3M Environmental Lab standard operating procedures.
Page 5 of30

3M Environmental Laboratory
8 Appendices
Appendix A: Individual Sample Results
Appendix B: laboratory Control Spikes
Appendix C: Example Chromatograms
University of Dayton lncineration Study
Page 6 000
3M Environmental Laboratory University of Dayton Incineration Study
9 Signatures
I;" IJ • .)-2J-D] Date
-r i.~} k r2w4.J
QualitYJlS; ce Representative oak I
Kent R. Lindstrom. Senior Research Chemist Date I
Page 7 of30
3M Environmental Laboratory Univenity of Dayton lncinetatian Study
Appendix A: Individual Sample Results
Page 8 ar30

3M Environmental Laboratory University of Dayton Incineration Study
pros pros" PFoS· Cometed··
Sample (PilaL) (all (all E02-0820-42'OO HBI-600-1 <10.0 <0.20 <0.25
E02-0820-42502 HBl·9O()..1 <10.0 <0.20 <0.25 E02-0820-42504 HBI-BLK-PUF <10.0 <0.20 <0.25 E02-0820-42S0S HBI-I 14.9 0.082 0.10
E02-0820-42507 HBI-BLK <10.0 <OS5 <0.68
E02-0821-42519 PFOS I 232 1.3 1.6 E02-082 1-42520 PFOS2 40,S 0.22 0.28 E02-0840-42708 FCI395-600-1 <:5.00 <0.10 <0.12 E02-0840-42709 FCI39S·600-1 <5.00 <0.10 <0.12
E02-0840-42710 FCI395-900-1 <5.00 <0.10 <0.12 E02-0840-42711 FCI395·900-2 <$.00 <0.10 <0.12 E02-0840-42712 FCI39S-BLK-PUF <5.00 <0.10 <0.12
E02-0840-A FCI39S EXTRACT <$.00 <0.028 <0.035
E02-0840-B FCI395 EXTRACT <5.00 <0.028 <0.035 E02..()84o..C FCl39S EX11tACT <5.00 <0.028 <0.035
E02-0867-42903 FC807 -600-I <5.00 <0.10 <0.12 E02·0867-42904 FC807-600-2 <:5.00 <0.10 <0.12 E02-0867-42905 FC807-69BLK <$.00 <0.10 <0.12 E02·086' .... 2906 FC807-900-1 <$.00 <0.10 <0.12 E02-0867-42907 FC801-900-2 <:5.00 <0.10 <0,12
E02·0867-42908 FCS07-BLK-PUF <$.00 <0.10 <0.12 E02-0867-42909 FC807-O <$.00 <0.014 <0.017
E02-0867-4291O FC807-1 <5.00 <0.028 <0.035 E02-0867-42911 FC801-2 <$.00 <0.028 <0.03!! E02-0867-42912 FC801-BLK <$.00 <0.028 <0.035 E02·089S--41970 PFOS-600-1 25.1 O.SO 0.62 E02-0895-42971 PFOS-600-2 64.0 1.3 1.6 .02-0895-42912 PFOS-69BLK 6.32 0.13 0.16 E02-0895-42973 PF08-900-1 4.31 0.086 0.11 E02-0895-42914 PFOS-900-2 9.01 0.18 0.22 B02-0895-42915 PFOS-BLK-PUF <$.00 <0.10 <0.12 B02-0895-42916 PFOS-O 25.5 0.070 0.09 £02-0895-42971 PFOS-I IS .• 0.085 0.11 E02-0895-42978 PFOS-2 8.61 0.047 0.059 E02-0895-42979 PFOS-BLK 6.06 0.033 0.041 E02-089~3007 HB2·600-1 <10.0 <0.20 <0.25 EOl-0899-43009 HB2·900-1 <10.0 <0.20 <0.2' E02-0899-430 I 1 HB2-BLK-PUF <10.0 <0.20 <0.25 E02-0916-430B5 PFOS-TE-I <5.00 <0.10 <0.12 E02..()916-43086 PFOS·TE·2 <5.00 <0.10 <0.12 E02-0916-43087 TE-BLK <5.00 <0.10 <0.12 E02-0911-43094 PFOS-TE2-1 <10.0 <0.20 <0.25 E02-0911-43095 PFOS-TE2-2 <10.0 <0.20 <0.25 E02-0911-43096 TEl-BLK <10.0 <D.20 <D.2S E02-0917-43106 PFOS-TElX- I 897 17 21 E02-09 I 7-43 I 07 PFOS-TElX-2 <10.0 <0.19 <0.24 E02-0911-43108 PFOS·TE2X·BLX. <10.0 <0.19 <0.24 £02-0926-43141 NIIB-I <$.00 <0.028 <0.03S E02-D926-43142 NIIB-2 <$.00 <0.028 <0.03S E02-0926-43143 NIIB-BLK <$.00 <0.028 <0.035 E02-0968-43360 PFOS·HE·TE]·1 2330 41 58 002-0968-43361 PFO$·HE· TEJ·2 44,0 0.88 1.1 E02-0968-43362 TEl-EX-PPOS·R-3 13530 138 171 £02-0968-43363 TE3-BX-PFOS-R-4 ISO 1.5 1.9 E02-0968-41364 TE3-BX-PFOS-V-3 2218 6.2 7.1 E02-0968-43365 TE3-BX-PFOS-V-4 102 0.29 0.35
Page 9 of30
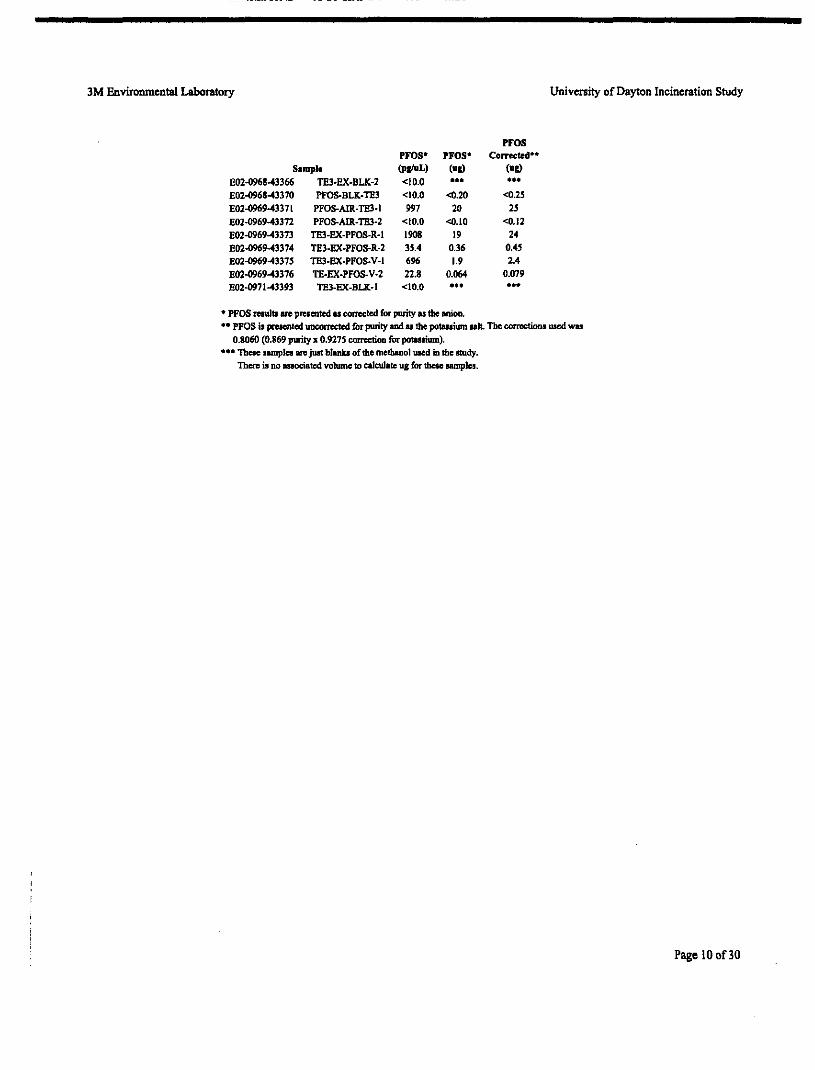
3M Environmental Laboratory University of Dayton Incineration Study
PFOS PFOS· PFOS· Corrected··
Sample (PafuL) (all (all E02.1)968-43366 TEJ-EX-BLK-2 <10.0 ... ... E02-4968-43370 PFOS-BLK-TE3 <10.0 <0.20 <0.25 E02.1)969-43371 PFOS-AIR-TE3-1 997 20 25 E02-0969-43372 PFOS-AIR-TB3-2 <10.0 <0.10 <0.12 E02-4969-43373 TE3-EX-PFOS-R-l 1908 19 24 E02.1)969-43374 TE3-EX-PFOS-R-2 3504 0.36 0.45 £02.1)969-43375 TE3-EX-PFOS-V-l 696 1.9 2.4 E02-4969-43376 TE-EX-PFOS-V-2 22.8 0.064 0.079 E02-4971-43393 TE3-EX-BLK-l <)0.0 ... ...
• PFOS result. are prclcnteci U COfTe()ted for pwity as the anion. •• pros is prcacntcd UDCOI'I'CCtcd for purity IIIId u the potauium uJt. The corrcction. uacd W&!!J
0.8060 (0.869 purity x 0.921S corrcetion for powrium) . ••• Tbese lamplCIJ are just blanU oflhe metbauol used iD the 1ItUdy.
There iI no lIIociated volume to calculate ug for tbeIo samples.
Page 10 of30
3M Enviroomental Laboratory University of Dayton Incineration Study
AppendixB: Laboratory Control Spikes
Page 11 of30
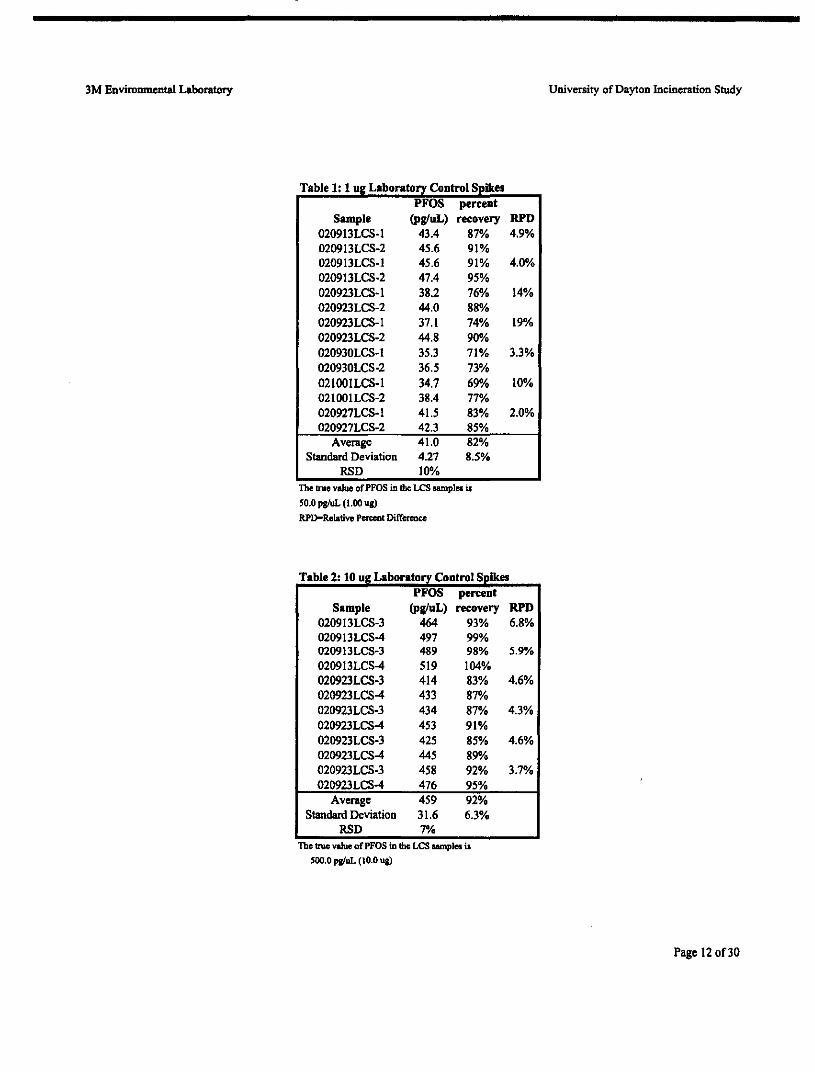
3M Environmental Laboratory
Table 1: 1 ug Laboratory CODtrol Spike. PFOS perteDt
Sample (pgluL) recovery 020913LCS-1 43.4 87% 020913LCS-2 45.6 91% 020913LCS-1 45.6 91% 020913LCS-2 47.4 95% 020923LCS-1 38.2 76% 020923LCS-2 44.0 88% 020923LCS-1 37.1 74% 020923LCS-2 44.8 90% 020930LCS-1 35.3 71% 020930LCS-2 36.5 73% 02100ILCS-1 34.7 69% 021001LCS-2 38.4 77% 020927LCS-1 41.5 83% 020927LCS-2 42.3 85%
Average 41.0 82% Standard Deviation 4.27 8.5%
RSD 10% The lnIe value ofPFOS Itt the LCS IWDplell.
SO.O pgIuL (1.00 ua)
RPD-RelatiVCI Pcn:cot Diffcrco.ce
Sample (pgluL) reeovery 020913LCS-3 464 93% 020913LCS-4 497 99% 020913LCS-3 489 98% 020913LCS-4 519 104% 020923LCS-3 414 83% 020923LCS-4 433 87% 02092JLCS-J 434 87% 020923LCS-4 453 91% 020923LCS-J 425 85% 020923LCS-4 445 89% 020923LCS-3 458 92%
Average Standard Deviation 31.6 6.3%
RSD 7% The true value of PFOS in the LeS samples il
'00.0 pgluL (10.0 ua)
University of Dayton Incineration Study
RPD 4.9%
4.0%
14%
19%
3.3%
10%
2.0%
RPD 6.8%
5.9%
4.6%
4.3%
4.6%
3.7%
Page 12 of30
3M Environmental Laboratory Univenity of Dayton Incineration Study
AppendixC: Example Chromatograms
Page 13 of30

• I
II
Ii
f If
~ II • l~ 2
~ II
i
f I· ~
,
•
II ~
S .., " ~ 0
~
~ -. ~ .-, • .. .0
.... '::l .. ~I':'
!':~ ..• ;;;."
• •• .. •
~~
I. I t·~ I
/"I h;
1:-1
X-I y~
LI I:. I
t3 I
f'l t" I I~!
.. ~ ... , ..... ~.:~! ·.!."·_I··T·~·:"l'·"4."·'··::'·-:'-:·:':···.l. '~-':"'~; 1"" .. ":..1.-:::":.1,"
I. I ,I'
I r I
• ~ • 0
0 g .0 ;:
• 0 "" R '" Q. · ,,; ~ ~;;~: ~ ...
• ." ":.";; r.
" ;; c§;;u.i..j ~
• N " • ~~ • • • • 0 - 00 0 .... ;;/!'!Il .0
• .. .,. .. • .. .. " • ~ • - .
" • ;; Ji~
" u • ,,;;
" • .;, .-X ~ • • ~O.
• • ~ 'Ill!"" ~ ., ~..' • " ~~'::.' ~ .. ~ ::~':O • ::.~ ,:" .--:;:.:a~ .. ,:;; :;:; ,,~ ;::;1'1--i'd-"I"L;- ;;;7';' ;:;:. ... ;""oollitl ;....."~ ..... HI:;:I 0 .. .... .. .. .. .. .. .. "" .. -,.. o· 0 • ... OOIiC
~g,,,!C~I:l~_f~<J Q!f • _WW!llI-i •. I!!.!_'-I."I,",9.'!.!! ~~~~W-'!I<~~-::~~~::~ ...... ~ .... ~ ......................... ~ .... -
.. i I ~
I I :: ;: ; -t i _
;j I::
. , r ! !
" '-1 : t
"
I"''''' A
J"I - [J
[, I
" ..

L'
" .. .0 , .." ,. " " ... ,. ," ""
- 1
I
II
II
i If
~ I!
~ I~
~ I~
~ I ! I , I
=
~
\
f
\ ,
~
1.1
l~ 1
:: 1
:~ 1
," 1
:~ I
:'~
LI I:. I
I'~ I 'll I:' I ~ ,. I
1'1 I~' - J 'J
1·.1 .t' \:. I ; I .. , ... , ... , ... , ..... , ... , ... , .... , ... , ... , .. " .... , .. " .... , .. J I r I "n, ·,·,a·,·".·,·~ I
l-
• • a , . I : .' ;; i
, g e ~ ~
• u ., ;"I~O • . " , • !;; " .. ;;g~
" 'I' , • • . , .. .. M • 0-
N ;;; '" ;.; s: .. ~ • , , , n N " " . • • , • • ." 0. • , · ~ , ... ~-~ p , I -
• • • y
• " , . , 1 " " ". • · "'- , : " .. " • r. .. • ; • " • , ." II· ... ., ::-~ Q .J
" >. .. "- x ~ • """ ~
•• • • 0 •• " , , 2
"" " ~ • • ~~ 1!.0!5~ - !!.2!i!' HI! ~ "!.':" !! ~':"';o • ~., '::"'~ ~ :: :-I:l ;:::~~ ~ ... hlFl'7 .. 7 ;:;77 ............. • ~ :":1;" M'JO :,.. .. "'0; ... .: H i'i • • .... - - .. .. - " " .... _ ... .. • •• o· 0 , -400ec , , ... 0
.... Q. ... 0 .... a ""' ~.u .. u~ • , ~ • • .WA,,'" .. 110: _Q.QAo C!liI! II! • , • ~ v
"~ ~.Aj'O!! Wolf! .~""~ "'!~'!! I::! ~ • , . - .... ................................ ..; ............ v ·

- 1
1
I~
"-~~ ,. " .. I::; · ..
t. LI
.-/ '.1 :. 1
:. 1
:. 1
:. 1
~. I
--. ,"J · " <: III
__ ~--, : .. "1
• It 6 III ::; Ie C' III
., I'
• r , , • • : , ,
, .• ,. C·,
" '-J ,. r:" , I'" II.' I:.. II f;- II
bo, f:1 1 -, ,'. ..
.:! I --' ,
''': I .. ,
____ I· ... '
-~ ' ... d
\ "' I.": I , ,
.,'
I '" .. J 01 .. .. " oi " .. • .. "I ............ H ..... .
• •
· ?
•
• •
..
· . ..
• • •
.,. " u
" " o
:;;-;:, &l1'i ., ....
_:tl't...oeFi
• • W
... iii S;;. N·~
HO ... .a.1I!
" .. ~"' " """. ••• -
• " 'il
" '" , • R
.... "''''' ........ 00 .. H .............. ,_ .... " ..
o u ",oo,:uc ... go.&.! O,>:! .c;.o,!_ flo,; IJ 11" !I
_"'~~"' •. "IiI_'-'04"'~I!!..~ ~~P!! Iif'~ I!~~".: "~"':'%:: ~
II. ~ : ;; f - ....
••
• I.,. r 11:.
Ii = ..
iI ! :
, , ! :
Ii: , I :
•
; : , . I ; &
t i
c
•
• • • ~
• ~ . " , ~ .
'" iii
e ., .B
~ .... 0
.~
..,
... .0
"
'~
I II
Ii , If ~ II • II , ! I! i ~ I ~
• ,
•
" ~ • ~.
• ~ 0;
" • ;; .. ~
• ~ • " • ~ " • " -- ~
fj",; • _0 "~ "0 ~,
.~
'" -". •
"'" 00
,.-I
I
'2 ~
<~'A
• 0
~ • ~ ~ ~ ~ ~ ~
" NOO U , .!( ;;:=~
~ , ""
.., " e - . " • ;:;: 1;:., ~ - = ;";' ~ 3
~ u ;;.a " ~ • '01 ~ • 0 .. > U U
~. ~~
: :C ~ -:-::-; . " ... .. " 1iIri ..
• • ••• ~ ~
t/.I19 toC) ~ ~ .,,, " I.::!<'.'<'I N-
~"'r._"!' !:: Cr. ~!:I"'" ~~':'1:":' ~~ .... ::::..::: -., :.. .. ;,7.~ ... _.- ._-_ ......... _ ... "" " .... .. _ .. - .... " . .. -. -" U • ~i:JOlDe
... I:IoU 0"'';:'" III':'UU. • .,aOlllH •• Q.QLIJIUGI
~.q~" 80 11 ~~~<jlll""".o"t~p u.., ... v ... ;a; ... ;a;;a;v<ll;u .......
I, I ( :~
"I
:~ I :j I
:~ I
""'> :'J
\ :- I
I '.1 1 :~ I
PI I :'1 11'" J,I .1'
,..I,' I f I
• · , , • · , , , • i • I :: • ! , • , • , · , , ,
V
~ , , • · , .. , , , , ;;
> ~
• , , , , • •
O , • •
" • ! , ~ 0 , - " ,
• , • " u
• , -• ; ~ •
I -:,i I
1 :'1 -J:'I
1:.1
"",J I u..!-' A
o
o ....

1'>
'" ~
" .E
~ .... 0
.~ II
.... Ii
I If
~ I~
• Ii 2
, I; ,
i
~ I ~ I . I ,
•
~ = ';
,;
'" • ~
~
e .. , .:>" • -•• "~
"" ~. ". .,
:'(~
~ "" .&> ;;.- . . , • ~ •• '" " , = ~eo ... "~ ~
."
.,
1:.1
f . I ~~
r- : I .~
/ "I
~ ,~ I ~ ;." ,
\ .1 hi I ;~ I :j I 1,"1 i '"I 1"1 "I J . I
I :. I .1' --,.:, I
···'····0 ... , .... " ... , ............. , ... , ...•...•...•... ". F I II ··"TTn·'··'··.·~) I
• ;; 0
• • • • " • ~
z
• 0
::; g 0: ~ N
V ~~? " -;; " ~.g ..: ., . . ~
• as::1I .. " " ~ •
" u "" G ., 0 '<12 .... ~ ~ ~ u .. · - . " "" ;; ." u u
• • ~". • • -!' • -: -:
!..,~ :.:::: ~ -.• :1-';- ~ :=.: ... .-.:;a: • to! •• t: i=>pr;--
Ii" ";' i.,;::I! iii. a~ .... ;""0 c.'D id ......... o ..... l1iOoo . ... ~-~ ........ -- .. -- .. .H 0 It .-Ioo.lIe
... qa.,,",o":fc"'_!114.1"'QJII !I;
.tDl.J "M., II \j! ... 1-1.>01'" ~!!.~
'!!~!:'IiW'''!'!o:~~''!-;~~1''" ........................... _ .............
i • .
• • , I • -
, • , • , ' , ,
• , •
• • , , • : · t
,
· : • : · , : i • , , ,
: :
, " , -
1 : t
"
~,.
• • ~
" ~ ~
."
• • • .. • •
~ • " • ~ , ~
u 00

... o
'i'j
,., '" .--'"
"' '" U
" 0 .~
-~
'"
-. ! - I
II
Ii t II
S I!
•
• u ~
• t;.
-~
• ~
~
• .. • ~-0 .. ". uo
11'! !!.!t !'t..:. -" .. " u.
a~
1.1 hi
/ '" I ) :·1 .,.'
\ ,J I
FS :~I
.~ :'~
n r. I I'~ I I .~ I
1:"1 PI 1- I I!'-' -===-_j:- I
LI , f' "-1. I .. '.1'" '~," _ .~- •. ~. ,.l. •••••••••• t· ·'to.· " ...... ! III
i • a " , I •
~ w • I
.. 2 u ~ Nao lr! • , , :;; .If ~~~
. i • I , · " -. ~ - . • ,; " .2ii !i:: .. ~ • I , H N ~ .. " ~ • • , • • w, • , I -• ... :u~ .' , , , • ~ ~ .. • u u , , • ~
• ., ., .. I ~
" • • • • ; • " " ." 'i1':; ~
• "u " . .. • • ~ • 81:";. OM •• a • • , • • ~. ~ • • ••• I!. <1 'i" • ~r: .. 0 ~"<:' = ~!!:!t: ~ 'l::: ::or. ':::.):: ... • ~~ "
_. oCi~':' -- _ ... " r,...~;.; ;,.'1:, ::,,;..;n;,; ... ;::1'i~ • .. .. .. .... .. .. .. .. .. .. .. ... ~ • ... 0 • .:. 0 ,ill ~f ! , ~ 0
... a,.,.. ou ~ .. ........... 0 .. • , .. .. • CGC.,'" •• O.g .... 01" II • , • c' u
&.!.q'C'''~lItl;!'''rjll!''''.o1I:!P , , .. u""' .... u"'a;va.a.U' ... ~ ........... ,
'" 0
'" If
II '" " N
!! LI :: .~ I L 1
~ ./ 'b r - \ .... l:' 13 · , il I~ I • 1
'" II
" -' '_I ,. , • .. '" ." • " ...... · . , .. • .. " • "
, • .. I.I!.
• " , ,. I'~ I , .j I
• , , , "
, , 1' .. 1 -4 ~.; I , J _ ; . '. , 1 ,. , II, \ ... , , ,. , " "'P' .. ",
• "" " >: "
).-" I " V:. I
~ "' • , • "-. ., .... ~ " :.--.r-~~L-''''· :r':.'.-r -, .. ...........
" A
• , Q • " · .. , , N • ~ " • • · . ~ " "
, • · ~ U ," NRO " • , • , • "- ;< .f. ';;13[! · p- , ,
~
~ • = " ~ " • OS::II ~ • , : ~ n " N '. • • , '. " H' .. , , · ~
, .... ;1,_ • , , · • ~ ~ '. ~ E " .. , • • ~ • ., ., .. c " • .~ , , .:; , > 'U U.;, ~
/0 • " " " 0- • m N moo ~
"- ._N .~~ " , • • "~ ~':':- N • • 00 !."'~ • 'uu - .
~. I':'! ....... ::1"': ," • '" ~.:;r ';;;;::::1> ~ ;;~H ;; " . - • ~ .. " w .... -r.:..; !;;~. c..:i -" •
.0 ;:'" :'-iiiI is .. ;'fli. ;"'i-io • .-i"'iSc , ., • .. w" M ,. -"" - .. -.. -. m , - •• •• 0 • ... 0 O,C/ c: , : "
, " ... Go .. O~ c"! ." ... .,.Il!' • , - .. • " ,
,03a " ... _.tl2_1.l .... Y.'~~ , , , ~ u
" I:!~ '.:!~'!:'!' ... ~.':: ':!~ ~"'"!'!:::!l ~ • i " ~. .. ...... Vv ...................... _ ... _
'<;; .,. .,.
~
'" ~ ~
.9
t .... Q
~ Ii ~ II
I I! ,
11 • 2. I!.
i ~
~ I
r I > • i
!1.
~ 0
~
" /
0
" -: c .,. .•
" .. /. It .::
"" .-... .... r,'';'' .. Li'i'
'" "" .D ..J • ~ '0 ." " " -• " "::1;:' ,.. > ,~
==
,./
\
? ,
~
LI
I'll "
-I :.:
,. I
:' I
". LI
hi
r~ I
F'I
1.1
I,ll
PI '-==~LJ Ii '
j, I i r I:, I .~:. '! ".I: "'11: ... ~. "':." "J. '0\" .~.- "0\' ........ "" III i"'!i"'lTrcll:riJ
• n .1 i I
• ;; ~ i • 0 • -~ :H'!~ • ,
" ,
" 'ii -fi' ~ .. ~ il -• · , , ~
a " ~ ., • , ! , • 0 0;'" ~ • ! • • " " " • • ". • ...... ~ ~ • , ,
" ':~:ot ,< • , • .. " ~ , .. = " , · , · .. " '" -" - ,
~
" • "" , , ,
> u ,~ ~
~ " " ~
• " " ~ ..... ~ ........ .. -~ , • , , " "-- ~ .. _- • • ;;,~-::: • ;;.x;:; "';"" .. , ., :;:.. c miitJ ~ iii iI'lJ .0 - • "" ; ." roQ"; • .... IIQD.IIU .. ....... O ..... I:I.OQ •
•• -::~ •• WM •• ~ .... :::.:-~_ II' • III... ,u II •. '"! l? u!!' 10 f; H • ::"!""!:!-!~.~!::_.l!!'!!"!:::~l'! .• !!! t. .' , .. - ... l'! .... ~l=! ........... y..::.~ rl. -. -':O':Il-o·"U!".::~~-';;;";:'::::;;:;;;;1:: t~
3M Environmental Laboratory
3M Environmental t.boratory
o.t. rile I
Lab SInp Id: \ \Et8t.U'3!et\Urget\chea\dw:lejr, 1 \D0209U .b\DUDB0030.D £02-0'''-4:13150
Inj Oat. Operator Smp Info Miac: Info <:onoe.'
2(·SB'P-20Q2 11,58 kj. PFOB-HB-TE3-1 5QnF
Meth04 \\Bt.t..rget\t.rg.t\che.\dudejr.i\DO~UY~4.b'V020924.m Meth Date 21-"_),-2003 O,,4'J .ich Quant TYge: ISTD t'al n.te 24-SKI"-ilII021"/:55 Cal rile: DUDB0024.D Alii bottle: :011 1>11 Factor I 1.00000 Integrator I Falcon Target Ver.1on: 4.12 Proce •• ing aoBtl Wl'55' _ .. -
cClllPOWld S\\bUat: nos, eub
.- -"" .. .,. -.I-~ ~ ''''''"''"' •• lIt ,., •• I.H' ._ou ... _ •• IU I.'" ' .• 61 •.
University of Dayton lncineJ1ltion Study
_. r------------------.,................................... ... ................. J.--------------------,
·,-i :::1 ..oj •. ~ ·.tl
··'i-':';'""''''.,.,T .... .-'''':-v.:''''1;T~!f';':; a_._ I.,: 2,.; 1I.1~
I.': a 1.": ~ t.!~ .. '.1~ .,,:
, .. _ .... ~
a " -.a:
,;.:"~.". .• C·;.~A~·~·~4:~.··;.c ....
II'tW ....... h-
Page22of30

3M EnviIOmncntal Laboratory
Di.t" File: \ \EUtarget\target\CbeIIl\itchy. i \I020926.b\ITCHYD27.D PlIgtI l. ItItPOrt. n.t.: 21_May_2(10] 09.31
3M RnviT~"t..l Laboratory
DaU. file : Lab 8"", Id. lnj Date :
\ \Etata%get\t.rget\ehelll\i tchy. i \1020926. b\lTOIY027.D E02-01t5-4.:iilng
Ope~.tor
$lap Info tUBe Info Com:aent
26·6BP-2002 li:l1 kJ. preS-SLit
Irwt 10: It.cby.i
Method \ \Et.t.rget\U'~flt\ch_\1tohv.1 \t020n& .b\1020Ue:. m Met" Date :J:l-May-2003 O:hl' etch Ouant ~. IS'rD (~1 uata : 26'5£P-2002 18.4.5 Cal Fil.: ITtHY023.D Ala bot.tle: 21 Dil Factor, 1.00000 lnt.Agrat.or. Falcon TIJ.l-'yel Version; ".12 Proc ••• ing Hoet: wlt55i
- _ .. -._t .... , .•
COIfIpOUNI subl tat, PI'O!'l • RUb
---" ........ Tn._ !..,.~ ~
..AU 1.111 ...... nun ...... , ••
University of Dayton Incineration Study
... na.. ,~~-"",.I-.J""'~"
'.Ii '.tl ::!i . .., • .oj ',-1 ..., I.~ '.Ii '." ',Ii ... , ',t, ~ •• ,j
,\'-'1 ". i~ !:~ .. ::~ .. " 1,'1
~::l I."!
'~~-"""'I"_IIN_.I
!~ ~~ :: -----~
_.
~ '-. "A .. i.;. u" ,;, ir:,' ':. ':i •.• : •. '.:, '.;.;' .:.. .;. . i:i . :,; •. ';:i" .. :.":.,...-.'.,..-
,_(~
.~
~~ :::1 ,..,
_ ...... !
•• "! ;; LS1 I ... ,tl· ••
!::1 J\ "-. .;.~ .. :.:.' . i.:i .• :.
Page 23 000
-'" cIi
e • I ~ , I
~ ;,.; 0
"j; II ,., Ii
I II 1 I! • I~ <
• I! :z
t 1 ~ 1 ~ 1
•
~
~ • g ~ , " ;;
• • ~
• .. • , • ~ " • • --~ ~ · "" • k.
",",
'!.~
r> " .. :. " ~.:;I ... ""-... :;:."
"' • •• .. ~ .
" • " "tP.o 0 u. "" -" -
~
\
'- \
-~
• • c .. , • e ~ ~ i. -~
" "~. " . " • ,
" ;.- ~=~ " ".l!: , , ~ •
" iJi5:111 ~ • : , " • ~ • , ;
" u " • • , : · • ''':Uf " , , " .. ..
" , : , • " .., , , • ,- • ; • To ,".:0 ·u c.. ~ ~ OI~. • . ~" , ..
" ! :: ~. -: • !..~ !.~~ ---"'-''0 "
...... ., .--:::=:::: " ':~J;; ::: ~ ... -M":' , . - ;;;~7 "' ... - .. :";;N.i!'S; :,... ... N ...... ~fiD ...... - - -" ,,- .. .... ... .... 0 • .... ouoe " ... 0. ... 0":' J: ... ....... 1.1. • , -
I1IA" .... _ II ~ _ R.IUI gliUt , I , "!!~'!:'IUo"'.-:::!,:!,>'j.",,!~~~ · , ............ VIZ- ..........................
1.1 /:.1 'I
'·1 "" :' I
,;;1 :oJ
i ~I
\:,1
I-~
I:~ 1
10"1 1:.1
• m ~
m
"
""\ ,;; 1
If" ,-==::-=-.1' 1 , I' \ •. 1
~
• ~ , 0 ). .., 2
• • • , • • • v
Q
g ...
.. . 01
'~
,., '" " .. ... .. " .. 0 '<: ~
...
I • I
II
Ii J If
~ I!
i ~
J I • I ~ I
•
· !
• I;
" " • ~
" " -:;
• --iii'.: (i"e:>
"~
"" ~,
U .. , .,. ..
•• :,.j-
• "'" ".
LI
hi ~ ,< I
:·1
J ." I
I ;~ I -., :'J
1 ' ... I
1:.1 1'31 r .~ I
I:" I "1 ';;1 I-I II' -\ ,'I
1:. I .1' I:, I ".1 ...• ;: •• .,!, •••• .!. •.•• ./. •••• .I. •. :..I. .... ,:." • .1 •••• .,!, •• _ ••• .J. •..•• \ .• }- I II rr:rr2"".r'X":.r·;L'-rr.r)"
• • 0 ., " · . ~ • i -~ ~ • u ~ NO. u I!!t.,
!? -1i !?DIi ~ ''is I • • .- " . .: ~~ " • '" :.;: C:ft ~ • I • " " ~ ;;. '~j , • , .• " " . ~ , , -
~ • .... :1 .. , , I • ~ ~ ~
• • • , ; , -• "" "" · I " " • •• , I • " -.: ~ 'n~ ~
~ .. '" - > r " ;; m.;;:;,; ,
ilia .... .~~ , • I • • ~. ~ • • ••• ~cc • I:!!":I'I 0"" • ~~~ , t: ~~ ::::11'"';" , .t::.:.-:- .- .-. ~~ .... , ~_M;::;lo'ol:'. '-;";;;;; .. ;:::;:;;:; • .. " .. - ., . _. N ~ ...... •• Ii- m , . " , • ....00 Iiii'! , , ~ , .,.fa.~O"'C., iIIi:.lJUIil • , · '" •
140,. ... 00 OAIioOlIIIII , , • ,.. U
... .qT:l'.g.·E1~""~· .... .I;!I1P • , -U ...... UCll""V&;3I; .. ".;..., ......... , . V •
" co
" ,~
'~
... " C .. " .. U .. 0 '~ .. '"
•
I
~
t I
hi
L'I :.1
PI
II ~~ I i If'----------.lpJ
i IJ n ~ I! t. I ! ~ I:~ I , I f::i I 1''' I ~ I ~ I
~·I IF',-' -' ~=::::::1:1 U ,I' 1,,1 I I! I ,,:::, __ :,,::,,:_:,_,,:}~ I
• 0 9 • • .3 I • ~ a n " ~ i -~ 8 ~ 0 " 000 • , , • , , .!} ;Q i' "a~ ~ • I' I • , , " !:::I.-l .':!
" " , ~l'"~ • ; •
~ • - ~ - - • , , ~ .. " :::.c;- ~ , I :.. • d, • , I • "
, ,~
• • ~ ~ · I , " • ~ ~, · I -: " • ". · I , • " ~ ~~
. - • .. • .. -0- • ~ ~ iii;'", " [:'0 ioi..,o MO\,.. • • , • ,,~
-~ " •
.0 a.a 0 '00 ~
~
_M • "nn ." •• ~~~ " 1t ~!'! ~19";S
• ~-'. ~ ." HiIIf., ou
,n --:'::::::!:T.'~ -:.::~:::..:.t"l::= ~
" . .. . - . ... .. - ••••• __ • M;';--. .. . .: ;.; n.i /Ii' I , - :..; ft.'::; n ... e .... • u:U,.c~ • , --" tad • .,. •• ·d.ll~tiI .. 1t • 1 • .HI. ~.a.,..,ItOO,.E"'.u ....... u ... O • , · 00< QI.lHOIoOZUZ'Z'UOC~""f-o'" • ,

~
til
~
" - I .!3
! .... 0
.~ II
'"' II ! If • I! • ~ I! ! I! ~ I , I
~
· , (~IA
• 0 9 • ~
" u E " ~ ~ ~ 0 " .0. " D
" jj' ~a~ ~ " , .. ~ ........
" · ; " ;.; r;:::.
" " " C .... ~ • 0 'ii " " ?i: ~
~ • ., . • k • "
, ... ... ~ ,
" ..,
-;; , • ~~
• " " -:-:.~
~~ = " -. -OJ -:: • & ~ ft.. iii N' • ~D " .0' "" /~ > /
•• ••• • ••• • '" .. , !!.'!'''' • '"" '" ~~ !:::'!:C " !;:'~ ••• ..
" -- -• :::"l''':' ~ .. ::
" - ' .. ;:::;: : • .'C ---- ~I':::: ., • ...... N ............ . ... - . .. .. 0:; • • .:.; nnlia" .. :,..; Il.U D ... i:i.., II .. ;;' roe" • U " I'.IO • .:..i .6··~A"'t:1 .... .. "0. .. .g ...... "'_ E ...................... 0 0 C. Qo-lHO.XUZXt.JoCQH~Do
.'" " ~
., i -• " , I' , • , , · • •
, •• •
• I ,
LI .hl
\ "I
I 0-1 .,
I ,'I 'I'll
I ,
" I , I , I
I . I , I , ! I ,
"
I • , -; , , -,
V~
VI 1.1 bl , I
~'I {'I
E" I
'-~=::::1"" I IF'
LI .1' [.1
J I ,I }'I ,....,.) A
, .,,~
" c

Appendix 6
Spreadsheet Linking the UDRI Combustion Tests with the
3M Analytical Results

Spreadsheet linking UDRI Thermal Testing and 3M Analytical Results
3M Sample Date Number Sampled VORl Sample Description Test" Detailed Sample Description E02-0821·42516 7/3012002 WT·DT·\ Desktop Wlpe lest before Test 2 E02-0821-42517 7/3012002 WT-BT-J Bench lOp wipe test before Test 2 E02"()82i·41518 7/3012002 WT-BLK-J Wipe test blank for before Test 2 E02-0821-42519 7/30/2002 PFOS I 5.2 lst extraction ofPFOS spike E02-082 1-42520 7/3012002 PFOS2 5.2 2nd extraction of PFOS spike E02-0821-42523 7/3012002 PFS - BLK 5.2 Solvent Blank for PFOS and PFBS extractions E02-082 1-42524 7/30/2002 WT-BT-2 Bench top wipe test after Test 2 E02-082 1-42525 7/30/2002 WT-BLK-2 Wipe test blank for after Test 2 E02-0820-42500 81212002 HBI-600-1 5.3 lsi PUF for heated blank Combustion al 60QoC E02-0820-42501 81212002 HBI-600·2 5.3 2nd PUF for heated blank Combustion at 600°C E02"'()S20-42502 S1212002 HBI·900·1 5.3 lst PUF for heated blank Combustion at 900°C E02...()S20·42503 8/2/2002 HBI-900-2 5.3 2nd PUF for heated blank Combustion at 900°C E02"'()S20-42504 S1212002 HBI-BLK-PUF 5.3 PUF blank for heated blank Combustion E02"'()S20-42505 S12/2OO2 HBI·I '.3 1st extraction for heated blank Combustion E02-0S20-42506 S12l2OO2 HBI·2 5.3 2nd extraction for heated blank Combustion E02-0S20-42507 812/2002 HBI-BLK 5.3 Extraction blank for heated blank Combustion E02-0S20-4250S S12/2OO2 WT-BT-3 Wipe test for bench top after heated blank Combustion E02-0S20-42509 SI212002 WT-DT-3 Wipe test for desktop after heated blank Combustion E02-0S20-425 I 0 81212002 WT-BLK-3 Wipe test blank after heated blank Combustion E02-0S40-4270S S/912002 FCI395-600-1 5.4.2 lst PUF for FC-1395 Combustion at 600°C E02-0S40-42709 8/912002 FCI395-600·1 5.4,2 2nd PUF for FC-1395 Combustion at 600cC E02-0840-42710 81912002 FC1395·900-l 5.4.2 1st PUF for FC-1395 Combustion at 900°C E02-0840-427 I I S1912002 FCI395-900-2 5.4.2 2nd PUF for FC-1395 Combustion at 900°C E02-0S40-42712 S/912002 FC1395-BLK-PUF 5.4.2 PUF blank for FC-1395 Combustion E02·0S40-427l4 8/912002 FC1395-1 5.4.2 1st extraction for FC·139S Combustion E02·0840·42715 S/912002 FC1395·2 H,2 2nd extraction for FC-1395 Combustion E02",()S40-42716 S/912002 FCI395-BLK H.2 Extraction blank for FC· 1395 Combustion E02...()S40-427l7 8/912002 WT-BT-4·3 Wipe test for bench top after FC·1395 Combustion E02·0840-42718 S/912002 WT-DT-4·3 Wipe test for desktop after FC· 1395 Combustion E02"'()S40-42719 S/912002 WT-BLK-4-3 Wipe test blank after FC-1395 Combustion E02",()S67·42903 S/20/2002 FC807-600·l H.3 1st PUF for FC-S07 Combustion at 600°C E02-OS67·42904 S/20/2002 FC807-600-2 SA.3 2nd PUF for FC·S07 Combustion at 600°C E02.QS67-4290S S120/2OO2 FCS07-69BLK 5.4.3 Blank Combustion between 600 and 900°C E02-0S67-42906 S/20/2002 FC807·900·1 5.4.3 1st PUF for FC-S07 Combustion at 900cC E02·0867·42907 S/20/2002 FC807·900-1 H.3 2nd PUF for FC-S07 Combustion at 900°C E02.QS67-4290S S12012OO2 FC807·BLK-PUF 5.4.3 PUF blank for FC·S07 Combustion E02.QS67-42909 S/2012002 FC807·0 5.4.3 Valve and Extended Tubing Extraction after 600°C FC-S07 Combustion E02·0S67-42910 S/20/2002 FCS07·1 5.4.3 lst extraction for FC-S07 Combustion E02-OS67-429 I I S/20/2002 FC807-2 5.4.3 2nd extraction for FC-S07 Combustion E02-0S67-42912 S/20/2002 FCS07-BLK 5.4,3 Extraction blank for FC-S07 Combustion E02"'()S67·42913 S120/2OO2 WT-BT-4-4 Wipe test for bench top after FC-S07 Combustion E02.QS67-42914 8120/2002 WT-DT-4·4 Wipe test for desktop after FC-S07 Combustion E02·0S67·42915 8/2012002 WT-BLK-4-4 Wipe test blank after FC·S07 Combustion E02·0S95-42970 S/2612002 PFOS-600-\ 5.4.1 lst PUF for PFOS Combustion at 600°C E02-0S95-4297I S126/2002 PFOS-600-2 5.4.1 2nd PUF for PFOS Combustion at 600"C E02-0S95·42972 S/2612002 PFOS-69BLK 5.4.1 Blank Combustion between 600 and 900"C E02-0S95-42973 S/26/2002 PFOS-900-J 5.4.1 1st PUF for PFOS Combustion at 900°C E02-0895-42974 S/26/2002 PFOS-900·2 54.1 2nd PUF for PFOS Combustion at 900°C E02-0S95-42975 8/26/2002 PFOS·BLK·PUF 5.4.) PUF blank for PFOS Combustion E02-0S95·42976 S126/2002 PFOS·O 5.4.\ Valve and Extended Tubing Extraction after 600°C PFOS Combustion E02-0S95-42977 S126/2002 PFOS-I 5.4.1 lst extraction for PFOS Combustion E02-0895-4297S 8126/2002 PFOS·2 SA.I 2nd extraction for PFOS Combustion E02-0S95-42979 S12612002 PFOS·BLK 5.4.1 Extraction blank for PFOS Combustion E02-0S95-419S0 812612002 WT-BT-4-7 Wipe test for bench top after PFOS Combustion E02-0S95-4298I S12612002 WT-DT-4-7 Wipe test for desktop after PFOS Combustion E02-0S95-42982 S12612002 WT-BLK-4-7 Wipe test blank after PFOS Combustion E02-0899-43007 SI2712002 HB2-600-1 5.5 1st PUF for 2nd heated blank Combustion at 600cC E02-0899-4300S S12712002 HB2·600·1 5.5 2nd PUF for 2nd heated blank Combustion at 600°C E02-0899-43009 SI2712002 HB2-900·1 5.5 lst PUF for 2nd heated blank Combustion at 900°C E02-0S99-430 I 0 S12712002 HB2·900·2 5.5 2nd PUF for 2nd heated blank Combustion at 900°C E02·0S99-430 II S12712002 HB2·BLK·PUF 5.5 PUF blank for 2nd heated blank Combustion E02-0S99-430l2 8/2712002 HB2·1 '.5 I st extraction for 2nd heated blank Combustion E02-0S99-430 13 812712002 HB2·2 5.5 2nd extraction for 2nd heated blank Combustion E02·0S99-430 14 8/2712002 HB2·BLK 5.5 Extraction blank for 2nd heated blank Combustion E02-OS99-43015 S127/2002 WT-BT-HB2 Wipe test for bench top after 2nd heated blank Combustion E02"'()S99-43016 S/2712002 WT·DT-HB2 Wipe test for desktop after 2nd heated blank Combustion E02-0S99-430 17 8127/2002 WT·BLK·HB2 Wipe test blank after 2nd heated blank Combustion E02-0916-430S5 S128/2002 PFOS-TE·! 5.6.1 1st PUF PFOS 1st Transfer Efficiency E02-0916-430S6 8/28/2002 PFOS·TE·2 56.1 2nd PUF PFOS 1st Transfer Efficiency E02·0916-430S7 812812002 TE-BLK 5.6.1 PUF Blank for 1st Transfer Efficiency E02·0916-4308S S12S12002 WT·DT-6 5.6.1 Wipe Test Desktop I st Transfer Efficiency E02-09!6·430S9 812S12002 WT-BLK-6 5.6.1 Wipe Test Blank 1st Transfer Efficiency E02-0917-43094 S/3012002 PFOS-TE2-1 5.6.2 1st PUF PFOS 2nd Transfer Efficiency E02.Q9 I 7-43095 8/30/2002 PFOS-TE2-2 5.6.2 2nd PUF PFOS 2nd Transfer Efficiency E02·09 I 7-43096 S/30/2002 TE2-BLK 5.6.2 PUF Blank for 2nd Transfer Efficiency E02·0917-43097 S/30/2002 WT-BT-TE2 5.6.2 Wipe Test Bench top 2nd Transfer Efficiency E02-09l7-4309S 8/3012002 WT·DT-TE2 5.6.2 Wipe Test Desktop 2nd Transfer Efficiency E02-0917-43099 8/3012002 WT-BLK-TE2 5.6.2 Wipe Test Blank 2nd Transfer Efficiency

Spreadsheet linking UDRI Thermal Testing and 3M Analytical Results
E02-0917-43106 8/3012002 PFOS· TE2X-l 5.6.2 Isf extraction PFOS 2nd Transfer Efficiency E02·09 1 7-43 1 07 8/30/2002 PFOS-TE2X-2 5.6.2 2nd extraction PFOS 2nd Transfer Efficiency E02-0917-43108 8/30/2002 PFOS-TE2X-BLK 5.6.2 Blank extraction PFOS 2nd Transfer Efficiency E02-0926-43141 9/6/2002 NHB-l 1st clltraction for non-heated blank E02-0926-43142 9/612002 NHB-l 2nd extraction for non-heated blank E02-0926-43143 9/6/2002 NHB-BLK Extraction blank for non-heated blank E02..()926-43144 9/612002 WT-BT-NHB Wipe test on bench top after non-heated blank E02-0926-43 [45 9/612002 WT-BLK-NHB Wipe test blank after non-heated blank E02-097 1-43393 9/2012002 TE3-EX-BLK-l 5.6.3 1st Blank extraction for 3td Transfer Efficiency E02·09694337I 912012002 PFQS·AIR·TE3·I 5.6.3 1st PUF for PFOS in air 3rd Transfer Efficiency E02·0969-43372 9/20/2002 PFOS-AIR-TE3-2 5,6.3 2nd PUF for PFOS in air 3rd Transfer Efficiency E02-0969-43373 9/2012002 TEJ-EX-PFOS-R-I 5.6.3 I st Extraction of Reactor and Transfer line for 3rd Transfer Efficiency ofPFOS in air E02·0969·43374 912012002 TE3-EX·PFOS-R-2 5.6.3 2nd Extraction of Reactor and Transfer line for 3rd Transfer Efficiency ofPFOS in air E02-0969-43375 912012002 TE3-EX·PFOS-V-1 5.6.3 1st Extraction ofVa[ve & Short Transfer line for 3rd Transfer Efficiency ofPFOS in air E02-0969·43376 9/2012002 TE3-EX·PFOS-V-2 5.6.3 2nd Extraction of Valve & Short Transfer line for 3rd Transfer Efficiency ofPFOS in air E02-096843360 912012002 PFOS-HE-T£3-1 5.6.3 1st PUF for PFOS in He 3«1 Transfer Efficiency £02-0968-43361 912012002 PFOS-HE-TE3-2 5.6.3 2nd PUF for PFOS in He 3Td Transfer Efficiency E02·0968·43362 9/2012002 TE3-EX-PFOS-R-3 5.6.3 1st Extraction of Reactor and Transfer line for 3rd Transfer Efficiency ofPFOS in He E02-0968-43363 912012002 TE3·EX·PFOS-R4 5.6.3 2nd Extraction of Reactor and Transfer line for 3rd Transfer Efficiency ofPFOS in He E02-0968-43364 9120/2002 TE3-EX-PFOS-V-3 5.6.3 1st Extraction of Valve & Short Transfer line for 3rd Transfer Efficiency ofPFOS in He E02·096843365 912012002 TE3-EX-PFOS-V-4 5.6.3 2nd Extraction of Valve & Short Transfer line for 3rd Transfer Efficiency ofPFOS in He E02-0968-43366 9/20/2002 TE3·EX-BlK·2 5,6.3 2nd Blank extraction for 3ed Trllflsfer Efficiency E02-0968-43367 912012002 WT-BT·TE3-PFOS Wipe Test Bench top PFOS 3rd Transfer Efficiency E02-0968·43368 912012002 WT -DT -TE3-PFOS Wipe Test Desktop PFOS 3rd Trllflsfer Efficiency E02-0968-43369 912012002 WT-BlK·TE3-PFOS Wipe Test Blank PFOS 3rd Transfer Efficiency £02-0968-43370 9/20/2002 PFOS·BLK·TE3 5.6.3 PUF Blank for PFOS in air 3ed Transfer Efficiency
• corresponds to section number in final report,
Copyright © 2022 FDOKUMEN