Photosynthetic characteristics and C:N ratios of macroalgae from King George Island (Antarctica)
Upload
independentCategory
view
3download
0
PRIMARY RESEARCH PAPER
Seasonal changes in the abundance and distributionof submerged aquatic vegetation in a highly managedcoastal lagoon
D. Lirman Æ G. Deangelo Æ J. Serafy Æ A. Hazra Æ D. Smith Hazra ÆJ. Herlan Æ J. Luo Æ S. Bellmund Æ J. Wang Æ R. Clausing
Received: 31 January 2007 / Revised: 29 May 2007 / Accepted: 13 June 2007 / Published online: 17 July 2007
� Springer Science+Business Media B.V. 2007
Abstract The inflow of fresh water into coastal
lagoons is a key factor influencing the structure and
function of these ecosystems. Biscayne Bay, a coastal
lagoon adjacent to the city of Miami, is located
downstream of the Everglades ecosystem where the
extensive water management system now in place has
modified the historical hydrology, replacing ground-
water and overland flows with pulsed releases from
canals. In areas where canals discharge directly into
littoral habitats, an environment with low-mean
salinity and high-salinity variability is created. In this
study, we characterize the salinity patterns of near-
shore habitats (<500 m from shore) and document
patterns of seasonal abundance and distribution of
submerged aquatic vegetation (SAV) to evaluate the
impacts of water management practices. Seagrasses
were the principal component of the SAV community
during the 2005 dry season (mean cover = 25.5%),
while macroalgae dominated during the wet season
(mean cover = 33.4%). The distribution and abun-
dance of SAV were directly related to the tolerance of
each taxon to salinity patterns. Seagrass species with
high tolerance to low and variable salinity such as
Halodule wrightii and Ruppia maritima were found
only in canal-influenced areas and increased in
abundance and spatial distribution in the wet season
when freshwater inflow is highest. The dominance of
rhizophytic macroalgae during the wet season was
determined by the appearance and high abundance of
Chara, a taxon commonly associated with freshwater
environments. Thalassia testudinum, the most abun-
dant seagrass species, was found throughout the study
region, but decreased in abundance in the canal-
influenced areas during the wet season when lower,
more variable salinity resulted in lowered productiv-
ity. The data presented here showed a significant
relationship between salinity patterns and the seasonal
abundance and distribution of SAV. These findings
support the use of SAV as appropriate indicators of
changes in water quality resulting from future resto-
ration projects associated with the Everglades Resto-
ration Plan, which will once again modify the delivery
of fresh water into littoral habitats with unknown
ecological consequences.
Handling editor: S. M. Thomaz
D. Lirman (&) � A. Hazra � J. Herlan �J. Luo � J. Wang � R. Clausing
Rosenstiel School of Marine and Atmospheric Science,
University of Miami, 4600 Rickenbacker Cswy, Miami,
FL 33149, USA
e-mail: [email protected]
G. Deangelo
NOAA/National Geodetic Survey, 1315 East-West Hwy,
Silver Spring, MD 20910, USA
J. Serafy � D. Smith Hazra
NOAA/National Marine Fisheries Service, 75 Virginia
Beach Drive, Miami, FL 33149, USA
S. Bellmund
Biscayne National Park, 9700 Southwest 328th Street,
Homestead, FL 33033, USA
123
Hydrobiologia (2008) 596:105–120
DOI 10.1007/s10750-007-9061-x

Keywords SAV � Salinity patterns � Water
management � Freshwater canals � Seagrass �Macroalgae
Introduction
Coastal lagoons and estuaries play a pivotal role as
centers of high productivity, nursery habitats for fishes
and invertebrates, foci of human recreational activi-
ties, and nutrient and sediment sinks. However, the
proximity of these important ecosystems to large
urban developments has influenced their dramatic
decline in condition in recent history. Submerged
aquatic vegetation (SAV) communities are keystone
components of coastal lagoons and estuaries, and
significant patterns of decline and shifts in community
structure have been documented for these communi-
ties worldwide. In a recent study, Lotze et al. (2006)
documented declines of 65% of seagrasses and 48% of
other SAV taxa in 12 coastal systems in the past 150–
300 years. Among the main causes of the decline in
SAV are chemical pollution, eutrophication, physical
impacts, and modifications to the trophic structure
(Duarte, 2002; Orth et al., 2006; Short et al., 2006).
Worldwide, significant management efforts are under-
way to restore the extent and quality of estuarine
systems and to recover productivity and habitat value
of these important ecosystems. To guide the success-
ful management of estuarine systems located down-
stream of large population centers, a better
understanding of the influence of human activities
on water quality as well as the relationship between
physical and biological factors and the structure and
function of SAV communities is needed. In this study,
we evaluate the patterns of distribution and seasonal
abundance of SAV within the littoral habitats of
Biscayne Bay, a shallow (<4 m), subtropical coastal
lagoon adjacent to the city of Miami, to test the
hypothesis that the seasonal and spatial dynamics of
nearshore benthic communities are significantly influ-
enced by patterns of freshwater releases from man-
made structures in this managed system.
The coastal lagoons of South Florida are an
integral part of a linked regional hydroscape that
includes upland habitats, the Florida Everglades,
Biscayne Bay, Florida Bay, and the Florida Reef
Tract (Davis & Ogden, 1994). The hydrology of the
South Florida ecosystem is presently managed by an
extensive water management system that controls
water flows among the different system compart-
ments and the release of fresh water into coastal
habitats mainly through canals (Browder & Ogden,
1999). Canal drainage and associated point-source
releases of fresh water into nearshore habitats have
altered historical sheet and groundwater flows and
have created nearshore environments that now expe-
rience rapid fluctuations in salinity, nutrients, and
contaminants (Sklar et al., 2002).
Biscayne Bay supports extensive recreational and
commercial fishing activities and provides essential
habitat for numerous fish and invertebrate species
(Ault et al., 1999a, b; Serafy et al., 2003). Benthic
habitats of central and southern Biscayne Bay are
dominated by seagrass and hardbottom communities.
Seagrass communities are composed of four seagrass
species (i.e., Thalassia testudinum, Syringodium
filiforme, Halodule wrigthii, Ruppia maritima)
(Lirman & Cropper, 2003), while hardbottom com-
munities are composed of hard and soft corals and
sponges (Cropper et al., 2001; Lirman et al., 2003).
Moreover, both of these community types have
highly productive macroalgal components that pro-
vide essential habitat for associated fish and inverte-
brates (Zieman, 1982; Irlandi et al., 2004).
The location of Biscayne Bay, downstream of the
Florida Everglades and the coastal canal system, has
made this lagoon susceptible to water management
decisions that are based mainly on urban and
agricultural water needs and flood control, with
limited consideration for the potential impacts on
nearshore natural resources. In the recent past, the
modification of the historical sheet flow patterns of
drainage into coastal habitats has resulted in adverse
impacts to seagrass communities (Robblee et al.,
1991; Zieman et al., 1999), sponges (Butler et al.,
1995), and pink shrimp catches (Browder et al., 1999)
in nearby Florida Bay. Such adverse impacts have not
been documented yet for Biscayne Bay, but consid-
ering the potential future impacts of the recently
approved Comprehensive Everglades Restoration
Plan (CERP), which will once again modify the
regional hydrology (Davis & Ogden, 1994; Steinman
et al., 2002), it is important to understand present-day
linkages between species abundance and distribution
patterns and freshwater drainage patterns so that the
future impacts of the restoration activities on the
existing biota may be fully ascertained.
106 Hydrobiologia (2008) 596:105–120
123

Abundance and distribution of seagrasses and
macroalgae are known to be influenced by multiple
biotic and abiotic factors that can vary significantly
seasonally and spatially. Light, temperature, and
nutrient availability are usually recognized as key
abiotic factors, whereas herbivory, and intra- as well
as interspecific competition are recognized as key
biotic factors influencing marine plant productivity
(Larkum et al., 2006 and references therein). In
addition to these factors, human activities can
introduce both physical (e.g., dredging, boating
impacts) and chemical (e.g., heavy metals, oil, and
fuel) sources of disturbance that can influence
productivity and species distribution patterns (Ralph
et al., 2006). The focus of this study, however, is on
the relationship between salinity patterns and the
seasonal dynamics of submerged aquatic vegetation
(SAV) in the nearshore habitats of a coastal lagoon
presently influenced by water management practices
and the release of fresh water from canals. Our
approach was to focus on the littoral habitats most
susceptible to water management practices by imple-
menting a stratified random field sampling design,
which captured seasonal and spatial variation in SAV
species composition, distribution, and abundance, and
relate these patterns to simulated and observed
salinity patterns.
Materials and methods
Field surveys
In 2005, surveys of the nearshore habitats (<500 m
from shore) of western Biscayne Bay were conducted
using the Shallow Water Positioning System
(SWaPS), a video-based benthic survey technology
developed by scientists from NOAA’s National
Geodetic Survey (Lirman et al., in press) to document
seasonal species composition, distribution, and
abundance of submerged aquatic vegetation. This
methodology has been shown to be a rapid and cost-
effective way to survey shallow habitats that, due to
shallow depths (<30 cm–1 m), limit the access of
larger vessels and the deployment of divers. In
addition, a calibration exercise conducted to compare
the data obtained by divers and the SWaPS method
revealed no significant differences in estimates of
percent cover of SAV collected at the same sites
using these two methods (Lirman et al., in press).
Surveys were limited to the area <500 m from shore
because this is area most likely to be directly affected
by the proposed Everglades Restoration projects on
the watershed and where the influence of freshwater
inflow from canals is highest (RECOVER, 2004).
The SWaPS method uses a Global Positioning
System (GPS) receiver attached to a camera installed
in a shallow-draft boat (14-ft Carolina skiff). To
improve taxonomic classification, images of the
bottom were obtained using a high-resolution digital
SLR camera (7.0 megapixels). The GPS receiver was
centered over the camera that was suspended over a
glass enclosure that provided a down-looking view of
the bottom. Each image recorded was stamped with
time, date, depth, and position information and the
images were analyzed to determine percent cover and
spatial distribution of SAV.
Surveys to document benthic community patterns
along latitudinal and inshore–offshore gradients were
conducted using a stratified random sampling design
based on the US EPA’s EMAP sampling protocol
(Jackson et al., 2000). The sampling methodology
consisted of the following steps: (1) a shoreline map
of the study region was extracted from 3-m Digital
Ortho-Quarter Quad photography (Fig. 1); (2) a
shoreline vector was delineated, and five 100-m
buffers were created; (3) buffers were divided into
cells of equal size using the fishnet function in Xtools
(ArcGIS extension); and (4) one survey point was
generated within each subdivision of the buffer at a
random location using Hawth’s Tools (ArcGIS
extension). Survey sites were selected using this
method (80 sites within the buffer at <100 m from
shore and 40 sites in each of the remaining buffers,
n = 240 sites), and the same sites were surveyed
during the dry season (March–April) and the wet
season (July–August) to provide a seasonal compar-
ison. The GPS coordinates for each site were
exported to a portable GPS unit for navigation in
the field.
For each survey location (i.e., a transect <25 m
along the survey track), 10 non-overlapping geo-
referenced images were analyzed. This approach was
chosen to be consistent with the methods used by
existing SAV monitoring programs in the region
where multiple sites are sampled visually using
0.25 m2-quadrats (Durako et al., 2002; Fourqurean
et al., 2002). For each image (i.e., the sample unit for
Hydrobiologia (2008) 596:105–120 107
123

that site), community type, species list, and abun-
dance (percent cover) were recorded from a computer
monitor. Percent cover was determined as the fraction
of each frame occupied by each taxon. Seagrasses
were identified to species while macroalgae were
identified to species or functional form (Collado-
Vides et al., 2005). Two main macroalgal functional
groups, attached (rhizophytic) and unattached (drift)
macroalgae, were identified in this study (Biber &
Irlandi, 2006). The benthic coverage data obtained
for each frame were averaged for each site and used
to develop percent cover surface contours using the
ArcView Spatial Analyst software and applying the
Inverse Distance Weighted interpolation procedure.
Differences in percent cover were calculated as [(%
cover wet season � % cover dry season)/% cover dry
season] and these values were used to develop change
contour plots. The mean cover of each taxon was
compared between seasons using t-tests and among
buffers and between seasons using a 2-way ANOVA
with season and buffer as main factors. Coverage data
were arcsin-transformed to conform to the normality
assumption of the statistical tests employed (Sokal &
Rohlf, 1995).
Water quality patterns
The salinity patterns of nearshore habitats of Bis-
cayne Bay are influenced spatially and seasonally by
the release of fresh water from canals, with smaller
contributions from precipitation, groundwater, and
overland flows. Previous research has indicated that
the areas in the vicinity of canals are characterized by
low-mean salinity and high-salinity variability, while
areas removed from these sources of fresh water,
located in the northern section of the study area
Fig. 1 (A) Map of the
study area and the location
of the study sites (n = 240
sites surveyed each season).
(B) Photograph of the Black
Point area showing the
survey buffers. Sites (stars)
were located randomly
within each sub-section of
the five buffers
108 Hydrobiologia (2008) 596:105–120
123

directly adjacent to The Safety Valve, are influenced
by the influx of oceanic waters and are characterized
by higher-mean salinity and less-variable salinity
patterns (Wang et al., 2003).
Water quality data collected by Biscayne National
Park and the SERC-FIU Water Quality Monitoring
Network (Caccia & Boyer, 2005) provide broad-scale
information on water quality parameters in Biscayne
Bay, but have limited coverage in the nearshore
habitats where benthic surveys were conducted. In
this study, the Biscayne Bay salinity and hydrody-
namic model (Wang et al., 2003) was used to provide
a high-resolution temporal and spatial characteriza-
tion of the salinity patterns at nearshore environments
of western Biscayne Bay at a scale commensurate
with the benthic surveys. The two-dimensional
hydrodynamic and salinity transport numerical model
is based on a triangular finite element grid with 6,364
elements and 3,407 nodes, with an average grid point
spacing of 500 m. The model was run using wind data
and freshwater inputs for a four-year period (1995–
1998) to obtain hourly salinity values for each one of
the benthic survey points. Hourly data were simulated
for each site (n = 240 sites) for 1995–1998 and
averaged by day, month, and season. The monthly
mean salinity and salinity variability (S.D.) for each
simulation site were used in a hierarchical cluster
analysis using Ward’s minimum variance method to
determine the spatial distribution of sites with similar
salinity patterns (Fig. 2). Finally, the salinity simu-
lated for each point was related to the presence-
absence of seagrasses and macroalgae using logistic
regression to assess the probability of occurrence of
each taxon in relationship to salinity values.
In addition to the data simulated by the hydrody-
namic model, salinity and temperature data were
collected in the field during 2005 at eight locations
where water quality probes (YSI Environmental
6,600 Series) were deployed by Biscayne National
Park. Data from eight probes (two from within each
salinity cluster) were measured at 15-min intervals
and averaged by day and season. The data collected
in the field was compared to the data simulated by the
model at the locations closest to the field probes. The
mean monthly salinity calculated for each probe
(n = 8) was correlated to the monthly salinity values
obtained for the salinity model nodes at the same
locations to evaluate the performance of the model in
predicting salinity patterns of nearshore habitats.
Results
Salinity patterns obtained using the Biscayne Bay
salinity model showed clear spatial and seasonal
patterns in mean salinity and salinity variability. A
#######
####
######
##
###
###
####
###
###
########
##########
###
########
###
####
########## ##
####### #
lC 1retsu
lC 3retsu
lC 2retsu
lC 4retsu
ACSIB ENYYAB
uT kr ey Pt.
calB k .tP
maiM i
TA TNAL ICECO AN
ihC cke Kn ey
N
###########################################################################################
Fig. 2 Classification of
sites based on salinity
patterns obtained from the
Biscayne Bay salinity
model. The data for each
site (e.g., mean monthly
salinity and standard
deviation) simulated for
1995–1998 were used in a
hierarchical cluster analysis
to determine site groupings.
The dendrogram (left panel)
and the site map (right
panel) share the same color
scheme to represent the
spatial distribution of sites
with similar salinity
patterns
Hydrobiologia (2008) 596:105–120 109
123

negative correlation (r = �0.95) was found between
mean salinity and the standard deviation of salinity,
highlighting the fluctuating nature of freshwater
inflow through canals and groundwater sources. The
cluster analysis arranged the SAV sites into four main
clusters (Fig. 2). Cluster 4, comprising the sites most
heavily influenced by canal outflow, is characterized
by low mean salinity and high salinity variability,
especially in the wet season (Table 1). The northern
section of the study area (north of Black Point) has
higher mean salinity and lower salinity variability in
both the dry and wet season compared to the area to
the south where canal discharge is highest. Mean
salinity values for the dry season were >30 psu in the
northern region (clusters 1 and 2), while mean
salinity was 27–30 psu in the southern region of the
study area (clusters 3 and 4). During the wet season,
mean salinity values were >23 psu in the northern
region, while mean salinity was 17–23 psu in the
southern region (Table 1).
The data obtained from field probes in 2005
showed patterns similar to those obtained using the
salinity model. Salinity values (mean and median)
were higher and salinity variability lower in the
northern section, while lower-mean salinity and
higher-salinity variability were measured in cluster
4 where canal influences prevail (Table 2). Moreover,
salinity decreased in all clusters from the dry season
to the wet season, but the decrease was more
pronounced in the southern section of the study area.
In contrast, temperature patterns showed clear
seasonal patterns but no spatial patterns. Mean
temperature increased by up to 8�C between seasons
but temperature patterns were consistent among the
four salinity clusters (Table 2). Lastly, salinity
showed a general decrease with distance to shore in
all clusters in both seasons, with the exception of
cluster 4 in the dry season where mean salinity
showed a slight increase (1 psu) with increasing
distance to shore (Table 2). When the mean monthly
Table 1 Seasonal salinity patterns in Western Biscayne Bay
Salinity clusters 1 2 3 4
Season Dry Wet Dry Wet Dry Wet Dry Wet
Mean Sal (psu) 33.4 (2.2) 29.4 (3.1) 32.4 (3.6) 26.6 (4.6) 30.0 (5.3) 22.9 (6.5) 27.0 (7.5) 17.1 (8.2)
Min–Max Sal (psu) 26–37 20–36 23–37 13–36 14–37 6–37 10–38 2–33
Median Sal (psu) 34.0 29.6 33.6 26.7 31.4 22.1 28.8 16.3
The data were obtained from Biscayne Bat’s hydrodynamic model for 1995–1998. Daily salinity values were averaged for all sites
within each cluster (see Fig. 2 for the location of the salinity clusters)
Table 2 Salinity (psu) and temperature (�C) patterns from nearshore habitats of Western Biscayne Bay documented for the dry and
wet seasons of 2005
Sal
cluster
Dist. to
shore
(m)
Mean temp (S.D) Min–max temp Median
temp
Mean salinity (S.D) Min–max sal Median
sal
Dry Wet Dry Wet Dry Wet Dry Wet Dry Wet Dry Wet
1 680 22.8 (2.5) 30.5 (1.5) 18.1–27.8 26.8–32.7 23.3 30.9 34.5 (0.7) 29.8 (2.3) 33.1–35.6 19.6–32.3 34.6 30.0
1 2000 22.7 (2.3) 30.3 (1.5) 18.4–27.2 27.1–32.3 23.2 30.6 36.6 (1.0) 33 (2.6) 34.5–39.1 25.7–38.4 36.7 33.1
2 110 22.8 (2.5) 30.4 (1.5) 17.0–27.8 26.9–32.8 23.3 30.9 32.3 (2.1) 18.2 (8.5) 25.0–36.0 0.3–35.5 32.6 20.1
2 360 23.7 (2.6) 31.4 (2.1) 17.8–28.7 26.6–35.7 24.2 32.1 33.1 (1.9) 21.2 (7.1) 27.9–37.8 1.1–34.5 33.4 23.3
3 140 22.9 (2.5) 30.4 (1.6) 17.3–27.7 26.5–32.7 23.3 30.8 32.8 (3) 16.3 (6.3) 27.1–38.7 1.9–32.2 33.1 17.6
3 340 23.0 (2.7) 30.7 (1.8) 15.5–28.4 25.9–33.5 23.5 31.2 32.9 (2.8) 17.4 (6.2) 27.3–38.4 2.4–33.1 33.1 18.3
4 52 22.7 (2.7) 30.8 (1.3) 19.0–27.6 27.4–32.5 23.1 31.2 29.7 (2.9) 12.9 (6.6) 24.9–35.2 2.5–33.1 28.5 12.8
4 296 23.3 (2.6) 31 (1.9) 16.1–28.2 25.6–33.9 23.6 31.4 28.7 (4.0) 13.3 (6.7) 21.8–34.8 2.1–33.3 27.7 12.7
Data were collected at 15-min intervals with water quality probes (YSI Environmental 6600 Series) deployed by Biscayne National
Park. The data were averaged by day and season. The data presented are from representative probes deployed at increasing distance
from shore within the salinity clusters determined using Biscayne Bay’s hydrodynamic model in this study (Fig. 2)
110 Hydrobiologia (2008) 596:105–120
123

salinity values from each salinity probe (n = 8, 2 sites
within each salinity cluster) were compared to values
simulated by the hydrodynamic model for the same
locations, a significant correlation was obtained at
each location between the two data sources (P < 0.01,
r = 0.90–0.98), indicating that the output from the
salinity model can be adequately used to simulate
salinity patterns within nearshore habitats of western
Biscayne Bay.
Submerged aquatic vegetation dominates the near-
shore benthic communities of central and southern
Biscayne Bay. The mean cover of SAV in 2005 (all
taxa combined) was 41.3% (S.D. = ±34.8) in the dry
season and 66.1% (35.2) in the wet season. Only 17%
of sites in the dry season and 15% of sites in the wet
season were completely devoid of SAV. These sites
were found mainly in the northern section of the
study region (north of Shoal Point) in areas where
dredging activities have taken place and depth is
>2 m. Seagrasses were the principal component of
the SAV community during the dry season, while
macroalgae dominated during the wet season
(Table 3). Thalassia testudinum, the most abundant
seagrass species, was found at 68% of sites in the dry
season and 63% of sites in the wet season. The
highest abundance levels of T. testudinum were found
north of the Cutler Canal in the Chicken Key area and
north of Black Point, while the lowest abundance of
this species was recorded in the northernmost section
of the study area and south of Black Point, and
directly opposite Military canal (wet season) and
Mowry canal (dry season) (Figs. 3, 4). The overall
abundance and distribution of T. testudinum remained
consistent between seasons (Table 3), with general
increases in percent cover north of the Cutler Canal
and comparable decreases in the southern region of
the study area (Fig. 5).
In contrast to the wide distribution of Thalassia,
H. wrightii, S. filiforme, and R. maritima had lower
abundance and more patchy spatial distribution
(Table 3, Fig. 3). Halodule wrightii had high-
abundance foci in the areas in the immediate vicinity
of canals throughout the study domain (Figs. 3, 4),
S. filiforme was restricted to the northern section of
the survey area (Fig. 3), and R. maritima was
restricted to the southern region in areas directly
influenced by freshwater inflows from canals (Fig. 3).
Both H. wrigthii and S. filiforme experienced signif-
icant increases in percent cover in the wet season and
an expansion in the number of sites where these
species were observed (Table 3). Ruppia maritima
did not show a significant change in cover between
seasons (Table 3). The spatial patterns of change in
percent cover of H. wrightii were the opposite of
those of T. testudinum: the mean cover of H. wrightii
generally increased in the area south of the Cutler
Canal and decreased in the area north of this canal
(Fig. 5).
Attached macroalgae (Halimeda spp., Caulerpa
spp., Penicillus spp., Batophora spp., Acetabularia
sp.) and drift (Laurencia spp., Chondria spp., Dict-
yota spp) were found throughout the study region
(Table 3) and showed the largest seasonal changes in
percent cover of any taxa (Fig. 5). The cover of drift
macroalgae decreased significantly (from 12.5 to
4.4%), and attached macroalgae had a six-fold
Table 3 Percent cover (S.D.) and percentage of sites where SAV was found in Western Biscayne Bay in the 2005 Dry (March–
April) and Wet (July–August) seasons
% Sites dry season % Sites wet season % Cover dry season % Cover wet season P values
T. testudinum 68 63 19.9 (28.0) 19.2 (28.3) ns
H. wrightii 38 50 1.4 (8.3) 4.0 (13.2) <0.01
S. filiforme 15 21 4.2 (9.8) 5.2 (12.2) <0.05
R. maritime 4 5 0.03 (0.2) 0.01 (0.1) ns
Attached algae 64 66 4.0 (10.4) 29.0 (33.4) <0.01
Drift algae 69 43 12.5 (18.7) 4.4 (10.4) <0.01
Seagrass 78 80 25.5 (30.1) 28.4 (30.8) ns
Macroalgae 77 74 16.5 (20.8) 33.4 (35.5) <0.01
The mean cover of each taxon was compared between the dry and wet seasons using a t-test. ns = no significant differences between
seasons. n = 240 sites each season
Hydrobiologia (2008) 596:105–120 111
123
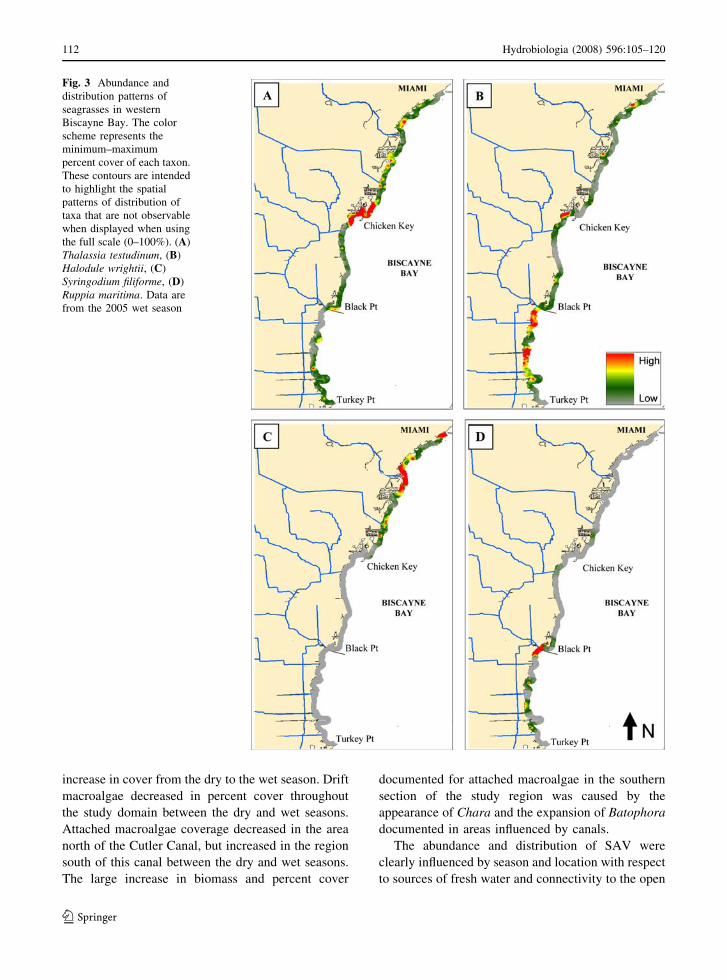
increase in cover from the dry to the wet season. Drift
macroalgae decreased in percent cover throughout
the study domain between the dry and wet seasons.
Attached macroalgae coverage decreased in the area
north of the Cutler Canal, but increased in the region
south of this canal between the dry and wet seasons.
The large increase in biomass and percent cover
documented for attached macroalgae in the southern
section of the study region was caused by the
appearance of Chara and the expansion of Batophora
documented in areas influenced by canals.
The abundance and distribution of SAV were
clearly influenced by season and location with respect
to sources of fresh water and connectivity to the open
Fig. 3 Abundance and
distribution patterns of
seagrasses in western
Biscayne Bay. The color
scheme represents the
minimum–maximum
percent cover of each taxon.
These contours are intended
to highlight the spatial
patterns of distribution of
taxa that are not observable
when displayed when using
the full scale (0–100%). (A)
Thalassia testudinum, (B)
Halodule wrightii, (C)
Syringodium filiforme, (D)
Ruppia maritima. Data are
from the 2005 wet season
112 Hydrobiologia (2008) 596:105–120
123

ocean. The abundance of each of the taxa encoun-
tered was significantly influenced by salinity patterns
within the four distinct salinity clusters recognized
(P < 0.05, 2-way ANOVA, Table 4). Significant
changes in abundance with respect to season were
only observed for drift macroalgae (lower cover in
the wet season) and S. filiforme and attached macro-
algae (higher cover in the wet season for both taxa)
(P < 0.05, 2-way ANOVA, Table 4) (Fig .6).
At a smaller spatial scale, SAV communities
showed significant patterns in percent cover with
respect to distance to shore, especially in areas
influenced by canals (Table 5). The cover of
T. testudinum increased significantly with increasing
distance from shore, while S. filiforme reached its
highest value at the 300-m buffer. Decreases in the
mean cover of H. wrightii and R. maritima were
observed with increasing distance from shore, but
the low and variable cover of these species reduced
the power to detect statistically different patterns
(power < 0.3). The abundance of attached and drift
macroalgae were significantly influenced by both
season and distance to shore (Table 5). Peaks in
percent cover of attached macroalgae were recorded
close to shore (100-m buffer) in the wet season due to
the high abundance of Chara and Batophora.
In light of the significant spatial patterns of
association documented between salinity and the
Fig. 4 Abundance of
seagrasses in western
Biscayne Bay in the area
with the greatest inflow of
fresh water through water
management canals. The
color scheme represents the
minimum–maximum
percent cover of each taxon.
(A) Thalassia testudinum(dry season), (B)
T. testudinum (wet season),
(C) Halodule wrightii (dry
season), (D) H. wrightii(wet season)
Hydrobiologia (2008) 596:105–120 113
123

abundance of SAV, the probability of occurrence of
each taxon in relationship to salinity was tested using
logistic regression where taxa were coded within sites
as either present or absent. The response curves
(logistic regression, P < 0.05 for all 5 taxa tested)
showed general agreement with the observed SAV
distribution patterns. Taxa like rhizophytic algae,
Halodule, and, to a lesser extent, drift algae, have a
higher probability of occurrence at low mean salinity.
In contrast, taxa like Thalassia and Syringodium have
a higher probability of occurrence at high mean
salinity. The steep salinity tolerance curves displayed
by attached algae and Syringodium contrast with the
broader tolerance to salinity exhibited by Halodule,
drift algae and, to a lesser extent, Thalassia.
Discussion and conclusions
The inflow of fresh water into estuaries and coastal
lagoons has been identified as one of the key factors
influencing the structure and function of these
ecosystems worldwide (Cross & Williams, 1981;
Sklar & Browder, 1998). In Biscayne Bay, water
quality and more specifically salinity fields are
significantly influenced by the drainage of fresh
water from the Florida Everglades through water
management canals. In areas where canals discharge
directly into littoral habitats, an environment with
low mean salinity and high salinity variability is
created. This environment is where those seagrass
species commonly associated with low and variable
salinity like H. wrightii (McMahan, 1968; Montague
& Ley, 1993) and R. maritima (Lazar & Dawes,
1991; Bird et al., 1993) reach their highest abun-
dance. In contrast, the northern area of the study
region, where higher mean salinity and lower salinity
variability prevail, is where S. filiforme, a species
commonly associated with deeper, oceanic conditions
(Fourqurean et al., 2002) reaches its maximum
abundance. T. testudinum, a seagrass species with a
wide salinity tolerance and maximum growth at
salinity between 25 and 40 psu (Zieman et al., 1989;
Lirman & Cropper, 2003) is the dominant component
of the seagrass community throughout the study area.
The relationships documented in this study between
the probability of occurrence of Thalassia, Halodule,
and Syringodium and salinity agree well with the
reported tolerance of these species to salinity (Fong
& Harwell, 1994; Lirman & Cropper, 2003) and
highlight the influence of this abiotic factor on the
abundance and distribution of SAV within the near-
shore habitats of Biscayne Bay. The influence of
human activities and freshwater inflow on the relative
Fig. 5 Seasonal change in the abundance and distribution of
SAV in western Biscayne Bay. The amount of change in
percent cover for each site was obtained for each taxon by
calculating the percent change with respect to the Dry Season
value (% change = (% cover wet season � % cover dry
season)/(% cover dry season). (A) Thalassia testudinum, (B)
Halodule wrightii, (C) Rhizophytic Macroalgae, (D) Drift
Macroalgae
114 Hydrobiologia (2008) 596:105–120
123

abundance of different macrophyte communities was
simulated for South African estuaries (Wortmann
et al., 1997). In this case, it was shown that a
reduction in riverine flow caused by freshwater
impoundment can result in higher mean salinities
and the population expansion of the seagrass Zostera
capensins, a species that thrives in salinity around
30 psu and can displace more brackish communities
under increased salinity scenarios. The opposite
pattern (i.e., the removal of Zostera) was observed
in a Mediterranean lagoon due to an increase in
freshwater flow from a hydroelectric plant (Bernard
et al., 2005). Salinity was also found to be one of the
main factors influencing the distribution, productiv-
ity, and competitive interactions between native and
invasive macrophytes in King’s Bay, a spring-fed
system in Florida’s Gulf Coast (Frazer et al., 2006).
In this system, increases in salinity due to drought
conditions and storms that enhance saltwater
intrusion can provide the salinity-tolerant native
macrophyte Vallisneria americana, a competitive
advantage over the less tolerant invasive species
Myriophyllum spicatum and Hydrilla verticillata.
Macroalgae, an important component of the ben-
thic community of Biscayne Bay, also showed spatial
and seasonal patterns influenced by salinity. Exper-
imental studies showed that drift macroalgae have a
higher tolerance for lower salinity and faster growth
rates in the fall and winter seasons when temperatures
are lower. In contrast, rhizophytic macroalgae have a
limited tolerance for low salinity (<20 psu) and faster
growth rates in the summer when water temperatures
are higher (Biber & Irlandi, 2006). In this study, the
spatial and seasonal distribution and abundance of
drift macroalgae in western Biscayne Bay agreed
with the growth data of Biber and Irlandi (2006).
Drift macroalgae were more abundant in the cooler
dry season and had a higher abundance in the canal-
influenced southern region of Biscayne Bay. Seasonal
peaks in high abundance of drift macroalgae during
cooler periods have also been observed in other
estuaries (Benz et al., 1979). In contrast, no clear
seasonal patterns in the abundance of drift macroal-
gae were detected by Riegl et al. (2005) in subtrop-
ical Indian River Lagoon, Florida, and by Kopecky
and Dunton (2006) in two Texas estuaries.
The increase in cover of rhizophytic algae in the
warmer wet season is consistent with previous reports
of maximal growth in the summer for calcareousTa
ble
4M
ean
per
cen
tco
ver
(S.D
.)o
fS
AV
inW
este
rnB
isca
yn
eB
ayin
20
05
Sal
init
ycl
ust
ers
12
34
2-W
ayA
NO
VA
Sea
son
Dry
Wet
Dry
Wet
Dry
Wet
Dry
Wet
Clu
ster
Sea
son
Inte
ract
ion
T.
test
ud
inu
m1
6.9
(24
.2)
21
.4(2
6.3
)2
5.7
(31
.9)
34
.6(3
7.6
)3
1.7
(25
.0)
17
.5(1
4.1
)1
8.1
(30
.9)
10
.3(1
9.7
)<
0.0
5n
s<
0.0
5
H.
wri
gh
tii
5.6
(10
.3)
5.0
(10
.8)
6.2
(13
.5)
4.1
(12
.0)
2.1
(4.4
)4
.6(9
.3)
6.0
(10
.2)
11
.9(1
7.1
)<
0.0
5n
s<
0.0
5
S.
fili
form
e8
.1(1
9.7
)2
5.5
(28
.6)
0.4
(2.5
)3
.4(9
.4)
0.2
(0.5
)0
.1(0
.4)
0.1
(0.1
)0
.4(1
.8)
<0
.05
<0
.05
<0
.05
R.
ma
riti
me
––
0.0
3(0
.2)
0.0
1(0
.02
)0
.08
(0.4
)0
.04
(0.2
)0
.01
(0.0
2)
0.0
1(0
.05
)<
0.0
5n
sn
s
Att
ach
edal
gae
0.5
(1.2
)0
.8(2
.3)
6.4
(15
.9)
24
.0(3
4.0
)4
.8(7
.9)
55
.2(2
4.1
)5
.6(9
.8)
49
.6(2
9.6
)<
0.0
5<
0.0
5<
0.0
5
Dri
ftal
gae
10
.0(1
7.8
)1
.7(3
.9)
8.1
(13
.9)
1.4
(3.7
)2
5.1
(22
.1)
14
.3(1
6.3
)1
7.8
(19
.9)
4.5
(10
.9)
<0
.05
<0
.05
ns
SA
Vsu
rvey
site
sw
ere
gro
up
edb
ased
on
the
clu
ster
sd
eter
min
edfr
om
the
sali
nit
yp
atte
rns
(Fig
.2
).T
he
mea
nco
ver
of
each
tax
on
was
com
par
edam
on
gsa
lin
ity
clu
ster
san
d
bet
wee
nth
ed
ryan
dw
etse
aso
ns
usi
ng
a2
-way
An
aly
sis
of
Var
ian
cew
ith
clu
ster
and
seas
on
asm
ain
fact
ors
.n
s=
no
sig
nifi
can
td
iffe
ren
ces
Hydrobiologia (2008) 596:105–120 115
123

green macroalgae including Halimeda, Penicillus,
and Udotea (Bach, 1979; Collado-Vides et al., 2005;
Biber & Irlandi, 2006). However, the significant
increase in abundance of this functional group in the
canal-influenced region during the wet season when
salinity is lowest is contrary to the predictions of
Biber et al. (2003) and the field observations of
Stockman et al. (1967) and Biber and Irlandi (2006)
who reported a reduced abundance of this stenohaline
functional group in areas with low and variable
salinity. The rhizophytic algae in Biscayne Bay
represent a heterogeneous group composed of species
with distinct susceptibility to salinity patterns. While
the calcareous green genera within this group (i.e.,
Halimeda, Penicillus) have been shown to have
reduced growth and abundance under low salinity
conditions (Biber & Irlandi, 2006), other genera such
as Chara and Batophora are commonly associated
with low and variable salinity (Montague & Ley,
1993). In fact, the large increase in biomass of
rhizophytic algae documented in the wet season in
the canal-influenced region of western Biscayne Bay
was due mainly to the high abundance of Chara and
Batophora. These results agree with Collado-Vides
et al. (2005), who suggested that while the functional-
group approach simplifies the documentation of
large-scale patterns of abundance by grouping similar
species together, it might not be adequate when the
species within a functional group respond differently
to environmental factors.
The significant relationship between salinity pat-
terns and the spatial and seasonal changes in abun-
dance of SAV observed in this study does not
discount the influence of other factors such as
temperature, light, nutrient availability, and grazing
that commonly influence macrophyte abundance and
distribution (Larkum et al., 2006). Indeed, the
influence of multiple physical factors was demon-
strated by Fourqurean et al. (2003) who analyzed
both water quality and seagrass distribution patterns
in Florida Bay and concluded that mean salinity and
salinity variability alone could be used to correctly
classify 16.7% of stations, but the predictive capa-
bilities of their discriminant function increased to
>55% after the inclusion of irradiance, sediment
depth, and nutrient and organic carbon availability in
the model.
Seasonal patterns of SAV growth are influenced by
temperature and, even in the subtropical climate of
South Florida, it was expected that the seasonal
productivity would be higher in the warmer wet
season (Fong & Harwell, 1994; Biber et al., 2003).
The temperature patterns documented during 2005
showed a significant increase in mean seawater
temperature (up 8�C) between seasons that can
account for the increase in biomass for some SAV
taxa in the wet season but, unlike salinity, temper-
atures did not show distinct spatial patterns that could
explain the observed spatial patterns of SAV distri-
bution and abundance. The influence of salinity on
the ecological niche (Rotenberry et al., 2006) that a
species can occupy is especially evident when the
expectation of higher biomass in the wet season is
considered. Namely, increases in abundance and
spatial extent of seagrasses in the warmer wet season
were only observed in the areas where salinity
muidogniryS
tyhpozihR cieaglA
firD eaglAt
eludolaH
aissalahT
.0 52
.0 05
.0 57
.1 00
Prob
abili
ty o
f O
ccur
renc
e (p
)
tT
wH
fS
AR
AD
041 61 81 02 22 42 62 82 03 23
inilaSnaeM t )usp(y
Fig. 6 Probability of
occurrence of SAV taxa in
relation to mean salinity
during the wet season fitted
with logistic regression. The
low abundance of Ruppiaprecluded this species from
being included in this
analysis
116 Hydrobiologia (2008) 596:105–120
123

patterns were within the tolerance range of each
species. Syringodium filiforme increased in abun-
dance and spatial distribution only in the area with
limited influence of canal discharge, while H. wrightii
experienced significant increases in both abundance
and spatial distribution only in the region of canal
influence. In the wet season, as the area of low and
variable salinity expands due to the higher flow of
fresh water, so does the ecological niche that can be
occupied by H. wrightii. Moreover, T. testudinum, the
seagrass species with the widest distribution showed
increases in abundance in the northern region (area
with higher-salinity and lower-salinity variability)
and corresponding decreases in the southern, canal-
influenced region where lower, more variable salinity
resulted in lowered productivity.
Detailed information on other abiotic (e.g., light,
nutrients, pollutants) and biotic (e.g., grazing) factors
known to influence SAV productivity is presently
lacking for nearshore habitats of Biscayne Bay and
the documentation of these additional factors at a
scale commensurable with the benthic monitoring
program is needed to develop better predictive
capabilities in support of future habitat restoration
efforts (Dennison et al., 1993). A limited number of
water quality stations (n = 25) have been surveyed
quarterly since 1994 in Biscayne Bay but none of
these stations are located in nearshore habitats
(<500 m from shore); thus the patterns documented
at these locations are not fully representative of
nearshore environments (Caccia & Boyer, 2005).
Nevertheless, relationships were established between
salinity and nutrient patterns, with higher nutrient
concentrations associated with lower salinity values.
The significant spatial and temporal correlation
between freshwater input and nutrient availability
suggests that nutrients may play a role in determining
the abundance and distribution patterns of SAV
documented in this study. However, experimental
studies need to be performed in the future to
accurately evaluate the relative influence of salinity
and nutrients on SAV communities of nearshore
habitats. The main sources of N and P, the South
Dade agricultural basins, the Black Point Landfill and
Sewage treatment plant, and freshwater canals, are all
located in the southern portion of the study region
(Caccia & Boyer, 2005) and the dominance of early
successional species like H. wrightii, which are able
to thrive and outcompete the competitive dominantTa
ble
5P
erce
nt
cov
er(S
.D.)
of
ben
thic
org
anis
ms
inW
este
rnB
isca
yn
eB
ayin
the
20
05
Dry
(Mar
ch–
Ap
ril)
and
Wet
(Ju
ly–
Au
gu
st)
seas
on
s
Bu
ffer
(m)
10
02
00
30
04
00
50
0P
val
ue
Dep
th(m
)0
.5(0
.3)
0.7
(0.3
)0
.9(0
.3)
1.0
(0.3
)1
.0(0
.3)
Sea
son
Dry
Wet
Dry
Wet
Dry
Wet
Dry
Wet
Dry
Wet
Sea
son
Bu
ffer
Inte
ract
ion
T.
test
ud
inu
m1
4.1
(25
.5)
12
.6(2
5.2
)1
1.8
(17
.1)
19
.9(2
8.3
)2
8.3
(33
.4)
21
.5(2
7.0
)2
3.2
(24
.0)
26
.8(3
1.3
)3
1.3
(36
.2)
27
.0(3
2.1
)n
s<
0.0
5n
s
H.
wri
gh
tii
3.5
(7.9
)7
.5(1
0.2
)4
.1(3
.9)
7.0
(8.2
)5
.7(1
6.2
)2
.5(2
3.7
)6
.7(5
.1)
2.2
(13
.9)
1.9
(0.6
)1
.5(7
.6)
ns
ns
ns
S.
fili
form
e1
.0(8
.3)
2.2
(15
.1)
0.9
(8.6
)2
.1(1
4.9
)4
.6(1
5.9
)1
0.6
(5.1
)0
.9(1
0.6
)6
.2(5
.5)
0.1
(3.8
)2
.8(3
.3)
<0
.05
<0
.05
ns
R.
ma
riti
me
0.0
5(0
.3)
0.0
2(0
.1)
0.0
6(0
.4)
0.0
1(0
.04
)0
00
00
0.0
1(0
.04
)n
sn
sn
s
Att
ach
edal
gae
3.4
(20
.4)
39
.4(7
.7)
3.5
(21
.0)
22
.0(8
.4)
2.5
(16
.2)
24
.4(1
2.4
)7
.4(1
4.4
)2
0.4
(14
.6)
3.6
(18
.1)
23
.7(1
0.5
)<
0.0
5<
0.0
5<
0.0
5
Dri
ftal
gae
11
.5(8
.4)
2.1
(38
.2)
14
.7(8
.9)
3.2
(28
.7)
12
.1(5
.3)
5.6
(30
.5)
9.6
(18
.4)
8.3
(27
.3)
15
.0(7
.9)
7.9
(27
.9)
<0
.05
<0
.05
ns
Su
rvey
site
sw
ere
dis
trib
ute
dam
on
g1
00
-mb
uff
ers
atin
crea
sin
gd
ista
nce
fro
msh
ore
.T
he
mea
nco
ver
of
each
tax
on
was
com
par
edam
on
gb
uff
ers
and
bet
wee
nth
ed
ryan
dw
et
seas
on
su
sin
ga
2-w
ayA
nal
ysi
so
fV
aria
nce
wit
hse
aso
nan
db
uff
eras
mai
nfa
cto
rs.
ns
=n
osi
gn
ifica
nt
dif
fere
nce
s
Hydrobiologia (2008) 596:105–120 117
123

T. testudinum under high-nutrient conditions
(Fourqurean et al., 1995), in the vicinity of canals
highlights the interactive role between salinity and
nutrients. Low canal discharge, better connection to
the open ocean, and lower water residence times
combine to keep nutrient concentrations lower in
northern region of the study area where Syringodium
and Thalassia coexist. Chlorophyll a content and
turbidity exhibited minor seasonal variations but very
limited spatial trends between the north and south
areas of the study region (Caccia & Boyer, 2005)
suggesting that light requirements may play a
secondary role in determining species distribution in
the shallow habitats of nearshore western Biscayne
Bay.
The Comprehensive Everglades Restoration Plan
(CERP), approved by the US Congress in 2000, is the
largest environmental restoration project in the world
and the role of freshwater distribution within the
system plays a central role within this program. One
of the main objectives of this engineering project is to
recapture and redistribute fresh water now ‘‘lost to
tide’’ to restore the natural hydroperiod and increase
flows into coastal habitats. The modification of
freshwater flows into coastal lagoons has been the
focus of restoration efforts not only in the United
States, but in countries such as Mexico (Herrera-
Silveira et al., 2000) and South Africa (Wortmann
et al., 1997) as well. The principal restoration goals
for Biscayne Bay are to: (1) restore quantities and
timing of freshwater flows into littoral habitats;
(2) modify the present drainage system by replacing
point-sources of freshwater inflow to the shoreline
through canals with an upstream spreader system that
would restore a more natural overland flow through
coastal wetlands; and (3) reduce nutrient loads by
allowing the uptake of nutrients by wetland vegeta-
tion prior to discharge (USACE & SFWMD, 1999;
CERP, 2005). While the future impacts of the
proposed activities on SAV and associated organisms
are not known, performance measures that are based
explicitly on the relationship between salinity pat-
terns and the abundance and distribution of seagrass-
es and macroalgae have been proposed. More
specifically, it is expected that the modification of
freshwater deliveries will result in an increase in the
abundance and an expansion in the spatial distribu-
tion of taxa with tolerance for lower salinity like
Chara, Halodule, and Ruppia, and a reduction in the
dominance of Thalassia (RECOVER, 2004). These
predictions were tested for Florida Bay by Fourqu-
rean et al. (2003) who showed, through simulation
modeling, that a decrease in salinity by one-half of
current values and an increase in salinity variability
would indeed expand the range of Halodule and
Ruppia while decreasing the extent of Thalassia.
The data presented here showed a significant
relationship between salinity patterns (i.e., mean
value, variability) and the seasonal abundance and
spatial distribution of SAV in western Biscayne Bay,
which supports the use of SAV as appropriate
indicators of changes in water quality resulting from
restoration projects. Nevertheless, it should be noted
that the patterns reported were obtained for only a
single year and that interannual variability in SAV
abundance and distribution need to be fully docu-
mented to be able to discern the impacts of the
restoration projects and evaluate restoration perfor-
mance. The health of its coastal ecosystems is vital to
the ecology and economy of Florida and it is
important that the habitat value of the littoral
environment be conserved or enhanced in the face
of increasing human pressure. The role of these
habitats as essential nursery habitat for estuarine and
reef organisms is highly dependent on the extent and
condition of the SAV (e.g., Jackson et al., 2001;
Dahlgren et al., 2006), and, therefore, it is recom-
mended that spatially and temporally resolved mon-
itoring should be continued so that early-warning
signals of unexpected or undesirable patterns can be
detected in time and remediation steps implemented.
Acknowledgments This research was funded by NOAA’s
National Geodetic Survey and the US Department of the
Interior’s Critical Ecosystem Studies Initiative (Award
#Q528404CESI). Research activities in Biscayne National
Park were conducted under permit BISC-2002-SCI-0052. We
are grateful for the support and guidance provided by G. Mader
(NOAA NGS), E. Kearns (NPS), L. Collado (FIU), and
J. Browder (NOAA/National Marine Fisheries Service). We
appreciate the helpful comments of two anonymous reviewers.
References
Ault, J., G. A. Diaz, S. G. Smith, J. Luo & J. E. Serafy, 1999a.
An efficient sampling survey design to estimate pink
shrimp population abundance in Biscayne Bay, Florida.
North American Journal of Fisheries Management 19:
696–712.
Ault, J., J. Luo, S. G. Smith, J. E. Serafy, J. D. Wang, R.
Humston & G. A. Diaz, 1999b. A spatial dynamic
118 Hydrobiologia (2008) 596:105–120
123

multistock production model. Canadian Journal of Fish-
eries and Aquatic Science 56: 4–25.
Bach, S., 1979. Standing crop, growth, and production of cal-
careous Siphonales in a South Florida lagoon. Bulletin of
Marine Science 29: 191–201.
Benz, M. C., N. J. Eiseman & E. E. Gallaher, 1979. Seasonal
occurrence and variation in standing crop of a drift algae
community in the Indian River, Florida. Botanica Marina
22: 413–420.
Bernard, G., P. Bonhomme & C. F. Boudouresque, 2005.
Recovery of the seagrass Zostera marina in a disturbed
Mediterranean lagoon (Etang de Berre, Bouches-du-
Rhone, Southern France). Hydrobiologia 539: 157–161.
Biber, P. D. & E. A. Irlandi, 2006. Temporal and spatial
dynamics of macroalgal communities along an anthropo-
genic salinity gradient in Biscayne Bay (Florida, USA).
Aquatic Botany 85: 65–77.
Biber, P. D., M. A. Harwell & W. P. Cropper, Jr., 2003.
Modeling the dynamics of three functional groups of
macroalgae in tropical seagrass habitats. Ecological
Modeling 175: 25–54.
Bird, K. T., B. R. Cody, J. Jewett-Smith & M. E. Kane, 1993.
Salinity effects on Ruppia maritima L. cultured in vitro.
Botanica Marina 36: 23–28.
Browder, J. A. & J. C. Ogden, 1999. The natural South Florida
system II: predrainage ecology. Urban Ecosystems 3:
245–277.
Browder, J. A., V. R. Restrepo, J. K. Rice, M. B. Robblee & Z.
Zein-Eldin, 1999. Environmental influences on potential
recruitment of pink shrimp, Farfantepenaeus duorarum,
from Florida Bay Nursery Grounds. Estuaries 22: 484–499.
Butler IV, M. J., J. H. Hunt, W. F. Herrnkind, M. J. Childress,
R. Bertelsen, W. Sharp, T. Matthews, J. M. Field & H. G.
Marshall, 1995. Cascading disturbances in Florida Bay,
USA: cyanobacteria blooms, sponge mortality, and
implications for juvenile spiny lobsters Panulirus argus.
Marine Ecology Progress Series 129: 119–125.
Caccia, V. G. & J. N. Boyer, 2005. Spatial patterning of water
quality in Biscayne Bay, Florida as a function of land use
and water management. Marine Pollution Bulletin 50:
1416–1429.
CERP, 2005. Central and Southern Florida Project. Compre-
hensive Everglades Restoration Plan. 2005 Report to
Congress. U.S. Department of the Interior and U.S. Army
Corps of Engineers. 114 pp.
Collado-Vides, L., L. M. Rutten & J. W. Fourqurean, 2005.
Spatiotemporal variation of the abundance of calcareous
green macroalgae in the Florida Keys: a study of syn-
chrony within a macroalgal functional-form group. Jour-
nal of Phycology 41: 742–752.
Cropper Jr., W. P., D. Lirman, S. C. Tosini, D. DiResta, J. Luo
& J. Wang, 2001. Sponge population dynamics in Bis-
cayne Bay, Florida. Estuarine Coastal and Shelf Science
53: 13–23.
Cross, R. & D. Williams (eds.), 1981. Proceedings of the na-
tional symposium on freshwater inflow to estuaries, vols. I
and II. FWS/OBS-81/04. US Fish Wildlife Service,
Washington, D.C.
Dahlgren, C. P., G. T. Kellison, A. J. Adams, B. M. Gillanders,
M. S. Kendall, C. A. Layman, J. A. Ley, I. Nagelkerken &
J. E. Serafy, 2006. Marine nurseries and effective juvenile
habitats: concepts and applications. Marine Ecology Pro-
gress Series 312: 291–295.
Davis, S. M. & J. C. Ogden, 1994. Toward Ecosystem Resto-
ration. In Davis, S. M. & J. C. Ogden (eds), Everglades.
The Ecosystem and its Restoration. St. Lucie Press,
Delray Beach, Florida: 769–797.
Dennison, W. C., R. J. Orth, K. A. Moore, J. Court Stevenson,
V. Carter, S. Kollar, P. W. Bergstrom & R. A. Batiuk,
1993. Assessing water quality with submersed aquatic
vegetation. Bioscience 43: 86–94.
Duarte, C. M., 2002. The future of seagrass meadows. Envi-
ronmental Conservation 29: 192–206.
Durako, M. J., M. O. Hall, M. Merello, 2002. Patterns of
Change in the Seagrass Dominated Florida Bay Hydro-
scape. In Porter, J. W. & K. G. Porter (eds), The Ever-
glades, Florida Bay, and Coral Reefs of the Florida Keys.
An Ecosystem Sourcebook. CRC Press, Boca Raton,
Florida: 523–537.
Fong, P.& Harwell M. A., 1994. Modeling seagrass commu-
nities in tropical and subtropical Bays and estuaries: a
mathematical model synthesis of current hypotheses.
Bulletin of Marine Science 54: 757–781.
Fourqurean, J. W., G. V. N. Powell, W. J. Kenworthy & J. W.
Zieman, 1995. The effects of long-term manipulation of
nutrient supply on competition between the seagrasses
Thalassia testudinum and Halodule wrightii in Florida
Bay. Oikos 72: 349–358.
Fourqurean, J. W., M. J. Durako, M. O. Hall & L. N. Hefty,
2002. Seagrass Distribution in South Florida: A Multi-
agency Coordinated Monitoring Program. In Porter, J. W.
& K.G. Porter (eds), The Everglades, Florida Bay, and
Coral Reefs of the Florida Keys. An Ecosystem Source-
book. CRC Press, Boca Raton, Florida: 497–522.
Fourqurean, J. W., J. N. Boyer, M. J. Durako, L. N. Hefty &
B. J. Peterson, 2003. Forecasting responses of seagrass
distributions to changing water quality using monitoring
data. Ecological Applications 13: 474–489.
Frazer, T. K., S. K. Notestein, C. A. Jacoby, C. J. Littles, S. R.
Keller & R. A. Swett, 2006. Effects of storm-induced
salinity changes on submersed aquatic vegetation in Kings
Bay, Florida. Estuaries and Coasts 29: 943–953.
Herrera-Silveira, J. A., J. Ramirez-Ramirez, N. Gomez & A.
Zaldivar-Jimenez, 2000. Seagrass Bed Recovery After
Hydrological Restoration in a Coastal Lagoon with
Groundwater Discharges in the North of Yucatan
(Southeastern Mexico). In Bortone, S. A. (ed.), Seag-
rasses: Monitoring, Ecology, Physiology, and Manage-
ment. CRC Press, Boca Raton, Florida: 219–229.
Irlandi, E. A., B. A. Orlando & P. D. Biber, 2004. Drift algae–
epiphyte–seagrass interactions in a subtropical Thalassiatestudinum meadow. Marine Ecology Progress Series 279:
81–91.
Jackson, L. E., J. C. Kurtz & W. S. Fisher (eds), 2000. Eval-
uation Guidelines for Ecological Indicators. US EPA/620/
R-99/005. U.S. Environmental Protection Agency, Office
of Research and Development, Research Triangle Park,
NC, 107p.
Jackson, E. L., A. A. Rowden, M. J. Attrill, S. J. Bossey & M.
B. Jones, 2001. The importance of seagrass beds as a
habitat for fishery species. Oceanography and Marine
Biology 39: 269–303.
Hydrobiologia (2008) 596:105–120 119
123

Kopecky, A. L. & K. H. Dunton, 2006. Variability in drift
macroalgal abundance in relation to biotic and abiotic
factors in two seagrass dominated estuaries in the Western
Gulf of Mexico. Estuaries and Coasts 29: 617–629.
Larkum, A. W. D., R. J. Orth & C. M. Duarte (eds), 2006.
Seagrasses: Biology, Ecology and Conservation. Springer,
The Netherlands.
Lazar, A. C. & C. J. Dawes, 1991. A seasonal study of the
seagrass Ruppia maritima L. in Tampa Bay, Florida. Or-
ganic constituents and tolerances to salinity and temper-
ature. Botanica Marina 34: 265–269.
Lirman, D. & W. P. Cropper Jr., 2003. The influence of salinity
on seagrass growth, survivorship, and distribution within
Biscayne Bay, Florida: field, experimental, and modeling
studies. Estuaries 26: 131–141.
Lirman, D., G. Deangelo, J. Serafy, A. Hazra, D. Smith Hazra
& A. Brown, In Press. Geospatial video monitoring of
nearshore benthic habitats of western Biscayne Bay
(Florida, USA) using the Shallow-Water Positioning
System (SWaPS). Journal of Coastal Research.
Lirman, D., B. Orlando, S. Macia, D. Manzello, L. Kaufman, P.
Biber & T. Jones, 2003. Coral communities of Biscayne
Bay, Florida and adjacent offshore areas: diversity,
abundance, distribution, and environmental correlates.
Aquatic Conservation 13: 121–135.
Lotze, H. K., H. S. Lenihan, B. J. Bourque, R. H. Bradbury, R.
G. Cooke, M. C. Kay, S. M. Kidwell, M. X. Kirby, C. H.
Peterson & J. B. C. Jackson, 2006. Depletion, degrada-
tion, and recovery potential of estuaries and coastal seas.
Science 312: 1806–1809.
McMahan, C. A., 1968. Biomass and salinity tolerance of
shoalgrass and manateegrass in Lower Laguna Madre,
Texas. Journal of Wildlife Management 32: 501–506.
Montague, C. L. & J. A. Ley, 1993. A possible effect of salinity
fluctuation on abundance of benthic vegetation and asso-
ciated fauna in Northeastern Florida Bay. Estuaries 16:
703–717.
Orth, R. J., T. J. B. Carruthers, W. C. Dennison, C. M. Duarte,
J. W. Fourqurean, K. L. Heck Jr., A. R. Hughes, G. A.
Kendrick, W. J. Kenworthy, S. Olyarnik, F. T. Short, M.
Waycott & S. L. Williams, 2006. A global crisis for
seagrass ecosystems. Bioscience 56: 987–996.
Ralph, P. J., D. Tomasko, K. Moore, S. Seddon & C. M. O.
Macinnis-Ng, 2006. Human Impacts on Seagrasses:
Eutrophication, Sedimentation and Contamination. In
Larkum, A. W. D., R. J. Orth & C. M. Duarte (eds),
Seagrasses: Biology, Ecology and Conservation. Springer,
The Netherlands: 567–593.
RECOVER, 2004. Draft CERP Systemwide Performance
Measures. Restoration Coordination and Verification Team
(RECOVER), United States Army Corps of Engineers,
Jacksonville District, Jacksonville, FL and South Florida
Water Management District, West Palm Beach, FL.
Riegl, B. M, R. P. Moyer, L. J. Morris, R. W. Virnstein, & S. J.
Purkis, 2005. Distribution and seasonal biomass of drift
macroalgae in the Indian River Lagoon (Florida, USA)
estimated with acoustic seafloor classification (QTCView,
Echoplus). Journal of Experimental Marine Biology and
Ecology 326: 89–104.
Robblee, M. B., T. R. Barber, P. R. Carlson, M. J. Durako,
J. W. Fourqurean, L. K. Muehlstein, D. Porter, L. A.
Yarbro, R. T. Zieman & J. C. Zieman, 1991. Mass mor-
tality of the tropical seagrass Thalassia testudinum in
Florida Bay (USA). Marine Ecology Progress Series 71:
297–299.
Rotenberry, J. T., K. L. Preston & S. T. Knick, 2006. GIS-
based niche modeling for mapping species’ habitat.
Ecology 87: 1458–1464.
Serafy, J. E., C. H. Faunce & J. J. Lorenz, 2003. Mangrove
shoreline fishes of Biscayne Bay, Florida. Bulletin of
Marine Science 72: 161–180.
Short, F. T., E. W. Koch, J. C. Creed, K. M. Magalha, E.
Fernandez & J. L. Gaeckle, 2006. Seagrass Net monitor-
ing across the Americas: case studies of seagrass decline.
Marine Ecology 27: 277–289.
Sklar, F. H. & J. A. Browder, 1998. Coastal environmental
impacts brought about by alterations to freshwater flow in
the Gulf of Mexico. Environmental Management 22:
547–562.
Sklar, F., C. Mcvoy, R. Vanzee, D. E. Gawlik, K. Tarboton,
D. Rudnick, S. Miao & T. Armentano, 2002. The Effects
of Altered Hydrology on the Ecology of the Everglades.
In Porter J.W. & K. G. Porter (eds), The Everglades,
Florida Bay, and Coral Reefs of the Florida Keys. An
Ecosystem Sourcebook. CRC Press, Boca Raton, Florida:
39–82.
Sokal, R. & F. J. Rohlf, 1995. Biometry, 3rd ed. W.H. Freeman
and Co., New York.
Steinman, A. D., K. E. Havens, H. J. Carrick & R. Vanzee,
2002. The Past, Present, and Future Hydrology and
Ecology of Lake Okeechobee and its Watersheds. In
Porter, J. W. & Porter K. G. (eds), The Everglades,
Florida Bay, and Coral Reefs of the Florida Keys. An
Ecosystem Sourcebook. CRC Press, Boca Raton, Florida:
19–37.
Stockman, K., R. N. Ginsburg & E. A. Shinn, 1967. The pro-
duction of lime mud by algae in South Florida. Journal of
Sedimentary Petrology 37: 633–648.
USACE and SFWMD, 1999. Central and Southern Florida
Project. Comprehensive Review Study Final Integrated
Feasibility Report and Programmatic Environmental Im-
pact Statement. United States Army Corps of Engineers,
Jacksonville District, FL, USA and South Florida Water
Management District, West Palm Beach, FL, USA.
Wang, J. D., J. Luo & J. Ault, 2003. Flows, salinity, and some
implications on larval transport in South Biscayne Bay,
Florida. Bulletin of Marine Science 72: 695–723.
Wortmann, J., J. W. Hearne & J. B. Adams, 1997. A mathe-
matical model of an estuarine seagrass. Ecological Mod-
elling 98: 137–149.
Zieman, J. C., 1982. The Ecology of the Seagrasses of South
Florida, A Community Profile. FWS/OBS-82/25, US Fish
and Wildlife Services. Office of Biological Services,
Washington, DC.
Zieman, J. C., J. W. Fourqurean & R. L. Iverson, 1989. Dis-
tribution, abundance and productivity of seagrasses and
macroalgae in Florida Bay. Bulletin of Marine Science 44:
292–311.
Zieman, J. C., J. W. Fourqurean & T. A. Frankovich, 1999.
Seagrass die-off in Florida Bay: long-term trends in
abundance and growth of turtle grass, Thalassia testudi-num. Estuaries 22: 460–470.
120 Hydrobiologia (2008) 596:105–120
123
Copyright © 2022 FDOKUMEN