
Onslow Marine Support Base Shoreline Impacts Assessment
100
Onslow Marine Support Base Shoreline Impacts Assessment 27 July 2017 | 12636.101.R1.Rev0
-
Upload
khangminh22 -
Category
Documents
-
view
0 -
download
0
Transcript of Onslow Marine Support Base Shoreline Impacts Assessment

Onslow Marine Support Base Shoreline Impacts Assessment
27 July 2017 | 12636.101.R1.Rev0

Onslow Marine Support Base Shoreline Impacts Assessment
© 2017 Baird Australia Pty Ltd as Trustee for the Baird Australia Unit Trust (Baird) All Rights Reserved. Copyright in the whole and every part of this document, including any data sets or outputs that accompany this report, belongs to Baird and may not be used, sold, transferred, copied or reproduced in whole or in part in any manner or form or in or on any media to any person without the prior written consent of Baird.
This document was prepared by Baird Australia Pty Ltd as Trustee for the Baird Australia Unit Trust for O2 Marine. The outputs from this document are designated only for application to the intended purpose, as specified in the document, and should not be used for any other site or project. The material in it reflects the judgment of Baird in light of the information available to them at the time of preparation. Any use that a Third Party makes of this document, or any reliance on decisions to be made based on it, are the responsibility of such Third Parties. Baird accepts no responsibility for damages, if any, suffered by any Third Party as a result of decisions made or actions based on this document.
12636.101.R1.Rev0 Page i
Prepared for: Prepared by:
O2 Marine
Suite 2, 4B Mews Rd Fremantle WA 6160
Baird Australia Pty Ltd as Trustee for the Baird Australia Unit Trust ACN 161 683 889 | ABN 92 798 128 010
For further information, please contact Jim Churchill at +61 8 6151 5537 [email protected] www.baird.com
12636.101.R1.Rev0 T:\2017\Report.2017\12636.101.R1.Rev0.OnslowMarineSupplyBase_ShorelineImpactsAssessmentReport.docx
Revision Date Status Comments Prepared Reviewed Approved
A 26/05/2017 Draft Draft for Client Review JC SJG
B 14/06/2017 Draft Updated to address comments Following Client Review JC DRT
C 4/07/2017 Draft Updated with Sedimentation Section for Client Review JC SJG
0 26/07/2017 Issue Updated following Review JC SJG

Onslow Marine Support Base Shoreline Impacts Assessment
12636.101.R1.Rev0 Page ii
Executive Summary
The Onslow Marine Support Base (OMSB) project will develop a major marine support base in Onslow that will provide maritime support services to commercial operations across a range of sectors. The OMSB will deliver a land backed wharf with a deep berth pocket for a range of vessel sizes, connected to Beadon Bay through a deepened, wider navigation channel which is planned to be dredged through the Beadon Creek entrance.
As part of the environmental approvals process for the OMSB project, the impact of the Stage 2 capital dredging to the Beadon Creek system is being referred to Western Australia’s Environmental Protection Authority (EPA). This requires investigation of the changes that will occur to the coastal dynamics for the Beadon Creek entrance, shorelines and upstream areas.
A hydrodynamic model of the Onslow coastal region has been developed to support investigations into changes to the coastal processes associated with the planned capital dredging. The model has been validated against the available measured water level record from a tide gauge location within Beadon Creek and at an AWAC instrument northwest of the training wall, showing good agreement to the measured data for water level, current velocity and direction.
The modelling investigations indicate that whilst there is an increase in storage volume associated with the Stage 2 capital dredging, there is only a minor (<1%) increase to the overall tidal prism. The upstream impacts to water level and velocity in Beadon Creek show only negligible changes compared to the existing condition.
A quantitative assessment of sediment transport and sedimentation has been completed, with the hydrodynamic and wave models developed in the initial project phase applied to sediment transport modelling of the planned capital dredging. The modelled sedimentation volumes in the existing and post-dredging case have been assessed within ten distinct channel sections that have previously been used to assess dredging requirements for Beadon Creek (Oceanica 2014).
For the navigable areas of the OMSB footprint (navigation channel, entrance channel, turning circle and berth area) annual total sedimentation in the range of 18,000 m3 to 28,000 m3 could occur based on the modelled outcomes. Post-dredging estimates of sedimentation in lower Beadon Creek (south of the OMSB footprint) show the rate of sedimentation could increase by approximately 30% from those historically reported (from approximately 1,700m3 to 2,300m3) though this is likely to move back within the historical range as the bathymetry adjusts to the new hydrodynamic regime over the longer term. The potential sedimentation impacts for the OMSB developed footprint from a severe tropical cyclone event was assessed based on modelling of TC Olwyn (2015) and TC Vance (1999). This analysis concluded that sedimentation volumes in the OMSB footprint from an extreme cyclone event could range from 5,000m3 to 10,000m3.
In general, there is only minor annual sedimentation volumes predicted for the OMSB berth, turning circle and inner channel approach areas, with the largest sedimentation expected to occur within the OMSB navigation channel both offshore and on the lee side of the training wall as eastward littoral drift of sediment is trapped in the deep navigation channel. Maintenance dredging of the sediment that is directed into the navigation channel will be required to maintain navigable depth in this area, with some form of bypassing required that can restore the natural eastward supply of sand to the eastern shoal and eastern shoreline.

Onslow Marine Support Base Shoreline Impacts Assessment
12636.101.R1.Rev0 Page iii
Table of Contents
1. Introduction ............................................................................................................................. 1
1.1 Project Overview 1
1.1.1 Project Location 1
1.2 Coastal Dynamics 2
1.3 Study Scope and Approach 3
2. Coastal Processes Summary ................................................................................................ 4
2.1 Oceanographic Conditions 4
2.2 Beadon Creek and Entrance Channel Dynamics 6
3. Model Setup and Calibration .............................................................................................. 10
3.1 Model Inputs 10
3.1.1 Bathymetry Data and Elevation Data Sources 10
3.1.2 Measured Data 11
3.1.3 Sediment Sampling 12
3.2 Regional Scale Model 13
3.2.1 Model Setup 13
3.3 Local Model Setup 15
3.3.1 Grid and Bathymetry 15
3.3.2 Boundary Conditions 17
3.3.3 Discharge for the Onslow Salt Operations 17
3.3.4 Calibration Terms 18
3.4 Model Validation 19
3.4.1 Simulation Periods 19
3.4.2 Model Comparison – Monsoon Season 20
3.4.3 Model Comparison – Dry Season 21
3.4.4 Eddy Shedding 22
4. Developed Case Layout ...................................................................................................... 24
4.1 Developed Case Model Bathymetry 25

Onslow Marine Support Base Shoreline Impacts Assessment
12636.101.R1.Rev0 Page iv
5. Hydrodynamic Assessment Results ................................................................................. 26
5.1 Model Reporting Locations 26
5.2 Change to Beadon Creek Tidal Prism 28
5.3 Spatial Plots for Current Velocity and Direction 30
5.4 Changes to Current Velocity at Key Locations 37
5.5 Submergence Curves 42
6. Sediment Transport and Morphological Impact Assessment ....................................... 45
6.1 Description of Sediment Transport Processes 45
6.2 Shoreline Processes 45
6.2.1 Movement of Shoreline Position 45
6.2.2 Aeolian Transport 50
6.2.3 Littoral Transport 50
6.2.4 Estimation of Sediment Volume Trapped on the Western Side of Beadon Creek Training Wall 52
6.2.5 Beadon Creek Tidal Flats - Creeks and Runoff 53
6.2.6 Conceptual Summary of sediment transport processes 54
6.3 Sediment Transport Model 54
6.3.1 Sediment Transport Model Description 56
6.3.2 Sediment Transport Model Hydrodynamic and Wave Validation 57
6.3.3 Sediment Transport Model Sediment Size 58
6.3.4 Sediment Transport Model Results – Sand Fractions 60
6.3.5 Sediment Transport Model Results – Fine Sediment Fractions 69
6.3.6 Sediment Transport Model Results – Longshore Transport Bypassing 71
6.3.7 Summary of Projected Sedimentation 76
6.3.8 Sedimentation from Extreme Cyclonic Events 76
7. Conclusions ......................................................................................................................... 83
8. References ............................................................................................................................ 86
Concept Plan Design Layouts

Onslow Marine Support Base Shoreline Impacts Assessment
12636.101.R1.Rev0 Page v
Tables
Table 2.1: Meteorological and Oceanographic Summary – Wet and Dry Season .......................................... 4
Table 2.2: Beadon Creek Tidal Planes ................................................................................................................ 5
Table 2.3: Dredging summary 1964 to 2013 (BMT Oceanica 2014) ................................................................ 9
Table 3.1: Bathymetry Sources for Model Development ................................................................................. 10
Table 3.2: Elevation Data Sources for Model Development ............................................................................ 10
Table 3.3: Sources of Measured Data ............................................................................................................... 11
Table 5.1: Model Reporting Locations ............................................................................................................... 26
Table 5.2: Increase to Tidal Prism Calculation Based on one Month of modelled Tides at the Beadon Creek Entrance for the Existing and Developed Case. .................................................................................... 29
Table 6.1: Shoreline changes west of training wall - transect analysis 2010 to 2016 LiDAR ........................ 53
Table 6.2: Three Fine Sediment Fractions Parameters ................................................................................... 56
Table 6.3: Baseline monitoring locations for turbidity within the model domain (Wheatstone 2013) ............ 60
Table 6.4: Annual Sedimentation Rates (m3/yr) for Channel Sections – Historical vs Modelled .................. 63
Table 6.5: Annual Sedimentation rates (m3/yr) for Developed case dredged footprint areas ....................... 66
Table 6.6: Sedimentation rates (m3/yr) for developed case in lower Beadon Creek ..................................... 69
Table 6.7: Summary of littoral transport pathways and driving mechanisms ................................................. 72
Table 6.8: Littoral Transport Sediment Deposition Summary .......................................................................... 75
Table 6.9: Summary of Annual Sedimentation Volumes (m3/yr) ..................................................................... 76
Table 6.10: Modelled Tropical Cyclone Summary ............................................................................................ 77
Table 6.11: Modelled Sedimentation Rates (m3) for OMSB Developed Case Dredged Footprint Area and Lower Beadon Creek Section for Cyclone Cases ............................................................................................ 78
Figures
Figure 1.1: Onslow Location and OMSB Project Area and Dredge Footprint (Google Earth) ........................ 1
Figure 1.2: Onslow Beadon Creek Site Overview and Key Reference Locations ........................................... 2
Figure 2.1: Onslow Beadon Creek Submergence Curve (DoT 2017) .............................................................. 5

Onslow Marine Support Base Shoreline Impacts Assessment
12636.101.R1.Rev0 Page vi
Figure 2.2: Influences on Beadon Creek and Entrance Channel Dynamics .................................................... 6
Figure 2.3: Analysis of Cross Sectional Area through the Entrance Channel (below m MSL). ...................... 8
Figure 2.4: Location of Beadon Creek dredging areas – Bellmouth, mid-channel and basin (DoT 2017 from JFA 2013) .............................................................................................................................................................. 9
Figure 3.1: Measured Data Sources and Locations ......................................................................................... 11
Figure 3.2: Sediment Sampling Locations (O2 Marine 2017) .......................................................................... 12
Figure 3.3: Regional Model Grid Extent shown in Delft-FM ............................................................................. 13
Figure 3.4: Regional Model Tidal Validation. Water Levels Shown: Modelled Blue, Predicted Red. ........... 14
Figure 3.5: Local Model Grid .............................................................................................................................. 15
Figure 3.6: Local Model Grid through Beadon Creek Entrance with Existing Bathymetry (datum m MSL) . 16
Figure 3.7: Local Model Domain (shown in magenta) nested inside Regional Model Domain Flexible Mesh Grid (shown in Blue) ............................................................................................................................................ 17
Figure 3.8: Modelled Discharge and Water level through the Beadon Creek Entrance Channel with and without the Onslow Salt Intake pump, spring tide conditions. .......................................................................... 18
Figure 3.9: Roughness Map from Delft-3D Model ............................................................................................ 19
Figure 3.10: Model Validation – Representative Monsoon Season, 28 Feb 2016 – 28 Mar 2016 ............... 20
Figure 3.11: Model Validation –Representative DrySeason, 25 Sep 2015 – 23 Oct 2015 ........................... 21
Figure 3.12: Model Validation – Eddy Shedding from Training Wall on Ebb Tide. Left Aerial Image, Right: 1 October 2015 0900 modelled ebb tide level (m MSL) and flow direction (depth averaged). ........................ 22
Figure 3.13: Comparison of modelled current velocity gradient at the AWAC location ................................. 23
Figure 4.1: Marine supply Base Concept (APH170162 C-05 RevB) .............................................................. 24
Figure 4.2: Re-use areas for Dredge Spoil (APH170162 C-06 RevC) ........................................................... 25
Figure 5.1: Model Reporting Locations – Beadon Creek Entrance ................................................................. 26
Figure 5.2: Model Reporting Locations – OMSB Site and Central Beadon Creek ........................................ 27
Figure 5.3: Model Reporting Locations – Beadon Creek Tidal Flats............................................................... 27
Figure 5.4: Modelled discharge rates for inflow and outflow through the Entrance Channel during a large spring tide. ........................................................................................................................................................... 28
Figure 5.5: Cross Sectional Area of Entrance Channel under pre and post-dredge condition. Levels shown from 2016 LiDAR and Bathymetry (mMSL) ...................................................................................................... 29
Figure 5.6: Existing case modelled depth average current speed through the Entrance Channel during a large flood tide (1 October 2015 1100 WST). ................................................................................................... 31

Onslow Marine Support Base Shoreline Impacts Assessment
12636.101.R1.Rev0 Page vii
Figure 5.7: Post development modelled depth average current speed through the Entrance Channel during a large flood tide (1 October 2015 1100 WST). ................................................................................................ 32
Figure 5.8: Comparisons of depth averaged current speed through Beadon Creek entrance during a large flood tide for the existing (left) and developed (right) case (1 October 2015 1100 WST). ............................. 33
Figure 5.9: Existing condition modelled depth average current speed through the Entrance Channel during a large ebb tide (1 October 2015 0230 WST). .................................................................................................. 34
Figure 5.10: Post development modelled depth average current speed through the Entrance Channel during a large ebb tide (1 October 2015 0230 WST). ...................................................................................... 35
Figure 5.11: Comparisons of depth averaged current speed through the central Beadon Creek Channel section during a large ebb tide for the existing (left) and developed (right) case (1 October 2015 0230 WST). ................................................................................................................................................................... 36
Figure 5.12: Modification to flow velocities along the Training wall post construction (Spring Tide 24 Sep to 8 Oct 2015) .......................................................................................................................................................... 37
Figure 5.13: Modification to flow velocities on the eastern shoal post construction (Spring Tide 24 Sep to 8 Oct 2015) ............................................................................................................................................................. 38
Figure 5.14: Modification to flow velocities in the Main Channel of Beadon Creek Post Construction (Spring Tide 24 Sep to 8 Oct 2015) ................................................................................................................................ 39
Figure 5.15: Modification to flow velocities in the Beadon Creek Tidal Branches Post Construction (Spring Tide 24 Sep to 8 Oct 2015) ................................................................................................................................ 40
Figure 5.16: Flow velocities during the neap-flood phase in the Berth Pocket Post Construction (Spring Tide 24 Sep to 8 Oct 2015) ................................................................................................................................ 41
Figure 5.17: Flow velocities during the neap-flood phase in the Main Access Channel Post Construction (Spring Tide 24 Sep to 8 Oct 2015) ................................................................................................................... 41
Figure 5.18: Submergence Curve for the Salt Intake location for the existing and post construction scenario .............................................................................................................................................................................. 42
Figure 5.19: Submergence Curve for the east and west Beadon Creek Tidal Branches CK0 and CK4 respectively under the existing and post construction scenario ....................................................................... 43
Figure 5.20: Submergence Curve for the Mangrove Location M1 and M2 for the existing and post construction scenario .......................................................................................................................................... 44
Figure 6.1: Historical aerials showing construction of the training wall on the western sand spit at the entrance to Beadon Creek (Seashore 2017) .................................................................................................... 45
Figure 6.2: Historical shoreline position on the western side of the training wall ........................................... 46
Figure 6.3: Historical shoreline position on the eastern side of the training wall ............................................ 46
Figure 6.4: Eastern shoal feature shown in historical aerial 1966 to 2015 ..................................................... 47

Onslow Marine Support Base Shoreline Impacts Assessment
12636.101.R1.Rev0 Page viii
Figure 6.5: Multi-beam bathymetry showing seabed elevation at the Beadon Creek Entrance (Datum mAHD) ................................................................................................................................................................. 48
Figure 6.6: Eastern shoreline with aerial imagery overlain with proposed dredge area footprint for years 1991, 1999 (post cyclone TC Vance), 2001, 2009 (post TC Dominic), 2013 and 2015. ............................... 49
Figure 6.7: Littoral transport modelling for the western shoreline using the LITDRIFT model. ..................... 51
Figure 6.8: Schematic of Cross Shore Profile Analysis based on the equilibrium profile concept in Kamphuis (2010) ................................................................................................................................................. 52
Figure 6.9: Assessment of shoreline change based on 2010 and 2016 LiDAR ............................................. 53
Figure 6.10: Conceptual summary of sediment transport ................................................................................ 54
Figure 6.11: Example of sand fractions at the Beadon Creek entrance (image 2013) .................................. 55
Figure 6.12: Example of suspended fine sediments at the Beadon Creek entrance (image 1991) ............. 55
Figure 6.13: Dry season comparison of measured and modelled wave, wind and atmospheric pressure conditions ............................................................................................................................................................. 57
Figure 6.14: Wet season comparison of measured and modelled wave, wind and atmospheric pressure conditions ............................................................................................................................................................. 58
Figure 6.15: Results for sediment size (D50, mm) at sampling locations in the Entrance Channel (O2 2017) used for the discretisation in Delft3d Model Map of variable sediment size. .................................................. 59
Figure 6.16: Baseline monitoring locations for NTU (Wheatstone 2013) shown relative to the Delft-FLOW model boundaries. ............................................................................................................................................... 60
Figure 6.17: Channel sections analysed for bed level changes (Oceanica, 2014) ........................................ 61
Figure 6.18: Sand fraction modelled annual erosion and sedimentation for the existing case. Outer channel (upper) and inside Beadon Creek (lower) areas with channel sections overlaid. .......................................... 62
Figure 6.19: Sand fraction modelled annual erosion and sedimentation for the developed case. Outer channel (upper) and inside Beadon Creek (lower) areas with channel sections overlaid ............................. 65
Figure 6.20: Channel sections analysis regions for developed case .............................................................. 66
Figure 6.21: Modelled sedimentation for cross sections through the channel approach (section 2) ............ 67
Figure 6.22: Depth transition through from the lower section of the dredged footprint to the existing seabed level of Beadon Creek (levels shown to mCD). ................................................................................................ 68
Figure 6.23: Fines Accumulation – total annual sedimentation for Existing Case (left), Developed Case (right) .................................................................................................................................................................... 70
Figure 6.24: Fines Accumulation – total annual sedimentation for Channel Entrance and OMSB area ...... 71
Figure 6.25: Distribution of Littoral Drift Volume that Bypasses the Training Wall Structure under existing conditions ............................................................................................................................................................. 73

Onslow Marine Support Base Shoreline Impacts Assessment
12636.101.R1.Rev0 Page ix
Figure 6.26: Distribution of Littoral Drift Volume that Bypasses the Training Wall Structure under developed conditions ............................................................................................................................................................. 74
Figure 6.27: TC Vance Track (left) and satellite image (right) (Source BOM 2017b) .................................... 77
Figure 6.28: Model Validation – TC Olwyn 2015 (Local Time) ...................................................................... 79
Figure 6.29: TC Vance 1999 - modelled metocean conditions ....................................................................... 80
Figure 6.30: TC Olwyn 2015, Sand fraction modelled erosion and sedimentation for the developed case. Outer channel (left) and inside Beadon Creek (right) areas with channel sections overlaid. ........................ 81
Figure 6.31: TC Vance 1999, Sand fraction modelled erosion and sedimentation for the developed case. Outer channel (left) and inside Beadon Creek (right) areas with channel sections overlaid. ........................ 82

Onslow Marine Support Base Shoreline Impacts Assessment
12636.101.R1.Rev0 Page 1
1. Introduction
1.1 Project Overview
The Onslow Marine Support Base (OMSB) project involves the development of a major marine supply base in Onslow which will provide maritime support services to commercial operations across a range of sectors. The project site is located on an undeveloped section of the western Beadon Creek shoreline, north of the existing marine precinct. The OMSB will deliver a land backed wharf with a deep berth pocket for a range of vessel sizes, connected to Beadon Bay through a deepened, wider navigation channel which is planned to be dredged through the Beadon Creek entrance.
Phase One of the OMSB project is nearing completion which has involved initial dredging of the berth pocket and development of the land backed wharf. The Stage Two capital dredging works within Beadon Creek and the channel approach from Beadon Bay will significantly improve the access for commercial vessels, and will involve the removal of approximately 1 million cubic metres of dredge material which is planned for onshore reuse.
1.1.1 Project Location
The town of Onslow is on Australia’s northwest coast approximately 1400km north of Perth (Figure 1.1). The OMSB site is located north of the Beadon Creek Maritime Facility which is on the western shoreline of Beadon Creek and managed by the Department of Transport (DoT). Currently the maritime facility supports commercial activities including the oil and gas industry and recreational and fishing charter operations. The OMSB site is well placed strategically to play a key role in servicing the current and future oil and gas operations on the north-west shelf.
Figure 1.1: Onslow Location and OMSB Project Area and Dredge Footprint (Google Earth)

Onslow Marine Support Base Shoreline Impacts Assessment
12636.101.R1.Rev0 Page 2
1.2 Coastal Dynamics
The town of Onslow is sited adjacent to Beadon Creek. The Beadon Creek Maritime Facility has been operational since the 1960’s. Over this time a number of modifications have been undertaken to the natural system. A training wall constructed in 1968 at the creek entrance was designed to formalise the channel opening, whilst the upstream catchment area of Beadon Creek was reduced by the development of the Onslow Salt Works in 1997. The Beadon Creek entrance channel is at a depth of approximately -1.6m CD (Figure 1.2).
Figure 1.2: Onslow Beadon Creek Site Overview and Key Reference Locations
The existing Beadon Creek navigation channel currently supports marine access to the Creek for a range of commercial and recreational activities, including the Beadon Creek Maritime Facility. Under the management of the Department of Transport (DoT), the channel depth has been maintained through

Onslow Marine Support Base Shoreline Impacts Assessment
12636.101.R1.Rev0 Page 3
periodic maintenance dredging, with an average of approximately 5,000m3 per year of dredged sediment removed (Damara, 2010; Crawford, 1995).
There has been continual accumulation of sediment on the western side of the training wall since its construction in 1968. Sediment littoral transport is eastward under the prevailing longshore wave direction with net accretion rates along the shoreline west of the training wall estimated at 5,000 to 10,000m3 annually (Damara, 2010). Damara (2010) estimates the total littoral drift to be between 35,000 and 85,000 m3 per annum eastwards. The entrance channel is maintained to a depth of -1.6mCD largely by the natural tidal flows, with the eastern bank of the creek and the ebb tide shoal to the east of the entrance fed by the natural bypass capacity of the channel.
1.3 Study Scope and Approach
As part of the environmental approvals process for the OMSB project, the impact of the Stage 2 capital dredging to the Beadon Creek system is being referred to Western Australia’s Environmental Protection Authority (EPA). This requires investigation of the changes that will occur to the coastal dynamics for the Beadon Creek entrance, shorelines and upstream areas.
This report details the hydrodynamic and morphological assessment of the existing Beadon Creek system, and investigates the potential changes to the coastal system that could occur following the planned Stage 2 capital dredging. A review of previous studies undertaken at the location is presented to provide a summary of the key factors influencing the coastal processes within the current Beadon Creek system. A hydrodynamic model has been developed to examine the changes to Beadon Creek associated with the modification to the system under the planned Stage Two capital dredging for the OMSB project. The hydrodynamic model is applied in sediment transport investigations that model morphological changes under general ambient conditions (wet and dry seasonal periods) and extreme conditions (cyclones) to provide quantitative assessment of changes to longshore transport rates at the offshore end of the western training wall, sedimentation in the navigation channel, sediment bypass rates, scour potential along the channel margins and entrance training wall.
The report is structured in the following sections: • Section 2: Coastal processes summary based on review of existing literature • Section 3: Hydrodynamic model setup, calibration and validation • Section 4: Developed case layout and model setup • Section 5: Hydrodynamic Assessment Results • Section 6: Sediment Transport and Morphological Impact Assessment • Section 7: Conclusions

Onslow Marine Support Base Shoreline Impacts Assessment
12636.101.R1.Rev0 Page 4
2. Coastal Processes Summary
2.1 Oceanographic Conditions
Onslow is situated on the northwest coast of Australia in the Pilbara region. The location experiences a tropical climate with two distinct seasons – a dry season between the months April to October and wet season between the months November to March. The dry season is typically categorised by light winds from the south, southeast and east. In the wet season or monsoon, the winds are typically stronger with a strong sea-breeze effect in operation and wind directions around the southwest, west and northwest directions (DoT 2017).
Ambient wave conditions at the Onslow shore are relatively minor, with a total wave height lower than 1m and generally less than 0.5m throughout the year. The location is well protected from swell originating in the Southern and Indian Oceans due to the orientation of the coast and the shallow continental shelf, with swell wave height generally less than 0.25m in the period range 8-20 seconds. An active sea breeze cycle is present in summer with onshore winds driving local seas in the afternoon at periods 3-8 seconds (DoT 2017).
The Pilbara is an active tropical cyclone region and Onslow has been subjected to a significant number of Tropical Cyclones in its history. The cyclone season typically lasts from November through April, and the impact from cyclones can result in extreme water levels, waves and damaging winds. The most damaging cyclone in recent history was Tropical Cyclone Vance which impacted Onslow on 22 March 1999 as a Category 5 system creating an estimated storm surge of 4m (BOM).
A summary of the typical wet and dry season conditions is presented in Table 2.1.
Table 2.1: Meteorological and Oceanographic Summary – Wet and Dry Season
Season Period Description
Dry Season April to October
Tendency for light winds from the S, SE and E Persistent low level background swell originating from the southern and Indian ocean (<0.25m)
Monsoon Season November to March
Seabreeze System from SW, W and N-W directions. Generally stronger winds compared to dry season Seabreeze effect provides diurnal wave response. Waves are larger than dry Season Elevated water levels
Onslow experiences semi-diurnal tides with a spring tide range of 1.9m. The tides are shown in Figure 2.1 with the DoT submergence curve presented on Table 2.2.

Onslow Marine Support Base Shoreline Impacts Assessment
12636.101.R1.Rev0 Page 5
Table 2.2: Beadon Creek Tidal Planes
Level Height (m CD)
HAT 3.1
MHWS 2.5
MHWN 1.8
MSL 1.6
AHD 1.49
MLWN 1.3
MLWS 0.6
LAT 0.1
Figure 2.1: Onslow Beadon Creek Submergence Curve (DoT 2017)

Onslow Marine Support Base Shoreline Impacts Assessment
12636.101.R1.Rev0 Page 6
2.2 Beadon Creek and Entrance Channel Dynamics
The tidal exchange and flows through Beadon Creek are controlled by the general tide regime, local bathymetry, the training wall at the entrance and the characteristics influencing the upstream tidal flats (Figure 2.2).
Figure 2.2: Influences on Beadon Creek and Entrance Channel Dynamics
The Onslow breakwater / training wall is a low-rise rubble mound structure that is designed to be overtopped under extreme cyclone events and high tide levels. The structure was built in 1968 in

Onslow Marine Support Base Shoreline Impacts Assessment
12636.101.R1.Rev0 Page 7
conjunction with a dredged channel through the bar for the purpose of maintaining a navigation channel to the maritime facility within Beadon Creek (DoT 2017).
Sediment littoral transport is eastward under the prevailing longshore wave direction with net accretion rates along the shoreline west of the training wall estimated at 5,000 to 10,000m3 annually (Damara 2010). There has been continual accumulation of sediment on the western side of the training wall since its construction in 1968. The entrance channel is maintained to a depth of -1.6mCD largely by the natural tidal flows, with the eastern bank of the creek and the ebb tide shoal to the east of the entrance fed by the natural bypass capacity of the channel.
The upstream area of Beadon Creek was significantly modified as a result of the construction of the Onslow Salt levee banks in 1997 which served to greatly reduce the sediment transport impacts associated with large flooding events. Historically sedimentation as a result of large scale catchment flooding during extreme rainfall events and breakout of the Ashburton River impacted Beadon Creek, and this source of sediment supply has now been largely restricted. As part of its operation, Onslow Salt operate three seawater pumps from a tidal branch on the eastern side of the upstream Beadon Creek, extracting 12m3/s when the water level in the creek is above 0.8mCD (Onslow Salt 2017). This extraction regime results in a difference between inflow and outflow volumes through Beadon Creek, with inflow exceeding outflow by approximately 35% during mean spring tides (HGM 1998).
The Beadon Creek entrance has generally maintained a stable cross section under the natural tidal regime, with this ‘quasi-equilibrium’ explained as evidence of a dynamically stable inlet system (HGM 1998). The inlet stability principle (Brunn 1979) is governed by the dynamics of the upstream area, tide regime and available sediment supply, and for Beadon Creek entrance a stable cross sectional area of 220-250m2 was estimated, as measured below mean sea level (HGM 1998). This estimation of a stable cross sectional area is supported by analysis of the present bathymetry through the channel. Figure 2.3 presents the entrance channel bathymetry from recent multibeam survey (DoT 2016), with the cross-sectional area measured below 0m MSL calculated as approximately 250m2. This concept has important implications for the planned deepening and widening of the channel through the entrance for the OMSB project, which will increase the cross-sectional area of the entrance beyond this dynamically stable level.

Onslow Marine Support Base Shoreline Impacts Assessment
12636.101.R1.Rev0 Page 8
Figure 2.3: Analysis of Cross Sectional Area through the Entrance Channel (below m MSL).
A brief summary of the historical dredging requirements in Beadon Creek is provided in Table 2.3 (from BMT Oceanica 2014) with the dredging locations indicated on Figure 2.4.
Area = 250m2

Onslow Marine Support Base Shoreline Impacts Assessment
12636.101.R1.Rev0 Page 9
Table 2.3: Dredging summary 1964 to 2013 (BMT Oceanica 2014)
Date Volume (m3) Depth (m CD) Disposal Site Reference Comments
1964-1968 Unknown -0.7 Unknown HGM 1998 Capital Dredging
1999 41,000 Bell Mouth: -1.6
Basin: -2.6
Dune Swale west rock wall and quarry
HGM 1999 Dredged Sand Bar and Mouth of Creek
2003 10,000 Bell Mouth: -1.6
Channel: -1.6 Dune Swale west rock wall
JFA 2004 Maintenance Dredging
2011 Unknown Berth Pocket Adjacent to Channel
Onshore adjacent to berth pocket
Oceanica 2012 Small Scale Dredging
2012 40,000 Bell Mouth: -1.6
Channel:-1.5 to -2.6 Dune Swale west rock wall
BMT JFA 2013 Maintenance Dredging
2013 13,000 Channel: -1.5 to -2.6
Cyclone Moorings: -1.5 Dune Swale west rock wall
Maintenance Dredging
2013 5,000 Berth Pocket Adjacent to Channel: -1.6 to -2.65
Dune Swale west of entrance training wall
Small Scale Dredging
Figure 2.4: Location of Beadon Creek dredging areas – Bellmouth, mid-channel and basin (DoT 2017 from JFA 2013)

Onslow Marine Support Base Shoreline Impacts Assessment
12636.101.R1.Rev0 Page 10
3. Model Setup and Calibration
A range of datasets have been sourced and used in the development of a suite of numerical models to describe the coastal processes in the region of Onslow and within Beadon Creek. The models are used to simulate the combined actions of tide, winds, waves and currents through Beadon Creek, and applied to understand modifications to the existing coastal system as a result of the planned capital dredging works.
A description of the input source data used to develop the numerical models is presented in this Section along with a detailed description of the model setup, calibration and validation to the existing condition of Beadon Creek.
3.1 Model Inputs
A digital elevation model (DEM) was developed for the project area from available bathymetric and elevation sources discussed in the following sections. All levels were adjusted to a datum of Mean Sea Level (MSL) for application in numerical model development.
3.1.1 Bathymetry Data and Elevation Data Sources
Bathymetry data sources used in the study are summarised in Table 3.1 and ranked in order of highest to lowest priority. It is noted the depth of the tidal creeks in the southern extent of the Beadon Creek tidal flats were not defined in available data and these were schematised based on extension of levels available in nearby areas and interpretation of aerial imagery.
Table 3.1: Bathymetry Sources for Model Development
Rank Areas Covered Data Type Year Source
1 Beadon Creek and Onslow Nearshore Multibeam 2016 DoT
2 Beadon Creek and Onslow Nearshore Multibeam 2017 DoT
3 Offshore Areas Navigation Charts - Australian
Hydrographic Service
Elevation data used for the model development is summarised in Table 3.2 and ranked in order of highest to lowest importance.
Table 3.2: Elevation Data Sources for Model Development
Rank Areas Covered Data Type Year Source
1 Beadon Creek and Onslow Coast Shoreline, Training Wall LiDAR 2016 Chevron
2 Beadon Creek and Onslow Coast Shoreline LiDAR 2015 Chevron
3 Beadon Creek and Shoreline LiDAR 2012 LandCorp
It is noted the south-eastern extent of the Beadon Creek Tidal Flat was not defined by any of the available elevation data sources. The elevation in this region was schematised by adopting the general surface levels recorded by the LiDAR capture on the western side.

Onslow Marine Support Base Shoreline Impacts Assessment
12636.101.R1.Rev0 Page 11
3.1.2 Measured Data
The meteorological and oceanographic measured data sources used in the project are summarised in Table 3.3 and shown on Figure 3.1.
Table 3.3: Sources of Measured Data
Instrument Location Data Data Availability
Beadon Creek Tide Gauge (DoT)
Lon 115.13153
Lat -21.64967
Depth 3.7m
Water Level 1/1/1986 to 31/12/2016 at 5 minute frequency
AWAC North-west of Training Wall (DoT)
Lon 115.13080
Lat -21.637317
Depth 3.7m
Water Levels, Wave Height, Wave Period, Wave Direction, Current Speed and Direction through water column
03/11/2014 to 21/07/2016.
Waves and Currents at 1 hour intervals
Wind Measurements Onslow Airport (BoM)
Lon 115.1092
Lat -21.6689
Height 10m Above Ground
Wind Speed, Wind Direction. Atmospheric Pressure
Nov 1997 to Dec 2016 Half Hour at 10m above Ground
Figure 3.1: Measured Data Sources and Locations

Onslow Marine Support Base Shoreline Impacts Assessment
12636.101.R1.Rev0 Page 12
3.1.3 Sediment Sampling
Sediment sampling data from locations inside Beadon Creek, the proposed Turning Circle as well as the Inner and Outer Channel areas have been collected and analysed for particle size distribution (PSD) and sediment properties (O2 Marine 2017). The sediment sampling locations are shown on Figure 3.2.
Figure 3.2: Sediment Sampling Locations (O2 Marine 2017)

Onslow Marine Support Base Shoreline Impacts Assessment
12636.101.R1.Rev0 Page 13
3.2 Regional Scale Model
3.2.1 Model Setup
The regional model has been developed by Baird using the Delft-Flow Flexible Mesh (D-Flow FM) platform. The model extent is shown in Figure 3.3 extending across the entire northern coast of Western Australia. The model is driven by tidal constituents along its open boundaries with bathymetry defined from hydrographic chart data and local scale bathymetry sources where available.
Validation of the hydrodynamic model to predicted astronomical tide at standard port locations across the north-west region of Australia shows very good agreement to tidal constants in both amplitude and phase. Predicted and modelled water levels for March 2011 are shown on Figure 3.4 for six port locations across the model domain including Onslow.
For this project, winds and atmospheric pressure have been sourced from the NCEP Climate Forecast System (CFSR). The climatic conditions were then applied spatially in D-FLOW FM and updated hourly across the regional model in conjunction with the tides, so their influence was captured in the determination of hydrodynamic forces acting in the domain.
Figure 3.3: Regional Model Grid Extent shown in Delft-FM

Onslow Marine Support Base Shoreline Impacts Assessment
12636.101.R1.Rev0 Page 14
Figure 3.4: Regional Model Tidal Validation. Water Levels Shown: Modelled Blue, Predicted Red.

Onslow Marine Support Base Shoreline Impacts Assessment
12636.101.R1.Rev0 Page 15
3.3 Local Model Setup
3.3.1 Grid and Bathymetry
The local model was developed to describe in fine detail the coastal processes acting along the Onslow coastal region, focussed on the key area of interest through Beadon Creek. The model was developed in the Delft3D-FLOW model system using a curvilinear grid extending approximately 17km offshore and 13km along the shore (Figure 3.5).
Figure 3.5: Local Model Grid
The curvilinear grid optimises model performance allowing varying grid resolution through the domain achieving high resolution in the nearshore areas through Beadon Creek (6m), with less detail in the offshore regions (180m).
The model bathymetry was assigned from the bathymetry and elevation data sets outlined in Section 3.1.1. All data sets were converted to the model datum of mean sea level (m MSL)

Onslow Marine Support Base Shoreline Impacts Assessment
12636.101.R1.Rev0 Page 16
Figure 3.6: Local Model Grid through Beadon Creek Entrance with Existing Bathymetry (datum m MSL)

Onslow Marine Support Base Shoreline Impacts Assessment
12636.101.R1.Rev0 Page 17
3.3.2 Boundary Conditions
The local model is driven by three offshore boundaries that control the hydrodynamics. The boundary conditions for the local model have been defined from the regional scale model as shown in Figure 3.7; summarised as follows: • The eastern and western boundaries are discharge boundaries which input flow volumes (in m3/s)
across the boundary with direction reversing through the ebb tide and flood tide cycle • The northern boundary is a water level boundary applying time series water level change at the
boundary under the general tidal cycle.
Local winds act over the model domain and are input half hourly based on the Onslow Airport measured wind speed and direction (BOM).
Figure 3.7: Local Model Domain (shown in magenta) nested inside Regional Model Domain Flexible Mesh Grid (shown in Blue)
3.3.3 Discharge for the Onslow Salt Operations
Onslow Salt pumps seawater out of the Beadon Creek system using three pumps located on one of the tidal branches that extend through the eastern side of the tidal flats. The extraction of seawater has been included in the model based on a total pumping rate of 12m3 per second whenever the water level in the creek is higher than 0.6mCD, based on the stated operational procedure in Gulf Holdings (1990). Recent advice from Onslow Salt confirms their current pumping operation continues to extract a total of 12m3 per second when the tide level in the creek is above 0.8mCD (Onslow Salt 2017). It is noted the chart datum referred in the Gulf Holdings (1990) reference differs slightly from the present tidal datum accounting for the difference in pumping cutoff rates, and the model is representative of the current Onslow Salt pumping operation.

Onslow Marine Support Base Shoreline Impacts Assessment
12636.101.R1.Rev0 Page 18
An assessment of the modelled volume of tidal inflow and outflow exchanged through the Beadon Creek entrance shows there is a significantly larger inflow volume to Beadon Creek with the intake operating. A comparison of the discharge rates through the entrance with and without the pump active is shown in Figure 3.8. The intake pumps draw a larger volume of water into Beadon Creek in the flood tide with the discharge rate for inflow increasing from approximately 175m3/s to 200m3/s, an increase of approximately 15% through the peak. The total modelled inflow and outflow volumes through the Beadon Creek entrance were calculated for a four week period. With the seawater pumps active the inflow volume was approximately 25% greater than the outflow through the entrance. This finding corresponds to work presented by HGM (1998).
Figure 3.8: Modelled Discharge and Water level through the Beadon Creek Entrance Channel with and without the Onslow Salt Intake pump, spring tide conditions.
3.3.4 Calibration Terms
Bed roughness has been assigned in the model based on the Chezy formulation with varying roughness through the model domain specified by landform type and depth (Figure 3.9). Higher Chezy values indicate less roughness in the model with a summary of assigned values as follows: • Offshore coastal areas: 40-75 • Beadon Creek and Channel branches: 40 • Mangrove Areas: 5 • Tidal Flats: 25

Onslow Marine Support Base Shoreline Impacts Assessment
12636.101.R1.Rev0 Page 19
Figure 3.9: Roughness Map from Delft-3D Model
Eddy viscosity was used to dampen oscillations in the model and spatially varying values were applied in the model ranging from 100 at the open boundary sections to 10 within the general model domain.
3.4 Model Validation
3.4.1 Simulation Periods
To recognise seasonal conditions affecting coastal processes in the study area, one month of representative Dry Season and Wet Season conditions were identified for model investigations as follows: • Monsoon Season: 1 to 31 March 2016 • Dry Season: 25 September to 23 October 2015
The representative seasonal periods were selected at times corresponding with large spring tides when measured data was available (Section 3).

Onslow Marine Support Base Shoreline Impacts Assessment
12636.101.R1.Rev0 Page 20
3.4.2 Model Comparison – Monsoon Season
The monsoon season model comparisons are shown on Figure 3.10 with validation against the measured data. Water level comparisons within Beadon Creek and at the AWAC location show very good agreement to phase. The model shows a slight offset in water levels, particularly in the first half of the simulation period, noting that February is the period of highest regional residuals across the North-West Shelf with typically 0.2m additional water level residual. At the AWAC location the trend in current speeds and directions are generally well described. Spikes in the measured current velocity data are not replicated in the model and are considered a result of the eddy shedding from the end of the training wall (further discussed in Section 3.4.4).
Figure 3.10: Model Validation – Representative Monsoon Season, 28 Feb 2016 – 28 Mar 2016

Onslow Marine Support Base Shoreline Impacts Assessment
12636.101.R1.Rev0 Page 21
3.4.3 Model Comparison – Dry Season
The dry season model comparisons are shown on Figure 3.11 with validation against the measured data. Water level comparisons within Beadon Creek and at the AWAC location show very good agreement to phase and water level magnitude. At the AWAC location the trend in current speeds and directions are generally well described. As noted for the monsoon season simulation, peaks in the measured current velocity data are a result of eddy shedding from the end of the training wall and are not replicated in the model (further discussed in Section 3.4.4).
Figure 3.11: Model Validation –Representative DrySeason, 25 Sep 2015 – 23 Oct 2015

Onslow Marine Support Base Shoreline Impacts Assessment
12636.101.R1.Rev0 Page 22
3.4.4 Eddy Shedding
On the ebb tide, water passes through the entrance channel and around the end of the training wall in the northwest direction. This process results in eddy structures that form in the nearshore area with local currents that turn anti-clockwise changing in scale and magnitude as the proximity to the entrance training wall increases and the stage of the tide changes. The aerial image, presented in Figure 3.12, clearly shows the eddy shedding on northwestern side of the entrance training wall, highlighted by the suspended sediment in the water column. Model outcomes presented alongside the aerial image in Figure 3.12 indicate the broader eddy structures are replicated in the model.
Figure 3.12: Model Validation – Eddy Shedding from Training Wall on Ebb Tide. Left Aerial Image, Right: 1 October 2015 0900 modelled ebb tide level (m MSL) and flow direction (depth averaged).
One of the outcomes of the eddy formation in the nearshore area is that it will setup a very localised gradient in the velocities, where large differences in velocity magnitude can exist across comparatively short distances. This has been investigated in the model to understand if this is the cause of the very large velocity spikes in the measured record.
In Figure 3.13 the modelled velocity gradients at the AWAC location are compared to current velocity magnitude at a location 125m north. This shows the velocity magnitudes are higher than at the AWAC location and supports the theory that velocity gradients exist across this area making point comparisons of modelled and measured data highly sensitive to the exact location and model resolution. Overall, the model is representing the turbulent processes near the entrance to a similar magnitude, although the exact location of eddies and vortices differ to some of the observations. In part, the resolution of the hydrodynamic model will limit the ability to exactly replicate the eddy length scales that may be present at the site and it is computationally expensive to refine the model to a resolution that could capture those processes.
Overall, the exact locations of the eddies near the entrance to Beadon Creek is a localised phenomenon that is not a key variable in the larger scale coastal processes at the site. The model achieves very good agreement to the general trend of the measured velocity magnitude and phasing at the AWAC which provides confidence the model is accurately reproducing the overall hydrodynamics for the location.

Onslow Marine Support Base Shoreline Impacts Assessment
12636.101.R1.Rev0 Page 23
Figure 3.13: Comparison of modelled current velocity gradient at the AWAC location

Onslow Marine Support Base Shoreline Impacts Assessment
12636.101.R1.Rev0 Page 24
4. Developed Case Layout
The Stage 2 design drawings showing the concept plan as at 14 March 2017 are provided in Appendix A. Figure 4.1 indicates the key design features that have been incorporated in the design with features and dimensions summarised as follows: • a land backed wharf with land reclaim constructed from dredge spoil • a berth pocket with dimensions of 240m x 40m and dredge level of -8.0m CD • a turning circle with a 70m radius and dredge level of -6.0m CD • a navigation channel through the Beadon Creek Entrance, dredged to -6m CD, with a width of 75m at
the training wall turn narrowing to 55m through the lee side of the entrance channel entering Beadon Creek
• Batter slopes to natural levels at approximately 1V:3H • An offshore navigation channel with a width of 55m dredged to a level of -6m CD and extending
approximately 2.5km into Beadon Bay.
Figure 4.1: Marine supply Base Concept (APH170162 C-05 RevB)
The estimated dredge volume for Stage 2 is 0.93 million m3 with the preferred option to re-use the dredge spoil in land areas shown in Figure 4.2. This approach is currently being negotiated with the Shire of Ashburton.

Onslow Marine Support Base Shoreline Impacts Assessment
12636.101.R1.Rev0 Page 25
Figure 4.2: Re-use areas for Dredge Spoil (APH170162 C-06 RevC, 17 Jul 2017)
4.1 Developed Case Model Bathymetry
The dredged levels shown in the concept design were adjusted to the model datum (m MSL) and updated in the model bathymetry to define the developed case layout.

Onslow Marine Support Base Shoreline Impacts Assessment
12636.101.R1.Rev0 Page 26
5. Hydrodynamic Assessment Results
5.1 Model Reporting Locations
The model reporting locations are summarised on Table 5.1 and shown for the Beadon Creek Entrance on Figure 5.1, the central Beadon Creek section in Figure 5.2 and the lower Beadon Creek area across the tidal flats in Figure 5.3.
Table 5.1: Model Reporting Locations
Location ID Location Description
T0 – T4 Training Wall channel section
ES0 – ES2 Eastern Shoal
DE1 – DE3 Developed Case Channel
EB1 – EB4 Eastern Bank of Beadon Creek
C1-C6 Main Channel Central Beadon Creek Section
B1-B2 OMSB Berth Pocket
CK1-CK4 Beadon Tidal Creeks
M1-M4 Mangrove Areas in Beadon Creek Tidal Flats
F1-F3 Tidal Flats
Figure 5.1: Model Reporting Locations – Beadon Creek Entrance

Onslow Marine Support Base Shoreline Impacts Assessment
12636.101.R1.Rev0 Page 27
Figure 5.2: Model Reporting Locations – OMSB Site and Central Beadon Creek
Figure 5.3: Model Reporting Locations – Beadon Creek Tidal Flats

Onslow Marine Support Base Shoreline Impacts Assessment
12636.101.R1.Rev0 Page 28
5.2 Change to Beadon Creek Tidal Prism
The storage volume of Beadon Creek will increase following the Stage 2 capital dredging. Calculated from the tip of the Entrance Channel through into the OMSB site, the dredging will result in an estimated 670,000m3 of additional storage volume in Beadon creek.
The dredging will alter the tidal prism of the creek as a result of both the increased available volume and the modification to the entrance which will make the exchange of flows in and out of the entrance more efficient. The change in the tidal prism volume was assessed by analysing the inflow and outflow through the entrance channel in the existing and developed (ie dredged) scenario model. The discharge through two spring tide cycles is shown in Figure 5.4.
Figure 5.4: Modelled discharge rates for inflow and outflow through the Entrance Channel during a large spring tide.
On Figure 5.4 the outflow rate increases under the developed scenario when compared to the existing with the outflow rate increasing at the peak of the ebb tide from approximately 220m3/second to 250m3/second. On the incoming flood tide the inflow rate is largely unchanged, however the more efficient dredged channel allows the water to reach a peak discharge rate slightly earlier. The water level comparisons shown on Figure 5.4 between the existing and developed cases show the magnitude of the peak and trough remains unchanged at the entrance location. Due to the increased channel efficiency for transferring the tide in the developed case, the timing of the water level is slightly quicker in the ebb and flood for the developed case, in line with the discharge rate increases. The difference in timing of the water level at the entrance is approximately 10 minutes earlier for the developed case mid stage of the ebb and flood tide.
The difference in cumulative discharge over a full month tidal cycle for the existing and developed case was assessed in the model for the Dry Season (23/9/2015 – 23/10/2015). The results are presented in Table 5.2 and indicate approximately 100 Gigalitres of inflow to Beadon Creek and approximately 75 Gigalitres of outflow occurred for the approximate 4 week period, resulting in a negligible increase in discharge volume through the entrance under the developed case scenario. Based on this four week period, the increase to the tidal prism of Beadon Creek is approximately 1%.

Onslow Marine Support Base Shoreline Impacts Assessment
12636.101.R1.Rev0 Page 29
Table 5.2: Increase to Tidal Prism Calculation Based on one Month of modelled Tides at the Beadon Creek Entrance for the Existing and Developed Case.
Existing Developed Existing Developed % Diff Pump Volume2
Total INFLOW % Diff Total OUTFLOW % Diff Inflow-Outflow
Total (GL)1 101.2 102.1 +1% 74.8 75.6 +1% 26.4
1. 1 Gigalitre = 1 million m3 2. The salt intake pump for Onslow Salt accounts for the volume difference of Total Inflow - Outflow
It is important to remember that whilst discharge rates are increasing through the ebb tide under the developed scenario, the cross-sectional area at the entrance is larger for the developed case. A representative cross section at the entrance is shown to illustrate this on Figure 5.5.
Figure 5.5: Cross Sectional Area of Entrance Channel under pre and post-dredge condition. Levels shown from 2016 LiDAR and Bathymetry (mMSL)

Onslow Marine Support Base Shoreline Impacts Assessment
12636.101.R1.Rev0 Page 30
A calculation of the cross-sectional area for the existing and developed channel shown on Figure 5.5 (as measured below 0m MSL) indicates the cross-sectional area would increase from approximately 250m2 to 650m2. This increase in cross sectional area associated with the increased channel depth and width reduces the current velocity despite the increased peak discharge rates through the channel. Similarly, a reduction in the velocity magnitude will be expected for all reporting locations where dredging has deepened the seabed level.
5.3 Spatial Plots for Current Velocity and Direction
Modelled spatial current velocity and direction is presented for dry season ebb and flood tide to examine changes to the velocity structure and magnitude under the post development scenario.
For the peak spring flood tide case the modelled current velocity and magnitude is presented for the existing case on Figure 5.6 and on Figure 5.7 for the developed case. A comparison of the existing and developed cases in the Beadon Creek central section is shown in Figure 5.8.
The additional depth associated with the dredging reduces the current speeds through the entrance channel and central section of Beadon Creek in the flood tide conditions. It is noted that minor differences in inundation may be observed between the existing and developed cases presented on Figure 5.6 and Figure 5.7 due to the dredged entrance being more efficient at transmitting the tide in and out in the developed case as discussed in Section 5.2. In effect, the developed cases are at a moderately more advanced stage of the tide cycle.

Onslow Marine Support Base Shoreline Impacts Assessment
12636.101.R1.Rev0 Page 31
Figure 5.6: Existing case modelled depth average current speed through the Entrance Channel during a large flood tide (1 October 2015 1100 WST).

Onslow Marine Support Base Shoreline Impacts Assessment
12636.101.R1.Rev0 Page 32
Figure 5.7: Post development modelled depth average current speed through the Entrance Channel during a large flood tide (1 October 2015 1100 WST).

Onslow Marine Support Base Shoreline Impacts Assessment
12636.101.R1.Rev0 Page 33
Figure 5.8: Comparisons of depth averaged current speed through Beadon Creek entrance during a large flood tide for the existing (left) and developed (right) case (1 October 2015 1100 WST).
For the peak spring ebb tide case, the modelled changes to current velocity and magnitude is presented in Figure 5.9 for the existing case and on Figure 5.10 for the developed case. A comparison of the existing and developed cases in the Beadon Creek central section is shown in Figure 5.11.

Onslow Marine Support Base Shoreline Impacts Assessment
12636.101.R1.Rev0 Page 34
Figure 5.9: Existing condition modelled depth average current speed through the Entrance Channel during a large ebb tide (1 October 2015 0230 WST).

Onslow Marine Support Base Shoreline Impacts Assessment
12636.101.R1.Rev0 Page 35
Figure 5.10: Post development modelled depth average current speed through the Entrance Channel during a large ebb tide (1 October 2015 0230 WST).

Onslow Marine Support Base Shoreline Impacts Assessment
12636.101.R1.Rev0 Page 36
Figure 5.11: Comparisons of depth averaged current speed through the central Beadon Creek Channel section during a large ebb tide for the existing (left) and developed (right) case (1 October 2015 0230 WST).

Onslow Marine Support Base Shoreline Impacts Assessment
12636.101.R1.Rev0 Page 37
5.4 Changes to Current Velocity at Key Locations
For the model reporting locations in Table 5.1, comparisons of the pre and post development current velocities modelled through the neap - spring cycle during the Dry Season are shown below.
For the Training Wall Locations T0 to T4 the modelled current speed comparisons are shown on Figure 5.12. The depth averaged current velocities reduce by between 40 to 60% following the establishment of the deeper channel to the east of the training wall location.
Figure 5.12: Modification to flow velocities along the Training wall post construction (Spring Tide 24 Sep to 8 Oct 2015)

Onslow Marine Support Base Shoreline Impacts Assessment
12636.101.R1.Rev0 Page 38
For the Eastern Shoal Locations ES1 to ES3 the modelled current speed comparisons are shown on Figure 5.13. The modelled depth averaged current velocity remains largely unchanged between the existing and post construction scenario for location ES0. For locations ES1 and ES2 a reduction in the velocity magnitude through the peak of the spring tide is noted, whilst through the neap phase these are generally unchanged.
Figure 5.13: Modification to flow velocities on the eastern shoal post construction (Spring Tide 24 Sep to 8 Oct 2015)

Onslow Marine Support Base Shoreline Impacts Assessment
12636.101.R1.Rev0 Page 39
For the main Channel section of Beadon Creek, reporting locations C1 to C6 modelled current speed comparisons are shown on Figure 5.14. The modelled depth averaged current velocity reduces markedly following the establishment of the deeper channel for the C1, C2 and C3 locations positioned inside the dredged footprint (Figure 5.2). For the lower sections of the creek at C4, C5 and C6 there is a minor increase in the velocity magnitude post construction, through the peak spring tide currents period. There is negligible difference in current velocity magnitude during the neap phase.
Figure 5.14: Modification to flow velocities in the Main Channel of Beadon Creek Post Construction (Spring Tide 24 Sep to 8 Oct 2015)

Onslow Marine Support Base Shoreline Impacts Assessment
12636.101.R1.Rev0 Page 40
For the Beadon tidal creek branches in locations CK0 to CK4 the modelled current speed comparisons are shown on Figure 5.15. The modelled depth averaged current velocity is largely unchanged through the neap phase of the month, however during the spring tide phase the current magnitude increases in the post-development case. This is considered to be due to the increased efficiency of the entrance channel, as discussed in Section 5.2, which moves the water through the entrance more easily, with the upstream flow velocities in turn increased. The increase in current speeds in the upper creek has the potential to increase the risk of erosion in this area is examined in detail in the morphological modelling presented in Section 6.
Figure 5.15: Modification to flow velocities in the Beadon Creek Tidal Branches Post Construction (Spring Tide 24 Sep to 8 Oct 2015)

Onslow Marine Support Base Shoreline Impacts Assessment
12636.101.R1.Rev0 Page 41
For the OMSB berth pocket, the modelled current speeds under the post-development scenario are presented for reference on Figure 5.16. The current speeds through the berth pockets through the peak of the spring tide ebb are approximately 0.2ms-1.
Figure 5.16: Flow velocities during the neap-flood phase in the Berth Pocket Post Construction (Spring Tide 24 Sep to 8 Oct 2015)
For the developed case dredged navigation channel into Beadon Creek east of the training wall, velocity changes are shown for reporting locations on Figure 5.17. The current magnitude peaks at 0.2 - 0.3 ms-1 through the spring tide peak, compared to 0.6 to 0.9 ms-1 for the present seabed condition. The high pre-development velocities modelled for the locations DE1, DE2 and DE3 are due to the lower bed levels and the tidal current being directed through the edge of the channel in this area, and are similar to the magnitude modelled at the training wall locations shown on Figure 5.12.
Figure 5.17: Flow velocities during the neap-flood phase in the Main Access Channel Post Construction (Spring Tide 24 Sep to 8 Oct 2015)

Onslow Marine Support Base Shoreline Impacts Assessment
12636.101.R1.Rev0 Page 42
5.5 Submergence Curves
For the Beadon Creek upstream reporting locations, shown in Figure 5.3, the modelled water level time series information for the four week representative Dry Season period has been used to produce submergence curves. These indicate the length of time that a nominated water level occurs at a point location. The submergence curves would indicate if there is a significant change to the inundation characteristics post construction of the OMSB.
For the Salt intake location the submergence curve is presented in Figure 5.18. Post construction water levels result in minor changes to the submergence curve.
Figure 5.18: Submergence Curve for the Salt Intake location for the existing and post construction scenario
The submergence curve for the east and west Tidal Branch locations CK0 and CK4 are shown in Figure 5.19. The outcomes post construction indicate minor changes to the submergence characteristics.

Onslow Marine Support Base Shoreline Impacts Assessment
12636.101.R1.Rev0 Page 43
Figure 5.19: Submergence Curve for the east and west Beadon Creek Tidal Branches CK0 and CK4 respectively under the existing and post construction scenario
For the Mangrove location M1 and M2 on the eastern side of the Beadon Creek tidal flats the submergence curve is presented in Figure 5.20. For these locations which are located at elevations of 1.8mCD and 1.6mCD, the submergence curves indicate a slight reduction in the time submerged, and are generally unchanged between the existing and develop cases.

Onslow Marine Support Base Shoreline Impacts Assessment
12636.101.R1.Rev0 Page 44
Figure 5.20: Submergence Curve for the Mangrove Location M1 and M2 for the existing and post construction scenario

Onslow Marine Support Base Shoreline Impacts Assessment
12636.101.R1.Rev0 Page 45
6. Sediment Transport and Morphological Impact Assessment
6.1 Description of Sediment Transport Processes
Sediment transport processes acting along the shoreline at the entrance to Beadon Creek are discussed in this section. A quantitative assessment of sediment transport and sedimentation mechanisms are presented based on analysis of available information and review of previous studies. This conceptual model is then used as the basis for morphological modelling of the Beadon Creek system under the existing and developed scenario.
6.2 Shoreline Processes
6.2.1 Movement of Shoreline Position
The training wall was constructed in 1968 on the western sand spit at the entrance to Beadon Creek as shown in Figure 6.1 (Seashore, 2017). This feature has played a critical role in stabilising the entrance and reshaping the coast on the western shore.
Figure 6.1: Historical aerials showing construction of the training wall on the western sand spit at the entrance to Beadon Creek (Seashore 2017)
Following the establishment of the Beadon Creek training wall, the shoreline on the western side of the training wall has continually accreted. Shoreline position based on analysis of aerial imagery presented in MRA (2012) and Cardno (2017) is shown for the western side of the training wall on Figure 6.2. The shoreline position is indicated using the vegetation line on the foredune in the aerial imagery as a proxy for the shoreline position. On Figure 6.2 it can be seen the western shoreline has accreted between 40m and 200m over the 52 year period (1963 to 2015) through the central section, and at the training wall by approximately 320m. Following the impacts to the western shoreline associated with Tropical Cyclone Vance in 1999, the shoreline position in the vicinity of the training wall eroded by as much as 20m from its 1993 position, however these impacts showed full recovery by 2004. The rate of shoreline movement has

Onslow Marine Support Base Shoreline Impacts Assessment
12636.101.R1.Rev0 Page 46
decreased in the past 20 years and in recent aerial imagery (2004 to 2015) the vegetation line has remained largely unchanged in the shoreline adjacent the training wall. For coastal hazard risk presented in Cardno (2017), the coastal processes allowance for this section of the western shore concluded an accretion value of 2.8m annually.
Figure 6.2: Historical shoreline position on the western side of the training wall
For the eastern side of the Beadon Creek entrance, analysis of recent aerial imagery was undertaken by Baird as shown on Figure 6.3. Similar shoreline position analysis reported for the Wheatstone project is shown on Figure 6.1 (Seashore, 2017). The shoreline on the eastern shore was located further seaward from its current position in the 1966 aerial image before the training wall construction. The realignment of the coastline position is shown in the aerial images 1991 to 2015 with recent imagery showing relative stability along this section of coast. Immediately following Tropical Cyclone Vance in 1999, the shoreline vegetation line was eroded by up to 60m at the eastern side of the entrance. Shoreline recovery was noted and shown in the 2002 and 2007 aerial imagery.
Figure 6.3: Historical shoreline position on the eastern side of the training wall

Onslow Marine Support Base Shoreline Impacts Assessment
12636.101.R1.Rev0 Page 47
The eastern shoal has been a constant feature of the shoreline through the historical aerial record as shown on Figure 6.4. The feature developed following the construction of the training wall and whilst its form has been reshaped over time its footprint appears in the aerial images as generally constant over its recent history.
Figure 6.4: Eastern shoal feature shown in historical aerial 1966 to 2015

Onslow Marine Support Base Shoreline Impacts Assessment
12636.101.R1.Rev0 Page 48
Multibeam bathymetry data (DoT 2017) is shown on Figure 6.5 to illustrate the seabed levels for features around the Beadon Creek entrance and training wall. Observations of note include: • The elevation of the training wall is approximately +1mAHD with the navigation channel clearly defined
along the lee side at a depth of over -3.0m AHD. • The outer section of the eastern shoal feature is in the depth range -1mAHD to -2mAHD. The
nearshore section is at depths higher than -1mAHD which are not described by the multi-beam data. • On the western side of the training wall there is a wide shallow shoreline as a result of sediment that is
moving eastward under littoral forcing being trapped by the training wall. • The main channel is shown as the deep section (in green on Figure 6.5) running along the lee side of
the training wall. The deep navigable section of channel narrows around the tip off the training wall. Maintenance dredging has been focussed through this entrance area historically.
• A degree of ‘natural bypassing’ of the sediment from the western side of the training wall to the eastern shoal is occurring, with sediment passing across the narrow navigation channel section at the tip of the training wall being redistributed onto the eastern shoal under hydrodynamic and wave forcing.
Figure 6.5: Multi-beam bathymetry showing seabed elevation at the Beadon Creek Entrance (Datum mAHD)
On Figure 6.6, the eastern shoreline at the entrance to Beadon Creek is shown with the proposed dredge footprint overlain for reference, indicating the erosion of the shoreline and proximity of the eastern bank to the turning circle area. Of note, the aerial images in 1991, 1999 and 2001 show the impact from tropical cyclone Vance (March 1999) and the reshaping of this spit feature. In the most recent aerial imagery (2009 to 2015) the shoreline has remained stable, noting that no major cyclones have made landfall along the Onslow coast since tropical cyclone Dominic in January, 2009. The eastern shoreline will play a key role in naturally protecting the entrance channel and turning circle areas.

Onslow Marine Support Base Shoreline Impacts Assessment
12636.101.R1.Rev0 Page 49
Figure 6.6: Eastern shoreline with aerial imagery overlain with proposed dredge area footprint for years 1991, 1999 (post cyclone TC Vance), 2001, 2009 (post TC Dominic), 2013 and 2015.
1991 1999 2001
2009 2013 2015

Onslow Marine Support Base Shoreline Impacts Assessment
12636.101.R1.Rev0 Page 50
6.2.2 Aeolian Transport
Aeolian transport of sediment (carried by the wind) is occurring along the Onslow shoreline, with sediment moved in an eastward direction under the prevailing wind direction, evidenced by site photos and anecdotal information of sediment along the crest of the training wall. It is likely this sediment is then deposited into the Beadon Creek channel directly through either wind forcing or carried into the entrance from the training wall crest in large flood tides.
6.2.3 Littoral Transport
The DHI LITDRIFT model was used to investigate the potential for littoral transport along the western shoreline for Onslow. A description of the model from DHI 2014 is provided in the following paragraphs.
The LITDRIFT model is a comprehensive deterministic numerical model which is part of the DHI LITPACK suite. The model is used for describing longshore current and littoral drift along a uniform beach with arbitrary coastal profile and consists of two major parts: • a hydrodynamic model • a sediment transport model, STP
The hydrodynamic model includes a description of propagation, shoaling and breaking of waves, calculation of the driving forces due to radiation stress gradients, momentum balance for the cross-shore and longshore direction giving the wave setup and the longshore current velocities. The model can be applied on complex coastal profiles with longshore bars. In the case of a longshore bar the broken waves can reform in the trough onshore of the bar. The waves can be treated as regular or irregular, and the effect of directional spreading can be included in the description. It is assumed in the model that the conditions are uniform along the straight coast. Having computed the longshore current - by the hydrodynamic module - points are selected which are representative for the littoral drift.
The sediment transport calculations carried out by the STP-module, are made to reflect the local conditions with respect to the energy dissipation, the percentage of non-breaking waves and the ‘rms’ of the wave heights (Deigaard et al., 1986). The total sediment transport is dominated by transport contributions from areas where wave breaking occurs. The point selection procedure therefore gives preference to points in this area. In case of a bar-profile, the sediment calculation points will thus be located on the bars where waves are breaking. This gives the distribution of sediment transport across the profile, which is integrated to obtain the total longshore sediment transport rate. By considering the variation on the hydrodynamic climate (e.g. the yearly wind, wave, tide, storm surge and profile conditions), it is possible to determine the net/gross littoral climate at a specific location (sediment budget). Important effects such as the linking of the profile to the wave climate, the wave climate to the storm surge and the variation in sediment properties across the profile are included.
For the Onslow location, a cross shore profile based on the LiDAR and multi-beam data was setup for a section of the shoreline approximately 1km west of the training wall as shown on Figure 6.7. Measured AWAC data for a one year period (wave height, wave period and direction) was applied in the model to assess the potential alongshore transport rates. Sediment characteristics in the model were based on sediment samples measured on the shoreline.
The model results are shown in Figure 6.7 and indicate the potential alongshore transport rate is 45,000m3 in an eastward direction annually. It is noted that this is the potential rate of transport assuming alongshore profile uniformity and infinite sand supply availability. The results on Figure 6.7 show that sediment transport is largely concentrated in the active wave breaking zone approximately -1.5mMSL to 0mMSL on the profile.

Onslow Marine Support Base Shoreline Impacts Assessment
12636.101.R1.Rev0 Page 51
Figure 6.7: Littoral transport modelling for the western shoreline using the LITDRIFT model.
The LITDRIFT result compares well to transport rates reported in DHI (2012) for the Wheatstone project for similarly north to north-east aligned coastlines which indicated potential transport rates of 50,000m3 to 75,000 m3 annually. Similarly, Damara 2010 estimated the total littoral drift in the range 35,000m3 to 85,000 m3 per annum eastwards for the Onslow shoreline west of the training wall. The large ranges in transport potential are attributable to cross shore profile alignment and the time period (metocean forcing) that is considered.
LITD
RIF
T Pr
ofile

Onslow Marine Support Base Shoreline Impacts Assessment
12636.101.R1.Rev0 Page 52
6.2.4 Estimation of Sediment Volume Trapped on the Western Side of Beadon Creek Training Wall
Using methods described in Kamphuis (2010), the accretion rate on the western shoreline was assessed, to estimate what proportion of the eastward bound sediment is trapped on the western side of the training wall annually. The Kamphuis method uses a cross shore profile assessment to estimate the volume change across the profile as the shoreline moves seaward. Local inputs describing wave conditions and sediment size (D50) were applied to determine the equilibrium beach profile and closure depth. Shoreline volume changes were estimated by integrating the area below the accreting shoreline to the closure depth.
Figure 6.8: Schematic of Cross Shore Profile Analysis based on the equilibrium profile concept in Kamphuis (2010)
The LiDAR data captured along the western side of the training wall was analysed for the period 2010 to 2016 to quantify the change at the shore with the volume of seaward accretion based on the movement of the 0mAHD contour in the two datasets, as shown on Figure 6.9. The section of beach over which progradation of the shoreline has been observed (extending approximately 1km west of the training wall) was analysed across 10 transects showing the annualised rate of change to be 2m on average. The results from this analysis are summarised on Table 6.1.
Applying the equilibrium profile method for the calculated shoreline changes, the progradation of the shoreline area accounts for approximately 2,700m3 of sediment annually. This only accounts for the area below the 0mAHD contour extending offshore to closure depth. Changes to the upper beach area were assessed through analysis of the LiDAR datasets to examine the volume change between surveys and showed that from 0mAHD up to the approximate berm level of 1.5mAHD there was on average 1,800m3 of sand accretion annually.
In total, it is estimated that the training wall trapped approximately 4,500m3 of sediment on its western side annually over the six-year period 2010 to 2016. This compares with the estimated range presented in Damara (2010) of between 5,000m3 and 10,000m3 of annual accretion, noting there appears to have been a reduction in the rate of shoreline accretion in this section of coast in recent years based on the historical shoreline positions presented in Figure 6.2.

Onslow Marine Support Base Shoreline Impacts Assessment
12636.101.R1.Rev0 Page 53
Table 6.1: Shoreline changes west of training wall - transect analysis 2010 to 2016 LiDAR
Transect 2010-2016 Change Annual Rate Change Distance Between Transects (m) 0 0 0 0
1 7.8 1.3 100
2 8.2 1.4 100
3 9.8 1.6 100
4 10 1.7 100
5 13.1 2.2 100
6 13.6 2.3 100
7 14.5 2.4 100
8 16.9 2.8 100
9 12.1 2.0 100
10 0 0.0 65
Figure 6.9: Assessment of shoreline change based on 2010 and 2016 LiDAR
6.2.5 Beadon Creek Tidal Flats - Creeks and Runoff
There is the potential for sediments in the tidal flats of the upstream tributaries of Beadon Creek to be mobilised under large runoff events and extremely high water levels (e.g. large spring tides and storm surge events). Whilst the availability of sediment supply in these large events has been greatly reduced by the reduction in the upstream catchment area following the construction of the Onslow Salt operations, there still exists a potential for erosion and sedimentation of fine sediments during these extreme events.

Onslow Marine Support Base Shoreline Impacts Assessment
12636.101.R1.Rev0 Page 54
6.2.6 Conceptual Summary of sediment transport processes
The shoreline processes discussed in this section are shown conceptually on Figure 6.10, with the locations targeted in historical maintenance dredging also indicated (refer Figure 2.4).
Figure 6.10: Conceptual summary of sediment transport
6.3 Sediment Transport Model
The sediment transport modelling approach follows on from the conceptual model of the sediment transport mechanisms discussed in Section 6.2 and presented in Figure 6.10.
The model examines sediment transport by considering sediment components within two categories: 1. The sand fraction which represents sediment sizes in the range 0.1mm to 0.4mm (100-400µm) 2. Fine sediments represented by clay, silt and coarse silt in the (4-55µm)

Onslow Marine Support Base Shoreline Impacts Assessment
12636.101.R1.Rev0 Page 55
Historical aerial imagery from the Beadon Creek entrance can be used to illustrate the fine sediments and sand fractions. In Figure 6.11 the eastern shoal is shown at mid-tide with reworking of the sand fractions occurring at the seabed under wave action and tidal current induced shear stresses. On Figure 6.12 the presence of fine suspended sediments in the water column is evident by the turbidity in the water column.
Figure 6.11: Example of sand fractions at the Beadon Creek entrance (image 2013)
Figure 6.12: Example of suspended fine sediments at the Beadon Creek entrance (image 1991)

Onslow Marine Support Base Shoreline Impacts Assessment
12636.101.R1.Rev0 Page 56
6.3.1 Sediment Transport Model Description
Sand Fraction – TRANMOR (2004) model
The Delft3D Online Sediment model has been applied in the sediment transport investigations to investigate the sediment transport and morphology changes from both sand and fine sediments. For the sand faction, the TRANMOR 2004 sediment transport model for non-cohesive sediments has been applied. This sand transport model has been documented recently in van Rijn (2007) and van Rijn et al (2007). The TR2004 model is significantly more accurate and robust compared to earlier sediment transport models. The key changes in the TR2004 model, compared to earlier transport models such as the van Rijn 1993 model, are associated with: • Bed roughness; • Bed forms; • Wave-induced transport; and • Reference concentration above the seabed.
Delft3D and the TRANMOR 2004 model has been used in a number of entrance and channel morphology studies over the last ten years including well validated models that have been developed for dynamic entrances with wave-current interactions. Two such studies of note, with publicly available reports, include the Brisbane Water (NSW) estuary processes study the Lake Illawarra Entrance Study. At Lake Illawarra, revalidation of the Deflt3D entrance morphological model using the TR2004 sediment transport model demonstrated substantially improved agreement between modelled and measured entrance morphological changes (Taylor et al, 2008). The model system was also applied in the coastal processes investigations for the Port Hedland Outer Harbour project.
In this study, bed roughness due to bed forms was included in the sediment transport and hydrodynamic model processes. The bed form roughness model is based on van Rijn (1993). A spatial sediment grain size description was also included in the model.
Fine Sediment Modelling
Fine sediments were modelled using the Partheniades-Krone formulations (Partheniades, 1965) for cohesive sediment. This model calculates the sediment fluxes between the water phase and the bed. The Partheniades-Krone formulations require the specification of the critical shear stresses for erosion and sedimentation, the maximum erosion rate and a hindered settling velocity. A review of van Rijn (2006) was undertaken to define the critical shear stress and maximum erosion rate for the defined silt fractions. Fall velocities were based on the sediment fraction particle size and adopted from appropriate literature Table 6.2. Critical shear stresses were adopted from literature (i.e. van Rijn 2006) and adjusted during model calibration. The critical shear stress for erosion was specified as 0.2 N/m2 and the critical shear stress for deposition was specified as 0.06 N/m2. Flocculation is not a significant process when suspended sediment concentrations are low, and salinity variations are minimal.
Table 6.2: Three Fine Sediment Fractions Parameters
Sediment Fraction
Nominal Particle Size Composition
Critical Shear Stress – Erosion
Ƭcr,e (N/m2)
Fall Velocity – Stokes
Law (mm/s)
Modelled Dry Bed Density
(kg/m3)
Clay 4µm 33% 0.2 0.004 400
Fine Silt 20µm 33% 0.2 0.06 900
Coarse Silt 55µm 33% 0.2 1.7 1100

Onslow Marine Support Base Shoreline Impacts Assessment
12636.101.R1.Rev0 Page 57
6.3.2 Sediment Transport Model Hydrodynamic and Wave Validation
A representative year is evaluated in the sediment model applying the dry season and wet season periods discussed in Section 3.4. The model evaluates sediment transport over a 4-week period for each of the seasonal conditions and results are adjusted using a morphological factor in Delft3D so that the overall outcomes represent a one year period.
Further to the hydrodynamic model validation presented in Section 3.4 , a comparison of the measured and modelled dry season and wet season conditions for waves, winds and atmospheric pressure is presented on Figure 6.13 and Figure 6.14.
The comparisons show that the model agreement to the measured data is generally good for wave conditions, with modelled wave heights moderately higher than the AWAC measured wave height. The peak period comparisons show variability, and it is noted that the derivation of this parameter is subject to differing interpretations in the AWAC instrument and model, with the general range for peak period noted as being consistent across the measured and modelled data. Wind conditions and atmospheric pressure are represented well in the model when compared against the measured data.
Figure 6.13: Dry season comparison of measured and modelled wave, wind and atmospheric pressure conditions

Onslow Marine Support Base Shoreline Impacts Assessment
12636.101.R1.Rev0 Page 58
Figure 6.14: Wet season comparison of measured and modelled wave, wind and atmospheric pressure conditions
6.3.3 Sediment Transport Model Sediment Size
Sand Fractions
A spatial map of sediment grain size was developed for the sediment transport model based on sediment sampling results from Beadon Creek and nearshore (Figure 3.2). The sediment samples are shown on Figure 6.15 with median sediment sizes (D50 values) shown as generally increasing inside Beadon Creek when compared with the nearshore area of Beadon Bay outside the entrance. The sediment size in the navigation channel through the entrance is high in comparison to other areas, with sediment sizes on Figure 6.15 shown in the range 0.33mm to 0.42mm likely due to scouring of this section.
Sediment sizing is the modelled spatial map adopts a range of sediment sizes varying from 0.225mm in the nearshore areas of Beadon Bay to 0.30mm inside Beadon Creek.

Onslow Marine Support Base Shoreline Impacts Assessment
12636.101.R1.Rev0 Page 59
Figure 6.15: Results for sediment size (D50, mm) at sampling locations in the Entrance Channel (O2 2017) used for the discretisation in Delft3d Model Map of variable sediment size.
Fine Sediments
The suspended fine sediment fractions in the model have been determined by examining turbidity measurements in the Onslow region for NTU and correlating these to a suspended sediment value (TSS).
The Wheatstone Baseline Reporting (Chevron, 2013) reported baseline NTU values (Nephelometric Turbidity Units) for seasonal periods across several sites over a two-year period from May 2011 to April 2013.

Onslow Marine Support Base Shoreline Impacts Assessment
12636.101.R1.Rev0 Page 60
Two sites reported in the Wheatstone data were selected within the Delft model domain to describe NTU values nearshore and offshore for input to D-FLOW Model Boundary as follows: • Inshore: Ward Reef
• Offshore: Weeks Shoal
The selected locations are indicated relative to the Sediment transport model domain in Figure 6.16 and the outcomes from the baseline monitoring summarised in Table 6.3.
Figure 6.16: Baseline monitoring locations for NTU (Wheatstone 2013) shown relative to the Delft-FLOW model boundaries.
Table 6.3: Baseline monitoring locations for turbidity within the model domain (Wheatstone 2013)
D3D Model BND
D3D Model Season
Wheatstone Season
NTU P20
NTU Median
NTU P80
Ward Reef Inshore Wet Summer 1.3 2.3 4.7
Ward Reef Inshore Dry Spring 1.1 1.8 2.8
Weeks Shoal Offshore Wet Summer 0.9 1.4 2.5
Weeks Shoal Offshore Dry Spring 0.7 1 1.3
The process to apply the measured values in Table 6.3 to the model boundaries is summarised as follows: • NTU was converted to TSS by adopting 1NTU = 1mg/L (1mg/L = 0.001 kg/m3)
• The NTU value was divided between the three sediment fractions equally (Silt, Fine Silt, Clay)
• A time series file for each model boundary was defined to reproduce the statistics for the P20, P50 and P80 values within each respective seasonal period (dry / monsoon).
6.3.4 Sediment Transport Model Results – Sand Fractions The sediment transport model was run for the representative monsoon and dry seasons and the outputs combined to produce the sediment transport results, which are representative of a year exclusive of longshore drift. The modelled sedimentation rates for the existing Beadon Creek case have been quantified within the channel sections that were reported in Oceanica (2014). The modelled results are compared against two historical sedimentation rate estimates: 1. Estimate 1: The 2012 pre-dredge assessment of annual sedimentation within each channel section in
the period following the dredging campaigns of 1999 and 2002 (Oceanica, 2014).
Weeks Shoal
Wards Reef

Onslow Marine Support Base Shoreline Impacts Assessment
12636.101.R1.Rev0 Page 61
2. Estimate 2: Recent multibeam survey of Beadon Creek (DoT, 2016) was analysed to estimate the bed level changes that have occurred in the period following the maintenance dredging campaign completed in 2012-2013 (based on target design depths of that campaign).
The channel sections that are used for the analysis are shown on Figure 6.17.
Figure 6.17: Channel sections analysed for bed level changes (Oceanica, 2014)
The model results are shown in Figure 6.18. The historically observed sedimentation rates within each of the channel sections is presented in Table 6.4 compared against those derived from the modelled outcomes as shown in Figure 6.18.

Onslow Marine Support Base Shoreline Impacts Assessment
12636.101.R1.Rev0 Page 62
Figure 6.18: Sand fraction modelled annual erosion and sedimentation for the existing case. Outer channel (upper) and inside Beadon Creek (lower) areas with channel sections overlaid.
N
N

Onslow Marine Support Base Shoreline Impacts Assessment
12636.101.R1.Rev0 Page 63
Table 6.4: Annual Sedimentation Rates (m3/yr) for Channel Sections – Historical vs Modelled
No. Description Design Depth Estimate 1 1 Estimate 2 2 Modelled
Estimate 3
1 Bell Mouth -1.6mCD 510 250 370
2 Bell Mouth Silt Trap -1.6mCD 2240 1570 4 320
3 Outer Entrance Channel -1.6mCD 60 10 190
4 Mid Entrance Channel A -1.6mCD 1190 270 5 440
5 Mid Entrance Channel B -1.6mCD 30 10 10
6 Inner Entrance Channel A -1.6mCD 40 10 30
7 Inner Entrance Channel B
-1.6mCD – 1.9mCD 20 0 20
8 Basin -2.2mCD to -2.6mCD 870 6 125 490
9 Cyclone Moorings Varies 7 620 - 310
10 Basin Silt Trap -1.5mCD 130 25 200
TOTAL 5700 2270 2160
Notes
1. Estimate 1: 2003 to 2012 Average Annual Sedimentation calculated from rates reported in Oceanica 2014
2. Estimate 2: 2012/13 to 2016 Average Annual Sedimentation calculated from changes to post dredging seabed depth (Oceanica 2014) and analysis of 2016 multibeam data (DoT 2016)
3. Modelled Annual Sedimentation Existing Case (Baird sediment transport model)
4. Bellmouth area is not completely described by the 2016 LiDAR data. Approximately 30% of the eastern side is not captured in the LiDAR
5. Dredging occurred for the nearshore berth adjacent the Mid Channel Section during this time period and may have impacted dredge volumes and / or creek dynamic in this section
6. Basin area was dredged in 1999 campaign, but not in 2003. Assessment based on 13 years
7. The design / target depth was not determined for the Cyclone Moorings in Oceanica 2014 so calculations from the LiDAR data were not completed

Onslow Marine Support Base Shoreline Impacts Assessment
12636.101.R1.Rev0 Page 64
For the comparisons shown in Table 6.4 and presented in Figure 6.18 the model is considered to provide a reasonable representation of the sedimentation with the following points noted: • Each sedimentation estimate is based on a different time period and therefore a result of different
hydrodynamic forcing conditions. Further, the modelled result is equivalent to a single representative year (from two seasonal month simulations) and will therefore not account for longer term seasonal and inter-annual variability.
• The eastern shoal is an active area with constant reworking under wave and tidal action causing localised erosion and deposition. Eroded sediment at the western side of the shoal is deposited at the channel margins of the existing navigation channel and mobilised to the Bell Mouth area and Silt Trap. The Bell Mouth sedimentation rate (370m3) compares well to historical records. Lower deposition in the Bell Mouth Silt Trap (320m3) than historically observed is considered due to the longshore transport not being considered in the modelled assessment. The longshore transport contribution is examined in sections to follow;
• For the Outer Channel Entrance area (Section 3) the model shows higher sedimentation in this region (190m3) than has been historically noted. The model has made assumptions on sediment size in this region which directly influence the erodibility of the seabed, and corresponding deposition in the Outer Channel Entrance area. The sedimentation in the Outer Channel entrance is close to the Bell Mouth area and overtime would likely mobilise in large spring tide ebb currents through the channel and be directed into the Bell Mouth;
• For the Mid Entrance Channel A (Section 4) the modelled rate of annual sedimentation of 440m3 is within the range of sedimentation values observed in this section of Beadon Creek historically;
• For the central Beadon Creek sections (Sections 5, 6 and 7) there is very minor sedimentation noted in the historical data, and this is also observed in the modelled results in these sections (10m3, 30m3 and 20m3 respectively);
• In the Basin area (Section 8) the modelled annual sedimentation rate of 490m3 compares well to the historical range of 125m3 to 870m3;
• In the Cyclone Moorings (Section 9) the modelled annual sedimentation rate of 310m3 is lower than the historical rate of 620m3, however the modelled outcome is considered a reasonable description of the magnitude of sedimentation in this region noting the influence of seasonal and inter-annual variability on the comparisons; and
• Modelled sedimentation in the Basin Silt Trap (Section 10) is higher than historical rates, however the modelled outcome is considered a reasonable description of the processes occurring in this section of Beadon Creek. It is noted the upstream bathymetry of Beadon Creek tidal creeks was estimated in the model as site specific data was unavailable and this may influence erosion and sedimentation outcomes.
For the developed case, the modelled outcomes for the dredged footprint area are examined in four sections: 1. Offshore navigation channel (section extends to offshore limit) 2. Approach Bend Around Training Wall 3. Inner Entrance Channel 4. Turning Circle and Berth Areas
The sections are shown on Figure 6.20, with modelled outcomes presented on Figure 6.19 and a summary of the sedimentation rates in each of the sections for the modelled case shown in Table 6.5.

Onslow Marine Support Base Shoreline Impacts Assessment
12636.101.R1.Rev0 Page 65
Figure 6.19: Sand fraction modelled annual erosion and sedimentation for the developed case. Outer channel (upper) and inside Beadon Creek (lower) areas with channel sections overlaid
N
N

Onslow Marine Support Base Shoreline Impacts Assessment
12636.101.R1.Rev0 Page 66
Figure 6.20: Channel sections analysis regions for developed case
Table 6.5: Annual Sedimentation rates (m3/yr) for Developed case dredged footprint areas
No. Description Design Depth Modelled Annual Sedimentation
Developed Case
1 Offshore Navigation Channel -6mCD 2,160
2 Approach Bend Around Training Wall -6mCD 1,870
3 Inner Entrance Channel -6mCD 470
4 Turning Circle and Berth Areas -6mCD to -8mCD
1,290
Total 5,790
Under the developed case the modelled sedimentation total in the dredged footprint is estimated as 5,790m3 annually. The following points are noted of the outcomes presented on Figure 6.19 and Table 6.5: • The sediment that is eroded and deposited on the dredged batters is expected to move into the deeper
dredged areas over time. This material has been included in the total dredge volumes presented on Table 6.5;
• The highest sedimentation area is predicted to be the offshore navigation channel with just over 2,000m3 of sedimentation annually. This volume is accumulated in Section 1 across approximately 1.5km of the offshore channel length with sedimentation depth in the range 0.05 to 0.1m annually;
• The approach bend around the training wall (Section 2) shows sedimentation of approximately 1,870m3 annually. Sedimentation modelled on the inside of the bend of the channel adjacent the training wall is shown on Figure 6.19 with maximum deposition of 0.3m at the channel edge reducing to 0m towards the channel centreline, noting that this does not include sedimentation effects from longshore transport discussed in sections to follow (Section 6.3.6).
2
3 4
1
N

Onslow Marine Support Base Shoreline Impacts Assessment
12636.101.R1.Rev0 Page 67
• Five cross sections through the Section 2 approach channel bend are shown in Figure 6.21: Modelled sedimentation for cross sections through the channel approach (section 2) to illustrate the distribution of modelled sedimentation across the dredged channel. Sedimentation is highest at the channel margin and reduces moving into the centre of the channel. At cross section 1 the sedimentation depth is 0.4m on the western edge of the channel batter, 0.3m at the channel toe reducing to 0m into the channel across approximately 40m.
Figure 6.21: Modelled sedimentation for cross sections through the channel approach (section 2)
• There is approximately 470m3 of sedimentation modelled in the inner entrance channel section (Section 3) which is largely deposited on the channel batter slopes;
• At the lower section of the dredged footprint in Beadon Creek (Section 4) the turning circle area is not impacted by sedimentation from sand fractions. However, the sharp transition from design depths to the existing bed depth in the central creek area results in a constriction in tidal flows and results in scour of the existing bed in the shallower existing creek and deposition in the adjacent deeper dredged areas, which includes the berth pocket. A maximum modelled sedimentation of 0.4m is estimated, focussed on the south east corner of the berth pocket area, adjacent to the transition from shallow existing bed levels to deeper design depths. This transition feature is shown in Figure 6.22 where the developed case footprint is overlain the LiDAR data from March 2017 (DoT 2017). For the southern side of the dredged footprint the depths of the existing seabed fall from approximately -2mCD to -8mCD on the western side and from approximately -2mCD to -6mCD on the eastern side. The transition of depth through this section results in high shear stresses at the seabed in the developed case through the spring flood and ebb tide as the flow constricts through this area. This section of channel experiences seabed changes from the dredged depth up to the ‘natural’ creek level and was shown to experience a minor increase in current speed in the developed case (refer Figure 5.2) which results in reworking of the bed levels in this section. The tidal current induced shear stress at the bed erodes material which is then mobilised and redeposited in the surrounding areas, predominantly the lower section of the dredged footprint, with some material likely deposited in the Basin area. This erosion/sedimentation process is likely to reduce over time as the bathymetry adjusts to new hydrodynamic regime.

Onslow Marine Support Base Shoreline Impacts Assessment
12636.101.R1.Rev0 Page 68
Figure 6.22: Depth transition through from the lower section of the dredged footprint to the existing seabed level of Beadon Creek (levels shown to mCD).
For the lower section of Beadon Creek, south of the dredging footprint, the sedimentation under the developed case is presented in Table 6.6. For reference, equivalent sedimentation rates for the existing case previously shown in Table 6.4 are also provided.
In general the sedimentation rates increase in this lower section of Beadon Creek when compared to the existing case, with increased current speeds in the ebb tide leading to higher bed shear stresses, which drive erosion and associated deposition increases. This erosion/sedimentation process is likely to reduce over time as the bathymetry through the transition area (shown in Figure 6.22) adjusts to the new hydrodynamic regime. As this process occurs the sedimentation rate is expected to move within the historical range.
Design Depth -6m CD
Design Depth -8m CD

Onslow Marine Support Base Shoreline Impacts Assessment
12636.101.R1.Rev0 Page 69
Table 6.6: Sedimentation rates (m3/yr) for developed case in lower Beadon Creek
No. Description Design Depth
Historical Range of Annual
Sedimentation
Modelled Annual Sedimentation Existing Case
Modelled Annual Sedimentation
Developed Case
5 Mid Entrance Channel B -1.6mCD 10 - 30 10 10
6 Inner Entrance Channel A -1.6mCD 10 - 40 30 360
7 Inner Entrance Channel B
-1.6mCD – 1.9mCD 0 -20 20 40
8 Basin -2.2mCD to -2.6mCD 125 - 870 490 940
9 Cyclone Moorings Varies 4 620 310 660
10 Basin Silt Trap -1.5mCD 25 - 130 200 330
TOTAL 1710 1060 2340
For the sedimentation rates presented in Table 6.6 it is noted: • The sedimentation comparison for the Mid Entrance Channel B (Section 5) is generally consistent with
the existing case outcomes. • For the Inner Entrance Channel A (section 6) the sedimentation is higher in the developed case
(360m3 vs 30m3). The reshaping of the seabed through the transition section at the southern side of the dredged footprint previously discussed accounts for the observed difference in sedimentation for this region. As stated previously, this is likely to stabilise over time;
• Sedimentation in the Basin area is modelled at 940m3 which is higher than the existing case, but comparable with the upper range of previous annual sedimentation rates reported for this section (125m3 to 870m3). The increase in sedimentation in the Basin is partly the result of increases in current speed in this section and the reshaping of the natural bed level under increased shear stresses, with some sediment likely originating from the eroded material at the transition of the dredged footprint area previously discussed;
• Modelled sedimentation in the Basin Silt Trap (Section 10) increases from 200m3 to 330m3 annually, with increases in current speeds in the developed case and associated increased bed shear stresses being the likely driver of this increase.
6.3.5 Sediment Transport Model Results – Fine Sediment Fractions
The modelled outcomes for the fine sediment fractions for the existing and developed case over a one year period is shown in Figure 6.23, with a closer view of the OMSB footprint provided on Figure 6.24. The model applies suspended sediments as boundary conditions defined for the three fine sediment categories outlined in Table 6.3, with an allowance at the seabed for erosion of fine material locally. Shear stresses acting through the domain erode fine material from the seabed areas, with mobilised material transported

Onslow Marine Support Base Shoreline Impacts Assessment
12636.101.R1.Rev0 Page 70
under the hydrodynamic forcing through the water column and then deposited in more tranquil regions (i.e. deep channels and protected areas). The following is noted for the modelled fine sediment: • Within the OMSB dredged footprint area the total volume of fine sediment accumulation annually is
approximately 7500m3 • All navigation areas in the development footprint are likely to experience sedimentation of fine
materials (< 64um), at a rate of up to 0.1 m per year. This material may be redistributed away from areas where propeller wash or vessel induced flows can mobilise fine materials in low tide conditions.
• Sedimentation in the existing case shown in Figure 6.23 for Beadon Creek and the lower tidal creeks is concentrated at the edges of the waterway. There is a minor reduction in the sedimentation rate noted in the lower tidal creeks for the developed case, likely as a result of the slightly elevated spring tide current speeds in this area reported in Figure 5.15.
Figure 6.23: Fines Accumulation – total annual sedimentation for Existing Case (left), Developed Case (right)

Onslow Marine Support Base Shoreline Impacts Assessment
12636.101.R1.Rev0 Page 71
The suspended sediment concentration in the water column during the modelled scenarios were compared against the target conditions defined by the measured values reported in Chevron (2013) and discussed in Section 6.3.3. The comparison showed that the modelled suspended sediment concentration at the entrance to Beadon Creek was higher than the boundary levels, a consequence of the model having eroded fine material from the local seabed which is then suspended in the water column and redistributed. Whilst allowing areas of the seabed to erode in the model is based on replicating the natural coastal processes, this is achieved at the cost of higher rates of suspended sediments than would be the case under the target TSS levels. It is noted that baseline water quality monitoring for Wheatstone (MSC 2009) reported a higher NTU to TSS relationship (TSS = 2.04+1.07*NTU) than adopted for the model boundaries in this study. Because the modelled suspended sediment concentration in the water column at the OMSB site is dominated by the local erosion of fine material, adopting this higher NTU to TSS conversion from would not impact the reported sedimentation volumes.
In conclusion, it is expected the annual sedimentation results for the fine sediment presented are likely higher than would be experienced in practice and should be considered an upper bound.
Figure 6.24: Fines Accumulation – total annual sedimentation for Channel Entrance and OMSB area
6.3.6 Sediment Transport Model Results – Longshore Transport Bypassing
Modelling of longshore transport (littoral drift) has been considered separately in the modelling investigations. The longshore transport rate is outlined in Section 6.2.3 and in summary this process directs sediment in a generally eastward direction under the prevailing wave conditions. There is a ‘natural bypassing’ of the sediment across the present Beadon Creek channel which directs the sediment around and over the eastern shoal ultimately feeding the shoal feature and the eastern shoreline. For the

Onslow Marine Support Base Shoreline Impacts Assessment
12636.101.R1.Rev0 Page 72
developed case, it is expected that the ability to naturally bypass sediment will be inhibited due to the reduction of velocities and seabed shear stresses through the deeper wider channel.
To assess the natural bypass mechanism of the existing channel, the sediment transport model adopted a sediment discharge node located on the north-western tip of the breakwater, with a fixed rate of sediment volume, to replicate the annual littoral bypass rate of the breakwater. The bypass sediment volume was then tracked through the model domain to investigate the sediment pathways and the resulting distribution of sediment deposition. For these simulations seabed morphology was not activated in the model, so that the longshore transport bypass process could be examined in isolation.
Simulations were run for 1 month of dry and monsoon season conditions and results proportionally combined and shown in Figure 6.25 as the distribution of this bypass volume. The modelled outcomes indicate the sediment is redistributed through the model under the forcing conditions along four general pathways summarised in Table 6.7.
Table 6.7: Summary of littoral transport pathways and driving mechanisms
Pathway General Forcing Mechanism
Into Lee (Eastern) Side of Breakwater
Easterly directed wave action. Once in the lee of breakwater the sediment either falls: • into the navigation channel at the Bell Mouth
and then may be subject to tidal current resuspension
• in the lee of the breakwater structure where tidal and wave stresses are minimal and deposition occurs
Around Eastern Shoal
Sediment at the bed subjected to high spring tide and flood tide velocities is mobilised and directed eastward under associated wave forcing. Sediment can move onto the shoal directly on the eastern side, but is predominantly directed around the northern deeper section of the shoal, and continues all the way to the eastern shoreline under wave forcing down the eastern side of the shoal.
Into Beadon Creek Entrance
A small amount of the sediment that is deposited in the navigation channel and shoal margins is resuspended in spring flood tides and directed into Beadon Creek where sedimentation will occur in areas of low bed shear stress.
Redistributed Westward
Under certain wave forcing conditions, the prevailing longshore transport direction reverses and sediment is moved back to the west. Additionally, material that is driven westerly on a strong ebb tide out of the range of the eastern shoal natural bypass mechanism may occur. The sediment will eventually be redirected back eastward with the prevailing littoral transport direction.
The existing case modelled results are shown in Figure 6.25. While the limitation in describing the long-term littoral transport processes with a one month simulation is noted, the outcomes in Figure 6.25 clearly

Onslow Marine Support Base Shoreline Impacts Assessment
12636.101.R1.Rev0 Page 73
demonstrate the four sediment pathways. The natural bypass mechanism as sediment is transported around the eastern shoal along its northern extent and onto the eastern shoreline is evident. There is a concentration of sedimentation on the lee of the breakwater in the bell mouth, silt trap area and adjacent the training wall. Westward redistribution of sediment is also observed.
Figure 6.25: Distribution of Littoral Drift Volume that Bypasses the Training Wall Structure under existing conditions
To examine the impacts to the natural bypass mechanism in the developed case, the sediment transport model was applied to the developed case that included the dredged channel footprint. The resulting sediment transport distribution are presented in Figure 6.26, and show that the impact of the dredged
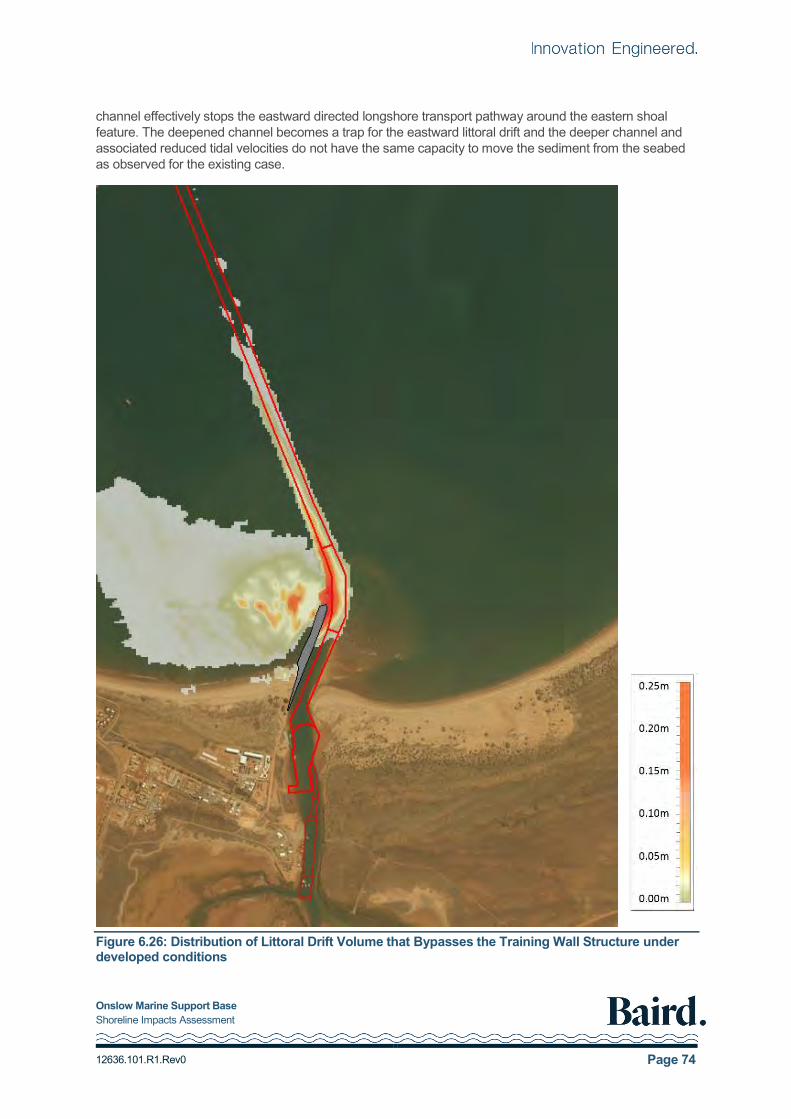
Onslow Marine Support Base Shoreline Impacts Assessment
12636.101.R1.Rev0 Page 74
channel effectively stops the eastward directed longshore transport pathway around the eastern shoal feature. The deepened channel becomes a trap for the eastward littoral drift and the deeper channel and associated reduced tidal velocities do not have the same capacity to move the sediment from the seabed as observed for the existing case.
Figure 6.26: Distribution of Littoral Drift Volume that Bypasses the Training Wall Structure under developed conditions

Onslow Marine Support Base Shoreline Impacts Assessment
12636.101.R1.Rev0 Page 75
A comparison of the modelled sediment volumes for the existing and developed cases is summarised on Table 6.8, indicating the proportion of sediment volume that is directed through each of the sediment pathways discussed in Table 6.7.
Table 6.8: Littoral Transport Sediment Deposition Summary
Pathway Existing Developed
Lee Side of Breakwater 37%
28% Bell Mouth and Silt Trap
9% Training Wall at Channel Margin
83%
5% Section 1 Channel Offshore
54% Section 2 Channel Turn
24% Training Wall at Channel Margin
Around Eastern Shoal 48% 0%
Southwards into Beadon Creek 1% 0%
Westwards Redistribution 14% 17%
The following is noted: • the volume of sediment transported around the eastern shoal reduces from 48% in the existing case to
0% in the developed case as the deeper wider channel effectively traps all eastward bound sediment; • for the existing case 37% of the sediment is trapped in the areas on the lee side of the breakwater,
with the majority in the Bell Mouth and Bell Mouth Silt Trap areas (28%) and a smaller proportion (9%) deposited at the section between the training wall and entrance channel, which may move into the navigation channel over a longer time period;
• for the developed case, 83% of the total sediment volume is trapped between the training wall and the eastern side of the dredged channel. This sedimentation volume is predominantly in the dredged channel area of Section 2 (54%) with the offshore section of the channel (Section 1) accumulating 5% as sediment trapped in the deeper dredged channel section redistributed northwards. In the lee of the training wall between the training wall and western edge of the dredged channel, 24% of the sedimentation volume accumulates and this would be likely to move east and into the deeper channel over time
• westward redistribution is largely consistent between the existing and developed cases (14% existing compared with 17% developed) with the marginally higher developed case outcome likely due to the deeper channel of the developed case influencing the approach angle of waves at the training wall tip;
• for the existing case, approximately 1% of the overall sediment volume is transported through the Beadon Creek entrance and distributed inside Beadon Creek. No transport through Beadon creek occurs under the developed case, considered to be due to the reduced flood tide velocities through the entrance channel in the deeper dredged channel which do not have the capacity to resuspend and drive sediment through the entrance.
Based on the assessment of the longshore transport volumes that are currently directed eastward, it is estimated that littoral drift volume in the range of 5,000m3 – 15,000m3 could be deposited into the OMSB dredged navigation channel annually on the lee side of the breakwater.
The critical section of the channel for sedimentation in the developed case will be the lee side of the breakwater in Section 2 indicated on Figure 6.19. The dredged navigation channel through this section represents an area of approximately 30,000 m2. For a trapped littoral drift volume of 5,000m3 this section of the channel would experience an average sedimentation depth of approximately 0.2m, and for a volume of 15,000m3 this section would experience an average sedimentation depth of 0.5m. It is noted that

Onslow Marine Support Base Shoreline Impacts Assessment
12636.101.R1.Rev0 Page 76
sedimentation would not be evenly distributed and localised areas of sedimentation would occur and be highest on the western side of the channel, in particular the section of channel closest to the training wall, as demonstrated in Figure 6.26.
6.3.7 Summary of Projected Sedimentation
The annual sedimentation affecting navigable areas of the OMSB footprint (entrance channel, turning circle and berth area) and the section of Beadon Creek below the development are summarised in Table 6.9 based on the sediment transport modelling presented in this section.
Table 6.9: Summary of Annual Sedimentation Volumes (m3/yr)
Region Sand Fractions
Fine Sediment Fractions1
Littoral Drift (Sand) Dredge Total
Lower Beadon Creek 2,300 m3 100 m3 0 m3 2,400 m3
OMSB Dredge Footprint 5,800 m3 7,500 m3 5,000 – 15,000 m3 18,300 – 28,300 m3
Notes
1. The estimate of fine sediments is an upper bound estimate
The key driver of sedimentation for the OMSB navigation channel is expected to be the eastward littoral drift. This sedimentation is likely to be most concentrated in the section of the OMSB channel on the lee side of the training wall (Section 2) on Figure 6.20. Maintenance dredging of the sediment that is directed into the navigation channel will be required to maintain navigable depth in this area. The rate at which sediment accumulates is expected to vary seasonally and annually.
A form of bypass for the sedimentation in the OMSB navigation channel is recommended that can restore the natural eastward supply of sand to the eastern shoal and eastern shoreline. Restoring this natural sediment supply to the eastern shore will be important to ensure that the existing observed stability along this section of shoreline is preserved which provides a natural barrier to Beadon Creek (refer Figure 6.6).
In lower Beadon Creek at the transition of the design depth of the OMSB dredge footprint and the natural creek bed levels, it is expected there will be reshaping and reprofiling of the seabed as it moves to an equilibrium. It is expected this will be a driver of erosion and sedimentation in this section of Beadon Creek post dredging.
Bypassing options have not been investigated as part of this scope, however it is anticipated the material will be predominantly clean sand material well suited to standard dredging operations. Further analysis of the sediment transport process to support detailed design is recommended adopting finer scale model resolution. Refinement of the sediment transport model would also be applicable for the design of the maintenance dredging strategy and options for bypassing the material to the eastern side of the channel.
6.3.8 Sedimentation from Extreme Cyclonic Events
Onslow is located in one of the most cyclone prone areas of the Australian coast. The sediment transport model was applied to assess the potential sedimentation impacts for the OMSB developed footprint from a severe tropical cyclone event. Two recent cyclones that have impacted Onslow were investigated; TC Olwyn (2015) and TC Vance (1999), as summarised on Table 6.10. For TC Olwyn, a range of measured data was available as shown on Table 6.10, whilst for TC Vance there was limited data available through the event.

Onslow Marine Support Base Shoreline Impacts Assessment
12636.101.R1.Rev0 Page 77
Table 6.10: Modelled Tropical Cyclone Summary
Cyclone Event Dates Measured Data Brief Summary
TC Olwyn
9–14 March 2015
• Beadon Creek Tide Gauge
• Onslow Airport BOM data
• AWAC – Wave measurements available but not continuous through the peak of event
TC Olwyn tracked approximately 100km west of Onslow along the western side of northwest Cape and continued south. The cyclone reached Category 3 scale. There is good availability of measured data for this event at Onslow (winds, water levels, currents, waves) and validation of the model was undertaken for this case.
TC Vance
18-24 March 1999
• Beadon Creek Tide Gauge – stopped working in lead up to the event peak
• Onslow Airport BOM data – Instrument Failure
• AWAC – not installed
TC Vance was one of the most destructive cyclones to make landfall on Western Australia’s coastline (Figure 6.27). The cyclone made landfall near Exmouth as a Category 5 system, with the eye of the cyclone passing through the Exmouth Gulf approximately 80 kilometres to the west of Onslow during Monday morning 22nd March 1999 (WST). The maximum recorded wind gust at Onslow was 174 kilometres per hour, and storm surge west of Onslow was estimated at over 5m (BOM 2017b).
Figure 6.27: TC Vance Track (left) and satellite image (right) (Source BOM 2017b)
For the extreme cyclonic simulations, cyclonic wind and pressure fields associated with the two respective cyclones were modelled with Baird’s in-house Cycwind program which combines a Holland et al. (2010) vortex model blended into Climate Forecast System Reanalysis (CFSR) regional scale atmospheric fields.

Onslow Marine Support Base Shoreline Impacts Assessment
12636.101.R1.Rev0 Page 78
The hydrodynamic model was run with the astronomical tide updating every 10 minutes and the wind and pressure fields updated every 30 minutes. The hydrodynamic model is coupled to the wave model which updates wave conditions hourly. Storm surge in the model is generated through wind and wave setup as well as the response to atmospheric pressure (inverse barometer effect). Erosion and sedimentation associated with extreme water levels, waves and currents in the model are simulated for the sand fractions through each modelled event.
Validation of the model against the measured data for the TC Olwyn event is presented in Figure 6.28 with a brief summary as follows: • the model shows good agreement to the measured conditions for water level with a peak water level of
approximately 1.5m MSL (3.1m CD) which corresponds to highest astronomical tide level (HAT); • the wind speed and direction in the model show good agreement to the measured data, and through
the peak of the event wind speeds are in the range of 20 to 25ms-1 with wind direction from the north-east;
• the peak modelled wave height at the AWAC location was approximately 2.0m. The wave heights are not measured through the peak of the event but agree well with modelled Hs in the lead up and post cyclone peak;
• at the AWAC location the peak wave direction is from the north through the peak of the event; and • modelled peak wave period (Tp) is in the range of 8 to 9 seconds.
The modelled metocean conditions for TC Vance are presented in Figure 6.29, with a summary as follows: • peak water level in the model is approximately 2m MSL (3.6m CD) which is 0.5m above HAT; • peak modelled wind speed is 33ms-1 with winds from due east leading up to the peak; • wave period is modelled in the range of 3 to 5 seconds through the peak of the event; and • wave direction is from the northeast leading into the peak, then turns through north at the peak of the
event
Sedimentation inside the OMSB footprint and Channel sections presented previously have been estimated for the two cyclone cases as summarised in Table 6.11.
Table 6.11: Modelled Sedimentation Rates (m3) for OMSB Developed Case Dredged Footprint Area and Lower Beadon Creek Section for Cyclone Cases
No. Description TC Olwyn TC Vance
1 Offshore Navigation Channel 4600 m3 1500 m3
2 Approach Bend Around Training Wall 1400 m3 1250 m3
3 Inner Entrance Channel 620 m3 590 m3
4 Turning Circle and Berth Areas 120 m3 1330 m3
OMSB Dredged Footprint Area Total 6740 m3 4670 m3
5-10 Lower Beadon Creek. Total for All Areas 120 m3 910 m3

Onslow Marine Support Base Shoreline Impacts Assessment
12636.101.R1.Rev0 Page 79
Figure 6.28: TC Olwyn 2015 Modelled Metocean Conditions (Local Time)

Onslow Marine Support Base Shoreline Impacts Assessment
12636.101.R1.Rev0 Page 80
Figure 6.29: TC Vance 1999 - Modelled Metocean Conditions (Local Time)

Onslow Marine Support Base Shoreline Impacts Assessment
12636.101.R1.Rev0 Page 81
A summary of the sedimentation in the cyclone cases is as follows: • the sedimentation volume reported in Table 6.11 indicate modelled sedimentation for the OMSB
footprint area of 6740m3 under TC Olwyn and 4670m3 for TC Vance; • For TC Olwyn, the majority of the sedimentation occurs in the offshore navigation channel (4600m3),
with very minor sedimentation of the turning circle and berth areas (120m3). Wave direction from a more northerly direction in the lead up and peak of the event, is likely the cause of higher sedimentation in the offshore navigation channel in TC Olwyn;
• For TC Vance the sedimentation volume is higher in the turning circle (1330m3) when compared to the TC Olwyn case (120m3), but there is much lower sedimentation in the offshore navigation channel (1500m3) compared to TC Olwyn. The ebb tide immediately following the peak of the water level in TC Vance causes significant erosion and re-deposition of sediment in the turning circle and berth areas. The large velocities through the navigation channel entrance during this ebb tide cause the erosion seen on the eastern channel batter in Figure 6.31;
• For lower Beadon Creek (channel sections 5 to 10) there is 120m3 of sedimentation modelled in TC Olwyn and 910m3 in TC Vance, largely concentrated in the Cyclone Moorings and Basin Silt Trap. The larger sedimentation volumes for TC Vance are a direct result of the ebb tide immediately following the peak of the water level, which causes extremely high current speeds and erosion of the creek bed.
The modelled results for the cyclone cases are presented in Figure 6.30 and Figure 6.31 for TC Olwyn and TC Vance respectively.
Figure 6.30: TC Olwyn 2015, Sand fraction modelled erosion and sedimentation for the developed case. Outer channel (left) and inside Beadon Creek (right) areas with channel sections overlaid.

Onslow Marine Support Base Shoreline Impacts Assessment
12636.101.R1.Rev0 Page 82
Figure 6.31: TC Vance 1999, Sand fraction modelled erosion and sedimentation for the developed case. Outer channel (left) and inside Beadon Creek (right) areas with channel sections overlaid.
In summary, an estimate of sedimentation volumes in the OMSB footprint from an extreme cyclone event could range from 5,000m3 to 10,000m3. There are a number of factors which determine the location where sedimentation is deposited in the footprint area. The results from modelling of TC Vance indicating an event with very high water levels through Beadon Creek can cause sedimentation impacts to the Turning Circle and Berth Area. The results from modelling of TC Olwyn indicate extreme waves from a northerly approach direction through the peak will cause higher sedimentation impacts to the offshore channel.

Onslow Marine Support Base Shoreline Impacts Assessment
12636.101.R1.Rev0 Page 83
7. Conclusions
The Onslow Marine Support Base (OMSB) project involves the development of a major marine support base in Onslow which will provide maritime support services to commercial operations across a range of sectors. The OMSB will deliver a land backed wharf with a deep berth pocket for a range of vessel sizes, connected to Beadon Bay through a deepened, wider navigation channel which is planned to be dredged through the Beadon Creek entrance.
As part of the environmental approvals process for the OMSB project, the impact of the Stage 2 capital dredging to the Beadon Creek system is being referred to Western Australia’s Environmental Protection Authority (EPA). This requires investigation of the changes that will occur to the coastal dynamics for the Beadon Creek entrance, shorelines and upstream areas. A hydrodynamic model of the Onslow coastal region has been developed to support investigations into changes to coastal processes associated with the planned capital dredging. The model has been validated against the available measured water level record from a tide gauge location within Beadon Creek and at an AWAC instrument northwest of the training wall, showing good agreement to the measured data for water level, current velocity and direction. Representative dry season and wet season conditions have been simulated with the model, with a four week period for each seasonal scenario applied to the existing coastal region as part of the model validation.
The hydrodynamic model has been used to assess changes within Beadon Creek under the planned Stage 2 capital dredging works. At key reporting locations within the Beadon Creek system, training wall and lower tidal creek network, the impacts to tidal velocities and the characteristics of the tidal plane and inundation were examined.
The key outcomes from the hydrodynamics assessment are summarised in the following bullet points:- • Total discharge volume through the channel entrance was examined for the developed case to
investigate changes to the tidal prism against the existing condition. For a four week period of modelled tides, the total inflow to the Beadon Creek system was estimated at 101GL and the total outflow volume 75GL. The difference in the inflow and outflow volume is due to the extraction of seawater from the Beadon creek system for the Onslow Salt pond operations, which have been included in the hydrodynamic model description. Under the developed scenario, the Beadon Creek tidal prism remains largely unchanged with total inflow and outflow volumes estimated to increase by only 1% based on the one month of modelled tides. There was an increase in the discharge rate at the channel entrance during ebb tides for the developed case, as the deeper wider channel allows more conveyance of the ebb tide flows;
• The channel entrance cross sectional area will increase from the current cross sectional area of approximately 220m2-250m2 (below MSL) to over 600m2 as a result of the channel dredging. Model comparisons for the developed case against the existing case indicate that whilst discharge rates increase through the Beadon Creek entrance in the ebb tide cycle, the larger cross section of the developed case channel results in overall reduced velocity magnitude through the channel entrance. Based on historical assessments of the entrance, the present 220-250m2 area has been estimated to be representative of a ‘stable’ inlet dimension with respect to the tidal prism upstream and the increase in the cross section under the developed scenario will likely result in an increased sedimentation rate for the navigation channel as the entrance system tries to move towards a new dynamic equilibrium based on the sediment supply and tidal prism;
• The change to current velocities post construction through the spring-neap phase was examined using the hydrodynamic model at key areas of interest in Beadon Creek. For the dredged areas through the entrance channel and central Beadon Creek the current speeds reduce for the developed case. Along the eastern side of the training wall the current speeds reduce from ebb tide peaks of approximately 1 ms-1 in the existing condition to less than 0.5 ms-1 post construction. Within the lower section of Beadon Creek the current magnitude increases slightly post construction, likely due to the increased efficiency of the dredged entrance channel to convey ebb tide peak flows;

Onslow Marine Support Base Shoreline Impacts Assessment
12636.101.R1.Rev0 Page 84
• At locations upstream of the OMSB dredging footprint including the Beadon Creek Tide gauge, mangrove areas and tidal branches of Beadon Creek submergence curves were compared between the existing and post construction scenarios and showed there was negligible change to the estuary tide plane post-construction.
The Delft3D and LITDRIFT modelling suite was applied in sediment transport and morphology investigations. Modelling was supported by the analysis of historical aerial imagery available from the site since the 1960’s to track the rate of existing shoreline movement. Morphological changes in the coastal system associated with the modification of the seabed and entrance channel dynamics under the Phase 2 capital dredging program were completed based on a representative year of simulations derived from dry season and monsoon conditions and for two cyclone events, with the following key outcomes: • Analysis of aerial imagery has been used to investigate shoreline movement at the shorelines east and
west of Beadon Creek entrance. For the shoreline adjacent to the western side of the entrance channel, accretion of over 300m has been observed since the construction of the training wall. The analysis of shoreline position in recent historical aerial imagery suggests the rate of accretion has slowed down in the past 10 years and this region is accreting at approximately 2m a year currently. This accretion is the direct result of trapped eastward bound littoral transport;
• Analysis of the shoreline east of the Beadon creek entrance using the available historical imagery indicates this section of the shoreline moved landward following the formalisation of the Beadon Creek entrance, but that the shoreline has remained reasonably stable over the past 25 years;
• The rate of littoral transport along the shoreline to the west of the training wall was assessed by applying one year of data from the AWAC instrument to the LITDRIFT model. The potential rate of transport was estimated at 45,000m3 annually, noting that this represents the total volume of sediment that could be transported eastward if unlimited sand supply was available. The actual average net rate of eastward littoral drift at the location is estimated to be much lower, and the rate would vary on an annual and seasonal basis depending on the wave conditions at the site (one representative year was assessed in this study);
• Analysis of LiDAR data captured for the shoreline west of the training wall between 2010 and 2016 was used to estimate the volume of sediment trapped on the western side of the training wall as approximately 4,500m3 annually;
• The existing form of the Beadon Creek entrance channel has the capacity to ‘naturally bypass’ a proportion of the net eastward bound littoral drift. This is directed by the action of spring tide current velocities on the ebb and flood tide which redistribute sediment that falls into the existing channel around and onto the eastern shoal, assisted by wave action. The ability for the system to ‘naturally bypass’ will be significantly reduced under the developed case as the deepened channel becomes a trap for the eastward littoral drift. The deeper channel and associated reduced tidal velocities will not have the same capacity to move the sediment from the seabed;
• It is estimated that eastward littoral drift volume that bypasses the breakwater is in the range of 5,000m3 – 15,000m3 annually and could be deposited in the dredged navigation channel on the lee side of the breakwater. Maintenance dredging and bypassing of the material would be required to maintain navigable depth and to restore supply of sand to both the eastern shoal and eastern shoreline;
• Sediment samples collected in the Beadon Creek entrance and nearshore areas indicate the dredged areas in the existing navigation channel and inside Beadon Creek consistent of generally coarser sediments than offshore regions, as a result of the winnowing of the seabed material from tidal velocities acting through these areas in spring tides. It is expected the dredged channel would have a low capacity to continue this process based on the hydraulic and sediment conditions in the channel;
• All navigation areas in the development are likely to experience sedimentation of fine materials (< 64um), at a rate of up to 0.1 m per year. This material may be redistributed away from areas where propeller wash or vessel induce flows may mobilise fine materials in low tide conditions. An annual sedimentation volume upper bound estimate of 7,500 m3 of fines material was predicted based on the sediment transport modelling, noting the expected rate is likely to be lower;

Onslow Marine Support Base Shoreline Impacts Assessment
12636.101.R1.Rev0 Page 85
• The modelled sedimentation volumes in the existing and post-dredging case have been assessed within ten distinct channel sections that have previously been used to assess dredging requirements for Beadon Creek (Oceanica 2013). The annual sedimentation estimates from the sediment transport model are comparable to historical sedimentation rates reported over the 2002 to 2012 period. Modelled post dredging estimates of sedimentation in lower Beadon Creek (south of the OMSB footprint) show the rate of sedimentation could increase by approximately 30% (from approximately 1700m3 to 2300m3). In lower Beadon Creek at the transition of the design depth of the OMSB dredge footprint and the natural creek bed levels, it is expected there will be reshaping and re-profiling of the seabed as it moves to a new equilibrium. This erosion/sedimentation process is likely to reduce over time as the bathymetry through the transition area adjusts to the new hydrodynamic regime and over the longer term the sedimentation rate would likely move within the historical range;
• The OMSB dredge footprint will experience sedimentation as sand is eroded at the margins and deposited on the dredged batters, with this sedimentation expected to move into the deeper dredged areas over time. This process is expected to contribute 5,800m3 of sedimentation annually and affect the offshore navigation channel and entrance channel sections mainly;
• The potential sedimentation impacts for the OMSB developed footprint from a severe tropical cyclone event was assessed based on modelling of TC Olwyn (2015) and TC Vance (1999). This analysis concluded that sedimentation volumes in the OMSB footprint from an extreme cyclone event could range from 5,000m3 to 10,000m3;
• The key driver of sedimentation for the OMSB navigation channel is expected to be eastward littoral drift of sediment. This sedimentation is likely to be most concentrated in the section of the OMSB channel on the lee side of the training wall (Section 2). Maintenance dredging of the sediment that is directed into the navigation channel will be required to maintain navigable depth in this area. A form of bypass for the sedimentation in the OMSB navigation channel is recommended that can restore the natural eastward supply of sand to the eastern shoal and eastern shoreline. Restoring this natural sediment supply to the eastern shore will be important to ensure there is future stability along this section of the shoreline which provides the natural barrier to Beadon Creek; and
• Bypassing options have not been investigated as part of this scope, however it is anticipated the material will be predominantly clean sand material well suited to standard dredging operations. Further modelling at finer resolution is recommended to support detailed design and development of the maintenance dredging strategy including options for bypassing sediment to the eastern side of the channel.

Onslow Marine Support Base Shoreline Impacts Assessment
12636.101.R1.Rev0 Page 86
8. References
BOM 2017a, Tropical Cyclones Affecting Onslow, http://www.bom.gov.au/cyclone/history/wa/onslow.shtml
BOM 2017b, Severe Tropical Cyclone Vance, http://www.bom.gov.au/cyclone/history/vance.shtml
Cardno (2016). Coastal Hazard Assessment – CHRMAP for the Onslow Coast, prepared for Shire of Ashburton 19 June 2016
Chevron (2010). Wheatstone Project Draft Environmental Impact Statement/ Environmental Review and Management Programme, Technical Appendix N12 Survey of Benthic Habitats off Onslow, Western Australia.
Chevron (2010). Wheatstone Project Draft Environmental Impact Statement/ Environmental Review and Management Programme, Technical Appendix N1 Coastal Geomorphology of Ashburton River Delta and Adjacent Areas, Western Australia.
Chevron (2013). Wheatstone Project, State of the Marine Environment Surveys Baseline Report, Chevron Australia 11 Jul 2013
Damara WA Pty Ltd (2010). Coastal Geomorphology of the Ashburton River Delta and Adjacent Areas. Report 82-01-01 May 2010
Deigaard, R., Fredsøe, J., and Brøker Hedegaard, I. (1986). Mathematical Model for Littoral Drift. Journal of Waterway, Port, Coastal and Ocean Engineering, ASCE, Vol. 112, No. 3, pp. 351-369.
Department of Transport (2016). Onslow Beadon Creek multibeam survey data, provided to project
Department of Transport (2017). Onslow Beadon Creek breakwater literature and data review - DT_R_492 - final version
DHI (2010). Wheatstone Project Coastal Impacts Modelling, Report prepared for Wheatstone Project, 5527/Coastal01, May 3rd 2010
DHI (2014). LITDRIFT Longshore Current and Littoral Drift, LITDRIFT User Guide
Gulf Holdings (1990). Onslow Solar Saltfield ERMP March 1990, Gulf Holdings Pty Ltd A0164_R0495_ERMP_Volume 1, April 1990.
Halpern Glick Maunsell (1998). Investigation Report on Harbour Basin and Entrance Channel at Beadon Creek, Onslow (DoT Reference No: CT 158/96/PI/011)
Kamphuis J.W. (2000). Introduction Coastal Engineering and Management. Advanced Series on Ocean Engineering – Volume 16. World Scientific Publishing Co. Pte. Ltd. Singapore.
MScience 2009, Wheatstone LNG Development – Baseline Water Quality Assessment Report, November 2009, Report MSA134R3
Oceanica 2014, Beadon Creek (Onslow) Maintenance Dredging, Closeout Report 2013 Session, Reference R-300.03-12.3-1, May 2014
Onslow Salt 2017, email from R.Baker to T.Hurley 25th July 2017
O2 Marine (2017), Onslow Marine Support Base - Stage 2 Capital Dredging Sediment Quality Assessment, Prepared for OMSB project April 2017.

Onslow Marine Support Base Shoreline Impacts Assessment
12636.101.R1.Rev0 Page 87
Seashore Engineering (2017). Onslow Maritime Facility, Beadon Creek Training Wall, Synopsis of Breakwater and Entrance Channel, Presentation Tuesday 28 March 2017
Taylor D.R., Treloar P.D., and Collier L.C.. (2008). “Lake Illawarra Entrance Studies – Flooding and Potential Climate Change Issues.” Proceedings of the 2008 NSW Coastal Conference. Wollongong, November 2008.
van Rijn, L. C. (2006): Principles of Sediment Transport in Rivers, Estuaries and Coastal Seas. Aqua Publications
van Rijn L. C. (2007). “Unified View of Sediment Transport by Currents and Waves – III- Graded Bed”. Journal of Hydraulic Research. American Society of Civil Engineers. July 2007 Vol 133 No. 7. pp761-775
van Rijn L. C., Walstra D. R. and van Ormondt M. (2007). “Unified View of Sediment Transport by Currents and Waves – IV- Application of Morphological Model”. Journal of Hydraulic Research. American Society of Civil Engineers. July 2007 Vol 133 No. 7. pp776-793.

Onslow Marine Support Base Shoreline Impacts Assessment
12636.101.R1.Rev0 Appendix A
Concept Plan Design Layouts

Onslow Marine Support Base Shoreline Impacts Assessment
12636.101.R1.Rev0 Appendix A

℄
℄
℄
PREL
IMINA
RY IS
SUE
NOT
FOR
CONS
TRUC
TION
P:\J
OB
S\2
017\
1701
62 -
Ons
low
Mar
ine
Sup
ply
Bas
e –
Cap
ital D
redg
ing\
Dra
fting
\AP
H17
0162
-C-0
5.dw
g, L
ayou
t1, 1
7/5/
2017
1:1
1 P
M, W
Bow
yer
When sheet printed full size, the scale bar is 100mm.0 50 100mm
DATE: CHECKED:CHECK PRINT:
C
A1 DRAWING NUMBERSheet No.Job Number Rev.
Design Drawn
634 Murray Street, West PerthWestern Australia 6005
Telephone 08 9336 6528Email [email protected]
REV. DATE DESCRIPTION DRAFT CHKDENG.
C-05APH170162WB WB
CHANNEL SETOUT PLAN - SHEET 2 OF 2CAPITAL DREDGE & NAV AIDSBEADON CREEK, ONSLOWONSLOW MARINE SUPPORT BASE (OMSB)