sarhad journal of management sciences (sjms)
122
-
Upload
khangminh22 -
Category
Documents
-
view
1 -
download
0
Transcript of sarhad journal of management sciences (sjms)
Volume II Issue I ISSN—2414-2336
SARHAD JOURNAL
OF
MANAGEMENT SCIENCES
(SJMS)
www.suit.edu.pk
ii
Sarhad Journal of Management Sciences Vol. 2 Issue 2, December 2016
Sarhad Journal of Management Sciences (SJMS) is the 2nd
academic and research
journal of Sarhad University of Science and Information Technology, Peshawar,
Pakistan. The journal has an established peer-review process for quality evaluation.
The journal is published biannually. It welcomes academic and research contributions
from scholars, researchers, and academicians across the world in the discipline of
Management Sciences.
Objectives of the Journal
The Journal has the following objectives:
► To provide a platform to scholars, researchers, and academicians for sharing
and enriching their knowledge;
► To contribute in the promotion of research culture in the country;
► To explore new vistas in the field of Business and Management;
► To facilitate scholars and researchers in their research endeavours to
contribute quality research and to publish their ideas, results and findings; and
► To promote quality research culture compatible with international standards.
Scope of the Journal
The journal solicits research work related to the discipline of Business and
Management. The journal welcomes unpublished, original research papers, review
papers, research survey and even tutorials. Authors are responsible for the reliability
and validity of the contents of their research work. Editors and publisher are not
accountable in this regard.

iii
Patron-in-Chief
Prof. Dr. Salim-ur-Rehman
Vice Chancellor,
Sarhad University of Science & IT, Peshawar, Pakistan
Editor-in-Chief
Dr. Wali Rahman,
Assistant Professor, Department of Business Administration,
Sarhad University of Science & IT, Peshawar, Pakistan
Associate Editors
Muhammad Irfan Khan,
Assistant Professor, Department of Business Administration,
Sarhad University of Science & IT, Peshawar, Pakistan
Mr. Adeel Rahim,
Lecturer, Department of Business Administration,
Sarhad University of Science & IT, Peshawar, Pakistan
General Information about the Journal
Publisher
Sarhad University of Science & IT, Peshawar.
Contact Information
Sarhad University of Science & Information Technology, Peshawar, Pakistan
Landi Akhun Ahmad, Ring Road (Kohat Road – Hayatabad Link) Peshawar Pakistan.
Phone No. +92-91-5230931-3
Fax No. +92-91-5230936
E-mail: [email protected],
Copyright © 2016, Sarhad University of Science & Information Technology,
Peshawar, Pakistan
All rights reserved. No part of this journal may be reproduced or transmitted in any
form or by any means, electronic or mechanical, including photocopying, recording or
by any information storage and retrieval system, without written permission from the
Sarhad University of Science & Information Technology, Peshawar, Pakistan.
iv
Editorial Board/Advisory Board (International)
Dr. Zekeriya Nas, Associate Professor, Yuzuncu Yil University, Van/Turkey
Email: [email protected]
Prof. Alain ROGER, Emeritus Professor, Institute of Business Administration
(IAE de Lyon), University of Lyon3 (France)
Email: [email protected]
Prof. Caroline COULOMBE, Professor, Department of Management &
Technology University of Québec in Montreal (Canada)
Email: [email protected]
Prof. Dr. Amran bin Muhammad Rasli, Universiti Teknologi Malaysia (UTM),
Malaysia
Email: [email protected]
Editorial Board/Advisory Board (National)
Prof. Dr. S Ghias-ul-Haq, Dean, Faculty of Management Sciences, Sarhad
University, Peshawar.
Email: [email protected] Ph: +92-91-5846508 Ext. 237
Prof. Dr. Habib-ur-Rehman, HOD, Department of Business Administration,
Sarhad University, Peshawar.
Email: [email protected] Ph: +92-91-5230931-33, Ext. 234
Dr. Syed Gohar Abbas, Assistant Professor, Department of Business
Administration, Sarhad University, Peshawar.
Email: [email protected] Ph: +92-91-5230931-33 Ext. 243
Dr. Abdul Qayyum, Associate Professor, Department of Management Sciences,
COMSATS, Wah Campus.
Email: [email protected] Ph: +92-51-9314382-83
Dr. Abid Usman, Associate Professor, Department of Business Administration,
Iqra National University, Peshawar
Email: [email protected] Ph: +92-346-9199888.
Dr. Sohail Akhtar, Chairman, Department of Statistics, University of Malakand,
Pakistan. Email: [email protected], Ph: +92-945-761621 Ext. 3174
v
Dr. Fayyaz Ali Shah, Assistant Professor, Department of Management Sciences,
Islamia College University, Peshawar.
Email: [email protected] Ph: +92-341-9375701
Prof. Dr. Jahanzeb, Head of Department, Department of Business
Administration, City University, Peshawar.
Email: [email protected] Ph: +92-91-2609501-8 Ext. 301
Prof. Dr. Razia Sultana, Vice Chancellor, Shaheed Benazir Bhutto Women
University, Peshawar. Email: [email protected] Ph: +92-91-9212422/922.
Prof. Dr. Farzand Ali Jan, Head of Department, COMSATS Attock Campus.
Email: [email protected] Ph: +92-57-9316330-1
Prof. Dr. Syed Amjad Farid Husnu, Management Sciences Department
COMSATS Abbottabad. Email: [email protected] Ph: +92-992-383591-6
Prof. Dr. Shehla Amjad, HoD, Management Sciences COMSATS Abbottabad.
Email: [email protected] Ph: +92-992-383591-6.

vi
TABLE OF CONTENTS
An Analysis of Job Related Factors and Personality Traits on Teachers’ Ill-
Health, Performance and Job Satisfaction
Syed Gohar Abbs, Rabia Ishrat, & Waheed-ur-Rahman ……………...…….96
Relationship between Employees Motivation and Turnover Intention:
Empirical Study of Traffic Police of District Charsadda
Abid Khan, Itebar Khan, & Zakirullah……………………………………...113
Does Organizational Learning Orientation Matter? Investigating the Impact
of Learning Orientation on SMES Performance
Jawad Hussain, Fayaz Ali Shah, & Muhammad Ayub Khan……………….128
The Impact of Merger and Acquisition on Karachi Stock Exchange–Testing
Semi-Strong Efficient Market Hypothesis
Saira Israil, & Niamatullah Khan……………………………………………139
Effect of Islamic Work Ethics on Employee Well-Being, Job Stress and
Turnover Intention
Maaz-ud-Din, & Saad Farooq…………………………………………..…..157
The Mediating Role of Career Development in its Antecedents and Outcomes:
Empirical Evidence from Pakistan
Haji Rahman, Wali Rahman, Muhammad Azizullah, & Khalid Anwar……165
Why are National Pharmaceutical Brands Considered more than
Multinationals? A Case of Pakistan’s Pharmaceutical Industry
Abid Shahzad, & Muhammad Wahab………………………………………177
Exploring the Relationship of Network Centrality and Academic Performance
of Female Students
Asma Mushtaq, Kamal Badar, Muhammad Anwar, Syed Gohar Abbas…...196
Manuscript Submission Guidelines…………………………………………...208

96 Vol. 2, Issue 2 (ISSN No. 2414-2336)
AN ANALYSIS OF JOB RELATED FACTORS AND PERSONALITY TRAITS
ON TEACHERS’ ILL-HEALTH, PERFORMANCE AND JOB SATISFACTION
Syed Gohar Abbas, Assistant Professor. Email: abbas.ba.suit.edu.pk
Rabiya Ishrat, Assistant Professor Email: rabia.ba.suit.edu.pk
Waheed ur Rehman, Assistant Professor. Email: rabia.ba.suit.edu.pk
Sarhad University of Science & Information Technology, Peshawar
Abstract. Teacher’s ill-health & job strains particularly in higher educa-
tion sector is usually more deceptive as compared to other professions
because of its vague nature of roles and is dissimilar to other professions
and has substantial connections with numbers of scholars in class, their
numerical assessments, workload issues, miserable organizational
practices, job insecurity and inadequate recognition. Moreover, the
antecedents and consequences of job related strains varies from person to
person because of our different personality types and as we are all unique
in our perceptions and behaviors. This exploratory research aimed to
investigate & explore the factors at the work environment which have a
significant impact on faculty well-being, and the possibilities of
improvement of the work environment for academic world with particular
reference to a public sector university. The results revealed inverse
relationship between job strains and performance. The significant job
related factors causing stress for male and female faculty members were
different. Furthermore female faculty members and faculty members with
Type A personality reported higher levels of ill-health. Type A personality
also reported higher performance when compared with Type B & Type AB.
Key words: Teacher, personality, job satisfaction, ill-health
Introduction
Research on physical & psychological ill-health among academe indicates that it is a
common phenomenon among teachers therefore the academic work environment needs
to be examined and more specifically organizational specific characteristics, like
leadership, HR practices, workload and time pressures, uncertainty, lack of feedback,
social support etc. (Kinman & Jones 2004; Winefield et al. 2003; Tytherleigh et al.,
2005). Job strains refer to a feeling of psychological and/or physical pressures because
of being incapable to manage the environmental demands, challenging events and
stressful encounters over period of time (Kahn et al., 1964; Lazarus, 1991). In such
situations, people are confronted with opportunities or demands related to what they
desire but the outcomes are perceived to be both indeterminate and significant
(Decenzo & Robbins, 2004) and it can be labeled as both positively and negatively
(Selye, 1956). Some reasons which have been identified by different researchers
include role conflict, role overload, role ambiguity, and fear of unknown and
perceptions of maltreatment by the organization (Srivastav, 2007). For example, an
instructor who attempts to conduct an outstanding lecture every day is likely to be

97 Vol. 2, Issue 2 (ISSN No. 2414-2336)
prone to exhaustion when his employer does not realize that other aspects of his job
(e.g. publication) which might be more important for him as compared to teaching.
Moreover, students‘ performance is usually on top priority of good academicians
(Shah, Rahman & Abbas, 2015), so dedicated teachers also try their level best to put
maximum efforts even for the performance of the low graders (students). Teachers who
try to overcome such issueswith less organizational support may end up in low
motivation, may cause strain on his/her emotions and physical conditions (Abbas,
Shahab & Badar, 2016) which in turn leads to absenteeism & high turnover. The
observations mentioned above differ from person to person because each one of us
brings unique characteristics to our job and these individual differences determine how
the individual will react to a particular situation. Some may recognize these issues as a
challenge but the others may take it as a risk. For example Type B personality usually
show less concern to stress as compared with Type A. Normally the Type A‘s tend to
be over-competitive, outgoing, and also sense impatience most of the time with the
speed at which the events take place and dissatisfied with life (Decenzo & Robbins,
2004). Type B‘s have less desire to compete; they are not impatient, are less status
conscious and also less aggressive.
Literature Review
Nowadays, the organizations‘ job environment considerably differ from the job
environment of few decades ago particularly in the academic world e.g. lengthier time
at workplace are common nowadays, regular modifications in organizational structure
are normal (Locke & Teichler, 2007; Fotinatos-Ventouratos & Cooper, 2005) which in-
turn lead to countless pressures on employees.
Burnout is one of the most burning issue which leads to ill-health (Lu et al., 2003). It
has been considered as a reaction to demanding circumstances at work that leads to
physiological reaction manifested by psychometric indications such as coronary artery
disease, hypertension, headache and peptic ulcer. According to a survey by Statistics
Canada, its not hard work which causes job stress. Rather, it‘s having no control over
how, when, or with whom you do your job. Based on survey from 9000 Canadians,
psychological distress was found highest among people in job with the high work
demands but little autonomy for decision making. People who had demanding
professions but also considerable autonomy to make decision were less stressed. Only
27% of them had high psychological ill-health scores. Consistent with other studies, the
worst job strain was reported by those, who were supposed to work directly with the
public e.g. police, nurses and teachers. Another deduction from this study was that
women reported a higher degree of pressures than men. The researchers recognized this
to two factors i.e. men usually have more decision-making power in their jobs and
women feel less supported by their co-workers as compared to men.
Most of the research on stress among academic staff has resulted from the work
conducted in Europe and USA. Blix, Cruise and Mitchell (1994) in their studies
reported that 66% of sample of university‘s teaching faculty perceived high levels of
worries during work at least 50% of the time. They found that most of the issues faced

98 Vol. 2, Issue 2 (ISSN No. 2414-2336)
by the faculty was directly related to time pressures and resource inadequacy. Some
researchers is defined stress & strain in terms of reaction to situations that results from
negative emotions, and particularly teaching faculty are the ones among all the
occupational groups which function under conditions of high stress which is frequently
caused by many internal and external factors which may include fewer rewards,
inadequate environment, performance pressures in limited time, poor motivation,
interpersonal conflicts, resources inadequacy, unequal work distribution, lack of
community spirit and dearth of support by bosses (Brown & Ralph, 1998; Gmelch,
1993; Travers & Cooper, 1998).
Faculty stress is usually more deceptive as compared to other professions because of its
vague nature of roles and is dissimilar to the business profession; the distressing effects
are not often counterbalanced by moments of satisfaction (Claxton, 1989). According
to Griffith et al. (1999), if other factors remain constant, stress affects younger and less
experienced teachers over seniors and ore experienced teachers; single teachers over
the married ones; and female teachers over males.
Lackritz (2004); Gillespie et al. (2001) in their studies on teachers‘ burnout revealed
that burnout had substantial connections with numbers of scholars in class, their
numerical assessments, workload issues, miserable organizational practices, job
insecurity and inadequate recognition Moreover they concluded that female faculty
members were more ―burned-out‖ as compared to males. Kyriacou (1998) also
identified few major categories as the sources of faculty stress which primarily include
time pressures, low status, students‘ indiscipline, poor working conditions, poor
motivation and conflicts with colleagues .
Stress produces a range of adverse, costly, and devastating consequences e.g.
dissatisfaction and anger; depression; inability to relax; feelings of low self-esteem and
self-accomplishment, fatigue and emotional exhaustion; irregular sleeping habits due
to insomnia, psychosomatic complaints and cardiac problems (Brown & Ralph, 1998;
Hinton & Rotheiler, 1998; Travers & Cooper, 1998). Thus in organizational setting,
burnout has become a major contributor to ill-health and performance issues of
individuals, and costs a lot to the organizations.
On the positive side, research also revealed that a certain level of stress in academe is
unavoidable, even beneficial. Hinton and Rotheiler (1998) pointed out that the
enthusiasm and challenge of teaching may cause the adrenaline level to rise which are
linked with stress, and Dunham (1992) showed that teachers work at highest efficiency
level when the jobs allocated to them are in equilibrium with their perceived coping
skills. Interestingly, very little challenge and too much can be harmful. Stress can be
temporary or long-term, minor or severe and its impact on a teacher depends generally
on how long its causes continue and how powerful they are? If stress is short-term and
minor, people may handle it or at least recover from its effects quickly. However
extreme outcomes of stress include depression, burnout, workplace violence and
decreased performance.
99 Vol. 2, Issue 2 (ISSN No. 2414-2336)
Individual differences and stress performance relationship
Individual differences account for a widespread range of responses to stress; a task
viewed as a challenge by one person may crop high level of anxiety in another
(Newstrom & Davis, 2003). In the mid-1900s, psychosomatic medicine began to
position on identifying precise psychological features that might be considered as
genuine risk factors in relation to ill-health. With particular reference to the ways in
which employees cope with stress, two separate personality categories characterized by
opposing sets of behavioral patterns called as Type A and Type B were found
(Friedman & Rosenman, 1959). Research shows that based on individual personality
differences, some employees are stimulated by stress and perform better, where as
other employees report low performance. In other words, a person‘s readiness to
respond to stress with negative or positive feeling may also be a critical cause of
performance. The ‗Type As‘ is the people operating at their maximum possible speed,
want to achieve competitive goals and are usually with exaggerated sense of time
urgency. They usually consider everything to be a challenge and can handle more tasks
at the same time while performing well at them all (Robbins & Judge, 2003). However
this over achievement does not come for free and are subject to significant amounts of
stress. The other personality is the Type B, who is exactly opposite as they are patient,
with no sense of time urgency, do not exhibit their achievements, may play for fun and
not to show their superiority. Unlike Type A, they can relax without guilt (Robbins &
Judge, 2003).
Summing up, Type-As are thus more prone to stress and in-turn have a higher chance
of getting psycho-somatic illness because of the over competition and performance
pressures round the clock. On the contrary, Type Bs has a greater capacity to handle the
stressful situations comfortably and in-turn, are less vulnerable to negative stress
related consequences.
One of the most vital challenges faced by education sector is to overcome teacher‘s
stress related issues by developing a conducive climate where they can understand its
pros and cons, take it as a challenge, and needs to be on their discussion agenda both
formally and informally (Claxton, 1989). This can be incorporated from three areas;
1- Teachers must become aware of their stress-full problems they face
2- They should be allowed to speak publicly about stress-full issues
3- Their captains should take care of such issues and respond accordingly
Objectives of Research
This exploratory research aims to investigate& explore (1) the well-being of teaching
faculty at the universities, (2) the factors at the work environment which have a
significant impact on faculty well-being, and (3) possibilities of improvement of the
work environment for academic world. This exploratory research aimed to address the
following research questions:
Which organizational factors have relatively high tendency towards bringing
occupational stress among teaching faculty of a public sector university?

100 Vol. 2, Issue 2 (ISSN No. 2414-2336)
What is the influence of job related stress on faculty performance of a public
sector university?
How the different personality types (Type A, Type B), stress and performance
are related?
What are the gender specific job stress factors?
Research Methodology
The present study targeted the academic staff of a public sector university of Pakistan.
Because of shortage of time and resources, convenience based sampling was used and
221 faculty members from various departments were approached directly to collect the
data. Tools used for gathering primary data were questionnaires and semi-structured
interviews. The tools of interview and observation were used to gather facts about their
job routine and to know how environmental factors influence the work patterns. This
helped us to refine our questionnaire, which we have used as a primary data collection
tool. Three of the main variables were used. Two of the variables were independent
including job related stress factors and personality. The dependent variable was
performance. The variables mentioned above were further categorized into many other
sub-variables.
Job Related Stress Factors
It was measured by self-designed questionnaire and defined as sources of stress by
Hartrick and Hills (1992) and Michie (2002).Keeping in view the organization of the
study; we intended to study the following independent variables:
Heavy workload
Lack of staff
Poor working conditions
Lack of acknowledgment
Job security
Nature of job
Time pressure and deadline
Lack of training and skills
Relationships with coworkers& supervisors
Workplace Privacy
o Autonomy
o Harassment
A five point Likert scale, ranging from ―never‖ to ―constantly‖ was used to measure all
scales. At some places reverse scale was also used. The scale was grouped into 10 sub
scales; These include Work Overload (WO), Job Description & Role Conflict (JDRC),
Communication & Comfort With Supervisor & Colleagues (CCS&C) , Office
Environment & Resources (OE&R), Feeling Of Inequity (FOIE), Lack Of Skills &
Training Opportunities (TSO), Harassment (HAR),Grievance Handling (GH), Lack of
Authority (AUTH) and Job Security (JSEC). These variables have been analyzed to
identify the factors that have high tendency towards occupational stress.The summated
101 Vol. 2, Issue 2 (ISSN No. 2414-2336)
scores are converted into percentages to get better results as the number of questions
varies from indicator to indicator. Percentages are used to make the analysis more
meaningful. The summated score ranges from 20% to 100% i.e.
21%-48% lower level of stress
49%-60% lower moderate level of stress
61%-74% upper moderate level of stress
75%-100% high level of stress
As all the departments reported their stress with in same range so conclusions were
made in relative terms i.e. relative to other departments‘ stress against performance.
Job Performance
It is the effectiveness of the individual in carrying out his/her roles and responsibilities
related to academics. A self explained questionnaire was a used as the research tool. A
five point Likert Scale ranging from 1 to 5 is another tool that was used. This scale is
grouped into many other subscales:
Knowledge & Skills
Job Enthusiasm and
Job Quality
Research Productivity
Job Inputs (Academic)
Job Inputs (Co-Curricular)
Self Appraisal
Appraisal by others
Absenteeism
To collect information about the performance faculty members, questionnaires, semi-
structured interviews from the faculty members and their reporting officers‘ feedback
was used. A traditional rating scale was utilized to determine a summative score for
performance. Each Faculty member was rated on the three performance items using a
scale ranging from 1 to 5 and these scores were converted into percentages. The
summated scores ranged from 20% to 100%.
As all the departments reported their performance within the same range so conclusions
were made in relative terms i.e. relative to other departments‘ performance against
stress.
20-50% low performance
51-70% medium performance
71-100% high performance
As all the departments reported their performance with in same range so conclusions
were made in relative terms i.e. relative to other departments‘ performance against
stress.
102 Vol. 2, Issue 2 (ISSN No. 2414-2336)
Personality Characteristics
A revised version of the questionnaire developed by Hartman et al., (2001) comprised
of 15 questions was adapted to our sample and was used to conclude the behavior
pattern for Type-A, Type-B & Mod A (Type AB).
Descriptive Statistics and Data Analysis
Occupational Stress, Personality Type and Job Performance
As mentioned earlier, structured questionnaire were designed to collect data from
different departments of a public sector university. Questionnaires from 221 faculty
members were collected from the different departments however questionnaires of 200
faculty members were considered for analysis. 21 questionnaires were rejected based
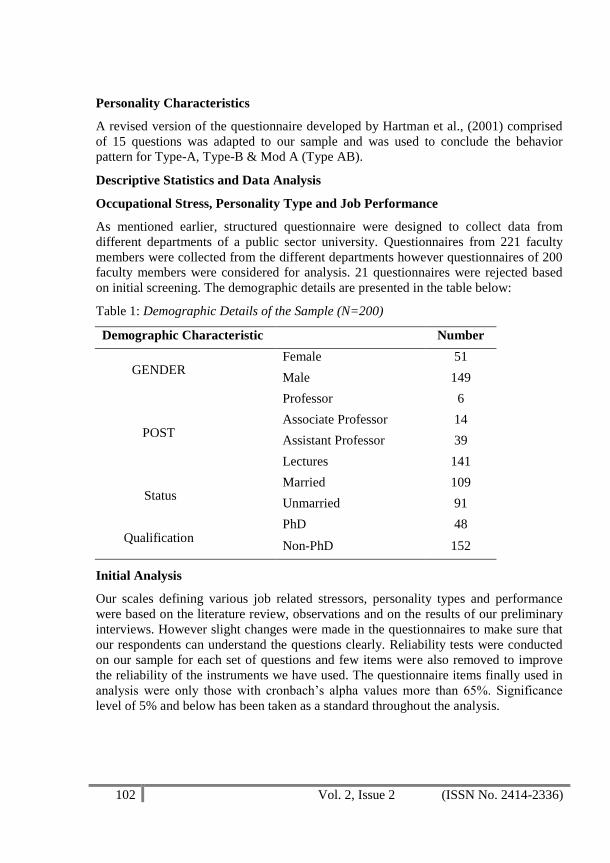
on initial screening. The demographic details are presented in the table below:
Table 1: Demographic Details of the Sample (N=200)
Demographic Characteristic Number
GENDER Female 51
Male 149
POST
Professor 6
Associate Professor 14
Assistant Professor 39
Lectures 141
Status Married 109
Unmarried 91
Qualification PhD 48
Non-PhD 152
Initial Analysis
Our scales defining various job related stressors, personality types and performance
were based on the literature review, observations and on the results of our preliminary
interviews. However slight changes were made in the questionnaires to make sure that
our respondents can understand the questions clearly. Reliability tests were conducted
on our sample for each set of questions and few items were also removed to improve
the reliability of the instruments we have used. The questionnaire items finally used in
analysis were only those with cronbach‘s alpha values more than 65%. Significance
level of 5% and below has been taken as a standard throughout the analysis.

103 Vol. 2, Issue 2 (ISSN No. 2414-2336)
Overall Stress Factors Impact
The average of all the factors reported that Job Description & Role Conflict, Work
Overload, Grievance Handling as the topmost reasons for stress with an average/mean
of 56 (approx). Office Environment & Resources was also reported as an important
reason of stress with an approximate score of 54. Almost all the departments reported
the factors of harassment, lack of training/skills opportunities at the lowest level as a
source of stress at an average of 36 and 30 as can be seen in the graph below.
Figure 1 – Overall Occupational Stress Factors
Regression analysis revealed Job Description and Role Conflict (JD & RC), Office
Environment and Resources (OE & R) and Grievance Handling (GH) most
significantly positively related to faculty ill-health.
Table 2: Regression Analysis (N=200)
Factors Beta t Sig.
(Constant) 1.758 0.081
JD&RC 0.399 2.119 0.001
FOIE 0.116 1.197 0.234
WO 0.189 2.231 0.027
CCS&C 0.065 0.645 0.52
OE&R 0.223 0.27 0.005
TSO 0.208 2.339 0.081
HARR 0.088 0.994 0.322
GH 0.188 1.784 0.015
AUTH 0.017 0.471 0.344
JSEC 0.114 0.342 0.092
a. Dependent Variable: ill-health
57 51 56 48 54
30 3657 52 48
Mean Values

104 Vol. 2, Issue 2 (ISSN No. 2414-2336)
As shown in Table 4, male faculty members reported the following sources of stress
more dominant as compared to females. These include Job Description and Role
Conflict, Office Environment and Resources, Lack of Authority and Job Security.
Female‘s concern towards the following factors has been reported at high level as
compared to male faculty members. These include Grievance Handling, Communi-
cation & Comfort with Supervisors and Colleagues, Feeling of In-Equity and Work
Overload.
Table 3: Overall Gender Specific Stressors (N=200)
Factors Male's Mean Female's Mean
JD&RC 58 54
FOIE 51 54
WO 57 58
CCS&C 47 52
OE&R 57 49
TSO 30 28
HARR 36 35
GH 56 59
AUTH 55 47
JSEC 52 43
Figure 2: Overall Gender Specific Stressors
0
10
20
30
40
50
60
70
Male's Mean
Female's Mean

105 Vol. 2, Issue 2 (ISSN No. 2414-2336)
Occupational Stress & Performance Relationship (Gender Specific Distribution)
Table 4 Occupational Stress and Performance Relationship (N=200)
Factors Min Maxi Mean
Stress Male
23.33 66.67 30.457
Performance 43.7 84.44 70.4622
Stress Female
26.67 60 48.3333
Performance 51.85 73.33 54.2222
Figure 2 Occupational Stress & Performance Relationship (EE)
Personality Characteristics of Participants
As discussed in the literature review, every person is unique in its perceptions and
responds differently to the same situation. Situations which one person smell as
challenging and stimulating might be seen as threat and may cause stress among others.
Literature suggests that type A personality being over competitive and impatient are
more vulnerable to stress, when compared with type B. Out of total 200 respondents,
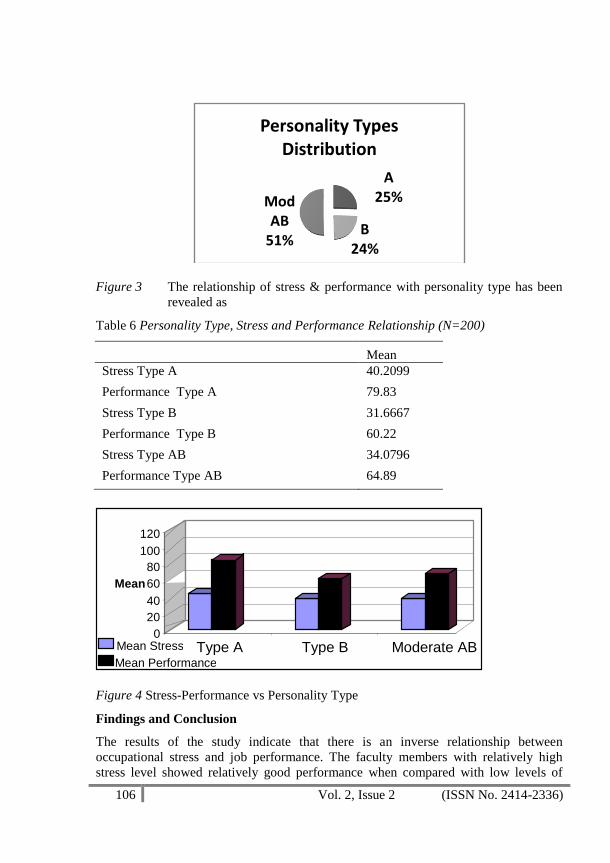
51 were TypeA, 48 were TypeB and 101 were Type AB.
Table 5 Personality Distribution of Participants (N=200)
Type Frequency Percent
A 51 25,5
B 48 24
Mod AB 101 50,5
Total 200 100.0
0
20
40
60
80
Males Females
Stress
Performance
106 Vol. 2, Issue 2 (ISSN No. 2414-2336)
Figure 3 The relationship of stress & performance with personality type has been
revealed as
Table 6 Personality Type, Stress and Performance Relationship (N=200)
Mean
Stress Type A 40.2099
Performance Type A 79.83
Stress Type B 31.6667
Performance Type B 60.22
Stress Type AB 34.0796
Performance Type AB 64.89
Figure 4 Stress-Performance vs Personality Type
Findings and Conclusion
The results of the study indicate that there is an inverse relationship between
occupational stress and job performance. The faculty members with relatively high
stress level showed relatively good performance when compared with low levels of
A25%
B24%
Mod AB
51%
Personality Types Distribution
0 20 40 60 80
100 120
Mean
Type A Type B Moderate AB Mean Stress
Mean Performance

107 Vol. 2, Issue 2 (ISSN No. 2414-2336)
stress. Furthermore female faculty members and faculty members with Type A
personality reported higher levels of stress. Type A personality also reported higher
performance when compared with Type B and Type AB.
The second most important reason reported by almost all the departments as a source of
stress was job description and role conflict. In unstructured interviews it was observed
that many faculty members were reporting to more than one boss, their job description
was not clear to them, and they suffered a lot because of their involvement in other co-
curricular activities. Our preliminary interviews also revealed that most of the faculty
members with ambiguous and multiple roles felt overloaded most of the time, but were
still willing to take other assignments and in parallel they seemed to be more stressed
and anxious as compared to others who were only engaged in teaching. These results
corroborated with the studies by Caplan et al. (1975) which revealed role ambiguity
and workload positively related with depression and anxiety; and it was greatest for
Type A people.
Through unstructured interviews and personal observations, it has been observed in
almost all the departments that even some senior faculty members faced a lot of
problems in getting hold of the resources to complete their tasks. It also has been
observed that the faculty members used to pick up and install the Multimedia
themselves, thus wasting a lot of time particularly when the devices proved to be out of
order. This causes an embarrassment for the teachers in front of the students. Even if
the faculty is fully prepared with a power point presentation for some technical lecture,
he is not sure whether a multimedia projector will be available or not. This has also
contributed a lot towards stress and firefighting on daily basis.
Job security, lack of authority, privacy, time management, office equipment &
resources, job description and role conflict have contributed to increase stress in male
faculty members more than the females. Females have reported the factors of grievance
handling, feeling of inequity, communication and comfort with supervisor & coworkers
to be main contributors towards stress, when compared with males. Harassment has
been placed at the lower end by both the male and female faculty, as a source of stress.
The results have shown that Type As slightly performed well with slightly highly
vulnerability towards stress, but there was no significant difference on stress
performance relationship among faculty with different personality attributes. There was
no significant difference between the stress level of Type B and Type AB. But stress
level of Type A was reported higher from both Type AB and Type B.
Recommendations
With particular reference to stress in academe in higher education, we recommend to
formulate a multimodal approach for stress management which will result in a more
efficient, broad-based intervention strategy with more chances of success.
In addition, we also recommend organizing such interventions at both individual and
organizational level, so as to ensure effective outcomes. Interestingly, some
interviewees revealed that if they admit experiencing stress or intend to
108 Vol. 2, Issue 2 (ISSN No. 2414-2336)
participate in stress management related activities, it may involve a risk being
labeled as ‗‗weak‘‘ and unable to cope with the demands of the job. Harkness et al.
(2005) suggest that people consider that revealing stress at job is usually perceived by
bosses as an expression of weakness or unskillfulness. Such views of the employees
should be curtailed and an environment of openness should be encouraged, so
employees may talk their hearts out and could benefit from such trainings and
sessions.
Based on the major finding and conclusions mentioned in the above paragraphs, few of
the recommendations are advised below. Since the major sources of stress identified
are job description & role conflict, grievance handling, work overload, office
environment & resources the following specific recommendations are made:
a. Managing Job Description and Role Conflict: Usually the conflicts which arise
among people are the role conflicts which according to Antonioni (1996) can be a mask
that hides the real person. To lessen conflict between students and teachers, precise
descriptions of expectations of all these must be in written and communicated to all.
Accurately defining the various roles are very important to reduce conflicts and it must
also be kept in mind we all are unique in our interpretations so individual differences
must also be considered while incorporating the policies.
As a social being, usually teachers have four roles including administrator and/or
teacher, father/mother, spouse, & friend and each of these roles are coupled with some
expectations and responsibilities. To be a good teacher, they must define their role to
teach with zeal and zest rather than just acting the role of a teacher. Once they add the
element of commitment in their job, they may not face the negative consequences of
stress. However, over commitment is not the solution but a problem in itself. For
example burnout has been related with dedicated and committed workers who feel
internal pressure to work (Freudenberger, 1974) and accumulated stresses can force the
dedicated educators to burn out. Moreover, the job description and the roles must be
fixed at the start of the job as a contractual agreement and it must match the educator‘s
interest, experience and academic background.
Furthermore if a teacher has been assigned different jobs at a time, with different roles
to play, it must be formally communicated to him/her with clear guidelines and
parameters defined to avoid any role ambiguity. He/she should be appraised against the
expectations and good work be acknowledged in public at the end of the day to keep
him motivated. If otherwise next time if he has to play the same role, not applauded last
time, the supervisor may not find the element of commitment but compliance and
ultimately resistance in the subordinate‘s attitude. The expected outcomes from
clarifying the job description and reducing role conflict in an academic setup will be:
Negative consequences of stress for the teachers will be reduced.
Teacher – student conflicts in the classroom and will be reduced.
Congenial relationships between the teachers, the students and the captains of
their institutions will be augmented.

109 Vol. 2, Issue 2 (ISSN No. 2414-2336)
b. Grievance Handling: There should be proper grievance handling committee with
experienced committee members. The culture of ―Who brings a trouble is a trouble
maker‖ should be avoided and the grievances be welcomed to avoid an atmosphere of
stress. Few of the recommendations regarding grievance handling are as follows:
Grievances should be resolved promptly and in accordance with relevant
policy of the university.
Reasonable steps must be followed to make sure the confidentiality of the
faculty member forwarding the grievance and s/he should be protected from
victimization.
The resolution process must be fair and impartial and records must be
maintained in a proper way.
Additionally the teacher orientation and socialization which starts right after s/he apply
for a job (Shahzad, Khan & Shah, 2015) should not be taken for granted and grievance
handling procedures should be made clear to all the new entrants.
c. Office Environment and Resources: Office environment and resources include the
physical office environment, ergonomics, availability of equipment i.e. computers,
printers, lab equipment, multimedia /overhead projector etc. It also includes the support
staff which reduces your work load particularly in handling the petty issues like
photocopying of notes, helping you to install the technical devices etc. It is advised that
sufficient number of Multimedia Projectors, Printers etc. be available for the faculty.
Each department should have its own technical staff to take care of these machines on
regular basis. Backup equipment be available to be utilized in emergency. The
departments be provided with equipment and support staff (peons) corresponding to the
number of faculty members inducted.
Furthermore the offices should be ergonomically designed, with smart office setup to
avoid the problems of backache, headache, eye irritations and other problems of
muscles and bones due to improper workstation and lighting/heating/cooling
arrangements.
d. Supportive Relationships: Supportive relationships, togetherness and lack of
conflict with co-workers are considered as a faculty‘s best assetto overcome isolation
and overload which is usually considered a major cause of faculty stress. Teams/small
groups of faculty can provide valuable support toone another, particularly to new team
members who seem to be surrendering to stress, and practicing what Claxton (p. 78)
calls "creative ranting and raving". Such teams support the team members by offering
constructive solutions to stressful situations, distributing their assignments to reduce
work overload. However it should be kept in mind that stress is not only experienced
in the early career stage teachers, but also at senior levels so such issues should be
addressed at all levels.
Some other recommendations based on personal observations and interviews include:
Recognition and appreciation of even small achievements in public based on
equity.
110 Vol. 2, Issue 2 (ISSN No. 2414-2336)
Unnecessary supervision and control which hurts the ego should be reduced at
bare minimum level and less intrusive means should be used wherever required.
Ensure proper time management at top level and unnecessary marathon
meetings be avoided particularly after office hours.
Unnecessary intrusion into the personal life of employees be reduced unless it is
required in special cases where it challenges the organizational culture.
Faculty from other cities be provided with appropriate accommodation as it has
been observed one of the important sources of stress. Though its not
occupational stress but its negative effects are trickled down to the performance
of the employees.
Arrangement of transport facilities for pick & drop and official assignments
should be streamlined.
Appropriate orientation be provided to all faculty on regular basis to clarify the
procedures regarding dealing with other departments e.g. re-imbursement of
bills, etc.
Time pressure be reduced and enough time be given to faculty to carry on with
their transactional academic assignments e.g. paper checking, marks uploading
etc.
Appropriate parking and café‘ arrangements specifically for faculty be arranged.
Special arrangements for female sports, aerobics etc. as they can‘t enjoy the
same as male faculty members can do in open play grounds
Finally, small signs such as words of gratitude during formal gatherings,
informal tea clubs, excursion trips and back rubs can help to raise a sense of
companionship among teachers.
There are many other individual level effective strategies for overcoming the negative
impacts of stress. These include
Physical activities (e.g. swimming, working out, jogging, sports, etc);
Self-entertainment (reading for pleasure, movies, excursions, concerts); and
Personal interests (hobbies such as gardening etc.)
Turning to God i.e. offering regular prayers and visits to holy places.
Venting of emotions and talking your heart out with friends.
Usually for teachers, drawing a perfect line of separation between work & personal
time is difficult as teachers are used to with bringing office work to home e.g.
(numerical assessment of students‘ assignments/quizzes, lecture preparation, deadlines
to submit research papers/projects). However effective time management strategies can
help them to overcome such issues and the habit of procrastination as well. Unforeseen
commitments and disturbances must be avoided during office hours so maximum time
can be dedicated to office affairs while their stay at the campus. In this way, they can
have sufficient leisure time to enjoy with friends and family after the office hours
particularly during the weekends.
111 Vol. 2, Issue 2 (ISSN No. 2414-2336)
Study Limitations & Suggestions for Future
From the empirical study perspective, this exploratory research study is subject to some
limitations which includes a smaller sample size from only one public sector university,
convenience based sampling, less number of female faculty members, data collection
just at a point of time rather than a longitudinal research design. We focused more on
questionnaires (quantitative methods) and less on interviews and cross sectional data
from the office bearers such as Registrar and HR offices. Such inputs/data if involved
in the study are definitely invaluable but it was not possible to exhaust these sources
due to some administrative bottlenecks and dearth of resources. Summing up, these
study limitations were because of limited finances and time constraints. Larger number
of respondents if selected randomly from various public sector universities would have
been considered as more pragmatic research design, which in turn would have led to
more generalizable results. For future research in this domain, we suggest to use
triangulation strategy, the data should be collected over a period of time, causal
relationships should be studied and advanced quantitative & quantitative techniques
should be used.
References
Abbas, G., Shahab, M. A., & Badar, K. (2016). Somatization and Depression Among
University Students: Antecedents and Antidotes. Sarhad Journal of Management
Sciences, 2(1), 74-93.
AntidotesAntonioni, D. (1996). Two strategies for responding to stressors: Managing
conflict and clarifying work expectations. Journal of Business and Psychology,
11(2).
Brown, M. & Ralph, S. (1998). The identification of stress in teachers. In J. Dunham &
V. Varma (Eds.), Stress in Teachers: Past, Present, and Future. (37-56). London:
Whurr.
Caplan, R. D., & Jones, K. W. (1975). Effects of work load, role ambiguity, and type A
personality on anxiety, depression, and heart rate. Journal of applied psychology,
60(6), 713.
Claxton, G. (1989). Being a Teacher: A Positive Approach to Change and Stress.
London: Cassell.
Dunham, J. & Varma, V. (1992). Stress in Teachers: Past, Present, and Future. (120-
138). London: Whurr.
Fotinatos-Ventouratos, R., Cooper, C. (2005). The role of gender and social class in
work stress. Journal of Managerial Psychology, 20(1), 14-23.
Friedman, M. & Rosenman, R. H. (1959). Type A Behavior and Your Heart. New
York: Knopf.
Gillespie, N. A., Walsh, M, Winefield, A .H., Dua, J., & Stough, C. (2001).
Occupational stress in universities: Staff perceptions of the causes, consequences
and moderators of stress. Work & Stress, 53-72.
Gmelch, W.H. (1993). Coping with Faculty Stress. Newbury Park, CA: Sage.
112 Vol. 2, Issue 2 (ISSN No. 2414-2336)
Harkness, A. M. B., Long, B. C., Bermbach, N., Patterson, K., Jordan, S., & Kahn, H.
(2005). Talking about work stress: Discourse analysis and implications for stress
interventions. Work & Stress, 19, 121-136.
Hinton, J. W. & Rotheiler, E. (1998). The psychophysiology of stress in teachers. In J.
Dunham & V. Varma (Eds), Stress in Teachers: Past, Present, and Future. (95-
119). London: Whurr.
Johnson, S., Cooper, C., Cartwright, S., Donald, I., Taylor, P., & Millet, C. (2005). The
experience of work-related stress across occupations. Journal of Managerial
Psychology, 20, 178-187.
Jones, F., & Bright, J. (2001). Stress: Myth, Theory and Research. London: Prentice
Hall.
Kyriacou, C. (1998). Teacher Stress: Past and Present. In J. Dunham & V. Varma
(Eds). Stress in Teachers: Past, Present, and Future (1-13). London: Whurr.
Lazarus, R. S. (1991). Psychological stress in the workplace. In P. Perrewe (Ed.),
Handbook on Job Stress. USA: Select Press.
Lackritz, J. R. (2004). Exploring burnout among university faculty: Incidence,
performance, and demographic issues. Teaching and Teacher Education, 20(1),
713−729
Locke, W., Teichler, U. (2007). Introduction, the changing conditions for academic
work and career in select countries, Werkstattberichte, 66, 7-14.
Lu, L., Cooper, C. L., Kao, S.-F., Zhou, Y. (2003). Work stress, control beliefs and
well-being in Greater China – An exploration of sub-cultural differences between
the PRC and Taiwan. Journal of Managerial Psychology, 18(6), 479-510.
Shah, R., Rahman, U. R., & Abbas, G. (2015). An analysis of students‘ academic
performance: A case study of Sarhad University, Peshawar, Pakistan. Sarhad
Journal of Management Sciences, 1(1), 31-41.
Tytherleigh, M. Y., Webb, C., Cooper, C. L., & Ricketts, C. (2005). Occupational
stress in UK higher education institutions: A comparative study of all staff
categories. Higher Education Research & Development, 24(1), 41-61.
Robbins, S. P., & Judge, T. (2003). Essentials of Organizational Behavior. Upper
Saddle River: Prentice Hall.
Simmons, T. (1996). Student evaluation of teachers: Professional practice or punitive
policy? SHIKEN, 1(1), 12-16.
Swindoll, C. (1982). Strengthening Your Grip. Dallas: Word, Inc.
Selye, H. (1956). The Stress of Life, New York: McGraw-Hill.
Travers, C. & Cooper, L. (1998). Increasing costs of occupational stress for teachers. In
J. Dunham, & V. Varma (Eds). Stress in Teachers: Past, Present, and Future (57-
75). London: Whurr.
Winefield, A. H., Gillespie, N., Stough, C., Dua, J., Hapuarachchi, J., & Boyd, C.
(2003). Occupational stress in Australian university staff: Results from a national
survey. International Journal of Stress Management, 10(1), 51-63.

113 Vol. 2, Issue 2 (ISSN No. 2414-2336)
RELATIONSHIP BETWEEN EMPLOYEES MOTIVATION AND TURNOVER
INTENTION: EMPIRICAL STUDY OF TRAFFIC POLICE OF DISTRICT
CHARSADDA
Abid Khan, Scholar in Management Science, Qurtuba University of Science &
Technology, Peshawar
Itbar Khan, HoD Department of Education, University of Malakand
Shakeel Ahmed, Independent Researcher
Zakirullah, PhD Scholar, Qurtuba University of Science & Technology, Peshawar
Abstract: Motivation is the combination of all the factors both external
and internal that stimulate desire and energy in people and make them
constantly interested and committed to a job, role or subject, and enable
them to make efforts for achieving organizational goals. Less motivated
people can cause low performance, bad inspiration for co-workers,
employees burnout etc. every organization tries to utilize their employees
in an optimal way but sometimes motivation does restrict their desired
goals. As an employer expects his personnel to perform, employees also
expect something in return, which works as stimulus for motivation and
when employees expectations are not fulfilled, addressed they simply
leave the organization. This study was approached with the purpose of
finding the perceived level of motivation (both intrinsic and extrinsic) and
its effect upon employee's turnover intention. Data were collected
through predesigned, self administered questionnaire. 62 respondents
participated actively . For data investigation statistical measures like
percentage, frequency, correlation and linear regression were used. For
determining the validity Cronbach's alpha was used and it found that all
the variables values stood above the minimum level of 0.70. showing the
reliability of the data. The end results showed that both intrinsic
motivation and over all motivation had effects upon turnover intention
and it was concluded that there is significant and empirical correlation
between motivation and turnover intention and also between intrinsic
motivation and turnover intention.
Key words: Motivation, intrinsic motivation, extrinsic motivation and
turnover intention.
Introduction
The word motivation is taken from the Latin word ―movere‖, which means to cause
moment. Authors like Bateman et al. (1999) stated that if employees of an organization
are motivated, they will perform above their perceived level of intelligence and skills.
They have also mentioned that even the talented people will not deliver to their
optimum level, if they are less motivated. Stoke (1999) stated that "A mental attribute
that leads to a person's degree of allegiance and later this allegiance level provides the
base for organizational performance" is called motivation.

114 Vol. 2, Issue 2 (ISSN No. 2414-2336)
Harackiewicz and Sansone (2000) defined motivation as, ―any stimulus generated
internally which causes generation and directing of behavior". They have given certain
examples as hunger and thirst, recognition, rewards etc causes motivation. Motivation
has been used to explain types of behavior since long ago i.e. behavior driven by
extrinsic rewards or punishment, behavior driven by basic biological needs or drives
related to procreation (hunger or thirst) and survival. Their explanations also states that
the need or desire to achieve particular outcomes i.e. recognition or avoidance of
punishment, promotion also motivates behavior. Germann (2004) also confirmed and
restated the findings of Sansone et al. (2000) and has highlighted the importance of
individual's motivation for their maximum level output.
The purpose of this study was to find the motivation level of employees in relation with
employee's turnover intention. The aim is also to find the more prevailing type of
motivation i.e. intrinsic or extrinsic in the studied organization. The marginal aim of
the study it among traffic police. Motivation plays a vital role in employee's
performance. The main problem our understudy organization faces is the negative
perception of the local police. People think that they are not socially responsible and
are involved in 1) bribes, 2) exploitation, and 3) miss-use of power. We have tried to
figure out their motivation level and as motivation can be externally in shape of salary,
allowances etc or internally in shape of sense of attachment, value, pride etc, we have
assumed that the negative perception of the people may be due to low performance of
this institution and again this low performance may be due to their low level of
motivation.
The basic concern and motive behind our proposed study can be categorized into three
parts, which are different in nature from each other.
1. To find out the relationship of motivation on turnover intention.
2. To investigate the relationship of intrinsic motivation on turnover intention.
3. To investigate the relationship of extrinsic motivation on turnover intention.
Research Hypothesis
H1: There is a significant association of employee's motivation with turnover intention.
H2: There is significant relationship between intrinsic motivation and turn over
intention.
H3: There is significant relationship between extrinsic motivation and turnover
intention.
Significance of the Study
Traffic police like our other security personnel perform their duty in different
conditions. So it is worth to find out as well that whether they are motivated for
performing their duties or not as they are playing an important part in our society where
taking a u-turn without being of a traffic police man is so difficult. So there duty is
important for us and we should give importance to them as well and we have tried to
115 Vol. 2, Issue 2 (ISSN No. 2414-2336)
seek out their motivating and demotivating factors, so that we could gauge their
performance and take the essential steps for its betterment. The study target population
will be only Charsadda traffic police and will try to find the aforementioned
relationship between motivation and turnover intention.
Literature Review
There are different theories regarding motivation which describes how and why human
behavior is directed towards a specific direction and also being activated. These
theories are broadly categorized into two different groups i.e. 1) Content 2) Process
theories.
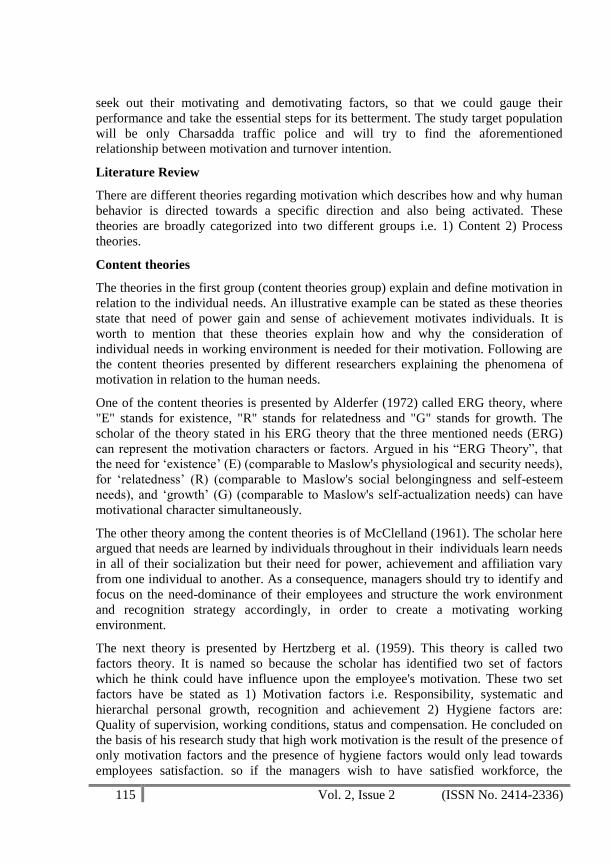
Content theories
The theories in the first group (content theories group) explain and define motivation in
relation to the individual needs. An illustrative example can be stated as these theories
state that need of power gain and sense of achievement motivates individuals. It is
worth to mention that these theories explain how and why the consideration of
individual needs in working environment is needed for their motivation. Following are
the content theories presented by different researchers explaining the phenomena of
motivation in relation to the human needs.
One of the content theories is presented by Alderfer (1972) called ERG theory, where
"E" stands for existence, "R" stands for relatedness and "G" stands for growth. The
scholar of the theory stated in his ERG theory that the three mentioned needs (ERG)
can represent the motivation characters or factors. Argued in his ―ERG Theory‖, that
the need for ‗existence‘ (E) (comparable to Maslow's physiological and security needs),
for ‗relatedness‘ (R) (comparable to Maslow's social belongingness and self-esteem
needs), and ‗growth‘ (G) (comparable to Maslow's self-actualization needs) can have
motivational character simultaneously.
The other theory among the content theories is of McClelland (1961). The scholar here
argued that needs are learned by individuals throughout in their individuals learn needs
in all of their socialization but their need for power, achievement and affiliation vary
from one individual to another. As a consequence, managers should try to identify and
focus on the need-dominance of their employees and structure the work environment
and recognition strategy accordingly, in order to create a motivating working
environment.
The next theory is presented by Hertzberg et al. (1959). This theory is called two
factors theory. It is named so because the scholar has identified two set of factors
which he think could have influence upon the employee's motivation. These two set
factors have be stated as 1) Motivation factors i.e. Responsibility, systematic and
hierarchal personal growth, recognition and achievement 2) Hygiene factors are:
Quality of supervision, working conditions, status and compensation. He concluded on
the basis of his research study that high work motivation is the result of the presence of
only motivation factors and the presence of hygiene factors would only lead towards
employees satisfaction. so if the managers wish to have satisfied workforce, the
116 Vol. 2, Issue 2 (ISSN No. 2414-2336)
managers will have to ensure that the set of hygiene factors for the employees are
addressed and met precisely, and if any of the managers wishes his/her personnel to
exert more effort additionally, he/she will have to address the motivation factors
adequately in shape of recognition of their work, efforts and valued outcomes and in
return should offer professional development opportunities, employees autonomy and
responsibilities.
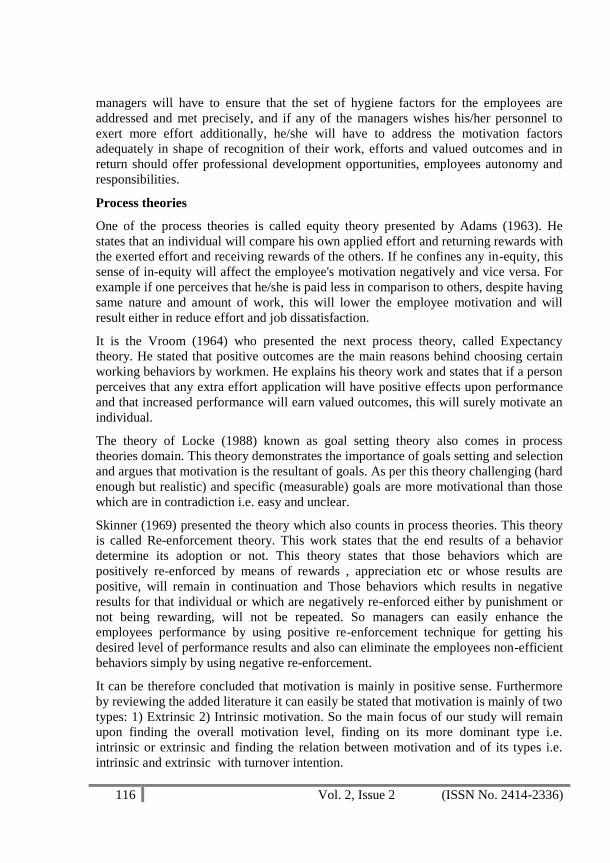
Process theories
One of the process theories is called equity theory presented by Adams (1963). He
states that an individual will compare his own applied effort and returning rewards with
the exerted effort and receiving rewards of the others. If he confines any in-equity, this
sense of in-equity will affect the employee's motivation negatively and vice versa. For
example if one perceives that he/she is paid less in comparison to others, despite having
same nature and amount of work, this will lower the employee motivation and will
result either in reduce effort and job dissatisfaction.
It is the Vroom (1964) who presented the next process theory, called Expectancy
theory. He stated that positive outcomes are the main reasons behind choosing certain
working behaviors by workmen. He explains his theory work and states that if a person
perceives that any extra effort application will have positive effects upon performance
and that increased performance will earn valued outcomes, this will surely motivate an
individual.
The theory of Locke (1988) known as goal setting theory also comes in process
theories domain. This theory demonstrates the importance of goals setting and selection
and argues that motivation is the resultant of goals. As per this theory challenging (hard
enough but realistic) and specific (measurable) goals are more motivational than those
which are in contradiction i.e. easy and unclear.
Skinner (1969) presented the theory which also counts in process theories. This theory
is called Re-enforcement theory. This work states that the end results of a behavior
determine its adoption or not. This theory states that those behaviors which are
positively re-enforced by means of rewards , appreciation etc or whose results are
positive, will remain in continuation and Those behaviors which results in negative
results for that individual or which are negatively re-enforced either by punishment or
not being rewarding, will not be repeated. So managers can easily enhance the
employees performance by using positive re-enforcement technique for getting his
desired level of performance results and also can eliminate the employees non-efficient
behaviors simply by using negative re-enforcement.
It can be therefore concluded that motivation is mainly in positive sense. Furthermore
by reviewing the added literature it can easily be stated that motivation is mainly of two
types: 1) Extrinsic 2) Intrinsic motivation. So the main focus of our study will remain
upon finding the overall motivation level, finding on its more dominant type i.e.
intrinsic or extrinsic and finding the relation between motivation and of its types i.e.
intrinsic and extrinsic with turnover intention.

117 Vol. 2, Issue 2 (ISSN No. 2414-2336)
Research Methodology
Sampling design
The target population of this study is traffic policemen serving at District Charsadda.
There are 65 policemen working at the mentioned locality. As it is clear that their
number was less than 100 which could easily be approached and studied so we selected
all the employees working at the locality but in the end got the response of 62
personnel. We have used convenient sampling technique for our study.
Variables of the study
The principal purpose of our conducted study was to find the relationship of two
qualitative variables i.e."Motivation" and "turnover intention". So motivation worked
as independent and turnover intention as dependent variable. Also intrinsic motivation
and extrinsic motivated were used as independent variables for turnover intention.
Theoretical model
Data collection method
Primary data were collected through pre-designed questionnaires, administered
personally. Likert five point scale was adopted for getting the respondents response and
all the questionnaire questions were close ended. The questionnaire consisted of ten
questions regarding intrinsic motivation, ten questions were about extrinsic motivation
and three questions were regarding turnover intention. Best efforts were made to get
the true responses by visiting almost every individual personally. For the sake of
removing their ambiguities regarding the questions, regular visits were made.
Data analysis and measurement
SPSS was used for analyzing the collected data. As the study was consisted of
qualitative variables, counts and percentages were used for its interpretation. For
finding the possible association between variables, Pearson correlation method was
used and for finding the causes and effects of variables upon one another, we used
Regression Analysis.
Extrinsic Motivation
Motivation Turnover Intention
Intrinsic Motivation

118 Vol. 2, Issue 2 (ISSN No. 2414-2336)
Results and discussion
The succeeding tables show the results obtained by analyzing the collected information
from respondents working at the studied population about motivation and job turnover
intention. It is consisted of demographic details i.e. frequency and percentage,
reliability, Mean Average Score, Correlation and Regression values.
Demographic Details
Table 1 shows the results regarding Age, Qualification, Job scale, Current job and total
job experience.
Table 1 Frequencies and Percentages of Different Variables i.e. Age, Qualification,
Designation, Current Job Exp, Total job Experience.
Gro
up
Yea
rs
No
(%
)
Gro
up
Qu
alif
icat
ion
No
(%
)
Des
ign
atio
n
No
(%
)
Gro
up
Cu
rren
t jo
b
Ex
per
ien
ce
No
(%
)
Gro
up
To
tal
Ex
per
ien
ce
No
(%
)
20–25 6
(9.7) Primary
1
(1.6)
LHC
(05)
58
(93.5) 1–5
47
(75.8) 1–5
7
(11.3)
26–30 7
(11.3) Middle
43
(69.4)
HC
(07)
2
(3.2) 6–10
12
(19.4) 6–10
13
(21.0)
31–35 16
(25.8) Matric
13
(21.0)
IHC
(09)
1
(1.6) 11–15
2
(3.2) 11–15
11
(17.7)
36-40 15
(24.2) F.A
5
(8.1)
SI
(14)
1
(1.6) 16–20
1
(1.6) 16-20
10
(16.1)
41–45 9
(14.5) B.A 0(0) 00 00 00 00 21-25
16
(25.8)
46 –
50
8(12.
9) M.A
0
(0) 00 00 00 26-30 3(4.8)
51 –
55 1(1.6) MS
0
(0) 00 00 00 31+ 2(3.2)
Total 62
(100)
62
(100) 00
62
(100) 00
62
(100) 00
62
(100)
Source: field data.
It is worth to mention that we have received responses of different job scale employees.
The above table shows that out of our 62 respondents 58(93.5%) have a job scale stated
as L.H.C i.e. scale 05, 2(3.2) have a job scale called H.C. (07), 1(1.6) employee has a
scale of I.H.C (09) and one respondent has S.I (14) job scale.
The same table contains current job and total job experience values as well. The table
shows the experience in small intervals and each interval is confronted by its number of
respondents and its percentage value. The table explains that there are 47 (75.8%)

119 Vol. 2, Issue 2 (ISSN No. 2414-2336)
employees, who have their traffic police experience lying in the range of 1-5 years of
interval. Similarly 12 (19.4%) employees have their traffic experience equal to value in
the range of 6-10 years of interval,2 (3.2%) and 1 (1.6%) employees have experience
value in the range of 11-15 years and 16-20 years respectively.
The very same table also consists of "Total job experience" values, their frequencies as
per different intervals and percentage as well. The experience of 7 (11.3%) employees
is located in the interval 1-5 years, 13 (21.0%) employees have experience values in the
interval of 6-10 years. Hence forth employees of frequency number 11 (17.7%) total
job experience value lays in the interval of 11-15 years, 10 (16.1%) employees total
experience value is somewhere located in the interval of 16-20 years,16 (25.8%) have
total job experience in the interval of 21- 25 years, 3 employees value is located in the
range of 26-30 years and 2 (3.2%) are very seasoned and has their total job experience
value in the interval of 31-35 years.
Reliability co-efficient
Table 2 shows the reliability co-efficient of different factors of motivation and turnover
intention. Cronbach's Alpha (α) has been used for checking the reliability of the data.
According to Cronbach's Alpha (α), data which result is 60% or more after being
checked for the said reliability, the data can be called as reliable and one can surely
trust upon this data and its vitalness. The following table shows the percentage values
of different variables. All of the variables values are reliable (individually). The overall
reliability value for the data is 60% which is a proof of the fact that the scale is reliable
(Green et al., 2000). So we can trust upon the results obtained from the data collected.
Table 2 Reliability Measure of Different Variables.
Category Cronbach's Alpha (%) Remarks
Extrinsic Motivation 71.4 Reliable
Intrinsic Motivation 73.2 Reliable
Motivation 75.00 Reliable
Turnover intention 73.9 Reliable
Correlation between employees Motivation, turnover intention, Intrinsic and
extrinsic Motivation
Table 3 shows the Pearson's co-efficient of correlation of the variables under study.
Pearson correlation was considered in order to evaluate the means of employees
Motivation, turnover intention, and Intrinsic and Extrinsic motivation. The result
showed that the three variables are significantly correlated and also we can find the
direction of effects among the variables i.e. how they will effect each other.

120 Vol. 2, Issue 2 (ISSN No. 2414-2336)
It is clear from the table that there is a significant and positive relationship between
intrinsic and extrinsic motivation in the selected sample (o.261 (*), p< 0.05). The result
indicates that in the studied organization both intrinsic and extrinsic motivations are
positively correlated and increase in one will lead to the consecutive increase in the as
well. Also the table values indicate that intrinsic motivation (0.778(*), p< 0.01) and
extrinsic motivation (0.803(*), p<0.01) have significant positive correlation with
Motivation. We can clearly assume from the above table results that increase or
decrease in intrinsic motivation or extrinsic motivation individually, will directly lead
towards increase or decrease in employees over all motivation.
The matrix of correlation indicates that intrinsic motivation (-0.276(*), p<0.05) and
overall motivation (-0.260(*), p<0.05) have significant but negative correlation
individually with turnover intention and increase or decrease in both of the variables
individually will cause different inverse effect upon turnover intention in the studied
organization. I.e. if intrinsic motivation will increase, turnover intention will decrease
and same will be the effect if over all motivation on turnover intention. Extrinsic
motivation has also negative correlation but insignificant correlation with turnover
intention i.e. (-0.120). Though the matrix values indicates insignificant correlation but
still it does not neglects its existence and the effect of extrinsic motivation upon
turnover intention may be minor but exists.
Table 3. Pearson's Correlation of Employee's Motivation, Turnover Intention,
Intrinsic and Extrinsic Motivation.
Variables Intrinsic
Motivation
Extrinsic
Motivation
Motivation Turnover
Intention
Intrinsic Motivation 1
Extrinsic Motivation 0.261* 1
Motivation 0.778* 0.803* 1
Turnover intention - 0.276* - 0.120 -0.260* 1
*.Correlation is significant at the 0.05 level (2-tailed).
Regression analysis between intrinsic motivation and turnover intention
Table 4 shows regression analysis of intrinsic motivation and turnover intention.
Values in the table show that there is a negative and significant relationship between
the two terms .i.e. intrinsic motivation and employee's turnover intention of the
employees in traffic police of Charsadda, which were selected for the study. The value
of t-ratio is 2.22 (which is well above the critical level 1.96 for 5% significance
(Joreskog & Sorbom, 1993), p<0.05, and the overall significance is 4.93 which is
greater than 3. Khan (2013) conducted a qualitative study for finding the relationship of
job stress (independent variable) with Employees performance, job satisfaction and
workload. The regression values he obtained were t >2, p< .05 and F-value was greater
121 Vol. 2, Issue 2 (ISSN No. 2414-2336)
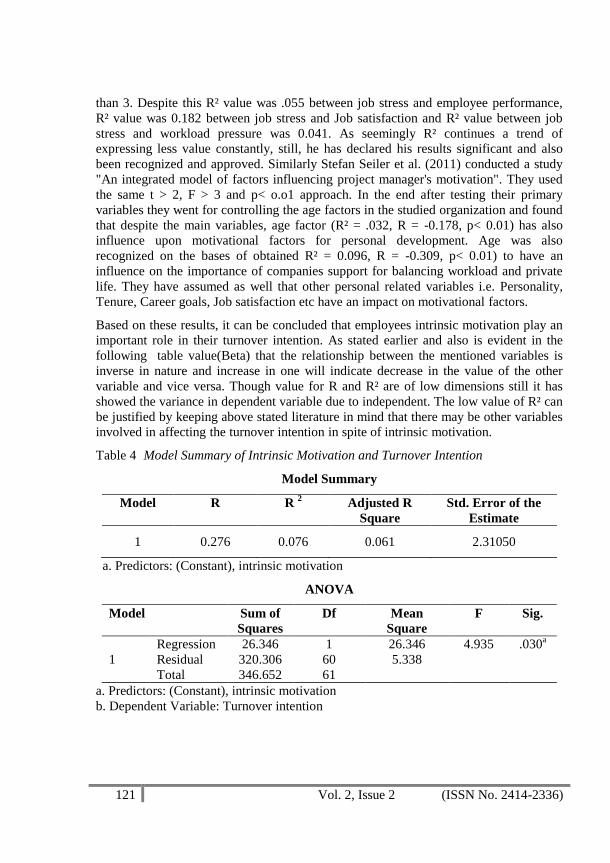
than 3. Despite this R² value was .055 between job stress and employee performance,
R² value was 0.182 between job stress and Job satisfaction and R² value between job
stress and workload pressure was 0.041. As seemingly R² continues a trend of
expressing less value constantly, still, he has declared his results significant and also
been recognized and approved. Similarly Stefan Seiler et al. (2011) conducted a study
"An integrated model of factors influencing project manager's motivation". They used
the same t > 2, F > 3 and p< o.o1 approach. In the end after testing their primary
variables they went for controlling the age factors in the studied organization and found
that despite the main variables, age factor (R² = .032, R = -0.178, p< 0.01) has also
influence upon motivational factors for personal development. Age was also
recognized on the bases of obtained R² = 0.096, R = -0.309, p< 0.01) to have an
influence on the importance of companies support for balancing workload and private
life. They have assumed as well that other personal related variables i.e. Personality,
Tenure, Career goals, Job satisfaction etc have an impact on motivational factors.
Based on these results, it can be concluded that employees intrinsic motivation play an
important role in their turnover intention. As stated earlier and also is evident in the
following table value(Beta) that the relationship between the mentioned variables is
inverse in nature and increase in one will indicate decrease in the value of the other
variable and vice versa. Though value for R and R² are of low dimensions still it has
showed the variance in dependent variable due to independent. The low value of R² can
be justified by keeping above stated literature in mind that there may be other variables
involved in affecting the turnover intention in spite of intrinsic motivation.
Table 4 Model Summary of Intrinsic Motivation and Turnover Intention
Model Summary
Model R R 2 Adjusted R
Square
Std. Error of the
Estimate
1 0.276 0.076 0.061 2.31050
a. Predictors: (Constant), intrinsic motivation
ANOVA
Model Sum of
Squares
Df Mean
Square
F Sig.
1
Regression 26.346 1 26.346 4.935 .030a
Residual 320.306 60 5.338
Total 346.652 61
a. Predictors: (Constant), intrinsic motivation
b. Dependent Variable: Turnover intention

122 Vol. 2, Issue 2 (ISSN No. 2414-2336)
Coefficients
Model Unstandardized
Coefficients
Standardized
Coefficients
T Sig.
B Std. Error Beta
1 (Constant) 13.106 1.910 6.863 0.000
Intrinsic
motivation - 0.128 0.058 -0.276 -2.222 0.030
a. Dependent Variable: Turnover intention
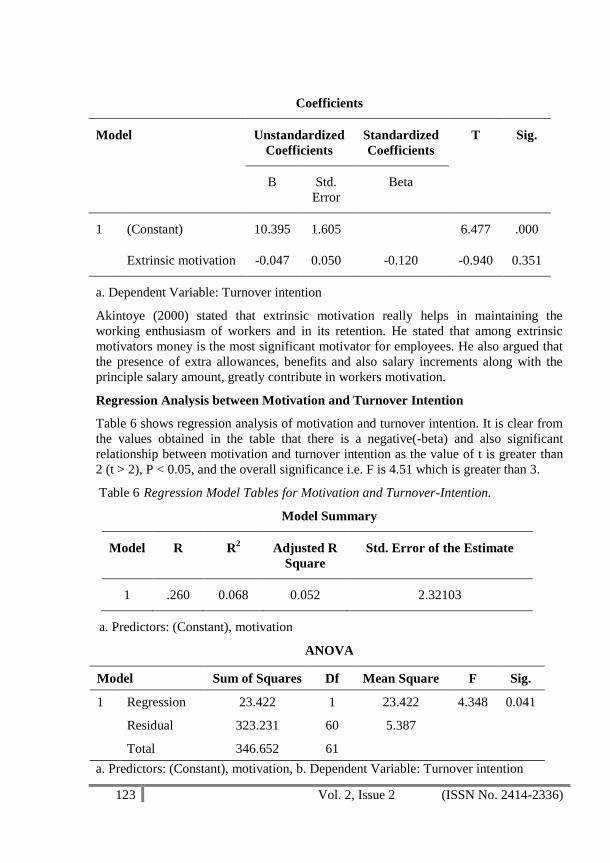
Regression Analysis between Extrinsic Motivation and Turnover Intention
It is clear from the values obtained in the table 5 that there is a negative but non-
significant relation between extrinsic motivation and Turnover intention. As it is clear
that in the following table i.e.4.7.2 the value of t-ratio is less than 2 (t > 2), P < 0.05,
and the overall significance value i.e. F value, is less than 3. The aforementioned
values indicate that the relationship between extrinsic motivation and turnover
intention is not a significant one.
Table 5 Regression Model Tables for Extrinsic Motivation and Turnover Intention.
Model Summary
Model R R Square Adjusted R
Square
Std. Error of the
Estimate
1 0.120a 0.015 -0.002 2.38615
a. Predictors: (Constant), Extrinsic motivation
ANOVA
Model Sum of
Squares
Df Mean
Square
F Sig.
1 Regression 5.029 1 5.029 0.883 0.351
Residual 341.624 60 5.694
Total 346.652 61
a. Predictors: (Constant), Extrinsic motivation
b. Dependent Variable: Turnover intention
123 Vol. 2, Issue 2 (ISSN No. 2414-2336)
Coefficients
Model Unstandardized
Coefficients
Standardized
Coefficients
T Sig.
B Std.
Error
Beta
1 (Constant) 10.395 1.605 6.477 .000
Extrinsic motivation -0.047 0.050 -0.120 -0.940 0.351
a. Dependent Variable: Turnover intention
Akintoye (2000) stated that extrinsic motivation really helps in maintaining the
working enthusiasm of workers and in its retention. He stated that among extrinsic
motivators money is the most significant motivator for employees. He also argued that
the presence of extra allowances, benefits and also salary increments along with the
principle salary amount, greatly contribute in workers motivation.
Regression Analysis between Motivation and Turnover Intention
Table 6 shows regression analysis of motivation and turnover intention. It is clear from
the values obtained in the table that there is a negative(-beta) and also significant
relationship between motivation and turnover intention as the value of t is greater than
2 (t > 2), P < 0.05, and the overall significance i.e. F is 4.51 which is greater than 3.
Table 6 Regression Model Tables for Motivation and Turnover-Intention.
Model Summary
Model R R2 Adjusted R
Square
Std. Error of the Estimate
1 .260 0.068 0.052 2.32103
a. Predictors: (Constant), motivation
ANOVA
Model Sum of Squares Df Mean Square F Sig.
1 Regression 23.422 1 23.422 4.348 0.041
Residual 323.231 60 5.387
Total 346.652 61
a. Predictors: (Constant), motivation, b. Dependent Variable: Turnover intention
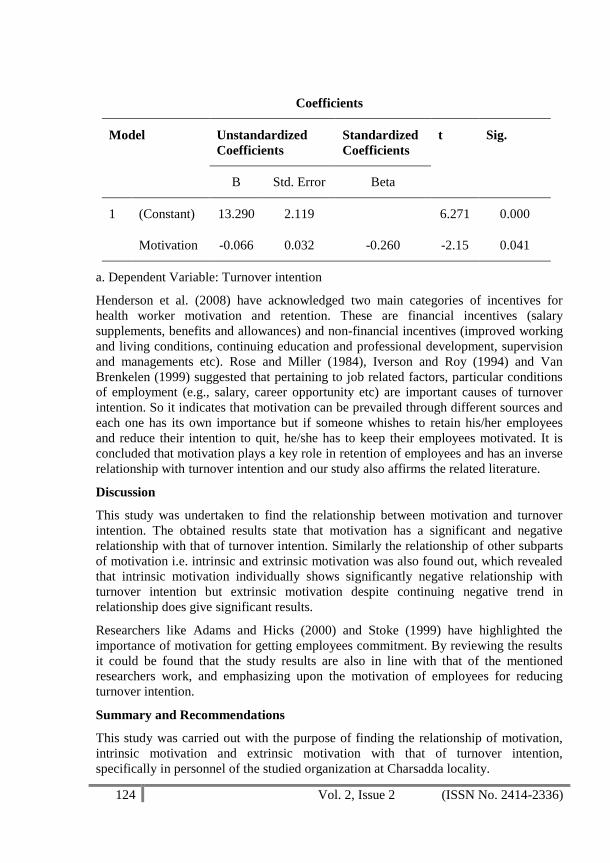
124 Vol. 2, Issue 2 (ISSN No. 2414-2336)
Coefficients
Model Unstandardized
Coefficients
Standardized
Coefficients
t Sig.
B Std. Error Beta
1 (Constant) 13.290 2.119 6.271 0.000
Motivation -0.066 0.032 -0.260 -2.15 0.041
a. Dependent Variable: Turnover intention
Henderson et al. (2008) have acknowledged two main categories of incentives for
health worker motivation and retention. These are financial incentives (salary
supplements, benefits and allowances) and non-financial incentives (improved working
and living conditions, continuing education and professional development, supervision
and managements etc). Rose and Miller (1984), Iverson and Roy (1994) and Van
Brenkelen (1999) suggested that pertaining to job related factors, particular conditions
of employment (e.g., salary, career opportunity etc) are important causes of turnover
intention. So it indicates that motivation can be prevailed through different sources and
each one has its own importance but if someone whishes to retain his/her employees
and reduce their intention to quit, he/she has to keep their employees motivated. It is
concluded that motivation plays a key role in retention of employees and has an inverse
relationship with turnover intention and our study also affirms the related literature.
Discussion
This study was undertaken to find the relationship between motivation and turnover
intention. The obtained results state that motivation has a significant and negative
relationship with that of turnover intention. Similarly the relationship of other subparts
of motivation i.e. intrinsic and extrinsic motivation was also found out, which revealed
that intrinsic motivation individually shows significantly negative relationship with
turnover intention but extrinsic motivation despite continuing negative trend in
relationship does give significant results.
Researchers like Adams and Hicks (2000) and Stoke (1999) have highlighted the
importance of motivation for getting employees commitment. By reviewing the results
it could be found that the study results are also in line with that of the mentioned
researchers work, and emphasizing upon the motivation of employees for reducing
turnover intention.
Summary and Recommendations
This study was carried out with the purpose of finding the relationship of motivation,
intrinsic motivation and extrinsic motivation with that of turnover intention,
specifically in personnel of the studied organization at Charsadda locality.
125 Vol. 2, Issue 2 (ISSN No. 2414-2336)
To achieve the desired objectives, primary data was collected at first instance through
pre-designed questionnaires. All the questions in there were close ended. In fact each
questionnaire was a combination of three questionnaires' .i.e. intrinsic motivation,
extrinsic motivation and turnover intention questionnaires. Questionnaire for intrinsic
motivation was designed by Williams and Anderson (1991), extrinsic motivation
questionnaire was again designed by Williams and Anderson (1991), and questioner for
finding turnover intention was developed by Camman et al (1979). As the questions
were close- ended, five point Likert scale was used to measure various views and
responses.
After collecting the data its reliability was measured by using Cronbach's Alpha.
Correlation among the variables was tested by the use of Pearson correlation. Due to
qualitative nature of the data firstly variables are presented in the form of counts and
percentages. For investigating the perception of respondents regarding each variable,
Mean average score (MAS) were calculated and for further justification of the results,
regression analysis was calculated at 5% level of significance.
However after measuring the Cronbach's Alpha for all the variables it can be stated that
as for every individual variable the value was greater than .65 and even greater than
0.70, the data is reliable. Similarly correlation technique was used in order to examine
the possible association and its nature among the variables. Keeping in view the
correlation table values, it can be found that there is significant and inverse relationship
between Motivation and turnover intention. Also the relationship between intrinsic
motivation and turnover intention is significant and inverse. However the relationship
between extrinsic motivation and turnover intention was not significant as per obtained
data results but is inverse.
Recommendations
1) The good working relationships should be preserved.
2) The government should impose such developmental policies, which could
promote desire and opportunities for higher education among the employees.
3) Government should introduce a systematic development plan based on the
education level of the employees.
4) Government and upper level personnel among the organization hierarchy
should promote proper need base training, not only for employees professional
development but also for creating awareness regarding social responsibilities.
References
Adams, J. S. (1963). Toward an understanding of equity. Journal of Abnormal &
Social Psychology, 67, 422–436.
Adams, O. & Hicks, V. (2000). Pay and non-pay incentives, performance and
motivation. Paper prepared for the world health organization, December
.2000. Health workforce strategy group: World health organization,
department of services delivery Geneva.
126 Vol. 2, Issue 2 (ISSN No. 2414-2336)
Alderfer, C. P. (1972). Existence, Relatedness and Growth, Human Needs in
Organizational Settings. Free Press, New York.
Amundsen, S. & Corey, E. (2000). Decisions behind career choice for nurse
practitioners: independent versus collaborative practice and motivational-
needs behaviour, Clinical Excellence of Nursing Practice, 5(4), 309-315.
Bateman, T. S., & Snell, S. (1999). Management—Building Competitive Advantage (4th
ed.). McGraw-Hill Boston.
Beecham, S, N. Baddo, T. H, Robinson, H., & Sharp, H. (2008). Motivation in
software engineering, a systematic literature review. Information and Software
Technology, 50 (9–10), 860–878.
Boehm, B. W. (1981). Software Engineering Economics. Prentice Hall, Englewood
Cliffs, NJ.
Davis, F. D., Bagozzi, R.P., & Warshaw, P. R. (1992). Extrinsic and intrinsic
motivation to use computers in the workplace. Journal of Applied Social
Psychology, 22(14), 1111–1132.
Ebuehi, O. M., & Campbell, P. C. (2011). Attraction and retention of qualified health
workers to rural areas in Nigeria: A case study of four LGAs in Ogun State,
Nigeria. Rural and Remote Health, 11(15).
Germann, M. (2004). Influence of project managers on the motivational factors of a
project team. Paper Presented at the 13th International Conference on
Management of Technology IAMOT, Washington, DC. April.
Hackman, .J. R., & Oldman, G. R. (1980). Work Re-design. Reading, MA : Addison-
Wesley.
Henderson, L. N., & Tulloch (2008). Incentives for retaining and motivating health
workers in pacific and Asian countries: Human Resource for Health, 6: 18.
Hertzberg, F. B., Mausner, & Snyderman, B.B. (1959). The Motivation to Work. John
Wiley, New York.
Huemann, M. (2010). Considering human resource management when developing a
project-oriented company: Case study of a telecommunication company.
International Journal of Project Management, 25, 315–323.
Iverson, .C. F, Roy. 1994. Ross and Miller .1984. Brenkelen, Van. 1999.
Joreskog, K. G., Sorbom, D. (1993). LISREL 8: Structural Equation Modeling with the
SIMPLIS Command Language. Scientific Software, Chicago.
Khan, A, (2013). The Effect of Job Stress on Job Outcomes of the Employees. MS
Thesis, IBMS.
127 Vol. 2, Issue 2 (ISSN No. 2414-2336)
Kotzee, T., & Couper, I. D. (2006). What interventions do South African qualified
doctors think will retain them in rural hospitals of the Limpopo province of
South Africa, Rural Remote Health, 6(3).
Locke, E. A. (1968). Towards a theory of task motivation and incentives.
Organizational Behavior and Human Performance, 3, 157–189.
Manongi, R., Marchant, T., & Bygbjerg, I. C. (2006). Improving motivation among
primary health care workers in Tanzania, a health worker perspective. Human
Resources for Health, 4(1).
Maslow, A. H. (1943). A theory of human motivation. Psychological Review 50, 370–
396.
McClelland, D. (1961). The Achieving Society. The Free Press, New York.
Morrison, R., Jones, L., & Fuller, B. (1997). The relation between leadership style and
empowerment on job satisfaction of nurses. Journal of Nursing
Administration, 27(5), 27-34.
Nel, P. S., Gerber, P. D., Van Dyk, P. S., Haasbroek, G. D., Schultz, H. B., Sono, T., &
Werner, A. (2001). Human Resources Management (5th
ed.). Oxford
University Press, Cape Town, South Africa.
Nguyen, B. N., Nguyen, B. L., & Nguyen, L. H. (2005). Human resource for health in
Vietnam and the mobilization of medical doctors to commune health centers:
Asia pacific action alliance on Human resources for health country reviews
[available :http//www.aaahrh.org/docs.php.accessed 10-1-2010].
Sansone, C., & Harackiewicz, J. (2000). Intrinsic and Extrinsic Motivation: The Search
for optimal Motivation and Performance. Academic Press, San Diego, CA.
Seiler, S. B., Lent, M., Pinkowska, & Pilanzaa, M. (2011). An integrated model of
factors influencing project managers motivation, findings from a Swiss
survey. International Journal of Project Management, 30, 60-72.
Sharp, H., Baddoo, N., Beecham, S., Hall, T., & Robinson, H. (2009). Models of
motivation in software engineering. Information and Software Technology,
51(1), 219–233.
Skinner, B. F. (1969). Contingencies of Reinforcement: A Theoretical Analysis.
Prentice-Hall, Englewood Cliffs, NJ.
Snell, S. (1999). Motivate Your Staff—Self Study Workbook (2nd
ed,). Kogan Page
Limited, London.
Vroom, V. H. (1964). Work and Motivation. John Wiley & Sons, New York.
WHO (2006). The World Health Report: Working Together for Health. Geneva.
Wiley, C. (1997). What motivates employees according to over 40 years of motivation
surveys. International Journal of Manpower, 18(3), 263–280.
128 Vol. 2, Issue 2 (ISSN No. 2414-2336)
DOES ORGANIZATIONAL LEARNING ORIENTATION MATTER?
INVESTIGATING THE IMPACT OF LEARNING ORIENTATION ON SMES
PERFORMANCE
Jawad Hussain, Assistant Professor, University of Malakand
Email: [email protected])
Fayaz Ali Shah, 2Assistant Professor, Islamia College University Peshawar
Muhammad Ayub Khan, PhD Scholar, PhD Scholar, Dongbei University of Finance &
Economics, Dalian, China
Abstract. The purpose of this study was to conduct an investigation into
the link between organizational learning orientation and business
performance in small and medium sized enterprises (SMEs). Data were
analysed using sample of 213 SMEs belonging to the manufacturing
sector in Sialkot, Pakistan. The findings indicated that learning
orientation is positively and significantly associated with the
organizational performance of SMEs. The implications and limitations of
the study are discussed and possible future research directions are
provided.
Key words: Learning orientation, Performance, SMEs, Sialkot, Pakistan
Introduction
Business organizations are in continuous search to embrace and practice those
strategies that could enable them to obtain greater performance and sustainable
competitive advantage. Learning orientation is one of the key strategies that affects the
creation of knowledge and results in shaping the behaviour of employees and improved
performance (Dada & Fogg, 2014; Spicer & Sadler-Smith, 2006). According to Argyris
and Schön (1978) organizational members are the main learning agents who
dessiminate the accumulated knowledge in the organization. This shared knowledge
makes the organization effective in responding to the external and internal
environmental changes. Learning orientation refers to the willingness and acceptance
of learning by the members of an organisation (Rhee, Park, & Lee, 2010). In order to
rapidly respond to the challenges posed by external environment, organisations are
required to continuously learn new ideas, skills and processes (Kim & Atuahene-Gima,
2010). Embracing learning capabilities are crucial for ensuring long term survival and
growth of the organisation (Bharadwaj, Varadarajan, & Fahy, 1993). Understanding
these learning capabilities helps organisations in interpreting the effects of
environmental changes and providing an insight to organisations to better deal with
these changes (Daft & Weick, 1984). Learning has been highlighted in the strategic
management literature as a fundamental strategic factor that improves the company
performance and results in competitive advantage (Real, Roldán, & Leal, 2014).
Nevertheless, majority of the empirical studies on learning orientation-performance
relationship have focused on the large-scale organizations in developed countries
(Fang, Chang, Ou, & Chou, 2014; Wang, 2008). The SME sector has been paid less
attention by the scholars in terms of learning orientation (Dada & Fogg, 2014; Sanzo,
129 Vol. 2, Issue 2 (ISSN No. 2414-2336)
Santos, García, & Trespalacios, 2012). Moreover, research focusing on the learning
oriented behaviour of SMEs in developing countries is scant. Thus, the present study
fills the gap in the literature by examining the relationship between learning orientation
and organizational performance in the context of SMEs in Pakistan being a developing
country.
Literature Review
Learning orientation
Organizational learning has been considered vital for attaining greater organizational
performance and sustainable competitive advantage for large organizations (Choi,
2012; Lukas & Maignan, 1996) and SMEs in particular (Dada & Fogg, 2014).
Organizational learning is clearly linked to learning orientation in order to indirectly
measure organizational learning. An organization is said to have learning orientation if
it has a set of values that encourages its employees to create and use new knowledge
and also promote a culture wherein proactive learning occurs (Sinkula, Baker, &
Noordewier, 1997). Organisations undertake learning activities to increase their ability
to effectively compete in the changing market through creation of knowledge. Leaning
orientation has been highlighted in the research as a mean for collection, interpretation,
evaluation and dissemination of information for organizations (Moorman & Miner,
1998). Prior research has highlighted that an organisation‘s quest to obtain new
knowledge reflects the presence of learning orientation (Sinkula et al., 1997).
Notably, learning orientation is the basic mechanism to share the knowledge about the
past experiences among the organisational members (Lipshitz, Popper, & Oz, 1996).
The attitude and inclination of the individuals toward the process of learning play an
important role in its effectiveness. According to Slater and Narver (2000), the
organisation may change the attitude of the employees by taking steps like directing
employees towards learning through introducing new mental models, ingenuousness,
knowledge sharing, supporting the workers to try innovative methods to get their work
done and discarding the obsolete methods.
A culture which is conducive to generative learning is developed when a particular
organisation motivates and creates such an atmosphere wherein employees learn and
enable them to think creatively or out of box (Baker & Sinkula, 1999; Fang et al., 2014;
Sinkula et al., 1997). Here organisation is required to raise the learning level of internal
employees either through counselling by senior employees or hiring experts with
updated knowledge (Simon, 1991). According to Celuch et al. (2002), learning at
individual level is required to make the firm market oriented. Learning orientation and
market orientation jointly improve the capabilities of a firm and create superior
performance (Eris & Ozmen, 2012). It is the learning orientation aspect of an
organization that causes the creation of new knowledge and insights enabling the
organisation to behave as the market demands and ensures its due share in the available
market opportunities (Fang et al., 2014).
130 Vol. 2, Issue 2 (ISSN No. 2414-2336)
Learning orientation consists of commitment to learning, open-mindedness and shared
vision (Baker and Sinkula, 1999). ―Commitment to learning is the readiness of the
organization to change the way it does things by combining existing knowledge or
incorporating new knowledge. It includes the acquisition, communication, acceptation
and assimilation of the knowledge in the organization‖ (Jolly & Thérin, 2007, p. 237).
Committed organizations consider learning as an important factor for the survival and
growth of the organization. Open mindedness refers to questioning the traditional ways
of viewing market information and seeking the new ways of looking at market
phenomena (Troy, Szymanski, & Varadarajan, 2001). Open-mindedness injects new
ideas into the firms, strengthens creativity and ability to yield new opportunities that
favor product innovation (Calisir, Gumussoy, & Guzelsoy, 2013). Open-mindedness
promotes firms to achieve competitive advantage and gain great organizational
performance (Usaahawanitchakit, 2011).
Shared vision refers to an organisation-wide focus on learning (Sinkula et al., 1997).
Shared vision provides direction to organisational learning. It encourages the
organisational members to use their potential and exhibit commitment to make the
learning process successful (Day, 1994). Shared vision brings employees at a similar
level of understanding. This commonness in understanding creates commitment and
alignment with the learning direction taken by the organisation. This alignment is
necessary for creating motivation and a sense of responsibility to learn among the
employees (McKee, 1992).
Organisational performance
Performance is the difference between the actual and the expected outcomes.
Researchers generally use two methods to measure the organisational performance.
One is subjective method and the other is objective methods. Generally, objective
method measures the performance by three main indicators, i.e. growth, profitability
and market share. These indicators can also be measured as non financial indicators. it
is more appropriate to use non-financial indicators to bridge the gap created by the
insufficiency of information (Dess & Robinson, 1984). Jantunen et al. (2008)
recommend using subjective measures of performance because the collection of data
becomes easier using subjective approach. Generally the managers/ owners of the firms
hide the financial data and are reluctant to disclose the information to outsiders. Apart
from this, subjective measures provide reliable, correct, and accurate measure while
measuring the organizational performance from the perspective of SMEs (Escribá-
Esteve, Sánchez-Peinado, & Sánchez-Peinado, 2008; Khan & Khalique, 2014).
Moreover, a positive correlation exists between the outcomes obtained from objective
and subjective measures in the previous studies (Love, Priem, & Lumpkin, 2002). The
study of Kirca et al. (2005) have identified four types of performance outcomes that are
―organisational (financial) performance, customer related outcomes (customer
satisfaction), innovative outcomes (innovation) and employee related outcomes
(employee satisfaction). The current study is confined to only non-financial
performance of the organisations, that are customer satisfaction, employees‘
satisfaction, service quality, growth and innovation respectively‖ (p. 27) .

131 Vol. 2, Issue 2 (ISSN No. 2414-2336)
Learning Orientation and Organisational Performance
Learning orientation facilitates the organizations to acquire knowledge to enhance
organizational performance and gain sustainable competitive advantage (Baker &
Sinkula, 1999; Bing & Zhengping, 2011; Celuch et al., 2002; Kaya & Patton, 2011;
Slater & Narver, 1995; Suliyanto & Rahab, 2012). Organizations that are prone to
accepting new ideas, skills and process are better able to efficiently respond to market
environment changes (Baker & Sinkula, 1999; Calantone, Cavusgil, & Zhao, 2002;
Fang et al., 2014) and results in maintaining greater firm performance and sustained
competitive advantage in the long run (Alegre & Chiva, 2013; Hussain, Ismail, &
Akhtar, 2015; Jiménez-Jiménez & Sanz-Valle, 2011). Organization that adopt and
practice learning orientation are better able to adapt to the evolving business
environment by developing new products that meet the emerging consumer needs
(Lonial & Carter, 2015; Wang, 2008).
Some studies provide evidence on a positive relationship exists between learning and
firm‘s performance. For example, Spicer and Sadler-Smith, (2006) reported that the
relationship of the learning orientation on firm performance is positive. Keskin (2006)
found a positive impact of learning orientation on innovation and firm performance in
developing countries. Baker and Sinkula (1999) indicated that learning orientation has
a direct effect on organizational performance. However, few studies reported the
indirect relationship between learning orientation and performance. Frank et al. (2012)
found that high level of learning orientation results in higher organizational
performance. However, both highly dynamic environments as well as hostile
environments absorb possible performance effects of a high learning orientation in
SMEs. Rhee et al. (2010) indicated indirect relationship between learning orientation
and performance. They found that learning orientation influences innovation
performance, which in turn improves organizational performance. Lee and Tsai (2005)
found that learning orientation effect market orientation positively that in turn has
significant impact on innovativeness and performance. Lonial and Carter (2015) found
learning orientation of SMEs as indicator of positional advantage which in turn is
linked to firm performance. The literature presented above leads to the development of
the following hypothesis:
H1: Organization‘s learning orientation is positively and directly related to
organizational performance of SMEs
Methodology
This study is a survey type study wherein the researchers have used a questionnaire for
data collection from the target population. The questionnaire developed for this study
has been administered personally to the 367 respondents through mail and self-
visitations. The respondents of the study were the top management such as CEO,
Director, and Managing Directors of the SMEs belonging to manufacturing sector of
the Sialkot region, Province of Punjab, Pakistan.
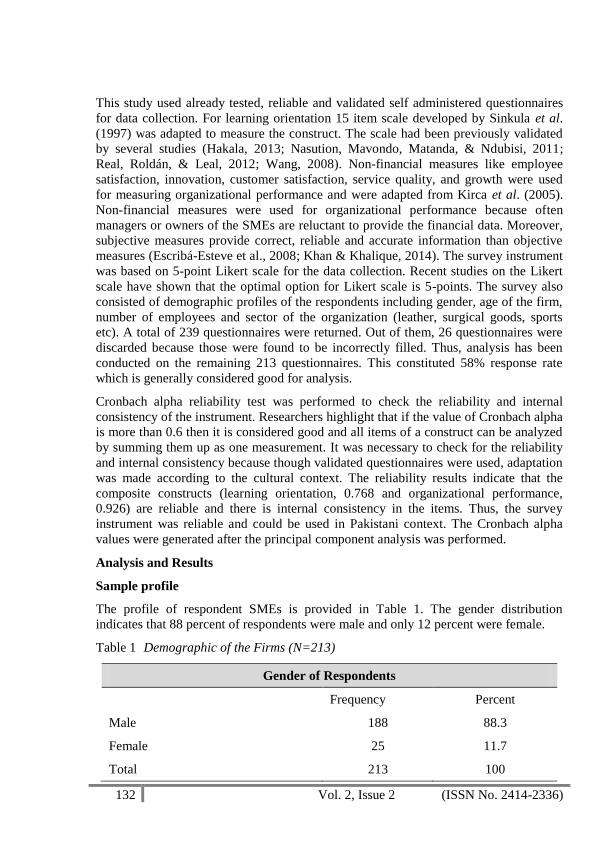
132 Vol. 2, Issue 2 (ISSN No. 2414-2336)
This study used already tested, reliable and validated self administered questionnaires
for data collection. For learning orientation 15 item scale developed by Sinkula et al.
(1997) was adapted to measure the construct. The scale had been previously validated
by several studies (Hakala, 2013; Nasution, Mavondo, Matanda, & Ndubisi, 2011;
Real, Roldán, & Leal, 2012; Wang, 2008). Non-financial measures like employee
satisfaction, innovation, customer satisfaction, service quality, and growth were used
for measuring organizational performance and were adapted from Kirca et al. (2005).
Non-financial measures were used for organizational performance because often
managers or owners of the SMEs are reluctant to provide the financial data. Moreover,
subjective measures provide correct, reliable and accurate information than objective
measures (Escribá-Esteve et al., 2008; Khan & Khalique, 2014). The survey instrument
was based on 5-point Likert scale for the data collection. Recent studies on the Likert
scale have shown that the optimal option for Likert scale is 5-points. The survey also
consisted of demographic profiles of the respondents including gender, age of the firm,
number of employees and sector of the organization (leather, surgical goods, sports
etc). A total of 239 questionnaires were returned. Out of them, 26 questionnaires were
discarded because those were found to be incorrectly filled. Thus, analysis has been
conducted on the remaining 213 questionnaires. This constituted 58% response rate
which is generally considered good for analysis.
Cronbach alpha reliability test was performed to check the reliability and internal
consistency of the instrument. Researchers highlight that if the value of Cronbach alpha
is more than 0.6 then it is considered good and all items of a construct can be analyzed
by summing them up as one measurement. It was necessary to check for the reliability
and internal consistency because though validated questionnaires were used, adaptation
was made according to the cultural context. The reliability results indicate that the
composite constructs (learning orientation, 0.768 and organizational performance,
0.926) are reliable and there is internal consistency in the items. Thus, the survey
instrument was reliable and could be used in Pakistani context. The Cronbach alpha
values were generated after the principal component analysis was performed.
Analysis and Results
Sample profile
The profile of respondent SMEs is provided in Table 1. The gender distribution
indicates that 88 percent of respondents were male and only 12 percent were female.
Table 1 Demographic of the Firms (N=213)
Gender of Respondents
Frequency Percent
Male 188 88.3
Female 25 11.7
Total 213 100

133 Vol. 2, Issue 2 (ISSN No. 2414-2336)
Line of Business
Surgical Goods 12 5.6
Leather Goods 43 20.2
Electrical Appliances 50 23.5
Earthenware 26 12.2
Silver Ware 17 8.0
Garments and Apparels 47 22.1
Sports 18 8.5
Total 213 100.0
Number of employees
Less than 25 30 14.1
25-50 63 29.6
51-75 65 30.5
76-100 37 17.4
More than 100 18 8.5
Total 213 100.0
Firm Age
Less than 3 years 32 15.0
3 to 5 years 51 23.9
5 to 7 years 48 22.5
7 to 10 years 56 26.3
More than 10 years 26 12.2
Total 213 100.0
Majority of the respondent firms were from the Electrical Appliances manufacturers
having frequency of 50 (23.5%). Garments and Apparels manufacturer firms are at
second highest frequency with 22.1 percent of the respondents. Leather products
manufacturer SMEs are at third highest participators with the frequency of the 43
(20.2%). In the firm age category, it was found that most of the firms were 7 to 10
years old (26.3%). The respondent SMEs were asked to indicate the number of full
time employees working in their businesses. The results indicate that 93 enterprises
(43.7%) employee up to 50 employees; while 65 enterprises (30.5 %) employ between
50 to 75 employees. The results further indicate that 37 enterprises (17.4%) have an

134 Vol. 2, Issue 2 (ISSN No. 2414-2336)
employee strength of more than 75 but less than 100 employees; whereas, only 18
enterprises (8.5%) has more than 100 full time employees. The employment trend
indicates that majority of the enterprises can be categorized as small enterprises.
Correlation
Pearson correlation was calculated to ascertain the relationship between the variables.
The results are provided in Table 2. The results indicate that there exists a strong and
statistically significant relationship between the variables of the study.
Table 2: Correlation Matrix (N=213)
No. Variables Learning
orientation
Organizational
Performance
1 Learning Orientation 1
2 Organizational
Performance .875
**
1
Note: P< 0.01 level (2 tailed)
Hypothesis Testing
To test the hypothesis of the study, regression analysis was performed to find the direct
effect of predicting variable (IV) learning orientation on the criterion variable
(DV) of organizational performance. Table 3 provides the results of the subject
analysis. These results demonstrate that learning orientation (β = 0.608, t = 12.431, p <
0.001) has positive and significant relationship with the performance of the
organization. Hence, these results support the current study hypothesis. It means these
results validate such results in the previous studies (Sinkula et al., 1997; Keskin, 2006;
Spicer and Sadler-Smith, 2006; Michna, 2009; Rhee et al., 2010; Frank et al., 2012;
Hakala, 2013).
Table 3 Regression of Learning Orientation-Performance (N=213)
Variables Adjusted R-square Beta t-statistic Sig.
Learning Orientation 0.420 0.608 12.431 0.000
Sig p < 0.001
Discussion and Conclusion
This study examines how learning orientation can affect the organizational
performance of SMEs in Pakistan. Significant conclusion from this study is that
learning orientation has a significant positive effect on business performance. The
results of the study conclude that with increase in the level of learning orientation, the
degree of organizational performance also increases. The results of the study posit that
strong learning orientation facilitates the achievement of sustainable competitive
135 Vol. 2, Issue 2 (ISSN No. 2414-2336)
advantage and yields greater organizational performance. The study also highlights that
when organization stops learning; it may not able to absorb the external pressure and
would be badly affected. This study guides the owners/ managers of SMEs to promote
and encourage learning in organization in order to ensure improved performance. The
findings would also help them to better understand the effects of organizational
learning through commitment to learning, open mindedness and shared vision of the
employees on business performance. The study has limited sample size belonging to
only Sialkot District of Punjab Pakistan. It is strongly advised that a larger sample size
from SMEs operating in various districts of Pakistan should be taken in order to
generalize the results of the study. Moreover, the longitudinal study is suggested to be
undertaken in future for the findings of the study to be validated.
References
Alegre, J., & Chiva, R. (2013). Linking Entrepreneurial Orientation and Firm
Performance: The Role of Organizational Learning Capability and Innovation
Performance. Journal of Small Business Management, 51(4), 491-507.
Argyris, C., & Schön, D. A. (1978). Organizational Learning II: Theory, Method, and
Practice. New York: Addison Wesley Publishing Company.
Baker, W. E., & Sinkula, J. M. (1999). Learning orientation, market orientation, and
innovation: integrating and extending models of organizational performance.
Journal of Market-Focused Management, 4(4), 295-308.
Bharadwaj, S. G., Varadarajan, P. R., & Fahy, J. (1993). Sustainable competitive
advantage in service industries: a conceptual model and research propositions.
The Journal of Marketing, 57(4), 83-99.
Bing, L., & Zhengping, F. (2011). Relationship between Strategic Orientation and
Organizational Performance in Born Global: A Critical Review. International
Journal of Business and Management, 6(3), 109-115.
Calantone, R. J., Cavusgil, S. T., & Zhao, Y. (2002). Learning orientation, firm
innovation capability, and firm performance. Industrial marketing management,
31(6), 515-524.
Calisir, F., Gumussoy, C. A., & Guzelsoy, E. (2013). Impacts of learning orientation on
product innovation performance. Learning Organization, 20(3), 176-194.
Celuch, K. G., Kasouf, C. J., & Peruvemba, V. (2002). The effects of perceived market
and learning orientation on assessed organizational capabilities. Industrial
marketing management, 31(6), 545-554.
Choi, S. (2012). Learning orientation and market orientation as catalysts for innovation
in nonprofit organizations. Nonprofit and voluntary sector quarterly, 1-21.
Dada, O. L., & Fogg, H. (2014). Organizational learning, entrepreneurial orientation,
and the role of university engagement in SMEs. International Small Business
Journal, 1-19.
Daft, R. L., & Weick, K. E. (1984). Toward a model of organizations as interpretation
systems. Academy of Management Review, 9(2), 284-295.

136 Vol. 2, Issue 2 (ISSN No. 2414-2336)
Day, G. S. (1994). The capabilities of market-driven organizations. The Journal of
Marketing, 58(4), 37-52.
Dess, G. G., & Robinson, R. B. (1984). Measuring organizational performance in the
absence of objective measures: The case of the privately‐held firm and
conglomerate business unit. Strategic Management Journal, 5(3), 265-273.
Eris, E. D., & Ozmen, O. N. T. (2012). The effect of market orientation, learning
orientation and innovativeness on firm performance: A research from Turkish
logistics sector. International Journal of Economic Sciences and Applied
Research, 5(1), 77-108.
Escribá-Esteve, A., Sánchez-Peinado, L., & Sánchez-Peinado, E. (2008). Moderating
influences on the firm's strategic orientation-performance relationship.
International Small Business Journal, 26(4), 463-489.
Fang, S.-R., Chang, E., Ou, C.-C., & Chou, C.-H. (2014). Internal market orientation,
market capabilities and learning orientation. European Journal of Marketing,
48(1/2), 170-192.
Frank, H., Kessler, A., Mitterer, G., & Weismeier-Sammer, D. (2012). Learning
Orientation of SMEs and Its Impact on Firm Performance. Journal of Marketing
Development and Competitiveness, 6(3), 29-41.
Hakala, H. (2013). Entrepreneurial and learning orientation: effects on growth and
profitability in the software sector. Baltic Journal of Management, 8(1), 102-118.
Hussain, J., Ismail, K., & Akhtar, C. S. (2015). Learning orientation and firm
performance: A review of literature The International Journal of Humanities and
Social Studies, 3 (1), 232-237.
Jantunen, A., Nummela, N., Puumalainen, K., & Saarenketo, S. (2008). Strategic
orientations of born globals—do they really matter? Journal of world business,
43(2), 158-170.
Jiménez-Jiménez, D., & Sanz-Valle, R. (2011). Innovation, organizational learning,
and performance. Journal of Business Research, 64(4), 408-417.
Jolly, D. R., & Thérin, F. (2007). New venture technology sourcing: exploring the
effect of absorptive capacity, learning attitude and past performance.
INNOVATION: management, policy & practice, 9(3-4), 235-248.
Kaya, N., & Patton, J. (2011). The effects of knowledge‐based resources, market
orientation and learning orientation on innovation performance: An empirical
study of Turkish firms. Journal of International Development, 23(2), 204-219.
Keskin, H. (2006). Market orientation, learning orientation, and innovation capabilities
in SMEs: An extended model. European Journal of Innovation Management,
9(4), 396-417.
Khan, M. W. J., & Khalique, M. (2014). Exploring the Measurements of
Organizational Performance: Review and the Small and Medium Enterprises
(SMEs) Perspective. International Journal of Business Management and
Economic Studies 1(1), 1-13.

137 Vol. 2, Issue 2 (ISSN No. 2414-2336)
Kim, N., & Atuahene‐Gima, K. (2010). Using exploratory and exploitative market
learning for new product development. Journal of Product Innovation
Management, 27(4), 519-536.
Kirca, A. H., Jayachandran, S., & Bearden, W. O. (2005). Market orientation: a meta-
analytic review and assessment of its antecedents and impact on performance.
Journal of Marketing, 69(2), 24-41.
Lee, T.-S., & Tsai, H.-J. (2005). The effects of business operation mode on market
orientation, learning orientation and innovativeness. Industrial Management &
Data Systems, 105(3), 325-348.
Lipshitz, R., Popper, M., & Oz, S. (1996). Building learning organizations: The design
and implementation of organizational learning mechanisms. The Journal of
Applied Behavioral Science, 32(3), 292-305.
Lonial, S. C., & Carter, R. E. (2015). The Impact of Organizational Orientations on
Medium and Small Firm Performance: A Resource Based Perspective. Journal of
Small Business Management, 53(1), 94-113.
Love, L. G., Priem, R. L., & Lumpkin, G. T. (2002). Explicitly articulated strategy and
firm performance under alternative levels of centralization. Journal of
Management, 28(5), 611-627.
Lukas, B. A., & Maignan, I. (1996). Striving for quality: the key role of internal and
external customers. Journal of Market-Focused Management, 1(2), 175-187.
McKee, D. (1992). An organizational learning approach to product innovation. Journal
of Product Innovation Management, 9(3), 232-245.
Michna, A. (2009). The relationship between organizational learning and SME
performance in Poland. Journal of European industrial training, 33(4), 356-370.
Moorman, C., & Miner, A. S. (1998). Organizational improvisation and organizational
memory. Academy of Management Review, 23(4), 698-723.
Nasution, H. N., Mavondo, F. T., Matanda, M. J., & Ndubisi, N. O. (2011).
Entrepreneurship: Its relationship with market orientation and learning orientation
and as antecedents to innovation and customer value. Industrial marketing
management, 40(3), 336-345.
Real, J. C., Roldán, J. L., & Leal, A. (2012). From entrepreneurial orientation and
learning orientation to business performance: analysing the mediating role of
organizational learning and the moderating effects of organizational size. British
Journal of Management, 1-23.
Real, J. C., Roldán, J. L., & Leal, A. (2014). From entrepreneurial orientation and
learning orientation to business performance: analysing the mediating role of
organizational learning and the moderating effects of organizational size. British
Journal of Management, 25(2), 186-208.
Rhee, J., Park, T., & Lee, D. H. (2010). Drivers of innovativeness and performance for
innovative SMEs in South Korea: Mediation of learning orientation.
Technovation, 30(1), 65-75.

138 Vol. 2, Issue 2 (ISSN No. 2414-2336)
Sanzo, M. J., Santos, M. L., García, N., & Trespalacios, J. A. (2012). Trust as a
moderator of the relationship between organizational learning and marketing
capabilities: Evidence from Spanish SMEs. International Small Business Journal,
30(6), 700-726.
Simon, H. A. (1991). Bounded rationality and organizational learning. Organization
science, 2(1), 125-134.
Sinkula, J. M., Baker, W. E., & Noordewier, T. (1997). A framework for market-based
organizational learning: linking values, knowledge, and behavior. Journal of the
academy of Marketing Science, 25(4), 305-318.
Slater, S. F., & Narver, J. C. (1995). Market orientation and the learning organization.
The Journal of Marketing, 59(3), 63-74.
Slater, S. F., & Narver, J. C. (2000). The positive effect of a market orientation on
business profitability: a balanced replication. Journal of Business Research,
48(1), 69-73.
Spicer, D. P., & Sadler-Smith, E. (2006). Organizational learning in smaller
manufacturing firms. International Small Business Journal, 24(2), 133-158.
Styles, C. (1998). Export performance measures in Australia and the United Kingdom.
Journal of International Marketing, 6(3), 12-36.
Suliyanto, & Rahab. (2012). The role of market orientation and learning orientation in
improving innovativeness and performance of small and medium enterprises.
Asian Social Science, 8(1), 134-145.
Suliyanto, S., & Rahab, R. (2012). The role of market orientation and learning
orientation in improving innovativeness and performance of small and medium
enterprises. Asian Social Science, 8(1), p134.
Troy, L. C., Szymanski, D. M., & Varadarajan, P. R. (2001). Generating new product
ideas: an initial investigation of the role of market information and organizational
characteristics. Journal of the academy of Marketing Science, 29(1), 89-101.
Usaahawanitchakit, P. (2011). Strategic leadership, organizational learning,
organizational innovation, and performance: evidence from electronics businesses
in Thailand. Journal of Academy of Business and Economics, 11(2), 1-12.
Wang, C. L. (2008). Entrepreneurial orientation, learning orientation, and firm
performance. Entrepreneurship Theory and Practice, 32(4), 635-657.
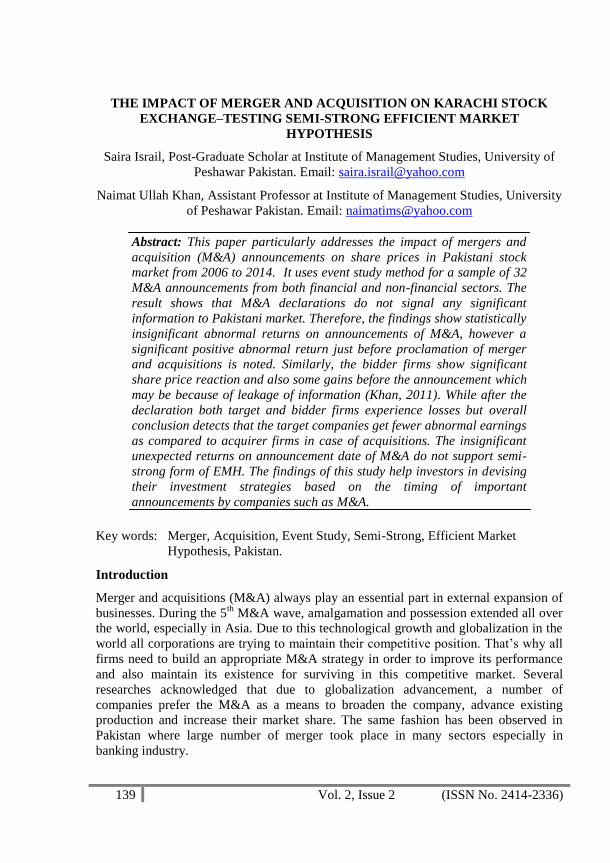
139 Vol. 2, Issue 2 (ISSN No. 2414-2336)
THE IMPACT OF MERGER AND ACQUISITION ON KARACHI STOCK
EXCHANGE–TESTING SEMI-STRONG EFFICIENT MARKET
HYPOTHESIS
Saira Israil, Post-Graduate Scholar at Institute of Management Studies, University of
Peshawar Pakistan. Email: [email protected]
Naimat Ullah Khan, Assistant Professor at Institute of Management Studies, University
of Peshawar Pakistan. Email: [email protected]
Abstract: This paper particularly addresses the impact of mergers and
acquisition (M&A) announcements on share prices in Pakistani stock
market from 2006 to 2014. It uses event study method for a sample of 32
M&A announcements from both financial and non-financial sectors. The
result shows that M&A declarations do not signal any significant
information to Pakistani market. Therefore, the findings show statistically
insignificant abnormal returns on announcements of M&A, however a
significant positive abnormal return just before proclamation of merger
and acquisitions is noted. Similarly, the bidder firms show significant
share price reaction and also some gains before the announcement which
may be because of leakage of information (Khan, 2011). While after the
declaration both target and bidder firms experience losses but overall
conclusion detects that the target companies get fewer abnormal earnings
as compared to acquirer firms in case of acquisitions. The insignificant
unexpected returns on announcement date of M&A do not support semi-
strong form of EMH. The findings of this study help investors in devising
their investment strategies based on the timing of important
announcements by companies such as M&A.
Key words: Merger, Acquisition, Event Study, Semi-Strong, Efficient Market
Hypothesis, Pakistan.
Introduction
Merger and acquisitions (M&A) always play an essential part in external expansion of
businesses. During the 5th
M&A wave, amalgamation and possession extended all over
the world, especially in Asia. Due to this technological growth and globalization in the
world all corporations are trying to maintain their competitive position. That‘s why all
firms need to build an appropriate M&A strategy in order to improve its performance
and also maintain its existence for surviving in this competitive market. Several
researches acknowledged that due to globalization advancement, a number of
companies prefer the M&A as a means to broaden the company, advance existing
production and increase their market share. The same fashion has been observed in
Pakistan where large number of merger took place in many sectors especially in
banking industry.

140 Vol. 2, Issue 2 (ISSN No. 2414-2336)
As an emerging market, according to analysis by Bloomberg, Pakistan ranked third in
2014 amongst the top ten best performing markets in the world and second the most
mature stock exchange in south Asia. Besides this Karachi Stock Exchange (KSE, now
Pakistan Stock Exchange, PSX; hereinafter PSX and KSE will be used interchange-
ably)1 is one of the major stock exchanges in Pakistan. It revealed significant growth in
few precedent periods.
This study analyzes the impact of M&A announcements on share prices on the KSE.
The reason behind conducting study on the KSE is that a lot of work has been done on
this topic in developed countries but very little is known about its influences in case of
Pakistan. This study analyses cases of M&A from both financial and non-financial
sectors. In addition, the main reason of choosing banking sector (financial sector) of
Pakistan is recently experiencing regulatory changes in the industry. The State Bank of
Pakistan has increased paid-up-capital for all banks operating in Pakistan from Rs.1
billion in 2001 to Rs. 10 billion in 2013 (Tauseef & Nishat, 2013). The increment in
paid-up capital compels many banks to either merge with other small banks or being
acquired by other banks. The last decade is considered as ―merger and acquisition
decade‖ in banking sector of Pakistan. Now, it is a suitable time to analyze the effect of
M&A on share prices.
Problem Statement
M&As have become increasingly widespread in the 1990‘s. According to the UN‘s
World Investment Report (UN, 2000), worldwide M&A grew at an annual rate about
42% over the period 1980-1999 to reach $2.3 trillion in 1999 where more than 24,000
M&A took place during that period (Liang, 2013). M&A activities have been a
common form for more than four decades in North American and European markets. In
Asia, most of the M&A activities have taken place after the Asian financial crisis in
1997 (cited in Liang, 2013, p. 3).
The stock markets of firms are affected due to different events including the
announcements of M&A. This research analyzes the impact of M&A in banking sector
of Pakistan over the period from 2006-2014.
1 Pakistan Stock Exchange (PSX) is the result of demutualization of three stock
exchanges of Pakistan (i.e., Karachi Stock Exchange, Lahore Stock Exchange and
Islamabad Stock Exchange) in January 2016. The old performance indicator KSE-
100 index is still used for measuring the performance of PSX.
141 Vol. 2, Issue 2 (ISSN No. 2414-2336)
Objectives of the Research
The main objective of this research is to analyze the effect of M&A on stock returns of
listed firms of the KSE. The banking sector of Pakistan is of prime interest as many
M&A took place in this industry due to increase in Minimum Capital Requirements
which compel the banks to either merge or be acquired by other banks. The study can
help in providing additional guidelines to decision makers by simultaneously planning
at the time of merger and acquisition. The results can help shareholders in making
investments decisions around M&A.
Theoretical Framework
This study is used to judge semi-strong form of Efficient Market Hypothesis (EMH).
This theory assumes that share prices are the true reflection of all available information
in the market (Fame, 1970). EMH has three types: weak form, semi-strong form and
strong form. Weak form of efficiency assumes that past share prices are embodied in
today‘s share prices. Semi-strong EMH states that any public information should be
quickly reflected in share prices in either positive or negative manner. While strong
EMH assumes that all information, including past share prices, public information and
private news, are available to all investors and no investor can beat the market (Fama,
1970). This research uses M&A events as public information to test semi-strong form
of EMH. In case, there are unexpected returns on the day of M&A, it testifies semi-
strong form of efficiency that public information (M&A announcements) reflects
quickly in share prices.
Literature Review
A significant amount of literature gives facilitation to know about the effect of M&A
on stock returns (Gopalaswamy, Acharya & Malik, 2008; Simões, Macedo-Soares,
Klotzle & Pinto, 2012). It also gives assistance in order to know that how target and
bidder firms are affected by it.
Liang (2013) examined the effect of M&A declarations of firms listed on the Hong
Kong Stock Exchange from 2007-2012. For analysis, the researcher selected a sample
of 44 firms. During this study, event study was applied for measuring abnormal
returns. The study found that the acquiring firms achieved a constructive and
momentous unexpected returns just 2 days pre & post of declaration dates.
Correspondingly Dianita, Tarmidi, and Hadian (2013) also analyzed the impact of
M&A proclamations in Indonesia from year 2005-2011 for 20 firms. Using the event
study, the results showed significant abnormal proceeds on the declaration date and
there was a significant Accumulated Abnormal Returns (AAR) prior to declaration of
M&A events. Similarly, Padmavathy and Ashok (2012) analyzed the impact of merger
announcements on stock price behavior in 2010 for a sample of 97 companies listed on
the Bombay Stock Exchange. Again, as a method to analyze the results, event method
was demeanor to discover AR. The event study method shows that M&A events failed
to produce any unexpected returns forbidders.

142 Vol. 2, Issue 2 (ISSN No. 2414-2336)
In the same way, Mahmood, Aamir, Hussain and Sohail (2012) also observed the
impact of merger and acquisition on post-merger life of 8 Pakistani companies for a
sample of three years (2000-2002) using event study method. Here results indicated
that in five companies the stock prices were affected positively while in two
companies, one month after the merger, the results were negative. Moreover, no
change in the price of one company has been found. Overall, the result specifies that
M&A positively affects the stock values of corporations.
Likewise Gopalaswamy et al. (2008) also carried out research in India to check stock
value response of companies due to M&A declarations from 2000-2007. For analysis,
25 firms were chosen. On the basis of standard event study model the author found
growing tendency in CARs for corporations and AR for firms before the time of
announcements which again confirmed the insider keenness.
Ma, Pagan and Chu (2009) also examined the abnormal returns by selecting a total
sample of 1477 firms from ten Asian stock markets.2 The author exploits event
procedure for measuring AR before and after the transactions in three event windows.
The findings suggest that the financial benefits related with M&A were beneficial and
it would be helpful in external growth of firms so it was highly recommended to
managers.
Similarly, studies are also conducted in order to outlook the impact of M&A on target
and bidder firms which illustrate sometimes gains for both firms (Sana & Nishat, 2013)
but most studies demonstrate gains for target firms (Karnik, 2005; Manasakis, 2009;
Shaheen, 2006).
Like Sana and Nishat (2013) examined the wealth effect of merger and acquisition of
seven M&A events in banking sector in Pakistan over the period from 2003 to 2008.
The authors divided the sample merger and acquisition transactions into three
categories3. The investigation was carried out on the basis of standard event study
model in order to measure the impact of M&A on the return of both bidder and target
banks around 30 days event window of announcement dates. It pointed out statistically
significant reactions and also the combined mean CARs for the target banks and bidder
companies are both positive and statistically significant.
2 China, India, Hong Kong, Indonesia, Malaysia, the Philippines, Singapore, South
Korea, Taiwan, and Thailand.
3 The sample of M&A were categorized as, (1) Merger of Pakistani banks with the
other domestic banks, (2) Acquisition of Pakistani banks by the foreign investors;
and (3) Merger of Pakistani banks with the foreign banks operating in Pakistan.
143 Vol. 2, Issue 2 (ISSN No. 2414-2336)
Likewise Karnik (2005) also assessed value creation for target companies‘ shareholders
in the Indian context. The author, using a sample of M&A spread across industries,
compared the share prices of target firms before and after public announcements for
open offer in relation to stock market index. The study found that the effect of public
announcements is sometimes very short-lived. This study used differing time windows
to test the hypotheses. It was found that there was a significant value creation for
target companies‘ shareholders due to public announcements as well as relative to
benchmark index, irrespective of the time window used for the study.
Manasakis (2009) also examined the shareholder wealth effects of M&A in Greek over
the period (1995-2001) through means of typical event method. The study gave
evidence of considerable abnormal returns by target investors due to declarations.
While on other side, the bidders‘ companies had major losses in these transactions. The
M&A in Greek market failed to initiate worth.
Shaheen (2006) explained acquisitions proclamation influence on share prices with
the help of market model of event study. For sample the researcher only considered
merger announcements after 1997 between two publicly traded companies. Out of 467,
only 40 announcements were randomly chosen which shows that sample consists of 80
securities, which were large enough for assessing firms. Beta‘s parameter estimation
period and post event phase were constant for all securities in this sample. The results
indicated meaningful positive abnormal proceeds for target businesses on
pronouncements date. Similarly Wong et al. (2009) also observed the effect of M&A
announcements on pricing activities of bidding investors in six Asian countries over the
period (2000-2007) for a sample of 95 mergers and 563 acquisitions. The authors used
market model and regression model in order to find abnormal value for bidder and
target firms. The study found drastically negative results for target companies while
good for bidders.
Bashir, Sajid and Sheikh (2011) analyzed M&A influence on shareholder‘s wealth in
44 mergers companies of Pakistan from 2004-2010. Among these 44 mergers, 27 were
in financial sectors and the rest occurred in non-financial industries. The findings of
event study showed that target firms experience insignificant losses while the acquirer
firms enjoy statistically insignificant gains.
In aforesaid literature it has been found that a lot of work has been done on the issue of
merger and acquisition and its consequences in emerging and developed countries. All
of which shows a mix pattern of results, some show positive impact (Ma et al., 2009;
Sana & Nishat, 2013) and some show negative results on stocks (Manasakis, 2009;
Wong, Cheung & Mun, 2009). As due to technological development and globalization
all firms in the world are trying to sustain their competitive situation. The same pattern
has been observed in various sectors of Pakistan with limited research. Although
researchers have tried to determine the impact of M&A on stock returns (Bashir et al.,
2011; Mahmood et al., 2012; Sana & Nishat, 2013) but that shows mix results which
may be due to small sample used in the analysis. So this current study tries to take a
144 Vol. 2, Issue 2 (ISSN No. 2414-2336)
bigger sample of M&A cases in Pakistan. Hence, this paper examines the impact of
M&A on stock return in Pakistani market from 2006 to 2014.
Based on the above literature, the following hypothesis can be derived for testing in the
paper. The following hypothesis is meant to be proved by this study:
Hο: AR=0: M&A has no significant impact on share prices around the announcement
date.
H₁: AR≠0: M&A has a significant impact on share prices around the announcement
date.
Methodology
A secondary data of M&A in Pakistan is taken from competition commission of
Pakistan (CCP‘s website, 2014). There are total 70 mergers and 372 acquisitions in
Pakistan over a period of 2006-14 (CCP‘s website, 2014). Due to non-availability of
data, about 38 firms are not included in this study in case of mergers. So to carry out
this particular research, a total of 32 firms both from financial and non-financial
sectors4 (see Appendix for more detail) are taken as a sample size which announced
mergers and acquisitions from 2006-20145. In these 32 firms, 22 firms are those
companies which have been merged, five are the target and five are the bidder firms.
The secondary data is collected from the KSE website, Competition Commission of
Pakistan (CCP‘s website, 2014) and other related websites like Bloomberg, Business
recorder and yahoo finance etc.
In order to test whether this M&A has any positive and negative impact on the KSE, an
event study is employed to calculate any unexpected returns around these
announcement dates (Brown & Warner, 1985; Dianita et al., 2013; Fuller et al., 2001;
Sana & Nishat, 2013; Shaheen, 2006; Travlos, 1987).
An econometric way to determine the effect of certain events is termed as event study
which is the most used empirical methods in finance and accounting for this purpose
(cited in Eleclasson, 2010, p. 7). It observes response of market to an incident,
where facts regarding incident are available as a pronouncement (Jogiyanto, 2007).
Event study can disclose significant information regarding how stocks respond to an
occasion and also facilitate in estimating other stock performance (Brown & Warner,
1985). Similarly, it also examines the information content of public news. Event study
research is usually associated with rapidness of facts approaching market and how
4 There are 14 banks from financial sector while 18 companies from non-financial
sector. 5 Due to non-accessibility of data before 2006, only this period is selected.
145 Vol. 2, Issue 2 (ISSN No. 2414-2336)
quickly that information is reflected in share prices (cited in Dianita et al., 2013, p. 3).
Hence, event study is used to measure the semi-strong form of efficiency.
It determines average unexpected returns pre & posts to the M&A announcements.
Unexpected return is the difference between actual returns and expected returns. Two
procedures of projected returns are considered in this study. First one is Market
Adjusted Returns which is used for scheming excess returns and the second one is
Market Model Returns which is used to measure abnormal returns (AR). The present
study centers on market model in analyzing unexpected earnings in the region of
broadcast date of mergers and acquisitions (Bashir et al., 2011; Dianita et al., 2013;
Shaheen, 2006; Wong et al., 2009); as according to Strong (1992), market model is
―the mainly well-liked‖ technique in scheming unexpected proceeds.
According to Dianita et al. (2013) the following steps are carried out for the
measurement of unexpected returns. Firstly, to calculate the actual returns which are
the gains from investment during period of observation. The share returns by
logarithmic method are computed by:
Rit=Ln (Pit/Pit-1) [1]
Whereas Rit is the daily return of firm i on day t; Ln is the natural log; Pit is the share
price of firm i on day t; Pt-1 is the share price of firm i on the previous day.
To inspect the impact of M&A on share prices daily data is used rather than their
weekly and monthly complement. While using the daily share prices, however, various
issues occur (such as thin trading etc.). In order to reduce these difficulties, this study
obtains Ln of share prices to bring the data into normality (Strong, 1992). Furthermore,
to address the econometric issue of normality, non-parametric tests (such Wilcoxon
Signed Rank Test) are also used along with parametric tests.
Secondly, the market returns are calculated with the help of following equation.
Rm = Ln (KSE-100t/KSE100t-1) [2]
Where, KSE-100 index is used as a proxy for market returns.
Thirdly, Excess Returns are calculated while comparing actual returns with market
returns where KSE-100 index is used as a proxy of market returns. A 21-day event
window is used for this purpose i.e., t-10 up to t +10 days. The ExR is deliberated by
the formula:
ExRit = Rit- RMt [3]
Whereas ExRit is the excess return of security i at time t; Rit is the actual return on
security i at time t; Rmt is the return on the market index at time t.
Fourthly, another alternative method of calculating unexpected returns is abnormal
returns where the expected returns are measured with the help of market model.
Consequently, it is premeditated by:
E(Rit) =αi + βi.RMt + εi,t [4]
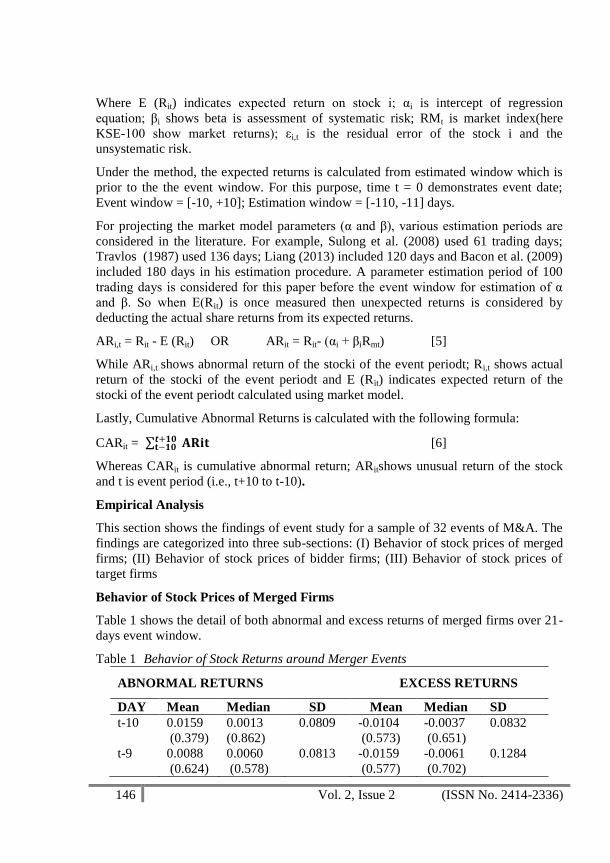
146 Vol. 2, Issue 2 (ISSN No. 2414-2336)
Where E (Rit) indicates expected return on stock i; αi is intercept of regression
equation; βi shows beta is assessment of systematic risk; RMt is market index(here
KSE-100 show market returns); εi,t is the residual error of the stock i and the
unsystematic risk.
Under the method, the expected returns is calculated from estimated window which is
prior to the the event window. For this purpose, time t = 0 demonstrates event date;
Event window = [-10, +10]; Estimation window = [-110, -11] days.
For projecting the market model parameters (α and β), various estimation periods are
considered in the literature. For example, Sulong et al. (2008) used 61 trading days;
Travlos (1987) used 136 days; Liang (2013) included 120 days and Bacon et al. (2009)
included 180 days in his estimation procedure. A parameter estimation period of 100
trading days is considered for this paper before the event window for estimation of α
and β. So when E(Rit) is once measured then unexpected returns is considered by
deducting the actual share returns from its expected returns.
ARi,t = Rit - E (Rit) OR ARit = Rit- (αi + βiRmt) [5]
While ARi,t shows abnormal return of the stocki of the event periodt; Ri,t shows actual
return of the stocki of the event periodt and E (Rit) indicates expected return of the
stocki of the event periodt calculated using market model.
Lastly, Cumulative Abnormal Returns is calculated with the following formula:
CARit = 𝐀𝐑𝐢𝐭𝒕+𝟏𝟎𝐭−𝟏𝟎 [6]
Whereas CARit is cumulative abnormal return; ARitshows unusual return of the stock
and t is event period (i.e., t+10 to t-10).
Empirical Analysis
This section shows the findings of event study for a sample of 32 events of M&A. The
findings are categorized into three sub-sections: (I) Behavior of stock prices of merged
firms; (II) Behavior of stock prices of bidder firms; (III) Behavior of stock prices of
target firms
Behavior of Stock Prices of Merged Firms
Table 1 shows the detail of both abnormal and excess returns of merged firms over 21-
days event window.
Table 1 Behavior of Stock Returns around Merger Events
ABNORMAL RETURNS EXCESS RETURNS
DAY Mean Median SD Mean Median SD
t-10 0.0159
(0.379)
0.0013
(0.862)
0.0809 -0.0104
(0.573)
-0.0037
(0.651)
0.0832
t-9 0.0088
(0.624)
0.0060
(0.578)
0.0813 -0.0159
(0.577)
-0.0061
(0.702)
0.1284
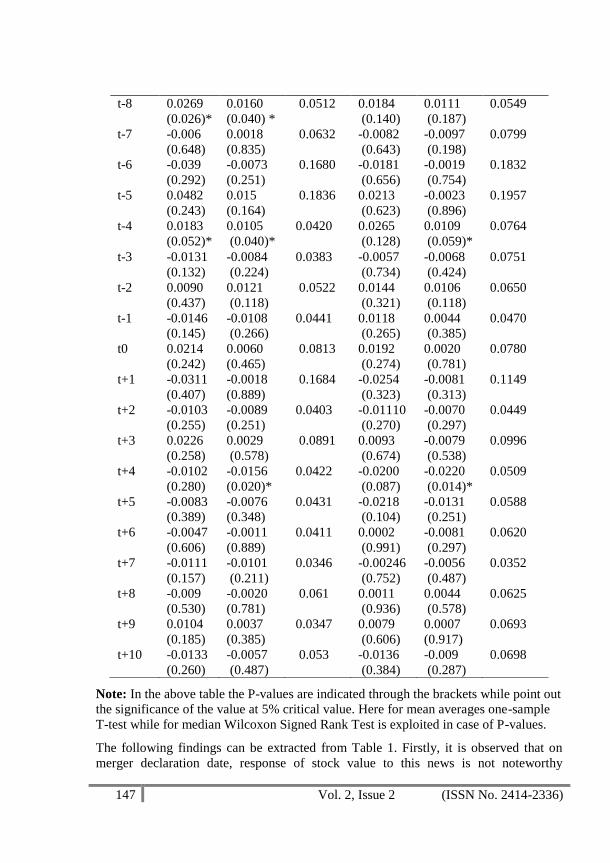
147 Vol. 2, Issue 2 (ISSN No. 2414-2336)
Note: In the above table the P-values are indicated through the brackets while point out
the significance of the value at 5% critical value. Here for mean averages one-sample
T-test while for median Wilcoxon Signed Rank Test is exploited in case of P-values.
The following findings can be extracted from Table 1. Firstly, it is observed that on
merger declaration date, response of stock value to this news is not noteworthy
t-8 0.0269
(0.026)*
0.0160
(0.040) *
0.0512 0.0184
(0.140)
0.0111
(0.187)
0.0549
t-7 -0.006
(0.648)
0.0018
(0.835)
0.0632 -0.0082
(0.643)
-0.0097
(0.198)
0.0799
t-6 -0.039
(0.292)
-0.0073
(0.251)
0.1680 -0.0181
(0.656)
-0.0019
(0.754)
0.1832
t-5 0.0482
(0.243)
0.015
(0.164)
0.1836 0.0213
(0.623)
-0.0023
(0.896)
0.1957
t-4 0.0183
(0.052)*
0.0105
(0.040)*
0.0420 0.0265
(0.128)
0.0109
(0.059)*
0.0764
t-3 -0.0131
(0.132)
-0.0084
(0.224)
0.0383 -0.0057
(0.734)
-0.0068
(0.424)
0.0751
t-2 0.0090
(0.437)
0.0121
(0.118)
0.0522 0.0144
(0.321)
0.0106
(0.118)
0.0650
t-1 -0.0146
(0.145)
-0.0108
(0.266)
0.0441 0.0118
(0.265)
0.0044
(0.385)
0.0470
t0 0.0214
(0.242)
0.0060
(0.465)
0.0813 0.0192
(0.274)
0.0020
(0.781)
0.0780
t+1 -0.0311
(0.407)
-0.0018
(0.889)
0.1684 -0.0254
(0.323)
-0.0081
(0.313)
0.1149
t+2 -0.0103
(0.255)
-0.0089
(0.251)
0.0403 -0.01110
(0.270)
-0.0070
(0.297)
0.0449
t+3 0.0226
(0.258)
0.0029
(0.578)
0.0891 0.0093
(0.674)
-0.0079
(0.538)
0.0996
t+4 -0.0102
(0.280)
-0.0156
(0.020)*
0.0422 -0.0200
(0.087)
-0.0220
(0.014)*
0.0509
t+5 -0.0083
(0.389)
-0.0076
(0.348)
0.0431 -0.0218
(0.104)
-0.0131
(0.251)
0.0588
t+6 -0.0047
(0.606)
-0.0011
(0.889)
0.0411 0.0002
(0.991)
-0.0081
(0.297)
0.0620
t+7 -0.0111
(0.157)
-0.0101
(0.211)
0.0346 -0.00246
(0.752)
-0.0056
(0.487)
0.0352
t+8 -0.009
(0.530)
-0.0020
(0.781)
0.061 0.0011
(0.936)
0.0044
(0.578)
0.0625
t+9 0.0104
(0.185)
0.0037
(0.385)
0.0347 0.0079
(0.606)
0.0007
(0.917)
0.0693
t+10 -0.0133
(0.260)
-0.0057
(0.487)
0.053 -0.0136
(0.384)
-0.009
(0.287)
0.0698

148 Vol. 2, Issue 2 (ISSN No. 2414-2336)
(Gopalaswamy et al., 2008; Padmavathy & Ashok, 2012). The mean (median)
abnormal return is 2.1 % (0.5952%) respectively but the p-value of abnormal return is
higher than the 5.0% critical value i.e., 0.24 (mean) and 0.46 (median). Similarly, on
day t0, the mean (median) excess return is at 1.92% (0.197%) but the p-value of excess
return is insignificant which is 0.27 (mean) and 0.78 (median). So, the declaration date
shows an affirmative mean (median) for AR & ExR but not significant at the 5.0%
level. Due to which the null hypothesis cannot be rejected which means unexpected
returns of share value on declaration date of merger are not significant. It shows that
merger announcement fails to incorporate any information to interested parties on
announcement date. This result also proves that the KSE is not efficient in semi-strong
form as it is unable to incorporate new information quickly. One reason for this
insignificant irregular gain to the market, on day of declaration, may be the leakage of
information before formal declaration (Gopalaswamy et al., 2008)
Secondly, Table 1 reports some significant values before announcement dates, for
example, day t-4 and day t-8 shows that mean value of abnormal return is 1.825% and
2.69% respectively which is statistically significant because its p-value is 0.052 and
0.040 respectively at 5% critical values. Similarly, the median of both abnormal return
and excess are significant on day t-4 (i.e., 1.048% with p-value of 0.04) and 1.089% (p-
value 0.05) respectively. The table also shows that median of day t-8 is 1.60% and its
p-value (0.04) is significant. So statistically considerable positive excess returns and
abnormal returns are found immediately before the announcement day (i.e., day t-4 and
day t-8). While for other rest of the days before declaration, the table indicates an
insignificant mix of negative and positive results for abnormal returns and excess
returns. So overall, the results propose a clue of information leakage to market prior to
the information of declaration which may cause insignificant unexpected gains on day
of declaration. This outcome is consistent with Gopalaswamy et al. (2008, p. 99)
findings who had done research in India and found a significant AR for businesses
before the time of announcement which again confirmed the insider keenness.
Thirdly, Table 1 shows a large divergence from mean for both AR & ExR in form of
standard deviation. In the vein of AR, it fluctuates as 3.4% on day t+7 to 18.3% on (t-
5) day. Similarly in ExR, it differs from 3.5% to 19.5% on same days. This huge
variability in returns may lead to insignificant unexpected returns on day t0.
Lastly, Table 1 also depicts that the mean (median) of abnormal returns and excess
returns of post-announcement dates are statistically insignificant at 5% level except on
day t+4 where the median of both abnormal return and excess return is statistically
significant and have p-values of 0.02 (abnormal return) and 0.01 (excess return) at 5%
significant level. On average, the findings indicate an insignificant negative mean
(median) of both abnormal returns and excess returns during post-announcement
period. The significant values after announcements further strengthen the argument of
non-existence of semi-strong form of efficiency, as the market takes some times to
incorporate new information.

149 Vol. 2, Issue 2 (ISSN No. 2414-2336)
Share Prices Behavior of Bidder Firms
Table 2 shows the results of event study around 21-day event window of bidder firms.
Table 2: Share Price Behavior of Bidder Firms (Acquisition)
ABNORMAL RETURNS EXCESS RETURNS
DAY Mean Median SD Mean Median SD
t-10 0.00162
(0.855)
0.002835
(0.862)
0.0186 0.00578
(0.426)
0.005717
(0.651)
0.01459
t-9 0.01301
(0.059)*
0.01300
(0.578)
0.0111 0.0219
(0.106)
0.01924
(0.702)
0.0236
t-8 -0.0803
(0.213)
-0.038
(0.040)*
0.1212 -0.0697
(0.223)
-0.03270
(0.187)
0.1080
t-7 0.0073
(0.516)
0.0069
(0.835)
0.0231 0.0124
(0.543)
0.01811
(0.198)
0.0416
t-6 -0.0027
(0.519)
-0.0025
(0.251)
0.0085 0.01339
(0.022)*
0.01174
(0.754)
0.00825
t-5 0.0125
(0.307)
0.0115
(0.164)
0.024 0.01151
(0.023)*
0.01230
(0.896)
0.00722
t-4 -0.0089
(0.143)
-0.010
(0.040)*
0.0120 0.0014
(0.933)
0.00738
(0.110)
0.0350
t-3 0.03006
(0.024)*
0.0303
(0.224)
0.0191 0.03508
(0.017)*
0.03323
(0.424)
0.01998
t-2 0.01723
(0.496)
0.0077
(0.118)
0.0172 0.0084
(0.554)
0.00996
(0.118)
0.0290
t-1 -0.0073
(0.707)
-0.0060
(0.266)
0.0407 -0.0070
(0.730)
-0.0036
(0.385)
0.0424
t0 -0.0072
(0.691)
-0.0069
(0.465)
0.0377 -0.0096
(0.473)
-0.0111
(0.781)
0.0271
t+1 0.0155
(0.233)
0.0156
(0.889)
0.0247 0.0087
(0.456)
0.00376
(0.313)
0.0235
t+2 -0.0083
(0.617)
-0.0087
(0.251)
0.0342 -0.0133
(0.453)
-0.0134
(0.297)
0.0357
t+3 -0.0228
(0.050)*
-0.0226
(0.578)
0.0183 -0.0206
(0.088)
-0.01713
(0.538)
0.02047
t+4 0.00750
(0.249)
0.0093
(0.020)*
0.0124 0.00314
(0.590)
0.00386
(0.014)*
0.01203
t+5 -0.0075
(0.579)
-0.0078
(0.348)
0.0277 -0.0133
(0.420)
-0.01397
(0.251)
0.0332
t+6 0.01080
(0.327)
0.0119
(0.889)
0.0217 0.00049
(0.963)
0.00071
(0.297)
0.02224
t+7 0.0143
(0.350)
0.0137
(0.211)
0.0302 0.01723
(0.153)
0.01446
(0.487)
0.02187
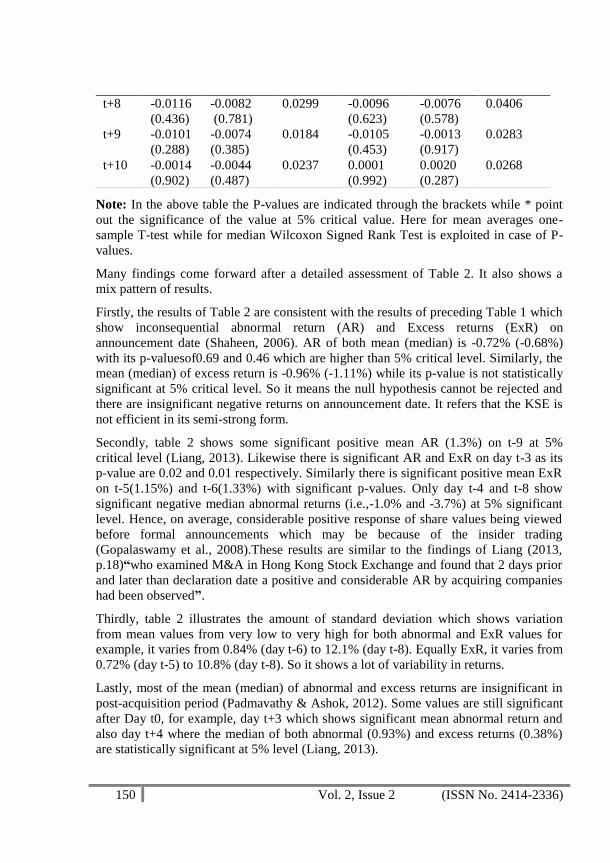
150 Vol. 2, Issue 2 (ISSN No. 2414-2336)
t+8 -0.0116
(0.436)
-0.0082
(0.781)
0.0299 -0.0096
(0.623)
-0.0076
(0.578)
0.0406
t+9 -0.0101
(0.288)
-0.0074
(0.385)
0.0184 -0.0105
(0.453)
-0.0013
(0.917)
0.0283
t+10 -0.0014
(0.902)
-0.0044
(0.487)
0.0237 0.0001
(0.992)
0.0020
(0.287)
0.0268
Note: In the above table the P-values are indicated through the brackets while * point
out the significance of the value at 5% critical value. Here for mean averages one-
sample T-test while for median Wilcoxon Signed Rank Test is exploited in case of P-
values.
Many findings come forward after a detailed assessment of Table 2. It also shows a
mix pattern of results.
Firstly, the results of Table 2 are consistent with the results of preceding Table 1 which
show inconsequential abnormal return (AR) and Excess returns (ExR) on
announcement date (Shaheen, 2006). AR of both mean (median) is -0.72% (-0.68%)
with its p-valuesof0.69 and 0.46 which are higher than 5% critical level. Similarly, the
mean (median) of excess return is -0.96% (-1.11%) while its p-value is not statistically
significant at 5% critical level. So it means the null hypothesis cannot be rejected and
there are insignificant negative returns on announcement date. It refers that the KSE is
not efficient in its semi-strong form.
Secondly, table 2 shows some significant positive mean AR (1.3%) on t-9 at 5%
critical level (Liang, 2013). Likewise there is significant AR and ExR on day t-3 as its
p-value are 0.02 and 0.01 respectively. Similarly there is significant positive mean ExR
on t-5(1.15%) and t-6(1.33%) with significant p-values. Only day t-4 and t-8 show
significant negative median abnormal returns (i.e.,-1.0% and -3.7%) at 5% significant
level. Hence, on average, considerable positive response of share values being viewed
before formal announcements which may be because of the insider trading
(Gopalaswamy et al., 2008).These results are similar to the findings of Liang (2013,
p.18)―who examined M&A in Hong Kong Stock Exchange and found that 2 days prior
and later than declaration date a positive and considerable AR by acquiring companies
had been observed‖.
Thirdly, table 2 illustrates the amount of standard deviation which shows variation
from mean values from very low to very high for both abnormal and ExR values for
example, it varies from 0.84% (day t-6) to 12.1% (day t-8). Equally ExR, it varies from
0.72% (day t-5) to 10.8% (day t-8). So it shows a lot of variability in returns.
Lastly, most of the mean (median) of abnormal and excess returns are insignificant in
post-acquisition period (Padmavathy & Ashok, 2012). Some values are still significant
after Day t0, for example, day t+3 which shows significant mean abnormal return and
also day t+4 where the median of both abnormal (0.93%) and excess returns (0.38%)
are statistically significant at 5% level (Liang, 2013).
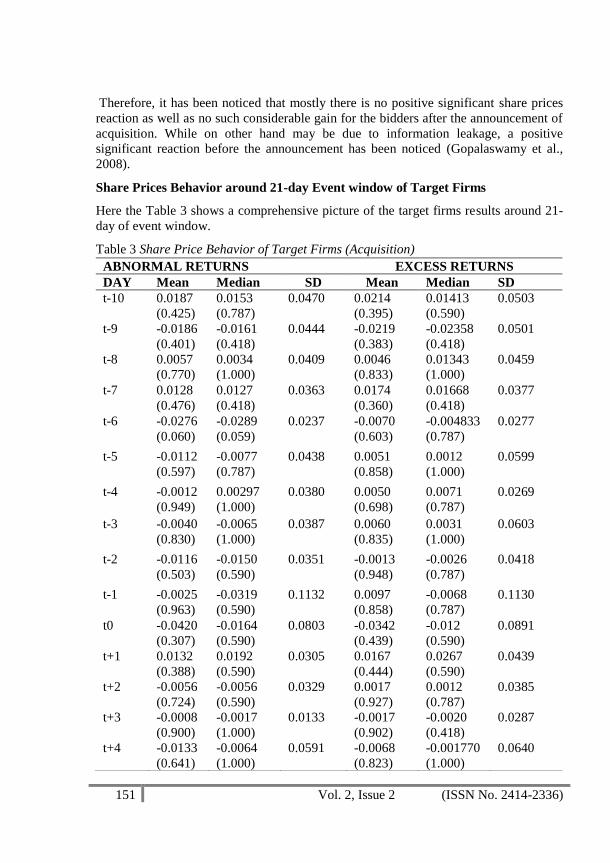
151 Vol. 2, Issue 2 (ISSN No. 2414-2336)
Therefore, it has been noticed that mostly there is no positive significant share prices
reaction as well as no such considerable gain for the bidders after the announcement of
acquisition. While on other hand may be due to information leakage, a positive
significant reaction before the announcement has been noticed (Gopalaswamy et al.,
2008).
Share Prices Behavior around 21-day Event window of Target Firms
Here the Table 3 shows a comprehensive picture of the target firms results around 21-
day of event window.
Table 3 Share Price Behavior of Target Firms (Acquisition)
ABNORMAL RETURNS EXCESS RETURNS
DAY Mean Median SD Mean Median SD
t-10 0.0187
(0.425)
0.0153
(0.787)
0.0470 0.0214
(0.395)
0.01413
(0.590)
0.0503
t-9 -0.0186
(0.401)
-0.0161
(0.418)
0.0444 -0.0219
(0.383)
-0.02358
(0.418)
0.0501
t-8 0.0057
(0.770)
0.0034
(1.000)
0.0409 0.0046
(0.833)
0.01343
(1.000)
0.0459
t-7 0.0128
(0.476)
0.0127
(0.418)
0.0363 0.0174
(0.360)
0.01668
(0.418)
0.0377
t-6 -0.0276
(0.060)
-0.0289
(0.059)
0.0237 -0.0070
(0.603)
-0.004833
(0.787)
0.0277
t-5 -0.0112
(0.597)
-0.0077
(0.787)
0.0438 0.0051
(0.858)
0.0012
(1.000)
0.0599
t-4 -0.0012
(0.949)
0.00297
(1.000)
0.0380 0.0050
(0.698)
0.0071
(0.787)
0.0269
t-3 -0.0040
(0.830)
-0.0065
(1.000)
0.0387 0.0060
(0.835)
0.0031
(1.000)
0.0603
t-2 -0.0116
(0.503)
-0.0150
(0.590)
0.0351 -0.0013
(0.948)
-0.0026
(0.787)
0.0418
t-1 -0.0025
(0.963)
-0.0319
(0.590)
0.1132 0.0097
(0.858)
-0.0068
(0.787)
0.1130
t0 -0.0420
(0.307)
-0.0164
(0.590)
0.0803 -0.0342
(0.439)
-0.012
(0.590)
0.0891
t+1 0.0132
(0.388)
0.0192
(0.590)
0.0305 0.0167
(0.444)
0.0267
(0.590)
0.0439
t+2 -0.0056
(0.724)
-0.0056
(0.590)
0.0329 0.0017
(0.927)
0.0012
(0.787)
0.0385
t+3 -0.0008
(0.900)
-0.0017
(1.000)
0.0133 -0.0017
(0.902)
-0.0020
(0.418)
0.0287
t+4 -0.0133
(0.641)
-0.0064
(1.000)
0.0591 -0.0068
(0.823)
-0.001770
(1.000)
0.0640
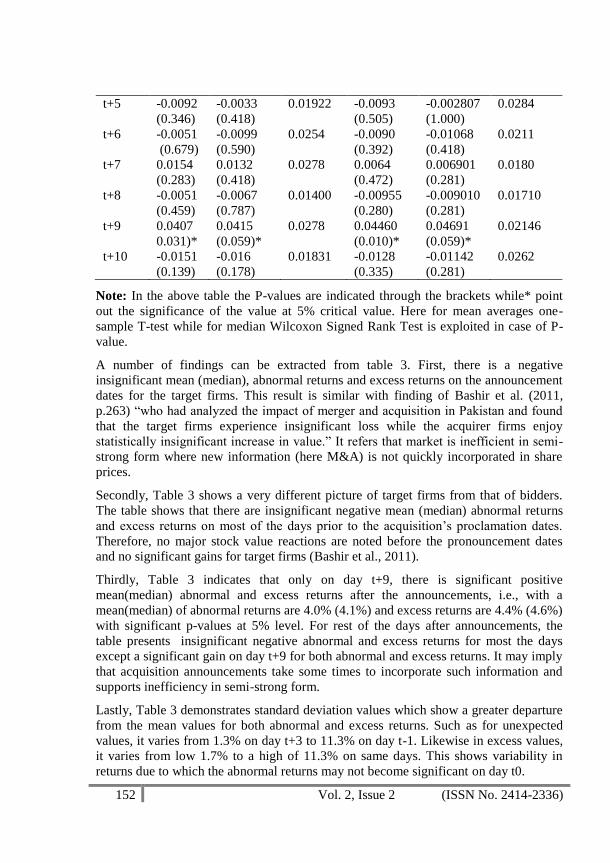
152 Vol. 2, Issue 2 (ISSN No. 2414-2336)
t+5 -0.0092
(0.346)
-0.0033
(0.418)
0.01922 -0.0093
(0.505)
-0.002807
(1.000)
0.0284
t+6 -0.0051
(0.679)
-0.0099
(0.590)
0.0254 -0.0090
(0.392)
-0.01068
(0.418)
0.0211
t+7 0.0154
(0.283)
0.0132
(0.418)
0.0278 0.0064
(0.472)
0.006901
(0.281)
0.0180
t+8 -0.0051
(0.459)
-0.0067
(0.787)
0.01400 -0.00955
(0.280)
-0.009010
(0.281)
0.01710
t+9 0.0407
0.031)*
0.0415
(0.059)*
0.0278 0.04460
(0.010)*
0.04691
(0.059)*
0.02146
t+10 -0.0151
(0.139)
-0.016
(0.178)
0.01831 -0.0128
(0.335)
-0.01142
(0.281)
0.0262
Note: In the above table the P-values are indicated through the brackets while* point
out the significance of the value at 5% critical value. Here for mean averages one-
sample T-test while for median Wilcoxon Signed Rank Test is exploited in case of P-
value.
A number of findings can be extracted from table 3. First, there is a negative
insignificant mean (median), abnormal returns and excess returns on the announcement
dates for the target firms. This result is similar with finding of Bashir et al. (2011,
p.263) ―who had analyzed the impact of merger and acquisition in Pakistan and found
that the target firms experience insignificant loss while the acquirer firms enjoy
statistically insignificant increase in value.‖ It refers that market is inefficient in semi-
strong form where new information (here M&A) is not quickly incorporated in share
prices.
Secondly, Table 3 shows a very different picture of target firms from that of bidders.
The table shows that there are insignificant negative mean (median) abnormal returns
and excess returns on most of the days prior to the acquisition‘s proclamation dates.
Therefore, no major stock value reactions are noted before the pronouncement dates
and no significant gains for target firms (Bashir et al., 2011).
Thirdly, Table 3 indicates that only on day t+9, there is significant positive
mean(median) abnormal and excess returns after the announcements, i.e., with a
mean(median) of abnormal returns are 4.0% (4.1%) and excess returns are 4.4% (4.6%)
with significant p-values at 5% level. For rest of the days after announcements, the
table presents insignificant negative abnormal and excess returns for most the days
except a significant gain on day t+9 for both abnormal and excess returns. It may imply
that acquisition announcements take some times to incorporate such information and
supports inefficiency in semi-strong form.
Lastly, Table 3 demonstrates standard deviation values which show a greater departure
from the mean values for both abnormal and excess returns. Such as for unexpected
values, it varies from 1.3% on day t+3 to 11.3% on day t-1. Likewise in excess values,
it varies from low 1.7% to a high of 11.3% on same days. This shows variability in
returns due to which the abnormal returns may not become significant on day t0.
153 Vol. 2, Issue 2 (ISSN No. 2414-2336)
Conclusion
This paper particularly addresses the impact of mergers and acquisition announcements
on share prices in Pakistani market from 2006 to 2014. The current study uses an event
study method in order to analyze the M&A announcements on stock returns of
32companies listed on the KSE (or PSX). Out of these 32 announcements, 22 firms are
those companies which have been merged, five companies are the target and five are
the bidder firms. A number of findings can be extracted from the results of event study.
Firstly, the results show statistically insignificant abnormal returns on the day of M&A
announcements (Gopalaswamy et al. 2008; Padmavathy & Ashok, 2012) for merger
firms. One reason for these insignificant unexpected gains may be due to news leakage
prior to the formal announcements because the firms show significant share price
reactions just before the announcements (Liang, 2013; Khan, 2011). So the current
outcome also proposes leakage of news to market immediately before the declaration
of amalgamation (Gopalaswamy et al., 2008). Alternatively, the findings indicate
negative insignificant abnormal returns after the announcements of merger.
Secondly, the results of bidder firms in acquisition announcements are also consistent
with the merger declarations, which indicate that on proclamation day there is no
significant share price reaction and also the bidders do not gain any proceeds on
announcement dates. On the other hand, there is considerable positive stock values
reaction prior to announcements of acquisition for bidder firms which may be because
of the leakage of information prior to formal announcements (Liang, 2013). Instead, on
average, the findings indicate insignificant negative abnormal returns after
announcements (Padmavathy & Ashok, 2012). Thirdly, the results depict a very
different picture of target firms from that of bidders before and after the announce-
ments of acquisition. So, on average, no major stock value reaction is documented
before the pronouncement date and no significant gains for target firms (Bashir et al.,
2011). On average, the conclusion detects that the target companies get less profit as
compared to acquirer firms in case of acquisition of Pakistani firms.
Based on the findings, this paper does not support semi-strong form of EMH because
there is insignificant unexpected return on the day of announcements of both merger
and acquisition. However, there are significant abnormal returns before and after
announcement date of M&A. The significant returns before the formal declaration may
refer to leakage of information. Similarly, the significant values after announcements
imply that the market takes time to incorporate any public news such as M&A. Further
research can be found to apply dedicated statistically tests to check the insider trading,
if any. In addition, the results have importance for investors to device the timing of
their investment decision around announcements of important events such as M&A.
This study suggests that investors can not earn abnormal profit on announcement date
of M&A.
154 Vol. 2, Issue 2 (ISSN No. 2414-2336)
References
Adebayo, O., & Olalekan, O. (2012). An analysis of the impact of mergers and
acquisitions on commercial banks performance in Nigeria. Pakistan Journal of
Social Sciences, 9(3), 139-146.
Ali, S., & Akbar, M. (2009). Calendar effects in Pakistani stock market. International
Review of Business Research Papers, 5(1), 389-404.
Ali, S. S., Mustafa, K., & Zaman, A. (2001). Testing semi-strong form efficiency of
stock market [with comments]. The Pakistan Development Review, 40(4), 651-
674.
Bashir, A., Sajid, R.M., & Sheikh, S. (2011). Impact of merger and acquisition on
shareholders wealth: Evidence from Pakistan. Journal of Scientific Research, 8(1),
261-264.
Brown, S. J., & Warner, J. B. (1985). Using daily stock returns: The case of event
studies. Journal of financial economics, 14(1), 3-31.
Chakraborty, M. (2006). Market efficiency for the Pakistan stock market: evidence
from the Karachi Stock Exchange. South Asia Economic Journal, 7(1), 67-81.
Dianita, M., Tarmidi, D., & Hadian, N. (2013, November). Analysis of Announcement
Merger and Acquisition and Payment Method to Stock Return: Study of Listed
Companies at Bei During 2005-2011. 23rd
International Business Research
Conference, World Business Institute.
Dodd, P., & Ruback, R. (1977). Tender offers and stockholder returns: An empirical
analysis. Journal of financial economics, 5(3), 351-373.
Fatima, T., & Shehzad, A. (2014). Analysis of Impact of Merger and Acquisition of
Financial Performance of banks: A case of Pakistan. Journal of Poverty,
Investment and Development and Open Access International Journal, 5, 29-36.
Fuller, K., Netter, J., & Stegemoller, M. (2002). What do returns to acquiring firms tell
us? Evidence from firms that make many acquisitions. The Journal of
Finance, 57(4), 1763-1793.
Gersdorff, N.V., & Bacon, D.F. (2009). U.S. Mergers and Acquisitions: A Test of
Market Efficiency. Journal of Finance and Accountancy.1(8), pp.1-8.
Gopalaswamy, A. K., Acharya, D., & Malik, J. (2008). Stock price reaction to merger
announcements: an empirical note on Indian markets. Investment Management and
Financial Innovations, 5(1), 95-103.
Hijzen, A., Görg, H., & Manchin, M. (2008). Cross-border mergers and acquisitions
and the role of trade costs. European Economic Review, 52(5), 849-866.
Hussain, F. (1999). The day of the week effect in the Pakistani equity market: an
investigation. The Lahore Journal of Economics, 5(1), 93- 98.
Indhumathi, G., & Selvam, M, M. (2008). Impact of mergers on stock return in Indian
stock exchange with reference to BSE. Department of Commerce. Available at
SSRN: 180114.

155 Vol. 2, Issue 2 (ISSN No. 2414-2336)
Karnik, S. (2005). Do M&As Create Value for Target Companies‘ Shareholders. The
ICFAI Journal of Mergers and Acquisitions, 11(4), 62-76.
Khan, N. U. (2011). Dividend policy and the stock market reaction to the dividend
announcements in Pakistan. University of Dundee, scotland, UK.
Liang, C. (2013).The impact of merger and acquisition announcements on firms‘ stock
performance: Evidence from Hong Kong Stock Market. Master Degree at Finance
Saint Mary’s University
Ma, J., Pagan, J. A., & Chu, Y. (2009). Abnormal returns to mergers and acquisitions
in ten Asian stock markets. International Journal of Business, 14(3), 235-250
Mahmood, I., Aamir, M., Hussain, C. M., & Sohail, N. (2012). Impact of
merger/acquisition on share price-a case study of Pakistan. European Journal of
Scientific Research, 67(4), 617-624.
Manasakis, C. (2009). Shareholder wealth effects from mergers and acquisitions in the
Greek banking industry. International Journal of Banking, Accounting and
Finance, 1(3), 242-256.
Odoru, M.I., & Agyei, K. S. (2013). Mergers & acquisition and firm performance:
evidence the Ghana stock exchange. Journal of finance and Accounting, 4(7), 99-
107.
Olusola, A.O., & Olusola, J.O. (2012). Effect of merger and acquisition on returns to
shareholders of conglomerates in Nigeria. Journal of finance and Accounting, 3(7),
86-90
Padmavathy, S., & Ashok, J. (2012). Merger announcements and stock price
behaviour: Empirical evidence from Indian stock market. International Research
Journal of Finance and Economics, 83(1), 153-160.
Shaheen, I. (2006). Stock market reaction to acquisition announcements using an event
study approach (Doctoral dissertation).
Simões, M. D., Macedo-Soares, T. D. L., Klotzle, M. C., & Pinto, A. C. F. (2012).
Assessment of market efficiency in Argentina, Brazil and Chile: an event study of
mergers and acquisitions. BAR-Brazilian Administration Review, 9(2), 229-245.
Smit, C. J., & Ward, M. J. D. (2007). The impact of large acquisitions on the share
price and operating financial performance of acquiring companies listed on the
JSE. Investment Analysts Journal, 65, 5-14.
Strong, N. (1992). Modelling abnormal returns: a review article. Journal of Business
Finance & Accounting, 19(4), 533-553.
Tauseef, S., & Mohammed, N. (2010). Wealth effect of mergers & acquisitions in an
emerging market: A case study of Pakistan‘s banking sector. Available at SSRN
1653690.
Travlos, N. G. (1987). Corporate takeover bids, methods of payment, and bidding
firms' stock returns. The Journal of Finance, 42(4), 943-963.
Woolridge, J. R., & Snow, C. C. (1990). Stock market reaction to strategic investment
decisions. Strategic management journal, 11(5), 353-363.
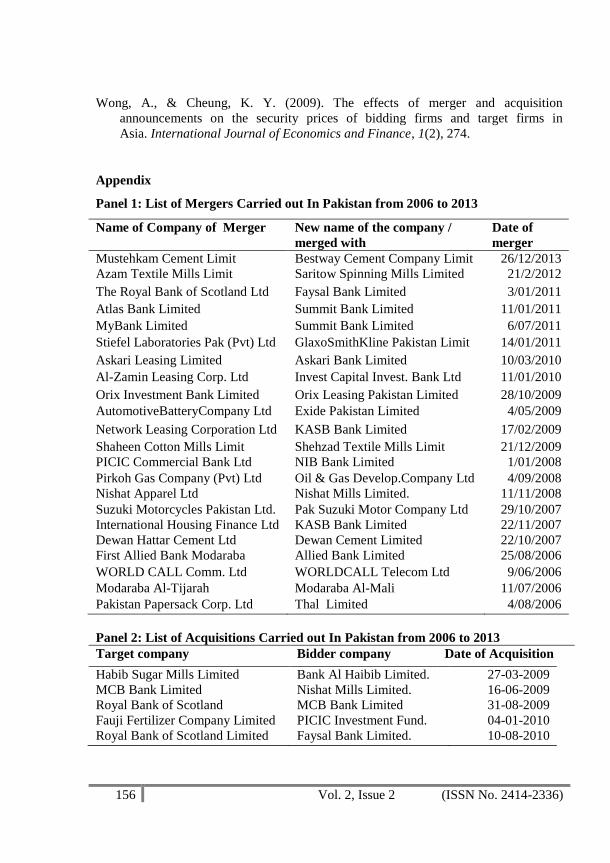
156 Vol. 2, Issue 2 (ISSN No. 2414-2336)
Wong, A., & Cheung, K. Y. (2009). The effects of merger and acquisition
announcements on the security prices of bidding firms and target firms in
Asia. International Journal of Economics and Finance, 1(2), 274.
Appendix
Panel 1: List of Mergers Carried out In Pakistan from 2006 to 2013
Name of Company of Merger New name of the company /
merged with
Date of
merger
Mustehkam Cement Limit Bestway Cement Company Limit 26/12/2013
Azam Textile Mills Limit Saritow Spinning Mills Limited 21/2/2012
The Royal Bank of Scotland Ltd Faysal Bank Limited 3/01/2011
Atlas Bank Limited Summit Bank Limited 11/01/2011
MyBank Limited Summit Bank Limited 6/07/2011
Stiefel Laboratories Pak (Pvt) Ltd GlaxoSmithKline Pakistan Limit 14/01/2011
Askari Leasing Limited Askari Bank Limited 10/03/2010
Al-Zamin Leasing Corp. Ltd Invest Capital Invest. Bank Ltd 11/01/2010
Orix Investment Bank Limited Orix Leasing Pakistan Limited 28/10/2009
AutomotiveBatteryCompany Ltd Exide Pakistan Limited 4/05/2009
Network Leasing Corporation Ltd KASB Bank Limited 17/02/2009
Shaheen Cotton Mills Limit Shehzad Textile Mills Limit 21/12/2009
PICIC Commercial Bank Ltd NIB Bank Limited 1/01/2008
Pirkoh Gas Company (Pvt) Ltd Oil & Gas Develop.Company Ltd 4/09/2008
Nishat Apparel Ltd Nishat Mills Limited. 11/11/2008
Suzuki Motorcycles Pakistan Ltd. Pak Suzuki Motor Company Ltd 29/10/2007
International Housing Finance Ltd KASB Bank Limited 22/11/2007
Dewan Hattar Cement Ltd Dewan Cement Limited 22/10/2007
First Allied Bank Modaraba Allied Bank Limited 25/08/2006
WORLD CALL Comm. Ltd WORLDCALL Telecom Ltd 9/06/2006
Modaraba Al-Tijarah Modaraba Al-Mali 11/07/2006
Pakistan Papersack Corp. Ltd Thal Limited 4/08/2006
Panel 2: List of Acquisitions Carried out In Pakistan from 2006 to 2013
Target company Bidder company Date of Acquisition
Habib Sugar Mills Limited Bank Al Haibib Limited. 27-03-2009
MCB Bank Limited Nishat Mills Limited. 16-06-2009
Royal Bank of Scotland MCB Bank Limited 31-08-2009
Fauji Fertilizer Company Limited PICIC Investment Fund. 04-01-2010
Royal Bank of Scotland Limited Faysal Bank Limited. 10-08-2010
157 Vol. 2, Issue 2 (ISSN No. 2414-2336)
EFFECT OF ISLAMIC WORK ETHICS ON EMPLOYEE WELL-BEING, JOB
STRESS AND TURNOVER INTENTION
Maaz-ud-Din, MS Scholar, IBMS, The University of Agriculture, Peshawar-Pakistan
Email:[email protected]
Saad Farooq, Lecturer IBMS, The University of Agriculture, Peshawar-Pakistan
Email:[email protected]
Abstract. This study is focused on to investigate the effects of Islamic
work ethics on employee well-being, job stress and turnover intention.
Adopted questionnaire was used to collect data, from 201 Government
School teachers of Peshawar District, Pakistan. Simple linear regression
model was used to identify the effects of Islamic work ethic on employee
well-being, job stress and turnover intention. Results show that Islamic
work ethics has significant effect on employee well-being whereas
insignificant effect on turnover intention and job stress. This paper also
provides basic information regarding the amount of work carried on
Islamic work ethics in business organizations of Pakistan mainly in
education sector of Peshawar District, Pakistan.
Key words: Turnover intention, Islamic work ethics, employee well-being, Job stress.
Introduction
The term ethics was defined Johnson (1984) as the science of conduct and behavior. In
the field of ethics there are different schools of thoughts. One important school of
thoughts is Islamic work ethics while second important is that of protestant work
ethics. According to Weber (1958) in the majority of European countries economy
protestant work ethics has been gained high importance in the expansion of capitalism.
Evidently Weber has connected the success that accomplished by most European states
to religious aspects (Yousef, 2000). He also suggests that Protestant work ethics mostly
hold to promote the potency of free enterprise which is totally grounded over the values
that economic gains and effort are focus to realize personal and spiritual achievement
(Kidron, 1978; Mirels & Garrett, 1971).
Islamic work ethics represents the mixture of principles or beliefs which are based on
the injunctions of the Quran Majeed, the recorded sayings of the Prophet Muhammad
(S.A.A.W) and hard work of the people involved (Ali & Al-Owaihan 2008; Rice,
1999). Shakil, (2011) contends that Islamic work ethics encompasses economic, social
and ethical scope. In every part of an individual‘s life, that includes her/his economic,
business and daily life, one must replicate the Islamic work ethics. Islamic work ethics
is the way that shape and also affects the contribution and participation of workers in
their working place (Ali, 2008). Employees‘ behavior toward their work and also
organization they work for can affect work ethics (Glazer, et al., 2004). The secular
ethical or Western standards, Islamic moral and moral system principles are completely
unrelated from one another. The Western secular system understand system of ethics
that were brief also narrow minded usually these models projected a structure of ethics
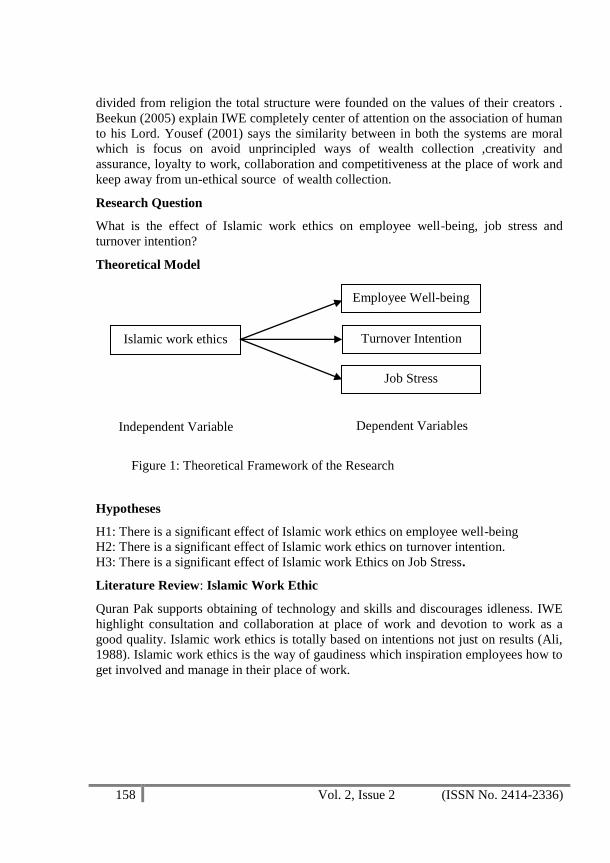
158 Vol. 2, Issue 2 (ISSN No. 2414-2336)
divided from religion the total structure were founded on the values of their creators .
Beekun (2005) explain IWE completely center of attention on the association of human
to his Lord. Yousef (2001) says the similarity between in both the systems are moral
which is focus on avoid unprincipled ways of wealth collection ,creativity and
assurance, loyalty to work, collaboration and competitiveness at the place of work and
keep away from un-ethical source of wealth collection.
Research Question
What is the effect of Islamic work ethics on employee well-being, job stress and
turnover intention?
Theoretical Model
Hypotheses
H1: There is a significant effect of Islamic work ethics on employee well-being
H2: There is a significant effect of Islamic work ethics on turnover intention.
H3: There is a significant effect of Islamic work Ethics on Job Stress.
Literature Review: Islamic Work Ethic
Quran Pak supports obtaining of technology and skills and discourages idleness. IWE
highlight consultation and collaboration at place of work and devotion to work as a
good quality. Islamic work ethics is totally based on intentions not just on results (Ali,
1988). Islamic work ethics is the way of gaudiness which inspiration employees how to
get involved and manage in their place of work.
Islamic work ethics Turnover Intention
Job Stress
Employee Well-being
Independent Variable Dependent Variables
Figure 1: Theoretical Framework of the Research
159 Vol. 2, Issue 2 (ISSN No. 2414-2336)
Islamic Work Ethics and Job Stress
Long (1995) says that within the working surroundings stress is race between the
source of demand and individual. Yousaf, (2000 & 2001) has two research studies on
Islamic work ethics simultaneously. Ali, (1992, 1988) and (Rehman et al., 2006)
research also vital on stress level and improving job satisfaction in place of work.
Yousaf (2001) and Rehman et al., (2006) in conformity with Furnham (1984, 1991)
have claimed so as to there is a job happiness and superior job declaration which results
in a most happy worker in his research on Islamic work ethics. Stress and depression
are insignificant associated with religion, (Fehring et al., 1987). Koenig et al., (2004)
suggested that energetic workers always tend to work high with less antagonism and
great expectations. Management should realize the concept of work ethics and speed up
the development growth and try to attract the employees together physically and
spiritually (Whittington & Diddams, 2003).
Islamic Work Ethics and Turnover intention
Turnover intention of worker has great impact on organization working. Islamic work
ethics research suggests, that workers accepting Islamic work ethics have lesser
turnover rate (Shakil, 2011). Hence, it is easy to conclude that such workers have been
found more happy, highly involved in job. Rokhman (2010) says IWE presented
insignificant association with intention to leave.
Rokhman (2010) suggested that those workers who chase Islamic work ethics and
contain powerful belief on Islam and all at once they express job satisfaction, low
turnover intention, more managerial obligation are found. The most important parts of
ethical values and Muslims attitude are Islamic work ethics; therefore staffs that are
more level in IWE are higher job participation, job happiness and intention to leave.
Islamic Work Ethics and Employee Well-being
About justifiable wages to help the workforces the Holy Prophet has said a lot about
work ethics. He says: before their sweat dries pay wages to your workers. Ali, (1988)
claimed that rise your employee‘s moral and due to this, it will offer them authority to
right their outcome, and will not made them unneeded and not to be unfaithful to the
assets at hands and it is a guarantee to reject your power, or deceive the expectation. He
also mentions extension of aliments which supports them to keep away from poverty to
the fact of education. According to Ahmad, (1971) the aim of the Islamic structure of
business are not mainly capital oriented, consequently are founded on the ideas of
achieving a good life and human gladness.
Methodology: Population and Sampling technique:
In District Peshawar, 9960 Government school teachers are working, therefore the
population of our study is 9960. Through adopted structure questionnaires the data
were collected from 201 Teachers of the subject schools in District Peshawar, Pakistan.
According to Sekran (2003) for the population of this magnitude there should be 370
respondents. Therefore, we distribute 400 questionnaires in the target population. The
return rate of questionnaires was 50.25%.

160 Vol. 2, Issue 2 (ISSN No. 2414-2336)
Analysis and Results
In the current study 201 respondents were selected for data collection, for this purpose
we divided all respondents in classification as gender, age, education and experiences,
among these respondents 61 were female respondents (30.34%), and 140 respondents
were male(70%). Mostly 30-40 years respondents group were in majority. Only 1%
respondents having intermediate, respondents having Bachelor degrees were about
35.8%, likewise respondents having Master and M.Phil were (56.5%) and (4%)
respectively. Similarly there were high experienced teachers among all the staffs/
teachers so respondents having 1-10 years experienced are (56.5%) 21-30 years
experienced were held only (15%) and 11-20 teachers were about (28.3%) among all
these teachers only one respondent got experienced more than 30 years. The
demographics characteristics are as follow in table no table (i).
Table 1 Demographic of Respondents
Description Frequency Percentage %
Gender Male
Female
Total
140
61
201
70
30.34
100%
Age
20-30
31-40
41-50
51-60
Total
65
74
53
9
201
32.3
32.3
26.5
4.5
100
Qualification
Intermediate
Bachelor
Master
M.Phil
Total
2
72
119
8
201
1.0
35.8
59.5
4.0
100
Experience
1-10
11-20
21-30
31-40
113
57
30
1
56.5
28.3
15.0
0.5
Total 201 100
Table 2 Reliability Statistics
No of Variables Items Alpha Score Reliability
Islamic work ethics 17 0.65 Reliable
Job stress 13 0.81 Reliable
Turnover intention 3 0.71 Reliable
Employee well-being 18 0.60 Reliable
Standard: Hair et al (2003).
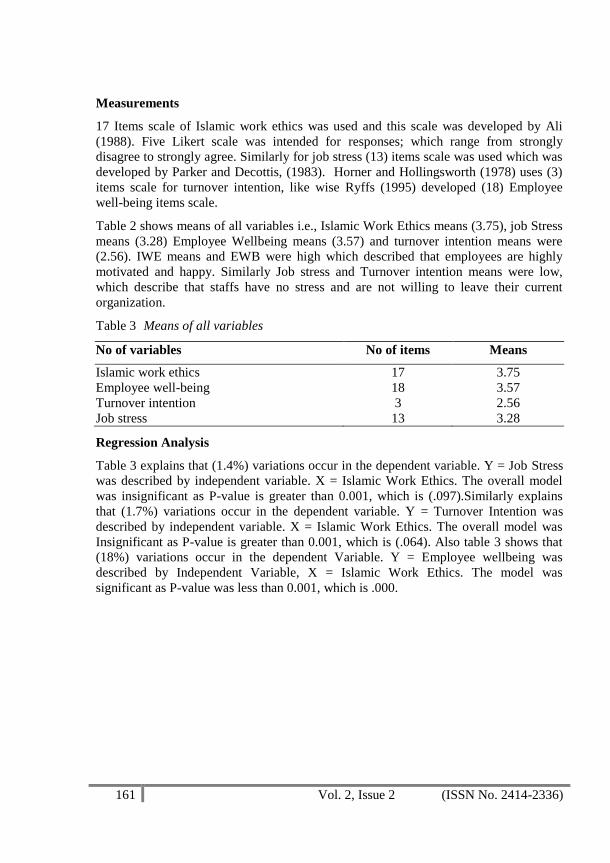
161 Vol. 2, Issue 2 (ISSN No. 2414-2336)
Measurements
17 Items scale of Islamic work ethics was used and this scale was developed by Ali
(1988). Five Likert scale was intended for responses; which range from strongly
disagree to strongly agree. Similarly for job stress (13) items scale was used which was
developed by Parker and Decottis, (1983). Horner and Hollingsworth (1978) uses (3)
items scale for turnover intention, like wise Ryffs (1995) developed (18) Employee
well-being items scale.
Table 2 shows means of all variables i.e., Islamic Work Ethics means (3.75), job Stress
means (3.28) Employee Wellbeing means (3.57) and turnover intention means were
(2.56). IWE means and EWB were high which described that employees are highly
motivated and happy. Similarly Job stress and Turnover intention means were low,
which describe that staffs have no stress and are not willing to leave their current
organization.
Table 3 Means of all variables
No of variables No of items Means
Islamic work ethics 17 3.75
Employee well-being 18 3.57
Turnover intention 3 2.56
Job stress 13 3.28
Regression Analysis
Table 3 explains that (1.4%) variations occur in the dependent variable. Y = Job Stress
was described by independent variable. X = Islamic Work Ethics. The overall model
was insignificant as P-value is greater than 0.001, which is (.097).Similarly explains
that (1.7%) variations occur in the dependent variable. Y = Turnover Intention was
described by independent variable. X = Islamic Work Ethics. The overall model was
Insignificant as P-value is greater than 0.001, which is (.064). Also table 3 shows that
(18%) variations occur in the dependent Variable. Y = Employee wellbeing was
described by Independent Variable, X = Islamic Work Ethics. The model was
significant as P-value was less than 0.001, which is .000.
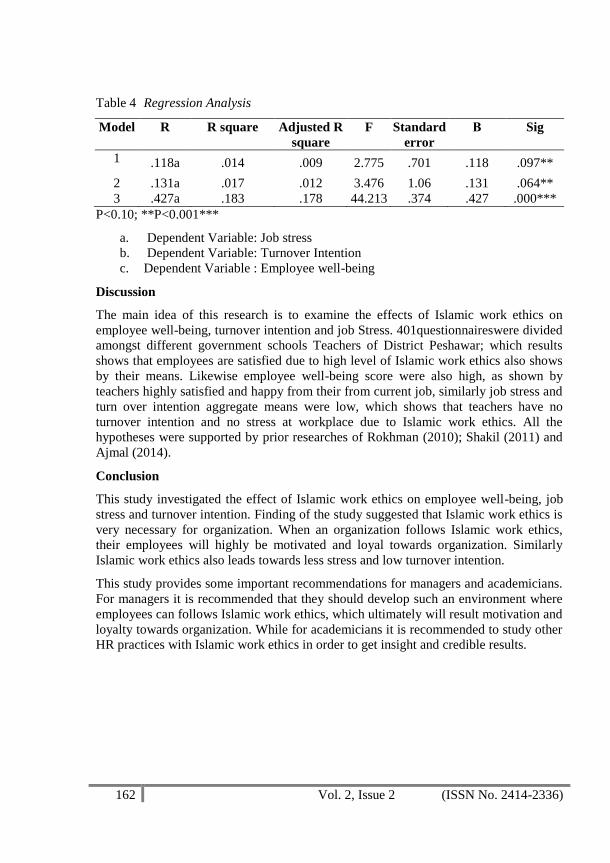
162 Vol. 2, Issue 2 (ISSN No. 2414-2336)
Table 4 Regression Analysis
Model R R square Adjusted R
square
F Standard
error
Β Sig
1 .118a .014 .009 2.775 .701 .118 .097**
2 .131a .017 .012 3.476 1.06 .131 .064**
3 .427a .183 .178 44.213 .374 .427 .000***
P<0.10; **P<0.001***
a. Dependent Variable: Job stress
b. Dependent Variable: Turnover Intention
c. Dependent Variable : Employee well-being
Discussion
The main idea of this research is to examine the effects of Islamic work ethics on
employee well-being, turnover intention and job Stress. 401questionnaireswere divided
amongst different government schools Teachers of District Peshawar; which results
shows that employees are satisfied due to high level of Islamic work ethics also shows
by their means. Likewise employee well-being score were also high, as shown by
teachers highly satisfied and happy from their from current job, similarly job stress and
turn over intention aggregate means were low, which shows that teachers have no
turnover intention and no stress at workplace due to Islamic work ethics. All the
hypotheses were supported by prior researches of Rokhman (2010); Shakil (2011) and
Ajmal (2014).
Conclusion
This study investigated the effect of Islamic work ethics on employee well-being, job
stress and turnover intention. Finding of the study suggested that Islamic work ethics is
very necessary for organization. When an organization follows Islamic work ethics,
their employees will highly be motivated and loyal towards organization. Similarly
Islamic work ethics also leads towards less stress and low turnover intention.
This study provides some important recommendations for managers and academicians.
For managers it is recommended that they should develop such an environment where
employees can follows Islamic work ethics, which ultimately will result motivation and
loyalty towards organization. While for academicians it is recommended to study other
HR practices with Islamic work ethics in order to get insight and credible results.
163 Vol. 2, Issue 2 (ISSN No. 2414-2336)
References
Abu-Saad,I. (2003). The work values of Arab teachers in Israel in a Multicultural
context. Journal of Beliefs & Values, 24(1), 39–51.
Ahmad, A. & Schimmel, A., (1971). An intellectual history of Islam in India. Journal
of the American Oriental Society, 91(2), 334-342.
Ajmal, M. U., & Irfan, S. (2014). Understanding the moderating role of Islamic work
ethics between job stress and work outcomes. IOSR Journal of Business and
Management, 16(1), 62–67.
Ali, A. (1988). Scaling an Islamic work ethic. The Journal of Social
Psychology, 128(5), 575–583.
Ali, A. J., & Al-Owaihan A. (2008). Islamic work ethic: A critical review. Cross
Cultural Management: An International Journal, 15(1), 5–19.
Beekun, R. I., & Badawi, J. A. (2005). Balancing ethical responsibility among multiple
organizational stakeholders: The Islamic perspective. Journal of Business
Ethics, 60(2), 131–145.
Fehring, R. J., Brennan, P. F., & Keller, M. L. (1987). Psychological and spiritual well-
being in college students. Research in Nursing & Health, 10(6), 391–398.
Furnham, A. (1991). The Protestant work ethic in Barbados. The Journal of Social
Psychology, 131(1), 29–43.
Furnham, A., & Muhiudeen, C. (1984). The Protestant work ethic in Britain and
Malaysia. The Journal of Social Psychology, 122(2), 157–161.
Glazer, S., Daniel, S. C., & Short, K. M. (2004). A study of the relationship between
organizational commitment and human values in four countries. Human
Relations, 57(3), 323–345.
Hair, J. F. Jr., Babin, B., Money, A. H., & Samouel, P. (2003). Essential of Business
Research Methods. John Wiley & Sons: United States of America.
Johnson, O. A. (1984). Ethics Selection from Classical and Contemporary Writers.
New York: Holt, Rinehart and Winsto.
Kidron, A. (1978). Work values and organizational commitment. Academy of
Management Journal, 21(2), 239–247.
Koenig, H. G., McCullough, M. E., & Larson, D. B. (2004). Handbook of religion and
health. The American Journal of Geriatric Psychiatry, 12(3), 332.
Long, B. C. (1995). Stress in the Work Place: ERIC Digest.
Mirels, H. L., & Garrett, J. B. (1971). The Protestant ethics as a personality
variable. Journal of Consulting and Clinical Psychology, 36(1), 40–44.
Horner & Hollingsworth (1978). Affective commitment and intent to quit: The impact
of work and non-work related issues. Journal of Managerial Issues, 18, 512-
529.
Parker, D. F. & DeCotiis, T. A. (1983). Organizational determinants of job stress.
Organizational Behavior and Human Performance, 32, 160-167.
164 Vol. 2, Issue 2 (ISSN No. 2414-2336)
Rehman, N. M., Muhammad, N., & Othman, A. S. (2006). The relationship between
Islamic work ethics and organizational commitment: A case
analysis. Malaysian Management Review,41(1), 79–89
Rice, Gillian. (1999) "Islamic ethics and the implications for business." Journal
ofbusiness ethics 18.4: 345-358.
Rokhman, W. (2010). The effect of Islamic work ethics on work outcomes, Electronic
Journal of Business Ethics and Organization Studies, 15:1.
Ryffs, C. D., & Keyes, C. L. M. (1995). The structure of psychological well-being
revisited. Journal of Personality & Social Psychology, 69(4), 719–727
Shakil, M. A. (2011). Work ethics: An Islamic prospective. International Journal of
Human Sciences. 8:1.
Sekaran, U. (2003). Research Methods for Business: A Skill Approach. New Jersey:
John Willey and Sons, Inc.
Whittington, M., & Nord, W. R. (2003). Book review essay: Revisiting the meaning of
meaningful work. Academy of Management Review, 28(3), 508–512.
Weber, M. (1958). The Protestant Ethic and the Spirit of Capitalism. Charles
Scribner‘s Sons, New York.
Yousef, D. A. (2001). Islamic work ethic: A moderator between organizational
commitment and job satisfaction in a cross-cultural context. Personnel
Review, 30(2), 152–169.
Yousef, D. A. (2000). The Islamic work ethic as a mediator of the relationship between
locus of control, role conflict and role ambiguity: A study in an Islamic
country setting. Journal of Managerial Psychology, 15(4), 283–298.

165 Vol. 2, Issue 2 (ISSN No. 2414-2336)
THE MEDIATING ROLE OF CAREER DEVELOPMENT IN ITS
ANTECEDENTS AND OUTCOMES: EMPIRICAL EVIDENCE FROM
PAKISTAN
Haji Rahman, Assistant Professor, Faculty of Business Administration, Preston
University, Islamabad. Email: [email protected]
Wali Rahman, Associate Professor, Department of Business Administration, Sarhad
University of Science & IT, Peshawar. Email. [email protected]
Muhammad Azizullah Khan, Assistant Professor, Faculty of Business Administration,
Preston University, Islamabad. Email: [email protected]
Khalid Javed Anwar, Assistant Professor, Faculty of Business Administration, Preston
University, Islamabad. Email: [email protected]
Abstract: The impression of strengthening human capital to promote
innovation and creation by planning the careers of organizational
members in light of HRM practices and policies and to develop distinct
mentalities, competencies and skills with the sole objective of providing a
series of novel services and products has been getting importance. The
current paper dig into the importance of career planning along with the
career management as input for the career development and career
commitment, and career satisfaction as the output of this relationship. A
sample of 395 teaching staff of the colleges of Malakand Division of
Khyber Pakhtunkhwa, Pakistan was randomly selected for the current
research. To test the hypotheses of the study, structural equation
modeling as a statistical technique for analysis of the empirical data was
employed. Empirical results supported all the hypotheses of the study.
These results illustrated that career planning along with the career
management are very important roots of the career development which
further engenders career commitment and career satisfaction. These
results also validated the mediating role of career development in the
relationship of career management and career planning on the one hand
as antecedents and career commitment and career satisfaction as
outcomes on the other hand. The study has uniqueness in the sense that
the study is the first one that tests these hypotheses in colleges in Khyber
Pakhtunkhwa. And that is why the study has both academic and practical
implications. At the end a few recommendations has been put forwarded
for future research.
Key words: Structure equation modeling; career development; career planning; career
commitment, career management, and career satisfaction.
Introduction
Our current globalized world of business is characterized by continuous and
unavoidable changes that are taking place on daily basis leading to downsizing/
rightsizing processes and restructuring, acquisitions and mergers, and technological

166 Vol. 2, Issue 2 (ISSN No. 2414-2336)
progressions to deal with the active pressures of globalization (Baruch, 2004;
Greenhaus, Callanan, & Godshalk, 2009). Such constant shifts in the organisations
have increased the level of importance for managing people at work, and specially, the
managing and planning of their employment careers (Baruch, 2004). Career related
issues are critical because they are matters of concerns for both the employee and
employer. It is a composite process and the related theories of this composite process
came into being in 1950s in the work of Anne Roe, John Holland, Eli Ginzberg,
Donald Super and David Tiedeman (Herr & Shahnasarian, 2001). Career development
involves a planned, formalized, and organized effort to create equilibrium between the
organization‘s work force requirements and individual‘s career needs. Literature on
careers in the 1990s remained focused on the practices of career development covering
a widespread range of career related issues, organizations and populations (Adekola,
2011).
Career is a lifelong process composed of some patterned work related experiences.
These experience inter alia, job positions, work related decisions, works related
activities or duties; and subjective interpretations of job and associated events, such as
work aspirations, values, expectations, needs, wants and feelings about any specific
work, related to a class of individual is called as career (Greenhaus et al., 2009).
Evidently, only a job is not a career, it is the collective name of a process, attitude and
behaviour, and a situation in an individual‘s work life with the aim to accomplish some
work related goals. According to Baruch (2004), although career is the attribute of an
individual, it is the responsibility of the organisation to plan and manage the career of
their employees and therefore, is a joint responsibility of taking care of the career
management for maximum benefit for both. Proper investment in the career planning
and career management of individuals enables them to harvest the fruits of such
investment by achieving in the form of career development. According to Greenhaus et
al. (2009) the development of career is a continuous process by which individuals
move on with a chain of steps, every step is characterized by a comparatively distinct
themes, issues, and unique set of tasks.
Organizations take initiatives for career planning and career development with the
purpose to enhance the experiences of their employees with the ultimate aim to enable
them to have proactive style of responsibility for their own promotion and progression
in their career (Ababneh, 2013; Martin, Romero, Valle, & Dolan, 2001). It has been
acknowledged that a properly structured career development system helps
organizations to retain their valuable personnel with more developed skills, knowledge,
and enhanced competencies. This further enables these organizations to equip
themselves with motivated and retrained employees, find themselves in a better
position to take informed decisions on compensation and succession planning ensuring
in a well engaged and productive manpower (Kapel & Shepherd, 2004; Kaye, 2005).
Keeping in view these theoretical perspectives this paper attempts to empirically test
career planning and career management as antecedents and career commitment and
career satisfaction as outcomes with the mediating role of career development in public
and private colleges‘ context.

167 Vol. 2, Issue 2 (ISSN No. 2414-2336)
Model of Career Development
Figure 1 represents the conceptual model for the current study. The variables are
interlinked and present a mediation role for career development. Each arrow in the path
diagram represents a distinct hypothesis. The subsequent discussion carries discussion
on the hypotheses.
Fig. 1 Conceptual Model of Career Development
Career Development and Career Planning
Career development has critical importance in the relationship between the employees
and their employer. No doubt, career development is an individual initiative,
organisations set up mechanisms, systems and structures, as well as processes to
nurture career development initiatives among personnel (Adekola, 2011); the
impression of individuals pursuing their careers and molding, developing and shaping
them with the objective to get maximum benefits, has received great attention in the
present age. It is imperative for them to make career planning as an intentional activity
for equipping themselves with personal knowledge, skills, strengths, create
opportunities, overcome constraints, consequences and choices, and planning for
education and work, and associated developmental experiences to devise planning to
achieve career goals (Ababneh, 2013). In the light of this discussion first hypothesis is
presented:
H1: Career planning of employees’ leads to their career development.
Career Management and Career Development
The second mostly quoted antecedent of career development is the career management.
When individuals plan their career aims and goals, they need knowledge, skills, and
competencies to execute them with appropriate career management practices.
Otherwise stated, forthcoming stage after career planning will be its execution via
suitable career management drills. It is clear that career management is a continuous
exercise of creating, developing, organizing, implementing and monitoring career plans
and strategizing them by the employee itself, or together with the employer (Greenhaus
et al., 2009). Surely, for any living organization career management is an ongoing
activity of work life. A well-managed career management can have positive effects on
employees like promoting and encouraging spirits of fulfillment while ill-managed
career management and poor career decisions can have negative effects on individual‘s
Career
Planning
Career
Management
Career
Development
Career
Satisfaction
Career
Commitment
H
1
H
2
H
3
H
4
168 Vol. 2, Issue 2 (ISSN No. 2414-2336)
sense of wellbeing. Similarly, continuous flux of change in business direction and
strategies, mergers and acquisitions, organizations‘ downsizing, and technological
innovations, needs continuous career management (Greenhaus et al., 2009). It is
claimed that most of the employees can arrive at informed decisions if they have
effective career management system. Any initiative of career management provides a
link between institutions and its employees and strengthens the bond, as institutions
strive to couple an employee‘s interests and capabilities with institutional opportunities
through some well-planned program including activities such as job enrichment, job
enlargement, job rotation, career counseling, etc. (Martin, et al., 2001). Effective career
management practices will help in gathering proper feedback and this feedback further
help the individuals in developing their knowledge and skills, promote employee
insight, goal and strategy development (Greenhaus et al., 2009; Martin et al., 2001). In
the light of this discussion second hypothesis is presented:
H2: Career management employees’ leads to their career development.
Career Development and Career Satisfaction
Career satisfaction has great importance in an employee physical, psychological, and
social well-being. It has significant and a positive impact on the output of an employee
(Afonso, Ramos, Saraiva, Moreira, & Figueira, 2014). This critical variable in
organizational behaviour represents an overall summary of how a person feels about a
lifetime of work. Organizations are serious about employees‘ career development as it
is considered one of the effective ways of developing and retaining employees (Kong,
Cheung, & Song, 2012). According to Greenhaus et al. (2009) it is the collectivity of
satisfaction that individuals get from the extrinsic and intrinsic facets of their careers,
promotion and increase in pay, and developmental opportunities. According to Kong,
et al. (2012) it is an important predictor of career success both subjective and objective.
External or objective career success relates more or less to some tangible indicators like
salary, promotion, etc. (Arthur, Khapova, & Wilderom, 2005). Researchers (e.g. Arthur
et al., 2005) consider subjective career success an increasingly important and is one of
the factors that contribute significantly to career success. In the light of this discussion
third hypothesis is presented:
H3: Career development of employees’ will have positive effects on their career
satisfaction.
Career Development and Career Commitment
Career development has many outcomes. Career commitment is one of them. Career
development opportunities affect an employee‘s personal career objectives,
identification with, involvement in and attachment to those objectives. Career
commitment is the intensity of an employee‘s motivation towards his or her work in
their career (Noordin, Williams, & Zimmer, 2002). Institutions that help and assist their
employees by providing them career related information well in time, it basically
narrow down the focus of their employees and bond them more tight to their
institutions, hence becoming committed towards their career. As institutions are subject
169 Vol. 2, Issue 2 (ISSN No. 2414-2336)
to more flux and become less capable of guaranteeing employment security hence
commitment to an internally defined career may become a significant source of
occupational meaning and continuity (Colarelli & Bishop, 1990). Therefore, career
development would be fundamental for career commitment and career progression
(Noordin et al., 2002). Career development opportunities and initiatives provided by
the organization strengthen employees‘ commitment. According to King (1999) some
psychological forces like self-insight, resilience and self-identity in pursuing career
aims and objectives constitute prime components for career commitment, motivation,
cohesiveness, consensus, and for strengthening cooperation in institutions. In the light
of this discussion our fourth hypothesis is:
H4: Career development of employees’ will have positive effects on their career
commitment.
Rationale of the Study
Career issues have got centrality in the relationship between employees and employers.
Any HR intervention that affects this relationship is very pivotal. Though variables in
this relationship may have common names, social and cultural development of these
variables differs from culture to culture and from organization to organization.
Studying these constructs in different organizational setups and validating hypotheses
therein is very essential. These hypotheses have been tested in developed countries and
in bits and pieces. This study is the first attempt to test these hypotheses through
empirical data from the colleges in Khyber Pakhtunkhwa which is a developing part of
a developing country. The results may have great academic and practical implications.
Method
Population and samples for the study
Population for the current study is all the teaching staff of colleges of the Malakand
division of Khyber Pakhtunkhwa, Pakistan. Simple random sampling technique has
been employed to cover the approximately 2200 population. A total of 750 employees,
lecturers, assistant professors, associate professor, and full professors within these
colleges were sent the survey questionnaire. The questionnaire has a covering letter
wherein the purpose and objectives of the research have been explained. A total of 415
employees returned the filled in questionnaires which made 55% response rate. Out of
these 20 questionnaires were discarded due to missing data, hence the analyses were
run on the remaining 395 which represented a participation rate of 53%.
Measures
Two main measures have been used: first consists of demographic information on
gender and rank of the employees; the second one is aimed at measuring the five career
constructs i.e. career management, career planning, career development, career
commitment, and career satisfaction. For the five career constructs, five point Likert
scale ranging from 1 (strongly disagreed) to 5 (strongly agreed) has been employed.

170 Vol. 2, Issue 2 (ISSN No. 2414-2336)
Demographic profile of the respondents
The frequency of respondents by gender is enlisted by Table 1. It is clear from table 1
that male participants dominate with 82% (n=324), while female participants are 18%
(n=71). Similarly, table 2 presents the frequency of respondents by age. The statistics
in table 2, it is clear that age group 25-35, having 52.2% (n=206) is the dominant
group. This is followed by the age group 36-45, having 25.8% (n=102). The age group
46 and above has 20% (n=79) share in the collected data. There are 8 respondents who
left the age column in the questionnaire blank.
Table 1 Gender of the Respondents (N=395)
Frequency Percent Valid % Cumulative %
Valid Male 324 82.0 82.0 82.0
Female 71 18.0 18.0 100
Total 395 100.0 100
Table 2 Age of the Respondents (N=395)
Frequency Percent Valid % Cumulative %
Valid 25-35 206 52.2 53.2 53.2
36-45 102 25.8 26.4 78.0
46 and above 79 20.0 20.4 100.0
Missing System 8 2.0
Total 395 100
Table 3 presents the information regarding designation of the respondents. It is clear
that lecturer is the dominant group, having 59.9% (n=233), followed by the group of
Assistant Professor (n=87) with 22.4%. Associate Professors share 15.2% (n=59), and
Professors with 1.5% (n=6), followed by Other (n=4) with a percentage of 1. Six
respondents (1.5%) did not reveal their designation.
Table 3 Designation of the Respondents (N=395)
Frequency Percent Valid % Cumulative %
Valid Lecturer 233 59.0 59.9 59.9
Assistant Professor 87 22.0 22.4 82.3
Associate Professor 59 14.9 15.2 97.4
Professor 6 1.5 1.5 99.0
Others 4 1.0 1.0 100.0
Total 389 98.5 100.0
Missing System 6 1.5
Total 395 100
171 Vol. 2, Issue 2 (ISSN No. 2414-2336)
Confirmatory Factor Analysis
Since the model for the study has interdependence, and to measure and assess the
constructs and the hypothesized relationships in such cases, the best statistical
technique recommended by the researchers is Structural Equation Modeling (SEM). In
addition, the hypotheses of the model are very common, here they are tested in a new
setting, hence confirmatory factor analysis is needed. Keeping these aspects in mind,
the researchers employed the same. The application of this technique is due to two
reasons ―1) it provides a straight forward method of dealing with multiple relationships
simultaneously while providing statistical efficiency; and 2) its ability to assess the
relationships comprehensively and provide a transition from exploratory to
confirmatory analysis‖ (Hair, et al., 2006, p. 578). Through this model testing
procedure, the goodness-of-fit between the hypothesized model and the sample data is
searched out. The researchers have applied the hypothesized structure model to the
empirical data to test as to what extent the observed data fit to the restricted structure.
For the validity of the model the researchers have employed five commonly used fit
indices i.e. CFI, GFI, RMSEA, RMR and CMIN/DF.
Career planning
In data collected, respondents have recorded their perceptions regarding the current
status of career planning in the career development process. The items for the
measurement of this construct were taken from Gould (1979), King (1999). Five point
Likert scale ranging from (1) for Strongly Disagree to (5) for Strongly Agree has been
employed. The construct has been measured with 11 items. The scale has been checked
for its reliability with the help of Cronbach Alpha which is 0.85.
While conducting CFA for this construct, the results of the initial model with eleven
indicators were not found with some low values for the fit statistics. Therefore, the
model was looked into in the light of recommendation of the modification indices. By
detailed assessment of the values it was found there that CrPlng-3, CrPlang-5, and
CrPlng-11 indicators are creating problems as they were highly correlated with other
indicators. They were, therefore, dropped and the model was run again. The results of
the CFA after deleting theses indicator are reported in Table 4.
Career management
The participants provided data about the presence of career management and
importance of career management in these colleges based on their perception. Career
management practices were measured by adapting scales from Lee and Bruvold (2003),
and Chen, Chang and Yeh (2004). Five point Likert scale was used. The reliability
estimates of the six items had Cronbach alpha value of 0.87.
CFA was conducted for this construct with six indicators. The results of the initial
model did not demonstrate good fit in the light of the fit indices. The model was, thus,
looked into in the light of recommendation of the modification index. By detailed
assessment of the values it was found there that CrMgnt-2 indicator was creating
problems as it was highly correlated with other indicators. This indicator was,
172 Vol. 2, Issue 2 (ISSN No. 2414-2336)
therefore, dropped and the model was run again. The results of the CFA after deleting
this indicator are reported in Table 4.
Career development
The mediating construct was supposed to measure whether career development has any
role between the antecedents and resultant variables. The items (five in total) for the
construct has been developed by adapting from Coachline‘s survey (available:
http://www.orghealth. com/cdn/). The five items had a Cronbach alpha value of 0.87.
CFA was conducted for the construct of career development having five indicators. The
results of the initial model were not found satisfactory in the light of the fit indices. By
detailed assessment of the values it was found there that that the error terms e1 and e2
were creating problems as they were highly correlated with one another. They were,
therefore, connected through correlation arrow. The results of the CFA after this are
reported in Table 4.
Career satisfaction
Career satisfaction was measured through an eight-items scale on a five point Likert
scale. Participants provided information on the items of this construct which were
adapted from the Survey of Hackman and Oldham (1976). Cronbach alpha value for
the scale was found 0.84.
After the reliability estimates, CFA was conducted to see the fitness of the model. The
results of the initial model were not found satisfactory as the values did not fall within
the acceptable range. By detailed assessment of the values it was found there that
indicators CrSatfcn-7 and CrSatfcn-8 were creating problems as they were highly
correlated with other indicators. These indicators were, therefore, dropped and the
model was run again. The results of the CFA after deleting these indictors, the results
are reported in Table 4.
Career commitment
The responded provided perceptual information about their experience and existence of
career commitment with these colleges. The items for this construct were adapted from
the work of Colarelli and Bishop (1990), and Lee and Bruvold (2003) evaluated career
commitment with a five point Likert scale was used. Cronbach alpha value for the scale
was found 0.85.
CFA was also conducted for this construct having seven indicators. Again the results of
the initial model were not found within the acceptable levels of the goodness-of-fit
indices. By detailed assessment of the values it was found that indicators CrComnt-5
and CrComnt-7 were creating problems as they were highly correlated with other
indicators. Therefore, these indicators were dropped. The final results of the CFA for
this construct are reported in Table 4.

173 Vol. 2, Issue 2 (ISSN No. 2414-2336)
Table 4 Fit statistics for the five constructs
Construct 2 CMIN/DF CFI GFI RMR RMSEA Sig
Career Planning 36.03 1.896 0.985 0.98 0.023 0.048 0.000
Career Management 11.71 2.927 0.987 0.99 0.028 0.073 0.000
Career Development 5.856 1.464 0.998 0.99 0.009 0.034 0.000
Career Commitment 11.92 2.981 0.985 0.99 0.020 0.074 0.000
Career Satisfaction 23.96 2.994 0.979 0.98 0.029 0.071 0.000
Hypotheses Testing
After testing the validity of the individual constructs structural equation modeling was
applied to the model as a whole. The hypothesized relationships of the model of the
study were analyzed in two ways: individual tests and a test of the overall path model.
Simultaneous equations‘ model estimation procedures were used. The results of the
hypotheses testing are as under:
H1: Career planning of employees’ leads to their career development.
This hypothesis was tested with aim to see whether the relationship between career
planning and career development could be validated or otherwise. The resultant value
represented by standardized path coefficient for this relationship is 0.540 and the t-
value is 8.346 were significant at p = 000. These values validate the relationship and
thus it can be concluded that the empirical data from the sample strongly support the
hypothesis.
H2: Career management employees’ leads to their career development.
This hypothesis was tested with the purpose to see the relationship between career
management and employees‘ perception about the career development. The value for
standardized path coefficient of is 0.120 and the t-value is 2.228 both were significant
at p = 022. These values validate the relationship and thus it can be concluded that the
empirical data from the sample strongly support the hypothesis.
H3: Career development of employees’ will have positive effects on their career
satisfaction.
This hypothesis was tested with the purpose to see the relationship between career
development and employees‘ perception of career satisfaction. The value for
standardized path coefficient is 0.604 and the t-value is 9.275. These values are
significant at p = 000. These values validate the relationship and thus it can be
concluded that the empirical data from the sample strongly support the hypothesis.
H4: Career development of employees’ will have positive effects on their career
commitment.
This hypothesis was tested with the purpose to see the relationship between career
development and employees‘ perception of career satisfaction. The value for
standardized path coefficient is 0.535 and the t-value of 8.192 were significant at p =

174 Vol. 2, Issue 2 (ISSN No. 2414-2336)
000. These values validate the relationship and thus it can be concluded that the
empirical data from the sample strongly support the hypothesis.
Table 5 Summary of Hypotheses Testing
Hypotheses Results
H1 Career planning of employees’ leads to their career development. Strongly
Supported
H2 Career management employees’ leads to their career
development.
Weakly
Supported
H3 Career development of employees’ will have positive effects on
their career satisfaction.
Strongly
Supported
H4 Career development of employees’ will have positive effects on
their career commitment.
Strongly
Supported
Discussion
The extant literature on career issues is replete with conceptual and empirical evidences
wherein the researchers have hypothesized and then empirical tested the relationships
among career constructs with organizational and employees‘ behavioural outcomes.
These results have been found varying in degrees from culture to culture and
organization to organization. This study was an effort to continue the empirical testing
of these relationships in the colleges of a little bit backward and far flung areas of
Khyber Pakhtunkhwa. The results validated most of the previous researches by
supporting almost all of the hypotheses. These results connote that college employees
in the Malakand Division share commonalities in their perceptions with employees in
the advanced organizational cultures. These results strengthen the concepts and theories
put forward by career theorists. They also illustrate the pervasiveness of employees‘
common concerns about their career issues and their appreciation for organizations that
support them in their career development.
Limitations of the Study
The study has a number of limitations. First, the study has taken a limited number of
constructs exclusively related to career. Variables like organizational culture could
have been made part of the study. Second, only teaching staff has been selected though
administrative staff could also have been made part of the study. Third, analyses have
been made only on the perceptions of the employees. Lastly, the results have been
drawn on the sample data which could have same limitations like other sample studies.
Implications of the Study
The study has both academic and practical implications. First, this study has been the
first empirical study undertaken in the colleges in Malakand Division and thereby
addressed the research vacuum. In other words the study would help the reader in
enhancing their understanding regarding interdependent relationships among these
constructs. More intensive research can be carried out in the light of the findings of this

175 Vol. 2, Issue 2 (ISSN No. 2414-2336)
study and can also be replicated. Similarly, findings of this study could help the policy
makers in addressing the lacunas in the present career related HR interventions. If
policy makers are sincere in providing quality education to the public, they must take
care of the career of the teaching staff.
Conclusion
Empirical investigations through the current study revealed that the effects of career
planning and career management are significant on the career development of the
teaching staff of colleges in Malakand Division of Khyber Pakhtunkhwa, Pakistan. It
further investigated the subsequent effects on career commitment and career
satisfaction of these employees. The results also demonstrated that career development
positively influence career commitment and career satisfaction. In summary, these
results reflect that the constructs of the study contribute to career development which
further affects career satisfaction and career commitment. These findings have
validated the findings of previous studies (Afonso et al., 2014; Appelbaum, Ayre, &
Shapiro, 2002; Kapel & Shepherd, 2004; Kaye, 2005; Kong et al., 2012; Martin et al.,
2001; Noordin et al., 2002) undertaken in the field of career.
These results have implications both for these colleges and the employees working
there. There is a clear cut message for the management to show seriousness about
career planning and career management issues of the employees in such a way that
these efforts may promote career development. The empirical evidence manifests that
there exists a relatively high difference between the path coefficients for career
planning and career management (0.54 and 0.12 respectively) which again warrants the
management about the tilted approach on the equally important career aspects.
However, the findings regarding career satisfaction and career commitment have
relatively close semblance. These findings from the current empirical evidence
strengthen the model presented in the study and are a positive contribution to the field
of career development.
References
Ababneh, R. (2013). Antecedents and outcomes of career development in Jordanian
public sector. Journal of Emerging Trends in Economics and Management
Sciences, 4(4), 417-426.
Adekola, B. (2011). Career planning and career management as correlates for career
development and job satisfaction: A case study of Nigerian bank employees.
Australian Journal of Business and Management Research, 1(2), 100-112.
Afonso, P., Ramos, M. R., Saraiva, S., Moreira, C. A., & Figueira, M. L. (2014).
Assessing the relation between career satisfaction in psychiatry with lifelong
learning and scientific activity. Psychiatry Research, 217, 210-214.
Appelbaum, S. H., Ayre, H., & Shapiro, B. T. (2002). Career management in
information technology: A case study. Career Development International, 7(3),
142-158.

176 Vol. 2, Issue 2 (ISSN No. 2414-2336)
Arthur, M. B., Khapova, S. N., & Wilderom, C. M. (2005). Career success in a
boundaryless career world. Journal of Organizational Behavior, 26, 177-202.
Baruch, Y. (2004). Managing Careers: Theory and Practice. New York: Prentice Hall.
Chen, T. Y., Chang, P. L., & Yeh, C. W. (2004). An investigation of career
development programs, job satisfaction, professional development and
productivity: The case of Taiwan. Human Resource Development International,
7(4), 441-463.
Colarelli, S. M., & Bishop, R. C. (1990). Career commitment functions, correlates, and
management. Group & Organization Management, 15(2), 158-176.
Gould, S. (1979). Characteristics of career planners in upwardly mobile occupations.
Academy of Management Journal, 22(3), 539-550.
Greenhaus, J. H., Callanan, G. A., & Godshalk, V. M. (2009). Career Management:
Sage Publication.
Hackman, J. R., & Oldham, G. R. (1976). Motivation through the design of work: Test
of a theory. Organizational behavior and human performance, 16(2), 250-279.
Herr, E. L., & Shahnasarian, M. (2001). Selected milestones in the evolution of career
development practices in the twentieth century. The Career Development
Quarterly, 49(3), 225-232.
Kapel, C., & Shepherd, C. (2004). Career ladders create common language for defining
jobs. Canadian HR Reporter, 14(12), 15-16.
Kaye, B. (2005). Build a culture of development. Leadership excellence, 22(3), 18.
King, A. S. (1999). Crescendo model of career motivation and commitment: Identity,
insight, and resilience. International Journal of Value-Based Management, 12, 29-
49.
Kong, H., Cheung, C., & Song, H. (2012). From hotel career management to
employees‘ career satisfaction: The mediating effect of career competency.
International Journal of Hospitality Management, 31, 76-85.
Lee, C. H., & Bruvold, N. T. (2003). Creating value for employees: investment in
employee development. The International Journal of Human Resource
Management, 14(6), 981-1000.
Martin, A. F., Romero, F. P., Valle, C. R., & Dolan, S. L. (2001). Corporate business
strategy, career management and recruitment: Do Spanish firms adhere to
contingency model? Career Development International, 6(3), 149-155.
Noordin, F., Williams, T., & Zimmer, C. (2002). Career commitment in collectivist and
individualist cultures: A comparative study. International Journal of Human
Resource Management, 13(1), 35-54.

177 Vol. 2, Issue 2 (ISSN No. 2414-2336)
WHY ARE NATIONAL PHARMACEUTICAL BRANDS MORE CONSIDER
THAN MULTINATIONALS? A CASE OF PAKISTAN’S PHARMACEUTICAL
INDUSTRY
Abid Shahzad, Bacha Khan University Charsada (BKUC), KP, Pakistan.
Email: [email protected]
Muhammad Wahab, Institute of Management Sciences, Peshawar, Pakistan
Abstract: The aim of study to empirically evaluate the health care
professional attitude towards the pharmaceutical products in context to
the Pakistan pharmaceutical market current situation, that why are
national companies’ brands more consider than multinationals, based on
primary data collected through self-administered questionnaire by field
visits to 250 health care professional. Results of explanatory sequential
method indicates that product efficacy is the primary factor to
considered, followed by sales representative, promotional material and
price factor including; some influence of new launches, packaging and
availability of the products are reported. However the bio equivalence
report and patient demands are rarely considered by HCP.
Key Words: Generic brands, Research brands, Promotional mix, Health care
professionals.
Introduction
Pharmaceutical industry is among the most scientific industries of the world. It is
estimated by the intercontinental marketing services prognoses (2016) that the
pharmaceutical market around the globe in terms of revenues is approximately 1.2
trillion US dollars. In which the majority of revenues about 50% are generated by
western markets. However, it is forecasted by IMS (2016) future growth trends of
pharmaceutical industry favor the Asia Pacific market. According to IMS health (2013)
this economic shift of growth from western markets to Asian markets is indeed, due to
the shift of global spending on pharmaceutical products from branded to generic based
brands (copy product). It is expected that generic products shares will achieve 63% of
the market share by the end 2017, which was 58% in the year 2012. Further this growth
trend of generic brands is bigger than research brands, which seems uniform regardless
of the markets either pharmerging or merged markets (developing or developed
markets).
According to business monitoring international (2015) Pakistan pharmaceutical
industry is the part of pharmerging markets. Its market size is approximately 2.3 billion
US dollars. This is expanding with 12% cumulative annual growth rate (CAGR).
According to research and markets (2016) national companies in Pakistan holding 60%
of the market shares, the rest of 40% are with multinational companies, which was
40:60 in late 90‘s. National companies businesses primarily depends on generic
products (copy product), while multinational mainly depends on their research products
178 Vol. 2, Issue 2 (ISSN No. 2414-2336)
(branded). Hence Pakistan pharmaceutical market current situation makes the problem
under investigation, that why are national pharmaceutical companies brands more
consider than multinationals in case of Pakistan‘s pharmaceutical?
Pharmaceutical companies in Pakistan promote their products to the health care
professional (HCP) through direct and indirect marketing activities. The HCP get
informed and influenced from the pharmaceutical companies in different manners to
prescribe any product. Thereby; this study mainly documents the HCP perspective in
context to marketing activities of pharmaceuticals, that how HCP consider the
pharmaceutical marketing practices, while prescribing any product (Generic/Branded)
to treat their patients.
Literature Review
Worldwide literature on pharmaceutical industry marketing is widely available,
however, in Pakistan prospects are that research work can be further expanded
regarding pharmaceutical marketing practices. Below are some relevant published
papers on pharmaceutical marketing practices As Tajdar et al (2015) HCP prescribing
behavior can be influenced by many factors e.g. Medical representative, product price
and efficacy of the drug including companies‘ indirect marketing activities. They have
investigated that the product price, medical representative and country of origin of the
product significantly impact on the HCP prescribing behavior. It has seen in study of
Ahmed et al (2014) promotional material also can influence over the prescribing
behavior of HCP. They have also highlighted the importance of other factors that HCP
generally consider like patient demands, new launches and sales representative of the
pharmaceutical companies. According to Shamim et al (2014) new drug launches and
the promotional materials, which are being used by pharmaceutical companies, have
differentiating impact over the HCP. Jamshed et al (2011) stresses on HCP to prefer
generic brands for patient‘s affordability, he further suggested HCP should consider
equally important bio equivalence or clinical reports, before to prescribing any generic
product (copy product) directly into patients. Below (Appendix C) comprehend a
summarized form of relevant literature specifically highlighting methodology, variables
and key findings of the studies.
Literature Gaps
The above mentioned and (Appendix C) published studies have their own attributes
and contribution towards the development of literature for pharmaceutical marketing
practices. However there is need to fill the gaps of some studies and their effects on
HCP prescribing behavior. For example, the term promotional material is being used
by authors for pharmaceutical promotional materials as a broad term. There is need to
define the term promotional material that; what actually it consist or what sort of
material comes under this definition? It is important to know that what factors actually
stimulates the HCP to consider any product, in context to the 4 P‘s of marketing mix.
More importantly, from the literature it has been observed that the studies have
identified many variables and has established their influencing role over HCP
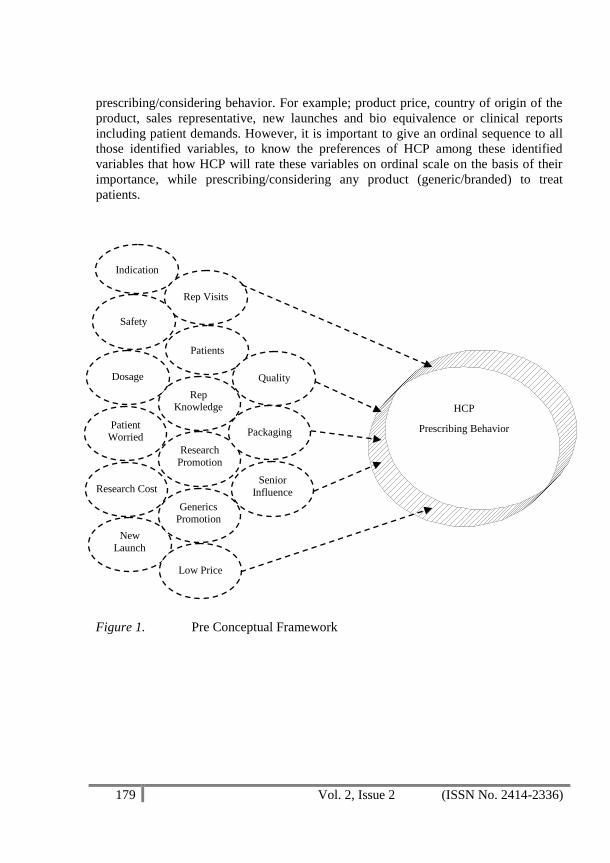
179 Vol. 2, Issue 2 (ISSN No. 2414-2336)
prescribing/considering behavior. For example; product price, country of origin of the
product, sales representative, new launches and bio equivalence or clinical reports
including patient demands. However, it is important to give an ordinal sequence to all
those identified variables, to know the preferences of HCP among these identified
variables that how HCP will rate these variables on ordinal scale on the basis of their
importance, while prescribing/considering any product (generic/branded) to treat
patients.
Figure 1. Pre Conceptual Framework
Rep Knowledge
Patients
Indication
New
Launch
Low Price
Research
Promotion
Generics Promotion
Rep Visits
Patient Worried
Research Cost
Dosage
Safety
HCP
Prescribing Behavior
Quality
Packaging
Senior
Influence
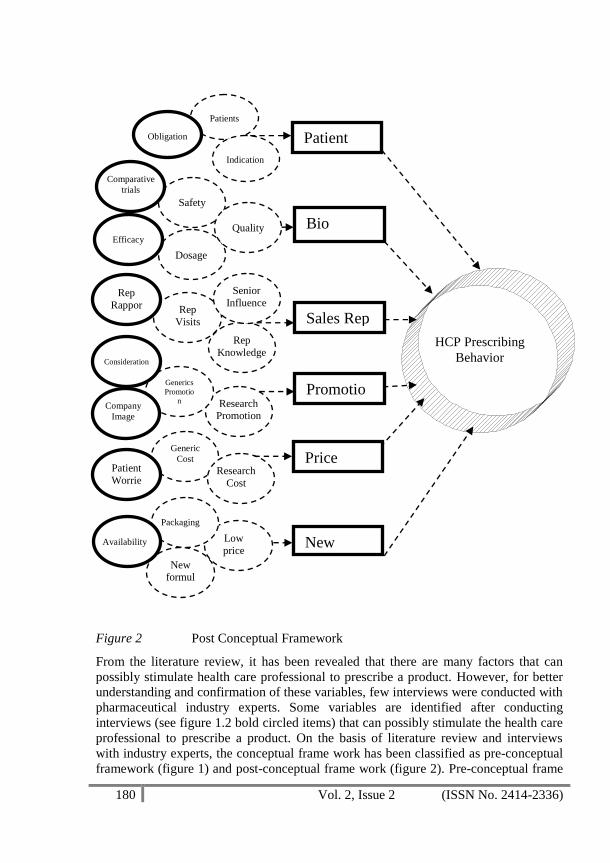
180 Vol. 2, Issue 2 (ISSN No. 2414-2336)
Figure 2 Post Conceptual Framework
From the literature review, it has been revealed that there are many factors that can
possibly stimulate health care professional to prescribe a product. However, for better
understanding and confirmation of these variables, few interviews were conducted with
pharmaceutical industry experts. Some variables are identified after conducting
interviews (see figure 1.2 bold circled items) that can possibly stimulate the health care
professional to prescribe a product. On the basis of literature review and interviews
with industry experts, the conceptual frame work has been classified as pre-conceptual
framework (figure 1) and post-conceptual frame work (figure 2). Pre-conceptual frame
Patient
Demands
New
Launch
Promotio
nal Mix
Sales Rep
Price
Bio
Equivalen
ce
HCP Prescribing
Behavior
Research Promotion
Patients
Indication
New formul
a
Low
price
Generics
Promotio
n
Rep
Visits
Rep
Knowledge
Generic
Cost
Research
Cost
Dosage
Safety
Obligation
Comparative
trials
Patient
Worrie
d
Rep
Rapport
Packaging
Consideration
Company
Image
Efficacy
Senior
Influence
Availability
Quality

181 Vol. 2, Issue 2 (ISSN No. 2414-2336)
work primarily depends on the factors that were identified during a literature review.
While the post-conceptual frame work consists of the literature review as well as
interviewed-identified variables. After a thorough review of literature and interviews,
these identified variables were reclassified (see appendix A) on the basis of their nature
and scope of marketing in the context of 4 - Ps of the marketing mix. This classification
has helped to draft questionnaire theme based on six variables. The variables are sales
representative, price factor, promotional material, new launch, bioequivalence and
patient demands; that possibly can stimulate HCP to prescribe a product.
Besides through interviews the term ‗promotional material‘ is explained in detail
which means that there are 35 types (see appendix B) of different goods and services,
which pharmaceutical companies are using named as promotional material/mix
Hypotheses
According to Ahmed et al. (2012), the importance of generic products cannot be denied
due to the affordability of generic products as compared to multinational brands.
Therefore, generic products should be more preferred than multinational brands.
However, the bioequivalence report of the generic brands is equally important and
should be considered by the HCP in same manners like affordability is considered for
generic brands. It has also endorsed by the Ahmed and Saeed (2014) that the qualities
of national companies‘ products have been remarkably improved. National companies‘
products are providing clinical results to the HCP for their patients. However, the
clinical trials are essential for generic products before using generic brands directly into
patients. This direct use of generic products cannot be allowed only on the basis of
pharmaceutical equivalence (physical resemblances). This study has selected the
bioequivalence or clinical reports (interchangeably use words) variable to test the
practices of HCP and pharmaceutical companies about bioequivalence or clinical
reports. To know how well HCP are aware and consider these important reports during
practice below hypothesis is being set to establish the fact about bioequivalence reports
and, its ordinal number among other identified variables.
H1: Generic brands are prescribing because of bio equivalence (BE)
Moreover, in views of different authors like Lanjouw (2005) and Ahmed et al. (2012),
the role of new launches either in the form of new packaging or new molecular formula
has got importance to influence the HCP prescribing behavior. According to Shafiq et
al. (2011), new product launch ―marketing campaigns messages‖ are being exaggerated
by the pharmaceutical marketers to influence the HCP. In views of Baig (2016), to
exaggerate the brand campaign messages, they draft it in an emotional context by using
the words like ―halal‖ and ―free from alcohol‖ targeting spiritual beliefs and values to
influence the HCP prescribing behaviors towards the new product launch. This is also
endorsed by the Chandra sekaran (2013). However, there is need to identify the amount
of influence of the new product launch on HCP prescribing behavior. Therefore; the
following hypothesis has been designed to find the ordinal number and the impact of
new product launch either in the form of new packing or a new molecular formula on
the prescription behavior of HCP;
182 Vol. 2, Issue 2 (ISSN No. 2414-2336)
H2: Generic brands are prescribing because of new launches (NL)
According to Narendran and Narendranathan (2013), pharmaceutical companies‘
promotional material significantly influences the HCP prescribing behavior. In views
of Tahir et al. (2013), HCP generally takes different kinds of gifts from pharmaceutical
companies including expensive goods like perfumes and wrist watches. HCP also
demands different types of goods and services which could be anything either of ethical
or unethical nature. According to Siddiqi et al. (2011), ―HCP prescription is
significantly influenced by the scientific tools than all other things‖, which is contrary
to what Ahmed et al. (2011), maintains. According to Kremer et al. (2008) ―direct to
HCP promotional material has very high elasticity than direct to price elasticity in
studies where the price has been taken as an independent variable‖. Thus, to
investigate the relationship between HCPs prescribing behavior and the promotional
materials used by the pharmaceutical companies, the following hypothesis is being set
to establish the ordinal number of promotional material among the other identified
variables.
H3: Generic brands are prescribing because of promotional mix (PM)
Ahmed and Sattar (2014) have found that ―medical representative plays an important
role while developing a relationship with HCP on behalf of pharmaceutical company‖.
Similarly, Fugh and Ahari (2007) has provided the evidence that how pharmaceutical
representatives scripted and trained to make a relationship with customers in order to
influence them for prescription. This is also explained by Tajdar et al. (2015) that ―a
medical representative‘s has a very influencing role over HCP prescribing behavior.
According to Shetty & Gujarathi (2013), the employee personal branding has got very
much importance while branding the organization or organizational brands to the
market. In this ongoing trial, the below hypothesis is being set in order to know the
sequential order of ‗medical representative‘ as an influencing factor among all other
selected factors?
H4: Generic brands are prescribing because of sales representative rapport SR)
According to Najmi et al. (1998), most of the time HCP feels neither under-pressure
nor monitored by the country health system, that whether HCP prescribe the product in
an appropriate way or not, to treat the patients. Even lack of demand and knowledge is
observed in patients to ask about medicines from HCP. This shows that the sole
decision maker is HCP to prescribe any product. While contrary to the findings of
Nejmi et al., Ahmed et al. (2012) stated that the importance of ‗patient demand‘ for
particular products usually is well entertained by the HCP. Therefore, to hypothetically
test the situation and establish the ordinal sequence following hypothesis has been set,
H5: Generic brands are prescribing because of patient demands (PD)
Furthermore, ‗affordability‘ is the key factor while treating patients with medicines.
According to Chintagunta and Desiraju (2005), pricing has a strategic importance all
over the world. This is aligned with research results of Tajdar et al. (2015) which has
demonstrated high importance of the role of price on HCP prescribing behavior. It is
183 Vol. 2, Issue 2 (ISSN No. 2414-2336)
also mentioned by Ahmed et al. (2012) and Jamshed et al. (2011). In views of Vogler
(2012), medicines prices are kept low for generic products to increase the accessibility
and affordability for those patients who pay out of their pockets. However, in the
reimbursement cases, theprice is notmandatory concern for stakeholders. Kremer et al.
(2008) maintains that price does impact on HCP prescribing behaviors as an
independent variable. In this investigation, the below hypothesis has been set to testify
and know the ordinal number of price factors on the sequential ladder that can possibly
influence or not the HCP prescribing behavior.
H6: Generic brands are prescribing because of price factor (RS)
Methodology
This research is based on mixed method of research adopted from Creswell (2014)
explanatory sequential design. The primary data was collected from HCP by dividing
them into two broad categories; practicing physicians and practicing surgeons from the
3 teaching hospital of Peshawar (lady reading hospital, Khyber Teaching Hospital and
Hayatabad Medical Complex) each category has 20 units on an average and 5
consultants in each unit along with 10 residence medical officers as well 8 house
officers. 50% of sample size of the total population (Approx 220 respondents) was
conveniently selected, besides 30 top class general practitioners (GPs) who had
participated as freelancers. Data was collected through self-administered questionnaire
composed of 19 closed ended questions and one open ended question, questionnaire
theme was based on post conceptual frame work. Initially through literature review one
preliminary questionnaire was developed which later restructured according to the local
practices and industry experts opinions. The reliability of the questionnaire was equal
to ―Cronbach Alpha 0.71‖. For the analysis of data multiple regressions were applied
through SPSS. In second phase, for qualitative analysis the follow up explanation
model was conducted. In which randomly visited to 20 physician, 20 surgeons and 10
general practitioners to validate the quantitative interpretations in view of market
practices.
Results
Table 1 Regression Model Summary
Model R R Square Adjusted Std. Error of the Estimate
1 0. 647a 0.418 0.404 0.56642
a: (Constant) Predictor: PM, SR, RS, NL, BE, PD.
Result of R-square suggests that approx. 42% (0.418) of the variation is explained by
the independent variables in the dependent variable, representing the amount of change
occurring in HCP prescription behavior due to the predictors / marketing activities of
pharmaceutical companies (Table 1).
The ANOVA test values (Table 2) are indicating that the overall model is statistically
significant (0.000).
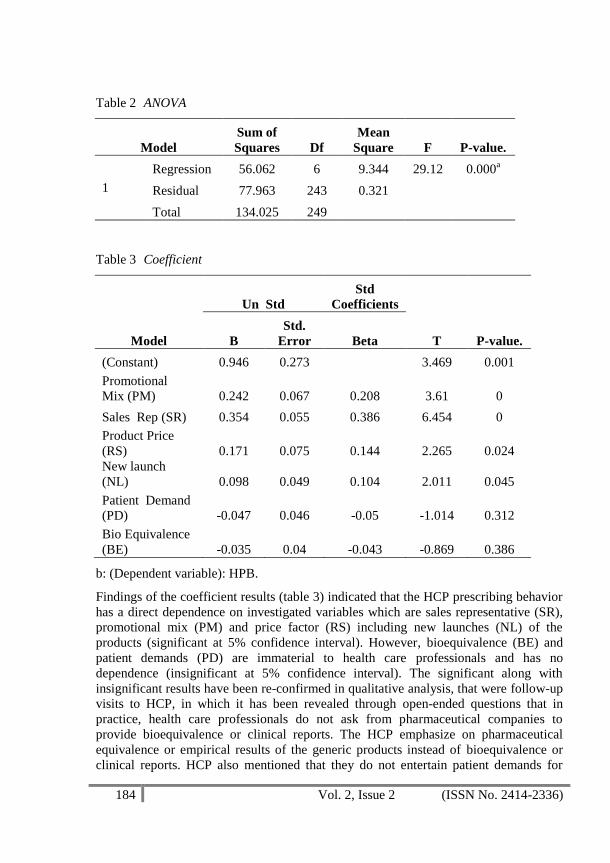
184 Vol. 2, Issue 2 (ISSN No. 2414-2336)
Table 2 ANOVA
Model
Sum of
Squares Df
Mean
Square F P-value.
1
Regression 56.062 6 9.344 29.12 0.000a
Residual 77.963 243 0.321
Total 134.025 249
Table 3 Coefficient
Model
Un Std
Std
Coefficients
T P-value. B
Std.
Error Beta
(Constant) 0.946 0.273
3.469 0.001
Promotional
Mix (PM) 0.242 0.067 0.208 3.61 0
Sales Rep (SR) 0.354 0.055 0.386 6.454 0
Product Price
(RS) 0.171 0.075 0.144 2.265 0.024
New launch
(NL) 0.098 0.049 0.104 2.011 0.045
Patient Demand
(PD) -0.047 0.046 -0.05 -1.014 0.312
Bio Equivalence
(BE) -0.035 0.04 -0.043 -0.869 0.386
b: (Dependent variable): HPB.
Findings of the coefficient results (table 3) indicated that the HCP prescribing behavior
has a direct dependence on investigated variables which are sales representative (SR),
promotional mix (PM) and price factor (RS) including new launches (NL) of the
products (significant at 5% confidence interval). However, bioequivalence (BE) and
patient demands (PD) are immaterial to health care professionals and has no
dependence (insignificant at 5% confidence interval). The significant along with
insignificant results have been re-confirmed in qualitative analysis, that were follow-up
visits to HCP, in which it has been revealed through open-ended questions that in
practice, health care professionals do not ask from pharmaceutical companies to
provide bioequivalence or clinical reports. The HCP emphasize on pharmaceutical
equivalence or empirical results of the generic products instead of bioequivalence or
clinical reports. HCP also mentioned that they do not entertain patient demands for
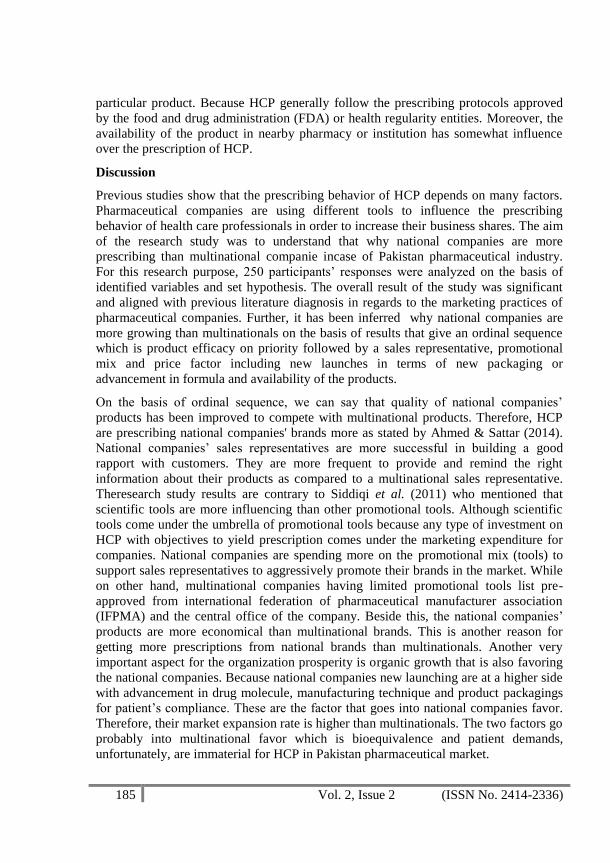
185 Vol. 2, Issue 2 (ISSN No. 2414-2336)
particular product. Because HCP generally follow the prescribing protocols approved
by the food and drug administration (FDA) or health regularity entities. Moreover, the
availability of the product in nearby pharmacy or institution has somewhat influence
over the prescription of HCP.
Discussion
Previous studies show that the prescribing behavior of HCP depends on many factors.
Pharmaceutical companies are using different tools to influence the prescribing
behavior of health care professionals in order to increase their business shares. The aim
of the research study was to understand that why national companies are more
prescribing than multinational companie incase of Pakistan pharmaceutical industry.
For this research purpose, 250 participants‘ responses were analyzed on the basis of
identified variables and set hypothesis. The overall result of the study was significant
and aligned with previous literature diagnosis in regards to the marketing practices of
pharmaceutical companies. Further, it has been inferred why national companies are
more growing than multinationals on the basis of results that give an ordinal sequence
which is product efficacy on priority followed by a sales representative, promotional
mix and price factor including new launches in terms of new packaging or
advancement in formula and availability of the products.
On the basis of ordinal sequence, we can say that quality of national companies‘
products has been improved to compete with multinational products. Therefore, HCP
are prescribing national companies' brands more as stated by Ahmed & Sattar (2014).
National companies‘ sales representatives are more successful in building a good
rapport with customers. They are more frequent to provide and remind the right
information about their products as compared to a multinational sales representative.
Theresearch study results are contrary to Siddiqi et al. (2011) who mentioned that
scientific tools are more influencing than other promotional tools. Although scientific
tools come under the umbrella of promotional tools because any type of investment on
HCP with objectives to yield prescription comes under the marketing expenditure for
companies. National companies are spending more on the promotional mix (tools) to
support sales representatives to aggressively promote their brands in the market. While
on other hand, multinational companies having limited promotional tools list pre-
approved from international federation of pharmaceutical manufacturer association
(IFPMA) and the central office of the company. Beside this, the national companies‘
products are more economical than multinational brands. This is another reason for
getting more prescriptions from national brands than multinationals. Another very
important aspect for the organization prosperity is organic growth that is also favoring
the national companies. Because national companies new launching are at a higher side
with advancement in drug molecule, manufacturing technique and product packagings
for patient‘s compliance. These are the factor that goes into national companies favor.
Therefore, their market expansion rate is higher than multinationals. The two factors go
probably into multinational favor which is bioequivalence and patient demands,
unfortunately, are immaterial for HCP in Pakistan pharmaceutical market.
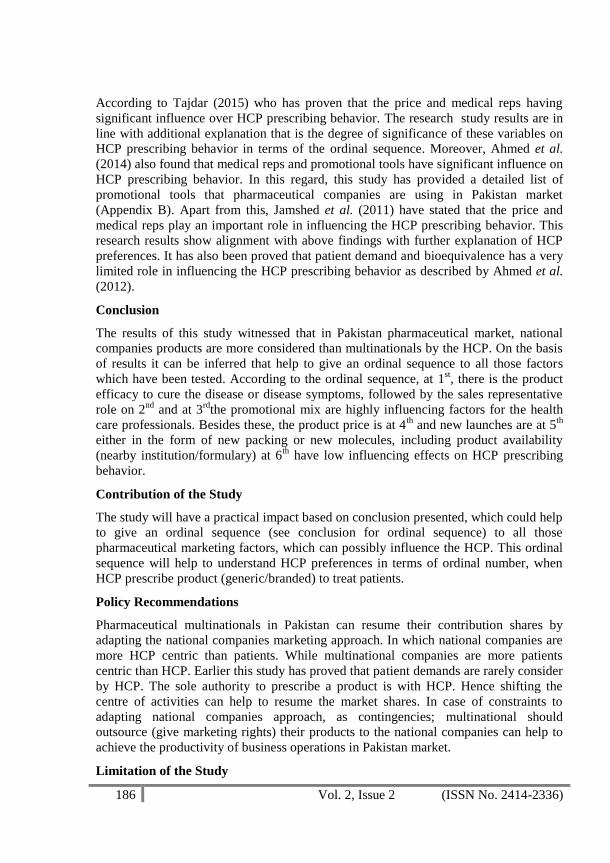
186 Vol. 2, Issue 2 (ISSN No. 2414-2336)
According to Tajdar (2015) who has proven that the price and medical reps having
significant influence over HCP prescribing behavior. The research study results are in
line with additional explanation that is the degree of significance of these variables on
HCP prescribing behavior in terms of the ordinal sequence. Moreover, Ahmed et al.
(2014) also found that medical reps and promotional tools have significant influence on
HCP prescribing behavior. In this regard, this study has provided a detailed list of
promotional tools that pharmaceutical companies are using in Pakistan market
(Appendix B). Apart from this, Jamshed et al. (2011) have stated that the price and
medical reps play an important role in influencing the HCP prescribing behavior. This
research results show alignment with above findings with further explanation of HCP
preferences. It has also been proved that patient demand and bioequivalence has a very
limited role in influencing the HCP prescribing behavior as described by Ahmed et al.
(2012).
Conclusion
The results of this study witnessed that in Pakistan pharmaceutical market, national
companies products are more considered than multinationals by the HCP. On the basis
of results it can be inferred that help to give an ordinal sequence to all those factors
which have been tested. According to the ordinal sequence, at 1st, there is the product
efficacy to cure the disease or disease symptoms, followed by the sales representative
role on 2nd
and at 3rd
the promotional mix are highly influencing factors for the health
care professionals. Besides these, the product price is at 4th
and new launches are at 5th
either in the form of new packing or new molecules, including product availability
(nearby institution/formulary) at 6th
have low influencing effects on HCP prescribing
behavior.
Contribution of the Study
The study will have a practical impact based on conclusion presented, which could help
to give an ordinal sequence (see conclusion for ordinal sequence) to all those
pharmaceutical marketing factors, which can possibly influence the HCP. This ordinal
sequence will help to understand HCP preferences in terms of ordinal number, when
HCP prescribe product (generic/branded) to treat patients.
Policy Recommendations
Pharmaceutical multinationals in Pakistan can resume their contribution shares by
adapting the national companies marketing approach. In which national companies are
more HCP centric than patients. While multinational companies are more patients
centric than HCP. Earlier this study has proved that patient demands are rarely consider
by HCP. The sole authority to prescribe a product is with HCP. Hence shifting the
centre of activities can help to resume the market shares. In case of constraints to
adapting national companies approach, as contingencies; multinational should
outsource (give marketing rights) their products to the national companies can help to
achieve the productivity of business operations in Pakistan market.
Limitation of the Study

187 Vol. 2, Issue 2 (ISSN No. 2414-2336)
There are some factors which are beyond the scope of the study. For example,
Pakistan‘s political, economic and law order situations. These factors can impact the
businesses in either way as barrier or driver. Besides companies standard operating
procedure (SOP) can also affect the decision-making process of business operations in
Pakistan.
References
Ahmad, M., Akhtar, N., Awan, M. H. A., & Murtaza, G. (2011). Ethical evaluation of
pharmaceutical marketing in Pakistan. Acta Bioethica, 17(2), 215-224.
Ahmed, R. R., & Saeed, A. (2014). Pharmaceutical drug promotion practices in
Pakistan: Issues in ethical and non-ethical pharmaceutical practices. Middle-East
Journal of Scientific Research, 20(11), 1630-1640.
Ahmed, R. R., & Sattar, I. (2014). Pharmaceutical promotional mix in Pakistan. Middle
East Journal of Scientific Research, 21(3), 533-542.
Ahmed, R. R., Khoso, I., Kiyani, P., Jeswani, D. D., Ahmed, J., & Vveinhardt, J.
(2014). Marketing Practices of Pakistan pharmaceutical industry and physician
prescription behavior. World Applied Sciences Journal, 32(5), 910-915.
Ahmed, R. R., Parmar, V., & Ahmed, J. (2012). Factors that affect attitude towards
generic drugs perception, IJMIE, Vol 2, ISSN: 2249-2258.
Akhtar, M. S., Shafiq, M., Irshad, N., Hussain, R., Malik, A., & Qayyum, M. I. (2013)
Assesment of prescribing practices of private GP‘S in Islamabad. Int J Curr
Pharm Res, 5(1), 49-53.
Baig, A. K., & Baig, U. K. (2016). The effects of religiosity on new product
adoption. International Journal of Research in Business and Social Science (2147-
4478), 2(2), 28-37.
Business Monitoring International (2016) Pakistan pharmaceutical and health care
report, 2015. Retrieved, 2017, January 23, from BMI,
Website:http://store.bmiresearch.com//pakistan-harmaceuticals-healthcare-
report.html
Chintagunta, P.K. & Desiraju, R. (2005). Strategic pricing and detailing behavior in
international markets. Marketing Science, 24(1), 67-80.
Creswell, J. W. (2014). Research design: Qualitative, quantitative, and mixed methods
approach (4th
ed.). Los Angeles: Sage.
Fugh. Berman, A., & Ahari, S. (2007). Following the script: how drug reps make
friends and influence doctors. PLOS Med, 4(4), e150.
Hakonsen H & Toverud E L. (2011). Special challenges for drug adherence following
generic substitution in Pakistani immigrants living in Norway. European Journal
of Clinical Pharmacology, 67(2), 193-201.
Intercontinental Marketing Services Health (2016). The global use of medicines:
Outlook through 2014-19. Retrieved 2017, January 23, from IMS, Website:
https://www.imshealth.com/files/web/ Corporate/News/

188 Vol. 2, Issue 2 (ISSN No. 2414-2336)
Intercontinental Marketing Services Prognosis (2016). Global content outlook 2012-
17.Retrieved 2017, Jan. 23, from IMS Web Site: .http://www.imshealth.com
Islam, T., & Chandrasekaran, U. (2013). Halal marketing: Growing the
pie. International Journal of Management Research and Reviews, 3(12), 3938.
Jamshed, S. Q., Hassali, M. A., Ibrahim, M. I., & Babar, Z. U. (2011). Knowledge
attitude and perception of dispensing doctors regarding generic medicines in
Karachi, Pakistan: a qualitative study. The Journal of the Pakistan Medical
Association, 61(1), 80.
Khan, H. U., Sarfraz, R. M., Mahmood, A., & Maheen, S. (2013). Emerging trends of
unethical pharmaceutical marketing in Pakistan. Indo American Journal of
Pharmaceutical Research, 3(10), 8127-8131.
Kremer, S. T., Bijmolt, T. H., Leeflang, P. S., & Wieringa, J. E. (2008).
Generalizations on the effectiveness of pharmaceutical promotional
expenditures. International Journal of Research in Marketing, 25(4), 234-246.
Lanjouw, J. O. (2005). Patents, price controls and access to new drugs: how policy
affects global market entry. National Bureau of Economic Research w11321.
Masood, I., Ibrahim, M. I., Hassali, M. A., & Ahmed, M. (2009). Evolution of
marketing techniques, adoption in pharmaceutical industry and related issues: a
review. J Clin Diagnostic Res, 3, 1942-1952.
Najmi, M. H., Hafiz, R. A., Khan, I., & Fazli, F. R. Y. (1998). Prescribing practices: an
overview of three teaching hospitals in Pakistan. JPMA, 48, 73-76.
Narendran, R., & Narendranathan, M. (2013). Influence of pharmaceutical marketing
on prescribing practices of physicians, 111(1), 47-50.
Shafiq, Y., Shaikh, B. T., & Kumar, R. (2011). Availability and affordability of
essential medicines: exploring the health seeking behaviors‘ and health service
utilization for children under-5 years living in squatter settlement of Karachi,
Pakistan. Journal of Ayub Medical College Abbottabad, 23(1), 132-138.
Shamimulhaq, S., Ahmed, R. R., Nawaz, A., Khoso, I., & Vishnu, P. (2014). Factors
influencing prescription behavior of physicians. The Pharma Innovation Journal,
ISSN, 2277-7695.
Shetty, B. R., & Gujarathi, R. (2013) Achieving employer branding through employee
branding with special reference to pharmaceutical sales industry. SIT Journal of
Management, 3(1), 300-316.
Siddiqi, A., Hussain, S., Parveen, G., Malik, F., Yasin, F., Akram, T. S., & Saeed, T.
(2011). Relevant influence of promotional tools by pharmaceutical industry on
prescribing behaviors of doctors: a cross-sectional survey in Pakistan. Afr J Pharm
Pharmacol, 5, 1623-6132.
Tahir, S., Rafique, A., Ghafoor, F., Saleem, A., & Khan, A. (2013). Attitude and
practice of dental surgeons towards pharmaceutical companies‘ marketing
gifts. Journal of Medical Ethics and History of Medicine, 6.
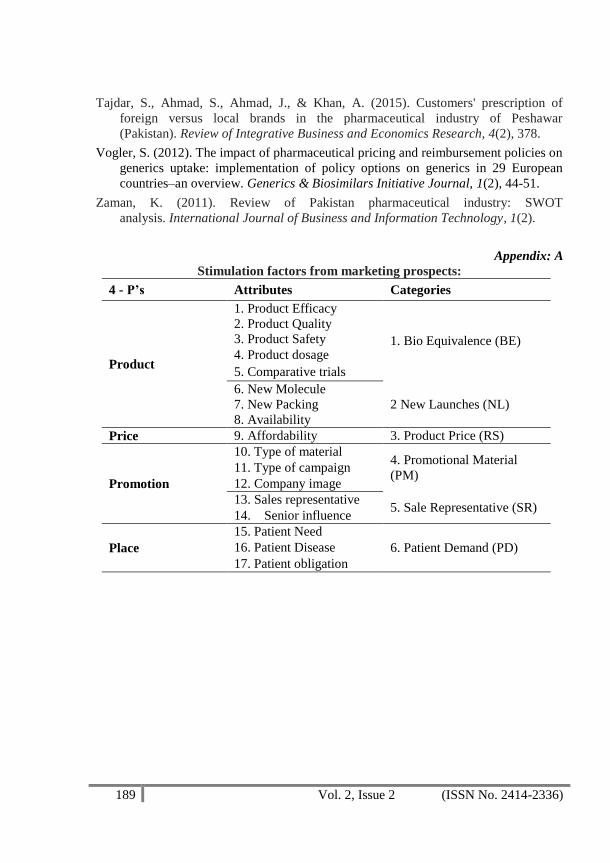
189 Vol. 2, Issue 2 (ISSN No. 2414-2336)
Tajdar, S., Ahmad, S., Ahmad, J., & Khan, A. (2015). Customers' prescription of
foreign versus local brands in the pharmaceutical industry of Peshawar
(Pakistan). Review of Integrative Business and Economics Research, 4(2), 378.
Vogler, S. (2012). The impact of pharmaceutical pricing and reimbursement policies on
generics uptake: implementation of policy options on generics in 29 European
countries–an overview. Generics & Biosimilars Initiative Journal, 1(2), 44-51.
Zaman, K. (2011). Review of Pakistan pharmaceutical industry: SWOT
analysis. International Journal of Business and Information Technology, 1(2).
Appendix: A
Stimulation factors from marketing prospects:
4 - P’s Attributes Categories
Product
1. Product Efficacy
1. Bio Equivalence (BE)
2. Product Quality
3. Product Safety
4. Product dosage
5. Comparative trials
6. New Molecule
2 New Launches (NL) 7. New Packing
8. Availability
Price 9. Affordability 3. Product Price (RS)
Promotion
10. Type of material 4. Promotional Material
(PM) 11. Type of campaign
12. Company image
13. Sales representative 5. Sale Representative (SR)
14. Senior influence
Place
15. Patient Need
6. Patient Demand (PD) 16. Patient Disease
17. Patient obligation
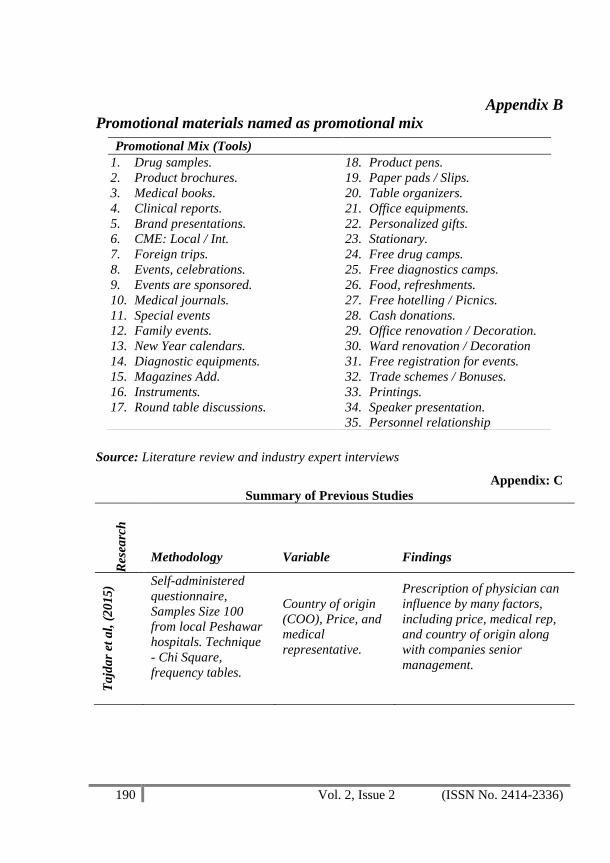
190 Vol. 2, Issue 2 (ISSN No. 2414-2336)
Appendix B
Promotional materials named as promotional mix
Source: Literature review and industry expert interviews
Appendix: C
Summary of Previous Studies
Res
earc
h
Methodology Variable Findings
Ta
jda
r et
al,
(2
015
) Self-administered
questionnaire,
Samples Size 100
from local Peshawar
hospitals. Technique
- Chi Square,
frequency tables.
Country of origin
(COO), Price, and
medical
representative.
Prescription of physician can
influence by many factors,
including price, medical rep,
and country of origin along
with companies senior
management.
Promotional Mix (Tools)
1. Drug samples.
2. Product brochures.
3. Medical books.
4. Clinical reports.
5. Brand presentations.
6. CME: Local / Int.
7. Foreign trips.
8. Events, celebrations.
9. Events are sponsored.
10. Medical journals.
11. Special events
12. Family events.
13. New Year calendars.
14. Diagnostic equipments.
15. Magazines Add.
16. Instruments.
17. Round table discussions.
18. Product pens.
19. Paper pads / Slips.
20. Table organizers.
21. Office equipments.
22. Personalized gifts.
23. Stationary.
24. Free drug camps.
25. Free diagnostics camps.
26. Food, refreshments.
27. Free hotelling / Picnics.
28. Cash donations.
29. Office renovation / Decoration.
30. Ward renovation / Decoration
31. Free registration for events.
32. Trade schemes / Bonuses.
33. Printings.
34. Speaker presentation.
35. Personnel relationship
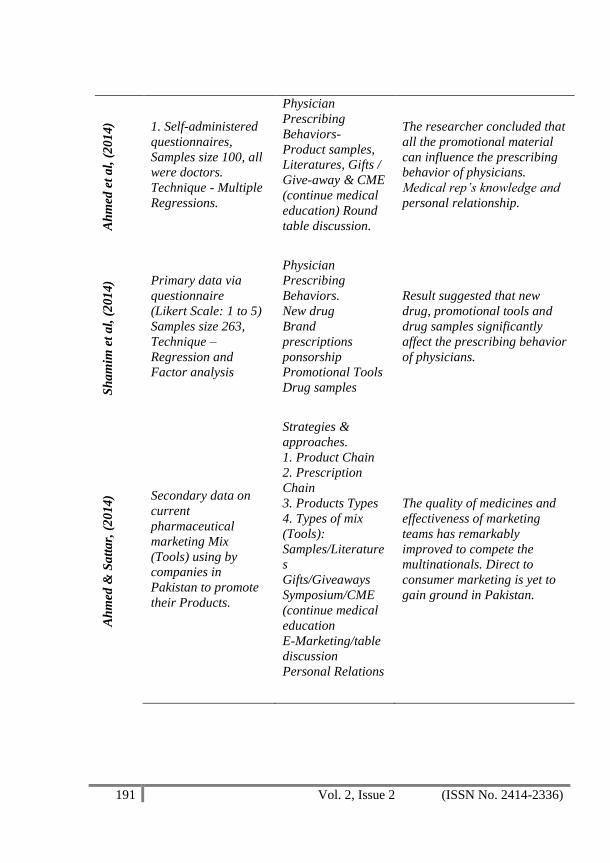
191 Vol. 2, Issue 2 (ISSN No. 2414-2336)
Ah
med
et
al,
(2
01
4) 1. Self-administered
questionnaires,
Samples size 100, all
were doctors.
Technique - Multiple
Regressions.
Physician
Prescribing
Behaviors-
Product samples,
Literatures, Gifts /
Give-away & CME
(continue medical
education) Round
table discussion.
The researcher concluded that
all the promotional material
can influence the prescribing
behavior of physicians.
Medical rep’s knowledge and
personal relationship.
Sh
am
im e
t a
l, (
201
4) Primary data via
questionnaire
(Likert Scale: 1 to 5)
Samples size 263,
Technique –
Regression and
Factor analysis
Physician
Prescribing
Behaviors.
New drug
Brand
prescriptions
ponsorship
Promotional Tools
Drug samples
Result suggested that new
drug, promotional tools and
drug samples significantly
affect the prescribing behavior
of physicians.
Ah
med
& S
att
ar,
(2
014
) Secondary data on
current
pharmaceutical
marketing Mix
(Tools) using by
companies in
Pakistan to promote
their Products.
Strategies &
approaches.
1. Product Chain
2. Prescription
Chain
3. Products Types
4. Types of mix
(Tools):
Samples/Literature
s
Gifts/Giveaways
Symposium/CME
(continue medical
education
E-Marketing/table
discussion
Personal Relations
The quality of medicines and
effectiveness of marketing
teams has remarkably
improved to compete the
multinationals. Direct to
consumer marketing is yet to
gain ground in Pakistan.
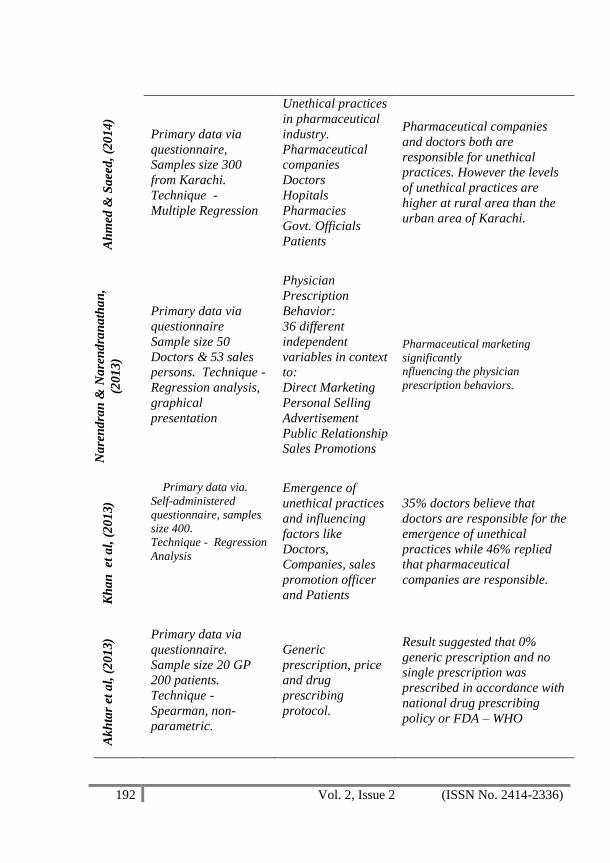
192 Vol. 2, Issue 2 (ISSN No. 2414-2336)
Ah
med
& S
aee
d,
(20
14)
Primary data via
questionnaire,
Samples size 300
from Karachi.
Technique -
Multiple Regression
Unethical practices
in pharmaceutical
industry.
Pharmaceutical
companies
Doctors
Hopitals
Pharmacies
Govt. Officials
Patients
Pharmaceutical companies
and doctors both are
responsible for unethical
practices. However the levels
of unethical practices are
higher at rural area than the
urban area of Karachi.
Na
ren
dra
n &
Na
ren
dra
na
tha
n,
(20
13
)
Primary data via
questionnaire
Sample size 50
Doctors & 53 sales
persons. Technique -
Regression analysis,
graphical
presentation
Physician
Prescription
Behavior:
36 different
independent
variables in context
to:
Direct Marketing
Personal Selling
Advertisement
Public Relationship
Sales Promotions
Pharmaceutical marketing
significantly
nfluencing the physician
prescription behaviors.
Kh
an
et
al,
(2
01
3)
Primary data via.
Self-administered
questionnaire, samples
size 400.
Technique - Regression
Analysis
Emergence of
unethical practices
and influencing
factors like
Doctors,
Companies, sales
promotion officer
and Patients
35% doctors believe that
doctors are responsible for the
emergence of unethical
practices while 46% replied
that pharmaceutical
companies are responsible.
Ak
hta
r et
al,
(2
01
3) Primary data via
questionnaire.
Sample size 20 GP
200 patients.
Technique -
Spearman, non-
parametric.
Generic
prescription, price
and drug
prescribing
protocol.
Result suggested that 0%
generic prescription and no
single prescription was
prescribed in accordance with
national drug prescribing
policy or FDA – WHO
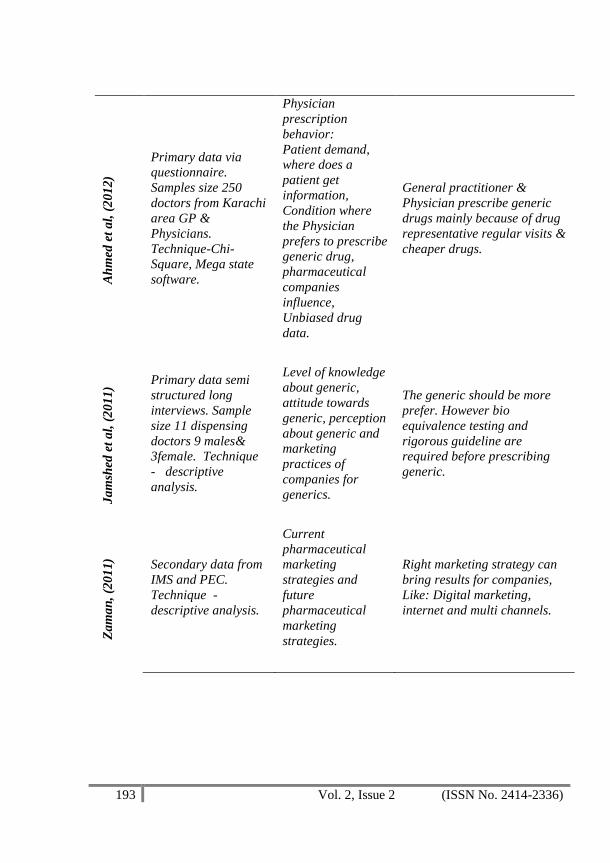
193 Vol. 2, Issue 2 (ISSN No. 2414-2336)
Ah
med
et
al,
(2
01
2)
Primary data via
questionnaire.
Samples size 250
doctors from Karachi
area GP &
Physicians.
Technique-Chi-
Square, Mega state
software.
Physician
prescription
behavior:
Patient demand,
where does a
patient get
information,
Condition where
the Physician
prefers to prescribe
generic drug,
pharmaceutical
companies
influence,
Unbiased drug
data.
General practitioner &
Physician prescribe generic
drugs mainly because of drug
representative regular visits &
cheaper drugs.
Ja
msh
ed e
t a
l, (
20
11
)
Primary data semi
structured long
interviews. Sample
size 11 dispensing
doctors 9 males&
3female. Technique
- descriptive
analysis.
Level of knowledge
about generic,
attitude towards
generic, perception
about generic and
marketing
practices of
companies for
generics.
The generic should be more
prefer. However bio
equivalence testing and
rigorous guideline are
required before prescribing
generic.
Za
ma
n,
(20
11) Secondary data from
IMS and PEC.
Technique -
descriptive analysis.
Current
pharmaceutical
marketing
strategies and
future
pharmaceutical
marketing
strategies.
Right marketing strategy can
bring results for companies,
Like: Digital marketing,
internet and multi channels.

194 Vol. 2, Issue 2 (ISSN No. 2414-2336)
Sid
diq
i et
al,
(20
11)
Cross sectional
survey. Sample size
200 doctors and 200
medical
representatives.
Primary data via
questionnaire
adapted from Girish
et al Technique -
Regression analysis.
Physician
Prescription
Behavior:Influenci
ng factors on
physician
prescribing
behavior.
Physician prescription more
influenced by scientific tools
than any other promotional
tools. Medical representative
had similar perception.
Ah
med
et
al,
(2
01
1)
Sample size 400
doctors and 100
pharmaceutical
companies. Primary
data via self-
administered
questionnaire.
Technique - Graphs,
Frequency tables.
Physician
perception about
marketing tactics
using by
pharmaceutical
companies in
ethical contexts.
58% of doctors believe that
pharmaceutical marketing
practices are unethical.
Ha
ko
nse
n,
(201
1)
Sample size 83
Pakistani with an
average age of 58
years.
Branded
medicines,
Substitute
medicines with
different names
and the satisfaction
of patients.
Substitute or generic
medicines may have negative
effects on Pakistani
immigrants in Oslo.
Ma
soo
d e
t a
l, (
200
9)
Secondary data,to
provide a detailed
basis to understand
pharmaceuticals
marketing practices.
Types of tools
using by
pharmaceutical
companies and
their abuse used.
All the codes of conduct, self-
regulations and laws
developed to control
pharmaceutical promotion
and marketing seem
ineffective.
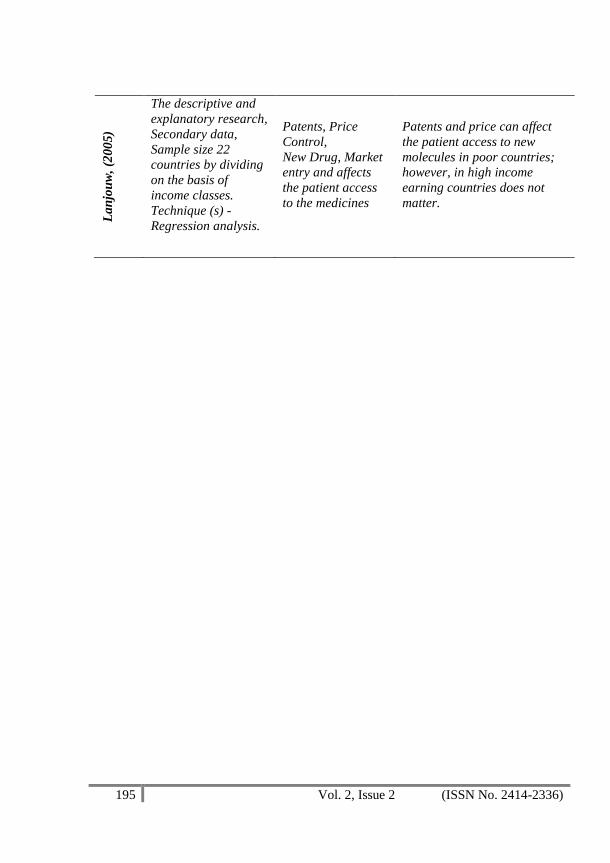
195 Vol. 2, Issue 2 (ISSN No. 2414-2336)
La
njo
uw
, (2
00
5)
The descriptive and
explanatory research,
Secondary data,
Sample size 22
countries by dividing
on the basis of
income classes.
Technique (s) -
Regression analysis.
Patents, Price
Control,
New Drug, Market
entry and affects
the patient access
to the medicines
Patents and price can affect
the patient access to new
molecules in poor countries;
however, in high income
earning countries does not
matter.

196 Vol. 2, Issue 2 (ISSN No. 2414-2336)
EXPLORING THE RELATIONSHIP OF NETWORK CENTRALITY AND
ACADEMIC PERFORMANCE OF FEMALE STUDENTS
Asma Mushtaq, Lecturer (Corresponding Author), Institute of Management Sciences
(IMS), University of Baluchistan, Quetta. Email: [email protected]
Kamal Badar, Assistant Professor, Institute of Management Sciences (IMS),
University of Baluchistan, Quetta. Email:[email protected]
Muhammad Anwar, Professor and Director, Institute of Biochemistry,
University of Baluchistan, Quetta. Email: [email protected]
Syed Gohar Abbas, Assistant Professor, Department of Business Administration,
Sarhad University of Science & Information Technology, Peshawar.
Email: [email protected]
Abstract: This research endeavor aims to investigate the impact of
network centrality (degree, closeness and betweenness) on academic
performance (CGPA) of female students in an academic advice network.
Where degree centrality refers to the number of direct links that an actor
has with other actors, betweenness centrality refers to the degree to
which an actor lies on the geodesic paths between other actors and
closeness centrality focuses on how close a member is to all other
members in network. Data was collected from 182 female students
enrolled in various programs at a public sector University in Baluchistan
through name generators for egocentric network by Burt. Techniques of
correlation and standard multiple regression analysis are employed to
test the hypotheses. The results of statistical analysis revealed that high
degree and betweenness centrality leads to increase academic
performance of students whereas higher closeness centrality leads to
decrease academic performance. The result of the study has practical
implications for students’ academic life: it will aid the female students to
discover structural pattern of social ties of their advice network and
enhance their tendency for forming more ties related with academic
advices for the achievement of excellent academic performance.
Key words: Network centrality, academic performance, advice network
Introduction
According to the ―social network approach‖, the performance of a person is affected by
the types of ties, and structural characteristics of network more than by qualities, traits,
characteristics that an individual owns (Yang &Tang, 2003).Structural characteristics
refer to the complete arrangement of relations among the system's actors (Tichy,
Tushman, & Fombrun, 1979), like, clustering, bridge, gatekeeper, density and
centrality etc. Structural characteristics (Granovetter, 1985) in social network have the
power to impact positively or negatively on performance of entities (Yang & Tang,
2003). Structural characteristics (Granovetter, 1985) served as focal principle in social
network studies. The unique characteristic of this stream of investigation lies in how it
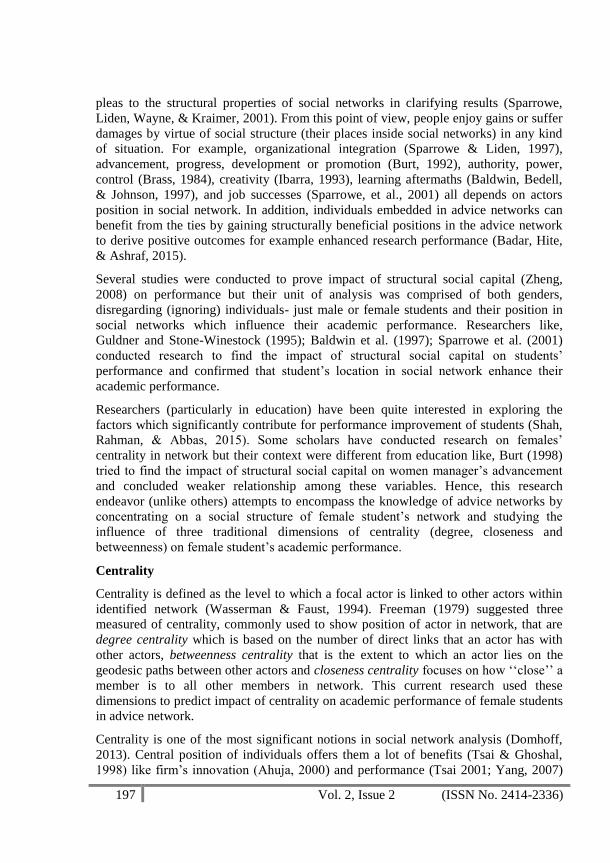
197 Vol. 2, Issue 2 (ISSN No. 2414-2336)
pleas to the structural properties of social networks in clarifying results (Sparrowe,
Liden, Wayne, & Kraimer, 2001). From this point of view, people enjoy gains or suffer
damages by virtue of social structure (their places inside social networks) in any kind
of situation. For example, organizational integration (Sparrowe & Liden, 1997),
advancement, progress, development or promotion (Burt, 1992), authority, power,
control (Brass, 1984), creativity (Ibarra, 1993), learning aftermaths (Baldwin, Bedell,
& Johnson, 1997), and job successes (Sparrowe, et al., 2001) all depends on actors
position in social network. In addition, individuals embedded in advice networks can
benefit from the ties by gaining structurally beneficial positions in the advice network
to derive positive outcomes for example enhanced research performance (Badar, Hite,
& Ashraf, 2015).
Several studies were conducted to prove impact of structural social capital (Zheng,
2008) on performance but their unit of analysis was comprised of both genders,
disregarding (ignoring) individuals- just male or female students and their position in
social networks which influence their academic performance. Researchers like,
Guldner and Stone-Winestock (1995); Baldwin et al. (1997); Sparrowe et al. (2001)
conducted research to find the impact of structural social capital on students‘
performance and confirmed that student‘s location in social network enhance their
academic performance.
Researchers (particularly in education) have been quite interested in exploring the
factors which significantly contribute for performance improvement of students (Shah,
Rahman, & Abbas, 2015). Some scholars have conducted research on females‘
centrality in network but their context were different from education like, Burt (1998)
tried to find the impact of structural social capital on women manager‘s advancement
and concluded weaker relationship among these variables. Hence, this research
endeavor (unlike others) attempts to encompass the knowledge of advice networks by
concentrating on a social structure of female student‘s network and studying the
influence of three traditional dimensions of centrality (degree, closeness and
betweenness) on female student‘s academic performance.
Centrality
Centrality is defined as the level to which a focal actor is linked to other actors within
identified network (Wasserman & Faust, 1994). Freeman (1979) suggested three
measured of centrality, commonly used to show position of actor in network, that are
degree centrality which is based on the number of direct links that an actor has with
other actors, betweenness centrality that is the extent to which an actor lies on the
geodesic paths between other actors and closeness centrality focuses on how ‗‗close‘‘ a
member is to all other members in network. This current research used these
dimensions to predict impact of centrality on academic performance of female students
in advice network.
Centrality is one of the most significant notions in social network analysis (Domhoff,
2013). Central position of individuals offers them a lot of benefits (Tsai & Ghoshal,
1998) like firm‘s innovation (Ahuja, 2000) and performance (Tsai 2001; Yang, 2007)

198 Vol. 2, Issue 2 (ISSN No. 2414-2336)
and a person‘s ingenuity (Smith & Shalley, 2003) and knowledge creation (Mcfadyen
& Cannella, 2004). Baldwin et al. (1997) indicated that network centrality has positive
effect on MBA team member‘s success. Similarly, Hopp, Iravani, Liu and Stringer
(2011) indicated that individuals having central position in advice network show good
job performance. Likewise, Brass (1981) revealed that the flow of the work represented
by centrality of one‘s position indirectly impact performance. Aktamov and Zhao
(2014) concluded that firms having higher degree centrality leads in the field of
innovation. It is affirmed by researchers e.g. Spillane and Kim (2012) that actor who
occupies central position in networks are better linked than others and are more
noticeable in the network.
Academic Performance
The utmost critical assets of educational institutes are students. The development of
any country depends on number of qualified individuals, larger the number of quality
graduates opens up endless ways for country to run on the road of success (Mushtaq &
Khan, 2012). The best and easiest way to judge presence of quality graduates with in
country is to check the academic performance of students through academic reports.
As suggested by Allen (2005) academic performance of students are conversed through
academic report that tells about students‘ progress/ achievement (in terms of CGPA/
GPA) established during course of study in particular discipline. The foremost purpose
for allocating CGPA/GPA is to generate a public record of student‘s academic success
that can perfectly and excellently communicate the level of mastery of a subject a
student has demonstrated (Airasian, 1991).
Conceptual Framework
This conceptual framework is showing the relationship between centrality measures
(degree centrality, degree closeness, betweenness centrality) and academic
performance of female student‘s in advice network.
Figure 1 Conceptual Framework
Theory and Hypothesis
Centrality and academic performance
Advice networks means set of ties through which individuals share information, data,
knowledge, facts and guidance that assist them in the completion of their assigned task
(Webster & Hackley, 1997) in better way. Student‘s position in advice network plays a
Academic Performance
Degree centrality
Betweenness centrality
Closeness centrality

199 Vol. 2, Issue 2 (ISSN No. 2414-2336)
dynamic role (Picciano,2002) but if a student resides the central location s/he can get
much more academic benefits. Gaining advices from number of contacts, not only
develop (Tsai, 2001) intellectual ability of student but can aid him in locating, griping,
diffusing, and blending relevant advices into valuable resources and ultimately
enhancing performance (Borgatti, 2005; Tsai, 2001). Student can also get assistance
form advice network, if s/he became only source of interaction among other two or
more students. Asking for advices from each other they have to depend on him/her
(Spillane & Kim, 2012). While helping other students in exchange of advices, s/he gain
a lot of advices which can be used by him/her in resolving his own study related
problems (Hopp, Iravani, Liu, & Stringer, 2011). Access to timely and dissimilar
advice‘s is also possible for students only if they are at shortest geodesic distance from
others in network. By finding position near to others saves his cost and energy too in
searching for required academic advices. With the help of timely and dissimilar
academic advices he can solve his difficulties which impede his performance instantly
and hastily.
Thus, it was proposed that:
H1: Female students with higher degree centrality scores in advice network will
have higher academic performance (in terms of CGPA).
H2: Female students with higher betweenness centrality scores in advice
network will have higher academic performance (in terms of CGPA).
H3: Female students with higher closeness centrality scores in advice network
will have higher academic performance (in terms of CGPA).
Method
Sample
182 female students enrolled in various programs at a public sector university served as
sample of this study. Convenience sampling technique was used to collect data.
Measures
Dependent variable: Academic performance. CGPA of each student was used to
measure academic performance. Which was taken from university examination record
but CGAP can be calculated with the help of grades, grade weights (A=4, B=3, C=2,
D=1), credit hours attempted, and number of semesters / classes / subjects attended.
Independent variables: centrality measures. According to Freeman, (1979), the
indexes/measures of centrality .i.e. degree, closeness and betweenness are used as a
measure of closeness centrality, degree centrality, and betweenness centrality of female
student‘s advice network. Where degree is the total sum of links to other people in the
network. Betweenness states the level to which a person lies in the middle of other
actors in the network. Closeness is the level to which a person is positioned near all the
other individuals in a network (directly or indirectly).
Procedure

200 Vol. 2, Issue 2 (ISSN No. 2414-2336)
Data was collected through network questionnaire based on name generators (these are
type of questions that ask central/ focal personal to list the names of those individuals
from whom s/he receive or to whom s/he provide resources)for egocentric network.
Name generator was adapted from standard method of name generator for egocentric
(personal) network as developed by Burt (1984) that is also used in United States
general social surveys (GSS) since 1984 (McPershon, Smith-Lovin, & Brashears,
2006). Name generators asked the respondents to write the names of those
learners/students with whom the s/he (respondent) most frequently discuss their study
related problems and take academic advices. Reliability of questionnaire was
determined by Cronbach‘s alpha to be 0.69.Participants were given questionnaire along
with informed consent form. Participants were requested to read inform consent form
carefully and if they agree to take part in this study then sign on form. After that
participants were requested to read the guidelines cautiously and sensibly to fill out
demographic and name generator sections of the questionnaire.
Ethical guidelines
It was announced that participants are free to withdraw participation. When all
questionnaires were returned back participants were praised and let them know that the
study was in fact considering for association among social network structure and
academic performance of students. It was made sure to participants that data would be
used for research purpose only and their names were kept anonymous. Participants
were given the right to ask question if they want. The data collection instrument by
Burt (1984) is free to use for all researchers so no permission was required.
Analysis
The study was carried out using the statistical techniques of correlation and standard
multiple regression. Correlation is used to show the relationship of all dependent and
independent variables with each other while, standard multiple regression is used to
predict the effect of predictor variables on the dependent variable. Analysis was
performed using Statistical Package for the Social Sciences (SPSS) 20.0 to determine
potential associations amongst the variables and effect of independent variables on
dependent variable.
Performance of students was measured by CGPA that was taken from university
examination record. Data about academic advice was collected through questionnaire
based on name generator (Burt, 1984) for egocentric network. With the help of data
collected through name generator 182 X 182 matrix was constructed in MS Excel,
where zero (0) shows absence of advice tie and one (1) shows presence of advice tie.
This matrix was later on imported in UCINET VI (Borgatti, Everett, & Freeman, 2002)
where three centrality measures were calculated (degree, closeness and betweenness).
Data was coded, entered and analyzed through IBM SPSS 20.0 to determine potential
relationships among the variables.
Correlation

201 Vol. 2, Issue 2 (ISSN No. 2414-2336)
The means, standard deviation and Spearman‘s correlation coefficients can be seen in
Table 1. Total number of students participated in the study was 182. Table 1 also
shows the data about the performance of students in exam as measured by their CGPA.
The highest possible CGPA was 3.85. The lowest possible CGPA was 0.24. The mean
CGPA score of all students was 2.74 (S.D=0.74). The measures of centrality were
likely to be correlated with the academic performance but were also expected to be
non-parametric in nature (Yan & Ding, 2009). Therefore, Spearman‘s correlation was
calculated to measure strength and direction of relationship among variables. The
correlation table disclosed that degree centrality have positively and significantly
correlated with CGPA (r =.60, p < 0.05), closeness centrality also shows positive and
significant correlation with CGPA (r = .39, p< 0.05) and betweenness centrality
positively but non-significantly correlated with CGPA (r=.33, p>0.05).
Table 1: Summary Statistics and spearman’s Correlation Matrix
Mean Std. Dev 1 2 3 4
1. CGPA 2.74 .74 ___
2. degree_centra .01 .01 .60** ___
3. betweenness_centra .03 .09 .39** .63** ___
4. closness_centra 18.33 79.17 .33** .57** .18* ___
**. Correlation is significant at the 0.01 level (2-tailed).
*. Correlation is significant at the 0.05 level (2-tailed).
Regression Analysis
Before applying multiple regression some assumptions related with multiple regression
must be addresses like normality of residuals, no outliers, independence of residuals,
Multicollinearity.
The assumption of normality of residuals and independent variable was checked by
using histogram(figure 1), and normal P–P (figure 2) and Q–Q plots (figure 3).The
shape of histogram curve nearly approaches a bell-curve, which means that residuals
are approximately normally distributed. All data points at normal P-P and Q-Q plot lies
near or on the straight line which also give indication of normality of data.
The assumption of no outlier can be checked through histogram. Outlier is an
observation that is different from general configuration of distribution. Through
graphical examination of histogram we concluded that overall trend of data set is
almost same, so there is no significant outlier.
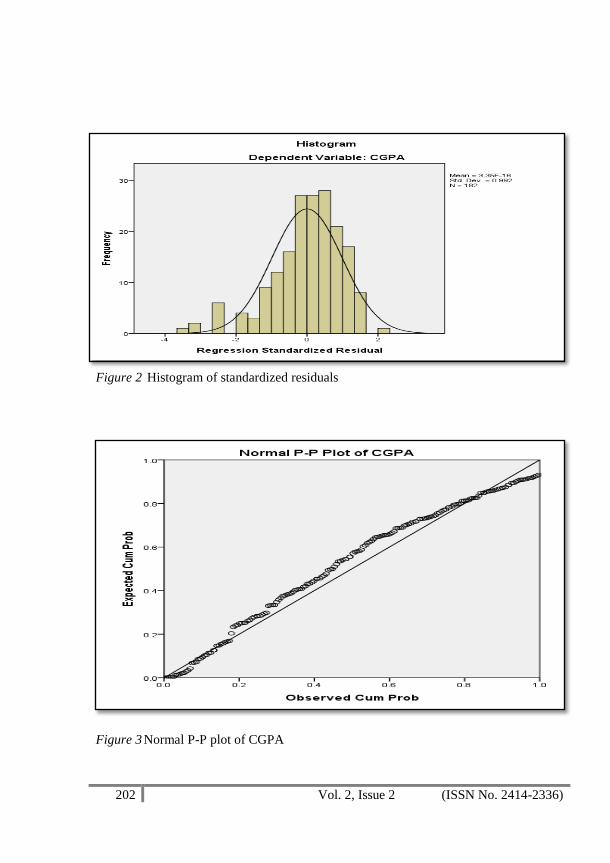
202 Vol. 2, Issue 2 (ISSN No. 2414-2336)
Figure 2 Histogram of standardized residuals
Figure 3 Normal P-P plot of CGPA

203 Vol. 2, Issue 2 (ISSN No. 2414-2336)
Figure 4. Normal Q-Q plot of CGPA
To check that the three measures of centrality(independent variables) can significantly
predict the academic performance (dependent variable) of female student‘s, standard
multiple regression analysis was executed. Result of the standard multiple regression is
reported in Table 2. This table also shows the value of Durbin-Watson statistic through
which we can check the assumption of independence of residuals (autocorrelation).
Independence of residuals means that error should not be interconnected to another
error. The value of Durbin-Watson statistic is always lies between 0 and 4. Zero (0)
mean positive autocorrelation, values near 4 mean direct negative autocorrelation and
values near 2 indicates no autocorrelation. In case of current study the value of Durbin-
Watson statistic was near 2 (1.63) indicating our data has almost no autocorrelation.
Multicollinearity is another problem associated with regression analysis. Therefore,
data should be checked for this problem before to apply regression. Multicollinearity
means that independent variables show high or moderate level of association with each
other to such an extent that they make it difficult to recognize the contribution of single
independent variable in predicting dependent variable. The assumption of no
multicollinearity was checked through the values of VIF. Normally, it is believed that
the value of VIF below 10 indicates no or low level of multicollinearity (Myers, 1990).
Table 2 specifies that there is no problem of multicollinearity as all values of VIF were
lowers than 10.
Table 2 shows the result of the multiple regression i.e. positive and significant
relationship between degree centrality (β1=0.74, p<0.05), betweenness centrality
(β2=0.32, p < 0.05) and academic performance.
Table 2: Summary of Slandered Multiple Regression Analysis
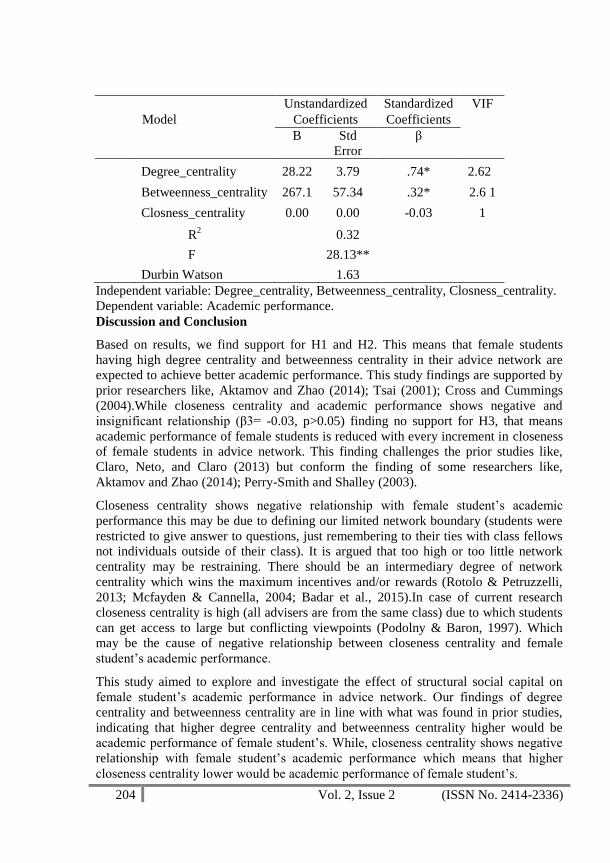
204 Vol. 2, Issue 2 (ISSN No. 2414-2336)
Unstandardized Standardized VIF
Model Coefficients Coefficients
B Std
Error
β
Degree_centrality 28.22 3.79 .74* 2.62
Betweenness_centrality 267.1 57.34 .32* 2.6 1
Closness_centrality 0.00 0.00 -0.03 1
R2 0.32
F 28.13**
Durbin Watson 1.63
Independent variable: Degree_centrality, Betweenness_centrality, Closness_centrality.
Dependent variable: Academic performance.
Discussion and Conclusion
Based on results, we find support for H1 and H2. This means that female students
having high degree centrality and betweenness centrality in their advice network are
expected to achieve better academic performance. This study findings are supported by
prior researchers like, Aktamov and Zhao (2014); Tsai (2001); Cross and Cummings
(2004).While closeness centrality and academic performance shows negative and
insignificant relationship (β3= -0.03, p>0.05) finding no support for H3, that means
academic performance of female students is reduced with every increment in closeness
of female students in advice network. This finding challenges the prior studies like,
Claro, Neto, and Claro (2013) but conform the finding of some researchers like,
Aktamov and Zhao (2014); Perry-Smith and Shalley (2003).
Closeness centrality shows negative relationship with female student‘s academic
performance this may be due to defining our limited network boundary (students were
restricted to give answer to questions, just remembering to their ties with class fellows
not individuals outside of their class). It is argued that too high or too little network
centrality may be restraining. There should be an intermediary degree of network
centrality which wins the maximum incentives and/or rewards (Rotolo & Petruzzelli,
2013; Mcfayden & Cannella, 2004; Badar et al., 2015).In case of current research
closeness centrality is high (all advisers are from the same class) due to which students
can get access to large but conflicting viewpoints (Podolny & Baron, 1997). Which
may be the cause of negative relationship between closeness centrality and female
student‘s academic performance.
This study aimed to explore and investigate the effect of structural social capital on
female student‘s academic performance in advice network. Our findings of degree
centrality and betweenness centrality are in line with what was found in prior studies,
indicating that higher degree centrality and betweenness centrality higher would be
academic performance of female student‘s. While, closeness centrality shows negative
relationship with female student‘s academic performance which means that higher
closeness centrality lower would be academic performance of female student‘s.
205 Vol. 2, Issue 2 (ISSN No. 2414-2336)
Limitations and Recommendations
This study has certain limitations e.g. our study lack generalization as female students
of one university may not represent all. More disseminated findings should be created
through involvement of other university female students and results of research can be
strengthen by increasing sample size.
The result of closeness centrality is different from scholar expectations of current
study. Therefore, it is recommended that more future research should be done
concerning relationship between closeness centrality and female student‘s academic
performance with an enlarged network boundary.
References
Ahuja, G. (2000). Collaboration networks, structural holes, and innovation: A
longitudinal study. Administrative Science Quarterly, 45(3), 425–455.
Airasian, P. W. (1991). Perspectives on measurement instruction. Educational
Measurement: Issues and Practice, 10(1), 13–26.
Aktamov, S., & Zhao, Y. (2014). Impact of network centrality positions on innovation
performance of the firm: evidence from china automobile industry. Business
Management and Strategy, 5(1).
Allen, D. J. (2005). Grades as valid measures of academic achievement of classroom
learning.A Journal of Educational Strategies, 78(5), 13.
Badar, K., Hite, J. M., & Ashraf, N. (2015). Knowledge network centrality, formal rank
and research performance: evidence for curvilinear and interaction effects.
Scientometrics, 105(3), 1553-1576.
Badar, K., Frantz, T. L., & Jabeen, M. (2016). Research performance and degree
centrality in co-authorship networks: The moderating role of homophily. Aslib
Journal of Information Management, 68(6), 756–771
Baldwin, T. T., Bedell, M. D., & Johnson, J. L. (1997). The social fabric of a team-
based M.B.A. program: Network effects on student satisfaction and performance.
Academy of Management Journal, 40(6), 1369-1397.
Borgatti, S. P., Everett, M. G., & Freeman, L. C. (2002). UCINET for Windows:
Software for Social Network Analysis. Harvard, MA: Analytic Technologies.
Borgatti, S. P. (2005). Centrality and network flow. Social Networks, 27, 55–71.
Brass, D. J. (1981). Structural relationships, job characteristics, and worker satisfaction
and performance. Administrative Science Quarterly, 26, 331-348.
Brass, D. J. (1984). Being in the right place: A structural analysis of individual
influence in an organization. Administrative Science Quarterly, 29, 518-539.
Burt, R. S. (1984). Network items and the general social survey. Social Networks, 6,
293-339.
Burt, R. S. (1992). Structural Holes: The Social Structure of Competition. Cambridge:
Harvard University Press.
Burt, R. S. (1998). The gender of social capital. Rationality and Society, 10, 15–46.

206 Vol. 2, Issue 2 (ISSN No. 2414-2336)
Claro, P.D., Neto, S. A., & Claro, P. B. (2013).The enhancing impact of friendship
networks on sales managers‘ performance. BAR, Rio de Janeiro, 10(2), 158-175.
Cross, R., & Cummings, J. N. (2004). Tie and network correlates of individual
performance in knowledge-intensive work. Academy of Management Journal,
47(6), 928–937.
Domhoff, W.G. (2013) Centrality in networks, and how it is measured.
http://whorulesamerica.net/power_elite/centrality.html.
Freeman, L. C. (1979). Centrality in social networks. Conceptual clarification. Social
Networks, 1, 215–239.
Granovetter, M. S. (1985). Economic action and social structure: The problem of
embeddedness. American Journal of Sociology, 91(3), 481-510.
Guldner, C. E., & Stone-Winestock, P. (1995).The use of sociometry in teaching at the
university level.Journal of Group Psychotherapy, Psychodrama & Sociometry,
47(4), 177-186.
Hopp, J. W., Iravani, M. S., Liu, F., & Stringer, J. M. (2011). The impact of discussion,
awareness, and collaboration network position on research performance of
engineering school faculty.
Ibarra, H. (1993). Network centrality, power and innovation involvement:
Determinants of technical and administrative roles. Academy of Management
Journal, 36, 471-501.
Mcfadyen, A. M., & Cannella, J. A. (2004). Social capital and knowledge creation:
Diminishing returns of the number and strength of exchange relationships.
Academy of Management Journal, 47(5), 735–746.
McPherson, M.., Smith-Lovin, L., & Brashears, M. E. (2006). Social isolation in
America: Changes in core discussion networks over two decades. American
Sociological Review,71(3), 353-375.
Mushtaq, I., & Khan, S. H. (2012). Factors affecting students‘ academic performance.
Global Journal of Management and Business Research, 12 (9).
Myers, R (1990). Classical and modern regression with applications (2nd
ed.). Boston,
MA: Duxbury.
Perry-Smith, J. E., & Shalley, C. E. (2003). The social side of creativity: A static and
dynamic social network perspective. The Academy of Management Review, 28(1),
89–106.
Picciano, A. G. (2002). Beyond student perceptions: Issues of interaction, presence,
and performance in an online course. Journal of Asynchronous Learning Networks,
6(1), 21-40.
Podolny, J. M., & Baron, J. N. (1997). Relationships and resources: Social networks
and mobility in the workplace. American Sociological Review, 62, 673–693.
Rotolo, D., &Petruzzelli, M. (2013). When does centrality matter? Scientific
productivity and the moderating role of research specialization and cross-
community ties. Journal of Organizational Behavior, 34(5), 648–670.

207 Vol. 2, Issue 2 (ISSN No. 2414-2336)
Shah R., Rahman W., & Abbas S. G., (2015) An analysis of students‘ academic
performance: A case study of Sarhad University, Peshawar, Pakistan. Sarhad
Journal of Management Sciences, 1(1), 31-41.
Sparrowe, T. R., & Liden, C. R. (1997). Process and structure in leader-member
exchange. The Academy of Management Review, 22(2), 522-552.
Sparrowe, R. T., Liden, R. C., Wayne, S.J., & Kraimer, M. L. (2001). Social networks
and the performance of individuals and groups. Academy of Management Journal,
44(2), 316-325.
Spillane, J. P., & Kim, C. M. (2012). An exploratory analysis of formal school leaders‘
positioning in instructional advice and information networks in elementary
schools.American Journal of Education, 119 (1), 73-102.
Tichy, N. M., Tushman, M. L., & Fombrun, C. (1979). Social network analysis for
organizations. Academy of Management Review, 4(4), 507-519.
Tsai, W., & Ghoshal, S. (1998). Social capital and value creation: The role of intra-firm
networks. Academy of Management Journal, 41, 464–476.
Tsai, W. P. (2001). Knowledge transfer in intra-organizational networks: Effects of
network position and absorptive capacity on business unit innovation and
performance. Academy of Management Journal, 44(5), 996–1004.
Wasserman, S., & Faust, K. (1994). Social Networks Analysis: Methods and
applications. Cambridge: Cambridge University Press.
Webster, J., & Hackley, P. (1997). Teaching effectiveness in technology-mediated
distance learning. Academy of Management Journal, 40(6), 282-309.
Yang, H., & Tang, J. (2003). Effects of social network on students‘ performance: A
web-based forum study in Taiwan. JALN, 7(3).Retrieved from:
http://www.adesignmedia. com/onlineresearch/socialnetworksv7n3_yang.pdf.
Yang, K. S. (2007).Firms’ network position, industry hierarchy position and
innovation and an additional examination on structural equivalent block models
and between-sector position. Academy of Management Annual Meeting
Proceeding, 1-6.
Yan, E., & Ding, Y. (2009). Applying centrality measures to impact analysis: A co-
authorship network analysis. Journal of the American Society for Information
Science and Technology, 60(10), 2107–2118.
Zheng, W. (2008). A social capital perspective of innovation from individuals to
nations: Where is empirical literature directing us? International Journal of
Management Reviews, 10(4), 1–39.

208 Vol. 2, Issue 2 (ISSN No. 2414-2336)
Manuscript Submission Guidelines
PLEASE READ CAREFULLY: All authors who want to submit paper(s) for
publication in Sarhad Journal of Management Sciences (SJMS) must follow the
following submission instructions and guidelines.
COPYRIGHT: Authors should note that papers submitted to the SJMS should be
original contributions and should not be under consideration simultaneously for any
other publication. Authors submitting manuscripts for publication journal will be liable
for any infringement of any existing copyright or for legal and academic consequences
of any unwarranted action. Manuscripts once submitted and accepted become the legal
copyright of the journal unless otherwise agreed in writing.
I. General Information: All papers submitted for publication in the journal should be
written in proper English. Proper attention should be given to its syntactic and semantic
aspects with correct spelling of words. Write the names of the authors (if more than
one) in the order you like (this order will not be changed). For more clearance see a
sample manuscript from the journal site provided for this purpose. The Editor must
receive your manuscript before April 30 and September 30 each year for first and
second issue respectively.
NOTE: PLEASE CAREFULLY FOLLOW THE GUIDELINES. IF YOUR
MANUSCRIPT IS NOT ACCORDING TO THE GUIDELINES PROVIDED, IT
MAY BE REJECTED BY THE DESK.
II. Page Setup: Select 8.5‖ x 11‖ size portrait-ONLY sheets with all margins 1‖ each.
Use Times New Romans 10-point font, 1.5-spaced lines, justified style in MS Word.
All data Tables/ Figures should appear at appropriate places of the body of the
manuscript and must be in portrait format ONLY. All figures and tables must be in
black and white and be properly captioned according to APA Format for social science
and IEEE for pure sciences.
III. First Page: Paper TITLE (not more than three lines) must be CENTRED,
CAPITALIZED AND IN BOLD LETTERS using Times New Roman 10-point font,
single-spaced (only here) lines. The name and university/organizational affiliation of
each author must be adjusted with the respective author‘s name with email address.
Please print the word ‖ABSTRACT‖ in capitalized bold letters, left justified, and
double-spaced from last author‘s name/affiliation. After abstract, please write Key
words (maximum 06 words) for your paper. No Landscape formats permitted.
IV. Headings: All other section headings starting with ―Introduction‖ need not be
numbered, (with each word in name-case for the main heading while sentence case for
the sub-heading) and be in bold letters, 10 point font size, left justified, and 1.5-spaced
from last line above them. For sake of ease see the sample manuscript for guidance.
209 Vol. 2, Issue 2 (ISSN No. 2414-2336)
V. Tables, Figures, and Charts: All tables, figures or charts must be inserted in the
body of the manuscripts with proper captions and within the margins and must follow
the APA 6th
in terms of caption, numbering, arrows, columns, etc.
VI. References: Authors are required to provide in-text references as well as a
reference list at the end of the manuscript. All references listed in the reference list
must appear in the main body of the article, and all citations in the main body of the
article must be referenced in the reference list provided at the end of the manuscript.
References should be complete in all respect and should follow APA-6th
. A reference
should contain full bibliographical details, and journal titles should not be abbreviated.
In case an author has more than one publication in the same year use a, b, c
immediately following the year of publication.
Example for articles (APA-6th):
Ikram, M. (2015). Strategic importance of proper choice of organizational design.
Academy of Management Journal, 10(2), 198-212.
Ali, S., & Javed, A. (2015). Human resource management practices and the challenges
for HR managers in an overwhelmingly uncertain labour market. Journal of
Management, 18(2), 29-45.
Example for books:
Aswathappa, K. (2008). Human Resource Management: Text and Cases. Delhi: Tata
McGraw-Hill Publishing Com.
Example for chapter in edited book:
Arthur, M. B., & Rousseau, D. M. (1996). The boundaryless career as a new
employment principle. In M. B. Arthur & D. M. Rousseau (Eds.), The
Boundaryless Career (pp. 3- 20). New York: Oxford University Press.