Journal of Plant Development Sciences
45
Journal of Plant Development Sciences (An International Monthly Refereed Research Journal) Volume 10 Number 9 September 2018 Contents RESEARCH ARTICLES To study the effect of Zn, Fe and Fym on yield, economics and nutrient uptake of different rice ( Oryza sativa L.) varieties —Uma Shanker Ram and V.K. Srivastava ------------------------------------------------------------------------ 489-497 Screening of 110-R root stock based table vareities of grape vine (Vitis vinifera L.) against anthracnose disease caused by Elsinoe ampelina (De bary) sher in Mandsaur district of Madhya Pradesh —R.P. Patel, G.N. Pandey, B.K. Patidar, Nitin Soni, S.B. Singh and A. Haldar -------------------------- 499-504 A study on financial ratio analysis of Sri Venkateswara Co-operative Sugar Ltd., Renigunta, Chittoor district —K. Shiny Israel and Y. Prabhavathi ------------------------------------------------------------------------------- 505-509 Reaction of BT cotton hybrids against sucking insect pests in Malwa region of Madhya Pradesh —S.B. Singh, R.P. Patel, and G.S. Chundavat -------------------------------------------------------------------- 511-515 Foraging behaviour of giant bee, Apis dorsata (Hymenoptera- apidae) on Ageratum conyzoides in northern hill zone of Chhattisgarh —G.P. Painkra ------------------------------------------------------------------------------------------------------------ 517-520 Growth and performance of Sri Venkateswara Co-operative Sugar Ltd.: A study in Chittoor district —K. Shiny Israel and Y. Prabhavathi ------------------------------------------------------------------------------- 521-524 Influence of sowing dates and plant densities on growth parameters of soybean ( Glycine max (L.) Merrill) —B. Sivakumar, M. Srinivasa Reddy, P. Kavitha and S. Tirumala Reddy -------------------------------- 525-528 Isolation and characterization of antibiotic producing Actinomycetes against certain pathogens —Vishal Kumar Deshwal and Mohd Tarik ------------------------------------------------------------------------ 529-532
-
Upload
khangminh22 -
Category
Documents
-
view
0 -
download
0
Transcript of Journal of Plant Development Sciences
Journal of Plant Development Sciences (An International Monthly Refereed Research Journal)
Volume 10 Number 9 September 2018
Contents
RESEARCH ARTICLES
To study the effect of Zn, Fe and Fym on yield, economics and nutrient uptake of different rice (Oryza sativa L.)
varieties
—Uma Shanker Ram and V.K. Srivastava ------------------------------------------------------------------------ 489-497
Screening of 110-R root stock based table vareities of grape vine (Vitis vinifera L.) against anthracnose disease
caused by Elsinoe ampelina (De bary) sher in Mandsaur district of Madhya Pradesh
—R.P. Patel, G.N. Pandey, B.K. Patidar, Nitin Soni, S.B. Singh and A. Haldar -------------------------- 499-504
A study on financial ratio analysis of Sri Venkateswara Co-operative Sugar Ltd., Renigunta, Chittoor district
—K. Shiny Israel and Y. Prabhavathi ------------------------------------------------------------------------------- 505-509
Reaction of BT cotton hybrids against sucking insect pests in Malwa region of Madhya Pradesh
—S.B. Singh, R.P. Patel, and G.S. Chundavat -------------------------------------------------------------------- 511-515
Foraging behaviour of giant bee, Apis dorsata (Hymenoptera- apidae) on Ageratum conyzoides in northern hill
zone of Chhattisgarh
—G.P. Painkra ------------------------------------------------------------------------------------------------------------ 517-520
Growth and performance of Sri Venkateswara Co-operative Sugar Ltd.: A study in Chittoor district
—K. Shiny Israel and Y. Prabhavathi ------------------------------------------------------------------------------- 521-524
Influence of sowing dates and plant densities on growth parameters of soybean (Glycine max (L.) Merrill)
—B. Sivakumar, M. Srinivasa Reddy, P. Kavitha and S. Tirumala Reddy -------------------------------- 525-528
Isolation and characterization of antibiotic producing Actinomycetes against certain pathogens
—Vishal Kumar Deshwal and Mohd Tarik ------------------------------------------------------------------------ 529-532
*Corresponding Author
________________________________________________ Journal of Plant Development Sciences Vol. 10 (9) : 489-497. 2018
TO STUDY THE EFFECT OF ZN, FE AND FYM ON YIELD, ECONOMICS AND
NUTRIENT UPTAKE OF DIFFERENT RICE (ORYZA SATIVA L.) VARIETIES
Uma Shanker Ram* and V.K. Srivastava
Department of Agronomy, Institute of Agricultural Sciences, BHU,
Varanasi, U.P. – 221005
Email: [email protected]
Received-11.09.2018, Revised-26.09.2018 Abstract: A field experiment was carried out at research farm Institute of Agricultural sciences, BHU, Varanasi for two
consecutive years during kharif seasons of 2006-07 and 2007-08. Testing variables consisting of two varieties i.e. NDR-359
and HUBR 2-1, two sources of fertilizer application i.e. 100% RFD of NPK through inorganic source and 75% RFD through
inorganic and rest 25% through FYM. Two micronutrients, Zn and Fe through Zn-EDTA and Fe-EDTA were tested in
different combinations either on soil or as foliar application or both @ 0.5 and 1.0 kg ha-1. Amongst varieties, var. NDR-359
recorded significantly higher yield, economics and NPK uptake of rice than HUBR 2-1, while Zn and Fe uptake were
significantly increased in HUBR 2-1. Fertilizer source as application of 75% RFD through inorganic and rest through FYM
recoded significantly higher yield, economics and N, P, K, Zn and Fe uptake of rice than 100% RFD through inorganic
source. Among the different micronutrient treatments, soil application of Zn-EDTA @ 1 kg ha-1 recorded significantly higher
Zn uptake in rice whereas application of Fe-EDTA @ 0.5 kg ha-1 recorded significantly higher Fe uptake by rice as compared
to other micronutrient treatments.
Keywords: RFD, FYM, Varieties, Yield attributes, Economics, N, P, K, Zn, Fe uptake
INTRODUCTION
ice is considered back bone of food security in
India and 70% of Asian country of globle lebel.
Rice production constitutes the major economic
activity and key sources of livelihood for the rural
households of the Punjab, Hariyana, Uttar Pradesh,
Bihar, Bengal and plain, where growing rice during
the kharif season is a physio graphic compulsion. In
Asia 90% rice is produced and consumed and the rest
(10%) in USA, Africa, Australia and Europe (Tiwari,
2002). Rice is the most important cereal crop in India
but its productivity is very low, particularly in eastern
U.P. Out of many factors, fertilizer is still an
important and inescapable input in increasing the
production of rice. However, increasing cost of
fertilizers has necessitated to improve the efficiency
of applied fertilizers, which depends on adequate
availability of most essential plant nutrients in a
balanced proportion throughout the crop growth
period. In recent year’s use of fertilizers coupled with
intensive cropping have accelerated the exhaustion of
micro-nutrient reserves of soils. It has, thus, become
imperative to use the matching doses of required NPK
and micro-nutrients along with FYM.
Besides, increasing the productivity of rice,
supplementation of micro-nutrients in fertilizer
schedule also is a significant factor to improve the
quality of grain to overcome certain malnutritional
problems in dietary system of human beings.
Accordingly its productivity, quality and profitability
have become an integral part of our National Food
System. Micro-nutrient malnutrition in rice is a
common phenomena due to deficiency of iron, zinc,
Fe, iodine and vitamin A (FAO and WHO, 2002).
Rice is an especially poor source of two important
minerals, calcium and iron (Welch and Graham,
1999) which is known to play significant role in
formation of hemoglobin and transport of oxygen in
human body. Micro-nutrients have attained a greater
significance in intensive farming system with
increased crop productivity for nutritional security
(Rattan et al., 1998). In India, among micro-nutrients,
Zn deficiency is the most widespread under the area
of high yielding crop varieties particularly in low land
rice (Singh et al., 2010). Therefore keeping this view
in mind it was thought worthwhile to study the effect
of Zn, Fe, and FYM on growth, yield and the content
of NPK, Zn and Fe in grains of different rice varieties.
MATERIALS AND METHODS
A field experiment was conducted at the Agricultural
Research Farm, Institute of Agricultural Sciences,
Banaras Hindu University Varanasi during kharif
seasons of 2006-07 and 2007-08. The soil of
experimental field was alluvium, neutral, having pH
(7.3), low in available N (190.56 kg ha-1
) medium in
available P (20.58 kg ha-1
) and exchangeable K
(223.87 kg ha-1
) while Zn (0.898 kg ha-1
), and Fe
(20.67 kg ha-1
) were deficient. The treatments
consisting of 4 main plot treatments, with
combination of two varieties (V1-NDR-359 and V2 -
HUBR2-1) and two fertilizer sources (F1-100%
recommended fertilizer dose (RFD), F2-75%
RFD+25% N through FYM and 9 sub plot treatment
combinations M0 (control), M1 (Zn as soil application
through Zn-EDTA @ 1.00 kg ha-1
), M2 (Zn as foliar
application through Zn-EDTA @ 0.5 kg ha-1
), M3 (Fe
as soil application through Fe- EDTA @ 1.00 kg ha-
R
RESEARCH ARTICLE
490 UMA SHANKER RAM AND V.K. SRIVASTAVA
1), M4 (Fe as foliar application through Fe-EDTA @
0.5 kg ha-1
), M5 (Zn as soil application through Zn-
EDTA @ 1.00 kg ha-1
+ Fe as soil application through
Fe-EDTA @ 1.00 kg ha-1
), M6 (Zn as foliar
application through Zn-EDTA @ 0.5 kg ha-1
followed
by Fe as foliar application through Fe-EDTA @ 0.5
kg ha-1
), M7 ( Zn as soil application through Zn-
EDTA @ 1.00 kg ha-1
followed by Fe as foliar
application through Fe-EDTA@ 0.5 kg ha-1
), M8 ( Fe
as soil application through Fe-EDTA @ 1.00 kg ha-1
followed by Zn as foliar application through Zn-
EDTA @ 0.5 kg ha-1
) allotted in split plot design
replicated three times. The duration of NDR-359 and
HUBR2-1 were 130-135 days and 125-130 days
respectively which were taken as a test crop and
planted on a spacing of 20 × 10 cm with 2 seedling
hill-1
. Observations on various yield parameters
(number of panicle m-2
), grains/panicle,test weight (g)
, grain and straw yield (qha-1
), cost off cultivation
(Rs/ha-1
), net returns (Rs/ha-1
), benefit cost ratio) and
nutrient uptake (N, P, K, Zn, and Fe) were done at
harvest after transplantation (DAT). Estimations of N,
P, K, Zn, and Fe were done by the methods given by,
N (Subbiah and Asija, 1973), P and K (Jackson,
1973), Zn and Fe (L’vov, B.V, 2005), respectively.
Yield and yield attributes of different treatments ha-1
were recorded and computed. As effect of different
treatments during two years showed similar trends,
pooled means of two years data were presented.
RESULTS AND DISCUSSION
Effect of varieties
Data revealed that variety NDR-359 produced
significantly higher yield parameters (number of
panicle m-2
), test weight (g), grain and straw yield
(qha-1
) over HUBR 2-1 whereas, grains/panicle,
significantly higher over NDR-359 during crop
seasons (Table 1).
The cost of cultivation of aromatic and non aromatic
rice (fine and coarse rice grains) varied from
29202.48 to 29577.54 Rs/ha. Owing to transplanted of
different nature type of rice varieties.The cost of
cultivation was the lower under V1 (NDR-359) for
variety treatment, whereas it was higher V2 (HUBR 2-
1) for variety treatment of rice. Owing to production
of grain yield and comparatively lower cost (V1), net
returns (55312.55 Rs/ha) and benefit cost ratio (1.87)
were the significantly highest under the V2 (HUBR 2-
1) varietal treatment during both the years.
light varietal differences were observed in N, P and K
uptake of grain and straw. Variety NDR-359 recorded
significantly higher N, P and K uptake than HUBR 2-
1. In case of non-aromatic rice varieties, about 73% of
N was translocated to grain and rest remaining in the
straw while in aromatic cultivars translocation of N
to grain was only 47% (De et al., 2002). The results
of the present study are in agreement with the
findings of Subrahmanym and Mehata (1974).
Application of N, P, K with micronutrients Zn and Fe
are known to increase the uptake or content of N, P,
K, Zn and Fe (Ganghaih et al., 1999). However,
micronutrients (Zn and Fe) content or uptake of
variety HUBR 2-1 proved significantly superior over
NDR-359 (Table 2). Varieties, HUBR 2-1 recorded
maximum zinc and iron in grains and straw because it
is aromatic in nature which supported the fact that
zinc and iron concentrations remain higher in grains
due to aromaticity of the variety. These findings are
strongly supported by Graham et al. (1997) and (Babu
et al. 2005).
It is well known that the application of N,P,K,
micronutrients along with FYM in proper
combinations might increase and synthecize, various
volatile aromatic compound found in rice, responsible
for its aroma. Among which 2-Acetyle-1-Pyrroline
(2-AP) is the most significant. Considerable
improvement in grain quality of aromatic rice was
recorded under might be due to increase of aroma and
nutrient content synthesizing in grain with combined
use of organic and inorganic sources of nutrients as
compared to 100% RFD through inorganic fertilizers.
These findings are strongly supported by (Sahu et al.,
2007).
Effect of fertilizers The Application of 75% RFD through inorganics +
25% N through FYM produced significantly higher
yield attributes of number of panicle m-2
, number of
grains panicle-1
, test weight (g) and grain yield of
54.06 qha-1
over 100% RFD through inorganics
(49.75 qha-1
). Application of F2 sources of fertilizers
also produced relatively higher straw yield (75.41
qha-1
), as compared to F1 sources of fertilizers at crop
harvest. (Table 1). Lower sterility under the 75% RFD
through inorganics + 25% N through FYM producing
bolder grains thus increased the test weight due to
slow release of nutrients for longer period after
decomposition of FYM, which favoured better plant
growth and improved the yield components of rice.
Improvement in all above yield attributes and yield
has also been reported by Gupta et al., (2009).
The cost of cultivation of aromatic and non aromatic
rice varieties varied from 28960.05 to 29819.97
Rs/ha. Owing to use of different doses and sources of
fertilizers. The cost of cultivation was the lowest for
100% RFD through inorganic fertilizers applied to
rice, whereas it was highest when 75% RFD through
inorganic+25% N through FYM. Owing to
production of grain yield and comparatively lower
cost (F1), net returns (46296.48 Rs/ha) and benefit
cost ratio (1.55) were the significantly highest under
the application of 75% RFD through inorganic+25%
N through FYM (F2).
Application of 75% RFD through inorganic sources +
25% N through FYM proved significantly superior in
increasing P, K, Zn and Fe uptake in grain and straw
over F1-100% RFD through inorganics during both
the years (Table 2). The present results are in
agreement with the findings of Srivastava et al.
(2008) and Chandrapala et al. (2010). Organic
JOURNAL OF PLANT DEVELOPMENT SCIENCES VOL. 10 (9) 491
sources also improved the uptake of Fe by supplying
chelating agents, which helps in maintaining the
solubility of micro-nutrients including Fe. The
response of organic matter showed profound
influence on the solubility of Fe in waterlogged soil
by providing resistance to Fe chlorosis (Singh et al.,
2010) and (Das et al., 2010). It is thus apparent that
application and maintenance of organic matter in the
soil translates adequate long term availability of Fe.
Improving N nutrition of plants may contribute to
increase Zn and Fe concentration in grain and straw
by affecting the levels of Zn or Fe-chelating
nitrogenous compound, required for transport of Zn
and Fe within plants, which increased Zn and Fe
transporters needed for its uptake by root and phloem
loading. It indicates that nitrogen management is an
effective agronomic tool to enhance grain Zn and Fe
concentrations. The present results are in agreement
with the findings of CakmakA (2010).
Effects of Zn and Fe Micronutrients in various mode of application
produced significant variation on yield attributes,
yield, economics and nutrient uptake. Incorporation of
Zn and Fe either individually or in combination
significantly increased the yield attributes, yield,
economics and nutrient uptake over control in both
the year of experimentation. The combined
application of M7 ( Zn as soil application through Zn-
EDTA @ 1.00 kg ha-1
followed by Fe as foliar
application through Fe-EDTA @ 0.5 kg ha-1
applied in
two splits at 15 DAT and at 50% panicle initiation)
produced significantly higher yield attributes, yield,
economics and nutrient uptake. Application of Zn and
Fe in combination with FYM and recommended dose
of N, P, K significantly influenced the yield attributes,
yield, economics and nutrient uptake (Table 1 and
Table 2). Similarly combined application of Zn-
EDTA @ 1.00 kg ha-1
followed by Fe-EDTA@ 0.5
kg ha-1
applied as foliar recorded significantly higher
number of panicles m-2, number of grains panicles-
1,grain and straw yield over the single or combined
application of Zn-EDTA and Fe-EDTA. Test weight
(g) remained statistically at par with the treatment M6,
M8 M1. Participation of Zn in biosynthesis of indole
acetic acid (IAA) and its role in initiation of
primordial reproductive parts and partitioning of
photosynthates towards them are responsible for
increased yield (Takaki and Kushizaki, 1970). The
favorable influence of applied Zn on yield may be due
to its catalytic or stimulatory effect on most of the
physiological and metabolic process of plants
(Mandal et al., 2009). Iron as a constituent of the
electron transport enzymes, like cytochromes and
ferredoxin are actively involved in photosynthesis and
mitochondrial respiration. It is also a constituent of
the enzymes catalase and peroxidase, which catalyze
the breakdown of H2O2 (peroxide released during
photorespiration) into H2O and O2, preventing H2O2
toxicity. Iron, along with molybdenum, is an element
of the nitrite and nitrate reductase enzymes. Thus,
iron helps in the utilization of nitrogen. All these
physiological processes proved instrumental in
increasing yield by application of iron.
The effects of treatments were also observed
significan in respect of net return and benefit cost
ratio (Table 1). The magnitude of incease due to
application of Zn and Fe to both in rice. Owing to net
returns and benefit cost ratio were the significantly
highest under the application of M7 ( Zn as soil
application through Zn-EDTA @ 1.00 kg ha-1
followed by Fe as foliar application through Fe-
EDTA @ 0.5 kg ha-1
applied in two splits at 15 DAT
and at 50% panicle initiation) in rice was found to be
net return (49120..43) and benefit cost ratio (1.64)
significantly higher over to all treatments during both
the years. M1 (Zn as soil application through Zn-
EDTA @ 1.00 kg ha-1
) and M4 (Fe-EDTA @ 0.5 kg
ha-1
applied in two splits at 15 DAT and at 50%
panicle initiation) applied alone resulted both on par
during both the years. Husain et al. (2009) also
reported similar results.
In general, nutrient removal by rice crop was recorded
mainly due to higher yield of rice and depend on
nature of rice varieties, fertility and field management
and practices. Incorporation of micronutrient (Zn-
EDTA and Fe-EDTA) proved significantly superior to
control in increasing N, P, K uptake by rice (Table 2).
Application of Zn-EDTA @ 1 kg ha-1
in soil followed
by Fe-EDTA @ 0.5 kg ha-1
as foliar spray in two
splits recorded maximum N, P and K uptake of rice
and proved superior over other treatments. Increase in
nutrient uptake with the increased fertility levels
could be attributed to better availability of nutrients
and their transport to the plant from the soil.
Incorporation of Zn-EDTA @ 1.00 kg ha-1
as soil
application showed significant superiority over all
treatments in increasing Zn content in grain followed
by M2, M7, M5, M6, M8, M4. The zinc and iron content
in rice grains were recorded maximum with their
separate application and minimum under control
whereas, combined and sequential applications of Zn-
EDTA and Fe-EDTA slightly decreased Zn and Fe
concentrations in grains as compared to their separate
applications reported by Verma and Tripathi (1983).
Jana et al. (2010) also observed that soil application
of Zn-EDTA led to higher content and uptake of N, P,
K and Zn in grain and straw of rice. Alvarez et al.
(2001) reported that when Zn was added as Zn-
EDTA, the amounts of the most labile fractions
(water-soluble plus exchangeable and organically
complexed Zn) increased throughout the entire soil
profile column, which enhanced the root-cell
membrane function. Activity of carbonic anhydrase
(CA) is closely related to Zn content in C3 plants
(Pearson et al., 1995). Under extreme Zn deficiency,
carbonic anhydrase activity remained almost absent.
The labeled Zn rapidly accumulated in the roots of
cereal crops upon immersion into the isotope solution.
Root uptake and root-to-shoot transport of zinc and
particularly internal utilization of zinc are equally
492 UMA SHANKER RAM AND V.K. SRIVASTAVA
important mechanism involved in the expression of
zinc efficiency in cereal crops varieties. Since flag
leaves are one of the sources of remobilized metals
for developing seeds, the identification of the
molecular players that might contribute to the process
of metal transport from flag leaves to the seeds may
be useful for biofortification purposes in relation to
Zn and Fe (Sperotto et al., 2010). Chandrapala et
al.(2010), Naik and Das, (2008) concluded that the
greater affectivity of Zn-EDTA over other sources of
Zn in terms of growth and its utilization by plants
might be due to less retention and greater transport
and movement of chelated Zn to plant roots. Fe as
foliar through Fe-EDTA recorded relatively higher
yield and nutrient uptake over Fe as soil through Fe-
EDTA at all the stages of plant growth, probably due
to higher Fe uptake through aerial portion of plant
under foliar spray (Sarangi et al., 2006). Evaluation of
Fe salts as foliar spray under different conditions
showed greening effect associated with increased
chlorophyll and Fe content. Subsequently, application
of non-charged or negatively charged Fe-chelates for
foliar sprays seems to be the most effective alternative
as suggested by Fernandez et al. (2005).
Foliar application of Fe in two splits (M4) produced
highest Fe content in grain and proved significantly
superior to all other combinations. Concurrently,
incorporation of Zn-EDTA @ 1 kg ha-1
in soil and
foliar application of Fe- EDTA @ 0.5 kg ha-1
showed
next best affectivity in increasing Fe content over
other treatments. Uptake of Zn or Fe however was
reduced in combined soil as well as foliar applications
of Zn and Fe which remarkably increased when
applied to soil individually. This obsiously indicated
antagonism between these two micronutrients when
applied in combination. Further, Fe content improved
due to application of N through organic sources which
might be due to maintenance of better soil aeration
and the solubility of micronutrients. Therefore,
overall findings concluded that Zn-EDTA as soil and
Fe-EDTA as foliar applied in rice contributed marked
increase in yield associated with grain micronutrient
content (Zn and Fe) along with their uptake as
compared to other treatments and finally significantly
balancing in ionic composition.
Uptake by grain and straw
The results of the present study indicated that zinc
and iron content in grains and straw favourably
influenced due to different treatments. Nutrient
content of rice significantly increased over control
due to Zn, Fe and FYM application. Zn, Fe and FYM
showed synergistic effect on N, P, K, Zn and Fe
content. However slight varietal differences were
observed in N, P and K content of plant at flowering
stage, grain and in straw. Variety NDR-359 recorded
higher uptake and N content than HUBR 2-1 at
flowering stage and in grain and straw, but it
remained significantly higher in straw of NDR-359
during both the years. The results of the present study
are in agreement with the findings of Subrahmanym
and Mehata (1974).They reported that Fe application
significantly increased the N content of rice.
Phosphorous content and uptake at flowering stage of
plant, grain and straw increased markedly in NDR-
359. Similarly K content and uptake of variety NDR-
359 remained significantly superior to HUBR 2-1 at
flowering stage, and in grain and straw during both
the years. Micronutrient (Zn and Fe) content and
uptake of variety HUBR 2-1 proved significantly
superior to NDR-359 during both the years due to
varietal differences and recorded maximum zinc and
iron in grains than HUBR 2-1. Since this variety is
aromatic in nature which supported the established
fact that zinc and iron concentration in grains are
related to aromaticity of the variety. These findings
are strongly supported by Graham et al. (1997), Qui
et al. (1993) and Babu et al. (2005).
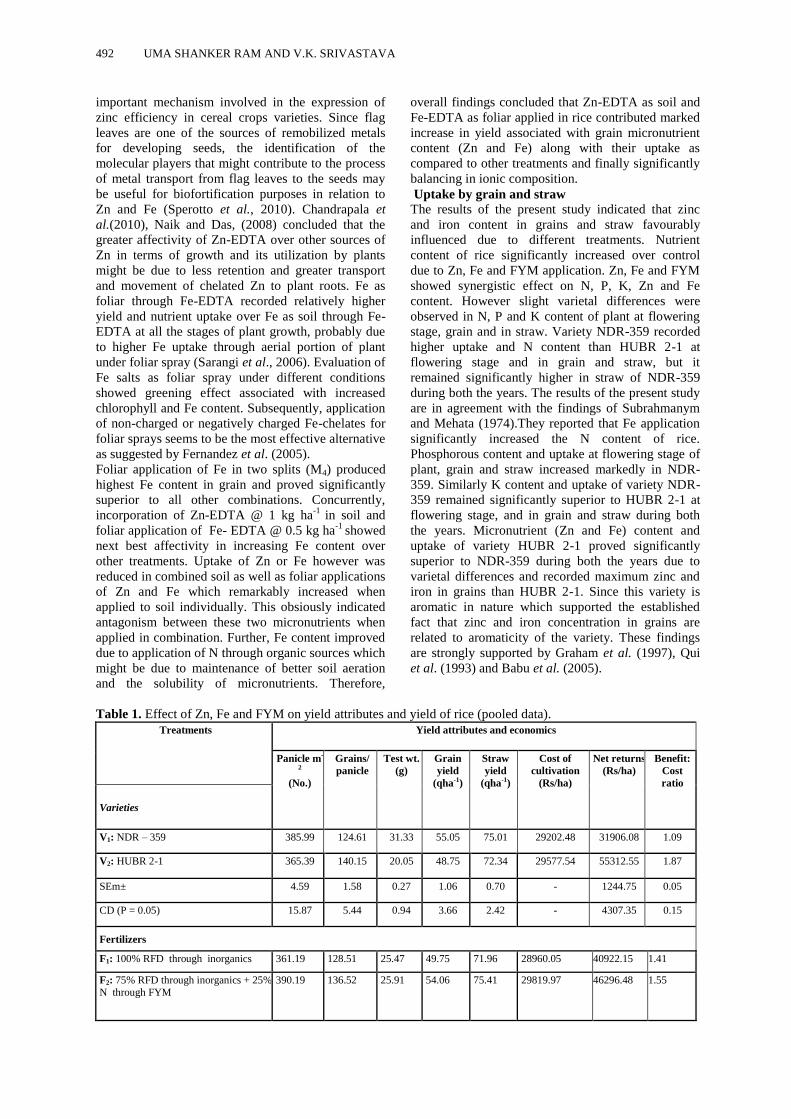
Table 1. Effect of Zn, Fe and FYM on yield attributes and yield of rice (pooled data).
Treatments
Yield attributes and economics
Panicle m-
2
(No.)
Grains/
panicle
Test wt.
(g)
Grain
yield
(qha-1)
Straw
yield
(qha-1)
Cost of
cultivation
(Rs/ha)
Net returns
(Rs/ha)
Benefit:
Cost
ratio
Varieties
V1: NDR – 359 385.99 124.61 31.33 55.05 75.01 29202.48 31906.08 1.09
V2: HUBR 2-1 365.39 140.15 20.05 48.75 72.34 29577.54 55312.55 1.87
SEm± 4.59 1.58 0.27 1.06 0.70 - 1244.75 0.05
CD (P = 0.05) 15.87 5.44 0.94 3.66 2.42 - 4307.35 0.15
Fertilizers
F1: 100% RFD through inorganics 361.19 128.51 25.47 49.75 71.96 28960.05 40922.15 1.41
F2: 75% RFD through inorganics + 25%
N through FYM
390.19 136.52 25.91 54.06 75.41 29819.97 46296.48 1.55
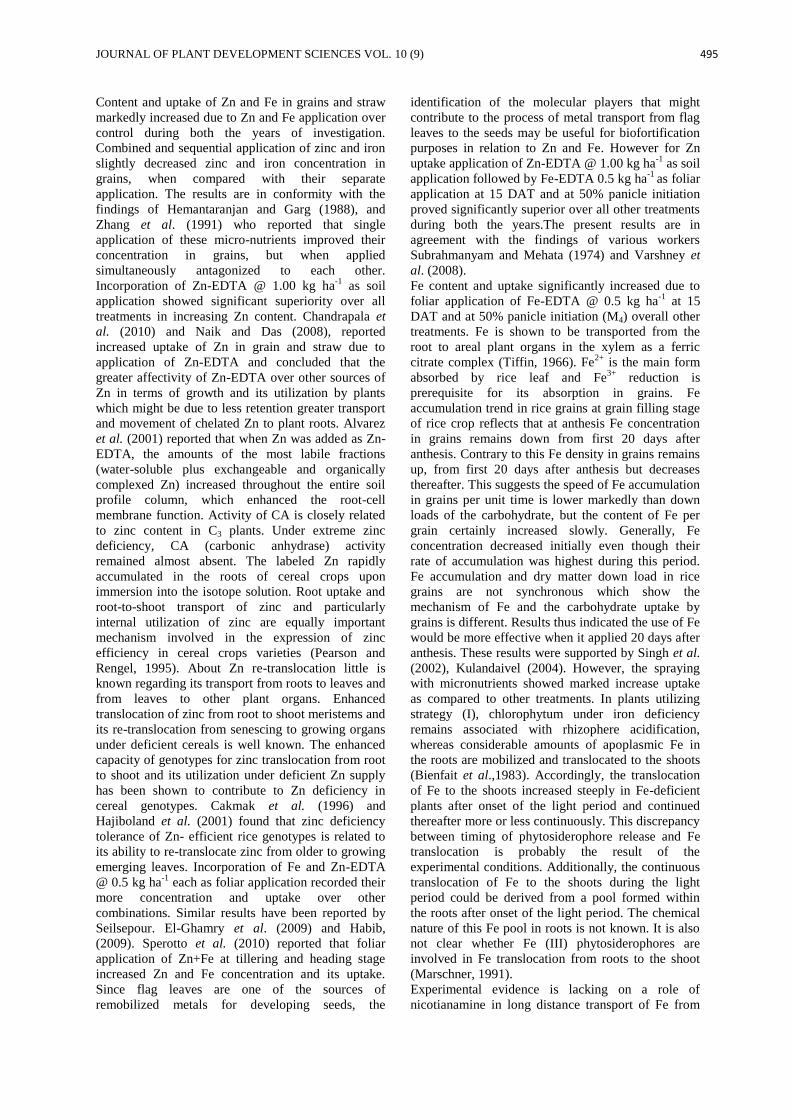
JOURNAL OF PLANT DEVELOPMENT SCIENCES VOL. 10 (9) 493
SEm± 4.59 1.58 0.27 1.06 0.70 - 1244.75 0.05
CD (P = 0.05) 15.87 5.44 0.94 3.66 2.42 - 4307.35 0.15
Micro-nutrient (Zn and Fe)
M0: Control 335.05 115.05 24.26 43.49 65.83 26744.01 34686.01 1.30
M1: Zn-EDTA @ 1.00 kg ha-1 (S) 372.31 133.63 26.28 53.25 74.65 29635.76 45118.47 1.52
M2: Zn-EDTA @ 0.5 kg ha-1 (F) 361.92 130.09 25.56 51.60 73.11 29295.76 43282.41 1.48
M3: Fe-EDTA @ 1.00 kg ha-1 (S) 359.82 126.10 25.43 50.71 72.28 29635.76 41739.90 1.41
M4: Fe-EDTA @ 0.5 kg ha-1 (F) 378.95 132.43 25.64 52.72 74.39 29295.76 44948.41 1.53
M5: Zn-EDTA @ 1.00 kg ha-1 (S)+Fe-
[email protected] ha-1 (S)
387.41 135.33 25.66 52.85 74.92 30315.76 43966.06 1.45
M6: Zn-EDTA @ 0.5 kg ha-1 (F) fb Fe-
EDTA @ 0.5 kg ha-1 (F)
395.75 137.21 25.68 53.48 75.58 29635.76 45575.07 1.54
M7: Zn-EDTA @ 1.00 kg ha-1 (S) fb Fe-EDTA @ 0.5 kg ha-1 (F)
407.78 146.87 26.25 56.27 78.52 29975.76 49120.43 1.64
M8: Fe-EDTA @ 1.00 kgha-1(S) fb Zn-
EDTA @ 0.5 kg ha-1(F)
382.21 135.73 26.80 52.76 74.77 29975.76 44047.08 1.47
SEm± 4.23 1.53 0.26 0.83 0.65 - 1187.41 0.04
CD (P = 0.05) 11.96 4.31 0.74 2.35 1.84 - 3354.65 0.11
*RFD –Recommended Fertilizers Dose, S – Soil application, F – Foliar application, fb – Followed by, NS –
Non-significant
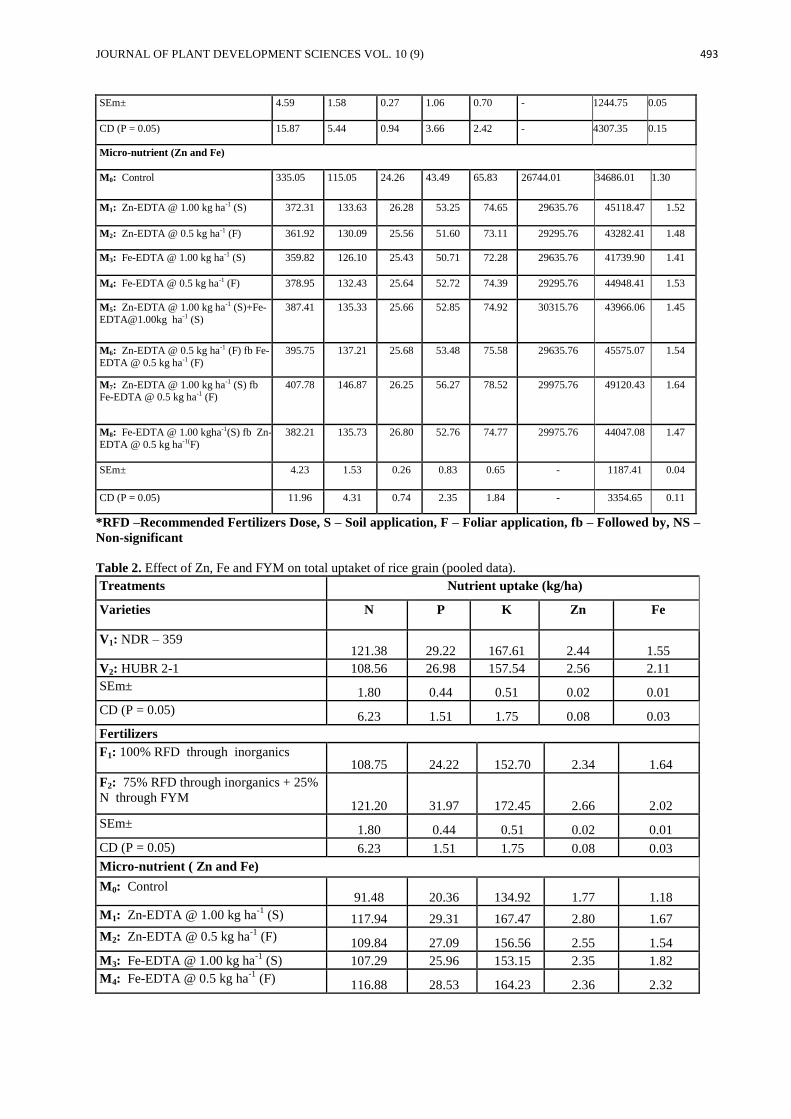
Table 2. Effect of Zn, Fe and FYM on total uptaket of rice grain (pooled data).
Treatments Nutrient uptake (kg/ha)
Varieties
N P K Zn Fe
V1: NDR – 359 121.38 29.22 167.61 2.44 1.55
V2: HUBR 2-1 108.56 26.98 157.54 2.56 2.11
SEm± 1.80 0.44 0.51 0.02 0.01
CD (P = 0.05) 6.23 1.51 1.75 0.08 0.03
Fertilizers
F1: 100% RFD through inorganics 108.75 24.22 152.70 2.34 1.64
F2: 75% RFD through inorganics + 25%
N through FYM 121.20 31.97 172.45 2.66 2.02
SEm± 1.80 0.44 0.51 0.02 0.01
CD (P = 0.05) 6.23 1.51 1.75 0.08 0.03
Micro-nutrient ( Zn and Fe)
M0: Control 91.48 20.36 134.92 1.77 1.18
M1: Zn-EDTA @ 1.00 kg ha-1
(S) 117.94 29.31 167.47 2.80 1.67
M2: Zn-EDTA @ 0.5 kg ha-1
(F) 109.84 27.09 156.56 2.55 1.54
M3: Fe-EDTA @ 1.00 kg ha-1
(S) 107.29 25.96 153.15 2.35 1.82
M4: Fe-EDTA @ 0.5 kg ha-1
(F) 116.88 28.53 164.23 2.36 2.32
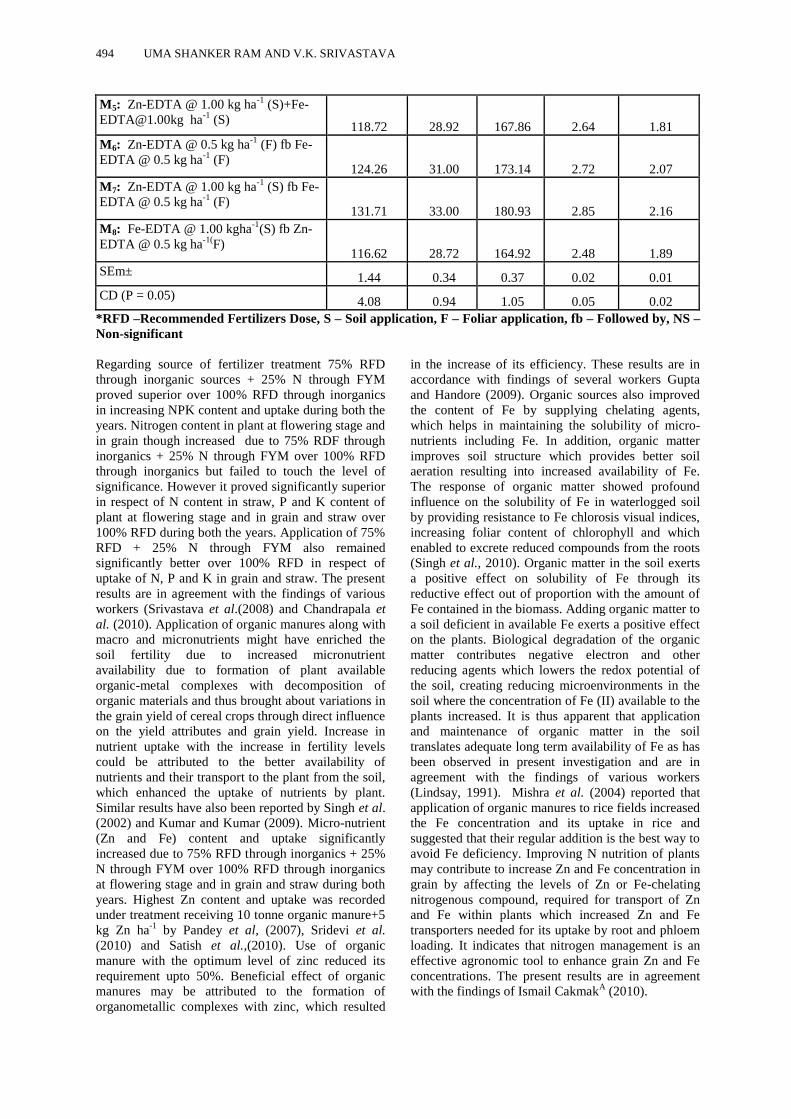
494 UMA SHANKER RAM AND V.K. SRIVASTAVA
M5: Zn-EDTA @ 1.00 kg ha-1
(S)+Fe-
[email protected] ha-1
(S) 118.72 28.92 167.86 2.64 1.81
M6: Zn-EDTA @ 0.5 kg ha-1
(F) fb Fe-
EDTA @ 0.5 kg ha-1
(F) 124.26 31.00 173.14 2.72 2.07
M7: Zn-EDTA @ 1.00 kg ha-1
(S) fb Fe-
EDTA @ 0.5 kg ha-1
(F) 131.71 33.00 180.93 2.85 2.16
M8: Fe-EDTA @ 1.00 kgha-1
(S) fb Zn-
EDTA @ 0.5 kg ha-1(
F) 116.62 28.72 164.92 2.48 1.89
SEm± 1.44 0.34 0.37 0.02 0.01
CD (P = 0.05) 4.08 0.94 1.05 0.05 0.02
*RFD –Recommended Fertilizers Dose, S – Soil application, F – Foliar application, fb – Followed by, NS –
Non-significant
Regarding source of fertilizer treatment 75% RFD
through inorganic sources + 25% N through FYM
proved superior over 100% RFD through inorganics
in increasing NPK content and uptake during both the
years. Nitrogen content in plant at flowering stage and
in grain though increased due to 75% RDF through
inorganics + 25% N through FYM over 100% RFD
through inorganics but failed to touch the level of
significance. However it proved significantly superior
in respect of N content in straw, P and K content of
plant at flowering stage and in grain and straw over
100% RFD during both the years. Application of 75%
RFD + 25% N through FYM also remained
significantly better over 100% RFD in respect of
uptake of N, P and K in grain and straw. The present
results are in agreement with the findings of various
workers (Srivastava et al.(2008) and Chandrapala et
al. (2010). Application of organic manures along with
macro and micronutrients might have enriched the
soil fertility due to increased micronutrient
availability due to formation of plant available
organic-metal complexes with decomposition of
organic materials and thus brought about variations in
the grain yield of cereal crops through direct influence
on the yield attributes and grain yield. Increase in
nutrient uptake with the increase in fertility levels
could be attributed to the better availability of
nutrients and their transport to the plant from the soil,
which enhanced the uptake of nutrients by plant.
Similar results have also been reported by Singh et al.
(2002) and Kumar and Kumar (2009). Micro-nutrient
(Zn and Fe) content and uptake significantly
increased due to 75% RFD through inorganics + 25%
N through FYM over 100% RFD through inorganics
at flowering stage and in grain and straw during both
years. Highest Zn content and uptake was recorded
under treatment receiving 10 tonne organic manure+5
kg Zn ha-1
by Pandey et al, (2007), Sridevi et al.
(2010) and Satish et al.,(2010). Use of organic
manure with the optimum level of zinc reduced its
requirement upto 50%. Beneficial effect of organic
manures may be attributed to the formation of
organometallic complexes with zinc, which resulted
in the increase of its efficiency. These results are in
accordance with findings of several workers Gupta
and Handore (2009). Organic sources also improved
the content of Fe by supplying chelating agents,
which helps in maintaining the solubility of micro-
nutrients including Fe. In addition, organic matter
improves soil structure which provides better soil
aeration resulting into increased availability of Fe.
The response of organic matter showed profound
influence on the solubility of Fe in waterlogged soil
by providing resistance to Fe chlorosis visual indices,
increasing foliar content of chlorophyll and which
enabled to excrete reduced compounds from the roots
(Singh et al., 2010). Organic matter in the soil exerts
a positive effect on solubility of Fe through its
reductive effect out of proportion with the amount of
Fe contained in the biomass. Adding organic matter to
a soil deficient in available Fe exerts a positive effect
on the plants. Biological degradation of the organic
matter contributes negative electron and other
reducing agents which lowers the redox potential of
the soil, creating reducing microenvironments in the
soil where the concentration of Fe (II) available to the
plants increased. It is thus apparent that application
and maintenance of organic matter in the soil
translates adequate long term availability of Fe as has
been observed in present investigation and are in
agreement with the findings of various workers
(Lindsay, 1991). Mishra et al. (2004) reported that
application of organic manures to rice fields increased
the Fe concentration and its uptake in rice and
suggested that their regular addition is the best way to
avoid Fe deficiency. Improving N nutrition of plants
may contribute to increase Zn and Fe concentration in
grain by affecting the levels of Zn or Fe-chelating
nitrogenous compound, required for transport of Zn
and Fe within plants which increased Zn and Fe
transporters needed for its uptake by root and phloem
loading. It indicates that nitrogen management is an
effective agronomic tool to enhance grain Zn and Fe
concentrations. The present results are in agreement
with the findings of Ismail CakmakA (2010).
JOURNAL OF PLANT DEVELOPMENT SCIENCES VOL. 10 (9) 495
Content and uptake of Zn and Fe in grains and straw
markedly increased due to Zn and Fe application over
control during both the years of investigation.
Combined and sequential application of zinc and iron
slightly decreased zinc and iron concentration in
grains, when compared with their separate
application. The results are in conformity with the
findings of Hemantaranjan and Garg (1988), and
Zhang et al. (1991) who reported that single
application of these micro-nutrients improved their
concentration in grains, but when applied
simultaneously antagonized to each other.
Incorporation of Zn-EDTA @ 1.00 kg ha-1
as soil
application showed significant superiority over all
treatments in increasing Zn content. Chandrapala et
al. (2010) and Naik and Das (2008), reported
increased uptake of Zn in grain and straw due to
application of Zn-EDTA and concluded that the
greater affectivity of Zn-EDTA over other sources of
Zn in terms of growth and its utilization by plants
which might be due to less retention greater transport
and movement of chelated Zn to plant roots. Alvarez
et al. (2001) reported that when Zn was added as Zn-
EDTA, the amounts of the most labile fractions
(water-soluble plus exchangeable and organically
complexed Zn) increased throughout the entire soil
profile column, which enhanced the root-cell
membrane function. Activity of CA is closely related
to zinc content in C3 plants. Under extreme zinc
deficiency, CA (carbonic anhydrase) activity
remained almost absent. The labeled Zn rapidly
accumulated in the roots of cereal crops upon
immersion into the isotope solution. Root uptake and
root-to-shoot transport of zinc and particularly
internal utilization of zinc are equally important
mechanism involved in the expression of zinc
efficiency in cereal crops varieties (Pearson and
Rengel, 1995). About Zn re-translocation little is
known regarding its transport from roots to leaves and
from leaves to other plant organs. Enhanced
translocation of zinc from root to shoot meristems and
its re-translocation from senescing to growing organs
under deficient cereals is well known. The enhanced
capacity of genotypes for zinc translocation from root
to shoot and its utilization under deficient Zn supply
has been shown to contribute to Zn deficiency in
cereal genotypes. Cakmak et al. (1996) and
Hajiboland et al. (2001) found that zinc deficiency
tolerance of Zn- efficient rice genotypes is related to
its ability to re-translocate zinc from older to growing
emerging leaves. Incorporation of Fe and Zn-EDTA
@ 0.5 kg ha-1
each as foliar application recorded their
more concentration and uptake over other
combinations. Similar results have been reported by
Seilsepour. El-Ghamry et al. (2009) and Habib,
(2009). Sperotto et al. (2010) reported that foliar
application of Zn+Fe at tillering and heading stage
increased Zn and Fe concentration and its uptake.
Since flag leaves are one of the sources of
remobilized metals for developing seeds, the
identification of the molecular players that might
contribute to the process of metal transport from flag
leaves to the seeds may be useful for biofortification
purposes in relation to Zn and Fe. However for Zn
uptake application of Zn-EDTA @ 1.00 kg ha-1
as soil
application followed by Fe-EDTA 0.5 kg ha-1
as foliar
application at 15 DAT and at 50% panicle initiation
proved significantly superior over all other treatments
during both the years.The present results are in
agreement with the findings of various workers
Subrahmanyam and Mehata (1974) and Varshney et
al. (2008).
Fe content and uptake significantly increased due to
foliar application of Fe-EDTA @ 0.5 kg ha-1
at 15
DAT and at 50% panicle initiation (M4) overall other
treatments. Fe is shown to be transported from the
root to areal plant organs in the xylem as a ferric
citrate complex (Tiffin, 1966). Fe2+
is the main form
absorbed by rice leaf and Fe3+
reduction is
prerequisite for its absorption in grains. Fe
accumulation trend in rice grains at grain filling stage
of rice crop reflects that at anthesis Fe concentration
in grains remains down from first 20 days after
anthesis. Contrary to this Fe density in grains remains
up, from first 20 days after anthesis but decreases
thereafter. This suggests the speed of Fe accumulation
in grains per unit time is lower markedly than down
loads of the carbohydrate, but the content of Fe per
grain certainly increased slowly. Generally, Fe
concentration decreased initially even though their
rate of accumulation was highest during this period.
Fe accumulation and dry matter down load in rice
grains are not synchronous which show the
mechanism of Fe and the carbohydrate uptake by
grains is different. Results thus indicated the use of Fe
would be more effective when it applied 20 days after
anthesis. These results were supported by Singh et al.
(2002), Kulandaivel (2004). However, the spraying
with micronutrients showed marked increase uptake
as compared to other treatments. In plants utilizing
strategy (I), chlorophytum under iron deficiency
remains associated with rhizophere acidification,
whereas considerable amounts of apoplasmic Fe in
the roots are mobilized and translocated to the shoots
(Bienfait et al.,1983). Accordingly, the translocation
of Fe to the shoots increased steeply in Fe-deficient
plants after onset of the light period and continued
thereafter more or less continuously. This discrepancy
between timing of phytosiderophore release and Fe
translocation is probably the result of the
experimental conditions. Additionally, the continuous
translocation of Fe to the shoots during the light
period could be derived from a pool formed within
the roots after onset of the light period. The chemical
nature of this Fe pool in roots is not known. It is also
not clear whether Fe (III) phytosiderophores are
involved in Fe translocation from roots to the shoot
(Marschner, 1991).
Experimental evidence is lacking on a role of
nicotianamine in long distance transport of Fe from
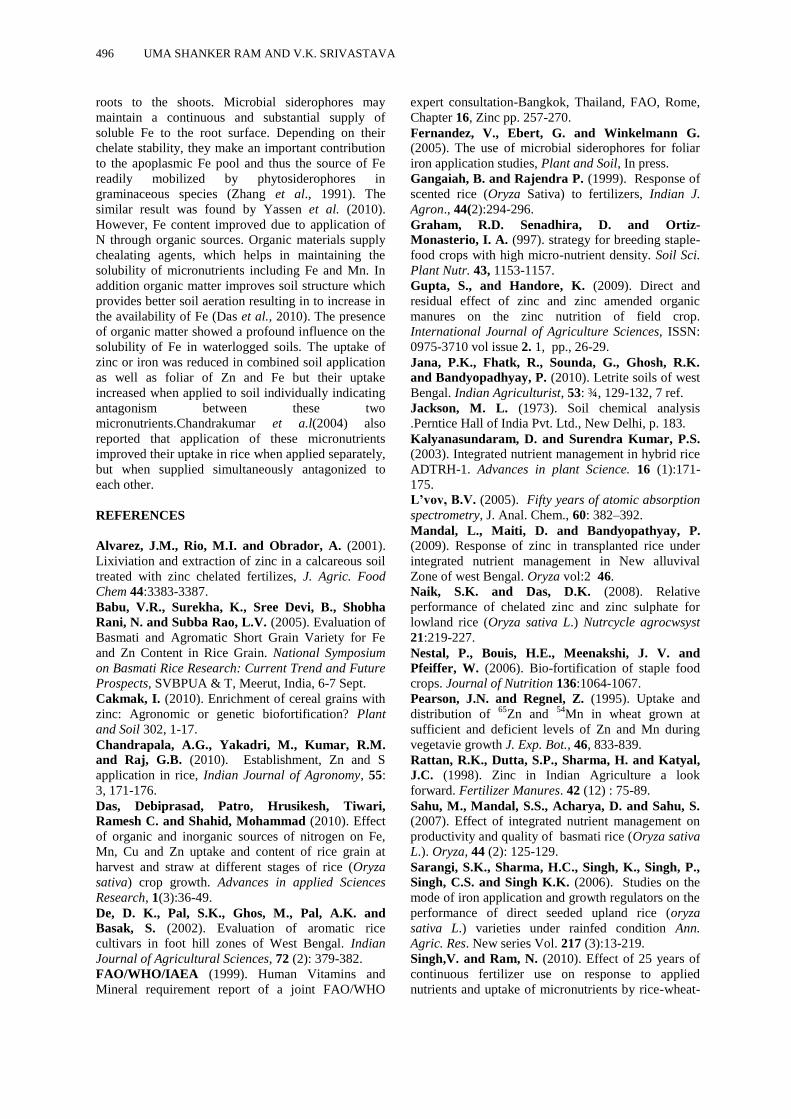
496 UMA SHANKER RAM AND V.K. SRIVASTAVA
roots to the shoots. Microbial siderophores may
maintain a continuous and substantial supply of
soluble Fe to the root surface. Depending on their
chelate stability, they make an important contribution
to the apoplasmic Fe pool and thus the source of Fe
readily mobilized by phytosiderophores in
graminaceous species (Zhang et al., 1991). The
similar result was found by Yassen et al. (2010).
However, Fe content improved due to application of
N through organic sources. Organic materials supply
chealating agents, which helps in maintaining the
solubility of micronutrients including Fe and Mn. In
addition organic matter improves soil structure which
provides better soil aeration resulting in to increase in
the availability of Fe (Das et al., 2010). The presence
of organic matter showed a profound influence on the
solubility of Fe in waterlogged soils. The uptake of
zinc or iron was reduced in combined soil application
as well as foliar of Zn and Fe but their uptake
increased when applied to soil individually indicating
antagonism between these two
micronutrients.Chandrakumar et a.l(2004) also
reported that application of these micronutrients
improved their uptake in rice when applied separately,
but when supplied simultaneously antagonized to
each other.
REFERENCES
Alvarez, J.M., Rio, M.I. and Obrador, A. (2001).
Lixiviation and extraction of zinc in a calcareous soil
treated with zinc chelated fertilizes, J. Agric. Food
Chem 44:3383-3387.
Babu, V.R., Surekha, K., Sree Devi, B., Shobha
Rani, N. and Subba Rao, L.V. (2005). Evaluation of
Basmati and Agromatic Short Grain Variety for Fe
and Zn Content in Rice Grain. National Symposium
on Basmati Rice Research: Current Trend and Future
Prospects, SVBPUA & T, Meerut, India, 6-7 Sept.
Cakmak, I. (2010). Enrichment of cereal grains with
zinc: Agronomic or genetic biofortification? Plant
and Soil 302, 1-17.
Chandrapala, A.G., Yakadri, M., Kumar, R.M.
and Raj, G.B. (2010). Establishment, Zn and S
application in rice, Indian Journal of Agronomy, 55:
3, 171-176.
Das, Debiprasad, Patro, Hrusikesh, Tiwari,
Ramesh C. and Shahid, Mohammad (2010). Effect
of organic and inorganic sources of nitrogen on Fe,
Mn, Cu and Zn uptake and content of rice grain at
harvest and straw at different stages of rice (Oryza
sativa) crop growth. Advances in applied Sciences
Research, 1(3):36-49.
De, D. K., Pal, S.K., Ghos, M., Pal, A.K. and
Basak, S. (2002). Evaluation of aromatic rice
cultivars in foot hill zones of West Bengal. Indian
Journal of Agricultural Sciences, 72 (2): 379-382.
FAO/WHO/IAEA (1999). Human Vitamins and
Mineral requirement report of a joint FAO/WHO
expert consultation-Bangkok, Thailand, FAO, Rome,
Chapter 16, Zinc pp. 257-270.
Fernandez, V., Ebert, G. and Winkelmann G. (2005). The use of microbial siderophores for foliar
iron application studies, Plant and Soil, In press.
Gangaiah, B. and Rajendra P. (1999). Response of
scented rice (Oryza Sativa) to fertilizers, Indian J.
Agron., 44(2):294-296.
Graham, R.D. Senadhira, D. and Ortiz-
Monasterio, I. A. (997). strategy for breeding staple-
food crops with high micro-nutrient density. Soil Sci.
Plant Nutr. 43, 1153-1157.
Gupta, S., and Handore, K. (2009). Direct and
residual effect of zinc and zinc amended organic
manures on the zinc nutrition of field crop.
International Journal of Agriculture Sciences, ISSN:
0975-3710 vol issue 2. 1, pp., 26-29.
Jana, P.K., Fhatk, R., Sounda, G., Ghosh, R.K.
and Bandyopadhyay, P. (2010). Letrite soils of west
Bengal. Indian Agriculturist, 53: ¾, 129-132, 7 ref.
Jackson, M. L. (1973). Soil chemical analysis
.Perntice Hall of India Pvt. Ltd., New Delhi, p. 183.
Kalyanasundaram, D. and Surendra Kumar, P.S. (2003). Integrated nutrient management in hybrid rice
ADTRH-1. Advances in plant Science. 16 (1):171-
175.
L’vov, B.V. (2005). Fifty years of atomic absorption
spectrometry, J. Anal. Chem., 60: 382–392.
Mandal, L., Maiti, D. and Bandyopathyay, P. (2009). Response of zinc in transplanted rice under
integrated nutrient management in New alluvival
Zone of west Bengal. Oryza vol:2 46.
Naik, S.K. and Das, D.K. (2008). Relative
performance of chelated zinc and zinc sulphate for
lowland rice (Oryza sativa L.) Nutrcycle agrocwsyst
21:219-227.
Nestal, P., Bouis, H.E., Meenakshi, J. V. and
Pfeiffer, W. (2006). Bio-fortification of staple food
crops. Journal of Nutrition 136:1064-1067.
Pearson, J.N. and Regnel, Z. (1995). Uptake and
distribution of 65
Zn and 54
Mn in wheat grown at
sufficient and deficient levels of Zn and Mn during
vegetavie growth J. Exp. Bot., 46, 833-839.
Rattan, R.K., Dutta, S.P., Sharma, H. and Katyal,
J.C. (1998). Zinc in Indian Agriculture a look
forward. Fertilizer Manures. 42 (12) : 75-89.
Sahu, M., Mandal, S.S., Acharya, D. and Sahu, S. (2007). Effect of integrated nutrient management on
productivity and quality of basmati rice (Oryza sativa
L.). Oryza, 44 (2): 125-129.
Sarangi, S.K., Sharma, H.C., Singh, K., Singh, P.,
Singh, C.S. and Singh K.K. (2006). Studies on the
mode of iron application and growth regulators on the
performance of direct seeded upland rice (oryza
sativa L.) varieties under rainfed condition Ann.
Agric. Res. New series Vol. 217 (3):13-219.
Singh,V. and Ram, N. (2010). Effect of 25 years of
continuous fertilizer use on response to applied
nutrients and uptake of micronutrients by rice-wheat-
JOURNAL OF PLANT DEVELOPMENT SCIENCES VOL. 10 (9) 497
cowpea system. Cereal Research Communications
33:2/3 589-594.
Sperotto, R.A., Boff, T., Duarte, G.L., Santos, L.S.,
Grusak, M.A. and Fett, J.P. (2010). Identification of
putative target genes to manipulate Fe and Zn
concentrations in rice grains. Journal of plant
physiology, 167: 17, 1500-1506.
Srivastava, V.K., Kumar, Vipin, Singh, S.P.,
Singh, R.N., Ram, U. S. and Ram (2008). Effect of
various fertility levels and organic manures on yield
and nutrient uptake of hybrid rice and its residual
effect on wheat. Environment & Ecology 26(4): 1477-
1480.
Subiah, B. V. and Asija, G. L. (1973). A rapid
procedure for estimation of available nitrogen in
soils. Current science 28 (8) :259-260.
Tiwari, K. N. (2002). Rice production and nutrient
management. Better Crops International, Vol. 16, pp-
18-22.
Takaki, H. and Kushizaki, M. (1970).
Accumulation of tryptophan and tryptamine in zinc
deficient maize seedlings. Plant and Cell Physiol.
11:793-804.
Verma T.S. and Tripathi, B.R. (1983). Zinc and
iron interaction in submerged paddy, plant and soil
72, 107-116.
Welch, R.M. and Graham, R.D. (1999). A new
paradigm for world agriculture: Meeting human
needs, productive, unsustainable, nutritious. Field
Crops Res. 60,1-10.

498 UMA SHANKER RAM AND V.K. SRIVASTAVA
*Corresponding Author
________________________________________________ Journal of Plant Development Sciences Vol. 10 (9) : 499-504. 2018
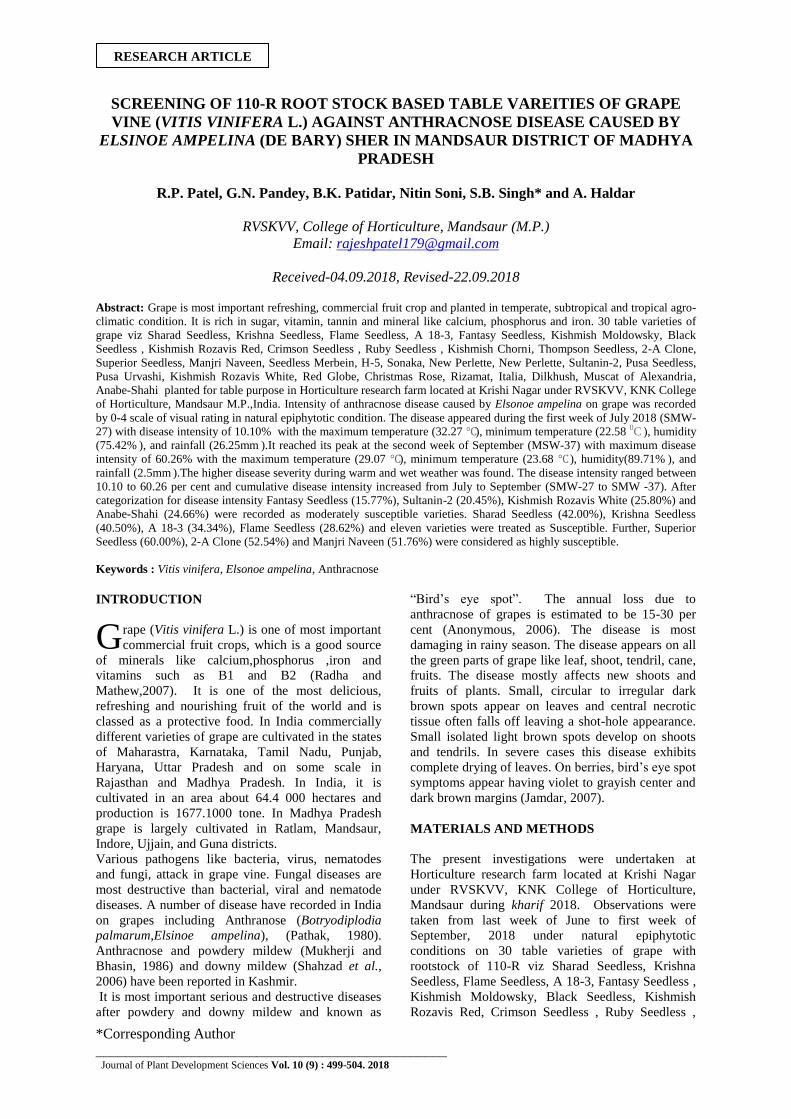
SCREENING OF 110-R ROOT STOCK BASED TABLE VAREITIES OF GRAPE
VINE (VITIS VINIFERA L.) AGAINST ANTHRACNOSE DISEASE CAUSED BY
ELSINOE AMPELINA (DE BARY) SHER IN MANDSAUR DISTRICT OF MADHYA
PRADESH
R.P. Patel, G.N. Pandey, B.K. Patidar, Nitin Soni, S.B. Singh* and A. Haldar
RVSKVV, College of Horticulture, Mandsaur (M.P.)
Email: [email protected]
Received-04.09.2018, Revised-22.09.2018 Abstract: Grape is most important refreshing, commercial fruit crop and planted in temperate, subtropical and tropical agro-
climatic condition. It is rich in sugar, vitamin, tannin and mineral like calcium, phosphorus and iron. 30 table varieties of
grape viz Sharad Seedless, Krishna Seedless, Flame Seedless, A 18-3, Fantasy Seedless, Kishmish Moldowsky, Black
Seedless , Kishmish Rozavis Red, Crimson Seedless , Ruby Seedless , Kishmish Chorni, Thompson Seedless, 2-A Clone,
Superior Seedless, Manjri Naveen, Seedless Merbein, H-5, Sonaka, New Perlette, New Perlette, Sultanin-2, Pusa Seedless,
Pusa Urvashi, Kishmish Rozavis White, Red Globe, Christmas Rose, Rizamat, Italia, Dilkhush, Muscat of Alexandria,
Anabe-Shahi planted for table purpose in Horticulture research farm located at Krishi Nagar under RVSKVV, KNK College
of Horticulture, Mandsaur M.P.,India. Intensity of anthracnose disease caused by Elsonoe ampelina on grape was recorded
by 0-4 scale of visual rating in natural epiphytotic condition. The disease appeared during the first week of July 2018 (SMW-
27) with disease intensity of 10.10% with the maximum temperature (32.27 ℃), minimum temperature (22.58 0C ), humidity
(75.42% ), and rainfall (26.25mm ).It reached its peak at the second week of September (MSW-37) with maximum disease
intensity of 60.26% with the maximum temperature (29.07 ℃), minimum temperature (23.68 ℃ ), humidity(89.71% ), and
rainfall (2.5mm ).The higher disease severity during warm and wet weather was found. The disease intensity ranged between
10.10 to 60.26 per cent and cumulative disease intensity increased from July to September (SMW-27 to SMW -37). After
categorization for disease intensity Fantasy Seedless (15.77%), Sultanin-2 (20.45%), Kishmish Rozavis White (25.80%) and
Anabe-Shahi (24.66%) were recorded as moderately susceptible varieties. Sharad Seedless (42.00%), Krishna Seedless
(40.50%), A 18-3 (34.34%), Flame Seedless (28.62%) and eleven varieties were treated as Susceptible. Further, Superior
Seedless (60.00%), 2-A Clone (52.54%) and Manjri Naveen (51.76%) were considered as highly susceptible.
Keywords : Vitis vinifera, Elsonoe ampelina, Anthracnose
INTRODUCTION
rape (Vitis vinifera L.) is one of most important
commercial fruit crops, which is a good source
of minerals like calcium,phosphorus ,iron and
vitamins such as B1 and B2 (Radha and
Mathew,2007). It is one of the most delicious,
refreshing and nourishing fruit of the world and is
classed as a protective food. In India commercially
different varieties of grape are cultivated in the states
of Maharastra, Karnataka, Tamil Nadu, Punjab,
Haryana, Uttar Pradesh and on some scale in
Rajasthan and Madhya Pradesh. In India, it is
cultivated in an area about 64.4 000 hectares and
production is 1677.1000 tone. In Madhya Pradesh
grape is largely cultivated in Ratlam, Mandsaur,
Indore, Ujjain, and Guna districts.
Various pathogens like bacteria, virus, nematodes
and fungi, attack in grape vine. Fungal diseases are
most destructive than bacterial, viral and nematode
diseases. A number of disease have recorded in India
on grapes including Anthranose (Botryodiplodia
palmarum,Elsinoe ampelina), (Pathak, 1980).
Anthracnose and powdery mildew (Mukherji and
Bhasin, 1986) and downy mildew (Shahzad et al.,
2006) have been reported in Kashmir.
It is most important serious and destructive diseases
after powdery and downy mildew and known as
“Bird’s eye spot”. The annual loss due to
anthracnose of grapes is estimated to be 15-30 per
cent (Anonymous, 2006). The disease is most
damaging in rainy season. The disease appears on all
the green parts of grape like leaf, shoot, tendril, cane,
fruits. The disease mostly affects new shoots and
fruits of plants. Small, circular to irregular dark
brown spots appear on leaves and central necrotic
tissue often falls off leaving a shot-hole appearance.
Small isolated light brown spots develop on shoots
and tendrils. In severe cases this disease exhibits
complete drying of leaves. On berries, bird’s eye spot
symptoms appear having violet to grayish center and
dark brown margins (Jamdar, 2007).
MATERIALS AND METHODS
The present investigations were undertaken at
Horticulture research farm located at Krishi Nagar
under RVSKVV, KNK College of Horticulture,
Mandsaur during kharif 2018. Observations were
taken from last week of June to first week of
September, 2018 under natural epiphytotic
conditions on 30 table varieties of grape with
rootstock of 110-R viz Sharad Seedless, Krishna
Seedless, Flame Seedless, A 18-3, Fantasy Seedless ,
Kishmish Moldowsky, Black Seedless, Kishmish
Rozavis Red, Crimson Seedless , Ruby Seedless ,
G
RESEARCH ARTICLE
500 R.P. PATEL, G.N. PANDEY, B.K. PATIDAR, NITIN SONI, S.B. SINGH AND A. HALDAR
Kishmish Chorni, Thompson Seedless, 2-A Clone,
Superior Seedless, Manjri Naveen, Seedless
Merbein, H-5, Sonaka, New Perlette, New Perlette ,
Sultanin-2, Pusa Seedless, Pusa Urvashi , Kishmish
Rozavis White , Red Globe, Christmas Rose,
Rizamat, Italia, Dilkhush, Muscat of Alexandria and
Anabe-Shahi, were planted for table purpose. The
symptoms of size, shape, colour of lesions on leaves,
shoots, tendrils and berries was recorded. The disease
intensity was recorded by visual observations using
0-4 scale (table-1) with slight modifications. The
table varieties were categorized as, tolerant (0.1-5.0
%), moderately tolerant (5.1-10.0%), moderately
susceptible (10.1-25.0%), susceptible (25.1-50.0%
and highly susceptible (50.1% and above) as
suggested by Chatta (1992).
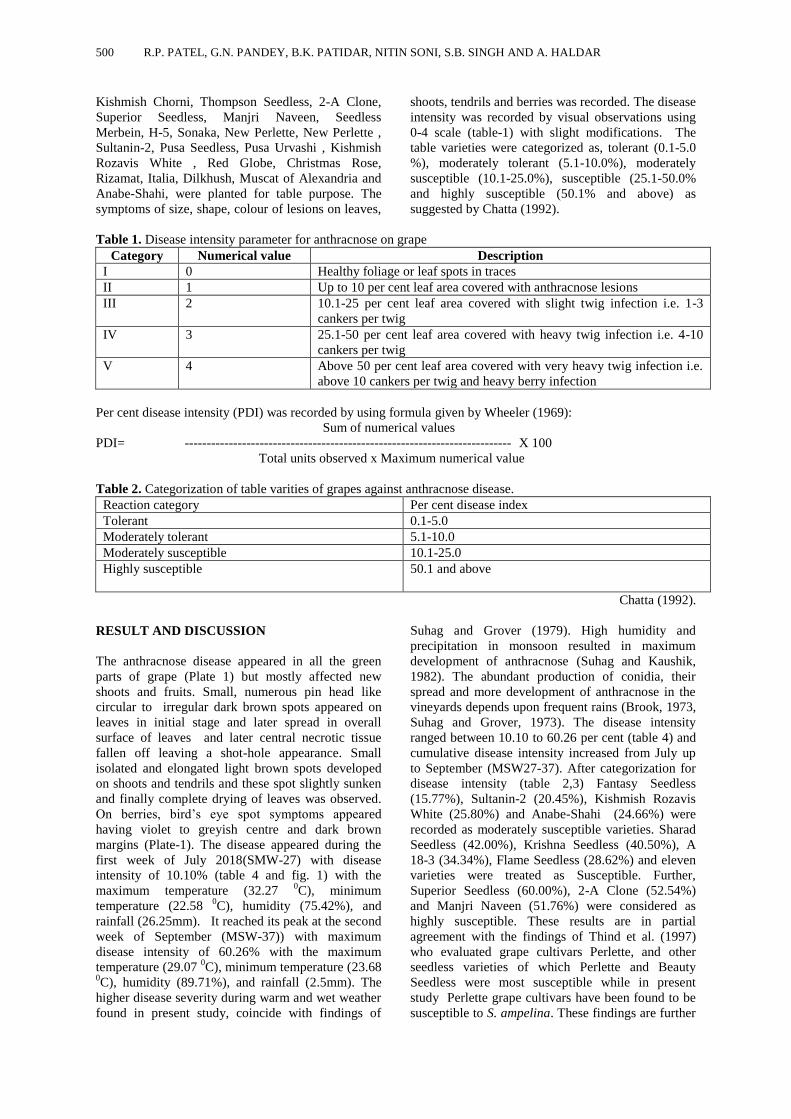
Table 1. Disease intensity parameter for anthracnose on grape
Category Numerical value Description
I 0 Healthy foliage or leaf spots in traces
II 1 Up to 10 per cent leaf area covered with anthracnose lesions
III 2 10.1-25 per cent leaf area covered with slight twig infection i.e. 1-3
cankers per twig
IV 3 25.1-50 per cent leaf area covered with heavy twig infection i.e. 4-10
cankers per twig
V 4 Above 50 per cent leaf area covered with very heavy twig infection i.e.
above 10 cankers per twig and heavy berry infection
Per cent disease intensity (PDI) was recorded by using formula given by Wheeler (1969):
Sum of numerical values
PDI= -------------------------------------------------------------------------- X 100
Total units observed x Maximum numerical value
Table 2. Categorization of table varities of grapes against anthracnose disease.
Reaction category Per cent disease index
Tolerant 0.1-5.0
Moderately tolerant 5.1-10.0
Moderately susceptible 10.1-25.0
Highly susceptible 50.1 and above
Chatta (1992).
RESULT AND DISCUSSION
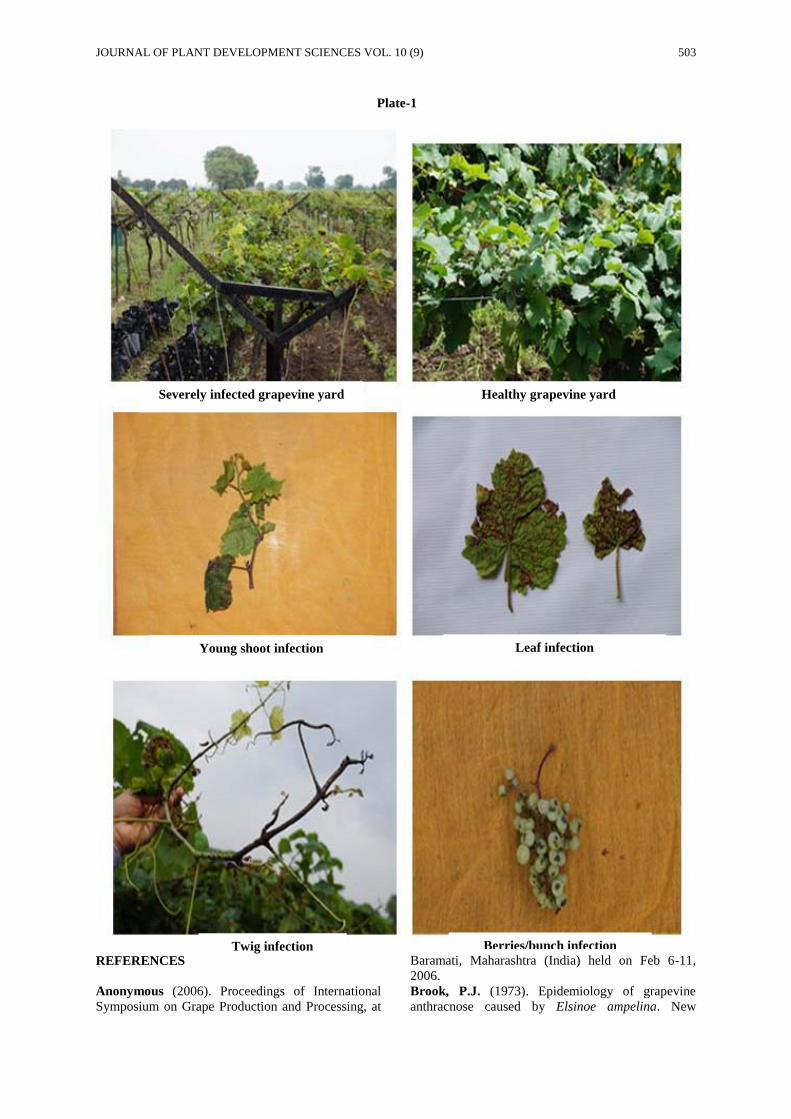
The anthracnose disease appeared in all the green
parts of grape (Plate 1) but mostly affected new
shoots and fruits. Small, numerous pin head like
circular to irregular dark brown spots appeared on
leaves in initial stage and later spread in overall
surface of leaves and later central necrotic tissue
fallen off leaving a shot-hole appearance. Small
isolated and elongated light brown spots developed
on shoots and tendrils and these spot slightly sunken
and finally complete drying of leaves was observed.
On berries, bird’s eye spot symptoms appeared
having violet to greyish centre and dark brown
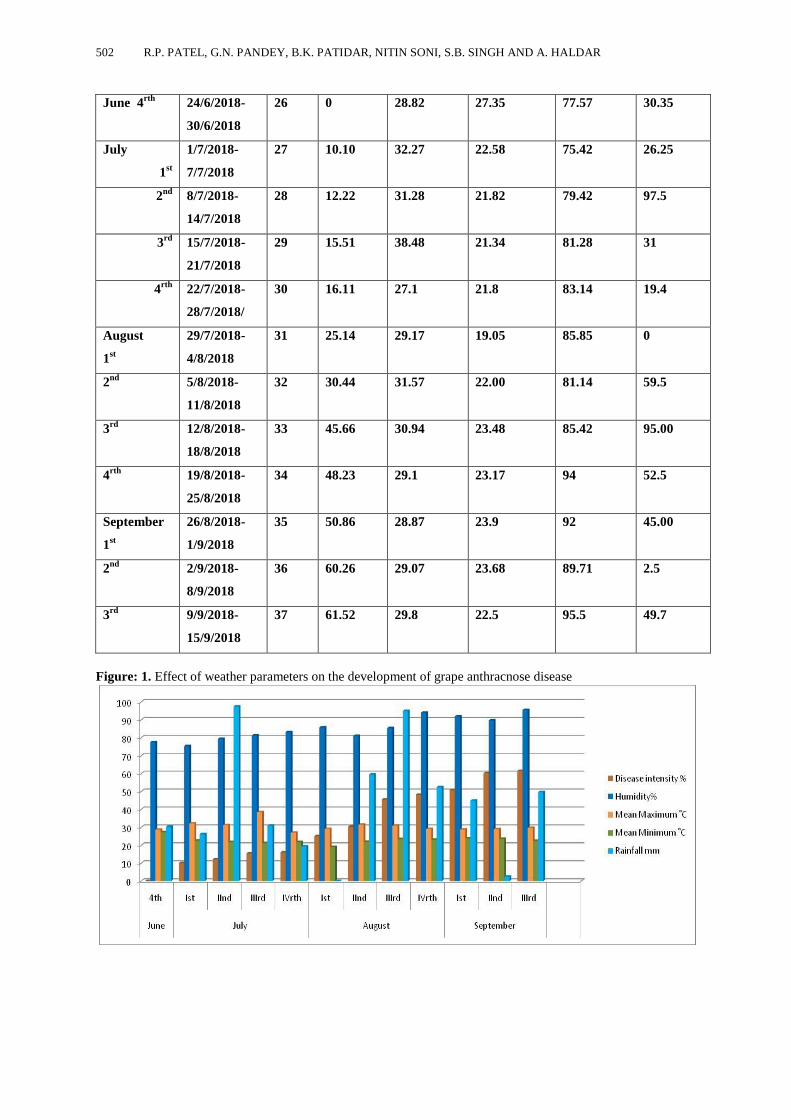
margins (Plate-1). The disease appeared during the
first week of July 2018(SMW-27) with disease
intensity of 10.10% (table 4 and fig. 1) with the
maximum temperature (32.27 0C), minimum
temperature (22.58 0C), humidity (75.42%), and
rainfall (26.25mm). It reached its peak at the second
week of September (MSW-37)) with maximum
disease intensity of 60.26% with the maximum
temperature (29.07 0C), minimum temperature (23.68
0C), humidity (89.71%), and rainfall (2.5mm). The
higher disease severity during warm and wet weather
found in present study, coincide with findings of
Suhag and Grover (1979). High humidity and
precipitation in monsoon resulted in maximum
development of anthracnose (Suhag and Kaushik,
1982). The abundant production of conidia, their
spread and more development of anthracnose in the
vineyards depends upon frequent rains (Brook, 1973,
Suhag and Grover, 1973). The disease intensity
ranged between 10.10 to 60.26 per cent (table 4) and
cumulative disease intensity increased from July up
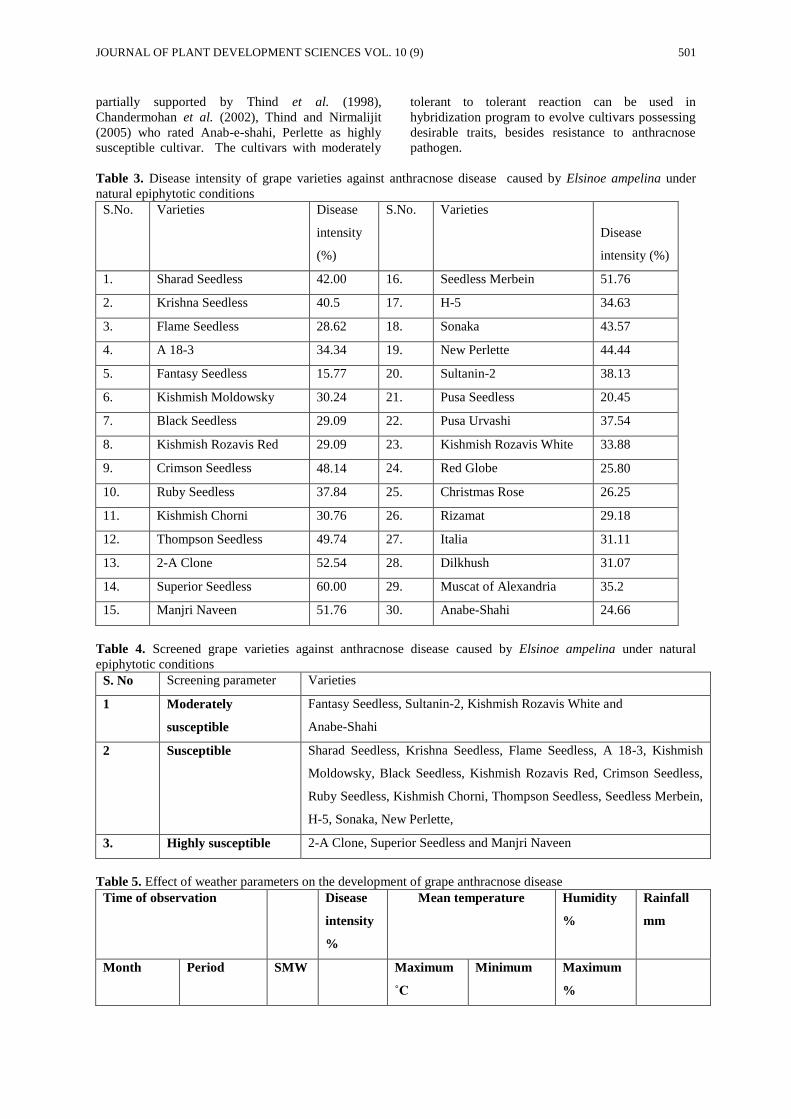
to September (MSW27-37). After categorization for
disease intensity (table 2,3) Fantasy Seedless
(15.77%), Sultanin-2 (20.45%), Kishmish Rozavis
White (25.80%) and Anabe-Shahi (24.66%) were
recorded as moderately susceptible varieties. Sharad
Seedless (42.00%), Krishna Seedless (40.50%), A
18-3 (34.34%), Flame Seedless (28.62%) and eleven
varieties were treated as Susceptible. Further,
Superior Seedless (60.00%), 2-A Clone (52.54%)
and Manjri Naveen (51.76%) were considered as
highly susceptible. These results are in partial
agreement with the findings of Thind et al. (1997)
who evaluated grape cultivars Perlette, and other
seedless varieties of which Perlette and Beauty
Seedless were most susceptible while in present
study Perlette grape cultivars have been found to be
susceptible to S. ampelina. These findings are further
JOURNAL OF PLANT DEVELOPMENT SCIENCES VOL. 10 (9) 501
partially supported by Thind et al. (1998),
Chandermohan et al. (2002), Thind and Nirmalijit
(2005) who rated Anab-e-shahi, Perlette as highly
susceptible cultivar. The cultivars with moderately
tolerant to tolerant reaction can be used in
hybridization program to evolve cultivars possessing
desirable traits, besides resistance to anthracnose
pathogen.
Table 3. Disease intensity of grape varieties against anthracnose disease caused by Elsinoe ampelina under
natural epiphytotic conditions
S.No. Varieties Disease
intensity
(%)
S.No. Varieties
Disease
intensity (%)
1. Sharad Seedless 42.00 16. Seedless Merbein 51.76
2. Krishna Seedless 40.5 17. H-5 34.63
3. Flame Seedless 28.62 18. Sonaka 43.57
4. A 18-3 34.34 19. New Perlette 44.44
5. Fantasy Seedless 15.77 20. Sultanin-2 38.13
6. Kishmish Moldowsky 30.24 21. Pusa Seedless 20.45
7. Black Seedless 29.09 22. Pusa Urvashi 37.54
8. Kishmish Rozavis Red 29.09 23. Kishmish Rozavis White 33.88
9. Crimson Seedless 48.14 24. Red Globe 25.80
10. Ruby Seedless 37.84 25. Christmas Rose 26.25
11. Kishmish Chorni 30.76 26. Rizamat 29.18
12. Thompson Seedless 49.74 27. Italia 31.11
13. 2-A Clone 52.54 28. Dilkhush 31.07
14. Superior Seedless 60.00 29. Muscat of Alexandria 35.2
15. Manjri Naveen 51.76 30. Anabe-Shahi 24.66
Table 4. Screened grape varieties against anthracnose disease caused by Elsinoe ampelina under natural
epiphytotic conditions
S. No Screening parameter Varieties
1 Moderately
susceptible
Fantasy Seedless, Sultanin-2, Kishmish Rozavis White and
Anabe-Shahi
2 Susceptible Sharad Seedless, Krishna Seedless, Flame Seedless, A 18-3, Kishmish
Moldowsky, Black Seedless, Kishmish Rozavis Red, Crimson Seedless,
Ruby Seedless, Kishmish Chorni, Thompson Seedless, Seedless Merbein,
H-5, Sonaka, New Perlette,
3. Highly susceptible 2-A Clone, Superior Seedless and Manjri Naveen
Table 5. Effect of weather parameters on the development of grape anthracnose disease
Time of observation Disease
intensity
%
Mean temperature Humidity
%
Rainfall
mm
Month
Period SMW Maximum
˚C
Minimum Maximum
%
502 R.P. PATEL, G.N. PANDEY, B.K. PATIDAR, NITIN SONI, S.B. SINGH AND A. HALDAR
June 4rth
24/6/2018-
30/6/2018
26 0 28.82 27.35 77.57 30.35
July
1st
1/7/2018-
7/7/2018
27 10.10 32.27 22.58 75.42 26.25
2nd
8/7/2018-
14/7/2018
28 12.22 31.28 21.82 79.42 97.5
3rd
15/7/2018-
21/7/2018
29 15.51 38.48 21.34 81.28 31
4rth
22/7/2018-
28/7/2018/
30 16.11 27.1 21.8 83.14 19.4
August
1st
29/7/2018-
4/8/2018
31 25.14 29.17 19.05 85.85 0
2nd
5/8/2018-
11/8/2018
32 30.44 31.57 22.00 81.14 59.5
3rd
12/8/2018-
18/8/2018
33 45.66 30.94 23.48 85.42 95.00
4rth
19/8/2018-
25/8/2018
34 48.23 29.1 23.17 94 52.5
September
1st
26/8/2018-
1/9/2018
35 50.86 28.87 23.9 92 45.00
2nd
2/9/2018-
8/9/2018
36 60.26 29.07 23.68 89.71 2.5
3rd
9/9/2018-
15/9/2018
37 61.52 29.8 22.5 95.5 49.7
Figure: 1. Effect of weather parameters on the development of grape anthracnose disease
JOURNAL OF PLANT DEVELOPMENT SCIENCES VOL. 10 (9) 503
REFERENCES
Anonymous (2006). Proceedings of International
Symposium on Grape Production and Processing, at
Baramati, Maharashtra (India) held on Feb 6-11,
2006.
Brook, P.J. (1973). Epidemiology of grapevine
anthracnose caused by Elsinoe ampelina. New
Plate-1
Severely infected grapevine yard Healthy grapevine yard
Young shoot infection Leaf infection
Twig infection Berries/bunch infection
504 R.P. PATEL, G.N. PANDEY, B.K. PATIDAR, NITIN SONI, S.B. SINGH AND A. HALDAR
Zealand Journal of Agricultural Research 16 : 333-
342.
Chandermohan, Singh, J. and Thind, T.S. (2002).
Prevalence of grape anthracnose and carbendazim
resistance in Gloeosporium ampelophagum in
Punjab. Plant Disease Research 17 : 176-177.
Chatta, S.K. (1992). Biology, perpetuation and
control of grape vine anthracnose caused by
Sphaceloma ampelinum Shear Elsinoe ampelina
Shear). M.Sc. Thesis submitted to Sher-e-Kashmir
University of Agricultural Sciences and Technology,
Jammu and Kashmir, Shalimar, Srinagar, p. 33.
Jamadar, M.M. (2007). Etiology, Epidemiology and
Management of Anthracnose of Grapevine. Ph.D.
Thesis submitted to University of Agricultural
Sciences, Dharwad, Karnatka.
Mukherji, K.G. and Bhasin, J. (1986). Vitis: Plant
Disease of India. A Source Book, pp. 258-259.
Pathak, V. N. (1980). Grape (Vitis vinifera L.). In:
Diseases of Fruit Crops, Oxford and IBH Publishing
Company. New Delhi, p.390.
Radha, T. and Mathew, L. (2007). Fruit Crops.
Third Edition. New Delhi publishing Agency, p. 419.
Shahzad Ahmad, Nisar Ahmad and Ashraf, S. (2006). Occurrence of Downy mildew of grapes
(Plasmopara viticola)-a new report from J and K.
Applied Biological Research 8 : 44-46.
Suhag, L.S. and Grover, R.K. (1973). Anthracnose
of grapevine can be controlled. Indian Farming 23 :
22-24.
Suhag, L. S. and Kaushik, J. C. (1982). Studies on
four pathogenic fungi on grapevine in North India.
Indian Phytopathology 35: 344-346.
Thind, S.K. and Nirmalijit, K. (2005). Status of
grape anthracnose in Punjab. Journal of Mycology
and Plant Pathology 35(1) :18-20.
Thind, S.K., Monga, P.K., Kaur, N. and Arora,
J.K. (1998). Effect of anthacnose disease on fruit
quality of grapes. Journal of Mycology and Plant
Pathology 31 : 253-254.
Thind, S.K., Monga, P.K., Nirmalijit Kaur, P.K.
and Kumar, H. (1997). Evaluation of grape varieties
against anthracnose and its fungicidal control. Plant
Disease Research 12: 99-100.
*Corresponding Author
________________________________________________ Journal of Plant Development Sciences Vol. 10(9) : 505-509. 2018
A STUDY ON FINANCIAL RATIO ANALYSIS OF SRI VENKATESWARA CO-
OPERATIVE SUGAR LTD., RENIGUNTA, CHITTOOR DISTRICT.
K. Shiny Israel* and Y. Prabhavathi1
Department of Agribusiness Management, University of Agricultural Sciences,
Dharwad (Karnataka), India 1Department of Agribusiness Management, ANGRAU, (Andhra Pradesh), India
Received-06.09.2018, Revised-24.09.2018 Abstract: Sugarcane is an important commercial crop cultivated in about 120 countries in the world. Sugarcane is cultivated
in an area of 42.40million hectares in the world. The total area under sugarcane cultivation is highest in Brazil (6.20 million
hectares) followed by India (5.01million hectare). Brazil is the biggest producer of sugar accounting for 41.4 per cent of the
world sugarcane production followed by India (17.7 per cent).The secondary data was collected fromthe sugar factory
records in the study area for the year of 2009-10 to 2013-14. The performance of sugar industry was examined by the
financial indicators. The results revealed that, ratios for period of five years were found to be positive and some years are
shown negative performance.The financial leverage of the factory over the study period reveals that financial risk of the firm
showed an increasing trend. An interest and principal repayment component was taken and analysis was made from 2009-10
to 2013-14. For a rupee of capital employed in fixed assets and current assets by the company, the sales revenue generated
by the company was highly fluctuating.
Keywords: Sugar factory, Financial indicators, Ratio analysis
INTRODUCTION
ugarcane is an important commercial crop
cultivated in about 120 countries in the world.
Analysis of financial indicators are the Current ratio,
current liabilities , Quick ratio, Debt ratio, Debt
Equity Ratio, Interest Coverage Ratio, Fixed charges
coverage ratio, Inventory Turnover ratio, Days of
Inventory Holding, Fixed Assets Turnover Ratio
Current Assets Turnover Ratio, Net Profit Margin,
Gross Profit Margin, Operating Expenses Ratio, Cost
of Goods Sold Ratio. Other Operating Expenses,
Ratio, Return on Total Assets, Return on Net Assets,
Return on Equity, fixed assets, current assets.
Financial analysis is the process of identifying the
financial strengths and weakness of the firm by
properly establishing relationships between the items
of balance sheet and profit and loss account. A more
rigorous analysis of financial position of the factory
was attempted by considering selected financial
ratios and examining their trend over the selected
years (2009-10 to 2013-14). For this purpose
solvency, liquidity, profitability and turn over aspects
of the factory were examined.
Objective of the study:To evaluate the growth and
performance in terms of ratio analysis.
METHODOLOGY
The data used for the study, it was based on the
secondary sources. The data on current liabilities,
and total assets of sugar industry were collected
fromSri Venkateswara co-operative sugar ltd,
Gajulamandyam, Renigunta, Chittoor District, Andhra
Pradeshfor the year 2009-10 to 2013-14.
Analytical tools
Financial indicators
To analysis of financial indicators are the current
assets, current liabilities, fixed assets, current assets
were employed.
RESULTS AND DISCUSSION
In this chapter an attempt is made to discuss the
results obtain from the study. The important findings
of this study are presented under following financial
indicators. Table 1 represents the liabilities of the
sugar factory in Sri Venkateswara co-operative sugar
Ltd, Gajulamandyam, Renigunta.The balance sheet of
the sugar factory for a period of five years that is
from 2009-10 to 2013-14 was analyzed. Various
parameters in the balance sheet were taken and ratio
analysis was made for the same period and results
were drawn.Current ratio and quick ratios of the
sugar factory from 2009-10 to 2013-14 was
calculated taking various parameters listed in the
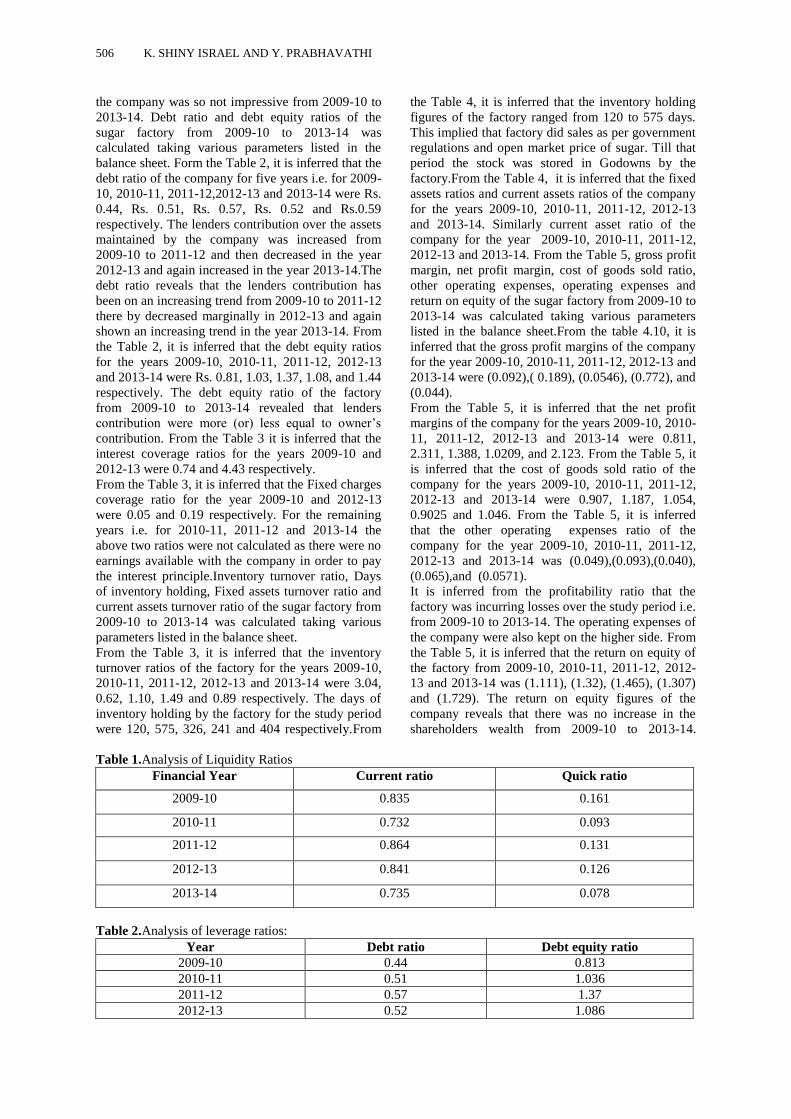
balance sheet.From the Table 1, it is inferred that the
current ratios of the factory for the years 2009-10,
2010-11, 2011-12, 2012-13 and 2013-14 were 0.83,
0.73, 0.86, 0.84 and 0.73 respectively. This infers
that the current obligations were higher compared to
the current assets maintained by the company. From
the Table 1, it is inferred that the quick ratio of the
factory for the years 2009-10, 2010-11,2011-
12,2012-13 and 2013-14 were 0.16 ,0.09,0.13,0.12
and 0.07 respectively.The quick ratios figures
revealed that current assets other than inventory
maintained by the company in the form of levy
sugar, free sugarand molasses were quite negligible.
Due to more payables and poor receivables inventory
was lying ideal for more time. Hence the liquidity of
S
RESEARCH ARTICLE
506 K. SHINY ISRAEL AND Y. PRABHAVATHI
the company was so not impressive from 2009-10 to
2013-14. Debt ratio and debt equity ratios of the
sugar factory from 2009-10 to 2013-14 was
calculated taking various parameters listed in the
balance sheet. Form the Table 2, it is inferred that the
debt ratio of the company for five years i.e. for 2009-
10, 2010-11, 2011-12,2012-13 and 2013-14 were Rs.
0.44, Rs. 0.51, Rs. 0.57, Rs. 0.52 and Rs.0.59
respectively. The lenders contribution over the assets
maintained by the company was increased from
2009-10 to 2011-12 and then decreased in the year
2012-13 and again increased in the year 2013-14.The
debt ratio reveals that the lenders contribution has
been on an increasing trend from 2009-10 to 2011-12
there by decreased marginally in 2012-13 and again
shown an increasing trend in the year 2013-14. From
the Table 2, it is inferred that the debt equity ratios
for the years 2009-10, 2010-11, 2011-12, 2012-13
and 2013-14 were Rs. 0.81, 1.03, 1.37, 1.08, and 1.44
respectively. The debt equity ratio of the factory
from 2009-10 to 2013-14 revealed that lenders
contribution were more (or) less equal to owner’s
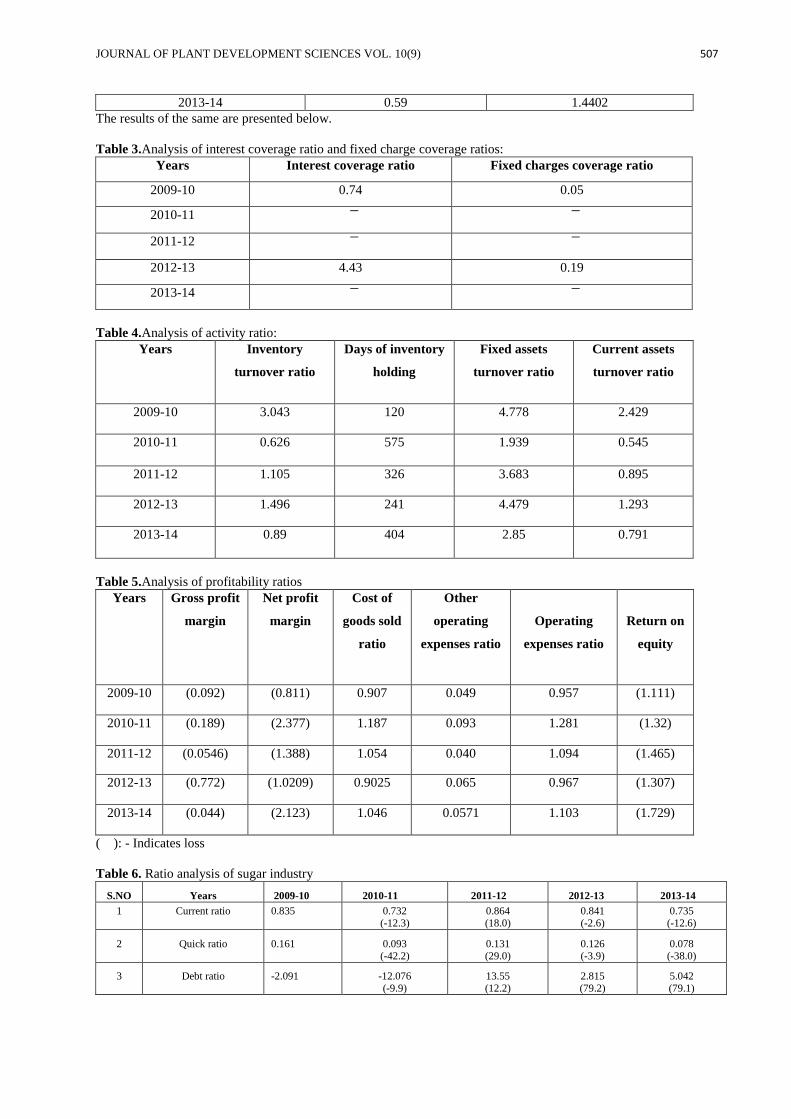
contribution. From the Table 3 it is inferred that the
interest coverage ratios for the years 2009-10 and
2012-13 were 0.74 and 4.43 respectively.
From the Table 3, it is inferred that the Fixed charges
coverage ratio for the year 2009-10 and 2012-13
were 0.05 and 0.19 respectively. For the remaining
years i.e. for 2010-11, 2011-12 and 2013-14 the
above two ratios were not calculated as there were no
earnings available with the company in order to pay
the interest principle.Inventory turnover ratio, Days
of inventory holding, Fixed assets turnover ratio and
current assets turnover ratio of the sugar factory from
2009-10 to 2013-14 was calculated taking various
parameters listed in the balance sheet.
From the Table 3, it is inferred that the inventory
turnover ratios of the factory for the years 2009-10,
2010-11, 2011-12, 2012-13 and 2013-14 were 3.04,
0.62, 1.10, 1.49 and 0.89 respectively. The days of
inventory holding by the factory for the study period
were 120, 575, 326, 241 and 404 respectively.From
the Table 4, it is inferred that the inventory holding
figures of the factory ranged from 120 to 575 days.
This implied that factory did sales as per government
regulations and open market price of sugar. Till that
period the stock was stored in Godowns by the
factory.From the Table 4, it is inferred that the fixed
assets ratios and current assets ratios of the company
for the years 2009-10, 2010-11, 2011-12, 2012-13
and 2013-14. Similarly current asset ratio of the
company for the year 2009-10, 2010-11, 2011-12,
2012-13 and 2013-14. From the Table 5, gross profit
margin, net profit margin, cost of goods sold ratio,
other operating expenses, operating expenses and
return on equity of the sugar factory from 2009-10 to
2013-14 was calculated taking various parameters
listed in the balance sheet.From the table 4.10, it is
inferred that the gross profit margins of the company
for the year 2009-10, 2010-11, 2011-12, 2012-13 and
2013-14 were (0.092),( 0.189), (0.0546), (0.772), and
(0.044).
From the Table 5, it is inferred that the net profit
margins of the company for the years 2009-10, 2010-
11, 2011-12, 2012-13 and 2013-14 were 0.811,
2.311, 1.388, 1.0209, and 2.123. From the Table 5, it
is inferred that the cost of goods sold ratio of the
company for the years 2009-10, 2010-11, 2011-12,
2012-13 and 2013-14 were 0.907, 1.187, 1.054,
0.9025 and 1.046. From the Table 5, it is inferred
that the other operating expenses ratio of the
company for the year 2009-10, 2010-11, 2011-12,
2012-13 and 2013-14 was (0.049),(0.093),(0.040),
(0.065),and (0.0571).
It is inferred from the profitability ratio that the
factory was incurring losses over the study period i.e.
from 2009-10 to 2013-14. The operating expenses of
the company were also kept on the higher side. From
the Table 5, it is inferred that the return on equity of
the factory from 2009-10, 2010-11, 2011-12, 2012-
13 and 2013-14 was (1.111), (1.32), (1.465), (1.307)
and (1.729). The return on equity figures of the
company reveals that there was no increase in the
shareholders wealth from 2009-10 to 2013-14.
Table 1.Analysis of Liquidity Ratios
Financial Year Current ratio Quick ratio
2009-10 0.835 0.161
2010-11 0.732 0.093
2011-12 0.864 0.131
2012-13 0.841 0.126
2013-14 0.735 0.078
Table 2.Analysis of leverage ratios:
Year Debt ratio Debt equity ratio
2009-10 0.44 0.813
2010-11 0.51 1.036
2011-12 0.57 1.37
2012-13 0.52 1.086
JOURNAL OF PLANT DEVELOPMENT SCIENCES VOL. 10(9) 507
2013-14 0.59 1.4402
The results of the same are presented below.
Table 3.Analysis of interest coverage ratio and fixed charge coverage ratios:
Years Interest coverage ratio Fixed charges coverage ratio
2009-10 0.74 0.05
2010-11 ͞ ͞
2011-12 ͞ ͞
2012-13 4.43 0.19
2013-14 ͞ ͞
Table 4.Analysis of activity ratio:
Years Inventory
turnover ratio
Days of inventory
holding
Fixed assets
turnover ratio
Current assets
turnover ratio
2009-10 3.043 120 4.778 2.429
2010-11 0.626 575 1.939 0.545
2011-12 1.105 326 3.683 0.895
2012-13 1.496 241 4.479 1.293
2013-14 0.89 404 2.85 0.791
Table 5.Analysis of profitability ratios
Years Gross profit
margin
Net profit
margin
Cost of
goods sold
ratio
Other
operating
expenses ratio
Operating
expenses ratio
Return on
equity
2009-10 (0.092) (0.811) 0.907 0.049 0.957 (1.111)
2010-11 (0.189) (2.377) 1.187 0.093 1.281 (1.32)
2011-12 (0.0546) (1.388) 1.054 0.040 1.094 (1.465)
2012-13 (0.772) (1.0209) 0.9025 0.065 0.967 (1.307)
2013-14 (0.044) (2.123) 1.046 0.0571 1.103 (1.729)
( ): - Indicates loss
Table 6. Ratio analysis of sugar industry
S.NO Years 2009-10 2010-11 2011-12 2012-13 2013-14
1
Current ratio
0.835
0.732 (-12.3)
0.864 (18.0)
0.841 (-2.6)
0.735 (-12.6)
2
Quick ratio
0.161
0.093 (-42.2)
0.131 (29.0)
0.126 (-3.9)
0.078 (-38.0)
3
Debt ratio
-2.091
-12.076
(-9.9)
13.55
(12.2)
2.815
(79.2)
5.042
(79.1)
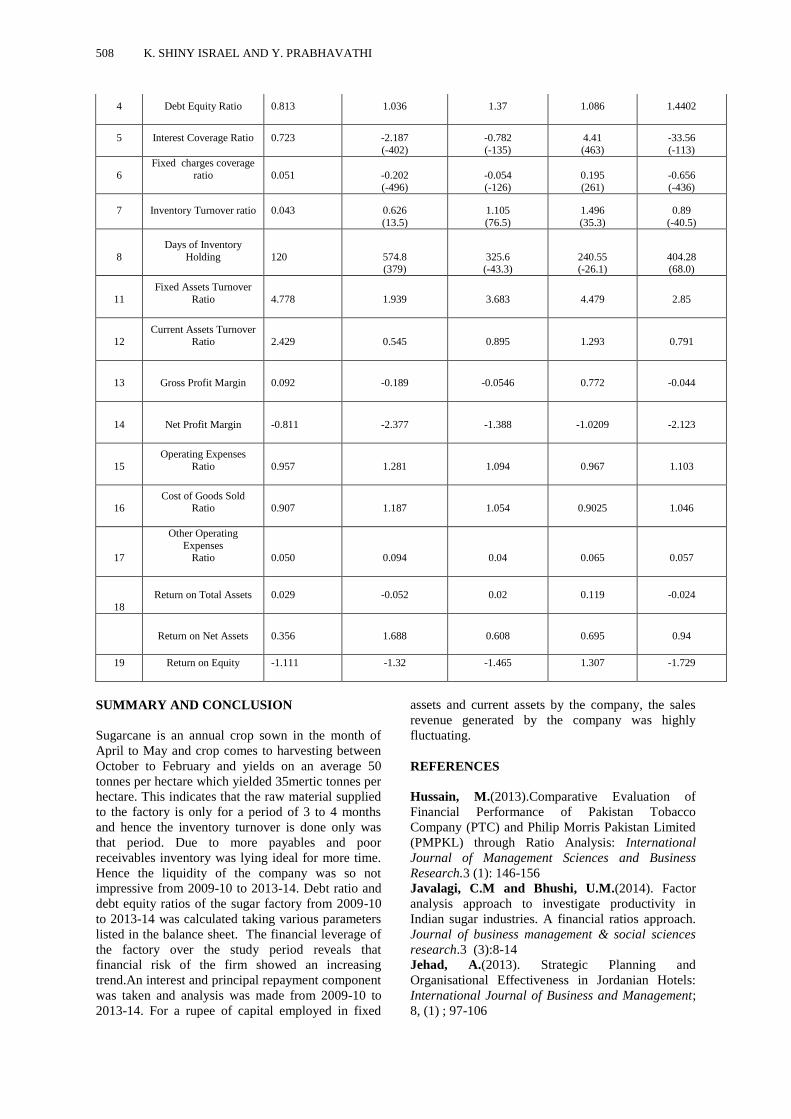
508 K. SHINY ISRAEL AND Y. PRABHAVATHI
4
Debt Equity Ratio
0.813
1.036
1.37
1.086
1.4402
5
Interest Coverage Ratio
0.723
-2.187
(-402)
-0.782
(-135)
4.41
(463)
-33.56
(-113)
6
Fixed charges coverage
ratio
0.051
-0.202 (-496)
-0.054 (-126)
0.195 (261)
-0.656 (-436)
7
Inventory Turnover ratio
0.043
0.626
(13.5)
1.105
(76.5)
1.496
(35.3)
0.89
(-40.5)
8
Days of Inventory
Holding
120
574.8 (379)
325.6 (-43.3)
240.55 (-26.1)
404.28 (68.0)
11
Fixed Assets Turnover
Ratio
4.778
1.939
3.683
4.479
2.85
12
Current Assets Turnover Ratio
2.429
0.545
0.895
1.293
0.791
13
Gross Profit Margin
0.092
-0.189
-0.0546
0.772
-0.044
14
Net Profit Margin
-0.811
-2.377
-1.388
-1.0209
-2.123
15
Operating Expenses
Ratio
0.957
1.281
1.094
0.967
1.103
16
Cost of Goods Sold Ratio
0.907
1.187
1.054
0.9025
1.046
17
Other Operating
Expenses
Ratio
0.050
0.094
0.04
0.065
0.057
18
Return on Total Assets
0.029
-0.052
0.02
0.119
-0.024
Return on Net Assets
0.356
1.688
0.608
0.695
0.94
19
Return on Equity
-1.111
-1.32
-1.465
1.307
-1.729
SUMMARY AND CONCLUSION
Sugarcane is an annual crop sown in the month of
April to May and crop comes to harvesting between
October to February and yields on an average 50
tonnes per hectare which yielded 35mertic tonnes per
hectare. This indicates that the raw material supplied
to the factory is only for a period of 3 to 4 months
and hence the inventory turnover is done only was
that period. Due to more payables and poor
receivables inventory was lying ideal for more time.
Hence the liquidity of the company was so not
impressive from 2009-10 to 2013-14. Debt ratio and
debt equity ratios of the sugar factory from 2009-10
to 2013-14 was calculated taking various parameters
listed in the balance sheet. The financial leverage of
the factory over the study period reveals that
financial risk of the firm showed an increasing
trend.An interest and principal repayment component
was taken and analysis was made from 2009-10 to
2013-14. For a rupee of capital employed in fixed
assets and current assets by the company, the sales
revenue generated by the company was highly
fluctuating.
REFERENCES
Hussain, M.(2013).Comparative Evaluation of
Financial Performance of Pakistan Tobacco
Company (PTC) and Philip Morris Pakistan Limited
(PMPKL) through Ratio Analysis: International
Journal of Management Sciences and Business
Research.3 (1): 146-156
Javalagi, C.M and Bhushi, U.M.(2014). Factor
analysis approach to investigate productivity in
Indian sugar industries. A financial ratios approach.
Journal of business management & social sciences
research.3 (3):8-14
Jehad, A.(2013). Strategic Planning and
Organisational Effectiveness in Jordanian Hotels:
International Journal of Business and Management;
8, (1) ; 97-106

JOURNAL OF PLANT DEVELOPMENT SCIENCES VOL. 10(9) 509
Khatun,S., Alam, M.M., Rahman, K.M.S and
Alam, M.M.G.(2011). An economic study on sugar
cane pricing and its impact on sugar production in
Bangladesh. Pakistan Sugar Journal. 26 (4):1-31.
Nadoni,N.N.(2013). Performance Appraisal of Co-
operative and Private Sugar Factory in Belgaum
District- An Economic Analysis: Global Journal of
Management and Business Studies.3(10):1197-1204.

510 K. SHINY ISRAEL AND Y. PRABHAVATHI
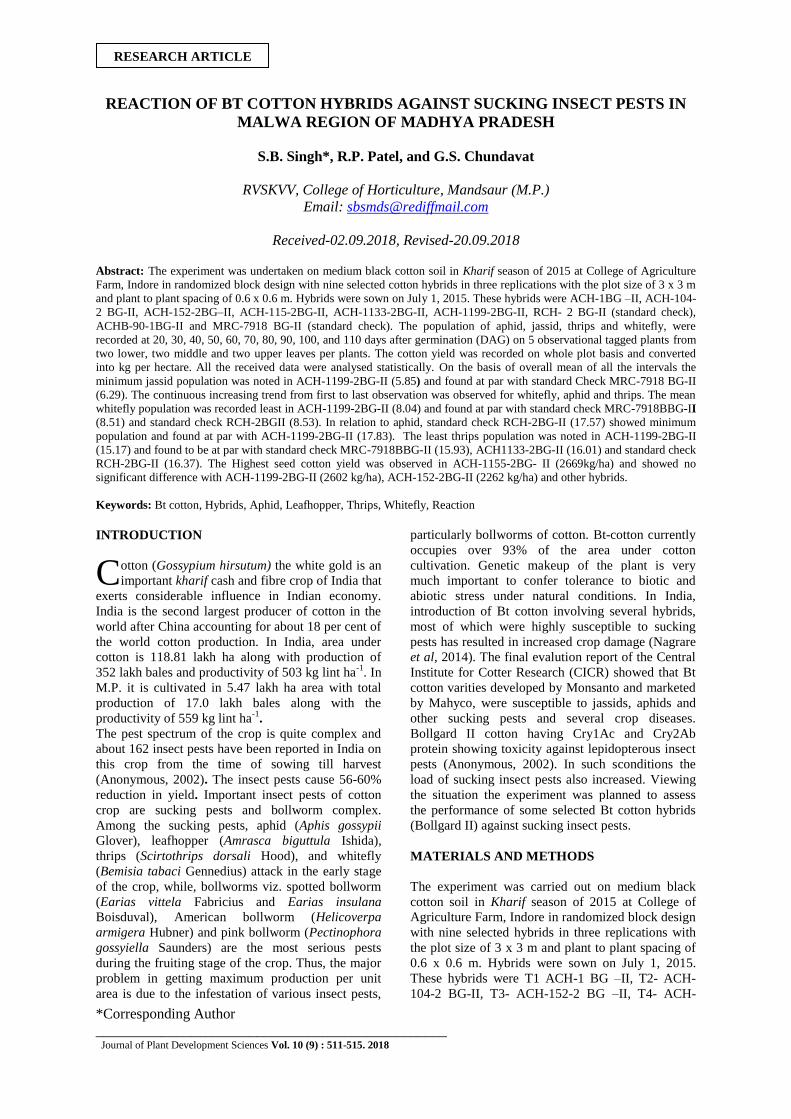
*Corresponding Author
________________________________________________ Journal of Plant Development Sciences Vol. 10 (9) : 511-515. 2018
REACTION OF BT COTTON HYBRIDS AGAINST SUCKING INSECT PESTS IN
MALWA REGION OF MADHYA PRADESH
S.B. Singh*, R.P. Patel, and G.S. Chundavat
RVSKVV, College of Horticulture, Mandsaur (M.P.)
Email: [email protected]
Received-02.09.2018, Revised-20.09.2018
Abstract: The experiment was undertaken on medium black cotton soil in Kharif season of 2015 at College of Agriculture
Farm, Indore in randomized block design with nine selected cotton hybrids in three replications with the plot size of 3 x 3 m
and plant to plant spacing of 0.6 x 0.6 m. Hybrids were sown on July 1, 2015. These hybrids were ACH-1BG –II, ACH-104-
2 BG-II, ACH-152-2BG–II, ACH-115-2BG-II, ACH-1133-2BG-II, ACH-1199-2BG-II, RCH- 2 BG-II (standard check),
ACHB-90-1BG-II and MRC-7918 BG-II (standard check). The population of aphid, jassid, thrips and whitefly, were
recorded at 20, 30, 40, 50, 60, 70, 80, 90, 100, and 110 days after germination (DAG) on 5 observational tagged plants from
two lower, two middle and two upper leaves per plants. The cotton yield was recorded on whole plot basis and converted
into kg per hectare. All the received data were analysed statistically. On the basis of overall mean of all the intervals the
minimum jassid population was noted in ACH-1199-2BG-II (5.85) and found at par with standard Check MRC-7918 BG-II
(6.29). The continuous increasing trend from first to last observation was observed for whitefly, aphid and thrips. The mean
whitefly population was recorded least in ACH-1199-2BG-II (8.04) and found at par with standard check MRC-7918BBG-II
(8.51) and standard check RCH-2BGII (8.53). In relation to aphid, standard check RCH-2BG-II (17.57) showed minimum
population and found at par with ACH-1199-2BG-II (17.83). The least thrips population was noted in ACH-1199-2BG-II
(15.17) and found to be at par with standard check MRC-7918BBG-II (15.93), ACH1133-2BG-II (16.01) and standard check
RCH-2BG-II (16.37). The Highest seed cotton yield was observed in ACH-1155-2BG- II (2669kg/ha) and showed no
significant difference with ACH-1199-2BG-II (2602 kg/ha), ACH-152-2BG-II (2262 kg/ha) and other hybrids.
Keywords: Bt cotton, Hybrids, Aphid, Leafhopper, Thrips, Whitefly, Reaction
INTRODUCTION
otton (Gossypium hirsutum) the white gold is an
important kharif cash and fibre crop of India that
exerts considerable influence in Indian economy.
India is the second largest producer of cotton in the
world after China accounting for about 18 per cent of
the world cotton production. In India, area under
cotton is 118.81 lakh ha along with production of
352 lakh bales and productivity of 503 kg lint ha-1
. In
M.P. it is cultivated in 5.47 lakh ha area with total
production of 17.0 lakh bales along with the
productivity of 559 kg lint ha-1
.
The pest spectrum of the crop is quite complex and
about 162 insect pests have been reported in India on
this crop from the time of sowing till harvest
(Anonymous, 2002). The insect pests cause 56-60%
reduction in yield. Important insect pests of cotton
crop are sucking pests and bollworm complex.
Among the sucking pests, aphid (Aphis gossypii
Glover), leafhopper (Amrasca biguttula Ishida),
thrips (Scirtothrips dorsali Hood), and whitefly
(Bemisia tabaci Gennedius) attack in the early stage
of the crop, while, bollworms viz. spotted bollworm
(Earias vittela Fabricius and Earias insulana
Boisduval), American bollworm (Helicoverpa
armigera Hubner) and pink bollworm (Pectinophora
gossyiella Saunders) are the most serious pests
during the fruiting stage of the crop. Thus, the major
problem in getting maximum production per unit
area is due to the infestation of various insect pests,
particularly bollworms of cotton. Bt-cotton currently
occupies over 93% of the area under cotton
cultivation. Genetic makeup of the plant is very
much important to confer tolerance to biotic and
abiotic stress under natural conditions. In India,
introduction of Bt cotton involving several hybrids,
most of which were highly susceptible to sucking
pests has resulted in increased crop damage (Nagrare
et al, 2014). The final evalution report of the Central
Institute for Cotter Research (CICR) showed that Bt
cotton varities developed by Monsanto and marketed
by Mahyco, were susceptible to jassids, aphids and
other sucking pests and several crop diseases.
Bollgard II cotton having Cry1Ac and Cry2Ab
protein showing toxicity against lepidopterous insect
pests (Anonymous, 2002). In such sconditions the
load of sucking insect pests also increased. Viewing
the situation the experiment was planned to assess
the performance of some selected Bt cotton hybrids
(Bollgard II) against sucking insect pests.
MATERIALS AND METHODS
The experiment was carried out on medium black
cotton soil in Kharif season of 2015 at College of
Agriculture Farm, Indore in randomized block design
with nine selected hybrids in three replications with
the plot size of 3 x 3 m and plant to plant spacing of
0.6 x 0.6 m. Hybrids were sown on July 1, 2015.
These hybrids were T1 ACH-1 BG –II, T2- ACH-
104-2 BG-II, T3- ACH-152-2 BG –II, T4- ACH-
C
RESEARCH ARTICLE
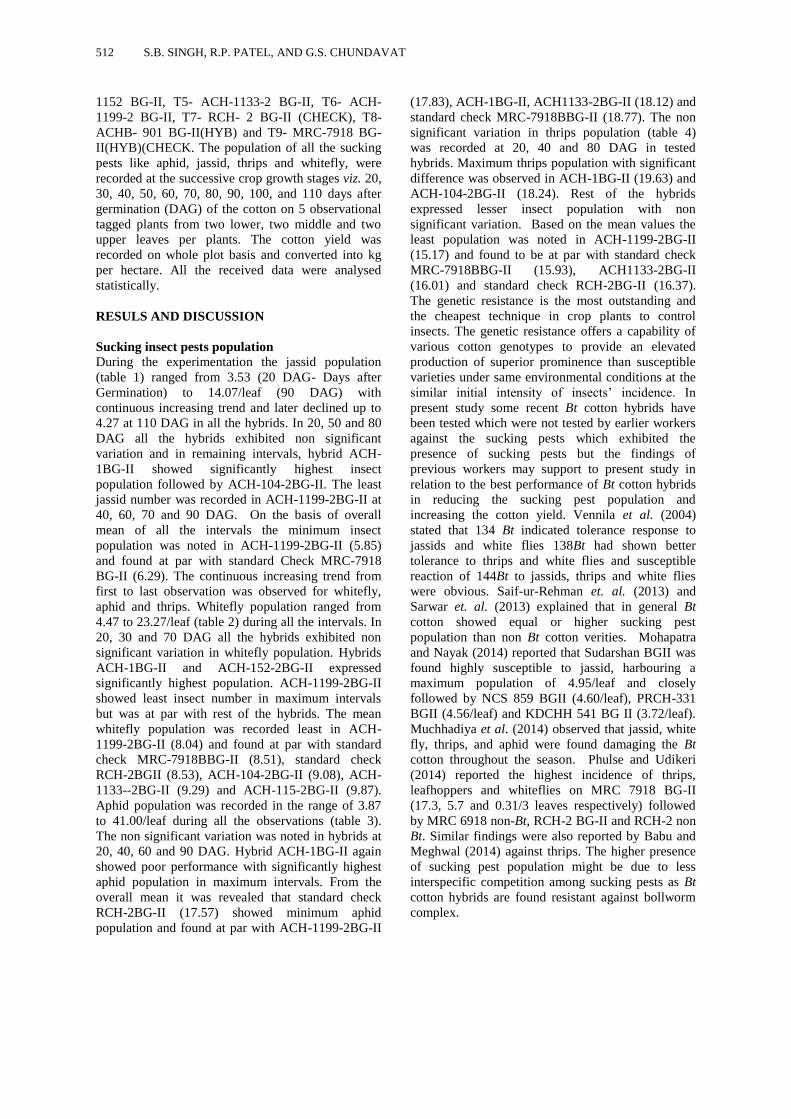
512 S.B. SINGH, R.P. PATEL, AND G.S. CHUNDAVAT
1152 BG-II, T5- ACH-1133-2 BG-II, T6- ACH-
1199-2 BG-II, T7- RCH- 2 BG-II (CHECK), T8-
ACHB- 901 BG-II(HYB) and T9- MRC-7918 BG-
II(HYB)(CHECK. The population of all the sucking
pests like aphid, jassid, thrips and whitefly, were
recorded at the successive crop growth stages viz. 20,
30, 40, 50, 60, 70, 80, 90, 100, and 110 days after
germination (DAG) of the cotton on 5 observational
tagged plants from two lower, two middle and two
upper leaves per plants. The cotton yield was
recorded on whole plot basis and converted into kg
per hectare. All the received data were analysed
statistically.
RESULS AND DISCUSSION
Sucking insect pests population
During the experimentation the jassid population
(table 1) ranged from 3.53 (20 DAG- Days after
Germination) to 14.07/leaf (90 DAG) with
continuous increasing trend and later declined up to
4.27 at 110 DAG in all the hybrids. In 20, 50 and 80
DAG all the hybrids exhibited non significant
variation and in remaining intervals, hybrid ACH-
1BG-II showed significantly highest insect
population followed by ACH-104-2BG-II. The least
jassid number was recorded in ACH-1199-2BG-II at
40, 60, 70 and 90 DAG. On the basis of overall
mean of all the intervals the minimum insect
population was noted in ACH-1199-2BG-II (5.85)
and found at par with standard Check MRC-7918
BG-II (6.29). The continuous increasing trend from
first to last observation was observed for whitefly,
aphid and thrips. Whitefly population ranged from
4.47 to 23.27/leaf (table 2) during all the intervals. In
20, 30 and 70 DAG all the hybrids exhibited non
significant variation in whitefly population. Hybrids
ACH-1BG-II and ACH-152-2BG-II expressed
significantly highest population. ACH-1199-2BG-II
showed least insect number in maximum intervals
but was at par with rest of the hybrids. The mean
whitefly population was recorded least in ACH-
1199-2BG-II (8.04) and found at par with standard
check MRC-7918BBG-II (8.51), standard check
RCH-2BGII (8.53), ACH-104-2BG-II (9.08), ACH-
1133--2BG-II (9.29) and ACH-115-2BG-II (9.87).
Aphid population was recorded in the range of 3.87
to 41.00/leaf during all the observations (table 3).
The non significant variation was noted in hybrids at
20, 40, 60 and 90 DAG. Hybrid ACH-1BG-II again
showed poor performance with significantly highest
aphid population in maximum intervals. From the
overall mean it was revealed that standard check
RCH-2BG-II (17.57) showed minimum aphid
population and found at par with ACH-1199-2BG-II
(17.83), ACH-1BG-II, ACH1133-2BG-II (18.12) and
standard check MRC-7918BBG-II (18.77). The non
significant variation in thrips population (table 4)
was recorded at 20, 40 and 80 DAG in tested
hybrids. Maximum thrips population with significant
difference was observed in ACH-1BG-II (19.63) and
ACH-104-2BG-II (18.24). Rest of the hybrids
expressed lesser insect population with non
significant variation. Based on the mean values the
least population was noted in ACH-1199-2BG-II
(15.17) and found to be at par with standard check
MRC-7918BBG-II (15.93), ACH1133-2BG-II
(16.01) and standard check RCH-2BG-II (16.37).
The genetic resistance is the most outstanding and
the cheapest technique in crop plants to control
insects. The genetic resistance offers a capability of
various cotton genotypes to provide an elevated
production of superior prominence than susceptible
varieties under same environmental conditions at the
similar initial intensity of insects’ incidence. In
present study some recent Bt cotton hybrids have
been tested which were not tested by earlier workers
against the sucking pests which exhibited the
presence of sucking pests but the findings of
previous workers may support to present study in
relation to the best performance of Bt cotton hybrids
in reducing the sucking pest population and
increasing the cotton yield. Vennila et al. (2004)
stated that 134 Bt indicated tolerance response to
jassids and white flies 138Bt had shown better
tolerance to thrips and white flies and susceptible
reaction of 144Bt to jassids, thrips and white flies
were obvious. Saif-ur-Rehman et. al. (2013) and
Sarwar et. al. (2013) explained that in general Bt
cotton showed equal or higher sucking pest
population than non Bt cotton verities. Mohapatra
and Nayak (2014) reported that Sudarshan BGII was
found highly susceptible to jassid, harbouring a
maximum population of 4.95/leaf and closely
followed by NCS 859 BGII (4.60/leaf), PRCH-331
BGII (4.56/leaf) and KDCHH 541 BG II (3.72/leaf).
Muchhadiya et al. (2014) observed that jassid, white
fly, thrips, and aphid were found damaging the Bt
cotton throughout the season. Phulse and Udikeri
(2014) reported the highest incidence of thrips,
leafhoppers and whiteflies on MRC 7918 BG-II
(17.3, 5.7 and 0.31/3 leaves respectively) followed
by MRC 6918 non-Bt, RCH-2 BG-II and RCH-2 non
Bt. Similar findings were also reported by Babu and
Meghwal (2014) against thrips. The higher presence
of sucking pest population might be due to less
interspecific competition among sucking pests as Bt
cotton hybrids are found resistant against bollworm
complex.
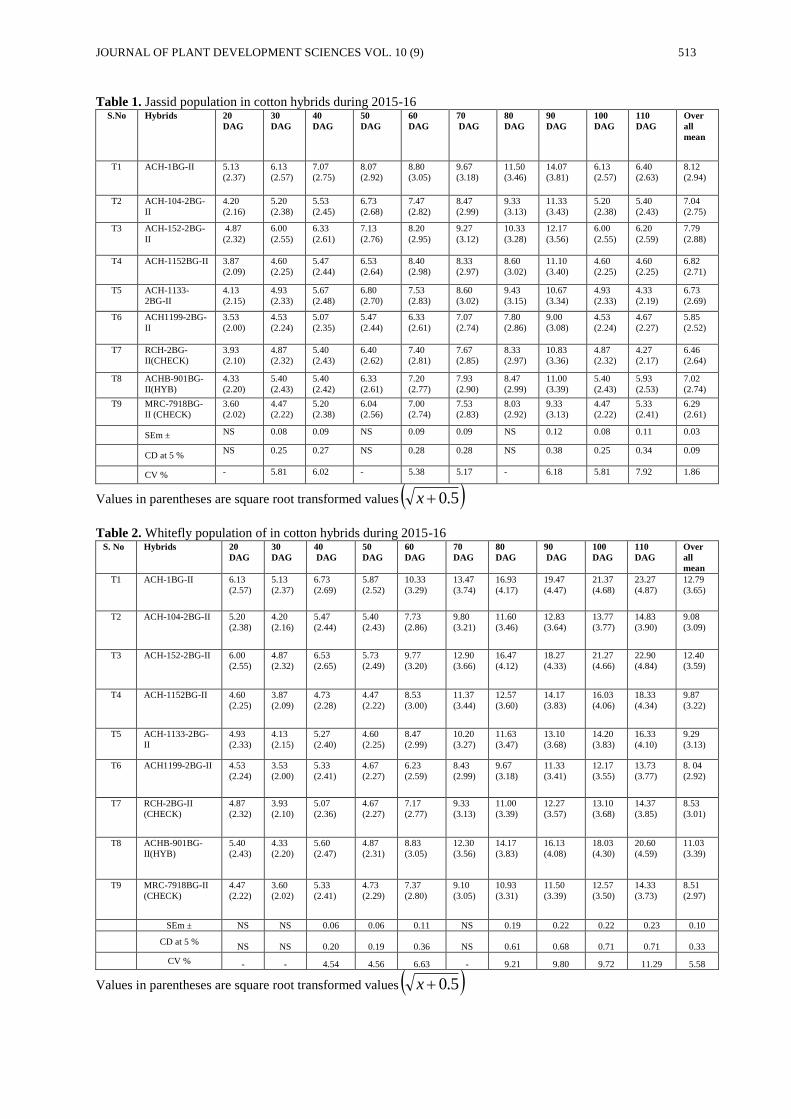
JOURNAL OF PLANT DEVELOPMENT SCIENCES VOL. 10 (9) 513
Table 1. Jassid population in cotton hybrids during 2015-16 S.No Hybrids 20
DAG
30
DAG
40
DAG
50
DAG
60
DAG
70
DAG
80
DAG
90
DAG
100
DAG
110
DAG
Over
all
mean
T1 ACH-1BG-II 5.13
(2.37)
6.13
(2.57)
7.07
(2.75)
8.07
(2.92)
8.80
(3.05)
9.67
(3.18)
11.50
(3.46)
14.07
(3.81)
6.13
(2.57)
6.40
(2.63)
8.12
(2.94)
T2 ACH-104-2BG-
II
4.20
(2.16)
5.20
(2.38)
5.53
(2.45)
6.73
(2.68)
7.47
(2.82)
8.47
(2.99)
9.33
(3.13)
11.33
(3.43)
5.20
(2.38)
5.40
(2.43)
7.04
(2.75)
T3 ACH-152-2BG-
II
4.87
(2.32)
6.00
(2.55)
6.33
(2.61)
7.13
(2.76)
8.20
(2.95)
9.27
(3.12)
10.33
(3.28)
12.17
(3.56)
6.00
(2.55)
6.20
(2.59)
7.79
(2.88)
T4 ACH-1152BG-II 3.87
(2.09)
4.60
(2.25)
5.47
(2.44)
6.53
(2.64)
8.40
(2.98)
8.33
(2.97)
8.60
(3.02)
11.10
(3.40)
4.60
(2.25)
4.60
(2.25)
6.82
(2.71)
T5 ACH-1133-
2BG-II
4.13
(2.15)
4.93
(2.33)
5.67
(2.48)
6.80
(2.70)
7.53
(2.83)
8.60
(3.02)
9.43
(3.15)
10.67
(3.34)
4.93
(2.33)
4.33
(2.19)
6.73
(2.69)
T6 ACH1199-2BG-
II
3.53
(2.00)
4.53
(2.24)
5.07
(2.35)
5.47
(2.44)
6.33
(2.61)
7.07
(2.74)
7.80
(2.86)
9.00
(3.08)
4.53
(2.24)
4.67
(2.27)
5.85
(2.52)
T7 RCH-2BG-
II(CHECK)
3.93
(2.10)
4.87
(2.32)
5.40
(2.43)
6.40
(2.62)
7.40
(2.81)
7.67
(2.85)
8.33
(2.97)
10.83
(3.36)
4.87
(2.32)
4.27
(2.17)
6.46
(2.64)
T8 ACHB-901BG-
II(HYB)
4.33
(2.20)
5.40
(2.43)
5.40
(2.42)
6.33
(2.61)
7.20
(2.77)
7.93
(2.90)
8.47
(2.99)
11.00
(3.39)
5.40
(2.43)
5.93
(2.53)
7.02
(2.74)
T9 MRC-7918BG-
II (CHECK)
3.60
(2.02)
4.47
(2.22)
5.20
(2.38)
6.04
(2.56)
7.00
(2.74)
7.53
(2.83)
8.03
(2.92)
9.33
(3.13)
4.47
(2.22)
5.33
(2.41)
6.29
(2.61)
SEm ± NS 0.08 0.09 NS 0.09 0.09 NS 0.12 0.08 0.11 0.03
CD at 5 %
NS 0.25 0.27 NS 0.28 0.28 NS 0.38 0.25 0.34 0.09
CV % - 5.81 6.02 - 5.38 5.17 - 6.18 5.81 7.92 1.86
Values in parentheses are square root transformed values 5.0x
Table 2. Whitefly population of in cotton hybrids during 2015-16 S. No Hybrids 20
DAG
30
DAG
40
DAG
50
DAG
60
DAG
70
DAG
80
DAG
90
DAG
100
DAG
110
DAG
Over
all
mean
T1 ACH-1BG-II 6.13
(2.57)
5.13
(2.37)
6.73
(2.69)
5.87
(2.52)
10.33
(3.29)
13.47
(3.74)
16.93
(4.17)
19.47
(4.47)
21.37
(4.68)
23.27
(4.87)
12.79
(3.65)
T2 ACH-104-2BG-II 5.20
(2.38)
4.20
(2.16)
5.47
(2.44)
5.40
(2.43)
7.73
(2.86)
9.80
(3.21)
11.60
(3.46)
12.83
(3.64)
13.77
(3.77)
14.83
(3.90)
9.08
(3.09)
T3 ACH-152-2BG-II 6.00
(2.55)
4.87
(2.32)
6.53
(2.65)
5.73
(2.49)
9.77
(3.20)
12.90
(3.66)
16.47
(4.12)
18.27
(4.33)
21.27
(4.66)
22.90
(4.84)
12.40
(3.59)
T4 ACH-1152BG-II 4.60
(2.25)
3.87
(2.09)
4.73
(2.28)
4.47
(2.22)
8.53
(3.00)
11.37
(3.44)
12.57
(3.60)
14.17
(3.83)
16.03
(4.06)
18.33
(4.34)
9.87
(3.22)
T5 ACH-1133-2BG-
II
4.93
(2.33)
4.13
(2.15)
5.27
(2.40)
4.60
(2.25)
8.47
(2.99)
10.20
(3.27)
11.63
(3.47)
13.10
(3.68)
14.20
(3.83)
16.33
(4.10)
9.29
(3.13)
T6 ACH1199-2BG-II 4.53
(2.24)
3.53
(2.00)
5.33
(2.41)
4.67
(2.27)
6.23
(2.59)
8.43
(2.99)
9.67
(3.18)
11.33
(3.41)
12.17
(3.55)
13.73
(3.77)
8. 04
(2.92)
T7 RCH-2BG-II
(CHECK)
4.87
(2.32)
3.93
(2.10)
5.07
(2.36)
4.67
(2.27)
7.17
(2.77)
9.33
(3.13)
11.00
(3.39)
12.27
(3.57)
13.10
(3.68)
14.37
(3.85)
8.53
(3.01)
T8 ACHB-901BG-
II(HYB)
5.40
(2.43)
4.33
(2.20)
5.60
(2.47)
4.87
(2.31)
8.83
(3.05)
12.30
(3.56)
14.17
(3.83)
16.13
(4.08)
18.03
(4.30)
20.60
(4.59)
11.03
(3.39)
T9 MRC-7918BG-II
(CHECK)
4.47
(2.22)
3.60
(2.02)
5.33
(2.41)
4.73
(2.29)
7.37
(2.80)
9.10
(3.05)
10.93
(3.31)
11.50
(3.39)
12.57
(3.50)
14.33
(3.73)
8.51
(2.97)
SEm ± NS NS 0.06 0.06 0.11 NS 0.19 0.22 0.22 0.23 0.10
CD at 5 %
NS NS 0.20 0.19 0.36 NS 0.61 0.68 0.71 0.71 0.33
CV % - - 4.54 4.56 6.63 - 9.21 9.80 9.72 11.29 5.58
Values in parentheses are square root transformed values 5.0x
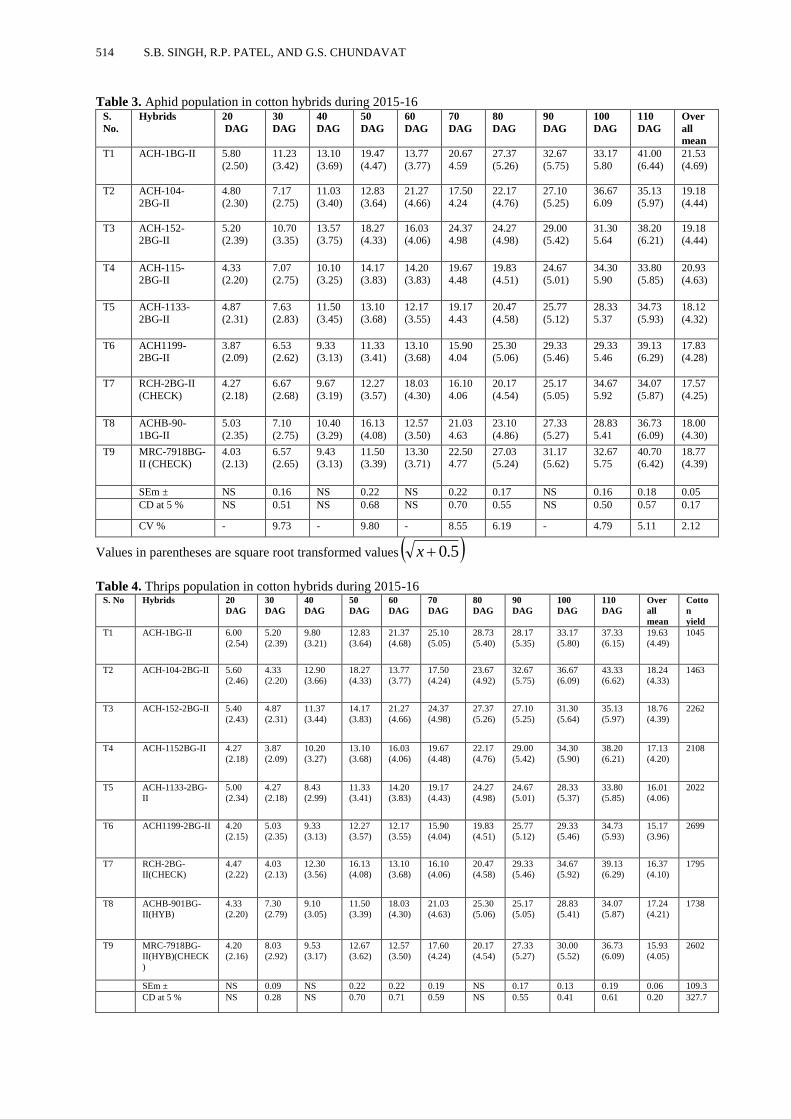
514 S.B. SINGH, R.P. PATEL, AND G.S. CHUNDAVAT
Table 3. Aphid population in cotton hybrids during 2015-16 S.
No.
Hybrids 20
DAG
30
DAG
40
DAG
50
DAG
60
DAG
70
DAG
80
DAG
90
DAG
100
DAG
110
DAG
Over
all
mean
T1 ACH-1BG-II 5.80
(2.50)
11.23
(3.42)
13.10
(3.69)
19.47
(4.47)
13.77
(3.77)
20.67
4.59
27.37
(5.26)
32.67
(5.75)
33.17
5.80
41.00
(6.44)
21.53
(4.69)
T2 ACH-104-
2BG-II
4.80
(2.30)
7.17
(2.75)
11.03
(3.40)
12.83
(3.64)
21.27
(4.66)
17.50
4.24
22.17
(4.76)
27.10
(5.25)
36.67
6.09
35.13
(5.97)
19.18
(4.44)
T3 ACH-152-2BG-II
5.20 (2.39)
10.70 (3.35)
13.57 (3.75)
18.27 (4.33)
16.03 (4.06)
24.37 4.98
24.27 (4.98)
29.00 (5.42)
31.30 5.64
38.20 (6.21)
19.18 (4.44)
T4 ACH-115-
2BG-II
4.33
(2.20)
7.07
(2.75)
10.10
(3.25)
14.17
(3.83)
14.20
(3.83)
19.67
4.48
19.83
(4.51)
24.67
(5.01)
34.30
5.90
33.80
(5.85)
20.93
(4.63)
T5 ACH-1133-
2BG-II
4.87
(2.31)
7.63
(2.83)
11.50
(3.45)
13.10
(3.68)
12.17
(3.55)
19.17
4.43
20.47
(4.58)
25.77
(5.12)
28.33
5.37
34.73
(5.93)
18.12
(4.32)
T6 ACH1199-2BG-II
3.87 (2.09)
6.53 (2.62)
9.33 (3.13)
11.33 (3.41)
13.10 (3.68)
15.90 4.04
25.30 (5.06)
29.33 (5.46)
29.33 5.46
39.13 (6.29)
17.83 (4.28)
T7 RCH-2BG-II
(CHECK)
4.27
(2.18)
6.67
(2.68)
9.67
(3.19)
12.27
(3.57)
18.03
(4.30)
16.10
4.06
20.17
(4.54)
25.17
(5.05)
34.67
5.92
34.07
(5.87)
17.57
(4.25)
T8 ACHB-90-
1BG-II
5.03
(2.35)
7.10
(2.75)
10.40
(3.29)
16.13
(4.08)
12.57
(3.50)
21.03
4.63
23.10
(4.86)
27.33
(5.27)
28.83
5.41
36.73
(6.09)
18.00
(4.30)
T9 MRC-7918BG-II (CHECK)
4.03 (2.13)
6.57 (2.65)
9.43 (3.13)
11.50 (3.39)
13.30 (3.71)
22.50 4.77
27.03 (5.24)
31.17 (5.62)
32.67 5.75
40.70 (6.42)
18.77 (4.39)
SEm ± NS 0.16 NS 0.22 NS 0.22 0.17 NS 0.16 0.18 0.05
CD at 5 % NS 0.51 NS 0.68 NS 0.70 0.55 NS 0.50 0.57 0.17
CV % - 9.73 - 9.80 - 8.55 6.19 - 4.79 5.11 2.12
Values in parentheses are square root transformed values 5.0x
Table 4. Thrips population in cotton hybrids during 2015-16 S. No Hybrids 20
DAG
30
DAG
40
DAG
50
DAG
60
DAG
70
DAG
80
DAG
90
DAG
100
DAG
110
DAG
Over
all
mean
Cotto
n
yield
T1 ACH-1BG-II 6.00
(2.54)
5.20
(2.39)
9.80
(3.21)
12.83
(3.64)
21.37
(4.68)
25.10
(5.05)
28.73
(5.40)
28.17
(5.35)
33.17
(5.80)
37.33
(6.15)
19.63
(4.49)
1045
T2 ACH-104-2BG-II 5.60
(2.46)
4.33
(2.20)
12.90
(3.66)
18.27
(4.33)
13.77
(3.77)
17.50
(4.24)
23.67
(4.92)
32.67
(5.75)
36.67
(6.09)
43.33
(6.62)
18.24
(4.33)
1463
T3 ACH-152-2BG-II 5.40
(2.43)
4.87
(2.31)
11.37
(3.44)
14.17
(3.83)
21.27
(4.66)
24.37
(4.98)
27.37
(5.26)
27.10
(5.25)
31.30
(5.64)
35.13
(5.97)
18.76
(4.39)
2262
T4 ACH-1152BG-II 4.27
(2.18)
3.87
(2.09)
10.20
(3.27)
13.10
(3.68)
16.03
(4.06)
19.67
(4.48)
22.17
(4.76)
29.00
(5.42)
34.30
(5.90)
38.20
(6.21)
17.13
(4.20)
2108
T5 ACH-1133-2BG-
II
5.00
(2.34)
4.27
(2.18)
8.43
(2.99)
11.33
(3.41)
14.20
(3.83)
19.17
(4.43)
24.27
(4.98)
24.67
(5.01)
28.33
(5.37)
33.80
(5.85)
16.01
(4.06)
2022
T6 ACH1199-2BG-II 4.20
(2.15)
5.03
(2.35)
9.33
(3.13)
12.27
(3.57)
12.17
(3.55)
15.90
(4.04)
19.83
(4.51)
25.77
(5.12)
29.33
(5.46)
34.73
(5.93)
15.17
(3.96)
2699
T7 RCH-2BG-
II(CHECK)
4.47
(2.22)
4.03
(2.13)
12.30
(3.56)
16.13
(4.08)
13.10
(3.68)
16.10
(4.06)
20.47
(4.58)
29.33
(5.46)
34.67
(5.92)
39.13
(6.29)
16.37
(4.10)
1795
T8 ACHB-901BG-
II(HYB)
4.33
(2.20)
7.30
(2.79)
9.10
(3.05)
11.50
(3.39)
18.03
(4.30)
21.03
(4.63)
25.30
(5.06)
25.17
(5.05)
28.83
(5.41)
34.07
(5.87)
17.24
(4.21)
1738
T9 MRC-7918BG-
II(HYB)(CHECK
)
4.20
(2.16)
8.03
(2.92)
9.53
(3.17)
12.67
(3.62)
12.57
(3.50)
17.60
(4.24)
20.17
(4.54)
27.33
(5.27)
30.00
(5.52)
36.73
(6.09)
15.93
(4.05)
2602
SEm ± NS 0.09 NS 0.22 0.22 0.19 NS 0.17 0.13 0.19 0.06 109.3
CD at 5 % NS 0.28 NS 0.70 0.71 0.59 NS 0.55 0.41 0.61 0.20 327.7
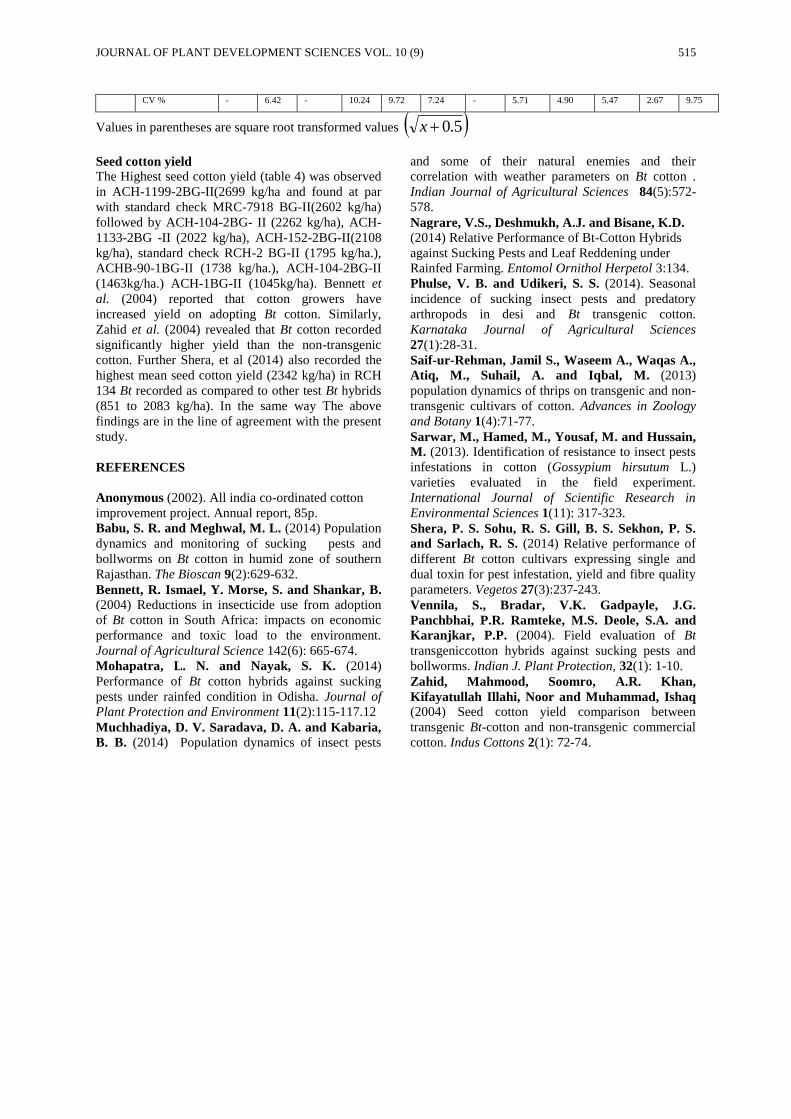
JOURNAL OF PLANT DEVELOPMENT SCIENCES VOL. 10 (9) 515
CV % - 6.42 - 10.24 9.72 7.24 - 5.71 4.90 5.47 2.67 9.75
Values in parentheses are square root transformed values 5.0x
Seed cotton yield The Highest seed cotton yield (table 4) was observed
in ACH-1199-2BG-II(2699 kg/ha and found at par
with standard check MRC-7918 BG-II(2602 kg/ha)
followed by ACH-104-2BG- II (2262 kg/ha), ACH-
1133-2BG -II (2022 kg/ha), ACH-152-2BG-II(2108
kg/ha), standard check RCH-2 BG-II (1795 kg/ha.),
ACHB-90-1BG-II (1738 kg/ha.), ACH-104-2BG-II
(1463kg/ha.) ACH-1BG-II (1045kg/ha). Bennett et
al. (2004) reported that cotton growers have
increased yield on adopting Bt cotton. Similarly,
Zahid et al. (2004) revealed that Bt cotton recorded
significantly higher yield than the non-transgenic
cotton. Further Shera, et al (2014) also recorded the
highest mean seed cotton yield (2342 kg/ha) in RCH
134 Bt recorded as compared to other test Bt hybrids
(851 to 2083 kg/ha). In the same way The above
findings are in the line of agreement with the present
study.
REFERENCES
Anonymous (2002). All india co-ordinated cotton
improvement project. Annual report, 85p.
Babu, S. R. and Meghwal, M. L. (2014) Population
dynamics and monitoring of sucking pests and
bollworms on Bt cotton in humid zone of southern
Rajasthan. The Bioscan 9(2):629-632.
Bennett, R. Ismael, Y. Morse, S. and Shankar, B. (2004) Reductions in insecticide use from adoption
of Bt cotton in South Africa: impacts on economic
performance and toxic load to the environment.
Journal of Agricultural Science 142(6): 665-674.
Mohapatra, L. N. and Nayak, S. K. (2014)
Performance of Bt cotton hybrids against sucking
pests under rainfed condition in Odisha. Journal of
Plant Protection and Environment 11(2):115-117.12
Muchhadiya, D. V. Saradava, D. A. and Kabaria,
B. B. (2014) Population dynamics of insect pests
and some of their natural enemies and their
correlation with weather parameters on Bt cotton .
Indian Journal of Agricultural Sciences 84(5):572-
578.
Nagrare, V.S., Deshmukh, A.J. and Bisane, K.D. (2014) Relative Performance of Bt-Cotton Hybrids
against Sucking Pests and Leaf Reddening under
Rainfed Farming. Entomol Ornithol Herpetol 3:134.
Phulse, V. B. and Udikeri, S. S. (2014). Seasonal
incidence of sucking insect pests and predatory
arthropods in desi and Bt transgenic cotton.
Karnataka Journal of Agricultural Sciences
27(1):28-31.
Saif-ur-Rehman, Jamil S., Waseem A., Waqas A.,
Atiq, M., Suhail, A. and Iqbal, M. (2013)
population dynamics of thrips on transgenic and non-
transgenic cultivars of cotton. Advances in Zoology
and Botany 1(4):71-77.
Sarwar, M., Hamed, M., Yousaf, M. and Hussain,
M. (2013). Identification of resistance to insect pests
infestations in cotton (Gossypium hirsutum L.)
varieties evaluated in the field experiment.
International Journal of Scientific Research in
Environmental Sciences 1(11): 317-323.
Shera, P. S. Sohu, R. S. Gill, B. S. Sekhon, P. S.
and Sarlach, R. S. (2014) Relative performance of
different Bt cotton cultivars expressing single and
dual toxin for pest infestation, yield and fibre quality
parameters. Vegetos 27(3):237-243.
Vennila, S., Bradar, V.K. Gadpayle, J.G.
Panchbhai, P.R. Ramteke, M.S. Deole, S.A. and
Karanjkar, P.P. (2004). Field evaluation of Bt
transgeniccotton hybrids against sucking pests and
bollworms. Indian J. Plant Protection, 32(1): 1-10.
Zahid, Mahmood, Soomro, A.R. Khan,
Kifayatullah Illahi, Noor and Muhammad, Ishaq (2004) Seed cotton yield comparison between
transgenic Bt-cotton and non-transgenic commercial
cotton. Indus Cottons 2(1): 72-74.

516 S.B. SINGH, R.P. PATEL, AND G.S. CHUNDAVAT
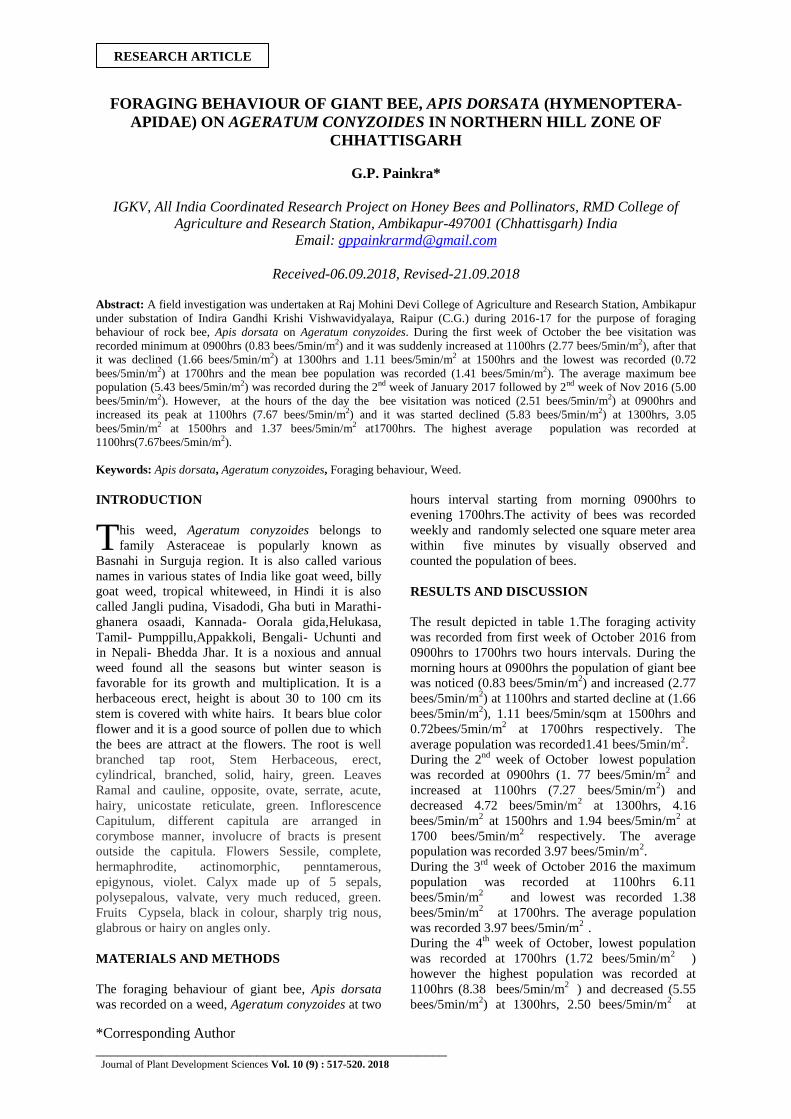
*Corresponding Author
________________________________________________ Journal of Plant Development Sciences Vol. 10 (9) : 517-520. 2018
FORAGING BEHAVIOUR OF GIANT BEE, APIS DORSATA (HYMENOPTERA-
APIDAE) ON AGERATUM CONYZOIDES IN NORTHERN HILL ZONE OF
CHHATTISGARH
G.P. Painkra*
IGKV, All India Coordinated Research Project on Honey Bees and Pollinators, RMD College of
Agriculture and Research Station, Ambikapur-497001 (Chhattisgarh) India
Email: [email protected]
Received-06.09.2018, Revised-21.09.2018
Abstract: A field investigation was undertaken at Raj Mohini Devi College of Agriculture and Research Station, Ambikapur
under substation of Indira Gandhi Krishi Vishwavidyalaya, Raipur (C.G.) during 2016-17 for the purpose of foraging
behaviour of rock bee, Apis dorsata on Ageratum conyzoides. During the first week of October the bee visitation was
recorded minimum at 0900hrs (0.83 bees/5min/m2) and it was suddenly increased at 1100hrs (2.77 bees/5min/m2), after that
it was declined (1.66 bees/5min/m2) at 1300hrs and 1.11 bees/5min/m2 at 1500hrs and the lowest was recorded (0.72
bees/5min/m2) at 1700hrs and the mean bee population was recorded (1.41 bees/5min/m2). The average maximum bee
population (5.43 bees/5min/m2) was recorded during the 2nd week of January 2017 followed by 2nd week of Nov 2016 (5.00
bees/5min/m2). However, at the hours of the day the bee visitation was noticed (2.51 bees/5min/m2) at 0900hrs and
increased its peak at 1100hrs (7.67 bees/5min/m2) and it was started declined (5.83 bees/5min/m2) at 1300hrs, 3.05
bees/5min/m2 at 1500hrs and 1.37 bees/5min/m2 at1700hrs. The highest average population was recorded at
1100hrs(7.67bees/5min/m2).
Keywords: Apis dorsata, Ageratum conyzoides, Foraging behaviour, Weed.
INTRODUCTION
his weed, Ageratum conyzoides belongs to
family Asteraceae is popularly known as
Basnahi in Surguja region. It is also called various
names in various states of India like goat weed, billy
goat weed, tropical whiteweed, in Hindi it is also
called Jangli pudina, Visadodi, Gha buti in Marathi-
ghanera osaadi, Kannada- Oorala gida,Helukasa,
Tamil- Pumppillu,Appakkoli, Bengali- Uchunti and
in Nepali- Bhedda Jhar. It is a noxious and annual
weed found all the seasons but winter season is
favorable for its growth and multiplication. It is a
herbaceous erect, height is about 30 to 100 cm its
stem is covered with white hairs. It bears blue color
flower and it is a good source of pollen due to which
the bees are attract at the flowers. The root is well
branched tap root, Stem Herbaceous, erect,
cylindrical, branched, solid, hairy, green. Leaves
Ramal and cauline, opposite, ovate, serrate, acute,
hairy, unicostate reticulate, green. Inflorescence
Capitulum, different capitula are arranged in
corymbose manner, involucre of bracts is present
outside the capitula. Flowers Sessile, complete,
hermaphrodite, actinomorphic, penntamerous,
epigynous, violet. Calyx made up of 5 sepals,
polysepalous, valvate, very much reduced, green.
Fruits Cypsela, black in colour, sharply trig nous,
glabrous or hairy on angles only.
MATERIALS AND METHODS
The foraging behaviour of giant bee, Apis dorsata
was recorded on a weed, Ageratum conyzoides at two
hours interval starting from morning 0900hrs to
evening 1700hrs.The activity of bees was recorded
weekly and randomly selected one square meter area
within five minutes by visually observed and
counted the population of bees.
RESULTS AND DISCUSSION
The result depicted in table 1.The foraging activity
was recorded from first week of October 2016 from
0900hrs to 1700hrs two hours intervals. During the
morning hours at 0900hrs the population of giant bee
was noticed (0.83 bees/5min/m2) and increased (2.77
bees/5min/m2) at 1100hrs and started decline at (1.66
bees/5min/m2), 1.11 bees/5min/sqm at 1500hrs and
0.72bees/5min/m2 at 1700hrs respectively. The
average population was recorded1.41 bees/5min/m2.
During the 2nd
week of October lowest population
was recorded at 0900hrs (1. 77 bees/5min/m2 and
increased at 1100hrs (7.27 bees/5min/m2) and
decreased 4.72 bees/5min/m2 at 1300hrs, 4.16
bees/5min/m2 at 1500hrs and 1.94 bees/5min/m
2 at
1700 bees/5min/m2 respectively. The average
population was recorded 3.97 bees/5min/m2.
During the 3rd
week of October 2016 the maximum
population was recorded at 1100hrs 6.11
bees/5min/m2
and lowest was recorded 1.38
bees/5min/m2
at 1700hrs. The average population
was recorded 3.97 bees/5min/m2
.
During the 4th
week of October, lowest population
was recorded at 1700hrs (1.72 bees/5min/m2
)
however the highest population was recorded at
1100hrs (8.38 bees/5min/m2
) and decreased (5.55
bees/5min/m2) at 1300hrs, 2.50 bees/5min/m
2 at
T
RESEARCH ARTICLE

518 G.P. PAINKRA
1500hrs and 2.27 bees/5min/m2
at 0900hrs. the
average population was noticed 4.08 bees/5min/m2 .
During the last week of October maximum
population was recorded 8.94 bees/5min/m2
at
1100hrs followed by 5.72 bees/5min/m2
at 1300hrs
and 4.16 bees/5min/m2
at 1500hrs lowest was found
2.16 bees/5min/m2
at 0900hrs. The average
population was recorded 4.65 bees/5min/m2.
During the first week of November maximum bee
visitation was recorded at 1100hrs (7.27
bees/5min/m2
) followed by 4.72 bees/5min/m2
at
1300hrs and 4.33 bees/5min/m2
at 1500hrs however
the lowest was record 0.83 bees/5min/m2
at 1700hrs.
Average population was recorded 3.93 bees/5min/m2.
During the second week of November the lowest
population was recorded 1.38 bees/5min/m2
at
1700hrs. However the highest population was
recorded 10.05 bees/5min/m2
at 1100hrs and it was
decreased at 6.05 bees/5min/m2
and 4.88
bees/5min/m2
at 1300hrs and 1500hrs respectively.
The average population was 5.00 bees/5min/m2.
During the 3rd
week of November 2016 highest
population was recorded 7.66 bees/5min/m2
at
1100hrs and the lowest population was recorded 0.83
bees/5min/m2
at 1700hrs. The average population
was recorded 4.21 bees/5min/m2.
During the 4th
week of November maximum
population was recorded 7.72 bees/5min/m2
at
1100hrs however the lowest was noticed 1.72
bees/5min/m2
at1700hrs. The average population was
recorded 3.96 bees/5min/m2.
During the first week of December highest
population was recorded 8.05 bees/5min/m2
at
1100hrs followed by 6.38 bees/5min/m2
and 2.50
bees/5min/m2
at 1300hrs and 1500hrs respectively.
However, the lowest population was recorded 1.66
bees/5min/m2
at 1700hrs.The averge population was
recorded 4.07 bees/5min/m2 .
During the 2nd
week of December highest and lowest
population was recorded at 1100hrs (7.27
bees/5min/m2) and 1.55 bees/5min/m
2 at 1700hrs.
The average population was recorded 3.91
bees/5min/m2.
During the 3rd
week of December the maximum
population was recorded 7.83 bees/5min/m2
at
1100hrs followed by 6.94 bees/5min/m2
and 2.50
bees/5min/m2 at 1500hrs. Lowest was recorded 1.38
bees/5min/m2
at 1700hrs. The average population
was recorded 4.13 bees/5min/m2.
During 1st week of January 2017 the population of
bee was recorded lowest 1.38 bees/5min/m2
at
1700hrs however the highest was 6.94 bees/5min/m2
at 1100hrs. The average population was recorded
4.21 bees/5min/m2.
During 2nd
week of January maximum population
was recorded 10.5 bees/5min/m2 at 1100hrs followed
by 7.00 bees/5min/m2
at 1300hrs and 4.50
bees/5min/m2
at 1500hrs and the minimum was
recorded 1.55 bees/5min/m2
at 1700hrs. The average
population was recorded 5.43 bees/5min/m2.
During the third week of January the highest
population was recorded 7.33 bees/5min/m2
at
1100hrs and lowest was recorded at 1700hrs (1.22
bees/5min/m2 ). The average population was recorded
3.95 bees/5min/m2.
During the 4th
week of January maximum population
was recorded 8.94 bees/5min/m2
at 1100hrs followed
by 4.16 bees/5min/m2
and 2.27 bees/5min/m2 at
1300hrs and 1500hrs respectively. The minimum
population was recorded at 1700hrs 1.00
bees/5min/m2.
The average population was recorded
3.99 bees/5min/m2.
The results are close agreement with the earlier
workers Dalio (2013 and 2015) recorded the faraging
behaviour of honey bee on Parthenium and
Trianthema, Fazal Said et al (2015) on sunflower,
Painkra (2016) on lajwanti grass, Painkra and Shaw
(2016) on niger flowers. Kaur and Kumar (2013) and
Roy (2014) on mustard.
Table 1. Foraging activity of giant bee on Ageratum conyzoides during 2016-17.
Date of
observation
Population of honey bees / 5min /m2
Total
Mean Hours of the day
0900 1100 1300 1500 1700
1-7 /10/2016 0.83 2.77 1.66 1.11 0.72 7.09 1.41
8-14/10/2016 1.77 7.27 4.72 4.16 1.94 19.86 3.97
15-21/10/2016 1.94 6.11 5.27 1.94 1.38 16.64 3.32
22-28/10/2016 2.27 8.38 5.55 2.50 1.72 20.42 4.08
29-4/11/2016 2.16 8.94 5.72 4.16 2.27 23.25 4.65
5-11/11/2016 2.50 7.27 4.72 4.33 0.83 19.65 3.93
12-18/11/2016 2.66 10.05 6.05 4.88 1.38 25.02 5.00
19-25/11/2016 2.83 7.66 5.61 4.16 0.83 21.09 4.21
26-2/12/2016 2.55 7.72 4.88 2.94 1.72 19.81 3.96
3-9/12/2016 1.77 8.05 6.38 2.50 1.66 20.36 4.07
10-16/12/2016 2.11 7.27 5.83 2.83 1.55 19.59 3.91
17-23/12/2016 2.00 7.83 6.94 2.50 1.38 20.65 4.13
24-30/12/2016 2.11 7.44 6.38 1.94 0.83 18.70 3.74
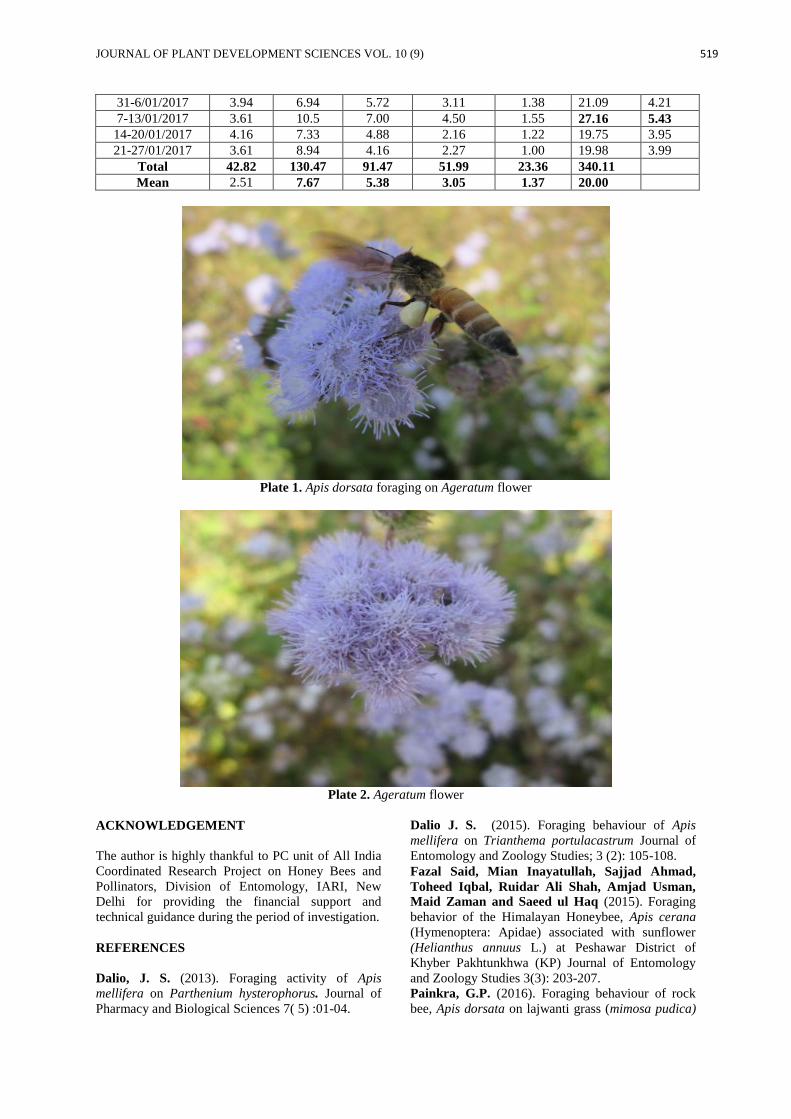
JOURNAL OF PLANT DEVELOPMENT SCIENCES VOL. 10 (9) 519
31-6/01/2017 3.94 6.94 5.72 3.11 1.38 21.09 4.21
7-13/01/2017 3.61 10.5 7.00 4.50 1.55 27.16 5.43
14-20/01/2017 4.16 7.33 4.88 2.16 1.22 19.75 3.95
21-27/01/2017 3.61 8.94 4.16 2.27 1.00 19.98 3.99
Total 42.82 130.47 91.47 51.99 23.36 340.11
Mean 2.51 7.67 5.38 3.05 1.37 20.00
Plate 1. Apis dorsata foraging on Ageratum flower
Plate 2. Ageratum flower
ACKNOWLEDGEMENT
The author is highly thankful to PC unit of All India
Coordinated Research Project on Honey Bees and
Pollinators, Division of Entomology, IARI, New
Delhi for providing the financial support and
technical guidance during the period of investigation.
REFERENCES
Dalio, J. S. (2013). Foraging activity of Apis
mellifera on Parthenium hysterophorus. Journal of
Pharmacy and Biological Sciences 7( 5) :01-04.
Dalio J. S. (2015). Foraging behaviour of Apis
mellifera on Trianthema portulacastrum Journal of
Entomology and Zoology Studies; 3 (2): 105-108.
Fazal Said, Mian Inayatullah, Sajjad Ahmad,
Toheed Iqbal, Ruidar Ali Shah, Amjad Usman,
Maid Zaman and Saeed ul Haq (2015). Foraging
behavior of the Himalayan Honeybee, Apis cerana
(Hymenoptera: Apidae) associated with sunflower
(Helianthus annuus L.) at Peshawar District of
Khyber Pakhtunkhwa (KP) Journal of Entomology
and Zoology Studies 3(3): 203-207.
Painkra, G.P. (2016). Foraging behaviour of rock
bee, Apis dorsata on lajwanti grass (mimosa pudica)

520 G.P. PAINKRA
in surguja of Chhattisgarh. Journal of Plant
Development Sciences. 8 (11) : 543-545.
Painkra, G.P and Shaw, S.S. (2016). Foraging
behaviour of honey bees in niger flowers, Guizotia
abyssinica Cass. in North Zone of Chhattisgarh
international journal of plant protection 9(1): 100-
106.
Kaur, Rajinder and Kumar, Neelima R (2013).
Pollen foraging activity of Apis mellifera during
autumn season in Chandigarh. Halteres. 4 4-12.
Roy, Sankarsan, Kumar Gayen, Amit, Mitra,
Bulganin and Duttagupta, Anup (2014). Diversity,
foraging activities of the insect visitors of Mustard
(Brassica juncea Linnaeus) and their role in
pollination in West Bengal The Journal of Zoology
Studies. 1(2): 07-12.
Soliman, M. Kamel1, Hatem M. Mahfouz, Abd
Elfatah H. Blal, Maysa Said Abd El-Wahed and
Mahmoud Farag Mahmoud (2013). Foraging
Activity of Four Bee Species on Sesame Flowers
During Two Successive Seasons in Ismailia
Governorate, Egypt Pestic. Phytomed. (Belgrade),
28(1), 39–45.
*Corresponding Author
________________________________________________ Journal of Plant Development Sciences Vol. 10(9) :521-524. 2018
GROWTH AND PERFORMANCE OF SRI VENKATESWARA CO-OPERATIVE
SUGAR LTD.: A STUDY IN CHITTOOR DISTRICT
K. Shiny Israel* and Y. Prabhavathi1
Department of Agribusiness Management,University of Agricultural Sciences,
Dharwad (Karnataka), India 1Department of Agribusiness Management,ANGRAU, (Andhra Pradesh), India
Received-04.09.2018, Revised-24.09.2018 Abstract: Sugarcane is an important commercial crop cultivated in about 120 countries in the world. Sugarcane is cultivated
in an area of 42.40million hectares in the world. Sugar industry is the second largest in India and first being the textile.This
study is mainly based on financial indicators. The secondary data was collected from2009-10 to 2013-14. The performance
of sugar industry was examined by the financial indicators through financial analysis. The results revealed that, the increase
in share capital contributed by members was quite negligible because sugar factory was unable to maximize the profits. For a
rupee of capital employed in fixed assets and current assets by the company, the sales revenue generated by the company
was highly fluctuating. The factory was incurring losses over the study period and the operating expenses of the company
were also kept on the higher side. Factory may follow the strategies on par with private factories in procurement of
sugarcane, payment method to sugar farmers and marketing of sugar and it would increase the profits.
Keywords: Sugar factory, Financial indicators, Financial analysis
INTRODUCTION
ugarcane is an important commercial crop
cultivated in about 120 countries in the world.
Sugar industry is the second largest in India and first
being the textile.
Sugarcane is cultivated in an area of 42.40million
hectares in the world. The total area under sugarcane
cultivation is highest in Brazil (6.20 million hectares)
followed by India (5.01million hectare). Brazil is the
biggest producer of sugar accounting for 41.4 per
cent of the world sugarcane production followed by
India (17.7 %). Other major producers of sugarcane
are China (6.6 %), Thailand (4.5 %), Pakistan (3.0
%) and Mexico (2.9 %). Over 3/4th of the total sugar
produced is consumed domestically in which it is
produced and the rest is traded around the globe
which is often termed as”world sugar”. For this
purpose liability, total assets, sales and annual losses
of the sugar factory were examined.
Objective of the study To evaluate the growth and performanceof sugar
factory in terms of financial indicators.
METHODOLOGY
Secondary data was used for analysis in the
presentstudy. The data on current liabilities and total
assets of sugar industry were collected fromSri
venkateswara co-operative sugar ltd., Gajulamandyam
village, Renigunta town, Chittoor district of Andhra
Pradesh for the period from 2009-10 to 2013-
14.Financialanalysis was employed for analysing the
financial indicators viz., share capital,reserves, loans,
deposits and borrowing, cash credit pledge, current
liabilities, fixed assets and current assets.
RESULTS AND DISCUSSION
The findings of this study are presented under
following financial indicators. Table 1 represents the
liabilities of the sugar factory in Sri Venkateswara co-
operative sugar Ltd.Data pertained to various financial
indicators was collected from financial statements
maintained by the factory and analysis of the same
was carried out for a period of five years i.e. from
2009-10 to 2013-14.The liabilities of the factory
include the share capital, reserves, loans, current
liabilities and central subsidy. The share capital of
the factory contributed by government and
institutions remained constant from 2009-10 and
2013-14 i.e. Rs.26,27,04,949 and Rs.1,05,000
respectively. The share capital contributed by
members for the year 2009-10 was Rs.82,95,800 and
2010-11, 2011-12 it was Rs. 83,12,400 and for 2012-
13,2013-14 it was Rs.83,32,800 and Rs. 83,46,600
respectively. The increase in share capital
contributed by member was quite negligible during
the study period. The reservesof the factory in the
year 2009-10, 2010-11, 2011-12, 2012-13 and 2013-
14 was Rs.13,07,23,464, Rs.13,11,96,178,13,
Rs.15,60,081, Rs.13,18,49,044 and Rs.13,20,83,500
respectively. This implies there was negligible
increase in the reserves over a period of five years
(increased by 0.017 %). The loans in the form of
deposits and borrowing availed by the factory for the
year 2009-10, 2010-11, 2011-12,2012-13, and 2013-
14 it was Rs.18, 91, 08, 204, Rs.15, 63, 34,
674,Rs.29,15,78, 867, Rs.22,89,61,701, and Rs.33,
63,22,849 respectively.The borrowing of the factory
has been increasing since 2009. From the cash credit
pledge availed by the factory for the year 2009-
10,2010-11,2011-12,2012-13 and 2013-14 it was Rs,
S
RESEARCH ARTICLE
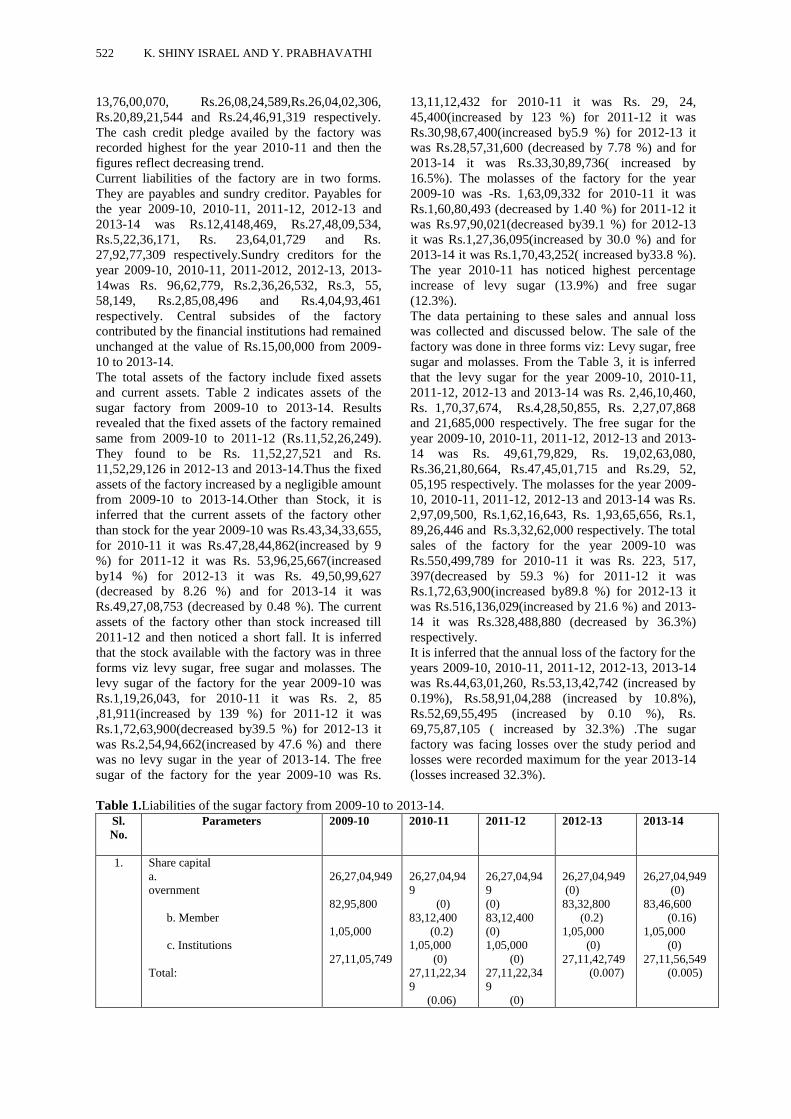
522 K. SHINY ISRAEL AND Y. PRABHAVATHI
13,76,00,070, Rs.26,08,24,589,Rs.26,04,02,306,
Rs.20,89,21,544 and Rs.24,46,91,319 respectively.
The cash credit pledge availed by the factory was
recorded highest for the year 2010-11 and then the
figures reflect decreasing trend.
Current liabilities of the factory are in two forms.
They are payables and sundry creditor. Payables for
the year 2009-10, 2010-11, 2011-12, 2012-13 and
2013-14 was Rs.12,4148,469, Rs.27,48,09,534,
Rs.5,22,36,171, Rs. 23,64,01,729 and Rs.
27,92,77,309 respectively.Sundry creditors for the
year 2009-10, 2010-11, 2011-2012, 2012-13, 2013-
14was Rs. 96,62,779, Rs.2,36,26,532, Rs.3, 55,
58,149, Rs.2,85,08,496 and Rs.4,04,93,461
respectively. Central subsides of the factory
contributed by the financial institutions had remained
unchanged at the value of Rs.15,00,000 from 2009-
10 to 2013-14.
The total assets of the factory include fixed assets
and current assets. Table 2 indicates assets of the
sugar factory from 2009-10 to 2013-14. Results
revealed that the fixed assets of the factory remained
same from 2009-10 to 2011-12 (Rs.11,52,26,249).
They found to be Rs. 11,52,27,521 and Rs.
11,52,29,126 in 2012-13 and 2013-14.Thus the fixed
assets of the factory increased by a negligible amount
from 2009-10 to 2013-14.Other than Stock, it is
inferred that the current assets of the factory other
than stock for the year 2009-10 was Rs.43,34,33,655,
for 2010-11 it was Rs.47,28,44,862(increased by 9
%) for 2011-12 it was Rs. 53,96,25,667(increased
by14 %) for 2012-13 it was Rs. 49,50,99,627
(decreased by 8.26 %) and for 2013-14 it was
Rs.49,27,08,753 (decreased by 0.48 %). The current
assets of the factory other than stock increased till
2011-12 and then noticed a short fall. It is inferred
that the stock available with the factory was in three
forms viz levy sugar, free sugar and molasses. The
levy sugar of the factory for the year 2009-10 was
Rs.1,19,26,043, for 2010-11 it was Rs. 2, 85
,81,911(increased by 139 %) for 2011-12 it was
Rs.1,72,63,900(decreased by39.5 %) for 2012-13 it
was Rs.2,54,94,662(increased by 47.6 %) and there
was no levy sugar in the year of 2013-14. The free
sugar of the factory for the year 2009-10 was Rs.
13,11,12,432 for 2010-11 it was Rs. 29, 24,
45,400(increased by 123 %) for 2011-12 it was
Rs.30,98,67,400(increased by5.9 %) for 2012-13 it
was Rs.28,57,31,600 (decreased by 7.78 %) and for
2013-14 it was Rs.33,30,89,736( increased by
16.5%). The molasses of the factory for the year
2009-10 was -Rs. 1,63,09,332 for 2010-11 it was
Rs.1,60,80,493 (decreased by 1.40 %) for 2011-12 it
was Rs.97,90,021(decreased by39.1 %) for 2012-13
it was Rs.1,27,36,095(increased by 30.0 %) and for
2013-14 it was Rs.1,70,43,252( increased by33.8 %).
The year 2010-11 has noticed highest percentage
increase of levy sugar (13.9%) and free sugar
(12.3%).
The data pertaining to these sales and annual loss
was collected and discussed below. The sale of the
factory was done in three forms viz: Levy sugar, free
sugar and molasses. From the Table 3, it is inferred
that the levy sugar for the year 2009-10, 2010-11,
2011-12, 2012-13 and 2013-14 was Rs. 2,46,10,460,
Rs. 1,70,37,674, Rs.4,28,50,855, Rs. 2,27,07,868
and 21,685,000 respectively. The free sugar for the
year 2009-10, 2010-11, 2011-12, 2012-13 and 2013-
14 was Rs. 49,61,79,829, Rs. 19,02,63,080,
Rs.36,21,80,664, Rs.47,45,01,715 and Rs.29, 52,
05,195 respectively. The molasses for the year 2009-
10, 2010-11, 2011-12, 2012-13 and 2013-14 was Rs.
2,97,09,500, Rs.1,62,16,643, Rs. 1,93,65,656, Rs.1,
89,26,446 and Rs.3,32,62,000 respectively. The total
sales of the factory for the year 2009-10 was
Rs.550,499,789 for 2010-11 it was Rs. 223, 517,
397(decreased by 59.3 %) for 2011-12 it was
Rs.1,72,63,900(increased by89.8 %) for 2012-13 it
was Rs.516,136,029(increased by 21.6 %) and 2013-
14 it was Rs.328,488,880 (decreased by 36.3%)
respectively.
It is inferred that the annual loss of the factory for the
years 2009-10, 2010-11, 2011-12, 2012-13, 2013-14
was Rs.44,63,01,260, Rs.53,13,42,742 (increased by
0.19%), Rs.58,91,04,288 (increased by 10.8%),
Rs.52,69,55,495 (increased by 0.10 %), Rs.
69,75,87,105 ( increased by 32.3%) .The sugar
factory was facing losses over the study period and
losses were recorded maximum for the year 2013-14
(losses increased 32.3%).
Table 1.Liabilities of the sugar factory from 2009-10 to 2013-14.
Sl.
No.
Parameters 2009-10 2010-11 2011-12 2012-13 2013-14
1. Share capital
a. G
overnment
b. Member
c. Institutions
Total:
26,27,04,949
82,95,800
1,05,000
27,11,05,749
26,27,04,94
9
(0)
83,12,400
(0.2)
1,05,000
(0)
27,11,22,34
9
(0.06)
26,27,04,94
9
(0)
83,12,400
(0)
1,05,000
(0)
27,11,22,34
9
(0)
26,27,04,949
(0)
83,32,800
(0.2)
1,05,000
(0)
27,11,42,749
(0.007)
26,27,04,949
(0)
83,46,600
(0.16)
1,05,000
(0)
27,11,56,549
(0.005)
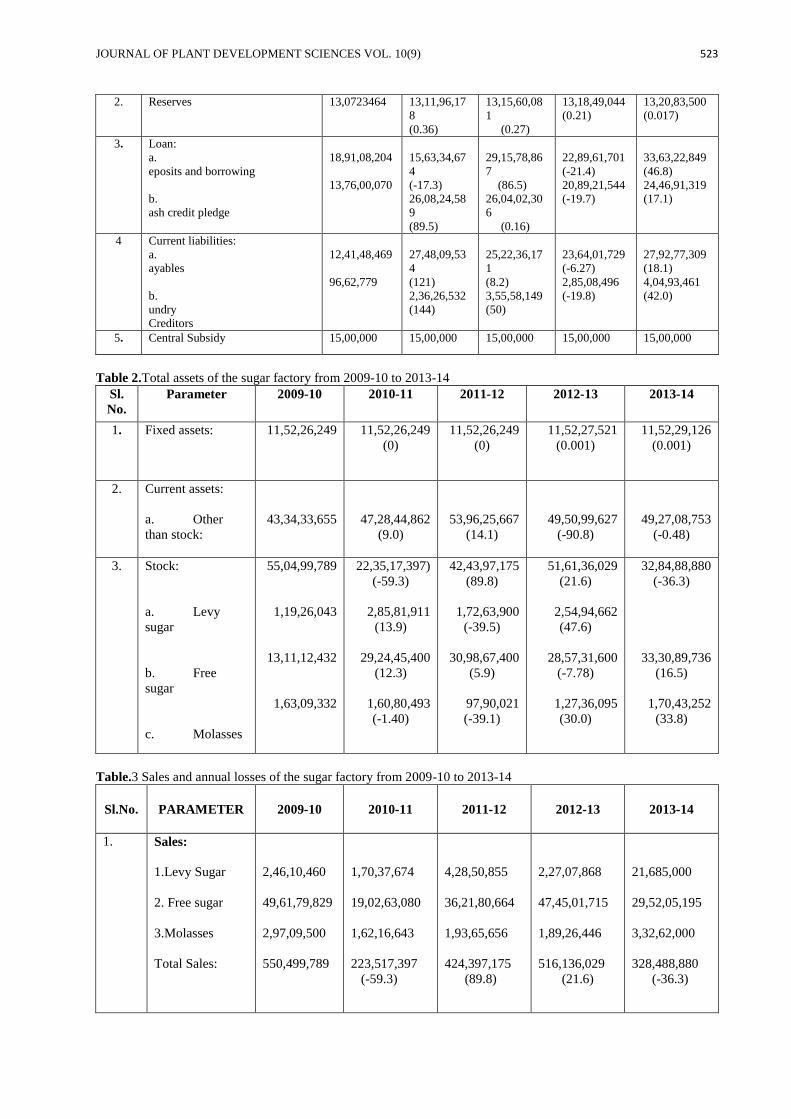
JOURNAL OF PLANT DEVELOPMENT SCIENCES VOL. 10(9) 523
2. Reserves 13,0723464 13,11,96,17
8
(0.36)
13,15,60,08
1
(0.27)
13,18,49,044
(0.21)
13,20,83,500
(0.017)
3. Loan:
a. D
eposits and borrowing
b. C
ash credit pledge
18,91,08,204
13,76,00,070
15,63,34,67
4
(-17.3)
26,08,24,58
9
(89.5)
29,15,78,86
7
(86.5)
26,04,02,30
6
(0.16)
22,89,61,701
(-21.4)
20,89,21,544
(-19.7)
33,63,22,849
(46.8)
24,46,91,319
(17.1)
4 Current liabilities:
a. P
ayables
b. S
undry
Creditors
12,41,48,469
96,62,779
27,48,09,53
4
(121)
2,36,26,532
(144)
25,22,36,17
1
(8.2)
3,55,58,149
(50)
23,64,01,729
(-6.27)
2,85,08,496
(-19.8)
27,92,77,309
(18.1)
4,04,93,461
(42.0)
5. Central Subsidy 15,00,000 15,00,000 15,00,000 15,00,000 15,00,000
Table 2.Total assets of the sugar factory from 2009-10 to 2013-14
Sl.
No.
Parameter 2009-10 2010-11 2011-12 2012-13 2013-14
1. Fixed assets:
11,52,26,249 11,52,26,249
(0)
11,52,26,249
(0)
11,52,27,521
(0.001)
11,52,29,126
(0.001)
2. Current assets:
a. Other
than stock:
43,34,33,655
47,28,44,862
(9.0)
53,96,25,667
(14.1)
49,50,99,627
(-90.8)
49,27,08,753
(-0.48)
3. Stock:
a. Levy
sugar
b. Free
sugar
c. Molasses
55,04,99,789
1,19,26,043
13,11,12,432
1,63,09,332
22,35,17,397)
(-59.3)
2,85,81,911
(13.9)
29,24,45,400
(12.3)
1,60,80,493
(-1.40)
42,43,97,175
(89.8)
1,72,63,900
(-39.5)
30,98,67,400
(5.9)
97,90,021
(-39.1)
51,61,36,029
(21.6)
2,54,94,662
(47.6)
28,57,31,600
(-7.78)
1,27,36,095
(30.0)
32,84,88,880
(-36.3)
33,30,89,736
(16.5)
1,70,43,252
(33.8)
Table.3 Sales and annual losses of the sugar factory from 2009-10 to 2013-14
Sl.No. PARAMETER 2009-10 2010-11 2011-12 2012-13 2013-14
1. Sales:
1.Levy Sugar
2. Free sugar
3.Molasses
Total Sales:
2,46,10,460
49,61,79,829
2,97,09,500
550,499,789
1,70,37,674
19,02,63,080
1,62,16,643
223,517,397
(-59.3)
4,28,50,855
36,21,80,664
1,93,65,656
424,397,175
(89.8)
2,27,07,868
47,45,01,715
1,89,26,446
516,136,029
(21.6)
21,685,000
29,52,05,195
3,32,62,000
328,488,880
(-36.3)
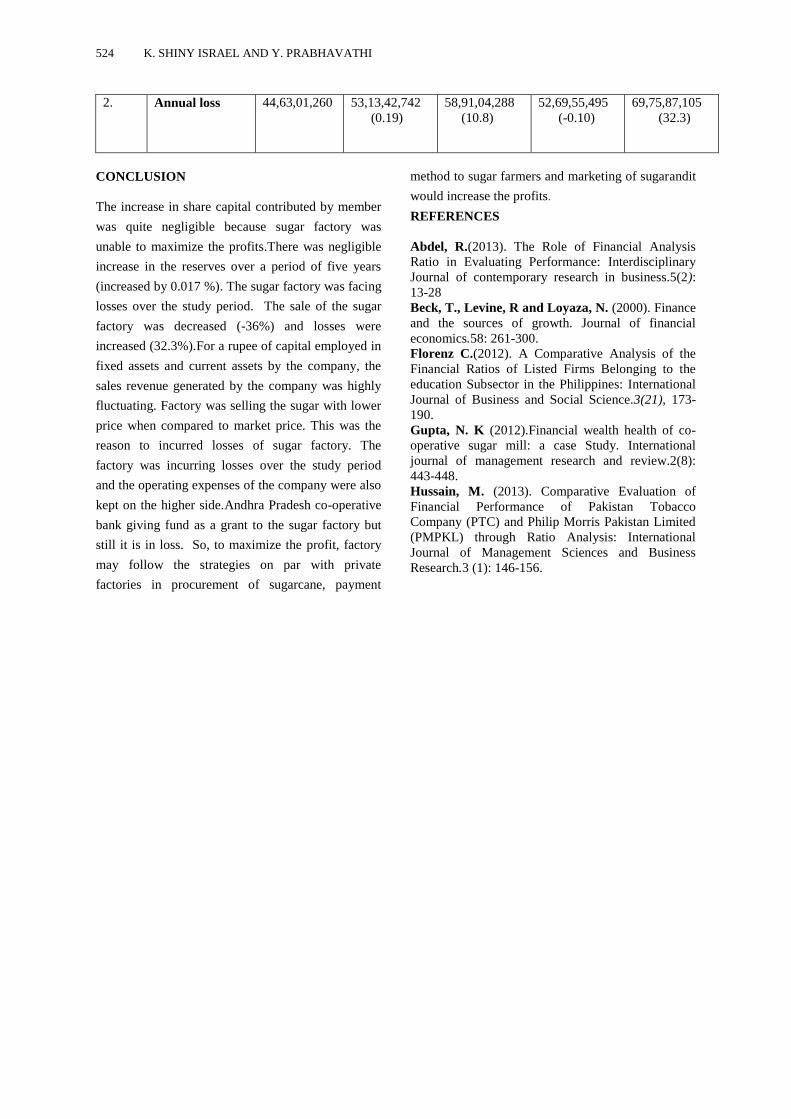
524 K. SHINY ISRAEL AND Y. PRABHAVATHI
2. Annual loss 44,63,01,260 53,13,42,742
(0.19)
58,91,04,288
(10.8)
52,69,55,495
(-0.10)
69,75,87,105
(32.3)
CONCLUSION
The increase in share capital contributed by member
was quite negligible because sugar factory was
unable to maximize the profits.There was negligible
increase in the reserves over a period of five years
(increased by 0.017 %). The sugar factory was facing
losses over the study period. The sale of the sugar
factory was decreased (-36%) and losses were
increased (32.3%).For a rupee of capital employed in
fixed assets and current assets by the company, the
sales revenue generated by the company was highly
fluctuating. Factory was selling the sugar with lower
price when compared to market price. This was the
reason to incurred losses of sugar factory. The
factory was incurring losses over the study period
and the operating expenses of the company were also
kept on the higher side.Andhra Pradesh co-operative
bank giving fund as a grant to the sugar factory but
still it is in loss. So, to maximize the profit, factory
may follow the strategies on par with private
factories in procurement of sugarcane, payment
method to sugar farmers and marketing of sugarandit
would increase the profits.
REFERENCES
Abdel, R.(2013). The Role of Financial Analysis
Ratio in Evaluating Performance: Interdisciplinary
Journal of contemporary research in business.5(2):
13-28
Beck, T., Levine, R and Loyaza, N. (2000). Finance
and the sources of growth. Journal of financial
economics.58: 261-300.
Florenz C.(2012). A Comparative Analysis of the
Financial Ratios of Listed Firms Belonging to the
education Subsector in the Philippines: International
Journal of Business and Social Science.3(21), 173-
190.
Gupta, N. K (2012).Financial wealth health of co-
operative sugar mill: a case Study. International
journal of management research and review.2(8):
443-448.
Hussain, M. (2013). Comparative Evaluation of
Financial Performance of Pakistan Tobacco
Company (PTC) and Philip Morris Pakistan Limited
(PMPKL) through Ratio Analysis: International
Journal of Management Sciences and Business
Research.3 (1): 146-156.
*Corresponding Author
________________________________________________ Journal of Plant Development Sciences Vol. 10 (9) : 525-528. 2018
INFLUENCE OF SOWING DATES AND PLANT DENSITIES ON GROWTH
PARAMETERS OF SOYBEAN (GLYCINE MAX (L.) MERRILL)
B. Sivakumar*, M. Srinivasa Reddy, P. Kavitha and S. Tirumala Reddy
Department of Agronomy, Agricultural College, Mahanandi,
ANGRAU, Hyderabad-500030 (A.P.), India
Received-02.09.2018, Revised-19.09.2018
Abstract: A field experiment was conducted during kharif season, 2014 to study the influence of different sowing dates and
plant densities on growth parameters of soybean. It was comprised of nine treatments with three sowing dates (June 28, July
14 and July 29) as main plot treatments and three row spacing of soybean (30 cm x 10 cm, 45 cm x 10 cm and 60 cm x10
cm) as sub plot treatments and replicated three times. Plant height, dry matter production, leaf area index (LAI), and Days to
50 per cent flowering increased with early sowing crop on June 28 than other two delayed sowings July 14 and July 29. July
14 sown crop is on par to June 28 sown crop. Growth parameters of soybean were inconsistent with different row spacings.
The highest plant height, dry matter production and leaf area index (LAI) was recorded at a spacing of 30 X 10 cm, more
number of days to 50 percent flowering were recorded at spacing of 60 cm x 10 cm.
Keywords: Sowing dates, Plant densities, Soybean, Growth parameters
INTRODUCTION
oybean [Glycine max (L.) Merrill] is an
important oilseed crop, which plays an important
role in the economy of India. Soybean has now
established as number one crop among oilseeds and
contributes more than 50 per cent of oilseed
production and 30 per cent of vegetable oil
production in India (Anonymous, 2008). It is a good
source of protein (40%), Oil (20%), unsaturated
fatty acids and minerals like Ca and P including
vitamin A, B, C, D which can meet-up different
nutritional needs of human and animals (Mondal et
al. 2012). Besides its main use for oil extraction, it
can be used as dal, soya milk, tofu etc. In 2013, it
occupied an area of 12 mha in India with production
of 12.8 million tones and with productivity of 1079
kg/ha. It is mainly grown in Madhya Pradesh,
Maharashtra and Rajasthan (Anonymous, 2008). The
productivity of soybean is low due to various
constraints. The time of sowing has a considerable
influence on growth and yield of soybean. Early
sowing in the season may encourage higher
vegetative growth which may invite various diseases
and insects pests. However, delayed sowing may
shrink the vegetative phase, which in turn reduces
dry matter accumulation leading to poor partitioning
to reproductive parts and ultimately poor realization
of the potential yield. In addition to sowing time
planting density is one of the main factors that has an
important role on growth and yield of soybean.
Optimum plant density ensures proper growth of the
aerial and underground parts of the plant through
efficient utilization of solar radiation, nutrients, land
as well as air spaces and water (Malek et al. 2012).
There are two general concepts to describe the
relationship between plant density and seed yield.
Firstly, irrespective of plant spacing within and
among rows, plant density must be such that the crop
develops a canopy able to intercept more than 95%
of the incoming solar radiation during reproductive
growth and secondly, a nearly equidistant plant
arrangement minimizes interplant competition and
produces maximum seed yield. Kang et al. (2001)
reported that appropriate plant density and cultivar is
necessary for obtaining high yield and quality of
soybean. The optimum plant density for higher yield
may differ from cultivar to cultivar and location to
location. There was a need to study the optimum
sowing time and optimum plant density for
producing higher yield. Therefore, an experiment
was initiated in 2014 to study the optimum sowing
time and optimum plant density.
MATERIALS AND METHODS
A field experiment was conducted during kharif,
2014 at college farm, agricultural college,
Mahanandi, ANGRAU. The soil of the experimental
site was sandy loam and it was slightly alkaline in
reaction with a pH of 7.98, EC of 0.06 dSm-1
and low
in organic carbon (0.46%) and available nitrogen
(266 kg ha-1
), medium in available phosphorous (145
kg P2O5 ha-1
) and high in available potassium (774.3
kg K2O ha-1
). The experiment was laid out in
factorial randomized block design and replicated
thrice. The treatments consisted of three sowing
dates viz., D1 (June 28), D2 (July 14) and D3 (July 29)
and three plant densities, viz., S1: 30 X 10 cm (3.33
lakh plants ha-1
), S2: 45 X 10 cm (2.22 lakh plants ha-
1) and S3: 60 X 10 cm (1.66 lakh plants ha
-1). Variety
JS335 which matures in 80-85 days was tested in this
experiment. A uniform dose of nitrogen,
phosphorous and potassium was applied as per the
recommendation @30kg N, 60kg P2O5 and 40kg
K2O ha-1
through urea, single super phosphate (SSP)
and muriate of potash (MOP) respectively to all the
plots. Entire quantity of phosphorous and potassium
S
RESEARCH ARTICLE

526 B. SIVAKUMAR, M. SRINIVASA REDDY, P. KAVITHA AND S. TIRUMALA REDDY
was applied as basal where as nitrogen was applied
in two equal splits, one at the time of sowing and
another at 30 days after sowing (DAS). No serious
attack of pests and diseases was observed. However,
minor incidence of tobacco caterpillar (Spodoptera
litura (Fab.) was observed at flowering.
Monocrotophos @ 2 ml L-1
and Acephate (0.08%) @
2ml L-1
were used for effective control of pest.
Weeding was done at 15 and 30 DAS of each sowing
date to keep the plots free from weeds. When crop
was subjected to prolonged dry spell to protect the
crop the irrigation was given. The total rainfall
received during crop growth was 515.2mm in 28
rainy days. Five plants were randomly selected in the
net plot area and tagged. Plant height of these plants
was recorded at 30, 60 DAS and at harvest from the
base of the plant to the tip of the growing point. The
mean value of five plants was computed and
expressed as plant height in cm. Dry matter
production was measured at 30, 60 DAS and at
harvest. Five plants were randomly selected in the
gross plot and dug out these plants for destructive
sampling. They were oven dried at 600C till a
constant weight is obtained. The dry weight per m2
was calculated and expressed as kg ha-1
. Leaf area
index (LAI) was measured at 30, 60 DAS and at
harvest. The leaf area was measured by electronic
leaf area meter. LAI was calculated using the
formula as Leaf area from the five plants divide by
ground area allowed for five plants. The number of
days taken from sowing to the attainment of fifty per
cent plants to flowering in the experimental plot was
considered as days to 50 percent flowering.
RESULTS AND DISCUSSION
Effect of sowing dates
Growth parameters
The differences in plant height due to different
sowing dates were significant from 30 days after
sowing onwards to harvest. Sowing of soybean on
June 28 increased the plant height (38.1 cm)
significantly over rest of the sowing dates i.e. July 14
and July 29 at 30, 60 days after sowing and at
harvest. Similarly next date of sowing July 14
sowing resulted in significantly taller plants than July
29 sowing at 30, 60 days after sowing and at harvest.
Taller plants in early sowing date might be due to
favorable environment enjoyed by early sown crop
than that sown at later dates even after receiving
similar inputs and less number of nodes and reduced
inter nodal distances caused by non-optimal sowing
time could be the reason for reduction in plant height
under delayed sowing dates. Shuddhodhan and
Jadhao (1986) also reported the enhancement of
growth characteristics with early sowings when
compared to late sown conditions in soybean. The
total drymatter production increased significantly
from 30 days after sowing to harvest. A gradual
increase in total dry matter production was noted
from 60 days after sowing. The total dry matter
production recorded at June 28 sowing was
significantly higher (3762 kg ha-1
) over the rest of
sowing dates i.e. July 14 and July 29 sowings.
Maximum drymatter accumulation in the early sown
crop was perhaps due to more plant height, higher
leaf area index and vigorous vegetative growth.
These are in conformity with the results reported by
Hanumantharao et al. (1990). The maximum leaf
area index (4.1) was registered with June 28 sowing
over July 14 and July 29 sowings throughout the crop
growth period. Sowing of soybean on July 29
resulted in early 50 per cent flowering (35 days) than
June 28 and July 14 sowings. Similarly July 14
sowing attained early flowering in soybean than June
28 sowing. The reduction in total duration from
sowing to 50 percent flowering might be due to
photosensitivity of soybean plant.
Effect of plant densities
With regard to spacings narrow row spacing 30 cm x
10 cm recorded more plant height (40.7 cm) than 45
cm x 10 cm and 60 cm x 10 cm spacings at 30, 60
days after sowing and at harvest. Similarly medium
row spacing 45 cm x 10 cm resulted in significantly
taller plants than wider row spacing 60 cm x 10 cm at
30, 60 days after sowing and at harvest. The positive
relationship of closer spacing on plant height might
be attributed to high inter-plant competition, which
caused internodal elongation as reported by
Ravichandran and Ramaswami (1992) and Halvankar
et al. (1993). Among row spacings 30 cm x 10 cm
spacing recorded highest total dry matter production
(3532 kg ha-1
) and it was significantly superior over
rest of row spacings i.e. 45 cm x 10 cm and 60 cm x
10 cm. Higher drymatter production in closer spacing
may have been due to the cumulative effect of more
number of plants per unit area, higher leaf area index
and more light interception. Arnon (1971) indicated
that dry matter yield tend to increase linearly with
increase in plant density of different crops. The
present findings are in accordance with the findings
reported by Duraisingh and Gopalaswamy (1991)
and Halvankar et al. (1999). Narrow row spacing of
30 cm x 10 cm recorded maximum leaf area index
(4.7) over the 45 cm x 10 cm and 60cm x 10 cm
spacings at all the stages of crop growth. Similarly
45cm x 10 cm spacing recorded a higher leaf area
index values over 60 cm x 10 cm spacing throughout
the crop growth period. Increase in leaf area index
with early sowing due to favorable environment for
the crop during vegetative phase. The decrease in
leaf index particularly at later stages of crop growth
was mainly due to leaf senescence. Similar results
were reported by Halvanker et al. (1989) and Sahoo
et al. (1991). With regard to row spacings narrow
row spacing 30 cm x 10 cm resulted in early 50 per
cent flowering (52 days) than 45 cm x 10 cm and 60
cm x 10 cm spacings. The reduction in days to 50
per cent flowering might be due to intra plant
competition in dense planting. This was also
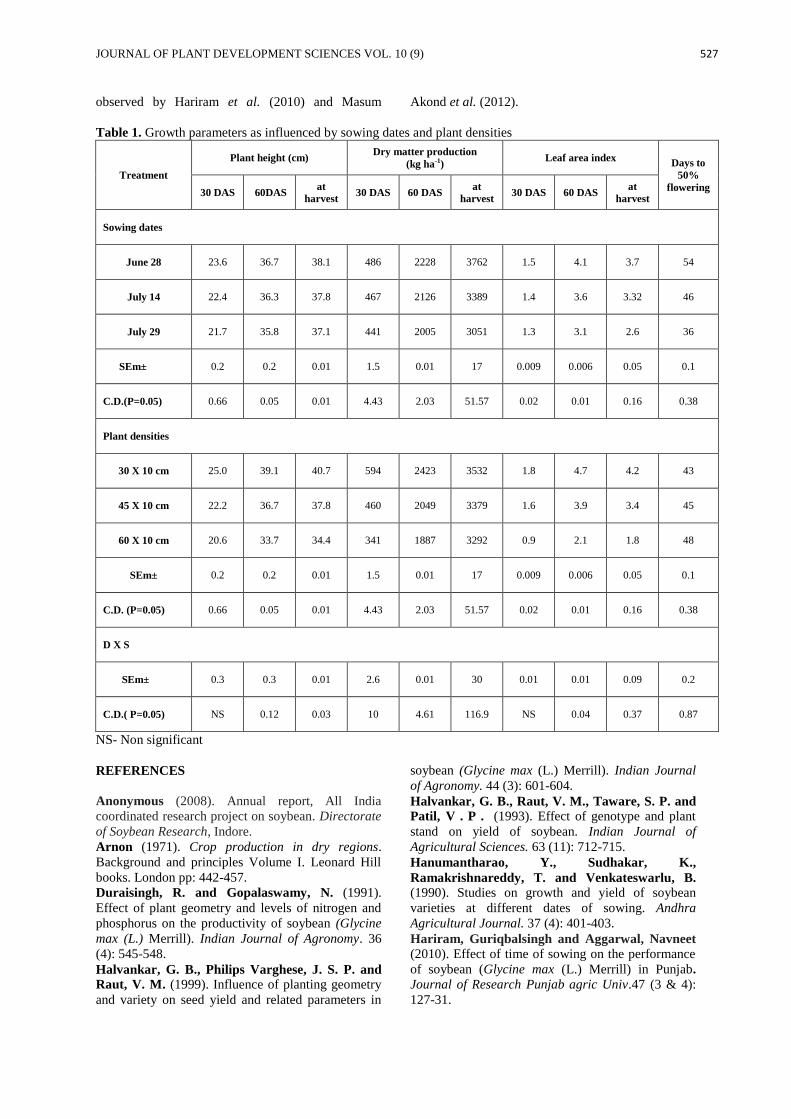
JOURNAL OF PLANT DEVELOPMENT SCIENCES VOL. 10 (9) 527
observed by Hariram et al. (2010) and Masum Akond et al. (2012).
Table 1. Growth parameters as influenced by sowing dates and plant densities
Treatment
Plant height (cm) Dry matter production
(kg ha-1) Leaf area index
Days to
50%
flowering 30 DAS 60DAS
at
harvest 30 DAS 60 DAS
at
harvest 30 DAS 60 DAS
at
harvest
Sowing dates
June 28 23.6 36.7 38.1 486 2228 3762 1.5 4.1 3.7 54
July 14 22.4 36.3 37.8 467 2126 3389 1.4 3.6 3.32 46
July 29 21.7 35.8 37.1 441 2005 3051 1.3 3.1 2.6 36
SEm± 0.2 0.2 0.01 1.5 0.01 17 0.009 0.006 0.05 0.1
C.D.(P=0.05) 0.66 0.05 0.01 4.43 2.03 51.57 0.02 0.01 0.16 0.38
Plant densities
30 X 10 cm 25.0 39.1 40.7 594 2423 3532 1.8 4.7 4.2 43
45 X 10 cm 22.2 36.7 37.8 460 2049 3379 1.6 3.9 3.4 45
60 X 10 cm 20.6 33.7 34.4 341 1887 3292 0.9 2.1 1.8 48
SEm± 0.2 0.2 0.01 1.5 0.01 17 0.009 0.006 0.05 0.1
C.D. (P=0.05) 0.66 0.05 0.01 4.43 2.03 51.57 0.02 0.01 0.16 0.38
D X S
SEm± 0.3 0.3 0.01 2.6 0.01 30 0.01 0.01 0.09 0.2
C.D.( P=0.05) NS 0.12 0.03 10 4.61 116.9 NS 0.04 0.37 0.87
NS- Non significant
REFERENCES
Anonymous (2008). Annual report, All India
coordinated research project on soybean. Directorate
of Soybean Research, Indore.
Arnon (1971). Crop production in dry regions.
Background and principles Volume I. Leonard Hill
books. London pp: 442-457.
Duraisingh, R. and Gopalaswamy, N. (1991).
Effect of plant geometry and levels of nitrogen and
phosphorus on the productivity of soybean (Glycine
max (L.) Merrill). Indian Journal of Agronomy. 36
(4): 545-548.
Halvankar, G. B., Philips Varghese, J. S. P. and
Raut, V. M. (1999). Influence of planting geometry
and variety on seed yield and related parameters in
soybean (Glycine max (L.) Merrill). Indian Journal
of Agronomy. 44 (3): 601-604.
Halvankar, G. B., Raut, V. M., Taware, S. P. and
Patil, V . P . (1993). Effect of genotype and plant
stand on yield of soybean. Indian Journal of
Agricultural Sciences. 63 (11): 712-715.
Hanumantharao, Y., Sudhakar, K.,
Ramakrishnareddy, T. and Venkateswarlu, B. (1990). Studies on growth and yield of soybean
varieties at different dates of sowing. Andhra
Agricultural Journal. 37 (4): 401-403.
Hariram, Guriqbalsingh and Aggarwal, Navneet
(2010). Effect of time of sowing on the performance
of soybean (Glycine max (L.) Merrill) in Punjab.
Journal of Research Punjab agric Univ.47 (3 & 4):
127-31.
528 B. SIVAKUMAR, M. SRINIVASA REDDY, P. KAVITHA AND S. TIRUMALA REDDY
Kang, Y.K., Kim, H.T., Cho, N.K. and Kim, Y.C. (2001). Effect of planting date and plant density on
yield and quality of soybean in Jeju. Korean Journal
of Crop Science. 46 (1): 95-99.
Malek, M.A., Shafiquzzaman, M., Rahman, M.S.,
Ismail, M.R. and Mondal, M.M.A. (2012).
Standardization of soybean row spacing based on
morphophysiological characters. Legume Research
2012; 35: 138-143.
Masum Akond, G., Ragin, Bobby, Richard,
Bazzelle and Wilsheana, Clark (2012). Effect of
two row spaces on several agronomic traits in soy-
bean (Glycine max (L.) Merr.) Atlas Journal of Plant
Biology. 1 (2): 18–23.
Mondal, M.M.A., Puteh, A.B., Malek, M.A. and
Ismail, M.R. (2002). Determination of optimum
seed rate for mungbean based on morpho-
physiological criteria. Legume Research. 35: 126-
131.
Ravichandran, V. K. and Ramaswami, C. (1992).
Response of soybean to different plant densities.
Madras Agricultural Journal. 79 (3): 181-182.
Sahoo, N. C., Mahapatra, P. K., Dixit, R. C. and
Uttaray, S. K. (1991). Effect of sowing date on
growth, yield and quality of soybean (Glycine max
(L). Merrill). Indian Journal of Agricultural
Sciences. 61 (9): 665-668.
Shuddhodhan, R. and Jadhao, S. L. (1986). Effect
of different dates of sowing on yield of various rabi
crops. Thesis Abstract XII (1-4): 31.
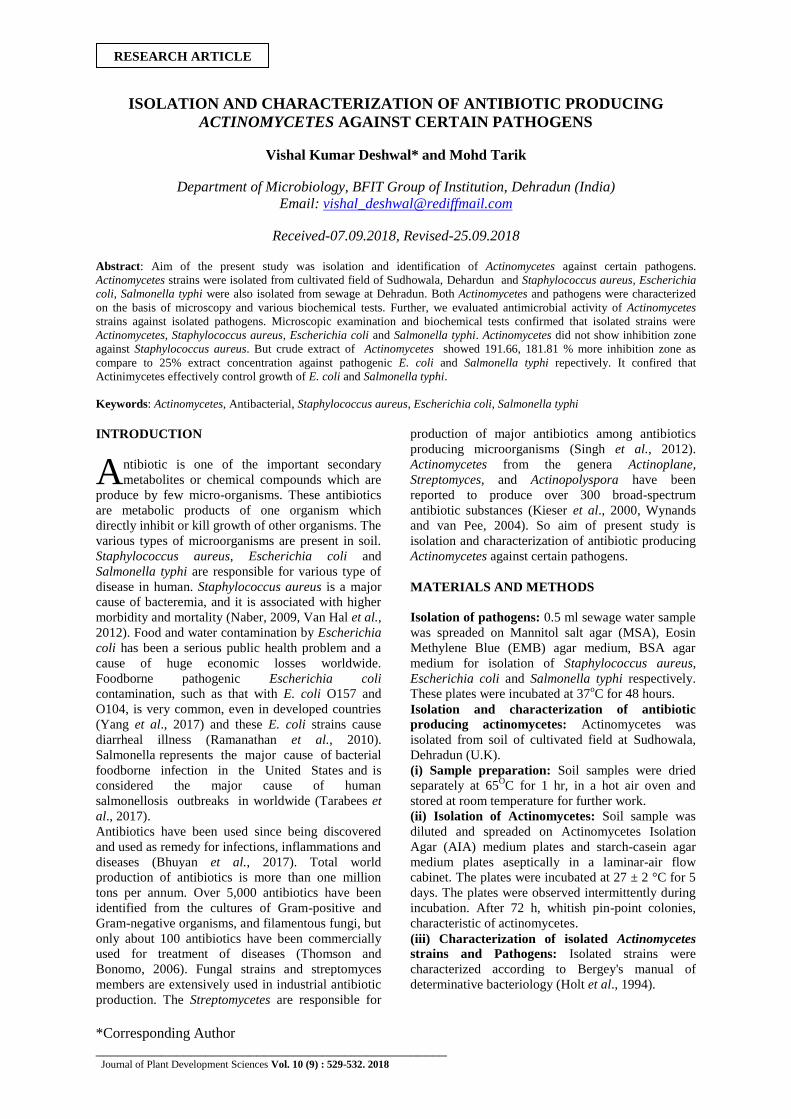
*Corresponding Author
________________________________________________ Journal of Plant Development Sciences Vol. 10 (9) : 529-532. 2018
ISOLATION AND CHARACTERIZATION OF ANTIBIOTIC PRODUCING
ACTINOMYCETES AGAINST CERTAIN PATHOGENS
Vishal Kumar Deshwal* and Mohd Tarik
Department of Microbiology, BFIT Group of Institution, Dehradun (India)
Email: [email protected]
Received-07.09.2018, Revised-25.09.2018
Abstract: Aim of the present study was isolation and identification of Actinomycetes against certain pathogens.
Actinomycetes strains were isolated from cultivated field of Sudhowala, Dehardun and Staphylococcus aureus, Escherichia
coli, Salmonella typhi were also isolated from sewage at Dehradun. Both Actinomycetes and pathogens were characterized
on the basis of microscopy and various biochemical tests. Further, we evaluated antimicrobial activity of Actinomycetes
strains against isolated pathogens. Microscopic examination and biochemical tests confirmed that isolated strains were
Actinomycetes, Staphylococcus aureus, Escherichia coli and Salmonella typhi. Actinomycetes did not show inhibition zone
against Staphylococcus aureus. But crude extract of Actinomycetes showed 191.66, 181.81 % more inhibition zone as
compare to 25% extract concentration against pathogenic E. coli and Salmonella typhi repectively. It confired that
Actinimycetes effectively control growth of E. coli and Salmonella typhi.
Keywords: Actinomycetes, Antibacterial, Staphylococcus aureus, Escherichia coli, Salmonella typhi
INTRODUCTION
ntibiotic is one of the important secondary
metabolites or chemical compounds which are
produce by few micro-organisms. These antibiotics
are metabolic products of one organism which
directly inhibit or kill growth of other organisms. The
various types of microorganisms are present in soil.
Staphylococcus aureus, Escherichia coli and
Salmonella typhi are responsible for various type of
disease in human. Staphylococcus aureus is a major
cause of bacteremia, and it is associated with higher
morbidity and mortality (Naber, 2009, Van Hal et al.,
2012). Food and water contamination by Escherichia
coli has been a serious public health problem and a
cause of huge economic losses worldwide.
Foodborne pathogenic Escherichia coli
contamination, such as that with E. coli O157 and
O104, is very common, even in developed countries
(Yang et al., 2017) and these E. coli strains cause
diarrheal illness (Ramanathan et al., 2010).
Salmonella represents the major cause of bacterial
foodborne infection in the United States and is
considered the major cause of human
salmonellosis outbreaks in worldwide (Tarabees et
al., 2017).
Antibiotics have been used since being discovered
and used as remedy for infections, inflammations and
diseases (Bhuyan et al., 2017). Total world
production of antibiotics is more than one million
tons per annum. Over 5,000 antibiotics have been
identified from the cultures of Gram-positive and
Gram-negative organisms, and filamentous fungi, but
only about 100 antibiotics have been commercially
used for treatment of diseases (Thomson and
Bonomo, 2006). Fungal strains and streptomyces
members are extensively used in industrial antibiotic
production. The Streptomycetes are responsible for
production of major antibiotics among antibiotics
producing microorganisms (Singh et al., 2012).
Actinomycetes from the genera Actinoplane,
Streptomyces, and Actinopolyspora have been
reported to produce over 300 broad-spectrum
antibiotic substances (Kieser et al., 2000, Wynands
and van Pee, 2004). So aim of present study is
isolation and characterization of antibiotic producing
Actinomycetes against certain pathogens.
MATERIALS AND METHODS
Isolation of pathogens: 0.5 ml sewage water sample
was spreaded on Mannitol salt agar (MSA), Eosin
Methylene Blue (EMB) agar medium, BSA agar
medium for isolation of Staphylococcus aureus,
Escherichia coli and Salmonella typhi respectively.
These plates were incubated at 37oC for 48 hours.
Isolation and characterization of antibiotic
producing actinomycetes: Actinomycetes was
isolated from soil of cultivated field at Sudhowala,
Dehradun (U.K).
(i) Sample preparation: Soil samples were dried
separately at 65OC for 1 hr, in a hot air oven and
stored at room temperature for further work.
(ii) Isolation of Actinomycetes: Soil sample was
diluted and spreaded on Actinomycetes Isolation
Agar (AIA) medium plates and starch-casein agar
medium plates aseptically in a laminar-air flow
cabinet. The plates were incubated at 27 ± 2 °C for 5
days. The plates were observed intermittently during
incubation. After 72 h, whitish pin-point colonies,
characteristic of actinomycetes.
(iii) Characterization of isolated Actinomycetes
strains and Pathogens: Isolated strains were
characterized according to Bergey's manual of
determinative bacteriology (Holt et al., 1994).
A
RESEARCH ARTICLE
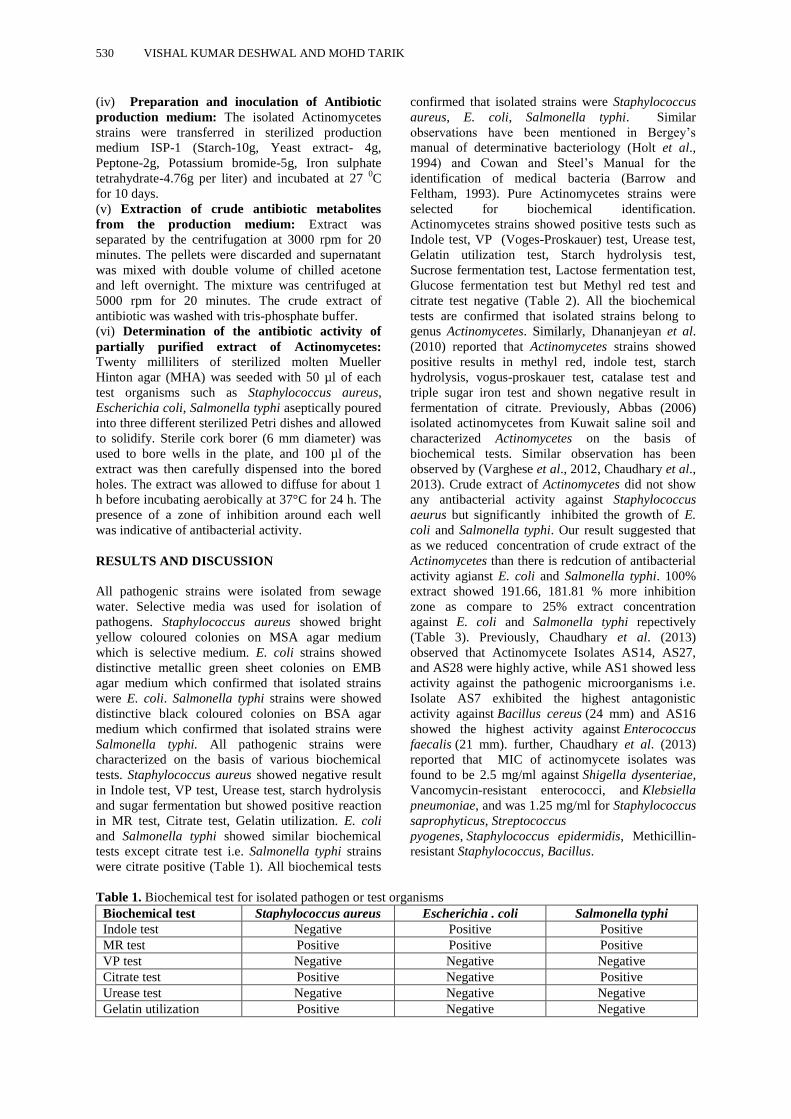
530 VISHAL KUMAR DESHWAL AND MOHD TARIK
(iv) Preparation and inoculation of Antibiotic
production medium: The isolated Actinomycetes
strains were transferred in sterilized production
medium ISP-1 (Starch-10g, Yeast extract- 4g,
Peptone-2g, Potassium bromide-5g, Iron sulphate
tetrahydrate-4.76g per liter) and incubated at 27 0C
for 10 days.
(v) Extraction of crude antibiotic metabolites
from the production medium: Extract was
separated by the centrifugation at 3000 rpm for 20
minutes. The pellets were discarded and supernatant
was mixed with double volume of chilled acetone
and left overnight. The mixture was centrifuged at
5000 rpm for 20 minutes. The crude extract of
antibiotic was washed with tris-phosphate buffer.
(vi) Determination of the antibiotic activity of
partially purified extract of Actinomycetes:
Twenty milliliters of sterilized molten Mueller
Hinton agar (MHA) was seeded with 50 µl of each
test organisms such as Staphylococcus aureus,
Escherichia coli, Salmonella typhi aseptically poured
into three different sterilized Petri dishes and allowed
to solidify. Sterile cork borer (6 mm diameter) was
used to bore wells in the plate, and 100 µl of the
extract was then carefully dispensed into the bored
holes. The extract was allowed to diffuse for about 1
h before incubating aerobically at 37°C for 24 h. The
presence of a zone of inhibition around each well
was indicative of antibacterial activity.
RESULTS AND DISCUSSION
All pathogenic strains were isolated from sewage
water. Selective media was used for isolation of
pathogens. Staphylococcus aureus showed bright
yellow coloured colonies on MSA agar medium
which is selective medium. E. coli strains showed
distinctive metallic green sheet colonies on EMB
agar medium which confirmed that isolated strains
were E. coli. Salmonella typhi strains were showed
distinctive black coloured colonies on BSA agar
medium which confirmed that isolated strains were
Salmonella typhi. All pathogenic strains were
characterized on the basis of various biochemical
tests. Staphylococcus aureus showed negative result
in Indole test, VP test, Urease test, starch hydrolysis
and sugar fermentation but showed positive reaction
in MR test, Citrate test, Gelatin utilization. E. coli
and Salmonella typhi showed similar biochemical
tests except citrate test i.e. Salmonella typhi strains
were citrate positive (Table 1). All biochemical tests
confirmed that isolated strains were Staphylococcus
aureus, E. coli, Salmonella typhi. Similar
observations have been mentioned in Bergey’s
manual of determinative bacteriology (Holt et al.,
1994) and Cowan and Steel’s Manual for the
identification of medical bacteria (Barrow and
Feltham, 1993). Pure Actinomycetes strains were
selected for biochemical identification.
Actinomycetes strains showed positive tests such as
Indole test, VP (Voges-Proskauer) test, Urease test,
Gelatin utilization test, Starch hydrolysis test,
Sucrose fermentation test, Lactose fermentation test,
Glucose fermentation test but Methyl red test and
citrate test negative (Table 2). All the biochemical
tests are confirmed that isolated strains belong to
genus Actinomycetes. Similarly, Dhananjeyan et al.
(2010) reported that Actinomycetes strains showed
positive results in methyl red, indole test, starch
hydrolysis, vogus-proskauer test, catalase test and
triple sugar iron test and shown negative result in
fermentation of citrate. Previously, Abbas (2006)
isolated actinomycetes from Kuwait saline soil and
characterized Actinomycetes on the basis of
biochemical tests. Similar observation has been
observed by (Varghese et al., 2012, Chaudhary et al.,
2013). Crude extract of Actinomycetes did not show
any antibacterial activity against Staphylococcus
aeurus but significantly inhibited the growth of E.
coli and Salmonella typhi. Our result suggested that
as we reduced concentration of crude extract of the
Actinomycetes than there is redcution of antibacterial
activity agianst E. coli and Salmonella typhi. 100%
extract showed 191.66, 181.81 % more inhibition
zone as compare to 25% extract concentration
against E. coli and Salmonella typhi repectively
(Table 3). Previously, Chaudhary et al. (2013)
observed that Actinomycete Isolates AS14, AS27,
and AS28 were highly active, while AS1 showed less
activity against the pathogenic microorganisms i.e.
Isolate AS7 exhibited the highest antagonistic
activity against Bacillus cereus (24 mm) and AS16
showed the highest activity against Enterococcus
faecalis (21 mm). further, Chaudhary et al. (2013)
reported that MIC of actinomycete isolates was
found to be 2.5 mg/ml against Shigella dysenteriae,
Vancomycin-resistant enterococci, and Klebsiella
pneumoniae, and was 1.25 mg/ml for Staphylococcus
saprophyticus, Streptococcus
pyogenes, Staphylococcus epidermidis, Methicillin-
resistant Staphylococcus, Bacillus.
Table 1. Biochemical test for isolated pathogen or test organisms
Biochemical test Staphylococcus aureus Escherichia . coli Salmonella typhi
Indole test Negative Positive Positive
MR test Positive Positive Positive
VP test Negative Negative Negative
Citrate test Positive Negative Positive
Urease test Negative Negative Negative
Gelatin utilization Positive Negative Negative
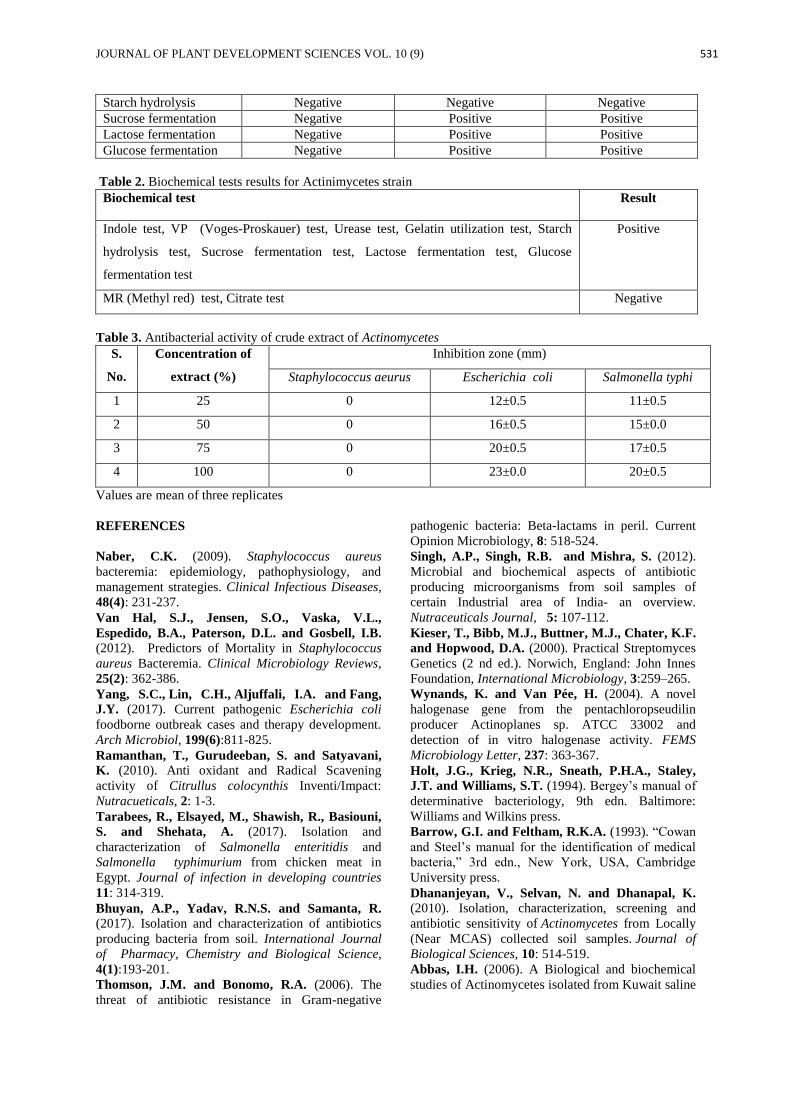
JOURNAL OF PLANT DEVELOPMENT SCIENCES VOL. 10 (9) 531
Starch hydrolysis Negative Negative Negative
Sucrose fermentation Negative Positive Positive
Lactose fermentation Negative Positive Positive
Glucose fermentation Negative Positive Positive
Table 2. Biochemical tests results for Actinimycetes strain
Biochemical test Result
Indole test, VP (Voges-Proskauer) test, Urease test, Gelatin utilization test, Starch
hydrolysis test, Sucrose fermentation test, Lactose fermentation test, Glucose
fermentation test
Positive
MR (Methyl red) test, Citrate test Negative
Table 3. Antibacterial activity of crude extract of Actinomycetes
S.
No.
Concentration of
extract (%)
Inhibition zone (mm)
Staphylococcus aeurus Escherichia coli Salmonella typhi
1 25 0 12±0.5 11±0.5
2 50 0 16±0.5 15±0.0
3 75 0 20±0.5 17±0.5
4 100 0 23±0.0 20±0.5
Values are mean of three replicates
REFERENCES
Naber, C.K. (2009). Staphylococcus aureus
bacteremia: epidemiology, pathophysiology, and
management strategies. Clinical Infectious Diseases,
48(4): 231-237.
Van Hal, S.J., Jensen, S.O., Vaska, V.L.,
Espedido, B.A., Paterson, D.L. and Gosbell, I.B.
(2012). Predictors of Mortality in Staphylococcus
aureus Bacteremia. Clinical Microbiology Reviews,
25(2): 362-386.
Yang, S.C., Lin, C.H., Aljuffali, I.A. and Fang,
J.Y. (2017). Current pathogenic Escherichia coli
foodborne outbreak cases and therapy development.
Arch Microbiol, 199(6):811-825.
Ramanthan, T., Gurudeeban, S. and Satyavani,
K. (2010). Anti oxidant and Radical Scavening
activity of Citrullus colocynthis Inventi/Impact:
Nutracueticals, 2: 1-3.
Tarabees, R., Elsayed, M., Shawish, R., Basiouni,
S. and Shehata, A. (2017). Isolation and
characterization of Salmonella enteritidis and
Salmonella typhimurium from chicken meat in
Egypt. Journal of infection in developing countries
11: 314-319.
Bhuyan, A.P., Yadav, R.N.S. and Samanta, R. (2017). Isolation and characterization of antibiotics
producing bacteria from soil. International Journal
of Pharmacy, Chemistry and Biological Science,
4(1):193-201.
Thomson, J.M. and Bonomo, R.A. (2006). The
threat of antibiotic resistance in Gram-negative
pathogenic bacteria: Beta-lactams in peril. Current
Opinion Microbiology, 8: 518-524.
Singh, A.P., Singh, R.B. and Mishra, S. (2012).
Microbial and biochemical aspects of antibiotic
producing microorganisms from soil samples of
certain Industrial area of India- an overview.
Nutraceuticals Journal, 5: 107-112.
Kieser, T., Bibb, M.J., Buttner, M.J., Chater, K.F.
and Hopwood, D.A. (2000). Practical Streptomyces
Genetics (2 nd ed.). Norwich, England: John Innes
Foundation, International Microbiology, 3:259–265.
Wynands, K. and Van Pée, H. (2004). A novel
halogenase gene from the pentachloropseudilin
producer Actinoplanes sp. ATCC 33002 and
detection of in vitro halogenase activity. FEMS
Microbiology Letter, 237: 363-367.
Holt, J.G., Krieg, N.R., Sneath, P.H.A., Staley,
J.T. and Williams, S.T. (1994). Bergey’s manual of
determinative bacteriology, 9th edn. Baltimore:
Williams and Wilkins press.
Barrow, G.I. and Feltham, R.K.A. (1993). “Cowan
and Steel’s manual for the identification of medical
bacteria,” 3rd edn., New York, USA, Cambridge
University press.
Dhananjeyan, V., Selvan, N. and Dhanapal, K.
(2010). Isolation, characterization, screening and
antibiotic sensitivity of Actinomycetes from Locally
(Near MCAS) collected soil samples. Journal of
Biological Sciences, 10: 514-519.
Abbas, I.H. (2006). A Biological and biochemical
studies of Actinomycetes isolated from Kuwait saline

532 VISHAL KUMAR DESHWAL AND MOHD TARIK
soil-Kuwait. Journal of Applied Science Research,
2(10): 809-815.
Varghese, R., Nishamol, S., Suchithra, R. and
Hatha, A.A.M. (2012). Biochemical and
physiological characteristics of Actinomycetes
isolated from high altitude shola soils of tropical
Montane forest. Indian Journal of Innovations
Development, 1(3):142-144.
Chaudhary, H.S., Yadav, J., Shrivastava, A.R.,
Singh,S., Singh, A.K. and Gopalan N. (2013).
Antibacterial activity of Actinomycetes isolated from
different soil samples of Sheopur (A city of central
India). Journal of Advanced Pharmaceutical
Technology and Research. 4(2):118-123.