JOURNAL OF SOCIAL AND DEVELOPMENT SCIENCES ...
96
Jornal of Social and Development Sciences (JSDS) Vol. 7, No. 2, June 2016 (ISSN 2221-1152) 1 Published by International Foundation for Research and Development (IFRD) Vol. 7 No. 2 ISSN 2221-1152 JOURNAL OF SOCIAL AND DEVELOPMENT SCIENCES (JSDS)
-
Upload
khangminh22 -
Category
Documents
-
view
1 -
download
0
Transcript of JOURNAL OF SOCIAL AND DEVELOPMENT SCIENCES ...
Jornal of Social and Development Sciences (JSDS) Vol. 7, No. 2, June 2016 (ISSN 2221-1152)
1
Published by
International Foundation for Research and Development (IFRD)
Vol. 7 No. 2 ISSN 2221-1152
JOURNAL OF SOCIAL AND DEVELOPMENT SCIENCES
(JSDS)
Jornal of Social and Development Sciences (JSDS) Vol. 7, No. 2, June 2016 (ISSN 2221-1152)
2
Editorial Journal of Social and Development Sciences (JSDS) is a scholarly journal deals with the disciplines of social and development sciences. JSDS publishes research work that meaningfully contributes towards theoretical bases of contemporary developments in society, business and related disciplines. The work submitted for publication consideration in JSDS should address empirical and theoretical contributions in the subjects related to scope of the journal in particular and allied theories and practices in general. Scope of JSDS includes: sociology, psychology, anthropology, economics, political science, international relations, linguistics, history, public relations, hospitality & tourism and project management. Author(s) should declare that work submitted to the journal is original, not under consideration for publication by another journal, and that all listed authors approve its submission to JSDS. It is JSDS policy to welcome submissions for consideration, which are original, and not under consideration for publication by another journal at the same time. Author (s) can submit: Research Paper, Conceptual Paper, Case Studies and Book Review. The current issue of JSDS consists of papers of scholars from Indonesia, Australia, South Africa, India and Zimbabwe. Utilization of
riparian area for settlements, rural area development strategy, energy social responsibility, health level of local government owned enterprises, empowerment of village development program, community participation in the process of villages infrastructure development, strategic issues of regional development, political stability and national development, public service by the government & special autonomy, global
indices of leadership in organic agriculture and impact of inclusive education on learners with disabilities are some of the major practices and concepts examined in these studies. Journal received research submission related to all aspects of major themes and tracks. All the submitted papers were first assessed by the editorial team for relevance and originality of the work and blindly peer reviewed by the external reviewers depending on the subject matter of the paper. After the rigorous peer-review process, the submitted papers were selected based on originality, significance, and clarity of the purpose. Current issue will therefore be a unique offer, where scholars will be able to appreciate the latest results in their field of expertise, and to acquire additional knowledge in other relevant fields.
Prof. Nek Kamal Yeop Yunus, Ph. D. Editor In Chief
Jornal of Social and Development Sciences (JSDS) Vol. 7, No. 2, June 2016 (ISSN 2221-1152)
3
Editorial Board
Editor In Chief
Nek Kamal Yeop Yunus, Ph. D, University Pendidikan Sultan Idris, Malaysia
Members
N. Panchanatham, Ph. D, Annamalai University, India
Somnath Sen, Ph. D, Birmingham University, UK
Anton Miglo, Ph. D, School of business, University of Bridgeport, USA
Mamta B Chowdhury, Ph. D, University of Western Sydney, Australia
R. K. Uppal, International University of Contemporary Studies, USA
Ketna Mehta, Ph. D, Welingkar Education, India
Khorshed Chowdhury, Ph. D, University of Wollongong, Australia
Inderjeet Singh, Ph. D, Punjabi University, Patiala, India
Ananda Wickramasinghe Ph. D, CQ University, Australia
Hai-Chin YU, Ph. D, Chung Yuan University ,Chungli, Taiwan
Mohan Bhai Patel, Ph. D, N S Arts College, India
Yapa M W Y Bandara, Ph. D, Charles Sturt University, Australia
Pacha Malyadri, Ph. D, Osmania University, Andhra Pradesh, India
Chux Gervase Iwu, Ph. D, Cape Peninsula University of Technology, South Africa
Pratibha Samson Gaikwad, Ph. D, Shivaji University of Pune, India
Mohammad Reza Noruzi, Ph. D, Tarbiat Modarres University, Tehran, Iran
M Azhar Khan, Ph. D, Hokkaido University, Japan Apostu Iulian, Ph. D, University of Bucharest, Romania
Rajendra Parsad GUNPUTH, Ph. D., University of Mauritius, Mauritius
Jornal of Social and Development Sciences (JSDS) Vol. 7, No. 2, June 2016 (ISSN 2221-1152)
4
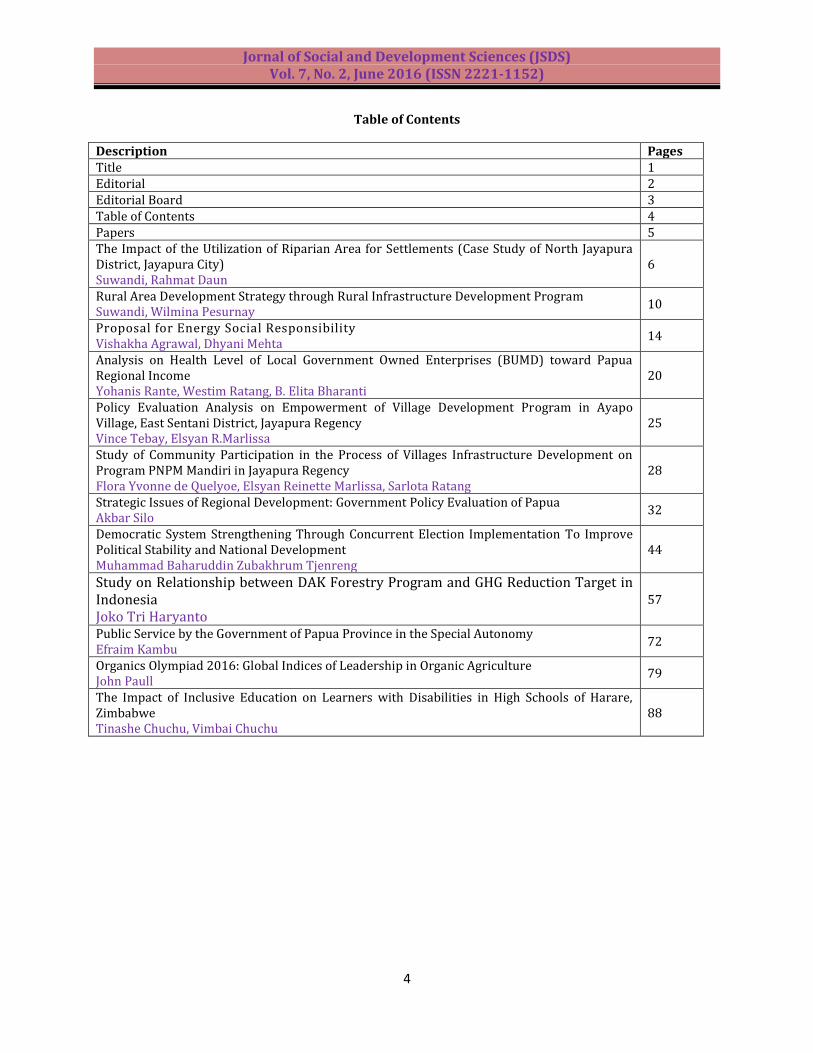
Table of Contents
Description Pages Title 1 Editorial 2 Editorial Board 3 Table of Contents 4 Papers 5 The Impact of the Utilization of Riparian Area for Settlements (Case Study of North Jayapura District, Jayapura City) Suwandi, Rahmat Daun
6
Rural Area Development Strategy through Rural Infrastructure Development Program Suwandi, Wilmina Pesurnay
10
Proposal for Energy Social Responsibility Vishakha Agrawal, Dhyani Mehta
14
Analysis on Health Level of Local Government Owned Enterprises (BUMD) toward Papua Regional Income Yohanis Rante, Westim Ratang, B. Elita Bharanti
20
Policy Evaluation Analysis on Empowerment of Village Development Program in Ayapo Village, East Sentani District, Jayapura Regency Vince Tebay, Elsyan R.Marlissa
25
Study of Community Participation in the Process of Villages Infrastructure Development on Program PNPM Mandiri in Jayapura Regency Flora Yvonne de Quelyoe, Elsyan Reinette Marlissa, Sarlota Ratang
28
Strategic Issues of Regional Development: Government Policy Evaluation of Papua Akbar Silo
32
Democratic System Strengthening Through Concurrent Election Implementation To Improve Political Stability and National Development Muhammad Baharuddin Zubakhrum Tjenreng
44
Study on Relationship between DAK Forestry Program and GHG Reduction Target in Indonesia Joko Tri Haryanto
57
Public Service by the Government of Papua Province in the Special Autonomy Efraim Kambu
72
Organics Olympiad 2016: Global Indices of Leadership in Organic Agriculture John Paull
79
The Impact of Inclusive Education on Learners with Disabilities in High Schools of Harare, Zimbabwe Tinashe Chuchu, Vimbai Chuchu
88
Jornal of Social and Development Sciences (JSDS) Vol. 7, No. 2, June 2016 (ISSN 2221-1152)
5
PAPERS
Jornal of Social and Development Sciences (JSDS) Vol. 7, No. 2, June 2016 (ISSN 2221-1152)
6
The Impact of the Utilization of Riparian Area for Settlements (Case Study of North Jayapura District,
Jayapura City)
Suwandi, Rahmat Daun University of Cenderawasih Jayapura Papua, Indonesia
[email protected] Abstract: The limitedness of area and plot of land in Jayapura City which are allocated for settlements has become a problem in Jayapura city. Population growth and high-rate of urbanization are impacted on the utilization of land which is not in accordance with its allocation. The modification of riparian area on the right and left sides of the river for settlements has reduced the function of the river, because in addition to river conservation, river has a double role as the securer of water source and as the protector of its surrounding area. Therefore, riparian area becomes more important to be considered. The riparian area in settlement area is assumed to be adequate for a 10-15 meters inspection road to be built on. The real condition of the rivers in North Jayapura District of Jayapura City, compared to the criteria of riparian area for settlement area, has not been inappropriate. The river’s function as the protector of its surrounding area has gone astray. If there is someday a flood, the impact may cause material damage or even life victims. Keywords: Riparian Area, Settlement, North Jayapura
1. Introduction A city which is a life network marked by high population density and colored by heterogeneous social economic strata (Anthony, 1992), in the end may bring influence to the process of physical growth and development of the city itself. The city’s physical growth and development are also influenced by the basic physical condition of a region or area such as topography and earth’s relief of a region or area (Barnett, 1982). In addition to an aspect of requirement of the people of a certain activity which later will cause various phenomena imply on the utilization of city space and in general to the formation of the city’s face. As one of the fundamental physical conditions in a region, river is an inseparable part to the growth and development of a city (Anthony, 1992). The utilization of river as transportation line will imply on various land utilization on its banks, where the utilization of these banks, in addition to bringing positive influence to the city’s growth and development, it will also give a number of impacts to the growth of the city’s problems (Djemabut, 1986). The condition developing in the area along the river banks has generally violated the Decree of the President of the Republic of Indonesia Number 32 of 1990 on the Management of Protected Area and the Regulation of the Government of the Republic of Indonesia Number 47 of 1997 on the National Spatial Plan which regulate the determination of riparian area lines and the application of riverside area as the local protected area (Kivel, 1993). 2. Literature Review Riparian Area: Riparian area or floodplain is located between the river ecosystem and land ecosystem. Based on the Decree of the President of the Republic of Indonesia No. 32 of 1990 on the Management of Protected Area, riparian area is defined as the areas alongside the left and right of the river, including man-made river/canal/primary irrigation channel, which has vital role to maintain the function of the river. Riparian area includes river banks, namely part of the river body which is only covered by water in the rainy season and the riparian area on the outer part of the banks, namely the area receiving the water flooding in the rainy season and which has higher soil humidity compared to that in the land ecosystem (Merriam, 2005). Flood in the riparian area in the rainy season is a natural phenomenon having vital ecological function in maintaining the balance of environment and soil fertility. The banks are determined based on the relation between flood flow and the area of lower flow profile, usually above 1.0 m – 1.5 m above the average low water face elevation (Sjarief, 1997). Riverbank Settlement: Riverbank settlement is generally a marginal settlement, because it sits on a land which is not allocated for buildings (Djemabut, 1986). The solution concerning wild settlement in the
Jornal of Social and Development Sciences (JSDS) Vol. 7, No. 2, June 2016 (ISSN 2221-1152)
7
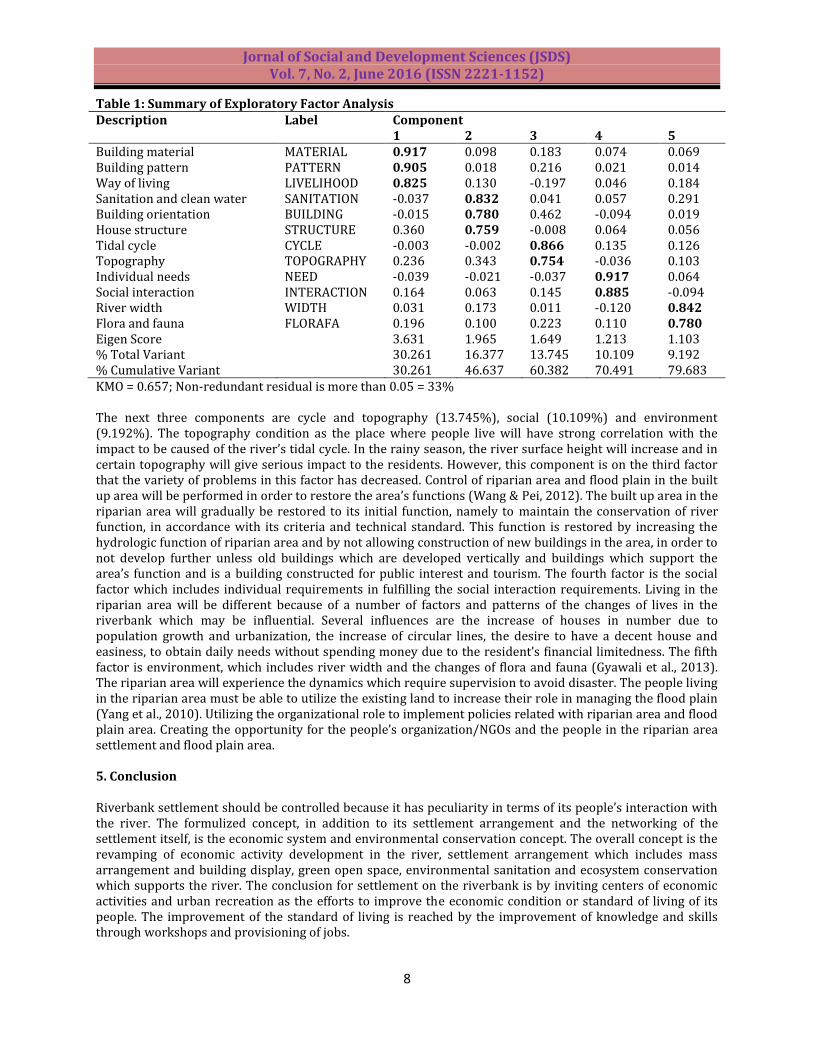
riverbank is by eviction or relocation of residents to a new place. The controlling of spatial utilization based on Act of the Republic of Indonesia No. 26 of 2007 on Spatial Planning is an activity related with supervision and policing towards the planning implementation, in order for the spatial utilization to be in accordance with the Spatial Planning (Department of Public Works, 1986). In Act of the Republic of Indonesia No. 26 of 2007 Article 35 it is explained that the spatial utilization control is performed through the stipulation of zoning, permit, incentives and disincentives, and sanctioning. The regulation is compiled based on the detailed spatial plan for each spatial utilization zone (Hasni, 2010). As an effort to restore the function of riverbank area as protected area but which is still can be utilized by the city people as a socially functioned area, the concept of riverbank area planning is created (Chay, 2004). The high requirement of activity space and the competence in urban land utilization causes the increase of land economic value, especially on the areas having commercial and strategic values, which in the end causes pressure and destruction towards areas related with the existence of public open spaces in the city (Jayadinta, 1999). Public open spaces such as city squares, parks, playgrounds, sport fields, are gradually disappearing, being replaced by buildings and inhuman pavements. The rarer open space in the cities will mean the lesser public spaces which are extremely required by the urban people on social and psychological needs (Kivell, 1993). Spatial utilization along the riverbanks are extremely alarming: dense settlements grow projecting onto the river body, denudation of riverbank protecting plants, sand mining, to waste disposal, whether solid or liquid and industrial or household waste (Sjarief, 1997). Those matters will overall bring terrible impact to the riverbank area and will specifically impact to the water quality which will then be utilized by the city people for their own needs (Maryono, 2005). Such condition, and the rapid growth of urban population, will cause various urban problems, such as the requirements of space, degradation in the environment quality, housing and the consequence on the increase in the urban facility-infrastructure requirements (Kivell, 1993) will cause the physical condition of the riverbank area to be worsened if it is not quickly being anticipated by the city’s policy makers. 3. Methodology This research is quantitative which objective is to acknowledge the impact in the utilization of riparian area, which is divided by four factors, namely: the people’s way of life, adaptation towards the river environment, physical factors and nonphysical factors. The people’s way of life includes: the ways to make their living, sanitation and clean water, building orientation. Adaptation towards the river environment includes: building’s structure and construction, building materials used and settlement patterns. The physical factors include: topography, river width, river’s tidal cycle, flora and fauna. The nonphysical factors include: social interaction pattern and individual (social) needs. The total attributes of the five variables being analyzed are 12. There are 100 respondents being researched, who are spread in 5 villages located around the riparian area. The data analysis used is exploratory factor analysis (EFA) by SPSS software of version 20. The factor analysis can be used if the interdependence of the entire attributes are acceptable, namely the Kaiser-Myer-Olkin (KMO) score is more than 0.50. EFA will result in a number of new factors consisting of several attributes to explain the total variety. Factor extraction will be optimized by choosing varimax rotation in order to give higher loading factor for each attribute. 4. Results The factor analysis related with the impact of the utilization of riparian area is mostly described in the variety of materials and building patterns and the ways to make a living for the family. The factor extraction of the 12 indicators being analyzed is extracted to five components with cumulative contribution of 79.683%. The first component with 30.261% contribution has high loading factor (more than 0.50) in building materials, building patterns and ways to make a living. The three attributes are in one factor because they have stronger correlation. The pattern of houses built on the riparian area will use different materials compared to those in the settlement area. The shape and materials of the houses will have relation of the residents of riverbank settlements and the river such as bathing, washing, toilet activities and waste, socio-cultural activities and the needs of clean water and drinking water. The second component with 16.377% contribution represents the indicators such as sanitation and clean water, building orientation and house structure. Living in the riparian area will face numerous risks such as flood and low quality sanitation.
Jornal of Social and Development Sciences (JSDS) Vol. 7, No. 2, June 2016 (ISSN 2221-1152)
8
Table 1: Summary of Exploratory Factor Analysis Description Label Component
1 2 3 4 5 Building material Building pattern Way of living Sanitation and clean water Building orientation House structure Tidal cycle Topography Individual needs Social interaction River width Flora and fauna
MATERIAL PATTERN LIVELIHOOD SANITATION BUILDING STRUCTURE CYCLE TOPOGRAPHY NEED INTERACTION WIDTH FLORAFA
0.917 0.905 0.825 -0.037 -0.015 0.360 -0.003 0.236 -0.039 0.164 0.031 0.196
0.098 0.018 0.130 0.832 0.780 0.759 -0.002 0.343 -0.021 0.063 0.173 0.100
0.183 0.216 -0.197 0.041 0.462 -0.008 0.866 0.754 -0.037 0.145 0.011 0.223
0.074 0.021 0.046 0.057 -0.094 0.064 0.135 -0.036 0.917 0.885 -0.120 0.110
0.069 0.014 0.184 0.291 0.019 0.056 0.126 0.103 0.064 -0.094 0.842 0.780
Eigen Score % Total Variant % Cumulative Variant
3.631 30.261 30.261
1.965 16.377 46.637
1.649 13.745 60.382
1.213 10.109 70.491
1.103 9.192 79.683
KMO = 0.657; Non-redundant residual is more than 0.05 = 33% The next three components are cycle and topography (13.745%), social (10.109%) and environment (9.192%). The topography condition as the place where people live will have strong correlation with the impact to be caused of the river’s tidal cycle. In the rainy season, the river surface height will increase and in certain topography will give serious impact to the residents. However, this component is on the third factor that the variety of problems in this factor has decreased. Control of riparian area and flood plain in the built up area will be performed in order to restore the area’s functions (Wang & Pei, 2012). The built up area in the riparian area will gradually be restored to its initial function, namely to maintain the conservation of river function, in accordance with its criteria and technical standard. This function is restored by increasing the hydrologic function of riparian area and by not allowing construction of new buildings in the area, in order to not develop further unless old buildings which are developed vertically and buildings which support the area’s function and is a building constructed for public interest and tourism. The fourth factor is the social factor which includes individual requirements in fulfilling the social interaction requirements. Living in the riparian area will be different because of a number of factors and patterns of the changes of lives in the riverbank which may be influential. Several influences are the increase of houses in number due to population growth and urbanization, the increase of circular lines, the desire to have a decent house and easiness, to obtain daily needs without spending money due to the resident’s financial limitedness. The fifth factor is environment, which includes river width and the changes of flora and fauna (Gyawali et al., 2013). The riparian area will experience the dynamics which require supervision to avoid disaster. The people living in the riparian area must be able to utilize the existing land to increase their role in managing the flood plain (Yang et al., 2010). Utilizing the organizational role to implement policies related with riparian area and flood plain area. Creating the opportunity for the people’s organization/NGOs and the people in the riparian area settlement and flood plain area. 5. Conclusion Riverbank settlement should be controlled because it has peculiarity in terms of its people’s interaction with the river. The formulized concept, in addition to its settlement arrangement and the networking of the settlement itself, is the economic system and environmental conservation concept. The overall concept is the revamping of economic activity development in the river, settlement arrangement which includes mass arrangement and building display, green open space, environmental sanitation and ecosystem conservation which supports the river. The conclusion for settlement on the riverbank is by inviting centers of economic activities and urban recreation as the efforts to improve the economic condition or standard of living of its people. The improvement of the standard of living is reached by the improvement of knowledge and skills through workshops and provisioning of jobs.

Jornal of Social and Development Sciences (JSDS) Vol. 7, No. 2, June 2016 (ISSN 2221-1152)
9
Reference Anthony, J. C. (1992). Perencanaan Kota. Jakarta: Erlangga. Barnett, J. (1982). An Introduction to Urban Design. New York: Harper & Row Chay, A. (2004). Hidrologi dan Pengelolaan Daerah Aliran Sungai. Yogyakarta: Gajah Mada University Press. Departemen Pekerjaan Umum. (2006). Konsep Dasar Panduan Penyusunan Peraturan Zonasi Kawasan
Perkotaan Djemabut, B. (1986). Perumahan dan Permukiman, Yayasan Obor Indonesia. Gyawali, S., Techato, K., Yuangyai, C. & Musikavong, C. (2013). Assessment of relationship between land uses
of riparian zone and water quality of river for sustainable development of river basin, A case study of U-Tapao river basin, Thailand. The 3rd International Conference on Sustainable Future for Human Security SUSTAIN 2012 Procedia Environmental Sciences, 1 7, 291 – 297.
Hasni. (2010). Hukum Penataan Ruang dan Penatagunaan Tanah, cetakan kedua, Rajagrafindo Persada, Jakarta.
Jayadinta, T. J. (1999). Tata Guna Tanah Dalam Perencanaan Pedesaan, Perkotaan, dan Wilayah: Edisi Ketiga. Bandung: ITB
Kivell, P. (1993). Land and the City: Pattern and Process of Urban Change. London: Routledge Maryono, A. (2005). Menangani Banjir, Kekeringan dan Lingkungan. Gama Press. Yang, M., Qia, X., Zhang, Y., Sheng, J. & Shen, D. (2010). Assessing Alternatives for Sustainable Management of a
Flood Control Dam. International Society for Environmental Information Sciences 2010 Annual Conference (ISEIS). Procedia Environmental Sciences, 2, 98–110
Merriam, D. H. (2005). The Complete Guide to Zoning. New York: McGraw-Hill. Sjarief, R. (1997). Kawasan Pedesaan Ditinjau Dari Sistem Tata Air Daerah Aliran Sungai (DAS). Jurnal
Perencanaan Wilayah dan Kota, 8(1). Undang-undang No 26 Tahun 2007 tentang Penataan Ruang Undang-Undang Nomor 7 tahun 2004 tentang Sumberdaya Air. Undang-Undang Republic Indonesia Nomor 1 Tahun 2011 tentang Perumahan dan Kawasan Permukiman. Wang, Z. & Pei, Y. (2012). Ecological risk resulting from invasive species: a lesson from riparian wetland
rehabilitation. The 18th Biennial Conference of International Society for Ecological Modeling. Procedia Environmental Sciences, 13, 1798–1808.
Jornal of Social and Development Sciences (JSDS) Vol. 7, No. 2, June 2016 (ISSN 2221-1152)
10
Rural Area Development Strategy through Rural Infrastructure Development Program
Suwandi, Wilmina Pesurnay
University of cenderawasih Jayapura Papua, Indonesia [email protected]
Abstract: This study was conducted in Biak District of Papua employing the quantitative method. The strategic concept in the development of local institutional capacity was to maximise the role of institutions as social capital not taken over, such as driving as farmers’ cooperatives, cooperatives as agro-tourism objects, and integrating the local institutional system under the auspices of Papua local institutions. Keywords: Capacity building, integrated agricultural system (Simantri) system, and sustainable development
1. Introduction The Rural Area Development Concept is developed from the need of a village to improve its function and role in managing the social, economic, cultural and educational life and social welfare in the rural area (Kuntoro, 2006). The influences of globalisation, free markets and regionalisation lead to interstate, inter-regional (city/district), inter-sub-district and inter-village spatial, social, and economic changes and dynamics. Globalisation is also characterised by revolutions in information technology, transportation and management (Syahrani, 2001). The revolutions have caused unclear boundaries of urban and rural areas, polarisation of regional development, formation of global cities, international-scale city systems, formation of trans-border regions and establishment of regional development either corridors for the local national, regional and international scales. Spatial-based planning plays an important role in formulating development policies (Supriatna, 2000). Therefore, spatial development of villages is part of regional development of sub-districts and districts, in which the preparation of sub-urban development plan needs to begin with an analysis of conditions, potentials and problems of a region to determine the causality of socio-economic developments, potential natural resources, human capacity, regional infrastructure and regional development objectives (Adisasmita, 2005). The sub-urban spatial planning aims at directing spatial structure, location and functional relationships of a village in a harmonious, balanced and aligned manner in order to utilise potential natural resources and technologies so as to achieve optimum results of rural development for quality improvements of human life and the environment in a sustainable manner. 2. Literature Review Sub-urban Planning Concepts: The sub-urban development plan is a guide or model for sub-urban potential exploration and development ideas focusing on community participation in the overall development process. The concept is based on the values and spirit of mutual cooperation that has been rooted in the Indonesian culture (Anonymous, 2007). Mutual cooperation is based on the belief that every citizen has the right to decide and plan what is best for him/her and the environment and the best way in an effort to make it happen. Broadly speaking, the sub-urban planning implies the following (Sumodiningrat, 2000);
a. Planning as a series of analysis activities from identification of needs to determination of community development program.
b. Environmental development planning; all programs to improve welfare, tranquillity, prosperity and peace of communities in residential neighbourhoods from RT/RW, hamlets to villages.
c. Development planning relies on problems, needs, aspirations and resources of local communities. d. Sub-urban planning is a tangible manifestation of community participation in future development. e. Planning to produce development programs which are expected to have an impact on improving
welfare, prosperity and peace for a long run. Development Policies and Programs in Rural Areas: A rural area covers smaller areas with certain conditions and functions that are different from each other (Anonymous, 2004; 2007). Inter-regional development of an area will differ, depending on potential natural resources, human resources, and socio-economic-cultural conditions of a community living therein (Salim, 2006). A rural area has potentials and

Jornal of Social and Development Sciences (JSDS) Vol. 7, No. 2, June 2016 (ISSN 2221-1152)
11
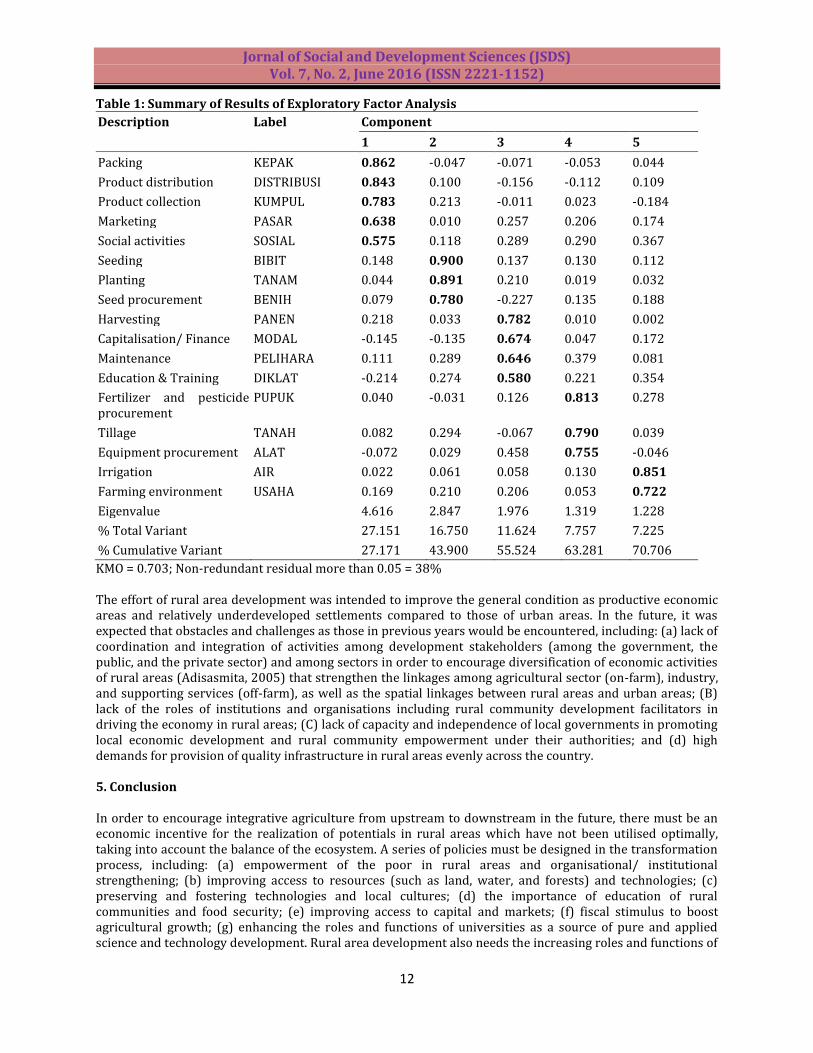
conditions that support development, thus will be more prominent in terms of growth and development as compared to other areas (Supriatna, 2000; Syahrani, 2001). It is called a ‘potential area’ or a ‘rural strategic area’. A potential area or a strategic area of medium-term development as stated in the National Medium-Term Development Plan (RPJMN) 2004-2009 (Presidential Decree No. 7/2005) includes: (a) creating a safe and peaceful Indonesia, (b) creating a fair and democratic Indonesia, and (c) improving welfare of the people. The development Priorities and policy directions are: poverty reduction and unemployment reduction, investment increase, revitalisation of agriculture, fisheries and forestry, rural development and reduction of inter-region imbalances, improvement of people’s access to quality education and healthcare, increase in social protection and welfare, development of quality population, and acceleration of infrastructure development (Indrawati, 2005). Based on various research and reviews of agricultural development policies, agriculture revitalisation through agro-industry development in rural areas is a strategic choice to drive the wheels of economy and the empowerment of rural community economy (Aziz, 2008). This is possible because of the high ability of agro-industry in employment, given that the agricultural industry is labour-intensive and massive in nature (Efiawan, 2004; Kuntoro, 2006). The middle- and lower-class community-based agricultural industry is a sector that is suitable for accommodating a lot of manpower and ensuring the expansion of doing business, thus, being effective in improving the economy of rural areas (Anonymous, 2005). The effort to revitalise the agricultural sector in Indonesia is the second-round green revolution in Indonesia (Nainggolan, 2008). 3. Methodology This research is quantitative, which aimed at determining an overview of people with regard to rural development. The research variables were five, namely: upstream sub-systems (seed procurement, fertilizer and pesticide procurement, agricultural equipment and machinery procurement), farming sub-systems (tillage, seeding, planting, maintenance, and harvesting, farming environment), and processing sub-systems (product collection, packing, processing), marketing sub-systems (product distribution, marketing) and supporting and service sub-systems (capitalisation, education and training, social activities). Total attributes of these five variables being analysed were 17. 70 respondents were examined under the research, those being spread over five villages with agricultural advantages. The data analysis employed the exploratory factor analysis (EFA) with SPSS version 20 software. The factor analysis could be used when interdependence of all attributes was acceptable, in which Kaiser-Myer-Olkin (KMO) had a value more than 0.50. EFA would generate a number of new factors consisting of several attributes to describe the total diversity. Extraction of factors would be optimised by selecting a varimax rotation so as to generate a higher loading factor for each attribute. 4. Results The calculation result of KMO value of 0.703 explained that the interdependence of all attributes was acceptable. Extraction of EFA produced 17 components, but only 5 components were used. The number of components to be used was the number of components with eigen values over 1. The contributions of the first, second to fifth component were 27.151%, 16.750%, 11.624%, 7.757% and 7.225%, respectively, in explaining the total diversity, thus cumulatively being 70.706%. Extraction of the first component consisted of six attributes to be named by processing and marketing factors: packing, product distribution, product collection, marketing and social activities. The first component explained that processing and marketing issues were important issues as in many regions there was a quite wide gap on the ability of people with regard to both issues. The second component would be named by seed and planting technique factors, consisting of attributes: seeding, planting and seed procurement. The right method of planting would take part in determining yields, in addition to the support of good seed quality. The third component was farm factors, consisting of attributes: harvesting, capitalisation (finance), maintenance and education and training. Crop harvesting and maintenance techniques needed to be known accurately through farming education and training opportunities. Rural communities with the major commodities in agriculture should also be able to calculate capital requirement in farming undertaken. The fourth component was named by upstream factors, consisting of: fertilizer and pesticide procurement, tillage and equipment and machinery procurement. The fifth component was named by irrigation environment, consisting of: farming irrigation and environment.
Jornal of Social and Development Sciences (JSDS) Vol. 7, No. 2, June 2016 (ISSN 2221-1152)
12
Table 1: Summary of Results of Exploratory Factor Analysis
Description Label Component
1 2 3 4 5
Packing KEPAK 0.862 -0.047 -0.071 -0.053 0.044
Product distribution DISTRIBUSI 0.843 0.100 -0.156 -0.112 0.109
Product collection KUMPUL 0.783 0.213 -0.011 0.023 -0.184
Marketing PASAR 0.638 0.010 0.257 0.206 0.174
Social activities SOSIAL 0.575 0.118 0.289 0.290 0.367
Seeding BIBIT 0.148 0.900 0.137 0.130 0.112
Planting TANAM 0.044 0.891 0.210 0.019 0.032
Seed procurement BENIH 0.079 0.780 -0.227 0.135 0.188
Harvesting PANEN 0.218 0.033 0.782 0.010 0.002
Capitalisation/ Finance MODAL -0.145 -0.135 0.674 0.047 0.172
Maintenance PELIHARA 0.111 0.289 0.646 0.379 0.081
Education & Training DIKLAT -0.214 0.274 0.580 0.221 0.354
Fertilizer and pesticide procurement
PUPUK 0.040 -0.031 0.126 0.813 0.278
Tillage TANAH 0.082 0.294 -0.067 0.790 0.039
Equipment procurement ALAT -0.072 0.029 0.458 0.755 -0.046
Irrigation AIR 0.022 0.061 0.058 0.130 0.851
Farming environment USAHA 0.169 0.210 0.206 0.053 0.722
Eigenvalue 4.616 2.847 1.976 1.319 1.228
% Total Variant 27.151 16.750 11.624 7.757 7.225
% Cumulative Variant 27.171 43.900 55.524 63.281 70.706
KMO = 0.703; Non-redundant residual more than 0.05 = 38% The effort of rural area development was intended to improve the general condition as productive economic areas and relatively underdeveloped settlements compared to those of urban areas. In the future, it was expected that obstacles and challenges as those in previous years would be encountered, including: (a) lack of coordination and integration of activities among development stakeholders (among the government, the public, and the private sector) and among sectors in order to encourage diversification of economic activities of rural areas (Adisasmita, 2005) that strengthen the linkages among agricultural sector (on-farm), industry, and supporting services (off-farm), as well as the spatial linkages between rural areas and urban areas; (B) lack of the roles of institutions and organisations including rural community development facilitators in driving the economy in rural areas; (C) lack of capacity and independence of local governments in promoting local economic development and rural community empowerment under their authorities; and (d) high demands for provision of quality infrastructure in rural areas evenly across the country. 5. Conclusion In order to encourage integrative agriculture from upstream to downstream in the future, there must be an economic incentive for the realization of potentials in rural areas which have not been utilised optimally, taking into account the balance of the ecosystem. A series of policies must be designed in the transformation process, including: (a) empowerment of the poor in rural areas and organisational/ institutional strengthening; (b) improving access to resources (such as land, water, and forests) and technologies; (c) preserving and fostering technologies and local cultures; (d) the importance of education of rural communities and food security; (e) improving access to capital and markets; (f) fiscal stimulus to boost agricultural growth; (g) enhancing the roles and functions of universities as a source of pure and applied science and technology development. Rural area development also needs the increasing roles and functions of
Jornal of Social and Development Sciences (JSDS) Vol. 7, No. 2, June 2016 (ISSN 2221-1152)
13
institutions in rural community development. The village administration should continue to foster the spirit of community initiation, self-reliance and mutual cooperation. Improving governance of community and village empowerment has always been one of the major programs in rural infrastructure development. References Adisasmita, H. R. (2005). Fundamentals of Economic Region. Publisher Graha Science, Yogyakarta. Anonymous. (2004). Basic Concepts Development Agropolitan. Jakarta: Director General Depkimpraswil Tata
Tata Urban and Rural. Anonymous. (2005). Presidential Decree Number 7 of 2005 on the National Medium Term Development Plan
(RPJMN) 2004-2009. Jakarta: State Secretariat. Anonymous. (2007). Rural Development. Jakarta: Ministry of Public Works, August 2007). Aziz, B. (2008). Preparation of Countryside Development Program Growth Centre (DPP Torue) District. Parigi
Moutong Independent Research Report. Palu: Department of Architecture UNTAD. Efiawan, H. R. (2004). Regional Management As Alternative Approaches to Inter-regional Development
Management in the Era of Decentralization. Papers in Regional Day Seminar in the Perspective of Regional Autonomy and Regional Development, Semarang.
Indrawati, S. M. (2005). Progress Report on the MDGs (Millennium Development Goals / MDGs) Country Indonesia Year 2005.
Kuntoro, B. A. (2006). Perspective Rural Regional Development, Innovation Magazine Vol. 6 / XVIII / March 2006, at PPI Online Website.
Nainggolan, K. (2008). Against Hunger and Poverty Century 21 First edition May). Bogor: Eternal Press. Salim, F. (2006). Urbanization, Rural-City, Growth Centre. Bandung: Institute for Public Policy Observer Univ.
Padjadjaran. Sumodiningrat, G. (2000). Economic Development Development Through Agriculture, PT.BINA Rena Tourism,
Jakarta. Supriatna, T. (2000). Development Strategy and Poverty. Publisher Rineka Cipta, Jakarta. Syahrani H. H. A. (2001). Implementation Agropolitan and Agribusiness In Regional Economic Development.
Frontier Journal, 33(2).
Jornal of Social and Development Sciences (JSDS) Vol. 7, No. 2, June 2016 (ISSN 2221-1152)
14
Proposal for Energy Social Responsibility
Vishakha Agrawal1*, Dhyani Mehta2
1Economics, School of Liberal Studies, PDPU, India 2Institute of Management, Nirma University, India
*[email protected] Abstract: The paper significantly works upon, how as per the newly implemented mandate under ‘The Companies Act, 2013’ organizations in India having turnover >100 cr &>200 cr (PAN India) or having net profit of at least 5 Crore have to spend 2 percent of their profit as part of CSR Corporate Social Responsibility to carry a philanthropic activity. As a social responsibility towards environment sustainability, India needs to change to renewable sources of energy which are non-polluting which will also support increasing demand for power and electricity. For economic as well as environmental rationales, this paper tries to recommend ESR (Energy Sustainability Responsibility) that can be accumulated through monetary support by all of the BSE (Bombay Stock Exchange) and NSE (National Stock Exchange) companies that in contrast can be accommodated on the research and development as well as infrastructural development of non-conventional and renewable sources of energy. The proposal can support India as well as countries across time zones to save fossil fuel reserves for future and create sustainability of these reserves. For the same objective the paper is addressing the applicability of ESR for setting up projects for renewable source of energy and cost involved in setting up of these projects vis-a-vis the efficient use of funds accumulated by the target companies by way of ESR: Energy Social Responsibility. The research design used is both descriptive and exploratory. Keywords: Solar Energy, Energy Social Responsibility, Energy Sustainability, Energy in India, BSE and NSE Companies, Renewable Sources of Energy
1. Introduction Fossil fuels play a very important role in administering the economy efficiently and enforcing newer developments effectively. Oil & gas, Coal and other mineral resources supports us with most of our energy mix and touch our lives in multiple dimensions. They cater to everything - from domestic uses to manufacturing industries and from transportation fuel for synthesis of organic and chemical products. India is a country with more than 1.3 billion people accounting for more than 17.5% of world’s population (Census of India). In the past ten years, it has seen an amplified growth of energy demand with confronting scarcity of energy resources. India’s economic growth has increased by 7-8% every year and is speculated to grow with the same momentum in the coming years (Asian Development Bank). This stresses the need of exploring avenues for meeting the energy requirement which fuels growth even to further extend. India’s population and economic growth have led India to be the third largest importer of energy (India Energy Outlook, IEA 2015). The nation faces challenges with balancing the demand and supply of energy which leads to the often seen shortage or ‘power cuts’. In the last decade, accessibility to power in India has both improved and enhanced but demand has over and over again outstripped supply and considerable energy peak shortages have prevailed. The statement of the problem does not conclude here. Maintaining environmental sustainability is a concern for the entire world and India is no exception. Since burning of fossil fuels is one of the most significant reasons for climate change and global warming, it becomes very much essential for countries across the globe to switch towards green energy. In the last few years there have been prodigious efforts, both at global level as well as in India, to encourage industries to move towards sustainable business models (CII, 2013). This proposal for Energy Social Responsibility details the model wherein the energy users can support sustainability of energy with the government. What is ESR? Energy Social Responsibility is expansion of new energy infrastructure which entails the nation to tackle quite a few key challenges. These include: (a) increasing concern of energy security at a time of rising global resource scarcity; (b) supporting large energy infrastructure with sizable investment disbursements; (c) increasing development in the interweaved maintenance infrastructure; (d) reducing societal and ecological influences of developing energy infrastructure; and (e) addressing climate change
Jornal of Social and Development Sciences (JSDS) Vol. 7, No. 2, June 2016 (ISSN 2221-1152)
15
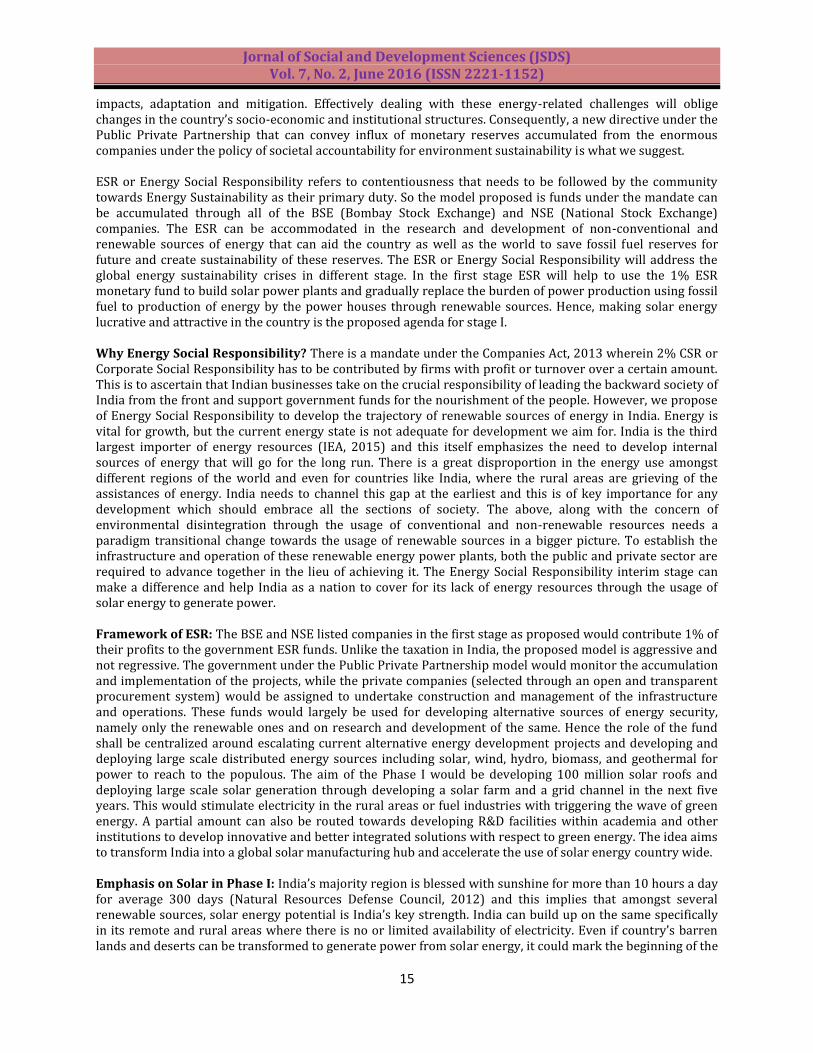
impacts, adaptation and mitigation. Effectively dealing with these energy-related challenges will oblige changes in the country’s socio-economic and institutional structures. Consequently, a new directive under the Public Private Partnership that can convey influx of monetary reserves accumulated from the enormous companies under the policy of societal accountability for environment sustainability is what we suggest. ESR or Energy Social Responsibility refers to contentiousness that needs to be followed by the community towards Energy Sustainability as their primary duty. So the model proposed is funds under the mandate can be accumulated through all of the BSE (Bombay Stock Exchange) and NSE (National Stock Exchange) companies. The ESR can be accommodated in the research and development of non-conventional and renewable sources of energy that can aid the country as well as the world to save fossil fuel reserves for future and create sustainability of these reserves. The ESR or Energy Social Responsibility will address the global energy sustainability crises in different stage. In the first stage ESR will help to use the 1% ESR monetary fund to build solar power plants and gradually replace the burden of power production using fossil fuel to production of energy by the power houses through renewable sources. Hence, making solar energy lucrative and attractive in the country is the proposed agenda for stage I. Why Energy Social Responsibility? There is a mandate under the Companies Act, 2013 wherein 2% CSR or Corporate Social Responsibility has to be contributed by firms with profit or turnover over a certain amount. This is to ascertain that Indian businesses take on the crucial responsibility of leading the backward society of India from the front and support government funds for the nourishment of the people. However, we propose of Energy Social Responsibility to develop the trajectory of renewable sources of energy in India. Energy is vital for growth, but the current energy state is not adequate for development we aim for. India is the third largest importer of energy resources (IEA, 2015) and this itself emphasizes the need to develop internal sources of energy that will go for the long run. There is a great disproportion in the energy use amongst different regions of the world and even for countries like India, where the rural areas are grieving of the assistances of energy. India needs to channel this gap at the earliest and this is of key importance for any development which should embrace all the sections of society. The above, along with the concern of environmental disintegration through the usage of conventional and non-renewable resources needs a paradigm transitional change towards the usage of renewable sources in a bigger picture. To establish the infrastructure and operation of these renewable energy power plants, both the public and private sector are required to advance together in the lieu of achieving it. The Energy Social Responsibility interim stage can make a difference and help India as a nation to cover for its lack of energy resources through the usage of solar energy to generate power. Framework of ESR: The BSE and NSE listed companies in the first stage as proposed would contribute 1% of their profits to the government ESR funds. Unlike the taxation in India, the proposed model is aggressive and not regressive. The government under the Public Private Partnership model would monitor the accumulation and implementation of the projects, while the private companies (selected through an open and transparent procurement system) would be assigned to undertake construction and management of the infrastructure and operations. These funds would largely be used for developing alternative sources of energy security, namely only the renewable ones and on research and development of the same. Hence the role of the fund shall be centralized around escalating current alternative energy development projects and developing and deploying large scale distributed energy sources including solar, wind, hydro, biomass, and geothermal for power to reach to the populous. The aim of the Phase I would be developing 100 million solar roofs and deploying large scale solar generation through developing a solar farm and a grid channel in the next five years. This would stimulate electricity in the rural areas or fuel industries with triggering the wave of green energy. A partial amount can also be routed towards developing R&D facilities within academia and other institutions to develop innovative and better integrated solutions with respect to green energy. The idea aims to transform India into a global solar manufacturing hub and accelerate the use of solar energy country wide. Emphasis on Solar in Phase I: India’s majority region is blessed with sunshine for more than 10 hours a day for average 300 days (Natural Resources Defense Council, 2012) and this implies that amongst several renewable sources, solar energy potential is India’s key strength. India can build up on the same specifically in its remote and rural areas where there is no or limited availability of electricity. Even if country’s barren lands and deserts can be transformed to generate power from solar energy, it could mark the beginning of the

Jornal of Social and Development Sciences (JSDS) Vol. 7, No. 2, June 2016 (ISSN 2221-1152)
16
end of India’s problem where around 300 million of its people have no reliable access to electricity (IEA, 2013). Developing solar manufacturing shall also enhance job opportunities in India. On the application side, commercializing solar will not only reduce India’s dependency on fuel imports but make industries self-reliable to develop with a higher growth with no limitation to use of energy which is green. 2. Analysis and Interpretation Cost of Setting Solar Power Plant: As per the order of CERC (Central Electricity Regulatory Commission) the normative capital cost of setting up Solar Photovoltaic Power Project was INR 1700Lakh/MW or INR 17.00 crore/MW for FY-2009-10. However as per the order published during September 2010 the normative capital cost of setting up Solar Photovoltaic Power Project was reviewed and finalized to be INR 1442Lakh/MW or INR14.42 crores/MW for FY-2011-12. This clearly signifies a reduction of INR 258Lakh/MW for setting up a Solar PV project within a span of two years (CERC report 2009, 2010). Contribution from ESR: Under the proposed ESR model every BSE and NSE listed company pays 1% of their net profit as ESR. It will create huge amount of cash flow under which the money accumulated by ESR can be used for setting renewable energy power generating plants. Just to have an idea about the amount of fund that can be generated we have taken 500 top performing companies of BSE (Bombay Stock Exchange) and top 50 companies of NSE (National Stock Exchange). The companies’ profits during the last decade i.e. starting from 2005 to 2015 were gathered and assessed to estimate the prospective ESR amount that can be accumulated. The Average Total Profit generated by all the selected companies is shown in table below:
Table 1: Profits for Companies Listed Exchange Number of Companies Average Total Profit (in
INR Crore) ESR Contribution (1% of Net Profit in INR Crore)
BSE 474 26,41,701.86 26417.02 NSE 50 15,78,705.76 15787.06 (Source: Ace Equity and Author’s calculation) In the last 10 years BSE 474 companies’ contribution at 1% to ESR could had been around INR 26417.02 Crore and the same for NSE 50 companies’ contribution at 1% in ESR is around INR 15787.06 Crore. This contribution as proposed, gets accumulated on yearly base by some regulatory body under the GOI (Government of India) under the PPP model (Private Public Partnership) for monitoring project implementation while the operations are undertaken by some private organization or firm. Utilization of ESR Contribution: As per the order of CERC (Central Electricity Regulatory Commission) the normative capital cost for setting up Solar Photovoltaic Power Project was INR 1700Lakh/MW or INR 17.00 crore/MW for FY-2009-10. However as per the order published during September 2010 the normative capital cost for setting up Solar Photovoltaic Power Project was reviewed and finalized to be INR 1442Lakh/MW or INR14.42 crores/MW for FY-2011-12. For sake of estimation we will calculate taking both cost that is 17 Cr/MW and 14.42 Cr/MW. We calculate the quant of power that can be generated in the plant with the ESR funds under both the scenarios.
Table 2: Estimated Costs Stock Exchange
Contribution Cost 1 (17 Cr/MW) Estimated Production Capacity Generated
Cost 2 (14.42 Cr/MW) Estimated Production Capacity Generated
BSE (500) 26417.02 1553.94 MW 1831.97 MW
NSE (50) 15787.06 928.56 MW 1094.80 MW (Source: Author’s Calculation) Electricity that can be generated from the solar power plants is around 1831.97 MW and 1094.08 MW which is quite remarkable to note. This much power is adequate to run a metro city and help to replace a large mass of production of power produced through using the fossil fuel coal in thermal power. It will also help us to
Jornal of Social and Development Sciences (JSDS) Vol. 7, No. 2, June 2016 (ISSN 2221-1152)
17
conserve fossil fuel for our future generations. The amount of coal used to generate fuel equal to 1 kilowatt (kW) is 0.00052 short tons or 1.05 pounds. If we produce power by solar energy, we can save importing quality coal which is used to generate electricity in the thermal power plant. The amount of natural gas and petroleum fuel utilized to generate 1 KW of power equals to 0.01010 Mcf or 1,000 cubic feet and to 0.00175 barrels (or 0.07 gallons) respectively.
Table 3: Non-Renewable energy to be saved Scenario Estimated
Production Capacity Generated MW
Estimated Production Capacity Generated in KW
Coal Saved (1.05 Pounds/KW)
Natural Gas Saved (1000 Cubic feet)
Petroleum Saved (0.07 gallons)
1 2482.50 MW 2482500 KW 2606625 Pound 2482500000 Cubic feet
173775 Gallons
2 2926.77 MW 2926770 KW 3073108.5 Pound
2926770000 Cubic feet
204873.9 Gallons
(Source: Author’s calculation) Now that every 1KW electricity we produce by solar energy can alternatively save consumption of coal by 1.05 pounds, natural gas by 1000 cf and petroleum by 0.07 gallons, the above calculations suggests how much quantity of these conventional fuels can be saved if we produce the electricity by the solar power plant. All of this is achievable only by the contribution of 1% from the BSE & NSE top 500 and 50 performing companies’ respectively. These figures would considerably change if we consider all of the companies listed and those unlisted but are financially playing a major role in driving the country’s economy. 3. Challenges India stands 21st amongst the world’s most densely populated countries (World Bank Database, 2011-2015). This suggests of the scarcity of land with respect to the high population in the country. The amount of land required for utility scale solar power plants currently approximately 1km² for every 20 to 60 megawatts (MW) generated could pose a strain on India’s available land resource (Srivastava and Srivastava, 2013). Exclusive installation of solar panels would cost other necessities that require land. And hence here the Roof Top Policy i.e. individual rooftop power generation systems connected through the local grid system can play a transcending role and would be the most suitable solar architecture in India. Another challenge in meeting the solar end is the cost to develop solar farms and photovoltaic cells. Building individual rooftop power generation systems is not viable for the majority of the residents of the country. Developing the same with sovereign money will not relish the economies of scale for the nation. And hence it requires a drop in the price of the panels and photovoltaic cells so that it interests individual domestic households. Moreover, developing ESR and utilizing it for developing alternative energy sources will take much time to progress. Its results would take even more time to reflect. But surely the potential of the proposal with government and corporate/industrial support be beneficial to the country in the long run. 4. Future Scope Rural Electrification has been a challenge for India, which can be overcome with the development of solar resources through ESR. Several research bodies in India and across time zones believe that sunny tropical areas which are densely populated such as India should adopt building on their solar energy assets and serve to large masses of potential consumer. This shall ensure no compromise on economic growth with reining on its long-term carbon emissions and backing long term energy requirements. Contributions from all the stakeholders - corporate, industries, masses and government can only make this sketch practicable. The stage II of the proposed ESR mandate can have establishing wind plants and tidal plants with the monetary fund’s accumulated than. On a wider perspective, developing and developed countries can adopt the mandate in accordance to their structures and laws and abide the ESR which will help expand renewable sources of energy and make this world greener and sustainable for the future generations.

Jornal of Social and Development Sciences (JSDS) Vol. 7, No. 2, June 2016 (ISSN 2221-1152)
18
5. Conclusion Energy is important in achieving the unified development - economic, social, and environmental; sustainably. But if India is to realize this significant objective, the kinds of energy India is producing and the ways it uses them will have to be changed. Else, harm to the environment will impede the economic growth. It is highly required that India looks more and more towards renewable energy for attaining energy security by 2050. India’s current target of developing around 15.9% of total energy from renewable sources by 2022 is too modest (Garg, 2012). We surely can’t restrict the demand for energy for it will steadily rise from increased output or activity directly; stress needs to be put on conservation measures at the early stage of development. Solar and wind energy can turn to be the intelligent options for India's economic future. If India made the massive switch from coal, oil, natural gas and nuclear power plants to renewable energy, it is possible that 70 percent of India's electricity and 35 percent of its total energy could be powered by renewable resources by 2030 (Goswami, 2013). This would ensure that there are no technological or economic barriers to supplying and catering to India’s energy demand through the use of a clean form of energy formed from solar, wind, hydro and biogas by 2050. It’s time that India puts more focus on renewable energy and implementing Energy Social Responsibility can just be the right way. There have been lots of developments in India when it comes to developing alternative energy and a lot more developments can still be integrated. With the low in oil prices, financially there is a lack of incentive for investors however investments in renewable sources not only promise a sustainable future but also an economic profitable future outlook. Newly built solar plants produce considerably cheaper energy than electricity produced from fossil fuels if calculated in the long run. It is the time when we make fossil energy a thing of past and embrace the renewable energy future now. References Asian Development Bank. Multiple Databases. http://www.adb.org/data/statistics Budget Reports. Union Government of India. Various Issues. Economic Times. (2011). Power sector: Rising imports cost, poor infrastructure trip earnings growth. http://articles.economictimes.indiatimes.com/2011-04-08/news/29396872_1_coal-india-power-
companies-indian-power-utilities (Accessed 8-04-2015). Goswami, D. (2013). India’s Renewable Energy Potential Remains Untapped.
www.renewableenergyworld.com/rea/news/article/2013/07/indias-renewable-energy-potential-remains-untapped (accessed on 13th April. 2015).
Government of India (a) Indian Public Finance Statistics. Ministry of Finance. New Delhi. Various issues. Government of India (b) Economic Survey. Ministry of Finance. New Delhi. Government of India (c) Budget Documents: Expenditure Budget. Ministry of Finance. New Delhi. Garg, P. (2012). Energy Scenario and Vision 2020 in India. Ministry of Environment and Forests. New Delhi.
Journal of Sustainable Energy & Environment. Guidebook-1 for National Certification Examination for Energy Managers and Energy Auditors. Bureau of
Energy Efficiency. MOP. GOI. Accessed on 2-04-2015. Handbook on Statistics. Reserve Bank of India. New Delhi. India Brand Equity Foundation. (2013). Oil and Gas Industry in India (June 2013).
http://www.ibef.org/industry/oil-gas-india.aspx (accessed on Feb 15. 2015). International Energy Agency. World Energy Outlook. Multiple Issues. International Institute for Sustainable Development (2012). A Citizen’s Guide: To Energy Subsidies. Lok Sabha Secretariat. (2013). Corporate Social Responsibility. No. 11 /RN/Ref./2013. Mandatory Corporate Social Responsibility: Is the Government Shifting its Failure to Corporate India?
https://socialissuesindia.files.wordpress.com/2012/12/mandatorycsrinindia.pdf (accessed on 5th April. 2015)
Ministry of New and Renewable Energy. Various Databases. http://www.mnre.gov.in (Accessed 2-04-2015). Natural Resources Defense Council. Council on Energy, Environment and Water. (2012). Laying the
Foundation for a Bright Future. Mumbai. OECD/IEA. (2010). Energy Poverty How to make modern energy access universal? PwC. (2012). Emerging opportunities and challenges Oil and Gas. WEC-IMC. 23rd January 2012. PWC. (2014). Handbook on Corporate Social Responsibility in India. Confederation of Indian Industry.

Jornal of Social and Development Sciences (JSDS) Vol. 7, No. 2, June 2016 (ISSN 2221-1152)
19
Renewable Energy Tariff for Financial Year 2011-12. Order-256-2010. Central Electricity Regulatory Commission. GOI.
Srivastava, S. P. & Prakash, S. S. (2013). Solar Energy and Its Future Role in Indian Economy. International Journal of Environmental Science: Development and Monitoring (IJESDM), 4(3).
World Bank Data. Various Databases. http://data.worldbank.org (Accessed 19-04-2015).
Jornal of Social and Development Sciences (JSDS) Vol. 7, No. 2, June 2016 (ISSN 2221-1152)
20
Analysis on Health Level of Local Government Owned Enterprises (BUMD) toward Papua
Regional Income
Yohanis Rante, Westim Ratang, B. Elita Bharanti Universitas Cenderawasih, Indonesia
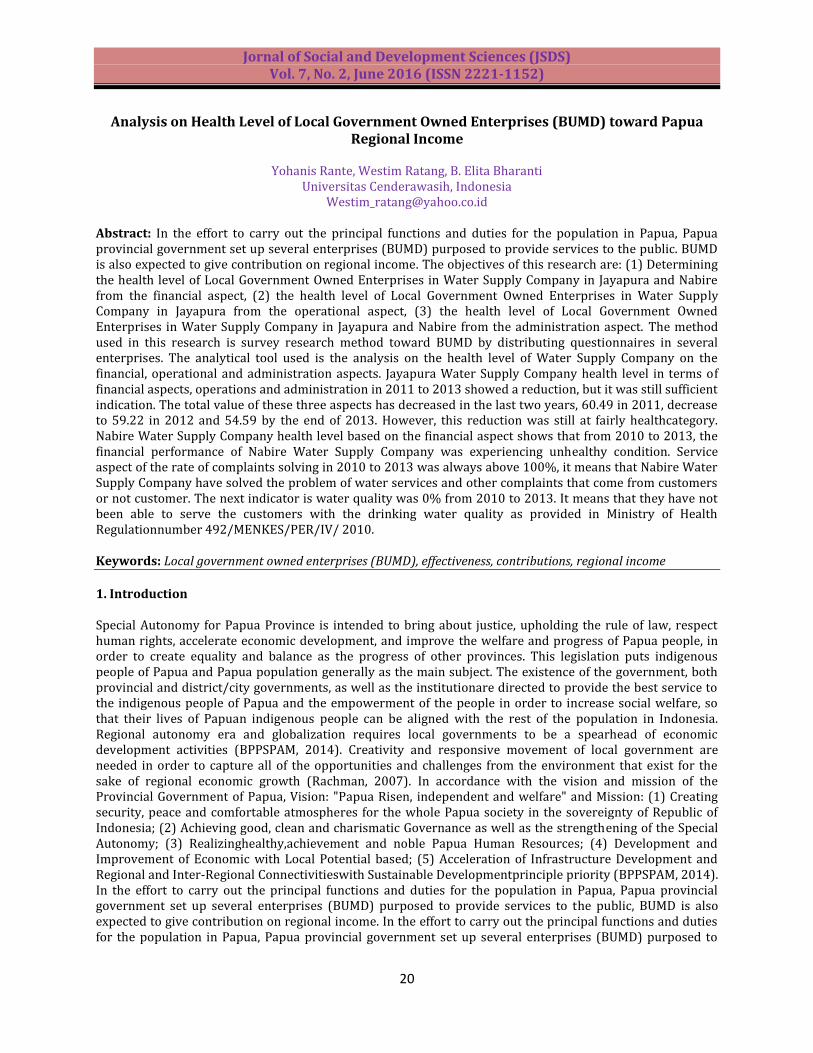
[email protected] Abstract: In the effort to carry out the principal functions and duties for the population in Papua, Papua provincial government set up several enterprises (BUMD) purposed to provide services to the public. BUMD is also expected to give contribution on regional income. The objectives of this research are: (1) Determining the health level of Local Government Owned Enterprises in Water Supply Company in Jayapura and Nabire from the financial aspect, (2) the health level of Local Government Owned Enterprises in Water Supply Company in Jayapura from the operational aspect, (3) the health level of Local Government Owned Enterprises in Water Supply Company in Jayapura and Nabire from the administration aspect. The method used in this research is survey research method toward BUMD by distributing questionnaires in several enterprises. The analytical tool used is the analysis on the health level of Water Supply Company on the financial, operational and administration aspects. Jayapura Water Supply Company health level in terms of financial aspects, operations and administration in 2011 to 2013 showed a reduction, but it was still sufficient indication. The total value of these three aspects has decreased in the last two years, 60.49 in 2011, decrease to 59.22 in 2012 and 54.59 by the end of 2013. However, this reduction was still at fairly healthcategory. Nabire Water Supply Company health level based on the financial aspect shows that from 2010 to 2013, the financial performance of Nabire Water Supply Company was experiencing unhealthy condition. Service aspect of the rate of complaints solving in 2010 to 2013 was always above 100%, it means that Nabire Water Supply Company have solved the problem of water services and other complaints that come from customers or not customer. The next indicator is water quality was 0% from 2010 to 2013. It means that they have not been able to serve the customers with the drinking water quality as provided in Ministry of Health Regulationnumber 492/MENKES/PER/IV/ 2010. Keywords: Local government owned enterprises (BUMD), effectiveness, contributions, regional income
1. Introduction Special Autonomy for Papua Province is intended to bring about justice, upholding the rule of law, respect human rights, accelerate economic development, and improve the welfare and progress of Papua people, in order to create equality and balance as the progress of other provinces. This legislation puts indigenous people of Papua and Papua population generally as the main subject. The existence of the government, both provincial and district/city governments, as well as the institutionare directed to provide the best service to the indigenous people of Papua and the empowerment of the people in order to increase social welfare, so that their lives of Papuan indigenous people can be aligned with the rest of the population in Indonesia. Regional autonomy era and globalization requires local governments to be a spearhead of economic development activities (BPPSPAM, 2014). Creativity and responsive movement of local government are needed in order to capture all of the opportunities and challenges from the environment that exist for the sake of regional economic growth (Rachman, 2007). In accordance with the vision and mission of the Provincial Government of Papua, Vision: "Papua Risen, independent and welfare" and Mission: (1) Creating security, peace and comfortable atmospheres for the whole Papua society in the sovereignty of Republic of Indonesia; (2) Achieving good, clean and charismatic Governance as well as the strengthening of the Special Autonomy; (3) Realizinghealthy,achievement and noble Papua Human Resources; (4) Development and Improvement of Economic with Local Potential based; (5) Acceleration of Infrastructure Development and Regional and Inter-Regional Connectivitieswith Sustainable Developmentprinciple priority (BPPSPAM, 2014). In the effort to carry out the principal functions and duties for the population in Papua, Papua provincial government set up several enterprises (BUMD) purposed to provide services to the public, BUMD is also expected to give contribution on regional income. In the effort to carry out the principal functions and duties for the population in Papua, Papua provincial government set up several enterprises (BUMD) purposed to
Jornal of Social and Development Sciences (JSDS) Vol. 7, No. 2, June 2016 (ISSN 2221-1152)
21
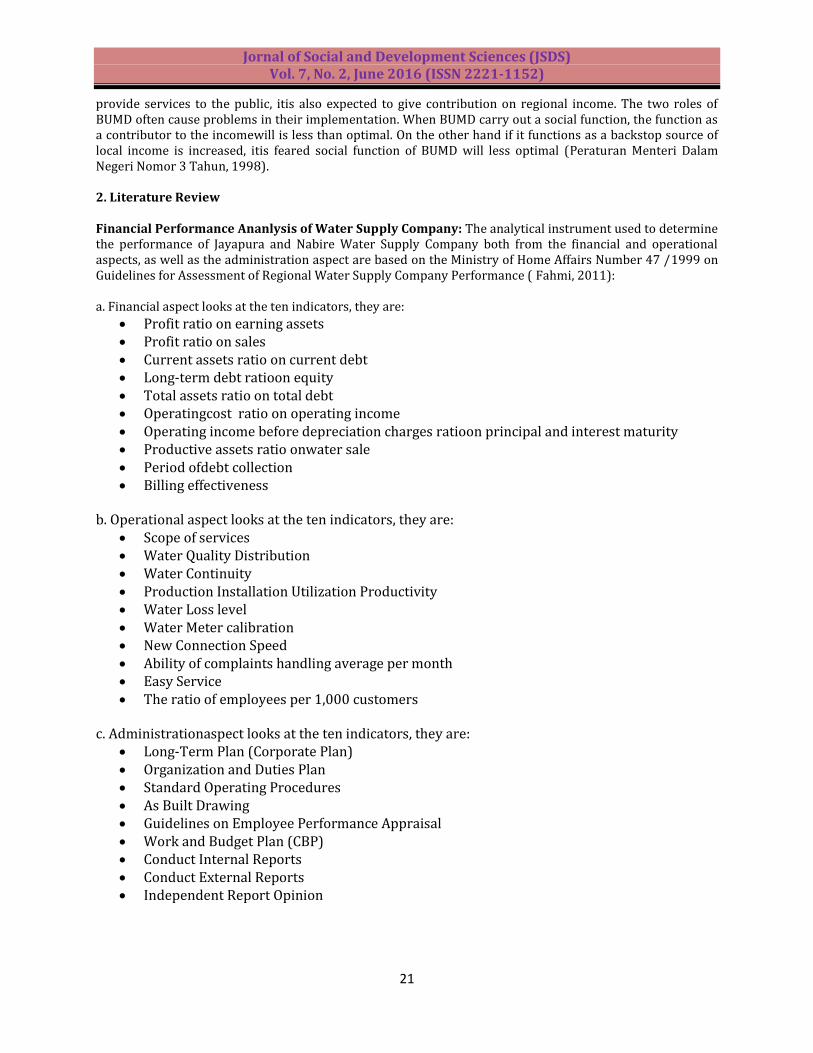
provide services to the public, itis also expected to give contribution on regional income. The two roles of BUMD often cause problems in their implementation. When BUMD carry out a social function, the function as a contributor to the incomewill is less than optimal. On the other hand if it functions as a backstop source of local income is increased, itis feared social function of BUMD will less optimal (Peraturan Menteri Dalam Negeri Nomor 3 Tahun, 1998). 2. Literature Review Financial Performance Ananlysis of Water Supply Company: The analytical instrument used to determine the performance of Jayapura and Nabire Water Supply Company both from the financial and operational aspects, as well as the administration aspect are based on the Ministry of Home Affairs Number 47 /1999 on Guidelines for Assessment of Regional Water Supply Company Performance ( Fahmi, 2011): a. Financial aspect looks at the ten indicators, they are:
Profit ratio on earning assets Profit ratio on sales Current assets ratio on current debt Long-term debt ratioon equity Total assets ratio on total debt Operatingcost ratio on operating income Operating income before depreciation charges ratioon principal and interest maturity Productive assets ratio onwater sale Period ofdebt collection Billing effectiveness
b. Operational aspect looks at the ten indicators, they are:
Scope of services Water Quality Distribution Water Continuity Production Installation Utilization Productivity Water Loss level Water Meter calibration New Connection Speed Ability of complaints handling average per month Easy Service The ratio of employees per 1,000 customers
c. Administrationaspect looks at the ten indicators, they are:
Long-Term Plan (Corporate Plan) Organization and Duties Plan Standard Operating Procedures As Built Drawing Guidelines on Employee Performance Appraisal Work and Budget Plan (CBP) Conduct Internal Reports Conduct External Reports Independent Report Opinion
Jornal of Social and Development Sciences (JSDS) Vol. 7, No. 2, June 2016 (ISSN 2221-1152)
22
3. Methodology
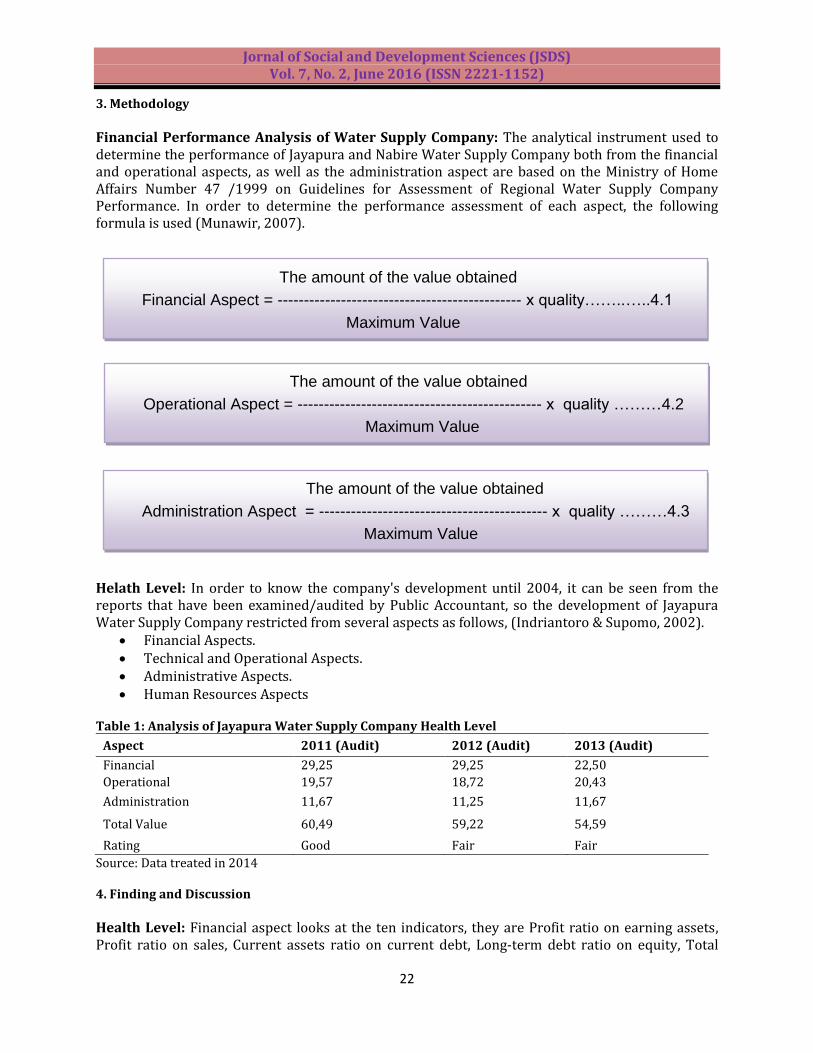
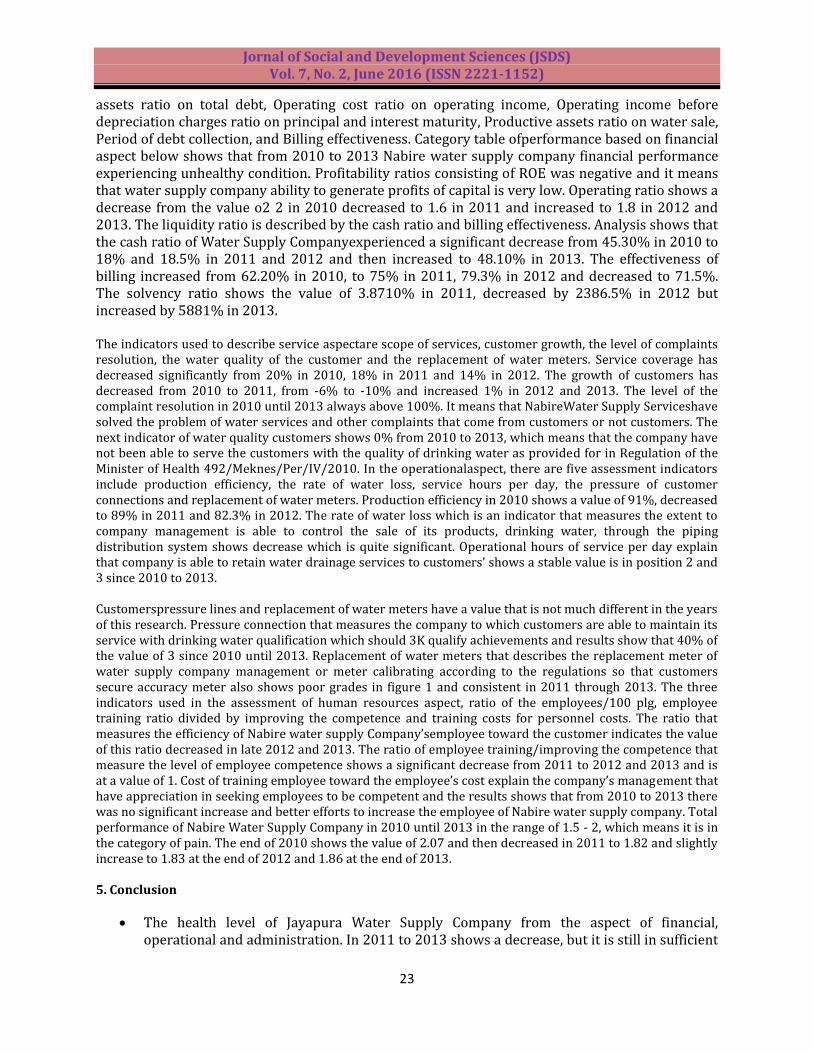
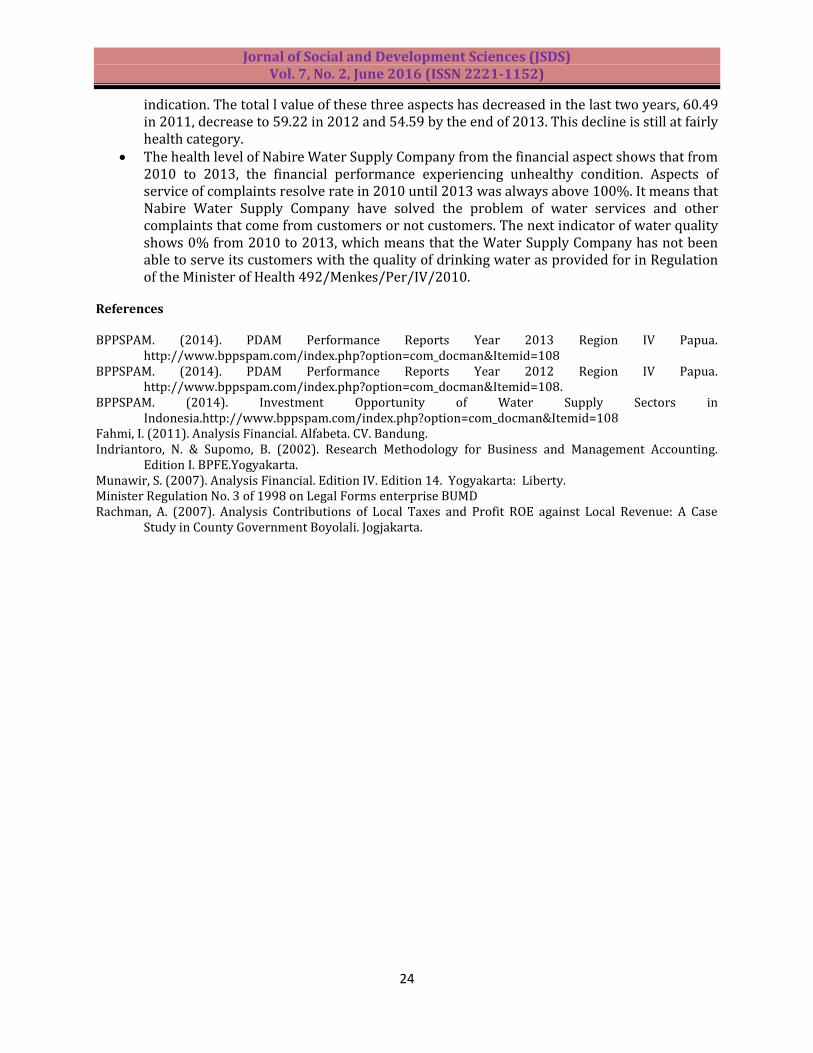
Financial Performance Analysis of Water Supply Company: The analytical instrument used to determine the performance of Jayapura and Nabire Water Supply Company both from the financial and operational aspects, as well as the administration aspect are based on the Ministry of Home Affairs Number 47 /1999 on Guidelines for Assessment of Regional Water Supply Company Performance. In order to determine the performance assessment of each aspect, the following formula is used (Munawir, 2007).
Helath Level: In order to know the company's development until 2004, it can be seen from the reports that have been examined/audited by Public Accountant, so the development of Jayapura Water Supply Company restricted from several aspects as follows, (Indriantoro & Supomo, 2002).
Financial Aspects. Technical and Operational Aspects. Administrative Aspects. Human Resources Aspects
Table 1: Analysis of Jayapura Water Supply Company Health Level
Aspect 2011 (Audit) 2012 (Audit) 2013 (Audit)
Financial 29,25 29,25 22,50
Operational 19,57 18,72 20,43
Administration 11,67 11,25 11,67
Total Value 60,49 59,22 54,59
Rating Good Fair Fair
Source: Data treated in 2014 4. Finding and Discussion
Health Level: Financial aspect looks at the ten indicators, they are Profit ratio on earning assets, Profit ratio on sales, Current assets ratio on current debt, Long-term debt ratio on equity, Total
The amount of the value obtained
Financial Aspect = ---------------------------------------------- x quality……..…..4.1
Maximum Value
The amount of the value obtained
Operational Aspect = ---------------------------------------------- x quality ………4.2
Maximum Value
The amount of the value obtained
Administration Aspect = ------------------------------------------- x quality ………4.3
Maximum Value
Jornal of Social and Development Sciences (JSDS) Vol. 7, No. 2, June 2016 (ISSN 2221-1152)
23
assets ratio on total debt, Operating cost ratio on operating income, Operating income before depreciation charges ratio on principal and interest maturity, Productive assets ratio on water sale, Period of debt collection, and Billing effectiveness. Category table ofperformance based on financial aspect below shows that from 2010 to 2013 Nabire water supply company financial performance experiencing unhealthy condition. Profitability ratios consisting of ROE was negative and it means that water supply company ability to generate profits of capital is very low. Operating ratio shows a decrease from the value o2 2 in 2010 decreased to 1.6 in 2011 and increased to 1.8 in 2012 and 2013. The liquidity ratio is described by the cash ratio and billing effectiveness. Analysis shows that the cash ratio of Water Supply Companyexperienced a significant decrease from 45.30% in 2010 to 18% and 18.5% in 2011 and 2012 and then increased to 48.10% in 2013. The effectiveness of billing increased from 62.20% in 2010, to 75% in 2011, 79.3% in 2012 and decreased to 71.5%. The solvency ratio shows the value of 3.8710% in 2011, decreased by 2386.5% in 2012 but increased by 5881% in 2013. The indicators used to describe service aspectare scope of services, customer growth, the level of complaints resolution, the water quality of the customer and the replacement of water meters. Service coverage has decreased significantly from 20% in 2010, 18% in 2011 and 14% in 2012. The growth of customers has decreased from 2010 to 2011, from -6% to -10% and increased 1% in 2012 and 2013. The level of the complaint resolution in 2010 until 2013 always above 100%. It means that NabireWater Supply Serviceshave solved the problem of water services and other complaints that come from customers or not customers. The next indicator of water quality customers shows 0% from 2010 to 2013, which means that the company have not been able to serve the customers with the quality of drinking water as provided for in Regulation of the Minister of Health 492/Meknes/Per/IV/2010. In the operationalaspect, there are five assessment indicators include production efficiency, the rate of water loss, service hours per day, the pressure of customer connections and replacement of water meters. Production efficiency in 2010 shows a value of 91%, decreased to 89% in 2011 and 82.3% in 2012. The rate of water loss which is an indicator that measures the extent to company management is able to control the sale of its products, drinking water, through the piping distribution system shows decrease which is quite significant. Operational hours of service per day explain that company is able to retain water drainage services to customers’ shows a stable value is in position 2 and 3 since 2010 to 2013. Customerspressure lines and replacement of water meters have a value that is not much different in the years of this research. Pressure connection that measures the company to which customers are able to maintain its service with drinking water qualification which should 3K qualify achievements and results show that 40% of the value of 3 since 2010 until 2013. Replacement of water meters that describes the replacement meter of water supply company management or meter calibrating according to the regulations so that customers secure accuracy meter also shows poor grades in figure 1 and consistent in 2011 through 2013. The three indicators used in the assessment of human resources aspect, ratio of the employees/100 plg, employee training ratio divided by improving the competence and training costs for personnel costs. The ratio that measures the efficiency of Nabire water supply Company’semployee toward the customer indicates the value of this ratio decreased in late 2012 and 2013. The ratio of employee training/improving the competence that measure the level of employee competence shows a significant decrease from 2011 to 2012 and 2013 and is at a value of 1. Cost of training employee toward the employee’s cost explain the company’s management that have appreciation in seeking employees to be competent and the results shows that from 2010 to 2013 there was no significant increase and better efforts to increase the employee of Nabire water supply company. Total performance of Nabire Water Supply Company in 2010 until 2013 in the range of 1.5 - 2, which means it is in the category of pain. The end of 2010 shows the value of 2.07 and then decreased in 2011 to 1.82 and slightly increase to 1.83 at the end of 2012 and 1.86 at the end of 2013. 5. Conclusion
The health level of Jayapura Water Supply Company from the aspect of financial, operational and administration. In 2011 to 2013 shows a decrease, but it is still in sufficient
Jornal of Social and Development Sciences (JSDS) Vol. 7, No. 2, June 2016 (ISSN 2221-1152)
24
indication. The total l value of these three aspects has decreased in the last two years, 60.49 in 2011, decrease to 59.22 in 2012 and 54.59 by the end of 2013. This decline is still at fairly health category.
The health level of Nabire Water Supply Company from the financial aspect shows that from 2010 to 2013, the financial performance experiencing unhealthy condition. Aspects of service of complaints resolve rate in 2010 until 2013 was always above 100%. It means that Nabire Water Supply Company have solved the problem of water services and other complaints that come from customers or not customers. The next indicator of water quality shows 0% from 2010 to 2013, which means that the Water Supply Company has not been able to serve its customers with the quality of drinking water as provided for in Regulation of the Minister of Health 492/Menkes/Per/IV/2010.
References BPPSPAM. (2014). PDAM Performance Reports Year 2013 Region IV Papua.
http://www.bppspam.com/index.php?option=com_docman&Itemid=108 BPPSPAM. (2014). PDAM Performance Reports Year 2012 Region IV Papua.
http://www.bppspam.com/index.php?option=com_docman&Itemid=108. BPPSPAM. (2014). Investment Opportunity of Water Supply Sectors in
Indonesia.http://www.bppspam.com/index.php?option=com_docman&Itemid=108 Fahmi, I. (2011). Analysis Financial. Alfabeta. CV. Bandung. Indriantoro, N. & Supomo, B. (2002). Research Methodology for Business and Management Accounting.
Edition I. BPFE.Yogyakarta. Munawir, S. (2007). Analysis Financial. Edition IV. Edition 14. Yogyakarta: Liberty. Minister Regulation No. 3 of 1998 on Legal Forms enterprise BUMD Rachman, A. (2007). Analysis Contributions of Local Taxes and Profit ROE against Local Revenue: A Case
Study in County Government Boyolali. Jogjakarta.
Jornal of Social and Development Sciences (JSDS) Vol. 7, No. 2, June 2016 (ISSN 2221-1152)
25
Policy Evaluation Analysis on Empowerment of Village Development Program in Ayapo Village, East
Sentani District, Jayapura Regency
Vince Tebay, Elsyan R.Marlissa Cenderawasih University, Papua, Indonesia
[email protected] Abstract: This research analyzes the policy evaluation and measure the successful of such a program. It also prevents irregularity on implementation of government program. By evaluating the program of village empowerment, we are able to determine the success performance rate of that program, whether in province, district, and village. When the evaluation of village empowerment goes well, it will be a correction for next year. So, for the next budgeting year focus on the village empowerment program that increase society participation in development village. It can be concluded that the research aspect on effectively, equalization, determination as the indicator of variable (X) proved that development by Ayapo’s society do not maximal. Since, the society participation has not yet been seen on the most of empowerment programs. Then, there are improvements and increasing on variable (Y) which consist of development health facilities, quality of education, and income. Because, there are physical construction and the society in Ayapo village directly feel the positive impacts. Keywords: Policy, Performance, Empowerment, Participation, Economics, Effectively
1. Introduction Jayapura Regency is expected give mentoring, especially for education program and training on budgeting management. Parameter and indicator of economics clusters are needed on village empowerment policy in Jayapura Regency. That’s implemented on program village empowerment. Ayapo village is one of the villages in Sentani district, Jayapura Regency implemented of that program. However, the implementation of this program still inefficient. It caused by lack of awareness and participation of the society to support this program and the development of this village do not maximal. It supported by the evident that many villagers do not have feasible house, improper health facilities, and terrible transportation. Therefore, improvement of many aspects is necessary to fulfil society needs. By seeing those phenomenons, it needs evaluation to know the implementation of village empowerment in Ayapo village. It also motivates the researcher to analyze the participation of society on development process in Ayapo village. In implementing government program, in this case village empowerment program (PPK), active participation from the society is needed. The participation related to the process of village development as the implementation of government program or PPK. Based on explanation above, the problem can be formulated as: How the process evaluation of policy about village empowerment program in Ayapo village, District Sentani Jayapura Regency? How the development in Ayapo village has been seriously involve society directly in village empowerment program? How the relationship between evaluations of village empowerment policy to the development of Ayapo District Sentani Kabupaten Jayapura? 2. Literature Review Siswanto (1997) claim that the attempt to make society more independent by manifestation of potential to choose the appropriate activities. He said that empirically, many researches showed that society easier to identify, assess, and formulate their problems, whether physical, socio-culture, economics, health environmental, construct vision, and aspiration. Then, they can make priority, inherency, planning, manage, monitoring, and choose the appropriate technology. The attempt to make society more independent also claimed by Merriam (1985). She conveyed that empowerment has two meanings:
Effort to increase society’s capability by doing some development programs, so their living condition appropriate with expected level of ability.
Giving, shifting, or delegating authorization to the society, so that they independent to take decision in order to develop their environment by themselves.
Jornal of Social and Development Sciences (JSDS) Vol. 7, No. 2, June 2016 (ISSN 2221-1152)
26
Based on the opinions above, empowerment is the development approach which focuses on society as the main object of development process by increasing their ability and giving authorization in decision making. Those are in order to establish themselves and their environment independently. That was according to Setiawan (2003). On the other side, Dunn (1994:17) said that public policy clustered into some steps, policy evaluation regarded as a functional activity. Meaning that, policy evaluation is not only in the last step, but also on a whole of policy process. According to Lester and Stewart in Winarno (2012:229), policy evaluation can be divided into two tasks. First task, determine the consequences of a policy by explaining its impact. Then, the second task, assessing the successful or failure of a policy based on standards or criteria’s which determined before. Soumelis (1983) in Mardikanto and Soebiato (2012:265) conveyed that policy evaluation is the process of decision making by comparing observation result on a certain object. Thus, according to William Dunn in Rian (2004:185), policy evaluation can be equated with appraisal, ratting, and assessment. In assessing the successful of a policy, need to develop some indicators, Dunn in Rian (1994) explaining the indicators or criteria’s of evaluation who elaborated by Dunn. 3. Methodology The research method used is associative qualitative. Since, the objective of this research relate to two or more variables. Sugiono (1997:7) said that associative research is one of methods which figure out the relationship one variable to another. Therefore, for analysing data on chapter four, need the formula of correlation product moment. It used to examine and prove that there is relationship influence evaluation on the policy of empowerment village. So, the formula based on Soedjadi (1995: 162) is:
𝑟𝑥𝑦 = 𝑛 𝑋 𝑌− 𝑋 𝑌
𝑛 𝑋2− 𝑋2 . 𝑛 𝑌2−( 𝑌)2
Keterangan: R : Value X : Independent Variable Y : Dependent Variable N : Respondents ∑ : Total 4. Findings Development Sub district Program (PKK) in Ayapo village East Sentani District is the program which driving the dynamics of bureaucracy and local society participatory with mobilization. Meaning that people in Ayapo given budget simultaneously that has been allocated and mentoring by facilitator and consultant. Thus, they are being able developing their village by themselves, so development management goes well. In development sub district program, known as Financial Management Unit (UPK/ Pengelola Keuangan). It manages the financial in the level of sub district and consist of people represent Ayapo villagers. UPK has function as financial management and controlling infrastructure procurement process which support rural social economic activity. UPK also functioned as society’s financial institution that accommodate and manage region development programs. Therefore, the financial for region development programs are easily controlled by themselves. So that, it minimize or tune out the risk of financial leak. Public control is the effective way to anticipate financial leak in managing region developments program. UPK can develop as financial institution alternative in scope of the society itself. It can be the embrio of financial institution which carried out by banking principles and apply cooperative principal. In further, it cans growth legally such as corporation. There are many functions on its development: firstly, preparing of creating access or opportunity for the society in getting help. Secondly, preparing low level of society to use those helping as their business capital. Thirdly, explaining that helping given has to create accumulation capital from surplus of social economic. The development of social economics activities focus on low level society in remote area. Those are such upgrading quality of human resources and increasing capital that supported by integrated
Jornal of Social and Development Sciences (JSDS) Vol. 7, No. 2, June 2016 (ISSN 2221-1152)
27
training since the capital accumulation, mastering of production technique, marketing the result, dan management surplus business. In normative conception, UPK give direction for the people in Ayapo village to take part in cooperative developments. For example: a) development in national food sustainable system, b) development of UKM (small medium enterprise) and small industry with cooperative system c) development of micro credit institution d) and other economics productive based on local potency and society aspiration. Based on finding and discussion of the data found, the problems of this research formulated as : Process of evaluation government policy on the development program in Ayapo village, District Sentani, Jayapura region indicate the society feel the positive effects of the development there, although it works inefficiently. It caused by another factors such as lack of human resources and less of human participation in development process, but they still be a passive participators in development program. The people in Ayapo entangled in that program, but they do not pro active to contribute because there is assumption that region development is the main duty of the government. That is one of the reasons why they are not give active contribution on that program. Then, how is the relationship between evaluations of village empowerment policy to the development of Ayapo District Sentani Kabupaten Jayapura? The answer of the third question proved that government dominate in implementing development empowerment program. On the other hand, the mentor has to socialize this program continually, so for the next program the society can participate directly. 5. Conclusion It can be concluded that the research aspect on effectively, equalization, provision as the indicator of variable (X) proved that development by Ayapo’s society do not maximal. Since, the participation of society has not yet been seen on the most of empowerment program. Then, there are improvements and increasing on variable (Y) which consist of development health facilities, quality of education, and income. Because, there are physical construction and they directly feel the positive impacts. This program encourages project activity rather than awareness process in direct participation on the development program. References Dunn, W. N. (1994). Public Policy analysis, New Jersey: Prentice Hall, Inc Merriam, S. (1985). Organization and Management, Publishers Gift and UT, Jakarta. Setiawan, B. (2003). The Community Development and Participatory Planning, Basic Concepts and Success
Factors, Training Papers on Participatory Planning, MPKD UGM cooperation with Bali Urban Infrastructure Programme (BUIP).
Siswanto. (1997). Through the Community Development Building Housing and Settlement Sector, Paper presented at the Workshop on Application of Strategi Pemberdayaan Community Housing and Settlement Development, 16 to 17 July 1997, BK4N, Jakarta.
Soedjadi. (1995). Analysis of modern management: conceptual framework and some basic applications. Mardikanto, T. & Soebiato, P. (2012). Community Empowerment (in the Perspective of Public Policy),
(revision edition, first edition), CV Alfabeta, Bandung. Rian, N. (2012). Public Policy (revision edition, fourth edition), PT Elex Media Komputindo, Jakarta. Sugiyono. (1997). Methods Administration (revised edition), CV Alfabeta, Bandung. Winarno, B. (2012). Public Policy (Theory, Process, and Case Studies), (revision edition, second edition), PT
Book Seru, CAPS, Yogyakarta.
Jornal of Social and Development Sciences (JSDS) Vol. 7, No. 2, June 2016 (ISSN 2221-1152)
28
Study of Community Participation in the Process of Villages Infrastructure Development on Program
PNPM Mandiri in Jayapura Regency
Flora Yvonne de Quelyoe, Elsyan Reinette Marlissa, Sarlota Ratang University of Cenderawasih Jayapura Papua, Indonesia [email protected], [email protected]
[email protected] Abstract: Community participation in each process of public policy making is an important issue as the mirror of principle of democracy in a country. It would be very precise when participation of community later became one of the principles that should be implemented by the government in an effort to realize good governance. The importance of participation and form of participation given a supporting factor for the success of the government program. The aim of Road Infrastructure development program is to increase local community welfare so they are able to access a wide range economy, social and politic activities. For example, in economic activity, the local producer can easily carry and sell their product to the local market when compared to the previous moment when road was damaged, especially during the rainy seasons. Therefore it is necessary participation of community to engage in solving the road infrastructure problem in their respective villages and districts. This research is located in Jayapura Regency, and using explanatory research with qualitative approach. The Techniques of data collection on this study is using questionnaire, distributed to 80 respondents. The result of this research shows that community participation community in the planning, implementation and evaluation is very good. Community participation on implementation phase of National Program of Community Empowerment (PNPM Mandiri) is really determined by the level community involvement in the planning stages. The important reasons related to community participation are: a) the engagement of community, either directly or indirectly, are able to create feel of belongings to all public asset that has been built with high cost. b) Through community participation, they know about the limitation of government resources (funds, manpower). c) Involvement of local society in those development stages could be a control tools to supervise all development financing in the level of village, district, and regency as well. Keyword: Community participation, Villages Development, Community, Empowerment
1. Introduction National development is development effort is implemented gradually and based on priority scale covering all of Nation and country life (Supriady, 2005). To achieve national goals, stated in the Preamble of the Constitution Act of 1945, namely to protect all people and land of Indonesia, realize the general welfare educating the nation, participate in the establishment of world order based on freedom, lasting peace and social justice. Autonomy as a form of decentralization of government essentially intended to meet the interests of the nation as a whole (Sumarto, 2003). This policy is an attempt to get closer to the goals of governance to realize the ideals of a justice and prosperous society. The existence of Law No 32 of 2004 on local government, directed to accelerate equitable distribution of development results so as to improve the welfare of the people through using their potential, in particular the development of the village (Achmadu, 1990). In the context of rural development, participatory become an important issue, not only being a target of rural development, but also because the most likely to receive the impact of development program is village community itself (Adisasminta, 2006; Hidayat, 2005; Sumarto, 2003). Seems that, Indonesian Government have convinced that participation of community in the development planning is a major prerequisite for the success of development in Indonesia. The willingness of Indonesian government to understand the importance of community participation in development planning is a step forward (Sumarto, 2003). Despite the government’s desire to support participation, but there are still many challenges in the field. However, to encourage people to participate in the development process is a problem that still needs to be solved. The utilization of local potential, especially in rural development will be a valuable activity in order to achieved society welfare (Kartasasmita, 1996).
Jornal of Social and Development Sciences (JSDS) Vol. 7, No. 2, June 2016 (ISSN 2221-1152)
29
2. Literature Review Community Participation: Participation means that an activity in order to evoke feelings and participate or taking a part in the activities of an organization (Hidayat, 2005). Participation is essentially to unify the consideration of the interest of the organization and individual satisfaction, but it is also seen as a technique of the relationship of employment. Therefore, participation in the spotlight as an important position within the scope of employment relationships (Sumarto, 2003). Herein, Participation is defined as an engagement or involvement of the person’s mental and emotional situations that encourage groups to contribute their assets or belongings in order to reach organizational goals and should be responsible for the participation. So, participation is a form of attitude or behavior that supports the existence of a program (Sumarto, 2003). Initially, the behavior itself is individual’s perception which is used to manage environments. The activity carried out by an individual is a perception that can be defined as a process of learning that connects past experiences with the reality today. Then, it will be compared with the alternative way to be taken, which will eventually emerge as a particular action of the people and manifested in form of participation (Hidayat, 2005). Community participation is the psychological events that include mental and emotional involvement. In this case the community is expected to observe, choose, interpret and understand a various types of information received and then will be implemented in the form of action. In addition, the community participation in this context is the engagement totally of individuals (physical, thoughts, material and feelings) as well as their willingness to support the success of an activity (Supriady, 2005). The community, who is actively involved in mutual cooperation, deliberations, and meeting, could be considered as a form of community participation. Community participation is also able to be increased by giving a stimulus in the form of grants, coaching, guidance and supervisions (Rukmana, 1993). Participation is also being importance issue in development context, because public participation give a contribution to the effort of funds utilizing efficiently and transparency. It is because all financing of development activity comes from public funds that must be supervised by the public directly or indirectly (Sumarto, 2003). Participation of society allows decision making which are based on priority needs and public capabilities. It could result in policy design, program, and finance which more realistic and encourage the people to donate their resources such as money, manpower and ideas as well for successful development. Generally, participation has the purpose to create a shared vision, building plans, brainstorm, settings of priorities or make a choice, aspiration and collect information (Siagian, 2005). Based on several opinions above, it can be concluded that public participation is really effective when people are involve in all development process, starting from planning, implementation and evaluation until the stage of receiving the result of development. Participation which has been elaborated before is able to support the process of implementing development program.
Development: Development is an effort to achieve growth and changes which is implemented consciously, and carried out by a nation, state and government towards modernity in order to develop the nation (Rukmana, 1993). In addition, development is process of change towards through the effort undertaken in planned manner. Concept of development is an effort to make changes towards better conditions (Suryono, 2001; Syafiie, 1999). The approach in development activity which focused on the community should be changed to the community-centered approach. It means that the development is focused on the community as a central figure (Yuwono, 2001). Along with the development of the concept and implementation of development in several countries, then there is changing of development paradigm, starting from people-centered strategy until community empowerment strategy as has being mentioned as an alternative of community development (Department Pekerjaan Umum, 2009). It is at least related to new direction of development, such as alignment on society and community empowerment. Infrastructure refers to the physical systems that provide transportation, irrigation, drainage, buildings and other public facilities are required to meet basic human needs in the social and economic sphere. Infrastructure is a major supporter of functions of economic system in people daily lives. Infrastructure system can be defined as facilities or basic structures, installation equipment are built and serves as a social and economic system (Andi, 2005; Kodoatie, 2005).
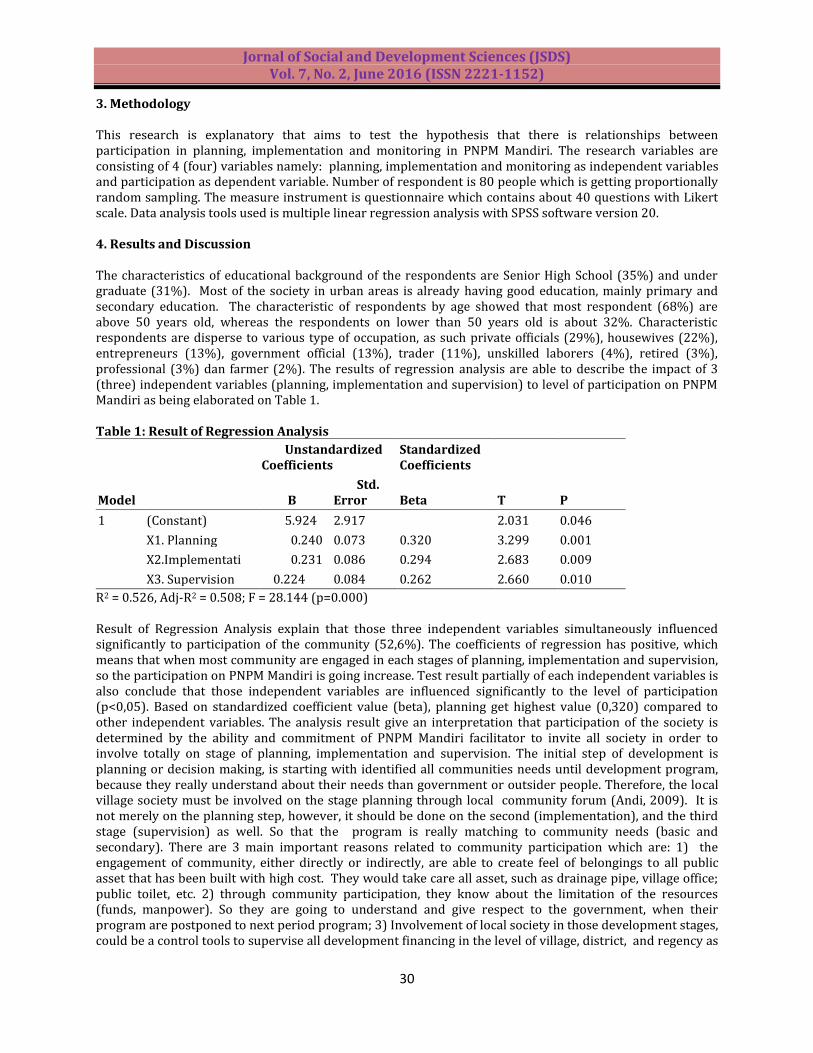
Jornal of Social and Development Sciences (JSDS) Vol. 7, No. 2, June 2016 (ISSN 2221-1152)
30
3. Methodology
This research is explanatory that aims to test the hypothesis that there is relationships between participation in planning, implementation and monitoring in PNPM Mandiri. The research variables are consisting of 4 (four) variables namely: planning, implementation and monitoring as independent variables and participation as dependent variable. Number of respondent is 80 people which is getting proportionally random sampling. The measure instrument is questionnaire which contains about 40 questions with Likert scale. Data analysis tools used is multiple linear regression analysis with SPSS software version 20. 4. Results and Discussion The characteristics of educational background of the respondents are Senior High School (35%) and under graduate (31%). Most of the society in urban areas is already having good education, mainly primary and secondary education. The characteristic of respondents by age showed that most respondent (68%) are above 50 years old, whereas the respondents on lower than 50 years old is about 32%. Characteristic respondents are disperse to various type of occupation, as such private officials (29%), housewives (22%), entrepreneurs (13%), government official (13%), trader (11%), unskilled laborers (4%), retired (3%), professional (3%) dan farmer (2%). The results of regression analysis are able to describe the impact of 3 (three) independent variables (planning, implementation and supervision) to level of participation on PNPM Mandiri as being elaborated on Table 1.
Table 1: Result of Regression Analysis
Model
Unstandardized Coefficients
Standardized Coefficients
T P B Std. Error Beta
1 (Constant) 5.924 2.917 2.031 0.046
X1. Planning 0.240 0.073 0.320 3.299 0.001
X2.Implementati 0.231 0.086 0.294 2.683 0.009
X3. Supervision 0.224 0.084 0.262 2.660 0.010
R2 = 0.526, Adj-R2 = 0.508; F = 28.144 (p=0.000) Result of Regression Analysis explain that those three independent variables simultaneously influenced significantly to participation of the community (52,6%). The coefficients of regression has positive, which means that when most community are engaged in each stages of planning, implementation and supervision, so the participation on PNPM Mandiri is going increase. Test result partially of each independent variables is also conclude that those independent variables are influenced significantly to the level of participation (p<0,05). Based on standardized coefficient value (beta), planning get highest value (0,320) compared to other independent variables. The analysis result give an interpretation that participation of the society is determined by the ability and commitment of PNPM Mandiri facilitator to invite all society in order to involve totally on stage of planning, implementation and supervision. The initial step of development is planning or decision making, is starting with identified all communities needs until development program, because they really understand about their needs than government or outsider people. Therefore, the local village society must be involved on the stage planning through local community forum (Andi, 2009). It is not merely on the planning step, however, it should be done on the second (implementation), and the third stage (supervision) as well. So that the program is really matching to community needs (basic and secondary). There are 3 main important reasons related to community participation which are: 1) the engagement of community, either directly or indirectly, are able to create feel of belongings to all public asset that has been built with high cost. They would take care all asset, such as drainage pipe, village office; public toilet, etc. 2) through community participation, they know about the limitation of the resources (funds, manpower). So they are going to understand and give respect to the government, when their program are postponed to next period program; 3) Involvement of local society in those development stages, could be a control tools to supervise all development financing in the level of village, district, and regency as
Jornal of Social and Development Sciences (JSDS) Vol. 7, No. 2, June 2016 (ISSN 2221-1152)
31
well, 5. Conclusion High awareness of local community to participate in all stage of development program, because they are willing to be an actor in the village development activities. Then, they are expected to changes their live and improves their welfare, individually, family or ethnic group. On participation side, seems that there are several of community participation in PNPM Mandiri in Jayapura Regency. Starting from the role of government (village, local, province) and all stakeholders. The importance things in the whole stages is transparency in providing information about the program, and funding as well. Transparency, accountability and communication are very important because those factors could be an obstacle in implementation of development program, especially in case of community participation. The importance reasons related to community participation which are: a) the engagement of community, either directly or indirectly, are able to create feel of belongings to all public asset that has been built with high cost. b) Through community participation, they know about the limitation of the resources (funds, manpower). c) Involvement of local society in those development stages, could be a control tools to supervise all development financing in the level of village, district, and regency as well. References Achmadu. (1990). Rural Development Focused, Jakarta, Prisma. Adisasmita, R. (2006). Building Participatory Village, Graha Ilmu, Yogyakarta. Andi, A. (2005). Construction Project Management. UNTAD Press-Palu. Andi, A. (2009). The Quality of Rural Infrastructure Development with the Involvement of Local Communities.
Jurnal SMARTEK, 4(2). Fakultas Teknik, Universitas Tadulako. Department Pekerjaan Umum. (2009). Technical Policy of Rural and Urban infrastructure development
based on community empowerment. Hidayat, W. (2005). Participatory Development. Yogyakarta : Penerbit YPAPI. Kartasasmita, G. (1996). Combining growth and Equity, Lidesindo, Jakarta. Kodoatie, R. (2005). Introduction of Infrastructure Management, Pustaka Pelajar, Yogyakarta. Mansor, M., Said, I. & Mohamad, I. (2012). Experiential Contacts with Green Infrastructure’s Diversity and
Well-being of Urban Community. Procedia - Social and Behavioral Sciences, 49, 257–267. Rukmana, D. W. N. (1993). Management of Rural Infrastructure Development. Jakarta : LP3S. Siagian, S. P. (2005). Development Administration, Dimensions Concept and Its Strategy. Jakarta: Bumi
Aksara. Soekanto, S. (2005). Sociology an Introduction, PT. Raja Grafindo Persada, Jakarta Sumarto, H. S. (2003). Inovation, Participation and Good Governance. Jakarta : Yayasan Obor Indonesia. Supriady, D. R. (2005). Regional Development Planning. Jakarta : SUN. Suryono, A. (2001). Theory and Development Issues. Jakarta: UN Press. Syafiie, I. K. (1999). Theory and Development Issues, Rineka Cipta, Jakarta. Yuwono, T. (2001). Regional Autonomy Management: Building an Area Based on a New Paradigm, Clogapps
Diponogoro University, Semarang.
Jornal of Social and Development Sciences (JSDS) Vol. 7, No. 2, June 2016 (ISSN 2221-1152)
32
Strategic Issues of Regional Development: Government Policy Evaluation of Papua
Akbar Silo
Cenderawasih University Papua, Indonesia [email protected]
Abstract: The five-year period of development as outlined in the document RPJMD (Medium-Term Regional Development Plan), has achieved significant success, although there are still conscious strategic issues that are unsolved optimally. It can be traced from a series of evaluation studies to ensure consistency between the programs organized in 5 years with defined policy agenda to achieve the vision of local government. This study was conducted in a pragmatic approach that emphasizes the evaluation of policies: First, Integratif. An evaluation of the program and its financial package on cross institutions (Ind: SKPD/regional work unit). Secondly, comparatively, the achievements of development program compared with: (a) the goals stated in the document of Medium-Term Regional Development Plan (RJPMD/Ind), (b) development of mean achievement average per year, (c) the achievements of other areas, including a national scale and the achievement of the MDG's (Millennium Development Goal's).Object of the study are: All the goals set out in the mission to realize its vision of regional development as well as development programs and activities to achieve the targets and affect from various sources of financial. This study covers the gains of development programs within 5 years, including: macro achievements and outcomes for each development field. In addition, it is also obtained a description of the degree of relevancy, coherence, and correspondence between the realization of programs and activities with targeted goals, as well as the achievement of the mission and the development agenda so it can be measured the degree of the medium-term vision achievement. The district/city as a target sample of the study is Jayapura District, Puncak Jaya, District, Mimika District, and Jayapura city. Keywords: Strategic, Regional Development, Policy Evaluation
1. Introduction In the framework of the implementation of Law No. 32 of 2004 on Regional Government, has put aspects of the regional authority in a strategic position. With these laws, the region gained broad latitude to determine its own internal affairs by the authority is in accordance with the aspirations of the people. Furthermore, in order to accommodate the initiative and creativity of the region, the Government has set up a regulatory framework development planning through Act No. 25 of 2004 on National Development Planning System, which actually serves as a "major corridor" for the management of national and regional development, particularly related to the preparation plan development, implementation mechanisms and performance evaluation of development programs. On the other hand, the framework of regional development in Papua province, intercepted by the spirit and philosophy of Law No. 21 of 2001 on Special Autonomy for Papua Province. The implication, each district / city are required to synchronize the authority in order to create harmony between the two levels of authority in these regulations. On the basic of specialization, the necessary adjustments to articulate authority as "added-justification". Accordingly, the Government of Papua Province has a "special authority" within the framework of governance and development that is oriented on raising the dignity of the Papuan People heading into independence in various aspects of life. The authority is distributed to the districts / cities in the region. In terms of evaluation of development, as outlined in the Indonesian Government Regulation No. 6 of 2008 on Regional Government Management Evaluation Guidelines, paragraph 2, is necessary to EKPPD (Performance Evaluation of Regional Government) at the End of Term of Office of Regional Head. Meanwhile, in the Minister Regulation No. 54 Year 2010 on the Implementation of Government Regulation No. 8 of 2008 on Stages, Procedure for Preparation, Control, and Evaluation of the Implementation Plan for Regional Development, in Paragraph 7, hinted that the Head of Regional Development Planning Agency / State must exercise control and evaluation of the implementation of the RPJMD (Medium Term of Regional Development Plan). Related to that, in order to understand the degree of success of development required the measurement and assessment of the existence of the development plan and its implementation. That measure the successful management of development is related to the articulation of the regional authority in various planning documents, for

Jornal of Social and Development Sciences (JSDS) Vol. 7, No. 2, June 2016 (ISSN 2221-1152)
33
example in the form RPJPD (Long Term of Regional Development Plan), RPJMD, RENSTRA SKPD (strategic plan for sectors-working units), RENJA (annual plan), and other planning documents that are hierarchically have relevance hierarchical relationship with development plans at the national and provincial level to the level of districts and villages. Based on the authorization, the construction can be managed in a planned and sustainable oriented to the fulfillment of basic needs, improved public services, and poverty reduction. Although, in the last 5 years, the government faces a number of factors weaknesses (internal) and challenges (external) as part of the dynamic development of governance and political consciousness of society. These dynamics require the intensity of initiative and creativity in articulating regional authority optimally. As we know that in the period of government, has prepared a 5-year development plan matured as engraved in the RPJMD document. In order to achieve the vision and mission of the construction of a 5-year, the general strategy of achievement include: First, the regional development strategy, intended as a development approach that is tailored to the General Plan Spatial (Spatial Plan), attempted to reach the vertices new development of the region in order to avoid buildup in the central districts, through the further elaboration than the spatial plan the layout plan more specific. Second, the strategy of public welfare development, as a manifestation of the responsiveness of demand to empower people towards physically and mentally welfare society. Focus approach, making man as a central point of development, man as the subject of development is not the object of development with a core of local community empowerment. Further, it is mentioned that in general the target within 5 years implemented through strategies to achieve 5 main priorities, namely: education, health, community economy, infrastructure, and social culture. 2. Literature Review As stated in the document of the Long-Term National Development Plan (RPJPN) 2005-2025, in order to realize equitable and fair development, there should be the distribution throughout the region by improving the quality of life and welfare of the community. This is consistent with the world view as expressed in its interaction in the context of MDG's, where Feeny and Clarke (2009) states that they are designed to address many of the multidimensional aspects of poverty and includes: (1) eradicating extreme income poverty and hunger, (2) achieving universal primary education; (3) promoting gender quality; (4) reducing child mortality; (5) improving maternal health; (6) combating HIV/AIDS, malaria, and other diseases; (7) ensuring environmental sustainability; and (8) developing a global partnership for development. These include efforts to reduce the development gap between urban and rural areas. The development in rural areas it’s important to reduce the gap. It requires seriousness because according Dewanti (2007), the State assets in large quantities are in rural areas, and when this potential is comprehensively developed, and it will give a great contribution to economic development not only at the local level but also at the regional and even national level. Relevant to this case, Fatem (2011) summed up the results of his research that the large influence from conducive situation results from commitment and consistent partiality, which in turn results in a sustainable village empowerment program, unlimited freedom and opportunities for the community to manage village development, increasing public interest in development, and guaranteed improvement for community businesses based on local potentials. The contribution from the strengthening of community capacity results from efforts to improve education, health, public economy, village infrastructures, and village institutions. The small contribution from community protection results from the lack of legal protection that ensures sustainable community empowerment, lack of facilitation in promotion and marketing, and lack of protection for the folk communities’ rights. The major problem in the current rural development is poor accessibility and mobility between rural areas or between rural and urban ones. If this is not achieved, undoubtedly poverty continues to grow, as stated by Robinson and Thagesen (2004), that conventional poverty can be measured by the level of income or expenditure does to reach the living standards. Meanwhile, according to the World Bank, those who earn US $ 370 per year or 10,000 per day were classified as poor. Thus, many available opportunities for development should be optimized by each region, through the patterns of integrated management, including proper planning, strict implementation, and evaluation are attached. In that case, an evaluation related to the desire to determine the success and failure of a policy, program, and activities is needed. It required a depiction of the impact of a policy. Thus, an evaluation should include several activities, namely specialization, measurement, analysis, and recommendations. Specialization, are intended to identify
Jornal of Social and Development Sciences (JSDS) Vol. 7, No. 2, June 2016 (ISSN 2221-1152)
34
goals or criteria by determining the focus target which is evaluated. Measurements, is required as the criteria used to assess the success, benefits, and impacts, related to the activity of gathering information relevant to the evaluation object. Evaluation is based discipline practitioners and evaluation theory comes from practice. Meanwhile, Leviton (2003), in her article, asserts that Very important has been the emergence of more comprehensive frameworks based on collective experience, and increased reliance on findings from other fields to inform us about the processes underlying utilization. The improved clarity of frameworks is important especially for the novice evaluation practitioner. The next, evaluation theory requires extensive empirical studies that take into account all the various issues and variables that interact in any given context so that the evaluation of predictive models may provide support for all of the potential outcomes of each option. According to Shadish, in Harnar, (2014) provided a clear reason why the theory of critical evaluation: includes what was done, what drives it is done, and the nomenclature given practice framework. In this context, the evaluation can be understood as an attempt to measure and give an objective value on achievement of results of the program that had been planned in advance and carried out systematically and objectively using the relevant evaluation method. The evaluation carried out both before a program/project which is implemented (ex-ante evaluation), when progress (on-going evaluation), and after the program/activity completed (ex-post evaluation).Objective and systematic evaluation is done taking into account the following principles: relevance, efficiency, effectiveness, impact, and sustainability. In conducting the evaluation, developed the procedure "cluster" according the stages: (1) Identify the purpose of the program to be evaluated;(2) analyze the root of the problem;(3) describe and standardize program and activities;(4) Perform measurement of the extent of the changes;(5) Determine whether the observed changes are the result of such activities or due to other causes; and (6) utilize appropriate assessment indicators in determining the measure of input, process, output, impact and benefits of a program/activity. In this case, Bitar, Hbeichi, Al-Zou'bi & Russon (2015) explains that, "Evaluation Cluster" is the process of assessing the progress, results and impact of programming initiatives to help use this information to plan and manage program, and educate the recipient, policy makers, and other relevant communities.Then, it is mentioned that "Evaluation Cluster" is a mechanism to collect information to use in determining the extent to which it can help people improve the quality of life. As stated in the Humanitarian Response Review (2014) cluster is a group composed of sector or thematic topic chosen, depending on the setting done by the Government. Premise is basically accountability, predictability and reliability that can be improved by identifying policies and strategies of the organization responsible for the certain fields. Development programs and activities accompanied by its evaluation plan include important questions as the basis of determining the cluster evaluation. The evaluation is conducted to get feedback so that biases the implementation of the program/development activities can be recognized, and formulated measures accurately perfected. Results of the evaluation according to Bourgeois & Nare (2015) shows that the evaluation instrument is used which is based on the type of recommendation that has been established to provide a response to the evaluation of programs/activities that was resulted .In order to make a judgment, the evaluation results will be grouped into very successful, not successful, quite successful, successful and very successful. Indicators are the identification and classification of indicators through the collection and processing of data to determine the performance of programs and activities. In order to assess the achievement of program/development activities that have been planned and implemented, used evaluation indicators include: input, output, results, benefits, and impacts achievement of performance that is a measure of performance to achieve measurable, tangible efficiency, effectiveness, quality, and quantity of execution programs and activities. Furthermore, the types of formulation of indicators, can actually be formed: Qualitative (using the scale: excellent, enough, less); Quantitative absolute; Percentage figure; ratio scale; Average (the average rate of a population or total events) and the Index (the benchmark figure of some variable incidence). 3. Methodology This study was conducted in four districts/cities sampled in Papua Province, namely, District: Jayapura, Mimika, Puncak Jaya District, and Jayapura City. The researcher uses a combination of qualitative-quantitative method, because the necessary flexibility in understanding the data. In matters related to the planning documents and evaluation of existing does not allow to only quantitative. Mixing approach,
Jornal of Social and Development Sciences (JSDS) Vol. 7, No. 2, June 2016 (ISSN 2221-1152)
35
according to Greene (2007) was used to develop and examine a set of statements to describe the transformation and potentially distinguish it from the others for more specifics understanding.In the context of the macro cannot only use a qualitative approach. To achieve the objectives of this study, the researcher applied the steps as follows: (1) Selection criteria, to establish the criteria used to assess the performance of the construction.(2) Determination of criteria, based on selection criteria, set at least one criterion that is considered appropriate. So that the evaluation does not become too complicated, just use three criteria.(3) The indicator, based on selected criteria, defined indicators for each criterion.(4) Determination of parameters, for each indicator selected parameters to be specified benchmark assessments. 4. Results Strategic Issues Analysis by Type of Fields-Mandatory affairs: Based on Government Regulation No. 38 Year 2007 about Division Affairs between the Government, Provincial Governments and Regional Government of Regency/City, are implicitly expalained in Article 7, obligatory is government affairs that shall be done by the provincial government and government district/city. The whole affair shall be regarded as strategic affair that has been held well. It is not mentioned in detail according to the nomenclature, as tailored to the implementation of the basic tasks and functions carried by SKPD. For example health affairs, handled by the Department of Health and Hospital Implementation Unit, classified into land affairs and government affairs, including the district, the affairs of national unity include municipal police. Options Fields: Affair choice as referred in Article 6 of Government Regulation No. 38 Year 2007 is a real government affairs that exist and have the potential to improve the welfare of the community in accordance with the conditions, peculiarities, and potential in the regions concerned. Consist of maritime affairs and fisheries, agriculture, forestry, energy and mineral resources, tourism, industry, commerce; and transmigration. In this affair, it is not all organized, but selected only the matters that are strategic for regional excellence. In the implementation, the adjustment of the basic tasks and functions according to the organizational structure and working procedures that applied. In which, a number of such affairs, industrial affairs and trade affairs to be part of the affairs of the Department of Industry, Trade and Cooperatives and SMEs. Likewise with integrated transmigration affairs with the employment affairs. Achievement consistent implementation of programs and activities for 5 years is 47.85%, in the category "Self-sufficient" with a value of 3 which implies that it is generally quite successful in conducting the affairs of choice.
According Issue Analysis Strategic Priorities for Development-Education Field: Human resource development efforts, referring to priority education sector in line with the national education development agenda as well as at the level of the province of Papua. Prioritizing education policy is meant to sharpen the direction of development objectives in order to increase competitiveness. The existence of financial support through the organization of co-administration of the Central Government and the Provincial Government of Papua, which has become a strategic opportunities that can be optimized. But not only rely on leader government support, but applied some breakthrough appropriate policies and strategies. Furthermore, the basis for the strategy was developed: First, seeking the expansion and equitable distribution of educational opportunities, especially for children aged 7-15 years. Secondly, pioneering educational boarding patterned with one-stop system; and Third, the implementation of inclusive education; Forth, regeneration children of Papua through the partnership program at internal and abroad. Basically, it has been responded equally between the authority of a special autonomy and the charge of the Law on National Education System (adopted parallel with RPJMD). At the same time consider the achievement of the Millennium Development Goals (MDG's) in the field of education, in 2015 ensured all children aged 15 years (men and women, children, minorities and children who are less fortunate) can complete the quality of basic education. Therefore, education development foundation, carrying the paradigm of national education (collaborative learning), which provide more open space for stakeholders in the education sector to be actively involved in the whole process of provision of educational services. This also underlies the development of education that is able to create equilibrium-based two-dimensional, where education shall be integrated through the development of curriculum charged national and institutional, which adopt and accommodate national values and also give recognition to the existence of values that live and thrive in a society with the character of locality.
Jornal of Social and Development Sciences (JSDS) Vol. 7, No. 2, June 2016 (ISSN 2221-1152)
36
Furthermore, by using the general indicators results as the basis of assessment within a period of 5 years later, the general performance of the development achievements in the education sector was the degree of success beyond the target RPJMD with an average of 105.53% achievement. This figure was obtained through a comparison between targets and achievements RPJMD last year only in four types of indicators of outcome, i.e., the net enrollment ratio, gross enrollment ratios, and the level of literacy. As for the indicators, such as, access learning for students Papua native, ratio of participation (enrollment ratio) in Primary Education, proportion of students start in grade 1 and reach Grade 5, analyzed qualitatively with the criteria of achievements at the level of "Enough". However, it needs a carefull that should be guard against the formation of annual performance. This is in line with the aggregate results of the analysis of the consistency of program achievements and activities. With consistency in the three years beginning in the category "Self-sufficient", and in the last 2 years in the category of "Insufficient, showed a tendency to move down. It implies that, first, the education budget has been affected above the minimum of 20% of regional budget per year, does not provide adequate contribution to the implementation of programs and educational activities that are substantive. Secondly, there is still a lack of creativity in the realization of the programs and activities of substantive, which implicitly intersect with aspects of human resource development. Thirdly, the proportion of the activities of a mere administrative (non-substantive) should be limited, so that the available budget can be optimized to improve the quantity and quality of the implementation of programs and activities that are substantive in education. Health Fields: The data base of health is needed to support one of the main strategies of human resource development in the health sector, namely improving surveillance, monitoring and health information with one of its products is the functioning of health information systems are based on data from district level down to district and village. The basic health data needed, covers all health indicators principal about the case of health (mortality, morbidity, and the number of disability), environmental health (physical environment, biological, and social), health behaviors (hygienic behavior and lifestyle), and the various aspects of health care (access, quality of care, health financing).Health Department, has been working to meet the needs of data/information with a view to mapping the objective conditions of development progress in the health sector in this area. With anallocation budget at least 15% of the budget that has been able to be realized, then the planning and implementation of programs and health development activities must be supported by the availability of accurate and complete data. In this case, the Health Department has been trying to meet the needs of planning data as shown in RPJMD document, although not exhaustive appropriate indicators of achievement set out in the SPM Health and MDG's. Similarly, in terms of reporting development achievements in the health sector has not fully used the indicator in question. With such a composition, it can beknowthat the degree of success of health development has exceeded its target of 4.75%.The figure was derived from the average of the achievements of the 34 types of indicators were identified quantitatively. While qualitatively still many aspects that need to be addressed more seriously in the future, such as, with regard to the provision of infrastructure and health facilities and the quality is adequate, inpatient services, the handling of patients with acute diseases and infectious, handling labor and birth, repairs nutrition, environmental health, as well as decreased levels of utilization of traditional medicine/herbal health standards which do not suit. Economics Fields: Economics is one of the important priorities within the framework of development in line with national economic development policies and policies of special autonomy in Papua. In this case has a lot of programs and activities implemented by relevant agencies, and even involve the agency up to the district and village level which is well organized in the context of obligatory functions and affairs of choice, and even some of the programs and activities of which are launched from the Central Government and the Provincial Government of Papua in the form of assignment with deconcentration based. An important note in this regard, especially in the context of measuring the achievement of economic development, because it is faced with the conditions in which: First, the document RPJMD, is not equipped with an indicator precise measurements as the basis of assessment, but only the technical nature of operating more deserves as indicators of achievement in Strategic Planning documents or working plan. Second, integration of programs and activities of the government superiors have not been integrated into the scale of assessment of indicators of success are accurate and complete. Third, it is not enough support for data on the achievements of
Jornal of Social and Development Sciences (JSDS) Vol. 7, No. 2, June 2016 (ISSN 2221-1152)
37
successful economic development per year which is ongoing and dynamic. Fourth, the various programs and activities that overlap in the form of redundant and even pitch so that potentially harm reduction in the assessment of achievements achievement, because not smooth mechanism CISS (coordination, integration, synchronization, and Simplification) across agencies related SKPD (sectors-working units). Surely nothing can be done to give consideration and evaluation, except by giving qualitative weight which is not too promising adequate degree of accuracy. However it should be noted that the agricultural sub-sector, at least marked the government's efforts to increase the intensity of land use is becoming increasingly better sleep. Likewise with livestock production continues to be driven, as well as their efforts to protect farmers against middlemen. However, food production is still considered lacking due to insufficient local needs, both grains and tubers and local food production such as sago. Therefore, the availability of food in each region is still inadequate because productivity is still low. Meanwhile, the plantation sub-sector, as represented targeted in the year of 2011 is 690 kg / ha, it is still insufficient achievements, including a new Cocoa productivity reached 0.93, while the production of forest and agro also still less optimal. In fisheries sub-sector, utilization marine resources, and the degree of protection of the fishermen of the middleman has strived to the maximum so that the production of fisheries and marine considered quite inadequate to meet the protein requirements of fish for the community. But aquaculture production which was originally targeted as much as 286.788 tons per hectare is still considered less equal.In Cooperatives and SME sector, the role of cooperatives as the pillar of the people's economy is still less serve to grow the creative economy to the villages and districts. It is characterized by the limited number and quality of cooperatives and SMEs or joint ventures that operate effectively with a number of members are recorded only 5.033 people still considered to have a low degree of representation. Likewise with the industry growth rate of the people who rely on the agricultural sector, especially high-value commodity adds. In the commercial sector, still needed the availability of people who are traditional markets in the districts and villages which can operate on a regular basis every day. It does not also obtain adequate support from employer’s cooperation in utilizing social responsibility to foster a creative economy in the field of trading and industry. Therefore, the aggregate economic conditions of the people who tend to move towards the negative, it can be understood if the reception area of revenue is still very limited, because the extension of regional income sources cannot be explored optimally. Furthermore, although there is a movement to improve the unemployment rate, it does not mean that it has achieved satisfactory results in terms of employment, because of the absorption of labor in the formal sector and non-formal are not encouraging. The only causal factor for the success of suppressing the number of unemployed is the job mobility of the population as a consequence of the increasing number of government funds affected to manage various programs and activities to the villages.
Infrastructure Fields: One area of strategic development priorities is infrastructure. Infrastructure development even becomes part of the policy and strategy of the Central Government and the government of the province of Papua in order to open the isolation area. Accessibilityof public services increasingly have a wider range, and further encourage the growth of the regional economy and society as well as increase social mobility. Therefore, basic infrastructure such as roads and bridges, housing, clean water, and electricity became the main inspiration in principle the increasing dynamics of community life in its various aspects. Realizing this, through SKPD institution, continues to spur the programs and activities of the construction of roads and bridges, housing, and the provision of worth clean drink water. There are 6 types of indicators that can be measured quantitatively, namely with regard to the increased length of 64.12 km road as far as the still far below the target RPJMD along 1,452 km to 893.94 km road length quality that goes far beyond the target RPJMD along 243 km. The roads and bridges are maintained as far as 135.37 km while the target RPJMD is 446 km. While the Type 36 permanent house built for the community as much as 430 units more than the target RPJMD only 300 units, as well as clean water network installed throughout the 18,000 m which is still very far from the target RPJMD along the 26,500 m. Thus, the aggregate of the six types of activities the achievement degree of success obtained by 124.98% or generally exceeded targets ideally. The 8 types of activities for the public works and 5 types of activities for the identified transportation can only be analyzed qualitatively, in which all activities intended to obtain sufficient assessment good. However, it still needs to

Jornal of Social and Development Sciences (JSDS) Vol. 7, No. 2, June 2016 (ISSN 2221-1152)
38
watch the performance of its programs and activities in the coming years, give the degree of consistency in general to 5 years later tendency toward negative. Social and Culture Fields: Social and cultural sectors, a development that is not classifiable into areas covered in the previous development. In this case, religion, women's empowerment, family planning, culture, youth, sports, and social welfare are involved.Similar with other areas of development, socio-cultural field did not has a representative indicator for the evaluation base and does not have data sufficient achievement indicators. Thus the socio-cultural field cannot be assessed quantitatively. The qualitative assessment conducted based on public point of view which is summarized through in-depth interviews of informants. In order to empower women there are four indicators chosen, namely: The ratio of girls to boys in the level of education of primary and secondary, Share female workers of non-agricultural sectors, percentage of violence against women, the proportion of women in the scope of the bureaucracy and politics, have an assessment with negative image, in which the ratio of females to males in primary and secondary education levels regarded as still small. In general, judging that the boy still more in every level of education. The involvement of women in the agricultural sector is still limited. The violence against women is still considered common in high frequency, mostly undetected. Likewise with the participation of women in politics and government are still fewer than men. There are 900 poor married couples who are targeted as the target family planning services of family welfare programs, but their achievements assessed to be less touched on aspects of regional and fostering consistency. The number of family planning participants, which fostered 23.708 people assessed to be less than the number of families. In terms of culture, related to the promotion aspect is considered still very limited, so that the culture of various tribes are still less known in the outside world, while fostering and preservation of local culture is considered to have a promising hope for existence. Related to the youth, achievements aspect in various fields is generally assessed to be less prominent, although it is recognize spatially in the fields of politics, law, government and sports, some of whom have been able to show a proud achievement. Similarly, the productivity of the youth in entrepreneurship independently not seems significantly influence in motivating themselves and society. While in the field of sport, still magnified ask the achievements of the students, not unheard of achievement of student achievement in a sporting event at the regional and national levels. On the other hand, the participation of athletes in various events up to a mash national level need to be upgraded so that the achievements earned can reach championship title. Meanwhile, for social welfare, there is a judgment that the growing social problem, including the use of alcohol and drugs. But, it is not accompanied by efforts to prevent it maximally. Web Design Analysis: In this section, analysis of web design using data source from the Ministry of Village, Development of Disadvantaged Regions, and Transmigration. Table 1: Baseline of 27 Mean Progress indicators and Trend Direction Standardization
No. Indicator Basic Data
Standardization Trend
Intervention Status
1 Poor family (%) 18.64 (0:01) (*)
2 Consumption Expenditure Per Capita (IDR) 622.12 (0:01) (*)
3 Life expectancy (Index) 67.32 0:18 (*)
4 Average Length of School 9:54 0:08 (*)
5 Literacy Rate 96.65 (0:27) (*)
6 The village which has Asphalt / Concrete road 79 1.85 (***)
7 The village which has hardened road 27 0:50 (***)
8 The village which has soil road 20 (0.46) (***)
9 The village which has other status road 1 (0:13) (***)
10 Household Electricity Users (%) 86.85 0:09 (*)
11 Household Phone Users (%) 7.70 0:18 (*)
12 Household Water Users (%) 46.81 0:21 (*)
13 The village which has non-permanent markets 113 1:05 (***)
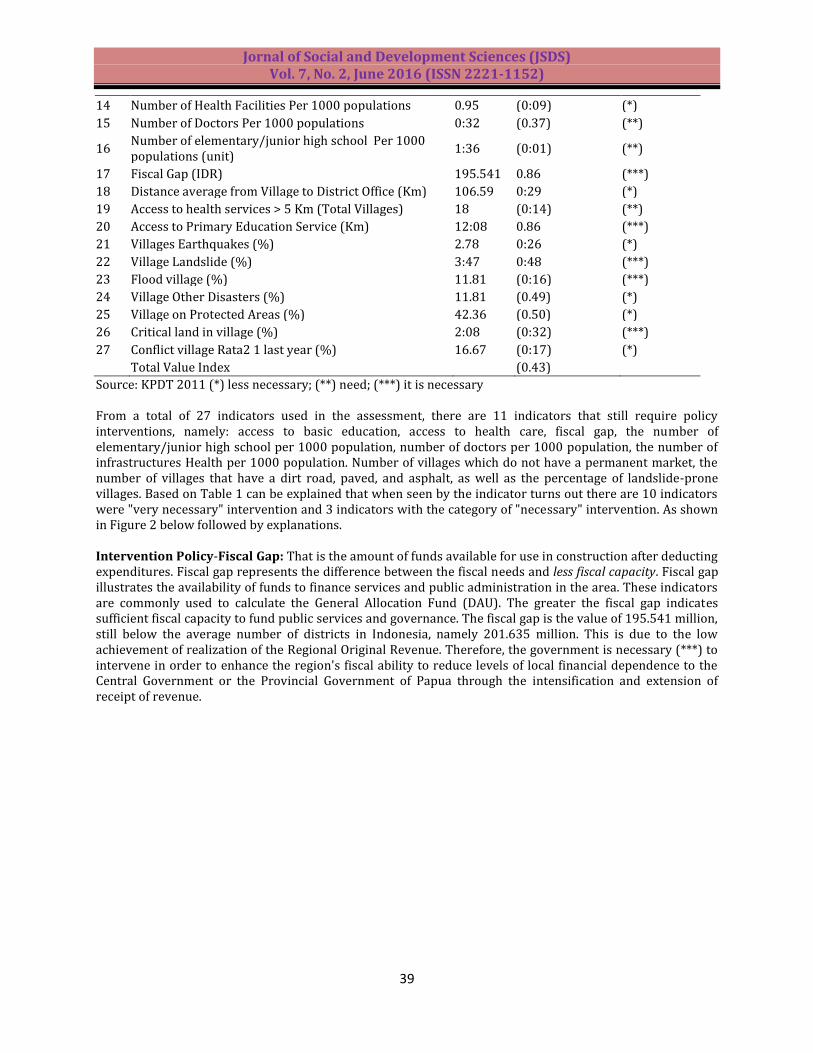
Jornal of Social and Development Sciences (JSDS) Vol. 7, No. 2, June 2016 (ISSN 2221-1152)
39
14 Number of Health Facilities Per 1000 populations 0.95 (0:09) (*)
15 Number of Doctors Per 1000 populations 0:32 (0.37) (**)
16 Number of elementary/junior high school Per 1000 populations (unit)
1:36 (0:01) (**)
17 Fiscal Gap (IDR) 195.541 0.86 (***)
18 Distance average from Village to District Office (Km) 106.59 0:29 (*)
19 Access to health services > 5 Km (Total Villages) 18 (0:14) (**)
20 Access to Primary Education Service (Km) 12:08 0.86 (***)
21 Villages Earthquakes (%) 2.78 0:26 (*)
22 Village Landslide (%) 3:47 0:48 (***)
23 Flood village (%) 11.81 (0:16) (***)
24 Village Other Disasters (%) 11.81 (0.49) (*)
25 Village on Protected Areas (%) 42.36 (0.50) (*)
26 Critical land in village (%) 2:08 (0:32) (***)
27 Conflict village Rata2 1 last year (%) 16.67 (0:17) (*)
Total Value Index
(0.43)
Source: KPDT 2011 (*) less necessary; (**) need; (***) it is necessary From a total of 27 indicators used in the assessment, there are 11 indicators that still require policy interventions, namely: access to basic education, access to health care, fiscal gap, the number of elementary/junior high school per 1000 population, number of doctors per 1000 population, the number of infrastructures Health per 1000 population. Number of villages which do not have a permanent market, the number of villages that have a dirt road, paved, and asphalt, as well as the percentage of landslide-prone villages. Based on Table 1 can be explained that when seen by the indicator turns out there are 10 indicators were "very necessary" intervention and 3 indicators with the category of "necessary" intervention. As shown in Figure 2 below followed by explanations. Intervention Policy-Fiscal Gap: That is the amount of funds available for use in construction after deducting expenditures. Fiscal gap represents the difference between the fiscal needs and less fiscal capacity. Fiscal gap illustrates the availability of funds to finance services and public administration in the area. These indicators are commonly used to calculate the General Allocation Fund (DAU). The greater the fiscal gap indicates sufficient fiscal capacity to fund public services and governance. The fiscal gap is the value of 195.541 million, still below the average number of districts in Indonesia, namely 201.635 million. This is due to the low achievement of realization of the Regional Original Revenue. Therefore, the government is necessary (***) to intervene in order to enhance the region's fiscal ability to reduce levels of local financial dependence to the Central Government or the Provincial Government of Papua through the intensification and extension of receipt of revenue.

Jornal of Social and Development Sciences (JSDS) Vol. 7, No. 2, June 2016 (ISSN 2221-1152)
40
Figure 1: Diagram Analysis Web Design
Access to Primary Education Services: On average the range of access to centers of education services as far as 12.08 km. Apparently, these figures are above the average number of districts in Indonesia is 8.5 km. This shows that in general, accessibility geographically is high which shows that in general, primary and secondary school students have to travel long distances from the residence to the school. Handling this issue through policy intervention is necessary (***) to get closer to the centers of educational services to the public more precise, among others, the school opened a patterned roof dorm. Total Elementary /Junior school Per 1000 Population is sufficient that one, 36 per 1000 population. This figure is almost equivalent to the average of districts in Indonesia that is 1.39 per 1000 population. Nonetheless, it is still necessary (**) intervention policies through various breakthroughs to increase this ratio as an alternative to the policy of the roof patterned boarding school. Figure 2: Development Indicators Before intervention
Jornal of Social and Development Sciences (JSDS) Vol. 7, No. 2, June 2016 (ISSN 2221-1152)
41
Access Health Services: There are still some villages that have access to health services within more than 5 km or more. Compared to the average of districts in Indonesia, this figure is still quite good. Nevertheless, it is still required (**) policy interventions more intense, in line with the vision of increased outreach education services cost and quality of human resources in order to build a healthy spiritual and physical. The number of doctors is sufficient, with a higher ratio than the average district in Indonesia. However, assessed still require (**) further policy intervention in order to increase the number and quality of doctors, associated with efforts to improve the quality and coverage of health services. Where, in each unit of health services to the health center, health center Roving, and IHC qualified doctors available. Number of health infrastructure, fairly adequate, although only slightly above the average of districts in Indonesia. Although still require policy interventions are in the category of less need (**). Therefore, the dynamics of society demand continues to grow due to the increase of health care more accessible. As we know that in addition to hospitals, has been supported by the availability of adequate health centers scattered in districts and villages. Market Village: There are still many villages that do not have a permanent market, so it is still very necessary (***) intervened. In order to spur economic growth and development of village entrepreneurship among the people of the village, is indispensable traditional market infrastructure availability permanent as one strategy to intensify the motivation of people in the business, at the same time making it as a container for the product market expansion villagers. If necessary regulated through binding regulations that at certain times of the apparatus and urban communities are required to shop at these villages. Have Road Village and so on: Based on this indicator, Villages that have dirt roads, paved and unpaved, as many as 79 villages, is still below the district average in Indonesia that still need to be intervened (**). Meanwhile, Number of villages with paved roads is still limited. Paved road is usually found on the road that connects the village with the local agricultural / plantation society. The street is very necessary (***) improved livelihoods since most of the population is obtained from the farm. With the means of transport that connects the village with the area of agriculture or plantation, of course, can further increase the frequency and distribution of agricultural production flow channel. This too is in need (***) policy interventions in improving the status of a road paved, asphalted / concreted. Likewise with the landslide-prone villages there is still approximately 3:47%, below the national. Of course required (**) government intervention, so as to prevent landslides. In addition, necessary to reduce illegal logging in the forest. Moreover, there are still approximately 2:08% villages have critical land, 11.81% is prone to flooding. 5. Conclusion RPJMD document, not yet fully used as a reference for planning program and an annual activity by all SKPD. The general policy direction and financial policy areas, have not been consistently used as the basis for policy development in various fields and sectors, so it can’t be known for certain target achievement overall. Less expensive policy implementation factors opportunities and challenges in a mature and accurate, so it does not need to happen crisis, requiring a readjustment plan and financing programs that require rationalization of local revenue sources. The formulation of the goals listed in the RPJMD document, did not explain clearly quantitative measures as well as the formulation of indicators and parameters of the size of the program and activities do not have the eligibility to serve as a reference for evaluation assessment. Indicators are formulated in accordance with the formulation of the indicators adopted by the national or at the level of the Province of Papua, and also formulated local indicators corresponding real needs of society. The Agencies of SKPD, inconsistent in implementing development programs that should be run properly every year. Many programs / activities undertaken without being based on medium-term planning document that has been agreed upon, but appeared suddenly as needed and or situational interests. There are very few programs are adequately implemented in order to achieve 5 missions and 14 goals. Most accomplished with inadequate results. Meanwhile, there are many programs and activities listed in the RPJMD document that failed to materialize, and even many programs and activities are held without an agreed reference for planning. According to Priority Sector. during the initial three years, the priority development of education in the category "Self-sufficient", and in the last 2 years in the category of "Insufficient (on the Likert scale), show a tendency to move down. Furthermore, in the aggregate, achievement of consistent implementation of development programs in health sector, it can’t be said to be the maximum, because in 5 years later
Jornal of Social and Development Sciences (JSDS) Vol. 7, No. 2, June 2016 (ISSN 2221-1152)
42
achievements of consistency at the level of "Self-sufficient". In the economic field, there is a tendency of decreasing achievement of consistency with the achievements of aggregate for 5 years is 2.82 or categorized as "Self-sufficient". Meanwhile, in the field of infrastructure, tend toward the negative, with an average category at level 3, namely, "adequate". The aggregate outcomes consistent implementation of government programs was negative with patterned zigzag conjuncture. Meanwhile, against the development program in socio-cultural field, the aggregate gain category "Quite adequate", with the trend moving in the negative direction. This caused a decrease in the degree of consistency of program achievement. With tolerances that the average achievements per year in the category "Self-sufficient". Lead to the creation of conditions of security and order are increasingly inadequate. It is conditioned by progress pa da period of 3 years, indicated by: (1) Access to education at the level of primary and secondary education, have acquired the portion of high attention, and has a tendency to development better than at the provincial level and national , so that the degree of quality and scope of educational services is increasing. (2) The degree of health services cheaper and more quality perceived by the public (including the poor). (3) Increasing basic services for the population, especially in terms of accessibility of households to clean water and electric lighting, as well as the area of telecommunications to the districts and villages. (4) success in empowering the community for 5 last years communities that have been able to deliver a better level of welfare and into the area of best practices for other regions in Papua and outside Papua. (5) It has a great potential as a new area industrial region, and trade center primary business center in the area of Papua and West Papua, and even in the Pacific Region, as supported by the ease of investing and the security situation more conducive and accessibility land transport, water and the sea is getting better. The other hand there are still some things that assessed yet been optimal, with respect to, (1) A large number of school-age children in primary and secondary education are not handled optimally as a direct implication of inadequate quality and affordability of infrastructure and educational facilities. (2) The availability of doctors and hospital facilities and health centers are inadequate quantity and quality according to the standards assigned, including surgical facility. (3) The assertion status of the right to land and land administration arrangements in each village / town and district, are still inadequate. Therefore, measures need to be more serious in asserting boundaries of customary rights of indigenous peoples. (4) The intensity of the development of regional culture on any existing tribe ongoing basis. (5) The success still requires follow-up financial governance improvement and development of villages optimally, should intervene administration and institutional policies on an ongoing basis. (6) The data subject is accurate and viable development is not yet available in a comprehensive, integrated, dynamic, and applicable, to be used by all sides as a common reference in policy formulation and development planning. (7) Fiscal gap is still wide in which the budget is still very high dependence. The reception itself is still very limited with a small contribution to the regional economy. (9) There may be controlled throughout the critical areas because of the low awareness of the public, although there are enhance percentage of degraded land under control. Meanwhile, the monitoring has not been significantly intensified against residents who violate the orderly build in the forbidden zone. References Bitar, K., Hbeichi, R., Al-Zou'bi, L. & Russon, C. (2015). Evaluation Capacity Development through Cluster
Evaluation. Journal of Multi Disciplinary Evaluation, Claremont Graduate University, 11(24). ISSN 1556‐8180
Bourgeois, I. & Naré, C. (2015). The Usability of Evaluation Reports: A Precursor to Evaluation Use in Government Organizations. Journal of Multi Disciplinary Evaluation, Claremont Graduate University, 11(25). ISSN 1556‐8180.
Dewanti. (2007). The Impact of Travel Pattern on Rural Transport Development. Journal Forum Teknik Sipil, XVII/3. Yogyakarta. UGM.
Fatem, A. (2011). Policies in Village Development: Learning from Community Empowerment and Participation in Jayapura. International Journal of Administrative Science & Organization, 18(2), ISSN 0854 – 3844.
Feeny, S. & Clarke, M. (2009). The Millennium Development Goals in the Asia-Pacific: An Introduction. Palgrave-MacMillan: London.
Jornal of Social and Development Sciences (JSDS) Vol. 7, No. 2, June 2016 (ISSN 2221-1152)
43
Government of India Planning Commission. Ministry of Rural Development. (2006). Working Group on Rural Roads in the 11th Five Year Plan
Harnar, M. A. (2014). Developing Criteria to Identify Transformative Participatory Evaluators. Journal of Multidisciplinary Evaluation. Claremont Graduate University, 10(22). ISSN 1556‐8180
Leviton, L. C. (2003). Evaluation Use: Advances, Challenges and Applications. American Journal of Evaluation, 24(4), 525-535.
Robinson, R. & Thagesen, B. (2014). Ed. Road engineering for development. London: Spon Press The Law on Special Autonomy for Papua, No. 21 of 2001, Supplement to the State Gazette 2001 No. 135. The Law on National Development Planning System, No. 25 of 2004, Supplement to the State Gazette of 2004
No. 104. The Law On Government Regional, No. 32 of 2004, Supplement to State Gazette 2004 No. 125.
Jornal of Social and Development Sciences (JSDS) Vol. 7, No. 2, June 2016 (ISSN 2221-1152)
44
Democratic System Strengthening Through Concurrent Election Implementation To Improve Political
Stability and National Development
Muhammad Baharuddin Zubakhrum Tjenreng Government Science, Padjadjaran University, Bandung, Indonesia
[email protected] Abstract: Indonesian recently held a regional head concurrent elections in the first phase on December 9, 2015. Concurrent elections has been a historic moment for Indonesia to elect regional heads organized and structured massively. Concurrent election significance for Indonesian politics, especially at the local level, not only to read limited local democratic party, but rather an instrument for strengthening the democratic process. This research seeks to examine and analyze the democracy strengthening through concurrent election implementation in order to improve political stability of national development. In carrying out this study, researchers using qualitative methods. Whereabout the main data from this study is the researchers observation result on the concurrent election day, which is supported by several secondary data from the media. Featured models concurrent election (local concurrent election) is believed to be the best solution to counter the problems remaining in the elections execution, especially in two important reasons: First, the elections implementation effectiveness in order to realize the elections are more qualified and dignified from both the process and elections outcome aspects; second, the elections efficiency especially from the budget efficiency aspect which must be issued by the state to finance the electoral process. Keywords: Concurrent elections, the democracy strengthening, political stability, national development
1. Introduction Political changes in Indonesia after the end of the New Order for 32 years (1967-1998) among others characterized by a constitutional reformation that managed the Indonesia constitutional system. Two important political instrument that became policy, namely democratic elections and a regional autonomy policy or decentralization, whereabout one of the fundamental steps in the decentralization policy is a local elections implementation to elect regional leader. The Indonesian success from held a national election (since 1999) and the elections (since 2005) by Henk Schulte Nordholt referred as the consolidation of electoral democracy, due to an extraordinary ongoing elections in a regency / city, province and national levels (Nordholt, and Hoogenboom, 2006: 1). The elections as such is a political process that is not only a politics mechanism to fill the democratic occupation, but also the regional autonomy implementation or political decentralization. To ensure the local elections conducted democratically as mandated by Article 18 paragraph (4) Constitution NKRI, 1945, popular sovereignty and democracy must be respected as a main elections implementation. But the Indonesian politics realities and dynamics is full of challenges in form of various efforts to suppress the people's sovereignty and undermine the democracy basic principles. Related to the local elections, The Representatives Council of the Republic Indonesia (DPR RI) in the period from 2014 to 2019 for various reasons have been enacted Law No. 22 Year 2014 regarding the Governors election, regents and mayors that regulate local elections mechanism indirectly through The Representatives Council (DPRD). The law has been get a broad resistance from the people, and the decision making process judged not reflect the democracy principles. Considering the crisis of the political and legal and widespread rejection among the public after the enactment of Law No. 22/2014, the President Susilo Bambang Yudhoyono (SBY) in his late period signed Government Regulation of Law (Perppu) No. 1 of 2014 about the governors, regents and mayors election, which essentially restores the people's sovereignty in direct local elections and not by parliament. In his speech, the President stated: "I respect the parliament decision about the elections law, but let me seek to democracy establishment of the people, by the people, for the people. Direct election is the reforms struggle
Jornal of Social and Development Sciences (JSDS) Vol. 7, No. 2, June 2016 (ISSN 2221-1152)
45
result. I became president through direct elections by the people in 2004 and 2009 ".1 Compared to developed countries, Indonesia has recently implemented the democracy principles through elections, whether national or local level. The first local elections took place in 2005 after the introduction of Law No. 32 of 2004 about Regional Government. For a decade the election implementation has many success and failed stories enliven the democracy implementation. Elections have resulted a double face in democratic context. In one hand, the elections have answered the people's sovereignty fulfillment demands, but on the other hand, the elections are also have several problematic. There are some inherent disadvantages suspected in the election, namely (1) the expensive election cost considering that not only a burden Budget (APBD) but also a burden for candidates, (2) the intensity of horizontal elections conflicts is quite high even destructive to the family and kinship at the community level, (3) the election does not guarantee the qualified local leaders election. Implementation of the elections is a shift from selecting leaders from the model that are elitist to populist model. Elections which closely related to the regional autonomy implementation is a unique color in the democracy development in Indonesia and the people are expected to participate actively. The elections are expected to be a catalyst towards the democracy consolidation and the local politics empowerment. Unfortunately, this goal is still far from fire. The elections are not yet fully become a participatory democracy tool. The political elite shifted into patronage democracy by using religion, ethnicity, families, and groups issues as a hegemony instrument (Nordholt, and Klinken, 2009: 10). As a result, the election was not a the people party, but the elite and patrons party. The money politics also has become a phenomenon and reality of its own in the elections. Money politics become so ordinary and absolutely essential if the candidate wants to go forward in the election, which starts from the candidate to the party, the candidate to the people and candidates for election organizers. The money politics practice has paved the way for prospective regional leader who have big capital or candidates who receive financial support from major investors in the competition to win the election, while candidates who have a mediocre coffers likely lose the battle. The money politics practice will lead to the "political rent seeking" emergence, where regional leader who won in the elections have to return the money borrowed from investors, or should restore its own capital which has been disbursed during the election process. This rentier political circuit will eventually form a "corruption crimes network" in order to restore large private capital, sponsorship, or supporting political parties into the regional leader. Departing from the messy election since 2005, the idea emerged to carry out concurrent election in several stages. Two important reasons why the concurrent elections be the best solution to counter the election implementation problems, namely (1) the elections implementation effectiveness reason in order to realize the qualified and dignified elections both from the process and elections outcome aspects; (2) The efficiency elections reasons, particularly from the budget efficiency aspects which must be issued by the state to finance the electoral process (Pahlevi, 2014: 19-20). The concurrent elections first phase stand on legitimate legal basis, the regulation has 1/2015 and later enacted into Law No. 1 of 2015, and refined through the establishment of Law No. 8 of 2015.
2. Literature Review Theorythically, elections are the tools and the same time is the most important democratization instrument. However, democracy realization will be felt in real terms when the electoral process was held in order to determine a leader candidate which worthy of holding power. Without that step, then the truth of democracy as a tools of realizing the people sovereignty still would invite a problem on its own and then open up space for the lawsuit legitimacy emergence of the government in power. The belief in elections as an important instrument for the democratization acquire strong legitimacy from Samuel P. Huntington in his book, The Third Wave of Democratization in the Late Twentieth Century (1993). Huntington defines democracy by referring to the opinion of Schumpeter. In the book Capitalism, Socialism, and Democracy, Schumpeter defines a procedural democracy with elections as the democracy essence. But Huntington added that the democratic system is not enough only with elections. Elections which free, fair,
1 Source: http://www.konfrontasi.com/content/nasional/untuk%20anulir%20pilkada%20tak%20langsung%20sby%20keluarkan%20perppu [Accessed: January, 15, 2016]

Jornal of Social and Development Sciences (JSDS) Vol. 7, No. 2, June 2016 (ISSN 2221-1152)
46
and competitive is possible only when there is a freedom of speech, assembly and press, and if candidates and opposition parties can criticize the authorities without fears of retaliation (Huntington in Azhari, 2004: 180). Study about democracy and electoral system covers a very broad spectrum, therefore it is necessary done for firmly classification issues that this study has a theoretical foundation that can be accounted for. The author classifying the issues referred in three theoretical grounds categories, namely (1) democracy in general; (2) the correlation of democracy and elections; (3) Concurrent election / local election. Democracy In general: Etymologically, democracy consists of two Greek words, namely "demos" means people or residents somewhere, and "cratein" or "cratos" which means power or sovereignty. So etymologically democracy is the country state where the government system is sovereignty vested in the people, the supreme power is in the people joint decision, the people in power, the people's government and mandate by the people. Terminologicaly, democracy meaning as revealed by a number of experts, among others: Schumpeter (2012: 239), democracy is an institutional planning to achieve political decisions in which individuals acquire the power to decide how the competitive struggle on the people's voice. Hook (1975: 685), democracy is a government form where the government important decisions directly or indirectly based on the freely agreement majority given from adult. Schmitter and Karl (Cited by Ubaedillah & Rozak, 2006: 132) democracy is a government system where the government held responsible for their actions in the public by citizens, which act indirectly through competition and cooperation with their chosen representatives. Mayo (2005: 12) democracy as a political system which showed that public policy is determined on a majority basis by the representatives who monitored effectively by the people in periodic elections based on the equality political principle and held in a secured political freedom atmosphere. Gaffar (2004: 7-9) interpret democracy in two forms, namely normative and empirical meaning. Normative democracy is an ideal democracy which be done by a state. While empirical democracy is a democracy manifestation which has existed in the practical politics world. Empirical democracy considered acceptable by the society as perceived in accordance with the norms that exist in society. There are still a lot of experts who define democracy with individual perspective. Call it like the ancient Greek philosophers (Plato, Aristotle, Socrates, Solon) who introduced the democracy doctrine; thinkers of the Renaissance time up to Abraham Lincoln (former President of the United States, fighters for democracy by enacting legislation against slavery) popularizing democracy as government of the people, by the people and for the people. Democracy is then considered as idealism that must be adopted by a country, so that most countries in the world calling itself a democracy country, even countries that considered not obtain democracy principles. The democracy long journey has also put forth a school or flow democracy, which can be classified into the classical democracy, civic virtue, social contract, and trias politica school (Suhelmi, 2001: 10-20). The classical democracy school emerged in the 5th century BC in Greece. That time the democracy implementation is done directly, people gather at a certain place in order to discuss various issues together. Adherents of this flow is Plato, Aristoteles, Polybus and Thomas Aquinas. In essence, the classical democracy basic principles is the resident should enjoy political equality so that they are free to organize or lead and led in turn. The civic virtue school with the central figure, Pericles (statesman of Athens) develop the democracy principles, namely the citizens equality, independence, respect for the law and justice, and virtue together. The shared virtue principle requires every citizen to devote themselves entirely to the state, placing the republic interests and common interest above personal interest and family. The specifics from this school is the direct democracy implementation, which then is very possible applied because the city-state population is still limited, small area, and simple social structure. The social contract school evolved and influenced by the ideas of the Enlightenment marked by rationalism, realism and humanism by placing the human being as the world movement center. Adherents of this flow is Hobbes, Locke, Rousseau, in the political analysis start from the human nature concept, then the nature state concept, natural rights and natural law. To avoid intolerance conditions and instability, then the community held a social contract, which formed by free will of all to establish justice and the highest morality fulfillment. Trias politica school with the central figure, Louis Montesquieu want for a power separation so that power is not concentrated in the hands of a king or a single ruler. Montesquieu divides state power into three categories, namely the legislative power to establish laws, the executive power to execute the laws, and the judiciary power to oversee the laws implementation. The power separation intended to maintain political freedom and prevent the domination of one power against the other. In the 20th century, democracy has been
Jornal of Social and Development Sciences (JSDS) Vol. 7, No. 2, June 2016 (ISSN 2221-1152)
47
used in the political system, which according to Huntington (1997: 5), the general election is an entry point democratization which allows candidates compete freely for votes and all of the adult population is eligible to vote. Thus democracy contains two dimensions namely competition and participation dimensions. In addition to these two dimensions, Sorensen (2003: 15) added political and civil freedoms dimension. Competition means that there is equal opportunity for individuals or groups to compete in occupy position or gain power access through a regular process and without violence. Participation is intended as the involvement of many individuals or groups in the leaders election and policy-making, which is done regularly and without getting rid of the main social groups. Social and civil freedom is a guarantee against the competition and participation, which include freedom of expression, press, and form and join organizations. From a number of expert opinions about democracy, appears that that democracy so far seen as a society and state system and government that places emphasis on the power presence in the hands of people, both in the state or government administration. Agrees with Abraham Lincoln views, in the end the government power in the people hands contains three terms, namely the people government, government by the people, and goverment for the people. More details Dahl (1999: 20-25) in his book, On Democracy, explained the country’s advantages implement the democracy principles to ensure people's lives quality. According to him, there are at least ten democracy benefits: prevent appearance of cruel and cunning autocrat; ensure the rights enforcement of every citizen; guarantees of wider personal liberty; help people to protect their basic needs; guarantees every citizen freedom to determine their own destiny; provides an opportunity to carry out moral responsibility; guarantees citizens develop their potential; upholds every citizen political equality; prevent a war between countries; and provide prosperity guarantee for people. Democracy Correlation and General Election: Huntington's Opinion in his thesis "third wave of democratization" that declared the elections as a democratization entry point was the most referenced view in assessing the correlation between democracy and elections. Election is a mechanism that allows the power rotation based on the public option, the peacefully power struggle institutionalization, and ultimately enable the people to perform control over public policy. A democratic political system allows the citizens constitutional rights protected and guaranteed by the state, public policy based on the people interests, and the power does not go beyond its authority. Furthermore Huntington asserts, the elections which meant not only formal procedural, but as an instrument embed the freedom principles to compete and participate to elect and be elected. In Huntington's perspective, the election is not just allow democracy to be operational in the roots namely allows people to choose according their political preferences, but also the the state governance passage legitimatively, although theoretically contribution in upholding democratic elections is still limited in the procedural area. One of the procedural democracy-minimalism fulfillment conditions is the political positions occupied by elections, the free and fair elections presence, as well as peacefully power rotation through fair freedom and public contestation, every individual substantially engagement in the power enforcement and adequate guarantee for the social and economic people rights. This is reciprocal with what Held (1987: 10) conceived as democracy autonomy. In democratic politics, the free and fair elections presence is a necessity. In fact, any country often make elections as a claims of democratic political system that he built. In developing countries the elections often can not be used as a accurate parameter in measuring or not democracy a politics system, as in the praxis election is not obtain using the democracy principle. In this context we need to explore Haynes (2000: 25-30) views distinguishes democracy in 3 levels, namely formal democracy, facade democracy, and substantive democracy. According Haynes, in formal democracy elections which obtain regularly, free and fair, but the election results have no impact in improving the society welfare characterized by economic and political stability. Surface democracy is democracy as seen from the outside is a democracy, but in fact did not have the democracy substance. This model of democracy may be more appropriate if analogycally with democracy situation and state in the new order era. While substantive democracy is a democracy that provides more space for the community, for example, an opened space for people to gain accurate information access in understanding important decisions by the authorities. The dynamic flexibility is not only at the political democracy level, but social and economic democracy. This substantive democracy model is a concept that ensures the society economic and social improvement realization. If substantive democracy can be realized, it can be said as a quality democracy because it is able to touch people's basic needs.
Jornal of Social and Development Sciences (JSDS) Vol. 7, No. 2, June 2016 (ISSN 2221-1152)
48
Elections determination as a democratic system is an important institutional decisions for countries to enforce civility and quality political system. Because the electoral system will produce a politics logic, obtain bureaucracy, to the civil society growth and development in the system. It became clear that the elections are an important democracy instrument that will determine the quality degree which obtain and determined by the state representatives (legislative and executive). Quality elections will produce a substantive democratic mechanism and quality leaders as well, which in turn will produce a quality policy product. Instead, the elections which were rigged, unfair, dishonest, only produce mild-transactional leaders who make the elections as a tools to retain and accumulate corrupt capital and power. Elections / Concurrent Election: Concurrent election simply can be defined as an electoral system that establishes some election at one time simultaneously (Geys, 2006: 652). The types of these elections include executive and legislative elections at various levels, which stretches from the national, regional and local elections. In the European Union countries, the concurrent elections even included election for supra-national level, namely European parliamentary elections simultaneously with the national elections, regional or local. With variety of factors affecting the concurrent elections operation, then occur several variants partly already implemented and some are still hypothetical. Some evidence suggests that the concurrent electoral system use has a major influence on voting behavior along with the election output. Related to voters behavior, many political scientists concerned with the simultaneous elections effect on voter participation. The concurrent election system application expected to increase the voter level at the ballot box. This expectation is based on two main arguments: (1) increasing the competitions number due to merge with several concurrent elections will increase the media notification and give impact on increasing voters awareness and knowledge about the elections; (2) because the "cost" which borne by the voters to go to the ballot box is fixed, regardless numbers of elections held. On the other side of the voters knowledge level, Andersen found that concurrent elections also have a negative influence on the voters knowledge to the candidates they would choose. The individual ability limitations to process large amounts information makes voters not being able to find or understand any information necessary to determine a good choice on any kind of election. As a result, voters tend to make a priority in determining the choice (Andersen, 2011). Based on longitudinal data for 20 years in the US, Andersen found that voters will tend to focus on the candidates at the national level compared to the candidates at the state level if the both election was conducted at the same time. Concurrent elections may also have side effects on other candidates in the legislative elections. Concurrent elections have a different effect on the legislator’s election at national and regional levels. Based on the results of elections in Brazil, Samuels found that while the popular governor will tend to raise the legislator election level from one party or the party's supporters, the effects were not found in the presidential election (Samuels, 2000). This is because the available resources (be mobilized) by a governor candidate will be able to help increase the affiliated candidates popularity. But not so with elections at the national level. A presidential candidate will not be able to mobilize enough resources to boost the legislative candidates election level that one party with at the national level. Variations concurrent elections can be distinguished by the implementation time and the government level that can affect voter perception of how important these elections. Theoretically, the elections held at the same time between many elections, such as the legislative elections with the presidential election, usually closely linked to the electoral cycle, the election utility mechanical effect, oppressive regimes, and also the existing models party. According to LIPI (2014), for Indonesian context by relying on empirical and hypothetical variants, there are at least six models of concurrent elections. First, concurrent elections once every five years for all public positions at the national level to district / city. This election includes the legislature election (DPR, DPD, Provincial DPRD and district / city), the presidential election, and the local election. It is often called the seven boxes election or bulk elections. Second, concurrent elections only to the entire legislative positions (central and local) and then followed by the concurrent elections for executive positions (central and local). In this clustered concurrent election method, elections for the DPR, DPD, Provincial DPRD and Regency / City implemented as long as coincide done in appropriate time, and then followed by the presidential election, the governor and regent / mayor a few months later. Third, concurrent elections with interval election by government level, which distinguished the time for national elections and local elections / local (concurrent election with mid-term election). In this model, the
Jornal of Social and Development Sciences (JSDS) Vol. 7, No. 2, June 2016 (ISSN 2221-1152)
49
presidential and legislative elections for the DPR and DPD conducted at the same time. Then in the second year held the concurrent local elections to choose provincial and district / city parliament as well as the governors election and regents / mayors by grouping certain region or island areas. With this model, each year each party will always work to gain the voters support, and government and political parties can be evaluated on an annual basis by the voters. Fourth, concurrent national elections, followed by the concurrent election in each province based on the time agreement or local election cycle in every province. With this model, then the presidential elections are accompanied with legislative elections for the DPR and DPD. Then after that depends on the cycle or local election schedule agreed jointly held local concurrent elections to choose governors, regents / mayors and provincial and district / city legislators in a province, and then followed by the same local concurrent elections in other provinces so that it could be a year there are several local elections in some provinces. Fifth, concurrent elections to elect members of DPR, DPD and DPRD as well as the president and vice president and then followed after a certain interval coincide time as well as the provincial executive elections. In this election, local concurrent election level is just to elect governors, regents / mayors simultaneously in a province, and the schedule is dependent on the local elections cycle in each province that had been agreed. From the five models concurrent elections variants as a results of LIPI mentioned above, the concurrent elections which held closer to the fifth model variants, with coverage concurrent elections expanded namely the concurrent elections in 6 phases include a number of provinces and districts / cities. 3. Methodology This research was conducted using qualitative methods. The data sources in this research consisted of a main or primary and additional sources or secondary data. Primary data in this research were collected through observation based on the activities and phenomenon. While the secondary data in this study is all the information contained in the mass media, government official documents, as well as results of studies on the implementation concurrent elections 2015 in Indonesia. The data validity test in this study is done through triangulation namely data validity testing techniques performed by checking the obtained data correctness. Triangulation is done on data sources that researchers get from the field.
4. Analysis To get a strengthening democratic system idea at local level through local concurrent elections, it is necessary to understand the democracy implementation overview related elections at national level, with the assumption that occur corelative relationship between democracy implementation at the national and local level. Problematic Presidential Democracy System: Indonesia has determined a presidential democracy system as a political choice, especially after end of authoritarian New Order regime in 1998. The political choice was approved by the assembly on election results in 1999 and eventually institutionalized through the changes result constitution (amendments) four stages from 1999 to 2002. While in general the constitutional substance amendment outcome itself tend to be "patchy", but clearly the spirit behind is strengthening effort as well as "purifying" presidential democracy scheme. At least there are four substance changes that ensure amandement result constitutional aims to the presidential strengthening system. First, the president and vice president election is done directly by the people. Second, the president and vice president institutionalization tenure be steady, in this case for five years and two terms maximum. Thirdly, the locus diversion legislative function of emphasis as the President authority (with approval of Parliament) to the Representative Council authorities (despite still discussed jointly and approved by the President). Fourth, the position liquidation and assembly role as the highest state institution. The latter changes not only ensure a locus political sovereignty diversion which was originally in the Assembly hands became sovereignty vested in the people and carried out according to the constitution, but also Assembly authority liquidation in selecting the president and vice president as well as the state policy outlines establishment. According to Lijphart (1994) there are acctually only three main elements of the presidential system, namely (1) the president or government leader elected for fixed period ( fixed-term ); (2) The president is elected directly by the people or by the board of voters ( electoral collage ) as in the United States; and (3) the

Jornal of Social and Development Sciences (JSDS) Vol. 7, No. 2, June 2016 (ISSN 2221-1152)
50
president is the only one chief executive. The experts who study the politics comparative study is already aware of the problematic inherent in the presidential system as practiced in the United States and adopted in the countries of America Latin. Executives stability caused by the fixed presidential term, legitimacy and political president mandate elected directly by the people, and the powers separation which is relatively firmly between government power branches, especially the executive-legislative, are three among numbers of major advantages presidential system. In addition its advantages compared to the parliamentary system, the presidential system has three major disadvantage, namely the first , the possibility of paralysis or political deadlock due to executive-legislative conflict. That potential deadlock was even greater if a presidential system combined with multi-party system as feared by Mainwaring (1993). Second , systemic rigidity inherent in presidentialism as a result of fixed executive tenure so there is no opportunity to replace the president in the middle of period if the performance does not satisfy the public. Thirdly, "the winner takes all" principle that is inherent in the presidential system which uses majority voting two rounds system, thus giving an opportunity for the president to claim discretion choices on people behalf, rather than parliament dominated by partisan interests from political parties. Linz & Arturo (1994) even say that the powers separation between executive and legislature in a presidential system tends to cause polarization and political instability, so that considered not so fit in adoption by the new democracy countries. Apart from Linz theoretical position as an advocate and parliamentary system supporter, the experience of America Latin countries shows that the presidential system practice was varies likewise the supporting institutions, so it is not a homogeneous government system. The institutions variety and presidential system practices system among others determined by the presidentialism forma, whether "pure" as practiced in the United States, the power executive scope which owned by the president, party system and its fragmentation and party discipline in parliament. Therefore, the institutional design related the president powers and legislature institution, the party system, and the president's ability to implement agendas become important factors that determines the presidential democracy stability. The powers separation between executive and legislature, for example, on one hand seen as presidentialism excess than parliamentarism, but on the other hand also opens up opportunities “government split formation" ( divided government ), in which the president and parliament is dominated or controlled by different parties. The presidential system problematic generally occur when it is combined with a multi-party system, especially with party fragmentation level and ideological polarization which relatively high. At least three reasons why the multi-party presidential combination has problematic. First, presidential system with based multi-party tends to produce paralysis due to executive-legislative deadlock and impasse that led to the democracy instability. Second, the multiparty system generates ideological polarization than the two-party system, that often cause complications problems when combined with presidentialism. Third, the multi-party and presidential combination posing difficulties to build coalitions between parties in a presidential democracy, so implicated to a democratic stability destruction (Mainwaring, 1993).
Executive-Legislative relations and Government Effectiveness: Unlike the parliamentary system in which executive and legislative institutions is basically a single entity, even can be said one body, then in a presidential system, the executive and legislature are separated from each other. Generally, Institutions design and executive and legislature relations reality in the democratic system context characterized two main trends, namely a relations pattern which is dominance from one institution over another, both executive dominance over legislature or vice versa; and a relations pattern based on the power balance between executive and legislative. Extent to which relations tendency pattern between executive and legislature in reality of the presidential system, whether the first pattern, the second pattern, or fluctuate between the two patterns, not only determined by the institutions design which constructed and institutionalized, but also other variables are conditional democracies countries. The two experiences under President SBY leadership shows that a broad coalition which supporting goverment formed after the election not only does not guarantee the support parties stability to executive, but also can never guarantee the election results government effectively. About 70 percent of political party in the Representative Council join the government supporting political coalition. In reality, a large coalition government supporters even more a burden to the President SBY rather than a solution for government effectiveness. During the government first period of SBY (2004-2009) even formed the President-Parliament relationship patterns that tend to be conflictual. This was reflected in rise of the interpellation and inquiry
Jornal of Social and Development Sciences (JSDS) Vol. 7, No. 2, June 2016 (ISSN 2221-1152)
51
rights proposed use submitted to the Parliament related SBY policies. Ironically, most of the interpellation right proposed and inquiry right have actually contributed filed by parliament which incorporated goverment coalition. Meanwhile during the second period of SBY goverment (2009-2014), when the government supporting political coalition covered more than 75 percent of the representatives council power, the proposed use of interpellation and inquiry rights intensity by the Representatives Council was reduced, but it does not go increase the government effectiveness of election results 2009. During two periods of President SBY goverment even tend to be imprisoned by the grand coalition formation which their built. In practicing in Indonesia, a large coalition support not fully guarantee the government effectiveness. Many factors which contribute to determine such as Indonesian presidential institution designs that not fully separate the president agency and parliament (DPR), because in establishment the Law, for example, the president jointly participate agreed with the Parliament. Similarly, in the assignation of public officials, not entirely become the president authority because co-decided by Parliament through the consideration mechanism and its approval. Outside the President's leadership factor, the other factors which also determine is weakness of parties dicipline as a result of the coalition feature that is more based on short-term interests rather than ideology, vision, and long-term political platform, as well as the election factors which has not be designed to improve the goverment effectiveness. Election Practices in Indonesia: Indonesian contemporary problem is not only related to political preferences on the presidential system combined with a multiparty system, but also because of the unsincerity political elite in institutionalizing, hence appear "difference" between presidentialism obsession on one hand, and parliamentary practice which tends to be on the other. All this has implications for the presidential democracy practice which is popularly referred as "half-hearted", "parliamentary nuanced" presidential, or other names that describe institutionalization inconsistencies presidential scheme in the political life of Indonesia nation. Indifference and inconsistency in the presidential democracy system institutionalizing was not only recorded in legislation material or substance which often overlap with each other, but can also be seen from the election administration scheme, especially since 2004, namely when the amendment constitutional mandate related to direct presidential elections by the people began to be implemented. As known, the legislative elections held in 2004, 2009 and 2014 ahead of the presidential election (and vice president), whereas the aim of amendment constitution is presidential system strengthened. As a logical consequence choice of the presidential democracy system, the presidential elections organization should precede the legislative elections implementation. If it was not, the presidential elections implementation at least be carried simultaneous with the legislative elections implementation, especially legislative elections at the national level. The logical consequence of the legislative elections which precede the presidential elections is created political parties dependency towards the parliament election results in preparing the president and vice president nominatio. That addiction was even then institutionalized through the prerequisite mechanism presidential threshold candidacy. As mandated by the President Election Law 2004 and 2009, political parties and / or coalitions must obtain total votes or specific seats nationally in the Representatives Council as a condition submit a presidential and vice presidential candidates. The presidential threshold mechanism nomination requirements is not only be a "prison" for the political parties themselves, but also reflects a nuanced presidential parliamentary practice. In fact, according presidential system scheme, the president institution and the Representative Council are two separate institutions that have different political legitimacy bases, and not depend on each other, and so that president candidacy "dictated" or determined by the political formation of the national parliament legislative election results. In addition, the president (and vice president) generated by the election and the Representatives Council which produced by legislative election have different political mandate and can not be mixed with one another. Legislative election results became basis for the political parties to form a coalition, both in carried out-vice presidential candidates as well as in government election results for any future candidate pair that won the election . This election schemes is clearly an anomaly in an effort to strengthen presidentialism as a major obsession behind the constitutional amendment. The problem is, the elected president become so dependent on the political forces formation in the Parliament. As a consequence of the presidential system practice based multiparty, presidential elections with two rounds system on one hand produce a president which have
Jornal of Social and Development Sciences (JSDS) Vol. 7, No. 2, June 2016 (ISSN 2221-1152)
52
very strong political legitimacy, but on the other hand in dealing with parliament, the president is nothing more than " minorities president ", namely president with the support or base minimum politics in Parliament. However, the minimum political base reality of an elected president in presidential scheme based multiparty should not be interpreted as a necessity for the president to rely on the majority support of the Representatitve Council entirely. It is true, the government policy effectiveness is highly dependent on the parliament political support, but not entirely true that government can not work without political parties support in Parliament. However, the elected president has a legitimacy base and political support which much greater than the fragmented support owned by political parties in parliament. Therefore the problem goes back to the elected president, whether capable managing intelligently, capitalizing and utilizing legitimacy and political mandate of the people who have it or not. If not, then the elected president will imprisoned forever by diverse parties political interests in Parliament. Presidentialism completion requires the format representation system reconsideration, implementation scheme and electoral system and the party system. In the elections context, arrangement is not only related to changes urgency in the electoral system, particularly the legislative election system , but also a scheme arrangement implementation towards concurrent elections between legislative and presidential elections. The arrangement leads to two elections schemes, namely the national concurrent elections (to elect the President / Vice President, DPR and DPD) and local concurrent elections (to elect members of parliament and regional leaders, provincial and district / city) with a interlude 2,5 years preceded national elections. Through local concurrent separate national elections be expected not only to achieve efficiency goals of budget and time, but can also be realized several changes at once. First, increasing the government effectiveness because assumed concurrent generated by the presidential and legislative elections are more stable as a coattail effect result, namely the election of the presidential candidate from particular political party or certain political parties coalition will influence legislature members election of a political party or certain political parties coalition as well. Thus the executive-legislative conflict, instability, and even political deadlock as a complication scheme based multiparty presidential system such as anxiety of Juan Linz and Scott Mainwaring expected not become a reality. That is, concurrent elections held could potentially increase the political support by the Parliament of the elected President. Second, the political coalition formation that inevitably must be done before legislative elections expected to "forced" political parties to change political parties coalition from short term and tend to be opportunistic become coalition based opportunistic ideology, vision and political platform in common. The next effect is the discipline political parties establishment, so that the political parties orientation expected to be changed from authority hunting ( office-seeking ) to struggle for a policy ( policy-seeking ). Third, national elections separation and concurrent local elections is expected to have a positive impact on three things: (1) there is an interval for people to assess the national government concurrent election results performance; (2) A great opened opportunity for local issues lifting to national level which tended to "sink" by national issues; (3) the growing local political elite opportunities whose leadership managed to compete to be the political elite at national level. Fourth, indirectly expected the party system simplification occur towards a simple multiparty system (moderate). As a result the political party or coalition election which similiar at the presidential and parliament election, the political parties fragmentation in parliament reduced and eventually is expected to culminate in formating moderate multiparty system. Fifth, concurrent separate national elections distinct from local concurrent election is expected to reduce transactional politics potential as a result of political opportunism institutionalization as this lasts. Transactions on short-term interests basis could be reduced if the political coalition foundations based on a common vision and political platform. Sixth, concurrent nationwide elections separated from lokal concurrent elections expected to improve the people's choice quality because voters' attention should not be divided on too many choices at once in a very limited time in voting booth. Because the number of ballots relatively limited in each concurrent elections, national and local, so voters have a little more time to decide which option is mature before ballots or mark the selection. Democracy System Contribution Through Concurrent Election Awakening Central Synergy and Local Government: If the local concurrent elections held separated in an interval 30 months (two and a half years) of national concurrent elections, then national government synergy with regional administration in a framework of the Unitary State will be created. The synergy is happening at
Jornal of Social and Development Sciences (JSDS) Vol. 7, No. 2, June 2016 (ISSN 2221-1152)
53
two levels: the party's coalition partners at national level tend to be the same as the party's coalition partners at local level, and the vision, mission and programs at the regional level will tend to be the same or a translation of mission, vision and national development programs. The synergy can occur for several reasons. First, both national and local concurrent elections be carefully prepared about one to two years before the election. Each party will seek to explore and search for political parties into a coalition partner based on proximity ideologic and based on equality or closeness criteria for president and vice president candidate pairs. If the coalition at the national level is established, political agenda which become a national concurrent election campaign material will be the same , both for the presidential - vice president election and parliament members election. Second, national concurrent elections held earlier than the local concurrent elections so that what has been agreed at national level will be carried out in a local concurrent elections area at the time. National government synergies with regional governments would happen if every political party can carry out two main political parties functions in representative democracy. First, the parties prepare future leaders and offer prospective leaders to the people during election campaign. For this function, the political parties recruit citizens become a party members, cadres systematically to members, and nominating a candidate member of parliament, local parliament, president, vice president, regional leader and deputy regional head election. And a second function, prepare public policy draft and offer it to the people during election campaign. For this function, the parties must listen and formulate the constituents aspirations, and lays out the political parties ideology to be a public policy pattern and aim in various fields based on the constituents aspirations. Conversely, if the parties more pragmatic orientation either in form "finding and maintaining power" released from a function to prepare leader candidates and in rents politics form, therefore national concurrent elections separated from local concurrent elections will not be able to create government synergies.
The efficiency and effectiveness election realization: Concurrent national and local elections also will create efficiency and effectiveness on three things. First, the planning, implementation and process election stages control will be carried out efficiently not only because national elections are separated from local elections but also because of a national election implementation evaluation weakness can be used to improve local election implementation and vice versa. Second, the enforcement cost of an election, especially local organizing committee honorarium will be saved significantly. Savings can be made because of two things: (1) because the number of polling station officials, PPS and PPK across Indonesia reaching more than 4 million people; (2) as honorarium officers before national elections are separated from local elections paid for three elections (parliament members, regents / mayors, and governor election) and will be one election (concurrent elections) after the national elections is separated from the local elections. From many types of election costs, election workers salaries component absorb 65 percent of the election cost. That means the more election is held, the more budget spent to pay officers because officer salaries are calculated based on the organization activities elections number, not by workload of each election. That is, if two or three elections implementation unified, the officers fee keep paid for one election activities. Thus, if only the implementations of legislative, presidential, governors elections as well as regent or mayor elections, united into only two elections, there will be tremendous financial savings. Within the Commission calculated, the cost savings reached Rp 15 trillion in the next five fiscal years.2 This calculation makes sense because by uniting five to seven elections to just two elections,namely the national and local elections, the budget spent to pay election workers only twice activities. And the third efficiency can be done on the full personnel utilization for five years either member of the Commission, the provincial Election Commission and the Election district / city commision,or central secretariat-general and staff, provincial and district / city. Before the national elections is separated from the local elections, both members and general secretariat staff commision work effectively only three years of five-year tenure. With the national elections separation of local elections,so the secretariat general commision members and staff will work throughout the year.
The democratic society maturity realization: Implementation of only two elections (concurrent national and synchronously local elections) will ensure at least two times access for people to declare its sovereignty.
2 Estimated cost savings presented by KPU member I Gusti Putu Artha in various occasions (source: from research observation).
Jornal of Social and Development Sciences (JSDS) Vol. 7, No. 2, June 2016 (ISSN 2221-1152)
54
Two things need to be explained in this statement. First, when concurrent local elections held after state officials working in concurrent national election results for at least two years, then voters have been able to assess state officials performance of national elections results. Whether public policy pattern and direction which promised on national elections have been implemented or not. Second, on local concurrent elections, voters will be voting not only based on the parties and candidates performance assessment in local elections but also based on their assessments results on state officials performance from national election of the same political party. And vice versa. In five years, a voter can effectively declare the assessment results of political party or candidate performance based on punishment and reward principle : choose another party or the candidate when the performance as promised ( reward ), and leave the party or the candidate if the performance is not accordance with promised ( punishment ). These consequences will be more pronounced when do a politic education series to raise voter awareness for declare sovereignty opportunities. Voting behavior expected to be more rational at least for three reasons: (1) the candidate pair and party that should be considered and have to be separated at national and local level. Thus voters can make smarter choices by comparing a number of candidates pairs and parties with a candidates list at the same level, both at national and local elections. (2) The public policy issue which offered also separates national and local issues. Thus not only issue which considered by voter does not mix but also voters can compare public policy issues both at the same level of national and local elections. (3) Voters not only have at least two opportunities to assert sovereignty but can also demand accountability of the party effectively. 5. Conclusion The elections since it was first held in 2005 from a schumpeterian procedures democratic style standpoint, evidently has succeeded in achieving basic essentially, the first, namely produce local leaders through democratic election mechanism. Second, the election is a continuation from previous elections practice, but at the same time has laid a new basis for the local political elite exchange mechanism in a regular basis. The elections become a new tradition, because there has been a change in the indirect election method by Parliament towards direct elections by all citizens in an area. This change has a serious impact on various local politics aspects and also can be read as a political investment which very important in terms of strengthening democratic system. This last point is closely related to institutionalization process of political (democracy) within the meaning Huntingtonian assumed as the backbone of establishment stability and sustainable development. Third , the elections have laid a new foundation for ongoing political citizens education process more broadly, especially the political education arena regarding "contestation" and normalcy "lost" and "win" in a democratic process that is fair and just. The success elections implementation by Election Commission which relatively independent and neutral from state and political forces, with a few exceptions, has broken the strereo-typing understanding on a non-state incompetence strength in politics manage. Nevertheless, as expressed by a variety of cases including that befell the Commission, struggle to uphold the public trust still requires climbing and winding journey. Systematic efforts to deny discrediting and non-state power, especially in political morality terms still occur today. Direct election significance for Indonesia politics, especially at local level and not just be read merely as a local democratic party, but rather an instrument for strengthening the democratic process. As an instrument and strengthening democracy process , the elections on one hand is a national elections continuation, but on the other hand is a preparation for the next phase of local political developments, namely effective governance creation after the new regional leaders election. Elections as a strengthening democracy fundamental part can be defined as a dual process that occur in country and society side. In countries terms, the democracy strengthening is development of three ways, namely (1) the mechanism institutionalization ( institutional design ) the trust creation on all political actors in the region include civil society, political society (political parties), including state apparatuses (the bureaucracy, the state security apparatus); (2) Strengthening administrative capacity-local government technocratic accompanied the institutionalization that has been created; and (3) the elections have forced a softening coercion character (which is expressed through an emphasis on the regulation and control function) state at local level toward a softer character (through a new emphasis on distributive function and public services). In society terms, democracy strengthening refers to the community penetration institutionalization and strengthening into the realm of formal politics and activities at local level. This is very fundamental in changing politics at local level. The reason is obvious, the citizens institutionalization

Jornal of Social and Development Sciences (JSDS) Vol. 7, No. 2, June 2016 (ISSN 2221-1152)
55
penetrative capacity process to the political decision-making territory takes place at a locus which for so long was very chewy and immune to penetration. Elections have become a new instrument in public facilitate to engage in permanent negotiations on how and with what resources local politics should be regulated and where local politics should be taken. Furthermore, local concurrent elections which began its first phase in December 2015 is a new policy choice that believe would further strengthen the Indonesian democratic system, and in turn will create political stability and ensure the national development sustainability. Selection of models concurrent election ( local concurrent elections ) is believed to be the best solution to acknowledge the problems that are still left in the election's implementation so far, particularly on two important reasons: (1) the elections implementation effectiveness in order to realize the more qualified and dignified elections in both process and elections outcome aspects; and (2) the elections efficiency, especially the budget efficiency aspects which must be issued by the state to finance electoral process. References Andersen, D. J. (2011). Pushing the Limits of Democracy: Concurrent Elections and Cognitive Limitations of
Voters. New Jersey: The State University of New Jersey. Azhari, A. F. (2004). Reformasi Pemilu dan Agenda Konsolidasi Demokrasi, Perspektif
Ketatanegaraan. Jurisprudence, 1(2). Dahl, R. A. (1999). On Democracy. Yale: University Press. Gaffar, A. (2004). Politik Indonesia: Transisi menuju Demokrasi. Yogyakarta: Pustaka Pelajar. Geys, B. (2006). Explaining Voter Turnout: A Review of Aggregate-Level Research. Electoral Studies 25.
Berlin: Elsevier. Hayness, J. (2000). Demokrasi dan Masyarakat Sipil di Dunia Ketiga. Jakarta: Obor. Held, D. (1987). Models of Democracy. Cambridge: Polity Press. Hook, S. (1975). The Encyclopedia Americana. New York: Americana Coorporation. Huntington, S. P. (1997). Gelombang Demokratisasi Ketiga. Jakarta: Pustaka Utama Grafiti. Lijphart, A. (1994). Presidentialism and Majoritarian Democracy: Theoretical Observations, in Juan J. Linz and
Arturo Valenzuela, (eds.), The Failure of Presidential Democracy. Baltimore and London: The Johns Hopkins University Press.
Linz, J. J. & Arturo, V. (1994). The Failure of Presidential Democracy. Baltimore and London: The Johns Hopkins University Press.
LIPI. (2014). Position Paper, Pemilu Nasional Serentak 2019. Jakarta: LIPI. Mainwaring, S. (1993). Presidentialism, Multipartism and Democracy: The Difficult Combination. Comparative
Political Studies, 26(2). Mayo, H. B. (2005). Mewujudkan Demokrasi Bermakna: Masalah dan Pilihan Indonesia. Jakarta: Demos. Nordholt, H. S. & Ireen, H. (2006). Indonesian in Transition. Yogyakarta: Pustaka Pelajar. Nordholt, H. S. & Gerry, V. K. (2009). Politik Lokal di Indonesia. Jakarta: Yayasan Obor. Pahlevi, I. (2014). Pilkada Serentak dalam RUU Pilkada. Bulletin INFO Kemendagri Brief, VI(2)/II/
P3DI/Jan/2014. Samuels, D. (2000). Concurrent Elections, Discordant Result: Presidentialism, Federalism, and Governance in
Brazil. Comparative Political Studies, 33(1), 1-20. Schumpeter, J. A. (2012). Capitalism Socialism and Democracy. Yogyakarta: Pustaka Pelajar. Sorensen, G. (2003). Demokrasi dan Demokratisasi: Proses dan Prospek dalam Sebuah Dunia yang Sedang
Berubah. Yogyakarta: Pustaka Pelajar. Suhelmi, A. (2001). Pemikiran Politik Barat. Jakarta: Gramedia Pustaka Utama. Ubaedillah, A. & Rozak, A. (2006). Pendidikan Kewarganegaraan: Demokrasi, Hak Asasi Manusia dan
Masyarakat Madani. Jakarta: ICCE UIN Syarif Hidayatullah.
Jornal of Social and Development Sciences (JSDS) Vol. 7, No. 2, June 2016 (ISSN 2221-1152)
56
LEGISLATION Law No 22 of 2014 regarding the Election of Governors, Regents and Mayors Law No. 1 of 2015 on Perppu Determination No. 1 of 2014 On the Election of Governors, Regents and Mayors
Become Law Law No. 8 of 2015 on the Amendment of Act No. 1 of 2015 Concerning Determination No. 1 of 2014 Perppu
On the Election of the Governor, Regent, and Mayor of the city Become Law Law No 9 of 2015 on Local Government Constitutional Court Decision No.22-24 / PUU / VI / 2008, dated December 19, 2008. Supriyanto, D., Source: http://www.rumahpemilu.org/in/read/4679/treshold-
dalam%20discourse%20elections [Accessed: January, 15, 2016]. http://www.konfrontasi.com/content/nasional/untuk%20anulir%20pilkada%20tak%20langsung%20sby%
20keluarkan%20perppu [Accessed: January, 15, 2016]. http://www.kpu.go.id [Accessed: January, 15, 2016].
Jornal of Social and Development Sciences (JSDS) Vol. 7, No. 2, June 2016 (ISSN 2221-1152)
57
Study on Relationship between DAK Forestry Program and GHG Reduction Target in Indonesia
Joko Tri Haryanto
Center for Climate Change Financing and Multilateral Policies, Fiscal Policy Agency, Ministry of Finance, Indonesia
[email protected] Abstract: It has been agreed that forestry is a key sector in the effort to tackle global warming. The government has demonstrated actual commitment to reduce GHG emissions by 26% with their own budget and by 41% with international financing. This commitment is set forth in Presidential Decree No. 61 Year 2011. This regulation indicates that one of the largest emitters is the forestry sector. The government has already allocated Specific Allocation Fund (DAK) Forestry in the State Budget annually to support forest rehabilitation. Despite the relatively small amount, the fund allocation is increasing significantly each year. The question is how the allocation for DAK Forestry can be synchronized with the GHG emission reduction target set forth in Presidential Decree No. 61 of 2011. For that reason, this study has been conducted in order to analyze the conformity of DAK Forestry funding with the emission reduction targets set forth in Presidential Decree No. 61 of 2011. By using qualitative descriptive statistical approach, it is known that the use of DAK Forestry fund as from 2010 to 2014 has had a significant alignment in support of GHG emission reduction target set forth in Presidential Decree No. 61 of 2011. Keywords: DAK Forestry, forestry sector, GHG emission, Gov Regulation Number 61 Year 2011
1. Introduction
Wibowo, 2013, mentions that the forestry sector is still among the largest emitters in the increasing national emission of Green House Gasses (GHG) due to deforestation, forest degradation and forest fire. In the research conducted by Siswiyanti et al. (2015), deforestation and degradation are considered as the indicators of success and failure of forest management. For a long time, forestry has also become a significant object of international attention, especially when there is an increasing awareness of the importance of global environment quality. Another study conducted by Resosudarmo, 2005 indicate that even though it has become an object of global attention, political interest is unfortunately still used as the main consideration in making policies, in addition to the interest of global actors as well as global power discourses which often time lead to damage to natural resources and marginalization of people as well as weakening community cohesion. Today, most countries regard a 20 C temperature increase above preindustrial level as the maximum tolerable limit for global warming. An exceedance probability of below 20% for this limit implies an emission budget of less than 250 GtC from 2000 to 2049, of which more than one third has already been emitted. Extrapolating current global CO2 emission this budget will only last until 2024 (Rickels, 2010). In the short run period, green economy should be support achievement on the sustainable development through its indicator. Based on The Brudtland Commission Report of 1987, (World Commission on Environment and Development-WECD) brought the concept of sustainable development into politics. The follow up of the Brudtland Report, Agenda 21 introduced the concept of sustainable development indicators. According to Ajani (2013) a sustainable development indicator should provide condensed and neutral information about the state and development of an environmental or economic asset to the general public. Forest actually has highly significant impacts on climate condition (Astana et al., 2012). When the number of trees and plants decreases (due to deforestation), the amount of carbon dioxide absorbed in the atmosphere will also decrease. FAO (2005) as quoted in Astana et al. (2012) said that the rate of global forest loss is still very high, reaching 7.3 million ha per year in the period of 2000-2005. While the Forest Inventory and Mapping Center (2008) indicated that the rate of deforestation in Indonesia reached 1.87 million ha during the period of 1990-1996, and increased to 3.51 million ha during the period of 1996-2000 (Astana et al., 2012). On the other hand, in 2009, President Susilo Bambang Yoedoyono (SBY) conveyed his commitment to decrease the national and regional GHG emission by 26% with the country’s own budget (BAU) and by 41% with international financial aid. President SBY’s commitment has been set out in Presidential Regulation Number 61 of 2011 regarding National Action Plan for the Reduction of GHG Emission (RAN/RAD-GRK).
Jornal of Social and Development Sciences (JSDS) Vol. 7, No. 2, June 2016 (ISSN 2221-1152)
58
The aforementioned regulation basically contains the outline of measures for the reduction of GHG emission including measures to be taken in the forestry sector, as well as the funding mechanism (Wibowo, 2013). In order to support measurable, reportable and verifiable measures for the reduction of GHG emission, the government has subsequently developed a method for the calculation of emission which was issued officially by IPCC (International Panel on Climate Change). With regard to financing, Presidential Regulation Number 61 of 2011 mandates the allocation of fund in the State/Regional Budget for financing RAN/RAD GRK activities, in addition to other potential sources from the private sector with due observance of applicable laws and regulations. In relation to the aforementioned mandate, the role of the State/Regional Budget in financing sectoral activities, especially in the forestry sector, may be implemented by using the budgeting mechanism of Technical Ministries/Agencies on annual basis or the mechanism of budget transfer to regions, particularly the Specific Allocation Fund (DAK) for Forestry (Fitri et al., 2011). If the financing is implemented by using the budgeting mechanism of Technical Ministries/Agencies, it must certainly be harmonized with the Government Work Plan (RKP) which refers to the National Medium Term Development Plan (RPJMN) and National Long Term Development Plan (RPJPN). The vision and mission of the President-elect are certainly regarded as additional considerations. During the presidency of President Jokowi, for example, his vision and mission set forth in Nawacita have certainly been used as one of the references in the preparation of the 2016 Government Work Plan. On contrary, if the financing mechanism used is the regime of Transfer to Regions, it must certainly be synchronized with the provision of Law Number 33 of 2004 regarding Financial Balance Between the Central and Regional Governments as well as Government Regulation Number 55 Year 2005 regarding Balancing Funds. The problem is that both of the aforementioned financing mechanisms, either the budgeting of Ministries/Agencies or DAK Forestry, must be synchronized with the authorities set out in the government programs and policies. Accordingly, it is necessary to ensure synergy between the programs and the financing mechanism, in order to avoid financing overlap. Financing through Ministry/Agency should be used for financing the implementation of authorities which are at the level of Central Government, whereas financing with DAK Forestry should be used for financing the implementation of authorities that have been delegated to regions. Considering the significance of such matter, this study was conducted in order to find out the programs that have been mapped in Presidential Regulation Number 61 of 2011 and subsequently to compare them with activities that have been financed by DAK for Forestry from 2010 to 2014; which programs that are included in Presidential Regulation Number 61 of 2011 and have received fund allocation from DAK Forestry, as well as which programs that are beyond the reach of DAK Forestry. By mapping those programs, the objective of avoiding financing overlapping is expected to be reached. This study also involved an analysis of the potentials of DAK financing by considering the provisions set forth in Law Number 33 of 2004 concerning Financial Balance between the Central Government and Regional Government, as well as the implementing regulations thereof, such as Regulations of the Minister of Finance related to the allocation of DAK fund from 2010 to 2014. Analysis of the allocation of DAK for Forestry in this study was limited to analysis of programs included in the technical guidelines and implementing regulations set forth in Regulations of the Minister of Forestry. More in-depth analysis cannot be conducted due to the limited data obtained from the Ministry of Forestry and Environment as the party responsible for DAK Forestry.
2. Literature Review History of Forest Management in Indonesia: Riyanto (2006) said that environmental management policies have never been separated from political condition occurring in the society. It has also been case with forest management in Indonesia. Before independence, teakwood was exploited in Java for the construction of ships, barrels and chests, wooden parts of guns, carpentry and furniture. However, those forest products were only used for domestic needs of the colonial rulers and were not traded in international markets. While by using its power, VOC issued the first environmental policy for its colonial regions, namely prohibition to cut down trees without permit, in 1620 and followed by the imposition of taxes on wood and other forest products. Still according to Riyanto, 2006, during the transition to the application of governmental system known as Leaded Democracy, there were significant administrative changes in the forest management system. During the
Jornal of Social and Development Sciences (JSDS) Vol. 7, No. 2, June 2016 (ISSN 2221-1152)
59
emergency government administration of Djuanda Cabinet, Indonesia issued Law Number 58 of 1958 stipulating that forest management shall be administered by level I autonomous regional government, except in Eastern Indonesia where it was to be administered by level II autonomous regional government. Such management system ended in 1960 when Indonesia issued Law Number 5 of 1960 regarding Principle Provisions on Agrarian Affairs setting forth that the State shall have the authorities for the management of agrarian resources, including land, water, forests, mining materials and air. For such purpose, the government stipulated in 1961 that the authority to manage all forests in Indonesia was to be held centrally by State-owned Forestry Company, Perusahaan Kehutanan Negara (Perhutani), which supervised 13 working units, and placed Perhutani as the regulator. During this period, there was an apparent shift in the orientation of forest management towards the ongoing development activities. Perhutani as the central institution regulating the forestry sector, started its activities to exploit wood in regions in cooperation with foreign companies. During the New Order era, according to Kartodihardjo and Jhamtani (2006), forest management was aimed at three new points of orientation, namely: 1) economic policy for implementing national development; 2) involvement of military elements in the elites managing the forestry sector; and 3) reduction of the role of community organizations in forest management without civil supervision and intervention. With the orientation on national development and economic advancement, the government subsequently formulated Law Number 5 of 1967 regarding the Basic Principles of Forestry as the basic regulation on the harvesting of forest products. Legal framework was applied by issuing Government Regulations, such as GR No 21 of 1970 regarding the Issuance of Forest Concessions (HPH) and Forest Product Harvesting Concessions (HPHH) and GR Number 33 of 1970 regarding Forest Planning. During the period following the formulation of such legal framework on forest exploitation, there was massive deforestation which will be used here as the basic problem. Kartodihardjo and Jhamtani (2006) also said mentioned about forest management during the 1997 monetary crisis, which was marked by weakening political stability in Indonesia. Such condition led to significant political changes, especially with regard to the management of the forestry sector. As a political force, civil society was able to convey their aspirations regarding traditional community forests which were increasingly exploited due to the rationalization of the existing legal framework. Forest management by the government which was driven by economic targets resulted in the increasing rate of deforestation. Accordingly, the government issued GR Number 6 of 1999 in place of GR Number 21 of 1970 and Law Number 41 of 1999 regarding Basic Principles of Forestry for regulating forest management so as to be more accommodative for the general public. Problems in Forest Management in Indonesia: Indonesia is the third largest country with the largest tropical forests in the world and ranks the first in the Asia Pacific. Indonesia is one of the largest contributors of carbon for the world. Indonesian tropical rain forests occupy ± 1,148,400 square kilometers with extensive biological diversity. Unfortunately, Indonesia is also among the countries with the highest rates of deforestation and forest degradation in the world (Ekawati et al., 2013). Forest destruction in Indonesia does not occur only in production forests but also in protected and conservation forests (natural conservations, animal conservations, natural tourism parks, game hunting parks). The decreasing size of forest areas caused by the increasing needs the surrounding communities, the dependence of the surrounding communities on forests, illegal logging, lack of awareness regarding the functions and benefits of forests, as well as the conversion of forests into agricultural fields, mining areas, and plantations has led to the increasing size of critical lands within and outside forest areas. Currently, various efforts have been made to address the issue of critical lands with various programs and financing models by the central government, regional governments and donors. However, those efforts have not been effective due to imbalances in the implementation of critical land rehabilitation programs (Rickels, 2010). Critical lands are occurring in Indonesia with increasing rate each year. It is caused by the increasing rate of land conversion as well as the high level of illegal logging within and outside forest areas for the creation of new areas for settlement, plantation, and agricultural activities. According to data in 2013, critical lands in Indonesia reached 133 million hectares, comprising potential critical lands of 47.55%, slightly critical lands of 34,28%, critical lands of 14.62% highly critical lands of 3.55% (KLHK, 2013). The high occurrence rate of critical land greatly affects the increasing rate of deforestation and global climate change. As a country with
Jornal of Social and Development Sciences (JSDS) Vol. 7, No. 2, June 2016 (ISSN 2221-1152)
60
complex biological diversity, Indonesia has a strategic role in addressing such problems. Various efforts and policies related to the handling of critical lands have been made for a long period of time. However, the fact is that such efforts and policies have not been implemented optimally and thus far they are still partial in nature (Susiyanto, 2015). The government has set a target for emission reduction by 31.15 million tons of CO2 in the National Action Plan for Green House Gas Emission Reduction (RAN-GRK). However, in order to achieve such target, there have been many obstacles encountered in rehabilitating critical lands in Indonesia, such as: weak political support from regional governments, unclear working mechanism among government agencies overseeing the forestry sector, as well as tenure and funding problems. Sectoral policies on the handling of critical lands need to be changed in order to ensure coordinated and effective management of the efforts. Participation of all parties and all ministries/agencies is required for decreasing the rate of occurrence of critical lands and for restoring the function of the lands by way of land rehabilitation to ensure that the land can sustain its physical, chemical or biological functions. Therefore, the hydrological, hydroorological, agricultural, settlement as well as social and economic functions of the surrounding areas will not be compromised because the ecological balance can be maintained (Diniyati & Awang, 2010).
DAK Forestry for RAD GRK: Pursuant to Law Number 33 of 2004 regarding Financial Balance Between the Central Government and Regional Governments, it can be concluded that DAK Forestry is fund originating from the State Budget allocated for regions having forest areas for helping those areas in financing RAD GRK programs, especially in the forestry sector. This is because RAD GRK is part of the mandatory regional affairs for managing the environmental function and it is also a national priority. The aforementioned conclusion has actually been implied in the background section of Regulation of the Minister of Forestry No. P.47/Menhut-II/2012 regarding technical guidelines on the use of specific allocation fund (DAK) for forestry sector in the fiscal year of 2013. In the background section of the aforementioned regulation, the Minister of Forestry mentioned as follows: One of the efforts to address the problems of climate change and global warming is by planting more trees and plants. Therefore, in order to preserve the existing forests so as to be functioning well, it is necessary to conduct Forest and Land Rehabilitation (RHL) activities, in addition to preventing activities causing forest destruction. Currently there are 27.2 million hectares of critical lands that need to be rehabilitated immediately (Directorate General of BPDASPS, 2011). The Ministry of Forestry places RHL as one of the national priority policies. This policy is very relevant for addressing the problems encountered by regions (Provinces and Regencies/Cities) in relation to the increasingly degraded environment, including forest and land destruction, as well as decreasing quality of the environment that may lead to flood, landslide, high rate of abrasion, sea water intrusion as well as global warming. Based on Government Regulation Number 55 of 2005 regarding Balancing Funds, Forest and Land Rehabilitation as well as its supporting activities which constitute the authority of regional government, may be financed with funds from the Ministry of Forestry’s portion of the State Budget by using the Specific Allocation Fund (DAK) for the forestry sector. Considering the limited amount of DAK Forestry (and DAK Environment), the Government faces increasing demand for selecting the most efficient and effective forestry activities in order to achieve the priority targets in environmental management. The obligation to allocate DAK for the most efficient and effective activities is set forth in Government Regulation No. 21 of 2004 regarding Preparation of Work Plan and Budget of State Ministries/Agencies. This regulation requires Ministries/Government Agencies to prepare performance-based (expenditures) budget. DAK is one of the expenditures for which Ministries/Government Agencies are responsible. Article 7 of the aforementioned Government Regulation specifies that the preparation of performance-based budget is to be conducted by taking into account the relations between the financing and the expected outputs of the activities, including efficiency with regard to the achievement of the aforementioned results and outputs. The output is in the form of goods and services produced by activities implemented for supporting the effort for achieving the targets and objectives of the program and policies. Whereas the outcome is anything reflecting the functioning of output from activities in a program. The preparation of performance-based budget requires performance indicators, cost standard, and performance evaluation for every program and every type of activity. The level of activity planned and cost standard determined in the beginning of the annual cycle of budgeting serve as the basis for determining the budget for the relevant budget year and prognostication for the relevant programs (Setiono, 2013).
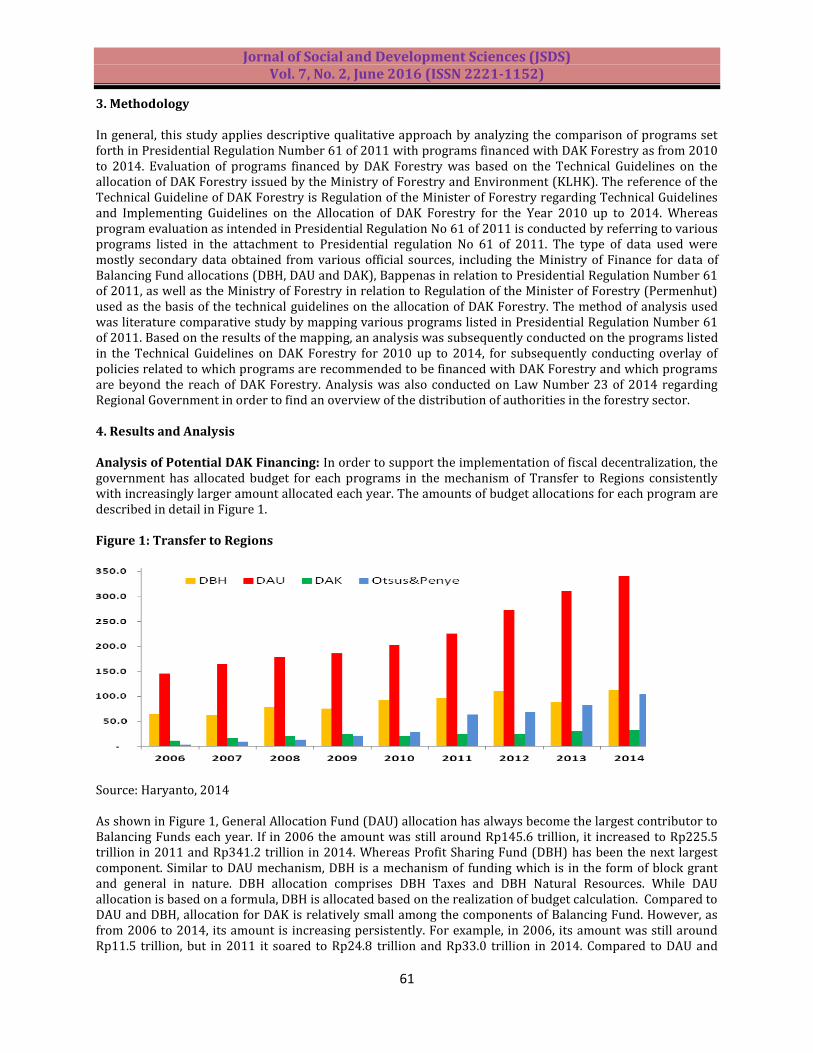
Jornal of Social and Development Sciences (JSDS) Vol. 7, No. 2, June 2016 (ISSN 2221-1152)
61
3. Methodology In general, this study applies descriptive qualitative approach by analyzing the comparison of programs set forth in Presidential Regulation Number 61 of 2011 with programs financed with DAK Forestry as from 2010 to 2014. Evaluation of programs financed by DAK Forestry was based on the Technical Guidelines on the allocation of DAK Forestry issued by the Ministry of Forestry and Environment (KLHK). The reference of the Technical Guideline of DAK Forestry is Regulation of the Minister of Forestry regarding Technical Guidelines and Implementing Guidelines on the Allocation of DAK Forestry for the Year 2010 up to 2014. Whereas program evaluation as intended in Presidential Regulation No 61 of 2011 is conducted by referring to various programs listed in the attachment to Presidential regulation No 61 of 2011. The type of data used were mostly secondary data obtained from various official sources, including the Ministry of Finance for data of Balancing Fund allocations (DBH, DAU and DAK), Bappenas in relation to Presidential Regulation Number 61 of 2011, as well as the Ministry of Forestry in relation to Regulation of the Minister of Forestry (Permenhut) used as the basis of the technical guidelines on the allocation of DAK Forestry. The method of analysis used was literature comparative study by mapping various programs listed in Presidential Regulation Number 61 of 2011. Based on the results of the mapping, an analysis was subsequently conducted on the programs listed in the Technical Guidelines on DAK Forestry for 2010 up to 2014, for subsequently conducting overlay of policies related to which programs are recommended to be financed with DAK Forestry and which programs are beyond the reach of DAK Forestry. Analysis was also conducted on Law Number 23 of 2014 regarding Regional Government in order to find an overview of the distribution of authorities in the forestry sector.
4. Results and Analysis Analysis of Potential DAK Financing: In order to support the implementation of fiscal decentralization, the government has allocated budget for each programs in the mechanism of Transfer to Regions consistently with increasingly larger amount allocated each year. The amounts of budget allocations for each program are described in detail in Figure 1. Figure 1: Transfer to Regions
Source: Haryanto, 2014 As shown in Figure 1, General Allocation Fund (DAU) allocation has always become the largest contributor to Balancing Funds each year. If in 2006 the amount was still around Rp145.6 trillion, it increased to Rp225.5 trillion in 2011 and Rp341.2 trillion in 2014. Whereas Profit Sharing Fund (DBH) has been the next largest component. Similar to DAU mechanism, DBH is a mechanism of funding which is in the form of block grant and general in nature. DBH allocation comprises DBH Taxes and DBH Natural Resources. While DAU allocation is based on a formula, DBH is allocated based on the realization of budget calculation. Compared to DAU and DBH, allocation for DAK is relatively small among the components of Balancing Fund. However, as from 2006 to 2014, its amount is increasing persistently. For example, in 2006, its amount was still around Rp11.5 trillion, but in 2011 it soared to Rp24.8 trillion and Rp33.0 trillion in 2014. Compared to DAU and
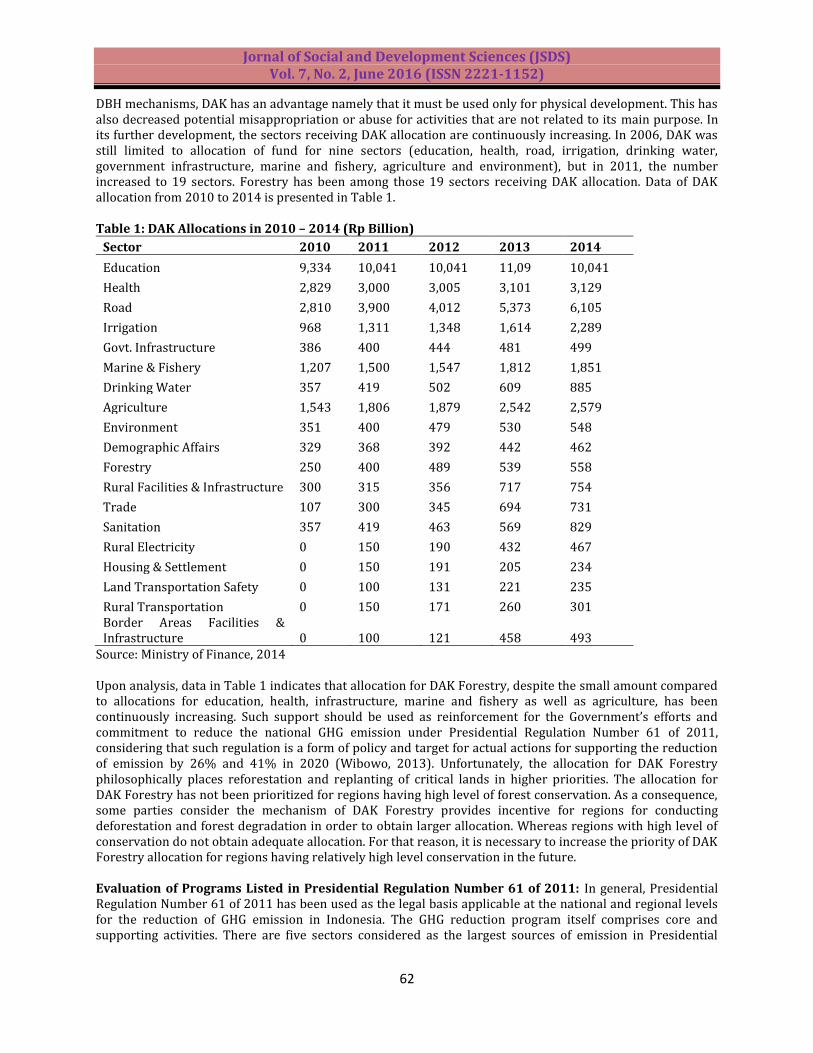
Jornal of Social and Development Sciences (JSDS) Vol. 7, No. 2, June 2016 (ISSN 2221-1152)
62
DBH mechanisms, DAK has an advantage namely that it must be used only for physical development. This has also decreased potential misappropriation or abuse for activities that are not related to its main purpose. In its further development, the sectors receiving DAK allocation are continuously increasing. In 2006, DAK was still limited to allocation of fund for nine sectors (education, health, road, irrigation, drinking water, government infrastructure, marine and fishery, agriculture and environment), but in 2011, the number increased to 19 sectors. Forestry has been among those 19 sectors receiving DAK allocation. Data of DAK allocation from 2010 to 2014 is presented in Table 1.
Table 1: DAK Allocations in 2010 – 2014 (Rp Billion)
Sector 2010 2011 2012 2013 2014
Education 9,334 10,041 10,041 11,09 10,041
Health 2,829 3,000 3,005 3,101 3,129
Road 2,810 3,900 4,012 5,373 6,105
Irrigation 968 1,311 1,348 1,614 2,289
Govt. Infrastructure 386 400 444 481 499
Marine & Fishery 1,207 1,500 1,547 1,812 1,851
Drinking Water 357 419 502 609 885
Agriculture 1,543 1,806 1,879 2,542 2,579
Environment 351 400 479 530 548
Demographic Affairs 329 368 392 442 462
Forestry 250 400 489 539 558
Rural Facilities & Infrastructure 300 315 356 717 754
Trade 107 300 345 694 731
Sanitation 357 419 463 569 829
Rural Electricity 0 150 190 432 467
Housing & Settlement 0 150 191 205 234
Land Transportation Safety 0 100 131 221 235
Rural Transportation 0 150 171 260 301 Border Areas Facilities & Infrastructure 0 100 121 458 493
Source: Ministry of Finance, 2014
Upon analysis, data in Table 1 indicates that allocation for DAK Forestry, despite the small amount compared to allocations for education, health, infrastructure, marine and fishery as well as agriculture, has been continuously increasing. Such support should be used as reinforcement for the Government’s efforts and commitment to reduce the national GHG emission under Presidential Regulation Number 61 of 2011, considering that such regulation is a form of policy and target for actual actions for supporting the reduction of emission by 26% and 41% in 2020 (Wibowo, 2013). Unfortunately, the allocation for DAK Forestry philosophically places reforestation and replanting of critical lands in higher priorities. The allocation for DAK Forestry has not been prioritized for regions having high level of forest conservation. As a consequence, some parties consider the mechanism of DAK Forestry provides incentive for regions for conducting deforestation and forest degradation in order to obtain larger allocation. Whereas regions with high level of conservation do not obtain adequate allocation. For that reason, it is necessary to increase the priority of DAK Forestry allocation for regions having relatively high level conservation in the future. Evaluation of Programs Listed in Presidential Regulation Number 61 of 2011: In general, Presidential Regulation Number 61 of 2011 has been used as the legal basis applicable at the national and regional levels for the reduction of GHG emission in Indonesia. The GHG reduction program itself comprises core and supporting activities. There are five sectors considered as the largest sources of emission in Presidential
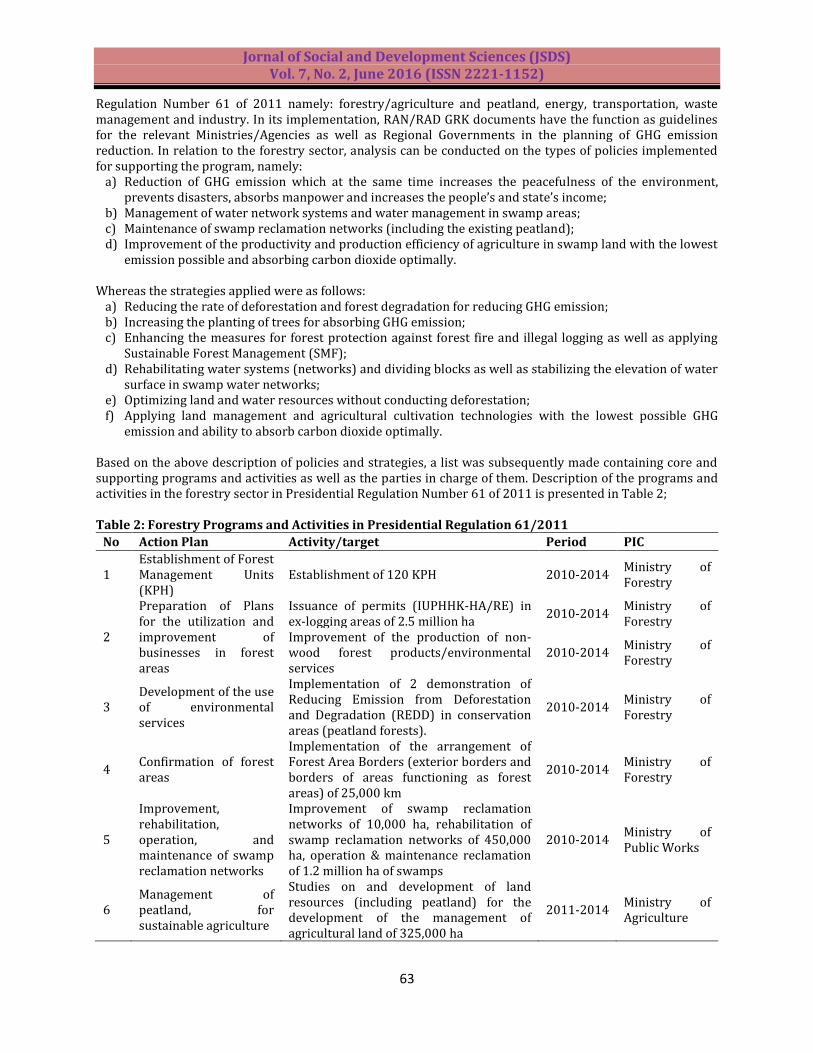
Jornal of Social and Development Sciences (JSDS) Vol. 7, No. 2, June 2016 (ISSN 2221-1152)
63
Regulation Number 61 of 2011 namely: forestry/agriculture and peatland, energy, transportation, waste management and industry. In its implementation, RAN/RAD GRK documents have the function as guidelines for the relevant Ministries/Agencies as well as Regional Governments in the planning of GHG emission reduction. In relation to the forestry sector, analysis can be conducted on the types of policies implemented for supporting the program, namely:
a) Reduction of GHG emission which at the same time increases the peacefulness of the environment, prevents disasters, absorbs manpower and increases the people’s and state’s income;
b) Management of water network systems and water management in swamp areas; c) Maintenance of swamp reclamation networks (including the existing peatland); d) Improvement of the productivity and production efficiency of agriculture in swamp land with the lowest
emission possible and absorbing carbon dioxide optimally. Whereas the strategies applied were as follows:
a) Reducing the rate of deforestation and forest degradation for reducing GHG emission; b) Increasing the planting of trees for absorbing GHG emission; c) Enhancing the measures for forest protection against forest fire and illegal logging as well as applying
Sustainable Forest Management (SMF); d) Rehabilitating water systems (networks) and dividing blocks as well as stabilizing the elevation of water
surface in swamp water networks; e) Optimizing land and water resources without conducting deforestation; f) Applying land management and agricultural cultivation technologies with the lowest possible GHG
emission and ability to absorb carbon dioxide optimally. Based on the above description of policies and strategies, a list was subsequently made containing core and supporting programs and activities as well as the parties in charge of them. Description of the programs and activities in the forestry sector in Presidential Regulation Number 61 of 2011 is presented in Table 2;
Table 2: Forestry Programs and Activities in Presidential Regulation 61/2011
No Action Plan Activity/target Period PIC
1 Establishment of Forest Management Units (KPH)
Establishment of 120 KPH 2010-2014 Ministry of Forestry
2
Preparation of Plans for the utilization and improvement of businesses in forest areas
Issuance of permits (IUPHHK-HA/RE) in ex-logging areas of 2.5 million ha
2010-2014 Ministry of Forestry
Improvement of the production of non-wood forest products/environmental services
2010-2014 Ministry of Forestry
3 Development of the use of environmental services
Implementation of 2 demonstration of Reducing Emission from Deforestation and Degradation (REDD) in conservation areas (peatland forests).
2010-2014 Ministry of Forestry
4 Confirmation of forest areas
Implementation of the arrangement of Forest Area Borders (exterior borders and borders of areas functioning as forest areas) of 25,000 km
2010-2014 Ministry of Forestry
5
Improvement, rehabilitation, operation, and maintenance of swamp reclamation networks
Improvement of swamp reclamation networks of 10,000 ha, rehabilitation of swamp reclamation networks of 450,000 ha, operation & maintenance reclamation of 1.2 million ha of swamps
2010-2014 Ministry of Public Works
6 Management of peatland, for sustainable agriculture
Studies on and development of land resources (including peatland) for the development of the management of agricultural land of 325,000 ha
2011-2014 Ministry of Agriculture
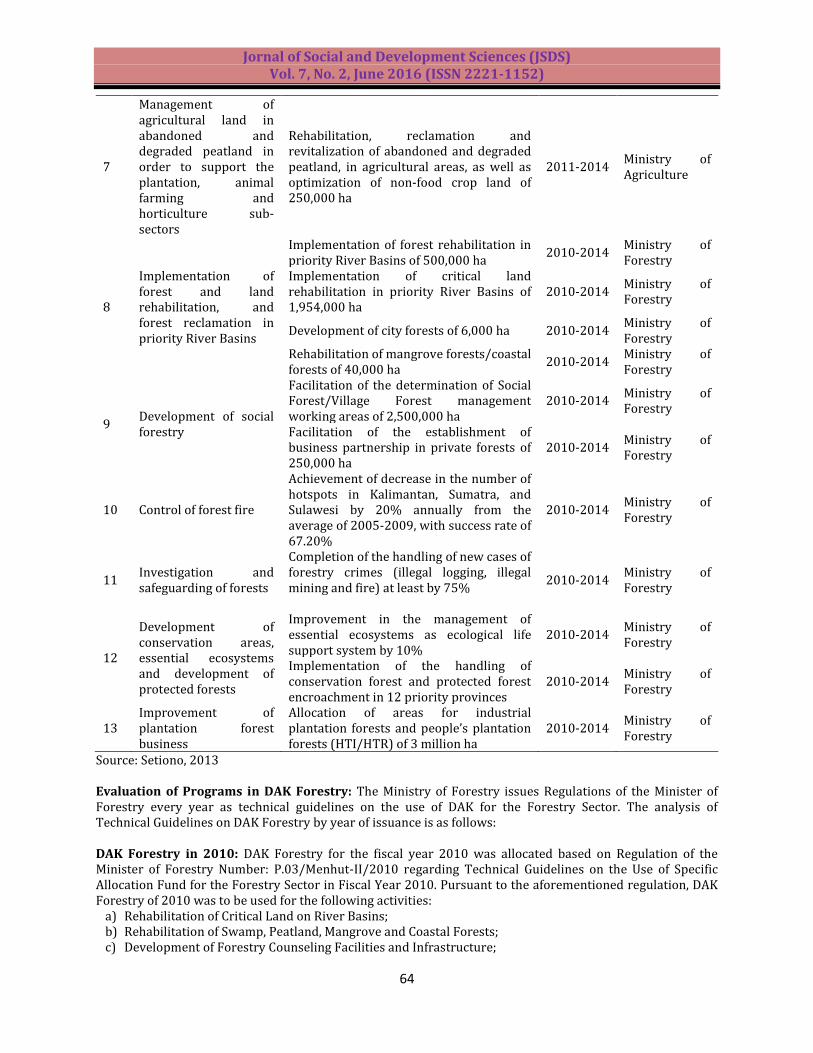
Jornal of Social and Development Sciences (JSDS) Vol. 7, No. 2, June 2016 (ISSN 2221-1152)
64
7
Management of agricultural land in abandoned and degraded peatland in order to support the plantation, animal farming and horticulture sub-sectors
Rehabilitation, reclamation and revitalization of abandoned and degraded peatland, in agricultural areas, as well as optimization of non-food crop land of 250,000 ha
2011-2014 Ministry of Agriculture
8
Implementation of forest and land rehabilitation, and forest reclamation in priority River Basins
Implementation of forest rehabilitation in priority River Basins of 500,000 ha
2010-2014 Ministry of Forestry
Implementation of critical land rehabilitation in priority River Basins of 1,954,000 ha
2010-2014 Ministry of Forestry
Development of city forests of 6,000 ha 2010-2014 Ministry of Forestry
Rehabilitation of mangrove forests/coastal forests of 40,000 ha
2010-2014 Ministry of Forestry
9 Development of social forestry
Facilitation of the determination of Social Forest/Village Forest management working areas of 2,500,000 ha
2010-2014 Ministry of Forestry
Facilitation of the establishment of business partnership in private forests of 250,000 ha
2010-2014 Ministry of Forestry
10 Control of forest fire
Achievement of decrease in the number of hotspots in Kalimantan, Sumatra, and Sulawesi by 20% annually from the average of 2005-2009, with success rate of 67.20%
2010-2014 Ministry of Forestry
11 Investigation and safeguarding of forests
Completion of the handling of new cases of forestry crimes (illegal logging, illegal mining and fire) at least by 75%
2010-2014 Ministry of Forestry
12
Development of conservation areas, essential ecosystems and development of protected forests
Improvement in the management of essential ecosystems as ecological life support system by 10%
2010-2014 Ministry of Forestry
Implementation of the handling of conservation forest and protected forest encroachment in 12 priority provinces
2010-2014 Ministry of Forestry
13 Improvement of plantation forest business
Allocation of areas for industrial plantation forests and people’s plantation forests (HTI/HTR) of 3 million ha
2010-2014 Ministry of Forestry
Source: Setiono, 2013 Evaluation of Programs in DAK Forestry: The Ministry of Forestry issues Regulations of the Minister of Forestry every year as technical guidelines on the use of DAK for the Forestry Sector. The analysis of Technical Guidelines on DAK Forestry by year of issuance is as follows: DAK Forestry in 2010: DAK Forestry for the fiscal year 2010 was allocated based on Regulation of the Minister of Forestry Number: P.03/Menhut-II/2010 regarding Technical Guidelines on the Use of Specific Allocation Fund for the Forestry Sector in Fiscal Year 2010. Pursuant to the aforementioned regulation, DAK Forestry of 2010 was to be used for the following activities:
a) Rehabilitation of Critical Land on River Basins; b) Rehabilitation of Swamp, Peatland, Mangrove and Coastal Forests; c) Development of Forestry Counseling Facilities and Infrastructure;
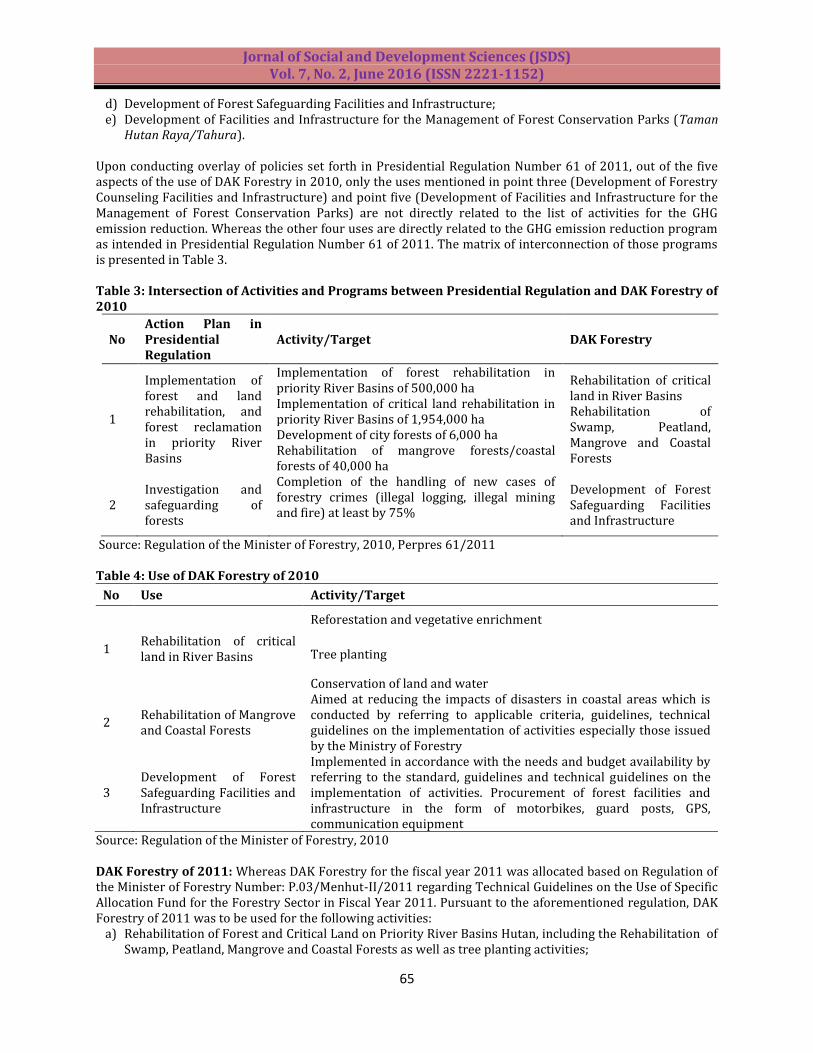
Jornal of Social and Development Sciences (JSDS) Vol. 7, No. 2, June 2016 (ISSN 2221-1152)
65
d) Development of Forest Safeguarding Facilities and Infrastructure; e) Development of Facilities and Infrastructure for the Management of Forest Conservation Parks (Taman
Hutan Raya/Tahura). Upon conducting overlay of policies set forth in Presidential Regulation Number 61 of 2011, out of the five aspects of the use of DAK Forestry in 2010, only the uses mentioned in point three (Development of Forestry Counseling Facilities and Infrastructure) and point five (Development of Facilities and Infrastructure for the Management of Forest Conservation Parks) are not directly related to the list of activities for the GHG emission reduction. Whereas the other four uses are directly related to the GHG emission reduction program as intended in Presidential Regulation Number 61 of 2011. The matrix of interconnection of those programs is presented in Table 3. Table 3: Intersection of Activities and Programs between Presidential Regulation and DAK Forestry of 2010
No Action Plan in Presidential Regulation
Activity/Target DAK Forestry
1
Implementation of forest and land rehabilitation, and forest reclamation in priority River Basins
Implementation of forest rehabilitation in priority River Basins of 500,000 ha
Rehabilitation of critical land in River Basins Rehabilitation of Swamp, Peatland, Mangrove and Coastal Forests
Implementation of critical land rehabilitation in priority River Basins of 1,954,000 ha Development of city forests of 6,000 ha Rehabilitation of mangrove forests/coastal forests of 40,000 ha
2 Investigation and safeguarding of forests
Completion of the handling of new cases of forestry crimes (illegal logging, illegal mining and fire) at least by 75%
Development of Forest Safeguarding Facilities and Infrastructure
Source: Regulation of the Minister of Forestry, 2010, Perpres 61/2011 Table 4: Use of DAK Forestry of 2010
No Use Activity/Target
1 Rehabilitation of critical land in River Basins
Reforestation and vegetative enrichment
Tree planting
Conservation of land and water
2 Rehabilitation of Mangrove and Coastal Forests
Aimed at reducing the impacts of disasters in coastal areas which is conducted by referring to applicable criteria, guidelines, technical guidelines on the implementation of activities especially those issued by the Ministry of Forestry
3 Development of Forest Safeguarding Facilities and Infrastructure
Implemented in accordance with the needs and budget availability by referring to the standard, guidelines and technical guidelines on the implementation of activities. Procurement of forest facilities and infrastructure in the form of motorbikes, guard posts, GPS, communication equipment
Source: Regulation of the Minister of Forestry, 2010 DAK Forestry of 2011: Whereas DAK Forestry for the fiscal year 2011 was allocated based on Regulation of the Minister of Forestry Number: P.03/Menhut-II/2011 regarding Technical Guidelines on the Use of Specific Allocation Fund for the Forestry Sector in Fiscal Year 2011. Pursuant to the aforementioned regulation, DAK Forestry of 2011 was to be used for the following activities:
a) Rehabilitation of Forest and Critical Land on Priority River Basins Hutan, including the Rehabilitation of Swamp, Peatland, Mangrove and Coastal Forests as well as tree planting activities;
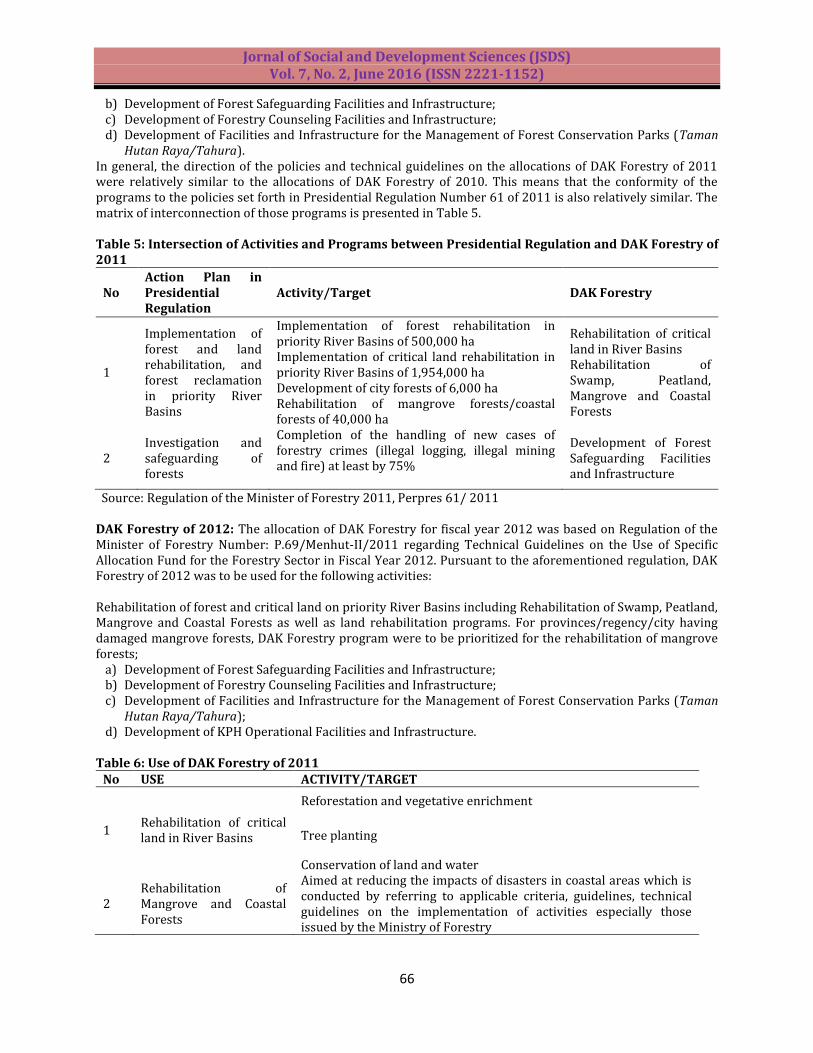
Jornal of Social and Development Sciences (JSDS) Vol. 7, No. 2, June 2016 (ISSN 2221-1152)
66
b) Development of Forest Safeguarding Facilities and Infrastructure; c) Development of Forestry Counseling Facilities and Infrastructure; d) Development of Facilities and Infrastructure for the Management of Forest Conservation Parks (Taman
Hutan Raya/Tahura). In general, the direction of the policies and technical guidelines on the allocations of DAK Forestry of 2011 were relatively similar to the allocations of DAK Forestry of 2010. This means that the conformity of the programs to the policies set forth in Presidential Regulation Number 61 of 2011 is also relatively similar. The matrix of interconnection of those programs is presented in Table 5.
Table 5: Intersection of Activities and Programs between Presidential Regulation and DAK Forestry of 2011
No Action Plan in Presidential Regulation
Activity/Target DAK Forestry
1
Implementation of forest and land rehabilitation, and forest reclamation in priority River Basins
Implementation of forest rehabilitation in priority River Basins of 500,000 ha
Rehabilitation of critical land in River Basins Rehabilitation of Swamp, Peatland, Mangrove and Coastal Forests
Implementation of critical land rehabilitation in priority River Basins of 1,954,000 ha Development of city forests of 6,000 ha Rehabilitation of mangrove forests/coastal forests of 40,000 ha
2 Investigation and safeguarding of forests
Completion of the handling of new cases of forestry crimes (illegal logging, illegal mining and fire) at least by 75%
Development of Forest Safeguarding Facilities and Infrastructure
Source: Regulation of the Minister of Forestry 2011, Perpres 61/ 2011 DAK Forestry of 2012: The allocation of DAK Forestry for fiscal year 2012 was based on Regulation of the Minister of Forestry Number: P.69/Menhut-II/2011 regarding Technical Guidelines on the Use of Specific Allocation Fund for the Forestry Sector in Fiscal Year 2012. Pursuant to the aforementioned regulation, DAK Forestry of 2012 was to be used for the following activities: Rehabilitation of forest and critical land on priority River Basins including Rehabilitation of Swamp, Peatland, Mangrove and Coastal Forests as well as land rehabilitation programs. For provinces/regency/city having damaged mangrove forests, DAK Forestry program were to be prioritized for the rehabilitation of mangrove forests;
a) Development of Forest Safeguarding Facilities and Infrastructure; b) Development of Forestry Counseling Facilities and Infrastructure; c) Development of Facilities and Infrastructure for the Management of Forest Conservation Parks (Taman
Hutan Raya/Tahura); d) Development of KPH Operational Facilities and Infrastructure.
Table 6: Use of DAK Forestry of 2011
No USE ACTIVITY/TARGET
1 Rehabilitation of critical land in River Basins
Reforestation and vegetative enrichment
Tree planting
Conservation of land and water
2 Rehabilitation of Mangrove and Coastal Forests
Aimed at reducing the impacts of disasters in coastal areas which is conducted by referring to applicable criteria, guidelines, technical guidelines on the implementation of activities especially those issued by the Ministry of Forestry

Jornal of Social and Development Sciences (JSDS) Vol. 7, No. 2, June 2016 (ISSN 2221-1152)
67
3 Development of Forest Safeguarding Facilities and Infrastructure
Implemented in accordance with the needs and budget availability by referring to the standard, guidelines and technical guidelines on the implementation of activities. Procurement of forest facilities and infrastructure in the form of motorbikes, guard posts, GPS, communication equipment
Source: Regulation of the Minister of Forestry, 2011 There is slight difference in the allocation of DAK Forestry in 2012 whereby it was also used for the Development of KPH Operational Facilities and Infrastructure. This is the only difference between the allocation of DAK Forestry of 2012 and the allocations in 2010 and 2011. In relation to the programs set forth in Presidential Regulation Number 61 of 2011, the additional allocation for the development of KPH operational facilities and infrastructure actually adds to supported programs having intersection. The matrix of interconnection of those programs is presented in Table 7.
Table 7: Intersection of Activities and Programs between Presidential Regulation and DAK Forestry of 2012
No Action Plan in Presidential Regulation
Activity/Target DAK Forestry
1 Development of Forest Management Unit (KPH)
Establishment of 120 KPH Development of KPH Operational Facilities and Infrastructure
2 Implementation of forest and land rehabilitation, and forest reclamation in priority River Basins
Implementation of forest rehabilitation in priority River Basins of 500,000 ha
Rehabilitation of critical land in River Basins Rehabilitation of Swamp, Peatland, Mangrove and Coastal Forests
Implementation of critical land rehabilitation in priority River Basins of 1,954,000 ha Development of city forests of 6,000 ha Rehabilitation of mangrove forests/coastal forests of 40,000 ha
3 Investigation and safeguarding of forests
Completion of the handling of new cases of forestry crimes (illegal logging, illegal mining and fire) at least by 75%
Development of Forest Safeguarding Facilities and Infrastructure
Source: Regulation of the Minister of Forestry, 2011, Perpres, 2011 Table 8: Use of DAK Forestry of 2012
No Use Activity/Target
1 Development of KPH Operational Facilities and Infrastructure
Implemented in accordance with the needs and budget availability by referring to the standard, guidelines and technical guidelines on the implementation of activities. Among others: GPS, forest inventory equipment and mapping equipment.
2 Rehabilitation of critical land in River Basins Rehabilitation of Swamp, Peatland, Mangrove and Coastal Forests
Reforestation and vegetative enrichment, Land rehabilitation and vegetative enrichment, Rehabilitation of Swamp/Peatland/Mangrove and Coastal areas,
3 Development of Forest Safeguarding Facilities and Infrastructure
Implemented in accordance with the needs and budget availability by referring to the standard, guidelines and technical guidelines on the implementation of activities. Procurement of forest facilities and infrastructure in the form of motorbikes, guard posts, GPS, communication equipment
Source: Regulation of the Minister of Forestry, 2012
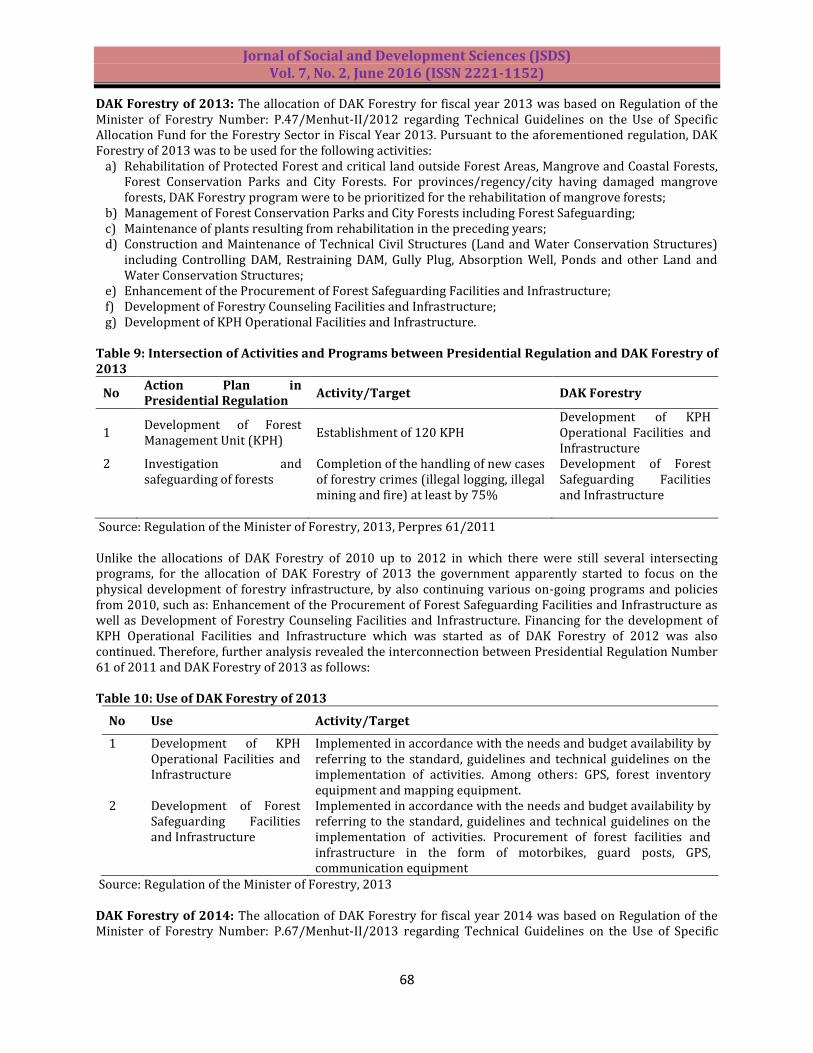
Jornal of Social and Development Sciences (JSDS) Vol. 7, No. 2, June 2016 (ISSN 2221-1152)
68
DAK Forestry of 2013: The allocation of DAK Forestry for fiscal year 2013 was based on Regulation of the Minister of Forestry Number: P.47/Menhut-II/2012 regarding Technical Guidelines on the Use of Specific Allocation Fund for the Forestry Sector in Fiscal Year 2013. Pursuant to the aforementioned regulation, DAK Forestry of 2013 was to be used for the following activities:
a) Rehabilitation of Protected Forest and critical land outside Forest Areas, Mangrove and Coastal Forests, Forest Conservation Parks and City Forests. For provinces/regency/city having damaged mangrove forests, DAK Forestry program were to be prioritized for the rehabilitation of mangrove forests;
b) Management of Forest Conservation Parks and City Forests including Forest Safeguarding; c) Maintenance of plants resulting from rehabilitation in the preceding years; d) Construction and Maintenance of Technical Civil Structures (Land and Water Conservation Structures)
including Controlling DAM, Restraining DAM, Gully Plug, Absorption Well, Ponds and other Land and Water Conservation Structures;
e) Enhancement of the Procurement of Forest Safeguarding Facilities and Infrastructure; f) Development of Forestry Counseling Facilities and Infrastructure; g) Development of KPH Operational Facilities and Infrastructure.
Table 9: Intersection of Activities and Programs between Presidential Regulation and DAK Forestry of 2013
No Action Plan in Presidential Regulation
Activity/Target DAK Forestry
1 Development of Forest Management Unit (KPH)
Establishment of 120 KPH Development of KPH Operational Facilities and Infrastructure
2 Investigation and safeguarding of forests
Completion of the handling of new cases of forestry crimes (illegal logging, illegal mining and fire) at least by 75%
Development of Forest Safeguarding Facilities and Infrastructure
Source: Regulation of the Minister of Forestry, 2013, Perpres 61/2011 Unlike the allocations of DAK Forestry of 2010 up to 2012 in which there were still several intersecting programs, for the allocation of DAK Forestry of 2013 the government apparently started to focus on the physical development of forestry infrastructure, by also continuing various on-going programs and policies from 2010, such as: Enhancement of the Procurement of Forest Safeguarding Facilities and Infrastructure as well as Development of Forestry Counseling Facilities and Infrastructure. Financing for the development of KPH Operational Facilities and Infrastructure which was started as of DAK Forestry of 2012 was also continued. Therefore, further analysis revealed the interconnection between Presidential Regulation Number 61 of 2011 and DAK Forestry of 2013 as follows: Table 10: Use of DAK Forestry of 2013
No Use Activity/Target
1 Development of KPH Operational Facilities and Infrastructure
Implemented in accordance with the needs and budget availability by referring to the standard, guidelines and technical guidelines on the implementation of activities. Among others: GPS, forest inventory equipment and mapping equipment.
2 Development of Forest Safeguarding Facilities and Infrastructure
Implemented in accordance with the needs and budget availability by referring to the standard, guidelines and technical guidelines on the implementation of activities. Procurement of forest facilities and infrastructure in the form of motorbikes, guard posts, GPS, communication equipment
Source: Regulation of the Minister of Forestry, 2013 DAK Forestry of 2014: The allocation of DAK Forestry for fiscal year 2014 was based on Regulation of the Minister of Forestry Number: P.67/Menhut-II/2013 regarding Technical Guidelines on the Use of Specific
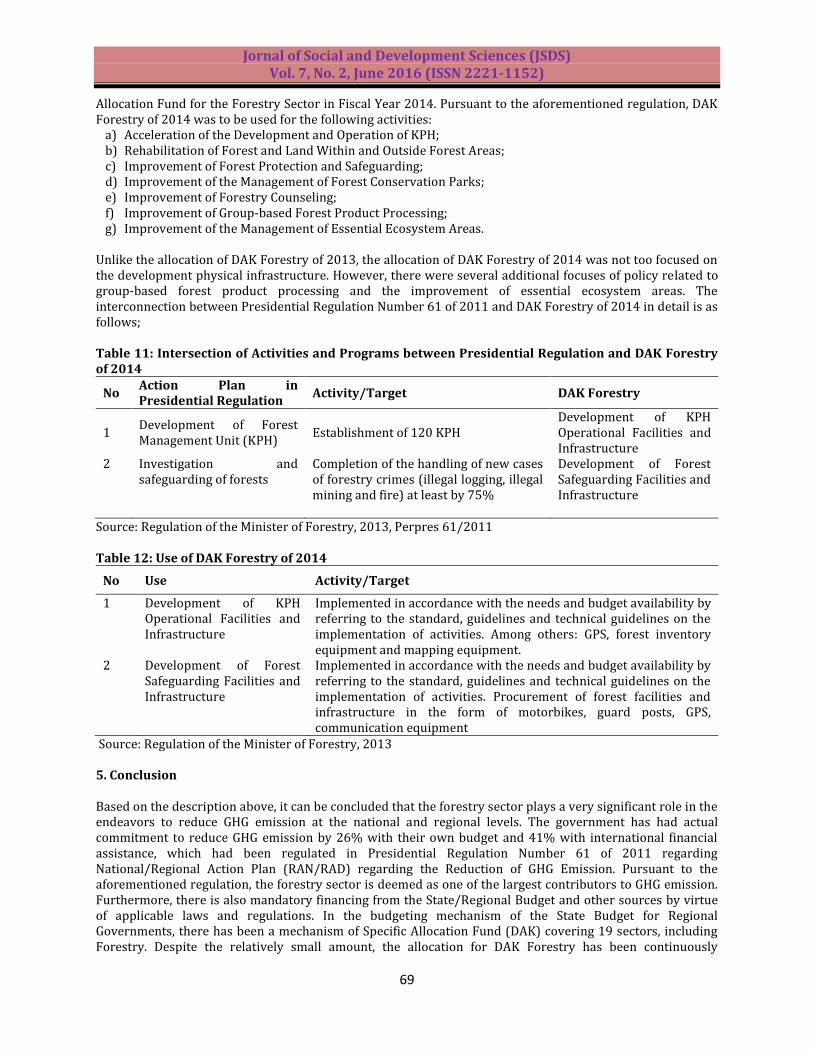
Jornal of Social and Development Sciences (JSDS) Vol. 7, No. 2, June 2016 (ISSN 2221-1152)
69
Allocation Fund for the Forestry Sector in Fiscal Year 2014. Pursuant to the aforementioned regulation, DAK Forestry of 2014 was to be used for the following activities:
a) Acceleration of the Development and Operation of KPH; b) Rehabilitation of Forest and Land Within and Outside Forest Areas; c) Improvement of Forest Protection and Safeguarding; d) Improvement of the Management of Forest Conservation Parks; e) Improvement of Forestry Counseling; f) Improvement of Group-based Forest Product Processing; g) Improvement of the Management of Essential Ecosystem Areas.
Unlike the allocation of DAK Forestry of 2013, the allocation of DAK Forestry of 2014 was not too focused on the development physical infrastructure. However, there were several additional focuses of policy related to group-based forest product processing and the improvement of essential ecosystem areas. The interconnection between Presidential Regulation Number 61 of 2011 and DAK Forestry of 2014 in detail is as follows; Table 11: Intersection of Activities and Programs between Presidential Regulation and DAK Forestry of 2014
No Action Plan in Presidential Regulation
Activity/Target DAK Forestry
1 Development of Forest Management Unit (KPH)
Establishment of 120 KPH Development of KPH Operational Facilities and Infrastructure
2 Investigation and safeguarding of forests
Completion of the handling of new cases of forestry crimes (illegal logging, illegal mining and fire) at least by 75%
Development of Forest Safeguarding Facilities and Infrastructure
Source: Regulation of the Minister of Forestry, 2013, Perpres 61/2011 Table 12: Use of DAK Forestry of 2014
No Use Activity/Target
1 Development of KPH Operational Facilities and Infrastructure
Implemented in accordance with the needs and budget availability by referring to the standard, guidelines and technical guidelines on the implementation of activities. Among others: GPS, forest inventory equipment and mapping equipment.
2 Development of Forest Safeguarding Facilities and Infrastructure
Implemented in accordance with the needs and budget availability by referring to the standard, guidelines and technical guidelines on the implementation of activities. Procurement of forest facilities and infrastructure in the form of motorbikes, guard posts, GPS, communication equipment
Source: Regulation of the Minister of Forestry, 2013 5. Conclusion Based on the description above, it can be concluded that the forestry sector plays a very significant role in the endeavors to reduce GHG emission at the national and regional levels. The government has had actual commitment to reduce GHG emission by 26% with their own budget and 41% with international financial assistance, which had been regulated in Presidential Regulation Number 61 of 2011 regarding National/Regional Action Plan (RAN/RAD) regarding the Reduction of GHG Emission. Pursuant to the aforementioned regulation, the forestry sector is deemed as one of the largest contributors to GHG emission. Furthermore, there is also mandatory financing from the State/Regional Budget and other sources by virtue of applicable laws and regulations. In the budgeting mechanism of the State Budget for Regional Governments, there has been a mechanism of Specific Allocation Fund (DAK) covering 19 sectors, including Forestry. Despite the relatively small amount, the allocation for DAK Forestry has been continuously
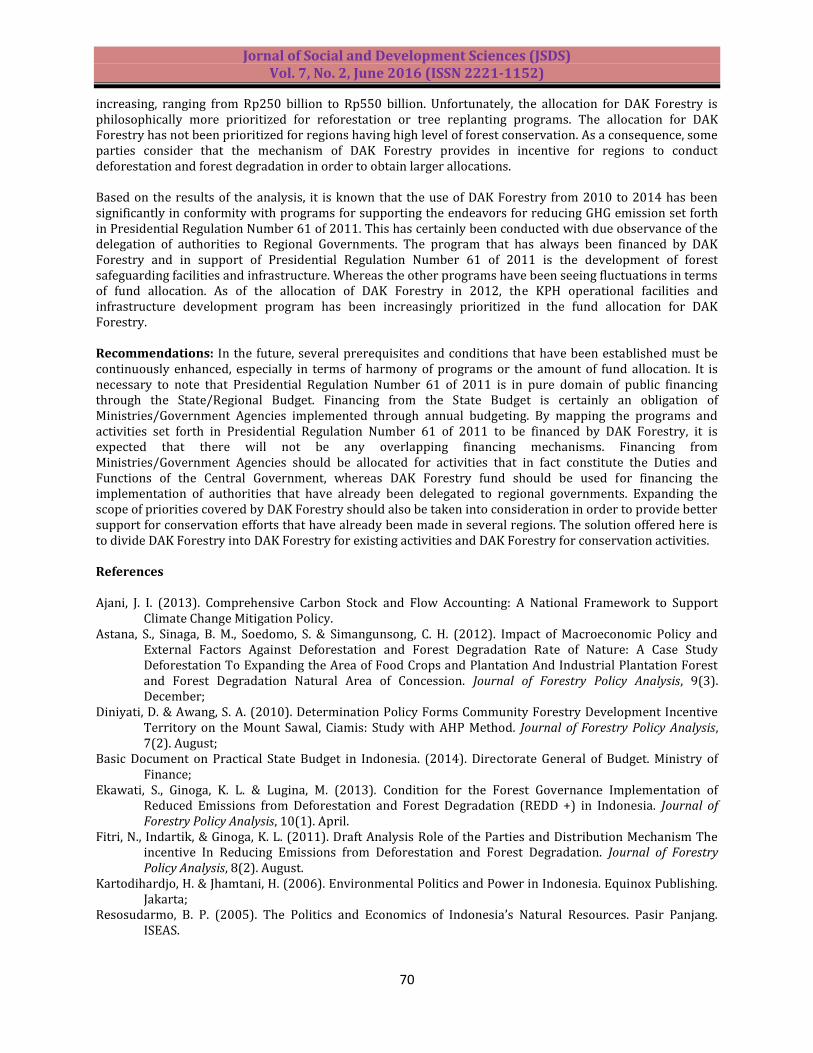
Jornal of Social and Development Sciences (JSDS) Vol. 7, No. 2, June 2016 (ISSN 2221-1152)
70
increasing, ranging from Rp250 billion to Rp550 billion. Unfortunately, the allocation for DAK Forestry is philosophically more prioritized for reforestation or tree replanting programs. The allocation for DAK Forestry has not been prioritized for regions having high level of forest conservation. As a consequence, some parties consider that the mechanism of DAK Forestry provides in incentive for regions to conduct deforestation and forest degradation in order to obtain larger allocations. Based on the results of the analysis, it is known that the use of DAK Forestry from 2010 to 2014 has been significantly in conformity with programs for supporting the endeavors for reducing GHG emission set forth in Presidential Regulation Number 61 of 2011. This has certainly been conducted with due observance of the delegation of authorities to Regional Governments. The program that has always been financed by DAK Forestry and in support of Presidential Regulation Number 61 of 2011 is the development of forest safeguarding facilities and infrastructure. Whereas the other programs have been seeing fluctuations in terms of fund allocation. As of the allocation of DAK Forestry in 2012, the KPH operational facilities and infrastructure development program has been increasingly prioritized in the fund allocation for DAK Forestry.
Recommendations: In the future, several prerequisites and conditions that have been established must be continuously enhanced, especially in terms of harmony of programs or the amount of fund allocation. It is necessary to note that Presidential Regulation Number 61 of 2011 is in pure domain of public financing through the State/Regional Budget. Financing from the State Budget is certainly an obligation of Ministries/Government Agencies implemented through annual budgeting. By mapping the programs and activities set forth in Presidential Regulation Number 61 of 2011 to be financed by DAK Forestry, it is expected that there will not be any overlapping financing mechanisms. Financing from Ministries/Government Agencies should be allocated for activities that in fact constitute the Duties and Functions of the Central Government, whereas DAK Forestry fund should be used for financing the implementation of authorities that have already been delegated to regional governments. Expanding the scope of priorities covered by DAK Forestry should also be taken into consideration in order to provide better support for conservation efforts that have already been made in several regions. The solution offered here is to divide DAK Forestry into DAK Forestry for existing activities and DAK Forestry for conservation activities. References Ajani, J. I. (2013). Comprehensive Carbon Stock and Flow Accounting: A National Framework to Support
Climate Change Mitigation Policy. Astana, S., Sinaga, B. M., Soedomo, S. & Simangunsong, C. H. (2012). Impact of Macroeconomic Policy and
External Factors Against Deforestation and Forest Degradation Rate of Nature: A Case Study Deforestation To Expanding the Area of Food Crops and Plantation And Industrial Plantation Forest and Forest Degradation Natural Area of Concession. Journal of Forestry Policy Analysis, 9(3). December;
Diniyati, D. & Awang, S. A. (2010). Determination Policy Forms Community Forestry Development Incentive Territory on the Mount Sawal, Ciamis: Study with AHP Method. Journal of Forestry Policy Analysis, 7(2). August;
Basic Document on Practical State Budget in Indonesia. (2014). Directorate General of Budget. Ministry of Finance;
Ekawati, S., Ginoga, K. L. & Lugina, M. (2013). Condition for the Forest Governance Implementation of Reduced Emissions from Deforestation and Forest Degradation (REDD +) in Indonesia. Journal of Forestry Policy Analysis, 10(1). April.
Fitri, N., Indartik, & Ginoga, K. L. (2011). Draft Analysis Role of the Parties and Distribution Mechanism The incentive In Reducing Emissions from Deforestation and Forest Degradation. Journal of Forestry Policy Analysis, 8(2). August.
Kartodihardjo, H. & Jhamtani, H. (2006). Environmental Politics and Power in Indonesia. Equinox Publishing. Jakarta;
Resosudarmo, B. P. (2005). The Politics and Economics of Indonesia’s Natural Resources. Pasir Panjang. ISEAS.

Jornal of Social and Development Sciences (JSDS) Vol. 7, No. 2, June 2016 (ISSN 2221-1152)
71
Riyanto, G. (2006). Order Politics and Policy Forest Management in Indonesia. Community Journal of Sociology, XIII(2). December.
Rickels, W. (2010). Method for Greenhouse Gas Offset Accounting; A Case Study of Ocean Iron Fertilization. Setiono, B. (2013). Specific Allocation Fund for Forestry To Help Local Government Implement: Government
Targets Reduce Carbon Emissions. Final Report BKF-AIPEG. Siswiyanti, Y., Darusman, D., Kartodihardjo, H. & Ichwandi, I. (2015). Prospects for Implementation of
Convention on Climate Change in Forest Management Indonesia. Journal of Forestry Policy Analysis, 12(1). April.
Susiyanto, D. (2015). Fiscal Financing Options to Support Critical Land Use in Indonesia. Final Report BKF-UKCCU.
Tambunan, P., Suhendi, H., Siswanto, B. E. & Lisnawati, Y. (2011). Adaptation Management of Climate Change. Journal Forestry Policy Analysis, 9(1).
Wibowo, A. (2013). Study of Greenhouse Gas Emission Reduction Forest Sector Policy Support of Presidential Decree Number 61 Year 2011. Journal Forestry Policy Analysis, 10(3).
Wibowo, A. (2013). Application 2006 IPCC Guidelines for Greenhouse Gas Emissions Calculation Forestry in South Sumatra. Journal Forestry Policy Analysis, 10(2).

Jornal of Social and Development Sciences (JSDS) Vol. 7, No. 2, June 2016 (ISSN 2221-1152)
72
Public Service by the Government of Papua Province in the Special Autonomy
Efraim Kambu
Cendrawasih University, Papua, Indonesia [email protected]
Abstract: Special Autonomy assigns its rights and obligations to local governments to regulate and manage their own affairs and interests of the society so that people increasingly can be served well. But in fact, public services provided is not maximized. This study used qualitative methods, data sources are divided into two types of data sources, namely primary and secondary data sources. The results of this study indicate that there is still lack of public services the Government of Papua Province visible from the weak aspects of responsiveness, which local governments less responsive to some of the problems in the field of education, economy and industry growth and physical development as well as non-physical. From the aspect of responsibility is also still found their weaknesses, which the Government of Papua Province is still not fully overcome the problems of corruption and poverty. Meanwhile, from the aspect of accountability, it is known that the performance of governance in Papua in providing public services are not running optimally, one reason is the lack of competence and capability of local government officials. Keywords: Special autonomy, government, Papua, public service
1. Introduction Papua or previously had the name Irian Jaya, before the year 2001 is a province that experienced a lot of pace compared to other provinces. Compared with abundant natural resources, the people of Papua is precisely in a state completely underdeveloped in comparison with the Indonesian community in another province. The issue of injustice, low welfare and law enforcement becomes then lead to disappointment that led to the conflict. So in the end, Papua also be one of the areas in Indonesia that has always plagued by conflict, particularly with respect to the conflict between the Free Papua Movement (OPM) with central government officials in Papua, the police and military. For OPM, Papua's independence is a matter that needs to be fought. The reason for being in the framework of the Unitary Republic of Indonesia (NKRI), the central government has never care about the fate of the people of Papua. As for the central government, Papua still must be part of the Unitary Republic of Indonesia, after previously losing East Timor in 1999 as a result of the referendum. In addressing the issues of underdevelopment and conflict in Papua, the Government subsequently approved Law No. 21 of 2001 concerning Special Autonomy for Papua Province. In other words, this law was born as a response to the central government of the overflow of the political resistance movement in Papua through demands for independence. However, the positive things from the Special Autonomy Law is this policy aims at encouraging Papua be on par with other provinces in Indonesia. Special Autonomy for Papua not only provides an opportunity politically, especially with presence of Papuan People's Assembly (MRP),3 but also provides a great opportunity for growth and economic development in Papua. Economically presence of Special Autonomy for Papua has an impact on budget or the addition of special autonomy fund, the aim is for the development in Papua can run well. Policy of special autonomy for Papua, on the other hand not only provide the right but also the obligation for local governments, namely improving local government performance in public service. In fact, although the special autonomy has been running for 14 years, but local governments in Papua have not been able to realize the performance of public services. Whereas according Maisini (2015: 94) until now the Papuan people have not felt the so-called prosperous. Besides that the condition of the Papuan people in the fields of education, economy, culture and social politics is still very alarming when compared to other provinces in Indonesia. Likewise, based on the information report issued by the USAID (2014: 37) where the report said that the challenge of assisting the
3 Papua People's Assembly (MRP) is an Institution in Papua Province, Indonesia the band consists of Indigenous Papuans What Being Equal with the parliament. In the Matter of Law No. 21 of 2001 on Special Autonomy for Papua Province, Chapter V, Form and Structure of Government, Explicitly Mentioned That the Main Pillars In The Governance of Papua Province Consists Of Three Parts. Three Components that is the Papuan Legislative Council (DPRP / DPRD), local government (governor Along These devices), and MRP.
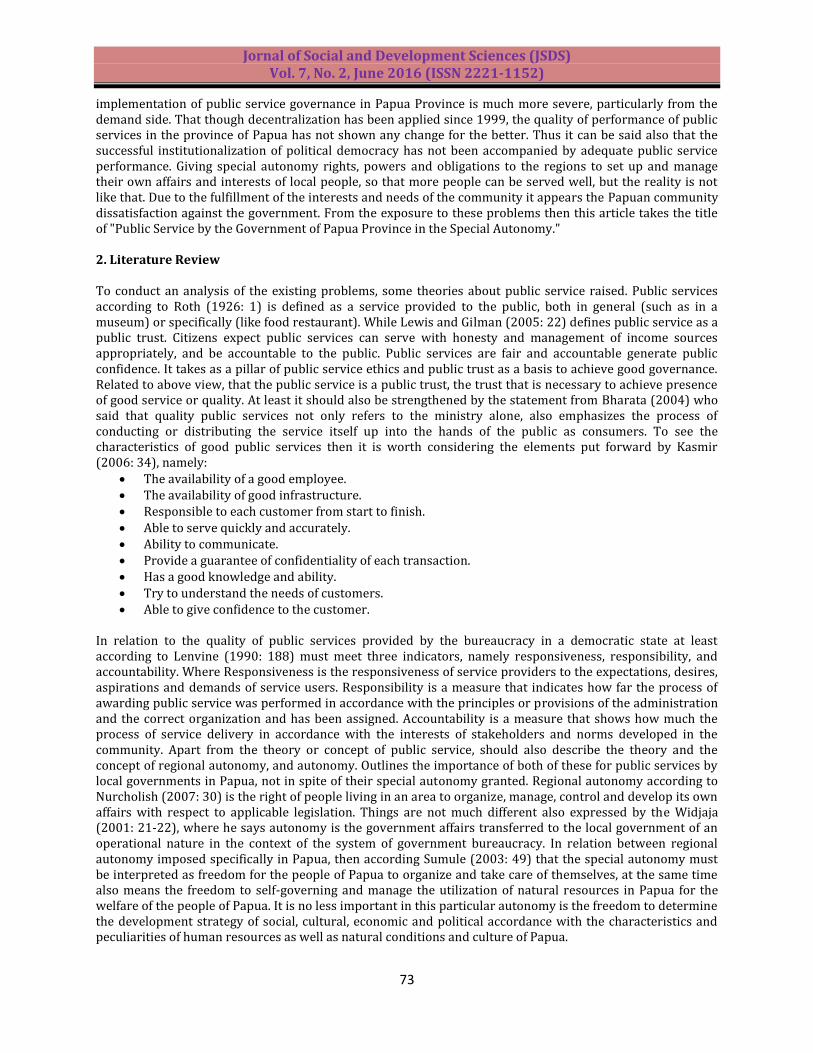
Jornal of Social and Development Sciences (JSDS) Vol. 7, No. 2, June 2016 (ISSN 2221-1152)
73
implementation of public service governance in Papua Province is much more severe, particularly from the demand side. That though decentralization has been applied since 1999, the quality of performance of public services in the province of Papua has not shown any change for the better. Thus it can be said also that the successful institutionalization of political democracy has not been accompanied by adequate public service performance. Giving special autonomy rights, powers and obligations to the regions to set up and manage their own affairs and interests of local people, so that more people can be served well, but the reality is not like that. Due to the fulfillment of the interests and needs of the community it appears the Papuan community dissatisfaction against the government. From the exposure to these problems then this article takes the title of "Public Service by the Government of Papua Province in the Special Autonomy." 2. Literature Review To conduct an analysis of the existing problems, some theories about public service raised. Public services according to Roth (1926: 1) is defined as a service provided to the public, both in general (such as in a museum) or specifically (like food restaurant). While Lewis and Gilman (2005: 22) defines public service as a public trust. Citizens expect public services can serve with honesty and management of income sources appropriately, and be accountable to the public. Public services are fair and accountable generate public confidence. It takes as a pillar of public service ethics and public trust as a basis to achieve good governance. Related to above view, that the public service is a public trust, the trust that is necessary to achieve presence of good service or quality. At least it should also be strengthened by the statement from Bharata (2004) who said that quality public services not only refers to the ministry alone, also emphasizes the process of conducting or distributing the service itself up into the hands of the public as consumers. To see the characteristics of good public services then it is worth considering the elements put forward by Kasmir (2006: 34), namely:
The availability of a good employee. The availability of good infrastructure. Responsible to each customer from start to finish. Able to serve quickly and accurately. Ability to communicate. Provide a guarantee of confidentiality of each transaction. Has a good knowledge and ability. Try to understand the needs of customers. Able to give confidence to the customer.
In relation to the quality of public services provided by the bureaucracy in a democratic state at least according to Lenvine (1990: 188) must meet three indicators, namely responsiveness, responsibility, and accountability. Where Responsiveness is the responsiveness of service providers to the expectations, desires, aspirations and demands of service users. Responsibility is a measure that indicates how far the process of awarding public service was performed in accordance with the principles or provisions of the administration and the correct organization and has been assigned. Accountability is a measure that shows how much the process of service delivery in accordance with the interests of stakeholders and norms developed in the community. Apart from the theory or concept of public service, should also describe the theory and the concept of regional autonomy, and autonomy. Outlines the importance of both of these for public services by local governments in Papua, not in spite of their special autonomy granted. Regional autonomy according to Nurcholish (2007: 30) is the right of people living in an area to organize, manage, control and develop its own affairs with respect to applicable legislation. Things are not much different also expressed by the Widjaja (2001: 21-22), where he says autonomy is the government affairs transferred to the local government of an operational nature in the context of the system of government bureaucracy. In relation between regional autonomy imposed specifically in Papua, then according Sumule (2003: 49) that the special autonomy must be interpreted as freedom for the people of Papua to organize and take care of themselves, at the same time also means the freedom to self-governing and manage the utilization of natural resources in Papua for the welfare of the people of Papua. It is no less important in this particular autonomy is the freedom to determine the development strategy of social, cultural, economic and political accordance with the characteristics and peculiarities of human resources as well as natural conditions and culture of Papua.

Jornal of Social and Development Sciences (JSDS) Vol. 7, No. 2, June 2016 (ISSN 2221-1152)
74
3. Methodology This study uses a qualitative method. The data source is divided into two types of data sources, namely primary and secondary data sources. Primary data is data obtained directly through interviews and observations in the field. Secondary data were obtained through documentation relevant to this study, the literature on public services by the Government of Papua Province. The informants were interviewed in this study are: Frans Rumbrawer, Lecturer in Anthropology Studies Program, University of Cenderawasih; M. Rumbiak, Padjadjaran University Graduate Students from Papua. Observations carried out on various activities that made the object of research, namely in the form of public service activities of the Government of Papua Province. While the documentation of the analysis carried out on various documents related to the public service of the Government of Papua Province. Furthermore, the process of collecting data in this study tailored to the type of research. The data collected in this study, namely in the form of words, actions, documents, situations, and events that can be observed. Test the validity of the data in this study is done through triangulation, which is a technique of testing the validity of data is done by checking correctness of the data obtained by researchers in other parties who can be trusted. To maintain the validity of the data or research, efforts are based on the principles of triangulation. In this study, triangulation is done on the data sources, and use various supporting references, to prove the data that has been found in research, such as: recording, photographs or other documents that support. 4. Analysis In order public services can achieve the desired goals, it needs to be supported by relevant elements, which is a supporting factor from the service process. The ineffectiveness of the factors to support public services will be able to inhibit the service itself. In Papua, an effort to provide better public services had also been a long time to implement, especially when Papua was granted special autonomy status. But the success or failure of these efforts need to be further analyzed with the theory, and to analyze the researchers used the theory of public services proposed Lenvine (1990: 188), where the quality of public services provided by the bureaucracy in a democratic state must meet three indicators, namely responsiveness , responsibility, and accountability. Responsiveness: Aspects of responsiveness in the public service performed by the government, is related to the responsiveness of the government as a service provider to the expectations, desires, aspirations and demands of the service users, ie the public. Also associated with the the implementation of special autonomy, the government of Papua in aspects of responsiveness required to quickly understand what the public demands, and strive to meet them. Governments are encouraged to not procrastinate time, extending lines of service, or the importance of the procedure but ignoring the substance. With it then public services can be said to be good if the government is considered to have a high responsiveness to demands, problems, concerns and aspirations of the people. Associated with the demands, hopes, wishes and aspirations of the Papuan people, at least there are some things that have been identified, some of them:
Regarding the increase in economic growth The improvement of welfare, which among others also includes the improvement of education and
health Demands to the problem of housing construction and clean water. Development of physical and non-physical, such as infrastructure and transport.
(Source: from various sources, 2016)4 The emergence of the demands and aspirations of the people of Papua are things need to be considered by the provincial government, in view of the provision of special autonomy for Papua based on a desire or goal to make advanced Papua province and the same as other provinces. Papua Special Autonomy has provided an opportunity to significantly growing, but on the other hand needs to be the responsibility from local governments to implement good public services. Where one of them, local governments must respond to the demands and aspirations of the people. The emergence of the demands and aspirations of the people of Papua
4 Http://Www.Merdeka.Com/Uang/6-Tuntutan-Ekonomi-Rakyat-Papua-Ke-Pemerintah-Termasuk-Freeport.Html and Http://Www.Dpd.Go.Id/Artikel-Tahun-Kesembilan-Otonomi-Khusus-Papua-Belum-Berhasil [Accessed February 17, 2016].
Jornal of Social and Development Sciences (JSDS) Vol. 7, No. 2, June 2016 (ISSN 2221-1152)
75
are things that need to be considered by the provincial government, considering the provision of special autonomy for Papua based on the objective to bring Papua province on par with other provinces. Papua Special Autonomy has provided an opportunity to significantly growing, but on the other hand need the accountability from local governments to implement good public services. Which one of them, local governments must respond to the demands and aspirations of the people. In analyzing aspects of Papua Provincial Government responsiveness to demands, grievances or aspirations of its people, then the analysis is performed on data associated with the various demands and aspirations. To analyze the demands of economic growth, then the visible aspect is the growth of the banking and investment, trade, agriculture, and industry. From the banking and investment growth data, it is known that the position of rupiah deposits and foreign currency commercial banks in the province of Papua in 2014 was the lowest compared to previous years (2010-2013). Where rupiah deposits and foreign currency commercial banks, in 2014 only Rp. 2 billion, far different from the year 2013 which amounted to Rp. 29 billion and in 2012 which amounted to Rp. 26 bilion, or in 2010 the number is still far greater, namely Rp. 20 billion. Not only that, the number of cooperative units in the province of Papua in 2014 is much lower than in 2012 and 2013. In 2014 the number of cooperative units amounted to 2.420, the number is smaller than the year 2013, which amounted to 2.816, and in 2012 amounted to 2.580. Although the number of cooperative units is reduced but this can be offset by the increasing number of investment companies in the domestic and foreign, are respectively 108 and 78 (previous year, ie 2013 by 103 and 75) (Source: BPS Papua Province, 2015). From the aspect of trade, though there were no comparative data, but the province of Papua have had a market share of exports to some countries for some agricultural commodities and industrial results, such as the United States, China and some other countries (Source: BPS Papua Province, 2015) As for agriculture, which the assessment is the growth from the rice crop production, horticulture, vegetables and fruits. For the production of rice plants is increasing every year, where in 2014 the productivity of rice plants was amounted to 43.08, while the production in 2013 amounted to only 41.30. Although the productivity of rice plants increased, but the productivity of horticultural crops is precisely decreased, for example, productivity of medicinal plants in 2014 amounted to only 64.527, far less than the productivity in 2013 amounted to 421.968. Also the case with the productivity of vegetables and fruits that come down, wherein each reaches only 21.939 and 8.525. Whereas in the previous year (2013) the productivity of vegetables amounted to 42.666 and 34.223 fruit trees of (Source: BPS Papua Province, 2015). Likewise in the industrial sector has not increased. As stated by the Minister of Industry, that the contribution of Papua to value added sector of national non-oil industry is still relatively small, which is 2.78%. More minister reveals underdeveloped industrial infrastructure supporting the cause of the spread and equity industry is relatively slow.5 From the data above, efforts to promote economic growth is still not completely worked well. Public service performed by Papua Provincial Government has not done optimally, because there are still shortcomings in the regulation of rupiah deposits and foreign currency at commercial banks, decreased number of cooperative units and the decline of agricultural production plants, as well as the slow pace of industrial growth. In providing good service to the community, the Government of Papua Province can actually maximize efforts to resolve the issues above. As for example in the field of agriculture, the Papua Provincial Agriculture Office should be able to maximize outreach activities and provision of agricultural plant seeds so that agricultural production can be increased. Demands improvements in welfare, which among others also includes the improvement of education and health. That from the Central Statistics Agency (BPS) Papua (2015), the level of poverty in the province of Papua in 2015, amounting to 28.17, a slight increase compared to 2014, amounting to 27.80. In the education sector, there is still a problem where the number of high school graduates (SMA) / equivalent is still smaller from the number of graduates of Elementary School (SD) / equivalent. For a number of high school graduates is at 30.04 while for primary school graduates is 75.86. The low educational level repairs, servicing shows educational system run by the government of Papua Province has not been effectively implemented. For the aspects of health care, conditions are still better than education, because every year the number of Papua Province Morbidity tends to fall. For example in 2014 Morbidity figure amounted to only 8.67, this figure is
5 Http://Financeroll.Co.Id/News/Saleh-Husin-Target-40-Persen-Industri-Diluar-Jawa-Infrastruktur-Pendukung-Jadi-Kendalanya/ [Accessed February 19, 2016]
Jornal of Social and Development Sciences (JSDS) Vol. 7, No. 2, June 2016 (ISSN 2221-1152)
76
far from the year 2013 which reached 18.97 (Source: BPS Papua Province, 2015). The fall in these rates can be used to measure the level of public health in the province of Papua. While in terms of response to the demands of housing construction and clean water, can be said to be a decline in provincial government services in providing adequate housing and have enough clean water. In the provision of housing, decent housing indicators in 2014 with the kind of ground floor not only at 77.95, is smaller compared to the year 2013, which amounted to 79.48 (Source: BPS Papua Province, 2015). Against a response to the demands of the development of physical and non-physical, such as infrastructure and transport. That the development of physical and non-physical in Papua has been slow. Although the financial resources available to the provincial governments, districts and municipalities for planning and infrastructure investment has increased dramatically in the last decade. Papua provincial government received transfers from Jakarta Rp 4.8 billion in 2008 (up from Rp 0.4 billion in 2000), while the district / city government received Rp 17.0 bilion (up from Rp 1.2 bilion a year 2000). In the total amount for 2008 is still not added one to two trillion to local revenue. However, useful infrastructure services provided to the population of Papua is only slightly increased.6 There are still problems in terms of improving the economy, welfare and development may be an indication that the Papua Provincial Government has not fully respond to the demands, aspirations and desires of the community. The slow pace of a response or not the government in responding to the demands of society can have an impact on disappointment with attitude and performance of the government. Whereas for the public, the slow response of the government to make the public more difficult to develop. Responsibility: The second indicator that also need to be considered in the public service by bureaucracy / government is the responsibility, where it is associated with a measure that indicates how far the process of public service provision is carried out in accordance with the principles of proper administration and organization. Regardless to correct standard of rules for the administration and organization, then there will be a wide variety of potential irregularities in public service delivery, such as corruption and the slow pace of public services. The problems of corruption and poverty close to audience feedback on Papua, this condition can occur in the absence of administrative provisions and the correct organization in providing public services. Director General (DG) Autonomous Region, the Ministry of Internal Affairs of Indonesia, namely Djohermansyah Djohan, revealed that the implementation of good public services in Papua related to post-special autonomy (Otsus), but unfortunately the policy implementation of special autonomy in Papua cannot be said to be successful. The one that caused it, he said, are the patterns and working mechanism has not been awakened synergistically.7 The problem of working mechanism is also a matter highlighted by the informants of this study, in which both the informant stated that the lack of working mechanism of employees due to the pattern of recruitment is still based on the relationship of ethnicity and kinship, also the case in staffing that is not based on the principle of the right man in the right place.8 Supposedly pattern of recruitment and staff by level of education and competence of employees, if the pattern of kinship or nepotism still characterize the process of placement and recruitment of employees, it can affect the commitment to create good governance. Public service in Papua with the color of red, this assessment together with an assessment of all 12 other provinces. By getting the red category means the public service in the province of Papua is relatively low. Rate lack of public services in Papua, one of which is inseparable from the poor standards of the organization in providing services. The Ombudsman assesses the poor standards of the organization of several things, including: the availability of the vision and mission of the service, as well as the availability of information on standards of public service for the community.9 With the reference of the votes at least can be identified, what is the cause of public service in Papua gets red values, one of which is caused by the lack of clarity of size or standard of rules for the administration and organization in providing public services. Clarity on the size or
6Http://Siteresources.Worldbank.Org/Intindonesia/Resources/Publication/280016-1235115695188/5847179-1263873728984/Exsum.Bh.Pdf [Accessed February 19, 2016] 7 Http://Www.Balairungpress.Com/2012/11/Menumbuhkan-Optimisme-Lewat-Pelayanan-Publik-Di-Papua/ [Accessed February 17, 2016]. 8 The interview with Frans Rumbrawer, Lecturer in Anthropology Studies Program, University of Cenderawasih, and M. Rumbaik, Graduate Student, University of Padjadjaran, from Papua. [Interview conducted on March 28, 2016]. 9 Http://Www.Jurnalasia.Com/2015/12/18/Standar-Pelayanan-Publik-Di-13-Provinsi-Rendah/ [Accessed February 17, 2016].
Jornal of Social and Development Sciences (JSDS) Vol. 7, No. 2, June 2016 (ISSN 2221-1152)
77
standard of rules for the administration and organization are important, these standards should be set out clearly in the vision and mission of the Government of Papua Province. Besides, size or standard of also should be known by the public, hence the availability of clear information for the public on standard of public services should be provided by the Government of Papua Province. Nonetheless, that does not mean there is no effort from the local government to seek to tackle the problem. Regional Government of Papua Province has actually also been carrying out government regulation and Regulation of the Minister of Internal Affairs. Some Performance Unit (SKPD) of the Government of Papua Province has made minimum service standards. However, the problem that arises is that the Government of Papua Province has not had guidelines for public service standards. As a result, many SKPD improvise their own in determining the standard public services. In addition, many SKPD are still feel confused in determining the standard public services. Therefore, it is very urgent for the Government of Papua Province to promptly develop guidelines for standards of public service that can be used by SKPD overall and sustainable reconstitute the minimum service standards. Standards of public service that is owned by the government sub-organizations can accelerate the process of public service, and this is also in accordance with the need to create good governance. Accountability: In the public service performed by the bureaucracy, accountability related to a measure that indicates how much the service delivery process in accordance with the interests of stakeholders and norms developed in the community. In connection with the special autonomy granted to Papua, accountability in the public service need to pay attention to the recognition and fulfillment of the basic rights of indigenous Papuans. In addition, public services within the framework of special autonomy must also consider the empowerment of the people of Papua strategically and fundamentally. The importance of paying attention and meets, as well as empowering the basic rights of indigenous Papuans in providing public services, because of the special autonomy gives authority and responsibility to the provincial government to take care of public interests at its own initiative based on the aspirations and fundamental rights of the Papuan people. Granting of Special Autonomy for Papua Province is intended to bring about justice, uphold the rule of law, respect for human rights, accelerating economic development, improving the welfare and progress of the people of Papua, in the framework of equality and balance with the progress of other provinces. Special autonomy through Law No. 21 of 2001 put the Papuan people and the people of Papua in general as a major subject. The existence of the Provincial Government of Papua and the unit below, are directed to provide the best services and empower people. But in hopes of increasing public services for indigenous Papuans, but until now the performance of Papua local government in providing public services are not running optimally. Although they are made several breakthroughs to spur the progress of Papua, but still many people perceive Papua is still underdeveloped. The more backward in terms of public service that ends an impact on the living standards of welfare. As Maisini (2015) in his research see that the government pays little attention to the potential and capacity of local communities as agents of development. Condition that occurs precisely the people of Papua is still poor, the development was considered failed, bureaucracy failing to create a ministry of basic rights and good performance for the public. Likewise with Wanimbo (2015) that in the conclusions of his research revealed that special autonomy is set forth in Law No. 21, 2001 has not succeeded in giving a guarantee for the improvement of public welfare, prosperity and recognition of the basic rights of indigenous people of Papua. Related to the lack of public services provided by the Provincial Government of Papua, the government should be able to reflect on some of the root causes of conflict in Papua, which is caused by the unfairness of the economy, such as the exploitation of natural resources and the participation of indigenous peoples is lacking, cultural domination and human resources development bias, marginalization and discrimination, as well as development failure. To solve the root of the problem, no doubt it is also necessary of qualified government officials. If the Government of Papua Province has qualified human resources, it will be able to assist government programs in empowerment and fulfillment of the rights of the Papuan people. Related to the above, an informant in this study revealed that the "quality of personnel in the Papua provincial government does not live up to expectations, many employees do not understand and explore the purpose of special autonomy. The issue of the lack of quality of human resources is also due to the recruitment system is
Jornal of Social and Development Sciences (JSDS) Vol. 7, No. 2, June 2016 (ISSN 2221-1152)
78
still based on factors of tribal or kinship, and is not based on competence."10 From the information given by the informant, it is known that one of the causes of unfulfilled rights of indigenous Papuans is due to lack of competence and capability of local government officials. This condition is a problem that must be addressed by the Government of Papua province, because the people of Papua should immediately get better public services so that their rights are met. 5. Conclusion Although the special autonomy has been running for 14 years, but local governments in Papua have not been able to realize good public service, until now the people of Papua have not felt the so-called prosperous, just and prosperous. Low public service of the Government of Papua Province seen from the weak aspects of Responsiveness, where the government is not responsive to some of the problems in the field of education, economy and industry growth, as well as the physical and non-physical development. From the aspect of responsibility is also still found their weaknesses, which the Government of Papua Province is still not fully overcome the problems of corruption and poverty, because the pattern and working mechanism has not been built synergistically. Low employee working mechanism caused by the pattern of recruitment which is still based on ethnicity and kinship relationships. While the last aspect, that is accountability, it is known that the performance of governance in Papua in providing public services are not running optimally. One cause of unfulfilled rights of indigenous Papuans is due to lack of competence and capability of local government officials. Therefore, the Papua provincial government needs to do some improvements in order to improve the quality of public services, one must be responsive to the demands of society, responsible for the mandate given by the people, and accountable. References Bharata, A. (2004). Dasar-dasar Pelayanan Prima. Jakarta : Elex Media. Komputindo. Kasmir. (2006). Manajemen Perbankan. Jakarta : PT. Raja Grafindo Persada. Lenvine, C. H. (1990). Public Administration: Chalenges, Choices, Consequences. Illionis: Scott Foreman. Lewis, C. W. & Gilman, S. C. (2005). The Ethics Challenge in Public Service: A Problem-Solving Guide. Market
Street. San Fransisco: Jossey-Bass. Maisini, A. (2015). Pelayanan Publik oleh Pemerintah Daerah dalam Penyelenggaraan Otonomi Khusus Papua.
Jurnal Lex Administratum, 3(4), Juni 2015. Nurcholis, H. (2007). Teori dan Praktik Pemerintahan Dan Otonomi Daerah. Jakarta: PT. Grasindo. Roth, G. J. (1926). The Privat Provision of Public Service in Developing Country. Washington DC: Oxford
University Press. Sumule, A. (2003). Mencari Jalan Tengah; Otonomi Khusus Provinsi Papua. Jakarta: PT. Gramedia Pustaka
Utama. USAID. (2014). Modul Tata Kelola Pelayanan Publik Berbasis Standar. Jakarta: USAID. Wanimbo, D. (2015). Implementasi Otonomi Khusus dalam Proses Pelayanan Publik (Studi Tentang Proses
Pelayanan Bidang Pendidikan Dan Kesehatan Kabupaten Lanny Jaya Propinsi Papua). Jurnal Politico, 2(6).
Widjaja, H. A. W. (2001). Otonomi Daerah dan Daerah Otonom. Jakarta: PT. RajaGrafindo.
10 The interview with Frans Rumbrawer, Lecturer in Anthropology Studies Program, University of Cenderawasih. [Interview conducted on March 28, 2016].
Jornal of Social and Development Sciences (JSDS) Vol. 7, No. 2, June 2016 (ISSN 2221-1152)
79
Organics Olympiad 2016: Global Indices of Leadership in Organic Agriculture
John Paull
School of Land and Food, University of Tasmania, Hobart, Australia [email protected]
Abstract: Organic production (including agriculture, wild culture, forestry and aquaculture) is a worldwide phenomenon that is practiced in at least 172 countries. The Organics Olympiad presents 14 indices of global organics leadership, each at three levels (Gold, Silver and Bronze). The Organics Olympiad of 2016 yields 29 countries as global organics leaders, and confirms that organics leadership is diversely distributed across countries, large and small, rich and poor, developed and less so, and cuts across linguistic, ethnic and cultural boundaries. Australia continues to lead the world in organic agriculture hectares. Australia also leads in the increase of organic hectares over the past four years (since the Organics Olympiad 2012) and in the number of WWOOF (Willing Workers on Organic Farms) hosts. Finlandleads in organic wild culture hectares. Vietnam leads in organic aquaculture hectares, and Tunisia leads in organic forest hectares. Germany leads in biodynamic hectares, as well as with the number of members of IFOAM-Organics International. India leads for the number of organic producers. The Falkland Islands (Malvinas) leads in terms of the percentage agricultural land dedicated as organic. Switzerland leads with the value of organics consumption per capita. USA leads in the value of the organics market. Denmark leads in the publishing of organics research papers over the past four years. Namibia leads in the percentage increase in organic hectares over the past four years. The overall global organics leaders, on the basis of aggregated scores, are Australia, Germany, and Switzerland, in positions one, two and three, respectively. This study demonstrates the successful global diffusion of organics, and identifies that leadership lessons can be available from a broad diversity of countries. Key implications are identified. Keywords: Organic farming, organic wild culture, organic forestry, organic aquaculture, biodynamic agriculture, worldwide statistics, FiBL, IFOAM, Organics International, Demeter, WWOOF
1. Introduction The great retreat of global organic agriculture, from its historical position of global dominance, dates from 1909 with the development of the Haber Bosch method of making industrial quantities of synthetic fertilizer (Smil, 2001). This retreat was then reinforced by the rapid development of the chemical industry in the twentieth century, and the impetus given by two world wars in creating toxic chemicals for warfare and then ‘successfully’ repurposing chemicals for agriculture. Rudolf Steiner made the call in 1924 for an agriculture differentiated from the prevailing march of chemical agriculture, and his call led to the development of biodynamic agriculture (Paull, 2011a; Pfeiffer, 1938; Steiner, 1924). Lord North bourne hosted a conference on his farm in Kent in 1939 (Paull, 2011b) and, in the following year, published his manifesto of what he dubbed ‘organic farming’ and in which he framed a contest of ‘organic versus chemical farming’ (Northbourne, 1940; Paull, 2014). These were major milestones in the quest to restore organic agricultural practices to mainstream agriculture. Despite nine decades of activism, organic agriculture is reported as just 0.99% of world agriculture (Willer & Lernoud, 2016). In the view of these pioneers of organic agriculture, the mission of the organics movement is to restore organic agriculture as the global dominant agriculture. Steiner urged his followers to win converts by demonstrating the superior outcomes of organic over chemical agriculture (Steiner, 1924). Northbourne was under no illusions as to the magnitude of the task, just how long it might take, and with no guarantee of success: “It is a task for generations of concentrated effort, slow and laborious, needing all available skill and resources ... A combination of cooperation and individual effort ... And those engaged will be fighting a rearguard action for many decades, perhaps for centuries” (Northbourne, 1940, p.115). Organic production excludes the use of synthetic fertilizers and pesticides, genetically modified organisms (GMOs), nanotechnology, and food irradiation. Consumers purchase organic food for reasons of health, environment and animal welfare (ACNielsen, 2005). A French study reported that organic food was more nutrient-dense, that 94-100% of organic food samples were pesticide-free, that those samples testing positive for residues
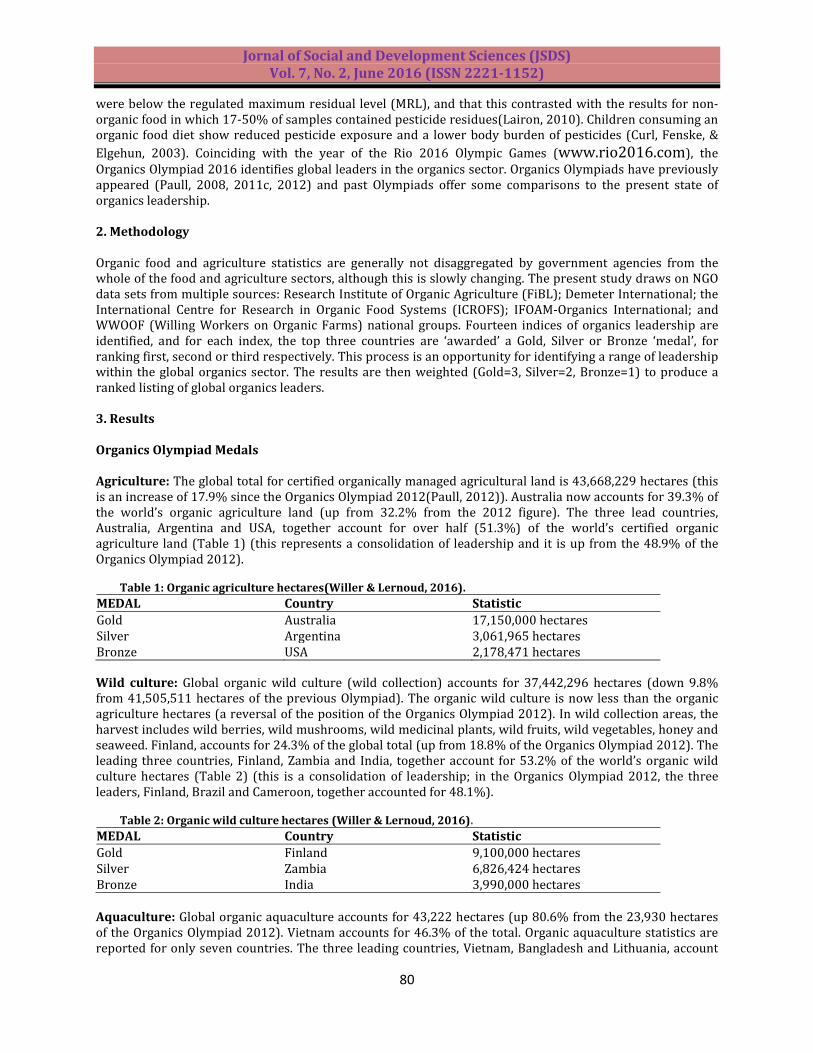
Jornal of Social and Development Sciences (JSDS) Vol. 7, No. 2, June 2016 (ISSN 2221-1152)
80
were below the regulated maximum residual level (MRL), and that this contrasted with the results for non-organic food in which 17-50% of samples contained pesticide residues(Lairon, 2010). Children consuming an organic food diet show reduced pesticide exposure and a lower body burden of pesticides (Curl, Fenske, &
Elgehun, 2003). Coinciding with the year of the Rio 2016 Olympic Games (www.rio2016.com), the Organics Olympiad 2016 identifies global leaders in the organics sector. Organics Olympiads have previously appeared (Paull, 2008, 2011c, 2012) and past Olympiads offer some comparisons to the present state of organics leadership. 2. Methodology Organic food and agriculture statistics are generally not disaggregated by government agencies from the whole of the food and agriculture sectors, although this is slowly changing. The present study draws on NGO data sets from multiple sources: Research Institute of Organic Agriculture (FiBL); Demeter International; the International Centre for Research in Organic Food Systems (ICROFS); IFOAM-Organics International; and WWOOF (Willing Workers on Organic Farms) national groups. Fourteen indices of organics leadership are identified, and for each index, the top three countries are ‘awarded’ a Gold, Silver or Bronze ‘medal’, for ranking first, second or third respectively. This process is an opportunity for identifying a range of leadership within the global organics sector. The results are then weighted (Gold=3, Silver=2, Bronze=1) to produce a ranked listing of global organics leaders. 3. Results Organics Olympiad Medals Agriculture: The global total for certified organically managed agricultural land is 43,668,229 hectares (this is an increase of 17.9% since the Organics Olympiad 2012(Paull, 2012)). Australia now accounts for 39.3% of the world’s organic agriculture land (up from 32.2% from the 2012 figure). The three lead countries, Australia, Argentina and USA, together account for over half (51.3%) of the world’s certified organic agriculture land (Table 1) (this represents a consolidation of leadership and it is up from the 48.9% of the Organics Olympiad 2012).
Table 1: Organic agriculture hectares(Willer & Lernoud, 2016).
MEDAL Country Statistic
Gold Australia 17,150,000 hectares Silver Argentina 3,061,965 hectares Bronze USA 2,178,471 hectares
Wild culture: Global organic wild culture (wild collection) accounts for 37,442,296 hectares (down 9.8% from 41,505,511 hectares of the previous Olympiad). The organic wild culture is now less than the organic agriculture hectares (a reversal of the position of the Organics Olympiad 2012). In wild collection areas, the harvest includes wild berries, wild mushrooms, wild medicinal plants, wild fruits, wild vegetables, honey and seaweed. Finland, accounts for 24.3% of the global total (up from 18.8% of the Organics Olympiad 2012). The leading three countries, Finland, Zambia and India, together account for 53.2% of the world’s organic wild culture hectares (Table 2) (this is a consolidation of leadership; in the Organics Olympiad 2012, the three leaders, Finland, Brazil and Cameroon, together accounted for 48.1%).
Table 2: Organic wild culture hectares (Willer & Lernoud, 2016).
MEDAL Country Statistic
Gold Finland 9,100,000 hectares Silver Zambia 6,826,424 hectares Bronze India 3,990,000 hectares
Aquaculture: Global organic aquaculture accounts for 43,222 hectares (up 80.6% from the 23,930 hectares of the Organics Olympiad 2012). Vietnam accounts for 46.3% of the total. Organic aquaculture statistics are reported for only seven countries. The three leading countries, Vietnam, Bangladesh and Lithuania, account
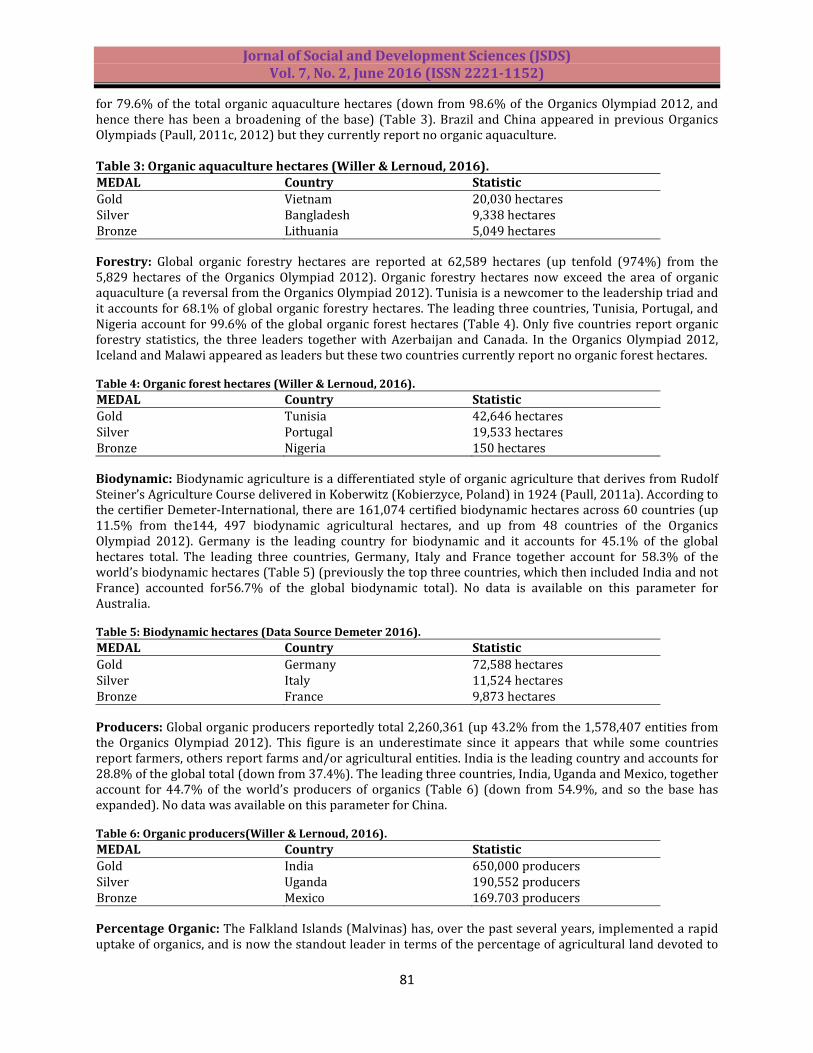
Jornal of Social and Development Sciences (JSDS) Vol. 7, No. 2, June 2016 (ISSN 2221-1152)
81
for 79.6% of the total organic aquaculture hectares (down from 98.6% of the Organics Olympiad 2012, and hence there has been a broadening of the base) (Table 3). Brazil and China appeared in previous Organics Olympiads (Paull, 2011c, 2012) but they currently report no organic aquaculture. Table 3: Organic aquaculture hectares (Willer & Lernoud, 2016). MEDAL Country Statistic
Gold Vietnam 20,030 hectares Silver Bangladesh 9,338 hectares Bronze Lithuania 5,049 hectares
Forestry: Global organic forestry hectares are reported at 62,589 hectares (up tenfold (974%) from the 5,829 hectares of the Organics Olympiad 2012). Organic forestry hectares now exceed the area of organic aquaculture (a reversal from the Organics Olympiad 2012). Tunisia is a newcomer to the leadership triad and it accounts for 68.1% of global organic forestry hectares. The leading three countries, Tunisia, Portugal, and Nigeria account for 99.6% of the global organic forest hectares (Table 4). Only five countries report organic forestry statistics, the three leaders together with Azerbaijan and Canada. In the Organics Olympiad 2012, Iceland and Malawi appeared as leaders but these two countries currently report no organic forest hectares.
Table 4: Organic forest hectares (Willer & Lernoud, 2016).
MEDAL Country Statistic
Gold Tunisia 42,646 hectares Silver Portugal 19,533 hectares Bronze Nigeria 150 hectares
Biodynamic: Biodynamic agriculture is a differentiated style of organic agriculture that derives from Rudolf Steiner’s Agriculture Course delivered in Koberwitz (Kobierzyce, Poland) in 1924 (Paull, 2011a). According to the certifier Demeter-International, there are 161,074 certified biodynamic hectares across 60 countries (up 11.5% from the144, 497 biodynamic agricultural hectares, and up from 48 countries of the Organics Olympiad 2012). Germany is the leading country for biodynamic and it accounts for 45.1% of the global hectares total. The leading three countries, Germany, Italy and France together account for 58.3% of the world’s biodynamic hectares (Table 5) (previously the top three countries, which then included India and not France) accounted for56.7% of the global biodynamic total). No data is available on this parameter for Australia.
Table 5: Biodynamic hectares (Data Source Demeter 2016).
MEDAL Country Statistic
Gold Germany 72,588 hectares Silver Italy 11,524 hectares Bronze France 9,873 hectares
Producers: Global organic producers reportedly total 2,260,361 (up 43.2% from the 1,578,407 entities from the Organics Olympiad 2012). This figure is an underestimate since it appears that while some countries report farmers, others report farms and/or agricultural entities. India is the leading country and accounts for 28.8% of the global total (down from 37.4%). The leading three countries, India, Uganda and Mexico, together account for 44.7% of the world’s producers of organics (Table 6) (down from 54.9%, and so the base has expanded). No data was available on this parameter for China.
Table 6: Organic producers(Willer & Lernoud, 2016).
MEDAL Country Statistic
Gold India 650,000 producers Silver Uganda 190,552 producers Bronze Mexico 169.703 producers
Percentage Organic: The Falkland Islands (Malvinas) has, over the past several years, implemented a rapid uptake of organics, and is now the standout leader in terms of the percentage of agricultural land devoted to

Jornal of Social and Development Sciences (JSDS) Vol. 7, No. 2, June 2016 (ISSN 2221-1152)
82
organic, with their organics share of agricultural land accounting for 36.3% (up from 35.9% from the Organics Olympiad 2012). Liechtenstein follows with 30.9% of its agricultural land as organic (up from 27.3%), and is followed by Austria with 19.4% (down from 19.7% of the Organics Olympiad 2012) (Table 7). Australia, by comparison rates 4.2% on this index (up from 2.9%), and the global figure is reported as 0.99% (up from 0.85% (Willer & Lernoud, 2016).
Table 7: Organic share of agricultural land (Willer & Lernoud, 2016).
MEDAL Country Statistic
Gold Falkland Islands (Malvinas) 36.3% Silver Liechtenstein 30.9% Bronze Austria 19.4%
Market: Global sales of organic food and beverages are estimated at US$80 billion, €60.4 billion (up from US$59.1 billion, €44.5 billion, of the Organics Olympiad 2012). The three leading countries, USA, Germany and France, account for 66% of the global market (Table 8).
Table 8: Organic market (Willer & Lernoud, 2016).
MEDAL Country Statistic
Gold USA €27.1b (US$35.9b) Silver Germany €7.9b (US$10.5b) Bronze France €4.8b (US$6.8b)
Per Capita Consumption: European countries lead in the per capita consumption of organics with Switzerland in position one (previously Denmark) with an annual spend of €221 per capita, followed by Luxembourg and Denmark (Table 9).
Table 9: Organic per capita consumption(Willer & Lernoud, 2016).
MEDAL Country Statistic
Gold Switzerland €221 Silver Luxembourg €164 Bronze Denmark €162
Membership: IFOAM-Organics International (formerly the International Federation of Organic Agriculture Movements) was founded in France in 1972 by five associations, advocates or organics or biodynamic (Paull, 2010). It is based in Bonn, Germany, and is the peak international organization for the certified organics sector, with 787 affiliated organizations as members from 119 countries (down from 804 affiliates, and up from 111 countries). The membership includes organic certifiers, and research and other organizations participating in the organics sector. Germany leads with a membership of 64, followed by China, and the India (Table 10). If the Hong Kong affiliates (N=7) are aggregated with the China affiliates (N=57) this would put China and Germany on a par with 64 affiliates each.
Table 10: Membership of IFOAM(IFOAM-Organics International, 2016).
MEDAL Country Statistic
Gold Germany 64 affiliates Silver China 57 affiliates Bronze India 41 affiliates
Hectares Increase: There has been a global total increase of 6,627,225 hectares of certified organic agriculture land since the Organics Olympiad 2012. Australia accounts for 77.7% of the four-year increase, China accounts for 8.1% of the increase, and Uruguay accounts for 5.7% of the four-year increase (Table 11). These three countries together account for 91.4% of the global increase in organic agriculture hectares reported over the past four years.
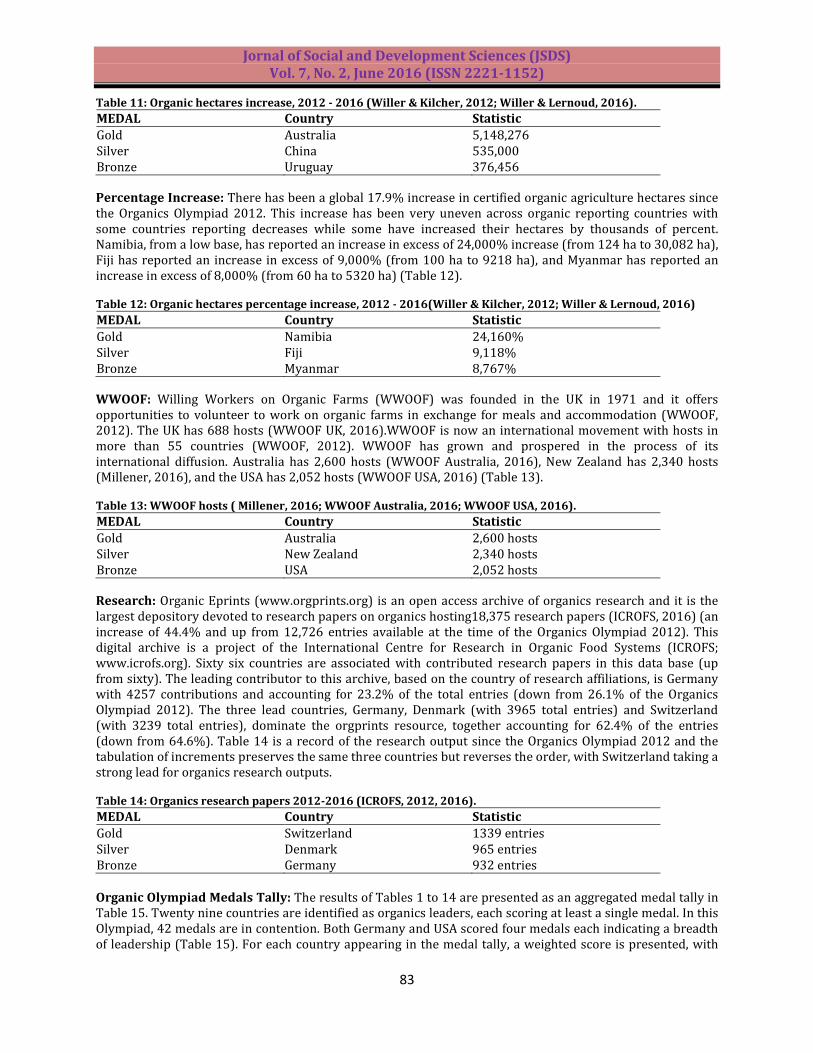
Jornal of Social and Development Sciences (JSDS) Vol. 7, No. 2, June 2016 (ISSN 2221-1152)
83
Table 11: Organic hectares increase, 2012 - 2016 (Willer & Kilcher, 2012; Willer & Lernoud, 2016).
MEDAL Country Statistic
Gold Australia 5,148,276 Silver China 535,000 Bronze Uruguay 376,456
Percentage Increase: There has been a global 17.9% increase in certified organic agriculture hectares since the Organics Olympiad 2012. This increase has been very uneven across organic reporting countries with some countries reporting decreases while some have increased their hectares by thousands of percent. Namibia, from a low base, has reported an increase in excess of 24,000% increase (from 124 ha to 30,082 ha), Fiji has reported an increase in excess of 9,000% (from 100 ha to 9218 ha), and Myanmar has reported an increase in excess of 8,000% (from 60 ha to 5320 ha) (Table 12). Table 12: Organic hectares percentage increase, 2012 - 2016(Willer & Kilcher, 2012; Willer & Lernoud, 2016)
MEDAL Country Statistic
Gold Namibia 24,160% Silver Fiji 9,118% Bronze Myanmar 8,767%
WWOOF: Willing Workers on Organic Farms (WWOOF) was founded in the UK in 1971 and it offers opportunities to volunteer to work on organic farms in exchange for meals and accommodation (WWOOF, 2012). The UK has 688 hosts (WWOOF UK, 2016).WWOOF is now an international movement with hosts in more than 55 countries (WWOOF, 2012). WWOOF has grown and prospered in the process of its international diffusion. Australia has 2,600 hosts (WWOOF Australia, 2016), New Zealand has 2,340 hosts (Millener, 2016), and the USA has 2,052 hosts (WWOOF USA, 2016) (Table 13). Table 13: WWOOF hosts ( Millener, 2016; WWOOF Australia, 2016; WWOOF USA, 2016).
MEDAL Country Statistic
Gold Australia 2,600 hosts Silver New Zealand 2,340 hosts Bronze USA 2,052 hosts
Research: Organic Eprints (www.orgprints.org) is an open access archive of organics research and it is the largest depository devoted to research papers on organics hosting18,375 research papers (ICROFS, 2016) (an increase of 44.4% and up from 12,726 entries available at the time of the Organics Olympiad 2012). This digital archive is a project of the International Centre for Research in Organic Food Systems (ICROFS; www.icrofs.org). Sixty six countries are associated with contributed research papers in this data base (up from sixty). The leading contributor to this archive, based on the country of research affiliations, is Germany with 4257 contributions and accounting for 23.2% of the total entries (down from 26.1% of the Organics Olympiad 2012). The three lead countries, Germany, Denmark (with 3965 total entries) and Switzerland (with 3239 total entries), dominate the orgprints resource, together accounting for 62.4% of the entries (down from 64.6%). Table 14 is a record of the research output since the Organics Olympiad 2012 and the tabulation of increments preserves the same three countries but reverses the order, with Switzerland taking a strong lead for organics research outputs.
Table 14: Organics research papers 2012-2016 (ICROFS, 2012, 2016).
MEDAL Country Statistic
Gold Switzerland 1339 entries Silver Denmark 965 entries Bronze Germany 932 entries
Organic Olympiad Medals Tally: The results of Tables 1 to 14 are presented as an aggregated medal tally in Table 15. Twenty nine countries are identified as organics leaders, each scoring at least a single medal. In this Olympiad, 42 medals are in contention. Both Germany and USA scored four medals each indicating a breadth of leadership (Table 15). For each country appearing in the medal tally, a weighted score is presented, with
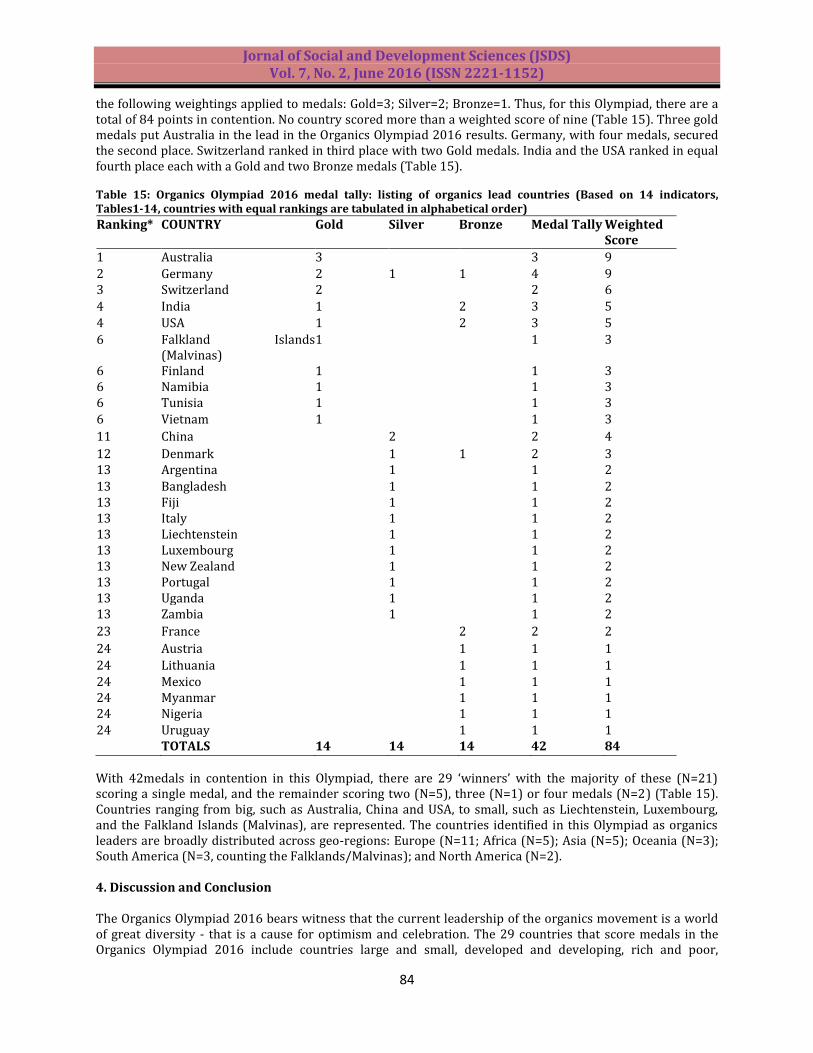
Jornal of Social and Development Sciences (JSDS) Vol. 7, No. 2, June 2016 (ISSN 2221-1152)
84
the following weightings applied to medals: Gold=3; Silver=2; Bronze=1. Thus, for this Olympiad, there are a total of 84 points in contention. No country scored more than a weighted score of nine (Table 15). Three gold medals put Australia in the lead in the Organics Olympiad 2016 results. Germany, with four medals, secured the second place. Switzerland ranked in third place with two Gold medals. India and the USA ranked in equal fourth place each with a Gold and two Bronze medals (Table 15).
Table 15: Organics Olympiad 2016 medal tally: listing of organics lead countries (Based on 14 indicators, Tables1-14, countries with equal rankings are tabulated in alphabetical order)
Ranking* COUNTRY Gold Silver Bronze Medal Tally Weighted Score
1 Australia 3 3 9
2 Germany 2 1 1 4 9 3 Switzerland 2 2 6
4 India 1 2 3 5
4 USA 1 2 3 5
6 Falkland Islands (Malvinas)
1 1 3
6 Finland 1 1 3 6 Namibia 1 1 3 6 Tunisia 1 1 3 6 Vietnam 1 1 3
11 China 2 2 4
12 Denmark 1 1 2 3 13 Argentina 1 1 2
13 Bangladesh 1 1 2 13 Fiji 1 1 2 13 Italy 1 1 2 13 Liechtenstein 1 1 2 13 Luxembourg 1 1 2 13 New Zealand 1 1 2 13 Portugal 1 1 2 13 Uganda 1 1 2 13 Zambia 1 1 2
23 France 2 2 2
24 Austria 1 1 1
24 Lithuania 1 1 1 24 Mexico 1 1 1 24 Myanmar 1 1 1 24 Nigeria 1 1 1 24 Uruguay 1 1 1 TOTALS 14 14 14 42 84
With 42medals in contention in this Olympiad, there are 29 ‘winners’ with the majority of these (N=21) scoring a single medal, and the remainder scoring two (N=5), three (N=1) or four medals (N=2) (Table 15). Countries ranging from big, such as Australia, China and USA, to small, such as Liechtenstein, Luxembourg, and the Falkland Islands (Malvinas), are represented. The countries identified in this Olympiad as organics leaders are broadly distributed across geo-regions: Europe (N=11; Africa (N=5); Asia (N=5); Oceania (N=3); South America (N=3, counting the Falklands/Malvinas); and North America (N=2). 4. Discussion and Conclusion The Organics Olympiad 2016 bears witness that the current leadership of the organics movement is a world of great diversity - that is a cause for optimism and celebration. The 29 countries that score medals in the Organics Olympiad 2016 include countries large and small, developed and developing, rich and poor,
Jornal of Social and Development Sciences (JSDS) Vol. 7, No. 2, June 2016 (ISSN 2221-1152)
85
geographically, ethnically and linguistically diverse, with countries from Oceania, Africa, Asia, Eastern and Western Europe, and North and South America. The 29 leaders identified in the Organics Olympiad 2016 are exemplars worthy of emulation as they each exhibit success in the uptake of organic practices. The statistics used, with the exception of the WWOOF and ICROFS statistics (Figs 13&14) are limited to certified organic. As such they are underestimates - there are numerous organic enterprises that are not certified (for example farms described in: Fawcett, 2016; Hudson, 2016; McLeod, 2016; & Odhong et al., 2015)and they are as a consequence, not recorded in certified organics statistics. So, while the achievements of the organic agriculture movement are somewhat modest, reported as 0.99% of world agricultural land, they are nevertheless not as modest as the statistics of the organics sector suggest. The earliest pioneers of organic agriculture (e.g. Northbourne, 1940; Pfeiffer, 1938; Steiner, 1924) had visions unconstrained by the paradigm of certification, which came long after their advocacy. It may be that certified organics is the tip of an organics iceberg (in which naked organics, i.e. organics without certification), may exceed, and perhaps greatly exceed, certified organics). In any event, the world of certified organics is certainly the tip of the organics potential, which is the 99% of global agriculture which is not certified organic, and which is (probably) mostly chemical agriculture. The diversity of the leadership in the Organics Olympiad 2016 bodes well in the global march for the uptake of organic agriculture. The Indian state of Sikkim is reportedly now 100% organic (Oberst, 2016; Seetharaman, 2016). The Indian states of Kerala, Mizoram, and Arunachal Pradesh are aiming to achieve 100% organic status (Oberst, 2016; Vijayan, 2007). Bhutan has also set the bar high aiming to become 100% organic (Paull, 2013). France has set a goal to be 20% organic by 2020 (Lichfield, 2007).The Soil Association has proposed the goal for the UK of “Organic by 2050”(Soil Association, 2009). Russia has a stated the intention of becoming a world leader in organic food (Case, 2015).The Atlas of Organics presents visual displays of the successful global diffusion of organics (Paull & Hennig, 2016). The path from goals to achievements may be facilitated by learning from the experiences of the organics leaders of this and previous Organics Olympiads. Key implications of the Organics Olympiad 2016 are that:
(a) the organics sector exhibits great diversity in leadership; (b) there are multiple exemplars of organics leadership for states aspiring to advance their organics sector; (c) since the previous Organics Olympiad published in the Journal of Social and Development Sciences (JSDS)
(Paull, 2011c), some leaders have entrenched their leadership, for example, Australia (Table 1), has increased its organic agriculture hectares by 43% while in the same period the global organic agriculture hectares have increased by 17%;
(d) some leaders have reasserted their leadership, for example, the Falkland Islands (Malvinas) retain their leadership for organic share of agricultural land (Table 7) - with a modest increase from 35.7% to 36.3% since the previous JSDS account;
(e) some leaders have newly appeared since the previous JSDS account, for example, Zambia has surged to position two for organic wild culture (Table 2), while Tunisia has streaked ahead to position one for organic forestry (Table 4) - neither ranked in the previous JSDS Olympiad;
(f) there is some volatility in the organics sector, for example, China was previously the leader in organic aquaculture, but has disappeared in the present Olympiad (Table 3);
(g) as statistics become available, the non-certified organics sector (i.e. naked organics) can broaden out the view of organics leadership - in the present Olympiad, WWOOF statistics are included (at Table 13);
(h) with organic agriculture accounting for just 0.99% of global agriculture, the Olympiad underscores the great opportunities that there are for the expansion of the organics sector;
(i) stated goals may facilitate progress in the organics sector - with various publicly declared goals, India continues to exhibit leadership with the number of producers (Table 6), while , apparently without any publicly stated goals, Australia maintains its leadership (Table 1).
Jornal of Social and Development Sciences (JSDS) Vol. 7, No. 2, June 2016 (ISSN 2221-1152)
86
References ACNielsen (2005). Consumer attitudes towards organic foods, A global consumer survey. New York:
ACNielsen. Case, P. (2015). Putin wants Russia to become world leader in organic food. Farmers Weekly, 4, 1-2;
www.fwi.co.uk. Curl, C. L., Fenske, R. A. & Elgehun, K. (2003). Organophosphorus pesticide exposure of urban and suburban
preschool children with organic and conventional diets. Environmental Health Perspectives, 111(3), 377-382.
Fawcett, T. (2016). The new black. Weekly Times Farm, 128, 19-25. Hudson, S. (2016). Growing in style. Weekly Times Farm, 128, 27-31. ICROFS. (2012). Research Affiliation: Country/Organization/Project. Foulum, Denmark: International Centre
for Research in Organic Food Systems (ICROFS). Retrieved 12 July 2012, from http://orgprints.org ICROFS. (2016). Research Affiliation: Country/Organization/Project. Foulum, Denmark: International Centre
for Research in Organic Food Systems (ICROFS). Retrieved 10 May 2016, from http://orgprints.org IFOAM-Organics International. (2016). The Organic Movement Worldwide Membership E-Directory 2016.
Bonn: IFOAM-Organics International. Lairon, D. (2010). Nutritional quality and safety of organic food. A review. Agronomy for Sustainable
Development, 30(1), 33-41. Lichfield, J. (2007). France goes green with organic farming pledge. The Independent, 26 October. McLeod, P. (2016). Just their cup of tea. Tasweekend, 19-20 March, 19. Millener, K. (2016). Personal communication. email, 10 May, WWOOF New Zealand. Northbourne, L. (1940). Look to the Land. London: Dent. Oberst, L. (2016). Why India's first 100% organic state matters for the future of organic food. The Food
Revolution Network, 19 February, www.foodrevolution.org. Odhong, C., Wahome, R., Vaarst, M., Kiggundu, M., Nalubwama, S., Halberg, N. & Githigia, S. (2015). Dairy cattle
management, health and welfare in smallholder farms: An organic farming perspective. Journal of Organics, 2(1), 3-20.
Paull, J. (2008). Organics Olympiad 2007 - Perspectives on the Global State of Organic Agriculture. Acres Australia, 16(1), 36-38.
Paull, J. (2010). From France to the World: The International Federation of Organic Agriculture Movements (IFOAM). Journal of Social Research & Policy, 1(2), 93-102.
Paull, J. (2011a). Attending the first organic agriculture course: Rudolf Steiner’s Agriculture Course at Koberwitz, 1924. European Journal of Social Sciences, 21(1), 64-70.
Paull, J. (2011b). The Betteshanger Summer School: Missing link between biodynamic agriculture and organic farming. Journal of Organic Systems, 6(2), 13-26.
Paull, J. (2011c). Organics Olympiad 2011: Global Indices of Leadership in Organic Agriculture. Journal of Social and Development Sciences, 1(4), 144-150.
Paull, J. (2012). Organics Olympiad 2012: Global Indices of Leadership in Organic Agriculture. Organic News, 26 July, 2 August, 9 August.
Paull, J. (2013). Bhutan's plans to go 100% organic make progress. Organic News, 26 February, 1-2. Paull, J. (2014). Lord Northbourne, the man who invented organic farming, a biography. Journal of Organic
Systems, 9(1), 31-53. Paull, J. & Hennig, B. (2016). Atlas of Organics: Four maps of the world of organic agriculture. Journal of
Organics, 3(1), 25-32. Pfeiffer, E. (1938). Bio-Dynamic Farming and Gardening: Soil Fertility Renewal and Preservation (F. Heckel,
Trans.). New York: Anthroposophic Press. Seetharaman, G. (2016). How Sikkim could offer lessons to other states in organic farming. The Economic
Times, 7 February, www.economictimes.indiatimes.com. Smil, V. (2001). Enriching the Earth: Fritz Haber, Carl Bosch, and the Transformation of World Food
Production. Cambridge, USA: The MIT Press. Soil Association. (2009). Organic by 2050 (press release ed.). Bristol: Soil Association. Steiner, R. (1924). Agriculture Course ("Printed for private circulation only"; 1929, first English language
edition; George Kaufmann Trans ed.). Dornach, Switzerland: Goetheanum. Vijayan, V. S. (2007). Kerala State Organic Farming Policy, Strategy and Action Plan. Thiruvananthapuram:
Jornal of Social and Development Sciences (JSDS) Vol. 7, No. 2, June 2016 (ISSN 2221-1152)
87
Kerala State Biodiversity Board. Willer, H. & Kilcher, L. (Eds.). (2012). The World of Organic Agriculture: Statistics and Emerging Trends 2012:
Bonn: International Federation of Organic Agriculture Movements (IFOAM); Frick, Switzerland: Research Institute of Organic Agriculture (FiBL).
Willer, H., & Lernoud, J. (Eds.). (2016). The World of Organic Agriculture: Statistics and Emerging Trends 2016: Frick, Switzerland: Research Institute of Organic Agriculture (FiBL) & Bonn: IFOAM-Organics International.
WWOOF. (2012). Current WWOOF Groups: WWOOF (wwoof.net). WWOOF Australia. (2016). Welcome to the wonderful world of WWOOF! NSW: WWOOF Australia
(wwoof.com.au). WWOOF UK. (2016). World Wide Opportunities on Organic Farms. Buckingham: WWOOF. WWOOF USA. (2016). Our Farms: WWOOF USA (wwoofusa.org).

Jornal of Social and Development Sciences (JSDS) Vol. 7, No. 2, June 2016 (ISSN 2221-1152)
88
The Impact of Inclusive Education on Learners with Disabilities in High Schools of Harare, Zimbabwe
Tinashe Chuchu1*, Vimbai Chuchu2
1University of the Witwatersrand, South Africa 2Womens’ University in Africa, Zimbabwe
*[email protected] Abstract: The problem of low inclusive education is essential to research as it highlights the importance of equal opportunity to all students regardless of mental or physical ability. The study was conducted within a Zimbabwean high school context. The purpose of the study was to conduct an empirical investigation into the impact of inclusive education and therefore establish the extent to which it has benefited students with disabilities in four high schools in the Harare province. Furthermore, study’s intention was to therefore propose a theoretical framework that could be used to address low success in inclusive education. The methodology was qualitative in nature and interviews were used to collect research data. Quota sampling was adopted in selection of suitable respondents. It was observed that a lack of financial and human resources, as well as effective policies had contributed to the low impact of inclusive education in high schools in Harare, Zimbabwe. In conclusion the results also revealed that inclusive education in high schools in Harare had not made much of an impact due to negative perceptions and attitudes of the people that are pivotal to its success. Keywords: Inclusive, education, disability, high schools
1. Introduction Inclusive education has received much attention globally and is viewed as a major challenge for educational systems across the world (Florian & Linklater, 2010; Srivastava, de Boer & Pijl, 2015; Baldiris-Navarro, Zervas, Fabregat-Gesa & Sampson, 2016). The current research aims to review relevant literature that explores inclusive education with special focus on learners with disabilities whilst identifying trends in literature. It has been noted in past literature (Ainscow, 2005) that inclusion is a major challenge that educational systems the world over experience. Ainscow (2005)goes on further to state that the main problem to successful inclusive strategies in education require a change in the existing way of thinking which has been detrimental to progress in inclusiveness in schools. The present study makes an extension to Ainscow (2005) by proposing a framework that would help in altering existing perceptions towards inclusive education and provide a new way of viewing inclusive education in schools. Motivation and purpose of the study: The present study is motivated by the need to understand how inclusive education has been implemented in Harare highs and whether it has been beneficial to the learners with disabilities themselves. The study aims to ascertain the impact that the advent of inclusive education has on learners with disabilities in high schools. It is therefore imperative to establish if there is inclusion after all in those schools. If so is the impact negative or positive? In ascertaining the impact the institutions and communities may be able to improve on. The study is of significance and relevance to a large number of entities, some of these include the following: academia, school authorities, learners, researchers and government as all these players are central to the success of inclusive education in schools. The remainder of this paper will comprise of the review of relevant literature, methodology, results and discussion, conclusion, recommendations, acknowledgements and lastly a list of references. Inclusive education is a global phenomenon that arose as a response to the exclusion of students who were viewed as different in terms of colour, socioeconomic background or being disabled (Waitoller & Artiles, 2013).Inclusive education also seeks to ensure that learners with varied needs and preferences (such as learners with disabilities) are provided equal opportunities in accessing learning resources, services and experiences (Florian & Linklater, 2010; Baldiris-Navarro et al., 2016). Waitoller & Artiles (2013) assert that a serious imperative for the development of inclusive school systems is the capacity to nurture and develop teachers who have the comprehension, skills, critical sensibilities, and contextual awareness to provide quality educational access, participation and outcomes for all learners. Furthermore Waitoller & Artiles
Jornal of Social and Development Sciences (JSDS) Vol. 7, No. 2, June 2016 (ISSN 2221-1152)
89
(2013) state that research on teacher learning for inclusive education emphasises what researchers view as a measure of change in the process of becoming inclusive teachers and schools. Disabilities are broken down into several categories namely: learning disabilities, mental challenges, visual impairments, hearing impairment, speech and language disorders, physical and motor disabilities, emotional and behavioural disorders and lastly health related disorders, as cited by (Chimonyo, Kaputa, Mamvura, Hlatywayo, Munemo & Nyatsanza, 2011). The international community has considered the education of students with special needs to be of great importance ever since the 1994 United Nations Salamanca statement and framework for action on special needs education (Arrah & Swain, 2014). According to Arrah & Swain (2014) students with special needs have not received education in general education settings historically. The main aim and goal for this article is to review relevant literature on inclusive education focusing on leaners with disability as well as exploring trends in the field of study. Inclusive and child-conducive education should therefore be seen as an approach to school development as it is about making quality education available to all (Harris, Miske & Attig, 2004). According to Harris et al. (2004) the majority of children with disabilities in developing countries are not enrolled in school. This finding is shared by Ainscow (2005) who states that most of the children from less economically developed countries never get a chance to even see the inside of a classroom. Inclusive education, considered as a practice of providing all learners with equal educational opportunities, is a major challenge for many educational systems worldwide. Baldiris-Navarro et al. (2016) posit that in order to address this issue, a broadly used framework known as the Universal Design for Learning (UDL) can be adopted to provide specific educational design guidelines that ensure accessibility of all learner types to the learning environment. Persons with disabilities were conventionally perceived as dependent individuals who evoke sympathy, if not pity and require societal security and support to compensate for their inabilities (Hendricks, 2007). As such, they were predominantly viewed as objects of care instead of legal subjects entitled to dignity and the full privilege of human rights (Hendricks, 2007). The following section outlines some key aspects of the present paper which are as follows: the gap in research, problem statement, research questions, objectives and the justification of the study. The section will also highlight what is known about research in the area of inclusive education and what needs to be known therefore leading to the research problem. Gap in research: Inclusive education as a research area has received at great deal of attention from researchers such as (Ainscow, 2005; Mittler, 2012).Research conducted by (Ainscow, 2005) explored inclusive education in the context of different economic classes while (Mittler, 2012) researched inclusive education very broadly in that there was discussion many aspects of inclusive education such as human rights, disabilities and parents’ role in the student’s education. The two authors (Ainscow, 2005; Mittler, 2012) had contradicting views were by (Ainscow, 2005) stated it was imperative for change in existing thought towards inclusive education however (Mittler, 2012) argues that a change was not necessary. Both authors (Ainscow, 2005; Mittler, 2012) investigated inclusive education at great depth but did not cover much on how learners’ with disability in particular were affected by inclusive education policies more specifically in high school settings. This research therefore identifies a gap of trying to incorporate both opposing views the and mainly focusing on the disability aspect of inclusive education. Problem Statement: Despite the advent of inclusive education learners with disabilities still face attitudinal, structural and physical barriers in accessing quality education. The research question that the present study seeks to address concerns establishing the extent to which inclusive education has made an impact in high schools of Harare, Zimbabwe? Objectives of the study are to assess how disabilities and inclusion are perceived by teachers and heads of the schools as well as to establish if learners with disabilities have benefit from inclusive educational practices. 2. Literature Review Baker (2000) considers reviewing current literature relevant to a research topic to be an essential first step and foundation for undertaking the research project. Therefore review of literature plays a crucial role in the current research. In the sections to follow efforts will be directed towards exploring the findings of other studies conducted by various scholars in the same field.
Jornal of Social and Development Sciences (JSDS) Vol. 7, No. 2, June 2016 (ISSN 2221-1152)
90
Theoretical Grounding: Particular attention will be paid to the following theories: the concept of inclusion, self-efficacy theory and the philosophy of normalisation. The concept of Inclusion: The concept of inclusion was deemed necessary for the present study as this study is grounded on inclusiveness. Salend (2001:5) defines inclusion as an attempt to "establish collaborative, supportive, and nurturing communities of learners that are based on giving all students the services and accommodations they need to learn, as well as respecting and learning from each other's individual differences."Mittler (2012) states that concept of inclusion involves a radical re-think of practise and policy thereby introducing a fundamentally new perception of the origins of learning and behavioural difficulties. Prior literature has supported inclusive education (Jobe, Rust & Brissie, 1996 and Malian & Love, 1998) who established that inclusive programs have a more positive impact on providing academic support to students with mild disabilities when compared to segregated settings. However the concept of inclusion has been criticised as well in past literature (Mastropieri & Scruggs, 2000; Salend, 2001) suggesting that inclusion has been associated with inadequate training of general education teachers to work with students with disabilities. Self-efficacy theory: The self-efficacy theory was also considered to be of relevance to the study at hand as it was used in an attempt to understand learners with disabilities. The Self-efficacy concept, according to theorist Bandura (1997), can be defined as a belief in one's ability to succeed in specific situations. An individual’s sense of self-efficacy can be an influential factor in how the person approaches goals, tasks, and challenges as their confidence in their own ability to behave in a way that allows control of the events which influence their life. Self-efficacy belief represents the basis of human agency. If trust in succeeding in something is little, therefore the weaker is the stimulus to do something (Bandura, 1997). Self-efficacy is a part of the self-concept and develops in the process of individualization. Understanding the process of individualization and formation of self-concept enables one to recognize the process of development of stress resistance as a component of the self-concept. The development of self-efficacy is closely connected to the process of socialisation and it interacts with it more essentially than other aspects of the arising personality. People gain a conviction of their self-efficacy from experience, social modelling, social persuasion in efficacy and reduction of stress or depression according to (Bandura, 1997). Philosophy of normalisation: The concept of normalisation refers to optimising conditions for normal living and including persons with disabilities (Meyer, 2003). According to Meyer (2003) the concept of normalisation was given a systematic and theoretical description by (Nirje, 1969).Normalisation can also be described as a sociological theory of the implementation, embedding and integration of new technologies and organisational innovation according to (May, Mair, Dowrick & Finch, 2007).This theory explains that when people are segregated labelled or treated in any way that is different, then their worth is devalued, as purported by (Winant, 1997). This theory becomes paramount to the current study as it aids the comprehension of including others in society. Perceptions on Disability and Inclusion: Hanson, Horn, Sandall, Beckman, Morgan, Marquart & Chou (2001)carried out a research to determine parent’s perspective of their children’s school experiences .This was in order to identify those factors that influenced inclusive placement decisions. Most of the parents valued inclusive placement, concerns about class size, availability of therapeutic services, acceptance by other children, attitudes about the child’ s disability , as well as teachers’ level of training and experience were expressed. The parent’s views’ along with those of teachers and therapists were also garnered to examine the environmental influences of children’s social experiences in school (Baker & Donnelly 2001). Even though only one of the four children with Fragile X syndrome attended a fully inclusive class, the authors (Baker & Donnelly 2001) stress the importance of the school environment for influencing the quality of social experiences, specifically, its physical environment, other children, executive staff, professionals and policy. The issues noted from these studies describe barriers to inclusive education and emphasises the value of parental reports for assessing and evaluating inclusive school environments and practices. Views of Learners with Disabilities: Ronen, Rosenbaum & Streiner (1999) asset that students are fully capable of identifying, expressing accessibility concerns therefore should be allowed opportunity to
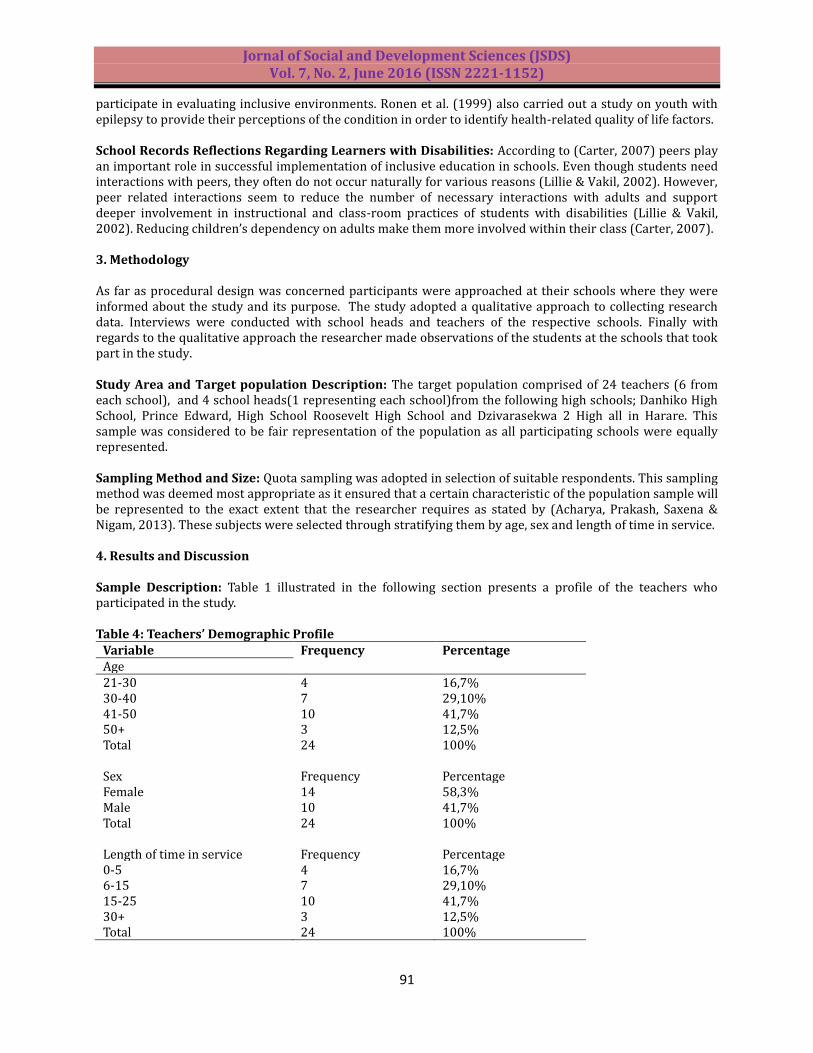
Jornal of Social and Development Sciences (JSDS) Vol. 7, No. 2, June 2016 (ISSN 2221-1152)
91
participate in evaluating inclusive environments. Ronen et al. (1999) also carried out a study on youth with epilepsy to provide their perceptions of the condition in order to identify health-related quality of life factors. School Records Reflections Regarding Learners with Disabilities: According to (Carter, 2007) peers play an important role in successful implementation of inclusive education in schools. Even though students need interactions with peers, they often do not occur naturally for various reasons (Lillie & Vakil, 2002). However, peer related interactions seem to reduce the number of necessary interactions with adults and support deeper involvement in instructional and class-room practices of students with disabilities (Lillie & Vakil, 2002). Reducing children’s dependency on adults make them more involved within their class (Carter, 2007). 3. Methodology As far as procedural design was concerned participants were approached at their schools where they were informed about the study and its purpose. The study adopted a qualitative approach to collecting research data. Interviews were conducted with school heads and teachers of the respective schools. Finally with regards to the qualitative approach the researcher made observations of the students at the schools that took part in the study. Study Area and Target population Description: The target population comprised of 24 teachers (6 from each school), and 4 school heads(1 representing each school)from the following high schools; Danhiko High School, Prince Edward, High School Roosevelt High School and Dzivarasekwa 2 High all in Harare. This sample was considered to be fair representation of the population as all participating schools were equally represented. Sampling Method and Size: Quota sampling was adopted in selection of suitable respondents. This sampling method was deemed most appropriate as it ensured that a certain characteristic of the population sample will be represented to the exact extent that the researcher requires as stated by (Acharya, Prakash, Saxena & Nigam, 2013). These subjects were selected through stratifying them by age, sex and length of time in service. 4. Results and Discussion Sample Description: Table 1 illustrated in the following section presents a profile of the teachers who participated in the study. Table 4: Teachers’ Demographic Profile
Variable Frequency Percentage Age 21-30 30-40 41-50 50+
4 7 10 3
16,7% 29,10% 41,7% 12,5%
Total 24 100% Sex Frequency Percentage Female Male
14 10
58,3% 41,7%
Total 24 100% Length of time in service Frequency Percentage 0-5 6-15 15-25 30+
4 7 10 3
16,7% 29,10% 41,7% 12,5%
Total 24 100%
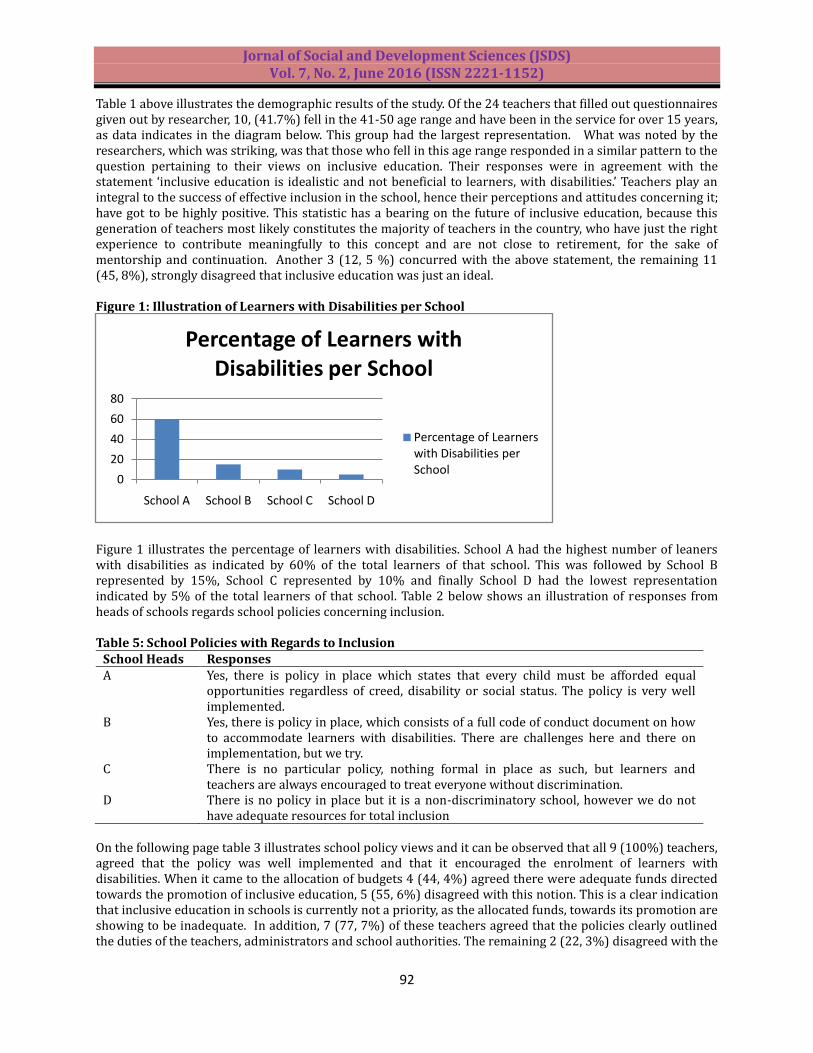
Jornal of Social and Development Sciences (JSDS) Vol. 7, No. 2, June 2016 (ISSN 2221-1152)
92
Table 1 above illustrates the demographic results of the study. Of the 24 teachers that filled out questionnaires given out by researcher, 10, (41.7%) fell in the 41-50 age range and have been in the service for over 15 years, as data indicates in the diagram below. This group had the largest representation. What was noted by the researchers, which was striking, was that those who fell in this age range responded in a similar pattern to the question pertaining to their views on inclusive education. Their responses were in agreement with the statement ‘inclusive education is idealistic and not beneficial to learners, with disabilities.’ Teachers play an integral to the success of effective inclusion in the school, hence their perceptions and attitudes concerning it; have got to be highly positive. This statistic has a bearing on the future of inclusive education, because this generation of teachers most likely constitutes the majority of teachers in the country, who have just the right experience to contribute meaningfully to this concept and are not close to retirement, for the sake of mentorship and continuation. Another 3 (12, 5 %) concurred with the above statement, the remaining 11 (45, 8%), strongly disagreed that inclusive education was just an ideal. Figure 1: Illustration of Learners with Disabilities per School
Figure 1 illustrates the percentage of learners with disabilities. School A had the highest number of leaners with disabilities as indicated by 60% of the total learners of that school. This was followed by School B represented by 15%, School C represented by 10% and finally School D had the lowest representation indicated by 5% of the total learners of that school. Table 2 below shows an illustration of responses from heads of schools regards school policies concerning inclusion. Table 5: School Policies with Regards to Inclusion
School Heads Responses A Yes, there is policy in place which states that every child must be afforded equal
opportunities regardless of creed, disability or social status. The policy is very well implemented.
B Yes, there is policy in place, which consists of a full code of conduct document on how to accommodate learners with disabilities. There are challenges here and there on implementation, but we try.
C There is no particular policy, nothing formal in place as such, but learners and teachers are always encouraged to treat everyone without discrimination.
D There is no policy in place but it is a non-discriminatory school, however we do not have adequate resources for total inclusion
On the following page table 3 illustrates school policy views and it can be observed that all 9 (100%) teachers, agreed that the policy was well implemented and that it encouraged the enrolment of learners with disabilities. When it came to the allocation of budgets 4 (44, 4%) agreed there were adequate funds directed towards the promotion of inclusive education, 5 (55, 6%) disagreed with this notion. This is a clear indication that inclusive education in schools is currently not a priority, as the allocated funds, towards its promotion are showing to be inadequate. In addition, 7 (77, 7%) of these teachers agreed that the policies clearly outlined the duties of the teachers, administrators and school authorities. The remaining 2 (22, 3%) disagreed with the
0
20
40
60
80
School A School B School C School D
Percentage of Learners with Disabilities per School
Percentage of Learners with Disabilities per School
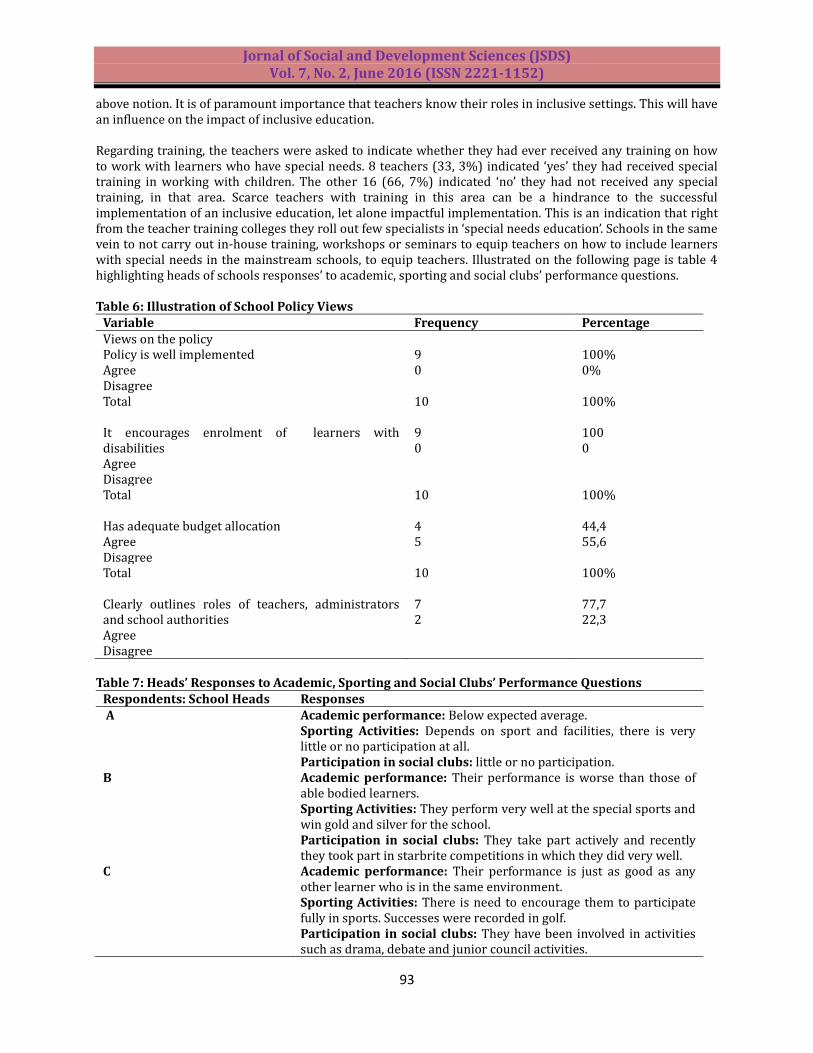
Jornal of Social and Development Sciences (JSDS) Vol. 7, No. 2, June 2016 (ISSN 2221-1152)
93
above notion. It is of paramount importance that teachers know their roles in inclusive settings. This will have an influence on the impact of inclusive education. Regarding training, the teachers were asked to indicate whether they had ever received any training on how to work with learners who have special needs. 8 teachers (33, 3%) indicated ‘yes’ they had received special training in working with children. The other 16 (66, 7%) indicated ‘no’ they had not received any special training, in that area. Scarce teachers with training in this area can be a hindrance to the successful implementation of an inclusive education, let alone impactful implementation. This is an indication that right from the teacher training colleges they roll out few specialists in ‘special needs education’. Schools in the same vein to not carry out in-house training, workshops or seminars to equip teachers on how to include learners with special needs in the mainstream schools, to equip teachers. Illustrated on the following page is table 4 highlighting heads of schools responses’ to academic, sporting and social clubs’ performance questions. Table 6: Illustration of School Policy Views
Variable Frequency Percentage Views on the policy Policy is well implemented Agree Disagree
9 0
100% 0%
Total 10 100% It encourages enrolment of learners with disabilities Agree Disagree
9 0
100 0
Total 10 100% Has adequate budget allocation Agree Disagree
4 5
44,4 55,6
Total 10 100% Clearly outlines roles of teachers, administrators and school authorities Agree Disagree
7 2
77,7 22,3
Table 7: Heads’ Responses to Academic, Sporting and Social Clubs’ Performance Questions
Respondents: School Heads Responses A Academic performance: Below expected average.
Sporting Activities: Depends on sport and facilities, there is very little or no participation at all. Participation in social clubs: little or no participation.
B Academic performance: Their performance is worse than those of able bodied learners. Sporting Activities: They perform very well at the special sports and win gold and silver for the school. Participation in social clubs: They take part actively and recently they took part in starbrite competitions in which they did very well.
C Academic performance: Their performance is just as good as any other learner who is in the same environment. Sporting Activities: There is need to encourage them to participate fully in sports. Successes were recorded in golf. Participation in social clubs: They have been involved in activities such as drama, debate and junior council activities.
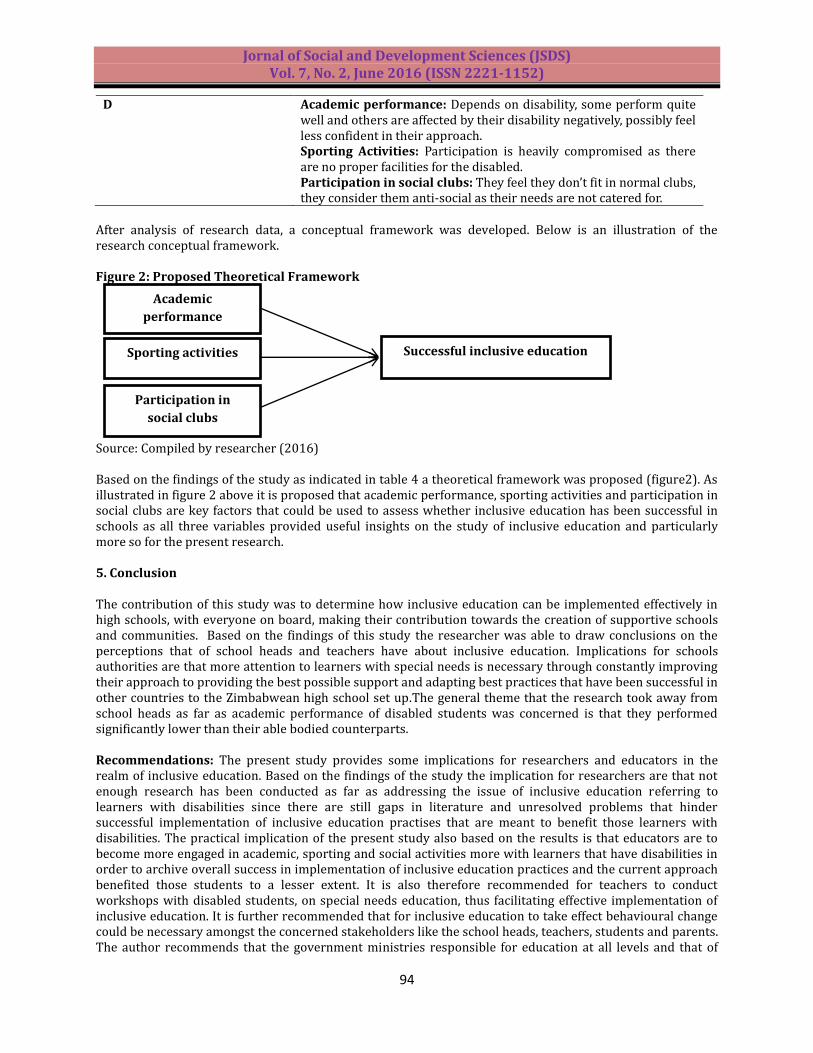
Jornal of Social and Development Sciences (JSDS) Vol. 7, No. 2, June 2016 (ISSN 2221-1152)
94
D
Academic performance: Depends on disability, some perform quite well and others are affected by their disability negatively, possibly feel less confident in their approach. Sporting Activities: Participation is heavily compromised as there are no proper facilities for the disabled. Participation in social clubs: They feel they don’t fit in normal clubs, they consider them anti-social as their needs are not catered for.
After analysis of research data, a conceptual framework was developed. Below is an illustration of the research conceptual framework. Figure 2: Proposed Theoretical Framework Source: Compiled by researcher (2016) Based on the findings of the study as indicated in table 4 a theoretical framework was proposed (figure2). As illustrated in figure 2 above it is proposed that academic performance, sporting activities and participation in social clubs are key factors that could be used to assess whether inclusive education has been successful in schools as all three variables provided useful insights on the study of inclusive education and particularly more so for the present research. 5. Conclusion The contribution of this study was to determine how inclusive education can be implemented effectively in high schools, with everyone on board, making their contribution towards the creation of supportive schools and communities. Based on the findings of this study the researcher was able to draw conclusions on the perceptions that of school heads and teachers have about inclusive education. Implications for schools authorities are that more attention to learners with special needs is necessary through constantly improving their approach to providing the best possible support and adapting best practices that have been successful in other countries to the Zimbabwean high school set up.The general theme that the research took away from school heads as far as academic performance of disabled students was concerned is that they performed significantly lower than their able bodied counterparts. Recommendations: The present study provides some implications for researchers and educators in the realm of inclusive education. Based on the findings of the study the implication for researchers are that not enough research has been conducted as far as addressing the issue of inclusive education referring to learners with disabilities since there are still gaps in literature and unresolved problems that hinder successful implementation of inclusive education practises that are meant to benefit those learners with disabilities. The practical implication of the present study also based on the results is that educators are to become more engaged in academic, sporting and social activities more with learners that have disabilities in order to archive overall success in implementation of inclusive education practices and the current approach benefited those students to a lesser extent. It is also therefore recommended for teachers to conduct workshops with disabled students, on special needs education, thus facilitating effective implementation of inclusive education. It is further recommended that for inclusive education to take effect behavioural change could be necessary amongst the concerned stakeholders like the school heads, teachers, students and parents. The author recommends that the government ministries responsible for education at all levels and that of
Academic
performance
Sporting activities
Participation in
social clubs
Successful inclusive education
Jornal of Social and Development Sciences (JSDS) Vol. 7, No. 2, June 2016 (ISSN 2221-1152)
95
sports, arts and cultures allocate specific funds and other resources towards making schools more inclusive as well as put in place more effective policies that address low success in inclusive education. Other recommendations for future research involve considering the role that can be played by communities were learners with disabilities reside and see if there is a correlation with their social and academic performance at school. Similar research as to the present one can be done using a larger sample from a greater geographic area such as a province or from more than just one city as the approach adopted for the present study could have compromised the findings.Raising awareness on disability issues could be beneficial for schools and communities at large, thus eliminating the element of discrimination and stigma attached to disability. Lastly the researcher recommends that until stakeholder perceptions in schools become more positive and further developments undertaken by responsible authorities to improve the state of schools to ensure policies in place are well implemented inclusive education would not benefit disabled students much. Theoretical Contribution of the Study: Based on finds of the study key themes were observed and these were the lack of appreciation of inclusive education in the high school education system as indicated by inadequate support that students with disabilities received. The study further contributes to literature through establishing that acknowledgement of students’ disability alone is not sufficient as the students remained significantly disadvantaged as compared to their able-bodied counterparts. This promoted an extension to existing literature in the form of a proposed theoretical framework provided in figure 2. The present study however leaves room for potentially interesting future research through conducting an empirical study on how inclusive education is perceived by the students themselves considering that the present study assessed inclusive education from the perspective of the teachers and school heads. Acknowledgements: The author would wish to thank the heads, staff and students of Danhiko High School, Prince Edward High School, Roosevelt High School and Dzivarasekwa 2 High School as well as the Harare School District (that provided access to participants) for participating in the study. References Acharya, A. S., Prakash, A., Saxena, P. & Nigam, A. (2013). Sampling: Why and how of it. Indian Journal of
Medical Specialties, 4(2), 330-333. Ainscow, M. (2005). Developing inclusive education systems: what are the levers for change? Journal of
educational change, 6(2), 109-124. Arrah, R. O. & Swain, K. D. (2014). Teachers' Perceptions of Students with Special Education Needs in
Cameroon Secondary Schools. International Journal of Special Education, 29(3), 101-110. Baker, K. & Donelly, M. (2001). The social experiences of children with disability and the influence of
environment: A framework for intervention. Disability & Society, 16(1), 71-85. Baker, M. J. (2000). Writing a literature review. The Marketing Review, 1(2), 219-247. Baldiris-Navarro, S., Zervas, P., Fabregat-Gesa, R. & Sampson, D. G. (2016). Developing Teachers' Competences
for Designing Inclusive Learning Experiences. Journal of Educational Technology & Society, 19(1), 17-27
Bandura, A. (1997). Self-efficacy: The exercise of control. (1sted) N Y: W H Freeman and Company Carter, E. W. (2007). Including people with disabilities in faith communities: A guide for service providers, families, & congregations. IL. Paul H Brookes Publishing Company.
Chimonyo, I., Kaputa, T. M., Mamvura, E. K., Hlatywayo, L., Munemo, E. T., Nyatsanza, T. D., Mutandwa, E. (2011). Breaking down Barriers to Inclusive Education in Zimbabwe: A teachers Handbook, Zimbabwe Open University, Harare
Florian, L. & Linklater, H. (2010). Preparing teachers for inclusive education: using inclusive pedagogy to enhance teaching and learning for all. Cambridge Journal of Education, 40(4), 369-386
Hanson, M. J., Horn, E., Sandall, S., Beckman, P., Morgan, M., Marquart, J. & Chou, H. Y. (2001). After preschool inclusion: Children's educational pathways over the early school years. Exceptional children, 68(1), 65-83.
Harris, R., Miske, S. & Attig, G. (2004). Embracing Diversity: Toolkit for Creating Inclusive Learning-Friendly Environments. UNESCO Bangkok.
Hendricks, A. (2007). UN Convention on the Rights of Persons with Disabilities. Eur. J. Health L., 14, 273.
Jornal of Social and Development Sciences (JSDS) Vol. 7, No. 2, June 2016 (ISSN 2221-1152)
96
Jobe, D., Rust, J. O. & Brissie, J. (1996).Teachers attitudes toward inclusion of students with disabilities into regular classrooms. Education, 117(1), 148.
Kuen-Fung, S. (2013). The practice and critical issues on inclusive education in Hong Kong. 6th changpa Cangbo. haksulje International, 17-27.
Lillie, T. & Vakil, S. (2002). Transitions in early childhood for students with disabilities: Law and best practice. Early Childhood Education Journal, 30(1), 53-58.
Malian, I. M. & Love, L. L. (1998). Leaving high school: An ongoing transition study. Teaching Exceptional Children, 30(3), 4.
Mastropieri, M. A. & Scruggs, T. E. (2000). The inclusive classroom: Strategies for effective instruction. New Jersey: Merrill.
May, C. R., Mair, F. S., Dowrick, C. F. & Finch, T. L. (2007). Process evaluation for complex interventions in primary care: understanding trials using the normalization process model. BMC Family Practice, 8(1), 1.
Meyer, J. (2003). A non‐institutional society for people with developmental disability in Norway. Journal of Intellectual and Developmental Disability, 28(3), 305-308.
Mittler, P. (2012). Working towards inclusive education: Social contexts. New York. USA. Routledge. Nirje, B. (1969). A Scandinavian visitor looks at US institutions. Changing patterns in residential services for
the mentally retarded, 51(54). Ronen, G. M., Rosenbaum, P., Law, M. & Streiner, D. L. (1999). Health‐related quality of life in childhood
epilepsy: the results of children's participation in identifying the components. Developmental Medicine & Child Neurology, 41(8), 554-559.
Salend, S. J. (2001). Creating inclusive classrooms: Effective and reflective practices New Jersey: Merrill. Srivastava, M., de Boer, A. & Pijl, S. J. (2015). Inclusive education in developing countries: a closer look at its
implementation in the last 10 years. Educational Review, 67(2), 179-195. Waitoller, F. R. & Artiles, A. J. (2013). A decade of professional development research for inclusive education a
critical review and notes for a research program. Review of educational research, 83(3), 319-356. Winant, H. (1997). Where culture meets structure. Race, class, and gender in a diverse society, ed. Diana
Kendall, 27-38.