Salubrinal, an inhibitor of protein synthesis, promotes deep slow wave sleep
25
1 Salubrinal, an inhibitor of protein synthesis, promotes deep slow wave sleep. Melvi M Methippara, 1,2 Tariq Bashir, 1 Sunil Kumar, 1,3,4 Noor Alam 1,2 , Ronald Szymusiak, 1,3 Dennis McGinty *1,2 (1) Research Service (151A3), Veterans Affairs of Greater Los Angeles Healthcare System, North Hills, CA, USA, (2) Department of Psychology, University of California, Los Angeles, CA, USA (3) School of Medicine, University of California, Los Angeles, CA, USA (4) Department of Zoology, Patna University, Bihar, India. Running Head:- Salubrinal and Sleep Contact Information: Dennis McGinty, Ph.D, Research Service (151A3), Bldg7, 16111 Plummer St., North Hills, CA 91343. Email:[email protected]; Ph: (818) 891 7711 x7579. Articles in PresS. Am J Physiol Regul Integr Comp Physiol (October 29, 2008). doi:10.1152/ajpregu.90765.2008 Copyright © 2008 by the American Physiological Society.
Transcript of Salubrinal, an inhibitor of protein synthesis, promotes deep slow wave sleep

1
Salubrinal, an inhibitor of protein synthesis, promotes deep slow wave sleep.
Melvi M Methippara, 1,2 Tariq Bashir,1 Sunil Kumar,1,3,4 Noor Alam1,2, Ronald Szymusiak, 1,3
Dennis McGinty *1,2
(1) Research Service (151A3), Veterans Affairs of Greater Los Angeles Healthcare System,
North Hills, CA, USA, (2) Department of Psychology, University of California, Los
Angeles, CA, USA (3) School of Medicine, University of California, Los Angeles, CA,
USA (4) Department of Zoology, Patna University, Bihar, India.
Running Head:- Salubrinal and Sleep
Contact Information:
Dennis McGinty, Ph.D,
Research Service (151A3), Bldg7,
16111 Plummer St., North Hills, CA 91343.
Email:[email protected]; Ph: (818) 891 7711 x7579.
Articles in PresS. Am J Physiol Regul Integr Comp Physiol (October 29, 2008). doi:10.1152/ajpregu.90765.2008
Copyright © 2008 by the American Physiological Society.
2
Abstract
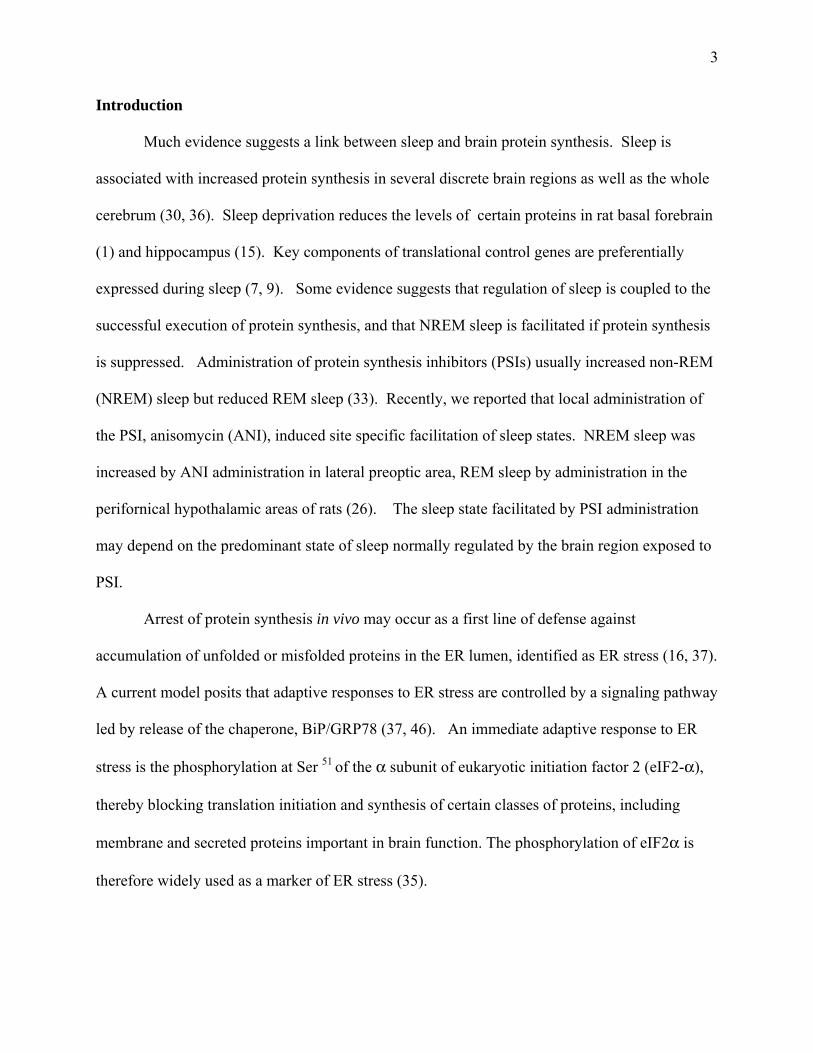
Previous work showed that sleep is associated with increased brain protein synthesis and
that arrest of protein synthesis facilitates sleep. Arrest of protein synthesis is induced during the
endoplasmic reticulum (ER) stress response, through phosphorylation of eukaryotic initiation
factor 2 (p-eIF2α). We tested a hypothesis that elevation of p-eIF2α would facilitate sleep. We
studied the effects of ICV infusion of Salubrinal (SALUB), which increases p-eIF2α by inhibiting
its dephosphorylation. SALUB increased deep slow wave sleep by 255%, while reducing active
waking by 49 %. Delta power within NREM sleep was increased while power in the sigma, beta
and gamma bands during NREM was reduced. We found that SALUB increased expression of p-
eIF2α in the basal forebrain (BF) area, a sleep-wake regulatory brain region. Therefore, we
quantified the p-eIF2α immunolabeled neurons in the BF area; SALUB administration increased
the number of p-eIF2α expressing non- cholinergic neurons in the caudal BF. In addition, SALUB
also increased the intensity of p-eIF2α expression in both cholinergic and non-cholinergic
neurons, but this was more widespread among the non-cholinergic neurons. Our findings support
a hypothesis that sleep is facilitated by signals associated with the ER stress response.
Key words: Sleep, Protein Synthesis Inhibition, ER stress, p-eIF2α, basal forebrain.
3
Introduction
Much evidence suggests a link between sleep and brain protein synthesis. Sleep is
associated with increased protein synthesis in several discrete brain regions as well as the whole
cerebrum (30, 36). Sleep deprivation reduces the levels of certain proteins in rat basal forebrain
(1) and hippocampus (15). Key components of translational control genes are preferentially
expressed during sleep (7, 9). Some evidence suggests that regulation of sleep is coupled to the
successful execution of protein synthesis, and that NREM sleep is facilitated if protein synthesis
is suppressed. Administration of protein synthesis inhibitors (PSIs) usually increased non-REM
(NREM) sleep but reduced REM sleep (33). Recently, we reported that local administration of
the PSI, anisomycin (ANI), induced site specific facilitation of sleep states. NREM sleep was
increased by ANI administration in lateral preoptic area, REM sleep by administration in the
perifornical hypothalamic areas of rats (26). The sleep state facilitated by PSI administration
may depend on the predominant state of sleep normally regulated by the brain region exposed to
PSI.
Arrest of protein synthesis in vivo may occur as a first line of defense against
accumulation of unfolded or misfolded proteins in the ER lumen, identified as ER stress (16, 37).
A current model posits that adaptive responses to ER stress are controlled by a signaling pathway
led by release of the chaperone, BiP/GRP78 (37, 46). An immediate adaptive response to ER
stress is the phosphorylation at Ser 51 of the α subunit of eukaryotic initiation factor 2 (eIF2-α),
thereby blocking translation initiation and synthesis of certain classes of proteins, including
membrane and secreted proteins important in brain function. The phosphorylation of eIF2α is
therefore widely used as a marker of ER stress (35).
4
All components of the UPR were found after 6 hours of sleep deprivation in mouse
neocortex including increases in p-eIF2-α as well as free BiP/GRP78 and phosphorylated PERK
(protein kinase -like endoplasmic reticulum kinase), a key kinase that phosphorylates eIF2-α (29).
Sleep deprivation has also been shown to increase the expression of BiP in Drosophila (28, 39),
white crowned sparrow (20), mice (25, 29, 41) and rats (8, 38, 42).
Based on the findings summarized above, our study was conceived as follows. On one
hand, sleep deprivation elicits the ER stress response; sleep deprivation is followed by
homeostatic facilitation of sleep. On the other hand, sleep state facilitation is coupled to
facilitation of brain protein synthesis. Therefore, we hypothesized that a component of the
molecular pathways of the ER stress response regulating protein synthesis could also play a role
in facilitation of sleep. As induction of p-eIF2a is a key step in the ER stress response, we
hypothesized that elevation of p-eIF2a would facilitate sleep.
This hypothesis was tested by administration of salubrinal (SALUB), a small molecule
which increases p-eIF2α by inhibiting its dephosphorylation (4), see discussion). We
administered SALUB into the lateral ventricle and observed its effects on sleep. Since p-eIF2α
immunolabeling was found to be more intense in the cholinergic basal forebrain (BF) area, a
sleep-wake regulatory brain region, we also quantified the number of p-eIF2α immunolabeled
neurons in the BF area after SALUB administration.
Materials and Methods
Experimental Subjects
Twenty six male Sprague-Dawley rats (250–300 g at the time of surgery, Harlan, IN)
were kept in a 12h L/D cycle and provided with ad libitum access to food and water.
Experiments were conducted in accordance with the National Research Council Guide for the

5
Care and Use of Laboratory Animals. All procedures were approved by the IACUC of the
Veterans Affairs of Greater Los Angeles Healthcare System.
Surgery
Under aseptic conditions and anesthesia induced by intraperitoneal administration of a
cocktail of ketamine + xylazine (80mg + 8 mg/kg), rats were surgically prepared for polygraphic
recording of sleep – wake parameters as previously described (27). Gold plated stainless steel
machine screws with soldered leads were threaded into the parietal and frontal bones for EEG
recording; another screw electrode served as a ground. Insulated stainless steel wires were
inserted into the dorsal neck muscles for EMG recording. All electrodes were soldered to a
standard plug. A 23 G guide cannula with a removable obdurator stylet was stereotaxically
implanted unilaterally 1 mm above lateral ventricle (AP = - 0.80 mm; DV = 3.6 mm; L = 1.4 mm
from bregma) (31). The guide cannula and the plug with the electrodes were affixed on the skull
with dental acrylic. Post-operative care included administration of the analgesic Buprenex (0.02
mg/Kg; i.m., twice daily for 2 days) and the application of a topical antibiotic around the incision
twice daily for three days.
Experimental Procedure
After surgery, animals were housed in individual Plexiglas cages in an electrically
shielded, sound - attenuated, temperature controlled recording chamber (temperature: 23 + 2°C).
Three days before the recordings began (post-operative day 5, POD5), the cannula patency and
localization was assessed by injecting the rats with 500 ng of angiotensin II (ANG II; Sigma, MO)
in pyrogen-free saline i.c.v.; patency was confirmed if ANG II elicited a drinking response in <
1minute (12). On POD 7, the obdurator stylet was removed from the guide cannula and replaced
with a 27 G injector cannula which was fixed in place with the dental acrylic. The injector

6
cannula was connected by a low dead volume Teflon tubing (100 cm, EiCom Corp., Japan) to a
remote pump kept outside the recording chamber, permitting delivery of SALUB or ACSF
without disturbing the rats. The rats were perfused with artificial cerebrospinal fluid (ACSF)
containing (in mM) Na + 145, K+ 2.7, Mg 2+ 1.0, Ca 2+ 1.2, Cl - 1.5 and Na2HPO4 (pH 7.2) for at
least 12 hrs before the studies began.
On POD 8, at least 18 hrs after the insertion of the injector cannula, the lateral ventricle of
the rat was perfused beginning at ZT 12 for either 12 hrs (Exp 1) or 3 hrs (Exp 2) with either 100
µM of salubrinal (SALUB) or artificial cerebrospinal fluid (ACSF) at a flow rate of 20 nM per
minute (pumping speed 0.2 µL/min) by a peristaltic pump. For Exp 1, eight rats were perfused
with both SALUB and ACSF, in counterbalanced order, with an intervening day between the two
treatments. Another set of six rats were perfused for 12 hrs with either 0.5% dimethyl sulfoxide
(DMSO, Sigma, MO) as vehicle control or ACSF on alternate days. Rats received only one
treatment in 24 hrs. For Exp 2, rats were treated for 3hr with either ACSF (n = 6) or SALUB (n =
6) after which they were euthanized for immunohistochemistry.
We used 100 µM of SALUB since this dose was shown to be non- toxic and conferred
maximum cytoprotection (4). SALUB (Calbiochem, La Jolla, CA) was initially dissolved in the
vehicle DMSO to make a 20 mM stock solution which was diluted with ACSF to 100 µM
aliquots; the aliquots were kept at - 20 ° C until use. The final concentration of DMSO was 0.5
%.
Sleep Recording and Perfusion
Recording of the sleep-wake parameters based on the EEG and EMG signals was
performed as previously described (27). Briefly, EEG (band pass filtered at 0.3 -100 Hz), and
EMG (10 - 300 Hz) were digitized at 128 Hz using a 1401 Plus interface and Spike2 software

7
(Cambridge Electronic Design, Cambridge, UK). After completion of the recordings, under deep
pentobarbital anesthesia, rats were transcardially perfused with 50 ml of PBS (pH 7.4) followed
by 300 ml of 4% paraformaldehyde. The brains, after equilibrating in 30% sucrose, were cut into
40 µM thick coronal sections on a freezing microtome. Sections were stained either for Nissl
(cresyl violet) for verifying the implantation sites of the injector cannula (Exp 1) or
immunohistochemically labeled for p- eIF2α and cholineacetyltransferase (ChAT) (Exp 2). Data
were used only from those rats where the position of the injector cannula was histologically
verified within the lateral ventricle and confirmed by drinking response to ANG II (Exp 1: n = 12
(7 rats for SALUB and ACSF and 5 rats for ACSF and DMSO); Exp 2, n = 10; 5 rats each for
SALUB and ACSF). Four rats which did not show the drinking response were eliminated from
the study.
Immunohistochemistry
For immunohistochemistry, free floating sections were treated with an antigen retrieval
protocol which consisted of incubation in 0.5 % sodium dodecyl sulfate (SDS) for 3 mins
followed by 10 mins in preheated (80 °C) 0.01 M sodium citrate buffer at pH 9.0. After rinsing
with TBS and blocking with 3 % goat serum in TBS, sections were incubated in a cocktail of
rabbit polyclonal anti-phospho-eIF2α (1:300, Stressgen, Ann Arbor, MI) and mouse monoclonal
anti-ChAT (1:1200; Chemicon, Temecula, CA) for 2 days at 4 °C. Sections were then washed in
TBS, blocked in goat serum and incubated for 4 hours in a mixture of goat anti-Rabbit Alexa 555
and anti-mouse Alexa 488 (Invitrogen, Carlsbad, CA) at 1:500. Labeled sections were mounted
and cover-slipped with Vectastain (Vector Labs, Burlingame, CA) mounting medium.
Immunohistochemistry was simultaneously performed on alternate sections through the BF from
8
ACSF and SALUB treated rats. Sections from the two groups were treated with aliquots from the
same batch of antibodies.
Cell Counting
Neuronal counting was performed using the Neurolucida computer aided plotting system
(Microbrightfield, VT, USA) by a person blind to the treatments of the animals. Neurons
expressing p-eIF2α were counted in the basal forebrain fields containing cholinergic neurons,
between stereotaxic planes of 0.26 mm and 0.92 mm posterior to bregma (32). Bilateral counts
were separately made for three sections each in defined rostral, medial, and caudal regions of the
BF, yielding a total of six counts for each region. For counting, section outlines were made at 20X
magnification. All cell counts were made at 400X magnification within 3 rectangular grids placed
over the regions containing ChAT-labeled neurons (Fig.2A).
Immunofluorescence Intensity Analysis.
Since SALUB administration was found to induce a graded increase in the p-eIF2α
immunoreactivity in motor neurons (48), we determined the magnitude of p-eIF2α expression by
measuring immunofluorescence intensity. Fluorescence intensity was measured in a randomly
selected subset of neurons used for cell counting, following the method of Togo (43) modified as
follows. A selection box (25 X 25 pixels) was placed under 400X over the cytoplasmic area with
the greatest staining, without overlapping the nucleus. Mean staining intensity within the selection
box (defined as the sum of the gray values of all the pixels in the selection divided by the number
of pixels) was measured using ImageJ (v 1.38). Cholinergic and non-cholinergic neurons were
separately evaluated. In addition to neurons, fluorescence intensity was also measured from the
adjacent background areas. Data are reported as relative fluorescence intensity (ratio of neuronal
fluorescence intensity to intensity of adjacent background). All measurements were made

9
bilaterally in rostral, medial and caudal BF areas, described above. The magnitude of expression
of p-eIF2α in the BF was assessed by comparing the IF intensity of BF to that of cortex and
medial preoptic area, two regions additionally shown to express p-eIF2α immunoreactivity, using
the same methods.
Sleep Data Analysis
Polysomnographic data were scored manually at 10 s intervals into five sleep-wake stages:
active waking (AW), quiet waking (QW), slow-wave sleep 1 (SWS1), slow-wave sleep 2 (SWS2)
and rapid eye movement (REM) sleep, as previously described (27). Sleep-wake data of 12hrs
( ZT12 -ZT24) were averaged in 3 hr blocks. The amounts of each of the five stages as the
percentage of the total recording duration were determined. The number of episodes and mean
episode duration of each of the stages for the first 3 hrs of drug/vehicle perfusion were also
calculated. In addition, REM latency was determined as the time taken for the appearance of the
first REM episode of duration of 10 sec or more after the drug/vehicle reached the animal.
Using SleepSign (Kissei Comtec, Japan), EEG spectral power of wake, NREM and REM
sleep for the first 3hr of recording, divided into first and last 90 minutes, was determined as
follows. EEG data from an ipsilateral pair of fronto-parietal EEG electrodes were digitally low-
pass filtered at 50 Hz. Epochs containing artifacts were excluded, resulting in the rejection of
49% of wake, 7 % of NREM and 18 % of REM sleep epochs. Spectral analyses were conducted
using the fast Fourier transform on 10 sec epochs tapered by Hanning window. The relative EEG
spectral power, as a percentage of the total power, for wake, NREM and REM in the first 3hrs
was calculated for the spectral range from 0.75-50.0 Hz. Averaged spectral data for each of the
three stages was calculated for six frequency bands: - lower delta (0.75 – 2.0 Hz), upper delta
(2.5– 4 Hz), theta (4.5– 8 Hz), sigma (8.5–16Hz), beta (16.5–30 Hz) and gamma (30.5–50 Hz).

10
Changes in spectral power induced by SALUB were calculated as a percentage of power in the
respective frequency bands during the first 3 h of ACSF treatment.
Statistics
All results are expressed as mean + SEM. Differences between the ACSF and SALUB
treatments on the amounts of sleep stages, number and duration of sleep episodes as well as the p-
eIF2α expression in BF neurons were analyzed by two way ANOVA using SigmaStat v 3.0.1.
The two factors used for 2-way ANOVA were: (1) drug (ACSF, DMSO and SALUB) vs sleep
stage (AW,QW,S1,S2 and REM) for the sleep study and (2) drug (ACSF, SALUB) vs BF region
(rostral, medial and caudal) for differences in the percentage of p-eIF2α expression in BF
neurons as well as the p-eIF2α immunofluorescence intensity differences in the BF. One way
ANOVA was used to assess regional differences in the immunofluorescence intensity in cortex,
preoptic and BF areas as well as differences on the EEG spectral power bands after the SALUB
treatment. Whenever ANOVA indicated a significant difference of p < 0.05, multiple
comparisons of different conditions were made by Holm-Sidak post- hoc test.
Results
Sleep-wake Response
Histological analysis of brain sections showed that the injector cannula terminated in the
lateral ventricle. In the first experiment, compared to vehicle, administration of 100 µM of
SALUB for 12 hrs into the lateral ventricle significantly (p < 0.05) reduced active wake while
increasing deep slow wave sleep (SWS2) in the first 3 hrs of perfusion (Fig 1A, B). The amounts
of other sleep - wake stages including REM were unaffected for the same period. During the first
3 hrs of SALUB perfusion, there was a significant increase in the number of episodes of SWS2 (p
< 0.009) and REM (p < 0.05), although the mean duration of episodes was not affected (Fig. 1C).

11
REM latency was not significantly affected. For the remaining 9 hrs of SALUB perfusion ,
amounts of all sleep-wake stages were not significantly altered except in 10 -12 hrs where a
significant (p < 0.05) decrease in AW and an increase in SWS2 was seen. SALUB also induced
differential effects on the EEG power spectrum. During the first 90 minutes of treatment, SALUB
increased the EEG power in the lower delta band by 53% (p < 0.03) while the power was reduced
in the sigma (-30 %; p < 0.05), beta (- 41 %; p < 0.003) and gamma (- 55 %; p < 0.002) bands
(Fig. 1D). Power in the other EEG spectral bands in wake, NREM or REM was not significantly
affected by SALUB. EEG spectral power was not significantly altered during the second 90 min
of SALUB administration (Fig. 1D).
P-eIF2α Expression in Neurons
In the second experiment, compared to vehicle, 3hr of SALUB administration decreased
active waking (28.83% vs 41.16%) while increasing sleep, especially SWS2 (40.27% vs 26.94%).
In the caudal BF, SALUB administration significantly (p < 0.05) increased the percentage of non-
cholinergic neurons expressing p-eIF2α (ACSF: 57 ± 5, SALUB: 75 ± 4) but decreased the
percentage of cholinergic neurons expressing p-eIF2α (ACSF: 43 ± 5, SALUB: 25 ± 4). The
neurons in the rostral and medial BF regions were not significantly affected by the SALUB
treatment (data not shown).
The intensity of p-eIF2α expression was significantly increased in the BF neurons (1.841
± 0.11) compared to neurons of the cortex (1.22 ± 0.03; p < 0.0003) or the medial preoptic area
(1.25 ± 0.07; p < 0.0004) in SALUB treated animals (Fig. 2B). SALUB treatment significantly
increased the intensity of p-eIF2α fluorescent intensity in non-cholinergic neurons in all three
regions (Rostral = p < 0.03; Medial = p < 0.003; Caudal = p < 0.02) and in cholinergic neurons
in rostral (p < 0.05) and medial (p < 0.02) BF. (Fig 2.D, E). Fluorescent intensity of the

12
cholinergic neurons in the caudal BF was not significantly different in SALUB vs ACSF-treated
animals (Fig 2. E).
Discussion
This study found that ICV administration of SALUB increased deep slow wave sleep (S2
in the rat) by 255%, while reducing active waking by 49 %. Delta power within NREM sleep was
increased while power in the sigma, beta and gamma bands during NREM was reduced. SALUB
also increased the number of REM sleep episodes without affecting the latency or amount of
REM. We note that REM sleep is often suppressed if sleep is induced by anesthetics or non-
physiological stimuli. In addition, spindles in NREM corresponding to the sigma band as well as
relative power in the beta and gamma bands are increased by agents such as barbiturate or
picrotoxin (24), in contrast to the effects observed in this study. These observations suggest that
SALUB induces normal physiological sleep and not EEG abnormalities that might be
misclassified as sleep. We found that SALUB increased S2 and decreased AW at both lights OFF
(ZT12) and lights ON (ZT 24), but a possible circadian modulation by SALUB requires
additional experimental analysis.
Because SALUB was perfused into the lateral ventricle, a site of action cannot be
determined. However, we confirmed that SALUB administration increased p-eIF2α expression in
the BF neuronal population. SALUB administration decreased the numbers of cholinergic
neurons exhibiting p-eIF2α expression but increased expression in non- cholinergic neurons of the
caudal BF. Moreover, SALUB increased the intensity of p-eIF2α expression in both cholinergic
and non-cholinergic neurons, but this was more widespread among the non-cholinergic neurons.
The intensity of the SALUB mediated increase in the p-eIF2α expression was greater in the BF
compared to the cortex or the medial preoptic area suggesting that protein synthesis regulatory

13
mechanisms in the BF might be more directly relevant to the sleep regulation. The presence of p-
eIF2α in ACSF treated rats indicates constitutive basal level of expression of p-eIF2α in our
experimental paradigm. SALUB’s action requires the presence of p-eIF2α. We cannot now
identify the kinase phosphorylating eIF2α under control conditions. Our study suggests that this
kinase may play a role in sleep regulation. A strong candidate is PERK, which is upregulated by
mild sleep restriction (see introduction).
Although the role of the BF in sleep-wake control is well-documented, the critical
importance of BF cholinergic neurons in sleep EEG patterns has been challenged (3). Instead,
evidence supports the importance of non-cholinergic BF neurons in generation of slow wave
activity, the widely accepted index of short-term sleep homeostasis (21). This is consistent with
the stereological estimates; non-cholinergic neurons constitute 95 % of the total BF population, of
which 35% are GABAergic (14). We hypothesize that increased p-eIF2α expression in non-
cholinergic wake-promoting BF neurons decreases their excitability, reducing their capacity to
generate behavioral and EEG arousal and, thereby contributes to increased NREM sleep and delta
activity within NREM sleep. Of course, in addition, i.c.v. SALUB may affect sleep-regulatory
cells in other regions, including hypothalamus.
The maintenance of the p-eIF2α in the phosphorylated state by SALUB attenuates the
translation of mRNAs and protein synthesis (4, 10). In this regard, the effects of SALUB are
directly comparable to the effects of a protein synthesis inhibitor. The findings of this study are
consistent with the earlier report of peripheral PSI administration which increased deep sleep (33)
as well as our recent findings (26), see introduction). Our findings together with evidence that
sleep deprivation induces ER stress support a hypothesis that sleep may be induced by signals
associated with an increased demand for brain protein synthesis and accumulation of unfolded

14
proteins. An alternative interpretation, that protein synthesis inhibition more directly facilitates
sleep, is unlikely since brain protein synthesis is elevated during sleep (30, 36).
Some possible molecular pathways by which SALUB may induce sleep are suggested by
previous work. Phosphorylation of eIF2α activates NF-ĸB (11). Induction of NF-ĸB was shown
to facilitate sleep (6, 22), and is expressed particularly in basal forebrain neurons (2) where we
found increased p-eIFα expression after SALUB administration. Paradoxically, phosphorylation
of eIF2α, by decreasing efficiency of recognition of AUG start-codons, induces scanning of
downstream AUG codons, such as that of activating transcription factor 4 (ATF4), which is
rapidly induced by ER stress (17, 44). ATF4 is a repressor of cAMP response element binding
protein (CREB)-mediated gene expression (5). CREB activation facilitates waking in
Drosophila (18) and increasing availability of cAMP increases wakefulness in rats (23). CREB
mutant mice have reduced waking (13). Thus, the induction of NF-ĸB or ATF4 could be a
mechanism linking ER stress to neurophysiological processes regulating sleep, perhaps by
reducing CREB-mediated activation of arousal-promoting neurons. Alternatively, SALUB may
inhibit synthesis of other wake-promoting factors or their precursors (19). Further work is
needed to determine which pathways mediate the sleep-promoting effects of SALUB.
SALUB was discovered in a screen of ~19,000 molecules for protection against
tunicamycin-induced apoptosis in vitro, and was shown to act by specifically blocking
serine/threonine phosphatase-dependent dephosphorylation of eIF2α (4). The central importance
of eIF2α phosphorylation in normal physiology was demonstrated by the finding that the deletion
of the gene coding for a kinase mediating eIF2α phosphorylation (PERK -/- ) results in diabetes
mellitus in mice (47). SALUB was found to protect hippocampal neuronal cultures against
excitotoxic neuronal injury (40) as well as brainstem motor neurons from ER stress induced by

15
long term intermittent hypoxia (48). It is hoped that SALUB may be useful in protecting brain and
other cell types from ER stress-induced injury. This regulatory process may be unusually potent
in brain, since neurons in most brain regions cannot be replaced. On the other hand, it must be
kept in mind that SALUB mediated suppression of protein synthesis is a double-edged sword, and
may also have deleterious effects (10).
Although short-term sleep deprivation induces molecular hallmarks of ER stress (29),
expression of these markers in cerebral cortex in response to chronic sleep loss is relatively less
compared to acute sleep loss (8). This suggests that the sleep deprivation response may elicit ER
stress only transiently. This observation is congruent with our finding that the strongest sleep
promoting effect of SALUB occurred in the initial 3 hrs of administration. The ER stress response
is comprised of processes which serve to diminish the stress. In addition to inhibition of folding
load through inhibition of translation, the response includes mechanisms to increase degradation
of unfolded or misfolded proteins, and increase folding capacity (37). These counter-regulatory
mechanisms may account for the limited duration of SALUB-induced increases in sleep. If our
working model is correct, sleep itself also counteracts ER stress.
The possible role of sleep in the functioning of protein folding machinery has been
previously demonstrated. Drosophila mutants deficient in the heat shock protein Hsp83, a
chaperone assisting in protein folding, show an exaggerated sleep homeostatic response and die
after sleep deprivation, whereas activation of Hsp83 rescued cyc mutant flies from the lethal
effects of sleep deprivation (39). Sleep deprivation up-regulates the expression of BiP, the
chaperone playing a central regulatory role in sensing the UPR, in mice (29, 41) and rats (8).
Experimentally induced changes in the expression of BiP affected the sleep recovery response

16
following sleep deprivation in Drosophila: over-expression of BiP increased the sleep rebound
and its under-expression decreased the rebound (28).
Perspectives and Significance
Our finding of facilitation of sleep after induction of a key element of the ER stress
signaling cascade supports hypotheses that sleep is an additional component of the compensatory
response to ER stress in brain, and is regulated by the ER stress pathway. Since prolongation of
waking has been shown to induce ER stress, the sleep promotion by an ER stress pathway
molecule observed in this study suggests that sleep may help counteract ER stress. SALUB has
been suggested to be used for reprogramming the ER stress pathways by balancing ER-protein
load with cellular-folding capacity, potentially protecting the brain against so-called
conformational diseases resulting from incorrect protein folding (45). If sleep normally
counteracts ER stress, the severe sleep disturbances that are known to accompany conformational
diseases such as Alzheimer’s and Parkinson’s diseases (34), may contribute to the etiology of
these diseases.

17
Acknowledgements:
The authors gratefully acknowledge the excellent technical help of Feng Xu and Keng-Tee Chew.
Grants:
This work was supported by VA Research Service and the NIH grants: MH 075076 and HL
60296.

18
1. Basheer R, Brown R, Ramesh V, Begum S, and McCarley RW. Sleep deprivation-induced protein changes in basal forebrain: Implications for synaptic plasticity. J Neurosci Res 82: 650-658, 2005. 2. Basheer R, Rainnie DG, Porkka-Heiskanen T, Ramesh V, and McCarley RW. Adenosine, prolonged wakefulness, and A1-activated NF-kappaB DNA binding in the basal forebrain of the rat. Neuroscience 104: 731-739, 2001. 3. Blanco-Centurion C, Xu M, Murillo-Rodriguez E, Gerashchenko D, Shiromani AM, Salin-Pascual RJ, Hof PR, and Shiromani PJ. Adenosine and sleep homeostasis in the Basal forebrain. J Neurosci 26: 8092-8100, 2006. 4. Boyce M, Bryant KF, Jousse C, Long K, Harding HP, Scheuner D, Kaufman RJ, Ma D, Coen DM, Ron D, and Yuan J. A selective inhibitor of eIF2alpha dephosphorylation protects cells from ER stress. Science (New York, NY 307: 935-939, 2005. 5. Chen A, Muzzio IA, Malleret G, Bartsch D, Verbitsky M, Pavlidis P, Yonan AL, Vronskaya S, Grody MB, Cepeda I, Gilliam TC, and Kandel ER. Inducible enhancement of memory storage and synaptic plasticity in transgenic mice expressing an inhibitor of ATF4 (CREB-2) and C/EBP proteins. Neuron 39: 655-669, 2003. 6. Chen Z, Gardi J, Kushikata T, Fang J, and Krueger JM. Nuclear factor-kappaB-like activity increases in murine cerebral cortex after sleep deprivation. The American journal of physiology 276: R1812-1818, 1999. 7. Cirelli C. Cellular consequences of sleep deprivation in the brain. Sleep medicine reviews 10: 307-321, 2006. 8. Cirelli C, Faraguna U, and Tononi G. Changes in brain gene expression after long-term sleep deprivation. Journal of neurochemistry 98: 1632-1645, 2006. 9. Cirelli C, Gutierrez CM, and Tononi G. Extensive and divergent effects of sleep and wakefulness on brain gene expression. Neuron 41: 35-43, 2004. 10. Cnop M, Ladriere L, Hekerman P, Ortis F, Cardozo AK, Dogusan Z, Flamez D, Boyce M, Yuan J, and Eizirik DL. Selective inhibition of eukaryotic translation initiation factor 2 alpha dephosphorylation potentiates fatty acid-induced endoplasmic reticulum stress and causes pancreatic beta-cell dysfunction and apoptosis. The Journal of biological chemistry 282: 3989-3997, 2007. 11. Deng J, Lu PD, Zhang Y, Scheuner D, Kaufman RJ, Sonenberg N, Harding HP, and Ron D. Translational repression mediates activation of nuclear factor kappa B by phosphorylated translation initiation factor 2. Molecular and cellular biology 24: 10161-10168, 2004. 12. Epstein AN, Fitzsimons JT, and Rolls BJ. Drinking induced by injection of angiotensin into the rain of the rat. The Journal of physiology 210: 457-474, 1970. 13. Graves LA, Hellman K, Veasey S, Blendy JA, Pack AI, and Abel T. Genetic evidence for a role of CREB in sustained cortical arousal. Journal of neurophysiology 90: 1152-1159, 2003. 14. Gritti I, Henny P, Galloni F, Mainville L, Mariotti M, and Jones BE. Stereological estimates of the basal forebrain cell population in the rat, including neurons containing choline acetyltransferase, glutamic acid decarboxylase or phosphate-activated glutaminase and colocalizing vesicular glutamate transporters. Neuroscience 143: 1051-1064, 2006.

19
15. Guzman-Marin R, Ying Z, Suntsova N, Methippara M, Bashir T, Szymusiak R, Gomez-Pinilla F, and McGinty D. Suppression of hippocampal plasticity-related gene expression by sleep deprivation in rats. The Journal of physiology 575: 807-819, 2006. 16. Harding HP, Calfon M, Urano F, Novoa I, and Ron D. Transcriptional and translational control in the Mammalian unfolded protein response. Annual review of cell and developmental biology 18: 575-599, 2002. 17. Harding HP, Zhang Y, Zeng H, Novoa I, Lu PD, Calfon M, Sadri N, Yun C, Popko B, Paules R, Stojdl DF, Bell JC, Hettmann T, Leiden JM, and Ron D. An integrated stress response regulates amino acid metabolism and resistance to oxidative stress. Molecular cell 11: 619-633, 2003. 18. Hendricks JC, Williams JA, Panckeri K, Kirk D, Tello M, Yin JC, and Sehgal A. A non-circadian role for cAMP signaling and CREB activity in Drosophila rest homeostasis. Nature neuroscience 4: 1108-1115, 2001. 19. Jones BE. Modulation of cortical activation and behavioral arousal by cholinergic and orexinergic systems. Annals of the New York Academy of Sciences 1129: 26-34, 2008. 20. Jones S, Pfister-Genskow M, Benca RM, and Cirelli C. Molecular correlates of sleep and wakefulness in the brain of the white-crowned sparrow. Journal of neurochemistry 105: 46-62, 2008. 21. Kaur S, Junek A, Black MA, and Semba K. Effects of ibotenate and 192IgG-saporin lesions of the nucleus basalis magnocellularis/substantia innominata on spontaneous sleep and wake states and on recovery sleep after sleep deprivation in rats. J Neurosci 28: 491-504, 2008. 22. Kubota T, Kushikata T, Fang J, and Krueger JM. Nuclear factor-kappaB inhibitor peptide inhibits spontaneous and interleukin-1beta-induced sleep. American journal of physiology 279: R404-413, 2000. 23. Lelkes Z, Alfoldi P, Erdos A, and Benedek G. Rolipram, an antidepressant that increases the availability of cAMP, transiently enhances wakefulness in rats. Pharmacology, biochemistry, and behavior 60: 835-839, 1998. 24. Mackenzie L, Pope KJ, and Willoughby JO. Physiological and pathological spindling phenomena have similar regional EEG power distributions. Brain research 1008: 92-106, 2004. 25. Mackiewicz M, Shockley KR, Romer MA, Galante RJ, Zimmerman JE, Naidoo N, Baldwin DA, Jensen ST, Churchill GA, and Pack AI. Macromolecule biosynthesis: a key function of sleep. Physiological genomics 31: 441-457, 2007. 26. Methippara MM, Alam MN, Kumar S, Bashir T, Szymusiak R, and McGinty D. Administration of the protein synthesis inhibitor, anisomycin, has distinct sleep-promoting effects in lateral preoptic and perifornical hypothalamic sites in rats. Neuroscience 151: 1-11, 2008. 27. Methippara MM, Kumar S, Alam MN, Szymusiak R, and McGinty D. Effects on sleep of microdialysis of adenosine A1 and A2a receptor analogs into the lateral preoptic area of rats. American journal of physiology 289: R1715-1723, 2005. 28. Naidoo N, Casiano V, Cater J, Zimmerman J, and Pack AI. A role for the molecular chaperone protein BiP/GRP78 in Drosophila sleep homeostasis. Sleep 30: 557-565, 2007. 29. Naidoo N, Giang W, Galante RJ, and Pack AI. Sleep deprivation induces the unfolded protein response in mouse cerebral cortex. Journal of neurochemistry 92: 1150-1157, 2005. 30. Nakanishi H, Sun Y, Nakamura RK, Mori K, Ito M, Suda S, Namba H, Storch FI, Dang TP, Mendelson W, Mishkin M, Kennedy C, Gillin JC, Smith CB, and Sokoloff L.
20
Positive correlations between cerebral protein synthesis rates and deep sleep in Macaca mulatta. The European journal of neuroscience 9: 271-279, 1997. 31. Paxinos G, and Watson C. The rat brain in stereotaxic coordinates San Diego: Academic Press, 1998. 32. Paxinos G, and Watson C. The Rat Brain: In Stereotaxic Co-ordinates. San Diego, CA: Academic Press, 1998. 33. Pegram V, Hammond D, and Bridgers W. The effects of protein synthesis inhibition on sleep in mice. Behavioral biology 9: 377-382, 1973. 34. Petit D, Gagnon JF, Fantini ML, Ferini-Strambi L, and Montplaisir J. Sleep and quantitative EEG in neurodegenerative disorders. Journal of psychosomatic research 56: 487-496, 2004. 35. Proud CG. eIF2 and the control of cell physiology. Seminars in cell & developmental biology 16: 3-12, 2005. 36. Ramm P, and Smith CT. Rates of cerebral protein synthesis are linked to slow wave sleep in the rat. Physiology & behavior 48: 749-753, 1990. 37. Schroder M, and Kaufman RJ. ER stress and the unfolded protein response. Mutation research 569: 29-63, 2005. 38. Shaw PJ, Cirelli C, Greenspan RJ, and Tononi G. Correlates of sleep and waking in Drosophila melanogaster. Science (New York, NY 287: 1834-1837, 2000. 39. Shaw PJ, Tononi G, Greenspan RJ, and Robinson DF. Stress response genes protect against lethal effects of sleep deprivation in Drosophila. Nature 417: 287-291, 2002. 40. Sokka AL, Putkonen N, Mudo G, Pryazhnikov E, Reijonen S, Khiroug L, Belluardo N, Lindholm D, and Korhonen L. Endoplasmic reticulum stress inhibition protects against excitotoxic neuronal injury in the rat brain. J Neurosci 27: 901-908, 2007. 41. Terao A, Steininger TL, Hyder K, Apte-Deshpande A, Ding J, Rishipathak D, Davis RW, Heller HC, and Kilduff TS. Differential increase in the expression of heat shock protein family members during sleep deprivation and during sleep. Neuroscience 116: 187-200, 2003. 42. Terao A, Wisor JP, Peyron C, Apte-Deshpande A, Wurts SW, Edgar DM, and Kilduff TS. Gene expression in the rat brain during sleep deprivation and recovery sleep: an Affymetrix GeneChip study. Neuroscience 137: 593-605, 2006. 43. Togo T. Long-term potentiation of wound-induced exocytosis and plasma membrane repair is dependent on cAMP-response element-mediated transcription via a protein kinase C- and p38 MAPK-dependent pathway. The Journal of biological chemistry 279: 44996-45003, 2004. 44. Vattem KM, and Wek RC. Reinitiation involving upstream ORFs regulates ATF4 mRNA translation in mammalian cells. Proceedings of the National Academy of Sciences of the United States of America 101: 11269-11274, 2004. 45. Wiseman RL, and Balch WE. A new pharmacology--drugging stressed folding pathways. Trends in molecular medicine 11: 347-350, 2005. 46. Zhang K, and Kaufman RJ. Signaling the unfolded protein response from the endoplasmic reticulum. The Journal of biological chemistry 279: 25935-25938, 2004. 47. Zhang P, McGrath B, Li S, Frank A, Zambito F, Reinert J, Gannon M, Ma K, McNaughton K, and Cavener DR. The PERK eukaryotic initiation factor 2 alpha kinase is required for the development of the skeletal system, postnatal growth, and the function and viability of the pancreas. Molecular and cellular biology 22: 3864-3874, 2002.

21
48. Zhu Y, Fenik P, Zhan G, Sanfillipo-Cohn B, Naidoo N, and Veasey SC. Eif-2a protects brainstem motoneurons in a murine model of sleep apnea. J Neurosci 28: 2168-2178, 2008.

22
Figure Legends
Fig.1. Effects of Salubrinal (SALUB) administration on sleep parameters compared to the ACSF
treatment. (A) Hypnograms and EEG delta power from a representative rat during the first 3hrs of
administration of ACSF (upper panel) and SALUB (lower panel). Note that strongest SALUB
effects were in the first half of the recording. (B) A comparison of effects of 12hrs (ZT12- ZT24)
of ICV administration ACSF, DMSO (vehicle) and SALUB on the different sleep-wake stages.
Data are shown in 3hr blocks. The black horizontal bar at the bottom indicates the duration of
treatment. In the first and last 3hrs of treatment, SALUB increased S2 sleep and reduced active
wake compared to the vehicle DMSO or ACSF. The DMSO induced a non-significant increase in
QW during 4-9 hrs. (C) Effects of SALUB vs ACSF on the number and duration of sleep-wake
episodes in the first 3hrs of treatment. (D) Effects of first 3hrs of SALUB administration on the
spectral power of six EEG frequency bands as percentage difference from the ACSF treatment. A
statistically significant difference of p < 0.05 compared to ACSF and DMSO are indicated by *
and # respectively (Two way ANOVA for B and C and one way ANOVA for D. Both ANOVAs
were followed by Holm-Sidak post hoc test).
Fig.2. Effect of SALUB administration on p-eIF2α expression in basal forebrain neurons.
(A) Grids represented as boxes used for neuronal counting in (a) rostral, (b) medial and (c)
caudal BF. 3V = Third ventricle; AC = anterior commissure; HDB = horizontal diagonal band;
MCPO = magnocellular preoptic nucleus; SI = substantia innominata. (B) Examples of p-eIF2α
expression in response to 3hrs of SALUB administration in cortex (B1), medial preoptic area (B2)
and BF (B3). (C) A comparison of p-eIF2α expression in response to 3hrs of administration of

23
ACSF (C1) vs SALUB (C2). a & b represent the magnified views of the corresponding boxes in
the upper panel. (D) ACSF (D1) vs SALUB (D2) treatment effect on the fluorescence intensity of
p-eIF2α expression in cholinergic and non-cholinergic neurons of the BF. P-eIF2α expression is
indicated by a yellow arrow in cholinergic neuron and by a red arrow in a non-cholinergic neuron.
(E) Regional differences in the fluorescence intensity of p-eIF2α expression after ACSF vs
SALUB treatment in cholinergic and non-cholinergic neurons of the BF. (Two way ANOVA
followed by Holm-Sidak post hoc test. * indicates p < 0.05).