Salinity regulates claudin mRNA and protein expression in the teleost gill
38
Salinity Regulates Claudin mRNA and Protein Expression in the Teleost Gill Christian K. Tipsmark 1,* , David A. Baltzegar 1 , Ozkan Ozden, Brenda J. Grubb, Russell J. Borski Department of Zoology, North Carolina State University, Raleigh, NC 27695-7617 Running headline: Claudin Expression in the Teleost Gill 1 These authors contributed equally to this work. * Correspondence and current address: Christian Kølbæk Tipsmark, Institute of Biology, University of Southern Denmark, Campusvej 55, DK-5230 Odense M. E-mail: [email protected]. Page 1 of 38 Articles in PresS. Am J Physiol Regul Integr Comp Physiol (January 9, 2008). doi:10.1152/ajpregu.00112.2007 Copyright © 2008 by the American Physiological Society.
-
Upload
independent -
Category
Documents
-
view
0 -
download
0
Transcript of Salinity regulates claudin mRNA and protein expression in the teleost gill

Salinity Regulates Claudin mRNA and
Protein Expression in the Teleost Gill
Christian K. Tipsmark1,*, David A. Baltzegar1, Ozkan Ozden, Brenda J. Grubb,
Russell J. Borski
Department of Zoology, North Carolina State University, Raleigh, NC 27695-7617
Running headline: Claudin Expression in the Teleost Gill
1 These authors contributed equally to this work.
* Correspondence and current address: Christian Kølbæk Tipsmark, Institute of Biology,
University of Southern Denmark, Campusvej 55, DK-5230 Odense M. E-mail:
Page 1 of 38Articles in PresS. Am J Physiol Regul Integr Comp Physiol (January 9, 2008). doi:10.1152/ajpregu.00112.2007
Copyright © 2008 by the American Physiological Society.

Abstract
The teleost gill carries out NaCl uptake in fresh water (FW) and NaCl excretion in seawater
(SW). This transformation with salinity requires close regulation of ion transporter capacity and
epithelial permeability. This study investigates the regulation of tight junctional claudins during
salinity acclimation in fish. We identified claudin 3- and claudin 4-like immunoreactive proteins
and examined their expression and that of select ion transporters by Western blot in tilapia
(Oreochromis mossambicus) gill during FW and SW acclimation. Transfer of FW tilapia to SW
increased plasma osmolality, which was corrected after 4 days, coincident with increased gill
Na+,K+-ATPase and Na+,K+,2Cl- cotransporter expression. Gill claudin 3- and claudin 4-like
proteins were reduced with exposure to SW. Transfer to FW increased both claudin-like proteins.
Immunohistochemistry shows that claudin 3-like protein was localized deep in the FW gill
filament, whereas staining was found apically in SW gill. Claudin 4-like proteins are localized
predominantly in the filament outer epithelial layer and staining appears more intense in gill of
FW versus SW fish. Additionally, tilapia claudin 28a and 30 genes were characterized, and
mRNA expression was found to increase during FW acclimation. These studies are the first to
detect putative claudin proteins in teleosts and show their localization and regulation with
salinity in gill epithelium. The data indicate that claudins may be important in permeability
changes associated with salinity acclimation and possibly the formation of deeper tight junctions
in FW gill. This may reduce ion permeability, which is a critical facet of FW osmoregulation.
Key words: osmoregulation; tight junction; tilapia; epithelia.
Page 2 of 38

Introduction
Euryhaline fish possess the remarkable ability to compensate for disturbances in
intracellular ion balance, cell volume, and protein function in the face of fluctuating ambient
salinities (31, 37, 48). One of the key events in osmoregulatory corrections involves fine-tuning
of the ion-transporting apparatus of the gill epithelia. This requires re-arrangement of gill
chloride cells and changes in gill Na+,K+-ATPase, Na+,K+,2Cl- cotransporter and other critical
ion-transport proteins (12, 13). In most euryhaline teleosts a strong up-regulation of gill Na+,K+-
ATPase (16, 31, 37) and Na+,K+,2Cl- cotransporter (32, 41, 47) is associated with seawater (SW)
acclimation while the opposite occurs during freshwater (FW) acclimation (41, 46).
In addition to ion-transporter expression, the transcellular and intercellular permeability of
the gill epithelium also contributes to overall epithelial transport characteristics. It has been
known for a long time that the osmotic permeability of the eel gill decreases drastically during
seawater (SW) acclimation (8, 14). The biochemical basis for changes in water permeability may
entail the robust down-regulation of gill aquaporin mRNA and protein expression that
accompanies SW acclimation in eel (6, 21). While osmotic permeability decreases in SW, the
conductance and short-circuit current is found to be larger in a SW teleost when compared to a
FW fish (8, 27). A simultaneous change in the ultrastructure of tight junctions (TJs) is also seen
(28). Secretion of Na+ is thought to involve a paracellular path confined to thin ‘leaky’ TJs that
occur in SW between mature chloride cells and accessory cells (19, 36) and this may contribute
to the relatively high ionic permeability of the gill of marine versus FW teleosts (17).
Claudins are four-transmembrane domain proteins that comprise a main component of TJ
strands and are directly involved in its barrier function (38, 43). Claudin proteins of adjacent cell
membranes interact with each other (10) to create charge and size selective pores in the
Page 3 of 38

paracellular space (1, 34, 35). Claudin-2 and -4, for instance, have been associated with
paracellular cation permeability (2, 4). Acute regulation of claudins by phosphorylation may play
a role in regulation of the paracellular barrier in mammals (11). Thus, it has been demonstrated
that claudin-3 and -4 are phosphorylated in ovarian cancer cells and that this results in increased
paracellular permeability (7). Most data available however, document hormone and cytokine
regulation of claudin gene expression taking days to appear and in some cases accompanying
paracellular permeability changes (44).
There are at least 24 claudins in the examined mammalian genomes (44) and 56 in the
puffer fish, Fugu rubribes (23). In Fugu, gene duplication has apparently produced 17 genes
closely related to mammalian claudin 3 and 4 (23). Homologs for some of these class V and VI
claudin genes are also present in the distantly related Danio rerio (18), suggesting that the
duplication occurred early in the development of teleosts. Messenger RNA coding the F.
rubribes claudin genes is expressed in a tissue- and developmental-specific manner (23). Recent
studies in the European eel shows claudin 27 mRNA to be upregulated in FW compared with
SW fish (15). Despite the crucial importance of TJ proteins in determining the characteristics of
epithelia and the presence of numerous claudin genes in teleosts, examination of claudin proteins
are lacking in fish or any non-tetrapod. Moreover, outside of claudin 27 in eel nothing is known
about the salinity dependent expression of claudin mRNA in teleosts.
The aim of this study was to investigate the regulation, and hence possible role, gill
claudins might play in the salinity acclimation process of the euryhaline Mozambique tilapia. We
examined gill localization and expression of claudin 3-like and claudin 4-like proteins in
conjunction with branchial Na+,K+-ATPase α-subunit and Na+,K+,2Cl- cotransporter expression
using a combination of immunohistochemistry and dual infrared fluorescence channel western
Page 4 of 38
detection methods during the SW and FW acclimation process. Additionally we cloned the
cDNA sequence of two tilapia claudin genes, claudin 28a and claudin 30, and examined their
expression profiles during both FW and SW challenge to determine if claudin mRNA might be
regulated by salinity in a fashion similar to protein expression.
Materials and Methods
Animals
Two separate series of salinity challenges were performed. For gill protein analyses, male
tilapia (Oreochromis mossambicus; 50-100 g) were maintained at a constant temperature (21-22
°C) and photoperiod (12:12 hours light:dark) in either FW (hardness, 125 mg/L; alkalinity,
200mg/L; pH 8.2-8.3) or full-strength SW (32 ppt; pH 8.2-8.5) for a minimum of 3 weeks prior
to experiments. Fish were fed 2% body weight daily with a pelleted feed (Southern States,
Richmond, VA, USA) except for 24 h prior to sampling during the salinity challenge
experiments.
In a second salinity challenge to measure gill gene expression, male tilapia (50-100 g) were
maintained at a constant temperature (24-25°C) and photoperiod (12:12 hours light:dark) in
either freshwater (FW: hardness, 110 mg/L; alkalinity, 150 mg/L; pH 8.0) or 2/3 seawater (SW,
22.5-25.0 ppt, pH 8.5) with identical feeding regimes to the first salinity challenge.
All experimental procedures were performed in accordance with NIH Guiding Principles
for Care and Use of Laboratory Animals and were approved by the North Carolina State
University Animal Care and Use Committee.
Page 5 of 38

Sampling
Tilapia were transferred directly from FW to SW and from SW to FW and sampled at 0,
24, 96 and 168 hours after transfer. Fish sham-transferred to FW or SW was used as controls. A
similar salinity challenge scheme was used in the second salinity challenge only 2/3 SW was
used instead of full-strength SW.
Fish were anaesthetized in buffered MS-222, blood was drawn from the caudal blood
vessels into a heparinized syringe, kept on ice and plasma was isolated by centrifugation. Before
further sampling, the fish were killed by spinal sectioning and pitting of the brain. For western
analyses one second gill arch was sampled from each fish, placed in chilled SEI buffer (in mM:
300 sucrose, 20 Na2-EDTA, 50 imidazole, pH 7.3) and quickly frozen in liquid nitrogen and
stored at -80 °C. A piece (~ 0.5 g) of muscle was sampled from the caudal region for
determination of water content.
In the second salinity challenge, plasma was collected as above for measures of plasma
osmolality. A 100 mg piece of the second gill arch was removed, dissected from the supporting
cartilage, and stored in chilled, 1 mL aliquots of RNAlater® (Ambion, Austin, TX). Tissue
sections were incubated overnight at 4°C prior to RNA isolation.
Analyses
Plasma osmolality and muscle water content: Plasma osmolality (mOsm/kg) was measured
by vapor pressure osmometry (Wescor, Logan, UT) and muscle water content was measured
gravimetrically after drying at 90 °C for 24 hours.
Western blotting: Gill tissue was homogenized in chilled SEI buffer (in mM: 300 sucrose,
20 Na2-EDTA, 50 imidazole, pH 7.3) with protease inhibitor cocktail (P8340; Sigma Aldrich, St
Page 6 of 38
Louis, MO, USA) using a handheld glass homogenizer. To remove intact cells and larger cell
fragments, the homogenate was centrifuged at 1,000g for 20 min (4 °C). A crude membrane
fraction was isolated from the supernatant by a second centrifugation at 50,000g for 30 min (4
°C). The obtained pellet was re-suspended, and protein content was measured by a micro-assay
based BCA protein assay (Pierce, Rockford, IL). Proteins were resolved by SDS-polyacrylamide
gel electrophoresis. Sample buffer and sample reducing agent (both NuPAGE, Invitrogen, San
Diego, CA; final concentration in the loaded samples in mM: 141 Tris base, 106 Tris HCl, 73
LDS, 0.5 EDTA, 50 1,4-dithiothretiol and: 8% glycerol [v/v], 0.019% serva blue G250 [w/v],
0.006% phenol red [w/v]) were added prior to heating at 80 °C for 10 min. An equal quantity of
membrane protein (10 µg) was loaded in all lanes. Coomassie staining confirmed that lanes were
loaded with similar protein levels. Proteins were separated by gel electrophoresis using 4–12%
bis-tris gels (NuPAGE system, Invitrogen), and MES/SDS-buffer (in mM: 50 2-(N-morpholino)-
ethanesulfonic acid, 50 Tris, 3.5 SDS, 1 Na2-EDTA; with addition of NuPAGE antioxidant) at
200 V (Xcell II SureLock, Invitrogen). Molecular size was estimated by including a prestained
marker (Biorad, Hercules, CA).
Following electrophoresis, the gel was soaked for 30 min in transfer buffer (in mM: 25
Tris, 192 glycin, and 10 % Methanol) and immunoblotted onto nitro-cellulose membranes (0.45
µm; Invitrogen) by submerged-blotting for 1 hr at 30 V (XCell II; Invitrogen). Membranes were
blocked in TBS-T with LI-COR (Lincoln, NE) blocking buffer (1:1) and washed in TBS-T. Blots
were incubated overnight (4 °C) with, Na+,K+-ATPase α-subunit (α5, 1:1000; mouse IgG) ,
Na+,K+,2Cl- cotransporter (T4, 1:1000; mouse IgG), claudin-3 (Z23.JM; Invitrogen; 1:250; rabbit
polyclonal), or claudin-4 antibodies (3E2C1; Invitrogen; 1:500; mouse IgG). Following washing,
membranes were incubated 1 hr with goat anti-mouse and/or goat anti-rabbit secondary
Page 7 of 38

antibodies conjugated to Alexa IRDye 680 or IRDye 800CW (LI-COR). Blotted proteins were
detected and quantified using the Odyssey infrared imaging system (LI-COR). The Claudin 3-
and 4-like proteins were always visualized on the same blots at different wavelengths (claudin-3,
rabbit polyclonal, 680 nm; claudin-4, mouse IgG, 800 nm; e.g. at Fig 1). Band intensity values
were expressed as a relative abundance to that observed in gills from fish at time 0 of the
experiments. The T4 and α5 antibodies were obtained from the Developmental Studies
Hybridoma Bank developed under auspices of the NICHD and maintained by The University of
Iowa, Department of Biological Sciences, Iowa City, IA. They react with conserved regions in
the Na+,K+-ATPase α-subunit (α5; 39) and Na+,K+,2Cl- cotransporter (T4; 26) and have been
used extensively in fish studies (e.g. 22, 32, 41, 45, 47).
The polyclonal claudin-3 antibody and monoclonal claudin 4 antibody were raised against
a 22 amino acid peptide sequence derived from the C-terminal region of mouse claudin 3 and
human claudin 4, respectively. In the F. rubribes genome, the two epitopes show homology (42-
100% over 4-20 amino acids) with the deduced amino acid sequence of several claudin genes
(claudin 3 antibody: Fugu claudin 1, 2, 3a, 3b, 3c, 5a, 14b, 27b, 30a, and 30c; claudin 4 antibody:
Fugu claudin 3a, 3c, 3d, 5a, 8b, 8c, 10b, 19, 20b, 23a, 23b, 27c, 27d, 28a, 28b, 28c, 29a, 29b,
30a, 30c, 30d, and 32a). Several of these are expressed at the mRNA level in the F. rubripes
gill (Fugu claudin 1, 3c, 5a, 8b, 14b, 27b, 28a, 28b, 28c 30a, 30c and 30d; 20). The Atlantic
salmon transcriptome is represented by >400,000 ESTs from a number of diverse tissues and
libraries available at NCBI. We have identified 26 salmon claudin isoforms using this resource,
and 5 are found in gill libraries (data not shown). Four of these are homologous to fugu 27, 28a,
28b and 30 (Genbank Accession No: CK877239, CK878575, DW180135, and DW180053,
respectively). They all belong to class VI claudins that share strong similarity with mammalian
Page 8 of 38

claudins 3 and 4 (23). The presence of class VI claudins in the gill of euryhaline fish has also
been confirmed in recent work on eel, where a claudin 27 homolog was found (15). It is
therefore likely, that the putative claudin 3- and claudin 4-like proteins being detected in this
study belong to the class V/VI claudins, which are expressed in the gill of teleosts, but the
particular fish claudin, whether it be the tilapia claudin 28a and 30 (see results), or some other
class V/VI claudin, cannot be discerned.
Immunohistochemistry: Immunohistochemical detection of claudin-like proteins in gill was
detected according to our previously established protocols used to detect a variety of ion
transporter proteins and enzymes (42). Gill tissue (0.5 cm) were sampled and fixed in fresh,
buffered paraformaldehyde (4 %) for 4 hours. After dehydration, tissues were embedded in
paraffin and sectioned (6 µm). For antigen retrieval, slides were boiled in citrate buffer (10 mM
Sodium Citrate, 0.05 % Tween 20, pH 6.0; 95 °C, 40 min). Endogenous peroxidase activity was
suppressed by treatment with hydrogen peroxide. Subsequently, blocking serum was applied for
1 h at room temperature (Vectastain kit, Vector labs, Burlingame, CA). Sections were incubated
with claudin 3 and claudin 4 antibodies (Ab) at 1:200 dilutions in PBS (in mM: 137 NaCl, 3 KCl,
10 Na2HPO4, 2KH2PO4, pH 7.4) for 16 h at 4oC in a closed and moistened chamber. For negative
controls, duplicate sections were treated with normal serum for the same time and temperature.
In addition, the claudin antibody was pre-absorbed overnight at 4˚C with 200 molar excess of
their respective blocking peptides to show the specificity of the immunostaining. Invitrogen
kindly provided the blocking peptides. After 16 h, diluted biotinylated universal IgG (Vectastain
kit, Vector labs, Burlingame, CA) was applied and slides were incubated for 60 min at room
temperature. Vectastain ABC reagent was then added for 60 min at room temperature. To
visualize the claudin proteins, 3, 3’-diaminobenzidine (DAB, Sigma Labs, St. Louis, MO) was
Page 9 of 38

prepared according to the manufacturer’s instructions and applied to sections for three min. The
DAB reaction was terminated by dipping the slides into water. Sections were counterstained
with hematoxylin.
Gill RNA isolation and cDNA synthesis: Gill tissue total RNA was isolated by TRI
Reagent® (Molecular Research Center, Cincinnati, OH) extraction with RNA quality confirmed
by gel electrophoresis (1% agarose, 0.4 µg/mL EtBr). RNA concentration and purity were
determined by spectrophotometry using a Nanodrop® ND-1000 before and after DNAse
treatment (DNA-free™, Ambion). Abs260/280 values in all samples were 1.8-2.0. One microgram
of DNAse treated total RNA was used in a cDNA synthesis reaction using a High Capacity
cDNA Reverse Transcription kit (Applied Biosystems, Foster City, CA).
Molecular cloning and sequencing: PCR reactions were performed using GoTaq®
polymerase and buffer using 10 mM dNTP mix and 10 µM primer concentrations (Promega,
Madison, WI). Amplicons were cloned into pCR II® TA cloning vector (Invitrogen, Carlsbad,
CA) and transformed into JM109 series competent cells (Promega). Two selected clones from
each amplicon were submitted to the University of Chicago Cancer Research Center for forward
and reverse sequencing with universal primers.
Initial partial coding sequences were obtained by PCR with degenerate primers (Table 1).
The claudin 28a primer pair was designed from a ClustalW multiple sequence alignment of Fugu
claudin 3 homologs (claudin 3a-d, Genbank Accession No: AY55437, AY554378, AY554367,
AY554368) using Vector NTI® sequence software (25). The claudin 30 primer pair was
designed from a ClustalW pair-wise alignment of EST sequences, Lipochromis sp. (DB871129)
and Salmo salar (DW180053). The PCR cycling parameters for claudin 28a were as follows: 1
cycle at 95°C for 2 minutes; 35 cycles at 95°C for 30 seconds, 50°C for 30 seconds, 72°C for 1
Page 10 of 38

minute; and 1 cycle final extension at 72°C for 5 minutes. The claudin 30 amplification
parameters were the same as claudin 28a, with the annealing temperature reduced to 47°C.
Gene specific primers (Table 1) were developed from the partial sequence clones for 5' and
3' RACE-PCR using First Choice® RNA-ligase mediated RACE kit (Ambion), which promotes
the capture of full 5' sequence by enzymatic, 5' monophosphate degradation of unprotected
(methyl cap) mRNA template. Primer design, RNA treatment, and PCR amplification were
performed in accordance with manufacturer's protocol.
Contig sequence analysis was performed on all clones, using Vector NTI® Contig Express
software to generate full-length O. mossambicus claudin 28a and claudin 30 cDNA sequences.
To verify the in silico contig analysis, we designed an additional primer pair (Table 1) for the full
coding sequence of both genes, which spans all sequences in the contig alignment. The PCR
cycling parameters for the claudin 28a coding sequence (CDS) were as follows: 1 cycle at 95°C
for 2 minutes; 35 cycles at 95°C for 30 seconds, 57°C for 30 seconds, 72°C for 75 seconds; and 1
cycle final extension at 72°C for 5 minutes. The claudin 30 CDS amplification parameters were
the same as claudin 28a, except the annealing temperature was reduced to 55°C.
mRNA expression: Claudin 28a and 30 mRNA levels were measured by Syber Green
quantitative RT-PCR according to our previously established protocol (33). Gene specific
primers to the coding sequence of O. mossambicus claudin 28a and claudin 30 were developed
using Vector NTI® sequence software package (Table 1). Real-time QRT-PCR analysis was
performed on 20 ng total RNA sample with Brilliant® Syber Green master mix (Stratagene)
containing 1.5 µM gene-specific primers on an ABI 7900 HT Sequence Detection System.
Following an initial denaturation at 95°C for 10 min, forty cycles of PCR was performed, each
consisting of denaturation at 95°C for 30 seconds, annealing at 60°C for 60 seconds and
Page 11 of 38

extension at 72°C for 60 seconds. Real-time measurements were made during the extension
step. Cycle threshold (Ct) values for experimental samples were transformed using a standard
curve of serially diluted cDNA versus Ct values (R2 = 0.93 - 0.99). All mRNA data were
normalized to total RNA concentration (4, 33) and depicted here as cDNA template/ ng total
RNA. Primer specificity was assessed by melting curve analysis and additionally by visual
inspection of sample amplicons using gel electrophoresis.
Statistics
A two factorial ANOVA was used to analyze for overall effects of salinity change (FW or
SW), time of sampling and interaction between factors. The group of fish sampled at time 0 hrs
was treated statistically as both a FW and SW group. When required, transformation of data was
done to meet the ANOVA assumption of homogeneity of variances (assessed by residual plots).
A priori, it was decided to compare FW and SW groups at the same time point. When the two-
way ANOVA showed that the interaction between factors was significant, groups were
compared with Bonferroni-adjusted Fisher’s least significant difference test. All statistical
analyses were performed using Statistica 7.0 (Tulsa, OK, USA) and significant differences were
accepted when P < 0.05.
Results
On immunoblots of gill proteins preparations, the antibody directed against mammalian
claudin 3 revealed one single band with apparent molecular weight (MW) of 18 kDa (Fig. 1A).
The claudin 4 antibody also detected only one protein band, this one having an apparent MW of
34 kDa (Fig. 1B). These distinct bands were of the same size in the gill of both FW and SW
Page 12 of 38

acclimated tilapia. Gill claudin 3- and claudin 4-like protein expression was lower in long-term
SW-acclimated (> 3 weeks) tilapia than in FW-acclimated fish (Fig. 1).
To examine the cellular site of claudin-like protein expression in the gill, localization of
claudin 3- and claudin 4-like proteins were examined by immunostaining shown in Fig. 2 and
Fig. 3, respectively. In the gill of FW fish, claudin 3 staining was localized mainly in the deeper
cell layers in the filament but also in pillar cells on the lammelae (Fig. 2B). In SW gill, claudin 3
antibody staining is closer to the apical side of the filament (Fig. 2E). In the FW gill, the claudin
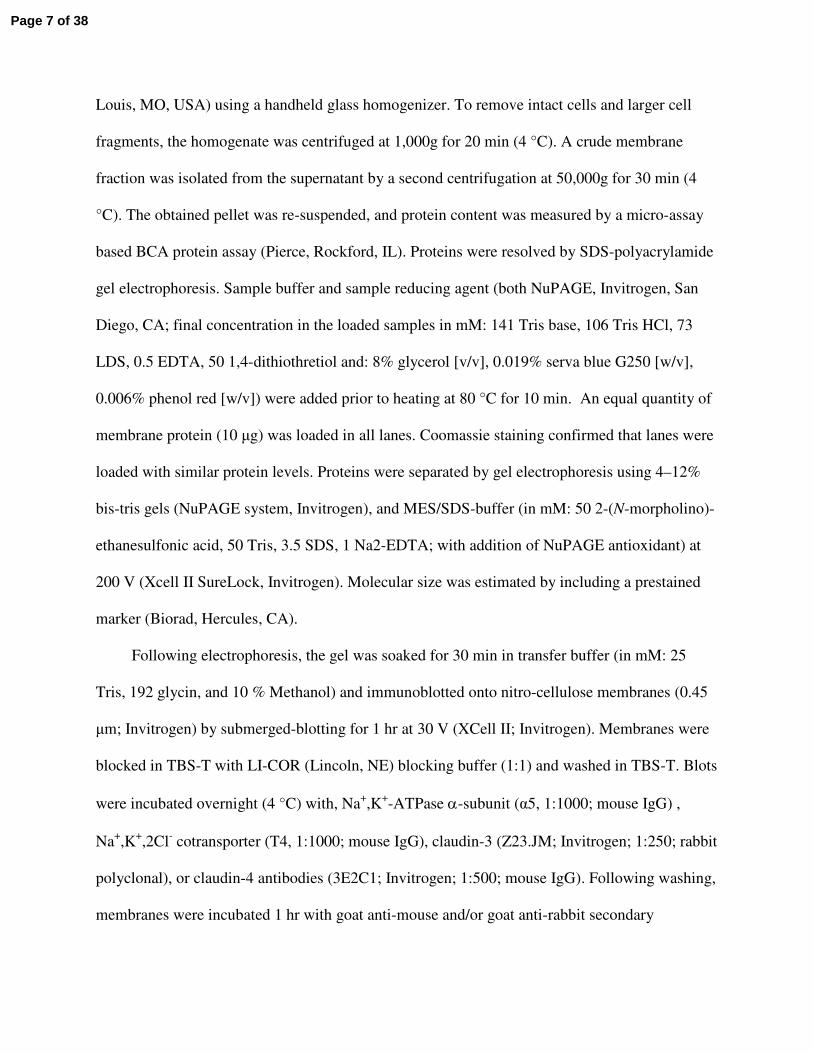
4 antibody stained epithelial cells in the filament, but also some cells on the lamellae, including
pillar cells (Fig. 3B). In SW gill, claudin 4 antibody staining was substantially weaker, found
mostly in a thin layer on the apical side of epithelial cells of the filament (Fig 3E). No staining
was seen in pillar cells (Fig. 3E). Negative staining was prepared by replacing primary antibody
with normal serum and this abolished the reaction (Figs. 2A, 2D, 3A, 3D). Binding of both
antibodies to gill cells was blocked when pre-absorbed with their respective blocking peptides,
which shows that staining was specific for both claudin antibodies (Figs. 2C, 2F, 3C, 3F).
To further investigate the response of the putative gill claudins to salinity change, time-
course salinity transfer experiments were performed. Transfer of FW acclimated fish to SW
induced an increase in plasma osmolality from ca 330 to 380 mOsm kg-1 after 24 hr (Fig. 4A).
After 4 days plasma osmolality was restored to levels typically observed in long term SW-
acclimated fish (350 mOsm kg-1), as seen in Fig. 4E. Muscle water content decreased
significantly after 24 hours in response to SW, but returned to control levels by 4 days (Fig. 4B).
The expression of gill Na+,K+-ATPase α-subunit protein and Na+,K+,2Cl- cotransporter protein
both increased four days after transfer to SW (Fig. 4C, D). By contrast, the expression of claudin
3- and claudin 4-like proteins in gill declined in response to SW (Fig. 5A, B: P < 0.01 for claudin
Page 13 of 38

3 and P < 0.05 for claudin 4). For the claudin 3-like protein, there was a significant interaction
between salinity and acclimation period, signifying the time dependence of the SW effect
(significant after 7 days; P < 0.01; Fig. 5A).
Transfer of SW acclimated fish to FW induced a rapid decrease in plasma osmolality from
~350 to 330 mOsm kg-1 after 24 hours (Fig. 4E) and it settled at this level over the remainder of
the experiment. No change in muscle water content was observed in this experiment (Fig. 4F).
There was an overall significant reduction in the expression of gill Na+,K+-ATPase α-subunit
protein (P < 0.05) and Na+,K+,2Cl- cotransporter protein (P < 0.001) in response to FW transfer
(Fig. 4G, H). For the Na+,K+,2Cl- cotransporter protein there was a significant interaction
between salinity and time, signifying the that protein declines with a greater significance over the
course of FW exposure (significant after 4 days; Fig. 4H). By contrast, the expression of claudin
3- and claudin 4-like proteins increased in the gill in response to FW (Fig. 5C, D; P < 0.01 for
claudin 3 and P < 0.05 for claudin 4). For the claudin 3-like protein, there was a significant
interaction between salinity and time, being significant after 7 days of transfer to FW (P < 0.01;
Fig. 5C).
Full length cDNA sequences of tilapia (O. mossambicus) claudin 28a (Genbank Accession
No. EU344800) and claudin 30 (EU344801) were characterized by RACE-PCR of partial coding
sequence clones. Analyses of claudin 28a indicates a single 1,175 bp cDNA sequence with 4X or
greater coverage. The translated 633 bp open reading frame (ORF) shares the highest amino acid
similarity (94%) with Takifugu rubripes claudin 28a and shares strong similarity to the class
V/VI claudins (AAT64053; NCBI bl2seq; 40, 23). The deduced claudin 28a amino acid
sequence shows 85% and 84% similarity to mouse claudin 3 (NP 034032) and human claudin 4
(NP 001296) proteins, respectively (Fig. 6). Tilapia claudin 30 analyses produced a 1,184 bp
Page 14 of 38

cDNA sequence with 4X coverage. A translated tilapia claudin 30 ORF (633 bp) shares equal
similarity (85%) to the 'a' and 'c' paralogs of Takifugu rubpripes claudin 30 (claudin 30a,
AAT64050; claudin 30c AAT64059). Pair-wise comparisons to mammalian claudins show 80%
similarity to mouse claudin 3 and 83% similarity to human claudin 4 protein sequences (Fig. 6).
An additional coding sequence PCR, spanning all segments of the gene was performed to
supplement the in silico contig analysis. The amplicons verified the predicted nucleotide
sequence for both claudin 28a and claudin 30.
Tilapia claudin 28a and claudin 30 mRNA levels were determined by QRT-PCR analyses
in fish challenged to FW or 2/3 SW. As in the first salinity study, a sharp rise in plasma
osmolality was observed 24 hours after FW-acclimated fish were transferred to SW (P < 0.001;
Fig. 7A), Osmolality was subsequently restored to baseline by 4 days. Claudin 28a and claudin
30 mRNA declined from initial time 0 levels through day 4 in both the SW and sham transferred
control groups (Fig. 7B, C). By day 7, levels of both genes were lower in SW transferred fish
than control animals, although no statistically significant differences were observed.
Plasma solute concentration dropped sharply in SW acclimated fish transferred to FW and
remained lower than sham transferred control fish at days 1 and 4 (Fig. 7D; P < 0.001). Levels
subsequently returned to levels observed in SW acclimated fish by day 7. Claudin 28a mRNA
levels increased by 45% in FW transferred fish by 24 hours, the earliest time point measured
(Fig. 7E, P < 0.05). Levels of claudin 28a mRNA continued to increase in FW transferred
animals and remaining elevated over sham transferred control fish throughout the course of the
experiment (P < 0.001, Fig. 7E). Claudin 30 mRNA levels were also significantly higher than the
control group in days 1 and 7 (P < 0.05, Fig. 7F), but not at day 4 of transfer, where an elevated
transcript level was observed in the control group.
Page 15 of 38

Discussion
Claudins are membrane proteins involved in the formation of TJs in epithelial tissue and
different isoforms confer distinctive charge and size selectivity of pores within these junctions
(43). The relationship between protein expression of claudins in the gill and salinity acclimation
of euryhaline fishes is unknown even though it is clear that major permeability changes occur in
gill epithelia and operculum membranes during salinity acclimations (8, 31) and that genes for
various forms of claudins are expressed in fish gills (3, 15, 23). In the present investigations we
therefore assessed the dynamics of gill expression of claudin mRNA and proteins along with ion
transporter proteins in tilapia during acclimation to either FW or SW.
Transfer of FW acclimated tilapia to SW induced an initial osmotic stress after 24 hours.
This was followed by acclimation to the new salinity within 4 days as judged by the restoration
of muscle water content to pre-transfer levels and plasma osmolality to levels typically found in
fish fully acclimated to SW (~ 350 mOsm; Fig. 4). The regain of osmotic balance coincides with
major increases in cotransporter and Na+,K+-ATPase abundance (Fig. 4C, 4D). This correlation
of increased levels of branchial Na+,K+,2Cl- cotransporter and Na+,K+-ATPase and SW
acclimation is in accord with earlier studies (24, 31, 41, 45, 47). Transfer of SW acclimated fish
to FW, on the other hand, induced a decrease in plasma osmolality to levels typically found in
long term FW-acclimated fish (~ 330 mOsm), but no significant change in muscle water content
(Fig. 4E, 4F). This suggests that acclimation to FW may not induce as dramatic an initial
osmoregulatory stress as is observed during SW acclimation, which is in agreement with that
previously reported for this and other euryhaline species (brown trout, 42; Mozambique tilapia,
22). The decline in gill abundance of cotransporter and Na+,K+-ATPase following FW transfer
Page 16 of 38

(Fig. 4G, 4H) may be linked to down-regulation of unused hypo-osmoregulatory capacity as
these proteins are highly active in NaCl excretion and the SW acclimation process.
The number, size, and morphology of chloride cells and expression of gill transport
proteins are dynamically regulated by both salinity and hormones (8, 30). In SW, transcellular
extrusion of chloride and paracellular extrusion of sodium are dependent on chloride cell and
transporter protein remodeling. To understand the paracellular pathway for Na+ ions, a
description of claudins and their regulation are essential, but until now lacking.
We used the Odyssey system with two infrared fluorescence channels for Western blot that
enabled simultaneous two-color target detection, and therefore the simultaneous analyses of two
putative claudins on the same blots. The employed mammalian claudin 3 and claudin 4
antibodies each detected one distinct gill protein band with an apparent MW of 18 kDa and 34
kDa, respectively. These apparent sizes are in the range that would be predicted for known
teleost claudins, based on their coding sequence (19-38 kDa; D. rerio, 18; F. rubribes, 23; see
Swiss-Prot at http://www.expasy.org/sprot/). Claudin 4-like immunohistochemical staining was
found mainly in the epithelial cell layer of the filament where one would expect to see high
concentrations of TJs. The reduced staining in SW gill, limited to a thin layer close to the apical
side, suggests that TJs might be thinner in this region. We found claudin 3-like staining deeper
in the FW filament relative to that of gill from SW fish. This may not be surprising considering
that claudin 3 has been localized to the basolateral membrane of intestinal cells (35).
Conversely, in SW gill, claudin 3-like staining is closer to the surface away from the deeper cell
layer. The gill epithelium of FW fish is usually considered to be tight due to the deep TJs
between adjacent pavement and chloride cells (9, 36). The deeper localization of claudin 3-like
proteins and more intense claudin 4-like staining seen in tilapia FW gill, as compared to SW gill,
Page 17 of 38

may well reflect this. Taken together, the specificity of the antibodies (staining displaceable by
claudin 3 and claudin 4 specific peptides), the Western detection of single distinct bands, and
their differential localization and regulation in the gill of FW and SW fish suggests that the
claudin 3 and claudin 4 heterologous antibodies specifically detect tilapia claudin isoforms and
that they may function, in part, in regulating gill permeability associated with changes in
environmental salinity.
We examined the dynamics in abundance of putative gill claudins during salinity
acclimation. We show a significant inhibitory effect of SW on gill expression of both claudin 3-
and claudin 4-like protein (Fig. 5A, 5B). The decrease in claudin-like proteins, becomes
apparent by day 4 and is most prominent by day 7 of SW exposure, a down-regulation that is
accompanied by increases in gill Na+,K+-ATPase and Na+,K+-2Cl-cotransporter. Therefore, it is
likely that a decline in claudin 3- and claudin 4-like proteins is important in reshaping the gill
tissue to an ion-secreting and more “leaky” epithelium. In contrast to that observed with SW
acclimation, both claudin 3- and claudin 4-like protein expression were elevated 2-fold in fish
transferred to FW compared with sham SW transferred controls (Fig. 5C, 5D). These salinity
challenge experiments indicate that both claudins show relatively high basal expression levels in
the gill of fish, as judged by strong Western blot signals. Furthermore, the remodeling of the gill
epithelium from an ion secreting to an ion absorptive epithelium, is accompanied by enhanced
protein expression of the two putative tilapia claudins. It is likely that the elevated claudin 3-
and claudin 4-like protein expression in gill of FW transferred fish is important in epithelial
tightening needed to reduce ion permeability, as is seen in fish that reside in FW environments
(29). The differential regulation of claudin proteins seen here with salinity is consistent with that
observed for gene expression of tilapia claudin 28a and 30, which are members of the Class VI
Page 18 of 38

claudins that are related to the mammalian claudin 3 and 4 (23). We found an upregulation of
claudin 28a and claudin 30 mRNAs during FW adaptation (Fig. 7) which is consistent with
investigations in the euryhaline European eel, where claudin 27 mRNA levels were higher in FW
compared with SW fish (15). By contrast, Boutet and coworkers (3) sequenced a claudin 3-like
gene in the European seabass (homologous to Fugu 8d, 23) and found higher gill mRNA
expression of this claudin in fish from the open sea (35 ppt; ~11oC) than in those animals living
in a lagoon where salinity fluctuates (3.5-41 ppt) and temperatures are lower (5oC). Whether this
gene is regulated in response to temperature changes or salinity specifically is uncertain.
In mammals, increased epithelial expression of claudins is associated with either increased
or decreased transepithelial resistance depending on the isoform. Thus in a mammalian kidney
cell model, it was shown that claudins 8 , 11 and 14 decrease paracellular conductance and
discriminate against cations while claudins 2 and 15 increase the permeability for Na+ (20, 44).
Claudins may also create charge and size selective TJ pores for specific ions making their
potential function in osmoregulation even more complex (1). Since the expression of the two gill
claudin isoforms decline during SW transfer and increase in response to FW acclimation, it
would appear that the proteins may play a role in TJ modification to provide a tighter or less
leaky epithelium.
Perspectives and Significance
Salinity acclimation in euryhaline teleosts involves the dynamic regulation of ion conductance
and TJ remodeling. Characterizing the claudin isoforms which are expressed in gills and the
corresponding response is critical to understanding how fish adjust to changes in salinity. These
studies are the first to detect putative claudin proteins in teleosts and show their localization and
Page 19 of 38

regulation with salinity in gill epithelium; claudin 3-like and claudin 4-like proteins decline
during SW acclimation and are upregulated during FW transfer. Additionally, we cloned two
tilapia claudin genes and show their expression is regulated in a similar manner by salinity as the
putative claudin proteins. Overall, the data indicate that claudins may be important in
permeability changes associated with salinity acclimation and possibly the formation of deeper
tight junctions in FW gill. It will be important in future studies, to clone the full suite of
branchial claudin isoforms, analyze their expression and examine their regulation by
environmental and hormonal factors.
Acknowledgements
We thank Andy McGinty and the Pamilco Aquaculture Field Laboratory (Aurora, NC) for
their help in producing and maintaining fish used in these studies
Grants
This research was supported by grants from the United States National Science Foundation
(IBN-0215205) and Carlsberg Foundation (2005-1-311).
Page 20 of 38

References
1. Alexandre MD, Lu Q, Chen YH. Overexpression of claudin-7 decreases the
paracellular Cl- conductance and increases the paracellular Na+ conductance in LLC-
PK1 cells. J Cell Science 118: 2683-2693, 2005.
2. Amasheh S, Meiri N, Gitter AH, Schoneberg T, Mankertz J, Schulzke JD, Fromm
M. Claudin-2 expression induces cation-selective channels in tight junctions of epithelial
cells. J Cell Science 115: 4969-4976, 2002.
3. Boutet I, Long Ky CL, Bonhomme F. A transcriptomic approach of salinity response in
the euryhaline teleost, Dicentrarchus labrax. Gene 379: 40–50, 2006.
4. Bustin SA. Absolute quantification of mRNA using real-time reverse transcription
polymerase chain reaction assays. J Mol Endocrinol 25:169-193, 2000.
5. Colegio OR, Van Itallie CM, McCrea HJ, Rahner C, Anderson JM. Claudins create
charge-selective channels in the paracellular pathway between epithelial cells. Am J
Physiol Cell Physiol 283: C142-C147, 2002.
6. Cutler CP, Cramb G. Branchial expression of an aquaporin 3 (AQP-3) homologue is
downregulated in the European eel Anguilla anguilla following seawater acclimation. J
Exp Biol 205: 2643-2651, 2002.
7. D’Souza T, Agarwal R, Morin PJ. Phosphorylation of claudin-3 at threonine 192 by
PKA regulates tight junction barrier function in ovarian cancer cells. J Biol Chem
280:26233–26240, 2005.
8. Evans DH. The roles of gill permeability and transport mechanisms in euryhalinity. In:
Fish Physiology, edited by Hoar WS and Randall DJ. Orlando, FL: Academic, p. 239–
283, 1984.
Page 21 of 38

9. Evans DH, Piermarini PM, Choe KP. The multifunctional fish gill: dominant site of
gas exchange, osmoregulation, acid-base regulation, and excretion of nitrogenous waste.
Physiol Rev 85: 97–177, 2005.
10. Furuse M, Sasaki H, Tsukita S. Manner of interaction of heterogeneous claudin species
within and between tight junction strands. J Cell Biol 147: 891-903, 1999.
11. Heiskala M, Peterson PA, Yang Y. The roles of claudin superfamily proteins in
paracellular transport, Traffic 2: 92–98, 2001.
12. Hiroi J, McCormick SD, Kaneko RO, Kaneko T. Functional classification of
mitochondrion-rich cells in euryhaline Mozambique tilapia (Oreochromis mossambicus)
embryos, by means of triple immunofluorescence staining for Na+/K+-ATPase,
Na+/K+/2Cl- cotransporter and CFTR anion channel. J Exp Biol 208: 2023-2036, 2005.
13. Hirose S, Kaneko T, Naito N, Takei Y. Molecular biology of major components of
chloride cells. Comp Biochem Physiol B 136: 593–620, 2003.
14. Isaia J, Hirano T. Effect of environmental salinity change on osmotic permeability of
isolated gill of eel, Anguilla anguilla L. Journal de Physiologie 70: 737-747, 1976.
15. Kalujnaia S, McWilliam IS, Zaguinaiko VA, Feilen AL, Nicholson J, Hazon N,
Cutler CP, Cramb G. A transcriptomic approach to the study of osmoregulation in
European eel Anguilla anguilla. Physiol. Genomics (July 31, 2007).
doi:10.1152/physiolgenomics.00059.2007
16. Kamiya M, Utida S. Sodium-potassium-activated adenosinetriphosphatase activity in
gills of fresh-water, marine and euryhaline teleosts. Comp Biochem Physiol 31: 671-674,
1969.
Page 22 of 38

17. Karnaky KJ Jr. Teleost osmoregulation: changes in the tight junction in response to the
salinity of the environment. In: TightJunctions, edited by Cereijido M. Boca Raton, FL:
CRC, p.175–185, 1991.
18. Kollmar R, Nakamura SK, Kappler JA, Hudspeth AJ. Expression and phylogeny of
claudins in vertebrate primordia. Proc Natl Acad Sci USA 98: 10196–10201, 2001.
19. Laurent P. Gill internal morphology. In: Fish Physiology, edited by Hoar WS and
Randall DJ. Orlando, FL: Academic, p.73–183, 1984.
20. Li WY, Huey CL, Yu ASL. Expression of claudin-7 and -8 along the mouse nephron.
Am J Physiol Renal Physiol 286:F1063–F1071, 2004.
21. Lignot JH, Cutler CP, Hazon N, Cramb G. Immunolocalisation of aquaporin 3 in the
gill and the gastrointestinal tract of the European eel Anguilla anguilla (L.). J Exp Biol
205: 2653–2663, 2002.
22. Lin CH, Huang CL, Yang CH, Lee TH, Hwang PP. Time-course changes in the
expression of Na, K-ATPase and the morphometry of mitochondrion-rich cells in gills of
euryhaline tilapia (Oreochromis mossambicus) during freshwater acclimation. J Exp Zool
301A: 85-96, 2004.
23. Loh YH, Christoffels A, Brenner S, Hunziker W, Venkatesh B. Extensive expansion
of the claudin gene family in the teleost fish, Fugu rubripes. Genome Research 14: 1248-
1257, 2004.
24. Lorin-Nebel C, Boulo V, Bodinier C, Charmantier G. The Na+/K+/2Cl(-)
cotransporter in the sea bass Dicentrarchus labrax during ontogeny: involvement in
osmoregulation. J Exp Biol 209: 4908-4922, 2006.
Page 23 of 38

25. Lu G, and Moriyama EN. Vector NTI, a balanced all-in-one sequence analysis suite.
Brief Bioinformatics 5: 378-388, 2004.
26. Lytle C, Xu J, Biemesderfer D, Forbush III B. Distribution and diversity of Na-K-Cl
cotransport proteins: a study with monoclonal antibodies. Am J Physiol Cell Physiol 269:
C1496-C1505, 1995.
27. Marshall WS. Transepithelial potential and short-circuit current across the isolated skin
of Gillichthys mirabilis (Teleostei: Gobiidae) acclimated to 5% and 100% seawater. J
Comp Physiol 114: 157–165, 1977.
28. Marshall WS, Bryson SE, Darling P, Whitten C, Patrick M, Wilkie M, Wood CM,
BucklandNicks J. NaCl transport and ultrastructure of opercular epithelium from a
freshwater-adapted euryhaline teleost, Fundulus heteroclitus. J Exp Zool 277: 23-37,
1997.
29. Marshall WS, Emberley TR, Singer TD, Bryson SE, McCormick SD. Time course of
salinity adaptation in a strongly euryhaline estuarine teleost, Fundulus heteroclitus: A
multivariable approach. J Exp Biol 202: 1535-1544, 1999.
30. McCormick SD. Endocrine control of osmoregulation in teleost fish. Am Zool 41: 781-
794, 2001.
31. Morgan JD, Sakamoto T, Grau EG, Iwama GK. Physiological and respiratory
responses of the Mozambique Tilapia (Oreochromis mossambicus) to salinity
acclimation. Comp Biochem Physiol A 117: 391-398, 1997.
32. Pelis RM, Zydlewski J, McCormick SD. Gill Na+,K+,2Cl- cotransporter abundance and
localization Atlantic salmon: effects of seawater and smolting. Am J Physiol Renal
Physiol 280: R1844-R1852, 2001.
Page 24 of 38

33. Picha ME, Silverstein JT, Borski RJ. Discordant regulation of hepatic IGF-I mRNA
and circulating IGF-I during compensatory growth in a teleost, the hybrid striped bass
(Morone chrysops X M. saxatilis). Gen. Comp. Endocrinol., 147:196-205, 2006.
34. Powell DW. Barrier function of epithelia. Am J Physiol Gastrointest Liver Physiol
241:G275-G288, 1981.
35. Rahner C, Mitic LL, Anderson JM. Heterogeneity in expression and subcellular
localization of claudins 2, 3, 4, and 5 in the rat liver, pancreas, and gut. Gastroenterology
120:411-422, 2001.
36. Sardet C, Pisam M, Maetz J. The surface epithelium of teleostean fish gills. Cellular
and junctional adaptations of the chloride cell in relation to salt adaptation. J Cell Biol 80:
96–117, 1979.
37. Seidelin M, Madsen SS, Blenstrup H, Tipsmark CK. Time-course changes in the
expression of Na+,K+-ATPase in gills and pyloric caeca of brown trout (Salmo trutta)
during acclimation to seawater. Physiol Biochem Zool 73: 446–453, 2000.
38. Sonoda N, Furuse M, Sasaki H, Yonemura S, Katahira J, Horiguchi Y, Tsukita S.
Clostridium perfringens enterotoxin fragment removes specific claudins from tight
junction strands: Evidence for direct involvement of claudins in tight junction barrier. J
Cell Biol 147: 195-204, 1999.
39. Takeyasu K, Tamkun MM, Renaud KJ, Fambrough DM. Ouabain-sensitive (Na+
+K+)-ATPase activity expressed in mouse L cells by transfection with DNA encoding the
α subunit of the avian sodium pump. J Biol Chem 263: 4347–4354, 1988.
40. Tatusova TA and Madden TL. Blast 2 sequences - a new tool for comparing protein
and nucleotide sequences. FEMS Microbiol Lett. 174:247-250, 1999.
Page 25 of 38

41. Tipsmark CK, Madsen SS, Seidelin M, Christensen AS, Cutler CP, Cramb G.
Dynamics of Na+,K+,2Cl(-) cotransporter and Na+,K+-ATPase expression in the
branchial epithelium of brown trout (Salmo trutta) and Atlantic salmon (Salmo salar). J
Exp Zool 293: 106-118, 2002.
42. Tipsmark CK, Luckenbach JA, Madsen SS, Borski RJ. IGF-I and branchial IGF receptor
expression and localization during salinity acclimation in striped bass. Am J Physiol Regul
Integr Comp Physiol 292: R535–R543, 2007.
43. Turksen K, Troy TC. Barriers built on claudins. J Cell Science 117: 2435-2447, 2004.
44. Van Itallie CM, Anderson JM. Claudins and epithelial paracellular transport. Annual
Rev Physiol 68: 403-429, 2006.
45. Wilson JM, Laurent P, Tufts BL, Benos DJ, Donowitz M, Vogl AW, Randall DJ.
NaCl uptake by the branchial epithelium in freshwater teleost fish: An immunological
approach to ion-transport protein localization. J Exp Biol 203: 2279-2296, 2000.
46. Wilson JM, Antunes JC, Bouca PD, Coimbra J. Osmoregulatory plasticity of the glass
eel of Anguilla anguilla: freshwater entry and changes in branchial ion-transport protein
expression. Can J Fish Aq Sci 61: 432-442, 2004.
47. Wu YC, Lin LY, Lee TH. Na+,K+,2Cl--cotransporter: A novel marker for identifying
freshwater- and seawater-type mitochondria-rich cells in gills of the euryhaline tilapia,
Oreochromis mossambicus. Zool Stud 42: 186-192, 2003.
48. Yoshikawa JSM, McCormick SD, Young G, Bern HA. Effects of salinity on chloride
cells and Na+-K+-ATPase activity in the teleost Gillichthys mirabilis. Comp Biochem
Physiol A 105: 311-317, 1993.
Page 26 of 38

Table 1. Primer sequences used in the cloning of O. mossambicus claudin 28a (cldn 28a) and
claudin 30 (cldn 30) cDNA and gene expression analysis.
Gene Primer Name Primer Sequence (5' to 3') ApplicationCldn28a Degenerate F GCY YTG CCC ATG TGG A initial sequence (partial cds)
Degenerate R SGT GTK KGC TGA CCA
5R Primary GCT CTG CAT GAC ACA GTT CAT CCA 5' RACE-PCR5R Nested CCG TCA CAA TGT TGG CTC CAA T
3R Primary CTA TGA TTC TCT GCT GGC TCT TCC 3' RACE-PCR3R Nested TAT GGG AGT TAT CCT GGG CAT TGC
CDS F ATG GTG TCA ATG GGA CGA CA full coding sequence
CDS R TCA AAC ATA GGC TCG GCT GG
QPCR F GGT CAC AGC CTT CAT TGG AGC C gene expression (QRT-PCR)
QPCR R GAG CTC TGG CAG CCT GAA GA
Cldn30 Degenerate F CTG KGC ATY ATT GG initial sequence (partial cds)
Degenerate R CCW GCR ATG ATG AAG A
5R Primary GGT CAT CCA GAT GCC TTC CC 5' RACE-PCR5R Nested GCC AGC AGG ATG CCA ATG ATA C
3R Primary TAC ATG GGA AGG CAT CTG GA 3' RACE-PCR3R Nested GCT GCT CGA GCC CTT ACT AT
CDS F ATG GTT TCA GCT GCT TTG CA full coding sequenceCDS R TCA AAC ATA GCC CTT GTT TG
QPCR F GCA TTA TTG GCT GGA TTG GGG T gene expression (QRT-PCR)
QPCR R GCA TTG CAT CTG GCC TGT GCT
Page 27 of 38

Legends
Fig. 1. Representative immunoblots of gill preparations recognizing claudin 3- and claudin 4-like
proteins on the same blots at different wavelengths. In A, FW (lanes 1, 3) and SW (lanes 2, 4)
preparations were probed with mouse claudin 3 antibody. In B, FW (lanes 1, 3) and SW (lanes 2,
4) preparations were probed with claudin 4 antibody. Molecular weight standards are displayed
in lane 5 in both A and B (from top to bottom: 250, 150, 100, 75, 50, 37, 25, 20, 15, 10 kDa).
Fig. 2. Six µm gill sections from FW (A, B, C) and SW (D, E, F) tilapia, immunostained with the
claudin 3 (cldn 3) antibody. Staining was specific as verified by the lack of staining with normal
serum (A, D) and when the antibody was pre-absorbed with blocking peptide (C, F).
Sections were counterstained with hematoxylin. The arrowheads and arrow indicate examples
of localized staining in the filament and on the lamellae, respectively. Bar = 20 µm.
Fig. 3. Six µm gill sections from FW (A, B, C) and SW (D, E, F) tilapia, immunostained with the
claudin 4 (cldn 4) antibody. Staining was specific as verified by the lack of staining with normal
serum (A, D) and when the antibody was pre-absorbed with blocking peptide (C, F).
Sections were counterstained with hematoxylin. The arrowheads and arrow indicate examples
of localized staining in the filament and on the lamellae, respectively. Bar = 20 µm.
Fig. 4. Effect of salinity transfer on plasma osmolality, muscle water content, gill Na+,K+-
ATPase α-subunit protein expression and gill Na+,K+,2Cl- cotransporter protein expression.
Figures A-D reflect fish transferred from FW to SW and figures E-H fish transferred from SW to
Page 28 of 38

FW at time 0. FW to FW represents FW control fish sham transferred to FW and SW to SW
represents SW control fish sham transferred to SW. Overall, transfer to SW increased plasma
osmolality (A; P < 0.001) and increased expression of Na+,K+-ATPase (C: P < 0.01) and
Na+,K+,2Cl- cotransporter (D: P < 0.001). There was an overall effect of time of sampling for
plasma osmolality, muscle water content and Na+,K+,2Cl- cotransporter (A, B, D; P < 0.001).
There was also interaction between the two factors for plasma osmolality (A; P < 0.001), muscle
water content (B; P < 0.05), Na+,K+-ATPase (C; P < 0.05) and Na+,K+,2Cl- cotransporter (D; P <
0.001). Transfer of SW fish to FW reduced plasma osmolality (E; P < 0.001) and expression of
Na+,K+-ATPase (G: P < 0.05) and Na+,K+,2Cl- cotransporter (H: P < 0.001). There was an
overall effect of time of sampling for plasma osmolality (E; P < 0.001) and a significant
interaction between salinity and time for both plasma osmolality and Na+,K+,2Cl- cotransporter
(E, H; P < 0.01). Asterisks indicate significant effects compared to sham-controls (*** P < 0.001,
** P < 0.01, * P < 0.05). Values are means ± SEM (N = 10, except for gill protein expression
analysis where N = 5).
Fig. 5. Effect of salinity transfer on gill expression of claudin 3-like (A,C) and claudin 4-like
proteins (B,D). Figures A and B reflect fish transferred from FW to SW and figures C and D fish
transferred from SW to FW at time 0. FW to FW represents FW control fish sham transferred to
FW and SW to SW represents SW control fish sham transferred to SW. Overall, transfer to SW
decreased expression of claudin 3-like (A; P < 0.01) and claudin 4-like proteins (B: P < 0.05).
There was no effect of time of sampling but a significant interaction between the two factors was
observed for the claudin 3-like protein (A; P < 0.05). Overall, FW transfer increased expression
of claudin 3-like (C; P < 0.01) and claudin 4-like proteins (D: P < 0.05). There was no effect of
Page 29 of 38

time of sampling but a significant interaction between time of sampling and salinity for claudin-3
like protein expression (C; P < 0.05). Asterisks indicate significant effects compared to sham-
controls (** P < 0.01). Values are means ± SEM (N = 5).
Fig. 6. ClustalW amino acid alignment of tilapia (O. mossambicus) claudin 28a (Accession No.
EU344800) and claudin 30 (EU344801) translated sequences to (A) mouse (Mus musculus)
claudin 3 (NP 034032) and (B) human (Homo sapiens) claudin 4 (NP 001296) proteins.
Fig. 7. Effects of salinity transfer on plasma osmolality and gill claudin 28a and claudin 30
mRNA levels. Figures A-C reflect fish transferred from FW to SW and figures D-F fish
transferred from SW to FW at time 0. FW to FW represents FW control fish sham transferred to
FW and SW to SW represents SW control fish sham transferred to SW. Overall, transfer to SW
increased plasma osmolality (A; P < 0.001). There was an overall effect of time of sampling for
plasma osmolality, claudin 28a and claudin 30 mRNA (A, B, C; P < 0.01). There was also
interaction between the two factors for plasma osmolality (A; P < 0.001). Transfer of SW fish to
FW caused an overall reduction in plasma osmolality (D; P < 0.001) and increased expression of
claudin 28a (E: P < 0.001) and claudin 30 mRNA (F: P < 0.05). There was an overall effect of
time of sampling for plasma osmolality (D; P < 0.05), claudin 28a (E: P < 0.01) and claudin 30
mRNA (F: P < 0.001). There was a significant interaction between salinity and time for both
plasma osmolality (D; P < 0.05) and expression of claudin 28a (E: P < 0.01) and claudin 30
mRNA (F: P < 0.05). Asterisks indicate significant effects compared to sham-controls (*** P <
0.001, ** P < 0.01, * P < 0.05). Values are means ± SE (N = 7-10).
Page 30 of 38

Fig. 1. Representative immunoblots of gill preparations recognizing claudin 3- and claudin 4-like proteins on the same blots at different wavelengths. In A, FW (lanes 1, 3) and SW (lanes 2, 4) preparations were probed with mouse claudin 3 antibody. In B, FW (lanes 1,
3) and SW (lanes 2, 4) preparations were probed with claudin 4 antibody. Molecular weight standards are displayed in lane 5 in both A and B (from top to bottom: 250, 150,
100, 75, 50, 37, 25, 20, 15, 10 kDa).
Page 31 of 38

Fig. 2. Six µm gill sections from FW (A, B, C) and SW (D, E, F) tilapia, immunostained with the claudin 3 (cldn 3) antibody. Staining was specific as verified by the lack of staining
with normal serum (A, D) and when the antibody was pre-absorbed with blocking peptide (C, F). Sections were counterstained with hematoxylin. The arrowheads and arrow
indicate examples of localized staining in the filament and on the lamellae, respectively. Bar = 20 µm.
132x126mm (300 x 300 DPI)
Page 32 of 38
Fig. 3. Six µm gill sections from FW (A, B, C) and SW (D, E, F) tilapia, immunostained with the claudin 4 (cldn 4) antibody. Staining was specific as verified by the lack of staining
with normal serum (A, D) and when the antibody was pre-absorbed with blocking peptide (C, F). Sections were counterstained with hematoxylin. The arrowheads and arrow
indicate examples of localized staining in the filament and on the lamellae, respectively. Bar = 20 µm.
153x130mm (300 x 300 DPI)
Page 33 of 38

Fig. 4. Effect of salinity transfer on plasma osmolality, muscle water content, gill Na+,K+-ATPase α-subunit protein expression and gill Na+,K+,2Cl- cotransporter protein
expression. Figures A-D reflect fish transferred from FW to SW and figures E-H fish transferred from SW to FW at time 0. FW to FW represents FW control fish sham
transferred to FW and SW to SW represents SW control fish sham transferred to SW. Overall, transfer to SW increased plasma osmolality (A; P < 0.001) and increased
expression of Na+,K+-ATPase (C: P < 0.01) and Na+,K+,2Cl- cotransporter (D: P < 0.001). There was an overall effect of time of sampling for plasma osmolality, muscle
water content and Na+,K+,2Cl- cotransporter (A, B, D; P < 0.001). There was also interaction between the two factors for plasma osmolality (A; P < 0.001), muscle water
content (B; P < 0.05), Na+,K+-ATPase (C; P < 0.05) and Na+,K+,2Cl- cotransporter (D; P < 0.001). Transfer of SW fish to FW reduced plasma osmolality (E; P < 0.001) and
Page 34 of 38

expression of Na+,K+-ATPase (G: P < 0.05) and Na+,K+,2Cl- cotransporter (H: P < 0.001). There was an overall effect of time of sampling for plasma osmolality (E; P <
0.001) and a significant interaction between salinity and time for both plasma osmolality and Na+,K+,2Cl- cotransporter (E, H; P < 0.01). Asterisks indicate significant effects
compared to sham-controls (*** P < 0.001, ** P < 0.01, * P < 0.05). Values are means ±SEM (N = 10, except for gill protein expression analysis where N = 5).
183x229mm (600 x 600 DPI)
Page 35 of 38

Fig. 5. Effect of salinity transfer on gill expression of claudin 3-like (A,C) and claudin 4-like proteins (B,D). Figures A and B reflect fish transferred from FW to SW and figures C
and D fish transferred from SW to FW at time 0. FW to FW represents FW control fish sham transferred to FW and SW to SW represents SW control fish sham transferred to SW. Overall, transfer to SW decreased expression of claudin 3-like (A; P < 0.01) and claudin 4-like proteins (B: P < 0.05). There was no effect of time of sampling but a significant interaction between the two factors was observed for the claudin 3-like
protein (A; P < 0.05). Overall, FW transfer increased expression of claudin 3-like (C; P < 0.01) and claudin 4-like proteins (D: P < 0.05). There was no effect of time of sampling
but a significant interaction between time of sampling and salinity for claudin-3 like protein expression (C; P < 0.05). Asterisks indicate significant effects compared to sham-
controls (** P < 0.01). Values are means ± SEM (N = 5). 186x123mm (600 x 600 DPI)
Page 36 of 38

A
Mmus3 -MSMGLEITG TSLAVLGWLC TIVCCALPMW RVSAFIGSSI ITAQITWEGL [ 50]
Omos28a MV...RQML. FA..II.F.G ..II..M... K.T....AN. V....I.... [ 50]
Omos30 MV.AA.QML. .A.CII..IG V..I....Q. K.T....QN. V...T....I [ 50]
Mmus3 WMNCVVQSTG QMQCKMYDSL LALPQDLQAA RALIVVSILL AAFGLLVALV [100]
Omos28a .....M.... .....I.... .......... ...V.IA.IV .FM.VILGIA [100]
Omos30 ..T....... .....V...M ...SS..... ...TIIA..I GII.I.L.MA [100]
Mmus3 GAQCTNCVQD ETAKAKITIV AGVLFLLAAL LTLVPVSWSA NTIIRDFYNP [150]
Omos28a .GK...F.EE QR..SRVA.A ...V.IC.GV .V.I..C... ....QN.... [150]
Omos30 .GK.....E. .GS.S..G.A ...V.II.GV .C....C.T. ....QE.... [150]
Mmus3 LVPEAQKREM GAGLYVGWAA AALQLLGGAL LCCSCPPRDK YAPTKILYSA [200]
Omos28a TLIN..R... ..A..I..GT ...LI..... ..S....KES PE---YPVKY [200]
Omos30 MFNAS..K.L ..S.FI..G. GG.LII.... ..AN...K.N .S---AK... [200]
Mmus3 PRSTGPGTGT GTAYDRKDYV [220]
Omos28a GGARSVA.SR AYV------- [220]
Omos30 ...SA.A.NK .YV------- [220]
B
Hsap4 MASMGLQVMG IALAVLGWLA VMLCCALPMW RVTAFIGSNI VTSQTIWEGL [ 50]
Omos28a .V...R.ML. F...II.F.G TIII..M... K......A.. ..A.I..... [ 50]
Omos30 .V.AA..ML. T..CII..IG .IVI....Q. K......Q.. ..A..T...I [ 50]
Hsap4 WMNCVVQSTG QMQCKVYDSL LALPQDLQAA RALVIISIIV AALGVLLSVV [100]
Omos28a .....M.... .....I.... .......... ....V.A... .FM..I.GIA [100]
Omos30 ..T....... .........M ...SS..... ...T..A.LI GII.I..AMA [100]
Hsap4 GGKCTNCLED ESAKAKTMIV AGVVFLLAGL MVIVPVSWTA HNIIQDFYNP [150]
Omos28a ......FV.E QR..SRVA.A .....IC..V L.LI..C.S. NT...N.... [150]
Omos30 .......V.. .GS.S.IG.A .....II..V LCL...C... NT...E.... [150]
Hsap4 LVASGQKREM GASLYVGWAA SGLLLLGGGL LCCNCPPRTD KPYSAKYSAA [200]
Omos28a TLINA.R... ..A..I..GT AA..I...A. ..SS...KES PE.PV..GG. [200]
Omos30 MFNAS..K.L ....FI..G. G...II..A. ..A....KDN YSAKYSAPRS [200]
Hsap4 RSAAASNYV- [210]
Omos28a ..V.T.RAYV [210]
Omos30 SAP.TNKGYV [210]
Page 37 of 38

Fig. 7. Effects of salinity transfer on plasma osmolality and gill claudin 28a and claudin 30 mRNA levels. Figures A-C reflect fish transferred from FW to SW and figures D-F fish
transferred from SW to FW at time 0. FW to FW represents FW control fish sham transferred to FW and SW to SW represents SW control fish sham transferred to SW.
Overall, transfer to SW increased plasma osmolality (A; P < 0.001). There was an overall effect of time of sampling for plasma osmolality, claudin 28a and claudin 30 mRNA (A, B, C; P < 0.01). There was also interaction between the two factors for plasma osmolality
(A; P < 0.001). Transfer of SW fish to FW caused an overall reduction in plasma osmolality (D; P < 0.001) and increased expression of claudin 28a (E: P < 0.001) and
claudin 30 mRNA (F: P < 0.05). There was an overall effect of time of sampling for plasma osmolality (D; P < 0.05), claudin 28a (E: P < 0.01) and claudin 30 mRNA (F: P < 0.001). There was a significant interaction between salinity and time for both plasma osmolality (D; P < 0.05) and expression of claudin 28a (E: P < 0.01) and claudin 30 mRNA (F: P < 0.05). Asterisks indicate significant effects compared to sham-controls (*** P < 0.001,
** P < 0.01, * P < 0.05). Values are means ± SE (N = 7-10). 186x179mm (600 x 600 DPI)
Page 38 of 38