SAIC MOTOR CORPORATION LIMITED Annual Report 2020
241
SAIC MOTOR ANNUAL REPORT 2020 1 / 241 Company Code: 600104 Abbreviation of Company: SAIC Motor SAIC MOTOR CORPORATION LIMITED Annual Report 2020
-
Upload
khangminh22 -
Category
Documents
-
view
1 -
download
0
Transcript of SAIC MOTOR CORPORATION LIMITED Annual Report 2020
SAIC MOTOR ANNUAL REPORT 2020
1 / 241
Company Code: 600104 Abbreviation of Company: SAIC Motor
SAIC MOTOR CORPORATION LIMITED
Annual Report 2020

SAIC MOTOR ANNUAL REPORT 2020
2 / 241
Important Note 1. Board of directors (the "Board"), board of supervisors, directors, supervisors and senior
management of the Company certify that this report does not contain any false or misleading statements or material omissions and are jointly and severally liable for the authenticity, accuracy and integrity of the content.
2. All directors attended Board meetings. 3. Deloitte Touche Tohmatsu Certified Public Accountants LLP issued a standard and
unqualified auditors’ report to the Company. 4. Mr. Chen Hong, Chairman of the Board, Mr. Wei Yong, the chief financial officer, and
Ms. Gu Xiao Qiong, head of Accounting Department, certify the authenticity, accuracy and integrity of the financial reports contained in the annual report of the current year.
5. Plan of profit distribution or capital reserve capitalization approved by the Board The Company plans to distribute cash dividends of RMB 6.20 (inclusive of tax) per 10 shares, amounting to RMB 7,176,685,655.90 in total based on 11,575,299,445 shares, that is, the total shares of 11,683,461,365 net of the number of shares on the special securities account for repurchase (108,161,920 shares). The Company has no plan of capitalization of capital reserve this year. The cash dividend distribution for the recent three years accumulates to RMB 34,218,572,051.80 in total (including shares repurchased in the year of 2020, amounting to RMB 2.039 billion).
6. Risk statement of forward-looking description √Applicable □N/A The forward-looking description on future plan and development strategy in this report does not constitute substantive commitment to investors. Please note the investment risk.
7. Does the situation exist where the controlling shareholder and its related parties occupy the funds of the Company for non-operational use? No.
8. Does the situation exist where the Company provides external guarantee which is not in
compliance with the required decision-making procedures?
No.
9. Are over 1/2 of directors not able to ensure the authenticity, accuracy and integrity of the
annual report disclosed by the Company?
No. 10. Significant risk alert
SAIC MOTOR ANNUAL REPORT 2020
3 / 241
There are no significant risks which have substantive effects on the Company's production and operation during the reporting period. The Company has described the possible risks that the Company may be exposed to in the process of production and operation in this report. Please refer to "Possible Risks" in Section IV Discussion and Analysis of Operations.
11. Others □Applicable √ N/A

SAIC MOTOR ANNUAL REPORT 2020
4 / 241
Contents Section I Definitions ...................................................................................................................... 5
Section II General Information and Major Financial Indicators of the Company ............................. 6
Section III Business Overview of the Company ............................................................................ 11
Section IV Discussion and Analysis of Operations ....................................................................... 13
Section V Important Events .......................................................................................................... 29
Section VI Changes in Ordinary Shares and Shareholders ............................................................ 45
Section VII Preferred Shares ........................................................................................................ 50
Section VIII Directors, Supervisors, Senior Management and Employees ..................................... 51
Section IX Corporate Governance ................................................................................................ 59
Section X Corporate Bonds .......................................................................................................... 64
Section XI Financial Report ......................................................................................................... 67
Section XII List of Documents Available For Inspection ............................................................ 241

SAIC MOTOR ANNUAL REPORT 2020
5 / 241
Section I Definitions I. Definition In this report, unless the context otherwise indicated, the following terms are defined as below:
Definitions of frequently-used words CSRC Refers to China Securities Regulatory Commission SSE Refers to Shanghai Stock Exchange
Shanghai SASAC Refers to Shanghai State-owned Assets Supervision and Administration Commission
Company, the Company, the Group, SAIC Group, SAIC Motor Refers to SAIC Motor Corporation Limited
SAIC Refers to Shanghai Automotive Industry Corporation (Group) SAIC VOLKSWAGEN Refers to SAIC Volkswagen Automobile Co., Ltd. SAIC GM Refers to SAIC General Motors Co., Ltd.
SAIC Passenger Vehicle Refers to SAIC Motor Corporation Limited Passenger Vehicle Branch
SGMW Refers to SAIC GM Wuling Co., Ltd. SAIC Maxus Refers to SAIC Maxus Vehicle Co., Ltd. Shanghai Sunwin Refers to Shanghai Sunwin Bus Co., Ltd. IVECO Hongyan, SAIC-IVECO Hongyan Refers to SAIC-IVECO Hongyan Commercial Vehicle Co., Ltd. Nanjing Iveco Refers to Nanjing Iveco Automobile Co., Ltd. SAIC Motor-CP Refers to SAIC Motor-CP Co., Ltd. SAIC Indonesia Refers to SAIC-GM-Wuling Motor Indonesia HASCO Motor, HASCO Refers to HUAYU Automotive Systems Co., Ltd. SFC Refers to SAIC Finance Co., Ltd. SAIC-GMAC Refers to SAIC-GMAC Automotive Finance Co., Ltd. Chexiang Technology Refers to Shanghai Chexiang Technology Industry Co., Ltd. Global Car Sharing Refers to Global Car Sharing and Rental Co., Ltd. Anji Logistics Refers to Anji Automotive Logistics Co., Ltd. Zhonghaiting Refers to Wuhan Zhonghaiting Data Technology Co., Ltd.
SAIC Infineon Refers to SAIC Infineon Automotive Power Modules (Shanghai) Co., Ltd.
IM Motors Refers to IM Motors Technology Co., Ltd.
SHPT Refers to Shanghai Hydrogen Propulsion Technology Co., Ltd.
Tsingdu Automotive Tech Refers to Shanghai Tsingdu Automotive Technology Co., Ltd.
SAIC MOTOR ANNUAL REPORT 2020
6 / 241
Section II General Information and Major Financial Indicators of the Company
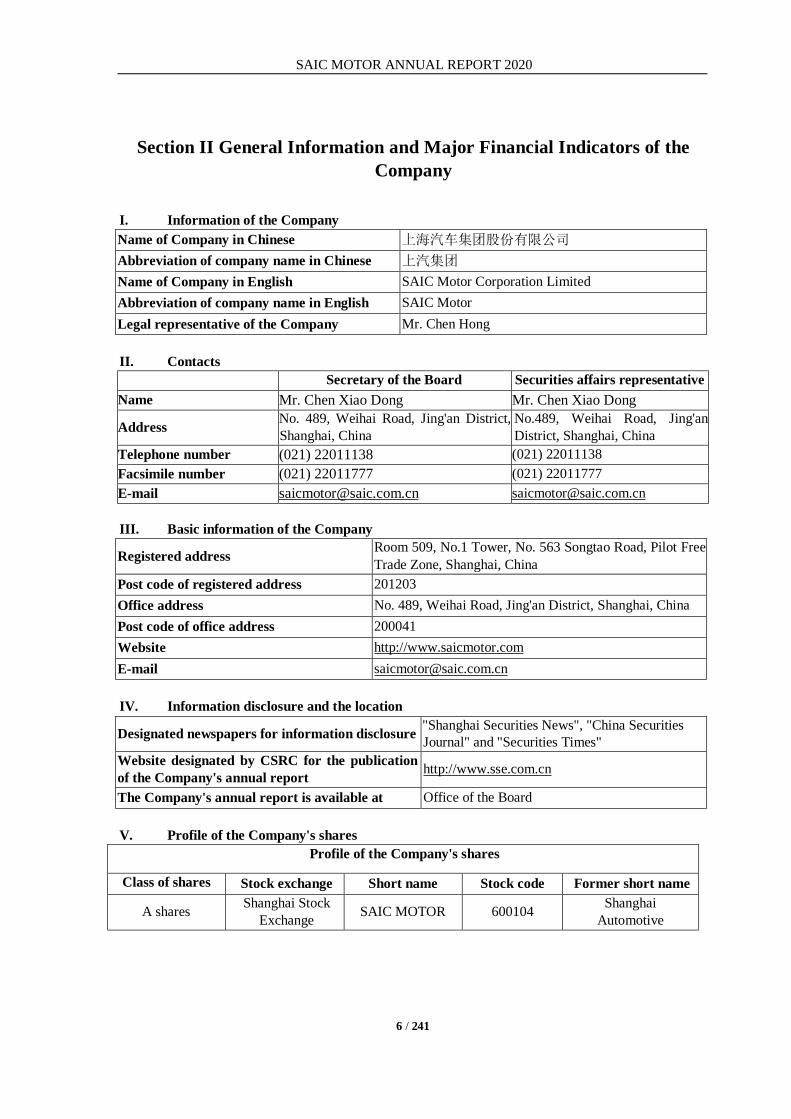
I. Information of the Company Name of Company in Chinese 上海汽车集团股份有限公司 Abbreviation of company name in Chinese 上汽集团 Name of Company in English SAIC Motor Corporation Limited Abbreviation of company name in English SAIC Motor Legal representative of the Company Mr. Chen Hong II. Contacts Secretary of the Board Securities affairs representative Name Mr. Chen Xiao Dong Mr. Chen Xiao Dong
Address No. 489, Weihai Road, Jing'an District, Shanghai, China
No.489, Weihai Road, Jing'an District, Shanghai, China
Telephone number (021) 22011138 (021) 22011138 Facsimile number (021) 22011777 (021) 22011777 E-mail [email protected] [email protected]
III. Basic information of the Company
Registered address Room 509, No.1 Tower, No. 563 Songtao Road, Pilot Free Trade Zone, Shanghai, China
Post code of registered address 201203 Office address No. 489, Weihai Road, Jing'an District, Shanghai, China Post code of office address 200041 Website http://www.saicmotor.com E-mail [email protected] IV. Information disclosure and the location
Designated newspapers for information disclosure "Shanghai Securities News", "China Securities Journal" and "Securities Times"
Website designated by CSRC for the publication of the Company's annual report http://www.sse.com.cn
The Company's annual report is available at Office of the Board V. Profile of the Company's shares
Profile of the Company's shares
Class of shares Stock exchange Short name Stock code Former short name
A shares Shanghai Stock Exchange SAIC MOTOR 600104 Shanghai
Automotive

SAIC MOTOR ANNUAL REPORT 2020
7 / 241
VI. Other relevant information
Information of the accounting firm appointed by the Company (domestic)
Name Deloitte Touche Tohmatsu Certified Public Accountants LLP
Office address F/30, Bund Center, No. 222 Yan An Road East, Shanghai
Signing Certified Public Accountant Hu Yuan Yuan, Luo Yi Ming
Sponsor performing continuous supervision duties in the reporting period
Name Guotai Junan Securities Co., Ltd.
Office address 35th Floor, Bohua Plaza, No.669 Xinzha Road, Jing’an District, Shanghai
Authorized sponsor representative Chi Hui Tao, Ding Ying Hua
Continuous supervision period From January 19, 2017 to the date when funds raised are used up
VII. Major accounting data and financial indicators in recent three years (I) Major accounting data
Unit: RMB
Major accounting data 2020 2019 Year-on-year (%) 2018
Total operating income 742,132,450,370.73 843,324,372,577.26 -12.00 902,194,064,732.24 Operating income 723,042,589,215.28 826,530,002,967.87 -12.52 887,626,207,288.41 Net profit attributable to shareholders of listed companies 20,431,037,479.76 25,603,384,202.16 -20.20 36,009,210,583.83
Net profit attributable to shareholders of listed companies after deducting non-recurring profit or loss
17,744,125,367.99 21,581,115,159.90 -17.78 32,409,013,305.15
Net cash flow from operating activities 37,517,935,804.19 46,271,852,926.75 -18.92 8,975,654,791.66
December 31, 2020 December 31, 2019 Year-on-year (%) December 31, 2018
Net assets attributable to shareholders of listed companies 260,102,954,415.43 249,702,009,694.74 4.17 234,368,561,956.28
Total assets 919,414,755,796.94 849,333,279,599.19 8.25 782,769,849,841.01 (II) Major financial indicators
Major financial indicators 2020 2019 Year-on-year (%) 2018
Basic earnings per share (RMB/Share) 1.752 2.191 -20.04 3.082
Diluted earnings per share (RMB/Share) N/A N/A N/A N/A
Basic earnings per share after deducting non-recurring profit or loss (RMB/Share)
1.522 1.847 -17.60 2.774
Weighted average return on net assets (%) 8.02 10.53 Decreased by
2.51% 15.67
Weighted average return on net assets after deducting non-recurring profit or loss (%)
6.96 8.87 Decreased by 1.91% 14.10
SAIC MOTOR ANNUAL REPORT 2020
8 / 241
Explanations on major accounting data and financial indicators in recent three years □ Applicable √ N/A VIII. Differences in accounting figures under China and foreign accounting standards i. Differences in net profit and net assets attributable to shareholders of the listed companies where financial statements are disclosed in accordance with International Accounting Standards and China Accounting Standards
□ Applicable √ N/A ii. Differences in net profit and net assets attributable to shareholders of the listed companies where financial statements are disclosed in accordance with Foreign Accounting Standards and China Accounting Standards
□ Applicable √ N/A iii. Explanations on differences between China and foreign accounting standards
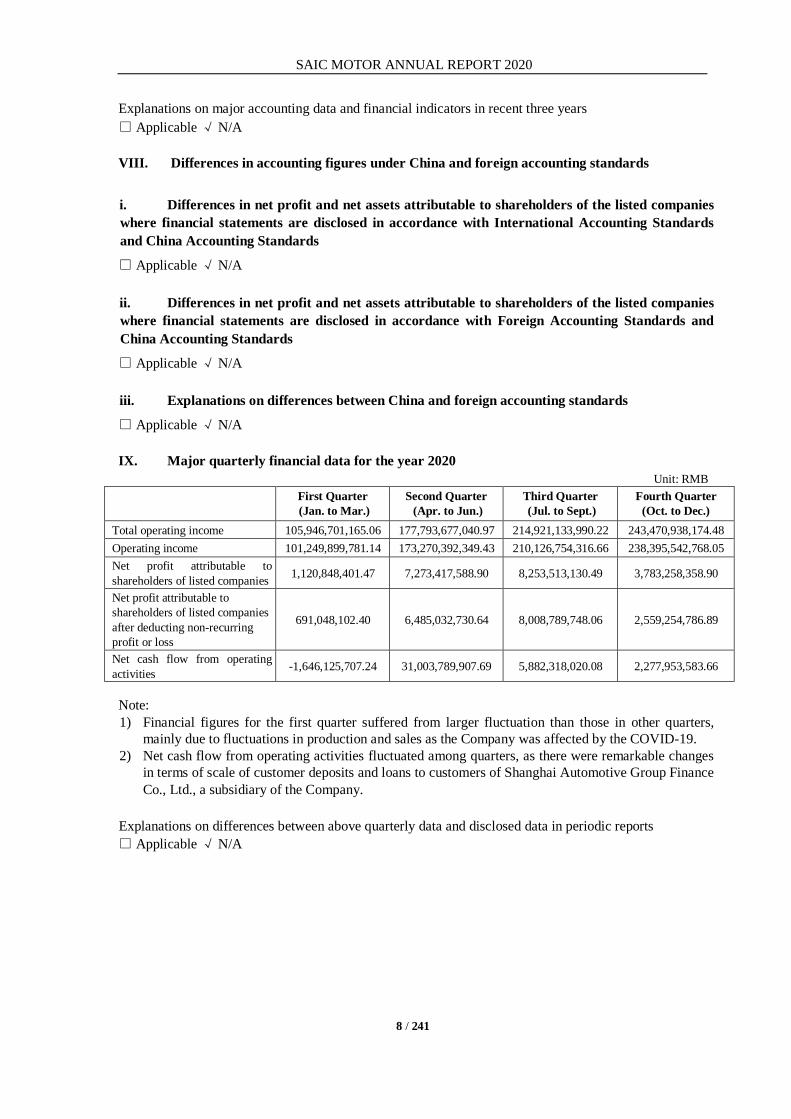
□ Applicable √ N/A IX. Major quarterly financial data for the year 2020
Unit: RMB
First Quarter (Jan. to Mar.)
Second Quarter (Apr. to Jun.)
Third Quarter (Jul. to Sept.)
Fourth Quarter (Oct. to Dec.)
Total operating income 105,946,701,165.06 177,793,677,040.97 214,921,133,990.22 243,470,938,174.48 Operating income 101,249,899,781.14 173,270,392,349.43 210,126,754,316.66 238,395,542,768.05 Net profit attributable to shareholders of listed companies 1,120,848,401.47 7,273,417,588.90 8,253,513,130.49 3,783,258,358.90
Net profit attributable to shareholders of listed companies after deducting non-recurring profit or loss
691,048,102.40 6,485,032,730.64 8,008,789,748.06 2,559,254,786.89
Net cash flow from operating activities -1,646,125,707.24 31,003,789,907.69 5,882,318,020.08 2,277,953,583.66
Note: 1) Financial figures for the first quarter suffered from larger fluctuation than those in other quarters,
mainly due to fluctuations in production and sales as the Company was affected by the COVID-19. 2) Net cash flow from operating activities fluctuated among quarters, as there were remarkable changes
in terms of scale of customer deposits and loans to customers of Shanghai Automotive Group Finance Co., Ltd., a subsidiary of the Company.
Explanations on differences between above quarterly data and disclosed data in periodic reports □ Applicable √ N/A

SAIC MOTOR ANNUAL REPORT 2020
9 / 241
X. Items and amounts of non-recurring profit or loss √ Applicable □ N/A
Unit: RMB Items of non-recurring profit or
loss 2020 Note (if applicable 2019 2018
Profit or loss on disposal of non-current assets 861,690,832.00 442,170,091.22 559,505,098.66
Government grants recognized in profit or loss for the current period, except for those that are closely related to the normal business of the Company, and granted on quota basis continuously based on the state policy
3,078,860,531.18 4,718,105,151.72 3,583,637,108.24
The excess of acquirer's proportionate share of fair value of identifiable net assets of acquiree over the consideration paid for the acquisition of subsidiaries, associates and joint ventures
9,600,202.00 214,426,978.94 1,449,378,901.59
Profit or loss on debt restructuring -196,365.28 -1,275,683.38 -304,726.30 Profit or loss on changes in the fair value of held-for-trading financial assets and held-for-trading financial liabilities and investment income on disposal of held-for-trading financial assets, held-for-trading financial liabilities and available-for-sale financial assets, other than those effective hedging activities relating to normal operating business of the Company
/ / 7,043,819.47
In addition to effective hedging operations related to the normal operations of the Company, gains and losses on fair value changes arising from held-for-trading financial assets, derivative financial assets, held-for-trading financial liabilities, derivative financial liabilities and investment income from the disposal of investments in held-for trading financial assets, derivative financial assets, held-for trading financial liabilities, derivative financial liabilities and other debt investments
7,331,420.95 8,120,839.43 /
Profit or loss on entrusted loans 42,746,182.50 61,038,194.43 53,313,687.71 Income from a business combination not involving enterprises under common control is achieved in stages that involve multiple transactions
307,853,661.00 146,659,331.55

SAIC MOTOR ANNUAL REPORT 2020
10 / 241
Other non-operating income and expenses other than the above -224,575,436.41 59,991,429.10 -310,571,110.00
Effects on minority interests -911,683,877.27 -756,049,659.84 -1,155,074,706.27 Effects on income tax -484,715,038.90 -870,917,630.91 -586,730,794.42
Total 2,686,912,111.77 4,022,269,042.26 3,600,197,278.68 XI. Items measured at fair value √ Applicable □ N/A
Unit: RMB
Item January 1,2020 December 31, 2020 Changes Effects on profit of the period
Held-for-trading financial assets 49,796,599,024.47 54,800,863,245.58 5,004,264,221.11 4,118,614,335.70
Receivables financing 11,401,837,512.65 13,168,746,883.14 1,766,909,370.49 Other current assets - negotiable certificate of deposit
35,220,926,210.05 50,002,187,609.98 14,781,261,399.93
Other debt investments 610,824,643.23 4,640,259,677.07 4,029,435,033.84 Other debt investments due within one year 40,045,800.00 40,045,800.00
Investments in other equity instruments 18,281,876,133.32 20,698,468,429.89 2,416,592,296.57 Other non-current financial assets 2,094,472,035.47 1,879,590,033.02 -214,882,002.45 -264,739,525.37 Held-for-trading financial liabilities 1,211,285,653.79 401,998,111.48 -809,287,542.31 -42,239,532.21
Total 118,617,821,212.98 145,632,159,790.16 27,014,338,577.18 3,811,635,278.12 XII. Other explanations □ Applicable √ N/A

SAIC MOTOR ANNUAL REPORT 2020
11 / 241
Section III Business Overview of the Company
I. Explanations on principal business, operation model and industry profile during the reporting period
As the largest automotive group in China in terms of production and sales currently, the Company divides its businesses into five segments: vehicles, spare parts, mobility and services, finance and international operations, providing the public with products and services including the research and development, production and sales of vehicles (passenger vehicles and commercial vehicles) and spare parts; logistics, mobility and automotive lifestyle services; automotive-related finance, insurance and investment; and automotive-related overseas operations and international commerce and trade. With the profound changes in the global automotive industry in recent years, accelerated formation of the new growth drivers mainly characterized by electric intelligent connection speeds up the pace to build the new competitive racing track for the next round of industrial competition. In the face of the reshaped competitive landscape of the industry, the Company focuses on cultivating and strengthening new growth drivers while continuing to renew the existing ones. On the one hand, the Company is making every effort to promote the industrialization of electric intelligent connected vehicle technology, continuously launching new products with "high technological content", actively exploring demonstration projects with "wide application scenarios", and simultaneously grasping the construction of core industrial chains including battery, electric drive and electric control as well as perception, decision-making and execution. On the other hand, the Company will improve technology capabilities of "data determining experience and software defining vehicles" at an accelerated pace with orderly deployment in software development, big data, artificial intelligence, cloud computing, network security and other emerging technology fields, focus on improving the digital level of automotive products, Mobility services and operation systems, continue to improve the user-centered business model innovation, and promote its transformation into a high-tech enterprise with upgraded technology, globalized business, upscale brand, and ultimate experience in mobility services and products. II. Explanations on significant changes in major assets of the Company during the reporting
period □ Applicable √ N/A III. Analysis of core competitiveness during the reporting period √ Applicable □ N/A At present, the Company ranks first in China in terms of vehicle production and sales, new energy vehicle sales and vehicle export sales, and has a number of single-champion enterprises in sub-sectors such as spare parts, auto finance and auto logistics. The Company takes the lead in comprehensive business system strength ahead of others in the domestic auto industry and provides a solid industrial foundation and resource guarantee for promoting SAIC Motor's innovation transformation and upgrade development strategy continuously. Faced with new trends and competitive racing track in the development of the global automotive industry, the Company has initially built three new competitive advantages in the process of accelerating the implementation of electric intelligent connected vehicle products and enhancing key technology capabilities:
Firstly, the Company has foremost technical hardware foundation. In terms of new energy vehicles, the Company independently dominates the leading core technologies of batteries, electric drives and electric control systems in China; it has achieved global deployment of key technologies such as new-generation lithium batteries, solid-state batteries and IGBT electric drive modules, and self-developed fuel battery system technology with performance comparable to the world's leading level; the Company also has taken the lead in implementation of all relevant technologies. In terms of advanced intelligent driving, the
SAIC MOTOR ANNUAL REPORT 2020
12 / 241
Company independently masters the key technologies of perception, decision-making and execution systems, and has taken the lead in the development of intelligent products and the operation of industrialization projects, and has improved its independent control over the core industry chain of intelligent driving through early investment and deployment of automotive-grade artificial intelligence chips. Secondly, the Company has forward-looking and innovative software capability. By building and improving the software development center, big data center, artificial intelligence center, cloud computing center and network security center, the Company has initially established the foundation of digital software technology system capabilities, and is the first enterprise in the industry to develop "centralized and domain control" electronic architecture, open service-oriented architecture ("SOA") software platform and vehicle data platform with data closed-loop capaility, and strive to create a full-stack technology solution with "cloud, pipe and device" integrated. Third, the Company has an open and integrated ecological platform. Focused on mobility services, the Company has built a "one-stop" mobility service platform with the goal of creating a full-scene intelligent mobility complex. Focused on enterprise operation, the Company is building and improving a digital operation platform in the fields of product R&D, supply chain management, manufacturing and sales service, enabling daily management with digital technology. Focused on win-win cooperation and key issues such as the industrial foundation upgrade and the industrial chain modernization, the Company is also developing cross-border cooperation with strong enterprises in areas such as the construction of new energy industry chain, the R&D and application of intelligent vehicles, the implementation of 5G and AI technologies, the network information security and the Fintech, to create a future-oriented "Circle of Friends" to collaborate in promoting the high-quality development of the automotive industry.
SAIC MOTOR ANNUAL REPORT 2020
13 / 241
Section IV Discussion and Analysis of Operations
I. Discussion and Analysis of Operations
The global economy and automotive market experienced a deep adjustment in 2020 due to the impact of the COVID-19 pandemic, but as the pandemic was effectively controlled domestically, automotive market in China began to get warm from April after the recovery of production and life at home, putting an end to the 21-month long and continuous decline. In particular, since the second half of the year, the domestic auto market has rebounded rapidly thanks to the stabilization of the macro economy and the favorable policies to promote automotive consumption. 25,324,000 vehicles were sold in the domestic market throughout the year, representing a year-on-year decrease of 2.2%. Among them, sales volume of new energy vehicles rebounded strongly in the second half of the year driven by the growth in private demand for high-end electric vehicles and economic mobility products, including 1,269,000 new energy vehicles sold for the year, representing a year-on-year increase of 7%. Throughout the year, the Company achieved total vehicle sales volume of 5.60 million, a year-on-year decrease of 10.2%; in particular, the sales volume in the second half of the year increased by 7.6% year-on-year, the quarterly sales volume grew quarter by quarter compared with that in the same period of prior year, and the quarter-on-quarter growth rate was also significantly better than the average level in the industry. The Company achieved sales volume of new energy vehicles up to 320,000, representing an increase of 73.4% year-on-year, ranked first among all Auto groups in China and third in the world; in addition, the Company had 390,000 vehicles exported and sold overseas in total, representing an increase of 11.3% year-on-year. The Company's vehicle export sales volume grew against the decline by 6.2% in national vehicle exports, accounting for more than one-third of national vehicle exports and ranking first in China for five consecutive years. During the reporting period, the Company achieved the total operating income of RMB 742.132 billion, a year-on-year decrease of 12.00%, and realized net profit attributable to shareholders of listed companies amounting to RMB 20.431 billion, a year-on-year decrease of 20.20%. II. Operation conditions in the reporting period
In the face of severe challenges from the adjustment of automotive market, the impact of pandemic and the shortage of chips, the Company, with a firm will, grasped prevention and control of pandemic, strived for market development and deepened reform and innovation persistently based on existing progress, making great efforts to maintain stable operation in the extraordinary ending year of the 13th Five-Year Plan. In particular, the Company's accelerating economic recovery and growing competitive advantage in new energy vehicles, international operations and other innovation businesses since the second half of the year laid a solid foundation for the start of the 14th Five-Year Plan. 1. Strive for progress while keeping performance stable, and make every effort to seize the market In terms of seizing opportunities in the domestic market, the Company launched a total of over 40 new products throughout the year targeted new demands such as healthy travel and consumer upgrading and combined with hot issues and opportunities such as new infrastructure and logistics and distribution, striving to exploit the potential of niche markets. New MG5, New Buick GL8, Wuling Kaijie and Hongguang MINIEV, Hongyan Jieshi tractor and other new products had outstanding market performance, especially the Wuling Hongguang MINIEV mini electric vehicle, which had been sold the best among all electric vehicles in China since August through its precise positioning of "mobility vehicle for people". At the same time, SAIC GM Cadillac, Wuling microcars and MPVs, SAIC Maxus wide-body light buses and Hongyan dump trucks continued to maintain their leading positions in the market segment.

SAIC MOTOR ANNUAL REPORT 2020
14 / 241
In terms of promoting the marketing system reform, the Company accelerated the enhancement of its online marketing capabilities and increased the operational autonomy of regional marketing through "cloud publishing", virtual showrooms and live video streaming, etc., to promote the channel sinking and refined operations. At the same time, the Company launched value-added services such as lifetime warranty, free lifetime maintenance and used car buyback, developed marketing programs such as "trade-in" and "tribute to the heroes in the battle against COVID-19", and launched special events for automobiles, such as the "May 5th Shopping Festival" and the "Double Eleven", and created the Roewe "R Space" cyber celebrity landmark and urban experience shop, and actively explored new automotive retail models. During the reporting period, dealer recruitment was launched for the SAIC Audi project, together with steady progress of marketing and product launch preparations. In terms of expanding sales in overseas markets, the Company brought into play its differentiation competitive advantages in new energy and the Internet, achieving an increase in overseas sales scale and market share against the trend. Throughout the year, the Company sold 267,000 own brand vehicles in overseas markets, accounting for nearly 70% of the Company's total overseas sales volume. In particular, in the European market, the Company sold more than 40,000 own brand vehicles, including 60% of new energy vehicles in total, and the main product, EZS, had occupied a top position in the market segment in many countries. With products and services entered more than 60 countries and regions around the world, the Company has cultivated nine "10,000 vehicles" overseas regional markets, with annual sales volume up to "30,000 vehicles" in the Middle East, India and Thailand. The Company also doubled its sales volume in Egypt, Australia and New Zealand. 2. Innovate and cope with changes, and establish presence emerging industries to promote transformation In terms of brand strategy upgrading, in order to grasp the consumption upgrading trend and strengthen innovation enabling and brand prosperity, the new round of product launches, in conjunction with rejuvenation of brands including Roewe's new "Lion" and "R" brands, Wuling's Global "Silver" brand and the Maxus EUNIQ, accelerated the implementation and application of innovative technologies and boosted the "youthful" and "intelligent" image of these brands. The Company also created a high-end brand of intelligent electric vehicles, "IM Motors", with Alibaba and Zhangjiang InnoPark, and was committed to achieving "digital determining experience and software defining vehicles" through the independent development of a new generation of electronic architecture converging central computing with domains and an open SOA software platform, making the vehicle a truly mobile intelligent terminal equipped with the subscription-based service capability of hardware pre-installation and software iteration, so as to provide users with full-lifetime customizable software services, and realize mobility reform in the intelligent era. In terms of the construction of the new energy industry chain, the Company continued to promote the upgrading and development of the exclusive architecture of electric vehicles and the development of key systems and core components of the "three electric" systems, including the new-generation electric drive system. All the primary spare parts of the Company's new-generation fuel battery reactor product, PROME M3, have been localized and achieved mass market launch by installing it on the SAIC Maxus EUNIQ7. The 7th generation of SAIC Infineon's IGBTs which have been successfully mass produced, enjoyed world-leading performance and significantly lower costs than imported products, providing an important guarantee for the supply of IGBTs to the Company. At the same time, the Company carried out strategic cooperation with CATL, QuantumScape, SolidEnergy, QingTao and other enterprises to accelerate the domestic and international layout of new-generation lithium batteries and solid-state batteries; accelerated the construction and layout of charging and switching stations based on the "vehicle-electricity separation model"; and the Company has also developed "hydrogen" strategic cooperation with partners such as Baowu Group, Shanghai Airport Authority, Shanghai Chemical Industry Park and Huayi Group to build and share the fuel battery vehicle industry ecology.
In terms of the promotion of the intelligent connected strategy, the Company unveiled MARVEL-R, the world's first mass production model with 5G connectivity; 5G-based intelligent heavy duty trucks
SAIC MOTOR ANNUAL REPORT 2020
15 / 241
developed by SAIC Motor at Yangshan Deepwater Port completed 20,000 TEU per annum of quasi-commercial operations, and "one towing four" queues' driving level and smart driving technology in the port area were also further improved. The Banma Zhixing VENUS system was successfully launched on the Roewe RX5 PLUS and over 100,000 sets of i-Smart internet-based vehicle systems for overseas have been activated. The "4i core technologies" of Smart Driving - iECU, iBOX, iEPS and iBS - have been industrialized. Zhonghaiting's high precision electronic map became the first product to be approved for commercial use by the Ministry of Natural Resources, and had collected high precision map data for nearly 300,000 km of highways nationwide. The construction of Smart Driving Data Factory and increasingly stronger security capability of the intelligent connected network contributed to the Company's productization of four major types of security detection scenarios: far-field, near-field, vehicle-mounted and in-vehicle. The Company built the globally first "5G-based Smart Transportation Demonstration Zone" in Jiading with Huawei and China Mobile, and accelerated the development arrangement of automotive-grade artificial intelligence chips through strategic investments in "unicorn" companies such as Horizon Robotics and Amlogic. The Company also established a joint artificial intelligence laboratory with Horizon Robotics to promote the research and industrialization of machine vision algorithms.
In terms of digital capability, the Company accelerated to strengthen its "cloud, pipe and device" digital capability, and the Z-One Software Center innovated a full-stack intelligent vehicle data platform solution to establish the close "end-to-end" digital product experience. The construction of the first batch of digital factories, including SAIC Volkswagen MEB Plant, SAIC GM Cadillac Plant and Passenger Vehicle Branch Lingang Plant, was accelerated. The Zhengzhou Data Center was delivered and accepted, so the Company's data storage, cloud security and disaster recovery capabilities were further enhanced.
In terms of mobility and service deployment, SAIC Mobility continued to expand its business regions and strengthen the synergistic and complementary development of the four product lines "Xiangdao Mobility Car, Xiangdao Mobility Car Rental, Global Car Sharing and Shen Cheng Cab", with the number of registered users currently exceeding 26 million and the daily order volume exceeding 150,000. SAIC Anji Logistics continued to consolidate its traditional advantages in auto logistics and vigorously develop new businesses such as express delivery, logistics technology, supply chain finance and after-freight market, accelerating its transformation into a technology platform for social services.
3. Stimulate vitality through a deeper reform and an improved mechanism In terms of improving the incentive and constraint mechanism, the Company continued to explore diversified incentive methods in accordance with market-oriented principles, and focused on "contractual management, rank management and performance management", comprehensively strengthening the incentive, constraint and termination mechanism of cadres, and strongly linking cadre management with performance targets.
In terms of deepening the mixed ownership reform, Xiangdao Mobility introduced strategic investors such as Alibaba and CATL to complete the A-round financing; the Company steadily pushed forward the mixed reform of SHPT, Tsingdu Automotive Tech, DiAS, Zhonghaiting and other enterprises, and promoted the market-oriented development of innovative businesses such as IM Motors, RV Life Home and the vehicle-battery separation project. In terms of fulfilling its corporate social responsibility, the Company and its affiliated companies actively participated in various social welfare undertakings such as the battles against pandemic and the fights against poverty. The Company and its affiliated companies denoted cash and vehicles to fight against the pandemic totaling up to RMB 60 million and other nearly 100 million of pieces of pandemic prevention supplies such as masks. At the same time, the Company cooperated with the Han Hong Love Charity Foundation to provide medical assistance to impoverished areas. The four impoverished villages receiving partner assistance from enterprises in Xuanwei, Yunnan have all been lifted out of poverty, and the agreements have been renewed to consolidate the results of poverty eradication.

SAIC MOTOR ANNUAL REPORT 2020
16 / 241
(I) Analysis of principal business 1. Analysis on changes in relevant accounts in income statement and cash flow statement
Unit: RMB Accounts 2020 2019 Changes (%)
Operating income 723,042,589,215.28 826,530,002,967.87 -12.52 Operating costs 645,250,010,442.13 726,100,213,388.33 -11.13 Selling expenses 38,066,862,119.75 57,450,586,216.84 -33.74 Administrative expenses 21,818,404,987.48 22,308,086,660.76 -2.20 R&D expenses 13,395,044,388.06 13,394,150,277.23 0.01 Financial expenses 516,918,858.15 24,366,630.19 2,021.42 Net cash flow from operating activities 37,517,935,804.19 46,271,852,926.75 -18.92 Net cash flow from investing activities -7,110,266,592.95 -39,264,387,323.87 81.89 Net cash flow from financing activities -15,851,827,877.23 -3,093,679,371.44 -412.39
Note: 1) Selling expenses decreased by 33.74% on a year-on-year basis, mainly due to: (1) the adoption of
new revenue standard in the current period so that discounted portion of the car loans were no longer included in selling expenses but to offset against revenue directly; and (2) a year-on-year decrease in the Company's advertising and promotion expenses, etc.
2) Financial expenses increased by 2,021.42% on a year-on-year basis, mainly due to a year-on-year increase of exchange losses of the Company.
3) Net cash flow from investing activities increased by 81.89% on a year-on-year basis, mainly due to the adjustment of the allocation of financial assets according to the liquidity needs of SAIC Finance Co., Ltd., subsidiary of the Company, causing a decrease in cash payments of investment.
4) Net cash flow from financing activities decreased by 412.39% on a year-on-year basis, mainly due to the year-on-year decrease in cash received from the Company's bonds issued during the current period.
2. Income and cost analysis √ Applicable □ N/A Details are as follows: (1). Analysis on principal businesses by industry, product and geographical region
Unit: RMB By industry
By industry Operating income Operating costs Gross
margin ratio (%)
Changes in operating
income (%)
Changes in operating costs (%)
Changes in gross margin ratio (%)
Automotive manufacturing 723,042,589,215.28 645,250,010,442.13 10.76 -12.52 -11.13 Decreased by 1.39 %
Financing 19,089,861,155.45 4,721,771,391.51 75.27 13.67 5.22 Increased by 1.99 % Total 742,132,450,370.73 649,971,781,833.64 12.42 -12.00 -11.03 Decreased by 0.95%
By product
By product Operating income Operating costs Gross
margin ratio (%)
Changes in operating
income (%)
Changes in operating costs (%)
Changes in gross margin ratio (%)
Vehicles 530,905,373,109.04 496,035,995,804.74 6.57 -13.44 -10.86 Decreased by 2.70 % Parts 154,883,501,043.67 120,145,122,474.91 22.43 -6.05 -6.27 Increased by 0.19%

SAIC MOTOR ANNUAL REPORT 2020
17 / 241
Trading 10,413,607,445.39 9,977,276,055.83 4.19 -1.53 1.53 Decreased by 2.89% Service and others 26,840,107,617.18 19,091,616,106.65 28.87 -28.92 -39.64 Increased by 12.64%
Financial services 19,089,861,155.45 4,721,771,391.51 75.27 13.67 5.22 Increased by 1.99%
Total 742,132,450,370.73 649,971,781,833.64 12.42 -12.00 -11.03 Decreased by 0.95% By geographical region
By geographical
region Operating income Operating costs
Gross margin ratio
(%)
Changes in operating
income (%)
Changes in operating costs (%)
Changes in gross margin ratio (%)
China 697,147,986,613.98 609,537,326,999.13 12.57 -13.24 -12.31 Decreased by 0.93% Others 44,984,463,756.75 40,434,454,834.51 10.11 13.03 13.90 Decreased by 0.68% Total 742,132,450,370.73 649,971,781,833.64 12.42 -12.00 -11.03 Decreased by 0.95%
(2). Analysis on production and sales volume √ Applicable □ N/A
Enterprises Unit Production Sales Inventories Changes in production volume (%)
Changes in sales
volume (%)
Changes in inventories (%)
SAIC VOLKSWAGEN Volume 1,495,669 1,505,505 5,413 -22.35 -24.79 -64.81 SAIC GM Volume 1,409,945 1,467,470 2,902 -12.79 -8.29 -95.21 SAIC Passenger Vehicle Volume 640,811 657,867 1,596 -2.06 -2.29 -91.57
SGMW Volume 1,554,683 1,600,057 17,963 -6.04 -3.61 -71.64
SAIC Maxus Volume 190,836 192,617 3,393 25.20 25.87 -34.42 Shanghai Sunwin Volume 2,122 2,122 0 83.09 83.09 -
SAIC-IVECO Hongyan Volume 77,671 80,077 1,746 44.14 37.88 -58.05
Nanjing Iveco Volume 29,564 28,385 2,368 14.06 11.31 99.16 SAIC Motor-CP Volume 25,349 29,102 1,184 0.76 23.69 -70.39 SAIC GM Wuling Indonesia Co., Ltd.
Volume 7,354 7,192 409 -69.92 -71.23 59.77
MG Motor India Private Limited
Volume 30,149 30,088 542 77.34 82.13 12.68
Total Volume 5,464,153 5,600,482 37,516 -11.18 -10.22 -78.37 (3). Cost analysis
Unit: RMB By industry
By industry Items 2020 Proportion
to total costs (%)
2019 Proportion
to total costs (%)
Changes (%)
Automotive manufacturing
Raw materials, labor salaries and wages, depreciation, energy, etc.
645,250,010,442.13 99.27 726,100,213,388.33 99.39 -11.13
Financial services
Labor salaries and wages, depreciation, energy, etc.
4,721,771,391.51 0.73 4,487,533,702.37 0.61 5.22
Total 649,971,781,833.64 100.00 730,587,747,090.70 100.00 -11.03
SAIC MOTOR ANNUAL REPORT 2020
18 / 241
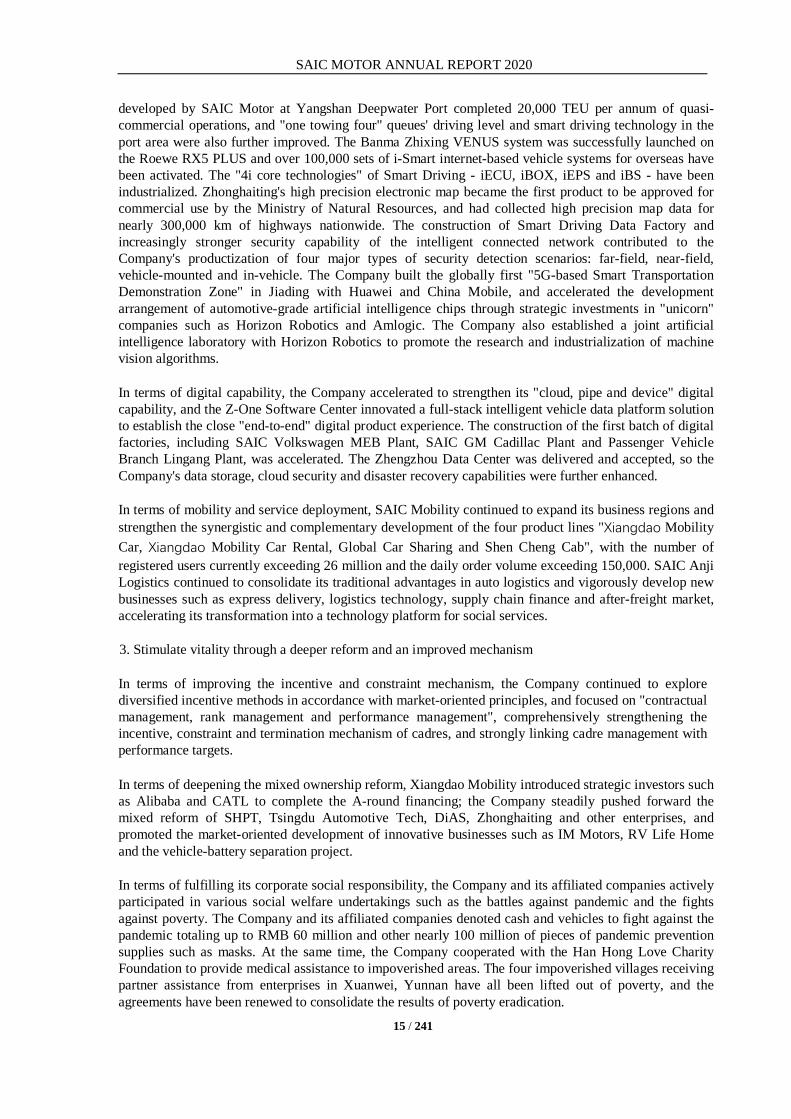
By product
By product Items 2020 Proportion
to total costs (%)
2019 Proportion
to total costs (%)
Changes (%)
Vehicles Raw materials, labor salaries and wages, depreciation, energy, etc.
496,035,995,804.74 76.31 556,458,246,294.66 76.16 -10.86
Parts Raw materials, labor salaries and wages, depreciation, energy, etc.
120,145,122,474.91 18.48 128,184,047,685.11 17.55 -6.27
Trading Raw materials, labor salaries and wages, depreciation, energy, etc.
9,977,276,055.83 1.54 9,826,704,207.43 1.35 1.53
Service and others
Raw materials, labor salaries and wages, depreciation, energy, etc.,
19,091,616,106.65 2.94 31,631,215,201.13 4.33 -39.64
Finance Labor salaries and wages, depreciation, energy, etc.
4,721,771,391.51 0.73 4,487,533,702.37 0.61 5.22
Total 649,971,781,833.64 100.00 730,587,747,090.70 100.00 -11.03 (4). Major customers and suppliers √ Applicable □ N/A Turnover from top five customers amounts to RMB 68,73,0310,500.00, accounting for 9.51% of the total annual turnover, of which the amount from related parties (based on the definition of the Stock Listing Rules of the Shanghai Stock Exchange) is RMB 0, accounting for 0% of the total annual turnover. Purchase from top five suppliers amounts to RMB 360,683,642,000.00, accounting for 55.90% of the total annual purchase amount, of which the amount from related parties (based on the definition of the Stock Listing Rules of the Shanghai Stock Exchange) is RMB 0, accounting for 0 % of the total annual purchase amount. 3. Expenses √ Applicable □ N/A
Unit: RMB Items 2020 2019 Changes (%)
Selling expenses 38,066,862,119.75 57,450,586,216.84 -33.74 Administrative expenses 21,818,404,987.48 22,308,086,660.76 -2.20 R&D expenses 13,395,044,388.06 13,394,150,277.23 0.01 Financial expenses 516,918,858.15 24,366,630.19 2021.42 Income tax expenses 6,703,573,806.26 5,668,885,296.06 18.25
Note: Analysis of changes in expenses is set out in the analysis table of changes in relevant accounts in income statement and cash flow statement.
4. Research and development expenditures (1). Research and development ("R&D") expenditures

SAIC MOTOR ANNUAL REPORT 2020
19 / 241
√ Applicable □ N/A Unit: RMB
R&D investments expensed in the current period 13,395,044,388.06 R&D investments capitalized in the current period 1,572,090,443.98 Total R&D expenditures 14,967,134,832.04 Proportion of R&D expenditures to operating income (%) 2.07 Headcount of R&D personnel 28,076 Proportion of R&D headcount to total employee headcount (%) 12.9 Proportion of capitalization of R&D expenditures (%) 10.50 (2). Explanations □ Applicable √ N/A 5. Cash flows √ Applicable □ N/A
Unit: RMB Items 2020 2019 Changes (%)
Net cash flow from operating activities 37,517,935,804.19 46,271,852,926.75 -18.92
Net cash flow from investing activities -7,110,266,592.95 -39,264,387,323.87 81.89
Net cash flow from financing activities -15,851,827,877.23 -3,093,679,371.44 -412.39
Note: Analysis of changes in cash flows is set out in the analysis table of changes in relevant accounts in income statement and cash flow statement. (II) Explanations on significant changes in profit arising from non-principal business □ Applicable √ N/A (III) Analysis of assets and liabilities √ Applicable □ N/A 1. Assets and liabilities
Unit: RMB
Items Amount December 31, 2020
Proportion to total
assets (%) December 31, 2020
Amount December 31,
2019
Proportion to total assets
(%) December 31, 2019
Changes (%)
Notes receivable 3,486,138,399.12 0.38 6,245,092,532.74 0.74 -44.18 Prepayments 39,101,796,495.91 4.25 28,939,123,052.21 3.41 35.12 Financial assets purchased under resale agreement
9,279,407,143.96 1.01 13,542,369,331.38 1.59 -31.48
Other debt investments 4,640,259,677.07 0.50 610,824,643.23 0.07 659.67
Taking from banks and other financial institutions
69,104,619,433.59 7.52 49,742,870,582.98 5.86 38.92
SAIC MOTOR ANNUAL REPORT 2020
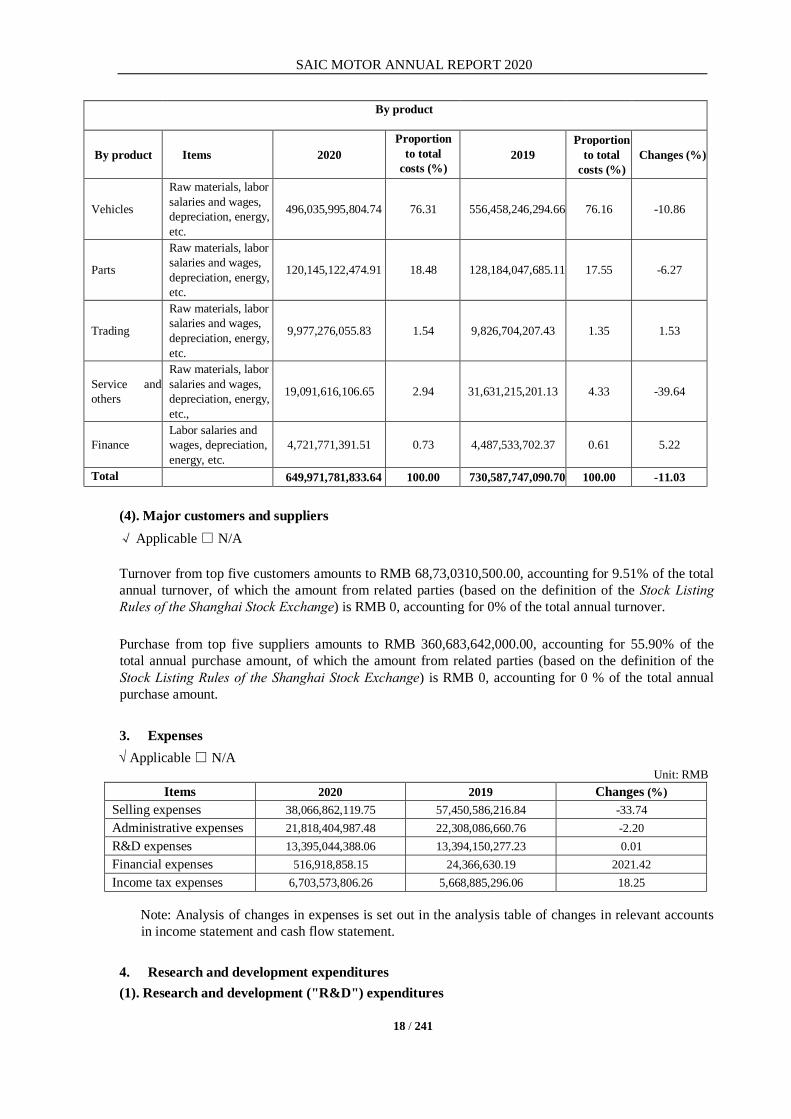
20 / 241
Notes payable 56,098,907,417.38 6.10 32,961,523,274.74 3.88 70.20 Bonds payable 23,492,143,054.46 2.56 16,161,761,950.51 1.90 45.36 Deferred tax liabilities 4,222,812,231.28 0.46 3,111,792,424.53 0.37 35.70
Other explanations 1) The balance of notes receivable decreased by 44.18% compared to the closing balance of the
previous period, mainly due to the reclassification of notes receivable into held-for-trading financial assets and receivables financing by the Company under the requirements of new financial instrument standard.
2) The balance of prepayments increased by 35.12% compared to the closing balance of the previous period, mainly due to the increase in the prepayments to the Company's joint venture vehicle enterprises.
3) The balance of financial assets purchased under resale agreement decreased by 31.48% compared to the closing balance of the previous period, mainly due to the decrease in asset allocation for repurchase business by SAIC Finance Co., Ltd., subsidiary of the Company, based on liquidity needs.
4) The balance of other debt investments increased by 659.67% compared to the closing balance of the previous period, mainly due to the increase in the allocation for negotiable certificate of deposit and bonds by SAIC Finance Co., Ltd., subsidiary of the Company, based on market return and the Company's liquidity condition.
5) The balance of taking from banks and other financial institutions increased by 38.92% compared to the closing balance of the previous period, mainly due to the increase in taking from banks and other financial institutions by SAIC Finance Co., Ltd., subsidiary of the Company, based on liquidity needs.
6) The balance of notes payable increased by 70.20% compared to the closing balance of the previous period, mainly due to the increase in the notes due to the joint venture vehicle enterprises by the Company.
7) The balance of bonds payable increased by 45.36% compared to the closing balance of the previous period, mainly due to issuance of bonds by the Company for development of automotive finance and finance lease.
8) The balance of deferred tax liabilities increased by 35.70% compared to the closing balance of the previous period, mainly due to recognition of deferred tax liabilities accordingly with a higher fair value of the Company's financial assets.
2. Restriction of significant assets as at December 31, 2020 □ Applicable √ N/A 3. Other explanations □ Applicable √ N/A (IV) Analysis on operational data in automotive industry √ Applicable □ N/A Details are as follows: Analysis of operation data for automotive manufacturing 1. Production capacity √ Applicable □ N/A Existing production capacity √ Applicable □ N/A

SAIC MOTOR ANNUAL REPORT 2020
21 / 241
Unit: 0'000 (vehicles)
Major manufactures Designed production capacity
Production capacity in the reporting
period Utilization rate (%)
SAIC VOLKSWAGEN 208.8 149.6 72 SAIC GM 190.8 141.0 74 SAIC Passenger Vehicle 80.0 64.1 80 SGMW 176.0 155.5 88 SAIC Maxus 37.5 19.1 51 Shanghai Sunwin 0.2 0.2 106 SAIC – IVECO Hongyan 7.5 7.8 104 Nanjing Iveco 6.0 3.0 49 SAIC Motor-CP 4.0 2.5 63 SAIC-GM-WULING MOTOR INDONESIA 6.0 0.7 12
MG Motor India Private Limited 5.6 3.0 54 Capacity under construction √ Applicable □ N/A
Unit: RMB 0'000 Workshop under construction
Planed investment
Amount invested in the period
Accumulated investment
Estimated completion date
Estimated capacity
SAIC Passenger Vehicle Zhengzhou Base, Phase II
535,980 32,730 432,710 2022 240,000
Capacity calculation criteria √ Applicable □ N/A The calculation of designed production capacity is on the basis of 250 working days per year, and 16 working hours per day, namely 4000 working hours for one year; "production capacity in the period" refers to actual output for the reporting period; utilization rate is actual output for the reporting period divided by designed production capacity. 2. Sales and production of vehicles √ Applicable □ N/A By vehicle type √ Applicable □ N/A
Sales (Volume) Production (Volume)
Categories 2020 2019 Changes
(%) 2020 2019 Changes
(%)
Basic passenger car 2,340,036 2,831,041 -17.34 2,300,192 2,758,014 -16.60 Sports utility vehicle (SUV) 1,595,719 1,698,184 -6.03 1,537,796 1,687,453 -8.87 Multi-purpose vehicle (MPV) 641,385 849,249 -24.48 604,830 856,900 -29.42 Cross passenger car 258,269 263,062 -1.82 257,823 263,387 -2.11 Passenger car 90,303 59,143 52.69 91,150 58,872 54.83
SAIC MOTOR ANNUAL REPORT 2020
22 / 241
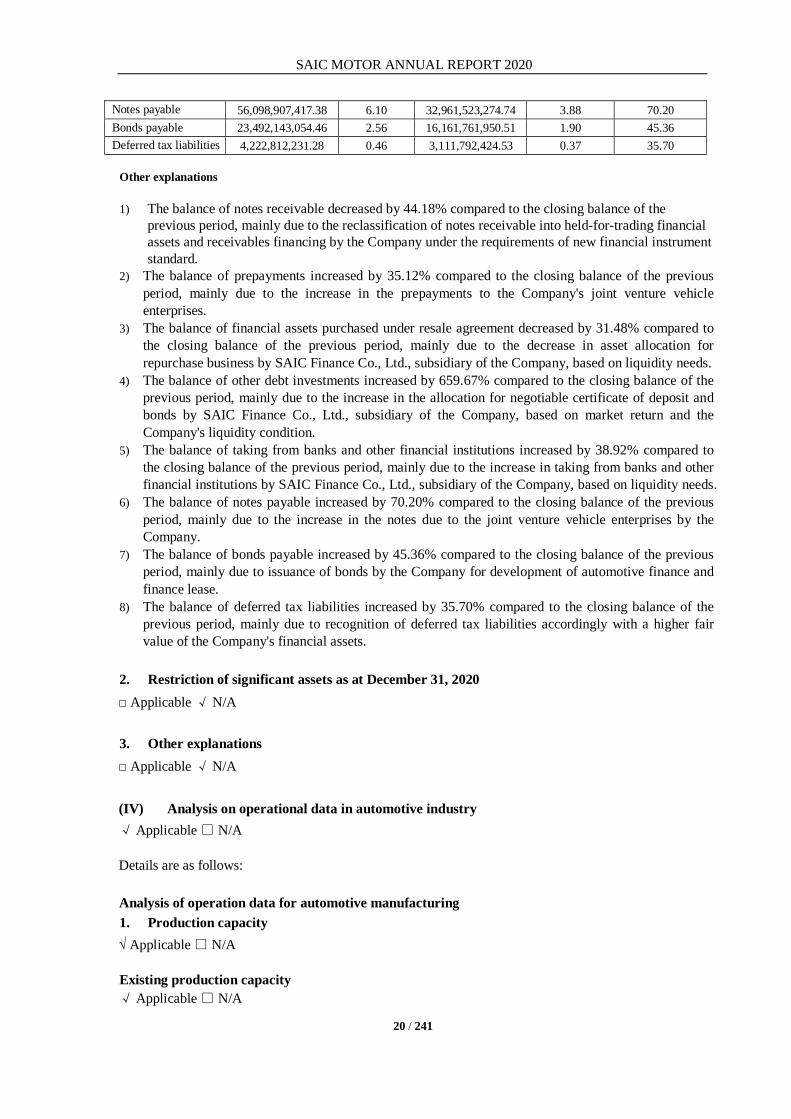
Truck 674,770 537,271 25.59 672,362 527,286 27.51 Total 5,600,482 6,237,950 -10.22 5,464,153 6,151,912 -11.18 By region √ Applicable □ N/A
Sales in domestic market (Volume) Sales in overseas market (Volume)
Categories 2020 2019 Changes (%) 2020 2019 Changes (%)
Basic passenger car 2,246,777 2,682,664 -16.25 93,259 148,377 -37.15 Sports utility vehicle (SUV) 1,349,228 1,542,061 -12.50 246,491 156,123 57.88 Multi-purpose vehicle (MPV) 631,195 833,027 -24.23 10,190 16,222 -37.18 Cross passenger car 247,095 254,058 -2.74 11,174 9,004 24.10 Passenger car 85,783 54,468 57.49 4,520 4,675 -3.32 Truck 650,724 521,569 24.76 24,046 15,702 53.14 Total 5,210,802 5,887,847 -11.50 389,680 350,103 11.30
3. Sales and production of auto parts √ Applicable □ N/A The Company's businesses of auto parts are mainly operated by HASCO (security code: 600741), a subsidiary controlled by the Company. For details of its business in 2020, refer to the annual report 2020 published on www.sse.com.cn by HASCO (600741).
Categorized by spare parts □ Applicable √ N/A Categorized by market □ Applicable √ N/A 4. New energy vehicles √ Applicable □ N/A Production capacity of new energy vehicles √ Applicable □ N/A
Major workshops Designed production capacity (Volume)
Production capacity in the period (Volume)
Utilization rate (%)
SAIC VOLKSWAGEN - 30,516 - SAIC GM - 9,999 - SAIC Passenger Vehicle - 72,851 - SGMW - 177,275 - SAIC Maxus - 9,667 - Shanghai Sunwin - 2,116 - Nanjing Iveco - 268 - SAIC Motor-CP Co., Ltd. - 787 -
SAIC MOTOR ANNUAL REPORT 2020
23 / 241
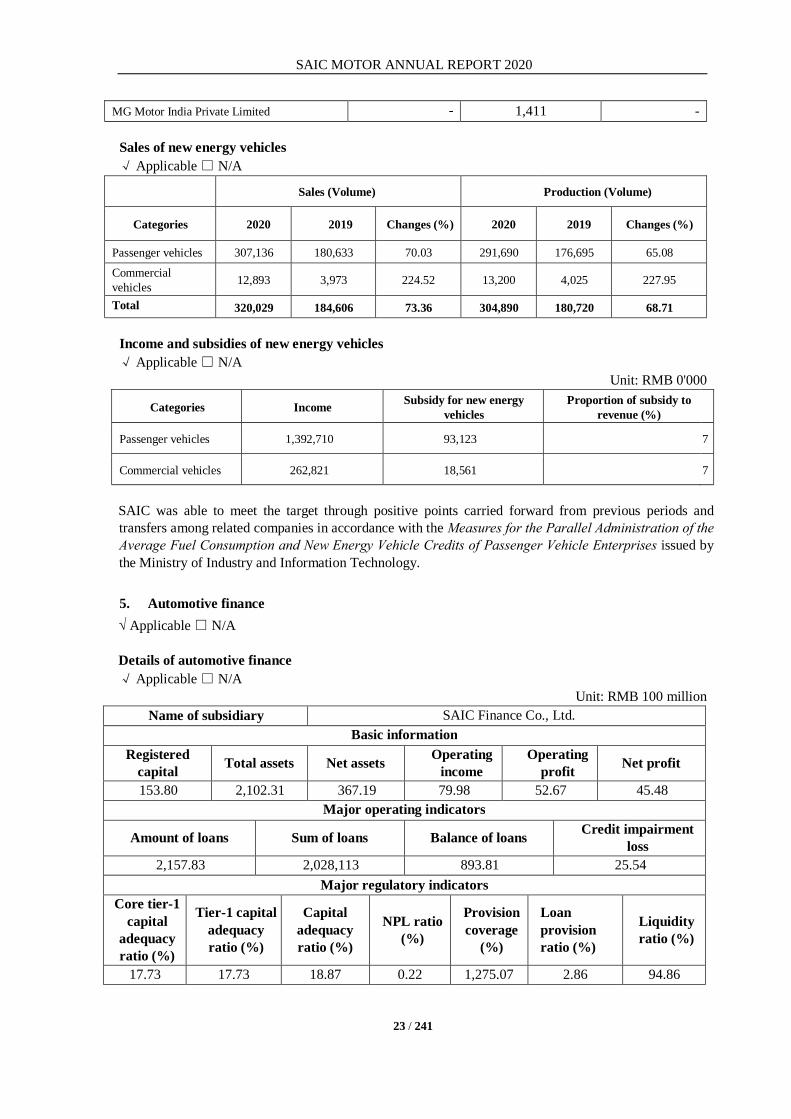
MG Motor India Private Limited - 1,411 - Sales of new energy vehicles √ Applicable □ N/A
Sales (Volume) Production (Volume)
Categories 2020 2019 Changes (%) 2020 2019 Changes (%)
Passenger vehicles 307,136 180,633 70.03 291,690 176,695 65.08 Commercial vehicles 12,893 3,973 224.52 13,200 4,025 227.95
Total 320,029 184,606 73.36 304,890 180,720 68.71 Income and subsidies of new energy vehicles √ Applicable □ N/A
Unit: RMB 0'000
Categories Income Subsidy for new energy vehicles
Proportion of subsidy to revenue (%)
Passenger vehicles 1,392,710 93,123 7
Commercial vehicles 262,821 18,561 7 SAIC was able to meet the target through positive points carried forward from previous periods and transfers among related companies in accordance with the Measures for the Parallel Administration of the Average Fuel Consumption and New Energy Vehicle Credits of Passenger Vehicle Enterprises issued by the Ministry of Industry and Information Technology. 5. Automotive finance √ Applicable □ N/A Details of automotive finance √ Applicable □ N/A
Unit: RMB 100 million Name of subsidiary SAIC Finance Co., Ltd.
Basic information Registered
capital Total assets Net assets Operating income
Operating profit Net profit
153.80 2,102.31 367.19 79.98 52.67 45.48 Major operating indicators
Amount of loans Sum of loans Balance of loans Credit impairment loss
2,157.83 2,028,113 893.81 25.54 Major regulatory indicators
Core tier-1 capital
adequacy ratio (%)
Tier-1 capital adequacy ratio (%)
Capital adequacy ratio (%)
NPL ratio (%)
Provision coverage
(%)
Loan provision ratio (%)
Liquidity ratio (%)
17.73 17.73 18.87 0.22 1,275.07 2.86 94.86
SAIC MOTOR ANNUAL REPORT 2020
24 / 241
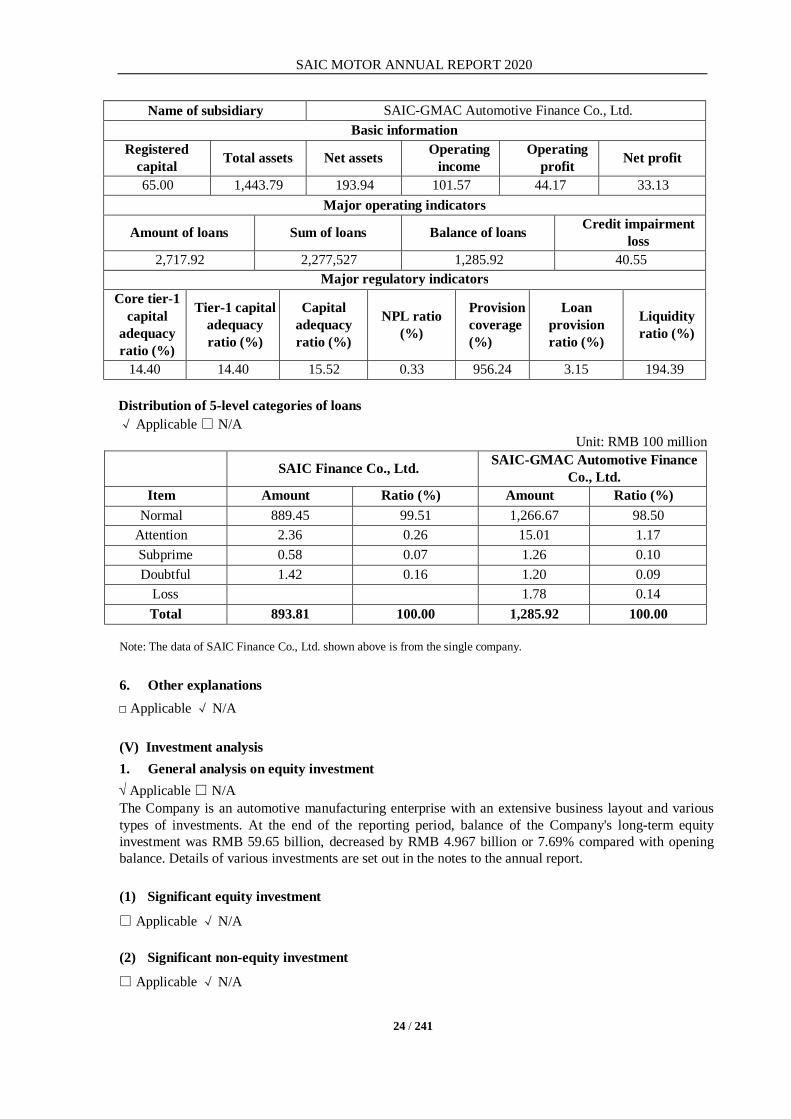
Name of subsidiary SAIC-GMAC Automotive Finance Co., Ltd. Basic information
Registered capital Total assets Net assets Operating
income Operating
profit Net profit
65.00 1,443.79 193.94 101.57 44.17 33.13 Major operating indicators
Amount of loans Sum of loans Balance of loans Credit impairment loss
2,717.92 2,277,527 1,285.92 40.55 Major regulatory indicators
Core tier-1 capital
adequacy ratio (%)
Tier-1 capital adequacy ratio (%)
Capital adequacy ratio (%)
NPL ratio (%)
Provision coverage (%)
Loan provision ratio (%)
Liquidity ratio (%)
14.40 14.40 15.52 0.33 956.24 3.15 194.39 Distribution of 5-level categories of loans √ Applicable □ N/A
Unit: RMB 100 million SAIC Finance Co., Ltd. SAIC-GMAC Automotive Finance
Co., Ltd. Item Amount Ratio (%) Amount Ratio (%)
Normal 889.45 99.51 1,266.67 98.50 Attention 2.36 0.26 15.01 1.17 Subprime 0.58 0.07 1.26 0.10 Doubtful 1.42 0.16 1.20 0.09
Loss 1.78 0.14 Total 893.81 100.00 1,285.92 100.00
Note: The data of SAIC Finance Co., Ltd. shown above is from the single company. 6. Other explanations □ Applicable √ N/A (V) Investment analysis 1. General analysis on equity investment √ Applicable □ N/A The Company is an automotive manufacturing enterprise with an extensive business layout and various types of investments. At the end of the reporting period, balance of the Company's long-term equity investment was RMB 59.65 billion, decreased by RMB 4.967 billion or 7.69% compared with opening balance. Details of various investments are set out in the notes to the annual report. (1) Significant equity investment
□ Applicable √ N/A (2) Significant non-equity investment □ Applicable √ N/A

SAIC MOTOR ANNUAL REPORT 2020
25 / 241
(3) Financial assets at fair value √ Applicable □ N/A
Unit: RMB
Items December 31, 2019 December 31, 2020 Changes Effects on profits of the period
Held-for-trading financial assets 49,796,599,024.47 54,800,863,245.58 5,004,264,221.11 4,118,614,335.70
Receivables financing 11,401,837,512.65 13,168,746,883.14 1,766,909,370.49 Other current assets - negotiable certificate of deposit
35,220,926,210.05 50,002,187,609.98 14,781,261,399.93
Other debt investments 610,824,643.23 4,640,259,677.07 4,029,435,033.84 Other debt investments due within one year 40,045,800.00 40,045,800.00
Investments in other equity instruments 18,281,876,133.32 20,698,468,429.89 2,416,592,296.57 Other non-current financial assets 2,094,472,035.47 1,879,590,033.02 -214,882,002.45 -264,739,525.37
Total 117,406,535,559.19 145,230,161,678.68 27,823,626,119.49 3,853,874,810.33 (VI) Disposal of significant assets and equity □ Applicable √ N/A (VII) Analysis of major holding companies and joint stock companies √ Applicable □ N/A
Unit: RMB 0'000
Company name
Business nature
Main products or services
Registered capital Total assets
Net assets attributable to owners of the company
Total revenue
Net profit attributable to owners of the company
SAIC VOLKSWAGEN Manufacturing
Manufacturing and sales of vehicles
1,150,000 12,665,899.29 3,275,062.28 17,449,668.72 1,548,852.99
SAIC GM Manufacturing Manufacturing and sales of vehicles
USD 108,300 10,526,636.26 1,958,060.74 17,729,541.86 410,321.33
SGMW Manufacturing Manufacturing and sales of vehicles
166,808 5,291,452.72 770,993.64 7,292,678.33 14,234.11
HASCO Manufacturing Manufacturing and sales of auto-parts
315,272 15,043,595.96 5,253,885.52 13,357,763.97 540,327.69
SFC Finance Financial service 1,538,000 35,044,654.27 4,139,225.36 1,815,237.13 513,838.52
(VIII) Structured entities controlled by the Company √ Applicable □ N/A As at December 31, 2020, the Company directly consolidated four structured entities and included those structured entities over which it had control in its consolidated financial statements, after taking into account its investment decision rights, its exposure to variable returns and the use of its investment decision rights to affect variable returns. Refer to the notes to this report for the relevant information.
SAIC MOTOR ANNUAL REPORT 2020
26 / 241
III. Discussion and analysis on future development of the Company (I) Industry structure and development trend √ Applicable □ N/A At present and for some time to come, China is still in important period of strategic opportunity for our development, with new changes in both opportunities and challenges. The Central Government has proposed to accelerate the construction of a new development pattern giving priority to domestic circulation and promoting positive interplay between domestic circulation and international circulation. The impact on the development of China's automotive industry is mainly reflected in three aspects: firstly, the strategy of expanding domestic demand is conductive to the sustainable development of the domestic automobile market; secondly, advancing reform and innovation is conductive to the quality and upgrading of automobile enterprises; and thirdly, boosting a higher level of opening up to the outside world is conductive to the integration of the automobile industry into the globe. Against this background, the Company expects the domestic automotive market to show a "box" trend in the short to medium term, and may enter a new phase of volatile growth in the long term. According to the market trends, as global economy rebounds, China avoids sharp turns in macro policies, and automotive market also enjoys a relatively low year-on-year basis, it is expected that in 2021, we will put an end to the continuous decline of automotive market since 2018. It is estimated that the domestic demand of vehicles will reach 26.10 million, increased by 3.1% year-on-year, including approximately 21.50 million of passenger vehicles with a year-on-year increase of 7.3%, 4.60 million of commercial vehicles with a year-on-year decrease of 12.9% and 1.70 million of new energy vehicles with a year-on-year increase of 34%. In the long run, the potential of the lower-tier market will be further stimulated by the huge market demands in China, expanding middle-income groups, rural revitalization and integrated urban-rural development in countries. At the same time, according to the experience of the pioneering countries, after the first "demand plateau" adjustment and recovery when passenger car stock reaches approximately 150 per 1,000 persons, annual sales volume of new cars will reach new highs and will take a long time to achieve a fluctuating "new growth" in passenger car stock from150 to400 per1,000 persons.
In terms of the end users ,the company realizes that the different income levels and various age level of users can drive the new trend of automotive consumption demands. On the one hand, increases in high-income group boosts continuous upgrading of consumption, while the low-income groups also have a huge potentials for consumption growth; however, the older but richer groups may want to replace or purchase a new car, while "Generation Z" prefer to new and different cars. Their huge consumption potential will act as an accelerator of the quality improvement and brand upgrading of China's automobile consumption.
From a technology-driven point of view, the new competitive racing track of the electric intelligent connections may soon become the mainstream competitive track. With the increasingly maturing electrification technology, the new energy vehicles will enjoy rapid growth. Electrification is developing at a parallel pace with intelligent connections, creating "digital determining experiences and software defining vehicles" as an important new trend. In addition, new energy vehicles enjoy a more obvious differentiation advantage, better meeting the needs of consumers in pursuit of fashion and experience of technology.
Digital transformation will redefines the relationship between automotive companies and users. Driven by data, automotive companies will establish a relationship with users when the products are design rather than when the products are delivered. A more accurate user profile will be provided to make the products meet the real needs of users better. At the same time, through the data connection and data circulation between automobile companies and users, a high-frequency and multi-dimensional interaction will be established, so as to realize the whole lifetime user services from vehicle manufacturing, selling to use and car life. Digitalization will greatly change the way vehicles are produced and the model business is

SAIC MOTOR ANNUAL REPORT 2020
27 / 241
operated, and the digital ecology will become an important new ecology for the automobile industry and an important new means to achieve commercial profitability in the future. (II) The Company's development strategy √ Applicable □ N/A The Company will, under market-orientated strategy, firmly grasp the general direction of the "new four modernizations" and core capabilities construction of its own brand. Driven by continuous and rapid implementation of major innovations and supported by digital transformation, the Company will achieve parallel development of manufacturing and services, create a new SAIC Motor with more influential brand, more competitive system and more flexible mechanism and ensure to seize the high ground for development of global automotive industry in the future, so as to accelerate the pace to a trillion-level world-class automotive group with global competitiveness and international brand influence. The Company will achieve the "four transformations":Brand structure will change from joint venture-based to both self-owned brands and joint ventures brands; Product technology will change from traditional automotive technology to electric intelligent connected upgrading; Market structure will change from domestic-based to both domestic and overseas marketplaces; Business scope will change from manufacturing to parallel development of manufacturing and services.
The Company will make decisive progress in the three critical battles: firstly, the Company will enhance its brands to make SAIC Motor's independent brands to be the leader of China's independent brands; secondly, the Company will accelerate the cultivation of differentiated competitiveness by global operations, laying a foundation for the Company to achieve full internationalization; and thirdly, the Company will provide precise services continuously meeting the service needs of users throughout their lifetime and becoming the main vehicle for the Company's transformation into a comprehensive service provider for mobility. The Company will strengthen its "two supports". Firstly, the Company will advance digital transformation and digital capabilities construction of product services, management and business ecology orderly focused on key areas and projects, boosting the number of direct subscribers and digital revenue to a new level. The Company will effectively control cost but to provide superior user experience, and reach an industry-leading level of digital operation capability. Secondly, the Company will advance SOE reform and mixed reform to acquire a more diversified shareholding structure; continue to promote market-based financing and spin-off listings of innovative enterprises and nurture a number of "unicorns" in the industry; and vigorously break down barriers that restrict the development of enterprises, improving flexibility of institutional mechanism, optimization of resource allocation and agility of the response. (III) Business plan √ Applicable □ N/A In 2021, the Company will adhere to work keynote to seek for improvement on a steady basis guided by President Xi Jinping's thought on socialism with China's characteristics for a new era based on new development stage, new development concept and new development pattern. The Company will "take advantage of the trend and adjust the structure" for economy to expand domestic and overseas markets and optimize economic operation quality, structure and efficiency without the slightest slacking in normal pandemic prevention and control; the Company will "respond to the trend and sustain its efforts" in innovation development, acting as the innovation-driven development engine to speed up the implementation of major strategic projects such as high-end brands, electric intelligence and digital transformation; in terms of deepening reform, the Company targets key areas such as mixed reform of state-owned enterprises, capital structure diversification of innovative enterprises and reform of the cadre and personnel system on market-oriented basis and accelerate changes in institutional mechanisms to make breakthroughs, continuously stimulating the vitality of enterprises and talent teams. The Company

SAIC MOTOR ANNUAL REPORT 2020
28 / 241
strives to achieve an annual sales of about 6.17 million vehicles, representing an increase of 10.2% on a year-on-year basis, and has expected a total operating income of RMB 830 billion and a total operating cost of RMB 720 billion, starting a new journey to build a world class automotive group. Major tasks of the Company's operations in 2021: Firstly, the Company should grasp the market rhythm and optimize the production and sales structure of vehicle business, deepen the building of new energy systemic capability, and advance channel reform and brand promotion focused on improving product and service power; secondly, the Company should continue to optimize its deployment of spare parts business, enhance the independent and controllable capability of key core technologies for emerging businesses, and vigorously promote cost reduction and efficiency increase and intelligent manufacturing; thirdly, the Company should reinforce user-oriented mobility services and refined operations focused on emerging electric intelligent connected vehicles, deploy more charging stations, strengthen the mobility service platform digitalization and intelligence, innovate and optimize business models and enhance sustainable profitability; fourthly, the Company should enhance finance enabling by virtue of financial instrument chains to promote Fintech level faster and provide better service to users; fifthly, the Company should continue to improve its international business deployment, deeply plowed the overseas bases and seize opportunities in international markets, achieving sustainable and rapid growth in overseas sales volume; sixthly, the Company should insist on market-orientated technological innovation, emphasize precision and efficiency, collaborate with internal and external resources, and accelerate the development of technology productization, product differentiation and enterprise marketization; and seventh, the Company should grasp normalized pandemic prevention and control, deeply improve basic management system and mechanism construction, and enhance management level and work efficiency. (IV) Potential risks √ Applicable □ N/A Company's potential risks: If COVID-19 pandemic rebounds, the recovery of global economy and stabilization of automotive industry chain may suffer from an adverse impact; meanwhile, shortage of chips also brings a challenge to the global automotive supply chain. (V) Other explanations □ Applicable √ N/A IV. Explanations on conditions and reasons for undisclosed matters due to regulations or other special reasons □ Applicable √ N/A

SAIC MOTOR ANNUAL REPORT 2020
29 / 241
Section V Important Events
I. Preliminary proposal for distribution of ordinary shares or capitalization of capital reserve (I) Determination, implementation and adjustment of policies on cash dividends √ Applicable □ N/A Pursuant to item 164 of the Articles of Association, profit distribution policy of the Company is: (1) Profit distribution of the Company shall reflect a reasonable investment return for the investors and take into account of sustainable development of the Company. Profit distribution policy shall be consistent and stable. (2) The Company can distribute dividends in cash or by stocks, and cash dividend should be considered first. The Company can make mid-year cash dividend distribution. (3) The Company shall make cash dividends distribution when its net profits and accumulated retained profits in the audited financial statements of the Company during the current year are presented in positive figures, and the cash flow of the Company can satisfy the Company's ordinary operation and sustainable development. Total amount for cash dividends distribution by the Company in the current year shall be equal to or exceed 30% of net profits attributable to shareholders of the listed companies in the audited consolidated financial statements in the current year. Cash paid for the repurchase of shares shall be deemed as cash dividends. (4) If the Company does not propose cash dividends distribution plan though it makes profits and accumulated retained profits are presented in positive figures during the current year, independent directors shall issue a clear opinion, meanwhile the Company shall explain in details the reasons for not making profit distribution in the annual report, and the usage of the funds which would otherwise have been used for cash dividend distribution. (5) If circumstance exists that shareholders occupy the funds of the Company which is in violation of the regulations, the occupied amount should be deducted from the shareholder's cash dividend in order to repay the cash the shareholders occupy. (6) When significant changes incur in the Company's operating environment or the Board think it is necessary, the Company will changes the profit distribution policies. During the adjustment of profit distribution policies proposed by the Company, opinions of minority shareholders should be considered, while reasons for the adjustment should be specified by the Board on the basis of an issue of independent opinions from independent directors. Resolution in respect of the adjustment of profit distribution shall be passed by over 2/3 of voting rights held by shareholders who attend the general meeting. During the reporting period, the Company completed the profit distribution of year 2019. The profit distribution policies comply with the requirements of Article of Association of the Company and the approval process, which has fully protected the interests of investors. (II) Plan or preliminary proposal for distribution of ordinary shares and capitalization of capital reserve of the Company in recent three years
Unit: RMB
Year Stock
dividend per 10 shares (shares)
Cash dividend
per 10 shares (RMB)
(inclusive of tax)
Capital reserve
transferred into share
capital per 10 shares (share)
Amount of cash dividend
(inclusive of tax)
Net profit attributable to shareholders of
the listed companies in consolidated
financial statements for the year of dividend
distribution
Proportion of net profit
attributable to the listed
company in consolidated
financial statements (%)
2020 0 6.20 0 7,176,685,655.90 20,431,037,479.76 35.13 2019 0 8.80 0 10,281,446,001.20 25,603,384,202.16 40.16 2018 0 12.60 0 14,721,161,319.90 36,009,210,583.83 40.88
SAIC MOTOR ANNUAL REPORT 2020
30 / 241
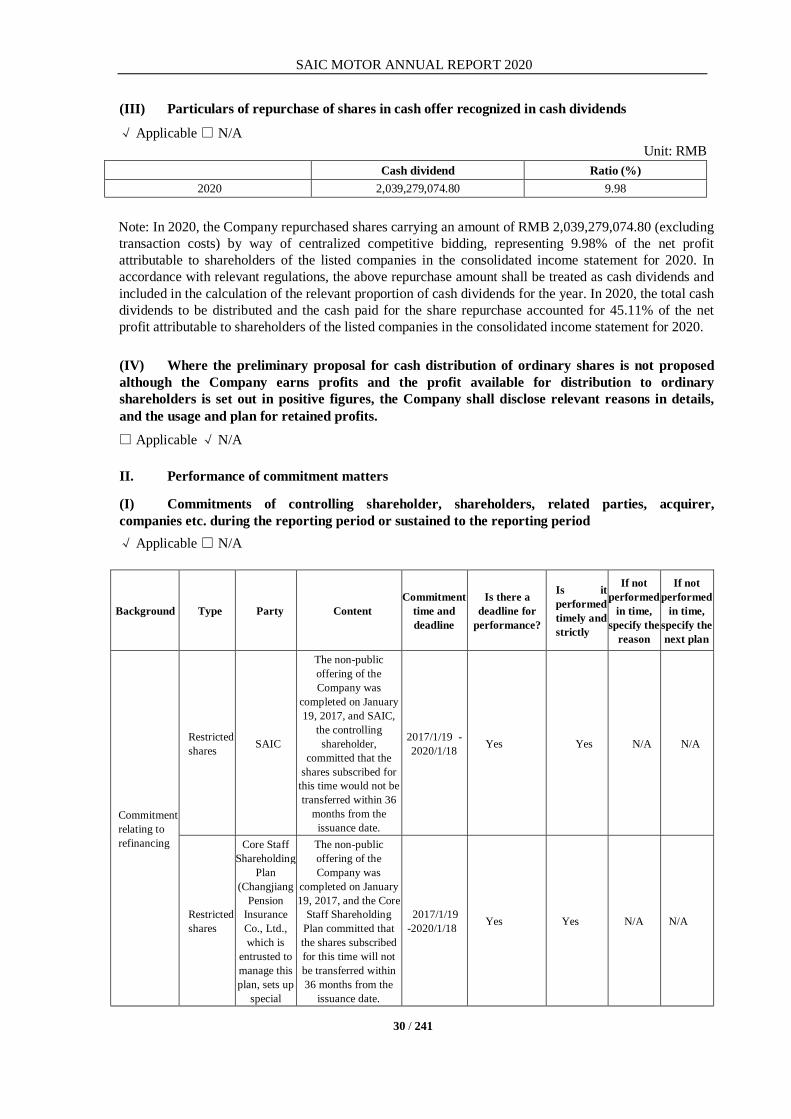
(III) Particulars of repurchase of shares in cash offer recognized in cash dividends
√ Applicable □ N/A Unit: RMB
Cash dividend Ratio (%) 2020 2,039,279,074.80 9.98
Note: In 2020, the Company repurchased shares carrying an amount of RMB 2,039,279,074.80 (excluding transaction costs) by way of centralized competitive bidding, representing 9.98% of the net profit attributable to shareholders of the listed companies in the consolidated income statement for 2020. In accordance with relevant regulations, the above repurchase amount shall be treated as cash dividends and included in the calculation of the relevant proportion of cash dividends for the year. In 2020, the total cash dividends to be distributed and the cash paid for the share repurchase accounted for 45.11% of the net profit attributable to shareholders of the listed companies in the consolidated income statement for 2020.
(IV) Where the preliminary proposal for cash distribution of ordinary shares is not proposed although the Company earns profits and the profit available for distribution to ordinary shareholders is set out in positive figures, the Company shall disclose relevant reasons in details, and the usage and plan for retained profits. □ Applicable √ N/A II. Performance of commitment matters
(I) Commitments of controlling shareholder, shareholders, related parties, acquirer, companies etc. during the reporting period or sustained to the reporting period √ Applicable □ N/A
Background Type Party Content Commitment
time and deadline
Is there a deadline for
performance?
Is it performed timely and strictly
If not performed
in time, specify the
reason
If not performed
in time, specify the next plan
Commitment relating to refinancing
Restricted shares SAIC
The non-public offering of the Company was
completed on January 19, 2017, and SAIC,
the controlling shareholder,
committed that the shares subscribed for
this time would not be transferred within 36
months from the issuance date.
2017/1/19 -2020/1/18 Yes Yes N/A N/A
Restricted shares
Core Staff Shareholding
Plan (Changjiang
Pension Insurance Co., Ltd., which is
entrusted to manage this plan, sets up
special
The non-public offering of the Company was
completed on January 19, 2017, and the Core
Staff Shareholding Plan committed that the shares subscribed for this time will not be transferred within 36 months from the
issuance date.
2017/1/19 -2020/1/18 Yes Yes N/A N/A

SAIC MOTOR ANNUAL REPORT 2020
31 / 241
products for subscription)
(II) For assets or projects which the Company has prepared profit forecast and are still within the forecast period in the reporting period, the Company shall state whether the forecasted profits are achieved and explain the reasons. □ Achieved □ Not achieved √ N/A (III) Completion of performance commitment and its effects on goodwill impairment testing
□ Applicable √ N/A III. Funds occupation and settlement during the reporting period □ Applicable √ N/A IV. Explanations on "Non-standard Auditors' Report" issued by certified public accountants □ Applicable √ N/A V. Analysis and explanation of the Company on reasons and effects of changes in accounting policies and accounting estimates and correction of significant accounting errors (I) Analysis and explanation of the Company on reasons and effects of changes in accounting policies and accounting estimates √ Applicable □ N/A In 2017, the Ministry of Finance revised and issued "Accounting Standard for Business Enterprises No. 14 - Revenue". In accordance with the above amendments to the accounting standards and implementation deadline requirements, the Company made corresponding changes to the original accounting policies with application starting from January 1, 2020. The above changes have been considered and approved by the 11th session of the seventh board of directors, the 11th session of the seventh board of supervisors, and the independent directors have expressed their opinions hereon. The changes in accounting policy do not require retroactive adjustments to the Company's comparative financial statements, will not significantly change the way how the Company to recognize the revenue, and will not have material impact on the Company's financial position, results of operations and cash flows. For details, please refer to the Company's announcement dated April 30, 2020 "Announcement of SAIC Group on Changes to Accounting Policies"(No. 2020-018). (II) Analysis and explanation of the Company on reasons and effect of correction in significant accounting errors □ Applicable √ N/A (III) Communication with the previous certified public accountants □ Applicable √ N/A (IV) Other explanations
□ Applicable √ N/A VI. Appointment and dismissal of certified public accountants
Unit: RMB 0'000 Current auditor
SAIC MOTOR ANNUAL REPORT 2020
32 / 241
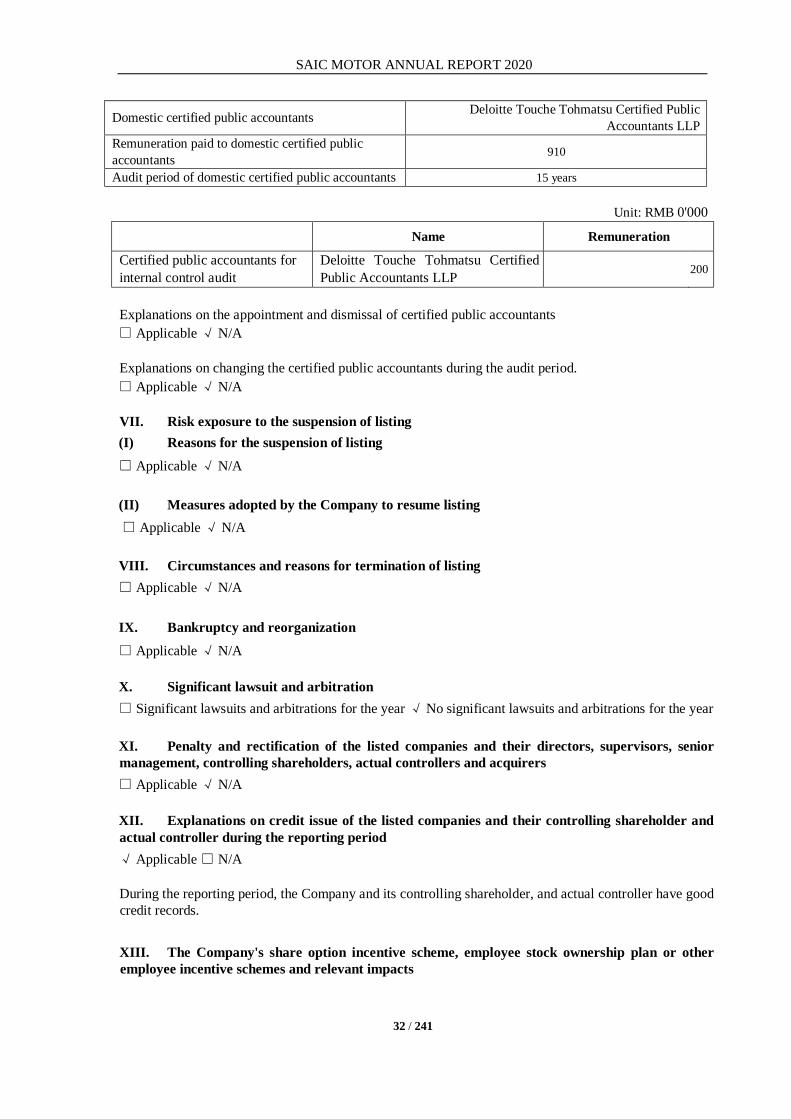
Domestic certified public accountants Deloitte Touche Tohmatsu Certified Public Accountants LLP
Remuneration paid to domestic certified public accountants 910
Audit period of domestic certified public accountants 15 years
Unit: RMB 0'000 Name Remuneration
Certified public accountants for internal control audit
Deloitte Touche Tohmatsu Certified Public Accountants LLP
200
Explanations on the appointment and dismissal of certified public accountants □ Applicable √ N/A Explanations on changing the certified public accountants during the audit period. □ Applicable √ N/A VII. Risk exposure to the suspension of listing (I) Reasons for the suspension of listing □ Applicable √ N/A (II) Measures adopted by the Company to resume listing □ Applicable √ N/A VIII. Circumstances and reasons for termination of listing □ Applicable √ N/A IX. Bankruptcy and reorganization □ Applicable √ N/A X. Significant lawsuit and arbitration □ Significant lawsuits and arbitrations for the year √ No significant lawsuits and arbitrations for the year XI. Penalty and rectification of the listed companies and their directors, supervisors, senior management, controlling shareholders, actual controllers and acquirers □ Applicable √ N/A XII. Explanations on credit issue of the listed companies and their controlling shareholder and actual controller during the reporting period √ Applicable □ N/A During the reporting period, the Company and its controlling shareholder, and actual controller have good credit records. XIII. The Company's share option incentive scheme, employee stock ownership plan or other employee incentive schemes and relevant impacts
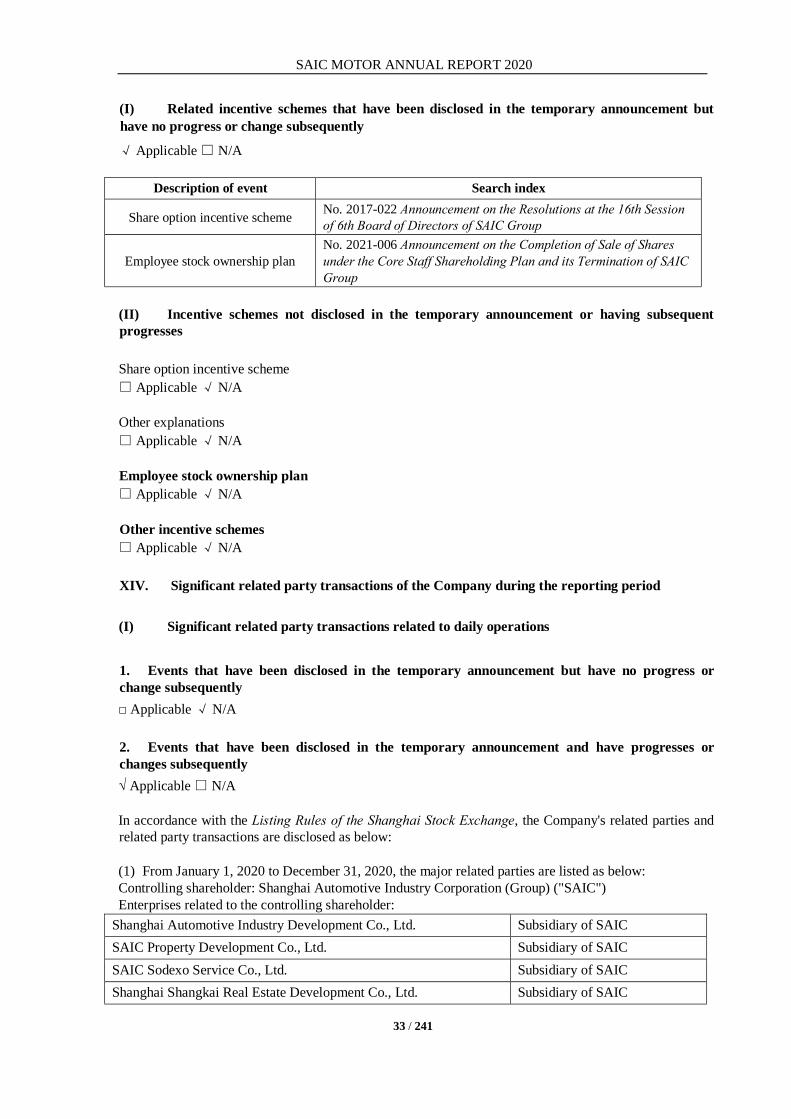
SAIC MOTOR ANNUAL REPORT 2020
33 / 241
(I) Related incentive schemes that have been disclosed in the temporary announcement but have no progress or change subsequently
√ Applicable □ N/A
Description of event Search index
Share option incentive scheme No. 2017-022 Announcement on the Resolutions at the 16th Session of 6th Board of Directors of SAIC Group
Employee stock ownership plan No. 2021-006 Announcement on the Completion of Sale of Shares under the Core Staff Shareholding Plan and its Termination of SAIC Group
(II) Incentive schemes not disclosed in the temporary announcement or having subsequent progresses Share option incentive scheme □ Applicable √ N/A Other explanations □ Applicable √ N/A Employee stock ownership plan □ Applicable √ N/A Other incentive schemes □ Applicable √ N/A XIV. Significant related party transactions of the Company during the reporting period (I) Significant related party transactions related to daily operations
1. Events that have been disclosed in the temporary announcement but have no progress or change subsequently □ Applicable √ N/A 2. Events that have been disclosed in the temporary announcement and have progresses or changes subsequently √ Applicable □ N/A In accordance with the Listing Rules of the Shanghai Stock Exchange, the Company's related parties and related party transactions are disclosed as below: (1) From January 1, 2020 to December 31, 2020, the major related parties are listed as below: Controlling shareholder: Shanghai Automotive Industry Corporation (Group) ("SAIC") Enterprises related to the controlling shareholder:
Shanghai Automotive Industry Development Co., Ltd. Subsidiary of SAIC SAIC Property Development Co., Ltd. Subsidiary of SAIC SAIC Sodexo Service Co., Ltd. Subsidiary of SAIC Shanghai Shangkai Real Estate Development Co., Ltd. Subsidiary of SAIC

SAIC MOTOR ANNUAL REPORT 2020
34 / 241
Shanghai Automotive Electronics Factory Subsidiary of SAIC Shanghai Internal Combustion Engine Research Institute Subsidiary of SAIC Changzhou SAIKC Mobility Investment Partnership (Limited Partnership)
Subsidiary of SAIC
Shanghai Saike Mobility Technology Service Co., Ltd. Subsidiary of SAIC Shanghai International Automobile City Development Co., Ltd. Associate of SAIC Shanghai Qiyuan Human Resources Consulting Co., Ltd. Subsidiary of SAIC Shanghai Automotive Industry Real Estate Development Co., Ltd. Subsidiary of SAIC Shenzhen SAIC South Industrial Co., Ltd. Subsidiary of SAIC Shenzhen SAIC South Automobile Sales Service Co., Ltd. Subsidiary of SAIC Suzhou Wanlong Huayu Logistics Co., Ltd. Subsidiary of SAIC Shanghai Huazhen Logistics Co., Ltd. Subsidiary of SAIC Shanghai Huazhen Transportation Co., Ltd. Subsidiary of SAIC Zhejiang Huayu Logistics Co., Ltd. Subsidiary of SAIC Wuhan Sanjiang Huayu Logistics Co., Ltd. Subsidiary of SAIC Guangzhou Wanlong Huajiang Logistics Co., Ltd. Subsidiary of SAIC Anji Car Rental & Leasing Co., Ltd. Subsidiary of SAIC Suzhou Xiangdao Car Leasing Co., Ltd. Subsidiary of SAIC Wuxi Xiangdao Car Leasing Co., Ltd. Subsidiary of SAIC Zhengzhou SAIC New Energy Leasing Automotive Co., Ltd. Subsidiary of SAIC Shanghai Rui Chuang Automobile Sales Co., Ltd. Subsidiary of SAIC Liyang Aiweitugou Equity Investment Partnership (Limited Partnership)
Subsidiary of SAIC
RV Life Home Technology Co., Ltd. Subsidiary of SAIC Shanghai Saike Intelligent Transportation Technology Co., Ltd. Subsidiary of SAIC Shanghai Automotive Industry Co., Ltd. Subsidiary of SAIC Shanghai Automotive Industry Environmental Engineering Co., Ltd. Subsidiary of SAIC Shanghai Shangfa Real Estate Development Co., Ltd. Subsidiary of SAIC Shanghai Kaihong Investment Management Co., Ltd. Subsidiary of SAIC SAIC Housing Exchange Co., Ltd. Subsidiary of SAIC Shanghai Engineering Industry Internal Combustion Engine Detection Bureau
Subsidiary of SAIC
SAIC Japan Co., Ltd. Subsidiary of SAIC Shanghai Kuobu Industry Co., Ltd. Subsidiary of SAIC Jiaxing Xinsheng Investment Partnership (Limited Partnership) Subsidiary of SAIC Anji Huayu Logistics Technology (Shanghai) Co., Ltd. Subsidiary of SAIC Shihe Natong (Shanghai) Industry Co., Ltd. Subsidiary of SAIC Jiangsu Tiandi Huayu IOT Technology Co., Ltd. Subsidiary of SAIC Shanghai Dudu Supply Chain Management Co., Ltd. Subsidiary of SAIC Duilong Deqing Tongli Venture Capital Management Centre (Limited Partnership) Subsidiary of SAIC
Others:
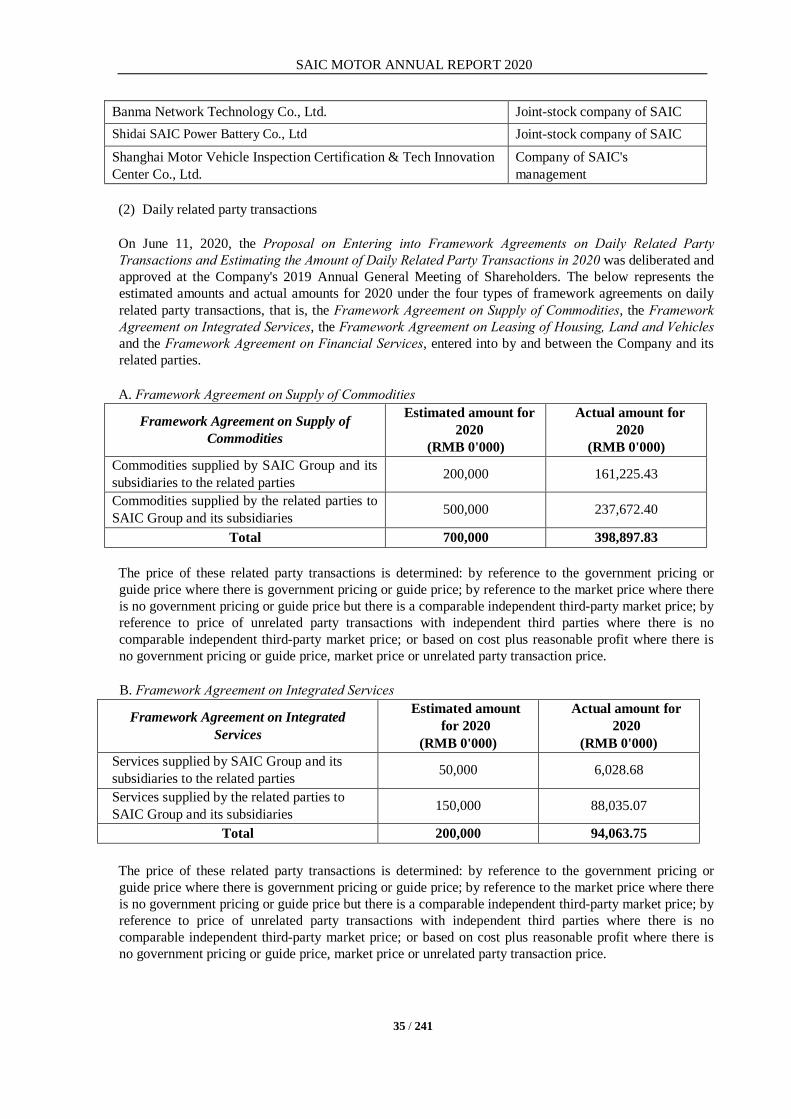
SAIC MOTOR ANNUAL REPORT 2020
35 / 241
Banma Network Technology Co., Ltd. Joint-stock company of SAIC Shidai SAIC Power Battery Co., Ltd Joint-stock company of SAIC Shanghai Motor Vehicle Inspection Certification & Tech Innovation Center Co., Ltd.
Company of SAIC's management
(2) Daily related party transactions On June 11, 2020, the Proposal on Entering into Framework Agreements on Daily Related Party Transactions and Estimating the Amount of Daily Related Party Transactions in 2020 was deliberated and approved at the Company's 2019 Annual General Meeting of Shareholders. The below represents the estimated amounts and actual amounts for 2020 under the four types of framework agreements on daily related party transactions, that is, the Framework Agreement on Supply of Commodities, the Framework Agreement on Integrated Services, the Framework Agreement on Leasing of Housing, Land and Vehicles and the Framework Agreement on Financial Services, entered into by and between the Company and its related parties. A. Framework Agreement on Supply of Commodities
Framework Agreement on Supply of Commodities
Estimated amount for 2020
(RMB 0'000)
Actual amount for 2020
(RMB 0'000) Commodities supplied by SAIC Group and its subsidiaries to the related parties 200,000 161,225.43
Commodities supplied by the related parties to SAIC Group and its subsidiaries 500,000 237,672.40
Total 700,000 398,897.83 The price of these related party transactions is determined: by reference to the government pricing or guide price where there is government pricing or guide price; by reference to the market price where there is no government pricing or guide price but there is a comparable independent third-party market price; by reference to price of unrelated party transactions with independent third parties where there is no comparable independent third-party market price; or based on cost plus reasonable profit where there is no government pricing or guide price, market price or unrelated party transaction price. B. Framework Agreement on Integrated Services
Framework Agreement on Integrated Services
Estimated amount for 2020
(RMB 0'000)
Actual amount for 2020
(RMB 0'000) Services supplied by SAIC Group and its subsidiaries to the related parties 50,000 6,028.68
Services supplied by the related parties to SAIC Group and its subsidiaries 150,000 88,035.07
Total 200,000 94,063.75 The price of these related party transactions is determined: by reference to the government pricing or guide price where there is government pricing or guide price; by reference to the market price where there is no government pricing or guide price but there is a comparable independent third-party market price; by reference to price of unrelated party transactions with independent third parties where there is no comparable independent third-party market price; or based on cost plus reasonable profit where there is no government pricing or guide price, market price or unrelated party transaction price.
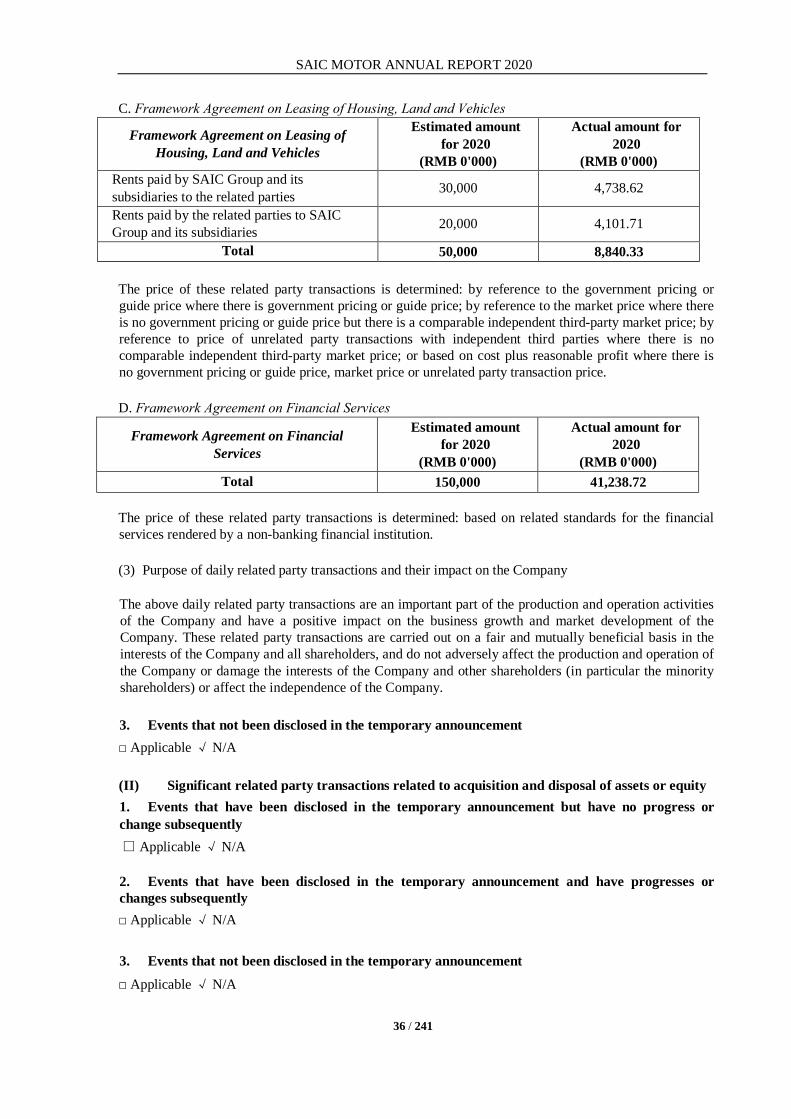
SAIC MOTOR ANNUAL REPORT 2020
36 / 241
C. Framework Agreement on Leasing of Housing, Land and Vehicles
Framework Agreement on Leasing of Housing, Land and Vehicles
Estimated amount for 2020
(RMB 0'000)
Actual amount for 2020
(RMB 0'000) Rents paid by SAIC Group and its subsidiaries to the related parties 30,000 4,738.62
Rents paid by the related parties to SAIC Group and its subsidiaries 20,000 4,101.71
Total 50,000 8,840.33 The price of these related party transactions is determined: by reference to the government pricing or guide price where there is government pricing or guide price; by reference to the market price where there is no government pricing or guide price but there is a comparable independent third-party market price; by reference to price of unrelated party transactions with independent third parties where there is no comparable independent third-party market price; or based on cost plus reasonable profit where there is no government pricing or guide price, market price or unrelated party transaction price. D. Framework Agreement on Financial Services
Framework Agreement on Financial Services
Estimated amount for 2020
(RMB 0'000)
Actual amount for 2020
(RMB 0'000) Total 150,000 41,238.72
The price of these related party transactions is determined: based on related standards for the financial services rendered by a non-banking financial institution. (3) Purpose of daily related party transactions and their impact on the Company The above daily related party transactions are an important part of the production and operation activities of the Company and have a positive impact on the business growth and market development of the Company. These related party transactions are carried out on a fair and mutually beneficial basis in the interests of the Company and all shareholders, and do not adversely affect the production and operation of the Company or damage the interests of the Company and other shareholders (in particular the minority shareholders) or affect the independence of the Company. 3. Events that not been disclosed in the temporary announcement □ Applicable √ N/A (II) Significant related party transactions related to acquisition and disposal of assets or equity 1. Events that have been disclosed in the temporary announcement but have no progress or change subsequently □ Applicable √ N/A 2. Events that have been disclosed in the temporary announcement and have progresses or changes subsequently □ Applicable √ N/A 3. Events that not been disclosed in the temporary announcement □ Applicable √ N/A
SAIC MOTOR ANNUAL REPORT 2020
37 / 241
4. Performance achievements involving performance convention in reporting period should be disclosed □ Applicable √ N/A (III) Significant related party transactions related to external joint investment 1. Events that have been disclosed in the temporary announcement but have no progress or change subsequently □ Applicable √ N/A 2. Events that have been disclosed in the temporary announcement and have progresses or changes subsequently □ Applicable √ N/A 3. Events that not been disclosed in the temporary announcement □ Applicable √ N/A (IV) Balances due from/to related parties 1. Events that have been disclosed in the temporary announcement but have no progress or change subsequently □ Applicable √ N/A 2. Events that have been disclosed in the temporary announcement and have progresses or changes subsequently □ Applicable √ N/A 3. Events that not been disclosed in the temporary announcement □ Applicable √ N/A (V) Others □ Applicable √ N/A XV. Significant contracts and performance of contracts (I) Trusteeship, contracting and leasing 1. Trusteeship □ Applicable √ N/A 2. Contracting □ Applicable √ N/A 3. Leasing □ Applicable √ N/A (II) Guarantee √ Applicable □ N/A
Unit: RMB 0'000
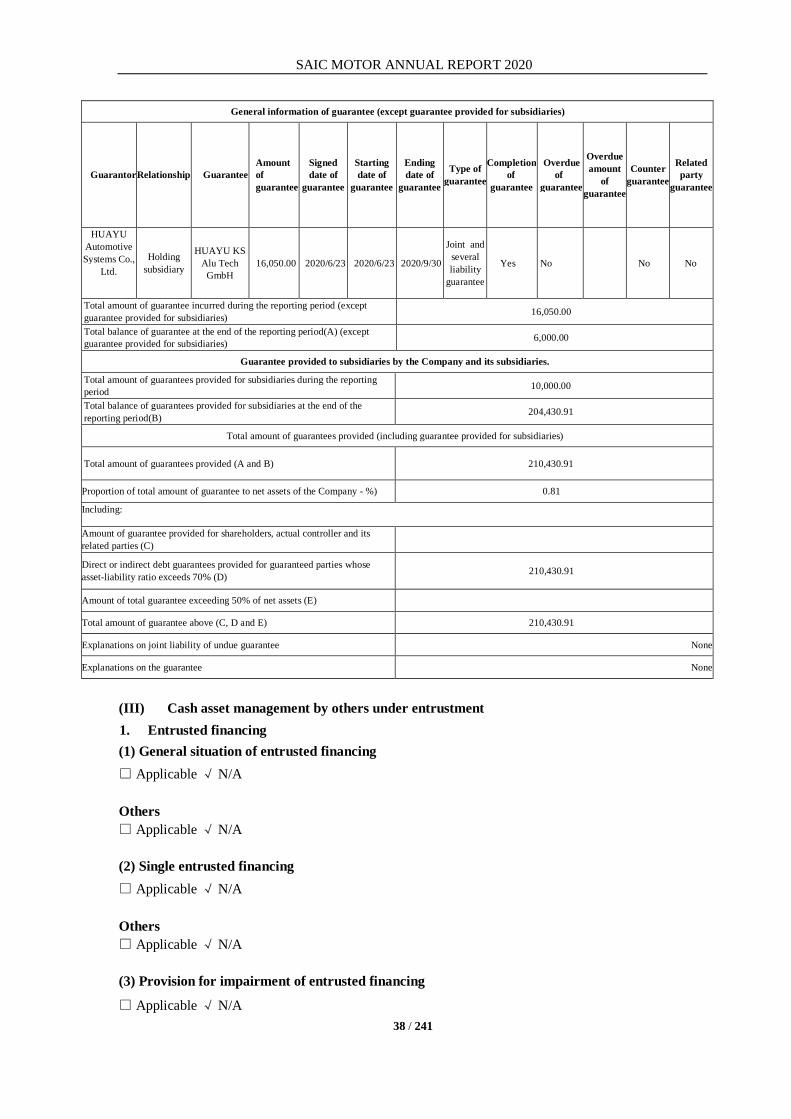
SAIC MOTOR ANNUAL REPORT 2020
38 / 241
General information of guarantee (except guarantee provided for subsidiaries)
GuarantorRelationship Guarantee Amount of guarantee
Signed date of
guarantee
Starting date of
guarantee
Ending date of
guarantee
Type of guarantee
Completion of
guarantee
Overdue of
guarantee
Overdue amount
of guarantee
Counter guarantee
Related party
guarantee
HUAYU Automotive Systems Co.,
Ltd. Holding
subsidiary
HUAYU KS Alu Tech
GmbH 16,050.00 2020/6/23 2020/6/23 2020/9/30
Joint and several liability
guarantee
Yes No No No
Total amount of guarantee incurred during the reporting period (except guarantee provided for subsidiaries) 16,050.00
Total balance of guarantee at the end of the reporting period(A) (except guarantee provided for subsidiaries) 6,000.00
Guarantee provided to subsidiaries by the Company and its subsidiaries.
Total amount of guarantees provided for subsidiaries during the reporting period 10,000.00
Total balance of guarantees provided for subsidiaries at the end of the reporting period(B) 204,430.91
Total amount of guarantees provided (including guarantee provided for subsidiaries)
Total amount of guarantees provided (A and B) 210,430.91
Proportion of total amount of guarantee to net assets of the Company - %) 0.81
Including:
Amount of guarantee provided for shareholders, actual controller and its related parties (C)
Direct or indirect debt guarantees provided for guaranteed parties whose asset-liability ratio exceeds 70% (D) 210,430.91
Amount of total guarantee exceeding 50% of net assets (E)
Total amount of guarantee above (C, D and E) 210,430.91
Explanations on joint liability of undue guarantee None
Explanations on the guarantee None
(III) Cash asset management by others under entrustment 1. Entrusted financing (1) General situation of entrusted financing □ Applicable √ N/A Others □ Applicable √ N/A (2) Single entrusted financing □ Applicable √ N/A Others □ Applicable √ N/A (3) Provision for impairment of entrusted financing
□ Applicable √ N/A
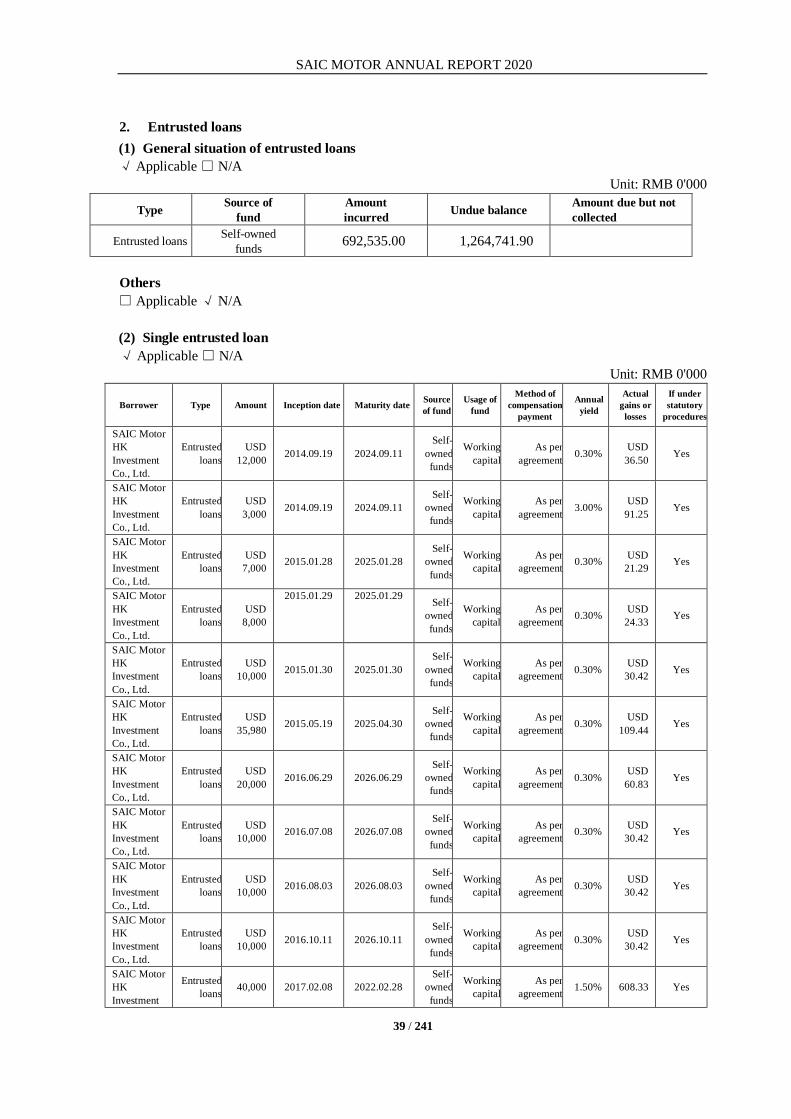
SAIC MOTOR ANNUAL REPORT 2020
39 / 241
2. Entrusted loans (1) General situation of entrusted loans √ Applicable □ N/A
Unit: RMB 0'000
Type Source of fund
Amount incurred Undue balance Amount due but not
collected Entrusted loans Self-owned
funds 692,535.00 1,264,741.90
Others □ Applicable √ N/A (2) Single entrusted loan √ Applicable □ N/A
Unit: RMB 0'000
Borrower Type Amount Inception date Maturity date Source of fund
Usage of fund
Method of compensation
payment Annual
yield Actual
gains or losses
If under statutory
procedures
SAIC Motor HK Investment Co., Ltd.
Entrusted loans
USD 12,000 2014.09.19 2024.09.11
Self-owned funds
Working capital
As per agreement 0.30% USD
36.50 Yes
SAIC Motor HK Investment Co., Ltd.
Entrusted loans
USD 3,000 2014.09.19 2024.09.11
Self-owned funds
Working capital
As per agreement 3.00% USD
91.25 Yes
SAIC Motor HK Investment Co., Ltd.
Entrusted loans
USD 7,000 2015.01.28 2025.01.28
Self-owned funds
Working capital
As per agreement 0.30% USD
21.29 Yes
SAIC Motor HK Investment Co., Ltd.
Entrusted loans
USD 8,000
2015.01.29 2025.01.29 Self-owned funds
Working capital
As per agreement 0.30% USD
24.33 Yes
SAIC Motor HK Investment Co., Ltd.
Entrusted loans
USD 10,000 2015.01.30 2025.01.30
Self-owned funds
Working capital
As per agreement 0.30% USD
30.42 Yes
SAIC Motor HK Investment Co., Ltd.
Entrusted loans
USD 35,980 2015.05.19 2025.04.30
Self-owned funds
Working capital
As per agreement 0.30% USD
109.44 Yes
SAIC Motor HK Investment Co., Ltd.
Entrusted loans
USD 20,000 2016.06.29 2026.06.29
Self-owned funds
Working capital
As per agreement 0.30% USD
60.83 Yes
SAIC Motor HK Investment Co., Ltd.
Entrusted loans
USD 10,000 2016.07.08 2026.07.08
Self-owned funds
Working capital
As per agreement 0.30% USD
30.42 Yes
SAIC Motor HK Investment Co., Ltd.
Entrusted loans
USD 10,000 2016.08.03 2026.08.03
Self-owned funds
Working capital
As per agreement 0.30% USD
30.42 Yes
SAIC Motor HK Investment Co., Ltd.
Entrusted loans
USD 10,000 2016.10.11 2026.10.11
Self-owned funds
Working capital
As per agreement 0.30% USD
30.42 Yes
SAIC Motor HK Investment
Entrusted loans 40,000 2017.02.08 2022.02.28
Self-owned funds
Working capital
As per agreement 1.50% 608.33 Yes

SAIC MOTOR ANNUAL REPORT 2020
40 / 241
Co., Ltd.
Shanghai Sunwin Bus Co., Ltd.
Entrusted loans 5,500 2020.03.23 2021.03.22
Self-owned funds
Working capital
As per agreement 2.10% 91.12 Yes
Shanghai Sunwin Bus Co., Ltd.
Entrusted loans 6,500 2020.03.23 2022.03.22
Self-owned funds
Working capital
As per agreement 2.25% 115.38 Yes
Shanghai Chexiangjia Automotive Technology Service Co., Ltd.
Entrusted loans 15,000 2020.03.27 2023.03.26
Self-owned funds
Working capital
As per agreement 4.75% 554.17 Yes
Shanghai Chexiangjia Automotive Technology Service Co., Ltd.
Entrusted loans 15,000 2020.06.24 2023.06.23
Self-owned funds
Working capital
As per agreement 4.65% 370.06 Yes
Shanghai Chexiangjia Automotive Technology Service Co., Ltd.
Entrusted loans 15,000 2020.12.01 2023.11.30
Self-owned funds
Working capital
As per agreement 4.65% 60.06 Yes
Global Car Sharing and Rental Co., Ltd.
Entrusted loans 29,368 2020.08.25 2021.08.11
Self-owned funds
Working capital
As per agreement 4.35% 457.77 Yes
Global Car Sharing and Rental Co., Ltd.
Entrusted loans 33,000 2020.09.27 2021.09.26
Self-owned funds
Working capital
As per agreement 4.67% 410.96 Yes
Global Car Sharing and Rental Co., Ltd.
Entrusted loans 29,368 2020.11.17 2021.11.16
Self-owned funds
Working capital
As per agreement 4.35% 159.69 Yes
SAIC International Trade Co., Ltd.
Entrusted loans 200,000 2020.10.30 2023.10.29
Self-owned funds
Working capital
As per agreement 2.40% 840.00 Yes
Shanghai Shanghong Real Estate Co., Ltd.
Entrusted loans 54,000 2020.12.23 2029.12.31
Self-owned funds
Working capital
As per agreement 3.00% 40.50 Yes
Others □ Applicable √ N/A (3) Provision for impairment of entrusted loans □ Applicable √ N/A 3. Others □ Applicable √ N/A (IV) Other significant contracts □ Applicable √ N/A XVI. Explanations on other significant matters □ Applicable √ N/A

SAIC MOTOR ANNUAL REPORT 2020
41 / 241
XVII. Active fulfilment of social responsibility (I) Poverty alleviation by listed companies √ Applicable □ N/A In 2020, the Company and its affiliated companies actively participated in various social welfare undertakings such as the battles against pandemic and the fight against poverty. The Company and its affiliated companies denoted cash and vehicles to fight against the pandemic totaling up to over RMB 60 million and other nearly 100 million of pieces of pandemic prevention supplies such as masks. At the same time, the Company cooperated with the Han Hong Love Charity Foundation to provide medical assistance to impoverished areas. The four impoverished villages receiving partner assistance from enterprises in Xuanwei, Yunnan have all been lifted out of poverty, and the agreements have been renewed to consolidate the results of poverty eradication. Refer to the Company's 2020 Social Responsibility Report (announced in www.sse.com.cn) for details.
1. Plan of targeted poverty alleviation □ Applicable √ N/A 2. Summary of targeted poverty alleviation for the year □ Applicable √ N/A 3. Achievements of targeted poverty alleviation □ Applicable √ N/A 4. Follow-up plans for targeted poverty alleviation □ Applicable √ N/A (II) Achievement of fulfilling social responsibility √ Applicable □ N/A For details, refer to the Company's 2020 Social Responsibility Report (announced in www.sse.com.cn). (III) Environmental information 1. Explanations on environment protection of companies and their subsidiaries listed as key pollutant discharging units by the State Environmental Protection Department √ Applicable □ N/A (1) Pollution discharge √ Applicable □ N/A SAIC Motor attached great importance to environment protection work, and has set up environmental protection leading group and work group especially to advance environmental protection institution and system construction and implement environmental protection policies strictly. During the reporting period, the relevant environmental protection information of the important subsidiaries of the Company (mainly refer to the holding companies, excluding HASCO Motor) such as SAIC VOLKSWAGEN, SAIC GM and SGMW is as follows: the pollutants involve the categories including wastewater, exhaust gas and solid waste, and major pollutants include chemical oxygen demand (COD), ammonia nitrogen (NH3-N), nitric oxide (NOx), sulfur dioxide (SO2) and etc. Wastewater, including industrial wastewater and sanitary wastewater, when meeting the standards after treatment, should be discharged to local sewage
SAIC MOTOR ANNUAL REPORT 2020
42 / 241
treatment plant through connecting facility for processing in a centralized manner, exhaust gas should be discharged at high altitude after collection and treatment, and solid wastes should be disposed properly through separation and collection. Hazardous waste shall be entrusted to eligible unit for treatment. The Company strictly implements duplicate form system and standing book management system.
The implemented discharge standards of pollutants include state standards, local standards where the enterprise is located and industrial standard. The major standards implemented include: wastewater discharge is applicable to Comprehensive Sewage Discharge Standards (GB8978-1996): maximum acceptable emission concentration standard of class-2 pollutants, COD≤500mg/L; Wastewater Quality Standards for Discharge to Municipal Sewers (GB/T 31962-2015): COD≤500mg/L, NH3-N≤45mg/L; exhaust emission is applicable to Integrated Emission Standard of Air Pollutants (GB16297-1996) Grade II Standard: SO2≤550mg/m3, NOx ≤240mg/m3; Integrate Emission Standards of Air Pollutants (DB31/933-2015): SO2≤100mg/m3, NOx ≤150mg/m3; Emission Standard of Air Pollutants for Industrial Furnaces and Kilns (DB31/860-2014): NOx ≤200mg/m3, SO2≤100mg/m3; NMHC emission concentration ≤30mg/m3; Emission Standard of Air Pollutants for Boiler (GB13271-2014) gas-fired boiler standard: SO2 ≤50mg/m3, NOx ≤200mg/m3; Emission Standard of Air Pollutants for Boilers (DB31/387-2018): NOx ≤150mg/m3, SO2≤20mg/m3, etc.
During the reporting period, the Company's significant subsidiaries (share-holding or share-participating companies, excluding Huayu Automobile) have 21 wastewater discharge outlets which are located in Minfeng Road, Hejing Road, Changji Road, Miquan Road, Tashan Road, Yutian Road, Zepu Road, Cao'an Road, Jinjing Road, Jinsui Road, Dongjing Road, Xihuan Road, Shuangren Road, etc. There were 690 exhaust discharge outlets, which are distributed in painting workshop, vehicle body workshop, GA workshop, engine workshop, energy center, technology center, canteens, etc. The certified emissions and actual emissions for key pollutant chemical oxygen demand ("COD") are 1427 tonnes and 326 tonnes respectively. The certified emissions and actual emissions for ammonia nitrogen (NH3-N) are 99 tonnes and 18 tonnes, respectively. The certified emissions and actual emissions for nitrogen oxides (NOx) are 433 tonnes and 188 tonnes, respectively. The certified emissions and actual emissions for sulphur dioxide (SO2) are 63 tonnes and 20 tonnes, respectively. SAIC Volkswagen mainly had the pollutants including COD with average emission concentration of 67.77 mg/L, NH3-N with average emission concentration of 3.61 mg/L, NOx with average emission concentration of 9.02 mg/m3 and SO2 with average emission concentration of 15 mg/m3. SAIC GM mainly had the pollutants including COD with average emission concentration of 61.69 mg/L for North Plant and South Plant and 149.41mg/L for Cadillac Plant, NH3-N with average emission concentration of 1.53mg/L for North Plant and South Plant and 7.95mg/L for Cadillac Plant, NOx with average emission concentration of 6.92mg/m3 for North Plant and South Plant and 7.44mg/m3 for Cadillac Plant; SO2 with average emission concentration of 0.95mg/m3 for North Plant and South Plant and 0.01mg/m3 for Cadillac Plant. SGMW mainly had the pollutants including COD with average emission concentration of 56.97mg/L for Hexi Base and 19.47mg/L for Baojun Base; NH3-N with average emission concentration of 2.48mg/L for Hexi Base and 0.72mg/L for Baojun Base; NOx with average emission concentration of 72.89mg/m3 for Hexi Base and 30mg/m3 for Baojun Base; SO2 with average emission concentration of 10.11mg/m3 for Hexi Base and 3mg/m3 for Baojun Base. The major pollutants were discharged in accordance with the emission standard specified by environmental protection laws and regulations. (2) Construction and operation of pollution prevention facilities √ Applicable □ N/A The Company and its affiliated companies carried out pollution prevention work in terms of wastewater, exhaust gas, noise and solid waste, and encouraged to advance third-party governance; maintained governance equipment and facilities regularly to ensure effective pollutant governance and meet the emission standards; entrusted eligible monitoring company annually to monitor wastewater, exhaust gas and noise, etc.; implemented rain and sewage separation and online monitor on water pollutants in heavy-metal-related enterprises; fugitive emissions have been strictly controlled, online monitoring devices for

SAIC MOTOR ANNUAL REPORT 2020
43 / 241
atmospheric pollutants emission have been installed at key atmospheric discharge outlets such as vehicle painting workshops; carried out industrial noise pollution governance; strictly separated and collected solid wastes and treated them properly; entrusted eligible units to disposed hazardous wastes legally, executed duplicate system and standing book management system strictly, and popularized sludge reduction treatment to hazardous waste. Therefore, facilities and devices for pollution control of SAIC Motor were complete and ran well. (3) Construction project environmental impact assessment and other environmental protection
administrative licensing √ Applicable □ N/A The Company and its affiliated companies carried out construction project environmental impact assessment following relevant laws and regulations of the Law of the People's Republic of China on Environmental Impact Assessment and implemented the "Three Simultaneities (the environmental protection facilities should be designed, constructed and put into operation simultaneously with major facilities)" strictly. During the reporting period, the newly-built, reconstructed and expansion projects have been approved by the environmental protection department and implemented in accordance with laws. (4) Emergency plans for environmental emergencies √ Applicable □ N/A The Company and its affiliated companies have prepared emergency plans for environmental emergencies and established emergency organization to ensure to carry out emergency response in a fast, orderly and efficient manner, reduce casualties and economic losses, so as to prevent the occurrence of such emergencies. Meanwhile, the Company also well prepared for the emergency training and practices of emergent environmental incidents. (5) Environmental self-monitoring plan √ Applicable □ N/A The Company and affiliated companies implemented the Self-monitoring Technology Guidelines for Pollution Sources—General Rule issued by the Ministry of Ecology and Environment of the People’s Republic of China, prepared self-monitoring plan, and entrusted an eligible monitoring unit to monitor the relevant pollutant discharge outlets as required to ensure that the discharge of all the pollutants have met the standards and requirements. The key monitor enterprise disclosed the environmental monitoring data on the environmental information platform of local environmental protection bureau. (6) Other environmental information that should be disclosed □ Applicable √ N/A 2. Explanations on the environmental protection of the companies other than key pollutant
discharging units √ Applicable □ N/A
For the detailed environmental protection of HASCO Motor (stock code: 600741), an important subsidiary of the Company, see the annual report for 2020 of HASCO Motor released on Shanghai Stock Exchange (www.sse.com.cn).

SAIC MOTOR ANNUAL REPORT 2020
44 / 241
As an important subsidiary of the Company, SFC is a non-banking financial institution not involving production and manufacturing, and has no industrial wastewater and industrial exhaust gas discharged. As a leader in the domestic automotive industry, the Company has advanced the implementation of ISO14001 environmental management system continuously, and directed the affiliated companies to observe environmental protection laws and regulations and execute the environmental emission standards strictly in the day-to-day operation and project construction. Meanwhile, the Company required the affiliated companies to give full expression to the environmental protection and sustainable development, etc. in the preparation of long-term development plan so as to include the environmental requirements and planning into the medium- and long-term business development plan and corporate operating decisions comprehensively as important elements of enterprise development, and thereby promote further upgrade and transformation of enterprises, help to achieve industrial high-end level in the aspect of manufacturing level in the environmental protection, creating value for the society. 3. Explanations on the reason why the companies other than key pollutant discharging units did not disclose environmental information □ Applicable √ N/A 4. Explanations on the subsequent progress or changes of the environmental information disclosed during the reporting period □ Applicable √ N/A (IV) Other explanations □ Applicable √ N/A XVIII. Convertible bonds of the Company □ Applicable √ N/A

SAIC MOTOR ANNUAL REPORT 2020
45 / 241
Section VI Changes in Ordinary Shares and Shareholders
I. Changes in share capital of ordinary shares (I) Statement of changes in ordinary shares 1. Statement of changes in ordinary shares During the reporting period, the Company's total ordinary shares and share capital structure remain unchanged. 2. Explanations on changes in ordinary shares □ Applicable √ N/A 3. Effect of changes in ordinary shares on financial indicators including earnings per share and net assets per share in latest year/period (if any) □ Applicable √ N/A 4. Other content the Company considers necessary or required to be disclosed by regulators √ Applicable □ N/A The Company convened the 12th session of seventh board of directors and first extraordinary shareholder meeting for 2020 on July 3, 2020 and July 20, 2020, respectively, deliberating and approving the Proposal on Repurchasing the Corporate Shares by way of Centralized Competitive Bidding and other proposals thereon. The Company first repurchased the shares by way of centralized competitive bidding on July 22, 2020. As at January 19, 2021 on which the first repurchase term expired, the Company has repurchased 108,161,920 shares of the Company in total actually by way of centralized competitive bidding, accounting for 0.93% of the total shares. Refer to No. 2021-005 Announcement on Implementation Results of Share Repurchase and the Changes in Shares of SAIC Group as disclosed on January 20, 2021.
(II) Changes in restricted shares √ Applicable □ N/A
Unit: Share
Name of shareholder
Number of restricted shares
at the beginning of year
Number of restricted shares released in the current year
Number of restricted
shares increased in the current
year
Number of restricted
shares at the end of year
Reason for restriction
Date of restriction release
Shanghai Automotive Industry Corporation (Group)
131,578,947 131,578,947 0 0 Private placement January 20, 2020

SAIC MOTOR ANNUAL REPORT 2020
46 / 241
Core Staff Shareholding Plan of SAIC Motor (Changjiang Pension Insurance Co., Ltd., which is entrusted to manage this plan, sets up special products for subscription)
48,449,561 48,449,561 0 0 Private placement January 20, 2020
Total 180,028,508 180,028,508 0 0 / / II. Shares issuing and listing (I) Securities issuing as at the reporting period □ Applicable √ N/A Explanations on securities issuing as at the reporting period (Please specify separately for bonds with different interest rate in the duration): □ Applicable √ N/A (II) Changes in the Company's total ordinary shares and shareholders' structure, as well as assets and liabilities □ Applicable √ N/A (III) Existing shares held by internal employees
□ Applicable √ N/A III. Shareholders and actual controller (I) Total number of shareholders
Total number of ordinary shareholders at the end of the reporting period 209,078 Total number of ordinary shareholders at the end of last month prior to the announcement of the annual report 260,466
(II) Shareholding of top ten shareholders, and top ten circulating shareholders (or shareholders of non-restricted shares) as at the end of reporting period
Unit: share Top ten shareholders
Name of shareholder Increase/decrease
during reporting period
Number of shares held at the end of
the period Proportion
(%) Number of
restricted shares held
Number of shares pledged or frozen
Nature of shareholders
Status Number
Shanghai Automotive Industry Corporation (Group) 0 8,323,028,878 71.24 0 None State-own
legal person Hong Kong Securities Clearing Company Ltd 83,617,601 498,098,506 4.26 0 None Unknown
Yuejin Motor (Group) Corporation 0 413,919,141 3.54 0 None State-own legal person

SAIC MOTOR ANNUAL REPORT 2020
47 / 241
China Securities Finance Corporation Limited 0 349,768,497 2.99 0 None Unknown Zhonghai Trust Co., Ltd. - Central China Equity Value No. 1 Single-asset Trust -5,970,000 105,230,000 0.90 0 None Unknown
Central Huijin Investment Ltd. 0 100,754,000 0.86 0 None Unknown Special securities account for repurchase of SAIC Motor Corporation Limited 100,000,035 100,000,035 0.86 0 None Others Hebei Port Group Co., Ltd. 0 87,719,298 0.75 0 None Unknown China Life Insurance Company Limited - Traditional - Ordinary Insurance Products - 005L - CT001 Hu 34,575,964 82,824,367 0.71 0 None
Unknown
Huarong Huitong Asset Management Co., Ltd. -4,530,414 71,688,948 0.61 0 None Unknown
Top ten shareholders of non-restricted shares
Name of shareholders Number of non-restricted shares held
Type of shares and number Type Shares
Shanghai Automotive Industry Corporation (Group) 8,323,028,878 Ordinary shares in RMB 8,323,028,878 Hong Kong Securities Clearing Company Ltd 498,098,506 Ordinary shares in RMB 498,098,506 Yuejin Motor (Group) Corporation 413,919,141 Ordinary shares in RMB 413,919,141 China Securities Finance Corporation Limited 349,768,497 Ordinary shares in RMB 349,768,497 Zhonghai Trust Co., Ltd.-Zhongyuan Equity Value No. 1 Single Fund Trust 105,230,000 Ordinary shares in RMB 105,230,000
Central Huijin Investment Ltd. 100,754,000 Ordinary shares in RMB 100,754,000 Special securities account for repurchase of SAIC Motor Corporation Limited 100,000,035 Ordinary shares in RMB 100,000,035
Hebei Port Group Co., Ltd. 87,719,298 Ordinary shares in RMB 87,719,298 China Life Insurance Company Limited - Traditional -Ordinary Insurance Products - 005L - CT001 Hu 82,824,367 Ordinary shares in RMB 82,824,367
Huarong Huitong Asset Management Co., Ltd. 71,688,948 Ordinary shares in RMB 71,688,948
Explanations on the related relationship or concerted actions among the above shareholders
Special securities account for repurchase of SAIC Motor Corporation Limited is an account specially opened by the Company for share repurchase in 2020; Shanghai Automotive Industry Corporation (Group) and other 10 shareholders have no related relationships or persons acting in concert as regulated in Administrative Rules on Acquisition of Listed Company. It is unknown whether other shareholders have related relationships or persons acting in concert.
Number of restricted shares held by the top ten shareholders and the restricted conditions □ Applicable √ N/A (III) Strategic investors or general legal representative who have been included in top 10 shareholders due to placement of new shares □ Applicable √ N/A IV. Controlling shareholder and actual controller (I) Controlling shareholder 1. Legal person √ Applicable □ N/A
Name Shanghai Automotive Industry Corporation (Group) Legal representative Mr. Chen Hong Date of establishment March 1, 1996
Business scope Manufacturing, development, sales and investment of automobiles, motorcycles and tractors, operation and

SAIC MOTOR ANNUAL REPORT 2020
48 / 241
management of state-owned assets under authorization, domestic trading (except for special provisions) and advisory services.
Investment in domestic or foreign listed companies during the reporting period
None
Other explanations None 2. Natural person □ Applicable √ N/A 3. Special explanation for the Company that has no controlling shareholder □ Applicable √ N/A 4. Index and date of changes in controlling shareholder during the reporting period □ Applicable √ N/A 5. Block diagram of ownership and controlling relationships between the Company and
controlling shareholder √ Applicable □ N/A
(II) Actual controller 1. Legal person √ Applicable □ N/A
Actual controller of the Company is State-owned Assets Supervision and Administration Commission of Shanghai Municipal Government which is directly under Municipal Government of Shanghai and authorized to represent the Municipal Government of Shanghai to perform responsibilities as contributor and supervise municipal state-owned assets.
2. Natural Person □ Applicable √ N/A 3. Special explanation for the Company that has no actual controller □ Applicable √ N/A 4. Index and date of changes in actual controller during the reporting period □ Applicable √ N/A 5. Block diagram of ownership and controlling relationship between the Company and actual controller
Shanghai Automotive Industry Corporation (Group)
SAIC Motor Corporation Limited

SAIC MOTOR ANNUAL REPORT 2020
49 / 241
√ Applicable □ N/A
6. The actual controller controls the Company through trust and other asset management □ Applicable √ N/A (III) Other explanations about the controlling shareholder and the actual controller
□ Applicable √ N/A V. Other corporate shareholders holding more than 10% shares of the Company □ Applicable √ N/A VI. Explanations on reduction of ownership of restricted shares □ Applicable √ N/A
Shanghai State-owned Assets Supervision and Administration Commission
Shanghai Automotive Industry Corporation (Group)
SAIC Motor Corporation Limited
SAIC MOTOR ANNUAL REPORT 2020
50 / 241
Section VII Preferred Shares
□ Applicable √ N/A
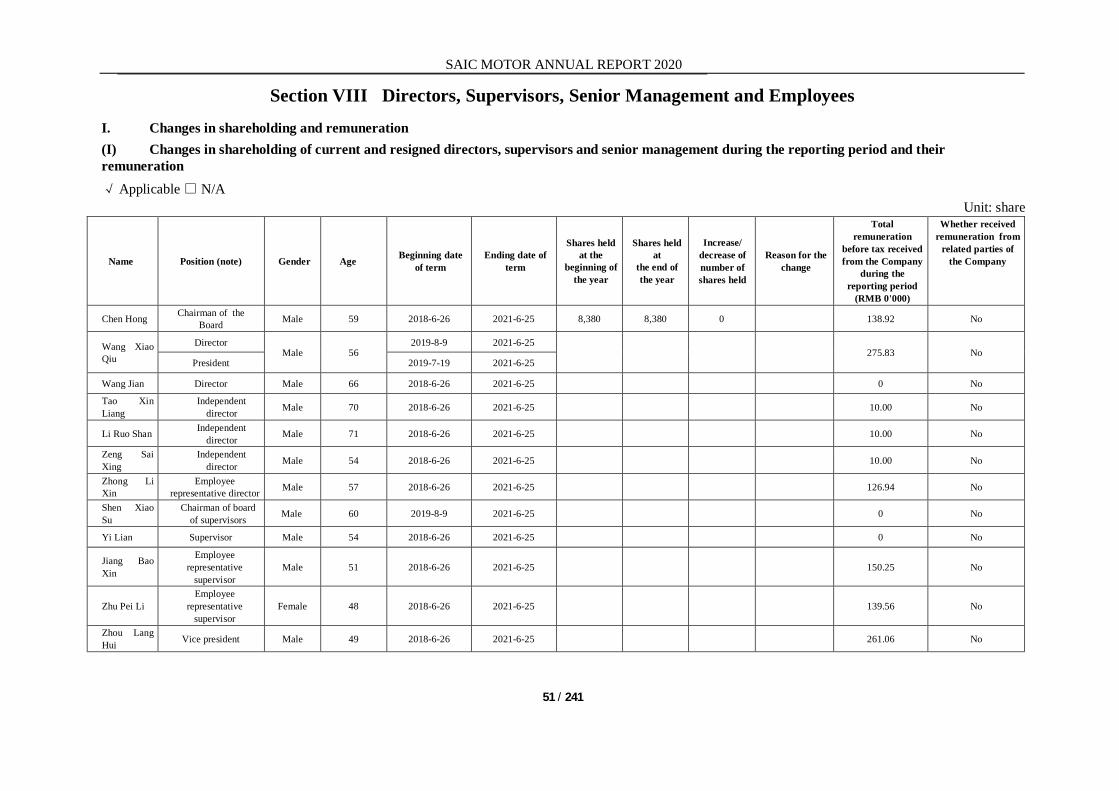
SAIC MOTOR ANNUAL REPORT 2020
51 / 241
Section VIII Directors, Supervisors, Senior Management and Employees I. Changes in shareholding and remuneration (I) Changes in shareholding of current and resigned directors, supervisors and senior management during the reporting period and their remuneration √ Applicable □ N/A
Unit: share
Name Position (note) Gender Age Beginning date of term
Ending date of term
Shares held at the
beginning of the year
Shares held at
the end of the year
Increase/ decrease of number of shares held
Reason for the change
Total remuneration
before tax received from the Company
during the reporting period
(RMB 0'000)
Whether received remuneration from
related parties of the Company
Chen Hong Chairman of the Board Male 59 2018-6-26 2021-6-25 8,380 8,380 0 138.92 No
Wang Xiao Qiu
Director Male 56
2019-8-9 2021-6-25 275.83 No
President 2019-7-19 2021-6-25
Wang Jian Director Male 66 2018-6-26 2021-6-25 0 No
Tao Xin Liang
Independent director Male 70 2018-6-26 2021-6-25 10.00 No
Li Ruo Shan Independent director Male 71 2018-6-26 2021-6-25 10.00 No
Zeng Sai Xing
Independent director Male 54 2018-6-26 2021-6-25 10.00 No
Zhong Li Xin
Employee representative director Male 57 2018-6-26 2021-6-25 126.94 No
Shen Xiao Su
Chairman of board of supervisors Male 60 2019-8-9 2021-6-25 0 No
Yi Lian Supervisor Male 54 2018-6-26 2021-6-25 0 No
Jiang Bao Xin
Employee representative
supervisor Male 51 2018-6-26 2021-6-25 150.25 No
Zhu Pei Li Employee
representative supervisor
Female 48 2018-6-26 2021-6-25 139.56 No
Zhou Lang Hui Vice president Male 49 2018-6-26 2021-6-25 261.06 No

SAIC MOTOR ANNUAL REPORT 2020
52 / 241
Chen De Mei Vice president Male 58 2018-6-26 2021-6-25 243.87 No
Shen Yang Vice president Male 59 2018-6-26 2021-6-25 0 No
Lan Qing Song Vice president Male 55 2018-6-26 2021-6-25 250.08 No
Wei Yong Vice president
Male 48 2019-7-19 2021-6-25
216.19 No Acting CFO 2018-6-26 2021-6-25
Zu Si Jie Vice president, chief engineer Male 52 2019-7-19 2021-6-25 199.49 No
Yang Xiao Dong Vice president Male 50 2019-7-19 2021-6-25 209.83 No
Chen Xiao Dong
Secretary of the Board Male 43 2019-8-5 2021-6-25 144.73 No
Total / / / / / 8,380 8,380 0 / 2386.75 /
Note: During the reporting period, in accordance with relevant regulations and the tenure assessment results for 2015-2017 and performance assessment result for 2019, the remuneration of the Company’s senior management as disclosed included a part of tenure incentives for 2015-2017, the annual performance salary for 2019 and medium- and long-term incentives for 2019 that had been honored.
Name Major working experience Chen Hong He is the chairman of the Board and secretary of the Party Committee of SAIC Motor Corporation Limited. Wang Xiao Qiu
He served as executive vice president of SAIC Motor Corporation Limited and general manager of passenger vehicle branch, Head of Technical Center. He is currently director, president and deputy secretary of the Party Committee of SAIC Motor Corporation Limited.
Zhong Li Xin
He served as chairman of the labor union and director of the Party Committee Office of SAIC Motor Corporation Limited. He is currently employee representative director and chairman of the labor union of SAIC Motor Corporation Limited.
Wang Jian He served as chairman of the Board and deputy secretary of the Party Committee of Shenergy Group Company Limited; secretary of the Party Committee and chairman of the Board; the vice chairman of the Board of China Pacific Insurance (Group) Co., Ltd. He is currently director of SAIC Motor Corporation Limited.
Tao Xin Liang
He currently serves as honorary dean of Intellectual Property Academy of Dalian University of Technology, honorary dean of Intellectual Property Academy of Shanghai University, partner of DeHeng Shanghai Law Office and an independent director at SAIC Motor Corporation Limited.
Li Ruo Shan
He served as deputy dean of School of Management, director of accounting department and director of finance department of Fudan University; and deputy president of Shanghai Institute of Accounting, and deputy president of Shanghai Institute of Audit. He is currently academic director of Professional Master of Accounting of School of Management of Fudan University, member of the listed company expert committee of Shanghai Stock Exchange, member of budget committee of Shanghai SASAC and an independent director of SAIC Motor Corporation Limited.

SAIC MOTOR ANNUAL REPORT 2020
53 / 241
Zeng Sai Xing
Former head of discipline of Management Science and Department of Innovation and Strategy of Antai College of Economics & Management, Shanghai Jiao Tong University. Current distinguished professor and doctoral advisor of Antai College of Economics & Management, Shanghai Jiao Tong University. Independent director of SAIC Motor Corporation Limited.
Shen Xiao Su
Former director and secretary of the Leading Party Members' Group of Shanghai Municipal Civil Defense Office. Current chairman of board of supervisors of SAIC Motor Corporation Limited, chairman of board of supervisors of Shanghai Land (Group) Co., Ltd.
Yi Lian He served as deputy director general of Economic Responsibility Audit Division (Internal Audit Guidance Office) of Shanghai Municipal Audit Bureau. He is currently supervisor of SAIC Motor Corporation Limited.
Jiang Bao Xin
He currently serves as employee representative supervisor , director of audit office -,and general manager of risk management department in Shanghai Motor Corporation Limited..
Zhu Pei Li She used to serve as the secretary of the Party Committee, secretary of the Disciplinary Committee and chairman of the labor union of KPSNC. She currently serves as employee representative supervisor, director of the Party Committee Office, vice chairman of the labor union, and secretary of the Party Committee of the headquarter of SAIC Motor Corporation Limited.
Zhou Lang Hui He is currently vice president and vice secretary of the Party Committee of SAIC Motor Corporation Limited.
Chen De Mei He is currently vice president of SAIC Motor Corporation Limited.
Shen Yang He is currently the vice president of SAIC Motor Corporation Limited and general manager of SGMW. Lan Qing Song
He served as general manager of SAIC Motor Commercial Vehicle Co., Ltd. and general manager of SAIC Maxus. He is currently vice president of SAIC Motor Corporation Limited and general manager of department of commercial vehicle.
Wei Yong Former director of Board Office, Board Secretary, general manager of securities affairs &investor relations Department, securities affairs representative and general manager of Finance Business Department of SAIC Motor Corporation Limited. Current vice president, acting CFO of SAIC Motor Corporation Limited, general manager of SAIC HK Investment Co., Ltd., general manager of SAIC investment management Co., Ltd.
Zu Si Jie Former executive director, general manager of Planning Department of SAIC Motor Corporation Limited, former deputy general engineer. Current vice president, general engineer of SAIC Motor Corporation Limited.
Yang Xiao Dong
Former director (administration), executive director, general manager of International Business Department of SAIC Motor Corporation Limited, general manager of SAIC International Trade Co., Ltd., general manager of Shanghai Automobile Import & Export Company. Current vice president of SAIC Motor Corporation Limited and general manager of Passenger Vehicle Branch, Head of Technical Center.
Chen Xiao Dong
Former director of finance department of SAIC Motor Corporation Limited, CFO of HUAYU Automotive Systems Co., Ltd., general manager of Huayu Automotive Systems (Shanghai) Co., Ltd., general manager of Huayu Automotive Systems (HK) Co., Ltd. Current secretary of the board, general manager of securities affairs &investor relations department, securities affairs representative of SAIC Motor Corporation Limited.
Other explanations □ Applicable √ N/A

SAIC MOTOR ANNUAL REPORT 2020
54 / 241
(II) Information of incentive shares awarded to directors, supervisors and senior management during the reporting period □ Applicable √ N/A II. Information of appointed and resigned directors, supervisors and senior management during the reporting period (I) Positions held in shareholders’ entity √ Applicable □ N/A
Name Name of shareholder entity Position held Starting date of term
Ending date of term
Chen Hong Shanghai Automotive Industry Corporation (Group) Chairman of the Board 2018-3-30 2021-3-29
Zhou Lang Hui Shanghai Automotive Industry Corporation (Group) Supervisor 2018-3-30 2021-3-29
Chen De Mei Shanghai Automotive Industry Corporation (Group) Director 2018-3-30 2021-3-29
(II) Positions held in other entities √ Applicable □ N/A
Name Name of shareholder entity Position held Starting date of term
Ending date of term
Chen Hong HUAYU Automotive Systems Co., Ltd. Chairman of the Board 2018-6-27 2021-6-26
Wang Xiao Qiu HUAYU Automotive Systems Co., Ltd.
Vice chairman of the Board 2019-9-25 2021-6-26
Zhong Li Xin HUAYU Automotive Systems Co., Ltd. Director 2018-6-27 2021-6-26
Zhou Lang Hui HUAYU Automotive Systems Co., Ltd.
Chairman of board of supervisors 2018-6-27 2021-6-26
Zhou Lang Hui Shanghai Diesel Engine Co., Ltd. Chairman of board of supervisors 2018-5-17 2021-5-16

SAIC MOTOR ANNUAL REPORT 2020
55 / 241
Lan Qing Song Shanghai Diesel Engine Co., Ltd. Director 2018-5-17 2021-5-16 Jiang Bao Xin Shanghai Diesel Engine Co., Ltd. Supervisor 2018-5-17 2021-5-16
III Remuneration of directors, supervisors and senior management personnel √ Applicable □ N/A
Decision-making process for remuneration of directors supervisors and senior management
The allowance of independent directors shall be decided by the Board and subject to the approval of general meeting of shareholders. Each independent director may receive allowance of RMB 100,000 and the necessary and reasonable costs arising from performing the duties shall be borne by the Company. The Company's non-independent directors shall not receive remuneration for the position of directors. The Company's supervisors shall not receive remuneration for the position of supervisors.
Determination basis of remuneration of directors, supervisors and senior management
According to the Company's medium and long-term strategic planning, annual key work arrangements, and the division of responsibilities of senior management personnel, etc., the performance assessment targets are clarified and assessments are conducted. Senior management personnel' performance pay is related to the corporate performance and the results of performance assessment.
Actual payment of remuneration of directors, supervisors and senior management
According to the "Proposal on 2019 Annual Performance Assessment for the Company's Professional Manager" approved by the 11th session of seventh board of directors, the Company's professional managers cashed 2019 performance annual pay and 2019 medium- and long-term incentive during the reporting period. According to 2015-2017 tenure assessment results, the Company's senior management cashed part of 2015-2017 incentives within their tenure during the reporting period. The specific amount have been included in the total annual remuneration payable.
Total remuneration of all directors supervisors and senior management received by the end of the reporting period
RMB 2.38675million
IV. Alteration of directors, supervisors and key management personnel □ Applicable √ N/A V. Penalty by regulators in recent three years □ Applicable √ N/A
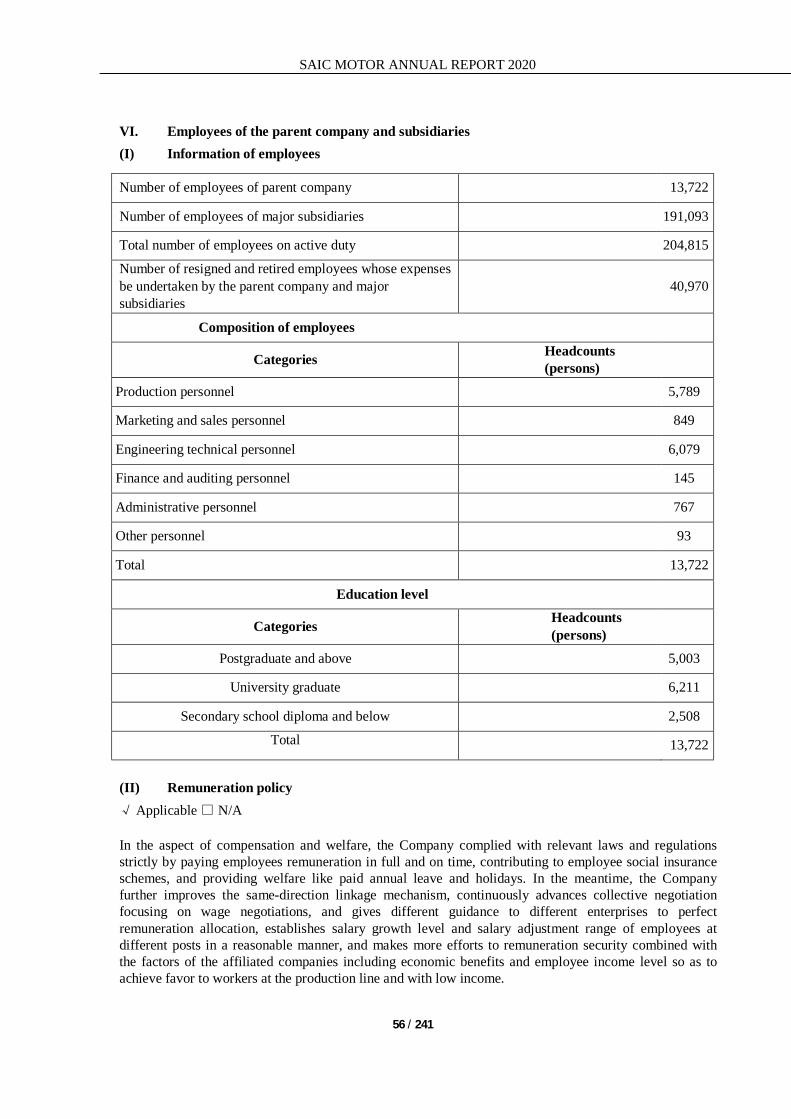
SAIC MOTOR ANNUAL REPORT 2020
56 / 241
VI. Employees of the parent company and subsidiaries (I) Information of employees
Number of employees of parent company 13,722
Number of employees of major subsidiaries 191,093
Total number of employees on active duty 204,815 Number of resigned and retired employees whose expenses be undertaken by the parent company and major subsidiaries
40,970
Composition of employees
Categories Headcounts (persons)
Production personnel 5,789
Marketing and sales personnel 849
Engineering technical personnel 6,079
Finance and auditing personnel 145
Administrative personnel 767
Other personnel 93
Total 13,722
Education level
Categories Headcounts (persons)
Postgraduate and above 5,003
University graduate 6,211
Secondary school diploma and below 2,508 Total 13,722
(II) Remuneration policy √ Applicable □ N/A In the aspect of compensation and welfare, the Company complied with relevant laws and regulations strictly by paying employees remuneration in full and on time, contributing to employee social insurance schemes, and providing welfare like paid annual leave and holidays. In the meantime, the Company further improves the same-direction linkage mechanism, continuously advances collective negotiation focusing on wage negotiations, and gives different guidance to different enterprises to perfect remuneration allocation, establishes salary growth level and salary adjustment range of employees at different posts in a reasonable manner, and makes more efforts to remuneration security combined with the factors of the affiliated companies including economic benefits and employee income level so as to achieve favor to workers at the production line and with low income.

SAIC MOTOR ANNUAL REPORT 2020
57 / 241
In the aspect of employee incentive, the Company improved incentive mechanisms and made more efforts to attract and retain talents as follows: 1) to implement SAIC innovation incentive fund on technology and management for key talents; 2) to implement incentives to personnel with significant contribution to the employees awarded with national and industrial, provincial/municipal award for scientific and technological advancement, national skill master, Chief Mechanic, Shanghai May 1st Labor Medal and other honors, the employees awarded with national patent invention grant, and the employees awarded with SAIC Excellent Technical Talent Award, Technological Innovation Award, Patent Award and Software Award in 2019; and 3) to promote talent development and complete various awards and merits appraisal. (III) Training plan √ Applicable □ N/A SAIC Motor pays attention to the career development and growth of talents. The Company adopts "dual-channel system for career development" as a basic requirement for talent growth management and is constantly building and improving the professional and management channels for talent career development. A customized training and cultivation system is built according to different career development paths, and targeted and diversified incentives are provided for different types of talents to contribute to their success and fruits on their respective career development paths. In 2020, the Group, focused on vision, mission, value and “new four modernizations” strategy deployment, vigorously advanced the vocational education for employees and made more efforts to employee education and training to accelerate the capacity construction and employee quality improvement. Approximately 720,000 persons attended trainings at all levels per day throughout the year.
In 2020, the Group stepped up its efforts to promote innovation and transformation training, and accelerated the construction of SAIC's talent team in conjunction with the deployment of key projects based on the "two bases"—the training base for automotive engineers and the training base for highly skilled personnel. Firstly, the Company has strengthened the building of senior management talent team. The Company has enriched the knowledge structure of senior management talents through holding “Bi-weekly Lecture”, training classes for young cadres and Tsinghua University Innovation Workshop, providing the employees a broader vision, richer thinking and stronger capability to complete work more perfectly. Secondly, the Company has held induction training for new employees. The Company organized 11 induction trainings for all university graduators newly employed by SAIC in 2020 to help them understand SAIC's cultures and set up group awareness. Thirdly, the Company has developed professional technicians in a deep-going way. In 2020, SAIC was awarded the "National Continuing Education Base for Professionals and Technicians", becoming the only local enterprise to be awarded by the Ministry of Human Resources and Social Security. In 2020, through continuing education, the Company trained 30,000 automotive engineers and organized 5 senior training courses in Shanghai, 1 professional training course at the grassroots level and 3 training courses for urgently needed talents, including 1 national senior training course. Fourthly, the Company has strengthened the development of skilled personnel. In 2020, SAIC's highly skilled personnel were once again awarded one additional grant for the "Shanghai Skill Master Studio", seven additional grants for the "Chief Technician Project" and three additional grants for the "Chief Technician Project"; so far, SAIC has established nine national Skill Master Studios and ten Shanghai Skill Master Studios, and over one hundred technicians have been awarded grants for the Shanghai Chief Technician Project. The Company carried out the technical update training for technicians and organized high-skilled talents to participate in industrial evaluation staff training; it also deepened the professional skills competitions and carried out 15 competitions at all levels. In 2020, over 3,800 skilled personnel

SAIC MOTOR ANNUAL REPORT 2020
58 / 241
have achieved professional-skill-level promotion through professional skills training and appraisal, among which, nearly 700 were senior staff or above. Since the high-skilled personnel training base was approved in 2011, SAIC Group has continuously increased the investment in the construction of training bases. The total construction area of the training base has been built to approximately 35,500 square meters. (IV) Labor outsourcing □ Applicable √ N/A VII. Others □ Applicable √ N/A

SAIC MOTOR ANNUAL REPORT 2020
59 / 241
Section IX Corporate Governance I. Explanations on corporate governance √ Applicable □ N/A In accordance with laws and regulations including Corporate Law, Securities Law, Code of Corporate Governance for Listed Companies, Stock Listing Rules of Shanghai Stock Exchange, Articles of Association and relevant normative documents issued by CSRC and SSE, the Company established of and maintained a governance system that is suitable for the Company's production and operation, innovation and development so as to effectively respond to the changes in the external environment, prevent and control risks, and promote the realization of the Company's sustainable development. The Company sticks to regulated operation and effective implementation, strictly fulfills the obligation of information disclosure, actively carries out investors' relationship management, seriously fulfills social responsibility and continuously improves the Company's governance.
1. Shareholders and general meeting of shareholders
During the reporting period, the Company strictly followed the relevant provisions of Code of Corporate Governance for Listed Companies, Stock Listing Rules of Shanghai Stock Exchange, Articles of Association and Rules of Procedure for General Meeting of Shareholders to convene general meetings of shareholders, combine online voting with on-site voting. At the same time, the Company commissioned an attorney to attend general meetings of shareholders to witness and verify meeting procedures, and the identification of the attendants, proposal to be deliberated, and voting related matters to ensure the validity of the general meetings of shareholders and the equal status and rights of all shareholders to exercise their rights. The Company held two general meetings of shareholders in 2020, and please refer to "general meeting of shareholders review" for further details.
2. Directors and Board
There are seven directors of the Company including 1 external director (no other duty role in the Company except for director and is not an independent director) and 3 independent directors. Strategic committee, audit committee as well as nomination, remuneration and assessment committee are established under the Board of the Company, of which external directors and independent directors account for three fifths, and comprise audit committee and nomination, remuneration and assessment committee with the independent director acting as chairman of the committee. During the reporting period, the board of directors held 7 board meetings, 1 meeting of the strategic committee, 6 meetings of audit committee and 2 meetings of nomination, remuneration and appraisal committee, and the special committee has played an important role in reviewing and deliberating regular reports and "1+5" rolling plan, related party transactions, use and management of funds raised, and repurchase of corporate shares, and assessing professional manager, improving internal control system, supervising and assessing external audit institutions, etc.
During the reporting period, all the directors performed their obligations and duties in a faithful, diligent and prudent manner. They devoted continuous attention to the operation and management of the Company and actively participated in on-site interviews and investigations. On board meetings, they carefully deliberated on the proposals, carried out thorough discussion and exchange and made scientific decisions. No circumstances of violating against laws and regulations or the damaging the interests of the Company or shareholders were found. 3. Supervisors and board of supervisors

SAIC MOTOR ANNUAL REPORT 2020
60 / 241
The Company's board of supervisors and supervisors have earnestly performed the supervisory and examination responsibilities endowed by the general meeting of shareholders in a spirit of being highly responsible for all the shareholders according to the provisions of the Articles of Association and Rules of Procedure for the Board of Supervisors and implemented effective supervision on the Company's operation, financial condition, internal control construction and duty-performing of directors and senior management. During the reporting period, the board of supervisors held 5 meetings in total, during which they have deliberated and supervised on important matters such as regular reports, construction for internal control, related party transactions, repurchase of corporate shares, management of the raised funds, and changes in accounting policies etc., and no situations such as violation of laws or regulations or damage to the interests of shareholders was identified. 4. Corporate governance system
During the reporting period, considering the regulatory requirements and actual demands, the Company continuously optimized the systems, revised the Articles of Association, the Rules of Procedure of the Board of Directors, the Rules of Procedure of the Board of Supervisors and Information Disclosure Management System, improve business process, and continuously enhances internal control. In the aspects of proposal decision, information disclosure, investor relationship management, dividends distribution, fund raising and share repurchase, the Company strictly implements relevant systems and regulate various work procedures. Meanwhile, the Company carries out registration management system for insiders to continue its good work in management including training, registering, reporting, and etc., to effectively maintain fair disclosure of company information.
5. Performance evaluation, incentive and restraining mechanism
The Company has selected managerial personnel according to the principle of ability and integrity, equality and fairness and implemented tenure system. In the meantime, the Company has established a performance evaluation and remuneration system which links remuneration of management with the Company's operating performance and individual's performance. Meanwhile, in order to improve the Company's operating performance continuously and to achieve sustainable development, the Company approved "The Incentive Fund Plan of the Company" at the 36th session of the fourth board of directors in 2012. The 14th session of the sixth board of directors in 2017 deliberated and approved the Proposal on Continuous Implementation of the Company's Incentive Fund Plan in 2016. Given that the incentive fund plan is able to better stimulate the enthusiasm and creativity of the Company's core talent team, meanwhile, in order to further stimulate innovation vitality of the senior management, the 16th session of the sixth board of directors has approved the new round of Incentive Fund Plan of the Company and Proposal on the Implementation of the Company’s Professional Managers Scheme. The 11th session of the seventh board of directors in 2020 deliberated and approved Proposal on 2019 Performance Assessment for the Company's Professional Managers.
6. Stakeholders
The Company has fully demonstrated due respect to maintain legal rights of stakeholders and actively perform social responsibilities to balance interest in shareholders, employee and society, etc. to promote sustainable and healthy development of the Company eventually. (Please refer to the Company's social responsibility report of 2020).
7. Information disclosure and transparency
During the reporting period, the Company took initiative to work on investors' relationship in accordance with the requirements as set forth in Investors Relationship Management System and Information Disclosure Management System. As affected by the COVID-19 pandemic in 2020, the Company received over 50 investment agents' visits, 550 individual investors' visits and more than 900 enquiry calls online or
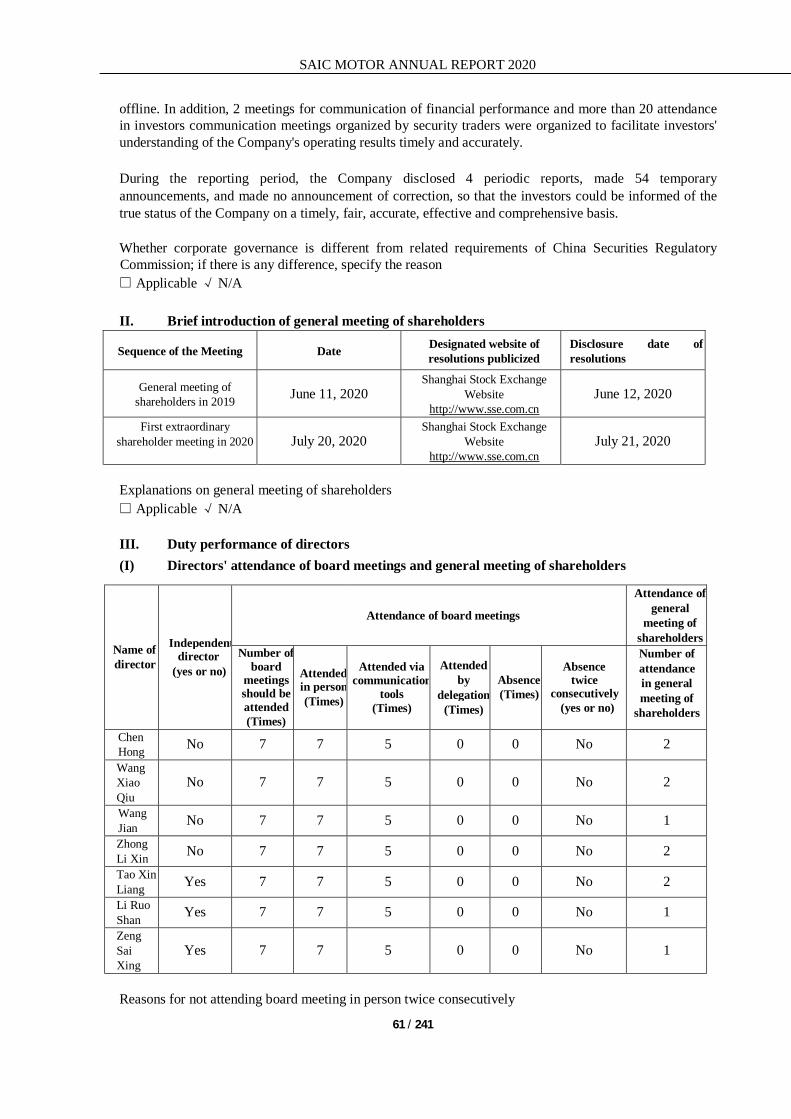
SAIC MOTOR ANNUAL REPORT 2020
61 / 241
offline. In addition, 2 meetings for communication of financial performance and more than 20 attendance in investors communication meetings organized by security traders were organized to facilitate investors' understanding of the Company's operating results timely and accurately.
During the reporting period, the Company disclosed 4 periodic reports, made 54 temporary announcements, and made no announcement of correction, so that the investors could be informed of the true status of the Company on a timely, fair, accurate, effective and comprehensive basis. Whether corporate governance is different from related requirements of China Securities Regulatory Commission; if there is any difference, specify the reason □ Applicable √ N/A II. Brief introduction of general meeting of shareholders
Sequence of the Meeting Date Designated website of resolutions publicized
Disclosure date of resolutions
General meeting of shareholders in 2019 June 11, 2020
Shanghai Stock Exchange Website
http://www.sse.com.cn June 12, 2020
First extraordinary shareholder meeting in 2020 July 20, 2020
Shanghai Stock Exchange Website
http://www.sse.com.cn July 21, 2020
Explanations on general meeting of shareholders □ Applicable √ N/A III. Duty performance of directors (I) Directors' attendance of board meetings and general meeting of shareholders
Name of director
Independent director
(yes or no)
Attendance of board meetings
Attendance of general
meeting of shareholders
Number of board
meetings should be attended (Times)
Attended in person(Times)
Attended via communication
tools (Times)
Attended by
delegation(Times)
Absence (Times)
Absence twice
consecutively (yes or no)
Number of attendance in general meeting of
shareholders
Chen Hong No 7 7 5 0 0 No 2 Wang Xiao Qiu
No 7 7 5 0 0 No 2
Wang Jian No 7 7 5 0 0 No 1 Zhong Li Xin No 7 7 5 0 0 No 2 Tao Xin Liang Yes 7 7 5 0 0 No 2 Li Ruo Shan Yes 7 7 5 0 0 No 1 Zeng Sai Xing
Yes 7 7 5 0 0 No 1
Reasons for not attending board meeting in person twice consecutively

SAIC MOTOR ANNUAL REPORT 2020
62 / 241
□ Applicable √ N/A
Number of board meetings 7 Including: Number of on-site meetings 2 Number of meetings via communication tools 5 Number of meetings on-site and via communication tools simultaneously 0
(II) Circumstance where independent directors raised different opinions
□ Applicable √ N/A (III) Others □ Applicable √ N/A IV. Important comments and suggestions made by specialized committees under the Board when performing their duties during the reporting period, any disagreement should be disclosed with details √ Applicable □ N/A
During the reporting period, the Company's strategy committee of the board held 1 meetings, mainly deliberating the Company's "1+5" rolling development plan. When deliberating the "1+5" Rolling Development Plan (2020-2024), the strategy committee believes that, the Company is required to complete the tasks of the current year while preparing a scientific plan for long-term development under the upcoming impacts from economic adjustments and COVID-19 pandemic, and accordingly, it is particularly important to accurately assess the trends of socio-economic changes at home and abroad in the face of an increasingly complex external environment in the future. The audit committee of the board of directors of the Company held 6 meetings, mainly reviewing regular financial reports, assessing external audit institutions, deliberating the use and management of the raised funds, deliberating the repurchase of the corporate shares, guiding internal audit work, and inspecting the effectiveness of internal control system etc. When listening to the report of Deloitte regarding the financial and internal control audit plan in 2020, Deloitte also will provide more value-added services and suggestions to help the Company control various risks in the development of new business through system improvement and process management. The Company's Nomination, Remuneration and Appraisal Committees of Board of Directors held 2 meetings, mainly supervised and reviewed the implementation of the Company's remuneration system, and assessment of professional managers, etc. In discussing and deliberating the Proposal on the Participation of the Company's Directors in the Incentive Fund Plan, the Nomination, Remuneration and Appraisal Committees believed that through the incentive fund plan, the Company has stimulated the innovation vitality of the core talent team effectively, which was significant to accelerate innovation developing strategy successfully. V. Explanations on the risks of the Company identified by board of supervisors □ Applicable √ N/A VI. Declaration on whether the Company is independent from the controlling shareholder on business, personnel, assets, organization and finance and whether it can keep independent operating abilities □ Applicable √ N/A

SAIC MOTOR ANNUAL REPORT 2020
63 / 241
Resolutions, work schedules and subsequent working plan for peer rivalry □ Applicable √ N/A VII. The establishment and execution of evaluation and incentive system for senior management during the reporting period √ Applicable □ N/A
During the reporting period, to further stimulate the innovation vitality of senior management, according to the "Proposal on 2019 Annual Performance Assessment for the Company's Professional Manager" approved by the 11th session of the seventh board of directors, the Company's professional managers cashed 2019 performance annual pay and 2019 medium- and long-term incentive during the reporting period. According to 2015-2017 tenure assessment results, the Company's senior management cashed part of 2015-2017 incentives within their tenure. VIII. Whether the self-assessment report on internal control is disclosed √ Applicable □ N/A In accordance with internal control system and evaluation method, the Company assessed effectiveness of internal control on December 31, 2020 (date of internal control assessment report) based on regular and special supervision on internal control and then prepared an internal control self-assessment report. There was no significant deficiency regarding internal control over financial reporting at the date of internal control assessment report based on relevant assessment. Directors believe that the Company has maintained, in all material aspects, effective internal control over financial reporting in accordance with relevant requirements and internal control system of the Company. Please refer to Internal Control Assessment Report of SAIC Motor Corporation Limited of 2020 published on Shanghai Stock Exchange website on the same issuing day of this report for more details. Explanations on significant deficiencies in internal control during the reporting period □ Applicable √ N/A IX. Auditors' report on internal control √ Applicable □ N/A Deloitte Touche Tohmatsu Certified Public Accountants LLP issued "Auditors' Report on Internal Control of SAIC Motor Corporation Limited" (De Shi Bao (Shen) Zi (21) No. S00094). For details, please refer to relevant announcement of the Company.
Whether the auditors' report on internal control is disclosed: Yes Type of opinion on internal control audit report: Standard unmodified opinion X. Others □ Applicable √ N/A

SAIC MOTOR ANNUAL REPORT 2020
64 / 241
Section X Corporate Bonds
√ Applicable □ N/A I. Basic information of corporate bonds
Unit: RMB hundred million
Bonds name Abbreviation Code Issuing date
Maturity date Balance
Interest rate
(%)
Method of repayment of principal
and payment of
interest
Trading place
SAIC Motor Corporation
Limited 2019 Public
Corporate Bonds (1st tranche)
19 SAIC 01 155709 2019/9/19 2022/9/19 30 3.42
Interest paid on yearly
basis, principal
fully repaid in one time
upon maturity.
Shanghai Stock
Exchange
SAIC Motor Corporation
Limited 2019 Public
Corporate Bonds (2nd
tranche)
19 SAIC 02 155847 2019/11/14 2022/11/14 20 3.60
Interest paid on yearly
basis, principal
fully repaid in one time
upon maturity.
Shanghai Stock
Exchange
Interest payment, encashment of corporate bonds √ Applicable □ N/A During the reporting period, the Company paid interest amounting to RMB 102.60 million on the SAIC Motor Corporation Limited 2019 public corporate bonds (1st tranche) for the period from September 19, 2019 to September 18, 2020 on September 21, 2020. During the reporting period, the Company paid interest amounting to RMB 72.00 million on the SAIC Motor Corporation Limited 2019 public corporate bonds (2nd tranche) for the period from November 14, 2019 to November 13, 2020 on November 16, 2020. Other descriptions of the corporate bonds □ Applicable √ N/A II. Corporate bonds trusteeship contacts, phone number and contact of credit rating institution
Trustee of the bonds
Name Guotai Junan Securities Co., Ltd. Office address Bohua Plaza 36F, No.669 Xinzha Rd., Jingan
District, Shanghai Contact Wang Pai, Zeng Yun Ye Phone number 021-38676666
SAIC MOTOR ANNUAL REPORT 2020
65 / 241
Credit rating institution
Name China Chengxin International Credit Rating Co., Ltd.
Office address 60101, Building 1, No.2 Nanzhugan Hutong, Dongcheng District, Beijing
Other descriptions: √ Applicable □ N/A China Chengxin Securities Rating Co., Ltd., a wholly-owned subsidiary of China Chengxin International Credit Rating Co., Ltd., acts as the credit rating institution of SAIC Motor Corporation Limited 2019 Public Corporate Bonds (1st tranche) and SAIC Motor Corporation Limited 2019 Public Corporate Bonds (2nd tranche). In accordance with the Reply of the China Securities Regulatory Commission on Approving China Chengxin International Credit Rating Co., Ltd. to Engage in Securities Market Credit Rating Business (Zheng Jian Xu Ke [2020] No. 267), China Chengxin International Credit Rating Co., Ltd. has succeeded to the securities market credit rating business of its wholly-owned subsidiary China Chengxin Securities Rating Co., Ltd. since February 26, 2020, and started to carry out securities market credit rating business since February 26, 2020. III. Use of the funds raised by the Company √ Applicable □ N/A As of December 31, 2019, the funds raised by the Company through issuance of "19 SAIC 01" AND "19 SAIC 02" have been fully used for the purpose disclosed in the prospectus. IV. Rating of corporate bonds √ Applicable □ N/A On June 11, 2020, China Chengxin Securities Rating Co., Ltd. issued SAIC Motor Corporation Limited 2019 Public Corporate Bonds (1st Tranche and 2nd Tranche) Tracking Rating Report (2020), and published the above reports at the website of Shanghai Stock Exchange (www.sse.com.cn). As assessed, the Company's credit rating maintains AAA, and the rating outlook is stable; the credit rating of above bonds maintains AAA. V. Credit enhancement mechanism, debt settlement plan and other information within the reporting period √ Applicable □ N/A The Company issued the corporate bonds without providing guarantee or taking other credit enhancement measures.
The value date of "19 SAIC 01" is September 19, 2019. The interest of the bonds is paid once a year within lifetime since the value date. From 2020 to 2022, the September 19 is the payment date of interest of the current tranche of bonds for prior interest-bearing period (in case of non-trading date, defer to the subsequent first trading date). The maturity date of this tranche of bonds is September 19, 2022, on which the principal and the interest of last period are paid. The value date of "19 SAIC 02" is November 14, 2019. The interest of the bonds is paid once a year within lifetime since the value date. From 2020 to 2022, the November 14 is the payment date of interest of the current tranche of bonds for prior interest-bearing period (in case of non-trading date, defer to the subsequent first trading date). The maturity date of this tranche of bonds is November 14, 2022, on which the principal and the interest of last period are paid.

SAIC MOTOR ANNUAL REPORT 2020
66 / 241
During the reporting period, the Company's credit enhancement mechanism for corporate bonds, debt settlement plan and other debt settlement guarantee measures remain unchanged. This is in line with commitments in prospectus. VI. Meetings held by holders of corporate bonds □ Applicable √ N/A VII. Performance of trustee of corporate bonds √ Applicable □ N/A During the reporting period, the trustee of corporate bonds performs its duty strictly in accordance with relevant laws and regulations and Bonds Trusteeship Management Agreement. VIII. Recent 2 years accounting figures and financial indicators of the Company as at the end of the reporting period √ Applicable □ N/A
Unit: RMB Major indicator 2020 2019 Year-on-year Changes (%)
EBITDA 52,417,471,040.65 56,458,190,319.75 -7.16 Liquidity ratio 1.1082 1.1045 0.33 Quick ratio 0.9724 0.9869 -1.47 Asset-liability ratio (%) 66.28 64.58 2.63 EBITDA total debt ratio 0.0860 0.1029 -16.42 Interest coverage ratio 17.7045 20.4611 -13.47 Cash flow interest coverage ratio 22.6516 29.3799 -22.90
EBITDA Interest coverage ratio 24.4501 26.8753 -9.02 Loan repayment rate (%) 100.00 100.00 Interest coverage ratio (%) 100.00 100.00 IX. Payment of interest of the Company's other bonds and debt financing instruments □ Applicable √ N/A X. Bank credit of the Company within the reporting period √ Applicable □ N/A The Company has good credit and maintains long-term cooperation with several banks, enabling the Company with strong financing capabilities. As at December 31, 2020, the Company has total bank credit of RMB 68.61 billion, including used credit of RMB 11.50 billion. XI. The Company's performance of relevant agreements or commitments in the prospectus within reporting period √ Applicable □ N/A During the reporting period, the Company has strictly performs the commitments made in the prospectus and used the raised funds according to regulations, without any detriment to the interests of bonds investors. XII. Significant events of the Company and the impact on the Company's operation and solvency □ Applicable √ N/A
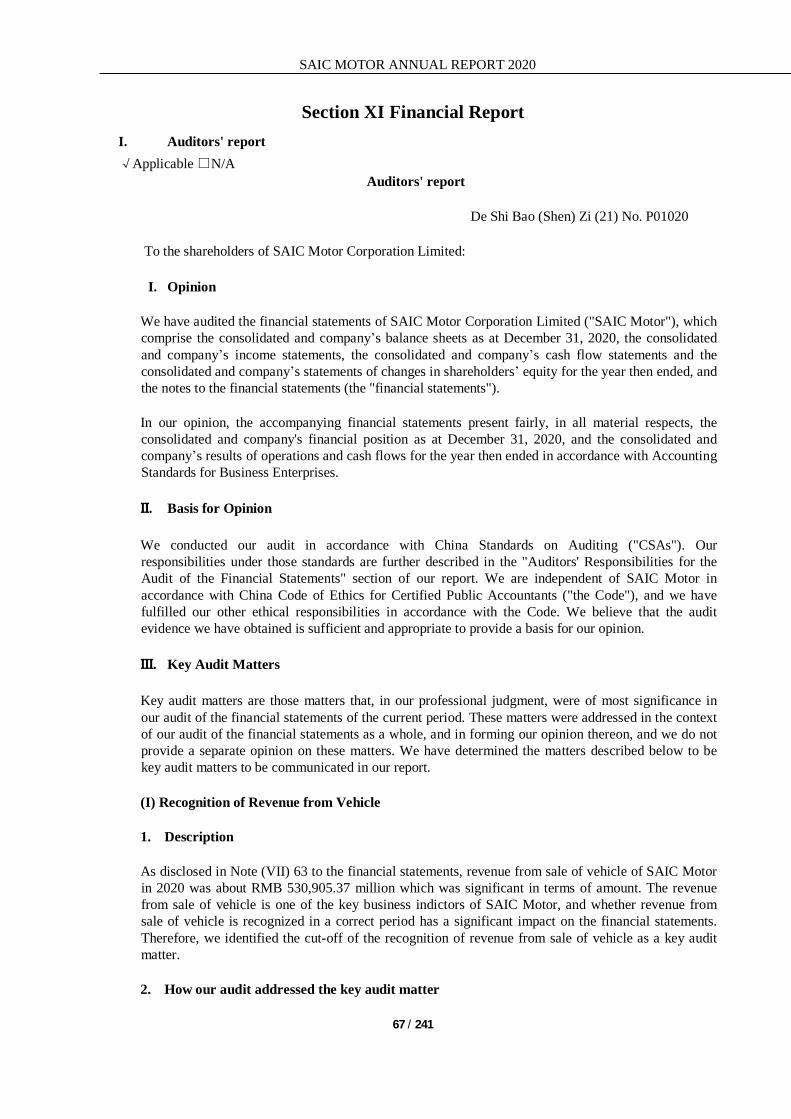
SAIC MOTOR ANNUAL REPORT 2020
67 / 241
Section XI Financial Report I. Auditors' report √Applicable □N/A
Auditors' report
De Shi Bao (Shen) Zi (21) No. P01020
To the shareholders of SAIC Motor Corporation Limited:
I. Opinion
We have audited the financial statements of SAIC Motor Corporation Limited ("SAIC Motor"), which comprise the consolidated and company’s balance sheets as at December 31, 2020, the consolidated and company’s income statements, the consolidated and company’s cash flow statements and the consolidated and company’s statements of changes in shareholders’ equity for the year then ended, and the notes to the financial statements (the "financial statements").
In our opinion, the accompanying financial statements present fairly, in all material respects, the consolidated and company's financial position as at December 31, 2020, and the consolidated and company’s results of operations and cash flows for the year then ended in accordance with Accounting Standards for Business Enterprises.
II. Basis for Opinion
We conducted our audit in accordance with China Standards on Auditing ("CSAs"). Our responsibilities under those standards are further described in the "Auditors' Responsibilities for the Audit of the Financial Statements" section of our report. We are independent of SAIC Motor in accordance with China Code of Ethics for Certified Public Accountants ("the Code"), and we have fulfilled our other ethical responsibilities in accordance with the Code. We believe that the audit evidence we have obtained is sufficient and appropriate to provide a basis for our opinion.
III. Key Audit Matters
Key audit matters are those matters that, in our professional judgment, were of most significance in our audit of the financial statements of the current period. These matters were addressed in the context of our audit of the financial statements as a whole, and in forming our opinion thereon, and we do not provide a separate opinion on these matters. We have determined the matters described below to be key audit matters to be communicated in our report.
(I) Recognition of Revenue from Vehicle
1. Description
As disclosed in Note (VII) 63 to the financial statements, revenue from sale of vehicle of SAIC Motor in 2020 was about RMB 530,905.37 million which was significant in terms of amount. The revenue from sale of vehicle is one of the key business indictors of SAIC Motor, and whether revenue from sale of vehicle is recognized in a correct period has a significant impact on the financial statements. Therefore, we identified the cut-off of the recognition of revenue from sale of vehicle as a key audit matter.
2. How our audit addressed the key audit matter

SAIC MOTOR ANNUAL REPORT 2020
68 / 241
Our audit procedures in relation to the cut-off of the recognition of revenue from sale of vehicle mainly included:
(1) Understand and evaluate the reasonableness of the design of the internal control relating to the
recognition of revenue from sale of vehicle, and test their operating effectiveness; (2) Perform cut-off test for revenue and inspect the documents and vouchers regarding revenue
recognition, such as contracts, invoices, dealer electronic transaction platform records, delivery note, receipt records etc., focusing on whether the revenue is recognized in appropriate period and whether there is significant cross-period transaction or subsequent significant adjustment;
(3) Conduct year-end stocktaking, and pay attention to whether there are vehicles of which the
revenue from sale has been recognized but the vehicles are not delivered to the dealers; (4) Select samples or use data analysis technique, analyze the time interval from the dealer's placing
order at electronic platform and the actual delivery of goods. Analyze and test the records with abnormal time interval, and determine whether the revenue is recognized in correct period;
(5) Perform analytic review procedures including analyzing sale profit margin of branch product
types, and analyzing whether the sale performance of the Company conforms to the industry environment where it operates, and judge whether the revenue amount is fluctuated abnormally;
(6) Test the subsequent sales return of vehicle, pay attention to the significant sales return, and
evaluate its impact on financial statements. (II) Product Quality Warranty
1. Description
As disclosed in Note (VII) 52 to the financial statements, the balance of accrued warranty as at December 31, 2020 was RMB 12,811.99 million, of which the balance of warranty for vehicles was RMB 10,862.91 million, which was significant. SAIC Motor shall assume the obligation of quality warranty for a certain period of time for the vehicles as referred to the prevailing business practice. The management makes estimation of warranty and makes provision accordingly based on contract terms and historical experience, where judgments and estimates are needed. We therefore identified product quality warranty of vehicles business as a key audit matter.
2. How our audit addressed the key audit matter
Our audit procedures in relation to the product quality guarantee mainly included:
(1) Understand and evaluate effectiveness of the design and implementation of internal controls relevant to the recognition of warranty, and test their operating effectiveness; (2) Evaluate whether the policy for provision of product quality warranty conforms to business practice, constitutes a single performance obligation, and whether the accounting method of product quality warranty conforms to the relevant regulations of the Accounting Standards for Business Enterprises; (3) Assess the method of the management for provision of warranty and review the calculation process of warranty;

SAIC MOTOR ANNUAL REPORT 2020
69 / 241
(4) Check the supporting documents of source data used in the calculation, such as sales data, historical claim data, etc.; (5) Test the actual payment of warranty in 2020; (6) Discuss with the management and search public information to check whether there is a major product defect in the current or subsequent period that may have a significant impact on the provision of warranty.
IV. Other Information
The management of SAIC Motor is responsible for the other information. The other information comprises the information included in the 2020 annual report of SAIC Motor, but does not include the financial statements and our auditor's report thereon.
Our opinion on the financial statements does not cover the other information and we do not express any form of assurance conclusion thereon. In connection with our audit of the financial statements, our responsibility is to read the other information and, in doing so, consider whether the other information is materially inconsistent with the financial statements or our knowledge obtained in the audit, or otherwise appears to be materially misstated.
If, based on the work we have performed, we conclude that there is a material misstatement of this other information, we are required to report that fact. We have nothing to report in this regard.
V. Responsibilities of the Management and Those Charged with Governance for the Financial Statements
The Management of SAIC Motor is responsible for the preparation and fair presentation of the financial statements in accordance with Accounting Standards for Business Enterprises, and for designing, implementing and maintaining internal control management determines is necessary to enable the preparation of financial statements that are free from material misstatement, whether due to fraud or error.
In preparing the financial statements, the Management is responsible for assessing the SAIC Motor's ability to continue as a going concern, disclosing, as applicable, matters related to going concern and using the going concern assumption unless the Management either intends to liquidate the SAIC Motor or to cease operations, or has no realistic alternative but to do so.
Those charged with Governance are responsible for overseeing the SAIC Motor's financial reporting process.
VI. Auditors' Responsibilities for the Audit of the Financial Statements
Our objectives are to obtain reasonable assurance about whether the financial statements as a whole are free from material misstatement, whether due to fraud or error, and to issue an auditor's report that includes our opinion. Reasonable assurance is a high level of assurance, but is not a guarantee that an audit conducted in accordance with CSAs will always detect a material misstatement when it exists. Misstatements can arise from fraud or error and are considered material if, individually or in the aggregate, they could reasonably be expected to influence the economic decisions of users taken on the basis of these financial statements.
As part of an audit in accordance with CSAs, we exercise professional judgment and maintain professional skepticism throughout the audit. We also:

SAIC MOTOR ANNUAL REPORT 2020
70 / 241
1. Identify and assess the risks of material misstatement of the financial statements, whether due to fraud or error, design and perform audit procedures responsive to those risks, and obtain audit evidence that is sufficient and appropriate to provide a basis for our opinion. The risk of not detecting a material misstatement resulting from fraud is higher than for one resulting from error, as fraud may involve collusion, forgery, intentional omissions, misrepresentations, or the override of internal control.
2. Obtain an understanding of internal control relevant to the audit in order to design audit procedures that are appropriate in the circumstances.
3. Evaluate the appropriateness of accounting policies used and the reasonableness of accounting estimates and related disclosures made by the Management.
4. Conclude on the appropriateness of the Management' use of the going concern assumption and, based on the audit evidence obtained, whether a material uncertainty exists related to events or conditions that may cast significant doubt on the SAIC Motor's ability to continue as a going concern. If we conclude that a material uncertainty exists, we are required by CSAs to draw attention in our auditor's report to the related disclosures in the financial statements or, if such disclosures are inadequate, to modify our opinion. Our conclusions are based on the audit evidence obtained up to the date of our auditor's report. However, future events or conditions may cause the SAIC Motor to cease to continue as a going concern.
5. Evaluate the overall presentation, including the disclosures, structure and content of the financial statements, and whether the financial statements represent the underlying transactions and events in a manner that achieves fair presentation.
6. Obtain sufficient appropriate audit evidence regarding the financial information of the entities or business activities within the SAIC Motor to express an opinion on the financial statements. We are responsible for the direction, supervision and performance of the group audit. We remain solely responsible for our audit opinion.
We communicate with those charged with Governance regarding, among other matters, the planned scope and timing of the audit and significant audit findings, including any significant deficiencies in internal control that we identify during our audit.
We also provide Those charged with Governance with a statement that we have complied with relevant ethical requirements regarding independence, and to communicate with them all relationships and other matters that may reasonably be thought to bear on our independence, and where applicable, related safeguards.
From the matters communicated with those charged with Governance, we determine those matters that were of most significance in the audit of the financial statements for the current year and are therefore the key audit matters. We describe these matters in our auditor's report unless law or regulation precludes public disclosure about the matter or when, in extremely rare circumstances, we determine that a matter should not be communicated in our report because the adverse consequences of doing so would reasonably be expected to outweigh the public interest benefits of such communication.
Deloitte Touche Tohmatsu Certified Public Accountants LLP Chinese Certified Public Accountant:
Hu Yuan Yuan Shanghai, China (Engagement Partner)

SAIC MOTOR ANNUAL REPORT 2020
71 / 241
Chinese Certified Public Accountant: Luo Yi Ming
25 March 2021 The auditors’ report and the accompanying financial statements are English translations of the Chinese auditors’ report and statutory financial statements prepared under accounting principles and practices generally accepted in the People’s Republic of China. These financial statements are not intended to present the financial position and results of operations and cash flows in accordance with accounting principles and practices generally accepted in other countries and jurisdictions. In case the English version does not conform to the Chinese version, the Chinese version prevails.
II. Financial Statements Consolidated Balance Sheet
December 31, 2020 Prepared by: SAIC MOTOR CORPORATION LIMITED
Unit: RMB Item Notes December 31, 2020 December 31, 2019
Current assets: Cash and bank balances 142,564,970,359.58 127,826,836,682.25 Balances with clearing agencies Placements with banks and other financial institutions
Held-for-trading financial assets 54,800,863,245.58 49,796,599,024.47 Derivative financial assets Notes receivable 3,486,138,399.12 6,245,092,532.74 Accounts receivable 43,602,501,087.14 41,340,635,443.91 Financing with receivables 13,168,746,883.14 11,401,837,512.65 Prepayments 39,101,796,495.91 28,939,123,052.21 Premiums receivable Amounts receivable under reinsurance contracts
Reinsurer's share of insurance contract reserves
Other receivables 11,191,801,767.53 14,602,620,859.24 Including: Interest receivable 272,429,503.45 323,603,469.30
Dividends receivable 1,082,662,112.79 1,066,824,275.97 Financial assets purchased under resale agreements
9,279,407,143.96 13,542,369,331.38
Inventories 69,395,466,035.32 54,398,633,356.34 Contract assets
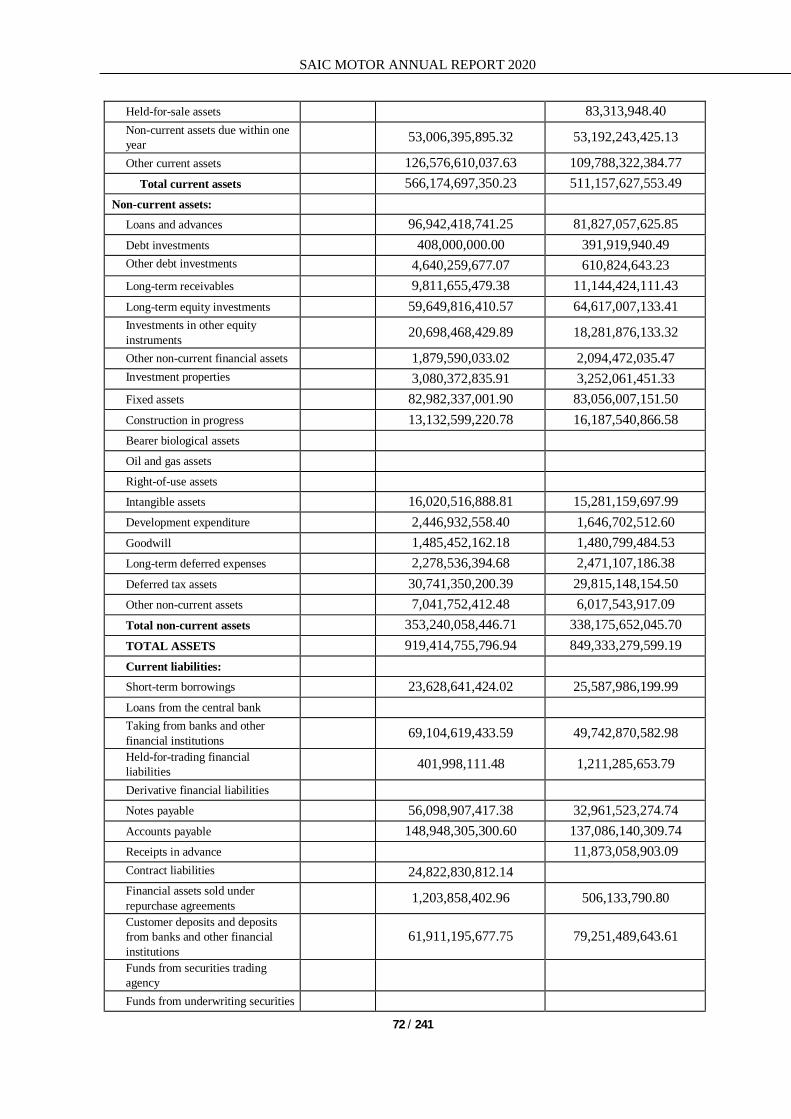
SAIC MOTOR ANNUAL REPORT 2020
72 / 241
Held-for-sale assets 83,313,948.40 Non-current assets due within one year
53,006,395,895.32 53,192,243,425.13
Other current assets 126,576,610,037.63 109,788,322,384.77 Total current assets 566,174,697,350.23 511,157,627,553.49
Non-current assets: Loans and advances 96,942,418,741.25 81,827,057,625.85 Debt investments 408,000,000.00 391,919,940.49 Other debt investments 4,640,259,677.07 610,824,643.23 Long-term receivables 9,811,655,479.38 11,144,424,111.43 Long-term equity investments 59,649,816,410.57 64,617,007,133.41 Investments in other equity instruments
20,698,468,429.89 18,281,876,133.32
Other non-current financial assets 1,879,590,033.02 2,094,472,035.47 Investment properties 3,080,372,835.91 3,252,061,451.33 Fixed assets 82,982,337,001.90 83,056,007,151.50 Construction in progress 13,132,599,220.78 16,187,540,866.58 Bearer biological assets Oil and gas assets Right-of-use assets Intangible assets 16,020,516,888.81 15,281,159,697.99 Development expenditure 2,446,932,558.40 1,646,702,512.60 Goodwill 1,485,452,162.18 1,480,799,484.53 Long-term deferred expenses 2,278,536,394.68 2,471,107,186.38 Deferred tax assets 30,741,350,200.39 29,815,148,154.50 Other non-current assets 7,041,752,412.48 6,017,543,917.09 Total non-current assets 353,240,058,446.71 338,175,652,045.70 TOTAL ASSETS 919,414,755,796.94 849,333,279,599.19 Current liabilities: Short-term borrowings 23,628,641,424.02 25,587,986,199.99 Loans from the central bank Taking from banks and other financial institutions
69,104,619,433.59 49,742,870,582.98 Held-for-trading financial liabilities
401,998,111.48 1,211,285,653.79
Derivative financial liabilities Notes payable 56,098,907,417.38 32,961,523,274.74 Accounts payable 148,948,305,300.60 137,086,140,309.74 Receipts in advance 11,873,058,903.09 Contract liabilities 24,822,830,812.14 Financial assets sold under repurchase agreements
1,203,858,402.96 506,133,790.80 Customer deposits and deposits from banks and other financial institutions
61,911,195,677.75 79,251,489,643.61
Funds from securities trading agency
Funds from underwriting securities

SAIC MOTOR ANNUAL REPORT 2020
73 / 241
agency
Employee benefits payable 11,511,239,398.79 10,379,170,737.45 Taxes payable 11,790,876,523.91 10,094,429,795.94 Other payables 77,594,213,655.77 77,082,601,425.77 Including: Interest payable 82,815,028.04 104,301,970.97 Dividends payable 2,247,573,969.63 764,365,300.59 Fees and commissions payable Amounts payable under reinsurance contracts
Held-for-sale liabilities Non-current liabilities due within one year
23,426,546,440.17 26,838,165,703.07
Other current liabilities 440,831,849.17 188,420,686.01 Total current liabilities 510,884,064,447.73 462,803,276,706.98 Non-current liabilities: Insurance contract reserves Long-term borrowings 23,608,251,949.74 19,136,965,849.72 Bonds payable 23,492,143,054.46 16,161,761,950.51 Including: Preference shares Perpetual bonds Lease liability Long-term payables 1,546,152,096.10 1,566,933,667.08 Long-term employee benefits payable
5,508,343,141.66 5,604,308,153.21
Provisions 13,669,634,572.68 13,997,027,058.90 Deferred income 23,515,634,111.73 26,111,589,446.55 Deferred tax liabilities 4,222,812,231.28 3,111,792,424.53 Other non-current liabilities 2,926,408,307.98 Total non-current liabilities 98,489,379,465.63 85,690,378,550.50 TOTAL LIABILITIES 609,373,443,913.36 548,493,655,257.48 SHAREHOLDERS' EQUITY: Paid-in capital (or share capital) 11,683,461,365.00 11,683,461,365.00 Other equity instruments Including: Preference shares Perpetual bonds Capital reserve 57,027,070,037.48 55,566,657,996.87 Less: Treasury shares 2,039,625,809.24 Other comprehensive income 13,335,554,649.53 12,504,734,839.32 Special reserve 723,680,916.08 620,295,956.53 Surplus reserve 40,843,171,648.51 40,843,171,648.51 General risk reserve 3,565,625,236.06 3,202,907,349.43 Retained earnings 134,964,016,372.01 125,280,780,539.08 Total shareholders’ equity attributable to shareholders of the Company
260,102,954,415.43 249,702,009,694.74
Minority interests 49,938,357,468.15 51,137,614,646.97

SAIC MOTOR ANNUAL REPORT 2020
74 / 241
TOTAL SHAREHOLDERS’ EQUITY
310,041,311,883.58 300,839,624,341.71
TOTAL LIABILITIES AND SHAREHOLDERS’ EQUITY
919,414,755,796.94 849,333,279,599.19
Legal Representative: Chen Hong Chief Financial Officer: Wei Yong
Head of Accounting Department: Gu Xiao Qiong
Balance Sheet of the Company December 31, 2020
Prepared by: SAIC MOTOR CORPORATION LIMITED
Unit: RMB Item Notes December 31, 2020 December 31, 2019
Current assets: Cash and bank balances 79,670,638,441.55 72,011,119,065.60 Held-for-trading financial assets
1,867,858,552.00
Derivative financial assets Notes receivable 9,164,804,838.97 6,071,016,788.76 Accounts receivable 5,418,380,341.65 2,874,223,501.88 Financing with receivables 160,542,072.65 Prepayments 562,963,184.76 529,361,646.55 Other receivables 6,312,026,191.59 7,444,277,448.97 Including: Interest receivable 1,559,376,166.02 1,145,422,370.63
Dividends receivable 885,581,149.71 1,110,646,255.34 Inventories 1,434,116,333.02 2,798,712,159.80
Contract assets Held-for-sale assets Non-current assets due within one year
821,700,000.00
Other current assets 1,582,030,457.71 5,250,897,362.65 Total current assets 106,012,818,341.25 97,961,850,046.86
Non-current assets: Debt investments 11,675,069,020.00 9,904,283,300.00 Other debt investments Long-term receivables Long-term equity investments 118,998,936,721.38 123,983,204,581.05 Investments in other equity instruments
13,630,029,876.90 11,654,528,390.76
Other non-current financial assets
Investment properties 258,277,381.29 268,817,494.81 Fixed assets 16,067,958,066.69 14,687,071,548.71 Construction in progress 2,593,629,619.27 3,720,856,168.81 Bearer biological assets Oil and gas assets

SAIC MOTOR ANNUAL REPORT 2020
75 / 241
Right-of-use assets Intangible assets 3,542,408,706.79 3,067,833,723.25 Development expenditure 2,318,369,674.55 1,548,417,822.58 Goodwill Long-term deferred expenses 132,864,523.56 Deferred tax assets Other non-current assets 9,065,399.02 25,633,554.50 Total non-current assets 169,226,608,989.45 168,860,646,584.47 TOTAL ASSETS 275,239,427,330.70 266,822,496,631.33 Current liabilities: Short-term borrowings 1,000,000,000.00 Held-for-trading financial liabilities
Derivative financial liabilities Notes payable 3,587,720,000.00 4,768,554,262.85 Accounts payable 30,498,381,942.84 28,222,090,695.05 Receipts in advance 1,493,046,298.26 Contract liabilities 3,088,000,387.91 Employee benefits payable 1,647,012,941.56 1,652,215,281.49 Taxes payable 508,780,748.92 410,401,145.84 Other payables 1,660,543,364.98 1,679,751,892.69 Including: Interest payable 45,780,821.86 44,181,076.85 Dividends payable Held-for-sale liabilities Non-current liabilities due within one year
1,730,076,088.00 1,817,576,741.00
Other current liabilities 754,835,727.38 Total current liabilities 43,475,351,201.59 41,043,636,317.18 Non-current liabilities: Long-term borrowings 9,000,000,000.00 4,400,000,000.00 Bonds payable 4,991,131,506.79 4,986,117,808.21 Including: Preference shares Perpetual bonds Lease liability Long-term payables 635,718,389.35 702,265,794.35 Long-term employee benefits payable
3,253,847,264.39 3,432,505,683.16
Provisions 2,185,841,429.11 2,056,596,984.62 Deferred income 3,511,947,358.28 3,257,536,722.60 Deferred tax liabilities 1,510,113,575.14 1,213,788,352.22 Other non-current liabilities Total non-current liabilities 25,088,599,523.06 20,048,811,345.16 TOTAL LIABILITIES 68,563,950,724.65 61,092,447,662.34 SHAREHOLDERS' EQUITY:
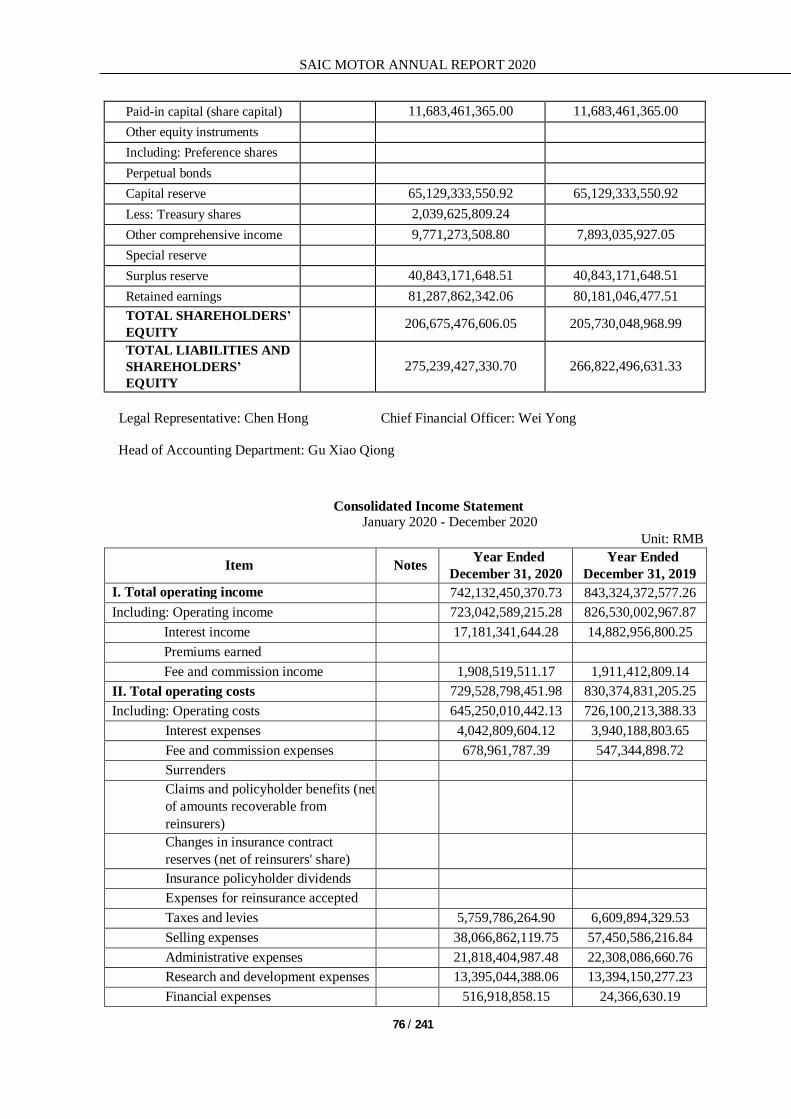
SAIC MOTOR ANNUAL REPORT 2020
76 / 241
Paid-in capital (share capital) 11,683,461,365.00 11,683,461,365.00 Other equity instruments Including: Preference shares Perpetual bonds Capital reserve 65,129,333,550.92 65,129,333,550.92 Less: Treasury shares 2,039,625,809.24 Other comprehensive income 9,771,273,508.80 7,893,035,927.05 Special reserve Surplus reserve 40,843,171,648.51 40,843,171,648.51 Retained earnings 81,287,862,342.06 80,181,046,477.51 TOTAL SHAREHOLDERS’ EQUITY
206,675,476,606.05 205,730,048,968.99
TOTAL LIABILITIES AND SHAREHOLDERS’ EQUITY
275,239,427,330.70 266,822,496,631.33
Legal Representative: Chen Hong Chief Financial Officer: Wei Yong
Head of Accounting Department: Gu Xiao Qiong
Consolidated Income Statement January 2020 - December 2020
Unit: RMB
Item Notes Year Ended December 31, 2020
Year Ended December 31, 2019
I. Total operating income 742,132,450,370.73 843,324,372,577.26 Including: Operating income 723,042,589,215.28 826,530,002,967.87
Interest income 17,181,341,644.28 14,882,956,800.25 Premiums earned Fee and commission income 1,908,519,511.17 1,911,412,809.14
II. Total operating costs 729,528,798,451.98 830,374,831,205.25 Including: Operating costs 645,250,010,442.13 726,100,213,388.33
Interest expenses 4,042,809,604.12 3,940,188,803.65 Fee and commission expenses 678,961,787.39 547,344,898.72 Surrenders Claims and policyholder benefits (net of amounts recoverable from reinsurers)
Changes in insurance contract reserves (net of reinsurers' share)
Insurance policyholder dividends Expenses for reinsurance accepted Taxes and levies 5,759,786,264.90 6,609,894,329.53 Selling expenses 38,066,862,119.75 57,450,586,216.84 Administrative expenses 21,818,404,987.48 22,308,086,660.76 Research and development expenses 13,395,044,388.06 13,394,150,277.23 Financial expenses 516,918,858.15 24,366,630.19

SAIC MOTOR ANNUAL REPORT 2020
77 / 241
Including: Interest expenses 2,179,748,060.66 2,025,928,206.43 Interest income 2,307,766,616.62 2,014,804,147.44
Add: Other income 2,579,563,169.78 4,378,558,797.16 Investment income (loss is indicated by
"-") 21,009,860,637.81 24,900,817,939.77
Including: Income from investments in associates and joint ventures
14,319,864,677.22 23,016,568,257.62
Including: Income from derecognition of financial assets at amortized cost
Foreign exchange gains (loss is indicated by "-")
19,634,717.19 29,587,749.04
Net exposure hedging income (Loss is indicated by "-")
Gains from changes in fair values (loss is indicated by "-")
3,811,635,278.12 1,496,510,091.60
Credit impairment loss (Loss is indicated by "-")
-1,116,245,649.21 -1,865,439,213.72
Impairment losses of assets (loss is indicated by "-")
-3,189,619,975.38 -1,641,964,704.12
Gains from disposal of assets (loss is indicated by "-")
-110,981,183.34 97,491,092.73
III. Operating Profit (loss is indicated by "-")
35,607,498,913.72 40,345,103,124.47
Add: Non-operating income 749,583,972.52 766,952,147.81 Less: Non-operating expenses 465,458,210.81 154,263,068.59
IV. Total profit (total loss is indicated by "-")
35,891,624,675.43 40,957,792,203.69
Less: Income tax expenses 6,703,573,806.26 5,668,885,296.06 V. Net profit (net loss is indicated by "-") 29,188,050,869.17 35,288,906,907.63 (I) Categorized by the continuity of operation
1. Net profit from continuing operations (net loss is indicated by "-")
29,188,050,869.17 35,288,906,907.63
2. Net profit from discontinued operations (net loss is indicated by "-")
(II) Categorized by ownership of equity 1. Net profit attributable to shareholders
of the Company (net loss is indicated by "-")
20,431,037,479.76 25,603,384,202.16
2. Profit or loss attributable to minority interests (net loss is indicated by "-")
8,757,013,389.41 9,685,522,705.47
VI. Other comprehensive income, net of tax 940,798,695.96 4,844,427,958.97 (I) Other comprehensive income attributable to owners of the Company, net of tax
858,382,998.64 4,381,508,462.73
1. Other comprehensive income that will not be reclassified subsequently to profit or loss
2,119,826,969.64 4,137,132,146.22
(1). Changes due to re-measurement of defined benefit plans
236,288,838.99 119,175,784.78
(2). Other comprehensive income that will not be reclassified subsequently to profit or loss under equity method
-2,654,110.89 -14,904,422.81
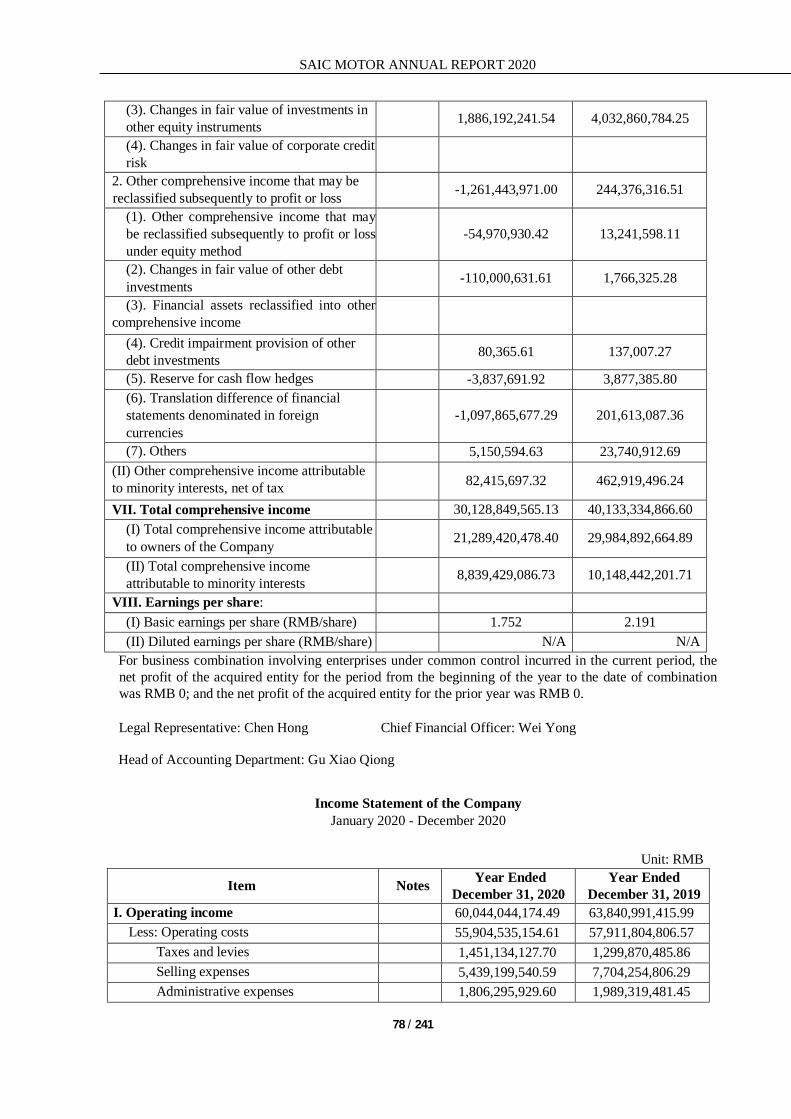
SAIC MOTOR ANNUAL REPORT 2020
78 / 241
(3). Changes in fair value of investments in other equity instruments
1,886,192,241.54 4,032,860,784.25
(4). Changes in fair value of corporate credit risk
2. Other comprehensive income that may be reclassified subsequently to profit or loss
-1,261,443,971.00 244,376,316.51
(1). Other comprehensive income that may be reclassified subsequently to profit or loss under equity method
-54,970,930.42 13,241,598.11
(2). Changes in fair value of other debt investments
-110,000,631.61 1,766,325.28
(3). Financial assets reclassified into other comprehensive income
(4). Credit impairment provision of other debt investments
80,365.61 137,007.27
(5). Reserve for cash flow hedges -3,837,691.92 3,877,385.80 (6). Translation difference of financial statements denominated in foreign currencies
-1,097,865,677.29 201,613,087.36
(7). Others 5,150,594.63 23,740,912.69 (II) Other comprehensive income attributable to minority interests, net of tax
82,415,697.32 462,919,496.24
VII. Total comprehensive income 30,128,849,565.13 40,133,334,866.60 (I) Total comprehensive income attributable to owners of the Company
21,289,420,478.40 29,984,892,664.89
(II) Total comprehensive income attributable to minority interests
8,839,429,086.73 10,148,442,201.71
VIII. Earnings per share: (I) Basic earnings per share (RMB/share) 1.752 2.191 (II) Diluted earnings per share (RMB/share) N/A N/A
For business combination involving enterprises under common control incurred in the current period, the net profit of the acquired entity for the period from the beginning of the year to the date of combination was RMB 0; and the net profit of the acquired entity for the prior year was RMB 0. Legal Representative: Chen Hong Chief Financial Officer: Wei Yong
Head of Accounting Department: Gu Xiao Qiong
Income Statement of the Company January 2020 - December 2020
Unit: RMB
Item Notes Year Ended December 31, 2020
Year Ended December 31, 2019
I. Operating income 60,044,044,174.49 63,840,991,415.99 Less: Operating costs 55,904,535,154.61 57,911,804,806.57
Taxes and levies 1,451,134,127.70 1,299,870,485.86 Selling expenses 5,439,199,540.59 7,704,254,806.29 Administrative expenses 1,806,295,929.60 1,989,319,481.45

SAIC MOTOR ANNUAL REPORT 2020
79 / 241
Research and development expenses 3,393,391,350.42 4,138,495,827.68 Financial expenses -317,440,560.91 -1,185,882,309.53 Including: Interest expenses 414,922,179.76 523,601,568.24
Interest income 1,395,954,088.18 1,486,523,251.56 Add: Other income 613,170,032.70 1,112,456,065.69
Investment income (loss is indicated by "-")
18,873,522,135.96 26,334,907,737.65
Including: Income from investments in associates and joint ventures
11,143,789,038.61 16,820,236,026.59
Income from derecognition of financial assets at amortized cost
Net exposure hedging income (Loss is indicated by "-")
Gains from changes in fair values (loss is indicated by "-")
Credit impairment loss (Loss is indicated by "-")
20,739,028.88 -26,375,413.30
Impairment losses of assets (loss is indicated by "-")
-322,649,551.38 -201,984,205.85
Gains from disposal of assets (loss is indicated by "-")
17,313,007.55 15,121,888.96
II. Operating profit (loss is indicated by "-") 11,569,023,286.19 19,217,254,390.82 Add: Non-operating income 11,854,903.12 14,019,763.75 Less: Non-operating expenses 192,616,323.56 5,706,179.43
III. Total profit (total loss is indicated by "-")
11,388,261,865.75 19,225,567,975.14
Less: Income tax expenses IV. Net Profit (net loss is indicated by "-") 11,388,261,865.75 19,225,567,975.14
(I) Net profit from continuing operations (net loss is indicated by "-")
11,388,261,865.75 19,225,567,975.14
(II) Net profit from discontinued operations (net loss is indicated by "-")
V. Other comprehensive income, net of tax 1,878,237,581.75 3,399,190,477.49 (I) Other comprehensive income that will
not be reclassified subsequently to profit or loss
1,914,079,140.24 3,387,994,921.88
1. Changes due to re-measurement of defined benefit plans
234,902,877.02 124,540,896.97
2. Other comprehensive income that will not be reclassified subsequently to profit or loss under equity method
3. Changes in fair value of investments in other equity instruments
1,679,176,263.22 3,263,454,024.91
4. Changes in fair value of corporate credit risk
(II) Other comprehensive income that may be reclassified subsequently to profit or loss
-35,841,558.49 11,195,555.61
1. Other comprehensive income that may be reclassified subsequently to profit or loss
-35,841,558.49 11,195,555.61

SAIC MOTOR ANNUAL REPORT 2020
80 / 241
under equity method 2. Changes in fair value of other debt
investments
3. Financial assets reclassified into other comprehensive income
4. Credit impairment provision of other debt investments
5. Reserve for cash flow hedges 6. Translation difference of financial
statements denominated in foreign currencies
7. Others VI. Total comprehensive income 13,266,499,447.50 22,624,758,452.63 VII. Earnings per share:
(I) Basic earnings per share (RMB/share) (II) Diluted earnings per share (RMB/share)
Legal Representative: Chen Hong Chief Financial Officer: Wei Yong
Head of Accounting Department: Gu Xiao Qiong
Consolidated Cash Flow Statement January 2020 - December 2020
Unit: RMB
Item Notes Year Ended December 31, 2020
Year Ended December 31, 2019
I. Cash flows from operating activities: Cash receipts from the sale of goods and rendering of services
637,683,837,716.36 694,909,477,909.70
Net increase in customer deposits and deposits from banks and other financial institutions
7,263,211,252.04
Net increase in loans from the central bank
Net increase in taking from banks and other financial institutions
Cash receipts from premiums under direct insurance contracts
Net cash receipts from reinsurance business
Net cash receipts from policyholders' deposits and investment contract liabilities
Cash receipts from interests, fees and commissions
21,011,673,157.42 15,328,282,421.77
Net increase in loans from banks and other financial institutions
19,361,748,850.61
Net decrease in loans and advances 24,906,969,924.38 Net increase in financial assets sold under repurchase arrangements
4,960,686,799.58
Net cash receipts from deputy securities trading

SAIC MOTOR ANNUAL REPORT 2020
81 / 241
Net decrease in balance with the central bank
201,020,078.32
Receipts of tax refunds 2,127,691,224.95 1,930,925,392.56 Other cash receipts relating to operating activities
4,823,480,853.29 8,959,680,772.78
Sub-total of cash inflows from operating activities
690,170,138,680.53 753,298,547,673.23
Cash payments for goods purchased and services received
532,397,952,038.42 583,098,756,031.78
Net decrease in customer deposits and deposits from banks and other financial institutions
17,340,293,965.86
Net increase in loans and advances 11,973,161,082.06 Net increase in balance with the central bank and due from banks and other financial institutions
800,610,904.30
Cash payments for claims and policyholders' benefits under direct insurance contracts
Net decrease in loans from banks and other financial institutions
2,367,787,705.29
Net increase in placements with other financial institutions
Cash payments for interests, fees and commissions
4,743,258,334.44 4,491,044,386.48
Cash payments for insurance policyholder dividends
Cash payments to and on behalf of employees
36,727,577,169.35 38,757,306,010.75
Net decrease in financial assets sold under repurchase arrangements
12,666,507,248.51
Payments for various types of taxes 25,438,972,333.18 29,840,839,002.02 Other payments relating to operating activities
24,030,987,953.03 35,003,843,457.35
Sub-total of cash outflows relating to operating activities
652,652,202,876.34 707,026,694,746.48
Net cash flow from operating activities 37,517,935,804.19 46,271,852,926.75 II. Cash flows from investing activities:
Cash receipts from disposals and recovery of investments
468,571,852,467.23 464,382,536,647.28
Cash receipts from investment income 24,628,968,533.37 28,993,477,154.78 Net cash receipts from disposals of fixed
assets, intangible assets and other long-term assets
923,928,493.68 1,855,522,650.39
Net cash receipts from disposals of subsidiaries and business entities
335,695,399.27 148,789,000.58
Net cash receipts from acquisitions of subsidiaries and business entities
461,714,928.24
Other cash receipts relating to investing activities
Sub-total of cash inflows from investing activities
494,922,159,821.79 495,380,325,453.03
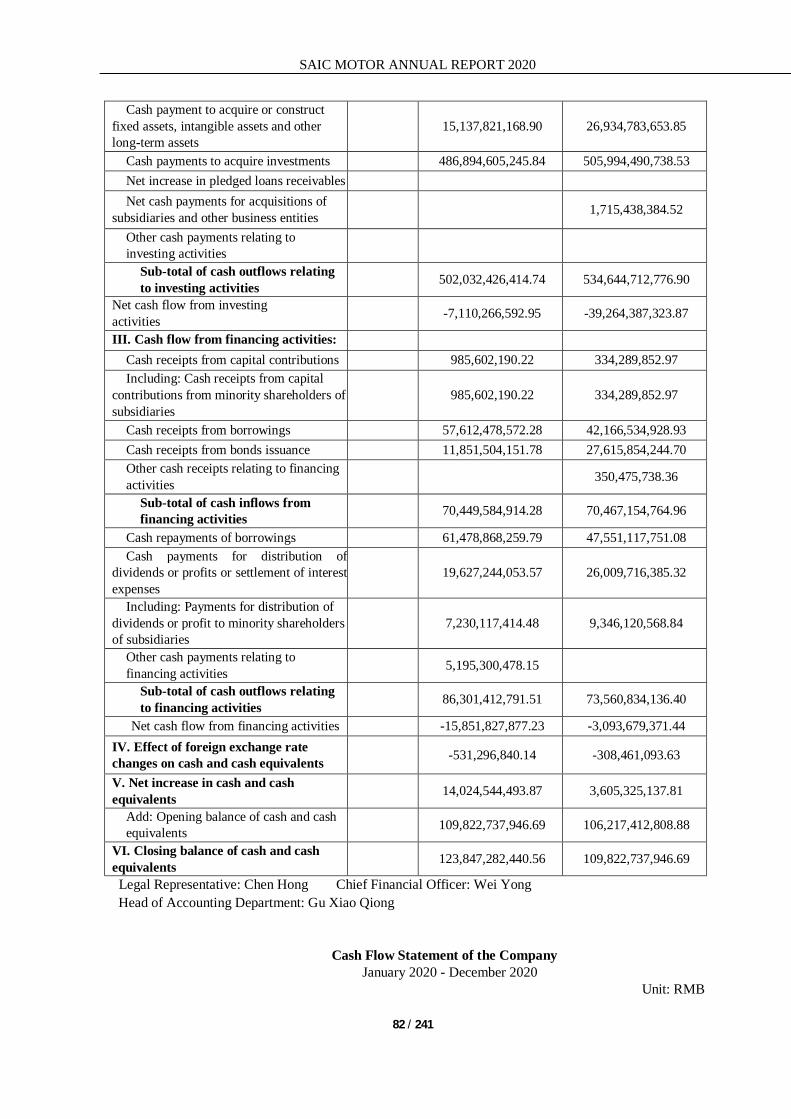
SAIC MOTOR ANNUAL REPORT 2020
82 / 241
Cash payment to acquire or construct fixed assets, intangible assets and other long-term assets
15,137,821,168.90 26,934,783,653.85
Cash payments to acquire investments 486,894,605,245.84 505,994,490,738.53 Net increase in pledged loans receivables Net cash payments for acquisitions of
subsidiaries and other business entities
1,715,438,384.52
Other cash payments relating to investing activities
Sub-total of cash outflows relating to investing activities
502,032,426,414.74 534,644,712,776.90
Net cash flow from investing activities
-7,110,266,592.95 -39,264,387,323.87
III. Cash flow from financing activities: Cash receipts from capital contributions 985,602,190.22 334,289,852.97 Including: Cash receipts from capital
contributions from minority shareholders of subsidiaries
985,602,190.22 334,289,852.97
Cash receipts from borrowings 57,612,478,572.28 42,166,534,928.93 Cash receipts from bonds issuance 11,851,504,151.78 27,615,854,244.70 Other cash receipts relating to financing activities
350,475,738.36
Sub-total of cash inflows from financing activities
70,449,584,914.28 70,467,154,764.96
Cash repayments of borrowings 61,478,868,259.79 47,551,117,751.08 Cash payments for distribution of
dividends or profits or settlement of interest expenses
19,627,244,053.57 26,009,716,385.32
Including: Payments for distribution of dividends or profit to minority shareholders of subsidiaries
7,230,117,414.48 9,346,120,568.84
Other cash payments relating to financing activities
5,195,300,478.15
Sub-total of cash outflows relating to financing activities
86,301,412,791.51 73,560,834,136.40
Net cash flow from financing activities -15,851,827,877.23 -3,093,679,371.44 IV. Effect of foreign exchange rate changes on cash and cash equivalents
-531,296,840.14 -308,461,093.63
V. Net increase in cash and cash equivalents
14,024,544,493.87 3,605,325,137.81
Add: Opening balance of cash and cash equivalents
109,822,737,946.69 106,217,412,808.88
VI. Closing balance of cash and cash equivalents
123,847,282,440.56 109,822,737,946.69
Legal Representative: Chen Hong Chief Financial Officer: Wei Yong Head of Accounting Department: Gu Xiao Qiong
Cash Flow Statement of the Company
January 2020 - December 2020 Unit: RMB
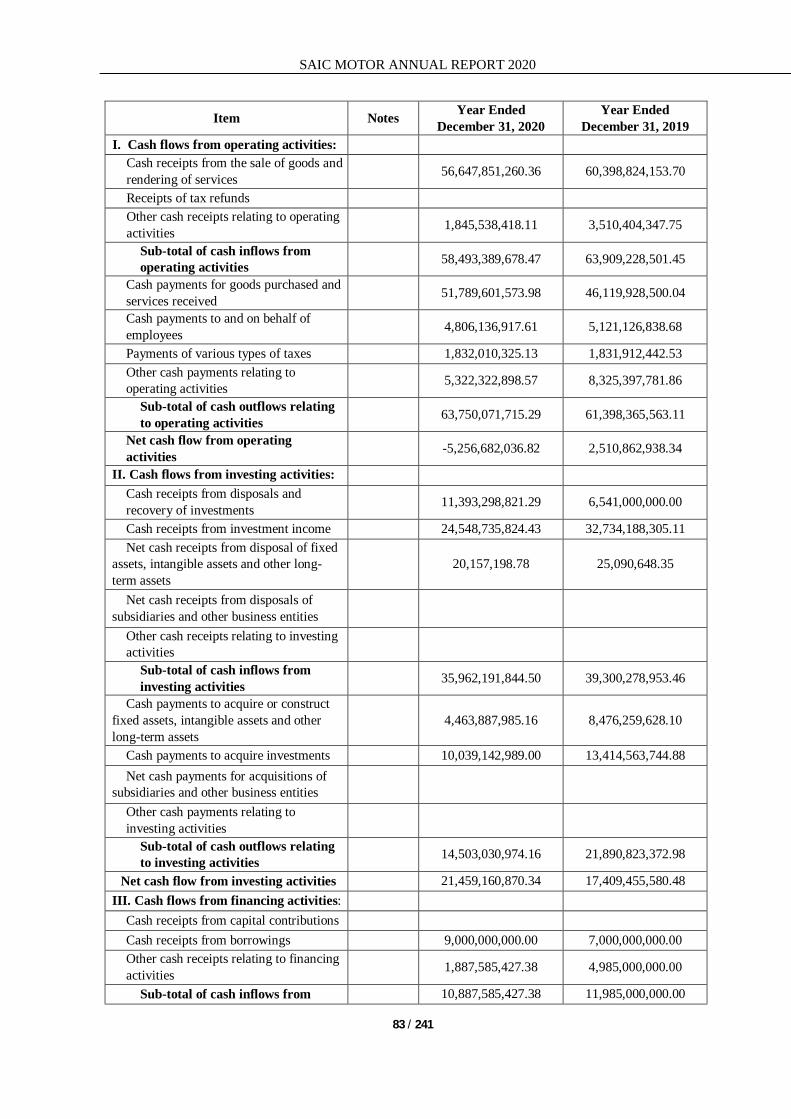
SAIC MOTOR ANNUAL REPORT 2020
83 / 241
Item Notes Year Ended December 31, 2020
Year Ended December 31, 2019
I. Cash flows from operating activities: Cash receipts from the sale of goods and rendering of services
56,647,851,260.36 60,398,824,153.70
Receipts of tax refunds Other cash receipts relating to operating activities
1,845,538,418.11 3,510,404,347.75
Sub-total of cash inflows from operating activities
58,493,389,678.47 63,909,228,501.45
Cash payments for goods purchased and services received
51,789,601,573.98 46,119,928,500.04
Cash payments to and on behalf of employees
4,806,136,917.61 5,121,126,838.68
Payments of various types of taxes 1,832,010,325.13 1,831,912,442.53 Other cash payments relating to operating activities
5,322,322,898.57 8,325,397,781.86
Sub-total of cash outflows relating to operating activities
63,750,071,715.29 61,398,365,563.11
Net cash flow from operating activities
-5,256,682,036.82 2,510,862,938.34
II. Cash flows from investing activities: Cash receipts from disposals and recovery of investments
11,393,298,821.29 6,541,000,000.00
Cash receipts from investment income 24,548,735,824.43 32,734,188,305.11 Net cash receipts from disposal of fixed
assets, intangible assets and other long-term assets
20,157,198.78 25,090,648.35
Net cash receipts from disposals of subsidiaries and other business entities
Other cash receipts relating to investing activities
Sub-total of cash inflows from investing activities
35,962,191,844.50 39,300,278,953.46
Cash payments to acquire or construct fixed assets, intangible assets and other long-term assets
4,463,887,985.16 8,476,259,628.10
Cash payments to acquire investments 10,039,142,989.00 13,414,563,744.88 Net cash payments for acquisitions of
subsidiaries and other business entities
Other cash payments relating to investing activities
Sub-total of cash outflows relating to investing activities
14,503,030,974.16 21,890,823,372.98
Net cash flow from investing activities 21,459,160,870.34 17,409,455,580.48 III. Cash flows from financing activities:
Cash receipts from capital contributions Cash receipts from borrowings 9,000,000,000.00 7,000,000,000.00 Other cash receipts relating to financing activities
1,887,585,427.38 4,985,000,000.00
Sub-total of cash inflows from 10,887,585,427.38 11,985,000,000.00
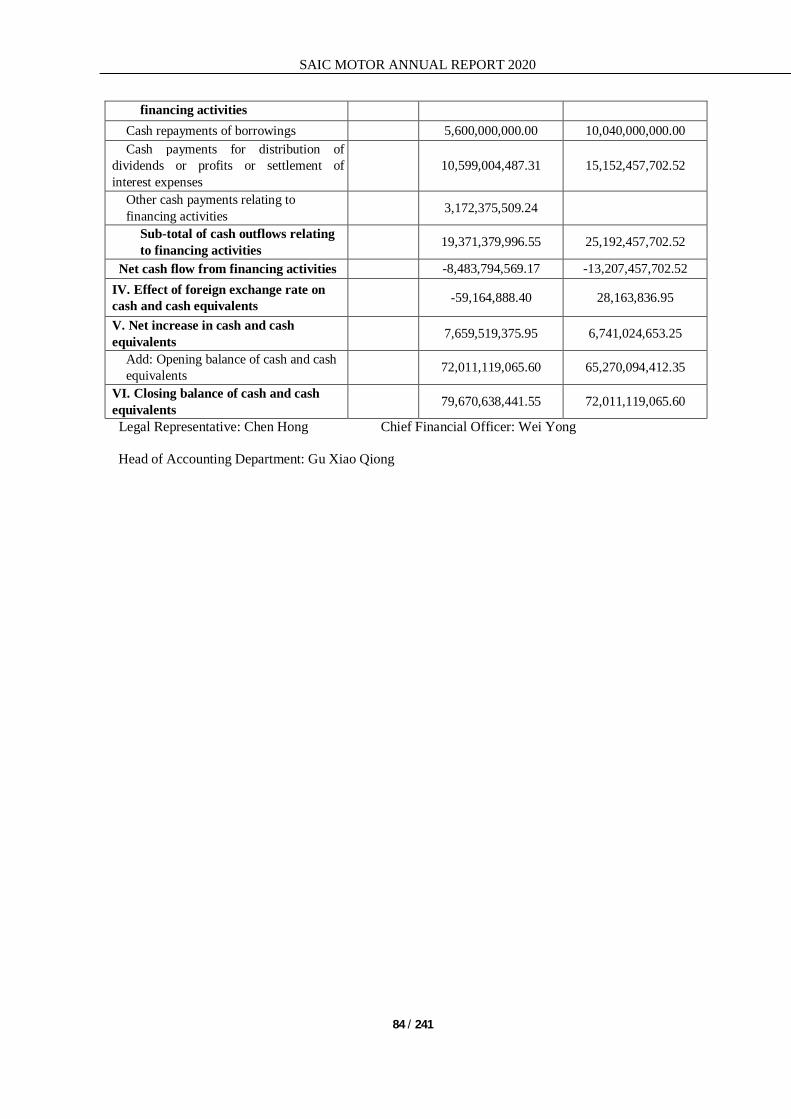
SAIC MOTOR ANNUAL REPORT 2020
84 / 241
financing activities Cash repayments of borrowings 5,600,000,000.00 10,040,000,000.00 Cash payments for distribution of
dividends or profits or settlement of interest expenses
10,599,004,487.31 15,152,457,702.52
Other cash payments relating to financing activities
3,172,375,509.24
Sub-total of cash outflows relating to financing activities
19,371,379,996.55 25,192,457,702.52
Net cash flow from financing activities -8,483,794,569.17 -13,207,457,702.52 IV. Effect of foreign exchange rate on cash and cash equivalents
-59,164,888.40 28,163,836.95
V. Net increase in cash and cash equivalents
7,659,519,375.95 6,741,024,653.25
Add: Opening balance of cash and cash equivalents
72,011,119,065.60 65,270,094,412.35
VI. Closing balance of cash and cash equivalents
79,670,638,441.55 72,011,119,065.60
Legal Representative: Chen Hong Chief Financial Officer: Wei Yong
Head of Accounting Department: Gu Xiao Qiong

SAIC MOTOR ANNUAL REPORT 2020
85 / 241
Consolidated Statement of Changes in Owners’ Equity
January 2020 - December 2020 Unit: RMB
Item
2020
Attributable to owners of the Company
Minority interests Total owners’ equity
Share capital
Other equity instruments
Capital reserve Less: Treasury shares
Other comprehensive income Special reserve Surplus reserve General risk
reserve Retained earnings Others Subtotal Preference shares Perpetual
bonds Others
I. Balance as at December 31, 2019 11,683,461,365.00 55,566,657,996.87 12,504,734,839.32 620,295,956.53 40,843,171,648.51 3,202,907,349.43 125,280,780,539.08 249,702,009,694.74 51,137,614,646.97 300,839,624,341.71 Add: Changes in accounting policies -18,806,032.89 -18,806,032.89 -4,434,842.51 -23,240,875.40
Corrections of prior period errors Business combination involving enterprises under common control Others
II. Balance as at January 1, 2020 11,683,461,365.00 55,566,657,996.87 12,504,734,839.32 620,295,956.53 40,843,171,648.51 3,202,907,349.43 125,261,974,506.19 249,683,203,661.85 51,133,179,804.46 300,816,383,466.31 III. Changes for the period (Decrease is indicated by "-") 1,460,412,040.61 2,039,625,809.24 830,819,810.21 103,384,959.55 362,717,886.63 9,702,041,865.82 10,419,750,753.58 -1,194,822,336.31 9,224,928,417.27 (I) Total comprehensive income 858,382,998.64 20,431,037,479.76 21,289,420,478.40 8,839,429,086.73 30,128,849,565.13 (II) Owners’ contributions and reduction in capital 2,039,625,809.24 -2,039,625,809.24 985,602,190.22 -1,054,023,619.02 1. Ordinary shares from owners 985,602,190.22 985,602,190.22 2. Capital contribution from other equity instrument holders
3. Share-based payment recognized in owners’ equity 4. Others 2,039,625,809.24 -2,039,625,809.24 -2,039,625,809.24 (III) Profit distribution 362,717,886.63 -10,730,263,609.26 -10,367,545,722.63 -8,846,467,151.42 -19,214,012,874.05 1. Transfer to special reserve 2. Transfer to general risk reserve 362,717,886.63 -362,717,886.63 3. Distribution to owners (or shareholders) -10,281,446,001.20 -10,281,446,001.20 -8,713,326,083.52 -18,994,772,084.72 4. Others -86,099,721.43 -86,099,721.43 -133,141,067.90 -219,240,789.33 (IV) Transfers within owners’ equity

SAIC MOTOR ANNUAL REPORT 2020
86 / 241
1. Capitalization of capital reserve (or share capital) 2. Capitalization of surplus reserve (or share capital) 3. Loss offset by surplus reserve 4. Transfers of retained earnings due to changes in defined benefit plans
5. Transfer of changes in other comprehensive income to retained earnings
6. Others (V) Special reserve 103,384,959.55 103,384,959.55 22,725,049.54 126,110,009.09 1. Transfer to special reserve in the period 127,480,465.12 127,480,465.12 45,429,458.48 172,909,923.60 2. Amount utilized in the period 24,095,505.57 24,095,505.57 22,704,408.94 46,799,914.51 (VI) Others 1,460,412,040.61 -27,563,188.43 1,267,995.32 1,434,116,847.50 -2,196,111,511.38 -761,994,663.88 IV. Balance as at December 31, 2020 11,683,461,365.00 57,027,070,037.48 2,039,625,809.24 13,335,554,649.53 723,680,916.08 40,843,171,648.51 3,565,625,236.06 134,964,016,372.01 260,102,954,415.43 49,938,357,468.15 310,041,311,883.58
Item
2019
Attributable to owners of the Company
Minority interests Total owners’ equity Share capital
Other equity instruments Capital reserve Less:
Treasury shares
Other comprehensive
income Special reserve Surplus reserve General risk reserve Retained earnings Others Subtotal
Preference shares Perpetual
bonds Others I. Balance as at December 31, 2018 11,683,461,365.00 55,322,945,530.44 8,014,045,544.15 509,046,814.71 40,843,171,648.51 2,898,526,086.15 115,097,364,967.32 234,368,561,956.28 50,351,663,521.69 284,720,225,477.97 Add: Changes in accounting policies 110,350,903.67 -181,598,428.51 -71,247,524.84 -54,300,086.58 -125,547,611.42
Corrections of prior period errors Business combination involving enterprises under common control Others
II. Balance as at January 1, 2019 11,683,461,365.00 55,322,945,530.44 8,124,396,447.82 509,046,814.71 40,843,171,648.51 2,898,526,086.15 114,915,766,538.81 234,297,314,431.44 50,297,363,435.11 284,594,677,866.55 III. Changes for the period (Decrease is indicated by "-") 243,712,466.43 4,380,338,391.50 111,249,141.82 304,381,263.28 10,365,014,000.27 15,404,695,263.30 840,251,211.86 16,244,946,475.16

SAIC MOTOR ANNUAL REPORT 2020
87 / 241
(I) Total comprehensive income 4,381,508,462.73 25,603,384,202.16 29,984,892,664.89 10,148,442,201.71 40,133,334,866.60 (II) Owners’ contributions and reduction in capital 334,289,852.97 334,289,852.97 1. Ordinary shares from owners 334,289,852.97 334,289,852.97 2. Capital contribution from other equity instrument holders 3. Share-based payment recognized in owners’ equity 4. Others (III) Profit distribution 4,298,659.31 304,381,263.28 -15,231,855,142.38 -14,923,175,219.79 -9,713,815,358.48 -24,636,990,578.27 1. Transfer to special reserve 2. Transfer to general risk reserve 304,381,263.28 -304,381,263.28 3. Distribution to owners (or shareholders) -14,721,161,319.90 -14,721,161,319.90 -9,462,987,646.51 -24,184,148,966.41 4. Others 4,298,659.31 -206,312,559.20 -202,013,899.89 -250,827,711.97 -452,841,611.86 (IV) Transfers within owners’ equity 1. Capitalization of capital reserve (or share capital) 2. Capitalization of surplus reserve (or share capital) 3. Loss offset by surplus reserve 4. Transfers of retained earnings due to changes in defined benefit plans
5. Transfer of changes in other comprehensive income to retained earnings
6. Others
(V) Special reserve 111,249,141.82 111,249,141.82 20,830,119.65 132,079,261.47 1. Transfer to special reserve in the period 141,815,943.76 141,815,943.76 47,083,071.14 188,899,014.90 2. Amount utilized in the period 30,566,801.94 30,566,801.94 26,252,951.49 56,819,753.43 (VI) Others 239,413,807.12 -1,170,071.23 -6,515,059.51 231,728,676.38 50,504,396.01 282,233,072.39 IV. Balance as at December 31, 2019 11,683,461,365.00 55,566,657,996.87 12,504,734,839.32 620,295,956.53 40,843,171,648.51 3,202,907,349.43 125,280,780,539.08 249,702,009,694.74 51,137,614,646.97 300,839,624,341.71
Legal Representative: Chen Hong Chief Financial Officer: Wei Yong Head of Accounting Department: Gu Xiao Qiong

SAIC MOTOR ANNUAL REPORT 2020
88 / 241
Statement of Changes in Owners’ Equity of the Company January 2020 - December 2020
Unit: RMB
Item
2020
Share capital Other equity instruments
Capital reserve Less: Treasury shares Other comprehensive income Special
reserve Surplus reserve Retained earnings Total owners’ equity Preference
shares Perpetual bonds Others
I. Balance as at December 31, 2019 11,683,461,365.00 65,129,333,550.92 7,893,035,927.05 40,843,171,648.51 80,181,046,477.51 205,730,048,968.99 Add: Changes in accounting policies
Corrections of prior period errors Others
II. Balance as at January 1, 2020 11,683,461,365.00 65,129,333,550.92 7,893,035,927.05 40,843,171,648.51 80,181,046,477.51 205,730,048,968.99 III. Changes for the period (Decrease is indicated by "-") 2,039,625,809.24 1,878,237,581.75 1,106,815,864.55 945,427,637.06 (I) Total comprehensive income 1,878,237,581.75 11,388,261,865.75 13,266,499,447.50 (II) Owners’ contributions and reduction in capital 2,039,625,809.24 -2,039,625,809.24 1. Ordinary shares from owners 2. Capital contribution from other equity instrument holders 3. Share-based payment recognized in owners’ equity 4. Others 2,039,625,809.24 -2,039,625,809.24 (III) Profit distribution -10,281,446,001.20 -10,281,446,001.20 1. Transfer to special reserve 2. Distribution to owners (or shareholders) -10,281,446,001.20 -10,281,446,001.20 3. Others (IV) Transfers within owners’ equity 1. Capitalization of capital reserve (or share capital) 2. Capitalization of surplus reserve (or share capital) 3. Loss offset by surplus reserve 4. Transfers of retained earnings due to changes in defined benefit plans 5. Transfer of changes in other comprehensive income to retained earnings 6. Others
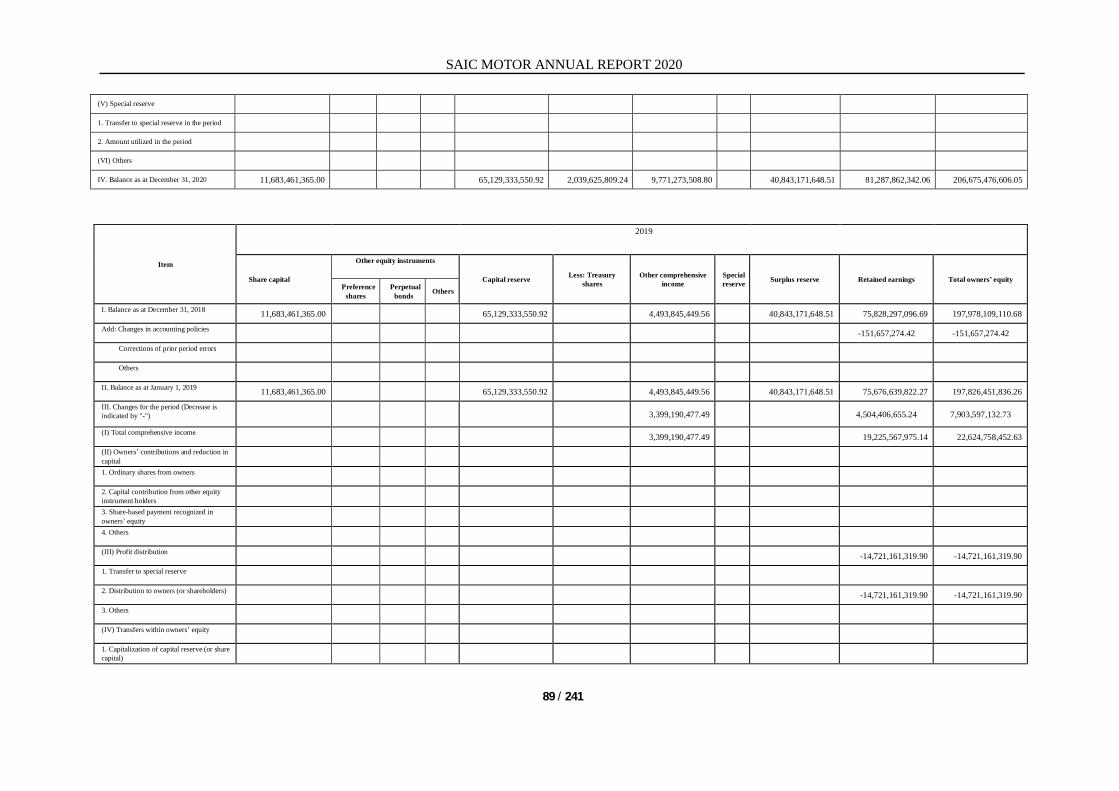
SAIC MOTOR ANNUAL REPORT 2020
89 / 241
(V) Special reserve 1. Transfer to special reserve in the period 2. Amount utilized in the period (VI) Others IV. Balance as at December 31, 2020 11,683,461,365.00 65,129,333,550.92 2,039,625,809.24 9,771,273,508.80 40,843,171,648.51 81,287,862,342.06 206,675,476,606.05
Item
2019
Share capital Other equity instruments
Capital reserve Less: Treasury shares Other comprehensive
income Special reserve Surplus reserve Retained earnings Total owners’ equity
Preference shares Perpetual
bonds Others I. Balance as at December 31, 2018 11,683,461,365.00 65,129,333,550.92 4,493,845,449.56 40,843,171,648.51 75,828,297,096.69 197,978,109,110.68 Add: Changes in accounting policies -151,657,274.42 -151,657,274.42
Corrections of prior period errors Others
II. Balance as at January 1, 2019 11,683,461,365.00 65,129,333,550.92 4,493,845,449.56 40,843,171,648.51 75,676,639,822.27 197,826,451,836.26 III. Changes for the period (Decrease is indicated by "-") 3,399,190,477.49 4,504,406,655.24 7,903,597,132.73 (I) Total comprehensive income 3,399,190,477.49 19,225,567,975.14 22,624,758,452.63 (II) Owners’ contributions and reduction in capital 1. Ordinary shares from owners 2. Capital contribution from other equity instrument holders 3. Share-based payment recognized in owners’ equity 4. Others (III) Profit distribution -14,721,161,319.90 -14,721,161,319.90 1. Transfer to special reserve 2. Distribution to owners (or shareholders) -14,721,161,319.90 -14,721,161,319.90 3. Others
(IV) Transfers within owners’ equity
1. Capitalization of capital reserve (or share capital)

SAIC MOTOR ANNUAL REPORT 2020
90 / 241
2. Capitalization of surplus reserve (or share capital) 3. Loss offset by surplus reserve
4. Transfers of retained earnings due to changes in defined benefit plans 5. Transfer of changes in other comprehensive income to retained earnings 6. Others
(V) Special reserve
1. Transfer to special reserve in the period
2. Amount utilized in the period
(VI) Others
IV. Balance as at December 31, 2019 11,683,461,365.00 65,129,333,550.92 7,893,035,927.05 40,843,171,648.51 80,181,046,477.51 205,730,048,968.99 Legal Representative: Chen Hong Chief Financial Officer: Wei Yong Head of Accounting Department: Gu Xiao Qiong

SAIC MOTOR ANNUAL REPORT 2020
91 / 241
III. THE COMPANY'S PROFILE 1. General √Applicable □N/A SAIC Motor Corporation Limited (hereinafter referred to as the “Company”) is a limited liability company exclusively initiated by Shanghai Automotive Industry Corporation (Group) (hereinafter referred to as “SAIC”) as approved by [1997] No. 41 Document issued by Shanghai Municipal People’s Government and Hu Zheng Si [1997] No. 104 Document issued by Shanghai Securities Management Office in August 1997. The credibility code is 91310000132260250X, and the operating period is infinite. On November 7, 1997, as approved by China Securities Regulatory Commission (hereinafter referred to as “CSRC”) with Zheng Jian Fa Zi [1997] No. 500, the Company issued the domestic shares that were listed in China (A Share) to the public for trading in the market, with the stock code of 600104. After the establishment, the Company has undertaken quite a few equity transactions. As at December 31, 2015, the Company’s total share capital was RMB 11,025,566,629.00 in 11,025,566,629 shares, of which SAIC held 8,191,449,931 shares, accounting for 74.30% of the total shares, and remaining shares held by the public were 2,834,116,698 shares, accounting for 25.70% of the total shares. Proposal concerning the Company's non-public issuance of A shares was approved in the 4th meeting of the sixth session of the Board held on November 5, 2015 and the 1st extraordinary general meeting in 2015 and authorized by Shanghai State-owned Assets Supervision and Administration Commission with "Reply to SAIC Motor Corporation Limited's Non-public Issuance of A Shares " (Hu Guo Zi Wei Chan Quan [2015] No. 484) and China Securities Regulatory Commission with “Approval of the Non-public Issuance of Shares of SAIC Motor Corporation Limited.” (Zheng Jian Xu Ke [2016] No. 2977), the Company was approved to issue no more than 1,056,338,028 shares (the "Issuance") of non-public issuance of A shares in RMB. The final price of the Issuance is RMB 22.80 per share at par value of RMB 1 per share which were subscribed by cash. As at January 19, 2017, the Company actually issued ordinary shares in RMB (A Share) of 657,894,736 shares at the price of RMB 22.80 per share with par value of RMB 1 per share to raise funds of RMB 14,999,999,980.80 in total. After the non-public issuance of A shares, the Company held a total of 11,683,461,365 shares. As at December 31, 2020, the Company’s total share capital was RMB 11,683,461,365.00 in 11,683,461,365 shares, of which SAIC held 8,323,028,878 shares, accounting for 71.24% of the total shares. The Company repurchased 100,000,035 shares by means of centralized bidding, accounting for 0.86% of the total shares; and there were 3,260,432,452 shares held by other public shareholders, accounting for 27.90% of the total shares. Business scope of the Company includes manufacturing and sales of automobiles, motorcycles, tractors and other motor vehicles, and machinery equipment, assembly and automobile parts, domestic trading (except those under special provisions), advisory services, sale of vehicle, assembly and components and parts in an e-commerce manner, technical service in the field of science and technology, export of self-manufactured products and technology, import of machinery and equipment, spare parts, raw and supplementary materials, and technology needed in the business operating (except goods and technology forbidden to import and export by Chinese government), rental of cars and machinery and equipment, industrial investment, periodical publishing, advertisements in the Company’s own media, import and export business of goods and technology (Any item that requires to be approved by law can only be carried out after approval by relevant authorities). The Company’s parent company is SAIC Group, which is a state-owned enterprise supervised by Shanghai SASAC. 2. Scope of the consolidated financial statements √Applicable □N/A

SAIC MOTOR ANNUAL REPORT 2020
92 / 241
Refer to Note (IX) "Interests in other entities" for details of the scope of consolidated financial statements for the year. Refer to note (VIII) "Changes in the scope of consolidation" for details of changes in the scope of consolidation during the year. IV. BASIS OF PREPARATION OF FINANCIAL STATEMENTS 1. Basis of preparation The financial statements of the Company have been prepared on a going concern basis. Basis of preparation The Company and its subsidiaries (hereinafter collectively referred to as the “Group”) adopt Accounting Standards for Business Enterprises (hereinafter referred to as “ASBE”) and other related regulations issued and enforced by the Ministry of Finance of the People’s Republic of China. In addition, the Group discloses financial information in accordance with “Information Disclosure and Preparation and Reporting Rules for Companies Offering Securities to the Public No. 15 - General Provisions on Financial Reporting (Revised in 2014)”. Basis of accounting and principle of measurement The Group has adopted the accrual basis of accounting. Except for certain financial instruments which are measured at fair value, the Company has adopted the historical cost as the principle of measurement of the financial statements. Where assets are impaired, provisions for asset impairment are made in accordance with relevant requirements. Under the basis of historical cost, assets are measured by amount of cash or cash equivalents paid for purchase or fair value of paid consideration. Liabilities are measured by funds or amount of assets received by current obligation or amount of contract, or anticipated cash and cash equivalents paid for repayment of liabilities in daily routines. Fair value is the price that would be received to sell an asset or paid to transfer a liability in an orderly transaction between market participants at the measurement date, regardless of whether that price is directly observable or estimated using another valuation technique. Fair value for measurement and disclosure purposes in the financial statements is determined on such a basis.
In measuring a non-financial asset at fair value, market participants' ability of generating economic benefits by making the best use of the assets or the ability of generating economic benefits by selling the assets to other market participants who can make the best use of the assets should be taken into consideration.
For a financial asset for which the transaction price is recognized as fair value upon initial recognition and using an valuation technique involving unobservable inputs when it is subsequently measured at fair value, the valuation technique should be rectified during the course of valuation so as to make the results of initial recognition determined by the valuation technique equal to the transaction price.
Fair value measurements are categorized into 3 levels based on the degree to which the inputs to the fair value measurements are observable and the significances of the inputs to the fair value measurement in its entirety, which are described as follows:
• Level 1 inputs are quoted prices (unadjusted) in active markets for identical assets or liabilities
that the entity can access at the measurement date; • Level 2 inputs are inputs, other than quoted prices included within Level 1, that are observable for
the asset or liability, either directly or indirectly; and

SAIC MOTOR ANNUAL REPORT 2020
93 / 241
• Level 3 inputs are unobservable inputs for the asset or liability. 2. Going concern √Applicable □N/A
The Group assessed its ability to continue as a going concern for the 12 months from December 31, 2020 and did not notice any events or circumstances that may cast significant doubt upon its ability to continue as a going concern. Therefore, the financial statements have been prepared on a going concern basis. V. SIGNIFICANT ACCOUNTING POLICIES AND ACCOUNTING ESTIMATES Tips on specific accounting policies and accounting estimates: □Applicable √N/A
1. Statement of compliance with ASBE The financial statements of the Company have been prepared in accordance with ASBE, and present truly
and completely, the consolidated and the Company’s financial position as at December 31, 2020, and the consolidated and the Company’s results of operations and cash flows for the year then ended.
2. Accounting period The Group has adopted the calendar year as its accounting year, i.e. from January 1 to December 31. 3. Operating cycle √Applicable □N/A Operating cycle is the period from purchasing assets for processing to realizing cash and cash equivalents.
The operating cycle of the Group is usually about 12 months. 4. Functional currency The Company adopts Renminbi (“RMB”) as its functional currency. RMB is the currency of the primary economic environment in which the Company and its domestic subsidiaries operate. Therefore, the Company and its domestic subsidiaries choose RMB as their functional currency. The Company’s foreign subsidiaries determine their functional currencies in accordance with the currencies in the primary economic environment where they operate. The Company adopts RMB to prepare its financial statements. 5. Accounting treatment of business combinations involving and not involving enterprises under
common control √Applicable □N/A
Business combinations are classified into business combinations involving enterprises under common control and business combinations not involving enterprises under common control. 5.1 Business combination involving enterprises under common control
A business combination involving enterprises under common control is a business combination in which all of the combining enterprises are ultimately controlled by the same party or parties both before and after

SAIC MOTOR ANNUAL REPORT 2020
94 / 241
the combination, and that control is not transitory. Assets and liabilities obtained shall be measured at their respective carrying amounts as recorded by the combining entities at the date of the combination. The difference between the carrying amount of the net assets obtained and the carrying amount of the consideration paid for the combination is adjusted to the share premium in capital reserve. If the share premium is not sufficient to absorb the difference, any excess shall be adjusted against retained earnings. Costs that are directly attributable to the combination are charged to profit or loss in the period in which they are incurred.
5.2 Business combination not involving enterprises under common control and goodwill
A business combination not involving enterprises under common control is a business combination in which all of the combining enterprises are not ultimately controlled by the same party or parties before and after the combination.
The cost of combination is the aggregate of the fair values, at the acquisition date, of the assets given, liabilities incurred or assumed, and equity securities issued by the acquirer in exchange for control of the acquiree. Where a business combination not involving enterprises under common control is achieved in stages that involve multiple transactions, the cost of combination is the sum of the consideration paid at the acquisition date and the fair value at the acquisition date of the acquirer's previously held interest in the acquiree. The intermediary expenses incurred by the acquirer in respect of auditing, legal services, valuation and consultancy services, etc. and other associated administrative expenses attributable to the business combination are recognized in profit or loss when they are incurred. The acquiree’s identifiable assets, liabilities and contingent liabilities, acquired by the acquirer in a business combination, that meet the recognition criteria shall be measured at fair value at the acquisition date. Where the cost of combination exceeds the acquirer’s interest in the fair value of the acquiree’s identifiable net assets, the difference is treated as an asset and recognized as goodwill, which is measured at cost on initial recognition. Where the cost of combination is less than the acquirer’s interest in the fair value of the acquiree’s identifiable net assets, the acquirer firstly reassesses the measurement of the fair values of the acquiree's identifiable assets, liabilities and contingent liabilities and measurement of the cost of combination. If after that reassessment, the cost of combination is still less than the acquirer’s interest in the fair value of the acquiree’s identifiable net assets, the acquirer recognizes the remaining difference immediately in profit or loss for the current period. Goodwill arising on a business combination is measured at cost less accumulated impairment losses, and is presented separately in the consolidated financial statements. 6. Preparation of consolidated financial statements √Applicable □N/A The scope of consolidation in the consolidated financial statements is determined on the basis of control. Control is the power over the investee, exposure or rights to variable returns from its involvement with the investee, and the ability to use its power over the investee to affect the amount of the investor's returns. If changes of related facts and situations lead to changes of related elements of control, the Group will undertake reassessment. The combination of subsidiaries begins with controlling the subsidiary by the Group, and ends with the Group's losing control of the subsidiary.

SAIC MOTOR ANNUAL REPORT 2020
95 / 241
For a subsidiary disposed of by the Group, the operating results and cash flows before the date of disposal (the date when control is lost) are included in the consolidated income statement and consolidated cash flow statement, as appropriate.
For a subsidiary acquired through a business combination not involving enterprises under common control, the operating results and cash flows from the acquisition date (the date when control is obtained) are included in the consolidated income statement and consolidated cash flow statement, as appropriate.
No matter when the business combination occurs in the reporting period, subsidiaries acquired through a business combination involving enterprises under common control or the party being absorbed under merger by absorption are included in the Group's scope of consolidation as if they had been included in the scope of consolidation from the date when they first came under the common control of the ultimate controlling party. Their operating results and cash flows from the beginning of the earliest reporting period are included in the consolidated income statement and consolidated cash flow statement, as appropriate.
The significant accounting policies and accounting periods adopted by the subsidiaries are determined based on the uniform accounting policies and accounting periods set out by the Company.
Influence over the consolidated financial statements arising from significant intra-group transactions are eliminated on consolidation.
The portion of subsidiaries' equity that is not attributable to the Company is treated as minority interests and presented as "minority interests" in the consolidated balance sheet within shareholders' equity. The portion of net profits or losses of subsidiaries for the period attributable to minority shareholders is presented as "profit or loss attributable to minority shareholders" in the consolidated income statement below the "net profit" line item.
When the amount of loss for the period attributable to the minority shareholders of a subsidiary exceeds the minority shareholders' portion of the opening balance of owners' equity of the subsidiary, the excess amount are still allocated against minority interests.
Acquisition of minority interests or disposal of interest in a subsidiary that does not result in the loss of control over the subsidiary is accounted for as equity transactions. The carrying amounts of the Company's interests and minority interests are adjusted to reflect the changes in their relative interests in the subsidiary. The difference between the amount by which the minority interests are adjusted and the fair value of the consideration paid or receipts is adjusted to capital reserve under shareholders' equity. If the capital reserve is not sufficient to absorb the difference, the excess are adjusted against retained earnings.
For the stepwise acquisition of equity interest till acquiring control after a few transactions and leading to business combination not under common control, this should be dealt with for whether this belongs to 'package deal': if it belongs to 'a bundled transaction', transactions will be dealt as transaction to acquire control. If it does not belong to 'a bundled transaction', transactions to acquire control on acquisition date will be under accounting treatment, the fair value of acquiree's shares held before acquisition date will be revalued, and the difference between fair value and book value will be recognized in profit or loss of current period; if acquiree's shares held before acquisition date involve in changes of other comprehensive income and other equity of owners under equity method, this will be transferred to income of acquisition date.
When the Group loses control over a subsidiary due to disposal of certain equity interest or other reasons, any retained interest is re-measured at its fair value at the date when control is lost. The difference between (i) the aggregate of the consideration received on disposal and the fair value of any retained interest and (ii) the share of the former subsidiary's net assets cumulatively calculated from the acquisition date according to the original proportion of ownership interest is recognized as investment income in the

SAIC MOTOR ANNUAL REPORT 2020
96 / 241
period in which control is lost, and goodwill is offset at the same time. Other comprehensive income associated with investment in the former subsidiary is reclassified to investment income in the period in which control is lost. When the Group loses control of a subsidiary in two or more arrangements (transactions), terms and conditions of the arrangements (transactions) and their economic effects are considered. One or more of the following indicate that the Group shall account for the multiple arrangements as a single transaction: (i) they are entered into at the same time or in contemplation of each other; (ii) they form a single transaction designed to achieve an overall commercial effect; (iii) the occurrence of one arrangement is dependent on the occurrence of at least one other arrangement; (iv) one arrangement considered on its own is not economically justified, but it is economically justified when considered together with other arrangements. If the transactions of disposal of equity interest of a subsidiary are assessed as a single transaction, these transactions are accounted for as one transaction of disposal of a subsidiary. Before losing control, the difference of consideration received on disposal and the share of net assets of the subsidiary continuously calculated from acquisition date is recognized as other comprehensive income. When losing control, the cumulated other comprehensive income is transferred to profit or loss of the period of losing control. If the transactions of disposal of equity investment of a subsidiary are not assessed as a single transaction, these transactions are accounted for as unrelated transactions.
Special purpose trust
The Group establishes a special purpose trust (structured entity) to satisfy the need of specific businesses. The Group will assess the nature of the relationship with the special purpose trust and relevant risks and rewards to determine whether the Group has control over the special purpose trust. During the above assessment, the Group make the judgement on whether it obtains control over special purpose trust based on all relevant facts and circumstances. Once the elements involved in the definition of control changes due to changes in relevant facts and circumstances, the Group will make a reassessment. Relevant facts and circumstances include: (1) Motivation for establishing special purpose trust; (2) Activities related to the special purpose trust and how to make decisions on such activities; (3) Capabilities of the Group to dominate activities related to the special purpose trust which depends on the rights enjoyed by the Group; (4) Possibility of enjoying variable returns by participating activities related to the special purpose trust; (5) Capabilities of the Group to affect the return amount by using its power on the invested entities; (6) Relationship between the Group and other parties. If the results of the assessment show that the Group obtains control over the special purpose trust, the special purpose trust will be merged by the Group.
7. Classification of joint arrangement and accounting treatment of joint operations
√Applicable □N/A
Joint arrangement is classified into joint operation and joint venture, depending on the rights and obligations of the parties to the arrangement, which is assessed by considering the structure and the legal form of the arrangement, the terms agreed by the parties in the contractual arrangement and, when relevant, other facts and circumstances. A joint operation is a joint arrangement whereby the parties that have joint control of the arrangement have rights to the assets, and obligations for the liabilities, relating to the arrangement. A joint venture is a joint arrangement whereby the parties that have joint control of the arrangement have rights to the net assets of the joint arrangement.
The Group accounts for investments in joint ventures using equity method. Refer to Note (V) 21.3.2 "Long-term equity investments accounted for using the equity method" for details.
When a group entity undertakes its activities under joint operations, the Group as a joint operator recognizes in relation to its interest in a joint operation: - its assets, including its share of any assets held jointly; - its liabilities, including its share of any liabilities incurred jointly;
SAIC MOTOR ANNUAL REPORT 2020
97 / 241
- its revenue from the sale of its share of the output arising from the joint operation; - its share of the revenue from the sale of the output by the joint operation; and - its expenses, including its share of any expenses incurred jointly.
The Group accounts for the assets, liabilities, revenues and expenses relating to its interest in a joint operation in accordance with the accounting standards applicable to the particular assets, liabilities, revenues and expenses. When the Group invest or sell assets or others (except that such assets constitute a business), only profit or loss arising from the transaction attributable to parties involved in such joint operation is recognized prior to the resale of the assets to third parties by joint operations. When there is impairment of the asset investment or sale, the Group recognizes such loss in full. When the Group purchase assets and other from joint operations (except that such assets constitute a business), only profit or loss arising from the transaction attributable to parties involved in such joint operation is recognized prior to the resale of the assets to third parties. When there is impairment of purchased assets, the Group recognizes losses based on its share. 8. Recognition criteria of cash and cash equivalents
Cash comprises cash on hand and deposits that can be readily withdrawn on demand. Cash equivalents are short-term, highly liquid investments that are readily convertible to known amounts of cash and which are subject to an insignificant risk of change in value. 9. Translation of transactions and financial statement denominated in foreign currencies √Applicable □N/A
9.1 Transactions denominated in foreign currencies
A foreign currency transaction is recorded, on initial recognition, by applying the spot exchange rate on the date of the transaction.
At the balance sheet date, foreign currency monetary items are translated into RMB using the spot exchange rates at the balance sheet date. Exchange differences arising from the differences between the spot exchange rates prevailing at the balance sheet date and those on initial recognition or at the previous balance sheet date are recognized in profit or loss for the period, except that (i) exchange differences related to a specific-purpose borrowing denominated in foreign currency that qualify for capitalization are capitalized as part of the cost of the qualifying asset during the capitalization period, (ii) exchange differences related to hedging instruments for the purpose of hedging against foreign currency risks are accounted for using hedge accounting; (3) exchange differences arising from changes in the carrying amounts (other than the amortized cost) of monetary items classified as at FVTOCI are recognized in other comprehensive income.
When the consolidated financial statements include foreign operation(s), if there is foreign currency monetary item constituting a net investment in a foreign operation, exchange difference arising from changes in exchange rates are recognized as “exchange differences arising on translation of financial statements denominated in foreign currencies” in other comprehensive income, and in profit and loss for the period upon disposal of the foreign operation.
Foreign currency non-monetary items measured at historical cost are translated to the amounts in functional currency at the spot exchange rates on the dates of the transactions and the amounts in functional currency remain unchanged. Foreign currency non-monetary items measured at fair value are re-translated at the spot exchange rate on the date the fair value is determined. Difference between the re-
SAIC MOTOR ANNUAL REPORT 2020
98 / 241
translated functional currency amount and the original functional currency amount is treated as changes in fair value (including changes of exchange rate) and is recognized in profit and loss or as other comprehensive income.
9.2 Translation of financial statements denominated in foreign currencies
For the purpose of preparing the consolidated financial statements, financial statements of a foreign operation are translated from the foreign currency into RMB using the following method: assets and liabilities on the balance sheet are translated at the spot exchange rate prevailing at the balance sheet date, shareholders’ equity items except for retained earnings are translated at the spot exchange rates at the dates on which such items arose, all items in the income statement as well as items reflecting the distribution of profits are translated at the spot exchange rates on the dates of the transactions, the opening balance of retained earnings is the translated closing balance of the previous year’s retained earnings, the closing balance of retained earnings is calculated and presented on the basis of each translated income statement and profit distribution item. The difference between the translated assets and the aggregate of liabilities and shareholders’ equity items is separately presented as the exchange differences arising on translation of financial statements denominated in other comprehensive income under the shareholders’ equity in the balance sheet. Cash flows arising from a transaction in foreign currency and the cash flows of a foreign subsidiary are translated at the spot exchange rate on the date of the cash. The effect of exchange rate changes on cash and cash equivalents is regarded as a reconciling item and presented separately in the cash flow statement as “effect of exchange rate changes on cash and cash equivalents”. The opening balances and the comparative figures of previous year are presented at the translated amounts in the previous year’s financial statements.
On disposal of the Group’s entire interest in a foreign operation, or upon a loss of control over a foreign operation due to disposal of certain interest in it or other reasons, the Group transfers the accumulated exchange differences arising on translation of financial statements of this foreign operation attributable to the owners’ equity of the Company and presented under shareholders’ equity, to profit or loss in the period in which the disposal occurs. In case of a disposal of part equity investments or other reason leading to lower interest percentage in foreign operations but does not result in the Group losing control over a foreign operation, the proportionate share of accumulated exchange differences arising on translation of financial statements are re-attributed to minority interests and are not recognized in profit and loss. For partial disposals of equity interests in foreign operations which are associates or joint ventures, the proportionate share of the accumulated exchange differences arising on translation of financial statements of foreign operations is reclassified to profit or loss. 10. Financial instruments √Applicable □N/A
Financial assets and financial liabilities are recognized when the Group becomes a party to the contractual provisions of the instrument. For financial assets purchased or sold in a regular way, the Group recognizes assets acquired and liabilities assumed on a trade date basis, or derecognizes the assets sold on a trade date basis. Financial assets and financial liabilities are initially measured at fair value. For financial assets and financial liabilities at fair value through profit or loss, transaction costs are immediately recognized in profit or loss. For other financial assets and financial liabilities, transaction costs are included in their initially recognized amounts. Initially recognized accounts receivable that do not contain significant financing components and accounts receivable that the Group decides not to consider a financing component of less than a year in accordance
SAIC MOTOR ANNUAL REPORT 2020
99 / 241
with the Accounting Standards for Business Enterprises No. 14 - Revenue ("Revenue Standards") are initially measured at the transaction price defined by the Revenue Standards.
When the fair value of a financial asset or financial liability is different from the transaction price, no profit or loss is recognized upon the initial recognition of such financial asset or financial liability provided that its fair value is determined based upon neither the quotation of same assets or liabilities in an active market nor the valuation techniques using observable market data. The effective interest method is a method of calculating the amortized cost of a financial asset or a financial liability and of allocating the interest income or interest expense over the relevant accounting period. The effective interest rate is the rate that exactly discounts estimated future cash flows through the expected life of the financial asset or financial liability or, where appropriate, a shorter period to the net carrying amount of the financial asset or financial liability. When calculating the effective interest rate, the Group estimates future cash flows considering all contractual terms of the financial asset or financial liability without considering expected credit losses. The amortized cost of a financial asset or a financial liability is an accumulatively amortized amount arising from the initially recognized amount of the financial asset or the financial liability deducting repaid principals plus or less amortization of balances between the initially recognized amount on initial recognition and the amount on maturity date using the effective interest method, and then deducting accumulated provisions for losses (only applicable to financial assets). 10.1 Classification, recognition and measurement of financial assets Subsequent to initial recognition, the Group's financial assets of various categories are subsequently measured at amortised cost, at fair value through other comprehensive income or at fair value through profit or loss. If the contractual terms of the financial asset give rise on specified dates to cash flows that are solely payments of principal and interest on the principal amount outstanding and the financial asset is held within a business model whose objective is achieved by collecting contractual cash flows, the Group shall classify the financial asset into the financial asset measured at amortized cost. Such type of financial assets are presented as debt investments or long-term receivables by nature if the maturity is over one year since acquisition date; or presented under non-current assets due within one year if the maturity is within one year (inclusive) since the balance sheet date; or presented under cash and bank balances, notes receivable, accounts receivable, other receivables or other current assets by nature if the maturity is within one year (inclusive) since acquisition date. If the contractual terms of the financial asset give rise on specified dates to cash flows that are solely payments of principal and interest on the principal amount outstanding, and the financial asset is held within a business model whose objective is achieved by both collecting contractual cash flows and selling the financial assets, the Group shall classify the financial asset into the financial assets at FVTOCI. Such type of financial assets are presented as other debt investments if the maturity is over one year since acquisition date; or presented under non-current assets due within one year if the maturity is within one year (inclusive) since the balance sheet date; or presented under financing with receivables or other current assets by nature if the maturity is within one year (inclusive) since acquisition date. Upon initial recognition, the Group irrevocably designates non-held-for-trading equity instrument investment except contingent considerations recognized in the business combination not under the same control as financial assets at fair value through other comprehensive income. Such type of financial assets are presented as other equity instrument investment.

SAIC MOTOR ANNUAL REPORT 2020
100 / 241
Financial assets meeting one of the following requirements indicate that the financial assets held by the Group are for trading: • The obtaining of relevant financial assets is mainly for the purpose of sale in the near future; • Relevant financial assets are part of the identifiable financial instrument combination under centralized
management upon initial recognition and there is objective evidence indicating that recently there exists a short-term profit model.
• Relevant financial assets are derivatives, excluding derivatives following the definition of financial guarantee contracts as well as derivatives designated as effective hedging instruments.
Financial assets at FVTPL include financial assets at FVTPL and those designated as at FVTPL.
• Financial assets that do not meet the criteria for being measured at amortized cost or FVTOCI are categorized into financial assets measured at FVTPL.
• On initial recognition, the Group may irrevocably designate a financial asset as measured at FVTPL if doing so eliminates or significantly reduces an accounting mismatch.
The financial assets at FVTPL is presented under held-for-trading financial assets. Where the financial assets are due after one year (or without fixed maturity) and expected to be held for more than one year, they are presented under other non-current financial assets.
10.1.1 Financial assets measured at amortized cost
Financial assets at amortized cost are measured subsequently at amortized cost using the effective interest method. Gains or losses arising from impairment or derecognition are recorded to profit or loss for the period. The Group recognizes interest income for financial assets measured at amortized cost using the effective interest method. The Group determines the interest income by multiplying the carrying amount of financial assets by effective rate except the following situations:
• For purchased or original credit-impaired financial assets, the Group recognizes their interest income
based on amortized cost and credit-adjusted effective interest rate of such financial assets since initial recognition.
• For purchased or original financial assets without credit impairment but subsequently becoming credit-impaired, the Group subsequently recognizes their interest income based on amortized costs and effective interest rate of such financial assets. If there exists no credit impairment due to improvement in credit risk of the financial instruments subsequently and the improvement is relevant to an event incurred subsequent to the application of above provisions, the Group recognizes interest income based on applying effective interest rate to carrying amount of the financial assets.
10.1.2 Financial assets classified as at fair value through other comprehensive income (FVTOCI)
Except that gains or losses on impairment relating to financial assets at fair value through other comprehensive income, interest income calculated using effective interest rate and exchange gains or losses are recognized in profit or loss for the period, fair value changes in the above financial assets are included in other comprehensive income. The amount of the financial assets included into profit or loss of each period shall be regarded as equal as the amount measured at amortized cost through profit or loss over each period. Upon derecognition of the financial assets, cumulative gains or losses previously recognized in other comprehensive income are transferred and reclassified into profit or loss for the period. The changes in fair value of non-held-for-trading equity investments designated as at fair value through other comprehensive income are included in retained earnings. Upon derecognition of the financial asset, cumulative gains or losses previously recognized in other comprehensive income are transferred and included in retained earnings. During the period for which the Group holds the investments in the non-
SAIC MOTOR ANNUAL REPORT 2020
101 / 241
held-for-trading equity instruments, dividend income is recognized and included in profit or loss for the period when 1) the Group’s right to collect dividend has been established; 2) it is probable that economic benefits associated with dividend will flow to the Group; and 3) the amount of dividend can be reliably measured.
10.1.3 Financial assets classified as at fair value through profit or loss
Financial assets at fair value through profit or loss are measured subsequently at fair value with gains or losses arising from changes in the fair value and dividend and interest income relevant to the financial assets are recorded to profit or loss for the period.
10.2 Impairment of financial assets
For financial assets at amortized cost, financial assets at FVTOCI, contract assets, lease receivable and financial guarantee contract etc., the Group makes accounting treatment for impairment and recognizes loss provision on the basis of expected credit loss.
The Group measures loss provision based on the amount equal to the lifetime ECL for all the notes receivable, accounts receivable and contract assets arising from the transactions under revenue standards. For other financial instruments, except for purchased or original credit-impaired financial assets, at each balance sheet date, the Group assesses changes in credit risk of relevant financial instruments since initial recognition. If the credit risk of the above financial instruments has increased significantly since initial recognition, the Group measures loss allowance based on the amount of full lifetime; if credit risk of the financial instrument has not increased significantly since initial recognition, the Group recognizes loss allowance based on 12-month ECL of the financial instrument. Increase in or reversal of credit loss allowance is included in profit or loss as loss/gain on impairment, except for financial assets classified as at fair value through other comprehensive income. The Group recognizes credit loss allowance for financial assets at FVTOCI in other comprehensive income and recognizes loss/gain on impairment in profit or loss for the period, without reducing the carrying amount of the financial assets presented in the balance sheet. The Group measured loss allowance at the full lifetime ECL of the financial instruments in the prior accounting period. However, as at the balance sheet date for the current period, for the above financial instruments, due to failure to qualify as significant increase in credit risk since initial recognition, the Group measures loss allowance for the financial instrument at 12-month ECL at the balance sheet date for the current period. Relevant reversal of loss allowance is included in profit or loss as gain on impairment. 10.2.1 Significant increase of credit risk
The Group will make use of reasonable and supportable forward-looking information that is available to determine whether credit risk has increased significantly since initial recognition through comparing the risk of a default occurring on the financial instruments as at the reporting date with the risk of a default occurring on the financial instruments as at the date of initial recognition. The Group will take the following factors into consideration when assessing whether credit risk has increased significantly:
(1) Significant changes in internal price indicators of credit risk as a result of a change in credit risk; (2) Significant change in the interest rate or other terms (e.g. stricter contract terms, increase of
guarantees or collaterals or higher rate of return etc.) of the financial instrument, where the existing financial instrument is a new financial instrument originated or issued at the balance sheet date;
(3) Significant changes in external market indicators of the same financial instrument or similar financial instruments with the same estimated lifetime. These indicators include: credit spread, credit-default-swap prices for borrowers, the length of time and extent to which the fair value of the financial assets

SAIC MOTOR ANNUAL REPORT 2020
102 / 241
is below its amortized cost, other market information relating to the borrower (such as the changes in prices of the debt instrument or equity instrument of the borrower);
(4) Actual or expected significant changes in external ratings of the financial instrument; (5) Actual or expected downwards grading of internal credit ratings of the debtor; (6) Adverse changes in business, financial or economic conditions that are expected to cause a significant
change in the debtor’s ability to meet its debt obligations; (7) An actual or expected significant change in the operating results of the debtor; (8) Significant changes in credit risk of other financial instruments issued by the same debtor; (9) Significant adverse change in the regulatory, economic, or technological environment of the debtor; (10) Significant changes in the value of the collateral supporting the obligation or in the quality of third-
party guarantees or credit enhancements, which are expected to reduce the debtor’s economic incentive to make scheduled contractual payments or to otherwise have an effect on the probability of a default occurring;
(11) Significant changes in circumstances expected to reduce the debtor’s economic incentive to make scheduled contractual payments;
(12) Expected changes in the loan documentation including an expected breach of contract that may lead to covenant waivers or amendments, interest payment holidays, interest rate step-ups, requiring additional collateral or guarantees, or other changes to the contractual framework of the financial instruments;
(13) Significant changes in the expected performance and behavior of the debtor; (14) Changes in the Group’s credit management approach in relation to the financial instrument.
No matter whether the credit risk is increased significantly after above assessment, it indicates that the credit risk of such financial instrument has been increased significantly if it lasts over 30 (inclusive) days after the overdue payment of the financial instrument contract. At balance sheet date, if the Group judges that the financial instruments solely has lower credit risk, the Group will assume that the credit risk of the financial instruments has not been significantly increased since initial recognition. If the risk of default on financial instruments is low, the borrower’s ability to meet its contractual cash flow obligations in the short term is strong, and even if the economic situation and operating environment are adversely changed over a long period of time, it may not necessarily reduce the borrower’s ability to fulfill its contractual cash flow obligations, the financial instrument is considered to have a lower credit risk. 10.2.2 Credit-impaired financial assets
When the Group expected occurrence of one or more events which may cause adverse impact on future cash flows of a financial asset, the financial asset will become a credit-impaired financial assets. Objective evidence that a financial asset is impaired includes the following observable events: (1) Significant financial difficulty of the issuer or debtor; (2) A breach of contract by the debtor, such as a default or delinquency in interest or principa payments; (3) The creditor, for economic or legal reasons relating to the debtor’s financial difficulty, granting a
concession to the debtor (4) It becoming probable that the debtor will enter bankruptcy or other financial reorganizations; (5) The disappearance of an active market for that financial asset because of financial difficulties of the
issuer or the debtor; (6) Purchase or originate a financial asset with a large scale of discount, which reflects facts of credit
loss incurred. Based on the internal credit risk management of the Group, the Group considers that a default event happens if the financial instrument debtor cannot make a repayment fully to the debtors including the Group (irrespective of any guarantee obtained by the Group) according to internal suggestions or external information.

SAIC MOTOR ANNUAL REPORT 2020
103 / 241
10.2.3 Determination of expected credit loss
For notes receivable, accounts receivable, contract assets, financing with receivables, other receivables, loans and advances, debt investments, other debt investments and long-term receivables, the Group determines the credit loss of relevant financial instruments on a collective basis. The Group divides the financial instruments into different groups based on the shared risk characteristics. The shared risk characteristics adopted by the Group include: type of financial instruments, credit risk rating, type of collaterals, initial recognition date, remaining contractual period, industry of the debtor, geographical location of the debtor and the relative value of collaterals to the financial assets etc.
The Group determines expected credit losses of relevant financial instruments using the following methods:
• For a financial asset, a credit loss is the present value of the difference between the contractual cash
flows that are due to the Group under the contract and the cash flows that the Group expects to receive; • For a financial guarantee contract, the credit loss is the present value of the differences between
estimated amount paid by the Group for the credit losses incurred by the contract holder and the amount the Group expects to receive from the contract holder, the debtor or any other party;
• For a financial asset with credit-impaired at the balance sheet date, but not purchased or originated credit-impaired, a credit losses is the difference between the asset’s gross carrying amount and the present value of estimated future cash flows discounted at the financial asset’s original effective interest rate.
The factors reflected in methods of measurement of expected credit losses include an unbiased and probability-weighted amount that is determined by evaluating a range of possible outcomes; time value of money; reasonable and supportable information about past events, current conditions and forecasts on future economic status at balance sheet date without unnecessary additional costs or efforts.
10.2.4 Write-down of financial assets
When the Group will no longer reasonably expect that the contractual cash flows of financial assets can be collected in aggregate or in part, the Group will directly write down the carrying amount of the financial asset, which constitutes derecognition of relevant financial assets.
10.3 Transfer of financial assets
The Group will derecognize a financial asset if one of the following conditions is satisfied: (i) the contractual rights to the cash flows from the financial asset expire; (ii) the financial asset has been transferred and substantially all the risks and rewards of ownership of the financial asset is transferred to the transferee; or (iii) although the financial asset has been transferred, the Group neither transfers nor retains substantially all the risks and rewards of ownership of the financial asset but has not retained control of the financial asset.
If the Group neither transfers nor retains substantially all the risks and rewards of ownership of a financial asset, and it retains control of the financial asset, the Group will recognize the financial asset to the extent of its continuing involvement in the transferred financial asset and recognize an associated liability. The Group measures relevant liabilities as follows:
• For transferred financial assets carried at amortized cost, the carrying amount of relevant liabilities is
the carrying amount of financial assets transferred with continuing involvement less amortized cost of the Group’s retained rights (if the Group retains relevant rights upon transfer of financial assets) with addition of amortized cost of obligations assumed by the Group (if the Group assumes relevant obligations upon transfer of financial assets). Relevant liabilities are not designated as financial liabilities at fair value through profit or loss.
SAIC MOTOR ANNUAL REPORT 2020
104 / 241
• For financial assets carried at fair value, the carrying amount of relevant financial liabilities is the
carrying amount of financial assets transferred with continuing involvement less fair value of the Group’s retained rights (if the Group retains relevant rights upon transfer of financial assets) with addition of fair value of obligations assumed by the Group (if the Group assumes relevant obligations upon transfer of financial assets). Accordingly, the fair value of relevant rights and obligations shall be measured on an individual basis.
For a transfer of a financial asset in its entirety that satisfies the derecognition criteria, the difference between (1) carrying amount of such financial asset transferred on the derecognition date; and (2) the sum of consideration received from the transfer of such financial asset and the amount of derecognized part in the accumulative changes in fair value that has been recognized in other comprehensive income, is recognized in profit or loss. Where the financial asset transferred by the Group is a non-trading equity instrument designated as at fair value through other comprehensive income, cumulative gains or losses previously recognized in other comprehensive income are transferred and included in retained earnings.
If a part of the transferred financial asset qualifies for derecognition, the overall carrying amount of the financial asset prior to transfer is allocated between the part that continues to be recognized and the part that is derecognized, based on the respective fair values of those parts at the date of transfer. The difference between (1) the carrying amount allocated to the part derecognized on the date of derecognition; and (2) the sum of the consideration received for the part derecognized and any cumulative gain or loss allocated to the part derecognized which has been previously recognized in other comprehensive income, is recognized in profit or loss. Where the financial asset transferred by the Group is a non-trading equity instrument designated as at fair value through other comprehensive income, cumulative gains or losses previously recognized in other comprehensive income are transferred and included in retained earnings.
For a transfer of a financial asset in its entirety that does not satisfy the derecognition criteria, the Group will continuously recognize the transferred financial asset in its entirety. Considerations received due to transfer of assets should be recognized as a liability upon receipts.
10.4 Classification of financial liabilities and equity instrument
Financial instruments issued by the Group are classified into financial liabilities or equity instruments on the basis of the substance of the contractual arrangements and the economic nature not only its legal form, together with the definition of financial liability and equity instruments.
10.4.1 Classification, recognition and measurement of financial liabilities
On initial recognition, financial liabilities are classified into financial liabilities at fair value through profit or loss and other financial liabilities.
10.4.1.1 Financial liabilities at fair value through profit or loss
Financial liabilities at fair value through profit or loss consist of financial liabilities held for trading (including derivative instruments of financial liabilities) and those designated as at fair value through profit or loss on initial recognition. The financial liabilities at fair value through profit or loss are presented as held-for-trading financial liabilities except for the derivative financial liabilities that are presented individually.
Financial liabilities meet one of the following conditions, indicating that the Group's purpose of undertaking the financial liabilities is transactional:
• The purpose of undertaking relevant financial liabilities is mainly for the recent repurchase;
SAIC MOTOR ANNUAL REPORT 2020
105 / 241
• The relevant financial liabilities are part of the centrally managed identifiable financial instrument portfolio at initial recognition, and there is objective evidence that there is a short-term profits will presence in the near future;
• Related financial liabilities are derivatives, except for derivatives that meet the definition of a financial guarantee contract and that are designated as effective hedging instruments.
The Group designates a financial liability as at FVTPL upon initial recognition if any of the following criteria is satisfied: (1) such designation may eliminate or significantly reduce accounting mismatch; (2) according to the risk management or investment strategy specified in the Group's formal written documents, the fair value is used as the basis for management and performance assessment for the portfolio of financial liabilities or portfolio of financial assets and liabilities to which the financial liability belongs, meanwhile the management and performance assessment within the Group as well as the reporting to key management personnel are on such basis; (3) qualified hybrid contracts that contain embedded derivative instruments. Held-for-trading financial liabilities are subsequently measured at fair value, and any gains or losses arising from changes in fair value and any dividend or interest income earned on the financial liabilities are recognized in profit or loss.
The amount of change in the fair value of the financial liability that is attributable to changes in the credit risk of that liability shall be presented in other comprehensive income, and upon the derecognition of such liability, the accumulated amount of change in fair value that is attributable to changes in the credit risk of that liability, which is recognized in other comprehensive income, is transferred to retained earnings. Other gains or losses arising from changes in fair value and any dividend or interest income earned on the financial liabilities are recognized in profit or loss. If the impact of the change in credit risk of such financial liability dealt with in the above way would create or enlarge an accounting mismatch in profit or loss, the Group shall present all gains or losses on that liability (including the effects of changes in the credit risk of that liability) in profit or loss.
10.4.1.2 Other financial liabilities
Other financial liabilities, except for financial liabilities arising from transfer of financial assets does not satisfy derecognition criteria or continue involvement of transferred financial assets and financial guarantee contracts liability, are subsequently measured at amortized cost, with gain or loss arising from derecognition or amortization recognized in profit or loss.
That the Group and its counterparty modify or renegotiate the contract does not result in derecognition of a financial liability subsequently measured at amortized cost but result in changes in contractual cash flows, the Group will recalculate the carrying amount of the financial liability, with relevant gain or loss recognized in profit or loss. The Group will determine carrying amount of the financial liability based on the present value of renegotiated or modified contractual cash flows discounted at the financial liability's original effective interest rate. For all costs or expenses arising from modification or renegotiation of the contract, the Group will adjust the modified carrying amount of the financial liability and make amortization during the remaining term of the modified financial liability.
10.4.1.2.1 Financial guarantee contracts
A financial guarantee contract is a contract by which the issuer is required to compensate specific amount to the contract holder suffering losses in case the specific debtor fails to settle the debt in accordance with the initial or revised terms of debt instrument when the debt falls due. For a financial guarantee contract that is not a financial liability designated as at FVTPL or a financial liability arising from transfer of financial assets which does not satisfy the criteria of derecognition or continuing involvement in the transferred financial assets, it is subsequently measured at the higher of loss provision and the initially recognized amount net of accumulated amortization recognized under revenue standards.
10.4.2 Derecognition of financial liabilities
SAIC MOTOR ANNUAL REPORT 2020
106 / 241
The Group derecognizes a financial liability (or part of it) only when the underlying present obligation (or part of it) is discharged. An agreement between the Group (an existing borrower) and an existing lender to replace the original financial liability with a new financial liability with substantially different terms is accounted for as an extinguishment of the original financial liability and the recognition of a new financial liability. When the Group derecognizes a financial liability or a part of it, it recognizes the difference between the carrying amount of the financial liability (or part of the financial liability) derecognized and the consideration paid (including any non-cash assets transferred or new financial liabilities assumed) in profit or loss.
10.4.3 Equity instruments
An equity instrument is any contract that evidences a residual interest in the assets of the Group after deducting all of its liabilities. Equity instruments issued (including refinanced), repurchased, sold and written off by the Group are recognized as changes of equity. Change of fair value of equity instruments is not recognized by the Group. Transaction costs related to equity transaction are deducted from equity.
The Group recognizes the distribution to holders of the equity instruments as distribution of profits, and dividends paid do not affect total amount of shareholders equity.
10.5 Derivatives and embedded derivatives Derivative financial instruments include forward exchange contracts, interest rate swap contracts and etc. Derivatives are initially measured at fair value at the date when the derivative contracts are entered into and are subsequently re-measured at fair value. For the hybrid contract comprised of embedded derivatives and master contract, if the master contract belongs to financial assets, the Group shall apply the hybrid contract as a whole to the accounting standards on the classification of financial assets rather than split embedded derivatives from the hybrid contract. The Group will split the embed derivatives from the hybrid contract to treat as a stand-alone derivative instrument if the master contract included in the hybrid contract does not belong to financial assets, and the following conditions are met:
• The economic characteristics of the embedded derivatives are not closely related to the economic
characteristics and risk of the master contract. • The stand-alone instrument which has the same terms of embedded derivatives conforms to the
definition of derivative instruments. • The hybrid contract is not measured at fair value through profit or loss over the current period.
Where an embedded derivative is split from a hybrid contract, the Group performs accounting treatment for the master contract of the hybrid contract in accordance with applicable accounting standards. Where the Group is unable to measure the fair value of an embedded derivative reliably in accordance with the terms and conditions of the embedded derivative, the fair value of such embedded derivative is determined as the difference between the fair value of the hybrid contract and that of the master contract. Where the fair value of such embedded derivative on the acquisition date or the subsequent balance sheet dates is still unable to be measured separately, the Group designates the hybrid contract in a whole into the financial instrument at fair value through profit or loss over the current period.
10.6 Offsetting financial assets and financial liabilities
Where the Group has a legal right that is currently enforceable to set off the recognized financial assets and financial liabilities, and intends either to settle on a net basis, or to realize the financial asset and settle the

SAIC MOTOR ANNUAL REPORT 2020
107 / 241
financial liability simultaneously, a financial asset and a financial liability shall be offset and the net amount is presented in the balance sheet. Except for the above circumstances, financial assets and financial liabilities shall be presented separately in the balance sheet and shall not be offset. 11. Notes receivable Determination and accounting methods of expected credit loss of notes receivable □Applicable √N/A 12. Accounts receivable Determination and accounting methods of expected credit loss of accounts receivable □Applicable √N/A 13. Financing with receivables
√Applicable □N/A The notes receivable classified as at FVTOCI are presented as financing with receivables. Related accounting policies are set out in Note V 10.1, 10.2, 10.3. 14. Other receivables Determination and accounting methods of expected credit loss of other receivables □Applicable √N/A 15. Inventories √Applicable □N/A 15.1 Categories of inventories
The Group’s inventories mainly include raw materials, work-in-progress, finished goods or goods on hand. Inventories are initially measured at cost. Cost of inventories comprises all costs of purchase, costs of conversion and other expenditures incurred in bringing the inventories to their present location and condition.
15.2 Valuation method of inventories upon delivery
The actual cost of inventories upon delivery is calculated using the weighted average method. Inventories are accounted for using the planned costing method upon delivery. Cost variances are computed at the end of month to adjust planned costs to actual costs.
15.3 Basis for determining net realizable value of inventories and provision methods for decline in value of inventories
At the balance sheet date, inventories are measured at the lower of cost and net realizable value. If the net realizable value is below the cost of inventories, a provision for decline in value of inventories is made.
Net realizable value is the estimated selling price in the ordinary course of business less the estimated costs of completion, the estimated costs necessary to make the sale and relevant taxes. Net realizable value is determined on the basis of conclusive evidence obtained, and takes into consideration the purposes of holding inventories and effect of post balance sheet events.

SAIC MOTOR ANNUAL REPORT 2020
108 / 241
For large quantity and low price of inventories, the inventory impairment loss provision is appropriated by category. Provisions of other inventories are appropriated at cost of individual inventory item over its net realizable value.
After the provision for decline in value of inventories is made, if the circumstances that previously caused inventories to be written down below cost no longer exist so that the net realizable value of inventories is higher than their cost, the original provision for decline in value is reversed and the reversal is included in profit or loss for the period.
15.4 Inventory count system
The perpetual inventory system is maintained for stock system.
15.5 Amortization method for low cost and short-lived consumable items and packaging materials
Packaging materials and low cost and short-lived consumable items are amortized using the immediate write-off method.
Other reusable materials are amortized using the immediate write-off method.
16. Contract assets (1) Recognition methods and standards of contract assets √Applicable □N/A Contract asset refers to the Group's right to consideration in exchange for goods or services that the Group has transferred to a customer when that right is conditioned on something other than the passage of time. The Group's right of unconditional (i.e. solely depending on the passage of time) collection of consideration from the customer shall be separately set out as receivables.
(2) Determination and accounting method of expected credit loss of contract assets √Applicable □N/A The Determination and accounting method of expected credit losses of contract assets is set out in Note V "10.2 Impairment of financial instruments". 17. Assets classified as held-for-sale
√Applicable □N/A Non-current assets and disposal groups are classified as held for sale category when the Group recovers the book value through a sale (including an exchange of nonmonetary assets that has commercial substance) rather than continuing use.
Non-current assets or disposal groups classified as held for sale are required to satisfy the following conditions: (1) the asset or disposal group is available for immediate sale in its present condition subject only to terms that are usual and customary for sales of such asset or disposal group; (2) the sale is highly probable, i.e. the Group has made a resolution about selling plan and obtained a confirmed purchase commitment and the sale is expected to be completed within one year.
When there is loss of control over a subsidiary due to disposal of investments in the subsidiary, and the proposed disposal of investment in the subsidiary satisfies classification criteria of held-for-sale category, the investments in subsidiaries are classified as held-for-sale category as a whole in the company's separate financial statement , and all assets and liabilities of subsidiaries are classified as held-for-sale category in the consolidated financial statements regardless that part of the equity investments are remained after the

SAIC MOTOR ANNUAL REPORT 2020
109 / 241
sale. The Group measures the no-current assets or disposal groups classified as held for sale at the lower of their carrying amount and fair value less costs to sell. Where the carrying amount is higher than the net amount of fair value less costs to sell, carrying amount should be reduced to the net amount of fair value less costs to sell, and such reduction is recognized in impairment loss of assets and included in profit or loss for the period. Meanwhile, provision for impairment of held-for-sale assets are made. When there is increase in the net amount of fair value of non-current assets held for sale less costs to sell at the balance sheet date, the original deduction should be reversed in impairment loss of assets recognized after the classification of held-for-sale category, and the reverse amount is include in profit or loss for the period. No reversal would be made in the impairment loss of assets recognized before classification of held-for sale category.
Non-current assets classified as held-for-sale or disposal groups are not depreciated or amortized, interest and other costs of liabilities of disposal group classified as held for sale continue to be recognized. All or part of equity investments in an associate or joint venture are classified as held-for-sale assets. For the part that is classified as held-for-sale, it is no longer accounted for using the equity method since the date of the classification. 18. Debt investments (1). Determination and accounting method of expected credit loss of debt investments □Applicable √N/A 19. Other debt investments (1). Determination and accounting method of expected credit loss of other debt investments
□Applicable √N/A 20. Long-term receivables (1). Determination and accounting method of expected credit loss of long-term receivables □Applicable √N/A 21. Long-term equity investments √Applicable □N/A
21.1 Determination of control, joint control and significant influence Control is achieved when the investor has power over the investee, is exposed, or has rights, to variable returns from its involvement with the investee, and the ability to use its power to affect its returns. Joint control is the contractually agreed sharing of control of an arrangement, which exists only when decisions about the relevant activities require unanimous consent of the parties sharing control. Significant influence is the power to participate in the financial and operating policy decisions of the investee but is not control or joint control over those policies. When assessing whether the investor can has control or significant influence over the investee, it has considered potential voting rights (e.g. exercisable convertible bonds and warrants) held by the investor and other parties.
21.2 Determination of initial investment cost
For a long-term equity investment acquired through business combination involving enterprises under common control, shares of book value of owners' equity of combined party in financial statements of ultimate controlling party are recognized as initial investment cost of long-term equity investment at combination date. The difference between initial investment cost of long-term equity investment and cash paid, non-cash assets transferred and book value of liabilities assumed, is adjusted in capital reserve. If the
SAIC MOTOR ANNUAL REPORT 2020
110 / 241
balance of capital reserve is not sufficient, any excess is adjusted to retained earnings. If the consideration of the combination is satisfied by the issue of equity securities, the initial investment cost of the long-term equity investment is the share of book value of owners' equity of the acquired entity in the ultimate controlling party’s consolidated financial statements at the date of combination. The aggregate face value of the shares issued is accounted for as share capital. The difference between the initial investment cost and the aggregate face value of the shares issued is adjusted to capital reserve. If the balance of capital reserve is not sufficient, any excess is adjusted to retained earnings. Where equity interests in an acquiree are acquired in stages through stepwise transactions ultimately constituting a business combination involving entities under common control, the acquirer shall determine if these transactions are considered to be "a bundled transaction". If yes, these transactions are accounted for as a single transaction where control is obtained. If no, the initial investment cost of the long-term equity investment is the share of book value of owners' equity of the acquired entity in the ultimate controlling party’s consolidated financial statements at the date of combination. The difference between the initial investment cost and the sum of carrying amount of equity investments previously held in the acquiree and the new investment cost is adjusted to capital reserve. If the balance of capital reserve is not sufficient, any excess is adjusted to retained earnings. Other comprehensive income recognized for the previously held equity investments by accounting treatment of equity method or available-for-sale financial assets is not subject to accounting treatment temporarily.
For a long-term equity investment acquired through business combination not involving enterprises under common control, the investment cost of the long-term equity investment is the cost of acquisition. Where equity interests in an acquiree are acquired in stages through multiple transactions ultimately constituting a business combination not involving entities under common control, the acquirer shall determine if these transactions are considered to be "a bundled transaction". .If yes, these transactions are accounted for as a single transaction where control is obtained. If no, the sum of carrying amount of equity investments previously held in the acquiree and the new investment cost is deemed as the initial investment cost of long-term equity investments that was changed to be accounted for using cost method. If the equity previously held was accounted for using the equity method, the corresponding other comprehensive income is not subject to accounting treatment temporarily. Where the previous equity investment is a non-trading equity instrument investment designated as at FVTOCI, the difference between its fair value and carrying amount, and the accumulated fair value changes previously included in other comprehensive income are transferred to retained earnings.
The expenses incurred by the acquirer in respect of auditing, legal services, valuation and consultancy services and other associated administrative expenses attributable to the business combination are recognized in profit or loss when they are incurred. Long-term equity investment acquired otherwise than through a business combination is initially measured at its cost. When the entity is able to exercise significant influence or joint control (but not control) over an investee due to additional investment, the cost of long-term equity investments is the sum of the fair value of previously-held equity investments determined in accordance with "Accounting Standard for Business Enterprises No. 22 - Financial Instruments Recognition and Measurement" and the additional investment cost.
21.3 Subsequent measurement and recognition of profit or loss
21.3.1 Long-term equity investment accounted for using the cost method
Long-term equity investments in subsidiaries are accounted for using the cost method in the Company’s separate financial statements. A subsidiary is an investee that is controlled by the Group. Under the cost method, a long-term equity investment is measured at initial investment cost. When additional investment is made or the investment is recouped, the cost of the long-term equity investment is adjusted accordingly. Investment income is recognized in the period in accordance with the attributable share of cash dividends or profit distributions declared by the investee.

SAIC MOTOR ANNUAL REPORT 2020
111 / 241
21.3.2 Long-term equity investment accounted for using the equity method
The Group accounts for investment in associates and joint ventures using the equity method. An associate is an entity over which the Group has significant influence and a joint venture is an entity over which the Group exercises joint control along with other investors. Under the equity method, where the initial investment cost of a long-term equity investment exceeds the Group’s share of the fair value of the investee’s identifiable net assets at the time of acquisition, no adjustment is made to the initial investment cost. Where the initial investment cost is less than the Group’s share of the fair value of the investee’s identifiable net assets at the time of acquisition, the difference is recognized in profit or loss for the period, and the cost of the long-term equity investment is adjusted accordingly. Under the equity method, the Group recognizes its share of the net profit or loss and other comprehensive income of the investee for the period as investment income and other comprehensive income for the period. Meanwhile, carrying amount of long-term equity investment is adjusted: the carrying amount of long-term equity investment is decreased in accordance with its share of the investee’s declared profit or cash dividends; Other changes in owners’ equity of the investee other than net profit or loss and other comprehensive income are correspondingly adjusted to the carrying amount of the long-term equity investment, and recognized in the capital reserve. The Group recognizes its share of the investee’s net profit or loss based on the fair value of the investee’s individual identifiable assets, etc. at the acquisition date after making appropriate adjustments. When the investors’ accounting policies and accounting period are inconsistent with those of the Company, the Company recognizes investment income and other comprehensive income after making appropriate adjustments to conform to the Company's accounting policies and accounting period. However, unrealized gains or losses resulting from the Group’s transactions with its associates and joint ventures, which do not constitute a business, are eliminated based on the proportion attributable to the Group and then investment gains or losses or is recognized. However, unrealized losses resulting from the Group's transactions with its associates and joint ventures which represent impairment losses on the transferred assets are not eliminated. The Group discontinues recognizing its share of net losses of the investee after the carrying amount of the long-term equity investment together with any long-term interests that in substance form part of its net investment in the investee is reduced to zero. If the Group has incurred obligations to assume additional losses of the investee, a provision is recognized according to the expected obligation, and recorded as investment loss for the period. Where net profits are subsequently made by the investee, the Group resumes recognizing its share of those profits only after its share of the profits exceeds the share of losses previously not recognized.
21.4 Disposal of long-term equity investments
On disposal of a long term equity investment, the difference between the proceeds actually received and the carrying amount of receivables is recognized in profit or loss for the period. For a long-term equity investment accounted for using the equity method, the amount included in the owners’ equity attributable to the percentage interest disposed is transferred to profit or loss for the period. For a long-term equity investment accounted for using the cost method, if it is still accounted for cost method after disposal, other comprehensive income recognized before controlling the investee according to equity method or recognition and measurement of financial instruments, account for them on the basis of related assets and liabilities, and recognized in profit or loss for proportion; change of owners' equity except for net profit or loss, other comprehensive income and profit distribution is recognized in profit or loss of current period. The Group loses control on investee due to disposal of part of shares, during preparing separate financial statement, remaining shares after disposal can make joint control or significant influence on investee, are accounted under equity method, and adjust them as they are accounted under equity method from acquisition date; if remaining shares after disposal cannot make joint control or significant influence on investee, they are accounted according to recognition and measurement of financial instrument, and the difference between fair value on date of losing control and book value is recognized in profit or loss of

SAIC MOTOR ANNUAL REPORT 2020
112 / 241
current period. Before the Group controls the investee, other comprehensive income recognized due to equity method or recognition and measurement of financial instruments, account for them on the basis of related assets and liabilities, and recognized in profit or loss for proportion; change of owners' equity except for net profit or loss, other comprehensive income and profit distribution is recognized in profit or loss of current period. Remaining shares after disposal are accounted under equity method, other comprehensive income and other owners' equity are carried forward as proportion; remaining shares after disposal are accounted due to recognition and measurement of financial instruments other comprehensive income and other owners' equity are all carried forward.
For the Group loses joint control or significant influence on investee after part disposal of shares, remaining shares after disposal are accounted according to recognition and measurement of financial instruments, the difference between fair value at the date of losing joint control or significant influence and book value is recognized in profit or loss of current period. Other comprehensive income recognized under equity method, is accounted on the basis of related assets or liabilities when stop using equity method, change of owners' equity except for net profit or loss, other comprehensive income and profit distribution is recognized in profit or loss of current period The Group loses control on subsidiaries through stepwise transactions of disposal, if transactions are a bundled transaction, all transactions are seemed as one transaction of disposal investment on subsidiaries, difference between amount of disposal and book value of long-term equity investment, is recognized as other comprehensive income, and recognized in profit or loss when losing control. 22. Investment properties Investment property is property held to earn rentals or for capital appreciation or both. It includes a land use right that is leased out, a land use right held for transfer upon capital appreciation, and a building that is leased out. An investment property is measured initially at cost. Subsequent expenditures incurred for such investment property are included in the cost of the investment property if it is probable that economic benefits associated with an investment property will flow to the Group and the subsequent expenditures can be measured reliably. Other subsequent expenditures are recognized in profit or loss in the period in which they are incurred. The Group uses the cost model for subsequent measurement of investment property, and adopts a depreciation or amortization policy for the investment property which is consistent with that for buildings or land use rights. An investment property is derecognized upon disposal or when the investment property is permanently withdrawn from use and no future economic benefits are expected from its disposals. When an investment property is sold, transferred, retired or damaged, the Group recognizes the amount of any proceeds on disposal net of the carrying amount and related taxes in profit or loss for the period. 23. Fixed assets (1). Recognition criteria for fixed assets √Applicable □N/A
Fixed assets are tangible assets that are held for use in the production or supply of goods or services, for rental to others, or for administrative purposes, and have useful lives of more than one accounting year. A fixed asset is recognized only when it is probable that economic benefits associated with the asset will flow to the Group and the cost of the asset can be measured reliably. Fixed assets are initially measured at cost. Subsequent expenditures incurred for the fixed asset are included in the cost of the fixed asset and if it is probable that economic benefits associated with the asset will flow to the Group and the subsequent

SAIC MOTOR ANNUAL REPORT 2020
113 / 241
expenditures can be measured reliably. Meanwhile the carrying amount of the replaced part is derecognized. Other subsequent expenditures are recognized in profit or loss in the period in which they are incurred. (2). Depreciation method A fixed asset is depreciated over its useful life using the straight-line method, the units of production method or the double declining balance method since the month subsequent to the one in which it is ready for intended use. The useful life, depreciation method, estimated net residual value rate and annual depreciation rate of each category of fixed assets are as follows: √Applicable □N/A
Category Depreciation method
Depreciation period (years)
Residual value rate (%)
Annual depreciation rate (%)
Buildings Straight-line depreciation 5 - 50 0 – 10% 1.8% – 20%
Machinery and equipment Straight-line depreciation 3 - 20 0 – 10% 4.5% - 33.33%
Electronic equipment, fixtures and furniture
Straight-line depreciation 2 - 20 0 – 10% 4.5% - 50%
Transportation vehicles Straight-line depreciation 3 - 15 0 – 10% 6% - 33.33%
Molds Units of production method
Not applicable 0 – 5% Not applicable
Estimated net residual value of a fixed asset is the estimated amount that the Group would currently obtain from disposal of the asset, after deducting the estimated costs of disposal, if the asset were already of the age and in the condition expected at the end of its useful life. (3). Identification, valuation and depreciation method for fixed assets under finance lease √Applicable □N/A
At the commencement of the lease term, the Group records the leased asset at an amount equal to the lower of the fair value of the leased asset and the present value of the minimum lease payments at the inception of the lease, and recognizes a long-term payable at an amount equal to the minimum lease payments. The difference between the recorded amounts is accounted for as unrecognized finance charge. Besides, initial direct costs that are attributable to the leased item incurred during the process of negotiating and securing the lease agreement are also added to the amount recognized for the leased asset. The Group adopts a depreciation policy for a fixed asset held under a finance lease which is consistent with that for its owned fixed asset. If there is reasonable certainty that the Group will obtain ownership of the leased asset at the end of the lease term, the leased asset is depreciated over its useful life. If there is no reasonable certainty that the Group will obtain ownership of the leased asset at the end of the lease term, the leased asset is depreciated over the shorter of the lease term and its useful life.
(4). Other explanations
If a fixed asset is upon disposal or no future economic benefits are expected to be generated from its use or disposal, the fixed asset is derecognized. When a fixed asset is sold, transferred, retired or damaged, the amount of any proceeds on disposal of the asset net of the carrying amount and related taxes is recognized in profit or loss for the period.

SAIC MOTOR ANNUAL REPORT 2020
114 / 241
The Group reviews the useful life and estimated net residual value of a fixed asset and the depreciation method applied at least once at each financial year-end, and account for any change as a change in an accounting estimate. 24. Construction in progress √Applicable □N/A Construction in progress is measured at its actual costs. The actual costs include various construction expenditures during the construction period, borrowing costs capitalized before it is ready for intended use and other relevant costs. Construction in progress is not depreciated. Construction in progress is transferred to a fixed asset when it is ready for intended use. 25. Borrowing costs √Applicable □N/A
Borrowing costs directly attributable to the acquisition, construction or production of qualifying asset are capitalized when expenditures for such asset and borrowing costs are incurred and activities relating to the acquisition, construction or production of the asset that are necessary to prepare the asset for its intended use or sale have commenced. Capitalization of borrowing costs ceases when the qualifying asset being acquired, constructed or produced becomes ready for its intended use or sale. Capitalization of borrowing costs is suspended during periods in which the acquisition, construction or production of a qualifying asset is suspended abnormally and when the suspension is for a continuous period of more than 3 months. Capitalization is suspended until the acquisition, construction or production of the asset is resumed. Other borrowing costs are recognized as an expense in the period in which they are incurred. Where funds are borrowed under a specific-purpose borrowing, the amount of interest to be capitalized is the actual interest expense incurred on that borrowing for the period less any bank interest earned from depositing the borrowed funds before being used on the asset or any investment income on the temporary investment of those funds. Where funds are borrowed under general-purpose borrowings, the Group determines the amount of interest to be capitalized on such borrowings by applying a capitalization rate to the weighted average of the excess of cumulative expenditures on the asset over the amounts of specific-purpose borrowings. The capitalization rate is the weighted average of the interest rates applicable to the general-purpose borrowings. During the capitalization period, exchange differences related to a specific-purpose borrowing denominated in foreign currency are all capitalized. Exchange differences in connection with general-purpose borrowings are recognized in profit or loss in the period in which they are incurred. 26. Biological assets □Applicable √N/A 27. Oil and gas assets □Applicable √N/A 28. Right-of-use assets □Applicable √N/A 29. Intangible assets (1). Valuation method, useful life and impairment test √Applicable □N/A

SAIC MOTOR ANNUAL REPORT 2020
115 / 241
Intangible assets include land use rights, non-patent technology, royalty, software license, patents, and trademark, etc. An intangible asset is measured initially at cost. When an intangible asset with a finite useful life is available for use, its original cost less net residual value and any accumulated impairment losses is amortized over its estimated useful life using the straight-line method.
Category Amortization method Useful life (year) Land use right Straight-line method 40 - 50
Non-patent technology Straight-line method 3 - 10 Royalty Straight-line method 10 - 20
Software license Straight-line method 5 - 10 Patents Straight-line method 3 - 10
Trademark Straight-line method 10
For an intangible asset with a finite useful life, the Group reviews the useful life and amortization method at the end of the period, and makes adjustments when necessary.
Specific impairment tests of relevant intangible assets are set out in Note (V) "30 Impairment of non-financial assets other than goodwill".
(2). Accounting policies of internal research and development expenditure √Applicable □N/A
Expenditure during the research phase is recognized as an expense in the period in which it is incurred.
Expenditure during the development phase that meets all of the following conditions at the same time is recognized as intangible asset. Expenditure during development phase that does not meet the following conditions is recognized in profit or loss for the period:
(1) It is technically feasible to complete the intangible asset so that it will be available for use or sale, (2) The Group has the intention to complete the intangible asset and use or sell it, (3) The Group can demonstrate the ways in which the intangible asset will generate economic benefits,
including the evidence of the existence of a market for the output of the intangible asset or the intangible asset itself or, if it is to be used internally, the usefulness of the intangible asset,
(4) The availability of adequate technical, financial and other resources to complete the development and the ability to use or sell the intangible asset, and
(5) The expenditure attributable to the intangible asset during its development phase can be reliably measured.
If the expenditures cannot be distinguished between the research phase and development phase, the Group recognizes all of them in profit or loss for the period. Costs of intangible assets from internal development only include the total expenses incurred from the time point when the capitalization condition is satisfied to that when the intangible assets meet the expected purpose, and no adjustment should be made to an intangible asset that has been expensing and included into profit or loss before it met the capitalization condition in the process of development. 30. Impairment of non-financial assets other than goodwill √Applicable □N/A

SAIC MOTOR ANNUAL REPORT 2020
116 / 241
The Group assesses at each balance sheet date whether there is any indication that long-term equity investment, investment properties measured at cost method, fixed assets and construction in progress, the intangible assets with a finite useful life and contract costs may be impaired. If there is any indication that such assets may be impaired, recoverable amounts are estimated for such assets. Intangible assets with indefinite useful life and intangible assets not yet available for use are tested for impairment annually, irrespective of whether there is any indication that the assets may be impaired.
Recoverable amount is estimated on individual basis. If it is not practical to estimate the recoverable amount of an individual asset, the recoverable amount of the asset group to which the asset belongs will be estimated. Recoverable amount is the higher of net value of fair value of assets or assets group less disposal expenses and present value of anticipated future cash flow. If the recoverable amount of an asset or an asset group is less than its carrying amount, the deficit is accounted for as an impairment loss and is recognized in profit or loss for the period.
In determination of impairment losses of assets related to contract costs, firstly impairment losses of other assets related to the contract recognized based on other relevant accounting standards; secondly, the Group shall recognized an impairment loss to the extent that the carrying amount of an asset exceeds: (1) the remaining amount of consideration that the Group expects to receive in exchange for the goods or services to which the asset relates; less; the estimated costs that relate to providing those goods or services.
Goodwill is at least undertaken impairment test at balance sheet date. When goodwill is undertaken impairment test, it is combined with related asset group or asset group portfolio. From the acquisition date, the book value of goodwill is divided into asset group or asset portfolio benefited from synergy effect of the Company, if the recoverable amount of asset group or asset portfolio including divided goodwill is less than its book value, corresponding impairment loss is recognized. Firstly, amount of impairment loss should offset the book value of goodwill of asset group or asset portfolio, and offset book value of other assets according to proportion of other assets in asset group or asset portfolio.
Except for impairment losses related to contract costs, once the impairment losses are recognized for above assets, they will not be reversed in any subsequent period. The Group shall, after the asset impairment related to contract costs has been provided, recognize in profit or loss a reversal of some or all of an impairment loss previously recognized when the impairment conditions no longer exist or have improved. The increased carrying amount of the asset shall not exceed the carrying amount that would have been determined if no impairment loss had been recognized previously. 31. Long-term deferred expenses √Applicable □N/A
Long-term deferred expenses represent expenses incurred that should be borne and amortized over the current and subsequent periods (together of more than one year). Long-term deferred expenses are amortized using the straight-line method over the expected periods in which benefits are derived. 32. Contract liabilities (1). Recognition method of contract liabilities √Applicable □N/A
Contract liabilities refers to the Group's obligation to transfer goods or services to a customer for which the Group has received consideration from the customer. Contract assets and contract liabilities under the same contract are set out on a net basis. 33. Employee benefits
SAIC MOTOR ANNUAL REPORT 2020
117 / 241
(1). Accounting treatment of short-term benefits √Applicable □N/A
Actually occurred short-term employee benefits are recognized as liabilities, with a corresponding charge to the profit or loss for the period or in the costs of relevant assets in the accounting period in which employees provide services to the Group. Staff welfare expenses incurred by the Group are recognized in profit or loss for the period or the costs of relevant assets based on the actually occurred amounts when it actually occurred. Non-monetary staff welfare expenses are measured at fair value. Payment made by the Group of social security contributions for employees such as premiums or contributions on medical insurance, work injury insurance and maternity insurance, etc. and payments of housing funds, as well as trade union fund and employee education fund provided in accordance with relevant requirements, are calculated according to prescribed bases and percentages in determining the amount of employee benefits and recognized as relevant liabilities, with a corresponding charge to the profit or loss for the period or the costs of relevant assets in the accounting period in which employees provide services. (2). Accounting treatment of post-employment benefits √Applicable □N/A
Post-employment benefits are classified into defined contribution plans and defined benefit plans.
During the accounting period of rendering service to employees of the Group, amount which should be paid according to defined contribution plans is recognized as liabilities, and recognized in profit or loss or related costs of assets.
For defined benefit plans, the Group calculates defined benefit plan obligations using projected unit credit method and the service cost resulting from employee service in the current period is recorded in profit or loss or the cost of related assets. Defined benefit costs are categorized as follows:
• service cost (including current service cost, past service cost, as well as gains and losses on
curtailments and settlements); • net interest expense or income (including interest income of planned assets, interest expenses of
defined benefit plan liabilities and effect of asset ceiling); and • changes arising from remeasurement of net liabilities or net assets of defined benefit plans.
Service costs and net interest of net liabilities and net assets of defined benefit plans are recognized in profit or loss of current period or costs of related assets. Re-measurements of the net defined benefit liability (asset) (including actuarial gains and losses, the return on plan assets, excluding amounts included in net interest on the net defined benefit liability (asset), and any change in the effect of the asset ceiling, excluding amounts included in net interest on the net defined benefit liability (asset)) are recognized in other comprehensive income. Deficit or surplus from present value of obligation of defined benefit plans less fair value of planned asset of defined benefit plans are recognized as net liabilities or net assets of a defined benefit plan. When the defined benefit plan has a surplus, the defined benefit asset is measured at the lower of the surplus in the defined benefit plan and asset ceiling. (3). Accounting treatment of termination benefits √Applicable □N/A
A liability for a termination benefit is recognized in profit or loss for the period at the earlier of when the Group cannot unilaterally withdraw from the termination plan or the redundancy offer and when the Group recognizes any related restructuring costs or expenses.

SAIC MOTOR ANNUAL REPORT 2020
118 / 241
(4). Accounting treatment of other long-term employee benefits √Applicable □N/A
For other long-term employee benefits, where the definition of defined contribution plans is met, it is accounted for according to related requirements of defined contribution plans. Otherwise, net liabilities or net assets of such other long-term employee benefit are recognized and measured according to related requirements of defined benefit plans. At balance sheet date, cost of employee benefit generated from other long-term employee benefit comprises service cost, net interest of net liabilities or net assets of other long-term employee benefit and changes arising from re-measurement of net liabilities or net assets. Net value of these items is recognized in profit or loss, other comprehensive income or cost of related assets. 34. Lease liability
□Applicable √N/A 35. Provisions √Applicable □N/A
Provisions are recognized when the Group has a present obligation related to a contingency such as products quality assurance, it is probable that an outflow of economic benefits will be required to settle the obligation, and the amount of the obligation can be measured reliably. The amount recognized as a provision is the best estimate of the consideration required to settle the present obligation at the balance sheet date, taking into account factors pertaining to a contingency such as the risks, uncertainties and time value of money. Where the effect of the time value of money is material, the amount of the provision is determined by discounting the related future cash outflows. Where all or some of the expenditure required to settle a provision is expected to be reimbursed by a third party, the reimbursement is recognized as a separate asset only when it is virtually certain that reimbursement will be received, and the amount of reimbursement recognized does not exceed the carrying amount of the provision. 36. Share-ased payment □Applicable √N/A 37. Preference shares, perpetual bonds and otherfinancial instruments □Applicable √N/A 38. Revenue (1). Accounting policies for revenue recognition and measurement √Applicable □N/A The Group's revenue is mainly from the following business types:
(1) Sales of goods (2) Rendering of services
The Group recognizes revenue based on the transaction price allocated to such performance obligation when a performance obligation is satisfied, i.e. when "control" of the goods or services underlying the particular performance obligation is transferred to the customer. A performance obligation represents the commitment that a good and service that is distinct shall be transferred by the Group to the customer. Transaction price refers to the consideration that the Group is expected to charge due to the transfer of

SAIC MOTOR ANNUAL REPORT 2020
119 / 241
goods or services to the customer, but it does not include payments received on behalf of third parties and amounts that the Group expects to return to the customer. If one of the following criteria is met and it is a performance obligation performed over a period of time, the Group recognizes the revenue within a certain period of time according to the progress of the performance: (1) the customer simultaneously receives and consumes the benefits provided by the Group's performance as the Group performs; (2) the customer is able to control the goods under construction in the course of the Group's performance; (3) the goods produced by the Group during the performance of the contract are irreplaceable and the Group has the right to charge for the accumulated part of the contract that has been performed so far during the whole contract period. Otherwise, the Group recognizes revenue at a certain point in time when "control" of the goods or services is transferred to the customer.
The Group determines progress of performance using input method, namely according to the Group's input into the performance of contractual obligations. When the progress of performance cannot be reasonably determined, the costs incurred are expected to be compensated, the Group recognizes revenue based on the amount of costs incurred till the progress of performance can be reasonably determined.
If there are two or more of performance obligations included in the contract, at the contract inception, the Group allocates the transaction price to each single performance obligation based on the proportion of stand-alone selling price of goods or services promised in each stand-alone performance obligation. However, if there is conclusive evidence indicating that the contract discount or variable consideration is only relative with one or more (not the whole) performance obligations in the contract, the Group will allocate the contract discount or variable consideration to relative one or more performance obligation. Stand-alone selling price refers to the price of single sales of goods or services. If the stand-alone selling price cannot be observed directly, the Group estimates the stand-alone selling price through comprehensive consideration of all reasonably acquired relative information and maximum use of observable inputs.
In case of the existence of variable consideration (sales rebates, commercial discounts etc.) in the contract, the Group shall determine the best estimate of variable consideration based on the expected value or the most probably occurred amount. The transaction price including variable consideration shall not exceed the amount of the cumulative recognized revenue which is the most probably to be significantly reversed when elimination of relevant uncertainty. At each balance sheet date, the Group re-estimate the amount of variable consideration which should be included in transaction price.
For the sales that are affixed with terms of sales return, the Group recognizes the revenue in accordance with the consideration amount (i.e., excluding the amount that is expected to be returned for the return of sales) expected to charge for the transfer of goods to the customers when customers obtain the controlling rights of relevant goods and recognize the liabilities at the amount expected to be returned for the return of sales; in the meantime, the balance of the expected carrying amount to transfer the returned goods less the expected costs incurred for the recovery of the goods (including the impairment of the value of the goods returned) is recognized as an asset. And the costs are carried forward at the net amount of the carrying amount upon the transfer of the goods less the above cost of assets.
For sales with quality assurance terms, if the quality assurance provides a separate service to the customer other than ensuring that the goods or services sold meet the established standards, the quality assurance constitutes a single performance obligation. Otherwise, the Group will account for the quality assurance responsibility in accordance with the "ASBE No. 13 - Contingencies".
If the contract includes significant financing component, the Group determines the transaction price based on the amount payable under the assumption that the customer pays that amount payable in cash when "control" of the goods or services is obtained by the customer. The difference between the transaction price and the contract consideration shall be amortized within the contract period using effective interest rate. If the Group expects, at contract inception, that the period between when the Group transfers a promised

SAIC MOTOR ANNUAL REPORT 2020
120 / 241
good or service to a customer and when the customer pays for that good or service will be one year or less, the Group needs not to consider the significant financing component.
The Group determines whether it is a principal or an agent at the time of the transaction based on whether it owns the "control" of the goods or services before the transfer of such goods or services to the customer. The Group is a principal if it controls the specified good or service before that good or service is transferred to a customer, and the revenue shall be recognized based on the total consideration received or receivable; otherwise, the Group is an agent, and the revenue shall be recognized based on the amount of commission or handling fee that is expected to be charged, and such amount is determined based on the net amount of the total consideration received or receivable after deducting the prices payable to other related parties or according to the established commission amount or proportion.
When the Group collects amounts of goods or services sold in advance from the customer, the Group will firstly recognize the amounts as a liability and then transfer to revenue until satisfying relevant performance obligations. When the receipts in advance is non-refundable and the customer may give up all or part of contract right, and the Group is expected to be entitled to obtain amounts associated with contract rights given up by the customer, the above amounts shall be proportionally recognized as revenue in accordance with the model of exercising contract rights by the customer; otherwise, the Group will transfer the relevant balance of the above liability to revenue only when the probability is extremely low for the customer to ask for satisfying the remaining performance obligations. (2). Differences in accounting policies for revenue recognition due to different operation models for
the same type of business □Applicable √N/A 39. Contract costs √Applicable □N/A Costs to fulfill a contract
If the costs incurred in fulfilling a contract are not within the scope of other standard other than new standards for revenue, the Group shall recognized an asset from the costs incurred to fulfill a contract only if those costs meet all of the following criteria: (1) the costs relate directly to a contract or to an anticipated contract that the Group can specifically identify; (2) the costs generate or enhance resources of the entity that will be used in satisfying performance obligations in the future; and (3) the costs are expected to be recovered. The asset mentioned above shall be amortized on a basis that is consistent with the transfer to the customer of the goods or services to which the asset relates and recognized in profit or loss for the period. 40. Government grants
√Applicable □N/A
Government grants are transfer of monetary assets and non-monetary assets from the government to the Group at no consideration. A government grant is recognized only when the Group can comply with the conditions attaching to the grant and the Group will receive the grant. If a government grant is in the form of a transfer of a monetary asset, it is measured at the amount received or receivable. If a government grant is in the form of a non-monetary asset, it is measured at fair value. If the fair value cannot be reliably determined, it is measured at a nominal amount. A government grant measured at a nominal amount is recognized immediately in profit or loss for the period.
40.1 Determination basis and accounting treatment of government grants related to assets

SAIC MOTOR ANNUAL REPORT 2020
121 / 241
The Group's government grants include land eviction grant, subsidy for fixed assets purchase and technical transformation, because the grants are the government grants received by the Group to purchase or construct long-term assets, these grants are accounted for as government grants related to assets. A government grant related to an asset is charged against carrying amount of related assets or recognized as deferred income, if it is recognized as deferred income, it will be included in profit or loss over the useful life of related asset.
40.2 Determination basis and accounting treatment of government grants related to income
The Group's government grants mainly include allowance for project development and fiscal subsidies. These government grants are accounted for as government grants related to income. For a government grant related to income, if the grant is a compensation for related expenses or losses to be incurred in subsequent periods, the grant is recognized as deferred income and recognized in profit or loss or charged against the related cost over the periods in which the related costs or losses are recognized; If the grant is a compensation for related expenses or losses already incurred, the grant is recognized immediately in profit or loss or charged against related cost for the period. A government grant related to the Group's daily activities is recognized in other income based on the nature of economic activities; a government grant not related to the Group's daily activities is recognized in non-operating income. For repayment of a government grant already recognized, if there is related deferred income, the repayment is offset against the carrying amount of the deferred income, and any excess is recognized in profit or loss for the period. If there is no related deferred income, the repayment is recognized immediately in profit or loss for the period.
Relocation compensation received for relocation in the public interests
If the Group relocates for the benefits of the public interests such as overall planning of urban and rural areas and receives relocation compensation appropriated by the government directly from its fiscal budget, it recognizes such income as special payable. The income attributable to compensation for losses of fixed assets and intangible assets, related expenses, losses from suspension of production incurred during the relocation and reconstruction period, and purchases of assets after the relocation is transferred from special payable to deferred income and is accounted for as either a government grant related to an asset or a government grant related to income based on its nature. Any surplus of relocation compensation after deducting the amount transferred to deferred income is recognized as capital reserve. 41. Deferred tax assets/ deferred tax liabilities
√Applicable □N/A The income tax expenses include current income tax and deferred income tax.
41.1 Current income tax
At the balance sheet date, current income tax liabilities (or assets) for the current and prior periods are measured at the amount expected to be paid (or recovered) according to the requirements of tax laws.
41.2 Deferred tax assets and deferred tax liabilities
For temporary differences between the carrying amounts of certain assets or liabilities and their tax base,
SAIC MOTOR ANNUAL REPORT 2020
122 / 241
or between the nil carrying amount of those items that are not recognized as assets or liabilities and their tax base that can be determined according to tax laws, deferred tax assets and liabilities are recognized using the balance sheet liability method. Deferred tax is generally recognized for all temporary differences. Deferred tax assets for deductible temporary differences are recognized to the extent that it is probable that taxable profits will be available against which the deductible temporary differences can be utilized. However, for temporary differences associated with the initial recognition of goodwill and the initial recognition of an asset or liability arising from a transaction (not a business combination) that affects neither the accounting profit nor taxable profits (or deductible losses) at the time of transaction, no deferred tax asset or liability is recognized.
For deductible losses and tax credits that can be carried forward, deferred tax assets are recognized to the extent that it is probable that future taxable profits will be available against which the deductible losses and tax credits can be utilized.
Deferred tax liabilities are recognized for taxable temporary differences associated with investments in subsidiaries and associates, and interests in joint ventures, except where the Group is able to control the timing of the reversal of the temporary difference and it is probable that the temporary difference will not reverse in the foreseeable future. Deferred tax assets arising from deductible temporary differences associated with such investments and interests are only recognized to the extent that it is probable that there will be taxable profits against which to utilize the benefits of the temporary differences and they are expected to reverse in the foreseeable future.
At the balance sheet date, deferred tax assets and liabilities are measured at the tax rates, according to tax laws, that are expected to apply in the period in which the asset is realized or the liability is settled. Current and deferred tax expenses or income are recognized in profit or loss for the period, except when they arise from transactions or events that are directly recognized in other comprehensive income or in shareholders’ equity, in which case they are recognized in other comprehensive income or in shareholders’ equity, and when they arise from business combinations, in which case they adjust the carrying amount of goodwill. At the balance sheet date, the carrying amount of deferred tax assets is reviewed and reduced if it is no longer probable that sufficient taxable profits will be available in the future to allow the benefit of deferred tax assets to be utilized. Such reduction in amount is reversed when it becomes probable that sufficient taxable profits will be available.
41.3 Offset of income tax
When the Group has a legal right to settle on a net basis and intends either to settle on a net basis or to realize the assets and settle the liabilities simultaneously, current tax assets and current tax liabilities are offset and presented on a net basis. When the Group has a legal right to settle current tax assets and liabilities on a net basis, and deferred tax assets and deferred tax liabilities relate to income taxes levied by the same taxation authority on either the same taxable entity or different taxable entities which intend either to settle current tax assets and liabilities on a net basis or to realize the assets and liabilities simultaneously, in each future period in which significant amounts of deferred tax assets or liabilities are expected to be reversed, deferred tax assets and deferred tax liabilities are offset and presented on a net basis. 42. Leases Leases are classified as finance leases whenever the terms of the lease transfer substantially all the risks and rewards of ownership to the lessee. All other leases are classified as operating leases.

SAIC MOTOR ANNUAL REPORT 2020
123 / 241
(1). Accounting treatment of operating lease √Applicable □N/A 42.1.1 The Group as lessee under operating leases Operating lease payments are recognized on a straight-line basis over the term of the relevant lease, and are either included in the cost of related asset or charged to profit or loss for the period. Initial direct costs incurred are charged to profit or loss for the period. Contingent rents are charged to profit or loss in the period in which they are actually incurred.
42.1.2 The Group as lessor under operating leases
Rental income from operating leases is recognized in profit or loss on a straight-line basis over the term of the relevant lease. Initial direct costs with more than an insignificant amount are capitalized when incurred, and are recognized in profit or loss on the same basis as rental income over the lease term. Other initial direct costs with an insignificant amount are charged to profit or loss in the period in which they are incurred. Contingent rents are charged to profit or loss in the period in which they actually arise. (2). Accounting treatment of finance lease √Applicable □N/A
42.2.1 The Group as lessee under finance leases Recognition and measurement of finance leased assets are set out in Note (V) "23.3 Identification, valuation and depreciation method for fixed assets under finance lease".
Unrecognized finance charge is recognized as current finance charge by effective interest method during the lease term. Contingent rental is recognized in profit or loss when incurred. Minimum lease payment net of unrecognized finance charge is presented as long-term liabilities and long-term liabilities due within one year.
42.2.2 The Group as lessor under finance leases
At the commencement of the lease term, the aggregate of the minimum lease receivable at the inception of the lease and the initial direct costs is recognized as a finance lease receivable, and the unguaranteed residual value is recorded at the same time. The difference between the aggregate of the minimum lease receivable, the initial direct costs and the unguaranteed residual value, and the aggregate of their present values is recognized as unearned finance income. Unearned finance income is recognized as finance income for the period using the effective interest method over the lease term. Contingent rents are credited to profit or loss in the period in which they are actually incurred. The net amount of finance lease receivables less unearned finance income is separated into long-term receivables and the portion of long-term receivables due within one year for presentation. (3). Determination and accounting method of leases under the New Lease Standards □Applicable √N/A 43. Other significant accounting policies and accounting estimates √Applicable □N/A
43.1 Hedge accounting

SAIC MOTOR ANNUAL REPORT 2020
124 / 241
43.1.1 Basis for hedge accounting and method of accounting treatment
To manage the risk exposures arising from the specific risks such as foreign currency risk, interest rate risk, etc., the Group designates certain financial instruments as hedging instruments to hedge the risks. For hedges that satisfy specified criteria, the Group adopts hedge accounting treatment. The Group's hedges include cash flow hedges. Hedges of interest rate risk arising from specified commitments are accounted for as cash flow hedges. At the inception of a hedge, the Group records the relationship between the hedging instrument and hedged item, risk management objective and strategy for undertaking various hedging transactions. At the inception and in subsequent periods, the hedge is assessed for effectiveness by the Group on an ongoing basis so as to determine whether the hedge is highly effective throughout the accounting periods for which the hedging relationship was designated.
Where any of the following scenarios is satisfied, the Group will cease to use hedge accounting:
• the hedging relationship no longer satisfies risk management objectives due to the changes of risk management objectives; • the hedging instrument has expired, been sold, terminated or exercised; • the economic relationship between the hedged item and hedging instrument no longer exists, or the impact of credit risk is becoming a dominating factor of changes in value arising from the economic relationship between the hedged item and hedging instrument. • the hedging relationship no longer satisfy other criteria of using hedge accounting.
Cash flow hedges
For gains or losses from hedging instruments, the part attributable to effective hedges is considered as cash flow hedge reserves and included in other comprehensive income; while the part attributable to ineffective hedges is included in profit or loss. The amount of cash flow hedge reserves is determined at the lower of absolute amounts of: accumulated gains or losses of the hedging instrument since the commencement of the hedge; accumulated changes of present value of expected future cash flows of the hedged item since the commencement of the hedge.
Where the hedged item is an expected transaction that results in that the Group subsequently recognizes a non-financial asset or non-financial liability, or the expected transaction of non-financial asset or non-financial liability forms a specified commitment that is applicable to fair value hedge accounting, the Group will transfer the cash flow hedge reserve previously recognized in other comprehensive income to the initially recognized amount of the asset or liability. For cash flow hedges other than those involved in above scenarios, the Group transfers the cash flow hedge reserve previously recognized in other comprehensive income to profit or loss in the period in which the profit or loss is affected by expected cash flows of the hedged item. If the cash flow hedge reserve recognized in other comprehensive income is a loss, and the loss (or part of it) is not expected to be made up for in future accounting periods, the part that is not expected to be made up for is transferred from other comprehensive income to profit or loss when the Group makes such anticipation.
When the Group ceases to use the hedge accounting for cash flow hedges, if it is still expected that the hedged future cash flows will occur, the accumulated cash flow hedge reserve is retained, and accounted for using the above method; if it is expected that the hedged future cash flows will not occur, the accumulated cash flow hedge reserve is transferred from other comprehensive income to profit or loss.
43.1.2 Methods of assessment of effectiveness of hedges
The Group continuously assesses whether the hedging relationship satisfies the requirements of hedging effectiveness on the commencement date of the hedge and in subsequent periods. Where the hedge satisfies all of the following criteria, the Group will consider that the hedging relationship satisfies the requirements of hedging effectiveness:

SAIC MOTOR ANNUAL REPORT 2020
125 / 241
• there is economic relationship between the hedged item and hedging instrument; • the impact of credit risk is not the dominating factor of changes in value arising from the economic relationship between the hedged item and hedging instrument; • the hedging ratio of hedging relationship will equal to the ratio of the number of items hedged by the Group to the actual number of hedging instruments.
43.2 Accounting treatment of assets securitization
The Group transfers part of the individual automotive mortgage loans or portfolios of finance lease receivables to structured entities, which will then issue securities to the investors (hereinafter refer to as "assets securitization transactions"). The interests of securitized financial assets are reflected in the form of preferred asset-backed securities or subordinated asset-backed securities. The subordinated asset-backed securities are not allowed to be transferred before the settlement of principal and interest of preferred asset-backed securities in full amount.
For assets securitization transaction that does not satisfy the criteria of derecognition, relevant financial assets are not derecognized and the funds raised from third party investors are accounted for as financing transactions.
For assets securitization transaction where the Group neither transferred nor retained substantially all the risks and rewards of the ownership of the financial assets, but retained control over the financial assets, the Group continue to recognize the transferred assets to the extent of its continuing involvement in the transferred assets and recognizes relevant liabilities. When the assets securitization results in derecognition of (part of) the financial assets, the Group allocates the carrying amount of the transferred assets based on the respective fair value of the derecognized financial assets and the financial assets with retained interests. The gains of losses from the securitization transaction, i.e. the difference between the consideration received and the carrying amount of the derecognized financial assets, are included in profit or loss.
In applying the accounting policies of assets securitization, the Group has taken into consideration of the extent of risks and rewards transferred to other entity, as well as the extent of the Group's control over the entity:
- when the Group has transferred substantially all the risks and rewards of the ownership of the financial assets, the Group derecognizes the financial assets; - when the Group retained substantially all the risks and rewards of the ownership of the financial assets, the Group continue to recognize the financial assets; - If the Group neither transferred nor retained substantially all the risks and rewards of the ownership of the financial assets, the Group will consider whether it has control over the financial assets. If the Group retains no control, the Group will derecognize the financial assets, and respectively recognize rights and obligations from or retained in the transfer as assets or liabilities. If the Group retains control, the Group will recognize the financial assets to the extent of continuing involvement in the financial assets and recognize relevant liabilities.
43.3 Criteria of recognition of discontinued operation and accounting treatment
Discontinued operation represents the component that satisfies any of the following criteria and can be separately distinguished, and the component has been disposed or classified as held for sale:
- the component represents an independent major business or a major operation area; - the component is a part of the plan relating to the proposed disposal of an independent major business or a separate major operation area; - the component is a subsidiary obtained especially for resale purpose.
The gains or losses from derecognition are presented separately from operating profit or loss in the income statement. The operating profit or loss and gains or losses on disposal such as impairment losses from

SAIC MOTOR ANNUAL REPORT 2020
126 / 241
discontinued operations and amount of reversal, etc. are presented as discontinued operations. The Group presents the information previously presented as profit or loss from continuing operations as discontinued operations for the comparative accounting period in the current financial statements.
43.4 Transfer of assets under repurchase agreement
43.4.1 Financial assets purchased under resale agreements
According to agreement, financial assets to be sold on a certain future date are not recognized in balance sheet. Cost paid to purchase such assets, is presented in balance sheet as financial assets purchased under resale agreements. The difference between the price to purchase and price to sell the asset is calculated by effective interest method, and recognized in interest income.
43.4.2 Financial assets sold under repurchase agreements
According to agreement, financial assets to be purchased on a future certain date are not recognized in balance sheet. Cash received from sale of such assets, is presented in balance sheet as financial assets sold under repurchase agreements. The difference between the price to purchase and price to sell the asset is calculated by effective interest method, and recognized in interest expenses.
43.5 Production safety fee Production safety fee accrued according to relevant regulations is recognized in the cost of relevant products or profit or loss for the current period and is recorded as special reserve. Accounting treatments for the use of production safety fee are distinguished whether fixed assets are formed, for those in the nature of expenses are directly charged against special reserve, for those which form part of fixed assets, the accumulated cost is recognized in fixed assets when it is ready for intended use, meanwhile special reserve is reversed at the same amount and depreciation is recognized at the same amount.
43.6 Exchange of non-monetary assets
If the exchange of non-monetary assets is of commercial substance, and the fair value of assets received or surrendered can be reliably measured, the exchange of non-monetary assets is measured at fair value. The asset received is initially measured at cost which is the sum of the fair value of assets surrendered and related tax payable; for the asset surrendered, upon derecognition, the difference between the fair value of the asset surrendered and its carrying amount is included in profit or loss. Where there is objective evidence indicating the fair value of the asset received is more reliable, the initially recognized amount of the asset received is the sum of the fair value of the asset received and related tax payable; for the asset surrendered, upon derecognition, the difference between the fair value of the asset received and the carrying amount of the asset surrendered is included in profit or loss.
For exchange of non-monetary assets not satisfying the criteria of measurement at fair value, it is measured at carrying amount. For the asset received, the initially recognized amount is the sum of the carrying amount of the asset surrendered and related tax payable; for the asset surrendered, upon derecognition, no profit or loss is recognized upon derecognition.
When the time point of recognition of asset received is different from the time point of derecognition of asset surrendered, and where the asset received satisfies the criteria of recognition while the asset surrendered does not satisfy the criteria of derecognition, the obligation to deliver the asset surrendered is recognized as a liability at the meantime of recognition of asset received; where the asset received does not satisfy the criteria of recognition while the asset surrendered satisfies the criteria of derecognition, the right to obtained the asset received is recognized as an asset at the meantime of derecognition of the asset surrendered.
SAIC MOTOR ANNUAL REPORT 2020
127 / 241
43.7 Debt restructuring
43.7.1 Recording of debt restructuring obligation as the debtor
Where a debt is restructured in the manner of settlement of debt with asset, the Group will derecognize relevant asset and settled debt upon satisfaction of criteria of derecognition. The difference between the carrying amount of the settled debt and the carrying amount of the transferred asset is included in profit or loss. Where the debt is restructured in the manner of debt-to-equity conversion, the Group will derecognize the settled debts upon satisfaction of criteria of derecognition. Upon initial recognition, the equity instrument is measured at fair value. If the fair value of the equity instrument cannot be reliably measured, it is measured at the fair value of the settled debts. The difference between the carrying amount of the settled debts and the recognized amount of the equity instrument is recognized in profit or loss. Where the debt is restructured by revising other terms, the Group will recognize and measure the restructured debt in accordance with "Accounting Standards for Business Enterprises No. 22 - Recognition and Measurement of Financial Instruments" and "Accounting Standards for Business Enterprises No. 37 - Presentation of Financial Instruments". Where the debt is restructured through settlement of debt with multiple assets or through portfolios, the Group will recognize and measure equity instrument and restructuring debts using the above methods. The difference between the carrying amount of the settled debt and the sum of carrying amount of the transferred assets and recognized amount of the restructured debt is included in profit or loss.
43.7.2 Recording debt restructuring obligation as the creditor
Where a debt is restructured in the manner of settlement of debt with asset, upon initial recognition, the assets other than the financial assets received are measured at cost. Therein, the cost of inventories includes the fair value of debt waived and other direct costs incurred to bring the assets to current location and conditions, such as tax, transportation fee, handling charges, insurance premium, etc. The cost of investments in associates or joint ventures includes the fair value of debt waived and other costs directly attributable to the asset, such as tax etc. The cost of investment properties includes the fair value of debt waived and other costs directly attributable to the asset, such as tax etc. The cost of fixed assets include the fair value of debt waived and other direct costs incurred to bring the assets to current location and conditions, such as tax, transportation fee, handling charges, installation fee, professional service fee, etc. The cost of intangible assets include the fair value of debt waived and other direct costs incurred to bring the assets to current location and conditions, such as tax, etc. The difference between the fair value of debt waived and its carrying amount is included in profit or loss.
Where the debt restructuring through debt-to-equity instrument conversion results in the Group's conversion of debts to equity investments in associates or joint ventures, the Group will measure the initial investment cost at the fair value of the debt waived and other costs directly attributable to the asset, such as tax, etc. The difference between the fair value of debt waived and its carrying amount is included in profit or loss.
Where the debt is restructured by revising other terms, the Group will recognize and measure the restructured debt in accordance with "Accounting Standards for Business Enterprises No. 22 - Recognition and Measurement of Financial Instruments".
Where the debt is restructured through settlement of debt with multiple assets or through portfolios, the Group will first recognize and measure the financial assets received and restructured debts in accordance with "Accounting Standards for Business Enterprises No. 22 - Recognition and Measurement of Financial Instruments", the allocate the fair value of debts waived net of the recognized amounts of financial assets

SAIC MOTOR ANNUAL REPORT 2020
128 / 241
received and restructured debt according to the respective fair value of the assets other than the financial assets received. And the cost of each asset is determined using aforesaid methods on such basis. The fair value of the debt waived and its carrying amount is included in profit or loss. 44. Significant changes in accounting policies and estimates
(1). Changes in significant accounting policies √Applicable □N/A Changes of accounting policies and reasons for the changes
Approval procedures Remark (name and amount of significantly affected items in
the financial statements)
Implementation of New Revenue Standards
Approved by the 11th session of the seventh board of directors, the 11th session of the seventh
board of supervisors
Details are set out below
Other descriptions The Group has started adopting the Accounting Standards for Business Enterprises No. 14-Revenue (“New Revenue Standard”) revised by the Ministry of Finance ("MoF") in 2017 since January 1, 2020 ("the date of the initial implementation"). The new revenue standard introduces a 5-step method for the measurement of revenue recognition, and adds more guidelines regarding specific transactions (or events). Please refer to Note (V) 38 for detailed accounting policies of the Group in terms of revenue recognition and measurement. In accordance with the new revenue standard, it is required to adjust the opening balance (i.e. balance as at January 1, 2020) of retained earnings and amounts of other relevant items in the financial statements during the current period of the first implementation based on accumulative amounts impacted from the first implementation of the standard, and it is allowed to adjust no information for the comparable periods. In the adoption of the new revenue standard, the Group solely adjusted the accumulative impacted amounts for contracts not completed at the date of the first implementation. For contract changes prior to the beginning of the current year of the first implementation of the new revenue standard, the Group simplified the processes. Namely, the Group identified the fulfilled and unfulfilled obligations, determined transaction prices and evenly allocated the transaction prices between the fulfilled and unfulfilled obligations pursuant to final arrangements of contract changes. (2). Changes in significant accounting estimates □Applicable √N/A (3). Adjustment on the related opening balances in the financial statements for the current year due to implementation of New Revenue Standards or New Lease Standards since 2020 √Applicable □N/A
Consolidated Balance Sheet Unit: RMB
Item December 31, 2019 January 1, 2020 Adjustments Current assets:
Cash and bank balances 127,826,836,682.25 127,826,836,682.25 Balances with clearing agencies Placements with banks and other financial institutions
Held-for-trading financial assets 49,796,599,024.47 49,796,599,024.47 Derivative financial assets Notes receivable 6,245,092,532.74 6,245,092,532.74 Accounts receivable 41,340,635,443.91 41,340,635,443.91
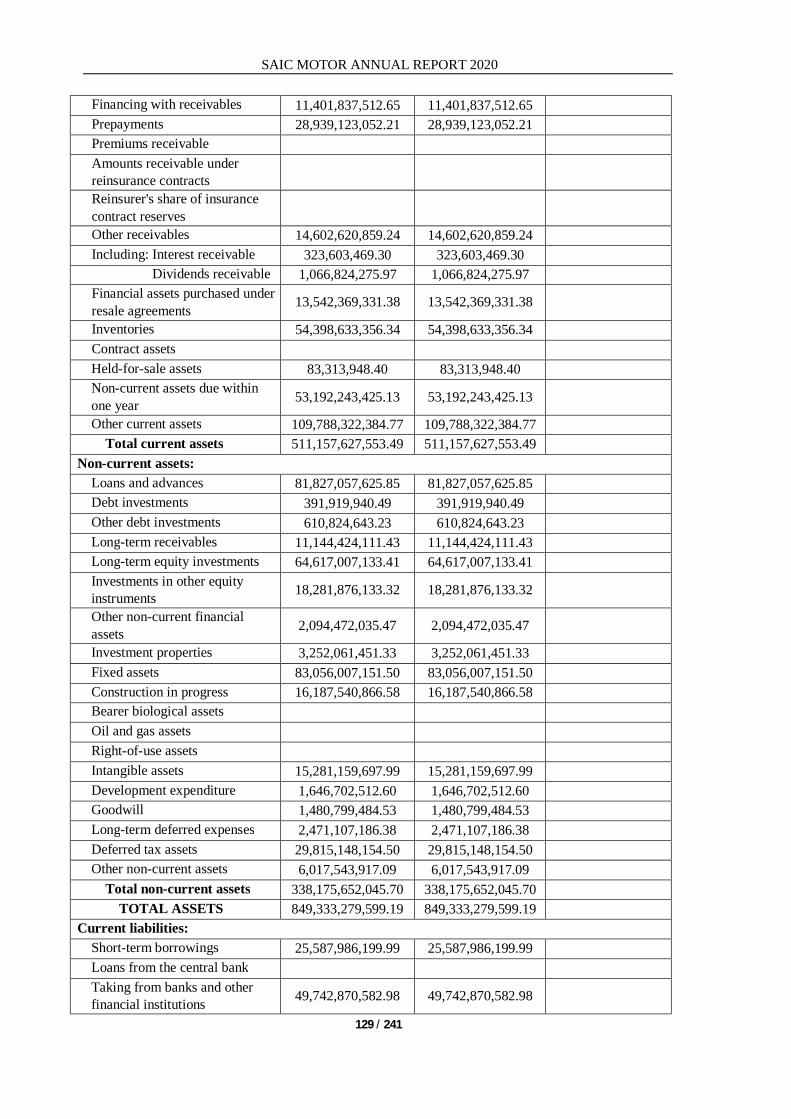
SAIC MOTOR ANNUAL REPORT 2020
129 / 241
Financing with receivables 11,401,837,512.65 11,401,837,512.65 Prepayments 28,939,123,052.21 28,939,123,052.21 Premiums receivable Amounts receivable under reinsurance contracts
Reinsurer's share of insurance contract reserves
Other receivables 14,602,620,859.24 14,602,620,859.24 Including: Interest receivable 323,603,469.30 323,603,469.30
Dividends receivable 1,066,824,275.97 1,066,824,275.97 Financial assets purchased under resale agreements 13,542,369,331.38 13,542,369,331.38
Inventories 54,398,633,356.34 54,398,633,356.34 Contract assets Held-for-sale assets 83,313,948.40 83,313,948.40 Non-current assets due within one year 53,192,243,425.13 53,192,243,425.13
Other current assets 109,788,322,384.77 109,788,322,384.77 Total current assets 511,157,627,553.49 511,157,627,553.49
Non-current assets: Loans and advances 81,827,057,625.85 81,827,057,625.85 Debt investments 391,919,940.49 391,919,940.49 Other debt investments 610,824,643.23 610,824,643.23 Long-term receivables 11,144,424,111.43 11,144,424,111.43 Long-term equity investments 64,617,007,133.41 64,617,007,133.41 Investments in other equity instruments 18,281,876,133.32 18,281,876,133.32
Other non-current financial assets 2,094,472,035.47 2,094,472,035.47
Investment properties 3,252,061,451.33 3,252,061,451.33 Fixed assets 83,056,007,151.50 83,056,007,151.50 Construction in progress 16,187,540,866.58 16,187,540,866.58 Bearer biological assets Oil and gas assets Right-of-use assets Intangible assets 15,281,159,697.99 15,281,159,697.99 Development expenditure 1,646,702,512.60 1,646,702,512.60 Goodwill 1,480,799,484.53 1,480,799,484.53 Long-term deferred expenses 2,471,107,186.38 2,471,107,186.38 Deferred tax assets 29,815,148,154.50 29,815,148,154.50 Other non-current assets 6,017,543,917.09 6,017,543,917.09
Total non-current assets 338,175,652,045.70 338,175,652,045.70 TOTAL ASSETS 849,333,279,599.19 849,333,279,599.19
Current liabilities: Short-term borrowings 25,587,986,199.99 25,587,986,199.99 Loans from the central bank Taking from banks and other financial institutions 49,742,870,582.98 49,742,870,582.98

SAIC MOTOR ANNUAL REPORT 2020
130 / 241
Held-for-trading financial liabilities 1,211,285,653.79 1,211,285,653.79
Derivative financial liabilities Notes payable 32,961,523,274.74 32,961,523,274.74 Accounts payable 137,086,140,309.74 137,086,140,309.74 Receipts in advance 11,873,058,903.09 -11,873,058,903.09 Contract liabilities 14,118,351,975.19 14,118,351,975.19 Financial assets sold under repurchase agreements 506,133,790.80 506,133,790.80
Customer deposits and deposits from banks and other financial institutions
79,251,489,643.61 79,251,489,643.61
Funds from securities trading agency
Funds from underwriting securities agency
Employee benefits payable 10,379,170,737.45 10,379,170,737.45 Taxes payable 10,094,429,795.94 10,094,429,795.94 Other payables 77,082,601,425.77 76,355,383,045.73 -727,218,380.04 Including: Interest payable 104,301,970.97 104,301,970.97
Dividends payable 764,365,300.59 764,365,300.59 Fees and commissions payable Amounts payable under reinsurance contracts
Held-for-sale liabilities Non-current liabilities due within one year 26,838,165,703.07 25,466,372,084.09 -1,371,793,618.98
Other current liabilities 188,420,686.01 145,396,088.33 -43,024,597.68 Total current liabilities 462,803,276,706.98 462,906,533,182.38 103,256,475.40
Non-current liabilities:
Insurance contract reserves Long-term borrowings 19,136,965,849.72 19,136,965,849.72 Bonds payable 16,161,761,950.51 16,161,761,950.51 Including: Preference shares
Perpetual bonds Lease liability Long-term payables 1,566,933,667.08 1,566,933,667.08 Long-term employee benefits payable 5,604,308,153.21 5,604,308,153.21
Provisions 13,997,027,058.90 13,517,066,134.79 -479,960,924.11 Deferred income 26,111,589,446.55 24,568,858,146.28 -1,542,731,300.27 Deferred tax liabilities 3,111,792,424.53 3,111,792,424.53 Other non-current liabilities 1,942,676,624.38 1,942,676,624.38
Total non-current liabilities 85,690,378,550.50 85,610,362,950.50 -80,015,600.00 TOTAL LIABILITIES 548,493,655,257.48 548,516,896,132.88 23,240,875.40
SHAREHOLDERS' EQUITY:
Paid-in capital (share capital) 11,683,461,365.00 11,683,461,365.00

SAIC MOTOR ANNUAL REPORT 2020
131 / 241
Other equity instruments Including: Preference shares
Perpetual bonds Capital reserve 55,566,657,996.87 55,566,657,996.87 Less: Treasury shares Other comprehensive income 12,504,734,839.32 12,504,734,839.32 Special reserve 620,295,956.53 620,295,956.53 Surplus reserve 40,843,171,648.51 40,843,171,648.51 General risk reserve 3,202,907,349.43 3,202,907,349.43 Retained earnings 125,280,780,539.08 125,261,974,506.19 -18,806,032.89
Total owners' equity attributable to equity holders of the Company 249,702,009,694.74 249,683,203,661.85 -18,806,032.89
Minority interests 51,137,614,646.97 51,133,179,804.46 -4,434,842.51
Total Shareholders’ equity 300,839,624,341.71 300,816,383,466.31 -23,240,875.40
Total Liabilities and shareholders' equity 849,333,279,599.19 849,333,279,599.19
Description of adjustments of items: √Applicable □N/A
Summary of Impacts of Initial Application of New Revenue Standards at January 1, 2020 (Consolidated)
Unit: RMB
Item
Carrying amount under previous
standards December 31, 2019
Impact of implementation of New Revenue Standards
Carrying amount under New Revenue
Standards January 1, 2020
Reclassification of receipts in advance
(Note 1)
Identified single performance
obligations (Note 2) Receipts in advance 11,873,058,903.09 -11,873,058,903.09 Contract liabilities 11,873,058,903.09 2,245,293,072.10 14,118,351,975.19 Other payables 77,082,601,425.77 -727,218,380.04 76,355,383,045.73 Non-current liabilities due within one year 26,838,165,703.07 -1,371,793,618.98 25,466,372,084.09
Other current liabilities 188,420,686.01 -43,024,597.68 145,396,088.33 Provisions 13,997,027,058.90 -479,960,924.11 13,517,066,134.79 Deferred income 26,111,589,446.55 -1,542,731,300.27 24,568,858,146.28 Other non-current liabilities 1,942,676,624.38 1,942,676,624.38
Retained earnings 125,280,780,539.08 -18,806,032.89 125,261,974,506.19
Minority interests 51,137,614,646.97 -4,434,842.51 51,133,179,804.46
Note 1: As at January 1, 2020, according to the New Revenue Standards, the Group's receipts in advance were the consideration received from customers and for which obligations of transferring goods or services to customers had incurred, so they were reclassified to contract liabilities. Note 2: As at January 1, 2020, the Group identified services such as maintenance, replacement of engine oil and extension of quality warranty period as compliments of vehicles sold to customers as single performance obligations respectively. For the portion of maintenance and replacement of engine oil for which considerations paid by customers are received but relevant services have not been rendered yet, revenue shall be recognized within the expected service period. The Group accordingly adjusted the considerations received from provisions amounting to RMB 479,960,924.11, other current liabilities amounting to RMB 43,024,597.68 and other payables amounting to RMB 727,218,380.04 to contract liabilities amounting to RMB 873,499,453.12 and other non-current liabilities amounting to RMB
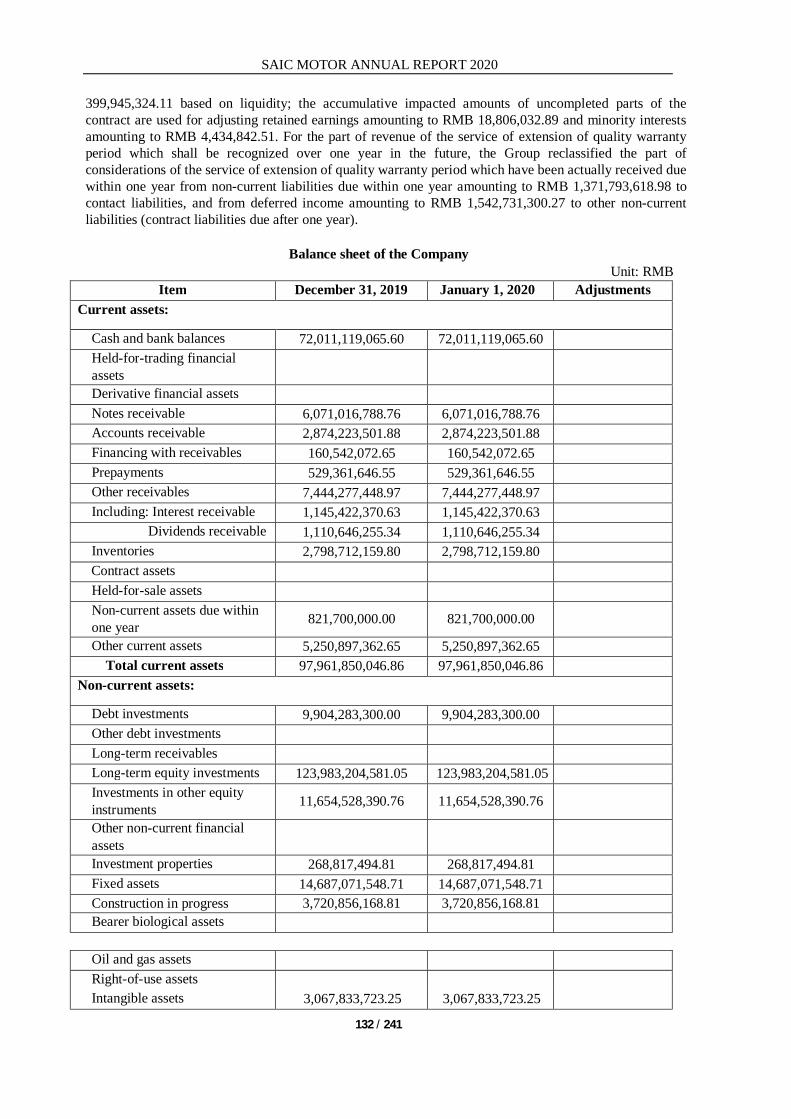
SAIC MOTOR ANNUAL REPORT 2020
132 / 241
399,945,324.11 based on liquidity; the accumulative impacted amounts of uncompleted parts of the contract are used for adjusting retained earnings amounting to RMB 18,806,032.89 and minority interests amounting to RMB 4,434,842.51. For the part of revenue of the service of extension of quality warranty period which shall be recognized over one year in the future, the Group reclassified the part of considerations of the service of extension of quality warranty period which have been actually received due within one year from non-current liabilities due within one year amounting to RMB 1,371,793,618.98 to contact liabilities, and from deferred income amounting to RMB 1,542,731,300.27 to other non-current liabilities (contract liabilities due after one year).
Balance sheet of the Company Unit: RMB
Item December 31, 2019 January 1, 2020 Adjustments Current assets:
Cash and bank balances 72,011,119,065.60 72,011,119,065.60 Held-for-trading financial assets
Derivative financial assets Notes receivable 6,071,016,788.76 6,071,016,788.76 Accounts receivable 2,874,223,501.88 2,874,223,501.88 Financing with receivables 160,542,072.65 160,542,072.65 Prepayments 529,361,646.55 529,361,646.55 Other receivables 7,444,277,448.97 7,444,277,448.97 Including: Interest receivable 1,145,422,370.63 1,145,422,370.63
Dividends receivable 1,110,646,255.34 1,110,646,255.34 Inventories 2,798,712,159.80 2,798,712,159.80 Contract assets Held-for-sale assets Non-current assets due within one year 821,700,000.00 821,700,000.00
Other current assets 5,250,897,362.65 5,250,897,362.65 Total current assets 97,961,850,046.86 97,961,850,046.86
Non-current assets:
Debt investments 9,904,283,300.00 9,904,283,300.00 Other debt investments Long-term receivables Long-term equity investments 123,983,204,581.05 123,983,204,581.05 Investments in other equity instruments 11,654,528,390.76 11,654,528,390.76
Other non-current financial assets
Investment properties 268,817,494.81 268,817,494.81 Fixed assets 14,687,071,548.71 14,687,071,548.71 Construction in progress 3,720,856,168.81 3,720,856,168.81 Bearer biological assets
Oil and gas assets Right-of-use assets Intangible assets 3,067,833,723.25 3,067,833,723.25

SAIC MOTOR ANNUAL REPORT 2020
133 / 241
Development expenditure 1,548,417,822.58 1,548,417,822.58 Goodwill Long-term deferred expenses Deferred tax assets Other non-current assets 25,633,554.50 25,633,554.50
Total non-current assets 168,860,646,584.47 168,860,646,584.47 TOTAL ASSETS 266,822,496,631.33 266,822,496,631.33
Current liabilities: Short-term borrowings 1,000,000,000.00 1,000,000,000.00 Held-for-trading financial liabilities
Derivative financial liabilities Notes payable 4,768,554,262.85 4,768,554,262.85 Accounts payable 28,222,090,695.05 28,222,090,695.05 Receipts in advance 1,493,046,298.26 -1,493,046,298.26 Contract liabilities 1,573,061,898.26 1,573,061,898.26 Employee benefits payable 1,652,215,281.49 1,652,215,281.49 Taxes payable 410,401,145.84 410,401,145.84 Other payables 1,679,751,892.69 1,679,751,892.69 Including: Interest payable 44,181,076.85 44,181,076.85
Dividends payable Held-for-sale liabilities Non-current liabilities due within one year 1,817,576,741.00 1,817,576,741.00
Other current liabilities Total current liabilities 41,043,636,317.18 41,123,651,917.18 80,015,600.00
Non-current liabilities: Long-term borrowings 4,400,000,000.00 4,400,000,000.00 Bonds payable 4,986,117,808.21 4,986,117,808.21 Including: Preference shares
Perpetual bonds Lease liability Long-term payables 702,265,794.35 702,265,794.35 Long-term employee benefits payable 3,432,505,683.16 3,432,505,683.16
Provisions 2,056,596,984.62 1,976,581,384.62 -80,015,600.00 Deferred income 3,257,536,722.60 3,257,536,722.60 Deferred tax liabilities 1,213,788,352.22 1,213,788,352.22 Other non-current liabilities
Total non-current liabilities 20,048,811,345.16 19,968,795,745.16 -80,015,600.00 TOTAL LIABILITIES 61,092,447,662.34 61,092,447,662.34
SHAREHOLDERS' EQUITY: Paid-in capital (share capital) 11,683,461,365.00 11,683,461,365.00 Other equity instruments Including: Preference shares
Perpetual bonds Capital reserve 65,129,333,550.92 65,129,333,550.92
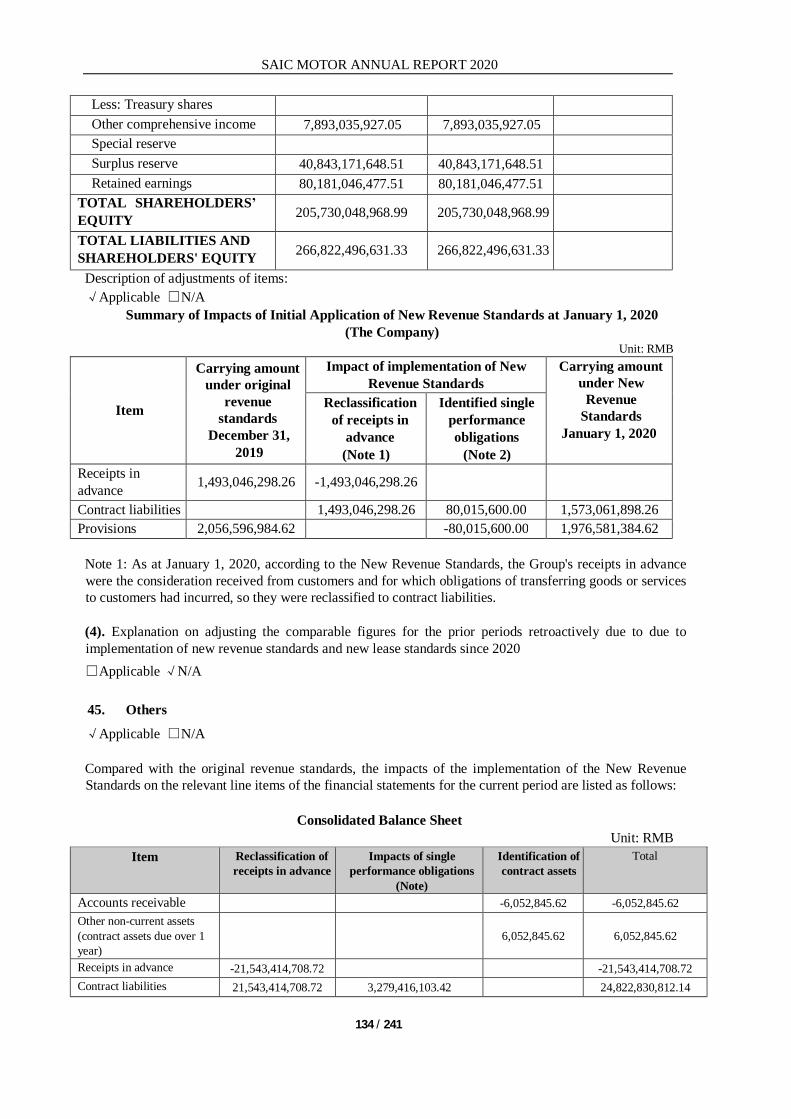
SAIC MOTOR ANNUAL REPORT 2020
134 / 241
Less: Treasury shares Other comprehensive income 7,893,035,927.05 7,893,035,927.05 Special reserve Surplus reserve 40,843,171,648.51 40,843,171,648.51 Retained earnings 80,181,046,477.51 80,181,046,477.51
TOTAL SHAREHOLDERS’ EQUITY 205,730,048,968.99 205,730,048,968.99
TOTAL LIABILITIES AND SHAREHOLDERS' EQUITY 266,822,496,631.33 266,822,496,631.33
Description of adjustments of items: √Applicable □N/A
Summary of Impacts of Initial Application of New Revenue Standards at January 1, 2020 (The Company)
Unit: RMB
Item
Carrying amount under original
revenue standards
December 31, 2019
Impact of implementation of New Revenue Standards
Carrying amount under New
Revenue Standards
January 1, 2020
Reclassification of receipts in
advance (Note 1)
Identified single performance obligations
(Note 2) Receipts in advance 1,493,046,298.26 -1,493,046,298.26
Contract liabilities 1,493,046,298.26 80,015,600.00 1,573,061,898.26 Provisions 2,056,596,984.62 -80,015,600.00 1,976,581,384.62
Note 1: As at January 1, 2020, according to the New Revenue Standards, the Group's receipts in advance were the consideration received from customers and for which obligations of transferring goods or services to customers had incurred, so they were reclassified to contract liabilities. (4). Explanation on adjusting the comparable figures for the prior periods retroactively due to due to implementation of new revenue standards and new lease standards since 2020 □Applicable √N/A 45. Others
√Applicable □N/A Compared with the original revenue standards, the impacts of the implementation of the New Revenue Standards on the relevant line items of the financial statements for the current period are listed as follows:
Consolidated Balance Sheet
Unit: RMB Item Reclassification of
receipts in advance Impacts of single
performance obligations (Note)
Identification of contract assets
Total
Accounts receivable -6,052,845.62 -6,052,845.62 Other non-current assets (contract assets due over 1 year)
6,052,845.62 6,052,845.62
Receipts in advance -21,543,414,708.72 -21,543,414,708.72 Contract liabilities 21,543,414,708.72 3,279,416,103.42 24,822,830,812.14

SAIC MOTOR ANNUAL REPORT 2020
135 / 241
Other payables -874,644,006.96 -874,644,006.96 Non-current liabilities due within one year -2,256,781,680.54 -2,256,781,680.54
Other current liabilities -38,965,559.45 -38,965,559.45 Provisions -1,017,312,736.94 -1,017,312,736.94 Deferred income -1,547,623,689.44 -1,547,623,689.44 Other non-current liabilities 2,479,879,826.38 2,479,879,826.38 Retained earnings -19,754,398.14 -19,754,398.14 Minority interests -4,213,858.33 -4,213,858.33
Balance Sheet of the Company
Unit: RMB Item Reclassification of receipts
in advance Identified single performance
obligations (Note) Identification of contract assets
Receipts in advance -3,002,943,787.91 -3,002,943,787.91 Contract liabilities 3,002,943,787.91 85,056,600.00 3,088,000,387.91 Provisions -85,056,600.00 -85,056,600.00
Consolidated Income Statement
Unit: RMB
Item Impact of single
performance obligation (Note 1)
Impact of revenue recognized on a net
basis (Note 2)
Impact of considerations due
to customers (Note 3)
Identification of contract
assets Total
Operating income -1,001,994,893.60 -4,730,040,500.17 -14,805,057,930.36 -20,537,093,324.13 Operating costs 4,059,038.23 -4,730,040,500.17 -4,725,981,461.94 Selling expenses -1,005,326,550.76 -13,780,343,587.92 -14,785,670,138.68 Financial expenses -1,024,714,342.44 -1,024,714,342.44 Credit impairment loss -307,952.55 -307,952.55
Impairment losses of assets 307,952.55 307,952.55
Income Statement of the Company
Unit: RMB
Item Impact of single
performance obligation (Note 1)
Impact of revenue recognized on a net
basis (Note 2)
Impact of considerations due to
customers (Note 3)
Identification of contract assets
Operating income -85,056,600.00 -398,796,727.79 -1,436,112,897.72 -1,919,966,225.51 Operating costs -398,796,727.79 -398,796,727.79 Selling expenses -85,056,600.00 -1,030,407,133.33 -1,115,463,733.33 Financial expenses -405,705,764.39 -405,705,764.39
Note 1: According to the New Revenue Standards, the Group identified services such as maintenance, replacement of engine oil and extension of quality warranty period as compliments of vehicles sold to customers as single performance obligations respectively. For the portion of maintenance and replacement of engine oil for which considerations paid by customers are received but relevant services have not been rendered yet, revenue shall be recognized within the expected service period. The expenditure on the aforementioned services of the Group are separately included in the selling expenses and operating costs under the original revenue standards according to the nature of business of the enterprise. Under the New Revenue Standards, this part of revenue from the service is recognized as a single performance obligation upon rendering of the service.

SAIC MOTOR ANNUAL REPORT 2020
136 / 241
Note 2: The Group is not acting as the principal in some transactions, so revenue is recognized on a net basis under the New Revenue Standard.
Note 3: According to the New Revenue Standards, interest discounts granted to distributors and personal credit formerly included in expenses are substantially the considerations due to customers, transaction prices are written down by considerations payable as a deduction of revenue. VI. TAXES 1. Major categories of taxes and tax rates
Information of major categories of taxes and tax rates √Applicable □N/A
Category of taxes Basis of tax computation Tax rate
Value-added tax
Sales of goods, rending of processing and repair and replacement services, and lease of tangible movable property Transportation services Modern services (excluding lease of immovable properties and tangible movable properties) (including research and technical services, and logistics support services, etc.) Lease of immovable properties Financial services
13%
9%
6%
9%, 5%
6% Consumption tax Revenue from sales of automobiles by vehicle manufacturers 1% - 25% Enterprise income tax
Enterprise's taxable income 15%, 25%
Note: The value-added tax (“VAT”) is the balance of output VAT less deductible input VAT. Before April 1, 2019, output VAT of sale of goods, transportation services and lease of immovable properties, etc. is calculated at 16% or 10% of sales volume calculated based on relevant taxation rules and regulations. Pursuant to the Announcement of the Ministry of Finance, the State Taxation Administration and the General Administration of Customs on Relevant Policies for Deepening the Value-Added Tax Reform (Announcement of the Ministry of Finance, the State Taxation Administration and the General Administration of Customs [2019] No. 39), since 1 April 2019, the tax rate of taxable sales is decreased from 16% to 13%, and from 10% to 9%. Disclosure about entities being levied at different enterprise income tax rates: √Applicable □N/A
Name of taxpayer Income tax rate (%) SAIC Maxus Vehicle Co., Ltd. (“SAIC Maxus”) 25 SAIC Capital Company Limited. (“SAIC Capital”) 25 SAIC General Motors Sales Co., Ltd. (“GM Sales”) 25 Shanghai Shanghong Real Estate Co., Ltd. (“Shanghong Real Estate”) 25 SAIC Investment Management Co., Ltd. (“Investment Management”) 25 SAIC Group Financial Holding Management Co., Ltd. ("SAIC Financial Holding”) 25
SAIC Insurance Sales Co., Ltd. ("SAIC Insurance") 25 SAIC Volkswagen Sales Co., Ltd. 25 China United Automotive System Co., Ltd. 25 SAIC Finance Co., Ltd. (“SFC”) 25 Shanghai Pengpu Machine Building Plant Co., Ltd. 25

SAIC MOTOR ANNUAL REPORT 2020
137 / 241
HUAYU Automotive Systems Co., Ltd. (“HASCO”) 25 Anji Automotive Logistics Co., Ltd. (“Anji Logistics”) 25 Shanghai Automotive Industry Sales Co., Ltd. (“Industry Sales”) 25 Shanghai Shangyuan Investment Management Co., Ltd. (“Shangyuan Investment”) 25
China Automotive Industrial Development Co., Ltd. 25 SAIC Motor (Beijing) Co., Ltd. 25 Shanghai Automobile Asset Management Co., Ltd. (“Asset Management”) 25
Donghua Automotive Industrial Co., Ltd. (“Donghua”) 25 SAIC Activity Centre Co., Ltd. 25 Nanjing Automobile (Group) Corporation (“Nanjing Automobile Group”) 25
Shanghai Sunwin Bus Co., Ltd. (“Shanghai Sunwin”) 25 SAIC-GMAC Automotive Finance Co., Ltd. (“SAIC-GMAC”) 25 Shanghai E-propulsion Auto Technology Co., Ltd. 25 Wuhan Zhonghaiting Data Technology Co., Ltd. 25 Global Car Sharing and Rental Co., Ltd. ("Global Car Sharing") 25 SAIC International Trade Co., Ltd. 25 2. Tax incentives √Applicable □N/A (1) According to Enterprise Income Tax Law of the People’s Republic of China (hereinafter referred to
as “EIT Law”) and other related regulations, the Company is recognized as a High-Technology Enterprise which is qualified to get the State’s special support from 2008, enjoying a preferential tax rate of 15% of enterprise income tax. The Company passed the review/reassessment of High-Technology Enterprise in 2011, 2014, 2017 and 2020, and obtained the certificate of High-Technology Enterprise. Therefore, the applicable income tax rate for the Company is 15% for the current year and last year.
(2) On 27 July 2011, the Ministry of Finance, the State Administration of Taxation and the General Administration of Customs jointly issued the Circular on Tax Policy Issues concerning Further Implementing the Western China Development Strategy (Cai Shui [2011] No. 58) (hereinafter referred to as "Cai Shui No. 58 Circular"), the applicable enterprise income tax rate of enterprises among encouraged industries established in western development zone for the years from 2011 to 2020 is reduced to 15%. SAIC GM Wuling Co., Ltd. (hereinafter referred to as "GM Wuling") registered in Liuzhou City, Guangxi Zhuang Autonomous Region, which is located in the China Western Development Region and established a branch in Chongqing ("Chongqing Branch"). National Development and Reform Commission ("NDRC") issued the Catalogue of Encouraged Industries in the Western Region to include automotive vehicles and special vehicles manufacturing in catalogue of encouraged industries of Guangxi Zhuang Autonomous Region and Chongqing Municipality, the enterprise income tax is applicable to the preferential tax rate of 15%. Therefore, enterprise income tax of the headquarters of GM Wuling located in Liuzhou City, Guangxi and Chongqing Branch is levied at a preferential income tax rate of 15%. On 23 April 2020, the Ministry of Finance, the State Administration of Taxation and the National Development and Reform Commission jointly released Announcement on Enterprises Income Tax Policy Concerning Continuation of the Western China Development (Cai Shui [2020] No. 23 Announcement), the applicable enterprise income tax rate of enterprises among encouraged industries established in western development zone from 1 January 2021 to 31 December 2030 is reduced to 15%. The management considers that the Company's principal business is among the encouraged industries in the western development zone, therefore, enterprise income tax of the headquarters of GM Wuling

SAIC MOTOR ANNUAL REPORT 2020
138 / 241
located in Liuzhou City, Guangxi and Chongqing Branch is still levied at the preferential income tax rate of 15% from January 1, 2021 to December 31, 2030.
(3) SAIC-IVECO Hongyan Commercial Vehicle Co., Ltd. (hereinafter referred to as "SAIC-IVECO Hongyan") is established in the western zone. According to Cai Shui No. 58 Circular, principal business of SAIC-IVECO Hongyan is included in the scope of "Automotive vehicles, special vehicles and parts manufacturing" in the Catalogue of Encouraged Industries in the Western Region, therefore the enterprise income tax of SAIC-IVECO Hongyan is levied at a reduced income tax rate of 15%. In addition, according to Cai Shui [2020] No. 23 Announcement, SAIC-IVECO Hongyan is still levied at a reduced income tax rate of 15% and recognizes deferred tax assets at the tax rate of 15% as at December 31, 2020.
(4) According to the EIT Law and other related regulations, SAIC Motor Transmission Co., Ltd. (“SAIC Transmission”), Shanghai Diesel Engine Co., Ltd. (“Shanghai Diesel”), and DIAS Automotive Electronic Systems Co., Ltd. (“DIAS Electronic”) are recognized as a High-Technology Enterprises which is qualified to get the State’s special support, in which SAIC Transmission, Shanghai Diesel and DIAS Electronic passed the reassessment of High-Technology Enterprise or were certified as high-tech enterprises in 2020. Therefore, these companies are subject to the EIT rate of 15% in the current year.
(5) In the current year, the EIT rate applicable to the overseas subsidiaries is subject to the local tax requirements.
3. Others □Applicable √N/A VII. NOTES TO ITEMS IN THE CONSOLIDATED FINANCIAL STATEMENTS 1. Cash and bank balances √Applicable □N/A
Unit: RMB Item December 31, 2020 December 31, 2019
Cash on hand 2,551,918.51 3,524,842.95 RMB 2,187,754.36 2,956,636.47 Other currencies 364,164.15 568,206.48 Bank balances 123,409,652,316.00 109,298,022,130.97 RMB 108,176,159,700.21 96,442,837,153.29 USD 6,576,840,889.35 8,011,320,753.78 EUR 2,481,986,121.51 867,073,643.25 AUD 1,057,171,738.18 245,910,766.93 THB 1,005,688,128.12 1,076,993,197.38 HKD 788,659,238.18 279,180,821.86 GBP 744,005,546.62 603,753,593.86 INR 647,510,433.26 374,516,950.04 AED 525,890,088.17 522,322,152.74 NOK 338,179,160.78 IDR 301,539,017.99 189,409,556.06 CLP 162,845,258.34 182,056,909.89 HUF 159,496,637.00 49,980,166.00 MYR 151,332,252.80 109,645,732.39 Other currencies 292,348,105.49 343,020,733.50 Other monetary funds 19,152,766,125.07 18,525,289,708.33

SAIC MOTOR ANNUAL REPORT 2020
139 / 241
RMB 18,817,064,407.22 18,296,134,031.76 Other currencies 335,701,717.85 229,155,676.57 Total 142,564,970,359.58 127,826,836,682.25
Including: Cash and bank balances deposited abroad
14,121,774,230.55 10,201,043,942.59
Other explanations Details of restricted cash and bank balances are as follows:
Unit: RMB Item December 31, 2020 December 31, 2019
Bank balances - Pledged for bank acceptances 1,933,447,750.31 415,129,790.46 - Pledged for borrowings 20,000,000.00 - - Others 11,813,388.86 11,963,207.78 Other monetary funds - Restricted deposits at the central bank (Note) 10,169,415,737.88 10,370,435,816.20
- Deposits for bank draft 6,396,647,733.91 7,058,257,083.47 - Pledged for letters of credit 165,571,634.72 134,556,197.59 - Others 20,791,673.34 13,756,640.06 Total 18,717,687,919.02 18,004,098,735.56
Note: It represents the general deposit reserve deposited at the central bank by SFC and SAIC-GMAC as required. SFC and SAIC-GMAC contribute restricted deposits at the central bank in accordance with its regulations, and the above-mentioned deposits should not be used for daily operations. 2. Held-for-trading financial assets √Applicable □N/A Unit: RMB
Item December 31, 2020 December 31, 2019 Financial assets at fair value through profit or loss 54,800,863,245.58 49,796,599,024.47
Including:
Bond investment 6,405,936,090.79 5,723,081,459.55 Investments such as stock and fund 39,476,437,930.70 34,769,424,836.85
Bank acceptances 8,878,189,495.78 9,284,033,134.38 Derivative instruments 40,299,728.31 20,059,593.69
Financial assets designated as at fair value through profit or loss
Total 54,800,863,245.58 49,796,599,024.47 Other explanations: □Applicable √N/A 3. Derivative financial assets □Applicable √N/A 4. Notes receivable

SAIC MOTOR ANNUAL REPORT 2020
140 / 241
(1). Presentation of notes receivable by categories √Applicable □N/A
Unit: RMB Item December 31, 2020 December 31, 2019
Bank acceptances 2,643,336,778.33 4,607,251,687.60 Commercial acceptances 842,801,620.79 1,637,840,845.14
Total 3,486,138,399.12 6,245,092,532.74 (2). The Company’s pledged notes receivable at the end of the period √Applicable □N/A
Unit: RMB Item December 31, 2020
Pledged for bank acceptance payable 386,878,804.00 Total 386,878,804.00
(3). Notes receivable endorsed or discounted by the Company to other parties which are not yet due at the balance sheet date □Applicable √N/A (4). Notes receivable reclassified to accounts receivable due to the drawer's inability to settle the notes on maturity □Applicable √N/A (5). Disclosure by categories under bad debt provision methods √Applicable □N/A
Unit: RMB
Category
December 31, 2020 December 31, 2019
Book balance Bad debt provision Carrying amount
Book balance Bad debt provision Carrying amount Amount (%) Amount (%) Amount (%) Amount (%)
Bad debt provision on a portfolio basis
3,486,742,999.30 100.00 604,600.18 0.02 3,486,138,399.12 6,255,400,196.93 100.00 10,307,664.19 0.16 6,245,092,532.74
Total 3,486,742,999.30 100.00 604,600.18 0.02 3,486,138,399.12 6,255,400,196.93 100.00 10,307,664.19 0.16 6,245,092,532.74
Bad debt provision on an individual basis: □Applicable √N/A
Bad debt provision on a portfolio basis: √Applicable □N/A
Unit: RMB
Item December 31, 2020
Notes receivable Bad debt provision (%) Bank acceptances 2,643,336,778.33 Commercial acceptances 843,406,220.97 604,600.18 0.07
Total 3,486,742,999.30 604,600.18 0.02
Recognition standards of bad debt provision on a portfolio basis and the explanations thereon
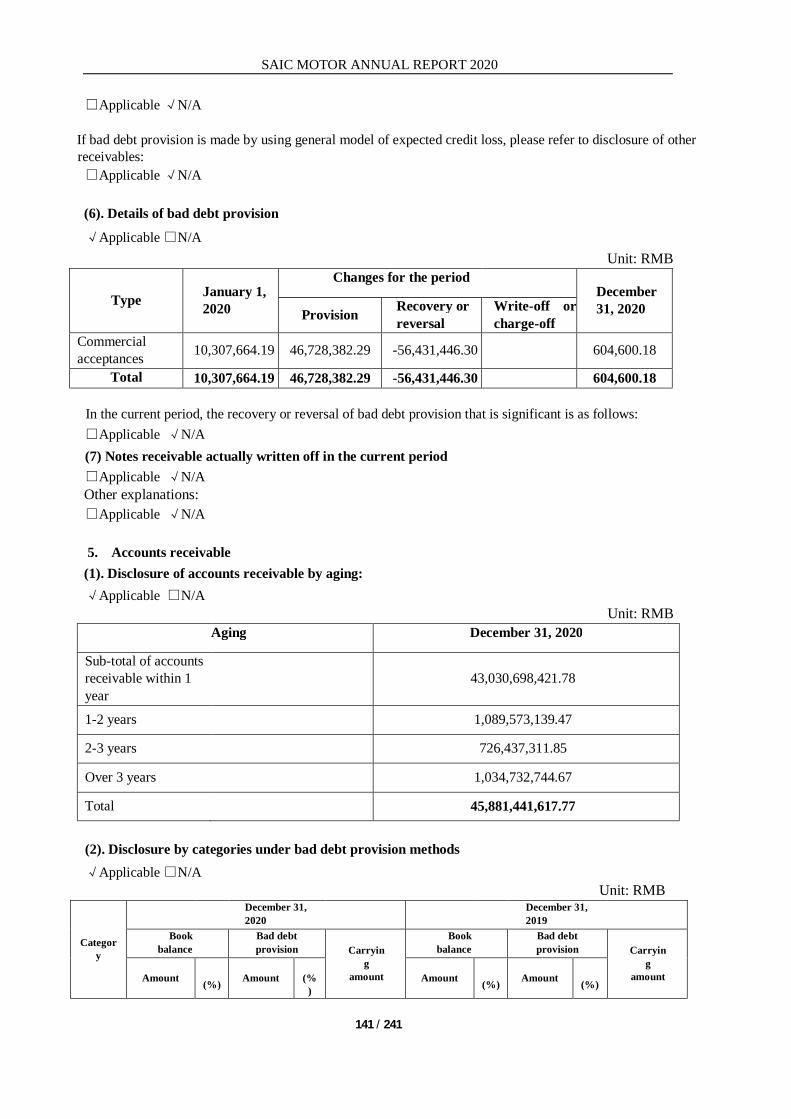
SAIC MOTOR ANNUAL REPORT 2020
141 / 241
□Applicable √N/A
If bad debt provision is made by using general model of expected credit loss, please refer to disclosure of other receivables: □Applicable √N/A (6). Details of bad debt provision √Applicable □N/A
Unit: RMB
Type January 1, 2020
Changes for the period December 31, 2020 Provision Recovery or
reversal Write-off or charge-off
Commercial acceptances 10,307,664.19 46,728,382.29 -56,431,446.30 604,600.18
Total 10,307,664.19 46,728,382.29 -56,431,446.30 604,600.18 In the current period, the recovery or reversal of bad debt provision that is significant is as follows: □Applicable √N/A (7) Notes receivable actually written off in the current period □Applicable √N/A Other explanations: □Applicable √N/A 5. Accounts receivable (1). Disclosure of accounts receivable by aging: √Applicable □N/A
Unit: RMB Aging December 31, 2020
Sub-total of accounts receivable within 1 year
43,030,698,421.78
1-2 years 1,089,573,139.47
2-3 years 726,437,311.85
Over 3 years 1,034,732,744.67
Total 45,881,441,617.77 (2). Disclosure by categories under bad debt provision methods √Applicable □N/A
Unit: RMB
Category
December 31, 2020
December 31, 2019
Book balance
Bad debt provision Carryin
g amount
Book balance
Bad debt provision Carryin
g amount Amount
(%) Amount
(%)
Amount (%) Amount
(%)
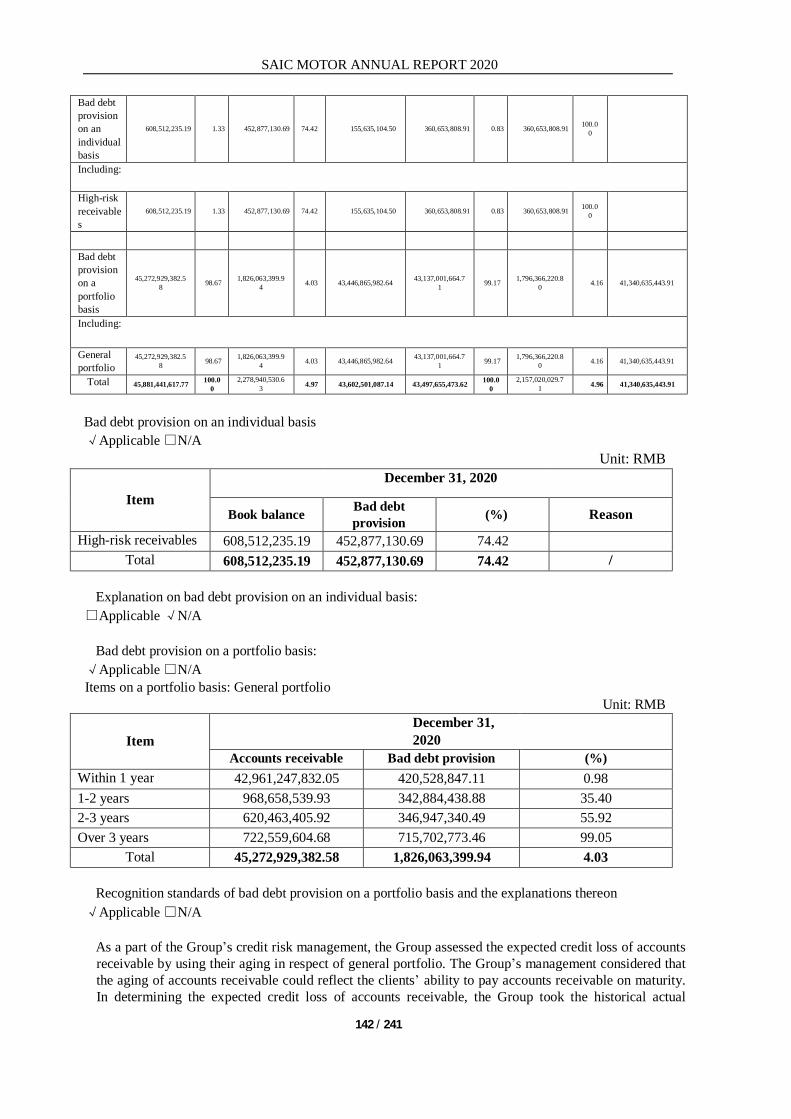
SAIC MOTOR ANNUAL REPORT 2020
142 / 241
Bad debt provision on an individual basis
608,512,235.19 1.33 452,877,130.69 74.42 155,635,104.50 360,653,808.91 0.83 360,653,808.91 100.00
Including:
High-risk receivables
608,512,235.19 1.33 452,877,130.69 74.42 155,635,104.50 360,653,808.91 0.83 360,653,808.91 100.00
Bad debt provision on a portfolio basis
45,272,929,382.58 98.67 1,826,063,399.9
4 4.03 43,446,865,982.64 43,137,001,664.71 99.17 1,796,366,220.8
0 4.16 41,340,635,443.91
Including:
General portfolio
45,272,929,382.58 98.67 1,826,063,399.9
4 4.03 43,446,865,982.64 43,137,001,664.71 99.17 1,796,366,220.8
0 4.16 41,340,635,443.91 Total 45,881,441,617.77 100.0
0 2,278,940,530.63 4.97 43,602,501,087.14 43,497,655,473.62 100.0
0 2,157,020,029.71 4.96 41,340,635,443.91
Bad debt provision on an individual basis √Applicable □N/A
Unit: RMB
Item December 31, 2020
Book balance Bad debt provision (%) Reason
High-risk receivables 608,512,235.19 452,877,130.69 74.42 Total 608,512,235.19 452,877,130.69 74.42 /
Explanation on bad debt provision on an individual basis: □Applicable √N/A
Bad debt provision on a portfolio basis: √Applicable □N/A Items on a portfolio basis: General portfolio
Unit: RMB
Item December 31, 2020
Accounts receivable Bad debt provision (%) Within 1 year 42,961,247,832.05 420,528,847.11 0.98 1-2 years 968,658,539.93 342,884,438.88 35.40 2-3 years 620,463,405.92 346,947,340.49 55.92 Over 3 years 722,559,604.68 715,702,773.46 99.05
Total 45,272,929,382.58 1,826,063,399.94 4.03
Recognition standards of bad debt provision on a portfolio basis and the explanations thereon √Applicable □N/A
As a part of the Group’s credit risk management, the Group assessed the expected credit loss of accounts receivable by using their aging in respect of general portfolio. The Group’s management considered that the aging of accounts receivable could reflect the clients’ ability to pay accounts receivable on maturity. In determining the expected credit loss of accounts receivable, the Group took the historical actual

SAIC MOTOR ANNUAL REPORT 2020
143 / 241
impairment condition, the present situation and the forecast of future economic condition into considerations to determine the corresponding expected credit risk and calculate the expected credit loss. If bad debt provision is made by using general model of expected credit loss, please refer to disclosure of other receivables: □Applicable √N/A (3). Details of bad debt provision √Applicable □N/A
Unit: RMB
Type December 31, 2019 Changes for the period
December 31, 2020 Provision Recovery or
reversal Write-off or charge-off
Others
Credit loss provision 2,157,020,029.71 429,982,827.01 -264,643,832.59 -66,855,090.86 23,436,597.36 2,278,940,530.63
Total 2,157,020,029.71 429,982,827.01 -264,643,832.59 -66,855,090.86 23,436,597.36 2,278,940,530.63 Recovery or reversal of bad debt provision that is significant: □Applicable √N/A (4). Accounts receivable actually written off in the current period □Applicable √N/A (5). Top five accounts receivable categorized by debtors √Applicable □N/A
Name Relationship
with the Group
Amount Aging Proportion to total accounts receivable (%)
Company 1 Joint venture 4,669,766,320.78 Within 1 year 10.18 Company 2 Joint venture 3,708,725,032.13 Within 1 year 8.08 Company 3 Joint venture 1,097,322,946.11 Within 1 year 2.39 Company 4 Third party 1,041,626,974.21 Within 3 years 2.27 Company 5 Associate 946,383,903.95 Within 1 year 2.06 Total 11,463,825,177.18 24.98 (6). Accounts receivable derecognized due to transfer of financial assets □Applicable √N/A (7). Assets and liabilities arising from transfer of accounts receivable and continuous involvement □Applicable √N/A
Other explanations: √Applicable □N/A At the year-end, accounts receivable carrying an amount of RMB 311,869,229.92 were pledged to banks as the collateral for loans. 6. Financing with receivables

SAIC MOTOR ANNUAL REPORT 2020
144 / 241
√Applicable □N/A Unit: RMB
Item December 31, 2020 December 31, 2019 Notes receivable - Bank acceptances 13,168,746,883.14 11,401,837,512.65
Total 13,168,746,883.14 11,401,837,512.65 Movements of accounting receivable financing and the changes in fair value: □Applicable √N/A If bad debt provision is made by using general model of expected credit loss, please refer to disclosure of other receivables: □Applicable √N/A Other explanations: □Applicable √N/A 7. Prepayments (1). Aging analysis of prepayments is as follows: √Applicable □N/A
Unit: RMB
Aging December 31, 2020 December 31, 2019
Amount Proportion (%)
Amount Proportion (%)
Within 1 year 38,755,392,619.32 99.12 28,507,620,415.28 98.51
1-2 years 241,907,730.08 0.62 292,984,652.62 1.01
2-3 years 60,087,291.69 0.15 82,855,748.52 0.29
Over 3 years 44,408,854.82 0.11 55,662,235.79 0.19
Total 39,101,796,495.91 100.00 28,939,123,052.21 100.00 (2). Top five prepayments categorized by receivers √Applicable □N/A Unit: RMB
Name Relationship with the Group
December 31, 2020 Aging Proportion to total
prepayments (%)
Company 1 Joint venture 25,248,287,817.50 Within 1 year 64.57
Company 2 Joint venture 6,322,568,759.80 Within 1 year 16.17
Company 3 Third party 827,304,541.30 Within 1 year 2.12
Company 4 Third party 417,934,723.66 Within 1 year 1.07
Company 5 Third party 392,400,000.00 Within 1 year 1.00
Total 33,208,495,842.26 84.93

SAIC MOTOR ANNUAL REPORT 2020
145 / 241
Other explanations √Applicable □N/A At the end of the year, the balance of bad debts provision for prepayments amounted to RMB 4,482,166.13, RMB 4,193,311.13 was accrued this year, and RMB 270,000.00 was written off this year. 8. Other receivables
Presentation by items √Applicable □N/A
Unit: RMB Item December 31, 2020 December 31, 2019
Interest receivable 272,429,503.45 323,603,469.30 Dividends receivable 1,082,662,112.79 1,066,824,275.97 Other receivables 9,836,710,151.29 13,212,193,113.97 Total 11,191,801,767.53 14,602,620,859.24 Other explanations: Interest receivable (1). Classification of interest receivable √Applicable □N/A
Unit: RMB Item December 31, 2020 December 31, 2019
Time deposits 272,429,503.45 296,198,444.47 Entrusted loans 22,460,180.18 Deposits at banks and other financial institutions 4,944,844.65
Total 272,429,503.45 323,603,469.30 (2). Significant overdue interest □Applicable √N/A (3). Details of bad debt provision accrued □Applicable √N/A Other explanations: □Applicable √N/A Dividends receivable (4). Dividends receivable √Applicable □N/A
Unit: RMB Item (or investee) December 31, 2020 December 31, 2019
Dividends receivable due from joint ventures 936,581,149.71 824,196,255.34
Dividends receivable due from associates 108,476,163.57 194,840,471.09
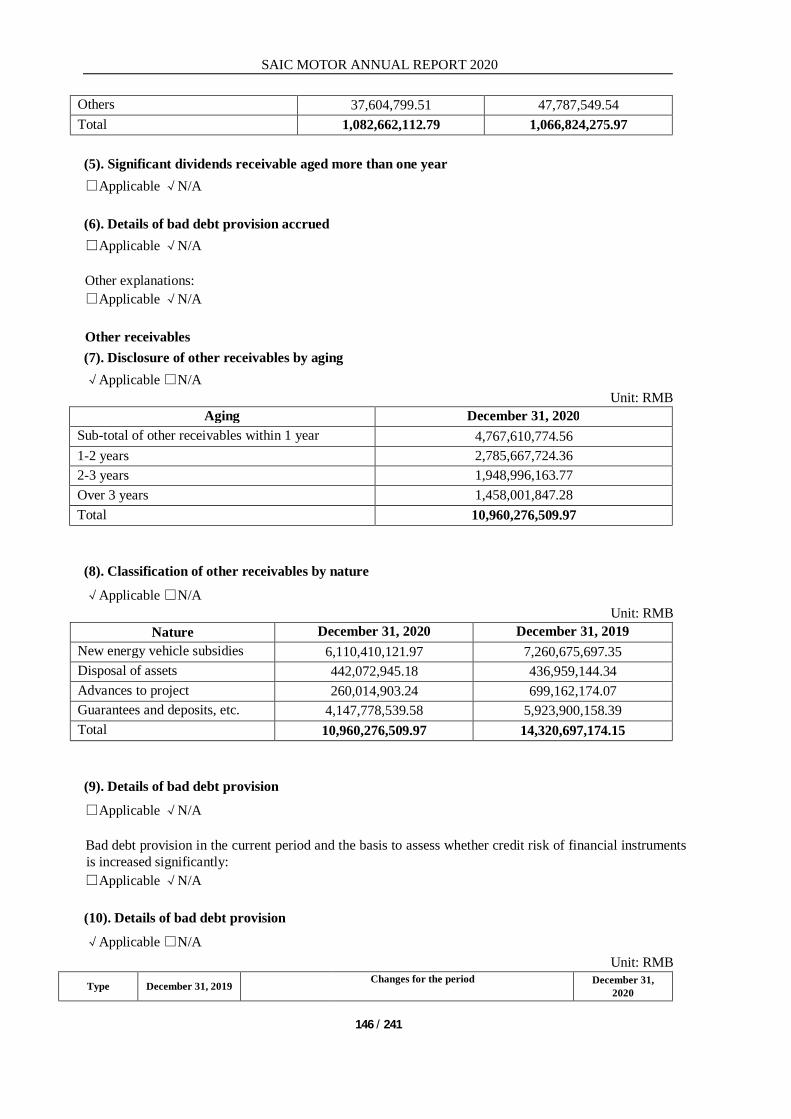
SAIC MOTOR ANNUAL REPORT 2020
146 / 241
Others 37,604,799.51 47,787,549.54 Total 1,082,662,112.79 1,066,824,275.97
(5). Significant dividends receivable aged more than one year □Applicable √N/A (6). Details of bad debt provision accrued □Applicable √N/A Other explanations: □Applicable √N/A Other receivables (7). Disclosure of other receivables by aging √Applicable □N/A
Unit: RMB Aging December 31, 2020
Sub-total of other receivables within 1 year 4,767,610,774.56 1-2 years 2,785,667,724.36 2-3 years 1,948,996,163.77 Over 3 years 1,458,001,847.28 Total 10,960,276,509.97 (8). Classification of other receivables by nature √Applicable □N/A
Unit: RMB Nature December 31, 2020 December 31, 2019
New energy vehicle subsidies 6,110,410,121.97 7,260,675,697.35 Disposal of assets 442,072,945.18 436,959,144.34 Advances to project 260,014,903.24 699,162,174.07 Guarantees and deposits, etc. 4,147,778,539.58 5,923,900,158.39 Total 10,960,276,509.97 14,320,697,174.15 (9). Details of bad debt provision
□Applicable √N/A Bad debt provision in the current period and the basis to assess whether credit risk of financial instruments is increased significantly: □Applicable √N/A (10). Details of bad debt provision √Applicable □N/A
Unit: RMB Type December 31, 2019 Changes for the period December 31,
2020

SAIC MOTOR ANNUAL REPORT 2020
147 / 241
Provision Recovery or reversal
Write-off or charge-off Others
Other receivables 1,108,504,060.18 116,160,344.62 -97,904,517.99 -3,467,716.27 274,188.14 1,123,566,358.68
Total 1,108,504,060.18 116,160,344.62 -97,904,517.99 -3,467,716.27 274,188.14 1,123,566,358.68 In the current period, the recovery or reversal of bad debt provision that is significant is as follows: □Applicable √N/A (11). Other receivables actually written off in the current period □Applicable √N/A (12). Top five other receivables categorized by debtors √Applicable □N/A
Unit: RMB
Name December 31, 2020 Aging Proportion to total other
receivables (%) Company 1 4,612,458,294.33 Within 1 to 5 years 42.08 Company 2 1,497,951,827.64 Within 1 to 4 years 13.67 Company 3 938,306,601.00 Within 1 year 8.56 Company 4 436,959,144.34 Within 6 years 3.99 Company 5 129,625,863.22 Within 1 year 1.18
Total 7,615,301,730.53 / 69.48
(13). Other receivables related to government grants □Applicable √N/A
(14). Other receivables derecognized due to transfer of financial assets □Applicable √N/A
(15). Assets and liabilities arising from transfer of other receivables and continuous involvement □Applicable √N/A Other explanations: □Applicable √N/A
9. Financial assets purchased under resale agreements Unit: RMB
Item December 31, 2020 December 31, 2019 Financial assets purchased under resale agreements 9,279,407,143.96 13,542,369,331.38
10. Inventories (1). Categories of inventories √Applicable □N/A
Unit: RMB Item December 31,
2020 December 31, 2019

SAIC MOTOR ANNUAL REPORT 2020
148 / 241
Book balance
Provision for decline in value of inventories /
impairment provision for costs to fulfill the contract
Carrying amount Book balance
Provision for decline in value of inventories /
impairment provision for costs to fulfill the contract
Carrying amount
Raw materials 8,577,789,632.99 1,302,803,643.63 7,274,985,989.36 9,346,371,569.98 877,488,313.77 8,468,883,256.21 Work-in- process 10,686,397,269.69 66,031,174.37 10,620,366,095.32 2,055,293,202.23 88,757,571.06 1,966,535,631.17 Goods on hand 53,179,564,717.29 1,749,908,887.54 51,429,655,829.75 45,782,796,518.77 1,819,582,049.81 43,963,214,468.96 Costs to fulfill the contract 70,458,120.89 70,458,120.89
Total 72,514,209,740.86 3,118,743,705.54 69,395,466,035.32 57,184,461,290.98 2,785,827,934.64 54,398,633,356.34
(2). Provision for decline in value of inventories and impairment provision for costs to fulfill the contract √Applicable □N/A
Unit: RMB
Item December 31, 2019
Increase during the period Decrease during the period 31 December
2020
Provision Others Reversal or write-off Others
Raw materials 877,488,313.77 707,669,366.32 229,232.76 272,777,851.03 9,805,418.19 1,302,803,643.63 Work-in- process 88,757,571.06 43,540,583.17 48,609.87 63,655,914.73 2,659,675.00 66,031,174.37 Goods on hand 1,819,582,049.81 1,457,487,314.69 2,344,937.84 1,528,768,927.40 736,487.40 1,749,908,887.54
Total 2,785,827,934.64 2,208,697,264.18 2,622,780.47 1,865,202,693.16 13,201,580.59 3,118,743,705.54 Details of provision for decline in value of inventories Item Basis of provision for decline
in value of inventories Reason for reversal of provision for decline in value of inventories
Raw materials Lower of cost or net realizable value Value rebound
Work-in-process Lower of cost or net realizable value Value rebound
Finished goods or goods on hand Lower of cost or net realizable value Value rebound
(3). Explanations on capitalized amount included in the closing balance of inventories □Applicable √N/A (4). Description of current amortization of costs to fulfill the contract □Applicable √N/A Other explanations □Applicable √N/A 11. Contract assets (1). Details of contract assets
□Applicable √N/A
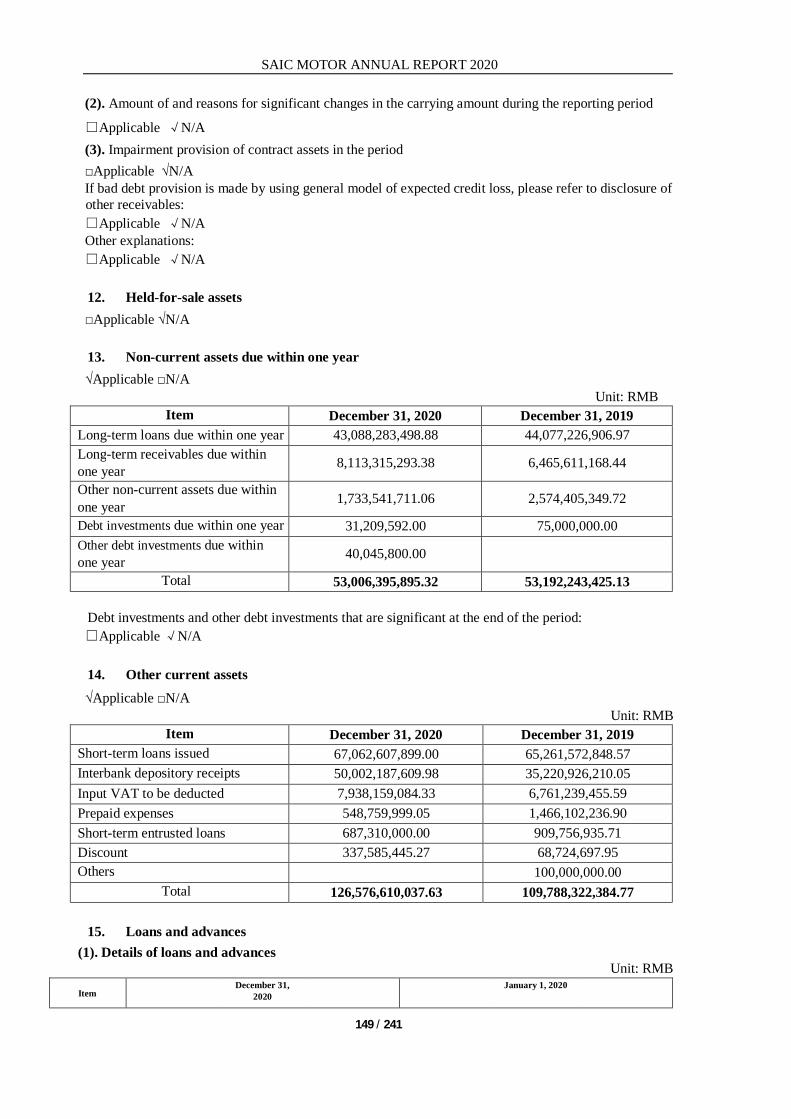
SAIC MOTOR ANNUAL REPORT 2020
149 / 241
(2). Amount of and reasons for significant changes in the carrying amount during the reporting period
□Applicable √N/A (3). Impairment provision of contract assets in the period □Applicable √N/A If bad debt provision is made by using general model of expected credit loss, please refer to disclosure of other receivables: □Applicable √N/A Other explanations: □Applicable √N/A 12. Held-for-sale assets □Applicable √N/A 13. Non-current assets due within one year √Applicable □N/A
Unit: RMB Item December 31, 2020 December 31, 2019
Long-term loans due within one year 43,088,283,498.88 44,077,226,906.97 Long-term receivables due within one year 8,113,315,293.38 6,465,611,168.44
Other non-current assets due within one year 1,733,541,711.06 2,574,405,349.72
Debt investments due within one year 31,209,592.00 75,000,000.00 Other debt investments due within one year 40,045,800.00
Total 53,006,395,895.32 53,192,243,425.13
Debt investments and other debt investments that are significant at the end of the period: □Applicable √N/A 14. Other current assets √Applicable □N/A
Unit: RMB Item December 31, 2020 December 31, 2019
Short-term loans issued 67,062,607,899.00 65,261,572,848.57 Interbank depository receipts 50,002,187,609.98 35,220,926,210.05 Input VAT to be deducted 7,938,159,084.33 6,761,239,455.59 Prepaid expenses 548,759,999.05 1,466,102,236.90 Short-term entrusted loans 687,310,000.00 909,756,935.71 Discount 337,585,445.27 68,724,697.95 Others 100,000,000.00
Total 126,576,610,037.63 109,788,322,384.77 15. Loans and advances
(1). Details of loans and advances Unit: RMB
Item December 31, 2020 January 1, 2020

SAIC MOTOR ANNUAL REPORT 2020
150 / 241
Book balance Credit impairment provision
Carrying amount Book balance Credit impairment provision
Carrying amount
Long-term loans issued 145,066,895,453.20 5,036,193,213.07 140,030,702,240.13 130,539,051,957.18 4,634,767,424.36 125,904,284,532.82 Less: Long-term loans due within one year
44,551,395,036.28 1,463,111,537.40 43,088,283,498.88 45,461,598,919.31 1,384,372,012.34 44,077,226,906.97
Long-term loans due after one year
100,515,500,416.92 3,573,081,675.67 96,942,418,741.25 85,077,453,037.87 3,250,395,412.02 81,827,057,625.85
(2). Credit risks of loans are set forth as below:
Unit: RMB December 31, 2020
Stage 1 Stage 2 Stage 3
Total 12-month expected credit loss
Lifetime expected credit loss (not credit-
impaired)
Lifetime expected credit loss (credit-
impaired) Total principal of loans and advances 204,152,792,930.15 9,341,174,933.05 742,223,898.84 214,236,191,762.04 Less: Impairment loss on loans 5,606,201,193.11 900,853,628.41 635,826,801.39 7,142,881,622.91 Loans and advances - net
198,546,591,737.04 8,440,321,304.64 106,397,097.45 207,093,310,139.13
(3). Changes in loss provision of loans and advances are as follows:
Unit: RMB
Item
2020
Stage 1 Stage 2 Stage 3
Total 12-month expected credit loss
Lifetime expected credit loss (not
credit-impaired)
Lifetime expected credit loss (credit-
impaired) Balance at January 1, 2020 5,140,276,381.52 997,483,339.16 572,991,349.42 6,710,751,070.10 Changes for the year
- Transfer to Stage 2 -19,792,595.72 19,792,595.72 - Transfer to Stage 3 -385,750.08 -24,178,674.31 24,564,424.39 - Transfer back to Stage 2 606,103.22 -606,103.22 - Transfer back to Stage 1 49,344,556.06 -33,754,039.04 -15,590,517.02 Net change for the year 436,758,601.33 -59,095,696.34 523,084,562.89 900,747,467.88 Recovered and written-off loans for the year 95,341,634.89 95,341,634.89
Write-off and charge-off for the year -563,958,549.96 -563,958,549.96
Balance at December 31, 2020 5,606,201,193.11 900,853,628.41 635,826,801.39 7,142,881,622.91
-Loss provision of long-term loans 5,036,193,213.07
- Loss provision of short-term loans 2,106,688,409.84
16. Debt investments (1). Details of debt investments √Applicable □N/A

SAIC MOTOR ANNUAL REPORT 2020
151 / 241
Unit: RMB
Item December 31,
2020 December 31, 2019
Book balance Impairment provision
Carrying amount Book balance Impairment
provision Carrying amount Entrusted loans 439,209,592.00 439,209,592.00 467,649,154.00 729,213.51 466,919,940.49 Less: Debt investments due within one year
-31,209,592.00 -31,209,592.00 -75,000,000.00 -75,000,000.00
Total 408,000,000.00 408,000,000.00 392,649,154.00 729,213.51 391,919,940.49 In the current year, provision for credit loss of entrusted loans is reversed, amounting to RMB 729,213.51.
(2). Debt investments that are significant at the end of the period □Applicable √N/A
(3). Details of provision for impairment □Applicable √N/A Impairment provision in the current period and the basis to assess whether credit risk of financial instruments is increased significantly: □Applicable √N/A Other explanations □Applicable √N/A
17. Other debt investments (1). Details of other debt investments √Applicable □N/A
Unit: RMB
Item December 31, 2019 December 31, 2020 Loss provision accumulatively
recognized in other comprehensive income
Interbank depository receipts and bonds 610,824,643.23 4,680,305,477.07 107,154.15 Less: Other debt investments due within one year 40,045,800.00 Other debt investments due after one year 610,824,643.23 4,640,259,677.07
In the current year, provision for credit loss of other debt investments is made, amounting to RMB 107,154.15, which had been included in other comprehensive income. As at December 31, 2020, the credit risk of this type of investments is not increased significantly since the initial recognition.
(2). Other debt investments that are significant at the end of the period □Applicable √N/A
(3). Details of provision for impairment □Applicable √N/A Impairment provision in the current period and the basis to assess whether credit risk of financial instruments is increased significantly: □Applicable √N/A Other explanations: □Applicable √N/A

SAIC MOTOR ANNUAL REPORT 2020
152 / 241
18. Long-term receivables (1). Long-term receivables √Applicable □N/A
Unit: RMB
Item December 31, 2020 December 31, 2019 Range
of discount
rate Book balance Bad debt provision Carrying amount Book balance Bad debt provision Carrying amount Finance lease receivables 17,015,935,154.09 412,293,948.29 16,603,641,205.80 17,152,337,466.76 384,849,464.12 16,767,488,002.64
Including: Unrealized financing income
1,758,251,213.54 1,758,251,213.54 1,437,075,691.72 1,437,075,691.72
Sale of goods settled by installments
1,318,658,561.72 7,134,909.00 1,311,523,652.72 832,650,535.00 4,312,413.25 828,338,121.75
Rendering of services settled by installments
Others 9,805,914.24 9,805,914.24 14,209,155.48 14,209,155.48 Long-term receivables due -8,284,945,506.92 -171,630,213.54 -8,113,315,293.38 -6,524,250,746.76 -58,639,578.32 -6,465,611,168.44
Total 10,059,454,123.13 247,798,643.75 9,811,655,479.38 11,474,946,410.48 330,522,299.05 11,144,424,111.43 /
(2). Details of bad debt provision □Applicable √N/A
Bad debt provision in the current period and the basis to assess whether credit risk of financial instruments is increased significantly □Applicable √N/A
(3). Long-term receivable derecognized due to transfer of financial assets □Applicable √N/A
(4). Assets and liabilities arising from transfer of long-term receivables and continuous involvement □Applicable √N/A Other explanations √Applicable □N/A Changes in provision for credit loss
Unit: RMB Finance lease
receivables Sale of goods settled by installments Total
Balance at December 31, 2019 384,849,464.12 4,312,413.25 389,161,877.37
Net change 169,239,610.40 3,451,476.00 172,691,086.40 Write-off and charge-off -184,484,296.50 -628,980.25 -185,113,276.75 Recovery of write-off in prior years 42,689,170.27 42,689,170.27
Balance at December 31, 2020 412,293,948.29 7,134,909.00 419,428,857.29

SAIC MOTOR ANNUAL REPORT 2020
153 / 241
19. Long-term equity investments √Applicable □N/A
Unit: RMB
Investee January,1,2020
Increase (decrease) during the period Decembe
r 31, 2020
Impairment provision as at December
31, 2020 Others
I. Joint ventures
SAIC Volkswagen Automotive Co., Ltd. 18,630,589,997.03 -2,255,278,621.72 16,375,311,375.31
Pan Asia Technical Automotive Center Co., Ltd. 407,498,849.78 16,310,408.01 423,809,257.79
SAIC Iveco Commercial Vehicle Investment Co., Ltd. 562,473,513.40 219,343,487.04 781,817,000.44
Shanghai Advanced Traction Battery Systems Co., Ltd. (Note 1) 48,046,593.40 -16,482,906.67 31,563,686.73
SAIC General Motors Co., Ltd. 13,380,890,895.44 -3,362,614,019.12 10,018,276,876.32 SAIC GM Dong Yue Motors Co., Ltd. 579,971,930.72 2,395,594.17 582,367,524.89 Shanghai GM Dong Yue Powertrain Co., Ltd. 1,539,579,031.28 10,468,610.18 1,550,047,641.46
Shanghai GM (Shenyang) Norsom Motors Co., Ltd. 706,319,773.00 -38,167,959.39 668,151,813.61
ZF Transmissions Shanghai Co., Ltd. (Note 1) 169,202,872.64 58,234,159.41 227,437,032.05
Shanghai SAIC Magneti Marelli Powertrain Co., Ltd 157,283,604.61 2,271,494.44 159,555,099.05
United Automotive Electronic Systems Co., Ltd. (Note 1) 5,983,693,896.77 -134,194,318.65 5,849,499,578.12
Nanjing Iveco Automobile Co., Ltd. 1,023,927,029.23 -490,428,068.33 533,498,960.90 Shanghai MHI Engine Co., Ltd. 65,133,691.04 16,529,259.90 81,662,950.94 Tianjin Zhongxing Auto Parts Co., Ltd. 30,031,798.33 839,820.84 30,871,619.17 Shanghai Kede Auto Parts Co., Ltd. (formerly known as: Shanghai Inteva Automotive Parts Co., Ltd.)
89,051,854.25 -6,903,108.60 82,148,745.65
Bosch Huayu Steering Systems Co., Ltd. (Note 1) 1,978,219,019.53 173,888,499.92 2,152,107,519.45
Shanghai Saiwei Investment Center (Limited Partnership) (Note 10) 305,896,805.41 1,711,426,842.25 2,017,323,647.66
Kolbenschmidt Shanghai Piston Co., Ltd. 325,515,489.41 -1,773,913.02 323,741,576.39
Shanghai Valeo Automotive Electrical Systems Co., Ltd. 370,797,866.19 -84,694,978.66 286,102,887.53
Kolbenschmidt Pierburg Shanghai Nonferrous Components Co., Ltd. 871,282,470.54 20,938,156.43 892,220,626.97
Shanghai GKN HUAYU Driveline Systems Co., Ltd (Note 1) 1,554,941,009.56 -11,898,973.02 1,543,042,036.54
Dongfeng Yanfeng Automotive Trim Systems Co., Ltd. 551,968,717.00 34,500,377.00 586,469,094.00
Shanghai Mahle Thermal Systems Co., Ltd. 474,302,482.75 5,386,578.29 479,689,061.04
Yan Feng Gabriel (Shanghai) Automotive Safety Systems Co., Ltd. (Note 1)
626,719,944.00 -527,285,109.00 99,434,835.00
Yanfeng Plastic Omnium Automotive Exterior Trimming System Co., Ltd. (Note 1)
798,814,035.00 -17,160,660.00 781,653,375.00
Hua Dong Teksid Automotive Foundry Co., Ltd. 226,917,218.96 750,259.27 227,667,478.23
Pierburg Huayu Pump Technology Co. Ltd. 125,488,314.67 20,446,969.85 145,935,284.52
Founding of Yanfeng Visteon Investment Co., Ltd. 603,959,020.02 37,720,259.00 641,679,279.02

SAIC MOTOR ANNUAL REPORT 2020
154 / 241
Kaibo Seating Mechanical Components Co., Ltd. (formerly known as: Yanfeng Adient Seating Mechanical Components Co., Ltd.) (Note 3)
894,257,684.00 -894,257,684.00
KS HUAYU AluTech GmbH 197,490,718.44 -33,655,293.43 163,835,425.01 CRH Automotive Systems (Shenyang) Co., Ltd. 41,950,317.00 -41,950,317.00
Huayu Continental Brake Systems (Chongqing) Co., Ltd. 3,533,549.96 331,564.37 3,865,114.33
Hubei Hangpeng Chemical Power Technology Co., Ltd. (Note 1) 147,292,806.70 7,134,301.09 154,427,107.79
Shanghai Anji Nyk Logistics Co., Ltd. (Note 1 and 8) 76,632,421.31 -76,632,421.31 -
Shanghai Anjie Car Transportation Co., Ltd. 71,834,816.84 375,810.05 72,210,626.89
Dalian Hai Jia Automobile Harbor Co., Ltd. 193,145,804.05 -3,277,374.14 189,868,429.91
Nanjing Harbor Jiangsheng Vehicle Dock Co., Ltd. 55,142,705.90 808,535.62 55,951,241.52
Shanghai Anfu Logistics Co., Ltd. (Note1) 83,228,079.35 -11,360,241.93 71,867,837.42
Shanghai Anji Xunda Automobile Transportation Co., Ltd. (Note 1) 55,631,671.73 -8,604,363.12 47,027,308.61
Tianjin Port Haijia Automotive Terminal Co., Ltd. (Note 1) 188,590,484.74 -3,256,317.12 185,334,167.62
Hangzhou Chang'an Minsheng Anji Logistics Co., Ltd. 12,845,452.49 -518,300.91 12,327,151.58
Anji Intelligent Instrumentation Technology Co., Ltd. (Note 5) 4,907,389.00 25,838,682.43 30,746,071.43
Shanghai Dingshang Logistics Co., Ltd. (Note 1) 3,942,709.76 1,208,108.74 5,150,818.50
Nanjing Jiazhong Logistics Co., Ltd. (Note 1) 8,868,277.13 -2,986,801.37 5,881,475.76
Beijing Boruiyechuan Car Service Co., Ltd. 48,055,591.01 -21,073,935.51 26,981,655.50
Shanghai Onstar Telematics Co., Ltd. 116,869,711.76 10,479,978.13 127,349,689.89 Nanjing Automotive Forging Co., Ltd. 288,711,012.90 40,473,469.60 329,184,482.50 Shenyang Jinbei-Yanfeng Automotive Interior System Co., Ltd. 405,524,251.00 87,350,934.00 492,875,185.00
SAIC Infineon Automotive Power Semiconductor (Shanghai) Co., Ltd. (Note 1,5 and 8)
Others 196,756,559.80 -1,933,452.36 194,823,107.44 Sub-total 55,283,729,738.83 -5,540,936,978.35 49,742,792,760.48 II. Associates Shanghai Volkswagen Powertrain Co., Ltd. 1,560,754,452.65 -56,905,606.09 1,503,848,846.56
Volkswagen Transmission (Shanghai) Co., Ltd. 202,087,908.45 -57,355,460.47 144,732,447.98
China Automobile Development United Investment Co., Ltd. 82,298,398.56 25,652,474.46 107,950,873.02
Shanghai Huizhong Sachs Shock absorber Co., Ltd 155,313,760.19 46,988,926.05 202,302,686.24
Shanghai ThyssenKrupp Presta HuiZhong Co., Ltd. 183,404,866.32 3,069,427.83 186,474,294.15 Shanghai Benteler Huizhong Automotive Parts Co., Ltd. 167,707,669.93 -12,948,655.14 154,759,014.79
Shanghai Sanli-Huizhong Auto Parts Co., Ltd. 170,379,215.17 11,504,914.33 181,884,129.50
Shanghai Mhi Turbocharger Co., Ltd. 281,726,089.45 -1,638,991.17 280,087,098.28 Shanghai Edscha Machinery Co., Ltd. 89,045,195.10 -17,109,253.25 71,935,941.85 Shanghai Tenneco Exhaust System Co., Ltd. 210,219,024.31 85,876,972.41 296,095,996.72
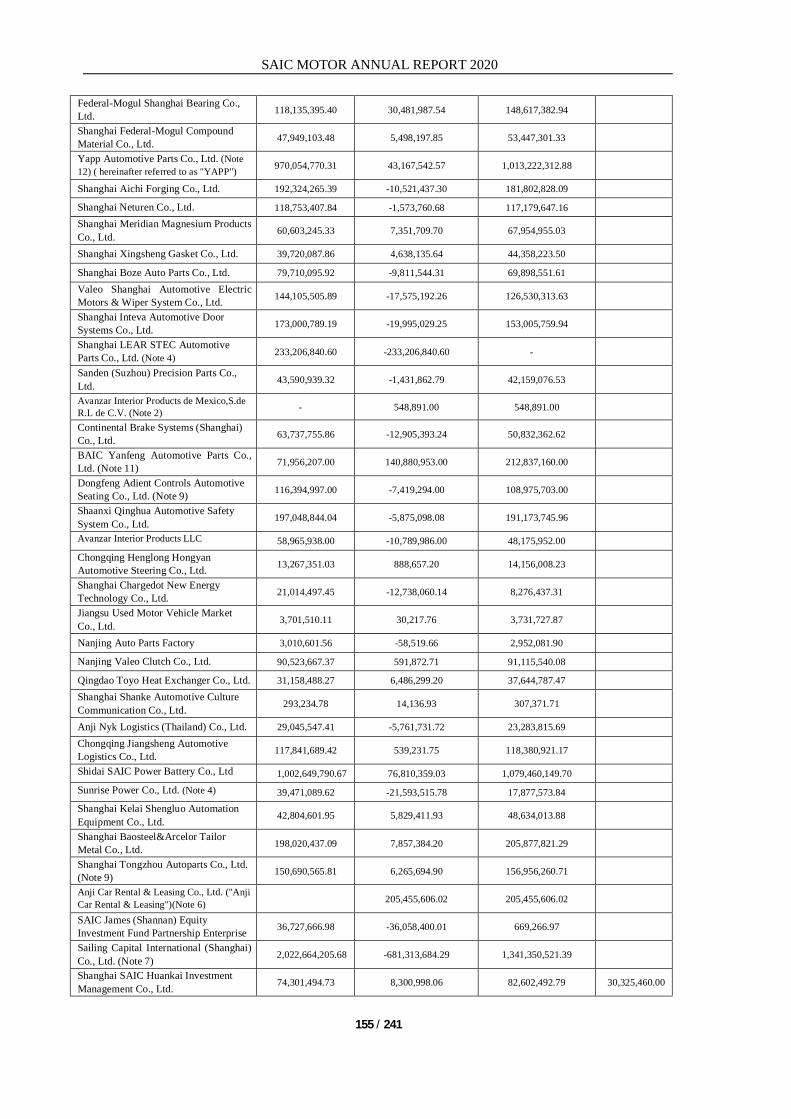
SAIC MOTOR ANNUAL REPORT 2020
155 / 241
Federal-Mogul Shanghai Bearing Co., Ltd. 118,135,395.40 30,481,987.54 148,617,382.94
Shanghai Federal-Mogul Compound Material Co., Ltd. 47,949,103.48 5,498,197.85 53,447,301.33
Yapp Automotive Parts Co., Ltd. (Note 12) ( hereinafter referred to as "YAPP") 970,054,770.31 43,167,542.57 1,013,222,312.88 Shanghai Aichi Forging Co., Ltd. 192,324,265.39 -10,521,437.30 181,802,828.09 Shanghai Neturen Co., Ltd. 118,753,407.84 -1,573,760.68 117,179,647.16 Shanghai Meridian Magnesium Products Co., Ltd. 60,603,245.33 7,351,709.70 67,954,955.03
Shanghai Xingsheng Gasket Co., Ltd. 39,720,087.86 4,638,135.64 44,358,223.50 Shanghai Boze Auto Parts Co., Ltd. 79,710,095.92 -9,811,544.31 69,898,551.61 Valeo Shanghai Automotive Electric Motors & Wiper System Co., Ltd. 144,105,505.89 -17,575,192.26 126,530,313.63
Shanghai Inteva Automotive Door Systems Co., Ltd. 173,000,789.19 -19,995,029.25 153,005,759.94
Shanghai LEAR STEC Automotive Parts Co., Ltd. (Note 4) 233,206,840.60 -233,206,840.60 - Sanden (Suzhou) Precision Parts Co., Ltd. 43,590,939.32 -1,431,862.79 42,159,076.53
Avanzar Interior Products de Mexico,S.de R.L de C.V. (Note 2) - 548,891.00 548,891.00 Continental Brake Systems (Shanghai) Co., Ltd. 63,737,755.86 -12,905,393.24 50,832,362.62
BAIC Yanfeng Automotive Parts Co., Ltd. (Note 11) 71,956,207.00 140,880,953.00 212,837,160.00
Dongfeng Adient Controls Automotive Seating Co., Ltd. (Note 9) 116,394,997.00 -7,419,294.00 108,975,703.00
Shaanxi Qinghua Automotive Safety System Co., Ltd. 197,048,844.04 -5,875,098.08 191,173,745.96
Avanzar Interior Products LLC 58,965,938.00 -10,789,986.00 48,175,952.00 Chongqing Henglong Hongyan Automotive Steering Co., Ltd. 13,267,351.03 888,657.20 14,156,008.23 Shanghai Chargedot New Energy Technology Co., Ltd. 21,014,497.45 -12,738,060.14 8,276,437.31 Jiangsu Used Motor Vehicle Market Co., Ltd. 3,701,510.11 30,217.76 3,731,727.87 Nanjing Auto Parts Factory 3,010,601.56 -58,519.66 2,952,081.90 Nanjing Valeo Clutch Co., Ltd. 90,523,667.37 591,872.71 91,115,540.08 Qingdao Toyo Heat Exchanger Co., Ltd. 31,158,488.27 6,486,299.20 37,644,787.47 Shanghai Shanke Automotive Culture Communication Co., Ltd. 293,234.78 14,136.93 307,371.71 Anji Nyk Logistics (Thailand) Co., Ltd. 29,045,547.41 -5,761,731.72 23,283,815.69 Chongqing Jiangsheng Automotive Logistics Co., Ltd. 117,841,689.42 539,231.75 118,380,921.17 Shidai SAIC Power Battery Co., Ltd 1,002,649,790.67 76,810,359.03 1,079,460,149.70 Sunrise Power Co., Ltd. (Note 4) 39,471,089.62 -21,593,515.78 17,877,573.84 Shanghai Kelai Shengluo Automation Equipment Co., Ltd. 42,804,601.95 5,829,411.93 48,634,013.88 Shanghai Baosteel&Arcelor Tailor Metal Co., Ltd. 198,020,437.09 7,857,384.20 205,877,821.29 Shanghai Tongzhou Autoparts Co., Ltd. (Note 9) 150,690,565.81 6,265,694.90 156,956,260.71 Anji Car Rental & Leasing Co., Ltd. ("Anji Car Rental & Leasing")(Note 6) 205,455,606.02 205,455,606.02 SAIC James (Shannan) Equity Investment Fund Partnership Enterprise 36,727,666.98 -36,058,400.01 669,266.97 Sailing Capital International (Shanghai) Co., Ltd. (Note 7) 2,022,664,205.68 -681,313,684.29 1,341,350,521.39 Shanghai SAIC Huankai Investment Management Co., Ltd. 74,301,494.73 8,300,998.06 82,602,492.79 30,325,460.00

SAIC MOTOR ANNUAL REPORT 2020
156 / 241
Shanghai SAIC Equity Investment Fund First Section Partnership Enterprise 58,608,699.64 -58,413,699.35 195,000.29 Shanghai SAIC Zhongyuan Equity Investment Partnership (L.P.) (Note 6 and 9)
- 587,724,795.73 587,724,795.73
Sailing Capital Management Co., Ltd. 76,110,475.67 1,304,648.58 77,415,124.25 Shanghai Integrated Circuit Industry Investment Fund Management Co., Ltd. 14,825,600.44 4,616,794.94 19,442,395.38 Qingdao SAIC Xinsheng Equity Investment Partnership (L.P.) (Note 2) - 270,049,707.27 270,049,707.27 Shanghai Xinpeng Lianzhong Auto Parts Co., Ltd. 293,666,529.14 -6,680,219.72 286,986,309.42 Changzhou SAIKC Mobility Investment Partnership (Limited Partnership) (Note 5 and 9)
48,959,802.64 30,812,935.21 79,772,737.85
Jiaxing Xinsheng Investment Partnership (Limited Partnership) 448,083,067.55 -129,416,335.78 318,666,731.77 Chongqing Guoyuan Ro-Ro Terminal Co., Ltd. 83,106,965.73 -1,804,221.12 81,302,744.61 Ningde Jiaocheng SAIC Industry Upgrade Equity Investment Partnership (L.P.) (Note 5)
75,625,129.58 105,716,164.59 181,341,294.17
Shanghai Yangtze River Delta Industry Upgrade Equity Investment Partnership (L.P.)
496,020,202.54 -179,304.41 495,840,898.13
Others (Note 5 and 7) 1,041,093,818.40 152,581,437.56 1,193,675,255.96 34,937,232.30 Sub-total 12,345,481,499.82 446,455,389.34 12,791,936,889.16 65,262,692.30
Total 67,629,211,238.65 -5,094,481,589.01 62,534,729,649.64 65,262,692.30
Unit: RMB December 31, 2020 January 1, 2020 Investments in joint ventures 49,742,792,760.48 55,283,729,738.83 Investments in associates 12,791,936,889.16 12,345,481,499.82 Write-off by cross-shareholding -2,819,650,546.77 -2,980,781,154.21 Total 59,715,079,102.87 64,648,430,084.44 Less: Impairment provisions of long-term equity investment 65,262,692.30 31,422,951.03 Net long-term equity investments 59,649,816,410.57 64,617,007,133.41 Other explanations Note 1:Pursuant to the Articles of Association, these companies are joint ventures of the Group as their significant financial and operating decisions should achieve unanimous consent of investors. Note 2:These companies are new investments of the Group for the year. Note 3:Refer to Note (VIII) 1 (1). Note 4:The Group disposed of all or part of the equity in these companies during the yearm and received disposal price of RMB 930,272,895.35, and recognized gains from disposal of investments of RMB 723,783,454.16. Refer to Note (VII) 70 for details. Note 5:In the current year, the shareholders of these companies contributed additional capital by cash to these companies at the original shareholding ratio, of which the Group increased its total capital by RMB 391,139,474.00. Note 6:Refer to Note (VIII) 4.
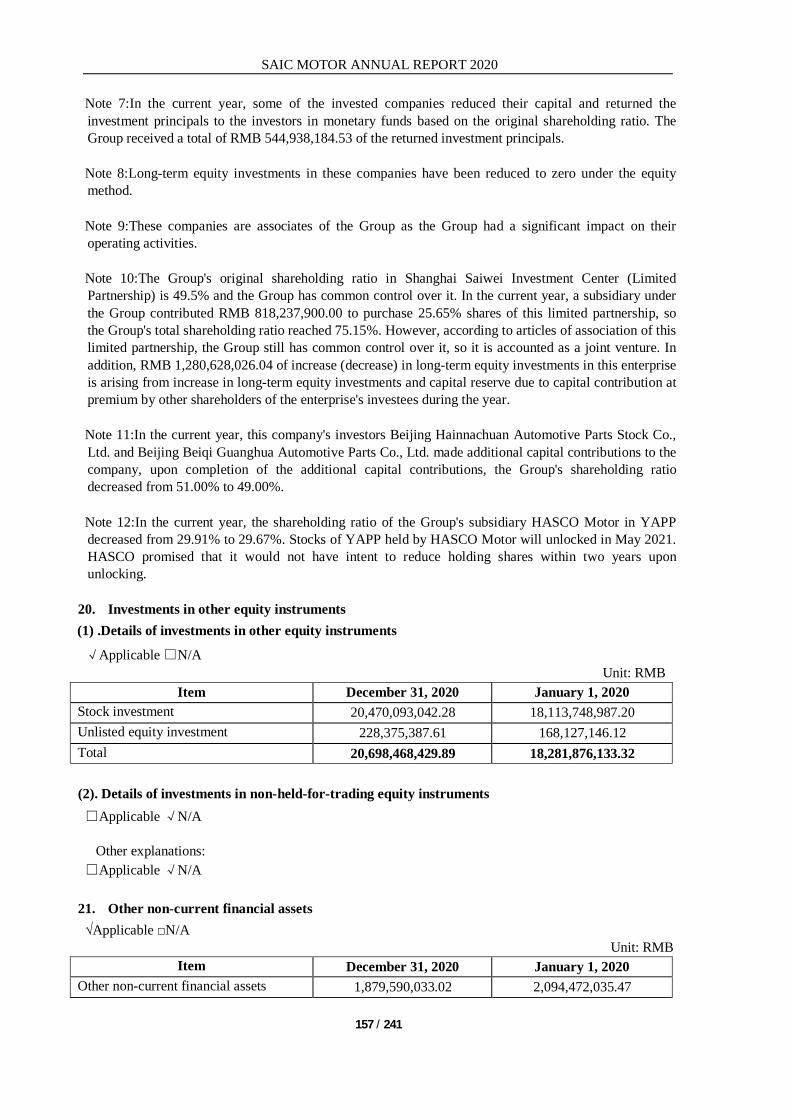
SAIC MOTOR ANNUAL REPORT 2020
157 / 241
Note 7:In the current year, some of the invested companies reduced their capital and returned the investment principals to the investors in monetary funds based on the original shareholding ratio. The Group received a total of RMB 544,938,184.53 of the returned investment principals. Note 8:Long-term equity investments in these companies have been reduced to zero under the equity method. Note 9:These companies are associates of the Group as the Group had a significant impact on their operating activities. Note 10:The Group's original shareholding ratio in Shanghai Saiwei Investment Center (Limited Partnership) is 49.5% and the Group has common control over it. In the current year, a subsidiary under the Group contributed RMB 818,237,900.00 to purchase 25.65% shares of this limited partnership, so the Group's total shareholding ratio reached 75.15%. However, according to articles of association of this limited partnership, the Group still has common control over it, so it is accounted as a joint venture. In addition, RMB 1,280,628,026.04 of increase (decrease) in long-term equity investments in this enterprise is arising from increase in long-term equity investments and capital reserve due to capital contribution at premium by other shareholders of the enterprise's investees during the year. Note 11:In the current year, this company's investors Beijing Hainnachuan Automotive Parts Stock Co., Ltd. and Beijing Beiqi Guanghua Automotive Parts Co., Ltd. made additional capital contributions to the company, upon completion of the additional capital contributions, the Group's shareholding ratio decreased from 51.00% to 49.00%. Note 12:In the current year, the shareholding ratio of the Group's subsidiary HASCO Motor in YAPP decreased from 29.91% to 29.67%. Stocks of YAPP held by HASCO Motor will unlocked in May 2021. HASCO promised that it would not have intent to reduce holding shares within two years upon unlocking.
20. Investments in other equity instruments (1) .Details of investments in other equity instruments √Applicable □N/A
Unit: RMB Item December 31, 2020 January 1, 2020
Stock investment 20,470,093,042.28 18,113,748,987.20 Unlisted equity investment 228,375,387.61 168,127,146.12 Total 20,698,468,429.89 18,281,876,133.32
(2). Details of investments in non-held-for-trading equity instruments □Applicable √N/A
Other explanations: □Applicable √N/A
21. Other non-current financial assets √Applicable □N/A
Unit: RMB Item December 31, 2020 January 1, 2020
Other non-current financial assets 1,879,590,033.02 2,094,472,035.47

SAIC MOTOR ANNUAL REPORT 2020
158 / 241
Total 1,879,590,033.02 2,094,472,035.47 Other explanations: □Applicable √N/A 22. Investment properties Measurement model of investment properties (1). Investment properties measured at cost
Unit: RMB Item Buildings Land use right Total
I. Cost
1. January 1, 2020 4,083,224,734.63 1,009,135,232.76 5,092,359,967.39 2. Increase in the current period 284,835,097.16 35,724,075.04 320,559,172.20 (1) Purchase
(2) Transfer from inventories / fixed assets / construction in progress 284,835,097.16 284,835,097.16
(3) Increase due to business combinations
(4) Transfer from intangible assets 35,724,075.04 35,724,075.04 3. Decrease in the current period 428,911,827.92 54,613,374.51 483,525,202.43 (1) Disposals 128,853,074.59 128,853,074.59 (2) Other transfer-out 300,058,753.33 54,613,374.51 354,672,127.84 4. December 31, 2020 3,939,148,003.87 990,245,933.29 4,929,393,937.16
II. Accumulated depreciation and amortization
1. January 1, 2020 1,627,594,357.09 212,704,158.97 1,840,298,516.06 2. Increase in the current period 177,288,340.70 46,730,995.76 224,019,336.46 (1) Provision or amortization 81,883,552.04 36,182,769.24 118,066,321.28 (2) Transfer from fixed assets 95,404,788.66 95,404,788.66 (3) Transfer from intangible assets 10,548,226.52 10,548,226.52 3. Decrease in the current period 207,495,053.57 7,880,721.42 215,375,774.99 (1) Disposals 101,025,061.25 101,025,061.25 (2) Other transfer-out 106,469,992.32 7,880,721.42 114,350,713.74 4. December 31, 2020 1,597,387,644.22 251,554,433.31 1,848,942,077.53
III. Impairment provision 1. January 1, 2020 2. Increase in the current period 79,023.72 79,023.72 (1) Provision 79,023.72 79,023.72 3. Decrease in the current period (1) Disposals (2) Other transfer-out 4. December 31, 2020 79,023.72 79,023.72
IV. Net carrying amount 1. December 31, 2020 2,341,681,335.93 738,691,499.98 3,080,372,835.91 2. January 1, 2020 2,455,630,377.54 796,431,073.79 3,252,061,451.33
(2). Investment properties of which certificates of title have not been obtained

SAIC MOTOR ANNUAL REPORT 2020
159 / 241
√Applicable □N/A Unit: RMB
Item Carrying amount Reasons why certificates of title have not been obtained
Buildings 52,489,172.06 In progress Other explanations □Applicable √N/A 23. Fixed assets presentation by items √Applicable □N/A
Unit: RMB Item December 31, 2020 January 1, 2020
Fixed assets 82,982,337,001.90 83,056,007,151.50
Total 82,982,337,001.90 83,056,007,151.50 Other explanations: □Applicable √N/A
(1). Details of fixed assets √Applicable □N/A Unit: RMB
Item Buildings Machinery and equipment
Electronic equipment, fixtures and
furniture Transportation
vehicles Molds Total
I. Cost 1. January 1, 2020 37,669,660,575.78 82,925,542,662.49 8,028,360,653.98 10,089,459,183.69 11,116,162,304.59 149,829,185,380.53 2. Increase in the current period 2,816,033,009.12 8,248,872,506.32 978,293,184.43 1,002,405,979.37 3,006,612,665.07 16,052,217,344.31
(1) Purchase 105,467,991.66 236,633,578.02 122,922,229.03 198,169,685.24 30,110,378.23 693,303,862.18 (2) Transfer from construction in progress 2,014,457,559.71 6,717,702,215.68 825,746,630.54 803,575,104.13 2,976,502,286.84 13,337,983,796.90 (3) Transfer from investment properties 300,058,753.33 300,058,753.33 (4) Increase due to business combinations 396,048,704.42 1,294,536,712.62 29,624,324.86 661,190.00 1,720,870,931.90
3. Decrease in the current period 574,517,212.51 1,672,780,068.44 560,305,127.60 2,432,027,523.54 373,955,684.88 5,613,585,616.97
(1) Disposals or retirement 159,337,159.84 1,245,936,084.58 517,816,586.91 873,684,129.14 285,532,279.81 3,082,306,240.28 (2) Transfer to investment properties during the year 246,082,019.17 246,082,019.17 (3) Decrease due to business combinations 8,766,764.33 1,552,560,755.84 1,561,327,520.17 (4) Translation differences of currency statement denominated in foreign currencies
169,098,033.50 426,843,983.86 33,721,776.36 5,782,638.56 88,423,405.07 723,869,837.35
4. December 31, 2020 39,911,176,372.39 89,501,635,100.37 8,446,348,710.81 8,659,837,639.52 13,748,819,284.78 160,267,817,107.87 II. Accumulated depreciation
1. January 1, 2020 10,014,085,916.05 37,841,499,131.22 5,068,354,534.69 3,236,541,525.88 3,895,780,687.35 60,056,261,795.19 2. Increase in the current period 1,848,055,689.02 6,651,715,827.11 871,688,999.46 887,363,975.47 1,958,189,850.84 12,217,014,341.90
(1) Provision 1,741,585,696.70 6,651,715,827.11 871,688,999.46 887,363,975.47 1,958,189,850.84 12,110,544,349.58 (2) Transfer from investment properties 106,469,992.32 106,469,992.32
3. Decrease in the current period 185,083,108.15 1,094,103,080.22 431,721,570.73 887,034,577.14 140,269,015.17 2,738,211,351.41
(1) Disposals or retirement 69,432,883.93 947,792,590.98 411,959,814.03 355,319,360.15 128,097,589.93 1,912,602,239.02 (2) Transfer to investment properties 95,404,788.66 95,404,788.66 (3) Decrease due to business combinations 5,750,915.78 529,504,876.67 535,255,792.45

SAIC MOTOR ANNUAL REPORT 2020
160 / 241
(4) Translation differences of currency statement denominated in foreign currencies
20,245,435.56 146,310,489.24 14,010,840.92 2,210,340.32 12,171,425.24 194,948,531.28
4. December 31, 2020 11,677,058,496.92 43,399,111,878.11 5,508,321,963.42 3,236,870,924.21 5,713,701,523.02 69,535,064,785.68 III. Impairment provision
1. January 1, 2020 129,214,308.30 3,569,884,981.49 129,796,072.18 45,010,126.32 2,843,010,945.55 6,716,916,433.84 2. Increase in the current period 1,098,756.75 575,250,364.35 8,684,720.72 149,663,285.57 753,936,339.26 1,488,633,466.65
(1) Provision 1,098,756.75 575,250,364.35 8,684,720.72 109,684,383.78 753,936,339.26 1,448,654,564.86 (2) Transfer from construction in progress 39,978,901.79 39,978,901.79
3. Decrease in the current period 44,755,752.13 151,295,603.02 22,916,522.28 119,949,746.50 116,216,956.27 455,134,580.20 (1) Disposal or retirement 44,755,752.13 124,873,249.21 22,916,522.28 115,463,577.75 105,525,270.48 413,534,371.85
(2) Decrease due to business combinations 4,434,554.53 4,434,554.53 (3) Translation differences of currency statement denominated in foreign currencies
26,422,353.81 51,614.22 10,691,685.79 37,165,653.82
4. December 31, 2020 85,557,312.92 3,993,839,742.82 115,564,270.62 74,723,665.39 3,480,730,328.54 7,750,415,320.29 IV. Net book value
1. December 31, 2020 28,148,560,562.55 42,108,683,479.44 2,822,462,476.77 5,348,243,049.92 4,554,387,433.22 82,982,337,001.90 2. January 1, 2020 27,526,360,351.43 41,514,158,549.78 2,830,210,047.11 6,807,907,531.49 4,377,370,671.69 83,056,007,151.50
(2). Details of temporary idle fixed assets □Applicable √N/A
(3). Details of fixed assets leased under finance leases □Applicable √N/A
(4). Fixed assets leased out under operating leases □Applicable √N/A
(5). Fixed assets of which certificates of title have not been obtained √Applicable □N/A
Unit: RMB
Item Carrying amount Reasons why certificates of title have not been obtained
Buildings 7,599,503,803.46 In progress
Other explanations: √Applicable □N/A At the end of the current year, the buildings, the machinery and equipment, the molds, the transportation vehicles, and the electronic equipment, fixtures and furniture, with net book value of RMB 1,569,978,139.13, RMB 1,147,303,640.53, RMB 438,221,201.90 and RMB 14,966,370.39 and RMB 60,163,110.20 respectively were pledged as the collateral for bank loans. Refer to Note (VII) 34 and 47. Disposal of fixed assets □Applicable √N/A 24. Construction in progress presentation by items √Applicable □N/A
Unit: RMB Item December 31, 2020 January 1, 2020

SAIC MOTOR ANNUAL REPORT 2020
161 / 241
Construction in progress
13,132,599,220.78 16,187,540,866.58
Total 13,132,599,220.78 16,187,540,866.58
Other explanations: □Applicable √N/A
(1). Details of construction in progress √Applicable □N/A
Unit: RMB
Item December 31,2020 January 1, 2020
Book balance Impairment provision Carrying amount Book balance Impairment
provision Carrying amount Yanfeng interior, seating, and electronic technology renovation projects, etc.
2,940,628,408.08 18,610,967.00 2,922,017,441.08 3,209,356,117.62 18,177,653.75 3,191,178,463.87 Project of self-owned brand of Commercial Vehicles 2,458,758,384.56 2,458,758,384.56 2,234,260,712.63 2,234,260,712.63 Project of passenger vehicles of self-owned brands 2,334,759,630.71 2,334,759,630.71 3,269,982,658.05 3,269,982,658.05 Project of Shanghong Real Estate Changfeng 1,664,984,925.65 1,664,984,925.65 1,531,915,667.15 1,531,915,667.15 Project of technology improvement and capacity expansion of SGMW
972,447,635.36 972,447,635.36 1,671,047,189.18 1,671,047,189.18 Gearbox renewal and renovation project, etc. 568,817,522.32 568,817,522.32 1,043,504,930.28 1,043,504,930.28 Project of Global Car Sharing periodic lease 459,788,732.19 209,920.85 459,578,811.34 844,199,455.12 39,978,901.79 804,220,553.33 Logistics operation center project of industrial pins etc. 437,218,182.61 437,218,182.61 387,356,217.46 387,356,217.46 Anji logistics infrastructure project, etc. 350,645,362.86 350,645,362.86 518,499,318.03 518,499,318.03 Manufacturing investment project of SAIC-IVECO Hongyan, etc. 124,259,291.68 124,259,291.68 135,222,873.17 135,222,873.17 Asset management photovoltaic power generation and other infrastructure projects, etc.
121,279,723.86 121,279,723.86 22,549,795.85 22,549,795.85 Project of self-owned brand in Thailand 118,689,831.79 118,689,831.79 168,078,453.39 168,078,453.39 MG Indian project 117,052,536.80 117,052,536.80 249,098,624.48 249,098,624.48 Others 497,521,178.21 15,431,238.05 482,089,940.16 985,375,172.48 24,749,762.77 960,625,409.71
Total 13,166,851,346.68 34,252,125.90 13,132,599,220.78 16,270,447,184.89 82,906,318.31 16,187,540,866.58

SAIC MOTOR ANNUAL REPORT 2020
(2). Changes in significant construction in progress √Applicable □N/A
Unit: RMB
Name of item Budget January 1, 2020
Increase during the year Transfer to fixed assets
upon completion Other decreases
during the period
December 31, 2020
Proportion of project investment to the budget (%)
Project progress
Amount of accumulated
capitalized interest Including: Interest capitalized
Interest capitalization rate for the period (%)
Sources of funds
Yanfeng interior, seating, and electronic technology renovation projects, etc.
15,805,885,661.05 3,209,356,117.62 3,964,160,205.21 3,899,476,854.93 333,411,059.82 2,940,628,408.08 79% Under
construction 7,164,900.32 10,323,259.19 4.02 Self-financed Project of self-owned brand of Commercial Vehicles 7,224,053,429.66 2,234,260,712.63 792,653,199.80 548,016,438.55 20,139,089.32 2,458,758,384.56 42%
Under construction
Self-financed and raised funds
Project of passenger vehicles of self-owned brands 22,086,738,515.41 3,269,982,658.05 2,142,939,968.25 3,029,489,843.05 48,673,152.54 2,334,759,630.71 59% Under
construction Self-financed and
raised funds
Project of Shanghong Real Estate Changfeng 4,543,210,000.00 1,531,915,667.15 133,069,258.50 1,664,984,925.65 74% Under
construction 157,503,625.99 67,993,116.79 4.58 Self-financed Project of technology improvement and capacity expansion of SGMW
3,124,321,790.18 1,671,047,189.18 1,138,775,026.32 1,810,198,010.16 27,176,569.98 972,447,635.36 95% Under
construction Self-financed Gearbox renewal and renovation project, etc. 5,092,706,722.42 1,043,504,930.28 531,962,376.93 983,924,938.30 22,724,846.59 568,817,522.32 38%
Under construction 74,164.00 681,106.32 4.75
Self-financed and raised funds
Project of Global Car Sharing periodic lease 5,270,000,000.00 844,199,455.12 589,615,234.53 955,125,530.21 18,900,427.25 459,788,732.19 80% Under
construction Self-financed Logistics operation center project of industrial pins, etc. 450,000,000.00 387,356,217.46 49,861,965.15 437,218,182.61 97% Under
construction Self-financed
Anji logistics infrastructure project, etc. 1,041,326,173.06 518,499,318.03 458,868,085.51 592,031,964.30 34,690,076.38 350,645,362.86 73% Under
construction Self-financed Manufacturing investment project of SAIC-IVECO Hongyan, etc.
715,344,253.96 135,222,873.17 175,369,112.82 85,780,193.25 100,552,501.06 124,259,291.68 37% Under
construction Self-financed
Asset management photovoltaic power generation and other infrastructure projects, etc.
619,116,064.00 22,549,795.85 140,777,011.11 144,082.11 41,903,000.99 121,279,723.86 26% Under
construction 619,392.18 614,530.95 4.90
Self-financed
Project of self-owned brand in Thailand 1,254,139,871.20 168,078,453.39 169,547,389.44 151,535,821.73 67,400,189.31 118,689,831.79 67% Under
construction Self-financed MG Indian project 2,632,577,229.56 249,098,624.48 213,481,972.93 277,725,802.85 67,802,257.76 117,052,536.80 41% Under
construction Self-financed
Others 12,801,762,987.96 985,375,172.48 883,170,139.31 1,004,534,317.46 366,489,816.12 497,521,178.21 Under construction
Self-financed
Total 82,661,182,698.46 16,270,447,184.89 11,384,250,945.81 13,337,983,796.90 1,149,862,987.12 13,166,851,346.68 165,362,082.49 79,612,013.25 / /

SAIC MOTOR ANNUAL REPORT 2020
163 / 241
(3). Provision for impairment losses of construction in progress √Applicable □N/A
Unit: RMB Item Amount provision for the period Reason for the provision
Provision for impairment losses of construction in progress
5,830,718.88 /
Total 5,830,718.88 / Other explanations √Applicable □N/A
At the end of current year, construction in progress with net book value of RMB 425,684,519.49 was pledged as the collateral for bank loans.
Materials for construction of fixed assets (4). Details of materials for construction of fixed assets □Applicable √N/A 25. Bearer biological assets (1). Bearer biological assets measured at cost □Applicable √N/A (2). Bearer biological assets measured at fair value □Applicable √N/A Other explanations □Applicable √N/A 26. Oil and gas assets □Applicable √N/A 27. Right-of-use assets □Applicable √N/A 28. Intangible assets (1). Details of intangible assets √Applicable □N/A
Unit: RMB Item Land use right Patent Royalty
right Software use
right Trademark
right Know-how Others Total I. Cost
1. January 1, 2020 14,197,041,505.94 1,033,952,252.05 170,100,094.11 3,882,812,531.77 264,962,933.29 4,372,006,534.29 1,415,557,025.48 25,336,432,876.93 2. Increase in the current period 286,402,503.90 579,617,905.45 1,438,378,152.95 548,954,612.00 2,853,353,174.30
(1) Purchase 61,729,876.92 172,579,431.11 308,481,010.10 18,817,963.00 561,608,281.13
(2) Internal R&D 771,860,398.18 771,860,398.18

SAIC MOTOR ANNUAL REPORT 2020
164 / 241
(3) Increases due to business combinations
92,445,471.92 4,310,273.00 128,507,205.00 523,863,918.00 749,126,867.92 (4) Transfer from investment properties
54,613,374.51 54,613,374.51 (5) Transfer from construction in progress
77,613,780.55 402,728,201.34 229,529,539.67 6,272,731.00 716,144,252.56 3. Decrease in the current period 249,774,687.23 6,463,500.00 105,649,598.66 210,738,919.15 371,143,384.20 943,770,089.24 (1) Disposals
162,105,350.76 6,463,500.00 47,478,829.70 182,366,467.61 255,092.00 398,669,240.07 (2) Transfer to investment properties
35,724,075.04 35,724,075.04 (3) Decreases due to business combinations
21,181,809.06 354,016,452.00 375,198,261.06 (4) Translation differences of financial statements denominated in foreign currencies
51,945,261.43 36,988,959.90 28,372,451.54 16,871,840.20 134,178,513.07
4. December 31, 2020 14,233,669,322.61 1,033,952,252.05 163,636,594.11 4,356,780,838.56 264,962,933.29 5,599,645,768.09 1,593,368,253.28 27,246,015,961.99 II. Accumulated amortization 1. January 1, 2020
1,724,730,237.79 952,652,252.05 162,415,631.93 2,375,863,849.58 164,802,366.46 2,791,180,641.75 851,630,775.76 9,023,275,755.32 2. Increase in the current period
285,132,145.25 2,969,512.18 550,089,249.75 24,169,627.72 275,069,240.86 293,591,176.73 1,431,020,952.49
(1) Provision 277,251,423.83 2,969,512.18 550,089,249.75 24,169,627.72 275,069,240.86 293,591,176.73 1,423,140,231.07 (2) Transfer from investment properties
7,880,721.42 7,880,721.42
3. Decrease in the current period 89,408,267.09 1,748,550.00 37,725,010.74 120,621,278.03 73,096,117.95 322,599,223.81 (1) Disposals
78,468,300.34 1,748,550.00 8,532,399.43 110,451,433.56 162,975.00 199,363,658.33 (2) Transfer to investment properties
10,548,226.52 10,548,226.52 (3) Decreases due to business combinations
16,796,942.44 68,832,207.25 85,629,149.69 (4) Translation differences of financial statements denominated in foreign currencies
391,740.23 12,395,668.87 10,169,844.47 4,100,935.70 27,058,189.27
4. December 31, 2020
1,920,454,115.95 952,652,252.05 163,636,594.11 2,888,228,088.59 188,971,994.18 2,945,628,604.58 1,072,125,834.54 10,131,697,484.00 III. Impairment provision 1. January 1, 2020
3,612,787.25 81,250,000.00 4,714,950.00 51,561,224.24 890,858,462.13 1,031,997,423.62 2. Increase in the current period 6,006,423.13 99,007,272.70 105,013,695.83
(1) Provision 6,006,423.13 99,007,272.70 105,013,695.83 3. .Decrease in the current period
4,714,950.00
1,706,481.10
36,788,099.17
43,209,530.27
(1) Disposals 4,714,950.00 1,706,481.10 36,121,555.87 42,542,986.97 (2) Translation differences of financial statements denominated in foreign currencies
666,543.30 666,543.30
4. December 31, 2020 3,612,787.25 81,250,000.00 55,861,166.27 953,077,635.66 1,093,801,589.18 IV. Net carrying amount 1. December 31, 2020 12,309,602,419.41 50,000.00 1,412,691,583.70 75,990,939.11 1,700,939,527.85 521,242,418.74 16,020,516,888.81
2. January 1, 2020 12,468,698,480.90 50,000.00 2,969,512.18 1,455,387,457.95 100,160,566.83 689,967,430.41 563,926,249.72 15,281,159,697.99

SAIC MOTOR ANNUAL REPORT 2020
165 / 241
At the end of the period, intangible assets arising from internal R&D by the Company accounted for 4.82% of total balance of intangible assets. (2). Land use right of which certificates of title have not been obtained □Applicable √N/A Other explanations: √Applicable □N/A At the end of current year, land use right and know-how at net carrying amount of RMB 4,779,375,894.34 and RMB 351,353,022.17 respectively were pledged as the collateral for bank loans. 29. Development expenditure √Applicable □N/A
Unit: RMB
Item December 31, 2019
Increase Decrease December 31, 2020
Internal
development expenditure
Others Recognized as intangible assets
Recognized in profit or loss
Research expenditures 3,663,838,315.44 3,663,838,315.44
Development expenditures 1,646,702,512.60 11,303,296,516.60 771,860,398.18 9,731,206,072.62 2,446,932,558.40
Total 1,646,702,512.60 14,967,134,832.04 771,860,398.18 13,395,044,388.06 2,446,932,558.40 Other explanations Development expenditures accounted for 75.52% of total research and development expenditures during the year. 30. Goodwill (1). Cost of goodwill √Applicable □N/A
Unit: RMB
Name of the investee or item resulting in goodwill December 31, 2019
Increase Decrease December 31, 2020 Business
combination Disposal Others
HASCO Vision Technology (Shanghai) Co., Ltd 781,115,081.73 781,115,081.73 SAIC-GMAC Automotive Finance Co., Ltd. 333,378,433.68 333,378,433.68
Anji Car Rental & Leasing Co., Ltd. (Note 1) 144,642,003.53 144,642,003.53 Shanghai International Automobile City New Energy Automotive Operation Service Co., Ltd.
142,443,867.15 142,443,867.15
Chongqing Yanfeng Johnson Automotive Parts Systems Co., Ltd. 71,566,642.00 71,566,642.00
Wuhan Zhonghaiting Data Technology Co., Ltd. 55,012,594.38 55,012,594.38 Shanghai Sunwin Bus Co., Ltd. 53,349,858.83 53,349,858.83 Shanghai Diesel Engine Co., Ltd. 6,994,594.88 6,994,594.88 Zhejiang Lishui Yidong New Energy Automobile Operation Service Co., 2,820,855.59 2,820,855.59

SAIC MOTOR ANNUAL REPORT 2020
166 / 241
Ltd.
Zhejiang Quzhou Yidong New Energy Automobile Operation Service Co., Ltd.
946,936.57 946,936.57
ANJI-CEVA Logistics Co., Ltd. 290,248.50 290,248.50 Nanjing Shendi Welding Technology Co., Ltd. (Note 2) 4,652,677.65 4,652,677.65 Others 43,622,349.54 2,016,628.36 41,605,721.18
Total 1,636,183,466.38 4,652,677.65 144,642,003.53 2,016,628.36 1,494,177,512.14 Note 1: Refer to Note (VIII) 4. Note 2: Refer to Note (VIII) 1 (1). (2). Impairment of goodwill √Applicable □N/A
Unit: RMB Name of the investee or item resulting in
goodwill December 31, 2019
Increase Decrease December 31, 2020 Provision Disposals Others
Impairment of goodwill 155,383,981.85 144,642,003.53 2,016,628.36 8,725,349.96
Total 155,383,981.85 144,642,003.53 2,016,628.36 8,725,349.96 (3). Details of asset group or portfolio of goodwill □Applicable √N/A (4). Describe the test procedure, parameters of impairment of goodwill (e.g.: growth rate during the forecast period and stable period, profit rate, discount rate, and forecast period when estimating the present value of future cash flows, if applicable) as well as recognition method for impairment loss □Applicable √N/A (5). Effect of impairment testing of goodwill □Applicable √N/A Other explanations □Applicable √N/A 31. Long-term deferred expenses √Applicable □N/A
Unit: RMB
Item December 31, 2019 Increase Amortization Other decrease December 31,
2020 Improvement expenditure of fixed assets
1,928,410,984.71 604,464,529.30 649,561,899.05 81,411,420.98 1,801,902,193.98
Others 542,696,201.67 94,231,368.87 160,293,369.84 476,634,200.70 Total 2,471,107,186.38 698,695,898.17 809,855,268.89 81,411,420.98 2,278,536,394.68
32. Deferred tax assets/deferred tax liabilities (1). Deferred tax assets that are not offset
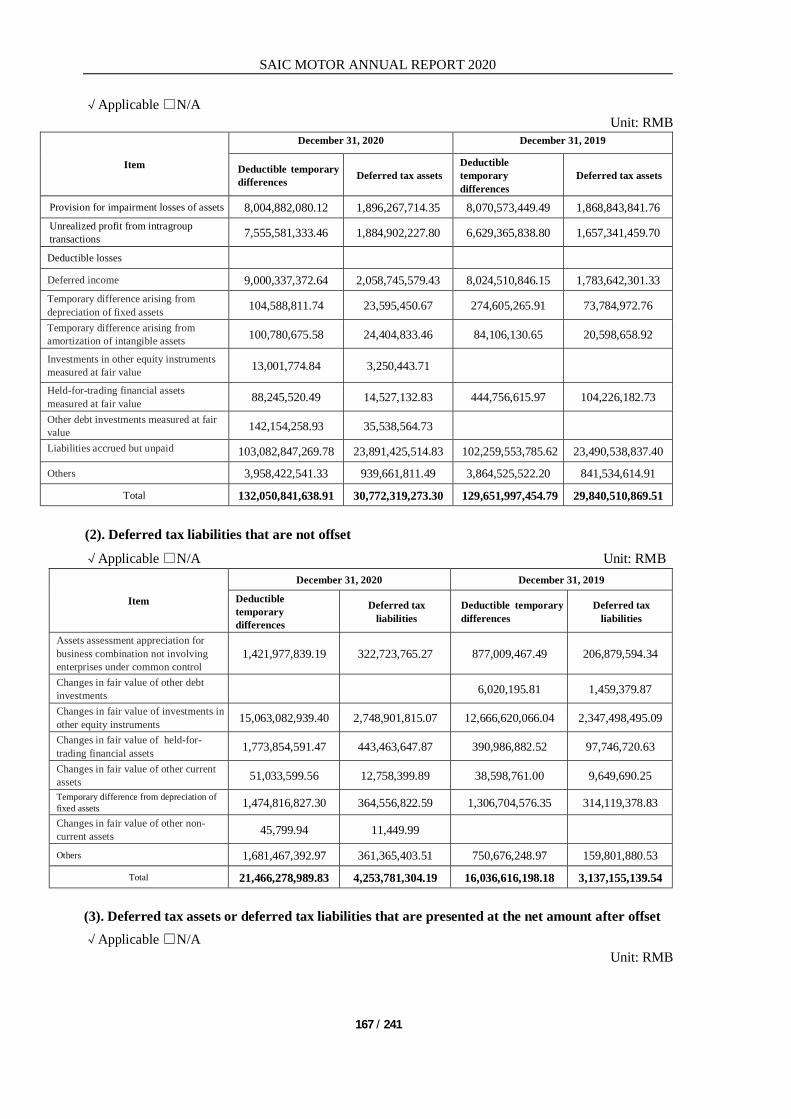
SAIC MOTOR ANNUAL REPORT 2020
167 / 241
√Applicable □N/A Unit: RMB
Item
December 31, 2020 December 31, 2019
Deductible temporary differences Deferred tax assets
Deductible temporary differences
Deferred tax assets
Provision for impairment losses of assets 8,004,882,080.12 1,896,267,714.35 8,070,573,449.49 1,868,843,841.76 Unrealized profit from intragroup transactions 7,555,581,333.46 1,884,902,227.80 6,629,365,838.80 1,657,341,459.70
Deductible losses Deferred income 9,000,337,372.64 2,058,745,579.43 8,024,510,846.15 1,783,642,301.33 Temporary difference arising from depreciation of fixed assets 104,588,811.74 23,595,450.67 274,605,265.91 73,784,972.76 Temporary difference arising from amortization of intangible assets 100,780,675.58 24,404,833.46 84,106,130.65 20,598,658.92
Investments in other equity instruments measured at fair value 13,001,774.84 3,250,443.71
Held-for-trading financial assets measured at fair value 88,245,520.49 14,527,132.83 444,756,615.97 104,226,182.73 Other debt investments measured at fair value 142,154,258.93 35,538,564.73 Liabilities accrued but unpaid 103,082,847,269.78 23,891,425,514.83 102,259,553,785.62 23,490,538,837.40 Others 3,958,422,541.33 939,661,811.49 3,864,525,522.20 841,534,614.91
Total 132,050,841,638.91 30,772,319,273.30 129,651,997,454.79 29,840,510,869.51 (2). Deferred tax liabilities that are not offset √Applicable □N/A Unit: RMB
Item December 31, 2020 December 31, 2019
Deductible temporary differences
Deferred tax liabilities
Deductible temporary differences
Deferred tax liabilities
Assets assessment appreciation for business combination not involving enterprises under common control
1,421,977,839.19 322,723,765.27 877,009,467.49 206,879,594.34
Changes in fair value of other debt investments 6,020,195.81 1,459,379.87 Changes in fair value of investments in other equity instruments 15,063,082,939.40 2,748,901,815.07 12,666,620,066.04 2,347,498,495.09 Changes in fair value of held-for-trading financial assets 1,773,854,591.47 443,463,647.87 390,986,882.52 97,746,720.63 Changes in fair value of other current assets 51,033,599.56 12,758,399.89 38,598,761.00 9,649,690.25 Temporary difference from depreciation of fixed assets 1,474,816,827.30 364,556,822.59 1,306,704,576.35 314,119,378.83 Changes in fair value of other non- current assets 45,799.94 11,449.99
Others 1,681,467,392.97 361,365,403.51 750,676,248.97 159,801,880.53 Total 21,466,278,989.83 4,253,781,304.19 16,036,616,198.18 3,137,155,139.54
(3). Deferred tax assets or deferred tax liabilities that are presented at the net amount after offset √Applicable □N/A
Unit: RMB
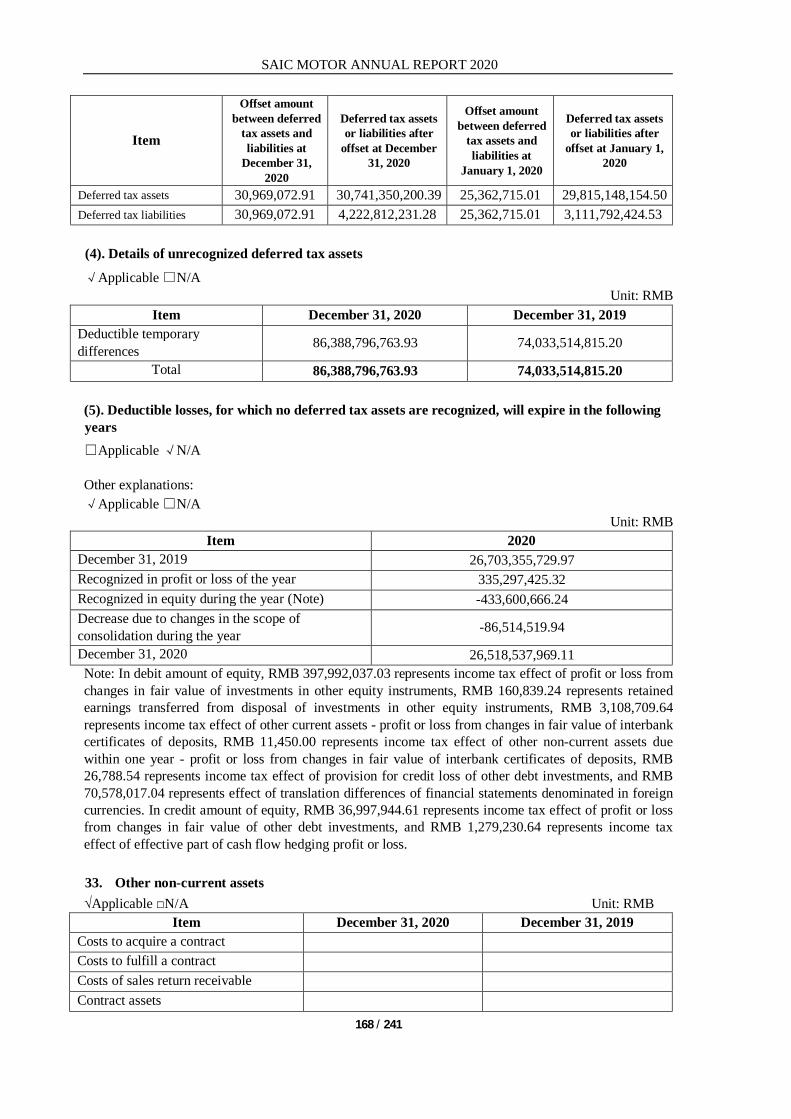
SAIC MOTOR ANNUAL REPORT 2020
168 / 241
Item
Offset amount between deferred
tax assets and liabilities at
December 31, 2020
Deferred tax assets or liabilities after
offset at December 31, 2020
Offset amount between deferred
tax assets and liabilities at
January 1, 2020
Deferred tax assets or liabilities after
offset at January 1, 2020
Deferred tax assets 30,969,072.91 30,741,350,200.39 25,362,715.01 29,815,148,154.50 Deferred tax liabilities 30,969,072.91 4,222,812,231.28 25,362,715.01 3,111,792,424.53 (4). Details of unrecognized deferred tax assets √Applicable □N/A
Unit: RMB Item December 31, 2020 December 31, 2019
Deductible temporary differences 86,388,796,763.93 74,033,514,815.20
Total 86,388,796,763.93 74,033,514,815.20 (5). Deductible losses, for which no deferred tax assets are recognized, will expire in the following years □Applicable √N/A Other explanations: √Applicable □N/A
Unit: RMB Item 2020
December 31, 2019 26,703,355,729.97 Recognized in profit or loss of the year 335,297,425.32 Recognized in equity during the year (Note) -433,600,666.24 Decrease due to changes in the scope of consolidation during the year -86,514,519.94
December 31, 2020 26,518,537,969.11 Note: In debit amount of equity, RMB 397,992,037.03 represents income tax effect of profit or loss from changes in fair value of investments in other equity instruments, RMB 160,839.24 represents retained earnings transferred from disposal of investments in other equity instruments, RMB 3,108,709.64 represents income tax effect of other current assets - profit or loss from changes in fair value of interbank certificates of deposits, RMB 11,450.00 represents income tax effect of other non-current assets due within one year - profit or loss from changes in fair value of interbank certificates of deposits, RMB 26,788.54 represents income tax effect of provision for credit loss of other debt investments, and RMB 70,578,017.04 represents effect of translation differences of financial statements denominated in foreign currencies. In credit amount of equity, RMB 36,997,944.61 represents income tax effect of profit or loss from changes in fair value of other debt investments, and RMB 1,279,230.64 represents income tax effect of effective part of cash flow hedging profit or loss. 33. Other non-current assets √Applicable □N/A Unit: RMB
Item December 31, 2020 December 31, 2019 Costs to acquire a contract Costs to fulfill a contract Costs of sales return receivable Contract assets

SAIC MOTOR ANNUAL REPORT 2020
169 / 241
Asset-backed securities 4,324,003,456.33 4,387,284,031.94 Continuous involvement in the financial assets 3,307,718,276.74 2,910,167,439.68
Prepayment of long-term assets 713,182,639.69 881,316,286.06 Others 1,237,054,564.91 1,361,942,665.69 Less: Impairment of other non-current assets -806,664,814.13 -948,761,156.56
Less: Other non-current assets due within one year -1,733,541,711.06 -2,574,405,349.72
Total 7,041,752,412.48 6,017,543,917.09 34. Short-term borrowings (1). Categories of short-term borrowings √Applicable □N/A
Unit: RMB Item December 31, 2020 December 31, 2019 Secured loans with securities under the custody of lenders
546,000,000.00 633,905,049.00
Secured loans with securities under the Group's custody
86,000,000.00 46,000,000.00
Guaranteed loans 503,429,051.82 255,740,000.00 Unsecured and non-guaranteed loans
22,493,212,372.20 24,652,341,150.99
Total 23,628,641,424.02 25,587,986,199.99 Explanations on categories of short-term borrowings: Note 1: At the end of the current year, the guaranteed loans amounting to RMB 15,000,000.00 were obtained under the guarantee of Jiangsu Susun Group Co., Ltd., and the guaranteed loans amounting to RMB 488,429,051.82 were obtained under the guarantee of Shanghai International Automotive City (Group) Co., Ltd. and Shanghai Anting Industrial Development Co., Ltd. jointly. Note 2: At the end of the current year, the secured loans with securities under the custody of lenders amounting to RMB 15,000,000.00 were obtained with accounts receivable with net book value of RMB 12,144,228.46 as the collateral. The secured loans with securities under the custody of lenders amounting to RMB 10,000,000.00 were obtained with time deposit certificate with net book value of RMB 20,000,000.00 as the collateral. The secured loans with securities under the custody of lenders amounting to RMB 521,000,000.00 were obtained with accounts receivable with net book value of RMB 299,725,001.46 as the collateral. Note 3: At the end of current year, the secured loans with securities under the Group's custody amounting to RMB 60,000,000.00 were obtained with fixed assets - buildings with net book value of RMB 91,996,063.29 and land use right with net book value of RMB 43,358,388.32 as the collateral. The secured loans with securities under the Group's custody amounting to RMB 26,000,000.00 were obtained with fixed assets - buildings with net book value of RMB 21,301,138.13 and land use right with net book value of RMB 6,212,266.17 as the collateral. (2). Short-term borrowings overdue but not yet repaid
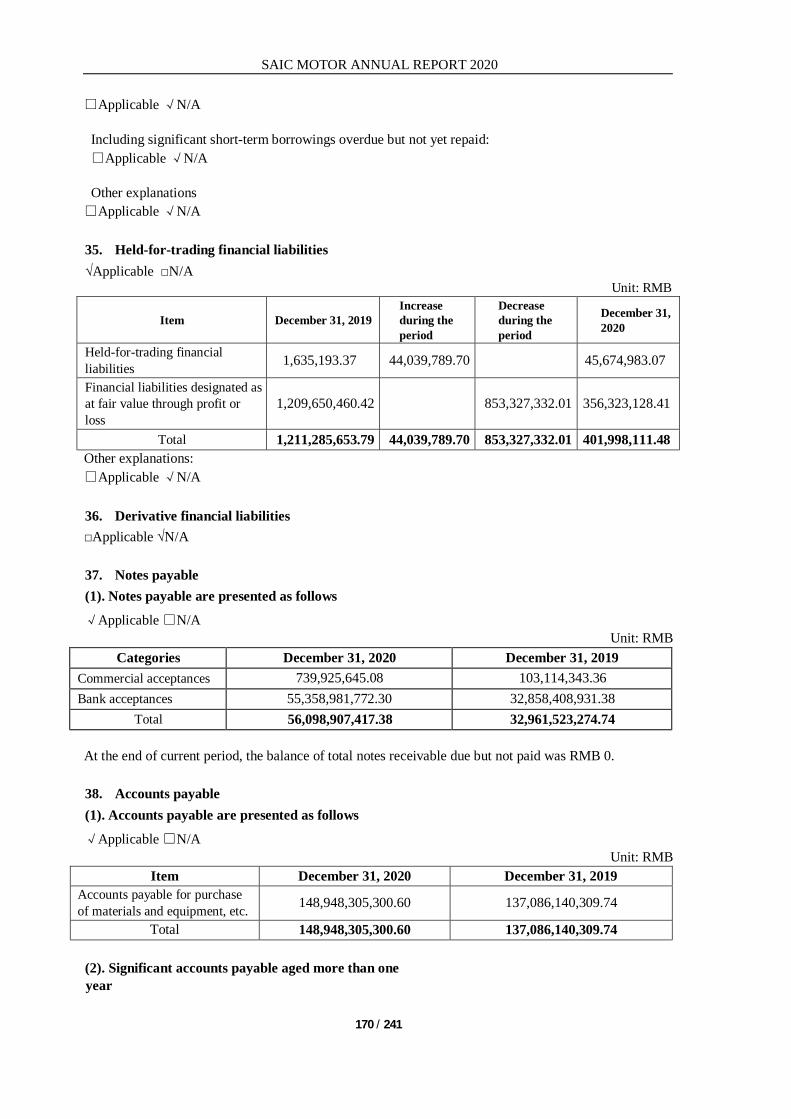
SAIC MOTOR ANNUAL REPORT 2020
170 / 241
□Applicable √N/A Including significant short-term borrowings overdue but not yet repaid: □Applicable √N/A Other explanations □Applicable √N/A 35. Held-for-trading financial liabilities √Applicable □N/A
Unit: RMB
Item December 31, 2019 Increase during the period
Decrease during the period
December 31, 2020
Held-for-trading financial liabilities 1,635,193.37 44,039,789.70 45,674,983.07
Financial liabilities designated as at fair value through profit or loss
1,209,650,460.42 853,327,332.01 356,323,128.41
Total 1,211,285,653.79 44,039,789.70 853,327,332.01 401,998,111.48 Other explanations: □Applicable √N/A 36. Derivative financial liabilities □Applicable √N/A 37. Notes payable (1). Notes payable are presented as follows √Applicable □N/A
Unit: RMB Categories December 31, 2020 December 31, 2019
Commercial acceptances 739,925,645.08 103,114,343.36 Bank acceptances 55,358,981,772.30 32,858,408,931.38
Total 56,098,907,417.38 32,961,523,274.74 At the end of current period, the balance of total notes receivable due but not paid was RMB 0. 38. Accounts payable (1). Accounts payable are presented as follows √Applicable □N/A
Unit: RMB Item December 31, 2020 December 31, 2019
Accounts payable for purchase of materials and equipment, etc. 148,948,305,300.60 137,086,140,309.74
Total 148,948,305,300.60 137,086,140,309.74 (2). Significant accounts payable aged more than one year

SAIC MOTOR ANNUAL REPORT 2020
171 / 241
□Applicable √N/A Other explanations □Applicable √N/A 39. Receipts in advance (1). Details of receipts in advance
□Applicable √N/A (2). Significant receipts in advance aged more than one year □Applicable √N/A Other explanations □Applicable √N/A 40. Contract liabilities (1). Contract liabilities are presented as follows √Applicable □N/A
Unit: RMB Item December 31, 2020 January 1, 2020
Payments for vehicles, materials, accessories, etc. received in advance
24,822,830,812.14 14,118,351,975.19
Total 24,822,830,812.14 14,118,351,975.19 (2).The amount and reason for the significant changes in the carrying amount during the reporting period □Applicable √N/A Other explanations □Applicable √N/A 41. Employee benefits payable (1). Employee benefits payable are presented as follows √Applicable □N/A
Unit: RMB Item December 31, 2019 Increase during the
period Decrease during the
period December 31, 2020 I. Short-term benefits 9,853,686,585.98 35,629,569,916.86 34,550,275,344.56 10,932,981,158.28 II. Post-employment benefit - defined contribution plans 247,203,319.33 1,638,060,424.18 1,568,597,129.44 316,666,614.07 III. Termination benefits 278,280,832.14 308,568,112.81 325,257,318.51 261,591,626.44 IV. Other benefits due within one year
Total 10,379,170,737.45 37,576,198,453.85 36,444,129,792.51 11,511,239,398.79 (2). Short-term benefits are presented as follows √Applicable □N/A
Unit: RMB

SAIC MOTOR ANNUAL REPORT 2020
172 / 241
Item December 31, 2019 Increase during the period
Decrease during the period December 31, 2020
I. Payroll, bonus, allowance and subsidies 6,934,785,381.04 31,118,573,182.24 30,253,282,572.24 7,800,075,991.04 II. Staff welfare 2,003,908,144.22 241,929,496.33 174,231,107.19 2,071,606,533.36 III. Social security contributions 117,775,301.04 1,477,575,706.93 1,416,424,960.96 178,926,047.01 IV. Housing funds 40,919,347.68 1,474,925,636.02 1,457,517,780.22 58,327,203.48 V. Trade union fund and employee education fund 437,836,646.59 434,468,237.81 391,752,261.83 480,552,622.57 VI. Short-term paid leaves VII. Short-term profit sharing plan Others 318,461,765.41 882,097,657.53 857,066,662.12 343,492,760.82
Total 9,853,686,585.98 35,629,569,916.86 34,550,275,344.56 10,932,981,158.28 (3). Defined contribution plan is presented as follows
√Applicable □N/A Unit: RMB
Item December 31, 2019 Increase during the period
Decrease during the period December 31, 2020
1. Basic pensions 229,712,618.47 1,532,153,610.02 1,471,430,572.91 290,435,655.58 2. Unemployment insurance 14,835,790.38 82,624,464.82 77,148,109.77 20,312,145.43 3. Enterprise annuity contribution 2,654,910.48 23,282,349.34 20,018,446.76 5,918,813.06
Total 247,203,319.33 1,638,060,424.18 1,568,597,129.44 316,666,614.07 Other explanations: □Applicable √N/A 42. Taxes payable √Applicable □N/A
Unit: RMB Item December 31, 2020 January 1, 2020
Value added tax 4,596,445,396.98 3,467,161,611.38 Consumption tax 791,310,185.38 709,246,663.96 Enterprise income tax 5,387,024,863.19 4,914,379,533.79 Individual income tax 192,068,484.12 229,794,105.13 City construction and maintenance tax 181,058,587.96 203,780,197.70
Educational surcharge 224,269,291.66 204,333,481.50 Land use tax 24,089,630.86 23,085,519.35 Others 394,610,083.76 342,648,683.13
Total 11,790,876,523.91 10,094,429,795.94 43. Other payables Presentation by items √Applicable □N/A
Unit: RMB Item December 31, 2020 December 31, 2019
Interest payable 82,815,028.04 104,301,970.97 Dividends payable 2,247,573,969.63 764,365,300.59 Other payables 75,263,824,658.10 75,486,715,774.17

SAIC MOTOR ANNUAL REPORT 2020
173 / 241
Total 77,594,213,655.77 76,355,383,045.73 Other explanations: □Applicable √N/A Interest payable (1). Presentation by categories √Applicable □N/A
Unit: RMB Item December 31, 2020 December 31, 2019
Interest of long-term borrowings for which interest is paid by installments and principal is repaid upon maturity
53,154,835.61 85,642,691.61
Interest of corporate bonds Interest payable on short-term borrowings 29,660,192.43 18,659,279.36
Total 82,815,028.04 104,301,970.97 Significant overdue but unpaid interest: □Applicable √N/A Other explanations: □Applicable √N/A Dividends payable (1). Presentation by categories √Applicable □N/A
Unit: RMB Item December 31, 2020 December 31, 2019
Dividends payable-Dividends payable of subsidiaries due to minority shareholders
2,247,573,969.63 764,365,300.59
Total 2,247,573,969.63 764,365,300.59 Other payables (1). Presentation of other payables by nature
√Applicable □N/A Unit: RMB
Item December 31, 2020 December 31, 2019 Sales commission and discount 59,802,944,582.83 56,036,040,857.04 Dealers' guarantees and deposits 1,189,263,676.20 2,236,896,124.96 Others 14,271,616,399.07 17,213,778,792.17
Total 75,263,824,658.10 75,486,715,774.17 (2). Significant other payables aged more than one year □Applicable √N/A
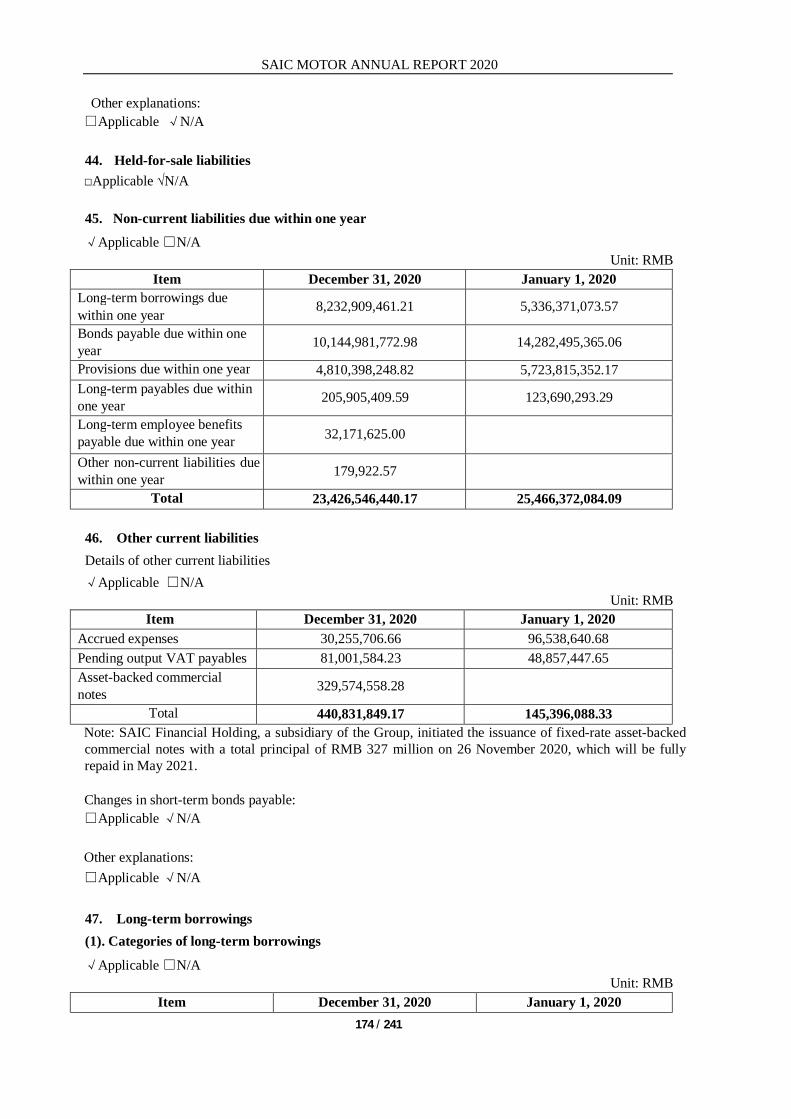
SAIC MOTOR ANNUAL REPORT 2020
174 / 241
Other explanations: □Applicable √N/A 44. Held-for-sale liabilities □Applicable √N/A 45. Non-current liabilities due within one year √Applicable □N/A
Unit: RMB Item December 31, 2020 January 1, 2020
Long-term borrowings due within one year 8,232,909,461.21 5,336,371,073.57
Bonds payable due within one year 10,144,981,772.98 14,282,495,365.06
Provisions due within one year 4,810,398,248.82 5,723,815,352.17 Long-term payables due within one year 205,905,409.59 123,690,293.29
Long-term employee benefits payable due within one year 32,171,625.00
Other non-current liabilities due within one year 179,922.57
Total 23,426,546,440.17 25,466,372,084.09 46. Other current liabilities Details of other current liabilities √Applicable □N/A
Unit: RMB Item December 31, 2020 January 1, 2020
Accrued expenses 30,255,706.66 96,538,640.68 Pending output VAT payables 81,001,584.23 48,857,447.65 Asset-backed commercial notes 329,574,558.28
Total 440,831,849.17 145,396,088.33 Note: SAIC Financial Holding, a subsidiary of the Group, initiated the issuance of fixed-rate asset-backed commercial notes with a total principal of RMB 327 million on 26 November 2020, which will be fully repaid in May 2021. Changes in short-term bonds payable: □Applicable √N/A Other explanations: □Applicable √N/A 47. Long-term borrowings (1). Categories of long-term borrowings
√Applicable □N/A Unit: RMB
Item December 31, 2020 January 1, 2020

SAIC MOTOR ANNUAL REPORT 2020
175 / 241
Secured loans with securities under the custody of lenders 7,511,343.75 1,190,669,524.13
Secured loans with securities under the Group's custody 4,135,856,060.91 3,961,876,825.99
Guaranteed loans 1,262,290,820.82 1,477,853,360.00 Unsecured and non-guaranteed loans 26,435,503,185.47 17,842,937,213.17
Less: Long-term borrowings due within one year 8,232,909,461.21 5,336,371,073.57
Total 23,608,251,949.74 19,136,965,849.72 Explanations on categories of long-term borrowings: Note 1: At the end of current year, the secured loans with securities under the custody of lenders amounting to RMB 7,511,343.75 were obtained with the letter of guarantee amounting to RMB 100,000,000.00 issued by the Bank of East Asia (China) Shanghai Branch as the collateral Note 2: At the end of current year, the guaranteed loans amounting to RMB 1,124,730,000.00 were obtained under the guarantee of Shanghai International Automotive City (Group) Co., Ltd.; and the guaranteed loans amounting to RMB 137,560,820.82 were obtained under the guarantee of Shanghai International Automotive City (Group) Co., Ltd. and Shanghai Anting Industrial Development Co., Ltd. jointly. Note 3: At the end of current year, the secured loans with securities under the Group's custody amounting to RMB 282,460,000.00 were obtained with fixed assets - buildings with net book value of RMB 207,708,932.99, the fixed assets - machinery and equipment with net book value of RMB 217,245,322.05, and land use right with net book value of RMB 53,515,897.35 as the collaterals; the secured loans with securities under the Group's custody amounting to RMB 360,000,000.00 were obtained with fixed assets - buildings with net book value of RMB 296,863,406.33, the fixed assets - machinery and equipment with net book value of RMB 299,306,583.20, and land use right with net book value of RMB 40,588,393.32 as the collateral; the secured loans with securities under the Group's custody amounting to RMB 175,808,478.00 were obtained with construction in progress with the net book value of RMB 306,994,687.70, the fixed assets - machinery and equipment with net book value of RMB 4,784,997.12, and land use right with net book value of RMB 45,161,191.74 as the collaterals; the secured loans with securities under the Group's custody amounting to RMB 98,000,000.00 were obtained with fixed assets - buildings with net book value of RMB 164,965,372.11, and land use right with net book value of RMB 98,034,804.99 as the collateral; the secured loans with securities under the Group's custody amounting to RMB 79,835,310.88 were obtained with fixed assets - buildings with net book value of RMB 101,826,395.75, and land use right with net book value of RMB 928,383,100.69 as the collateral; the secured loans with securities under the Group's custody amounting to RMB 1,186,219,547.15 were obtained with land use right with net book value of RMB 3,287,573,906.30 as the collateral; the secured loans with securities under the Group's custody amounting to RMB 1,953,532,724.88 were obtained with fixed assets - buildings with net book value of RMB 685,316,830.53, machinery and equipment with net book value of RMB 625,966,738.16, moulds with net book value of RMB 438,221,201.90, transportation vehicles with net book value of RMB 14,966,370.39, electronic equipment, fixtures and furniture with net book value of RMB 60,163,110.20, construction in progress with net book value of RMB 118,689,831.79, intangible assets - land use right with net book value of RMB 276,547,945.46, and intangible assets – non-patented technology with net book value of RMB 351,353,022.17 as the collateral. Other explanations, including interest rate range: □Applicable √N/A 48. Bonds payable (1). Bonds payable
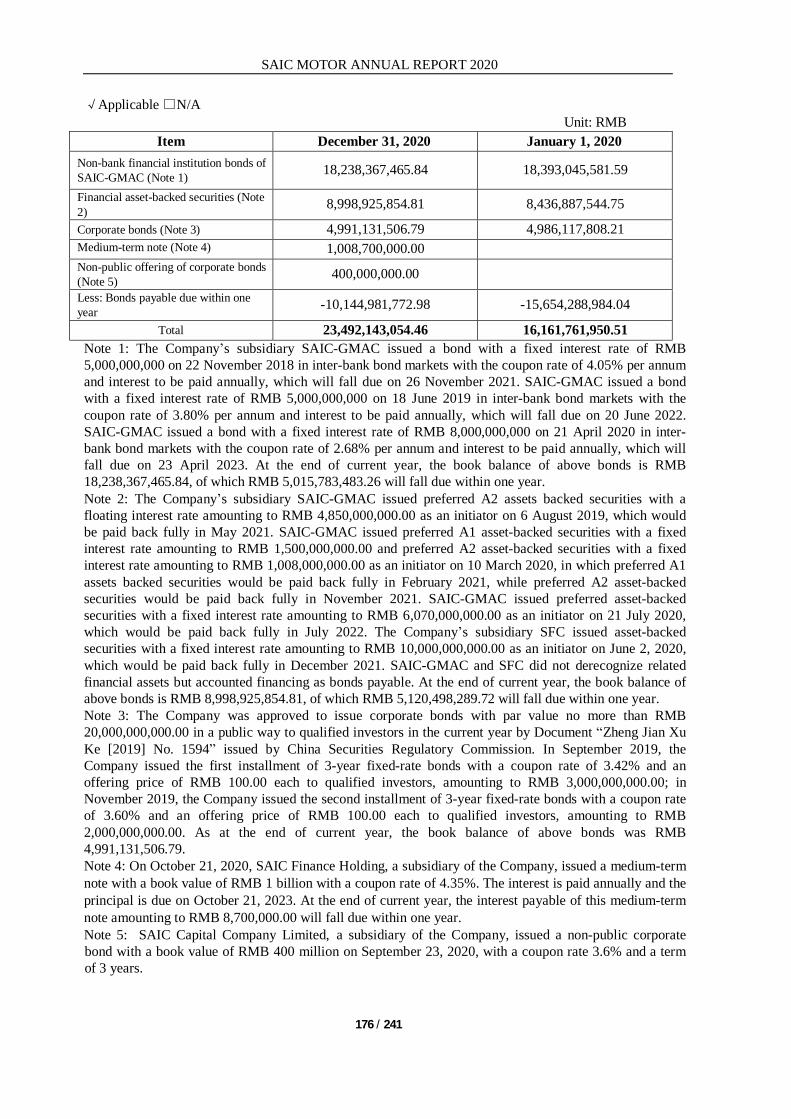
SAIC MOTOR ANNUAL REPORT 2020
176 / 241
√Applicable □N/A Unit: RMB
Item December 31, 2020 January 1, 2020 Non-bank financial institution bonds of SAIC-GMAC (Note 1) 18,238,367,465.84 18,393,045,581.59
Financial asset-backed securities (Note 2) 8,998,925,854.81 8,436,887,544.75
Corporate bonds (Note 3) 4,991,131,506.79 4,986,117,808.21 Medium-term note (Note 4) 1,008,700,000.00 Non-public offering of corporate bonds (Note 5) 400,000,000.00 Less: Bonds payable due within one year -10,144,981,772.98 -15,654,288,984.04
Total 23,492,143,054.46 16,161,761,950.51 Note 1: The Company’s subsidiary SAIC-GMAC issued a bond with a fixed interest rate of RMB 5,000,000,000 on 22 November 2018 in inter-bank bond markets with the coupon rate of 4.05% per annum and interest to be paid annually, which will fall due on 26 November 2021. SAIC-GMAC issued a bond with a fixed interest rate of RMB 5,000,000,000 on 18 June 2019 in inter-bank bond markets with the coupon rate of 3.80% per annum and interest to be paid annually, which will fall due on 20 June 2022. SAIC-GMAC issued a bond with a fixed interest rate of RMB 8,000,000,000 on 21 April 2020 in inter-bank bond markets with the coupon rate of 2.68% per annum and interest to be paid annually, which will fall due on 23 April 2023. At the end of current year, the book balance of above bonds is RMB 18,238,367,465.84, of which RMB 5,015,783,483.26 will fall due within one year. Note 2: The Company’s subsidiary SAIC-GMAC issued preferred A2 assets backed securities with a floating interest rate amounting to RMB 4,850,000,000.00 as an initiator on 6 August 2019, which would be paid back fully in May 2021. SAIC-GMAC issued preferred A1 asset-backed securities with a fixed interest rate amounting to RMB 1,500,000,000.00 and preferred A2 asset-backed securities with a fixed interest rate amounting to RMB 1,008,000,000.00 as an initiator on 10 March 2020, in which preferred A1 assets backed securities would be paid back fully in February 2021, while preferred A2 asset-backed securities would be paid back fully in November 2021. SAIC-GMAC issued preferred asset-backed securities with a fixed interest rate amounting to RMB 6,070,000,000.00 as an initiator on 21 July 2020, which would be paid back fully in July 2022. The Company’s subsidiary SFC issued asset-backed securities with a fixed interest rate amounting to RMB 10,000,000,000.00 as an initiator on June 2, 2020, which would be paid back fully in December 2021. SAIC-GMAC and SFC did not derecognize related financial assets but accounted financing as bonds payable. At the end of current year, the book balance of above bonds is RMB 8,998,925,854.81, of which RMB 5,120,498,289.72 will fall due within one year. Note 3: The Company was approved to issue corporate bonds with par value no more than RMB 20,000,000,000.00 in a public way to qualified investors in the current year by Document “Zheng Jian Xu Ke [2019] No. 1594” issued by China Securities Regulatory Commission. In September 2019, the Company issued the first installment of 3-year fixed-rate bonds with a coupon rate of 3.42% and an offering price of RMB 100.00 each to qualified investors, amounting to RMB 3,000,000,000.00; in November 2019, the Company issued the second installment of 3-year fixed-rate bonds with a coupon rate of 3.60% and an offering price of RMB 100.00 each to qualified investors, amounting to RMB 2,000,000,000.00. As at the end of current year, the book balance of above bonds was RMB 4,991,131,506.79. Note 4: On October 21, 2020, SAIC Finance Holding, a subsidiary of the Company, issued a medium-term note with a book value of RMB 1 billion with a coupon rate of 4.35%. The interest is paid annually and the principal is due on October 21, 2023. At the end of current year, the interest payable of this medium-term note amounting to RMB 8,700,000.00 will fall due within one year. Note 5: SAIC Capital Company Limited, a subsidiary of the Company, issued a non-public corporate bond with a book value of RMB 400 million on September 23, 2020, with a coupon rate 3.6% and a term of 3 years.

SAIC MOTOR ANNUAL REPORT 2020
177 / 241
(2). Changes in bonds payable (Excluding other financial instruments (preference shares, perpetual bonds and others) classified as financial liabilities) □Applicable √N/A (3). Converting terms and period of convertible corporate bonds □Applicable √N/A (4). Other financial instruments classified as financial liabilities
Basic information for outstanding preference shares, perpetual bonds and other financial instruments at the end of the period □Applicable √N/A Changes in financial instruments including outstanding preference shares and perpetual bonds at the end of the period □Applicable √N/A Basis for classifying other financial instruments to financial liabilities □Applicable √N/A Other explanations: □Applicable √N/A 49. Lease liabilities □Applicable √N/A 50. Long-term payables Presentation by items √Applicable □N/A
Unit: RMB Item December 31, 2020 January 1, 2020
Long-term payables 1,114,540,004.92 988,358,166.02 Special payables 637,517,500.77 702,265,794.35 Less: Long-term payables due within one year -205,905,409.59 -123,690,293.29
Total 1,546,152,096.10 1,566,933,667.08 Other explanations: □Applicable √N/A Long-term payables (1). Presentation of long-term payables by nature □Applicable √N/A Special payables (2). Presentation of special payables by nature
√Applicable □N/A Unit: RMB
Item January 1, 2020 Increase Decrease December 31,

SAIC MOTOR ANNUAL REPORT 2020
178 / 241
2020 Special reward fund 702,265,794.35 66,547,405.00 635,718,389.35
Others 1,799,111.42 1,799,111.42 Total 702,265,794.35 1,799,111.42 66,547,405.00 637,517,500.77
51. Long-term employee benefits payable √Applicable □N/A (1). Statement of long-term employee benefits payable
√Applicable □N/A Unit: RMB
Item December 31, 2020 January 1, 2020 I. Post-employment benefits - net liabilities of defined benefit plans 3,252,998,421.88 3,265,370,719.30
II. Termination benefits 1,634,052,331.99 1,823,373,431.88 III. Other long-term benefits 653,464,012.79 515,564,002.03 Less: Long-term employee benefits payable due within one year -32,171,625.00
Total 5,508,343,141.66 5,604,308,153.21 (2). Movements of defined benefit plans Present value of defined benefit plan obligations: √Applicable □N/A
Unit: RMB Item 2020 2019
I. Opening balance 3,265,370,719.30 3,396,309,239.30 II. Cost of defined benefit plans recognized in profit or loss 288,468,467.51 63,733,193.46
1. Current service cost 181,982,406.68 36,222,683.17 2. Past service cost 3. Gains on curtailments and settlements (Loss is indicated by "-") -9,021,805.42 -87,168,592.93
4. Net value of interests 115,507,866.25 114,679,103.22 III. Cost of defined benefit plans recognized in other comprehensive income
-237,669,378.61 -118,102,878.00
1. Actuarial gains (Loss is indicated by "-") -237,669,378.61 -118,102,878.00
IV. Other movements -63,171,386.32 -76,568,835.46 1. Consideration paid at the time of settlement
2. Benefits paid -63,171,386.32 -76,568,835.46 V. Closing balance 3,252,998,421.88 3,265,370,719.30 Planned asset: □Applicable √N/A
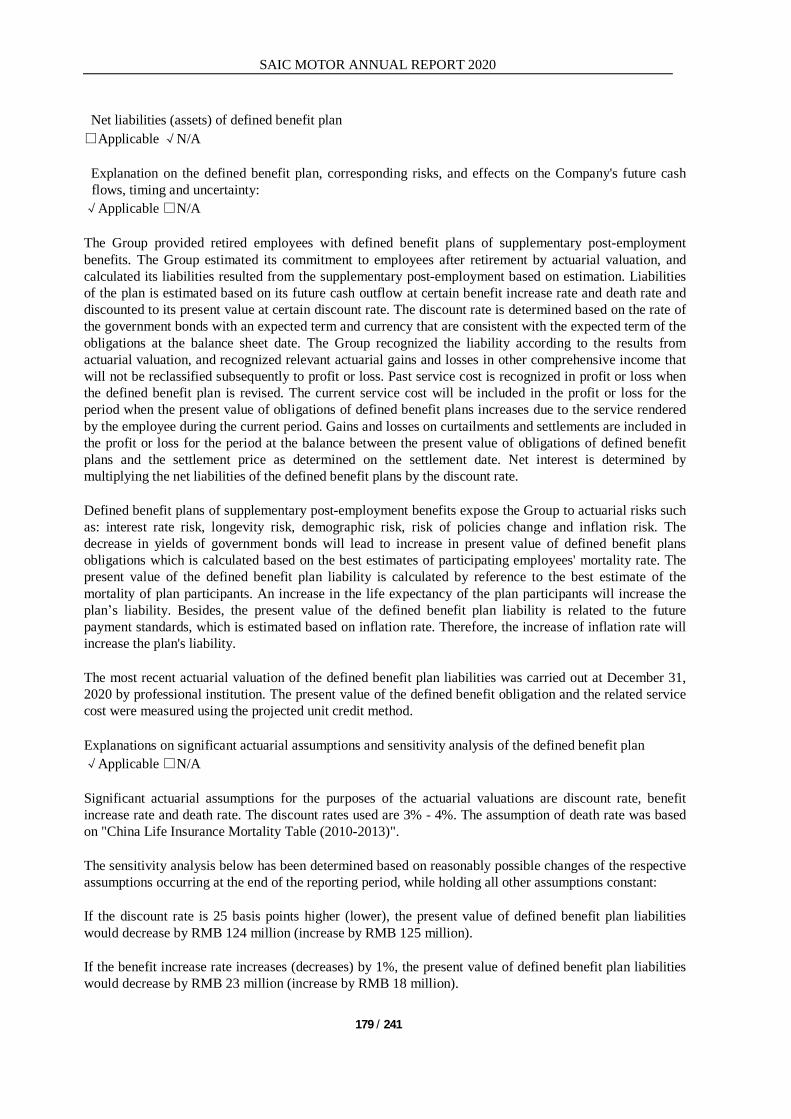
SAIC MOTOR ANNUAL REPORT 2020
179 / 241
Net liabilities (assets) of defined benefit plan □Applicable √N/A Explanation on the defined benefit plan, corresponding risks, and effects on the Company's future cash flows, timing and uncertainty: √Applicable □N/A The Group provided retired employees with defined benefit plans of supplementary post-employment benefits. The Group estimated its commitment to employees after retirement by actuarial valuation, and calculated its liabilities resulted from the supplementary post-employment based on estimation. Liabilities of the plan is estimated based on its future cash outflow at certain benefit increase rate and death rate and discounted to its present value at certain discount rate. The discount rate is determined based on the rate of the government bonds with an expected term and currency that are consistent with the expected term of the obligations at the balance sheet date. The Group recognized the liability according to the results from actuarial valuation, and recognized relevant actuarial gains and losses in other comprehensive income that will not be reclassified subsequently to profit or loss. Past service cost is recognized in profit or loss when the defined benefit plan is revised. The current service cost will be included in the profit or loss for the period when the present value of obligations of defined benefit plans increases due to the service rendered by the employee during the current period. Gains and losses on curtailments and settlements are included in the profit or loss for the period at the balance between the present value of obligations of defined benefit plans and the settlement price as determined on the settlement date. Net interest is determined by multiplying the net liabilities of the defined benefit plans by the discount rate.
Defined benefit plans of supplementary post-employment benefits expose the Group to actuarial risks such as: interest rate risk, longevity risk, demographic risk, risk of policies change and inflation risk. The decrease in yields of government bonds will lead to increase in present value of defined benefit plans obligations which is calculated based on the best estimates of participating employees' mortality rate. The present value of the defined benefit plan liability is calculated by reference to the best estimate of the mortality of plan participants. An increase in the life expectancy of the plan participants will increase the plan’s liability. Besides, the present value of the defined benefit plan liability is related to the future payment standards, which is estimated based on inflation rate. Therefore, the increase of inflation rate will increase the plan's liability. The most recent actuarial valuation of the defined benefit plan liabilities was carried out at December 31, 2020 by professional institution. The present value of the defined benefit obligation and the related service cost were measured using the projected unit credit method. Explanations on significant actuarial assumptions and sensitivity analysis of the defined benefit plan √Applicable □N/A Significant actuarial assumptions for the purposes of the actuarial valuations are discount rate, benefit increase rate and death rate. The discount rates used are 3% - 4%. The assumption of death rate was based on "China Life Insurance Mortality Table (2010-2013)". The sensitivity analysis below has been determined based on reasonably possible changes of the respective assumptions occurring at the end of the reporting period, while holding all other assumptions constant: If the discount rate is 25 basis points higher (lower), the present value of defined benefit plan liabilities would decrease by RMB 124 million (increase by RMB 125 million). If the benefit increase rate increases (decreases) by 1%, the present value of defined benefit plan liabilities would decrease by RMB 23 million (increase by RMB 18 million).
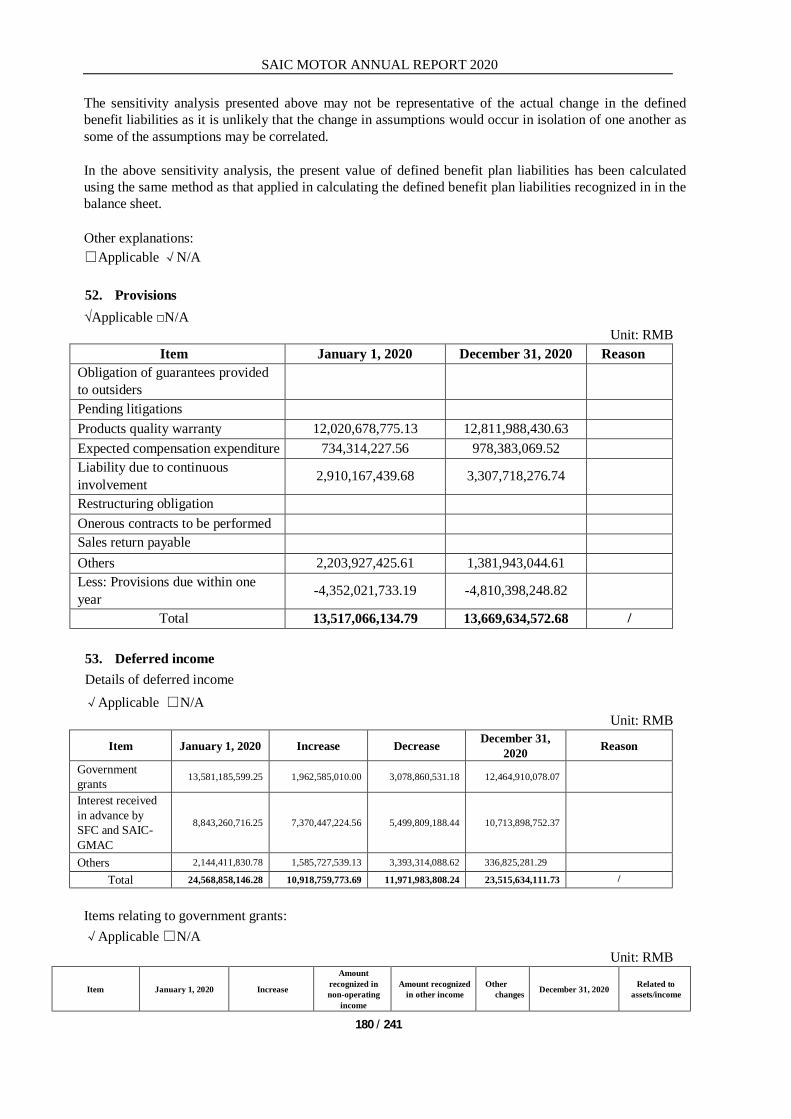
SAIC MOTOR ANNUAL REPORT 2020
180 / 241
The sensitivity analysis presented above may not be representative of the actual change in the defined benefit liabilities as it is unlikely that the change in assumptions would occur in isolation of one another as some of the assumptions may be correlated. In the above sensitivity analysis, the present value of defined benefit plan liabilities has been calculated using the same method as that applied in calculating the defined benefit plan liabilities recognized in in the balance sheet. Other explanations: □Applicable √N/A 52. Provisions √Applicable □N/A
Unit: RMB Item January 1, 2020 December 31, 2020 Reason
Obligation of guarantees provided to outsiders
Pending litigations Products quality warranty 12,020,678,775.13 12,811,988,430.63 Expected compensation expenditure 734,314,227.56 978,383,069.52 Liability due to continuous involvement 2,910,167,439.68 3,307,718,276.74
Restructuring obligation Onerous contracts to be performed Sales return payable Others 2,203,927,425.61 1,381,943,044.61 Less: Provisions due within one year -4,352,021,733.19 -4,810,398,248.82
Total 13,517,066,134.79 13,669,634,572.68 / 53. Deferred income Details of deferred income √Applicable □N/A
Unit: RMB
Item January 1, 2020 Increase Decrease December 31, 2020 Reason
Government grants 13,581,185,599.25 1,962,585,010.00 3,078,860,531.18 12,464,910,078.07
Interest received in advance by SFC and SAIC-GMAC
8,843,260,716.25 7,370,447,224.56 5,499,809,188.44 10,713,898,752.37
Others 2,144,411,830.78 1,585,727,539.13 3,393,314,088.62 336,825,281.29 Total 24,568,858,146.28 10,918,759,773.69 11,971,983,808.24 23,515,634,111.73 /
Items relating to government grants: √Applicable □N/A
Unit: RMB
Item January 1, 2020 Increase Amount
recognized in non-operating
income Amount recognized
in other income Other
changes December 31, 2020 Related to assets/income
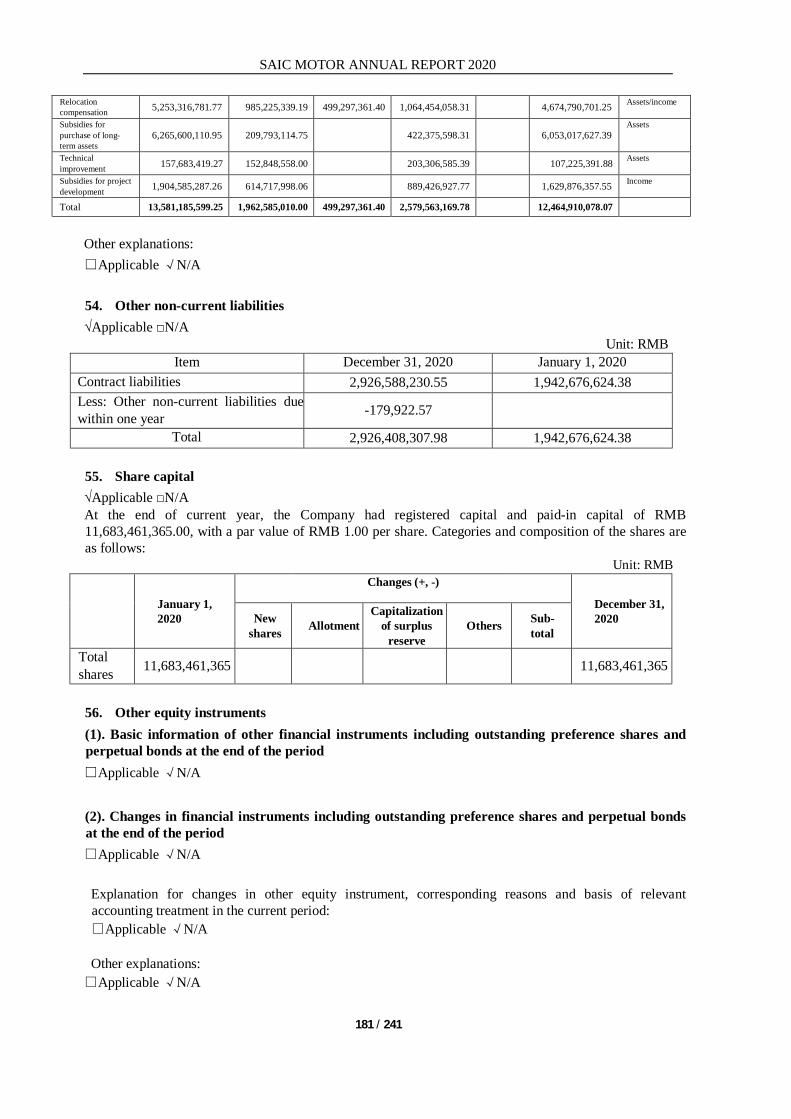
SAIC MOTOR ANNUAL REPORT 2020
181 / 241
Relocation compensation 5,253,316,781.77 985,225,339.19 499,297,361.40 1,064,454,058.31 4,674,790,701.25 Assets/income Subsidies for purchase of long-term assets
6,265,600,110.95 209,793,114.75 422,375,598.31 6,053,017,627.39 Assets
Technical improvement 157,683,419.27 152,848,558.00 203,306,585.39 107,225,391.88 Assets Subsidies for project development 1,904,585,287.26 614,717,998.06 889,426,927.77 1,629,876,357.55 Income
Total 13,581,185,599.25 1,962,585,010.00 499,297,361.40 2,579,563,169.78 12,464,910,078.07 Other explanations: □Applicable √N/A 54. Other non-current liabilities √Applicable □N/A
Unit: RMB Item December 31, 2020 January 1, 2020
Contract liabilities 2,926,588,230.55 1,942,676,624.38 Less: Other non-current liabilities due within one year -179,922.57
Total 2,926,408,307.98 1,942,676,624.38 55. Share capital √Applicable □N/A At the end of current year, the Company had registered capital and paid-in capital of RMB 11,683,461,365.00, with a par value of RMB 1.00 per share. Categories and composition of the shares are as follows:
Unit: RMB
January 1, 2020
Changes (+, -) December 31, 2020 New
shares Allotment Capitalization
of surplus reserve
Others Sub-total
Total shares 11,683,461,365 11,683,461,365
56. Other equity instruments (1). Basic information of other financial instruments including outstanding preference shares and perpetual bonds at the end of the period □Applicable √N/A (2). Changes in financial instruments including outstanding preference shares and perpetual bonds at the end of the period □Applicable √N/A Explanation for changes in other equity instrument, corresponding reasons and basis of relevant accounting treatment in the current period: □Applicable √N/A Other explanations: □Applicable √N/A

SAIC MOTOR ANNUAL REPORT 2020
182 / 241
57. Capital reserve √Applicable □N/A
Unit: RMB
Item January 1, 2020 Increase Decrease December 31, 2020
Capital premium (share premium) 53,907,436,372.76 168,782,765.74 54,076,219,138.50
Other capital reserve 1,659,221,624.11 1,291,629,274.87 2,950,850,898.98
Total 55,566,657,996.87 1,460,412,040.61 57,027,070,037.48 Other explanations, including increase or decrease in the period and related reasons: Note 1: In the other capital reserve, RMB 1,280,628,026.04 was resulted from the increase in capital reserve due to premium contribution made by other shareholders of a subsidiary of Shanghai Saiwei Investment Center (Limited Partnership), a joint venture of the Group. 58. Treasury shares √Applicable □N/A
Unit: RMB
Item January 1, 2020 Increase Decrease December 31, 2020
Repurchases of shares
2,039,625,809.24 2,039,625,809.24
Total 2,039,625,809.24 2,039,625,809.24 Other explanations, including increase or decrease in the period and related reasons: The Company respectively discussed and approved the "Proposal on Repurchases of Shares by Means of Concentrated Competitive Bidding" by the twelfth meeting of the seventh session of the Board of Directors held on 3 July 2020 and the first extraordinary general meeting of 2020 held on July 20, 2020 respectively, and announced the Report on the Repurchase of the Company's Shares by Means of Centralized Competitive Bidding of SAIC Motor Corporation Limited" on July 22, 2020. These repurchased shares are used for the Company's share incentive, the type of repurchased shares is common shares (A share) denominated in RMB, the minimum quantity of repurchased stocks is 58,417,307 shares and the maximum quantity is 116,834,613 shares, the time limit of repurchase is within 6 months since discussion and approval of A share proposal by the general meeting, the price of repurchase shall not exceed RMB 25.97/share (inclusive), and the funds of repurchase are originated from the Company's self-owned funds. For the year ended December 31, 2020, the Company has accumulatively repurchased a total of 100,000,035 shares of the Company, accounting for 0.86% of the total share capital, the highest price is RMB 24.82/share and the lowest price is RMB 17.81/share. Total amounts paid are RMB 2,039,279,074.80 (excluding transaction costs) and the transaction costs amounted to RMB 346,734.44. In addition, as of 19 January 2021, the time limit of this repurchase is expired. The Company repurchased a total of 108,161,920 shares of the Company by means of concentrated competitive bidding, accounting for 0.93% of the total share capital of the Company. 59. Other comprehensive income √Applicable □N/A
Unit: RMB Item January
1, 2020 2020 December 31, 2020
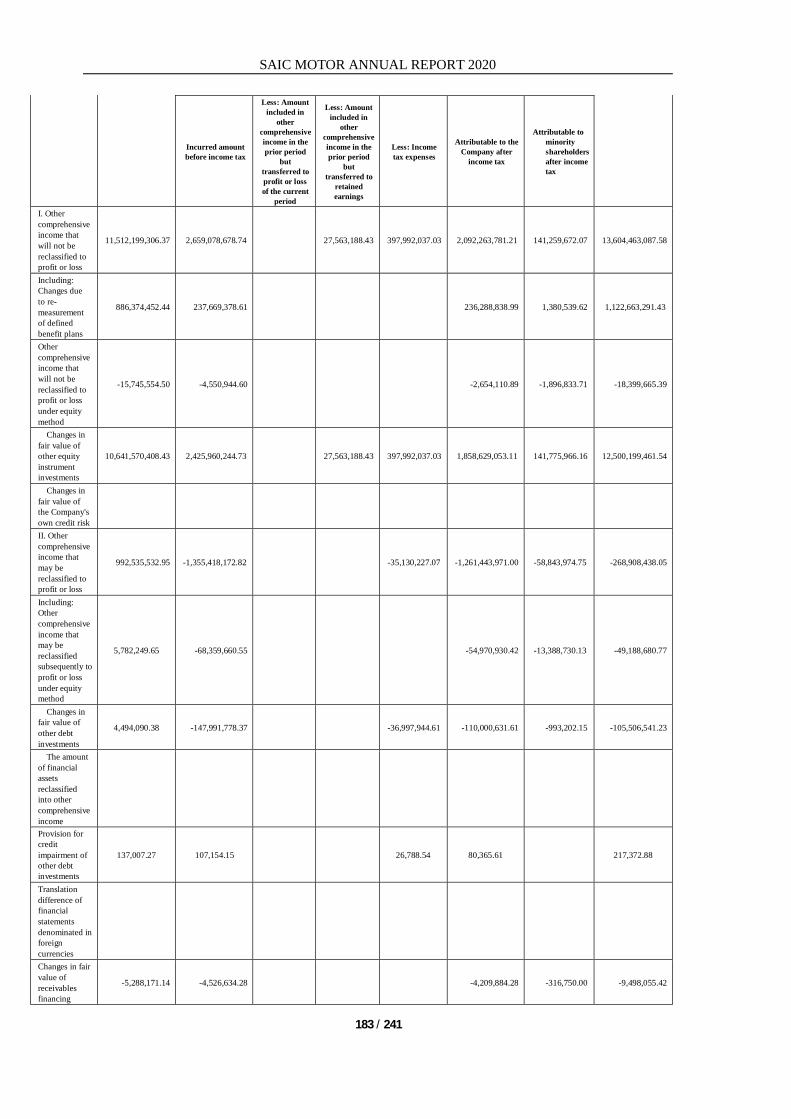
SAIC MOTOR ANNUAL REPORT 2020
183 / 241
Incurred amount before income tax
Less: Amount included in
other comprehensive income in the prior period
but transferred to profit or loss of the current
period
Less: Amount included in
other comprehensive income in the prior period
but transferred to
retained earnings
Less: Income tax expenses
Attributable to the Company after
income tax
Attributable to minority shareholders after income tax
I. Other comprehensive income that will not be reclassified to profit or loss
11,512,199,306.37 2,659,078,678.74 27,563,188.43 397,992,037.03 2,092,263,781.21 141,259,672.07 13,604,463,087.58
Including: Changes due to re-measurement of defined benefit plans
886,374,452.44 237,669,378.61 236,288,838.99 1,380,539.62 1,122,663,291.43
Other comprehensive income that will not be reclassified to profit or loss under equity method
-15,745,554.50 -4,550,944.60 -2,654,110.89 -1,896,833.71 -18,399,665.39
Changes in fair value of other equity instrument investments
10,641,570,408.43 2,425,960,244.73 27,563,188.43 397,992,037.03 1,858,629,053.11 141,775,966.16 12,500,199,461.54
Changes in fair value of the Company's own credit risk
II. Other comprehensive income that may be reclassified to profit or loss
992,535,532.95 -1,355,418,172.82 -35,130,227.07 -1,261,443,971.00 -58,843,974.75 -268,908,438.05
Including: Other comprehensive income that may be reclassified subsequently to profit or loss under equity method
5,782,249.65 -68,359,660.55 -54,970,930.42 -13,388,730.13 -49,188,680.77
Changes in fair value of other debt investments
4,494,090.38 -147,991,778.37 -36,997,944.61 -110,000,631.61 -993,202.15 -105,506,541.23
The amount of financial assets reclassified into other comprehensive income
Provision for credit impairment of other debt investments
137,007.27 107,154.15 26,788.54 80,365.61 217,372.88
Translation difference of financial statements denominated in foreign currencies
Changes in fair value of receivables financing
-5,288,171.14 -4,526,634.28 -4,209,884.28 -316,750.00 -9,498,055.42

SAIC MOTOR ANNUAL REPORT 2020
184 / 241
Other current assets – changes in fair value of interbank depository receipts
28,668,436.98 12,434,838.55 3,108,709.64 9,326,128.91 37,994,565.89
Other non-current assets due within one year – changes in fair value of bonds
45,800.00 11,450.00 34,350.00 34,350.00
Effective portion of profit or loss from cash flow hedges
3,877,385.80 -5,116,922.56 -1,279,230.64 -3,837,691.92 39,693.88
Translation difference of financial statements denominated in foreign currencies
954,864,534.01 -1,142,010,969.76 -1,097,865,677.29 -44,145,292.47 -143,001,143.28
Total 12,504,734,839.32 1,303,660,505.92 27,563,188.43 362,861,809.96 830,819,810.21 82,415,697.32 13,335,554,649.53
60. Special reserve √Applicable □N/A Unit: RMB
Item January 1, 2020 Increase Decrease December 31, 2020 Safety production costs 620,295,956.53 127,480,465.12 24,095,505.57 723,680,916.08
Total 620,295,956.53 127,480,465.12 24,095,505.57 723,680,916.08 61. Surplus reserve √Applicable □N/A
Unit: RMB Item January 1, 2020 Increase Decrease December 31, 2020
Statutory surplus reserve 22,779,030,101.35 22,779,030,101.35
Discretionary surplus reserve 18,064,141,547.16 18,064,141,547.16
Reserve fund Enterprise development fund
Others Total 40,843,171,648.51 40,843,171,648.51
62. Retained earnings √Applicable □N/A
Unit: RMB Item 2020 2019
Balance at the end of prior period before adjustment 125,280,780,539.08 115,097,364,967.32
Adjustment of opening balance of retained earnings (add: +; less: -) -18,806,032.89 -181,598,428.51

SAIC MOTOR ANNUAL REPORT 2020
185 / 241
Balance at the beginning of current period (adjusted) 125,261,974,506.19 114,915,766,538.81
Add: Net profit attributable to the owners of the Company 20,431,037,479.76 25,603,384,202.16
Retained earnings carried forward from other comprehensive income 27,563,188.43 1,170,071.23
Less: Appropriation to statutory surplus reserve
Appropriation to discretionary surplus reserve
Appropriation to general risk reserve Dividends distribution on ordinary shares 10,281,446,001.20 14,721,161,319.90
Conversion of ordinary shares' dividends into share capital
Appropriation to general risk reserve of SFC and SAIC-GMAC 362,717,886.63 304,381,263.28
Appropriation to foreign capital reserve of SFC 4,298,659.31
Appropriation to staff incentive and welfare fund of subsidiaries 86,099,721.43 202,013,899.89
Increase/decrease due to changes in shareholding ratio of the Company in subsidiaries
26,295,193.11 7,685,130.74
Balance at the end of period 134,964,016,372.01 125,280,780,539.08 Details of adjustment of retained earnings at the beginning of the current period: 1. Retained earnings at the beginning of the current period amounting to RMB -18,806,032.89 was affected due to retrospective adjustment based on ASBE and relevant new regulations. 2. Retained earnings at the beginning of the current period amounting to RMB 0 was affected due to changes in accounting policies. 3. Retained earnings at the beginning of the current period amounting to RMB 0 was affected due to corrections of significant accounting errors. 4. Retained earnings at the beginning of the current period amounting to RMB 0 was affected due to changes in consolidation scope of business combination involving enterprises under common control. 5. Retained earnings at the beginning of the current period amounting to RMB 0 was affected due to other adjustments. Retained earnings carried forward from other comprehensive income: The Group's subsidiaries disposed of a portion of their investments in other equity instruments during the year and the cumulative change in fair value included in other comprehensive income was carried forward to retained earnings. Dividends payable on ordinary shares: Prior year’s cash dividends approved at general meeting of shareholders Pursuant to resolution made at 2019 annual general meeting of shareholders on 11 June 2020, the Company distributed cash dividends of RMB 8.80 (tax included) per 10 shares, amounting to RMB 10,281,446,001.20 based on total 11,683,461,365 shares. Increase/decrease due to changes in shareholding ratio in subsidiaries during the current year: It is due to acquisition of minority interests of its subsidiary (Yanfeng International Automotive Technology Co., Ltd.) by Yanfeng Automotive Trim Systems Co., Ltd. (hereinafter referred to as
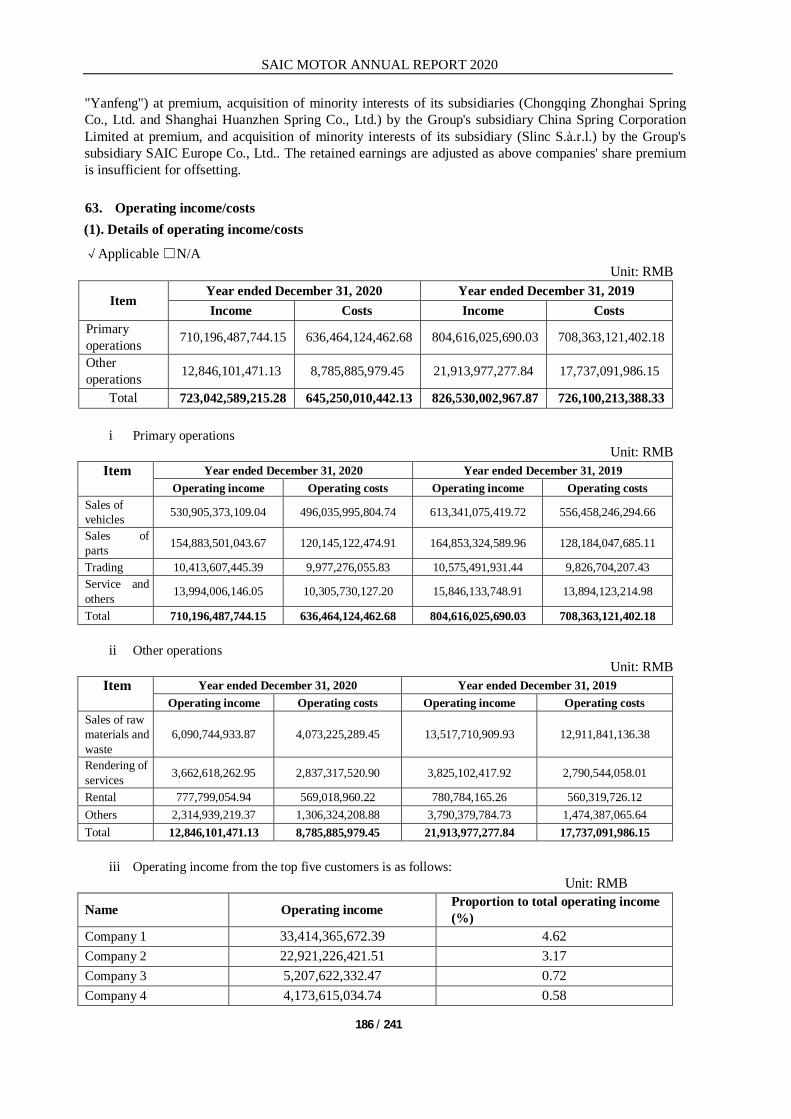
SAIC MOTOR ANNUAL REPORT 2020
186 / 241
"Yanfeng") at premium, acquisition of minority interests of its subsidiaries (Chongqing Zhonghai Spring Co., Ltd. and Shanghai Huanzhen Spring Co., Ltd.) by the Group's subsidiary China Spring Corporation Limited at premium, and acquisition of minority interests of its subsidiary (Slinc S.à.r.l.) by the Group's subsidiary SAIC Europe Co., Ltd.. The retained earnings are adjusted as above companies' share premium is insufficient for offsetting. 63. Operating income/costs (1). Details of operating income/costs √Applicable □N/A
Unit: RMB
Item Year ended December 31, 2020 Year ended December 31, 2019 Income Costs Income Costs
Primary operations 710,196,487,744.15 636,464,124,462.68 804,616,025,690.03 708,363,121,402.18
Other operations 12,846,101,471.13 8,785,885,979.45 21,913,977,277.84 17,737,091,986.15
Total 723,042,589,215.28 645,250,010,442.13 826,530,002,967.87 726,100,213,388.33
i Primary operations Unit: RMB
Item Year ended December 31, 2020 Year ended December 31, 2019 Operating income Operating costs Operating income Operating costs
Sales of vehicles 530,905,373,109.04 496,035,995,804.74 613,341,075,419.72 556,458,246,294.66 Sales of parts 154,883,501,043.67 120,145,122,474.91 164,853,324,589.96 128,184,047,685.11
Trading 10,413,607,445.39 9,977,276,055.83 10,575,491,931.44 9,826,704,207.43 Service and others 13,994,006,146.05 10,305,730,127.20 15,846,133,748.91 13,894,123,214.98
Total 710,196,487,744.15 636,464,124,462.68 804,616,025,690.03 708,363,121,402.18
ii Other operations Unit: RMB
Item Year ended December 31, 2020 Year ended December 31, 2019 Operating income Operating costs Operating income Operating costs
Sales of raw materials and waste
6,090,744,933.87 4,073,225,289.45 13,517,710,909.93 12,911,841,136.38
Rendering of services 3,662,618,262.95 2,837,317,520.90 3,825,102,417.92 2,790,544,058.01
Rental 777,799,054.94 569,018,960.22 780,784,165.26 560,319,726.12 Others 2,314,939,219.37 1,306,324,208.88 3,790,379,784.73 1,474,387,065.64 Total 12,846,101,471.13 8,785,885,979.45 21,913,977,277.84 17,737,091,986.15
iii Operating income from the top five customers is as follows: Unit: RMB
Name Operating income Proportion to total operating income (%)
Company 1 33,414,365,672.39 4.62 Company 2 22,921,226,421.51 3.17 Company 3 5,207,622,332.47 0.72 Company 4 4,173,615,034.74 0.58

SAIC MOTOR ANNUAL REPORT 2020
187 / 241
Company 5 3,013,481,023.63 0.42 Total 68,730,310,484.74 9.51 (2). Details of income from contracts □Applicable √N/A Explanation of income from contracts: □Applicable √N/A (3). Explanation of performance obligations √Applicable □N/A The Group is mainly engaged in research and development, production and sales of automobiles and parts. For goods sold to customers, the Group recognizes revenue when the control of the goods is transferred, that is, when the goods are delivered to the counterparty's designated location, delivered to the counterparty's designated carrier, or when the sales are completed as otherwise agreed. (4). Explanation of allocation to remaining performance obligations □Applicable √N/A 64. Taxes and levies √Applicable □N/A
Unit: RMB Item Year ended December 31, 2020 Year ended December 31, 2019
Consumption tax 3,383,566,087.87 3,871,844,575.10 City construction and maintenance tax 667,862,139.28 900,723,723.68
Education surcharges 702,639,281.68 765,015,954.09 Property tax 301,783,889.21 325,510,937.85 Land use tax 121,413,940.70 140,563,010.44 Stamp tax 454,979,561.02 489,093,715.09 Others 127,541,365.14 117,142,413.28
Total 5,759,786,264.90 6,609,894,329.53 65. Selling expenses √Applicable □N/A
Unit: RMB
Item Year ended December 31, 2020
Year ended December 31, 2019
Transportation expenses 13,916,063,697.95 14,473,696,203.46
Advertising expenses 10,435,505,680.31 13,441,494,239.10
Others 13,715,292,741.49 29,535,395,774.28
Total 38,066,862,119.75 57,450,586,216.84 66. Administrative expenses √Applicable □N/A Unit: RMB
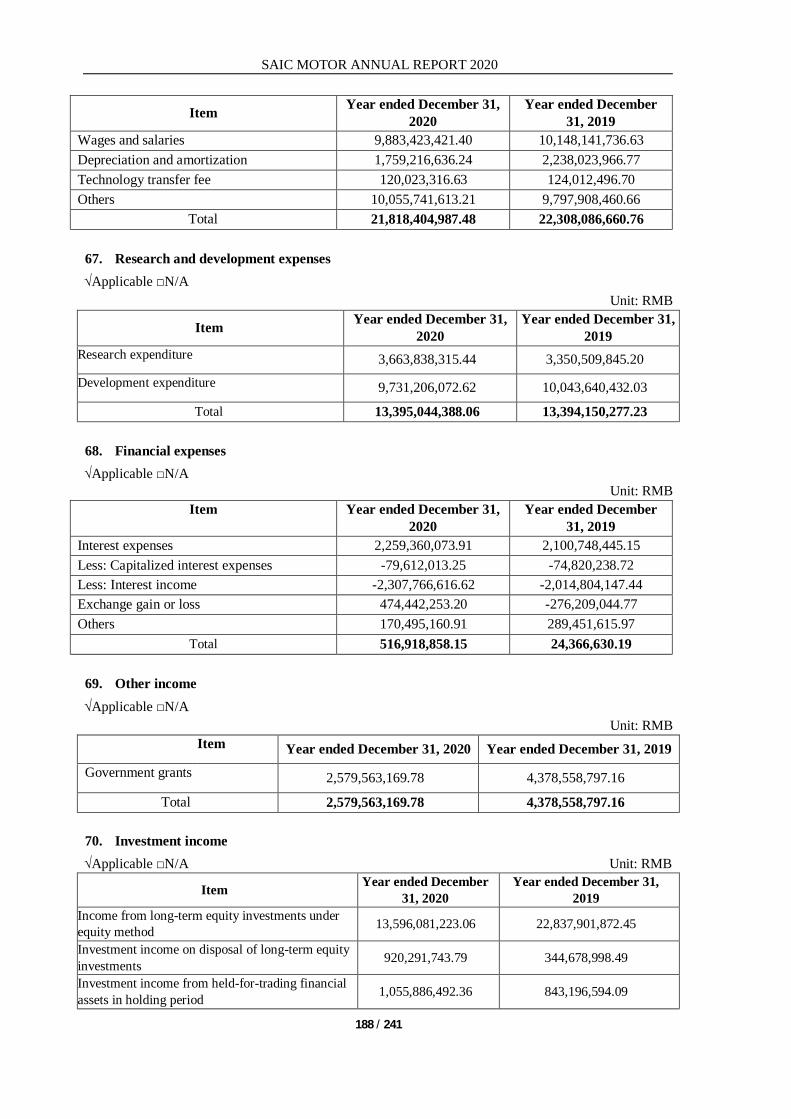
SAIC MOTOR ANNUAL REPORT 2020
188 / 241
Item Year ended December 31, 2020
Year ended December 31, 2019
Wages and salaries 9,883,423,421.40 10,148,141,736.63 Depreciation and amortization 1,759,216,636.24 2,238,023,966.77 Technology transfer fee 120,023,316.63 124,012,496.70 Others 10,055,741,613.21 9,797,908,460.66
Total 21,818,404,987.48 22,308,086,660.76 67. Research and development expenses √Applicable □N/A
Unit: RMB
Item Year ended December 31, 2020
Year ended December 31, 2019
Research expenditure 3,663,838,315.44 3,350,509,845.20 Development expenditure 9,731,206,072.62 10,043,640,432.03
Total 13,395,044,388.06 13,394,150,277.23 68. Financial expenses √Applicable □N/A
Unit: RMB Item Year ended December 31,
2020 Year ended December
31, 2019 Interest expenses 2,259,360,073.91 2,100,748,445.15 Less: Capitalized interest expenses -79,612,013.25 -74,820,238.72 Less: Interest income -2,307,766,616.62 -2,014,804,147.44 Exchange gain or loss 474,442,253.20 -276,209,044.77 Others 170,495,160.91 289,451,615.97
Total 516,918,858.15 24,366,630.19 69. Other income √Applicable □N/A
Unit: RMB Item Year ended December 31, 2020 Year ended December 31, 2019
Government grants 2,579,563,169.78 4,378,558,797.16
Total 2,579,563,169.78 4,378,558,797.16 70. Investment income √Applicable □N/A Unit: RMB
Item Year ended December 31, 2020
Year ended December 31, 2019
Income from long-term equity investments under equity method 13,596,081,223.06 22,837,901,872.45
Investment income on disposal of long-term equity investments 920,291,743.79 344,678,998.49
Investment income from held-for-trading financial assets in holding period 1,055,886,492.36 843,196,594.09

SAIC MOTOR ANNUAL REPORT 2020
189 / 241
Dividend income from other equity instruments investments in holding period 593,488,948.97 486,800,779.51
Interest income from debt investments in holding period
Interest income from other debt investments in holding period 31,093,019.39 5,365,772.55
Investment income from disposal of held-for-trading financial assets
Investment income from disposal of other equity instruments investments
Investment income from disposal of debt investments
Investment income from disposal of other debt investments
Gains from disposal of held-for-trading financial assets 4,460,806,717.96
Gain from business combinations not involving enterprises under common control achieved in stages involving multiple transactions
307,853,661.00 146,659,331.55
Gain from financial assets purchased under resale agreements 174,831,728.01
Others 44,358,831.28 61,382,863.12
Total 21,009,860,637.81 24,900,817,939.77 Other explanations: Note 1: It was mainly resulted from the business combination not involving enterprises under common control of the Group's subsidiary HASCO Motor in 2020. Note 2: Among them, RMB 723,783,454.16 is the investment income from disposal of long-term equity investments in associates; RMB 196,508,289.63 is from disposal of Anji Automobile Rental & Leasing Co., Ltd. by the Group's subsidiary Industry Sales. 71. Net exposure hedging income □Applicable √N/A 72. Gains from changes in fair values √Applicable □N/A
Unit: RMB
Source Year ended December 31, 2020
Year ended December 31, 2019
Held-for-trading financial assets 4,118,614,335.70 1,514,882,730.29 Other non-current financial assets -264,739,525.37 -40,693,859.11 Held-for-trading financial liabilities -42,239,532.21 22,321,220.42
Total 3,811,635,278.12 1,496,510,091.60 73. Impairment losses of credit √Applicable □N/A
Unit: RMB
Item Year ended December 31, 2020
Year ended December 31, 2019

SAIC MOTOR ANNUAL REPORT 2020
190 / 241
Bad debt provision of notes receivable 9,703,064.01 -6,757,269.10 Bad debt provision of accounts receivable -165,338,994.42 -461,976,868.07
Bad debt provision of other receivables -18,255,826.63 -122,837,019.85 Impairment provision of debt investments 729,213.51 -729,213.51
Impairment provision of other debt investments -107,154.15 -182,676.36
Bad debt provision of long-term receivables -172,691,086.40 -363,576,094.40
Impairment loss of loans and advances -900,747,467.88 -1,242,999,222.58 Impairment gains of credit of other non-current assets 130,462,602.75 333,619,150.15
Total -1,116,245,649.21 -1,865,439,213.72 74. Impairment losses of assets √Applicable □N/A Unit: RMB
Item Year ended December 31, 2020 Year ended December 31, 2019
1. Bad debt loss 2. Loss from decline in value of inventories and impairment losses on costs to fulfil a contract
-1,586,594,915.72 -1,259,505,875.01
3. Impairment on long-term equity investments -33,839,741.27
4. Impairment on investment properties -79,023.72
5. Impairment on fixed assets -1,448,654,564.86 -191,332,457.02 6. Impairment on materials for construction of fixed assets
7. Impairment on construction in progress -5,830,718.88 -41,077,052.46
8. Impairment on bearer biological assets
9. Impairment on oil and gas assets 10. Impairment on intangible assets -105,013,695.83 -4,834,573.10 11. Impairment on goodwill -145,214,746.53 12. Others -9,607,315.10
Total -3,189,619,975.38 -1,641,964,704.12 75. Gains from disposal of assets √Applicable □N/A
Unit: RMB Item Year ended December 31, 2020 Year ended December 31, 2019
Gains (losses) from disposal of fixed assets -108,267,389.48 94,345,837.44
Gains (losses) from disposal of construction in progress -2,621,677.86 1,109,441.28
Gains (losses) from disposal of -92,116.00 2,035,814.01
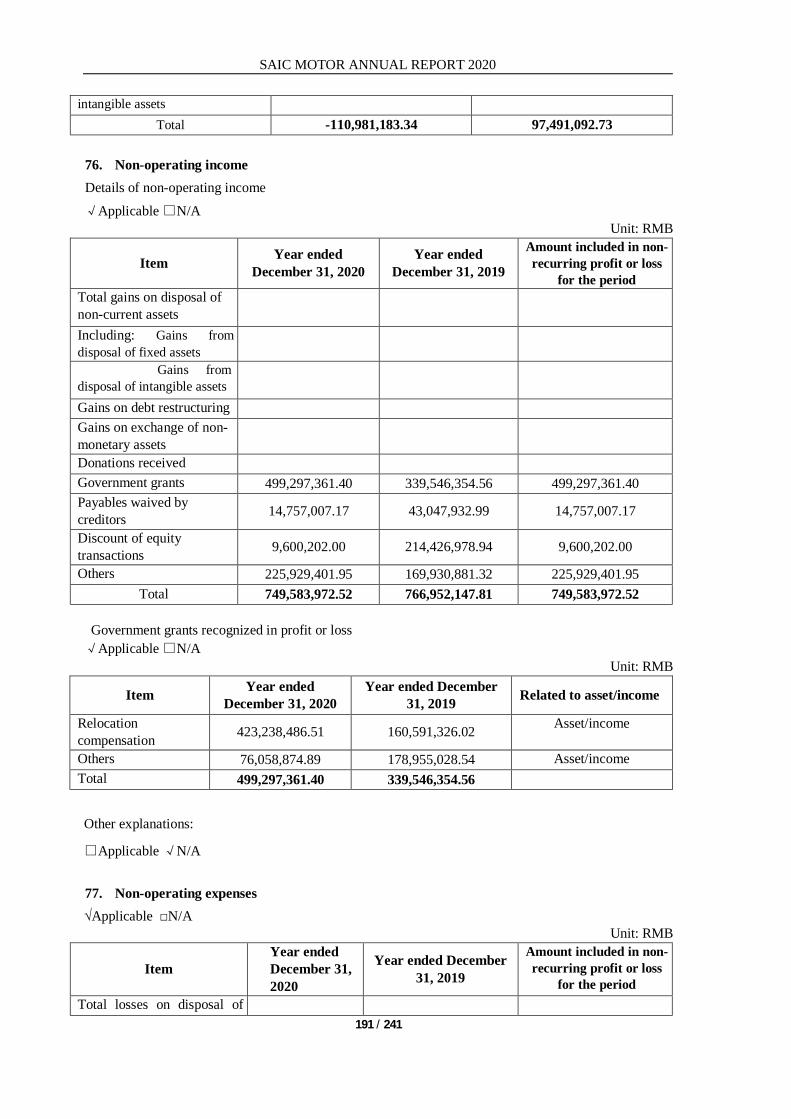
SAIC MOTOR ANNUAL REPORT 2020
191 / 241
intangible assets Total -110,981,183.34 97,491,092.73
76. Non-operating income Details of non-operating income √Applicable □N/A
Unit: RMB
Item Year ended December 31, 2020
Year ended December 31, 2019
Amount included in non-recurring profit or loss
for the period Total gains on disposal of non-current assets
Including: Gains from disposal of fixed assets
Gains from disposal of intangible assets
Gains on debt restructuring Gains on exchange of non-monetary assets
Donations received Government grants 499,297,361.40 339,546,354.56 499,297,361.40 Payables waived by creditors 14,757,007.17 43,047,932.99 14,757,007.17
Discount of equity transactions 9,600,202.00 214,426,978.94 9,600,202.00
Others 225,929,401.95 169,930,881.32 225,929,401.95 Total 749,583,972.52 766,952,147.81 749,583,972.52
Government grants recognized in profit or loss √Applicable □N/A
Unit: RMB
Item Year ended December 31, 2020
Year ended December 31, 2019 Related to asset/income
Relocation compensation 423,238,486.51 160,591,326.02 Asset/income
Others 76,058,874.89 178,955,028.54 Asset/income Total 499,297,361.40 339,546,354.56
Other explanations:
□Applicable √N/A 77. Non-operating expenses √Applicable □N/A
Unit: RMB
Item Year ended December 31, 2020
Year ended December 31, 2019
Amount included in non-recurring profit or loss
for the period Total losses on disposal of

SAIC MOTOR ANNUAL REPORT 2020
192 / 241
non-current assets Including: Losses from disposal of fixed assets
Losses from disposal of intangible assets
Losses on debt restructuring Losses on exchange of non-monetary assets
Donations 15,461,639.77 21,986,387.24 15,461,639.77 Indemnity loss to suppliers 283,299,193.26 72,145,651.58 283,299,193.26 Relocation 93,947,192.09 147,421,427.31 93,947,192.09 Others 72,750,185.69 -87,290,397.54 72,750,185.69
Total 465,458,210.81 154,263,068.59 465,458,210.81 78. Income tax expenses (1). Statement of income tax expenses √Applicable □N/A
Unit: RMB
Item Year ended December 31, 2020
Year ended December 31, 2019
Current income tax expenses 7,232,462,677.80 8,019,821,388.07 Effect of prior year’s income tax annual filing -193,591,446.22 -497,054,673.50
Deferred tax expenses -335,297,425.32 -1,853,881,418.51 Total 6,703,573,806.26 5,668,885,296.06
(2). Adjustment on accounting profit and income tax expenses √Applicable □N/A
Unit: RMB Item Year ended December 31, 2020
Total profit 35,891,624,675.43 Income tax expense calculated based on statutory/applicable tax rate 5,383,743,701.31
Effect of different tax rates of subsidiaries operating in other jurisdictions 2,608,258,849.07
Effect of adjustment on income tax for the periods -193,591,446.22 Effect of non-taxable income -2,426,135,328.58 Effect of non-deductible cost, expense and loss 135,820,910.94 Effect of utilizing deductible loss not recognized for deferred tax assets for prior period -428,926,352.68
Effect of deductible temporary difference or deductible loss not recognized for deferred tax assets for the current period 2,262,155,411.98
Changes in opening balances of deferred tax assets/liabilities resulted from tax rate adjustment
Effect of super tax deduction for research and development expenditures -637,751,939.56
Income tax expenses 6,703,573,806.26 Other explanations:

SAIC MOTOR ANNUAL REPORT 2020
193 / 241
□Applicable √N/A 79. Other comprehensive income √Applicable □N/A Please refer to Note (VII) 59. 80. Items in the cash flow statement (1). Other cash receipts relating to operating activities √Applicable □N/A
Unit: RMB
Item Year ended December 31, 2020
Year ended December 31, 2019
Cash receipts from financial leases and government grants 4,823,480,853.29 8,959,680,772.78
Total 4,823,480,853.29 8,959,680,772.78 (2). Other cash payments relating to operating activities √Applicable □N/A
Unit: RMB
Item Year ended December 31, 2020
Year ended December 31, 2019
Cash payments for operating activities and others 24,030,987,953.03 35,003,843,457.35
Total 24,030,987,953.03 35,003,843,457.35 (3). Other cash receipts relating to investing activities □Applicable √N/A (4). Other cash payments relating to investing activities □Applicable √N/A (5). Other cash receipts relating to financing activities √Applicable □N/A
Unit: RMB Item Year ended December 31, 2020 Year ended December 31, 2019 Cash receipts from recovery of bank draft deposits
350,475,738.36
Total 350,475,738.36 (6). Other cash payments relating to financing activities √Applicable □N/A
Unit: RMB
Item Year ended December 31, 2020
Year ended December 31, 2019
Cash payments for bank draft deposits 5,195,300,478.15

SAIC MOTOR ANNUAL REPORT 2020
194 / 241
Total 5,195,300,478.15 81. Supplementary information to the cash flow statements (1). Supplementary information to the cash flow statements √Applicable □N/A
Unit: RMB
Supplementary information Year ended December 31, 2020
Year ended December 31, 2019
1. Reconciliation of net profit to cash flows from operating activities:
Net profit 29,188,050,869.17 35,288,906,907.63 Add: Provision for impairment loss of assets 3,189,619,975.38 1,641,964,704.12 Impairment losses of credit 1,116,245,649.21 1,865,439,213.72 Depreciation of fixed assets, depletion of oil and gas assets, depreciation of bearer biological assets 12,110,544,349.58 11,456,536,577.21
Depreciation and amortization of investment properties 118,066,321.28 164,335,072.73 Amortization of intangible assets 1,423,140,231.07 1,159,706,116.18 Amortization of long-term deferred expenses 809,855,268.89 693,892,143.51 Losses on disposal of fixed assets, intangible assets and other long-term assets (gains are indicated by "-") 124,560,272.86 -89,101,686.01
Losses on retirement of fixed assets (gains are indicated by "-")
Losses on changes in fair values (gains are indicated by "-") -3,811,635,278.12 -1,496,510,091.60
Financial expenses (gains are indicated by "-") 2,179,748,060.66 2,025,928,206.43 Investment losses (income is indicated by "-") -21,009,860,637.81 -24,900,817,939.77 Decrease in deferred tax assets (increase is indicated by "-") -892,667,179.06 -1,788,821,945.54
Increase in deferred tax liabilities (decrease is indicated by "-") 557,369,753.74 -65,059,472.97
Decrease in inventories (increase is indicated by "-") -17,022,182,650.70 5,783,804,946.39 Net decrease in repurchase arrangements (increase is indicated by "-") 4,960,686,799.58 -12,666,507,248.51
Decrease in operating receivables (increase is indicated by "-") -23,203,104,368.78 4,831,394,760.08
Increase in operating payables (decrease is indicated by "-") 47,679,498,367.24 22,366,762,663.15
Others Net cash flow from operating activities 37,517,935,804.19 46,271,852,926.75 2. Significant investing and financing activities that do not involve cash receipts and payments:
Conversion of debt into capital
Convertible corporate bonds due within one year Fixed assets acquired under finance leases 3. Net changes in cash and cash equivalents: Closing balance of cash 123,847,282,440.56 109,822,737,946.69 Less: Opening balance of cash 109,822,737,946.69 106,217,412,808.88 Add: Closing balance of cash equivalents Less: Opening balance of cash equivalents Net increase in cash and cash equivalents 14,024,544,493.87 3,605,325,137.81
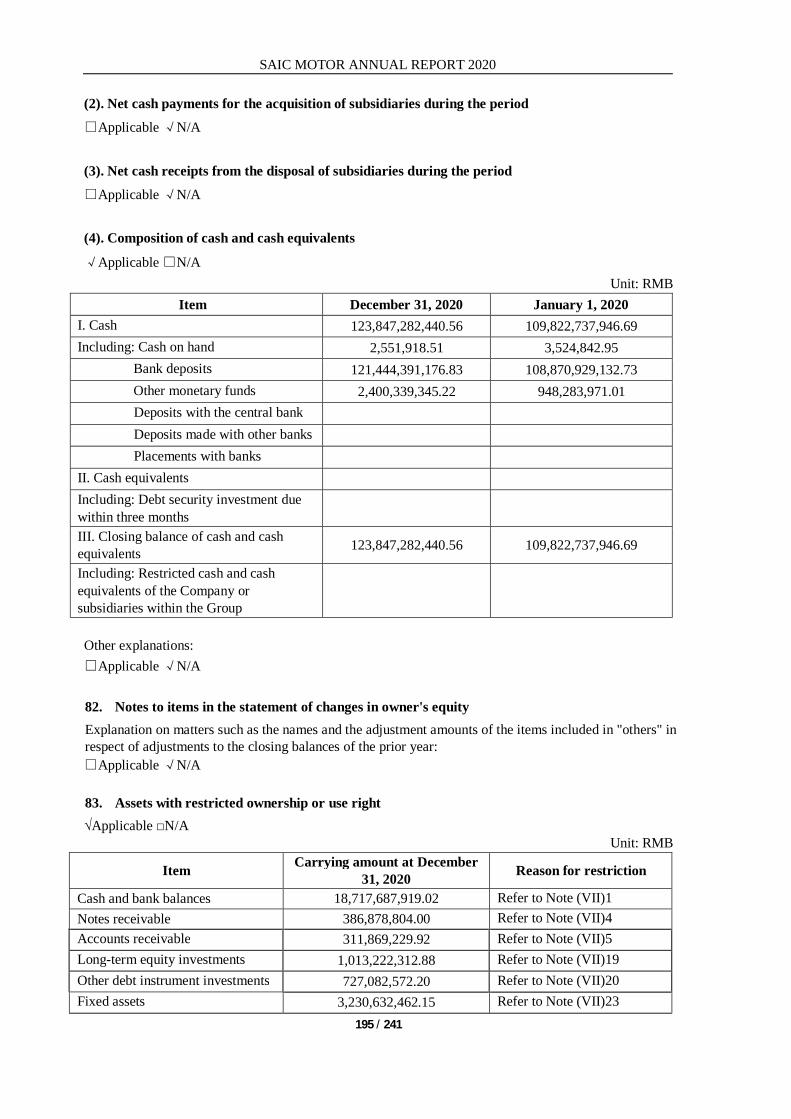
SAIC MOTOR ANNUAL REPORT 2020
195 / 241
(2). Net cash payments for the acquisition of subsidiaries during the period □Applicable √N/A (3). Net cash receipts from the disposal of subsidiaries during the period □Applicable √N/A (4). Composition of cash and cash equivalents
√Applicable □N/A Unit: RMB
Item December 31, 2020 January 1, 2020 I. Cash 123,847,282,440.56 109,822,737,946.69 Including: Cash on hand 2,551,918.51 3,524,842.95
Bank deposits 121,444,391,176.83 108,870,929,132.73 Other monetary funds 2,400,339,345.22 948,283,971.01
Deposits with the central bank Deposits made with other banks Placements with banks II. Cash equivalents Including: Debt security investment due within three months
III. Closing balance of cash and cash equivalents 123,847,282,440.56 109,822,737,946.69
Including: Restricted cash and cash equivalents of the Company or subsidiaries within the Group
Other explanations: □Applicable √N/A 82. Notes to items in the statement of changes in owner's equity Explanation on matters such as the names and the adjustment amounts of the items included in "others" in respect of adjustments to the closing balances of the prior year: □Applicable √N/A 83. Assets with restricted ownership or use right √Applicable □N/A
Unit: RMB
Item Carrying amount at December 31, 2020 Reason for restriction
Cash and bank balances 18,717,687,919.02 Refer to Note (VII)1 Notes receivable 386,878,804.00 Refer to Note (VII)4 Accounts receivable 311,869,229.92 Refer to Note (VII)5 Long-term equity investments 1,013,222,312.88 Refer to Note (VII)19 Other debt instrument investments 727,082,572.20 Refer to Note (VII)20 Fixed assets 3,230,632,462.15 Refer to Note (VII)23

SAIC MOTOR ANNUAL REPORT 2020
196 / 241
Construction in progress 425,684,519.49 Refer to Note (VII)24 Intangible assets 5,130,728,916.51 Refer to Note (VII)28
Total 29,943,786,736.17 / 84. Foreign currency monetary items
(1). Foreign currency monetary items √Applicable □N/A Unit: RMB
Item Closing balance of foreign currency Exchange rate Closing balance of
RMB equivalent Cash and bank balances - -
-USD 1,030,863,304.75 6.5249 6,726,279,977.16 -EUR 325,804,321.46 8.0250 2,614,579,679.72 -HKD 937,590,684.11 0.8416 789,076,319.75 -AUD 210,747,311.40 5.0163 1,057,171,738.18 -THB 4,615,367,434.10 0.2179 1,005,688,563.89 -GBP 83,714,324.33 8.8903 744,245,457.59 -INR 7,507,023,774.00 0.0891 668,875,818.26 -AED 296,092,612.00 1.7761 525,890,088.17 -NOK 442,237,689.00 0.7647 338,179,160.78 -IDR 630,942,244,400.00 0.0005 315,471,122.20 -CLP 17,700,571,559.00 0.0092 162,845,258.34 -HUF 7,333,881,318.18 0.0220 161,345,389.00 -MYR 93,570,922.40 1.6173 151,332,252.80 -Others 947,505,268.75 308,577,671.95
Short-term borrowings -USD 459,754,255.44 6.5249 2,999,850,541.22 -EUR 516,500,000.00 8.0250 4,144,912,500.00 -THB 2,371,800,000.00 0.2179 516,815,200.00
Long-term borrowings -USD 120,000,000.00 6.5249 782,988,000.00 -EUR 100,000,000.00 8.0250 802,500,000.00 -THB 8,965,933,794.09 0.2179 1,953,676,973.73
Other explanations: Note: Most of the transactions of the Group are incurred domestically, and majority of the assets and liabilities are denominated in RMB. Therefore, there were no other significant foreign currency monetary items except for cash and bank balances and borrowings. (2). Explanation on overseas operating entities, including significant overseas operating entities, of
which the major operation place, functional currency and selection basis as well as changes in functional currency should be disclosed
□Applicable √N/A 85. Hedging □Applicable √N/A 86. Government grants (1). Basic information of government grants □Applicable √N/A

SAIC MOTOR ANNUAL REPORT 2020
197 / 241
(2). Return of government grants □Applicable √N/A Other explanations: (1) Government grants related to assets
Unit: RMB
Item Year ended December 31, 2020
Year ended December 31, 2019
Relocation compensation 105,263,020.27 417,938,604.59 Subsidies for purchase of long-term assets 282,950,599.24 1,064,659,682.80
Technical improvement 178,190,659.72 377,246,603.41 Total 566,404,279.23 1,859,844,890.80 (2) Government grants related to income
Unit: RMB
Item Year ended December 31, 2020
Year ended December 31, 2019
Project development grants 405,594,252.69 549,157,766.39 Financial subsidies 717,812,932.89 1,732,093,851.33 Others 187,912,825.19 131,065,176.73 Total 1,311,320,010.77 2,412,316,794.45 (3) Government grants recognized in profit or loss and deferred income
Unit: RMB
Item Year ended December 31, 2020
Year ended December 31, 2019
Government grants recognized in deferred income 886,837,069.79 2,379,729,557.49
Increase in deferred income due to changes in the scope of consolidation 84,860,720.00
Deferred income amortized in the current year 2,087,973,310.97 2,825,673,023.96
Government grants immediately recognized in profit or loss for the period
990,887,220.21 1,892,432,127.76
(4) Government grants recognized in non-operating income
Unit: RMB
Item Year ended December 31, 2020
Year ended December 31, 2019 Related to assets/income
Relocation compensation 423,238,486.51 160,591,326.02 Asset/income
Others 76,058,874.89 178,955,028.54 Asset/income Total 499,297,361.40 339,546,354.56 (5) Government grants recognized in other income
Unit: RMB
Item Year ended December 31, 2020
Year ended December 31, 2019 Related to assets/income

SAIC MOTOR ANNUAL REPORT 2020
198 / 241
Relocation compensation 254,387,182.83 1,605,976,376.21 Asset/income
Subsidies for purchase of long-term assets 422,375,598.31 363,776,610.70 Asset
Technical improvement 203,306,585.39 448,827,603.97 Asset
Financial subsidies 717,812,932.89 1,732,093,851.33 Income Subsidies for project development 889,426,927.77 164,250,982.51 Income
Others 92,253,942.59 63,633,372.44 Income Total 2,579,563,169.78 4,378,558,797.16 87. Others □Applicable √N/A VIII. CHANGES IN THE SCOPE OF CONSOLIDATION 1. Business combinations not involving enterprises under common control √Applicable □N/A (1). Business combinations not involving enterprises under common control incurred in the current period √Applicable □N/A
Unit: RMB
Acquiree's name Acquisition cost
Proportion acquired (%)
Income received by the acquiree from
the acquisition date to the end of period
Net profit received by the acquiree
from the acquisition date to the end of period
Nanjing Shendi Welding Technology Co., Ltd. 31,051,710.14 100% 25,020,666.00 -2,994,764.00 Yanfeng Adient Seating Mechanical Components Co., Ltd. (which was renamed as Kaibo Seating Mechanical Components Co., Ltd. on 18 January 2021)
608,883,588.00 50% 4,031,346,109.14 510,637,847.11
Other explanations: Note 1: Nanjing Shendi Welding Technology Co., Ltd. (hereinafter referred to as "Nanjing Shendi Welding") is a wholly-owned subsidiary of Shanghai ROEWE Automotive Service Co., Ltd. (hereinafter referred to as "Shanghai ROEWE"). In this year, the Group's subsidiary Donghua entered into an equity transfer agreement with Shanghai ROEWE to purchase 100.00% equity interest held by Shanghai ROEWE in Nanjing Shendi Welding at a consideration of RMB 31,051,710.14. Donghua has paid all equity transfer considerations so that Nanjing Shendi Welding became Donghua's subsidiary and Donghua has included Nanjing Shendi Welding into the consolidation scope of the consolidated financial statements.
Note 2: Yanfeng Adient Seating Mechanical Components Co., Ltd. (which was renamed as Kaibo Seating Mechanical Components Co., Ltd. on 18 January 2021) was formerly a joint venture with a shareholding ratio of 50.00% held by the Group's subsidiary Yanfeng, for which another 50.00% equity interests were held by Adient Asia Holdings Co., Limited (hereinafter referred to as "Adient Asia"). On 24 June 2020, Yanfeng and Adient Asia entered into the fifth amendments of the Articles of Association of Kaibo Seating Mechanical Components, according to the amended and restated joint venture contract and amendments of the Articles of Association, Yanfeng acquired the majority voting power of the Board of Directors of Kaibo Seating Mechanical Components. Since the effective date of the amendments of the Articles of Association, Yanfeng has had control over Kaibo Seating Mechanical

SAIC MOTOR ANNUAL REPORT 2020
199 / 241
Components and Yanfeng has included Kaibo Seating Mechanical Components and its subsidiary Yanfeng Adient (Changshu) Seating Mechanical Components Co., Ltd. (which was renamed as Kaibo (Changshu) Seating Mechanical Components Co., Ltd. on 25 January 2021) into the consolidation scope of the consolidated financial statements. (2). Combination cost and goodwill √Applicable □N/A
Unit: RMB Cost of combination Nanjing Shendi Welding Kaibo Seating Mechanical
Components --Cash 31,051,710.14 -- Fair value of non-cash assets -- Fair value of debt issued or assumed -- Fair value of issued equity securities -- Fair value of contingent consideration -- Fair value of equity (held prior to the acquisition date ) at the acquisition date 608,883,588.00
-- Others Total cost of combination 31,051,710.14 608,883,588.00 Less: Share of fair value of identifiable net assets acquired 26,399,032.49 618,441,290.00
Amount of goodwill/combination cost less than share of fair value of identifiable net assets
4,652,677.65 -9,557,702.00
(3). Identifiable assets and liabilities of acquiree at the acquisition date √Applicable □N/A
Unit: RMB Nanjing Shendi Welding Kaibo Seating Mechanical Components
Fair value at the acquisition date
Carrying amount at the acquisition date
Fair value at the acquisition date
Carrying amount at the acquisition date
Assets: 69,601,511.86 60,092,193.91 4,142,674,946.00 3,504,945,872.00 Liabilities: 43,202,479.37 44,252,864.76 2,905,792,366.00 2,746,360,097.00 Net assets 26,399,032.49 15,839,329.15 1,236,882,580.00 758,585,775.00 Less: Minority interests
Net assets acquired 26,399,032.49 15,839,329.15 1,236,882,580.00 758,585,775.00
Other explanations: The fair value of the identifiable net assets is determined based on the appraisal report on the purchase date. (4). Gains or losses arising from equity held prior to the acquisition date re-measured at fair value Whether there are any transactions where the business combination is achieved in steps and control is obtained in the reporting period √Applicable □N/A
Unit: RMB
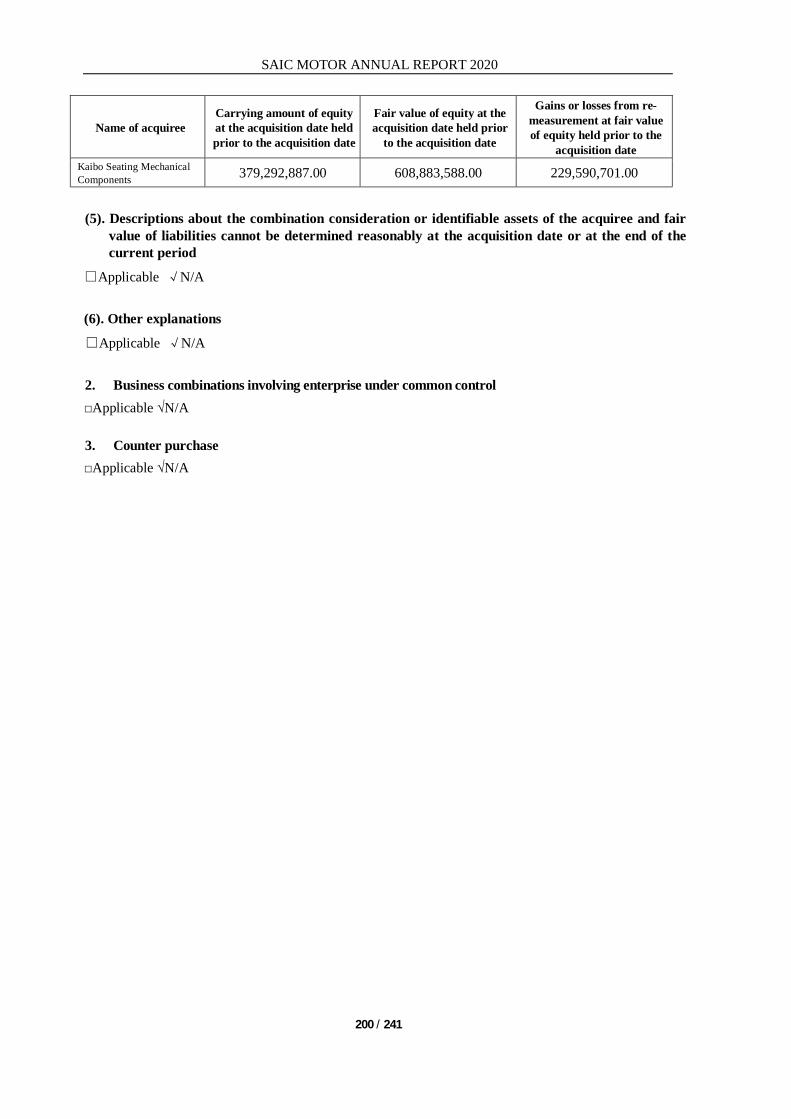
SAIC MOTOR ANNUAL REPORT 2020
200 / 241
Name of acquiree Carrying amount of equity at the acquisition date held prior to the acquisition date
Fair value of equity at the acquisition date held prior
to the acquisition date
Gains or losses from re-measurement at fair value of equity held prior to the
acquisition date Kaibo Seating Mechanical Components 379,292,887.00 608,883,588.00 229,590,701.00
(5). Descriptions about the combination consideration or identifiable assets of the acquiree and fair
value of liabilities cannot be determined reasonably at the acquisition date or at the end of the current period
□Applicable √N/A (6). Other explanations □Applicable √N/A 2. Business combinations involving enterprise under common control □Applicable √N/A 3. Counter purchase □Applicable √N/A

SAIC MOTOR ANNUAL REPORT 2020
4. Disposal of subsidiaries Whether the entity lost control over subsidiaries through a single disposal of the investment in them √Applicable □N/A
Unit: RMB Name of subsidiary Equity disposal method
Anji Car Rental & Leasing Co., Ltd. Sold in cash Other explanations: √Applicable □N/A (1) In this year, the Group's subsidiary Industry Sales sold some equity interests in Anji Car Rental & Leasing Co., Ltd. (hereinafter referred to as "Anji Rental & Leasing") to SAIC's subsidiary Shanghai Saike Mobility Technology Service Co., Ltd. at a consideration in cash of RMB 474,300,000.00 and its shareholding ratio in Anji Rental & Leasing decreased from 90.00% to 45.00% so that it lost control over Anji Rental & Leasing and accounted investments in Anji Rental & Leasing by changing to equity method. Fair values of identifiable net assets of Anji Rental & Leasing at the trading date are determined based on the appraisal report. Industry Sales acquired investment income amounting to RMB 196,508,289.63 in this transaction.
(2) In this year, the common manager of the Group's partnership Shanghai SAIC Zhongyuan Equity Investment Partnership (L.P.) was changed, after the change, Shanghai SAIC Zhongyuan Equity Investment Partnership (L.P.) would no longer be controlled by the Group, so the Group accounted investments in the partnership by changing to equity method. 5. Other reasons for changes in scope of consolidation Explanation on the changes in consolidation scope incurred by other reasons (such as incorporation of new subsidiaries, liquidation of subsidiaries and others) and other related circumstances: √Applicable □N/A
In this year, the Group established subsidiaries including Jiaxing Qijun No. 1 Equity Investment Partnership (Limited Partnership), Shanghai Yuanjie Intelligent Technology Equity Investment Fund Partnership (Limited Partnership), Zhengzhou SAIC Yuzi Energy Technology Co., Ltd. and Shanghai Chemical Industrial Park Anyue Suez Environment Technology Co., Ltd. and included these subsidiaries into consolidation scope of the consolidated financial statements since the inception date.
Other than the transactions above, there were no material changes to the scope of consolidation of consolidated financial statements during the year. 6. Others □Applicable √N/A
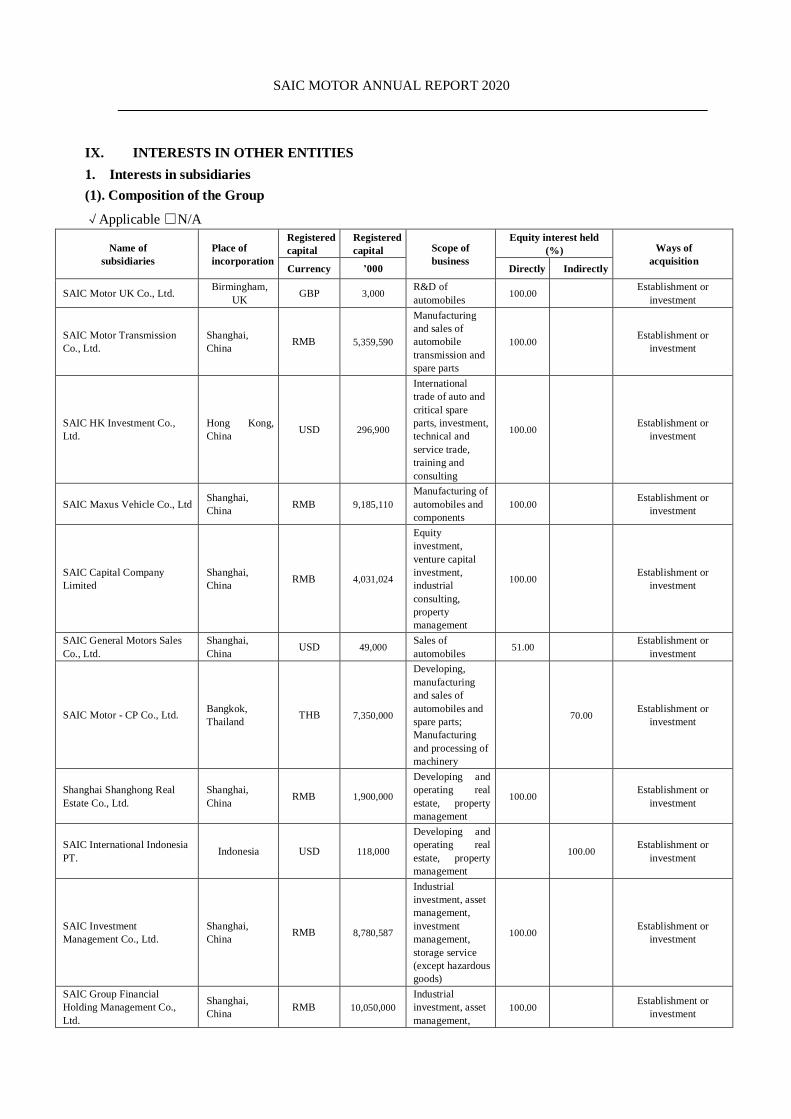
SAIC MOTOR ANNUAL REPORT 2020
IX. INTERESTS IN OTHER ENTITIES 1. Interests in subsidiaries (1). Composition of the Group √Applicable □N/A
Name of subsidiaries
Place of incorporation
Registered capital
Registered capital Scope of
business Equity interest held
(%) Ways of acquisition
Currency ’000 Directly Indirectly
SAIC Motor UK Co., Ltd. Birmingham, UK GBP 3,000 R&D of
automobiles 100.00 Establishment or investment
SAIC Motor Transmission Co., Ltd.
Shanghai, China RMB 5,359,590
Manufacturing and sales of automobile transmission and spare parts
100.00 Establishment or investment
SAIC HK Investment Co., Ltd.
Hong Kong, China USD 296,900
International trade of auto and critical spare parts, investment, technical and service trade, training and consulting
100.00 Establishment or investment
SAIC Maxus Vehicle Co., Ltd Shanghai, China RMB 9,185,110
Manufacturing of automobiles and components
100.00 Establishment or investment
SAIC Capital Company Limited
Shanghai, China RMB 4,031,024
Equity investment, venture capital investment, industrial consulting, property management
100.00 Establishment or investment
SAIC General Motors Sales Co., Ltd.
Shanghai, China USD 49,000 Sales of
automobiles 51.00 Establishment or investment
SAIC Motor - CP Co., Ltd. Bangkok, Thailand THB 7,350,000
Developing, manufacturing and sales of automobiles and spare parts; Manufacturing and processing of machinery
70.00 Establishment or investment
Shanghai Shanghong Real Estate Co., Ltd.
Shanghai, China RMB 1,900,000
Developing and operating real estate, property management
100.00 Establishment or investment
SAIC International Indonesia PT. Indonesia USD 118,000
Developing and operating real estate, property management
100.00 Establishment or investment
SAIC Investment Management Co., Ltd.
Shanghai, China RMB 8,780,587
Industrial investment, asset management, investment management, storage service (except hazardous goods)
100.00 Establishment or investment
SAIC Group Financial Holding Management Co., Ltd.
Shanghai, China RMB 10,050,000
Industrial investment, asset management,
100.00 Establishment or investment

SAIC MOTOR ANNUAL REPORT 2020
203 / 241
investment management, consulting services, and network technology etc.
SAIC Insurance Sales Co., Ltd.
Shanghai, China RMB 200,000
Insurance agent service
100.00 Establishment or investment
SAIC Volkswagen Sales Co., Ltd.
Shanghai, China USD 29,980
Sales of automobiles and spare parts
50.00 10.00 Acquired through
business combinations involving enterprises
under common control
SAIC GM Wuling Co., Ltd. Guangxi, China RMB 1,668,077 Sales and manufacturing of automobiles and spare parts
50.10 Acquired through
business combinations involving enterprises
under common control
China United Automotive System Co., Ltd.
Shanghai, China
RMB
600,620
Manufacturing and sales of electricity-controlled burning oil products
53.00 Acquired through
business combinations involving enterprises
under common control
SAIC Finance Co., Ltd. Shanghai, China
RMB 15,380,000 Automotive
Finance 99.00 1.00 Acquired through
business combinations involving enterprises
under common control
Shanghai Pengpu Machine Building Plant Co., Ltd.
Shanghai, China
RMB
1,030,000
Manufacturing and sale of engineering machinery facilities
100.00 Acquired through
business combinations involving enterprises
under common control
HUAYU Automotive Systems Co., Ltd.
Shanghai, China
RMB 3,152,724
Design, manufacturing and sales of spare parts assembly
58.32 Acquired through
business combinations involving enterprises
under common control
Anji Automotive Logistics Co., Ltd.
Shanghai, China
RMB 600,000
Logistics service for automobiles and spare parts
98.00 2.00 Acquired through
business combinations involving enterprises
under common control
Shanghai Automotive Industry Sales Co., Ltd.
Shanghai, China
RMB 4,124,472
Sales and purchase of automobiles and spare parts
100.00 Acquired through
business combinations involving enterprises
under common control
Shanghai Shangyuan Investment Management Co., Ltd.
Shanghai, China RMB 350,000
Development, operation, leasing, property management and investment management (excluding equity investment management) of industrial workshops and supporting facilities
100.00 Acquired through
business combinations involving enterprises
under common control
China Automotive Industrial Development Co., Ltd. Beijing, China RMB 64,165
Sales and after-sales service of automobiles
100.00 Acquired through
business combinations involving enterprises
under common control
SAIC Motor North America Co., Ltd. USA USD 980
Import and export of spare
100.00 Acquired through
business combinations involving enterprises
under common control
SAIC Motor (Beijing) Co., Ltd. Beijing, China RMB 200,000
Marketing, warehouse and logistics of automobiles
100.00 Acquired through
business combinations involving enterprises
under common control

Shanghai Automobile Asset Management Co., Ltd.
Shanghai, China RMB 915,900
Property management and innovation services, etc.
100.00 Acquired through
business combinations involving enterprises
under common control
Shanghai Hydrogen Propulsion Technology Co., Ltd.
Shanghai, China RMB 580,000
Technical service, technical development, technical consulting
12.00 78.00 Establishment or investment
Donghua Automotive Industrial Co., Ltd. Jiangsu, China RMB 1,083,208
Logistics, import and export, detail services of automobiles
75.00 Acquired through
business combinations involving enterprises
under common control
SAIC Activity Centre Co., Ltd.
Shanghai, China RMB 160,000
Hospitality, beverage and catering services
100.00 Acquired through
business combinations involving enterprises
under common control
Shanghai Automotive News Press Co., Ltd.
Shanghai, China RMB 1,000
Publishing and distribution of Shanghai Auto News
100.00 Acquired through
business combinations involving enterprises
under common control
DIAS Automotive Electronic Systems Co., Ltd.
Shanghai, China RMB 545,465
Research and development production and sales of automobile electronic systems and components
100.00 Acquired through
business combinations involving enterprises
under common control
Shanghai Diesel Engine Co., Ltd. (Note)
Shanghai, China RMB 866,690
Manufacturing and sales of diesel engines and spare parts
48.05
Acquired through business combinations
not involving enterprises under common control
Nanjing Automobile (Group) Corporation Jiangsu, China RMB 7,600,000
Development, manufacturing and sales of automobiles, engines and spare parts
100.00
Acquired through business combinations
not involving enterprises under common control
Shanghai Sunwin Bus Co., Ltd.
Shanghai, China RMB 1,371,160
Development, assembly, manufacture and sales of passenger bus and spare parts
100.00
Acquired through business combinations
not involving enterprises under common control
SAIC-IVECO Hongyan Commercial Vehicle Co., Ltd.
Chongqing, China RMB 3,100,000
Development, manufacture and sales of vehicle and spare parts
56.96 Acquired through
business combinations not involving enterprises under common control
SAIC New Energy Marketing Service (Shenzhen) Co., Ltd.
Shenzhen, China RMB 50,000
Vehicle sales, hardware and electricity components, building materials, sales of electromechanical products, etc.
100.00 Establishment or
investment
SAIC New Energy Vehicle Sales Service (Guangzhou) Co., Ltd.
Guangzhou, China RMB 10,000
Sales and leasing of automobile, wholesale of hardware, building materials, etc.
100.00 Establishment or
investment
Shanghai E-propulsion Auto Technology Co., Ltd.
Shanghai, China RMB 1,450,000
R&D of automobiles
100.00
Acquired through business combinations involving enterprises under common control
Shanghai New Energy Xiamen, China RMB 5,000 Wholesale of auto 100.00 Establishment or

SAIC MOTOR ANNUAL REPORT 2020
205 / 241
Vehicle Sales Service (Xiamen) Co., Ltd.
parts, hardware products, retail of automobiles, etc.
investment
Global Car Sharing and Rental Co., Ltd.
Shanghai, China RMB 1,650,000
Electric vehicle rental, technology development in the automotive and parts technology area
55.14 Establishment or
investment
SAIC International Trade Co., Ltd.
Shanghai, China RMB 3,081,749
Import and export of automobiles and spare parts
100.00 Establishment or investment
Ningbo Meishan Free Trade Port Zone Jie Chuang Equity Investment Partnership (Limited Partnership)
Ningbo, China RMB 70,010
Equity investment and related consulting services
99.99 Establishment or
investment
SAIC (Changzhou) Innovation Development Investment Fund Co., Ltd.
Changzhou, China RMB 2,821,000
Investment management, fund management, industrial investment, venture capital investment, etc.
99.50 Establishment or investment
Shanghai Fanyi Shangxing Technology Co., Ltd.
Shanghai, China RMB 30,000
Technical service, technical development, technical consulting, technical exchange, technical transfer
100.00 Establishment or
investment
MG MOTOR INDIA PROVATE., LTD India INR 32,750,000
Developing, manufacturing and sales of automobiles and spare parts
100.00 Establishment or investment
SAIC Overseas Mobility Technology Co., Ltd.
Shanghai, China RMB 80,000
Computer network science and technology, network technology and communication technology
100.00 Establishment or
investment
Changzhou Qide Equity Investment Fund Center (Limited Partnership) (Hereinafter referred to as "Changzhou Qide")
Jiangsu, China RMB 3,000,000
Trusteeship of private equity fund, investment management, industrial investment and venture capital investment
99.89 0.11
Acquired through business combinations
not involving enterprises under common control
Shanghai Yuanjie Intelligent Technology Equity Investment Fund Partnership (Limited Partnership)
Shanghai, China RMB 7,200,000
Equity investment, industrial investment, investment management, asset management
74.99 Establishment or
investment
Jiaxing Qijun No. 1 Equity Investment Partnership (Limited Partnership)
Shanghai, China RMB 1,001,000
Equity investment and related consulting services
99.70 Establishment or investment
SAIC GM Wuling Indonesia Multi Finance Company (hereinafter referred to as "Multi Finance Indonesia ")
Indonesia IDR 600,000,000 Diversified financial services 62.00 Establishment or
investment
SAIC Shidai Power Battery System Co., Ltd Jiangsu, China RMB 300,000
Development, production and 51.00
Establishment or investment

sales of power battery module and system
SECCO Intelligent Technology (Shanghai) Co., Ltd
Shanghai, China RMB 68,620
Technical development, technical transfer, technical consultation and technical service
100.00 Establishment or investment
Other explanations: Note: The shareholding ratio of the Group in Shanghai Diesel is less than 50%. However, given the fact that other shareholders hold relatively small and dispersed amount of shares, the Group has substantial control over Shanghai Diesel. (2). Significant non-wholly owned subsidiaries √Applicable □N/A
Unit: RMB'000
Name of the subsidiary
Equity interest held by minority
shareholders
Profit or loss attributable to
minority shareholders
during the period
Dividend declared to minority
shareholders during the period
Minority interests at
December 31, 2020
HASCO 41.68% 3,728,436.91 4,002,053.41 26,867,596.98 SGMW 49.90% 353,986.89 3,847,412.47
Explanation on situation that the shareholding proportion of minority shareholders of subsidiaries is different from the proportion of voting rights: □Applicable √N/A
Other explanations: □Applicable √N/A
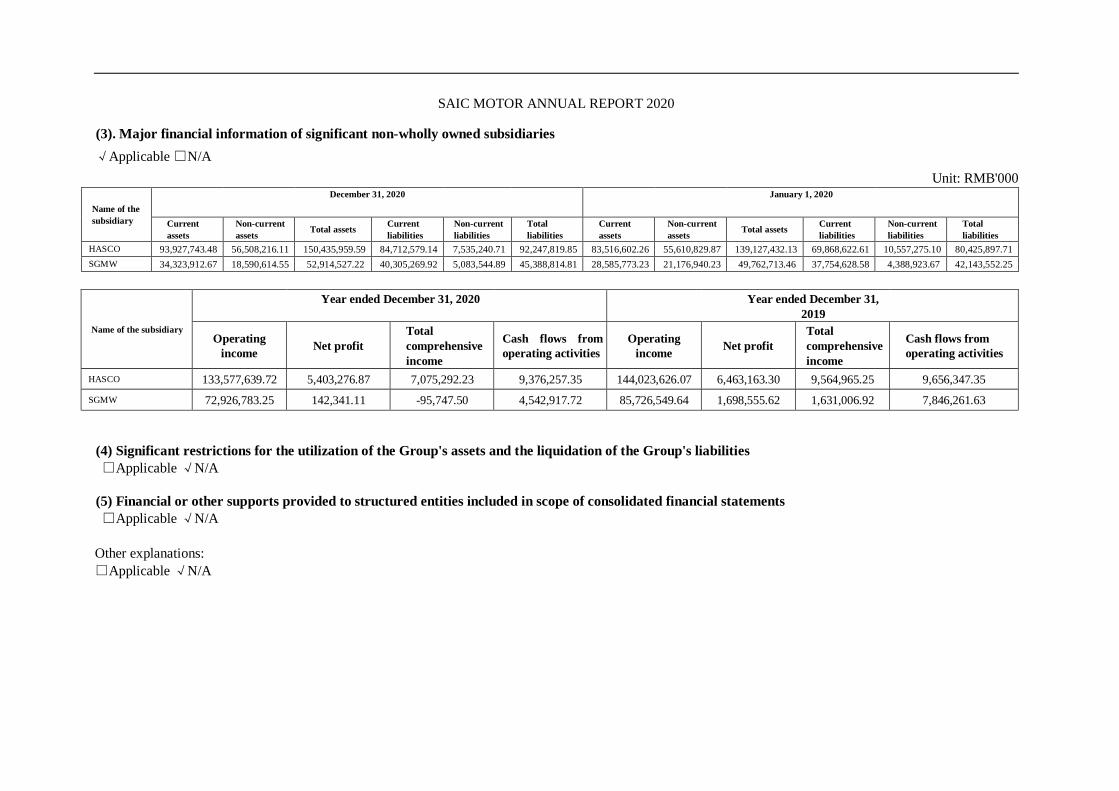
SAIC MOTOR ANNUAL REPORT 2020
(3). Major financial information of significant non-wholly owned subsidiaries √Applicable □N/A
Unit: RMB'000
Name of the subsidiary
December 31, 2020 January 1, 2020
Current assets
Non-current assets Total assets Current
liabilities Non-current liabilities
Total liabilities
Current assets
Non-current assets Total assets Current
liabilities Non-current liabilities
Total liabilities
HASCO 93,927,743.48 56,508,216.11 150,435,959.59 84,712,579.14 7,535,240.71 92,247,819.85 83,516,602.26 55,610,829.87 139,127,432.13 69,868,622.61 10,557,275.10 80,425,897.71 SGMW 34,323,912.67 18,590,614.55 52,914,527.22 40,305,269.92 5,083,544.89 45,388,814.81 28,585,773.23 21,176,940.23 49,762,713.46 37,754,628.58 4,388,923.67 42,143,552.25
Name of the subsidiary
Year ended December 31, 2020 Year ended December 31, 2019
Operating income Net profit
Total comprehensive income
Cash flows from operating activities
Operating income Net profit
Total comprehensive income
Cash flows from operating activities
HASCO 133,577,639.72 5,403,276.87 7,075,292.23 9,376,257.35 144,023,626.07 6,463,163.30 9,564,965.25 9,656,347.35 SGMW 72,926,783.25 142,341.11 -95,747.50 4,542,917.72 85,726,549.64 1,698,555.62 1,631,006.92 7,846,261.63
(4) Significant restrictions for the utilization of the Group's assets and the liquidation of the Group's liabilities □Applicable √N/A
(5) Financial or other supports provided to structured entities included in scope of consolidated financial statements □Applicable √N/A
Other explanations: □Applicable √N/A

SAIC MOTOR ANNUAL REPORT 2020
208 / 241
2.Transactions that cause changes in the Group's equity interest in subsidiaries but do not result in loss of control √Applicable □N/A (1). Explanations on changes in shares of owners' equity interest in subsidiaries
√Applicable □N/A 1) In this year, the Group's subsidiary SAIC Europe Co., Ltd. acquired the minority interests of its subsidiary Slinc S.à.r.l. at a consideration of EUR 5,000,000 in cash so that its shareholding ratio in Slinc S.à.r.l. was increased from 80.00% to 100.00%. 2) Yanfeng International Automotive Technology Co., Ltd. (formerly known as Yanfeng Automotive Trim Systems Co., Ltd., hereinafter referred to as "Yanfeng International") had been a subsidiary of the Group's subsidiary Yanfeng with a shareholding ratio of 70.00%, the remaining shareholding ratio of 30.00% was held by ADIENT INTERIOR HONG KONG LIMITED ("Adient Interior Hong Kong"). In this year, Yanfeng acquired the 30% equity interests of Yanfeng International held by Adient Interior Hong Kong at a consideration of USD 369 million. Upon completion of this transaction, Yanfeng International has become Yanfeng's wholly-owned subsidiary. 3) Shanghai Huanzhen Spring Co., Ltd. (hereinafter referred to as "Shanghai Huanzhen") had been a subsidiary of the Group's subsidiary China Spring Corporation Limited (China Spring) with a shareholding ratio of 51.00%, the remaining shareholding ratio of 49.00% was held by Dudek Bock Spring Manufacturing Co (hereinafter referred to as "Dudek Bock"). In this year, China Spring acquired the 49.00% equity interests of Shanghai Huanzhen held by Dudek Bock at a consideration of USD 1. Upon completion of this transaction, Shanghai Huanzhen has become China Spring's wholly-owned subsidiary. 4) Chongqing Zhonghai Spring Co., Ltd. (hereinafter referred to as "Chongqing Zhonghai") had been a subsidiary of the Group's subsidiary China Spring Corporation Limited (China Spring) with a shareholding ratio of 51.00%, the remaining shareholding ratio of 49.00% was held by a natural person. In this year, China Spring acquired the 49.00% equity interests of Chongqing Zhonghai held by the natural person at a consideration of RMB 20,223,900.00. Upon completion of this transaction, Chongqing Zhonghai has become China Spring's wholly-owned subsidiary. 5) Shanghai Hydrogen Propulsion Technology Co., Ltd. (“Hydrogen Propulsion Technology”) had been a subsidiary of Investment Management’s subsidiary SAIC (Changzhou) Innovation and Development Investment Fund Co., Ltd. (“Changzhou Innovation”) with a shareholding ratio of 83.54%. In this year, Changzhou Innovation, the Company and Shanghai JieJia Technology Advisory Partnership (Limited) which was a minority shareholder of Hydrogen Propulsion Technology made additional capital contributions to Hydrogen Propulsion Technology amounting to RMB 352,400,000.00, RMB 69,600,000.00 and RMB 24,796,249.00 respectively and accordingly the Group's shareholding ratio in Hydrogen Propulsion Technology was increased from 83.54% to 90.00% 6) The Global Car Sharing Rental (Nanjing) Co., Ltd. (hereinafter referred to as "Global Car Sharing Rental (Nanjing)" had been a subsidiary of the Investment Management's subsidiary Global Car Sharing with a shareholding ratio of 49.00% and Donghua with a shareholding ratio of 51.00%. In this year, Global Car Sharing, Donghua and Nanjing Yuejin Automobile Co., Ltd. made additional capital contributions of RMB 58,810,000.00, RMB 81,300,000.00 and RMB 210,000,000.00 respectively in the company, so the Group's shareholding ratio in Global Car Sharing Rental (Nanjing) was decreased from 100.00% to 95.00%.
(2). Effects of transactions on minority interests and owners’ equity attributed to equity holders of the Company

SAIC MOTOR ANNUAL REPORT 2020
209 / 241
□Applicable √N/A 3. Interests in joint ventures and associates √Applicable □N/A (1). Significant joint ventures and associates √Applicable □N/A Unit: RMB
Name of joint venture or associate
Principal place of business
Place of registration
Nature of business
Shareholding ratio (%) Accounting method
Directly Indirectly
SAIC Volkswagen Automotive Co., Ltd. ("SAIC Volkswagen")
Shanghai, China
Manufacturing and sales of automobiles and components
50.00 Equity method
SAIC General Motors Co., Ltd. ("SAIC GM")
Shanghai, China
Manufacturing and sales of automobiles and components
50.00 Equity method
(2). Major financial information of significant joint ventures √Applicable □N/A
Unit: RMB'000 Year ended December 31, 2020 Year ended December 31, 2019
SAIC Volkswagen SAIC GM SAIC
Volkswagen SAIC GM
Current assets 52,184,921.74 36,311,092.70 64,314,619.87 32,358,247.37 Non-current assets 74,474,071.13 68,955,269.85 74,630,085.90 70,381,348.18 Total assets 126,658,992.87 105,266,362.55 138,944,705.77 102,739,595.55 Current liabilities 85,194,158.46 77,855,391.51 91,103,315.58 68,476,463.28 Non-current liabilities 8,714,211.66 2,257,484.27 10,580,210.20 2,306,354.00 Total liabilities 93,908,370.12 80,112,875.78 101,683,525.78 70,782,817.28 Minority interests 5,572,879.39 5,650,942.85 Shareholders' equity attributable to equity holders of the Company 32,750,622.75 19,580,607.38 37,261,179.99 26,305,835.42
Share of net assets calculated based on shareholding ratio 16,375,311.38 9,790,303.69 18,630,590.00 13,152,917.71
Adjusting events 227,973.19 227,973.19 -Goodwill 227,973.19 227,973.19 Carrying amount of equity investment in joint ventures 16,375,311.38 10,018,276.88 18,630,590.00 13,380,890.90
Operating income 174,496,687.22 177,295,418.56 235,950,053.58 187,821,416.83 Net profit attributable to owners of the Company 15,488,529.87 4,103,213.26 20,024,551.90 10,958,324.11
Minority interests 1,828,901.00 2,001,872.67 Other comprehensive income -73,105.73 21,446.02 Total comprehensive income 15,415,424.14 5,932,114.26 20,045,997.92 12,960,196.78
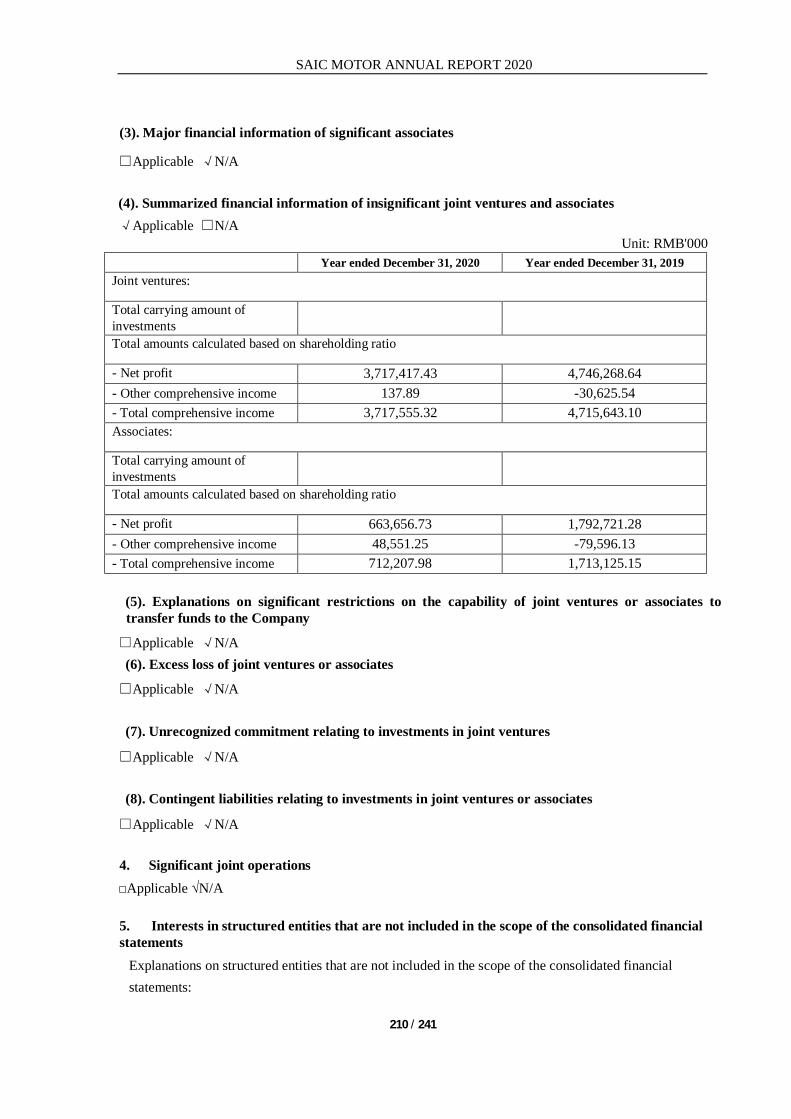
SAIC MOTOR ANNUAL REPORT 2020
210 / 241
(3). Major financial information of significant associates
□Applicable √N/A (4). Summarized financial information of insignificant joint ventures and associates √Applicable □N/A
Unit: RMB'000 Year ended December 31, 2020 Year ended December 31, 2019
Joint ventures:
Total carrying amount of investments
Total amounts calculated based on shareholding ratio
- Net profit 3,717,417.43 4,746,268.64 - Other comprehensive income 137.89 -30,625.54 - Total comprehensive income 3,717,555.32 4,715,643.10 Associates:
Total carrying amount of investments
Total amounts calculated based on shareholding ratio
- Net profit 663,656.73 1,792,721.28 - Other comprehensive income 48,551.25 -79,596.13 - Total comprehensive income 712,207.98 1,713,125.15 (5). Explanations on significant restrictions on the capability of joint ventures or associates to transfer funds to the Company
□Applicable √N/A (6). Excess loss of joint ventures or associates
□Applicable √N/A (7). Unrecognized commitment relating to investments in joint ventures
□Applicable √N/A (8). Contingent liabilities relating to investments in joint ventures or associates
□Applicable √N/A 4. Significant joint operations □Applicable √N/A 5. Interests in structured entities that are not included in the scope of the consolidated financial statements
Explanations on structured entities that are not included in the scope of the consolidated financial statements:
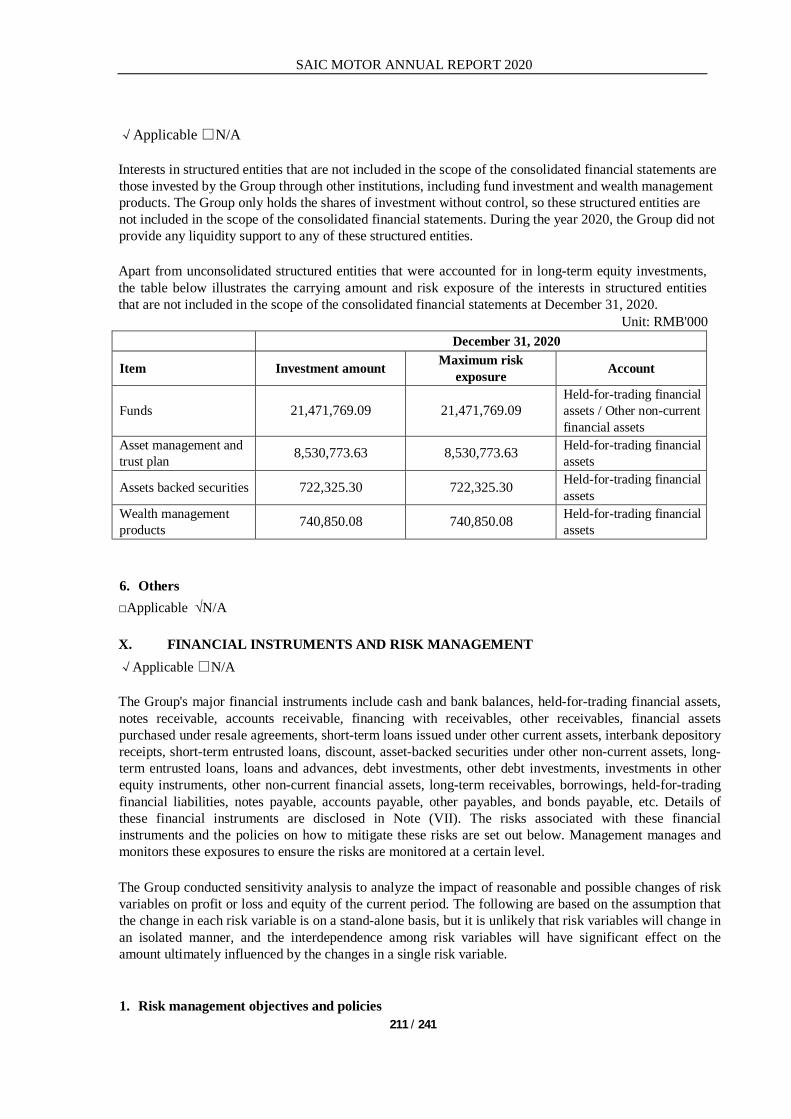
SAIC MOTOR ANNUAL REPORT 2020
211 / 241
√Applicable □N/A Interests in structured entities that are not included in the scope of the consolidated financial statements are those invested by the Group through other institutions, including fund investment and wealth management products. The Group only holds the shares of investment without control, so these structured entities are not included in the scope of the consolidated financial statements. During the year 2020, the Group did not provide any liquidity support to any of these structured entities.
Apart from unconsolidated structured entities that were accounted for in long-term equity investments, the table below illustrates the carrying amount and risk exposure of the interests in structured entities that are not included in the scope of the consolidated financial statements at December 31, 2020.
Unit: RMB'000 December 31, 2020
Item Investment amount Maximum risk exposure Account
Funds 21,471,769.09 21,471,769.09 Held-for-trading financial assets / Other non-current financial assets
Asset management and trust plan 8,530,773.63 8,530,773.63 Held-for-trading financial
assets
Assets backed securities 722,325.30 722,325.30 Held-for-trading financial assets
Wealth management products 740,850.08 740,850.08 Held-for-trading financial
assets 6. Others □Applicable √N/A X. FINANCIAL INSTRUMENTS AND RISK MANAGEMENT √Applicable □N/A
The Group's major financial instruments include cash and bank balances, held-for-trading financial assets, notes receivable, accounts receivable, financing with receivables, other receivables, financial assets purchased under resale agreements, short-term loans issued under other current assets, interbank depository receipts, short-term entrusted loans, discount, asset-backed securities under other non-current assets, long-term entrusted loans, loans and advances, debt investments, other debt investments, investments in other equity instruments, other non-current financial assets, long-term receivables, borrowings, held-for-trading financial liabilities, notes payable, accounts payable, other payables, and bonds payable, etc. Details of these financial instruments are disclosed in Note (VII). The risks associated with these financial instruments and the policies on how to mitigate these risks are set out below. Management manages and monitors these exposures to ensure the risks are monitored at a certain level. The Group conducted sensitivity analysis to analyze the impact of reasonable and possible changes of risk variables on profit or loss and equity of the current period. The following are based on the assumption that the change in each risk variable is on a stand-alone basis, but it is unlikely that risk variables will change in an isolated manner, and the interdependence among risk variables will have significant effect on the amount ultimately influenced by the changes in a single risk variable. 1. Risk management objectives and policies

SAIC MOTOR ANNUAL REPORT 2020
212 / 241
The Group’s risk management objectives are to achieve a proper balance between risks and yield, minimize the adverse impacts of risks on the Group’s operation performance, and maximize the benefits of the shareholders and other stakeholders. Based on these risk management objectives, the Group’s basic risk management strategy is to identify and analyze the Group’s exposure to various risks, establish an appropriate maximum tolerance to risk, implements risk management, and monitors regularly and effectively these exposures to ensure the risks are monitored at a certain level.
1.1 Market risk
1.1.1 Currency risk
Currency risk is the risk that losses will occur because of changes in foreign exchange rates. For the detailed items of currency risk, see Note (VII) 84. The Group is closely monitoring the effects that might have on currency risk due to change in exchange rate.
1.1.2. Interest rate risk
The Group is exposed to cash flow risk because the Group borrows funds at floating interest rates. At the year-end, Group had floating rate borrowings of RMB 12,322,105,510.00. For floating rate borrowings, provided that none of the outstanding liabilities at the balance sheet date is repaid throughout the year, if the interest rates had been 25 base points higher/lower and other variables were held constant, the pre-tax profit would decrease/increase by RMB 30,805,260.00. 1.1.3. Other price risk
The stocks held by the Group that included in held-for-trading financial assets and investments in other equity instruments are measured at fair value at the balance sheet date, exposing the Group to price risk. If the fair value of the stocks held by the Group at the end of the year had increased or decreased by 10% while all other variables remained constant, the shareholders' equity of the Group at the end of the year would have increased or decreased by RMB 2,903,259,770.00 (irrespective of deferred income tax effects).
1.2 Credit risk
As at the end of current year, the Group's maximum exposure to credit risk which will cause a financial loss to the Group due to failure to discharge an obligation by the counterparties and financial guarantees issued by the Group is arising from the carrying amounts of financial assets recognized in the consolidated balance sheet and finance lease receivables, and the amounts of the financial guarantee contracts disclosed in note (XIV). The carrying amount of the Group's financial assets at the balance sheet date represents its maximum credit risk exposure.
In order to minimize the credit risk, the Company and its subsidiaries have specially-assigned persons to take charge of determining credit limits, conducting credit approvals, and implementing other monitoring procedures to ensure that necessary measures are taken to recover past due claims In addition, the Group reviews the recoverable amount of each individual trade debt at each balance sheet date to ensure that adequate impairment losses are made for irrecoverable amounts. In this regard, the management of the Group considers that the Group's credit risk is significantly reduced.
The credit risk on liquid funds is limited because they are deposited with banks with high credit ratings.
Except for the amount of accounts receivable due from certain joint ventures and associates of the Group (refer to Note (VII) 5) and part of other receivables (refer to Note (VII) 8) that is significant, the Group has
SAIC MOTOR ANNUAL REPORT 2020
213 / 241
no significant concentration of credit risk, with exposure spread over a number of counterparties and customers.
1.3 Liquidity risk
In the management of liquidity risk, the management monitors the utilization of bank borrowings and ensures compliance with loan covenants. The Group monitors and maintains a level of cash and cash equivalents deemed adequate by the management to finance the Group’s operations and mitigate the effects of fluctuations of cash flows. 2. Transfer of financial assets 2.1 Assets securitization In the transaction of credit assets securitization, the Group derecognized this kind of financial assets wholly or partly based on the extent of retained risks and rewards of ownership in the transferred financial assets. The following table set forth the details of securitized credit assets of the Group's subsidiaries SAIC Financial Holding, SFC and SAIC-GMAC due to continuous involvement as at the end of current year: RMB 100 million Amount Carrying amount of securitized credit assets transferred before the transfer (Note) 615.31
Carrying amount of assets backed securities recognized by SAIC Financial Holding, SFC and SAIC-GMAC 35.69
Carrying amount of financial assets and liabilities involved continuously recognized by SAIC Financial Holding , SFC and SAIC-GMAC (Note)
33.08
Note: The Group's subsidiaries SAIC Financial Holding, SFC and SAIC GMAC, continued to provide management services for the above transferred securitized credit assets. SAIC Financial Holding, SFC and SAIC GMAC have neither transferred nor retained almost all of the risks and rewards of ownership of the relevant finance lease payments receivable and loan portfolios, and SAIC Financial Holding, SFC and SAIC GMAC had not completely relinquished control over the above credit assets. Therefore, SAIC Financial Holding, SFC and SAIC GM Financial recognized the related financial assets and financial liabilities involved continuously to the extent of their continuous involvement in the transferred credit assets.
In addition, at the end of current year, SAIC-GMAC, SFC and SAIC Financial Holding retained almost all the risks and rewards on the ownership of the transferred credit assets in some credit asset securitization transactions. Therefore, SFC, SAIC-GMAC and SAIC Financial Holding did not derecognize the transferred credit assets but recognized the receipts from the transfer of the related credit assets as bonds payable. At the end of current year, the book balance of these bonds payable amounted to RMB 9,328,500,413.09. 2.2 Sale and repurchase agreement
A sale and repurchase agreement is a transaction in which the Group sells a financial asset and agrees with the counterparty to repurchase such asset (or substantially the same financial asset as it) at a fixed price at a specified future date. As the repurchase price is fixed, the Group remains exposed to almost all credit and market risk and reward associated with the sale of assets. The financial assets sold (which are not available to the Group during the period of the sale and repurchase) are not derecognized in the financial statements,

SAIC MOTOR ANNUAL REPORT 2020
214 / 241
but are treated as collateral for the underlying secured borrowings as the Group retains almost all the risk and reward of those financial assets. In addition, the Group recognizes a financial liability for consideration received. In any such transaction, the counterparty's recourse against the Group is not limited to the transferred financial assets.
As at the end of current year and prior year, the Group entered into bonds sale and repurchase transaction with its counterparties. The consideration received from the transfer of such financial assets was recognized as "funds of financial assets sold under repurchase agreement". In the sale and repurchase transaction, the transferred financial assets that were not derecognized by the Group were all bonds of which the liabilities carried an amount as follows: Unit: RMB Item December 31, 2020 December 31, 2019 Carrying amount of related liabilities 1,203,858,402.96 506,133,790.80
3. Capital management The Group manages its capital by optimizing its structure of liabilities and shareholders’ equity to ensure that the entities within the Group could continue as a going concern and to maximize returns for shareholders. The capital structure of the Group is made up of the Group’s net liabilities and shareholders’ equity. The Group is not restrained to external mandatory requirements of capital management. The Group’s management regularly reviews the capital structure of the Group.
XI. DISCLOSURE OF FAIR VALUE 1. Closing fair value of assets and liabilities measured at fair value √Applicable □N/A
Unit: RMB
Item Fair value at December 31, 2020
Level 1 Level 2 Level 3 Total
I. Measured at fair value on a recurring basis
1. Held-for-trading financial assets 5,671,166,131.70 35,307,072,559.86 13,822,624,554.02 54,800,863,245.58
(I) Financial assets at fair value through profit or loss 5,671,166,131.70 35,307,072,559.86 13,822,624,554.02 54,800,863,245.58
(1) Debt instruments investment 1,855,675,529.88 3,301,305,336.61 6,300,000.00 5,163,280,866.49 (2) Equity instruments investment 3,815,490,601.82 25,198,595,315.16 11,705,007,238.02 40,719,093,155.00
(3) Bank acceptance 6,766,872,179.78 2,111,317,316.00 8,878,189,495.78 (4) Derivative financial assets 40,299,728.31 40,299,728.31 2. Designated as financial assets at fair value through profit or loss
(1) Debt instruments investment
(2) Equity instruments
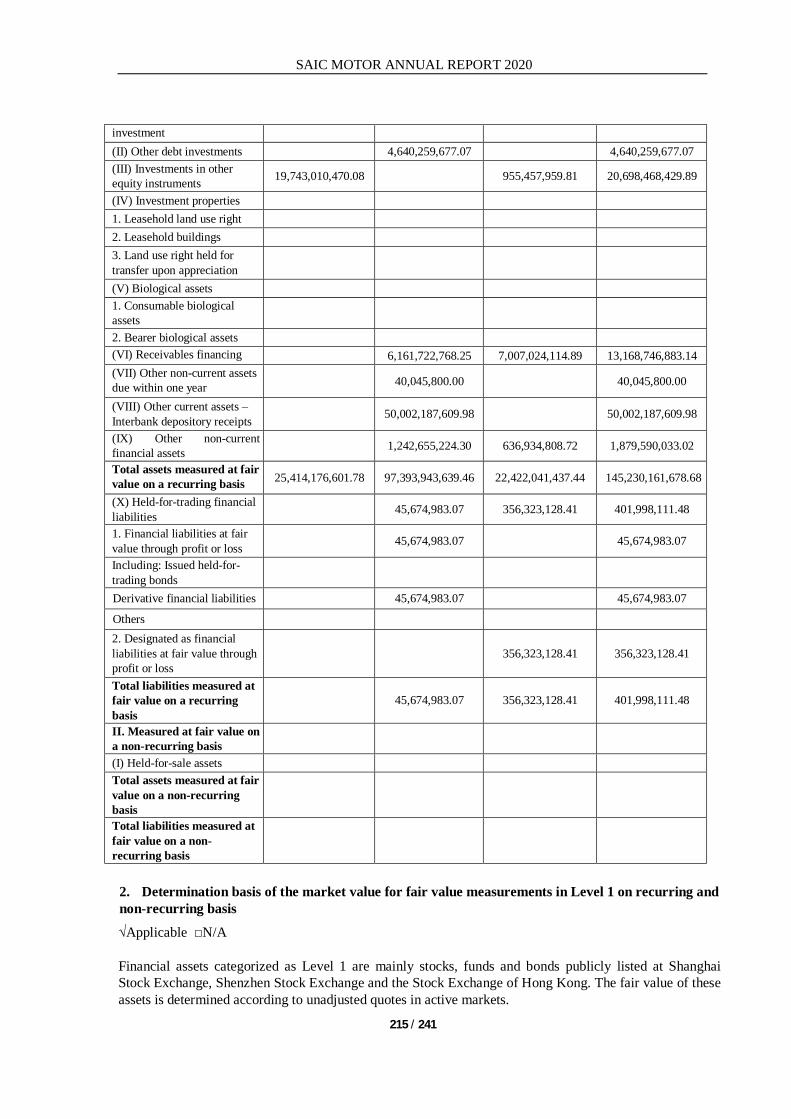
SAIC MOTOR ANNUAL REPORT 2020
215 / 241
investment (II) Other debt investments 4,640,259,677.07 4,640,259,677.07 (III) Investments in other equity instruments 19,743,010,470.08 955,457,959.81 20,698,468,429.89
(IV) Investment properties 1. Leasehold land use right 2. Leasehold buildings 3. Land use right held for transfer upon appreciation
(V) Biological assets 1. Consumable biological assets
2. Bearer biological assets (VI) Receivables financing 6,161,722,768.25 7,007,024,114.89 13,168,746,883.14 (VII) Other non-current assets due within one year 40,045,800.00 40,045,800.00
(VIII) Other current assets – Interbank depository receipts 50,002,187,609.98 50,002,187,609.98
(IX) Other non-current financial assets 1,242,655,224.30 636,934,808.72 1,879,590,033.02 Total assets measured at fair value on a recurring basis 25,414,176,601.78 97,393,943,639.46 22,422,041,437.44 145,230,161,678.68
(X) Held-for-trading financial liabilities 45,674,983.07 356,323,128.41 401,998,111.48
1. Financial liabilities at fair value through profit or loss 45,674,983.07 45,674,983.07
Including: Issued held-for-trading bonds
Derivative financial liabilities 45,674,983.07 45,674,983.07 Others 2. Designated as financial liabilities at fair value through profit or loss
356,323,128.41 356,323,128.41
Total liabilities measured at fair value on a recurring basis
45,674,983.07 356,323,128.41 401,998,111.48
II. Measured at fair value on a non-recurring basis
(I) Held-for-sale assets Total assets measured at fair value on a non-recurring basis
Total liabilities measured at fair value on a non-recurring basis
2. Determination basis of the market value for fair value measurements in Level 1 on recurring and non-recurring basis √Applicable □N/A
Financial assets categorized as Level 1 are mainly stocks, funds and bonds publicly listed at Shanghai Stock Exchange, Shenzhen Stock Exchange and the Stock Exchange of Hong Kong. The fair value of these assets is determined according to unadjusted quotes in active markets.

SAIC MOTOR ANNUAL REPORT 2020
216 / 241
3. Valuation techniques and qualitative and quantitative information of key parameters adopted for Level 2 fair value measurements on recurring and non-recurring basis √Applicable □N/A
Financial assets categorized as Level 2 include bonds, interbank depository receipts, currency swap contracts, assets backed securities, bank acceptances and currency funds traded in the interbank bond market. The fair value of bonds and interbank depository receipts traded in the interbank bond market is determined using valuation prices published by the bond registry custodian at the balance sheet date; the fair value of currency swap contracts is determined from counterparty quotations; the fair value of assets backed securities is determined using discounted cash flow prices based on bond yields; and the fair value of bank acceptances is determined using discounted cash flow prices based on discount rates. The fair value of the currency funds is determined based on the net product value approach, based on the valuation results of the underlying portfolio. Financial liabilities categorized as Level 2 consist primarily of currency swap contracts. 4. Valuation techniques and qualitative and quantitative information of key parameters adopted for Level 3 fair value measurements on recurring and non-recurring basis √Applicable □N/A
Financial assets categorized as Level 3 mainly include unlisted equity (private equity), stock investment under restricted conditions, financial management plan and trust plan. The Group adopts a series of valuation techniques to assess the fair values of Level 3 financial instruments, using valuation models that include unobservable parameters such as discount rates that lack market liquidity. If one or more unobservable parameters are changed based on a reasonable alternative hypothesis, the fair value of these financial instruments will change accordingly. The fair value of stocks under restricted conditions held by the Group is determined under market price discount method according to unadjusted quotes in active market and liquidity discount; the fair value of unlisted equity (private equity) is determined under comparison method according to the price of similar securities and liquidity discount; the fair value of asset management plans, financial management plans and trust plans of investment object with restricted characteristics is determined under net worth method according to valuation result of relevant investment portfolios. The fair value of financial liabilities categorized as Level 3 is determined according to the fair value of financial assets invested by corresponding structured entity and based on the relevant contract terms of such structured entity. 5. Reconciliation between opening and closing carrying amount and sensitivity analysis of unobservable parameters for Level 3 fair value measurements on recurring basis □Applicable √N/A 6. Reasons for the transfers and policies to determine the transfer timing if there are transfers between different fair value levels in respect of fair value measurements on recurring basis □Applicable √N/A 7. Changes in valuation techniques in the current period and the corresponding reasons □Applicable √N/A 8. Fair value of financial assets and liabilities not measured at fair value □Applicable √N/A 9. Others

SAIC MOTOR ANNUAL REPORT 2020
217 / 241
□Applicable √N/A XII. RELATED PARTY RELATIONSHIPS AND TRANSACTIONS 1. Details of the parent of the Company √Applicable □N/A
Unit: RMB
Name of the parent company
Place of incorporation Nature of operations Registered capital
Proportion of the Company's ownership
interest held by the parent
company (%)
Proportion of the Company's voting rights held by the
parent company (%)
SAIC Shanghai, China
Manufacturing, sales, domestic trading (except for those under special regulations) and advisory service of moto vehicles such as automobiles, motorcycles and tractors, and machinery equipment, powertrains and components and parts.
21,599,175,737.24 71.24 71.24
The ultimate controller of the Company is the Shanghai Municipal State-owned Assets Supervision and Administration Commission. 2. Details of the subsidiaries of the Company For the details of subsidiaries of the Company, refer to the notes.
√Applicable □N/A
For the details, refer to Note (IX) 1. 3. Details of joint ventures and associates of the Company For the details of significant joint ventures and associates of the Company, refer to the notes. √Applicable □N/A For the details, refer to Note (VII) 19 and Note (IX) 3. Details of other joint ventures or associates having related party transactions and balances with the Company in the period or in prior periods: □Applicable √N/A Other explanations □Applicable √N/A 4. Details of other related parties √Applicable □N/A
Name of other related parties Relationship with the Group Shanghai Automotive Industry Development Co., Ltd. Subsidiary of SAIC SAIC Property Development Co., Ltd. Subsidiary of SAIC SAIC Sodexo Service Co., Ltd. Subsidiary of SAIC Shanghai Shangkai Real Estate Development Co., Ltd. Subsidiary of SAIC Shanghai Automotive Electronics Factory Subsidiary of SAIC Shanghai Internal Combustion Engine Research Institute Subsidiary of SAIC
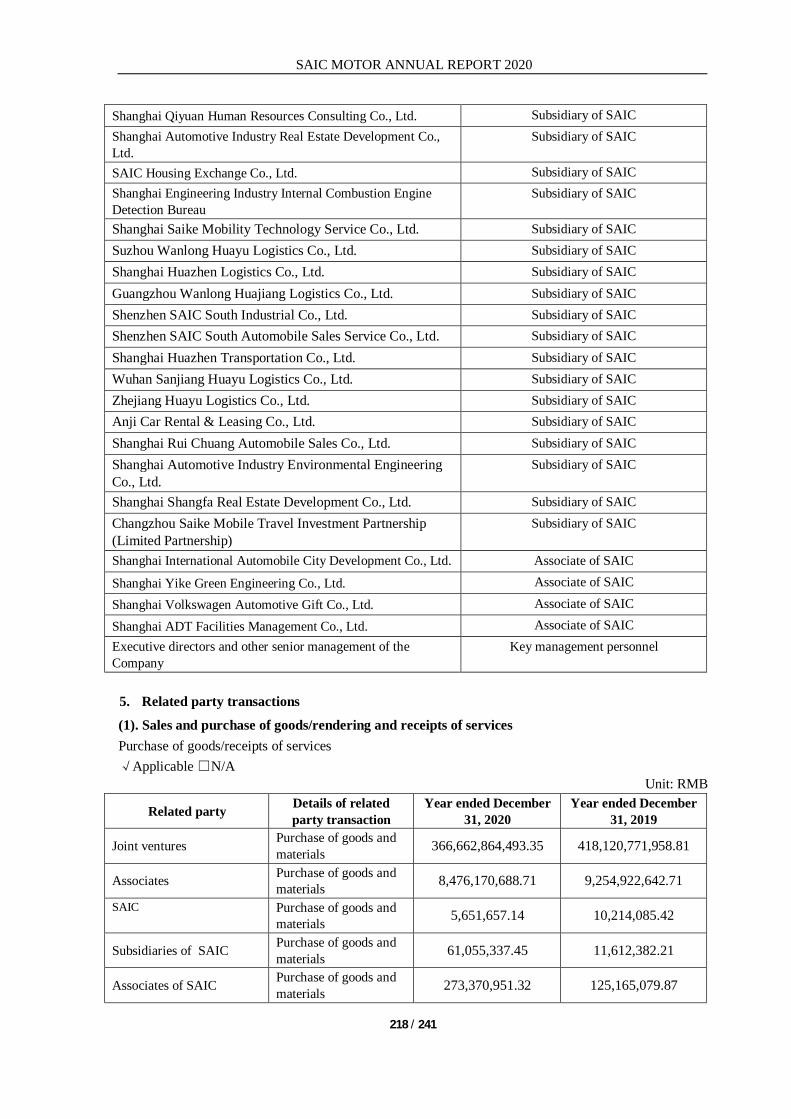
SAIC MOTOR ANNUAL REPORT 2020
218 / 241
Shanghai Qiyuan Human Resources Consulting Co., Ltd. Subsidiary of SAIC Shanghai Automotive Industry Real Estate Development Co., Ltd.
Subsidiary of SAIC
SAIC Housing Exchange Co., Ltd. Subsidiary of SAIC Shanghai Engineering Industry Internal Combustion Engine Detection Bureau
Subsidiary of SAIC
Shanghai Saike Mobility Technology Service Co., Ltd. Subsidiary of SAIC Suzhou Wanlong Huayu Logistics Co., Ltd. Subsidiary of SAIC Shanghai Huazhen Logistics Co., Ltd. Subsidiary of SAIC Guangzhou Wanlong Huajiang Logistics Co., Ltd. Subsidiary of SAIC Shenzhen SAIC South Industrial Co., Ltd. Subsidiary of SAIC Shenzhen SAIC South Automobile Sales Service Co., Ltd. Subsidiary of SAIC Shanghai Huazhen Transportation Co., Ltd. Subsidiary of SAIC Wuhan Sanjiang Huayu Logistics Co., Ltd. Subsidiary of SAIC Zhejiang Huayu Logistics Co., Ltd. Subsidiary of SAIC Anji Car Rental & Leasing Co., Ltd. Subsidiary of SAIC Shanghai Rui Chuang Automobile Sales Co., Ltd. Subsidiary of SAIC Shanghai Automotive Industry Environmental Engineering Co., Ltd.
Subsidiary of SAIC
Shanghai Shangfa Real Estate Development Co., Ltd. Subsidiary of SAIC Changzhou Saike Mobile Travel Investment Partnership (Limited Partnership)
Subsidiary of SAIC
Shanghai International Automobile City Development Co., Ltd. Associate of SAIC Shanghai Yike Green Engineering Co., Ltd. Associate of SAIC Shanghai Volkswagen Automotive Gift Co., Ltd. Associate of SAIC Shanghai ADT Facilities Management Co., Ltd. Associate of SAIC Executive directors and other senior management of the Company
Key management personnel
5. Related party transactions (1). Sales and purchase of goods/rendering and receipts of services Purchase of goods/receipts of services √Applicable □N/A
Unit: RMB
Related party Details of related party transaction
Year ended December 31, 2020
Year ended December 31, 2019
Joint ventures Purchase of goods and materials 366,662,864,493.35 418,120,771,958.81
Associates Purchase of goods and materials 8,476,170,688.71 9,254,922,642.71
SAIC Purchase of goods and materials 5,651,657.14 10,214,085.42
Subsidiaries of SAIC Purchase of goods and materials 61,055,337.45 11,612,382.21
Associates of SAIC Purchase of goods and materials 273,370,951.32 125,165,079.87

SAIC MOTOR ANNUAL REPORT 2020
219 / 241
Joint ventures Purchase of long-term assets 91,293,691.51 276,669,760.46
Associates Purchase of long-term assets 14,917,822.63 279,076.70
Subsidiaries of SAIC Purchase of long-term assets 262,241.38
Associates of SAIC Purchase of long-term assets 4,604,615.12 9,712,070.83
Joint ventures Receipts of services-R&D expenditure 594,005,269.26 736,632,170.67
Associates Receipts of services-R&D expenditure 53,984,950.93 11,594,200.81
Subsidiaries of SAIC Receipts of services-R&D expenditure 9,341,583.03 714,832.38
Associates of SAIC Receipts of services-R&D expenditure 2,073,404.47 2,481,014.80
Joint ventures Payment of logistics service expenses, royalties and others
120,046,950.50 49,153,209.87
Associates Payment of logistics service expenses, royalties and others
7,846,535.01 11,751,547.92
SAIC Payment of logistics service expenses, royalties and others
324,000.00 308,571.42
Subsidiaries of SAIC Payment of logistics service expenses, royalties and others
555,734,019.23 185,434,364.69
Associates of SAIC Payment of logistics service expenses, royalties and others
1,166,591.80
Joint ventures Payment of lease expenses 85,120,777.99 69,553,695.01
Associates Payment of lease expenses 498,408.00
SAIC Payment of lease expenses 36,061,873.18 5,389,285.60
Subsidiaries of SAIC Payment of lease expenses 9,392,392.02 9,535,540.36
Associates of SAIC Payment of lease expenses 4,818,387.33 835,122.96
Statement of sales of goods/rendering of services √Applicable □N/A
Unit: RMB
Related party Details of related party transaction
Year ended December 31, 2020
Year ended December 31, 2019
Joint ventures Sales of goods 60,515,315,255.71 69,306,340,314.37 Associates Sales of goods 7,659,956,828.22 7,717,825,817.01 Subsidiaries of SAIC Sales of goods 1,618,400,868.14 100,939,554.28

SAIC MOTOR ANNUAL REPORT 2020
220 / 241
Joint ventures Sales of materials 343,310,952.81 311,362,353.48 Associates Sales of materials 299,999,230.89 232,545,787.54 Joint ventures Trade income 2,570,561,852.42 2,839,437,842.26 Subsidiaries of SAIC Trade income 1,273,667.51 2,188,109.59 Joint ventures Rendering of services 4,134,752,926.03 5,171,277,759.27 Associates Rendering of services 212,996,634.49 235,828,405.73 SAIC Rendering of services 3,013,481,023.63 3,993,477,228.96 Subsidiaries of SAIC Rendering of services 49,413,714.48 50,809,288.11 Associates of SAIC Rendering of services 352,407.48 225,887.63 Joint ventures Rental income 259,534,083.45 270,293,272.54 Associates Rental income 1,297,238.51 26,043,593.99 Subsidiaries of SAIC Rental income 52,346,276.01 434,466.35
Joint ventures Royalties for technology and transfer fee 69,546,646.17 1,515,225,011.82
Explanations on purchase and sales of goods, rendering and receipt of services: □Applicable √N/A (2). Details of trust with related parties/subcontracting and trust management/ contract-issuing
Details of trust / contracting where the Company is the trustee / subcontractor □Applicable √N/A Explanations on trust/subcontracting with related parties □Applicable √N/A Details of trust / contracting where the Company is the trustor / contractor □Applicable √N/A Explanations on trust/contracting with related parties □Applicable √N/A (3). Leases with related parties The Company as a lessor: □Applicable √N/A The Company as a lessee: □Applicable √N/A Explanations on leases with related parties □Applicable √N/A (4). Guarantees with related parties The Company as a guarantor □Applicable √N/A The Company as a guarantee □Applicable √N/A Explanations on guarantees with related parties □Applicable √N/A (5). Borrowings/loans with related parties

SAIC MOTOR ANNUAL REPORT 2020
221 / 241
□Applicable √N/A (6). Assets transfer/debt restructuring with related parties
□Applicable √N/A (7). Remuneration of key management personnel
√Applicable □N/A Unit: RMB 0'000
Item Year ended December 31, 2020
Year ended December 31, 2019
Remuneration of key management personnel 2,386.75 2,866.30
(8). Other related parties √Applicable □N/A Financing The financing between the Group and its related parties is as follows: (a) Loans offered by SFC and SAIC-GMAC to related parties (i) Movements of loans offered by SFC and SAIC-GMAC to related parties are as follows:
Unit: RMB Joint ventures Associates Total December 31, 2019 904,000,000.00 88,420,294.07 992,420,294.07
Loans offered 3,542,699,988.83 208,145,628.08 3,750,845,616.91 Loans recovered -3,755,559,192.03 -267,409,815.83 -4,022,969,007.86
December 31, 2020 691,140,796.80 29,156,106.32 720,296,903.12
(ii) Balances of loans offered by SFC and SAIC-GMAC to related parties are as follows:
Unit: RMB December 31, 2020 December 31, 2019 Joint ventures- Short-term loans and discounts 691,140,796.80 904,000,000.00
Associates-Short-term loans and discounts 29,156,106.32 88,420,294.07
Total 720,296,903.12 992,420,294.07 (iii) Interest income received by SFC and SAIC-GMAC from related parties is as follows:
Unit: RMB
Related party Year ended December 31, 2020
Year ended December 31, 2019
Joint ventures 44,173,843.90 31,729,753.23 Associates 2,405,952.93 2,409,776.61 Total 46,579,796.83 34,139,529.84

SAIC MOTOR ANNUAL REPORT 2020
222 / 241
Interest rates for loans offered by SFC and SAIC-GMAC to related parties are calculated according to interest rates of financial institutions as specified by the People’s Bank of China. (b) Related parties' deposits at SFC and SAIC-GMAC (i) Movements of related parties' deposits at SFC and SAIC-GMAC are as follows:
Unit: RMB Joint ventures Associates SAIC Subsidiaries of
SAIC Associates of
SAIC Total December 31, 2019 31,406,212,364.28 2,142,389,982.36 28,439,359,210.43 947,707,188.03 511,746.77 62,936,180,491.87 Increase due to changes in scope of consolidation
124,168,075.45 124,168,075.45
Deposit taking (repayment) -11,381,592,541.66 -85,346,533.34 -8,224,069,775.70 3,385,019,999.27 52,684.52 -16,305,936,166.91 December 31, 2020 20,024,619,822.62 2,057,043,449.02 20,215,289,434.73 4,456,895,262.75 564,431.29 46,754,412,400.41
(ii) Interest paid by SFC and SAIC-GMAC to related parties are as follows:
Unit: RMB
Related party Year ended December 31, 2020
Year ended December 31, 2019
Joint ventures 416,774,313.07 457,390,961.48 Associates 43,307,300.65 51,448,612.52 SAIC 398,362,012.36 414,932,239.46 Subsidiaries of SAIC 3,079,159.23 5,128,978.35 Associates of SAIC 2,706.74 2,274.56
Total 861,525,492.05 928,903,066.37 Interest rates for deposits from related parties at SFC and SAIC-GMAC are calculated according to interest rates of financial institutions as specified by the People’s Bank of China. (c) Loans offered by the Group (except SFC and SAIC-GMAC) to related parties (i) Movements of entrusted loans offered by the Group to related parties are as follows:
Unit: RMB Joint ventures Associates Total
December 31, 2019 1,089,507,992.71 377,898,097.00 1,467,406,089.71 Decrease due to changes in scope of consolidation
-607,125,167.00 -607,125,167.00
Loans offered 902,514,407.26 241,898,097.00 1,144,412,504.26 Loans recovered 405,497,640.97 382,676,194.00 788,173,834.97 December 31, 2020 979,399,592.00 237,120,000.00 1,216,519,592.00 (ii) Balance of entrusted loans offered by the Group to related parties is as follows:
Unit: RMB Related party December 31, 2020 December 31, 2019
Joint ventures - short-term loans 546,190,000.00 627,858,838.71 Associates - short-term loans 231,120,000.00 371,898,097.00 Joint ventures - long-term loans 433,209,592.00 461,649,154.00

SAIC MOTOR ANNUAL REPORT 2020
223 / 241
Associates - long-term loans 6,000,000.00 6,000,000.00 Total 1,216,519,592.00 1,467,406,089.71
(iii) Interests received by the Group from related parties are as follows:
Unit: RMB Related party Year ended December 31, 2020 Year ended December 31, 2019
Joint ventures 30,745,309.94 46,911,416.61 Associates 11,220,048.29 13,943,252.39
Total 41,965,358.23 60,854,669.00 Interest rates for entrusted loans to related parties from the Group are determined according to contract agreements. (d) Entrusted business of SFC (i) Entrusted business between SFC and related parties is disclosed off balance sheet. SFC received bank charges based on agreements. The bank charges received by SFC from related parties are as follows:
Unit: RMB Related party Year ended December 31, 2020 Year ended December 31, 2019
Joint ventures 1,311,327.27 1,039,795.30 Associates 537,704.57 990,741.66 Subsidiaries of SAIC 250,792.52 13,760.00 Total 2,099,824.36 2,044,296.96 (ii) At the end of current year and prior year, entrusted business between SFC and related parties is as follows:
Unit: RMB
Entrusting parties Entrusted deposit at December 31, 2020 Targets Entrusted loans at
December 31, 2020 Joint ventures 973,000,000.00 Joint ventures 373,000,000.00 Associates 32,500,000.00 Associates 632,500,000.00 SAIC 20,000,000.00 Non-RPT 20,000,000.00 Subsidiaries of SAIC 585,000,000.00 Subsidiaries of SAIC 585,000,000.00 Total 1,610,500,000.00 Total 1,610,500,000.00
Unit: RMB
Entrusting parties Entrusted deposit at December 31, 2019 Targets Entrusted loans at
December 31, 2019 Joint ventures 1,325,000,000.00 Joint ventures 541,000,000.00 Associates 457,000,000.00 Associates 1,257,000,000.00 SAIC 20,000,000.00 Non-RPT 20,000,000.00 Subsidiaries of SAIC 12,000,000.00 Subsidiaries of SAIC 12,000,000.00 Non-RPT 16,000,000.00 Total 1,830,000,000.00 Total 1,830,000,000.00 6. Amounts due from/to related parties (1). Receivables √Applicable □N/A Unit: RMB
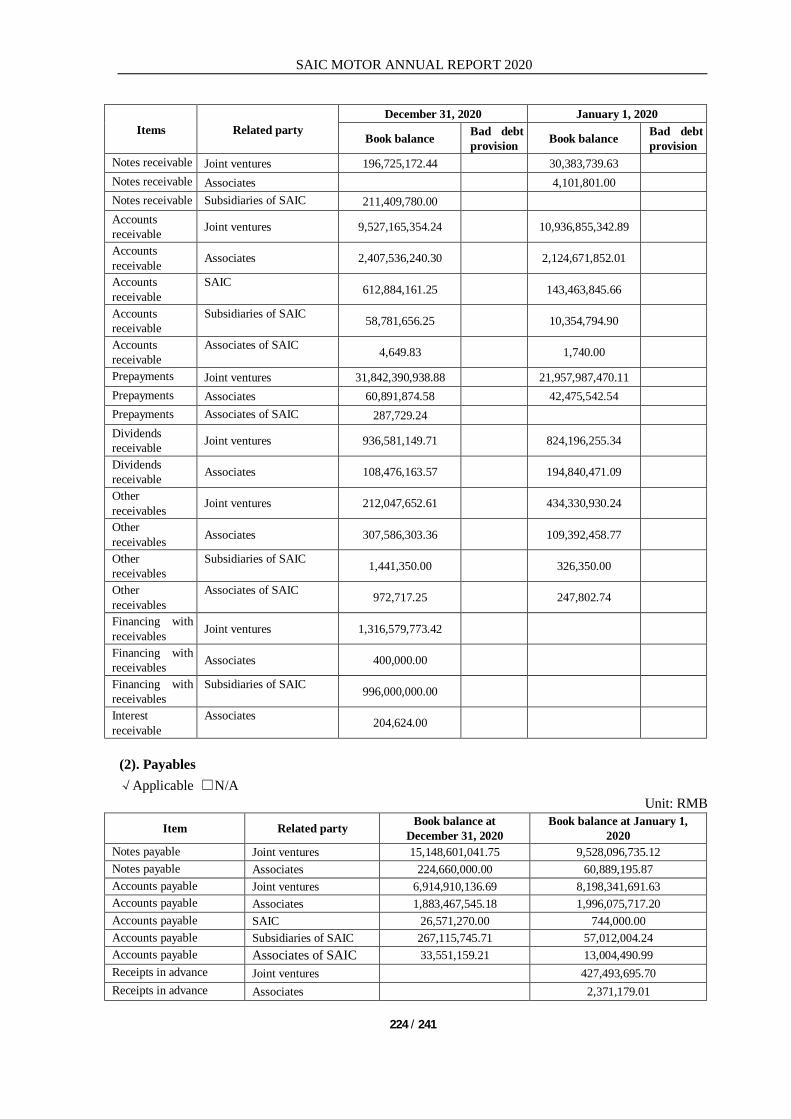
SAIC MOTOR ANNUAL REPORT 2020
224 / 241
Items Related party December 31, 2020 January 1, 2020
Book balance Bad debt provision Book balance Bad debt
provision Notes receivable Joint ventures 196,725,172.44 30,383,739.63 Notes receivable Associates 4,101,801.00 Notes receivable Subsidiaries of SAIC 211,409,780.00 Accounts receivable Joint ventures 9,527,165,354.24 10,936,855,342.89
Accounts receivable Associates 2,407,536,240.30 2,124,671,852.01
Accounts receivable
SAIC 612,884,161.25 143,463,845.66
Accounts receivable
Subsidiaries of SAIC 58,781,656.25 10,354,794.90
Accounts receivable
Associates of SAIC 4,649.83 1,740.00
Prepayments Joint ventures 31,842,390,938.88 21,957,987,470.11 Prepayments Associates 60,891,874.58 42,475,542.54 Prepayments Associates of SAIC 287,729.24 Dividends receivable Joint ventures 936,581,149.71 824,196,255.34
Dividends receivable Associates 108,476,163.57 194,840,471.09
Other receivables Joint ventures 212,047,652.61 434,330,930.24
Other receivables Associates 307,586,303.36 109,392,458.77
Other receivables
Subsidiaries of SAIC 1,441,350.00 326,350.00
Other receivables
Associates of SAIC 972,717.25 247,802.74
Financing with receivables Joint ventures 1,316,579,773.42
Financing with receivables Associates 400,000.00
Financing with receivables
Subsidiaries of SAIC 996,000,000.00
Interest receivable
Associates 204,624.00
(2). Payables √Applicable □N/A
Unit: RMB
Item Related party Book balance at December 31, 2020
Book balance at January 1, 2020
Notes payable Joint ventures 15,148,601,041.75 9,528,096,735.12 Notes payable Associates 224,660,000.00 60,889,195.87 Accounts payable Joint ventures 6,914,910,136.69 8,198,341,691.63 Accounts payable Associates 1,883,467,545.18 1,996,075,717.20 Accounts payable SAIC 26,571,270.00 744,000.00 Accounts payable Subsidiaries of SAIC 267,115,745.71 57,012,004.24 Accounts payable Associates of SAIC 33,551,159.21 13,004,490.99 Receipts in advance Joint ventures 427,493,695.70 Receipts in advance Associates 2,371,179.01

SAIC MOTOR ANNUAL REPORT 2020
225 / 241
Receipts in advance SAIC 961,738,836.72 Receipts in advance Subsidiaries of SAIC 5,210,240.64 Contract liabilities Joint ventures 3,392,415,319.30 Contract liabilities Associates 33,830,581.35 Contract liabilities SAIC 465,765,407.42 Contract liabilities Subsidiaries of SAIC 42,877,232.77 Other payables Joint ventures 133,453,760.09 55,648,510.49 Other payables Associates 392,890.23 728,371.07 Other payables Subsidiaries of SAIC 6,333,676.54 45,299.36 Other payables Associates of SAIC 470,350.00 520,350.00
7. Commitments of related parties □Applicable √N/A 8. Others □Applicable √N/A XIII. SHARE-BASED PAYMENTS 1. Summary of share-based payments □Applicable √N/A 2. Equity-settled share-based payments □Applicable √N/A 3. Cash-settled share-based payments □Applicable √N/A 4. Amendment and termination of share-based payments □Applicable √N/A
5. Others □Applicable √N/A XIV. COMMITMENTS AND CONTINGENCIES 1. Significant commitments √Applicable □N/A Significant external commitments and their nature and amounts as at the balance sheet date (1). Capital commitments
Unit: RMB'000 Consolidated
December 31, 2020 December 31, 2019
Capital commitments that have been signed but have not been recognized in the financial statements:
- Commitment for acquisition of long-term assets 8,977,924 6,762,138

SAIC MOTOR ANNUAL REPORT 2020
226 / 241
- External investment commitment 2,940 2,940 Total 8,980,864 6,765,078 (2). Operating lease commitments At the balance sheet date, the Group has the following commitments in respect of non-cancellable operating leases:
Unit: RMB'000 Consolidated December 31, 2020 December 31, 2019 Minimum lease payments under non-cancellable operating lease:
1st year subsequent to the balance sheet date 1,611,403 4,449,403
2nd year subsequent to the balance sheet date 1,370,491 1,474,055
3rd year subsequent to the balance sheet date 1,251,438 1,228,597
Subsequent years 6,078,534 6,019,794 Total 10,311,866 13,171,849 2. Contingencies (1). Significant contingencies at the balance sheet date √Applicable □N/A
Guarantor Guarantee
Relationship between
Guarantee and the Group
Category Currency Ceiling amount
Anji Logistics Guangzhou Harbour Haijia Vehicle Dock
Co., Ltd. Joint venture Liability
guarantee RMB 60,000,000.00 (Note)
Note: According to the relevant guarantee contract, Anji Logistics assumes the guarantee liability based on 50.00% of the actual guarantee loan balance amounting to RMB 120,000,000.00 at the end of the year. (2). Explanations on contingencies should be presented even if no significant contingency needs to be disclosed in the Company: □Applicable √N/A 3. Others □Applicable √N/A XV. EVENTS AFTER THE BALANCE SHEET DATE 1. Significant non-adjusting events □Applicable √N/A 2. Profits appropriation √Applicable □N/A

SAIC MOTOR ANNUAL REPORT 2020
227 / 241
Unit: RMB Proposed distributions of profits or dividends 7,176,685,655.90
Distributions of profits or dividends authorized and declared
3. Sales return □Applicable √N/A 4. Other events after the balance sheet date □Applicable √N/A XVI. OTHER SIGNIFICANT EVENTS 1. Corrections of prior period errors (1). Retrospective restatement □Applicable √N/A (2). Prospective application □Applicable √N/A 2. Debt restructuring □Applicable √N/A 3. Exchange of assets (1). Exchange of non-monetary assets
□Applicable √N/A (2). Other exchange of assets □Applicable √N/A 4. Annuity plan □Applicable √N/A 5. Discontinued operations □Applicable √N/A 6. Segment information (1). Determining basis and accounting policies of reporting segments
√Applicable □N/A
Based on the Group’s internal organization structure, management requirements and internal reporting system, the operations of the Group are classified into two reporting segments, which are “vehicles and parts” and “financing”. The reporting segments are determined based on the Group’s operating structure. The Group’s management periodically evaluates the operating results of these reporting segments to make decisions about resources to be allocated to the segments and assess their performance. Major products and

SAIC MOTOR ANNUAL REPORT 2020
228 / 241
services delivered or provided by each of the reporting segments are vehicles and parts and financing services. The Group carried out internal management on SFC, Equity Investment, SAIC Insurance, SAIC Financial Holding Changzhou Qide, and Multi-finance Indonesia other investees managed by the Financial Business Division, SAIC HK Investment Co., Ltd. and SAIC Motor North America Co., Ltd. of the Group as financial transactions. Segment information is disclosed in accordance with the accounting policies and measurement criteria adopted by each segment when reporting to management.

SAIC MOTOR ANNUAL REPORT 2020
1) Segmental reporting information
Unit: RMB Vehicles and parts Finance Elimination Total
Year ended December 31, 2020
Year ended December 31, 2019
Year ended December 31, 2020
Year ended December 31, 2019
Year ended December 31, 2020
Year ended December 31, 2019
Year ended December 31, 2020
Year ended December 31, 2019
Total operating income External revenue 721,467,998,803.51 825,033,352,058.42 20,664,451,567.22 18,291,020,518.84 742,132,450,370.73 843,324,372,577.26 Inter-segment revenue 57,820,274.18 2,163,267,250.13 -57,820,274.18 -2,163,267,250.13 Total segment operating income 721,467,998,803.51 825,033,352,058.42 20,722,271,841.40 20,454,287,768.97 -57,820,274.18 -2,163,267,250.13 742,132,450,370.73 843,324,372,577.26
Total operating costs 717,884,582,344.19 820,614,678,302.23 12,299,129,984.24 11,826,002,396.35 -654,913,876.45 -2,065,849,493.33 729,528,798,451.98 830,374,831,205.25 Add: Other income 2,359,870,889.24 4,125,989,482.62 219,692,280.54 252,569,314.54 2,579,563,169.78 4,378,558,797.16 Gain on changes in fair value 15,076,172.25 933,133,236.10 3,796,559,105.87 563,376,855.50 3,811,635,278.12 1,496,510,091.60
Investment income 17,749,537,290.59 23,352,439,757.90 5,584,029,383.15 1,863,539,964.36 -2,323,706,035.93 -315,161,782.49 21,009,860,637.81 24,900,817,939.77 Exchange gain 19,634,717.19 29,587,749.04 19,634,717.19 29,587,749.04
Impairment gain (loss) of credit -210,571,594.40 -595,193,123.78 -716,079,742.66 -1,213,597,624.41 -189,594,312.15 -56,648,465.53 -1,116,245,649.21 -1,865,439,213.72
Impairment gain (loss) of assets -3,189,619,975.38 -1,641,964,704.12 -3,189,619,975.38 -1,641,964,704.12
Gain (loss)on disposal of assets -73,869,098.79 21,645,620.83 -37,112,084.55 75,845,471.90 -110,981,183.34 97,491,092.73
Operating profit 20,233,840,142.83 30,614,724,025.74 17,289,865,516.70 10,199,607,103.55 -1,916,206,745.81 -469,228,004.82 35,607,498,913.72 40,345,103,124.47 Add: Non-operating income 730,277,913.88 759,892,448.17 19,306,058.64 7,059,699.64 749,583,972.52 766,952,147.81 Less: Non-operating expenses 465,087,529.59 153,140,538.83 370,681.22 1,122,529.76 465,458,210.81 154,263,068.59 Total profit 20,499,030,527.12 31,221,475,935.08 17,308,800,894.12 10,205,544,273.43 -1,916,206,745.81 -469,228,004.82 35,891,624,675.43 40,957,792,203.69 Less: Income tax expenses 4,265,785,025.66 3,675,956,181.20 2,437,788,780.60 1,992,929,114.86 6,703,573,806.26 5,668,885,296.06 Net profit 16,233,245,501.46 27,545,519,753.88 14,871,012,113.52 8,212,615,158.57 -1,916,206,745.81 -469,228,004.82 29,188,050,869.17 35,288,906,907.63 Total assets of segments 641,047,094,713.52 595,199,574,873.50 415,130,255,349.76 373,504,549,382.59 -136,762,594,266.34 -119,370,844,656.90 919,414,755,796.94 849,333,279,599.19 Total liabilities of segments 427,251,724,442.67 379,507,069,437.93 320,920,817,737.82 290,418,137,355.78 -138,799,098,267.13 -121,431,551,536.23 609,373,443,913.36 548,493,655,257.48 Supplementary information Depreciation and amortization expenses 14,370,513,243.84 13,380,711,977.03 91,092,926.98 93,757,932.60 14,461,606,170.82 13,474,469,909.63
Impairment loss recognized in the current period 3,400,191,569.78 2,237,157,827.90 716,079,742.66 1,213,597,624.41 189,594,312.15 56,648,465.53 4,305,865,624.59 3,507,403,917.84
Capital expenditure 15,102,175,567.03 26,883,205,236.59 35,645,601.87 51,578,417.26 15,137,821,168.90 26,934,783,653.85
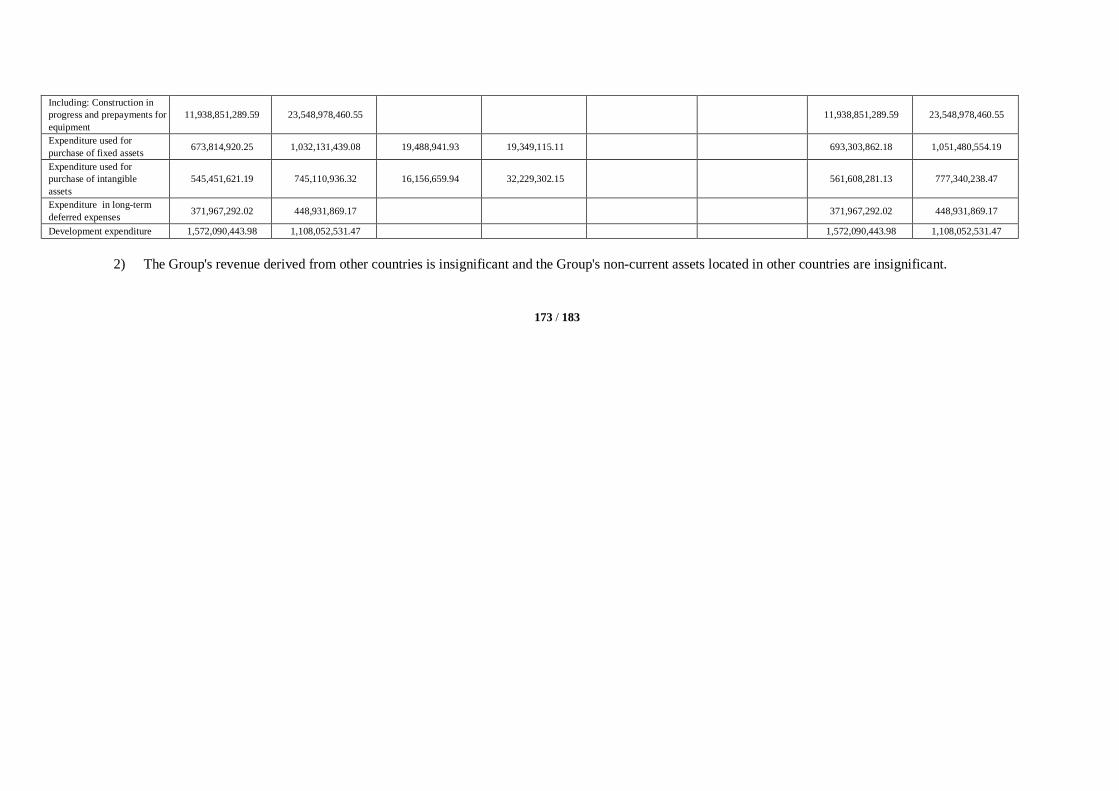
Including: Construction in progress and prepayments for equipment
11,938,851,289.59 23,548,978,460.55 11,938,851,289.59 23,548,978,460.55
Expenditure used for purchase of fixed assets 673,814,920.25 1,032,131,439.08 19,488,941.93 19,349,115.11 693,303,862.18 1,051,480,554.19
Expenditure used for purchase of intangible assets
545,451,621.19 745,110,936.32 16,156,659.94 32,229,302.15 561,608,281.13 777,340,238.47
Expenditure in long-term deferred expenses 371,967,292.02 448,931,869.17 371,967,292.02 448,931,869.17
Development expenditure 1,572,090,443.98 1,108,052,531.47 1,572,090,443.98 1,108,052,531.47
2) The Group's revenue derived from other countries is insignificant and the Group's non-current assets located in other countries are insignificant.
173 / 183
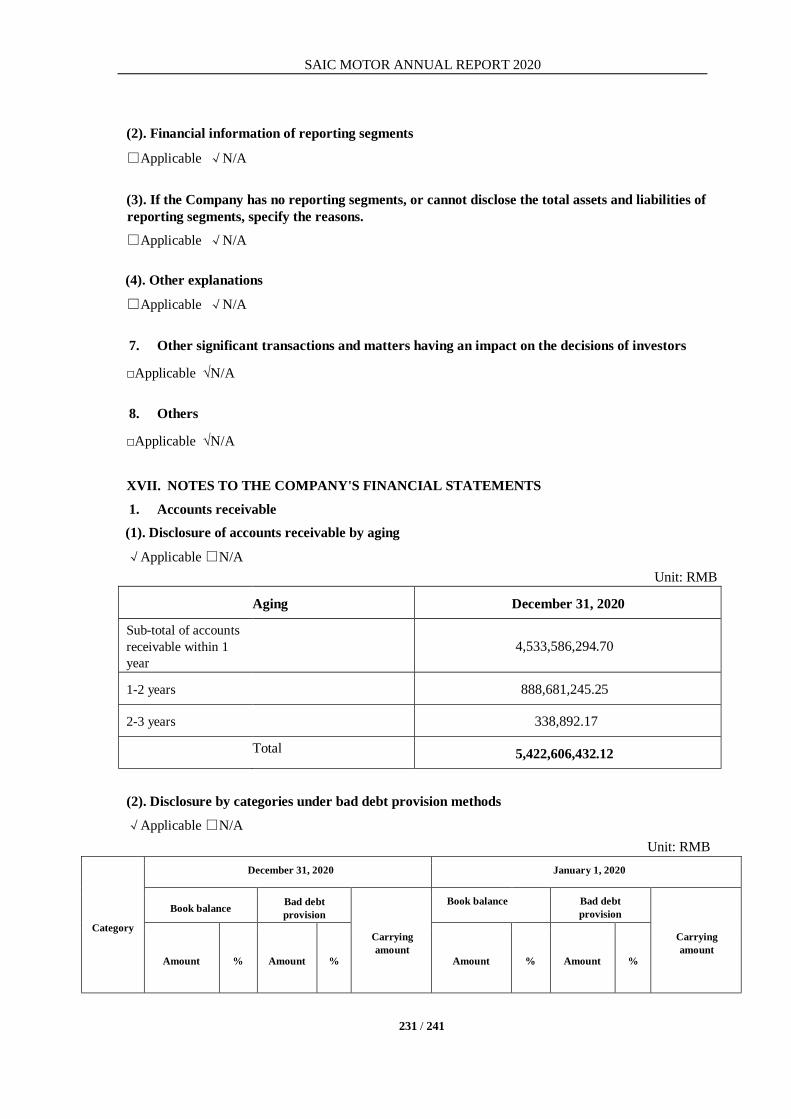
SAIC MOTOR ANNUAL REPORT 2020
231 / 241
(2). Financial information of reporting segments
□Applicable √N/A
(3). If the Company has no reporting segments, or cannot disclose the total assets and liabilities of reporting segments, specify the reasons. □Applicable √N/A (4). Other explanations □Applicable √N/A 7. Other significant transactions and matters having an impact on the decisions of investors
□Applicable √N/A 8. Others
□Applicable √N/A XVII. NOTES TO THE COMPANY'S FINANCIAL STATEMENTS 1. Accounts receivable (1). Disclosure of accounts receivable by aging √Applicable □N/A
Unit: RMB Aging December 31, 2020
Sub-total of accounts receivable within 1 year
4,533,586,294.70
1-2 years 888,681,245.25
2-3 years 338,892.17
Total 5,422,606,432.12
(2). Disclosure by categories under bad debt provision methods √Applicable □N/A
Unit: RMB
Category
December 31, 2020 January 1, 2020
Book balance Bad debt provision
Carrying amount
Book balance Bad debt provision
Carrying amount
Amount % Amount % Amount % Amount %
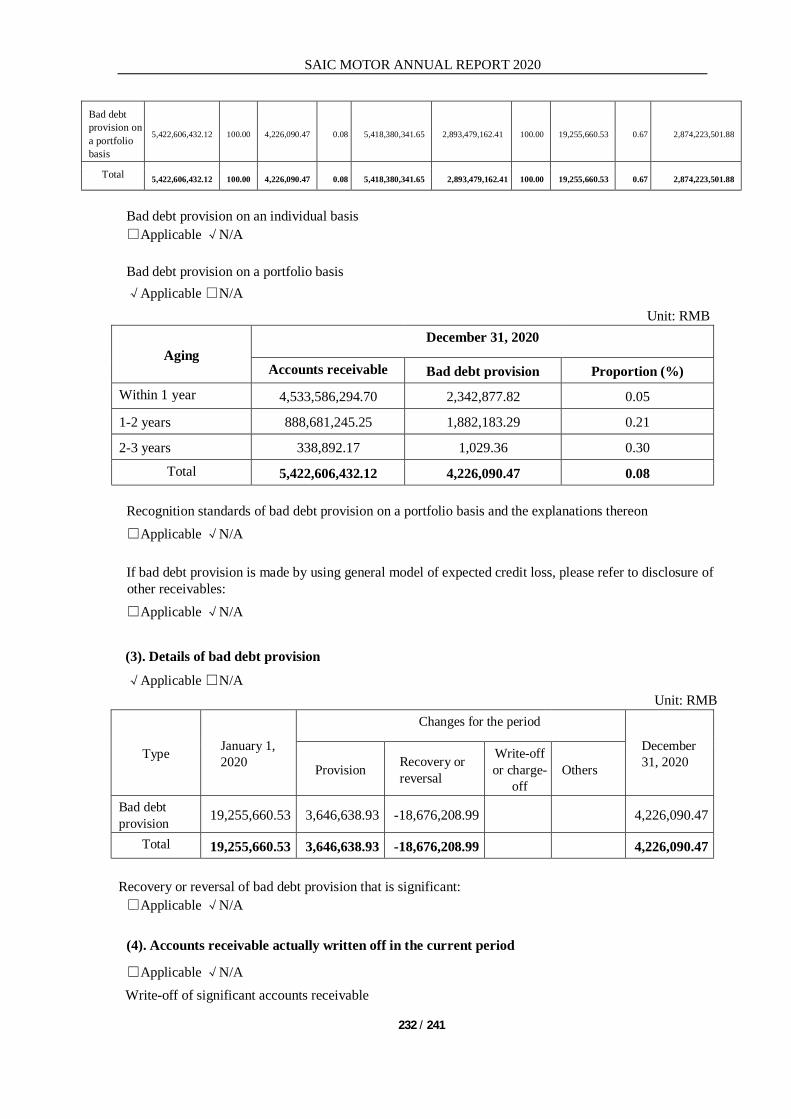
SAIC MOTOR ANNUAL REPORT 2020
232 / 241
Bad debt provision on a portfolio basis
5,422,606,432.12 100.00 4,226,090.47 0.08 5,418,380,341.65 2,893,479,162.41 100.00 19,255,660.53 0.67 2,874,223,501.88
Total 5,422,606,432.12 100.00 4,226,090.47 0.08 5,418,380,341.65 2,893,479,162.41 100.00 19,255,660.53 0.67 2,874,223,501.88 Bad debt provision on an individual basis □Applicable √N/A Bad debt provision on a portfolio basis √Applicable □N/A
Unit: RMB
Aging December 31, 2020
Accounts receivable Bad debt provision Proportion (%) Within 1 year 4,533,586,294.70 2,342,877.82 0.05
1-2 years 888,681,245.25 1,882,183.29 0.21
2-3 years 338,892.17 1,029.36 0.30 Total 5,422,606,432.12 4,226,090.47 0.08
Recognition standards of bad debt provision on a portfolio basis and the explanations thereon □Applicable √N/A If bad debt provision is made by using general model of expected credit loss, please refer to disclosure of other receivables: □Applicable √N/A
(3). Details of bad debt provision √Applicable □N/A
Unit: RMB
Type January 1, 2020
Changes for the period December 31, 2020 Provision Recovery or
reversal
Write-off or charge-
off Others
Bad debt provision 19,255,660.53 3,646,638.93 -18,676,208.99 4,226,090.47
Total 19,255,660.53 3,646,638.93 -18,676,208.99 4,226,090.47
Recovery or reversal of bad debt provision that is significant: □Applicable √N/A (4). Accounts receivable actually written off in the current period
□Applicable √N/A Write-off of significant accounts receivable
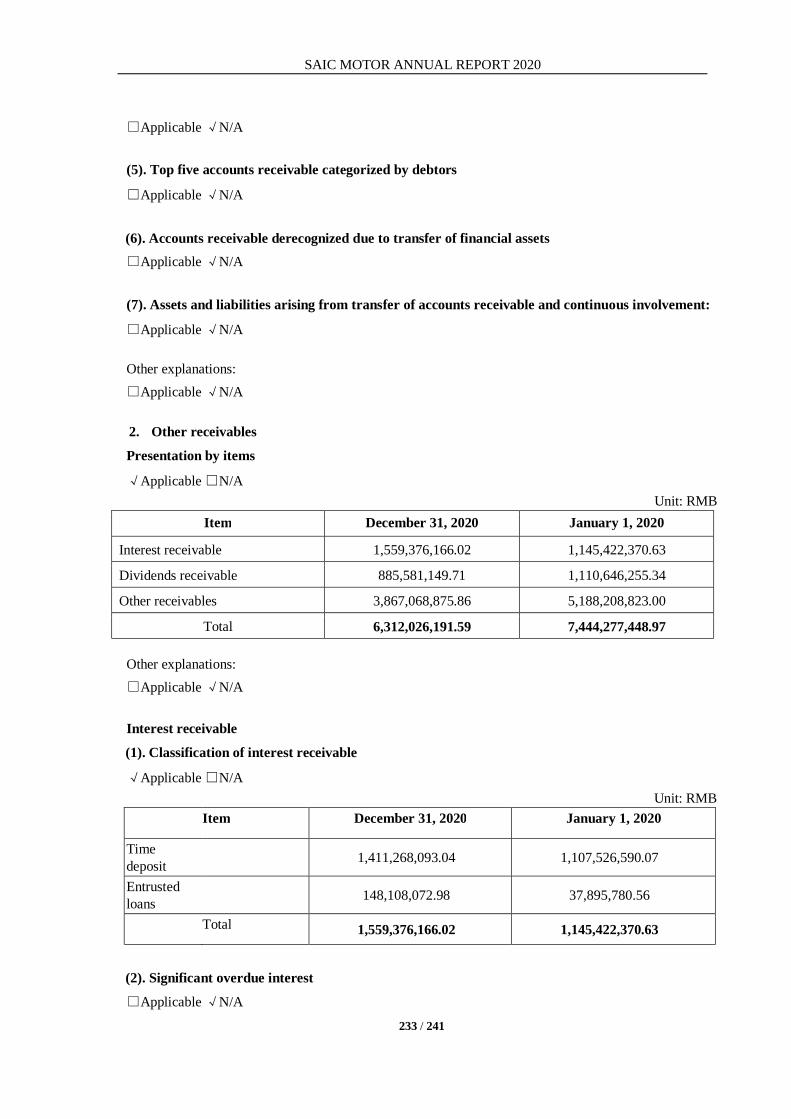
SAIC MOTOR ANNUAL REPORT 2020
233 / 241
□Applicable √N/A
(5). Top five accounts receivable categorized by debtors
□Applicable √N/A (6). Accounts receivable derecognized due to transfer of financial assets □Applicable √N/A (7). Assets and liabilities arising from transfer of accounts receivable and continuous involvement:
□Applicable √N/A Other explanations: □Applicable √N/A 2. Other receivables Presentation by items
√Applicable □N/A Unit: RMB
Item December 31, 2020 January 1, 2020
Interest receivable 1,559,376,166.02 1,145,422,370.63
Dividends receivable 885,581,149.71 1,110,646,255.34
Other receivables 3,867,068,875.86 5,188,208,823.00
Total 6,312,026,191.59 7,444,277,448.97 Other explanations: □Applicable √N/A Interest receivable (1). Classification of interest receivable
√Applicable □N/A Unit: RMB
Item December 31, 2020 January 1, 2020
Time deposit
1,411,268,093.04 1,107,526,590.07
Entrusted loans
148,108,072.98 37,895,780.56
Total 1,559,376,166.02 1,145,422,370.63
(2). Significant overdue interest □Applicable √N/A
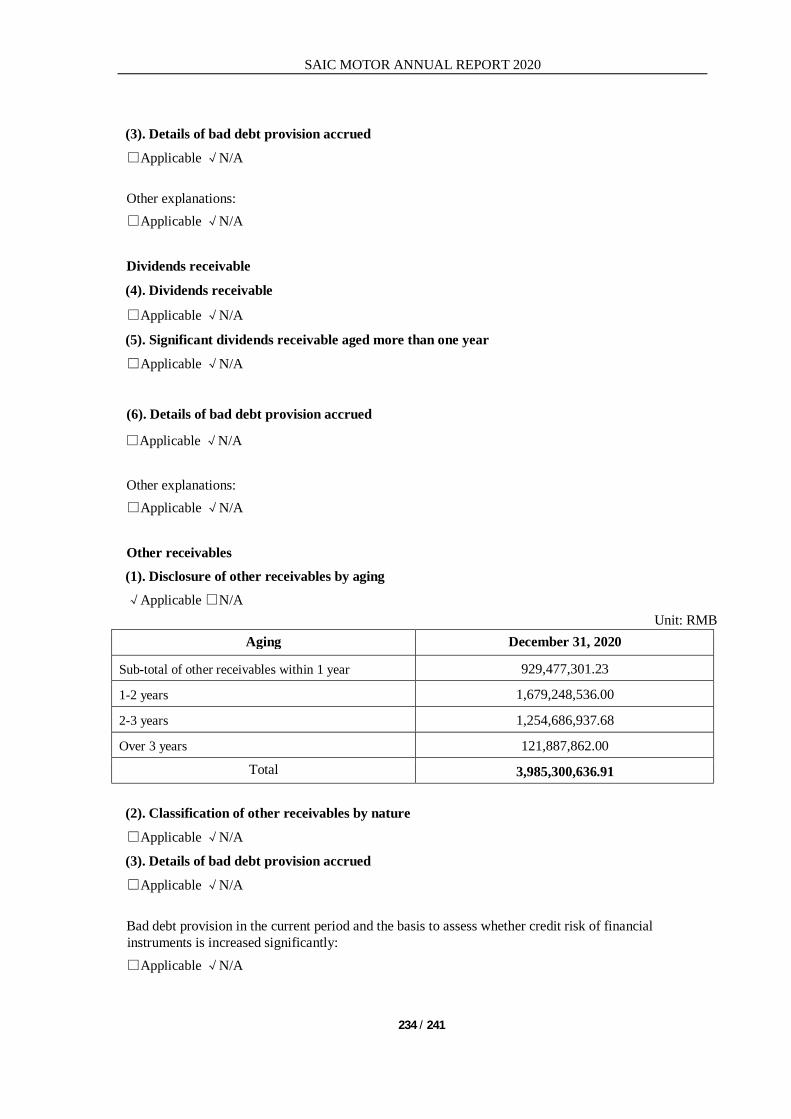
SAIC MOTOR ANNUAL REPORT 2020
234 / 241
(3). Details of bad debt provision accrued □Applicable √N/A Other explanations: □Applicable √N/A
Dividends receivable (4). Dividends receivable
□Applicable √N/A
(5). Significant dividends receivable aged more than one year □Applicable √N/A
(6). Details of bad debt provision accrued
□Applicable √N/A Other explanations: □Applicable √N/A
Other receivables (1). Disclosure of other receivables by aging √Applicable □N/A
Unit: RMB Aging December 31, 2020
Sub-total of other receivables within 1 year 929,477,301.23
1-2 years 1,679,248,536.00
2-3 years 1,254,686,937.68
Over 3 years 121,887,862.00 Total 3,985,300,636.91
(2). Classification of other receivables by nature □Applicable √N/A
(3). Details of bad debt provision accrued □Applicable √N/A Bad debt provision in the current period and the basis to assess whether credit risk of financial instruments is increased significantly: □Applicable √N/A

SAIC MOTOR ANNUAL REPORT 2020
235 / 241
(4). Details of bad debt provision √Applicable □N/A
Unit: RMB
Type January 1, 2020
Changes for the period December 31, 2020
Provision Recovery or reversal
Write-off or charge-off Others
Bad debt provision 136,252,398.95 12,976,343.95 -30,996,981.85 118,231,761.05
Total 136,252,398.95 12,976,343.95 -30,996,981.85 118,231,761.05 Significant reversal or recovery of bad debt provision for the period: □Applicable √N/A (5). Other receivables actually written off in the current period □Applicable √N/A
(6). Top five other receivables categorized by debtors □Applicable √N/A (7). Other receivables related to government grants □Applicable √N/A (8). Other receivables derecognized due to transfer of financial assets □Applicable √N/A (9). Assets and liabilities arising from transfer of other receivables and continuous involvement: □Applicable √N/A Other explanations: □Applicable √N/A
3. Long-term equity investments √Applicable □N/A
Unit: RMB
Item December 31, 2020 January 1, 2020
Book balance Impairment provision Carrying amount Book balance Impairment
provision Carrying amount
Investments in subsidiaries 87,178,547,124.75 87,178,547,124.75 86,641,011,417.04 86,641,011,417.04
Investments in joint ventures and associates
31,820,389,596.63 31,820,389,596.63 37,342,193,164.01 37,342,193,164.01
Total 118,998,936,721.38 118,998,936,721.38 123,983,204,581.05 123,983,204,581.05

SAIC MOTOR ANNUAL REPORT 2020
236 / 241
(1). Investments in subsidiaries
√Applicable □N/A Unit: RMB
Investee January 1, 2020 Increase Decrease December 31, 2020
Impairment provision for
the period
Impairment provision as
at December 31, 2020
SAIC GM Wuling Co., Ltd. 1,126,669,400.01 1,126,669,400.01 SAIC Maxus Vehicle Co., Ltd. (Note 1) 8,937,230,000.00 247,880,000.00 9,185,110,000.00
SAIC Finance Co., Ltd. 11,534,123,733.09 11,534,123,733.09 SAIC Volkswagen Sales Co., Ltd. 225,339,303.84 225,339,303.84 Shanghai Pengpu Machine Building Plant Co., Ltd. 925,582,955.01 925,582,955.01 SAIC Motor Transmission Co., Ltd. 5,359,590,000.00 5,359,590,000.00 Nanjing Automobile (Group) Corporation 3,423,861,978.39 3,423,861,978.39
Shanghai Diesel Engine Co., Ltd. 1,173,419,996.46 1,173,419,996.46
SAIC HK Investment Co., Ltd. 2,046,066,390.00 2,046,066,390.00
SAIC Motor UK Co., Ltd. 46,468,800.00 46,468,800.00
SAIC Capital Company Limited. 4,031,024,000.00 4,031,024,000.00 SAIC General Motors Sales Co., Ltd. 158,319,147.00 158,319,147.00 HUAYU Automotive Systems Co., Ltd. 12,878,718,472.88 12,878,718,472.88
SAIC Motor (Beijing) Co., Ltd. 316,317,252.11 316,317,252.11 Shanghai Automobile Asset Management Co., Ltd 970,325,316.32 970,325,316.32 Shanghai Automotive Industry Sales Co., Ltd 4,825,048,435.94 4,825,048,435.94 SAIC Motor North America Co., Ltd. 172,336,204.50 172,336,204.50 Anji Automotive Logistics Co., Ltd. 2,118,090,251.55 2,118,090,251.55 Donghua Automobile Industrial Co., Ltd. 654,940,453.36 654,940,453.36 Shanghai Shangyuan Investment Management Co., Ltd. 349,767,221.39 349,767,221.39 China Automotive Industrial Development Co., Ltd. 274,872,910.12 274,872,910.12
SAIC Activity Centre Co., Ltd. 163,314,188.68 163,314,188.68 Shanghai Automotive News Press Co., Ltd. 9,891,593.78 9,891,593.78 SAIC Investment Management Co., Ltd. (Note 2) 9,728,738,900.03 1,219,412,536.41 8,509,326,363.62
Shanghai Shanghong Real Estate Co., Ltd. 2,071,880,000.00 2,071,880,000.00
Shanghai Sunwin Bus Co., Ltd. 922,209,374.40 922,209,374.40 SAIC Group Financial Holding Management Co., Ltd. 10,050,000,000.00 10,050,000,000.00
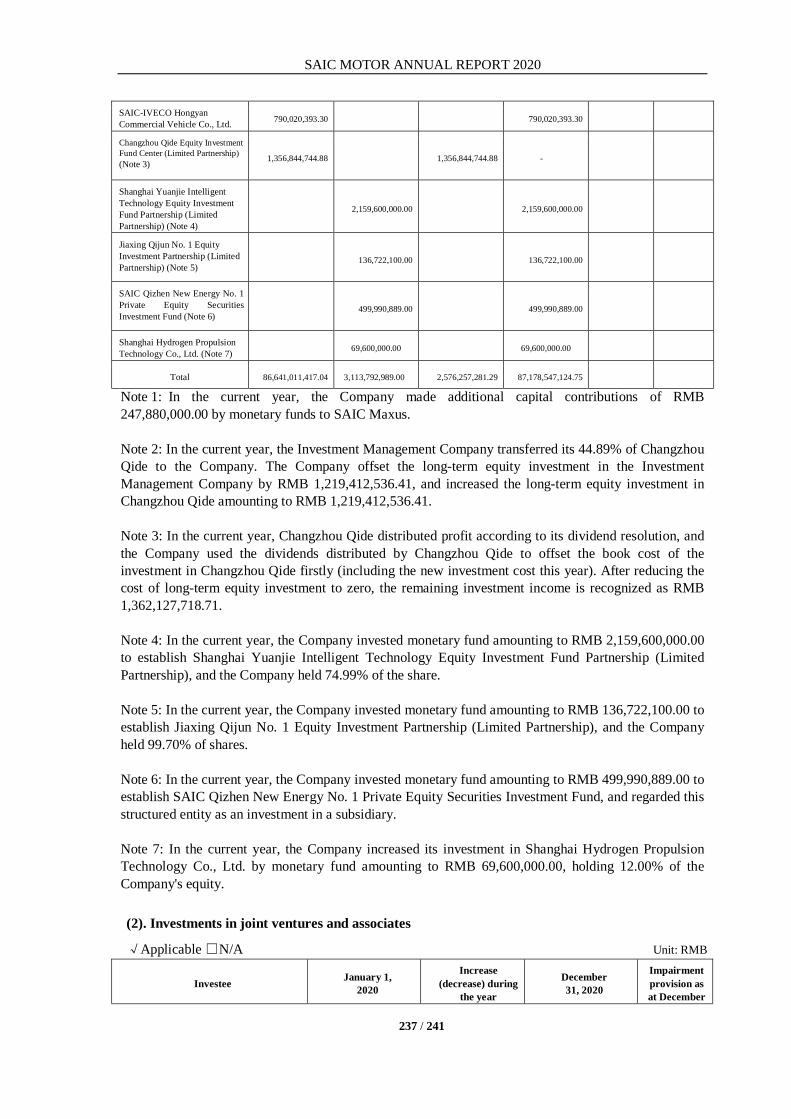
SAIC MOTOR ANNUAL REPORT 2020
237 / 241
SAIC-IVECO Hongyan Commercial Vehicle Co., Ltd. 790,020,393.30 790,020,393.30 Changzhou Qide Equity Investment Fund Center (Limited Partnership) (Note 3) 1,356,844,744.88 1,356,844,744.88 -
Shanghai Yuanjie Intelligent Technology Equity Investment Fund Partnership (Limited Partnership) (Note 4)
2,159,600,000.00 2,159,600,000.00
Jiaxing Qijun No. 1 Equity Investment Partnership (Limited Partnership) (Note 5)
136,722,100.00 136,722,100.00
SAIC Qizhen New Energy No. 1 Private Equity Securities Investment Fund (Note 6)
499,990,889.00 499,990,889.00
Shanghai Hydrogen Propulsion Technology Co., Ltd. (Note 7) 69,600,000.00 69,600,000.00
Total 86,641,011,417.04 3,113,792,989.00 2,576,257,281.29 87,178,547,124.75 Note 1: In the current year, the Company made additional capital contributions of RMB 247,880,000.00 by monetary funds to SAIC Maxus. Note 2: In the current year, the Investment Management Company transferred its 44.89% of Changzhou Qide to the Company. The Company offset the long-term equity investment in the Investment Management Company by RMB 1,219,412,536.41, and increased the long-term equity investment in Changzhou Qide amounting to RMB 1,219,412,536.41. Note 3: In the current year, Changzhou Qide distributed profit according to its dividend resolution, and the Company used the dividends distributed by Changzhou Qide to offset the book cost of the investment in Changzhou Qide firstly (including the new investment cost this year). After reducing the cost of long-term equity investment to zero, the remaining investment income is recognized as RMB 1,362,127,718.71. Note 4: In the current year, the Company invested monetary fund amounting to RMB 2,159,600,000.00 to establish Shanghai Yuanjie Intelligent Technology Equity Investment Fund Partnership (Limited Partnership), and the Company held 74.99% of the share. Note 5: In the current year, the Company invested monetary fund amounting to RMB 136,722,100.00 to establish Jiaxing Qijun No. 1 Equity Investment Partnership (Limited Partnership), and the Company held 99.70% of shares. Note 6: In the current year, the Company invested monetary fund amounting to RMB 499,990,889.00 to establish SAIC Qizhen New Energy No. 1 Private Equity Securities Investment Fund, and regarded this structured entity as an investment in a subsidiary. Note 7: In the current year, the Company increased its investment in Shanghai Hydrogen Propulsion Technology Co., Ltd. by monetary fund amounting to RMB 69,600,000.00, holding 12.00% of the Company's equity. (2). Investments in joint ventures and associates
√Applicable □N/A Unit: RMB
Investee January 1, 2020
Increase (decrease) during
the year December 31, 2020
Impairment provision as at December

SAIC MOTOR ANNUAL REPORT 2020
238 / 241
Others 31, 2020
I Joint ventures
SAIC Volkswagen Automotive Co., Ltd. 18,630,589,997.03 -2,255,278,621.72 16,375,311,375.31
SAIC General Motors Co., Ltd. 13,152,917,707.70 -3,362,614,019.12 9,790,303,688.58
Shanghai GM Dong Yue Motors Co., Ltd. 579,971,930.72 2,395,594.17 582,367,524.89 Shanghai GM Dong Yue Automotive Powertrain Co., Ltd. 1,539,579,031.28 10,468,610.19 1,550,047,641.47
Shanghai GM (Shenyang) Norsom Motors Co., Ltd. 706,319,773.00 -38,167,959.39 668,151,813.61
Pan-Asia Technical Automotive Centre 407,498,849.78 16,310,408.01 423,809,257.79 SAIC Iveco Commercial Vehicle Investment Co., Ltd. 562,473,513.40 219,343,487.04 781,817,000.44
Sub-total 35,579,350,802.91 -5,407,542,500.82 30,171,808,302.09
II Associates
Volkswagen Automotive Powertrain Co., Ltd. 1,560,754,452.65 -56,905,606.09 1,503,848,846.56
Volkswagen Transmission (Shanghai) Co., Ltd. 202,087,908.45 -57,355,460.47 144,732,447.98
Sub-total 1,762,842,361.10 -114,261,066.56 1,648,581,294.54
Total 37,342,193,164.01 -5,521,803,567.38 31,820,389,596.63 4. Operating income/costs (1). Details of operating income/costs √Applicable □N/A
Unit: RMB
Item Year ended December 31, 2020 Year ended December 31, 2019
Income Costs Income Costs
Primary operations 54,476,008,896.42 51,054,538,449.73 56,195,554,113.18 52,645,135,725.62
Other operations 5,568,035,278.07 4,849,996,704.88 7,645,437,302.81 5,266,669,080.95
Total 60,044,044,174.49 55,904,535,154.61 63,840,991,415.99 57,911,804,806.57 (2). Details of income from contacts
□Applicable √N/A
(3). Explanation of performance obligations
√Applicable □N/A The Group's mainly engaged in the research and development, production and sales of automobiles and parts and components. For goods sold to customers, the Group recognizes revenue when the control of the goods is transferred, namely, when the goods are delivered to the counterparty's designated location, delivered to the counterparty's designated carrier, or when the sales are completed as otherwise agreed.
(4). Explanation of allocation to remaining performance obligations

SAIC MOTOR ANNUAL REPORT 2020
239 / 241
□Applicable √N/A Other explanations:
Primary operations Unit: RMB Year ended December 31, 2020 Year ended December 31, 2019 Operating income Operating costs Operating income Operating costs
Sales of vehicles 51,965,263,700.16 49,250,438,502.52 53,322,268,299.29 50,414,317,960.48 Sales of parts and components 2,510,745,196.26 1,804,099,947.21 2,873,285,813.89 2,230,817,765.14
Total 54,476,008,896.42 51,054,538,449.73 56,195,554,113.18 52,645,135,725.62 Other operations
Unit: RMB Year ended December 31, 2020 Year ended 31 December 2019 Operating income Operating costs Operating income Operating costs
Rendering of services 3,202,404,832.87 3,136,570,820.19 3,602,561,279.81 3,580,378,322.82
Sales of raw materials and waste 1,693,702,313.41 1,555,425,543.06 1,462,423,624.84 1,451,353,105.29
Commission and royalties of technology
505,253,706.07 72,624,427.71 2,438,624,811.82 161,701,472.02
Rental 60,968,193.51 16,385,339.18 51,806,066.69 17,091,176.69
Others 105,706,232.21 68,990,574.74 90,021,519.65 56,145,004.13
Total 5,568,035,278.07 4,849,996,704.88 7,645,437,302.81 5,266,669,080.95 5. Investment income √Applicable □N/A
Unit: RMB Item Year ended December 31, 2020 Year ended December 31, 2019
Dividends declared by subsidiaries 7,152,881,085.41 9,101,775,968.06 Income from long-term equity investments under equity method 11,143,789,038.61 16,820,236,026.59
Investment income from other equity instruments investments in holding period 382,129,477.16 291,518,272.68
Investment income from entrusted loans 194,722,534.78 121,377,470.32 Total 18,873,522,135.96 26,334,907,737.65
6. Others □Applicable √N/A
XVIII. SUPPLEMENTARY INFORMATION 1. Statement of non-recurring profit or loss
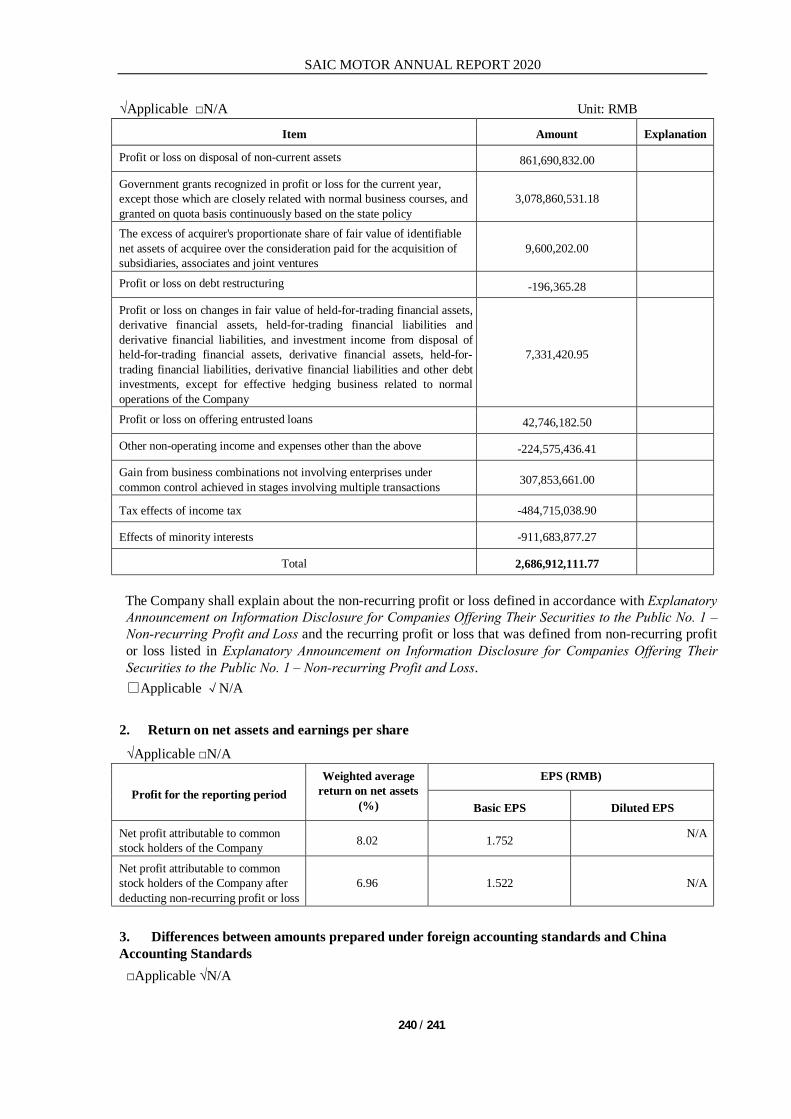
SAIC MOTOR ANNUAL REPORT 2020
240 / 241
√Applicable □N/A Unit: RMB
Item Amount Explanation Profit or loss on disposal of non-current assets 861,690,832.00 Government grants recognized in profit or loss for the current year, except those which are closely related with normal business courses, and granted on quota basis continuously based on the state policy
3,078,860,531.18
The excess of acquirer's proportionate share of fair value of identifiable net assets of acquiree over the consideration paid for the acquisition of subsidiaries, associates and joint ventures
9,600,202.00
Profit or loss on debt restructuring -196,365.28
Profit or loss on changes in fair value of held-for-trading financial assets, derivative financial assets, held-for-trading financial liabilities and derivative financial liabilities, and investment income from disposal of held-for-trading financial assets, derivative financial assets, held-for-trading financial liabilities, derivative financial liabilities and other debt investments, except for effective hedging business related to normal operations of the Company
7,331,420.95
Profit or loss on offering entrusted loans 42,746,182.50
Other non-operating income and expenses other than the above -224,575,436.41
Gain from business combinations not involving enterprises under common control achieved in stages involving multiple transactions 307,853,661.00
Tax effects of income tax -484,715,038.90
Effects of minority interests -911,683,877.27
Total 2,686,912,111.77 The Company shall explain about the non-recurring profit or loss defined in accordance with Explanatory Announcement on Information Disclosure for Companies Offering Their Securities to the Public No. 1 – Non-recurring Profit and Loss and the recurring profit or loss that was defined from non-recurring profit or loss listed in Explanatory Announcement on Information Disclosure for Companies Offering Their Securities to the Public No. 1 – Non-recurring Profit and Loss. □Applicable √N/A
2. Return on net assets and earnings per share √Applicable □N/A
Profit for the reporting period Weighted average
return on net assets (%)
EPS (RMB)
Basic EPS Diluted EPS
Net profit attributable to common stock holders of the Company 8.02 1.752 N/A
Net profit attributable to common stock holders of the Company after deducting non-recurring profit or loss
6.96 1.522 N/A
3. Differences between amounts prepared under foreign accounting standards and China Accounting Standards □Applicable √N/A
SAIC MOTOR ANNUAL REPORT 2020
241 / 241
4. Others □Applicable √N/A
Section XII List of Documents Available For Inspection
List of Documents
Available For Inspection Financial statements with signatures of legal representative, chief financial officer and head of accounting department
List of Documents Available For Inspection Auditors' report with signatures of accounting firm and certificated accountants
List of Documents Available For Inspection Announcement and document released on paper of CSRC during reporting period
President: Mr. Chen Hong Date of Approval by the Board: 26 March 2021
Revised information □Applicable √N/A