Safety analysis in process facilities: Comparison of fault tree and Bayesian network approaches
8
Safety analysis in process facilities: Comparison of fault tree and Bayesian network approaches Nima Khakzad a , Faisal Khan a,n , Paul Amyotte b a Process Engineering, Faculty of Engineering & Applied Science, Memorial University, St. John’s, NL, Canada A1B 3X5 b Department of Process Engineering & Applied Science, Dalhousie University, Halifax, NS, Canada B3J 2X4 article info Article history: Received 24 July 2010 Received in revised form 4 March 2011 Accepted 15 March 2011 Available online 23 March 2011 Keywords: Bayesian network Fault tree analysis Accident analysis Uncertainty modeling abstract Safety analysis in gas process facilities is necessary to prevent unwanted events that may cause catastrophic accidents. Accident scenario analysis with probability updating is the key to dynamic safety analysis. Although conventional failure assessment techniques such as fault tree (FT) have been used effectively for this purpose, they suffer severe limitations of static structure and uncertainty handling, which are of great significance in process safety analysis. Bayesian network (BN) is an alternative technique with ample potential for application in safety analysis. BNs have a strong similarity to FTs in many respects; however, the distinct advantages making them more suitable than FTs are their ability in explicitly representing the dependencies of events, updating probabilities, and coping with uncertainties. The objective of this paper is to demonstrate the application of BNs in safety analysis of process systems. The first part of the paper shows those modeling aspects that are common between FT and BN, giving preference to BN due to its ability to update probabilities. The second part is devoted to various modeling features of BN, helping to incorporate multi-state variables, dependent failures, functional uncertainty, and expert opinion which are frequently encountered in safety analysis, but cannot be considered by FT. The paper concludes that BN is a superior technique in safety analysis because of its flexible structure, allowing it to fit a wide variety of accident scenarios. & 2011 Elsevier Ltd. All rights reserved. 1. Introduction Safety analysis is very important in gas process facilities as they deal with a large amount of flammable chemicals; also, process areas are congested with complex piping, high-pressure compressors, and separators of which malfunctions and mishaps may lead to catastrophic accidents [1,2]. There have been many fatal explosions and fires imposing major capital loss and considerable death toll in the past two decades. On 23 March 2005, the BP refinery explosion in Texas City caused 15 deaths and more than 170 injuries [3]. According to the final report issued by BP [4], a lack of process safety measures and insufficient risk reduction measures were entirely to blame for the accident. On 7 February 2010, the Kleen Energy power plant exploded in Middletown, Connecticut, U.S., killing 6 and injuring at least 12. The explosion was one of the worst industrial disasters in the U.S. in recent years [5]. Most recently, on 20 April 2010, explosion and fire on Transocean Ltd’s drilling rig killed 11 and injured 17 in the Gulf of Mexico. The failure of a blowout preventer has been determined as the primary cause of the accident [6]. It is important to broaden the risk analysis scope by considering accident scenario and real-time safety analysis in order to predict and continuously update the likelihood of catastrophic accidents and to take actions to prevent them. Forecasting likely accident scenarios is the most important step in safety analysis. Khan [7] proposed a ‘‘maximum credible accident scenario’’ approach that short-lists the important scenar- ios based on both their consequences and the likelihood of accident occurrence. Delvosalle et al. [8] used two methodologies: MIMAH for the identification of major accident hazards, in which no safety system was considered, and MIRAS for the identification of reference accident scenarios, in which all the actual safety functions and barriers were included in the analysis. The next step in safety analysis is to quantify the occurrence probability of the selected accident scenarios. For this, there are many techni- ques available, among which fault tree (FT) is very popular. Although having some limitations, FTs are extensively used in the field of risk analysis of process systems [1,9,10] and fault diagnosis [11–13]. Standard FTs are not suitable for analyzing large systems, particularly if the system presents redundant failures, common cause failures, or mutually exclusive primary events. More importantly, events in a FT are assumed indepen- dent, which is not usually a valid assumption [2,14,15]. In recent years, a Bayesian network (BN) methodology has begun to be used in engineering applications. A BN is a graphical inference technique used to express the causal relationships Contents lists available at ScienceDirect journal homepage: www.elsevier.com/locate/ress Reliability Engineering and System Safety 0951-8320/$ - see front matter & 2011 Elsevier Ltd. All rights reserved. doi:10.1016/j.ress.2011.03.012 n Corresponding author. E-mail address: fi[email protected] (F. Khan). Reliability Engineering and System Safety 96 (2011) 925–932
Transcript of Safety analysis in process facilities: Comparison of fault tree and Bayesian network approaches
Reliability Engineering and System Safety 96 (2011) 925–932
Contents lists available at ScienceDirect
Reliability Engineering and System Safety
0951-83
doi:10.1
n Corr
E-m
journal homepage: www.elsevier.com/locate/ress
Safety analysis in process facilities: Comparison of fault tree and Bayesiannetwork approaches
Nima Khakzad a, Faisal Khan a,n, Paul Amyotte b
a Process Engineering, Faculty of Engineering & Applied Science, Memorial University, St. John’s, NL, Canada A1B 3X5b Department of Process Engineering & Applied Science, Dalhousie University, Halifax, NS, Canada B3J 2X4
a r t i c l e i n f o
Article history:
Received 24 July 2010
Received in revised form
4 March 2011
Accepted 15 March 2011Available online 23 March 2011
Keywords:
Bayesian network
Fault tree analysis
Accident analysis
Uncertainty modeling
20/$ - see front matter & 2011 Elsevier Ltd. A
016/j.ress.2011.03.012
esponding author.
ail address: [email protected] (F. Khan).
a b s t r a c t
Safety analysis in gas process facilities is necessary to prevent unwanted events that may cause
catastrophic accidents. Accident scenario analysis with probability updating is the key to dynamic
safety analysis. Although conventional failure assessment techniques such as fault tree (FT) have been
used effectively for this purpose, they suffer severe limitations of static structure and uncertainty
handling, which are of great significance in process safety analysis. Bayesian network (BN) is an
alternative technique with ample potential for application in safety analysis. BNs have a strong
similarity to FTs in many respects; however, the distinct advantages making them more suitable than
FTs are their ability in explicitly representing the dependencies of events, updating probabilities, and
coping with uncertainties. The objective of this paper is to demonstrate the application of BNs in safety
analysis of process systems. The first part of the paper shows those modeling aspects that are common
between FT and BN, giving preference to BN due to its ability to update probabilities. The second part is
devoted to various modeling features of BN, helping to incorporate multi-state variables, dependent
failures, functional uncertainty, and expert opinion which are frequently encountered in safety analysis,
but cannot be considered by FT. The paper concludes that BN is a superior technique in safety analysis
because of its flexible structure, allowing it to fit a wide variety of accident scenarios.
& 2011 Elsevier Ltd. All rights reserved.
1. Introduction
Safety analysis is very important in gas process facilities asthey deal with a large amount of flammable chemicals; also,process areas are congested with complex piping, high-pressurecompressors, and separators of which malfunctions and mishapsmay lead to catastrophic accidents [1,2].
There have been many fatal explosions and fires imposingmajor capital loss and considerable death toll in the past twodecades. On 23 March 2005, the BP refinery explosion in TexasCity caused 15 deaths and more than 170 injuries [3]. Accordingto the final report issued by BP [4], a lack of process safetymeasures and insufficient risk reduction measures were entirelyto blame for the accident. On 7 February 2010, the Kleen Energypower plant exploded in Middletown, Connecticut, U.S., killing6 and injuring at least 12. The explosion was one of the worstindustrial disasters in the U.S. in recent years [5]. Most recently,on 20 April 2010, explosion and fire on Transocean Ltd’s drillingrig killed 11 and injured 17 in the Gulf of Mexico. The failure of ablowout preventer has been determined as the primary cause ofthe accident [6]. It is important to broaden the risk analysis scope
ll rights reserved.
by considering accident scenario and real-time safety analysis inorder to predict and continuously update the likelihood ofcatastrophic accidents and to take actions to prevent them.
Forecasting likely accident scenarios is the most importantstep in safety analysis. Khan [7] proposed a ‘‘maximum credible
accident scenario’’ approach that short-lists the important scenar-ios based on both their consequences and the likelihood ofaccident occurrence. Delvosalle et al. [8] used two methodologies:MIMAH for the identification of major accident hazards, in whichno safety system was considered, and MIRAS for the identificationof reference accident scenarios, in which all the actual safetyfunctions and barriers were included in the analysis. The nextstep in safety analysis is to quantify the occurrence probability ofthe selected accident scenarios. For this, there are many techni-ques available, among which fault tree (FT) is very popular.
Although having some limitations, FTs are extensively used inthe field of risk analysis of process systems [1,9,10] and faultdiagnosis [11–13]. Standard FTs are not suitable for analyzinglarge systems, particularly if the system presents redundantfailures, common cause failures, or mutually exclusive primaryevents. More importantly, events in a FT are assumed indepen-dent, which is not usually a valid assumption [2,14,15].
In recent years, a Bayesian network (BN) methodology hasbegun to be used in engineering applications. A BN is a graphicalinference technique used to express the causal relationships
N. Khakzad et al. / Reliability Engineering and System Safety 96 (2011) 925–932926
among variables. BNs are used either to predict the probability ofunknown variables or to update the probability of known vari-ables given the certain state of other variables (evidence) throughthe process of probability propagation or reasoning. The reason-ing is based on Bayes’ theorem. Due to this ability, BNs haveprovided a promising framework for system safety analysis andrisk management [16].
BNs are increasingly used in reliability assessment [2,16–18],fault diagnosis [19,20], and updating the failure probability ofsafety systems [21,22] have examined the parallels between BNsand FTs and have shown the obvious superiority of BNs over FTsin terms of modeling and analysis capabilities. Bobbio et al. [14]showed that the limitations of FTs can be relaxed to a great extentby relying on BNs. Other relevant works have been done by eithermapping static FTs to BNs [15,23,24] or mapping dynamic FTs intothe corresponding dynamic BNs [22,25,26].
Many authors have investigated different techniques in acci-dent scenario analysis, very few of whom have used BNs in theirwork. Sklet [27] qualitatively compared some commonly usedmethods such as FT analysis, event tree analysis, and barrieranalysis for accident analysis. The comparison was made based oncriteria such as graphical representation and the ability to supportsafety barriers. Nivolianitou et al. [28] used FT, event tree, andPetri nets for a qualitative accident scenario analysis in anammonia storage plant, concluding that Petri nets are able toincorporate the evidence through scenario analysis and thus aremore appropriate for dynamic accident analysis. Zheng and Liu[29] made a comparison among some widely used methods foraccident forecasting. Although FT as a scenario analysis methodand BN were briefly discussed, the main focus in their researchwas devoted to methods such as regression models, time-seriesmethods, and neural networks.
Most recently, Weber et al. [30] gave an exhaustive statisticalreview of BN application in different areas such as risk andmaintenance analysis, in which BN was qualitatively comparedwith other methods such as FTs, Markov chains, and Petri nets. Thepresent work is aimed at showing the parallels between FTs andBNs in the specific area of accident modeling and process safetyanalysis, which have not been studied thus far. The paper alsodiscusses the modeling potential offered by BNs, making them asuperior method compared to FTs for dynamic safety analysis.
A brief description of the fundamentals of FTs, BNs, and themapping algorithm are presented in Section 2. The comparison ofthe two methods is done in Section 3, where a simple accidentscenario is modeled using both methods. Section 4 is devoted tothe application of BN to more complicated scenarios whichcannot be modeled using FTs. The conclusions and recommenda-tions for future work are presented in Section 5.
2. Failure analysis techniques
Many approaches have been developed for accident analysis,among which FT analysis is the most common. Recently BNs havedrawn much attention. In the subsequent subsections, bothapproaches are described, and the mapping algorithm from FTto BN is recapitulated.
2.1. Fault tree
FT is a deductive, structured methodology to determine thepotential causes of an undesired event, referred to as the topevent. The top event usually represents a major accident causingsafety hazards or economic loss [31]. While the top event isplaced at the top of the tree, the tree is constructed downwards,dissecting the system for further detail until the primary events
leading to the top event are known. Primary events are consid-ered binary (with two states) and statistically independent In anFT, the relationships between events are represented by means ofgates, of which AND-gates and OR-gates are the most widely used.
Once completed, the FT can be analyzed both qualitatively andquantitatively. In the qualitative evaluation, using Boolean algebra,an expression is derived for the top event in terms of combinationsof primary events. In the quantitative part, the probability of thetop event is expressed in terms of the occurrence probability of theprimary events or in terms of the minimal cut-sets.
Small FTs can be evaluated manually; however, large andcomplex FTs require the aid of computerized methods for evalua-tion. Methods for FT analysis include the analytical method,Monte Carlo simulation, and binary decision diagram. Due tolimitations in using the Monte Carlo simulation, an analyticalapproach (e.g., minimal cut-sets determination) is more fre-quently used for evaluation of a FT. To reduce the margin of errordue to inaccuracy and incompleteness of the data of the primaryevents, some authors have recently used fuzzy set theory andevidence theory in FT analysis [9,32–34].
2.2. Bayesian network
BNs are increasingly used for the construction of systemreliability models, risk management, and safety analysis basedon probabilistic and uncertain knowledge. Similar to FTs, BNsconsist of both qualitative and quantitative parts. BNs are directedacyclic graphs, in which the nodes represent variables, arcs signifydirect causal relationships between the linked nodes, and theconditional probability tables assigned to the nodes specify howstrongly the linked nodes influence each other [2].
BN takes advantage of the ‘‘d-separation’’ criterion (Jensen andNielsen, 2007) and the chain rule to perform quantitative analysis.Based on d-separation criteria, all root nodes are conditionallyindependent and the other nodes are conditionally dependent ononly their direct parents [14].
According to the conditional independence and the chain rule,BNs represent the joint probability distribution P(U) of variablesU¼{A1,y,An} included in the network as
PðUÞ ¼Yn
i ¼ 1
PðAi9PaðAiÞÞ ð1Þ
where PaðAiÞ are the parents of Ai in the BN, and P(U) reflects theproperties of the BN [35].
BNs’ main application in accident analysis is an inferenceengine for updating the prior occurrence probability of eventsgiven new information, called evidence E. The new information isusually operational data including occurrence or non-occurrenceof the accident or primary events:
PðU9EÞ ¼PðU,EÞ
PðEÞ¼
PðU,EÞPUPðU,EÞ
ð2Þ
Eq. (2) can be used for either probability prediction or prob-ability updating. In predictive analysis, conditional probabilitiesof the form P(accident9event) are calculated, indicating the occur-rence probability of a particular accident given the occurrence ornon-occurrence of a certain primary event. On the other hand, inupdating analysis, those of the form P(event9accident) are eval-uated, showing the occurrence probability of a particular eventgiven the occurrence of a certain accident [19].
2.3. Mapping fault trees to Bayesian networks
A mapping algorithm includes graphical and numerical tasks.In graphical mapping, primary events, intermediate events,and the top event of the FT are represented as root nodes,
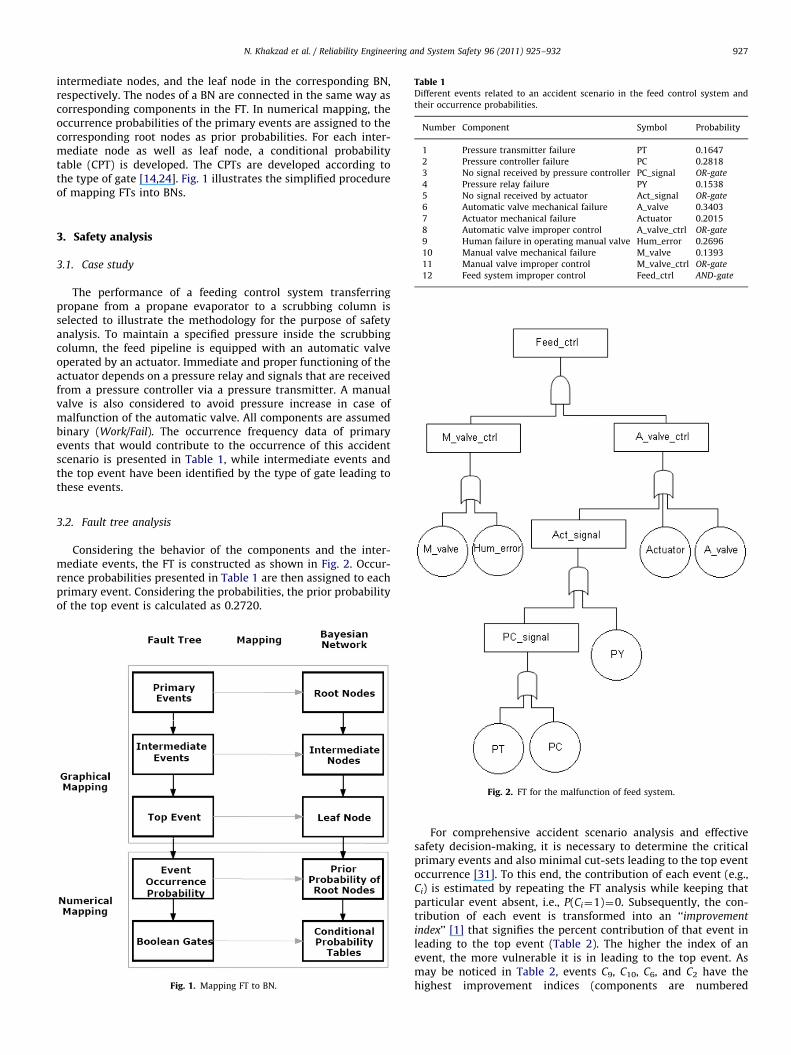
Table 1Different events related to an accident scenario in the feed control system and
their occurrence probabilities.
Number Component Symbol Probability
1 Pressure transmitter failure PT 0.1647
2 Pressure controller failure PC 0.2818
3 No signal received by pressure controller PC_signal OR-gate
4 Pressure relay failure PY 0.1538
5 No signal received by actuator Act_signal OR-gate
N. Khakzad et al. / Reliability Engineering and System Safety 96 (2011) 925–932 927
intermediate nodes, and the leaf node in the corresponding BN,respectively. The nodes of a BN are connected in the same way ascorresponding components in the FT. In numerical mapping, theoccurrence probabilities of the primary events are assigned to thecorresponding root nodes as prior probabilities. For each inter-mediate node as well as leaf node, a conditional probabilitytable (CPT) is developed. The CPTs are developed according tothe type of gate [14,24]. Fig. 1 illustrates the simplified procedureof mapping FTs into BNs.
6 Automatic valve mechanical failure A_valve 0.3403
7 Actuator mechanical failure Actuator 0.2015
8 Automatic valve improper control A_valve_ctrl OR-gate
9 Human failure in operating manual valve Hum_error 0.2696
10 Manual valve mechanical failure M_valve 0.1393
11 Manual valve improper control M_valve_ctrl OR-gate
12 Feed system improper control Feed_ctrl AND-gate
3. Safety analysis
3.1. Case study
The performance of a feeding control system transferringpropane from a propane evaporator to a scrubbing column isselected to illustrate the methodology for the purpose of safetyanalysis. To maintain a specified pressure inside the scrubbingcolumn, the feed pipeline is equipped with an automatic valveoperated by an actuator. Immediate and proper functioning of theactuator depends on a pressure relay and signals that are receivedfrom a pressure controller via a pressure transmitter. A manualvalve is also considered to avoid pressure increase in case ofmalfunction of the automatic valve. All components are assumedbinary (Work/Fail). The occurrence frequency data of primaryevents that would contribute to the occurrence of this accidentscenario is presented in Table 1, while intermediate events andthe top event have been identified by the type of gate leading tothese events.
3.2. Fault tree analysis
Considering the behavior of the components and the inter-mediate events, the FT is constructed as shown in Fig. 2. Occur-rence probabilities presented in Table 1 are then assigned to eachprimary event. Considering the probabilities, the prior probabilityof the top event is calculated as 0.2720.
Fig. 1. Mapping FT to BN.
Fig. 2. FT for the malfunction of feed system.
For comprehensive accident scenario analysis and effectivesafety decision-making, it is necessary to determine the criticalprimary events and also minimal cut-sets leading to the top eventoccurrence [31]. To this end, the contribution of each event (e.g.,Ci) is estimated by repeating the FT analysis while keeping thatparticular event absent, i.e., P(Ci¼1)¼0. Subsequently, the con-tribution of each event is transformed into an ‘‘improvement
index’’ [1] that signifies the percent contribution of that event inleading to the top event (Table 2). The higher the index of anevent, the more vulnerable it is in leading to the top event. Asmay be noticed in Table 2, events C9, C10, C6, and C2 have thehighest improvement indices (components are numbered
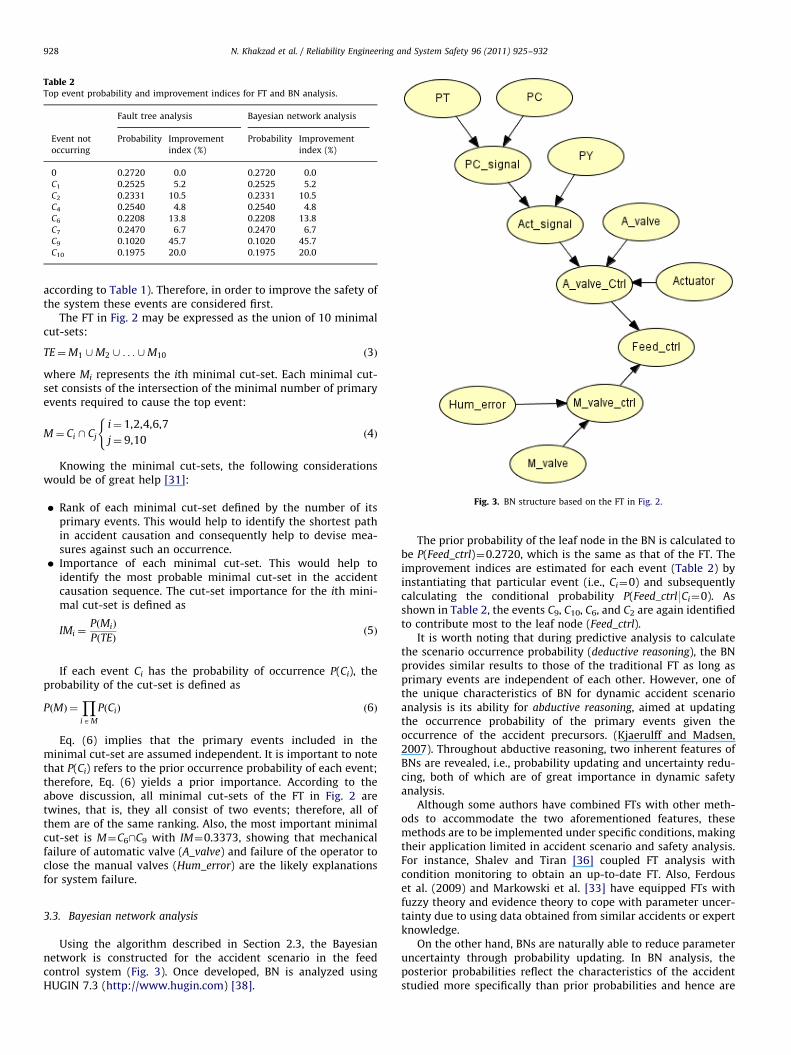
Table 2Top event probability and improvement indices for FT and BN analysis.
Fault tree analysis Bayesian network analysis
Event not
occurring
Probability Improvement
index (%)
Probability Improvement
index (%)
0 0.2720 0.0 0.2720 0.0
C1 0.2525 5.2 0.2525 5.2
C2 0.2331 10.5 0.2331 10.5
C4 0.2540 4.8 0.2540 4.8
C6 0.2208 13.8 0.2208 13.8
C7 0.2470 6.7 0.2470 6.7
C9 0.1020 45.7 0.1020 45.7
C10 0.1975 20.0 0.1975 20.0
N. Khakzad et al. / Reliability Engineering and System Safety 96 (2011) 925–932928
according to Table 1). Therefore, in order to improve the safety ofthe system these events are considered first.
The FT in Fig. 2 may be expressed as the union of 10 minimalcut-sets:
TE¼M1 [M2 [ . . . [M10 ð3Þ
where Mi represents the ith minimal cut-set. Each minimal cut-set consists of the intersection of the minimal number of primaryevents required to cause the top event:
M¼ Ci \ Cj
i¼ 1,2,4,6,7
j¼ 9,10
(ð4Þ
Knowing the minimal cut-sets, the following considerationswould be of great help [31]:
Fig. 3. BN structure based on the FT in Fig. 2.
� Rank of each minimal cut-set defined by the number of itsprimary events. This would help to identify the shortest pathin accident causation and consequently help to devise mea-sures against such an occurrence.
� Importance of each minimal cut-set. This would help toidentify the most probable minimal cut-set in the accidentcausation sequence. The cut-set importance for the ith mini-mal cut-set is defined as
IMi ¼PðMiÞ
PðTEÞð5Þ
If each event Ci has the probability of occurrence P(Ci), theprobability of the cut-set is defined as
PðMÞ ¼YiAM
PðCiÞ ð6Þ
Eq. (6) implies that the primary events included in theminimal cut-set are assumed independent. It is important to notethat P(Ci) refers to the prior occurrence probability of each event;therefore, Eq. (6) yields a prior importance. According to theabove discussion, all minimal cut-sets of the FT in Fig. 2 aretwines, that is, they all consist of two events; therefore, all ofthem are of the same ranking. Also, the most important minimalcut-set is M¼C6\C9 with IM¼0.3373, showing that mechanicalfailure of automatic valve (A_valve) and failure of the operator toclose the manual valves (Hum_error) are the likely explanationsfor system failure.
3.3. Bayesian network analysis
Using the algorithm described in Section 2.3, the Bayesiannetwork is constructed for the accident scenario in the feedcontrol system (Fig. 3). Once developed, BN is analyzed usingHUGIN 7.3 (http://www.hugin.com) [38].
The prior probability of the leaf node in the BN is calculated tobe P(Feed_ctrl)¼0.2720, which is the same as that of the FT. Theimprovement indices are estimated for each event (Table 2) byinstantiating that particular event (i.e., Ci¼0) and subsequentlycalculating the conditional probability P(Feed_ctrl9Ci¼0). Asshown in Table 2, the events C9, C10, C6, and C2 are again identifiedto contribute most to the leaf node (Feed_ctrl).
It is worth noting that during predictive analysis to calculatethe scenario occurrence probability (deductive reasoning), the BNprovides similar results to those of the traditional FT as long asprimary events are independent of each other. However, one ofthe unique characteristics of BN for dynamic accident scenarioanalysis is its ability for abductive reasoning, aimed at updatingthe occurrence probability of the primary events given theoccurrence of the accident precursors. (Kjaerulff and Madsen,2007). Throughout abductive reasoning, two inherent features ofBNs are revealed, i.e., probability updating and uncertainty redu-cing, both of which are of great importance in dynamic safetyanalysis.
Although some authors have combined FTs with other meth-ods to accommodate the two aforementioned features, thesemethods are to be implemented under specific conditions, makingtheir application limited in accident scenario and safety analysis.For instance, Shalev and Tiran [36] coupled FT analysis withcondition monitoring to obtain an up-to-date FT. Also, Ferdouset al. (2009) and Markowski et al. [33] have equipped FTs withfuzzy theory and evidence theory to cope with parameter uncer-tainty due to using data obtained from similar accidents or expertknowledge.
On the other hand, BNs are naturally able to reduce parameteruncertainty through probability updating. In BN analysis, theposterior probabilities reflect the characteristics of the accidentstudied more specifically than prior probabilities and hence are
N. Khakzad et al. / Reliability Engineering and System Safety 96 (2011) 925–932 929
less uncertain. This is because posteriors, unlike priors, areprobabilities that have been updated using the accident’s latestinformation. BN can repetitively substitute the posteriors forpriors in the accident re-analysis when a new set of accident-related information is observed. This substitution not only con-tinuously reduces the data uncertainty, but it also provides theaccident scenario with real-time and up-to-date analysis.
3.4. Probability updating
Beyond the usual measures available in FTs, BN is able toperform probability updating analysis, given new observations[14]. In this regard, the computation of the posterior marginalprobabilities of root nodes given the scenario occurrence is themost popular (i.e., abductive reasoning). To this end, the posteriorprobability of each root node Ci is calculated using P(Ci9Feed_ctrl),indicating the probability of Ci conditioned to the Feed_ctrl
malfunction (column 4 of Table 3).It may be observed from Table 3 that the occurrence prob-
ability of the events C9, C10, and C11 had the highest increase. Also,event severity ranking based on posteriors is different from thatbased on priors. Based on the event posterior probabilities, themost important minimal cut-set is defined as M¼C6\C9 (the sameas in the FT) with the posterior importance index as IM¼0.3372.It is to be noted that in the calculation of the posterior importanceindex, P(Feed_ctrl)¼1 is considered.
The posterior joint probability of all the primary events giventhe accident occurrence is much more helpful than the mostimportant minimal cut-set if a precise and comprehensive safetyanalysis is desired. This is because the latter does not provide anyinformation about the occurrence or non-occurrence of theprimary events not included in it [14].
To determine the most probable state of all the variables giventhe accident occurrence, the most probable configuration, the BNsearches over the state space of each variable to identify weaklinks. Using the most probable explanation concept, the mostprobable state given the accident occurrence is the one corre-sponding to the occurrence of the primary events C6, C9, and C10,and the non-occurrence of the other primary events:
PðC1,C2,C4,C6,C7,C9,C109Feed_ctrlÞ ¼ 0:1179
It is important to note that unlike the posterior minimal cut-set, which identifies C6 and C9 as the most likely causes for systemfailure, the most probable explanation provides more informationby adding C10 to the foregoing set. Also, it implies that the othernon-mentioned events do not contribute to system failure. In thisregard, using BN in safety analysis helps to identify critical events
Table 3Comparison between prior and posterior probabilities in different modeling steps.
Number Component First modeling Alarm m
Prior Posterior Prior
1 PT 0.1647 0.2248 0.1647
2 PC 0.2818 0.3847 0.2818
3 PC_signal 0.4001 0.5461 0.4001
4 PY 0.1538 0.2099 0.1538
5 Act_signal 0.4924 0.6721 0.4924
6 A_valve 0.3403 0.4645 0.3403
7 Actuator 0.2015 0.2751 0.2015
8 A_valve_ctrl 0.7326 1.0000 0.7326
9 Hum_error 0.2696 0.7260 0.2696
10 M_valve 0.1393 0.3751 0.1393
11 M_valve_ctrl 0.3713 1.0000 0.3713
12 Feed_ctrl 0.2720 1.0000 0.1146
13 Alarm 0.2614, 0
and allocate preventative safety barriers not only to the primaryevents directly leading to the top event but also to weak links(combination of non-critical events).
4. Modeling techniques
Modeling aspects of BN such as handling multi-state variables,sequentially dependent failures, and uncertainty handling arediscussed in this section to demonstrate that BN has a moreflexible structure than FT, and is also a preferred option over FTfor modeling some accident scenarios.
4.1. Multi-state variables and dependent failures
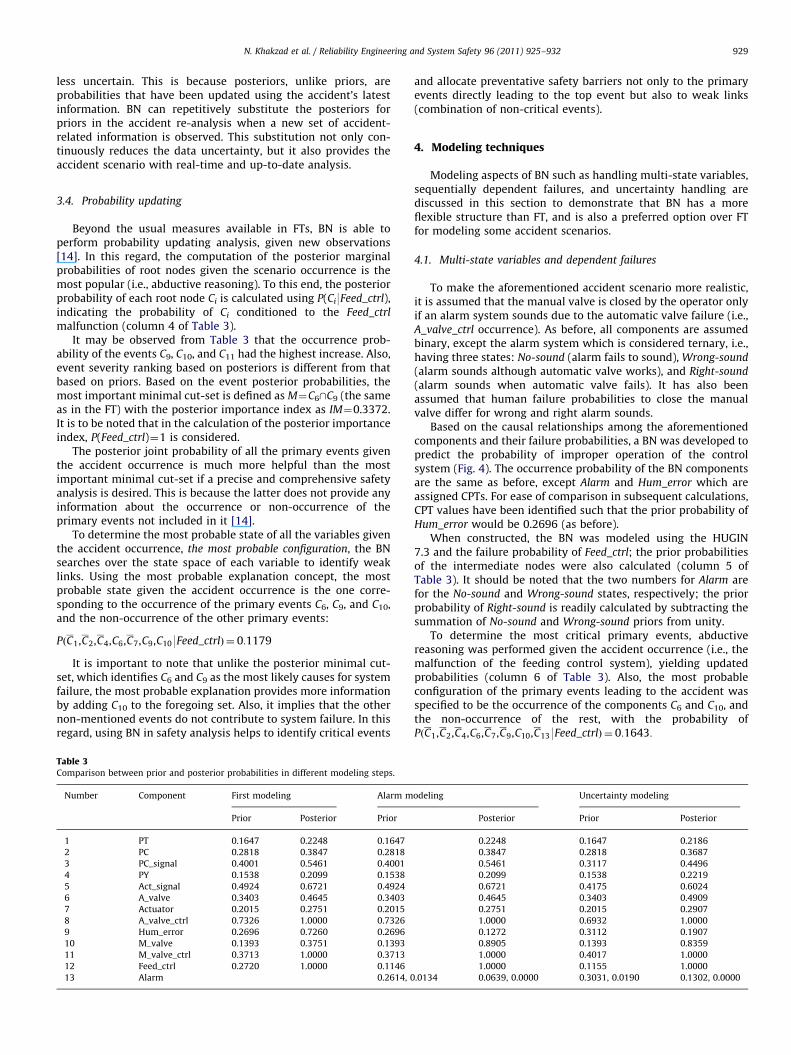
To make the aforementioned accident scenario more realistic,it is assumed that the manual valve is closed by the operator onlyif an alarm system sounds due to the automatic valve failure (i.e.,A_valve_ctrl occurrence). As before, all components are assumedbinary, except the alarm system which is considered ternary, i.e.,having three states: No-sound (alarm fails to sound), Wrong-sound
(alarm sounds although automatic valve works), and Right-sound
(alarm sounds when automatic valve fails). It has also beenassumed that human failure probabilities to close the manualvalve differ for wrong and right alarm sounds.
Based on the causal relationships among the aforementionedcomponents and their failure probabilities, a BN was developed topredict the probability of improper operation of the controlsystem (Fig. 4). The occurrence probability of the BN componentsare the same as before, except Alarm and Hum_error which areassigned CPTs. For ease of comparison in subsequent calculations,CPT values have been identified such that the prior probability ofHum_error would be 0.2696 (as before).
When constructed, the BN was modeled using the HUGIN7.3 and the failure probability of Feed_ctrl; the prior probabilitiesof the intermediate nodes were also calculated (column 5 ofTable 3). It should be noted that the two numbers for Alarm arefor the No-sound and Wrong-sound states, respectively; the priorprobability of Right-sound is readily calculated by subtracting thesummation of No-sound and Wrong-sound priors from unity.
To determine the most critical primary events, abductivereasoning was performed given the accident occurrence (i.e., themalfunction of the feeding control system), yielding updatedprobabilities (column 6 of Table 3). Also, the most probableconfiguration of the primary events leading to the accident wasspecified to be the occurrence of the components C6 and C10, andthe non-occurrence of the rest, with the probability ofPðC1,C2,C4,C6,C7,C9,C10,C139Feed_ctrlÞ ¼ 0:1643:
odeling Uncertainty modeling
Posterior Prior Posterior
0.2248 0.1647 0.2186
0.3847 0.2818 0.3687
0.5461 0.3117 0.4496
0.2099 0.1538 0.2219
0.6721 0.4175 0.6024
0.4645 0.3403 0.4909
0.2751 0.2015 0.2907
1.0000 0.6932 1.0000
0.1272 0.3112 0.1907
0.8905 0.1393 0.8359
1.0000 0.4017 1.0000
1.0000 0.1155 1.0000
.0134 0.0639, 0.0000 0.3031, 0.0190 0.1302, 0.0000
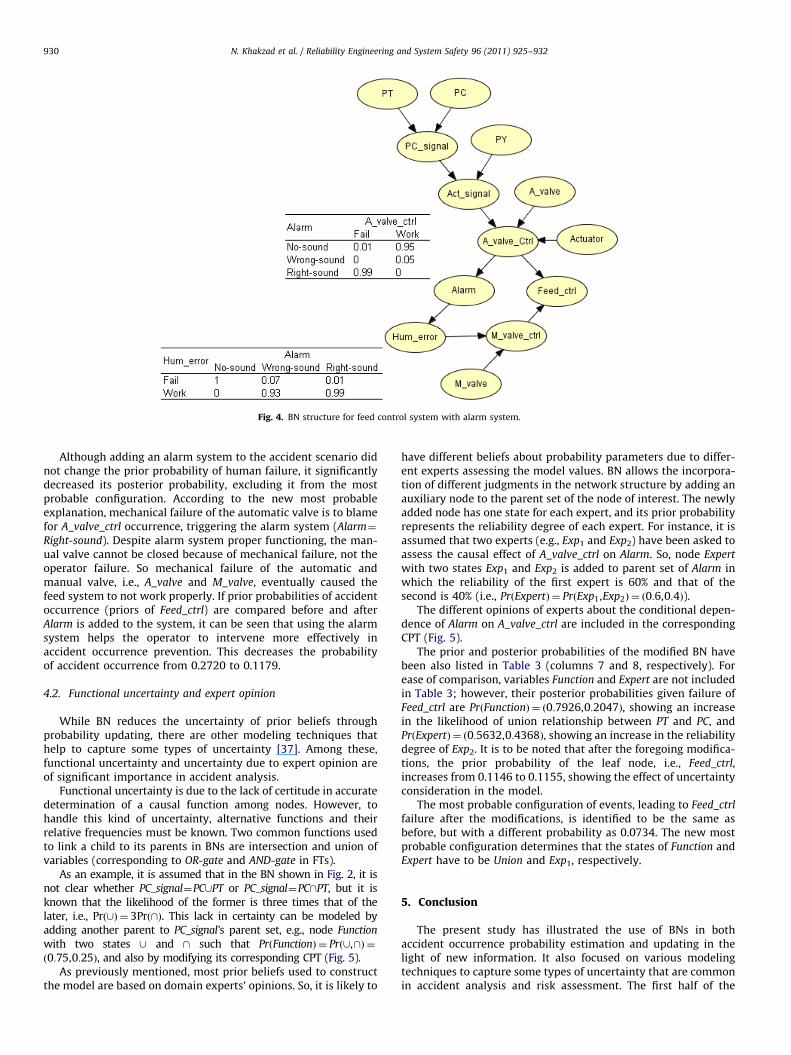
Fig. 4. BN structure for feed control system with alarm system.
N. Khakzad et al. / Reliability Engineering and System Safety 96 (2011) 925–932930
Although adding an alarm system to the accident scenario didnot change the prior probability of human failure, it significantlydecreased its posterior probability, excluding it from the mostprobable configuration. According to the new most probableexplanation, mechanical failure of the automatic valve is to blamefor A_valve_ctrl occurrence, triggering the alarm system (Alarm¼
Right-sound). Despite alarm system proper functioning, the man-ual valve cannot be closed because of mechanical failure, not theoperator failure. So mechanical failure of the automatic andmanual valve, i.e., A_valve and M_valve, eventually caused thefeed system to not work properly. If prior probabilities of accidentoccurrence (priors of Feed_ctrl) are compared before and afterAlarm is added to the system, it can be seen that using the alarmsystem helps the operator to intervene more effectively inaccident occurrence prevention. This decreases the probabilityof accident occurrence from 0.2720 to 0.1179.
4.2. Functional uncertainty and expert opinion
While BN reduces the uncertainty of prior beliefs throughprobability updating, there are other modeling techniques thathelp to capture some types of uncertainty [37]. Among these,functional uncertainty and uncertainty due to expert opinion areof significant importance in accident analysis.
Functional uncertainty is due to the lack of certitude in accuratedetermination of a causal function among nodes. However, tohandle this kind of uncertainty, alternative functions and theirrelative frequencies must be known. Two common functions usedto link a child to its parents in BNs are intersection and union ofvariables (corresponding to OR-gate and AND-gate in FTs).
As an example, it is assumed that in the BN shown in Fig. 2, it isnot clear whether PC_signal¼PC[PT or PC_signal¼PC\PT, but it isknown that the likelihood of the former is three times that of thelater, i.e., Prð[Þ ¼ 3Prð\Þ. This lack in certainty can be modeled byadding another parent to PC_signal’s parent set, e.g., node Function
with two states [ and \ such that PrðFunctionÞ ¼ Prð[,\Þ ¼ð0:75,0:25Þ, and also by modifying its corresponding CPT (Fig. 5).
As previously mentioned, most prior beliefs used to constructthe model are based on domain experts’ opinions. So, it is likely to
have different beliefs about probability parameters due to differ-ent experts assessing the model values. BN allows the incorpora-tion of different judgments in the network structure by adding anauxiliary node to the parent set of the node of interest. The newlyadded node has one state for each expert, and its prior probabilityrepresents the reliability degree of each expert. For instance, it isassumed that two experts (e.g., Exp1 and Exp2) have been asked toassess the causal effect of A_valve_ctrl on Alarm. So, node Expert
with two states Exp1 and Exp2 is added to parent set of Alarm inwhich the reliability of the first expert is 60% and that of thesecond is 40% (i.e., PrðExpertÞ ¼ PrðExp1,Exp2Þ ¼ ð0:6,0:4Þ).
The different opinions of experts about the conditional depen-dence of Alarm on A_valve_ctrl are included in the correspondingCPT (Fig. 5).
The prior and posterior probabilities of the modified BN havebeen also listed in Table 3 (columns 7 and 8, respectively). Forease of comparison, variables Function and Expert are not includedin Table 3; however, their posterior probabilities given failure ofFeed_ctrl are PrðFunctionÞ ¼ ð0:7926,0:2047Þ, showing an increasein the likelihood of union relationship between PT and PC, andPrðExpertÞ ¼ ð0:5632,0:4368Þ, showing an increase in the reliabilitydegree of Exp2. It is to be noted that after the foregoing modifica-tions, the prior probability of the leaf node, i.e., Feed_ctrl,increases from 0.1146 to 0.1155, showing the effect of uncertaintyconsideration in the model.
The most probable configuration of events, leading to Feed_ctrl
failure after the modifications, is identified to be the same asbefore, but with a different probability as 0.0734. The new mostprobable configuration determines that the states of Function andExpert have to be Union and Exp1, respectively.
5. Conclusion
The present study has illustrated the use of BNs in bothaccident occurrence probability estimation and updating in thelight of new information. It also focused on various modelingtechniques to capture some types of uncertainty that are commonin accident analysis and risk assessment. The first half of the
Fig. 5. Modified BN to capture functional uncertainty and expert opinion.
N. Khakzad et al. / Reliability Engineering and System Safety 96 (2011) 925–932 931
paper was devoted to common features of FT and BN, where a FTwas used to construct a corresponding BN. Although both meth-ods resulted in similar estimations for accident occurrence prob-ability, it was the BN that was able to update the prior beliefsabout the accident by taking new information into account and bytaking advantage of probability updating. The second half of thepaper discussed those aspects and modeling issues of BN whichFT is incapable of handling, such as multi-state variables, depen-dent failures and uncertainty. The main conclusions of this studycan be summarized as follows:
1.
By propagation of new observations through the network, BNupdates the prior probabilities, yielding posterior probabilities.These posteriors, unlike priors that are based mainly ongeneric data and expert knowledge, are more specific to theaccident studied and better reflect its characteristics.2.
The calculation of CPTs requires a comprehensive study ofcausal relationships and a huge amount of data usuallyprovided by domain experts. However, the current study hasshown that a BN is a superior technique to a traditional FTeven if its CPTs are developed deterministically (Fig. 3). Thismay be helpful in situations where there is not enoughinformation to estimate the CPT values probabilistically.3.
Considering minimal cut-set importance, it is observed that BNproduces a more reliable measure of such importance byproviding the most probable configuration of primary eventsleading to an accident. Unlike minimal cut-sets, the mostprobable configuration provides information about both occur-rence and non-occurrence of primary events.4.
Each FT can be mapped to its corresponding BN, while a BNdoes not necessarily have an equivalent FT due to multi-statevariables, different causal relationships rather than simpleBoolean functions such as OR-gate and AND-gate, and sequen-tially dependent failures. BNs are also able to handle uncer-tainty without coupling by other methods, i.e., by simplymodifying their structure.In general, BN has a much more flexible structure than FT,fitting to a wide range of accident scenarios. Its ability forabductive reasoning and uncertainty handling makes it a moresuitable technique for real-time accident analysis and moreimportantly, for design and evaluation of safety measures. How-ever, before BNs can be used in a comprehensive accident risk
assessment, their applicability in accident consequence analysis,safety barrier implementation, and decision making must beexamined thoroughly.
Acknowledgment
The authors gratefully acknowledge the support provided byQatar National Research Foundation through National PriorityResearch Program (08-074-2-015) and the Natural Sciences andEngineering Research Council of Canada.
References
[1] Khan FI, Sadiq R, Husain T. Risk-based process safety assessment and controlmeasures design for offshore process facilities. Journal of Hazardous Materi-als 2001;A94:1–36.
[2] Torres-Toledano JG, Sucar LE. Bayesian networks for reliability analysis ofcomplex systems. Lecture notes in computer science 1998;1484:195–206.
[3] CNN. (2005). /http://www.cnn.com/2005/US/03/23/plant.blast/index.htmlS(last checked on 29.06.10).
[4] BP. (2005). /http://www.bp.com/genericarticle.do?categoryId=2012968S &contentId¼7012963 (last checked on 29.06.10).
[5] Reuters. (2010). /http://www.reuters.com/article/idUSTRE61619Q20100207S(last checked on 25.06.10).
[6] Reuters. (2010). /http://www.reuters.com/article/idUSTRE6482L220100510S(last checked on 29.06.10).
[7] Khan FI. Use maximum-credible accident scenarios for realistic and reliablerisk assessment. Chemical Engineering Progress 2001;11:56–64.
[8] Delvosalle C, Fievez C, Pipart A, Debray B. ARAMIS project: a comprehensivemethodology for the identification of reference accident scenarios in processindustries. Journal of Hazardous Materials 2006;130:200–19.
[9] Ferdous R, Khan FI, Veitch B, Amyotte P. Methodology for computer aidedfuzzy FT analysis. Journal of Process safety and Environmental Protection2009;87:217–26.
[10] Ferdous R, Khan FI, Veitch B, Amyotte P. Methodology for computer-aided FTanalysis. Process Safety and Environmental Protection 2007;85:70–80.
[11] Khoo LP, Tor SB, Li JR. A rough set approach to the ordering of basic events ina FT for fault diagnosis. International Journal of Advanced ManufacturingTechnology 2001;17:769–74.
[12] Bartlett LM, Hurdle EE, Kelly EM. Integrated system fault diagnostics utilizingdiagraph and FT-based approach. Journal of Reliability Engineering andSystem Safety 2009;94:1107–15.
[13] Kavcic M, Juricic D. CAD for FT-based diagnosis of industrial processes.Journal of Engineering Application of Artificial Intelligence 2001;14:203–16.
[14] Bobbio A, Portinale L, Minichino M, Ciancamerla E. Improving the analysis ofdependable systems by mapping FTs into Bayesian networks. Journal ofReliability Engineering and System Safety 2001;71:249–60.
[15] Simon C, Weber P, Levrat E. Bayesian networks and evidence theory to modelcomplex systems reliability. Journal of Computers 2007;2:33–43.
N. Khakzad et al. / Reliability Engineering and System Safety 96 (2011) 925–932932
[16] Mahadevan S, Zhang R, Smith N. Bayesian networks for system reliabilityreassessment. Journal of Structural Safety 2001;23:231–51.
[17] Langseth H, Portinale L. Bayesian networks in reliability. Journal of Reliability
Engineering and System Safety 2007;92:92–108.[18] Wilson AG, Huzurbazar AV. Bayesian networks for multilevel system relia-
bility. Journal of Reliability Engineering and System Safety 2007;92:1413–20.[19] Przytula, K.W., & Thompson, D. (2000). Construction of Bayesian networks for
diagnostics. In: Proceedings of IEEE aerospace conference, vol.5. p. 193–200.[20] Huang Y, McMurran R, Dhadyalla G, Jones RP. Probability based vehicle fault
diagnosis: Bayesian network method. Journal of Intelligent Manufacturing2008;19:301–11.
[21] Giribone R, Valette B. Principles of failure probability assessment (PoF).International Journal of Pressure Vessels and Piping 2004;81:797–806.
[22] Boudali H, Dugan JB. A new Bayesian approach to solve dynamic FTs. Proceed-ings of Reliability and Maintainability Symposium (RAMS’05) 2005:451–6.
[23] Graves TL, Hamada MS, Klamann R, Koehler A, Martz HF. A fully Bayesianapproach for combining multi-level information in multi-state FT quantifica-tion. Journal of Reliability Engineering and System Safety 2007;92:1476–83.
[24] Lampis M, Andrews D. Bayesian belief networks for system fault diagnostics.International Journal of Quality and Reliability Engineering 2009;25:409–26.
[25] Montani S, Portinale L, Bobbio A, Codetta-Raiteri D. RADYBAN: a tool forreliability analysis of dynamic FTs through conversion into dynamic Bayesian
networks. Journal of Reliability Engineering and System Safety 2008;93:922–32.[26] Montani S, Portinale L, Bobbio A, Codetta-Raiteri D. Automatically translating
dynamic FTs into dynamic Bayesian networks by means of a softwaretool. Proceedings of Reliability and Maintainability Symposium (RAMS’06)2006:434–41.
[27] Sklet S. Comparison of some selected methods for accident investigation.Journal of Hazardous Materials 2004;111:29–37.
[28] Nivolianitou ZS, Leopoulos VN, Konstantinidou M. Comparison of techniquesfor accident scenario analysis in hazardous systems. Journal of Loss Preven-tion in the Process Industries 2004;17:467–75.
[29] Zheng X, Liu M. An overview of accident forecasting methodologies. Journalof Loss Prevention in the Process Industries 2009;22:484–91.
[30] Weber, P., Medina-Oliva, G., Simon, C., & Iung, B. (2010). Overview onBayesian networks applications for dependability, risk analysis, and main-tenance areas. Engineering Application of Artificial Intelligence, doi:10.1016/j.engappai.2010.06.002.
[31] Lewis EE. Introduction to reliability engineering. 2nd ed. New York:John Wiley& Sons; 1994.
[32] Lin C-T, Wang M-JJ. Hybrid FT analysis using fuzzy sets. Journal of ReliabilityEngineering and System Safety 1997;58:205–13.
[33] Markowski AS, Mannan MS, Bigoszewska A. Fuzzy logic for process safetyanalysis. Journal of Loss Prevention in the Process Industries 2009;22:695–702.
[34] Yuhua D, Datao Y. Estimation of failure probability of oil and gas transmis-sion pipelines by fuzzy FT analysis. Journal of Loss Prevention in the ProcessIndustries 2005;18:83–8.
[35] Jensen FV, Nielsen TD. Bayesian networks and decision graphs. 2nd ed.New York: Springer; 2007.
[36] Shalev DM, Tiran J. Condition-based FT analysis (CBFTA): a new method forimproved fault tee analysis (FTA), reliability and safety calculations. Journalof Reliability Engineering and System Safety 2007;92:1231–41.
[37] Kjaerulff UB, Madsen AL. Bayesian networks and influence diagrams: a guideto construction and analysis. New York: Springer; 2007.
[38] HUGIN Expert software version 7.3 (2010). /http://www.hugin.comS.