SAARI-DISSERTATION-2018.pdf (5.904Mb)
232
ABSTRACT Individual and Interactive Influences of Low Dissolved Oxygen and Calcium Channel Blockers in Inland Aquatic Systems Gavin N. Saari, B.S. Mentor: Bryan W. Brooks, Ph.D. Understanding and managing influences of multiple stressors represents a major water quality challenge, particularly in urbanizing regions. Because aquatic hazard assessments with chemical and nonchemical stressors can identify the global trends in occurrence and hazards of stressors for the protection of aquatic life, probabilistic aquatic hazard assessments were performed to examine whether water quality guidelines for dissolved oxygen (DO) are protective of aquatic life in inland waters. My analyses indicate that adverse effects of low DO to freshwater invertebrates and fish have been underestimated in inland waters. Additional low DO threshold information, including sublethal toxicity, for additional species such as warm water fish and mollusks across multiple life history stages is necessary to support environmental assessment and management of ecosystem protection goals. Similar techniques were used to examine the occurrence of calcium channel blockers (CCBs), a common class of vasodilators and cardio suppressants, in environmental matrices, and to predict hazards to non-target aquatic organisms in multiple environmental matrices and geographic regions. Whereas
-
Upload
khangminh22 -
Category
Documents
-
view
0 -
download
0
Transcript of SAARI-DISSERTATION-2018.pdf (5.904Mb)

ABSTRACT
Individual and Interactive Influences of Low Dissolved Oxygen and Calcium Channel Blockers in Inland Aquatic Systems
Gavin N. Saari, B.S.
Mentor: Bryan W. Brooks, Ph.D.
Understanding and managing influences of multiple stressors represents a major
water quality challenge, particularly in urbanizing regions. Because aquatic hazard
assessments with chemical and nonchemical stressors can identify the global trends in
occurrence and hazards of stressors for the protection of aquatic life, probabilistic aquatic
hazard assessments were performed to examine whether water quality guidelines for
dissolved oxygen (DO) are protective of aquatic life in inland waters. My analyses
indicate that adverse effects of low DO to freshwater invertebrates and fish have been
underestimated in inland waters. Additional low DO threshold information, including
sublethal toxicity, for additional species such as warm water fish and mollusks across
multiple life history stages is necessary to support environmental assessment and
management of ecosystem protection goals. Similar techniques were used to examine the
occurrence of calcium channel blockers (CCBs), a common class of vasodilators and
cardio suppressants, in environmental matrices, and to predict hazards to non-target
aquatic organisms in multiple environmental matrices and geographic regions. Whereas

environmental occurrence of CCBs in freshwater and effluent have predominantly been
reported from North America and Europe, data is lacking from many developing regions
around the world and hazards and risks of CCBs to non-target biota remains poorly
understood. Therapeutic hazard values (THVs), a comparative pharmacology and
toxicology approach, employed during probabilistic hazard assessments with
environmental exposure distributions revealed that amlodipine and verapamil in effluent
and freshwater exceeded THVs 28% of the time. Diltiazem exceeded minimum human
therapeutic thresholds based on observations in fish plasma from the field ~18% of the
time in surface waters. This approach demonstrated the utility of global assessments to
identify specific CCBs and geographic regions where environmental assessments appear
necessary. Subsequently, to understand adverse effects of individual and multiple
stressors influencing cardiac function (DO, diltiazem, or DO x diltiazem), toxicity studies
were performed using a comparative toxicology and pharmacology approach in fathead
minnows (Pimephales promelas) across larval and adult life stages. DO x diltiazem
toxicity studies with larval fish revealed acute lethality increased with decreasing DO
levels and altered burst swimming behavior at DO water quality criteria levels deemed
protective of aquatic life. In adult fathead minnows, low DO (3.0 mg DO/L) increased
uptake of diltiazem and altered physiological responses (e.g., hematocrit, plasma lactate)
at and above human therapeutic plasma levels. Failing to consider low DO influences
with chemical exposure during toxicological studies of cardioactive medications and
potentially other cardiotoxicants underestimates adverse outcomes in fish.

Page bearing signatures is kept on file in the Graduate School.
Individual and Interactive Influences of Low Dissolved Oxygen and Calcium Channel Blockers in Inland Aquatic Systems
by
Gavin N. Saari, B.S.
A Dissertation
Approved by the Department of Environmental Science
George P. Cobb, Ph.D., Chairperson
Submitted to the Graduate Faculty of Baylor University in Partial Fulfillment of the
Requirements for the Degree of
Doctor of Philosophy
Approved by the Dissertation Committee
Bryan W. Brooks, Ph.D., Chairperson
Erica D. Bruce, Ph.D.
Cole W. Matson, Ph.D.
Ramon Lavado, Ph.D.
C. Kevin Chambliss, Ph.D.
Accepted by the Graduate SchoolDecember 2018
J. Larry Lyon, Ph.D., Dean

Copyright © 2018 by Gavin N. Saari
All rights reserved

v
TABLE OF CONTENTS
LIST OF FIGURES ......................................................................................................... viii
LIST OF TABLES ............................................................................................................ xv
ACKNOWLEDGMENTS ................................................................................................ xx
DEDICATION ................................................................................................................ xxii
CHAPTER ONE ................................................................................................................. 1 Introduction ..................................................................................................................1
Background and Significance ..................................................................................... 1
Scope of Dissertation .................................................................................................. 5
CHAPTER TWO ................................................................................................................ 6 Revisiting Inland Hypoxia: Diverse Exceedances of Dissolved Oxygen Thresholds for Freshwater Aquatic Life .........................................................................................6 Abstract ........................................................................................................................6
Introduction ................................................................................................................. 7
Methods ..................................................................................................................... 11
Results ....................................................................................................................... 15
Discussion ................................................................................................................. 28
References ................................................................................................................. 36
CHAPTER THREE .......................................................................................................... 41 Global Scanning Assessment of Calcium Channel Blockers in the Environment: Review and Analysis of Occurrence, Ecotoxicology and Hazards in Aquatic Systems ....................................................................................................................................41
Abstract ......................................................................................................................41
Introduction ............................................................................................................... 42
Methods and Materials .............................................................................................. 44
Results and Discussion ............................................................................................. 48
Conclusions ............................................................................................................... 73
Acknowledgement .................................................................................................... 75
References ................................................................................................................. 76
CHAPTER FOUR ............................................................................................................. 82

vi
Influence of Diltiazem on Fathead Minnow Responses Across Dissolved Oxygen Gradients ...................................................................................................................82 Abstract ......................................................................................................................82
Introduction ............................................................................................................... 83
Materials and Methods .............................................................................................. 85 Results ....................................................................................................................... 93
Discussion ............................................................................................................... 103
Acknowledgments ................................................................................................... 115
References ............................................................................................................... 116
CHAPTER FIVE ............................................................................................................ 125 Low Dissolved Oxygen Increases Uptake of a Model Calcium Channel Blocker by its Effects on Swimming Performance of Pimephales promelas .............................125
Abstract ................................................................................................................... 125
Introduction ............................................................................................................. 126
Materials and Methods ............................................................................................ 131
Results ..................................................................................................................... 139
Discussion ............................................................................................................... 156
Conclusions ............................................................................................................. 157 Acknowledgments ................................................................................................... 157
References ............................................................................................................... 158
APENDICES................................................................................................................... 125 APPENDIX A ................................................................................................................. 166
Supplemental Information for Chapter Two ............................................................166
APPENDIX B ................................................................................................................. 181
Supplementary Information for Chapter .................................................................181
APPENDIX C ................................................................................................................. 186
Supplementary Information for Chapter Four .........................................................186
APPENDIX D ................................................................................................................. 198
Supplementary Information for Chapter Four .........................................................198 COMBINED REFERENCES ......................................................................................... 200

vii
LIST OF FIGURES
Figure 1: Aquatic hazard assessments of invertebrate and fish dissolved oxygen thresholds from both acute and chronic lethality (LC50) and chronic fish growth (EC) toxicity studies. (A) All acute (2-96 h) invertebrate toxicity data (LC50s) relative to those classified as published pre and post the United States Environmental Protection Agency’s Ambient Water Quality Criteria (1986); (B) Acute Lotic, Lentic, and Lotic and Lentic invertebrate (LC50s); (C) Acute invertebrate data (LC50s) divided into the orders (taxa) Ephemeroptera, Plecoptera, and Trichoptera (EPT) or non-EPT taxa; (D) acute and chronic invertebrate toxicity data (LC50s); (E) Chronic warm and cold water fish growth effect concentrations (EC50) relative to acute fish acute toxicity data (LC50); (F) Acute fish and invertebrate toxicity data (LC50) relative to acute invertebrate or acute fish toxicity data (LC50). Vertical lines (left to right) represent water quality criteria for DO subcategory high aquatic life use, commonly assigned to water bodies in Texas, where 24-hour DO minimum are not to extend beyond 8 hours (3 mg/L, dotted) and the 24-hour mean minimum (5 mg/L, long dash) that cannot be exceeded over 24 hours (TCEQ, 2010).. ...................... 22 Figure 2: Peer-reviewed studies reportin the occurrence of calcium channel blockers in environmental matrices through time (until March 2017). .......................................... 49 Figure 3: Global calcium channel blocker (CCB) environmental exposure distributions of maximum measured environmental concentrations in influent sewage, effluent, freshwater, and saltwater. Numbers within parenthesis indicate the number of detections in each matrix. Four different CCBs, which were detected throughout different geographic regions, are included in each matrix EED.. ................. 54 Figure 4: Environmental exposure distributions of maximum measured effluent concentrations for diltiazem, verapamil, and amlodipine across all and within specific geographic regions. Numbers within parenthesis indicate the number of detections in each geographic region. Vertical short dashed lines represent the therapeutic hazard value (THV) for a calcium channel blocker.. .................................... 55 Figure 5: Environmental exposure distributions of maximum measured freshwater and saltwater concentrations for diltiazem, verapamil, and nifedipine and its metabolite dehydronifedipine across all and within specific geographic regions. Numbers within parenthesis indicate the number of detections in each geographic region. Vertical short dashed lines represent the therapeutic hazard value (THV) for a calcium channel blocker ................................................................................................ 55

viii
Figure 6: Probabilistic hazard assessment of mean measured fish plasma diltiazem concentrations from several freshwater and saltwater species across all geographic regions. Numbers within parenthesis indicate the number of detected diltiazem concentrations acrsoss all geographic regions within each water matrix. Vertical small dashed line represents the diltiazem minimum human therapeutic plasma level (Cmin = 30 ng/mL).therapeutic hazard value (THV) for a calcium channel blocker. ....... 70 Figure 7: Probabilistic hazard assessment of maximum measured environmental concentrations for diltiazem and verapamil in effluent reported from the same study across all geographic regions. Numbers within parenthesis indicate the number of each detected CCB acrsoss all geographic regions. Vertical dotted lines represents the therapeutic hazard value (THV) for verapamil (157 ng/L) and the vertical short dasehd line represents the THV for diltiazem (1618 ng/L). Horizontal short-short-long dashed lines represent percentile value when an additive therapeutic hazard ratio (THR) equaled 1. ..................................................................................................... 73 Figure 8: Mean (±SD, N=3 studies) percent survival by Pimephales promelas larvae following 48 h A) dissolved oxygen (DO), B) diltiazem or C) DO x diltiazem studies. Moderate and low DO x diltiazem studies were conducted in separate experiments (C) with a normal DO treatment (black circles = normal and moderate DO x diltiazem study; gray circles = normal and low DO x diltiazem study). *: p < 0.05................................................................................................................................... 98 Figure 9: Baseline behavior activity of unexposed Pimephales promelas larvae. Mean (±SE) total distance traveled per minute by P. promelas larvae following A) 48 h or B) 7 d studies. Two dark and two light photoperiod responses were measured. A total of 72 (18 replicates each of 4 larvae) and 64 (16 replicates of 4 fish) P. promelas from 48 h and 7 d studies, respectively, were used for each baseline behavioral observation. Data presented as total distance traveled by unexposed larval fish across three speed categories in the light (white background) or dark (gray background).. ............................................................................................. 98 Figure 10: Mean (±SE) distance traveled per minute by Pimephales promelas larvae following 48 h (panels A, B, C; N=3 studies) or 7 d (panels D, E, F; N=4, n=4-5) studies across dissolved oxygen (DO) gradients. Data presented as distance traveled in speed (mm/s) categories for resting (< 5 mm/s; panels A, D), cruising (5-20 mm/s; B,E), and bursting (>20 mm/s; C, F) behaviors. Distance traveled was observed over two alternating 10 minute periods of light (white bars) and dark (black bars) conditions. No behavioral observations were recorded (N.M.: Not Measured) at DO concentrations causing significant mortality. *: p < 0.05.. .............................................. 99

ix
Figure 11: Mean (±SE) distance traveled per minute by Pimephales promelas larvae following 7 d (panels A, B, C; N=4, n=4-5) diltiazem studies. Data presented as distance traveled in speed (mm/s) categories for resting (< 5 mm/s; panels A), cruising (5-20 mm/s; B), and bursting (>20 mm/s; C) behaviors. Distance traveled was observed over two alternating 10 minute periods of light (white bars) and dark (black bars) conditions. No behavioral observations were recorded (N.M.: Not Measured) at DO concentrations causing significant mortality. *: p < 0.05.. ............... 102 Figure 12: Mean (±SE) distance traveled per minute by Pimephales promelas larvae following 48 h (panels A, B, C, D, E, F; N=4, n=4-5) or 7 d (panels G, H, I, J, K, L; N=4, n=4-5) studies across normal and moderate dissolved oxygen (DO) x diltiazem interaction treatments. Data presented as distance traveled in speed (mm/s) categories for resting (< 5 mm/s; panels A, D, G, J), cruising (5-20 mm/s; B, E, H, K), and bursting (>20 mm/s; C, F, I, L) behaviors. Distance traveled was observed over two alternating 10 minute periods of light (white bars) and dark (black bars) conditions. No behavioral observations were recorded (N.M.: Not Measured) at DO concentrations causing significant mortality. *: p < 0.05. Normal DO: 8.2 mg DO/L; Moderate DO: 5.0 mg DO/L.. .......................................................................................... 99 Figure 13: Mean (±SE) distance traveled per minute by Pimephales promelas larvae following 48 h (panels A, B, C, D, E, F; N=4, n=4-5) or 7 d (panels G, H, I, J, K, L; N=4, n=4-5) studies across normal and low dissolved oxygen (DO) x diltiazem interaction treatments. Data presented as distance traveled in speed (mm/s) categories for resting (< 5 mm/s; panels A, D, G, J), cruising (5-20 mm/s; B, E, H, K), and bursting (>20 mm/s; C, F, I, L) behaviors. Distance traveled was observed over two alternating 10 minute periods of light (white bars) and dark (black bars) conditions. No behavioral observations were recorded (N.M.: Not Measured) at DO concentrations causing significant mortality. *: p < 0.05. Normal DO: 8.2 mg DO/L; Low DO: 3.0 mg DO/L. ................................................................................................. 100 Figure 14: Mean (±SE, N=4, n=6-8) dry weights (growth) by Pimephales promelas larvae following 7 d A) dissolved oxygen (DO) and B) diltiazem studies. No growth measurements were observed (N.M.: Not Measured) at DO or diltiazem concentrations causing significant mortality. *: p < 0.05. ............................................. 102 Figure 15: Mean (±SE, N=4, n=6-8) dry weight (growth) by Pimephales promelas larvae following 7 d experiments across A) normal and moderate dissolved oxygen x diltiazem and B) normal and low DO x diltiazem studies. No growth measurements were observed (N.M.: Not Measured) at DO or diltiazem concentrations causing significant mortality. *: p < 0.05. Normal DO: 8.2 mg DO/L; Moderate DO: 5.0 mg DO/L; Low DO: 3.0 mg DO/L. ..................................................................................... 103

x
Figure 16: Mean (±SD, N=4, n=1-2) measured concentration of diltiazem in A) plasma and B) whole-body tissue of male adult fathead minnows (Pimephales promelas) following 96 h normal and low dissolved oxygen (DO) x diltiazem (1 μg/L) studies. Normal and low DO x diltiazem studies were conducted separately. Tissue samples were collected across five time points throughout each 96 h DO x diltiazem uptake experiment (0, 1, 6, 24, 96 h). Black and white circles represent normal (8.2 mg DO/L) and low (3.0 mg DO/L) levels, respectively. Different letters in the same group (capitalized or not capitalized) correspond to significant (p < 0.05) differences. #: significant (p < 0.05) influence of DO across time (p < 0.05).. ............. 143 Figure 17 Mean (±SD, N=4, n=1-2) measured concentration of diltiazem in plasma and of male adult fathead minnows (Pimephales promelas) following 24 h normal and low dissolved oxygen (DO) x diltiazem (0, 3, 30 μg/L) studies. Normal and low DO x diltiazem studies were conducted separately. Black and white circles represent normal (8.2 mg DO/L) and low (3.0 mg DO/L) levels, respectively. Different letters in the same group (capitalized or not capitalized) correspond to significant (p < 0.05) differences between diltiazem water concentrations. #: significant difference between DO conditions (p < 0.05).. ............................................................................... 146 Figure 18 Mean (±SE, N=4, n=1-2) ventilation rate (beats/minute; A) and burst swimming performance (BL/sec.; B) by male adult fathead minnows (Pimephales promelas) following 24 h normal and low dissolved oxygen (DO) x diltiazem (0, 3, 30 μg/L) experiments. Normal and low DO x diltiazem studies were conducted separately. DO and diltiazem concentrations are nominal to increase clarity but measured concentrations are in Table 2. Black and gray bars represent normal (8.2 mg DO/L) and low (3.0 mg DO/L) levels, respectively. *: p < 0.05 (diltiazem). #: p < 0.05 (DO). BL/sec.: body length per second. ............................................................. 147 Figure 19 Mean (±SE, N=4, n=1-2) hematocrit (%; A) and plasma lactate (μM; B) of male adult fathead minnows (Pimephales promelas) following 24 h normal and low dissolved oxygen (DO) x diltiazem experiments. Normal and low DO x diltiazem studies were conducted separately. DO and diltiazem concentrations are nominal to increase clarity but measured concentrations are in Table 2. Black and gray bars represent normal (8.2 mg DO/L) and low (3.0 mg DO/L) levels, respectively. *: p < 0.05 (diltiazem). #: p < 0.05 (DO).. ............................................................................... 147 Supplementary: Figure 20: Aquatic hazard assessment for dissolved oxygen with acute invertebrate data. The distribution represents all of the available acute invertebrate data compared to those newly published acute invertebrate data values within the dataset (red circles). ...................................................................................... 177

xi
Supplementary: Figure 21: Acute (2-96h) temperature-dependent dissolved oxygen (DO) toxicity relationships for A) invertebrates within the orders Ephemeroptera, Trichoptera, Megaloptera, and Odonata. Solid lines represent linear regression lines fitted for each species (C. simile, H. betteri, S. fusca; p < 0.05). B) The acute (2-96h) temperature-dependent dissolved oxygen (DO) toxicity SSD for five ephemeroptera species studied across the same three temperatures and C) the HC80 values of the five ephemeroptera species across three temperatures. Dose-response curves were plotted based on data availability when a species were studied across at least three different temperatures by the same researcher. All species inhabit either lotic (Ephemerella mucronata, Hydropsyche betteni, Leptpohlebia marginata), lentic (Cloeon simile), or both lotic and lentic (Epeorus sylvicola, Ephemera vulgate, Sialis lutaria, Siphlonurus lacustris, Sympecma fusca) habitats. ............................................ 178 Supplementary: Figure 22: Temperature-dependent chronic fish growth effect concentration (EC) data to illicit 10% (EC90) and 50% (EC50) decreased growth for Oncorhynchus kisutch and Oncorhynchus tshawytscha. Effect concentrations were calculated from log-linear normalized growth rates for each species across multiple temperatures (JRB Associates, 1984; Warren et al, 1973). Solid and long dashed lines represent Oncorhynchus tshawytscha fitted linear regressions for EC90 and EC50 values, respectively (p < 0.05). Short and long-dot-dot-long dashed lines represent Oncorhynchus kisutch fitted polynomial regressions describing the relationship between temperature and EC values. ......................................................... 179 Supplementary: Figure 23: Aquatic hazard assessment for dissolved oxygen with fish. Distributions of recent warm water fish LC50 values were compared to the warm water fish growth EC10 values. Vertical lines represent water quality criteria for DO subcategory high aquatic life use commonly assigned to water bodies in Texas, where 24-hour DO minimum are not to extend beyond 8 hours (3 mg/L, dotted) and the 24-hour minimum average (5 mg/L, long dash) cannot exceed over 24 hours (Texas Commission on Environmental Quality 2010).. ................................. 180 Supplementary: Figure 24: Acute (≤ 96 h LC50) species sensitivity distribution for verapamil. LC50 values were reported for verapamil from six different aquatic species (Artemia salina, Brachionus calyciflorus, Daphnia magna, Oncorhynchus mykiss, Oreochromis niloticus, Thamnocephalus platyurus)... ..................................... 185 Supplementary: Figure 25: Mean (±SE, N=3 studies) heart rate (beats/minute) by Pimephales promeals larvae following 48 h A) dissolved oxygen (DO) and B) diltiazem studies. Mean larval survival at 2.3 mg DO/L and 24451 μg/L diltiazem were 80 and 88%, respectively, while other experimental treatments with significant decreases in survival were not measured (N.M.: Not Measured). *: p < 0.05... ............ 190

xii
Supplementary: Figure 26: Mean (±SE, N=4, n=4) heart rate (beats/minute) by Pimephales promeals larvae following 48 h A) normal and moderate dissolved oxygen (DO) x diltiazem and B) normal and low DO x diltiazem studies. In experimental treatments with with significant decreases in survival, heart rates were not measured (N.M.: Not Measured). Normal DO: 8.2 mg DO/L; Moderate DO: 5.0 mg DO/L; Low DO: 3.0 mg DO/L. *: p < 0.05.... ......................................................... 190 Supplementary: Figure 27: Mean (±SE) total number of movements (counts) per minute by Pimephales promelas larvae following 48 h (A, B, C; N=3 studies) and 7 d (D, E, F; N=4, n=4-5) dissolved oxygen (DO) studies. Data presented as number of movements in speed (mm/s) categories for resting (< 5 mm/s; A,D), cruising (5-20 mm/s; B,E), and bursting (>20 mm/s; C, F). Number of movements were observed over two alternating 10 minute periods of light (white bars) and dark (black bars) conditions. No behavioral observations were recorded (N.M.: Not Measured) at DO concentrations causing significant mortality. *: p < 0.05..... ......................................... 191 Supplementary: Figure 28: Mean (±SE) duration per minute (60 sec.) by Pimephales promelas larvae following 48 h (A, B, C; N=3 studies) and 7 d (D, E, F; N=4, n=4-5) dissolved oxygen (DO) studies. Data presented as duration in speed (mm/s) categories for resting (< 5 mm/s; A,D), cruising (5-20 mm/s; B,E), and bursting (>20 mm/s; C, F). Duration was observed over two alternating 10 minute periods of light (white bars) and dark (black bars) conditions. No behavioral observations were recorded (N.M.: Not Measured) at DO concentrations causing significant mortality. *: p < 0.05..... ................................................................................................................. 191 Supplementary: Figure 29: Mean (±SE) total number of movements (counts) per minute by Pimephales promelas larvae following and 7 d (A, B, C; N=4, n=4-5) dilitiazem studies. Data presented as number of movements in speed (mm/s) categories for resting (< 5 mm/s; A), cruising (5-20 mm/s; B), and bursting (>20 mm/s; C). Number of movements were observed over two alternating 10 minute periods of light (white bars) and dark (black bars) conditions. No behavioral observations were recorded (N.M.: Not Measured) at DO concentrations causing significant mortality. *: p < 0.05..... ............................................................................... 192 Supplementary: Figure 30: Mean (±SE) duration per minute (60 sec.) by Pimephales promelas larvae following 7 d (A, B, C; N=4, n=4-5) diltiazem studies. Data presented as duration in speed (mm/s) categories for resting (< 5 mm/s; A,D), cruising (5-20 mm/s; B,E), and bursting (>20 mm/s; C, F). Duration was observed over two alternating 10 minute periods of light (white bars) and dark (black bars) conditions. No behavioral observations were recorded (N.M.: Not Measured) at DO concentrations causing significant mortality. *: p < 0.05..... ......................................... 192

xiii
Supplementary: Figure 31: Mean (±SE; N=4, n=4-5) total number of movements (counts) per minute by Pimephales promelas larvae following 48 h (panels A, B, C, D, E, F) or 7 d (panels G, H, I, J, K, L) studies across normal and moderate dissolved oxygen (DO) x diltiazem interaction treatments. Data presented as number of movements in speed (mm/s) categories for resting (< 5 mm/s; panels A, D, G, J), cruising (5-20 mm/s; B, E, H, K), and bursting (>20 mm/s; C, F, I, L) behaviors. Number of movements were observed over two alternating 10 minute periods of light (white bars) and dark (black bars) conditions. No behavioral observations were recorded (N.M.: Not Measured) at concentrations causing significant mortality. *: p < 0.05. Normal DO: 8.2 mg DO/L; Moderate DO: 5.0 mg DO/L...... ........................... 193 Supplementary: Figure 32: Mean (±SE; N=4, n=4-5) duration per minute by Pimephales promelas larvae following 48 h (panels A, B, C, D, E, F) or 7 d (panels G, H, I, J, K, L) studies across normal and moderate dissolved oxygen (DO) x diltiazem interaction treatments. Data presented as duration in speed (mm/s) categories for resting (< 5 mm/s; panels A, D, G, J), cruising (5-20 mm/s; B, E, H, K), and bursting (>20 mm/s; C, F, I, L) behaviors. Duration was observed over two alternating 10 minute periods of light (white bars) and dark (black bars) conditions. No behavioral observations were recorded (N.M.: Not Measured) at DO concentrations causing significant mortality. *: p < 0.05. Normal DO: 8.2 mg DO/L; Moderate DO: 5.0 mg DO/L...... .................................................................................... 193 Supplementary: Figure 33: Mean (±SE; N=4, n=4-5) total number of movements (counts) per minute by Pimephales promelas larvae following 48 h (panels A, B, C, D, E, F) or 7 d (panels G, H, I, J, K, L) studies across normal and low dissolved oxygen (DO) x diltiazem interaction treatments. Data presented as number of movements in speed (mm/s) categories for resting (< 5 mm/s; panels A, D, G, J), cruising (5-20 mm/s; B, E, H, K), and bursting (>20 mm/s; C, F, I, L) behaviors. Number of movements were observed over two alternating 10 minute periods of light (white bars) and dark (black bars) conditions. No behavioral observations were recorded (N.M.: Not Measured) at concentrations causing significant mortality. *: p < 0.05. Normal DO: 8.2 mg DO/L; Low DO: 3.0 mg DO/L...... ................................... 194 Supplementary: Figure 34: Mean (±SE; N=4, n=4-5) duration per minute by Pimephales promelas larvae following 48 h (panels A, B, C, D, E, F) or 7 d (panels G, H, I, J, K, L) studies across normal and low dissolved oxygen (DO) x diltiazem interaction treatments. Data presented as duration in speed (mm/s) categories for resting (< 5 mm/s; panels A, D, G, J), cruising (5-20 mm/s; B, E, H, K), and bursting (>20 mm/s; C, F, I, L) behaviors. Duration was observed over two alternating 10 minute periods of light (white bars) and dark (black bars) conditions. No behavioral observations were recorded (N.M.: Not Measured) at DO concentrations causing significant mortality. *: p < 0.05. N.M.: Not Measured. Normal DO: 8.2 mg DO/L; Low DO: 3.0 mg DO/L....... ........................................................................................... 194

xiv
Supplementary: Figure 35: Mean heart rate (beats/minute) by Pimephales promelas larvae following 7 d A) dissolved oxygen (DO; ±SE N=4, n=4) and B) diltiazem (N=2, n=4) studies. In experimental treatments with with significant decreases in survival, heart rates were not measured (N.M.: Not Measured). *: p < 0.05................. 195 Supplementary: Figure 36: Mean (±SE, N=4, n=4) heart rate (beats/minute) by Pimephales promelas larvae following 7 d A) normal and moderate dissolved oxygen (DO) x diltiazem and B) normal and low DO x diltiazem studies. Low DO x 2348 μg/L diltiazem decreased survival but were measured to demonstrate concomitant DO x diltiazem reduced heart rates. Normal DO: 8.2 mg DO/L; Moderate DO: 5.0 mg DO/L; Low DO: 3.0 mg DO/L. *: p < 0.05. #: p < 0.05, significant influence of DO across diltiazem concentrations........ ................................ 195 Supplementary: Figure 37: Mean (±SE, N=4, n=2) feeding rate (artemia/minute) by Pimephales promelas larvae following 7 d A) dissolved oxygen (DO) and B) diltiazem studies. In experimental treatments with with significant decreases in survival, feeding rates were not measured (N.M.: Not Measured). *: p < 0.05............. 196 Supplementary: Figure 38: Mean (±SE, N=4, n=2) feeding rate (artemia/minute) by Pimephales promelas larvae following 7 d A) normal and moderate dissolved oxygen (DO) x diltiazem and B) normal and low DO x diltiazem studies. Low DO x 2348 μg/L diltiazem decreased survival but feeding rate was measured. *: p < 0.05. Normal DO: 8.2 mg DO/L. Moderate DO: 5.0 mg DO/L. Low DO: 3.0 mg DO/L........ ...................................................................................................................... 196

xv
LIST OF TABLES Table 1: Summary of species sensitivity distributions associated with aquatic hazard assessments for freshwater organisms. The number of the data points (n) and number of species (Sp) in each dataset; the Median, Variance and Range for each dataset are provided, and the correlation coefficient (r²), slope (b) and intercept (a) for each of the log-normal fitting model are listed............................................................................. 20 Table 2: Specific dissolved oxygen (DO) water quality criteria in the south central United States of America. The Aquatic Life Category indicates a State DO criteria specified for cold and/or warm water aquatic life. The Habitat Specific Category describes whether states contain specified DO criteria for lakes, streams, and/or impoundments, not including site-specific criteria. Seasonal DO Categories indicate whether State specific DO criteria were derived based on seasons, and the Mean and/or Minimum DO Criteria demonstrates the range of criteria values and whether such DO criteria exist as mean and/or minimum values in each State (APCEC 2011; LDEQ 2012; NMED 2000; OWRB 2007; TCEQ 2010). *Other – In Texas, two different freshwater seasonal criteria are derived and include one specific for ‘freshwater in spring’ and ‘other’ (interpreted as the criteria implemented for the other seasons). .................................................................................................................. 25

xvi
Table 3: Individual US EPA Region 6 state water quality criteria (WQC) that were derived for the protection of early life stages (ELS) and other life stages (OLS). The total number of DO WQC for each state were separated into those providing protection for cold and warm water fisheries. Based on the actual DO concentration, each individual state WQC is placed into a corresponding predicted degree of fisheries production impairment (APCEC 2011; LDEQ 2012; NMED 2000; OWRB 2007; TCEQ 2010; USEPA 1986). Note, AR = Arkansas, LA = Louisiana, NM = New Mexico, OK = Oklahoma, TX = Texas. Cold water DO concentrations for early life stages (the first value is the recommended water column concentration and the value in parentheses represents intergravel DO concentrations in mg DO/L): no production impairment = 11 (8); slight production impairment = 9 (6); moderate production impairment = 8 (5); severe production impairment = 7 (4); limit to avoid acute mortality = 6 (3). Cold water DO concentrations for other life stages (water column concentrations in mg DO/L): no production impairment = 8; slight production impairment = 6; moderate production impairment = 5; severe production impairment = 4; limit to avoid acute mortality = 3. Warm water DO concentrations for early life stages (water column concentrations in mg DO/L): no production impairment = 6.5; slight production impairment = 5.5; moderate production impairment = 5; severe production impairment = 4.5; limit to avoid acute mortality = 4. Warm water DO concentrations for other life stages (water column concentrations in mg DO/L): no production impairment = 6; slight production impairment = 5; moderate production impairment = 4; severe production impairment = 3.5; limit to avoid acute mortality = 3 (modified from the U.S. EPA Ambient Water Quality Criteria for Dissolved Oxygen, 1986. (*) = Three WQC values exist in New Mexico and they apply to both ELS and OLS.. ............................................................................ 26 Table 4: Detection frequency and geographic distributions of calcium channel blockers in influent sewage. * Huber et al (2016) measured amlodipine in effluent from two countries (Europe and North America); therefore, the total studies throughout the geographic regions (5) does not match the # times studied (4)... ............ 50 Table 5: Detection frequency and geographic distributions of calcium channel blockers in effluent wastewater. * Huber et al (2016) measured amlodipine in effluent from two countries (Europe and North America); therefore, the total studies throughout the geographic regions (8) does not match the # times studied (7). .............. 51 Table 6: Detection frequency and geographic distributions of calcium channel blockers in freshwater. * Huber et al (2016) measured amlodipine in effluent from two countries (Europe and North America); therefore, the total studies throughout the geographic regions (5) does not match the # times studied (4). ................................ 52 Table 7: Detection frequency and geographic distributions of calcium channel blockers in saltwater. * Huber et al (2016) measured amlodipine in saltwater from two countries (Europe and North America); therefore, the total studies throughout the geographic regions (6) does not match the # times studied (5). ................................ 53

xvii
Table 8: Equations for regression lines and concentration values corresponding to various centiles for various environmental exposure distributions of maximum reported calcium channel blocker (CCB) concentrations (ng/L) in influent, effluent, freshwater, and saltwater. For each distribution, ‘n’ represents the number of CCBs reported and used in that specific water matrix. Based on data availability, geographic regions and individual CCBs were categorized and equation descriptors are provided. .................................................................................................................... 66 Table 9: Exceedance percentages of therapeutic hazard values (THV) by measured concentrations of four calcium channel blockers in different environmental matrices. Predicted percent exceedances of the THVs were calculated using both the minimum and maximum human therapeutic level (Cmin, Cmax). (-) indicates an environmental exposure distribution contained < 5 data values and therefore the THV percent exceedance was not calculated................................................................... 68 Table 10: Equations for regression lines and concentration values corresponding to various centiles for internal diltiazem fish plasma levels (ng/L) from all available surface water data, or from freshwater or saltwater systems. For each distribution, ‘n’ represents the number of reported fish plasma concentrations. Based on data availability, geographic regions and individual CCBs were categorized and equation descriptors are reported. Exceedance probabilities of minimum therapeutic dose (Cmin) in fish palsma are included. ................................................................................... 69 Table 11: Diltiazem and verapamil 5th, 20th, 50th, 80th, and 95th percentiles with corresponding concentrations (ng/L) are presented from environmental exposure distributions. Therapeutic hazard ratios (THR) of predicted calcium channel blocker concentrations to compound specific therapeutic hazard values (THV) were calculated. A THR value > 1.0 indicates an exceedance of an additive THR. Diltiazem THV (ng/L) = 1618; Verapamil THV (ng/L) = 157. ...................................... 72 Table 12: Acute (48 h) LC50 values, and chronic (7 d) Lowest Observed Effect Concentrations (LOEC) and No Observed Effect Concentrations (NOEC) for heart rate, feeding rate and growth responses following dissolved oxygen (DO), diltiazem (DZM), and DO x DZM studies with Pimephales promelas. (a) Indicates mean (±SD, N=3 studies). (b) Indicates a LOEC was not calculated because the concentration above the NOEC resulted in significant mortality (1.1 mg/L). (c) Indicates mean heart rates for 3 studies. (d) Insufficient data for statistical analysis (N=2 per concentration). (e) Acute 48 h DO x diltiazem studies were conducted once and LC50 estimates did not have enough information to calculate confidence intervals. (f) Significant increase in heart rate at 0.259 μg/L (LOEC), thus the NOEC was 23 μg/L; however, a significant decrease in heart rate was observed at 2215 μg/L... ............................................................................................................................... 95

xviii
Table 13: Lowest Observed Effect Concentrations (LOEC) and No Observed Effect Concentrations (NOEC) for photo-locomotor behaviors following dissolved oxygen (DO), diltiazem (DZM), and DO x DZM studies with Pimephales promelas. Arrows indicate whether responses were significantly (p< 0.05) increased or decreased relative to control. DO: dissolved oxygen; DZM: diltiazem; 8.2: normal 8.2 mg DO/L; 5.0: moderate 5.0 mg DO/L; 3.0: low 3.0 mg DO/L. (-): indicates no significant effects observed. TD: sum total distance traveled per minute across all speed categories; RD: resting (<5 mm/s) distance traveled per minute; CD: cruising (5-20 mm/s) distance traveled per minute; BD: bursting (>20 mm/s) distance traveled per minute. TC: total number of movements (counts) per minute across all speed thresholds; RC: resting (<5 mm/s) number of movements (counts) per minute; CC: cruising (5-20 mm/s) number of movements (counts) per minute; BC: bursting (> 20 mm/s) number of movements (counts) per minute. RD: resting (<5 mm/s) duration (sec.) per minute; CD: cruising (5-20 mm/s) duration (sec.) per minute; BD: bursting (>20 mm/s) duration (sec.) per minute... ........................................................... 96 Table 14: Mean (±SE) values for fathead minnow (Pimephales promelas) weight, total body length (BL), and age of fish used in DO x diltiazem bioconcentration and burst swim performance studies. Fish in DO x diltiazem studies were measured immediately after each bioconcentration study or swim tunnel trial. Normal: 8.2 mg DO/L. Low: 3.0 mg DO/L. (a) Indicates female fish were used as controls for tissue analyses. (b) Indicates one male fish was used control for tissue analyses due to a limited supply of male fathead minnows. (c) One fish euthanized after handling error (flopped out of net onto floor) during 0 h introduction to exposure tank. (d) One fish died approximately 3 hours into exposure. (e) One fish from each replicate died approximately 6 h into 24 h DO x diltiazem exposure. The remaining fish in replicate tanks displayed normal fish behavior; therefore, the remaining fish were included in the study. (f) One fish was euthanized while loading into replicate tank #3 due to 0 h loading error (fish flopped out of net onto floor). (g) One fish died overnight after ~12 h exposure to low DO x diltiazem 3.0 μg/L... ................................ 141 Table 15: Concentrations of diltiazem (DZM) in exposure water, plasma, and whole-body tissue of adult male fathead minnow (Pimephales promelas) following normal and low dissolved oxygen (DO) x DZM bioconcentration and burst swim performance studies. In bioconcentration (nominal 1 μg/L diltiazem) and burst swim performance (nominal 0, 3, 30 μg/L diltiazem) studies, fish were sampled at 0, 1, 6, 24, and 96 h and 24 h, respectively. Normal: 8.2 mg DO/L; Low: 3.0 mg DO/L; NA: sample size (n) insufficient to calculate standard deviation. SD: standard deviation. N: number of replicates. n: number of samples. (a) Indicates mean (±SE, N=4) concentrations. ............................................................................................................... 142

xix
Supplementary: Table 16: Dissolved oxygen toxicity values used to create species sensitivity distributions from both pre-1986 and recently published data on the effects of low DO to freshwater fish and invertebrates. References are given for each study used in SSDs including the type of organisms, species, common name, life stage, test duration, experimental temperature, median lethal concentration or 50% effective concentration (LC50/EC50), and the parameter calculated. Note: GM, (-), and MCT represent geometric mean, an unknown measure of central tendency, and measure of central tendency, respectively. ......................................................................167 Supplementary: Table 17: Download additional supplemental data related to Chapter Three (214 KB spreadsheet) at https://doi.org/10.1016/j.chemosphere.2017.09.058. ....181 Supplementary: Table 18: Summary of studies evaluating adverse effects of calcium channel blockers in aquatic organisms. ............................................................................182 Supplementary: Table 19: Mean (±SE) dissolved oxygen (DO; mg/L) and diltiazem (μg/L) concentrations measured and analytically verified in acute (48 h) and chronic (7 d) studies with Pimephales promelas. SE: standard error; Acute: 48 hour; Interaction: DO x diltiazem; Chronic: 7 day. * Analytical verification indicated 0 (control) and 0.15 μg/L treatments were contaminated; however, significant effects were not observed in Pimephales promelas at these levels. (a) Indicates water concentrations were analytically verified at time 0 h. (b) Mean (±SD) water concentrations were analytically verified on day 0, 3, and 6. ... ......................................187 Supplementary: Table 20: Mean water chemistry measurements from acute (48h) and chronic (7 d) studies with Pimephales promelas. DO: dissolved oxygen; DZM: diltiazem; Acute: 48 hours; Chronic: 7 day .....................................................................189 Supplementary Table 21: Mean (±SE, N=3-4) water chemistry measurements from normal and low dissolved oxygen (DO) x diltiazem (DZM) bioconcentration (96 h) and burst swim performance (24 h) studies with adult male Pimephales promelas. Normal DO: 8.2 mg DO/L. Low DO: 3.0 mg DO/L. Temp: Temperature. Cond: Conductivity. Cl2: Chlorine. NH3: ammonia. NM: not measured. (a) Exact mean (±SE) measured diltiazem concentrations are listed in Table 2. (b) Alkalinity, hardness, free chlorine, total ammonia measured at 96 h sampling time point only... ....198

xx
ACKNOWLEDGMENTS I would like to thank my mother, Gail, father, Gary, and my brother and sisters for
their support during my time in Waco. Although they were half a country away, they’d
often provide a listening ear. Thank you Grandpa Ray for our long phone conversations
about everything under the sun (e.g., Green Bay Packers, Milwaukee Brewers, hunting,
fishing, and of course solving the world’s problems). These conversations were so
appreciative, I cannot thank you enough.
Another big thank you goes out to my wife, Kady, for supporting me through my
graduate studies in Waco. I love you and I couldn’t have done it without you! Thank
goodness you picked up Pip, without me knowing, to keep you company.
Finally, I would like to thank the Turnpike Troubadours, country ‘red dirt’ music,
and the various movie soundtracks that lightened the mood while I was working in the
lab and writing. The last thanks goes out to the Melody Ranch two-steppin’ dance hall…I
will miss you…a great time was had by all!

xxi
DEDICATION
To friends, family, the state of Wisconsin, and the Lake Superior watershed which influenced my career path in some shape or form.

xxii
ATTRIBUTION
Co-Author Contributions
Dr. Zhen Wang, Samuel P. Haddad, Dr. Jone Corrales, W. Casan Scott, and Prof.
C. Kevin Chambliss all contributed intellectually and/or financially to one or more of my
published works. My advisor, Prof. Bryan W. Brooks, contributed intellectually and
financially to all chapters. Our discussions of research questions, experimental design and
results interpretation, along with provisions of laboratory supplies and living stipend,
were necessary to complete this dissertation. Discussions with Dr. Zhen Wang improved
my first journal publication and chapter two in this dissertation. Intellectual assistance
from W. Casan Scott resulted in the publication of chapter three. Finally, discussions and
laboratory assistance from Dr. Jone Corrales, Prof. C. Kevin Chambliss and Samuel P.
Haddad resulted in data presented in chapter four.

1
CHAPTER ONE
Introduction
Background and Significance
Continued global growth of the human population and its concentration to cities
has created a new urban water cycle (Brooks, 2014; Postel, 2010). Effective water
management is essential to maintain sufficient quality and quantities of water for its
designated uses, especially as our access to consumer goods and medicines are increasing
faster than our waste infrastructure. Consumption of water and consumer products
including pharmaceuticals varies worldwide, while the number of persons above age 60
is expected to double by 2050 (Gaw and Brooks, 2016; Kookana et al., 2014).
Coincidentally, 70% of the human population reside in coastal cities where local water
resources are stressed from climate change, nutrient enrichment, and contaminant
loadings (Brooks et al., 2006; Heathwaite, 2010; Hooper et al, 2013). Therefore, potential
risks to aquatic organisms from urban water stressors such as contaminants of emerging
concern and nutrients, leading to the increased occurrence of hypoxia (< 2 mg/L DO)
worldwide, are of concern (Diaz, 2001; Kookana et al., 2014).
Occurrence, frequency, and duration of hypoxia in freshwater and marine systems
throughout the world has been well documented (Cooper and Brush, 1991; Delorme,
1982; Diaz, 2001; Diaz and Rosenberg, 2008; Thornton et al., 1990). As such, with a
majority of the human population residing in coastal cities, local water resources are
stressed from climate change and nonpoint and point sources of contaminants (Brooks et
al., 2006; Heathwaite, 2010; Hooper, 2013). Deleterious effects of hypoxia to aquatic

2
organisms has been observed in multiple species and even at moderate dissolved oxygen
(DO) levels (McKim and Erickson, 1991; Thomas et al., 2006; Vaquer-Sunyer and
Duarte, 2008; Wu, 2002). An empirical hypoxia assessment by Vaquer-Sunyer and
Duarte (2008) demonstrated approximately 4.60 mg DO/L is necessary to prevent acute
adverse effects to marine species (Vaquer-Sunyer and Duarte, 2008). Unfortunately, such
an understanding of low DO hazards to freshwater species have received less study in
recent years. Therefore, understanding the effects of hypoxia to aquatic organisms and
the geographic regions where multiple stressors may be exacerbating chemical toxicity in
non-target organisms is necessary to identify whether monitoring, assessment, and
management efforts are adequate.
Occurrence of stressors other than hypoxia in aquatic systems have also been
reported, especially in urban water cycles experiencing population growth and climate
change (Brooks et al., 2006; Postel, 2010; Scott et al., 2016). Pharmaceuticals are
continuously released from wastewater treatment plants (WWTP) resulting in life cycle
exposures to aquatic organisms, particularly in effluent-dominated or dependent systems
(Brooks et al., 2006). Around 98% of published literature on pharmaceuticals in the
environment (PiE) has been published after 1995, and has increased by 5- and 10-fold in
the past two decades (Daughton, 2016). This research growth has been spurred by an
increasing ability to detect human and veterinary medicines in the environment, which
has provided substantial evidence to determine exposure scenarios and consider their
potential toxicological effects to non-target organisms (Halling-Sorensen et al., 1998;
Monteiro and Boxall, 2010; Ternes, 1998). Unfortunately as attention to PiE continues to
grow, our understanding of the environmental effects remains less defined (Brooks et al.,

3
2012). Most of these compounds are not acutely toxic at environmentally relevant
concentrations and therefore significant challenges exist to characterize the sublethal
effects of pharmaceuticals to non-target organisms (Brooks et al., 2009). Considering
mechanism of action (MOA) of a chemical a priori and leveraging pharmacological
safety data in a read-across approach has been purposed to anticipate or predict effects in
ecotoxicological models (Ankley et al., 2007; Brooks et al. 2009; Rand-Weaver et al.,
2013; Winter et al., 2010). Despite this concept of “intelligent testing” for human and
ecological risk assessment of pharmaceuticals, data to support this approach is still
limited (Winter et al., 2010, Brooks 2014, 2018).
In addition to a need for sufficient toxicity data for chemical stressors like
pharmaceuticals, ecological risks of these compounds relative to and in combination with
nonchemical stressors (e.g., pH, temperature, DO) has been emphasized (Boxall et al.,
2012). Pharmaceuticals are released to surface waters with other contaminants (e.g.,
nutrients, pesticides) common to effluent dominated or dependent systems (Boxall et al.,
2012; Brooks et al., 2006). Effects of pharmaceuticals to aquatic organisms relative to
nonchemical stressors is far more complex (Boxall et al., 2012). The relative impact of
pharmaceuticals compared to other stressors in the natural environment are unknown but
necessary to make knowledgeable management decisions (Boxall et al., 2012).
Toxicological and biochemical responses to contaminants, such as ammonia (Lyu
et al., 2013), crude oil (Dasgupta et al., 2016; Dasgupta et al., 2015), heavy metals
(Fitzgerald et al., 2016; Hattlink et al., 2005; Malekpouri et al., 2016), and contaminants
of emerging concern (Cypher et al., 2015; Hu et al., 2015; Prokkola et al., 2015) by fish
have been shown to be DO-dependent. Recently, human therapeutic levels of the calcium

4
channel blocker diltiazem has been reported in fish plasma from estuaries along the
Texas Gulf of Mexico (Scott et al., 2016). These urbanized watersheds, which are
additionally impaired waterbodies on the Texas 303(d) list due to nonattainment of DO
water quality standards (WQS), represent pronounced estuarine exposure scenarios for
multiple stressors (Brooks et al., 2008; Du et al., 2016; Scott et al., 2016). Similar plasma
diltiazem observations have occurred in fish exposed to WWTP effluent in Sweden and
Japan, which lead to concerns regarding the worldwide occurrence of diltiazem and other
calcium channel blockers in environmental matrices. Unfortunately, the ecological effects
of diltiazem in fish are poorly understood and deserve future research to understand their
potential pharmacological activity in fish.
Fish uptake modeling of pharmaceuticals has been described previously (Brooks,
2014; Du et al., 2014) and is based on physiological pharmacokinetic modeling
accompanied with the conservation of drug targets in vertebrates, particularly in
mammals and fish (Fitzsimmons et al., 2001; Gunnarsson et al., 2008; Huggett et al.,
2003; Verbruggen et al., 2017). Our research group recently explored the utility of using
therapeutic hazard values (THV) to identify pharmaceutical water concentrations
predicted to bioconcentrate in fish plasma at human therapeutic levels (Cmin- Cmax). Read-
across represents an approach using mammalian pharmacological data to predict and
empirically measure the toxicological effects of drugs in non-target organism.
Unfortunately, a minimal number of reports using fish plasma modeling and read-across
exist (Rand-Weaver et al., 2013). The above approaches are necessary to effectively
inform the applicability of mammalian to fish read-across and further broaden our
understanding of pharmaceutical mixtures and multiple stressor (e.g., hypoxia,

5
temperature) impacts to aquatic organisms in urbanized ecosystems (Brooks, 2018;
Brooks et al., 2006; Scott et al., 2016).
Scope of dissertation
In this dissertation, I aimed to better understand the environmental hazards of
multiple stressors by examining a model weak base pharmaceutical (e.g., diltiazem) and a
common nonchemical stressor (e.g., DO) in fish. Both of these stressors co-occur in
aquatic systems and have the potential to adversely affect cardiac function. In the second
chapter, an examination of the national guidelines and regional water quality criteria for
the nonchemical stressor DO was performed and identified inadequate environmental
assessment and management strategies for DO in inland waters. In chapter three, a novel
probabilistic hazard analysis was performed with individual and mixtures of CCBs by
leveraging existing chemical environmental occurrence data and mammalian
pharmacological information to identify global hazards to non-target organisms. Based
on my observations in chapters two and three, these predictive tools can identify regions
where environmental assessment and management efforts appear inadequate. In chapters
four and five, I advanced toxicokinetic and comparative pharmacology efforts using a
model calcium channel blocker (diltiazem) and model fish species across an
environmentally relevant DO gradient. Such basic and applied studies have the capacity,
when paired with fish plasma modeling and read-across approaches, to predict the effects
of human therapeutic plasma levels in non-target aquatic vertebrates. Such approaches
are necessary and essential for robust ecological risk assessment and management of
cardiotoxicants.

6
CHAPTER TWO
Revisiting Inland Hypoxia: Diverse Exceedances of Dissolved Oxygen Thresholds for Freshwater Aquatic Life
This chapter published as: Saari GN, Wang Z, Brooks BW. 2018. Revisiting inland
hypoxia: diverse exceedances of dissolved oxygen thresholds for freshwater aquatic life. Environmental Science and Pollution Research 25:3139–3150.
Abstract
Water resources in many regions are stressed by impairments resulting from
climate change, population growth and urbanization. In the United States (US), water
quality criteria (WQC) and standards (WQS) were established to protect surface waters
and associated designated uses, including aquatic life. In inland waters of the south
central US, for example, depressed dissolved oxygen (DO) consistently results in
impaired aquatic systems due to noncompliance with DO WQC and WQS. In the present
study, we systematically examined currently available DO threshold data for freshwater
fish and invertebrates and performed probabilistic aquatic hazard assessments with low
DO toxicity data that were used to derive the US Environmental Protection Agency’s
(EPA) Ambient Water Quality Criteria (AWQC) for DO and newly published
information. Aquatic hazard assessments predicted acute invertebrate DO thresholds for
Ephemeroptera, Plecoptera, or Trichoptera (EPT) taxa and species inhabiting lotic
systems to be more sensitive than fish. For example, these organisms were predicted to
have acute low DO toxicity thresholds exceeding the US EPA guidelines 17, 26, 31 and
38% and 13, 24, 30 and 39% of the time at 8.0, 5.0, 4.0 and 3.0 mg DO/L, respectively.
Based on our analysis, it appears possible that low DO effects to freshwater organisms

7
have been underestimated. We also identified influences of temperature on low DO
thresholds and pronounced differences in implementation and assessment of the US EPA
AWQC among habitats, seasons, and geographic regions. These results suggest some
implemented DO guidelines may adversely affect the survival, growth, and reproduction
of freshwater aquatic organisms in a region susceptible to climate change and rapid
population growth. Given the global decline of species, particularly invertebrates, low
DO threshold information, including sublethal (e.g., reproduction, behavior) responses,
for additional species (e.g., mollusks, other invertebrates, warm water fish) across
seasons, habitats, and life history stages using consistent experimental designs is needed
to support more sustainable environmental assessment efforts and management of
biodiversity protection goals in inland waters.
Introduction
Freshwater systems can experience significant modification in response to climate
change, population growth, and other anthropogenic stressors such as nutrient
enrichment, contaminants of emerging concern, pH, and dissolved oxygen (DO). These
alterations are particularly observed in arid to semi-arid regions (Brooks et al. 2006;
Delorme 1982; Heathwaite 2010). Nutrient enrichment of freshwater systems due to
anthropogenic point and nonpoint sources can indirectly result in depressed DO and, in
extreme scenarios, hypoxic or anoxic conditions leading to poor water quality (Brooks et
al. 2006; Delorme 1982; Heathwaite 2010; Valenti et al. 2011). In aquatic systems, an
increase in temperature co-occurring with carbon dioxide accumulation can also
exaggerate hypoxia due to elevated oxygen demand and lower oxygen solubility at high

8
temperature (Brewer and Peltzer 2009; Pörtner 2010). Hypoxia in aquatic ecosystems is
typically defined as low levels of DO from near maximum solubility to below 2 mg
DO/L (Committee on Environment and Natural Resources 2003). Hypoxic conditions
have occasionally occurred naturally in some systems, such as Lake Erie (Delorme 1982;
Zhou et al. 2013) and the Chesapeake Bay (Cooper and Brush 1991; Committee on
Environment and Natural Resources 2003). However, nutrient enrichment and increased
organic matter due to anthropogenic activities has resulted in intensified magnitude,
frequency, and duration of hypoxia and anoxia in freshwater and marine systems (Diaz
and Breitburg 2009; Committee on Environment and Natural Resources 2003). Low DO
concentrations typically occur in hypolimnetic waters with high organic matter, poor
circulation, defined stratification, or seasonal ice cover (Chambers et al. 1997; Diaz and
Breitburg 2009). Depressed DO levels produce adverse effects on metabolic and
behavioral processes in aquatic organisms. For example, moderate hypoxia (2 to 5 mg
DO/L) can cause physiological or biochemical stress (e.g., hormonal responses, oxidative
stress) in fish and invertebrates, while severe hypoxia can impact survival (mortality),
growth, reproduction, and population trajectories of aquatic life (Brett and Blackburn
1981; Doudoroff and Shumway 1970). Unfortunately, though hypoxia has received much
study in marine and coastal systems, depressed DO has received relatively limited
attention in freshwater ecosystems over the past few decades (Pollock et al. 2007). In the
US, the 303(d) list (Section 303(d)) of the Clean Water Act (CWA) includes impaired
surface waters that do not attain water quality standards (WQS). In states experiencing
dramatic population growth and climate change, such as Texas, freshwater
impoundments and tidally influenced rivers have been consistently listed on 303(d) lists

9
due to noncompliance with DO water quality criteria (WQC) and standards (Brooks et al.
2008; Brooks et al. 2011). Reservoirs located in these arid to semi-arid regions are
particularly prone to hypolimnetic and even metalimnetic hypoxia due to high loads of
organic matter, droughts, withdrawal rates, and spatial variability (Brooks et al. 2011;
Diaz and Breitburg 2009; Thornton et al. 1990). Though reservoir zones (e.g., riverine,
transition, lacustrine) represent different aquatic habitats that should be considered during
surface water quality assessment and management (Lind et al. 1993), various reservoir
habitats are not routinely considered during surface water quality assessments of DO and
other contaminants (Brooks et al. 2008; Brooks et al. 2011). Whether habitat-specific
implementation and assessment of AWQC, including DO, differs among states and other
geographic regions remains poorly described, but differing implementation practices can
introduce uncertainty during surface water quality assessments and management
activities. The US CWA mandates states and authorized tribes to develop, implement,
enforce, and periodically update WQC to protect designated uses of aquatic ecosystems.
Based on the 1986 US EPA AWQC for DO, these WQC were intended to protect aquatic
life uses and were predominantly dependent on available low DO toxicity data for growth
impairment in cold and warm water fish (U.S. Environmental Protection Agency 1986;
U.S. Environmental Protection Agency 2012). In 1986, the recommended freshwater DO
AWQC were derived for the protection of no to slight (10%) growth/production
impairment to fish populations because these DO concentrations were also expected to
provide adequate protection for other aquatic organisms (i.e., invertebrates; U.S.
Environmental Protection Agency 1986). Canada and UK published DO water quality
guidelines after the US EPA in 1987 and 1992, respectively, with the UK specifically

10
referencing both fresh and marine waters (Canadian Council of Ministers of the
Environment 2001; Stiff et al. 1992). Similar to the US AWQC (U.S. Environmental
Protection Agency 1986). Canada recommended DO criteria across different
developmental stages, while the UK aquatic life criteria were categorized based on the
fishery (e.g., salmonid, cyprinid, less sensitive cyprinid). No revisions have occurred to
the EPA AWQC since its initial publication 30 years ago; whether such criteria are
protective of threatened and endangered species is largely understudied (Woods et al.
2010). However, DO is of particular importance because of the increased frequency of
hypoxic events worldwide over the past few decades (Diaz 2001; Committee on
Environment and Natural Resources 2003) and future projections of population growth,
landscape modification, and climate change. Whether more recently published low DO
toxicity data could improve our understanding of the adverse effects of hypoxia in inland
waters, and thus reduce uncertainty during surface water quality assessment and
management efforts, is not understood. Thus, in the present study, we (1) examined the
current status of historical (pre-1986) and more recent low DO toxicity data (post-1986)
for freshwater fish and invertebrates, hypothesizing more recent data would differ from
historical information; (2) employed probabilistic aquatic hazard assessments to
determine the percent of species affected by low DO relative to WQC; and (3) identified
whether implementation and assessment of DO WQC differs among freshwater habitats,
seasons, and the south central geographic area of the US, a region susceptible to climate
change and population growth. We further examined the relationship between
temperature and low DO thresholds because increasing temperature decreases oxygen
water solubility under conditions when metabolic demands increase with less oxygen

11
availability and the US AWQC are based on water temperature (cold water vs. warm
water) and fish (salmonid vs. nonsalmonid species).
Methods Data collection Acute and chronic toxicity data (lethal or effect concentrations, LC50s or EC50s) for low
DO and corresponding experimental conditions (e.g., DO, pH, temperature) of freshwater
fishes and invertebrates were collected from the peer-reviewed literatures and the US
EPA AQWQC document (U.S. Environmental Protection Agency 1986). Acute toxicity
endpoints included individual species’ LC50 (≤96 h, ≥96 h) values, while chronic
endpoints included EC10 and EC50s for the effects of DO on growth (>96 h). For data
quality consistency, toxicity data were selected using the following approach. Only
published DO experiments that documented experimental designs and study procedures
were used for further analyses. These study procedures included sufficient water
renewals, clearly identified DO control methods (constant or declining DO), organismal
conditions (species, size, weight, life stage, source, diet, acclimation period), daily water
chemistry observations (DO, pH, temperature), adequate controls, at least initial and final
mortality observations (with sufficient control survival), and statistically calculated
standard toxicity values (LC50 or ECx) (Sprague 1973). DO treatment levels reported
simply as values greater or less than a concentration were excluded from probabilistic
analyses. In the present study, low DO toxicity refers to a calculated lower DO threshold
for either decreased survival or growth of an organism. Toxicity data used for species

12
sensitivity distributions (SSDs) are listed in supplementary information (Supplementary:
Table: 16). Fish growth data calculated from both laboratory and mesocosm studies were
used in our analyses because they were explicitly included in the derivation of the 1986
AWQC for DO.
Aquatic hazard assessments Geometric means were calculated for species LC50 or ECx values when study conditions
within 1 °C, the same life stage, and multiple toxicity values were reported. When
multiple LC50 or ECx values were available for the same species from studies at
temperatures varying by greater than 1 °C or by life stage, these data values were
separately included in taxa SSD development. Low DO toxicity values were selected to
be inclusive of all available temperature conditions, life stages, and study designs.
Toxicity data were first ranked in ascending order and assigned percentiles using the
Weibull equation:
j = (i x 100)/ (n + 1)
where j is the percent rank, i is the rank assigned to an acute (LC50) or chronic
concentration (EC10 or EC50), n is the number of species examined, and n + 1 accounts
for the assumption that there is always one less than all species tested (Posthuma et al.
2002). SSDs were then constructed following the procedures described in Wheeler et al.
(2002), having log concentrations of toxicity values (LC or EC) as x-axis and the
proportion of species being affected as y-axis (SigmaPlot Version 11.0 Systat Software,
Inc., San Jose, CA, USA). Analyses of covariance (ANCOVA, SPSS, Chicago, IL, USA)
were conducted to compare the slopes and intercepts of Weibull ranked probit normalized

13
regression models of specific classified datasets (e.g., Ephemeroptera, Plecoptera, or
Trichoptera (EPT) taxa vs. non-EPT taxa). Due to a variety of low DO toxicity data,
which spanned five decades across multiple species (e.g., Hyalella azteca, Hexagenia
limbata, Onchorynchus mykiss), different SSDs were generated (i.e., EPT, lotic habitat,
pre-1986) for fish and invertebrates. Probabilistic aquatic hazard assessments using
developed SSDs were then performed to determine the percentage of toxicity thresholds
(e.g., LC50, EC50) likely to be exceeded at the existing US EPA AWQC. Slopes and y-
intercepts were extracted from SSD regression models and centile values were calculated
(Microsoft Excel 2016 Microsoft Corp, Richmond, WA, USA) using the equation:
Centile value = NORMDIST ((b x log 10(x)) + a))
where the NORMSDIST returns the standard normal cumulative distribution function of a
selected value, and b and a represent the slope and intercept, respectively, from the linear
regression.
To quantify differences in SSDs, hazard concentrations (HC) at the 80th
percentile (i.e., HC20 or 20% protection level) were calculated from each SSD. More
common HC95 or HC90 (i.e., 95 or 90% protection level for DO, respectively) values
were not compared in this study because over half of the SSDs contained less than 20
data values (minimum was 5) and would introduce higher uncertainty in such predictions
(Grist et al. 2002; Wheeler et al. 2002). HC values derived from each dataset were
calculated and compared to compute an HC ratio. When a ratio was greater than one, the
dataset/ species were considered sensitive to DO. HCs and their corresponding 95%
confidence interval were computed by Monte Carlo simulation, following the log-normal
procedure available in the SAS package (SAS 9.4, Cary, NC, USA), and were determined

14
at 10th, 50th, 80th, 90th, 95th, and 99th centiles.
Temperature-dependent DO thresholds To investigate potential temperature effects on DO thresholds of freshwater species, a
comprehensive meta-analysis of various acute toxicity endpoints (LC50s andEC50s) for
DO across multiple temperatures (n ≥ 3) was conducted for the data generated from an
individual study. Linear regression was applied to fit relationships between temperature
and acute toxicity endpoints (SigmaPlot 13.0, San Jose, CA, USA). To define the
inherent effect of temperature on freshwater communities and populations, temperature-
dependent SSDs (i.e., 15, 20, and 25 °C) were constructed for examining the effects of
temperature on SSDs. To further quantitatively compare the differences among
temperature-dependent SSDs for DO, the HC value and 95% CIs were computed for each
SSD by Monte Carlo simulation, following the log-normal procedure available in SAS
(SAS 9.4, Cary, NC, USA). To minimize the uncertainty caused by data quantity (n = 5),
relative species sensitivities among temperatures for DO were compared on the basis of
HC20 values. A linear regression function (y = a + b x) was also applied to fit these data
(SigmaPlot 13.0, San Jose, CA, USA).
Geographic- and habitat-specific DO water quality criteria and standards The south central region of the US is characterized by diverse watersheds, urbanization,
population growth, and appreciable annual rainfall gradients. For example, annual rainfall
in Texas spans over 114 cm per year from west to east, and contains three of the top ten

15
largest and fastest growing metropolitan areas in the US (Dallas/Ft. Worth, Houston, San
Antonio) and are thus potentially representative of other regions experiencing climate
change and population growth. Subsequently, WQC for DO in the south central US,
which corresponded to states in US EPA Region 6 (Arkansas, Louisiana, New Mexico,
Oklahoma, Texas), were examined to determine whether habitat and geographic
differences in implementation and assessment of WQC and WQS exist (Texas
Commission on Environmental Quality 2010; Arkansas Pollution Control and Ecology
Commission 2011; Louisiana Department of Environmental Quality 2012; New Mexico
Environment Department 2000; Oklahoma Water Resources Board 2007).
Results Freshwater invertebrate and fish thresholds to low DO
The majority of studies reporting standard lethality thresholds were conducted
with invertebrates prior to the US EPA AWQC (pre-1986). Additionally, a large amount
of low DO toxicity data published pre-1986 included chronic data for growth studies of
multiple cold water (e.g., chinook salmon: Oncorhynchus kisutch) and warm water (e.g.,
largemouth bass: Micropterus salmoides) fish. Acute and chronic DO toxicity data for
fishes and invertebrates published over the last five plus decades with over 70 different
fish and invertebrate species are provided in supplementary information (Supplementary:
Table: 16). Prior to publication of the AWQC in 1986, no standard calculated fish
toxicity values (e.g., LC50) were found (Supplementary: Table: 16) because the majority
of these historical studies reported the percent mortality at some DO treatment level(s).

16
However, recent publications have derived DO LC50 values for a variety of fish species
including rainbow trout (Oncorhynchus mykiss), suckers (Deltistes luxatus and
Chasmistes brevirostris), common smelt (Retropinna retropinna), inanga (Galaxias
maculatus), common bully (Gobiomorphus cotidianus), short-finned eel (Anguilla
australis), shiner (Notropis topeka), and catfish (Rhamdia quelen) (Supplementary:
Table: 16). Acute and chronic invertebrate LC50 values published pre- 1986 ranged from
0.03 (Jacob et al. 1984; Sprague et al., 1963) to 8.75 (Jacob et al. 1984) mg DO/L and
4.50 (Nebeker et al. 1992) to 5.00 (Nebeker et al. 1992) mg DO/ L, respectively, while
more recent (post-1986) acute and chronic invertebrate LC50 values ranged from 0.51
(Nebeker et al. 1992) to 1.95 (Nebeker et al. 1996) mg DO/L and 0.49 (Nebeker et al.
1992) to 2.00 (Nebeker et al. 1996) mg DO/L, respectively (Supplementary: Table: 16).
Only 8 and 13 acute DO toxicity values were published since 1986 for freshwater
invertebrates and fish, respectively, and one chronic invertebrate DO toxicity value has
been published since 1986. Such studies of invertebrate species largely focused on
organisms from lentic and lotic habitats. Specifically, those species in both lotic and
lentic habitats comprised ~58% of the available low DO toxicity data for invertebrates
and represented the most robust invertebrate data set we examined. Similarly, fish DO
toxicity data, which included mainly growth studies, were mainly comprised by species
inhabiting cold waters (optimal temperature ~11 °C).
Aquatic hazard assessments
Nine invertebrate and five fish SSDs were generated using acute and chronic DO
toxicity data. The dataset with the largest and smallest range of LC50 values were 8.72

17
and 1.44 mg DO/L (Table 1). Because pre-1986 data on acute DO toxicity only was
identified for invertebrates, this dataset was compared to all available acute invertebrate
and fish DO toxicity data published pre- and post-1986 and was significantly different
from each other with the pre-1986 dataset more sensitive (Fig. 1a; ANCOVA, slope p >
0.217; y-int p < 0.001). These distributions differed at in the middle of the SSD and
converged at the lower and upper end. Both datasets were dominated by invertebrates,
with the latter dataset encompassing acute fish DO toxicity data and invertebrate data.
This acute dataset including both invertebrate and fish DO toxicity data is comprised of
86.5 and 13.5% invertebrate and fish values, respectively. The datasets containing acute
invertebrate DO toxicity data include some taxonomic diversity (Table 1) but those SSDs
including all available invertebrate data were dominated by EPT taxa compared to non-
EPT taxa (~3-fold difference in n and no. of species).
When invertebrates were classified based on lentic or lotic habitats (Merritt and
Cummins 1996), our results indicated all three SSDs were significantly different from
each other (ANCOVA; lentic and lotic vs lentic p < 0.014; lotic vs lentic p < 0.008; both
vs lotic, p < 0.001). Lentic and lotic datasets contained 71.4 and 92.6% EPT taxa. When
we then classified acute invertebrate datasets by EPT and non-EPT taxa, our results
indicated that the EPT and non-EPT taxa SSDs were also significantly different.
Additionally, acute and chronic lethality (LC50) SSDs were significantly different
(ANCOVA, p < 0.001), though the slopes were not (p > 0.762). As mentioned above, the
pre-1986 dataset, which included only acute invertebrate DO toxicity data, was
significantly different from both invertebrate and fish DO toxicity data; our results
revealed acute invertebrate and acute fish SSDs were also significantly different

18
(ANCOVA, p < 0.001). Acute fish DO toxicity data were dominated by warm water
species with one acute cold water LC50 value identified for rainbow trout.
When HCs were computed from each dataset and HC80s compared based on the
minimum data values in several SSDs, the HC80 ratios for acute DO toxicity involving
invertebrate from pre-1986 were consistently greater than one, suggesting that
invertebrate mortality thresholds were more sensitive than fish. Specifically, the acute
invertebrate pre-1986 DO toxicity SSD was more sensitive than the SSD including the
most recent acute invertebrate data and the predicted HC80 was 10.6% lower following
the addition of newly published data because these toxicity values fell within the bottom
half of the distribution (Supplementary: Figure 20). This is reflected by the acute
invertebrate to fish HC ratio of 2.3, again suggesting that invertebrates are twice as
sensitive to decreases in DO as fish. Increasing the exposure duration to low DO
increased sensitivity, which was reflected in the chronic to acute invertebrate lethality HC
ratio of 1.9. Further, EPT taxa were ~2.5× more sensitive than non-EPT taxa. However,
ratios comparing fish growth (EC10) to acute invertebrate (LC50) were consistently
greater than one regardless of habitat (cold or warm water, lotic or lentic), suggesting fish
growth responses are more sensitive to DO than invertebrate mortality.
Aquatic hazard assessments predicted 14, 23, 28, and 35% of acute low DO
toxicity values pre-1986 exceed the existing US EPA AWQC at 8.0, 5.0, 4.0, and 3.0 mg
DO/L. When this dataset included the newly published invertebrate and fish DO toxicity
values, the results predicted 7, 15, 20, and 28% of species to be adversely affected at
same DO concentrations, respectively. In comparison, including acute fish DO toxicity
data with the acute invertebrate data decreased the percent exceeded by 4–5% and again

19
indicated, based on the data available, that freshwater invertebrates are more susceptible
to DO than fish. When the acute invertebrate datasets were then classified based on
habitat types, those species inhabiting lotic environments were predicted to be more
adversely affected at 8.0, 5.0, 4.0, and 3.0 mg DO/L (13, 24, 30, and 39%) than those
species inhabiting lentic or both lentic and lotic habitats (1–29 to 13–30%, respectively;
Fig. 1b; Table 1). Interestingly, a similar percentages of species affected were predicted
for those invertebrates divided to EPT (17, 26, 31, and 38%) and non-EPT taxa (5, 10, 14,
and 19%) at the same DO concentrations (Fig. 1c; Table 1).
Though there were only five chronic invertebrate DO toxicity values,
encompassing 7–30-day exposure durations, 22, 33, 39, and 45% of species were
predicted to be affected at 8.0, 5.0, 4.0, and 3.0 mg DO/L (Fig. 1d, Table 1). Compared to
predicted acute DO thresholds for aquatic invertebrates, there was an increase of ~10% in
the number of affected invertebrates when exposure duration was greater than 7 days.
The percent of acute fish DO toxicity values exceeding the US EPA AWQC at 8.0, 5.0,
4.0, and 3.0mg/L (~0, 2, 5, and 11%, respectively; Fig. 1e, Table 1) were low compared
to invertebrates. Again, such predictions were based on post-1986 acute fish toxicity
values (LC50s) and could not be compared to DO toxicity values available pre-1986
because standard toxicity values were not identified. Using the cold water fish growth
EC10 values, results indicated 23, 48, 61, and 76%of fish to be adversely affected at 8.0,
5.0, 4.0, and 3.0 mg DO/L, respectively (Fig. 1e, Table 1). Similarly, 2, 48, 83, and 99%
of fishes are predicted to be adversely affected at the same DO levels, using the warm
water fish growth EC10 values, although only five values were available from four
different species.

20
Tabl
e 1.
Sum
mar
y of
spec
ies s
ensi
tivity
dis
tribu
tions
ass
ocia
ted
with
aqu
atic
haz
ard
asse
ssm
ents
for f
resh
wat
er o
rgan
ism
s. Th
e nu
mbe
r of t
he d
ata
poin
ts (n
) and
nu
mbe
r of s
peci
es (S
p) in
eac
h da
tase
t; th
e M
edia
n, V
aria
nce
and
Rang
e fo
r eac
h da
tase
t are
pro
vide
d, a
nd th
e co
rrel
atio
n co
effic
ient
(r²),
slop
e (b
) and
inte
rcep
t (a
) for
eac
h of
the
log-
norm
al fi
tting
mod
el a
re li
sted
.
Haz
ard
Con
cent
ratio
n (m
g D
O/L
(95%
CI)
)
Dis
trib
utio
ns
n Sp
Med
ian
Toxi
city
Va
lue
Var
Ran
ge
r2
a b
10%
50
%
80%
90
%
95%
99
%
Lotic
in
verte
brat
es
27
17
2.40
4.
62
7.85
0.
86
-0.6
6 1.
97
0.49
(0
.32-
0.61
)
2.17
(1
.80-
2.49
)
5.78
(4
.63-
7.31
)
9.65
(7
.34-
13.3
)
14.7
(1
0.7-
22.2
)
32.6
(2
1.5-
58.1
)
Lent
ic
inve
rtebr
ates
8
4 2.
06
1.20
3.
28
0.97
-1
.34
4.00
1.04
(0
.93-
1.15
)
2.16
2.
06-
2.30
)
3.51
(3
.28-
3.87
)
4.52
(4
.14-
5.14
)
5.58
(5
.00-
6.50
)
8.25
(7
.10-
10.2
)
Lotic
and
lent
ic
inve
rtebr
ates
48
31
1.
53
5.62
8.
72
0.90
-0
.15
1.44
0.16
(0
.12-
0.20
)
1.28
(1
.09-
1.46
)
4.91
(4
.02-
6.01
)
9.93
(7
.78-
12.9
)
17.8
(1
3.3-
24.3
)
52.9
36
.2-
81.8
)
All
acut
e in
verte
brat
es
83
52
1.99
4.
87
8.72
0.
88
-0.3
3 1.
64
0.30
(0
.25-
0.34
)
1.57
(1
.43-
1.71
)
4.68
(4
.13-
5.27
)
8.27
(7
.08-
9.65
)
13.2
(1
1.0-
16.0
)
32.0
(2
5.3-
41.2
)
Post
-198
6 in
verte
brat
es
8 6
0.93
0.
28
1.44
0.
97
-0.0
03
3.83
0.46
(0
.41-
0.52
)
1.00
(0
.94-
1.06
)
1.66
(1
.54-
1.84
)
2.16
(1
.95-
2.49
)
2.68
(2
.38-
3.20
)
4.04
(3
.43-
5.13
)
Pre-
1986
in
verte
brat
es
75
47
2.20
5.
11
8.72
0.
86
-0.3
5 1.
56
0.27
(0
.21-
0.32
)
1.73
(1
.51-
1.95
)
5.86
(4
.94-
7.00
)
11.1
(9
.00-
14.0
)
18.8
(1
4.7-
24.9
)
50.6
(3
6.6-
73.6
) C
hron
ic
inve
rtebr
ate
LC50
5
5 4.
5 3.
97
4.51
0.
78
-0.6
2 1.
53
0.37
(0
.028
-0.7
3)
2.53
(1
.22-
4.26
)
8.96
(4
.40-
58.5
)
17.4
(7
.12-
240)
30.0
(1
0.2-
810)
83.4
(2
0.0-
8589
)
War
m w
ater
fis
h EC
10
5 4
5.00
0.
66
2.02
0.
80
-7.1
4 10
.3
3.58
(2
.94-
3.98
)
4.79
(4
.52-
5.17
)
5.80
(5
.42-
6.67
)
6.40
(5
.87-
7.75
)
6.95
(6
.25-
8.81
)
8.11
(7
.01-
11.3
)
Col
d w
ater
fish
EC
10
16
7 5.
20
2.53
6.
82
0.64
-2
.33
3.40
2.03
(0
.31-
2.65
)
4.83
(3
.25-
5.80
)
8.53
(6
.18-
19.2
)
11.5
(7
.73-
43.0
)
14.7
(9
.33-
87.6
)
23.3
(1
3.0-
336)
War
m w
ater
fis
h EC
50
5 4
1.38
0.
51
1.75
0.
94
-0.2
4 2.
82
0.48
(0
.28-
0.62
)
1.35
(1
.12-
1.58
)
2.68
(2
.12-
3.66
)
3.83
(2
.85-
5.94
)
5.15
(3
.59-
9.05
)
8.95
(5
.56-
19.9
)
Col
d w
ater
fish
EC
50
16
7 2.
26
0.81
3.
72
0.89
-1
.47
4.56
1.10
(0
.90-
1.24
)
2.10
(1
.92-
2.26
)
3.21
(2
.87-
3.65
)
4.01
(3
.48-
4.77
)
4.82
(4
.08-
5.97
)
6.80
(5
.46-
9.15
) W
arm
and
col
d w
ater
fish
LC
50
13
9 1.
59
0.45
2.
13
0.90
-0
.33
3.28
0.52
(0
.39-
0.61
)
1.26
(1
.12-
1.40
)
2.28
(1
.95-
2.75
)
3.11
(2
.55-
4.02
)
4.01
(3
.16-
5.54
)
6.46
(4
.74-
10.1
)

21
EPT
taxa
62
38
2.
66
5.51
8.
72
0.82
-0
.39
1.49
0.28
(0
.21-
0.35
)
1.93
(1
.63-
2.23
)
6.86
(5
.51-
8.67
)
13.3
(1
0.2-
18.2
)
23.1
(1
6.8-
33.5
64.5
(4
2.8-
107)
Non
e EP
T ta
xa
21
14
0.96
0.
94
4.27
0.
72
-0.0
06
1.81
0.19
(0
.04-
0.30
)
0.99
(0
.64-
1.29
)
2.89
(1
.82-
5.58
)
5.06
(2
.89-
14.1
)
8.03
(4
.18-
32.2
)
19.1
(8
.17-
149)
A
ll fis
h an
d in
verte
brat
e LC
50
96
61
1.82
4.
42
8.72
0.
89
-0.3
3 1.
75
0.28
(0
.23-
0.32
)
1.64
(1
.46-
1.80
)
5.22
(4
.51-
6.02
)
9.59
(8
.00-
11.5
)
15.8
(1
2.8-
19.8
)
40.6
(3
0.8-
54.9
)
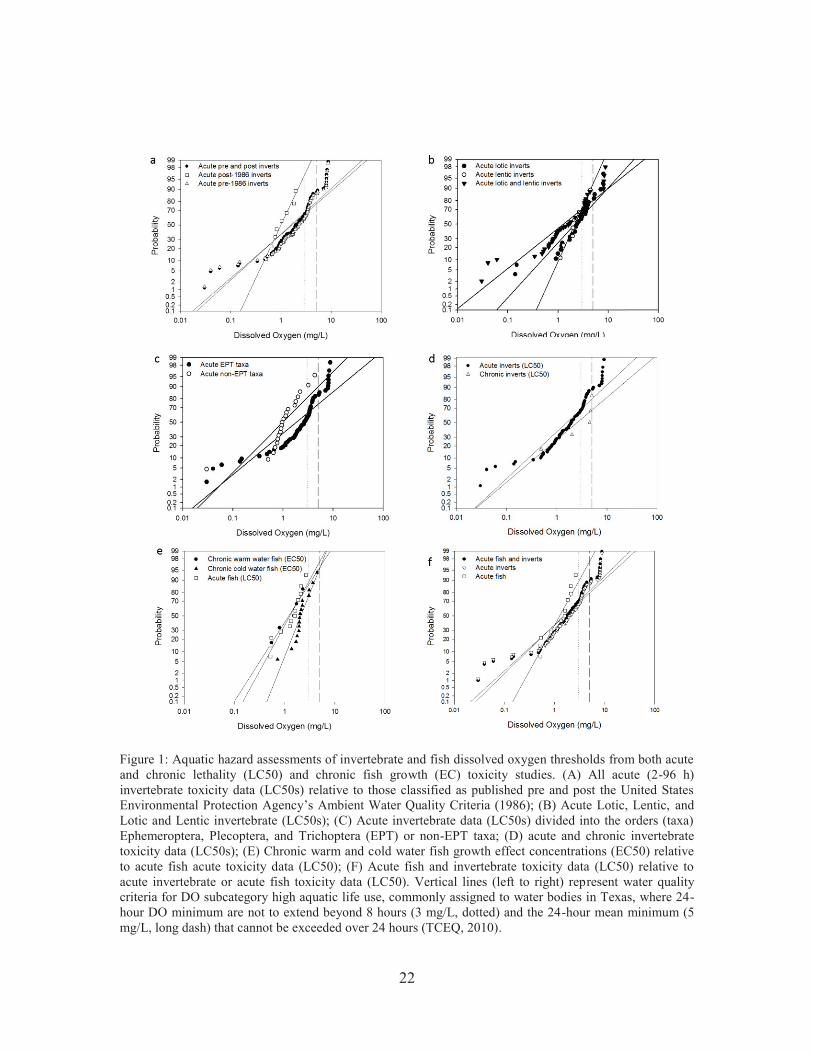
22
Figure 1: Aquatic hazard assessments of invertebrate and fish dissolved oxygen thresholds from both acute and chronic lethality (LC50) and chronic fish growth (EC) toxicity studies. (A) All acute (2-96 h) invertebrate toxicity data (LC50s) relative to those classified as published pre and post the United States Environmental Protection Agency’s Ambient Water Quality Criteria (1986); (B) Acute Lotic, Lentic, and Lotic and Lentic invertebrate (LC50s); (C) Acute invertebrate data (LC50s) divided into the orders (taxa) Ephemeroptera, Plecoptera, and Trichoptera (EPT) or non-EPT taxa; (D) acute and chronic invertebrate toxicity data (LC50s); (E) Chronic warm and cold water fish growth effect concentrations (EC50) relative to acute fish acute toxicity data (LC50); (F) Acute fish and invertebrate toxicity data (LC50) relative to acute invertebrate or acute fish toxicity data (LC50). Vertical lines (left to right) represent water quality criteria for DO subcategory high aquatic life use, commonly assigned to water bodies in Texas, where 24-hour DO minimum are not to extend beyond 8 hours (3 mg/L, dotted) and the 24-hour mean minimum (5 mg/L, long dash) that cannot be exceeded over 24 hours (TCEQ, 2010).

23
Temperature-dependent DO thresholds
Temperature is an important factor in chemical-induced toxicity, which typically
increases with increasing temperature. To examine potential errors and variability
associated with different experimental conditions, we systematically examined low DO
toxicity data from individual studies at multiple temperatures. There were 3 of 9
invertebrate (LC50) and 1 of 2 fish (EC90, EC50 growth) cases following a positive
linear relationship, indicating low DO toxicity increased with elevating temperatures
(Supplementary: Figure: 21 and Supplementary: Figure: 22). Three acute temperature-
dependent SSDs (15, 20, 25 °C) were also constructed using five similarly available low
DO toxicity values for species within the order Ephemeroptera (Supplementary: Figure:
21). When temperature-dependent HC80 values were considered, an insignificant yet
positive relationship between temperature and HC80 values was observed, which
suggests low DO toxicity may be expected to increase with increasing surface water
temperatures (Supplementary: Figure: 21).
Geographic- and habitat-specific DO water quality criteria and standards
States in the south central US were found to have diverging surface water quality
assessment approaches that varied by habitat, time of the year, and aquatic life use
designations relative to AWQC (Table 2). In the state of Texas, for example, historical
high and limited aquatic life use WQC consisted of a 24-h mean and absolute minimum
DO WQC at 5 and 3 mg DO/L, respectively, for reservoir systems, and were dependent
on the type of waterbody (stream, tidally influenced river; Texas Commission on

24
Environmental Quality 2003). These WQS were revised in 2010 to implement DO
concentrations based on aquatic life use (Texas Commission on Environmental Quality
2010). To compare different implementation practices within the south central US, we
found the number of different WQC and standards per state ranged between 1 and 41, not
including site-specific criteria within states of Arkansas, Louisiana, New Mexico,
Oklahoma, and Texas. Subsequently, we compared the number of early life stage (ELS)
and other life stage (OLS) WQC or WQS recommended for cold and warm water fish
species within this region and found the number of states with these distinct criteria
ranged from 0 to 4 and 0 to 36, respectively (Table 3). All six states have derived DO
criteria for warm water species but only three of the six states (Arkansas, New Mexico,
Oklahoma) appear to have derived criteria for cold water fishes due to inherent habitat
differences. Arkansas has the most distinctly different DO WQC (41) accounting for ELS
and OLS, while Louisiana has apparently derived the fewest criterion values (Table 3).

25
Tabl
e 2.
Spe
cific
dis
solv
ed o
xyge
n (D
O)
wat
er q
ualit
y cr
iteria
in th
e so
uth
cent
ral U
nite
d St
ates
of
Am
eric
a. T
he A
quat
ic L
ife C
ateg
ory
indi
cate
s a
Stat
e D
O
crite
ria sp
ecifi
ed fo
r col
d an
d/or
war
m w
ater
aqu
atic
life
. The
Hab
itat S
peci
fic C
ateg
ory
desc
ribes
whe
ther
stat
es c
onta
in sp
ecifi
ed D
O c
riter
ia fo
r lak
es, s
tream
s, an
d/or
impo
undm
ents
, not
incl
udin
g si
te-s
peci
fic c
riter
ia. S
easo
nal D
O C
ateg
orie
s ind
icat
e w
heth
er S
tate
spec
ific
DO
crit
eria
wer
e de
rived
bas
ed o
n se
ason
s, an
d th
e M
ean
and/
or M
inim
um D
O C
riter
ia d
emon
stra
tes
the
rang
e of
crit
eria
val
ues
and
whe
ther
suc
h D
O c
riter
ia e
xist
as
mea
n an
d/or
min
imum
val
ues
in e
ach
Stat
e (A
PCEC
201
1; L
DEQ
201
2; N
MED
200
0; O
WR
B 2
007;
TC
EQ 2
010)
. *O
ther
– I
n Te
xas,
two
diff
eren
t fre
shw
ater
sea
sona
l cr
iteria
are
der
ived
and
in
clud
e on
e sp
ecifi
c fo
r ‘fr
eshw
ater
in sp
ring’
and
‘oth
er’ (
inte
rpre
ted
as th
e cr
iteria
impl
emen
ted
for t
he o
ther
seas
ons)
.
EPA
Reg
ion
6 St
ates
A
quat
ic L
ife
Cat
egor
ies
Hab
itat S
peci
fic
Cat
egor
y Se
ason
al D
O
Cat
egor
ies
Mea
n an
d/or
Min
imum
D
O C
rite
ria
Texa
s Y
es
No
Sprin
g an
d O
ther
* 6.
0-2.
0/4.
0-1.
5 (m
ean/
min
imum
)
New
Mex
ico
Yes
N
o N
one
6.0-
5.0
(min
imum
)
Okl
ahom
a Y
es
No
Apr
il-Ju
ne, S
umm
er,
and
Win
ter
7.0-
3.0
(min
imum
)
Ark
ansa
s Y
es
Yes
M
arch
-May
, Crit
ical
, an
d Pr
imar
y 6.
0-2.
0 (m
inim
um)
Loui
sian
a Y
es
No
Non
e 5.
0 (m
inim
um)

26
Tabl
e 3.
Ind
ivid
ual U
S EP
A R
egio
n 6
stat
e w
ater
qua
lity
crite
ria (
WQ
C)
that
wer
e de
rived
for
the
prot
ectio
n of
ear
ly li
fe s
tage
s (E
LS)
and
othe
r lif
e st
ages
(O
LS).
The
tota
l num
ber o
f DO
WQ
C fo
r eac
h st
ate
wer
e se
para
ted
into
thos
e pr
ovid
ing
prot
ectio
n fo
r col
d an
d w
arm
wat
er fi
sher
ies.
Bas
ed o
n th
e ac
tual
DO
co
ncen
tratio
n, e
ach
indi
vidu
al s
tate
WQ
C i
s pl
aced
int
o a
corr
espo
ndin
g pr
edic
ted
degr
ee o
f fis
herie
s pr
oduc
tion
impa
irmen
t (A
PCEC
201
1; L
DEQ
201
2;
NM
ED 2
000;
OW
RB
200
7; T
CEQ
201
0; U
SEPA
198
6). N
ote,
AR
= A
rkan
sas,
LA =
Lou
isia
na, N
M =
New
Mex
ico,
OK
= O
klah
oma,
TX
= T
exas
. Col
d w
ater
D
O c
once
ntra
tions
for e
arly
life
sta
ges
(the
first
val
ue is
the
reco
mm
ende
d w
ater
col
umn
conc
entra
tion
and
the
valu
e in
par
enth
eses
repr
esen
ts in
terg
rave
l DO
co
ncen
tratio
ns i
n m
g D
O/L
): no
pro
duct
ion
impa
irmen
t =
11 (
8);
slig
ht p
rodu
ctio
n im
pairm
ent
= 9
(6);
mod
erat
e pr
oduc
tion
impa
irmen
t =
8 (5
); se
vere
pr
oduc
tion
impa
irmen
t = 7
(4)
; lim
it to
avo
id a
cute
mor
talit
y =
6 (3
). C
old
wat
er D
O c
once
ntra
tions
for
oth
er li
fe s
tage
s (w
ater
col
umn
conc
entra
tions
in m
g D
O/L
): no
pro
duct
ion
impa
irmen
t = 8
; slig
ht p
rodu
ctio
n im
pairm
ent =
6; m
oder
ate
prod
uctio
n im
pairm
ent =
5; s
ever
e pr
oduc
tion
impa
irmen
t = 4
; lim
it to
avo
id
acut
e m
orta
lity
= 3.
War
m w
ater
DO
con
cent
ratio
ns f
or e
arly
life
sta
ges
(wat
er c
olum
n co
ncen
tratio
ns in
mg
DO
/L):
no
prod
uctio
n im
pairm
ent =
6.5
; slig
ht
prod
uctio
n im
pairm
ent =
5.5
; mod
erat
e pr
oduc
tion
impa
irmen
t = 5
; sev
ere
prod
uctio
n im
pairm
ent =
4.5
; lim
it to
avo
id a
cute
mor
talit
y =
4.
War
m w
ater
DO
co
ncen
tratio
ns f
or o
ther
life
sta
ges
(wat
er c
olum
n co
ncen
tratio
ns in
mg
DO
/L):
no
prod
uctio
n im
pairm
ent =
6; s
light
pro
duct
ion
impa
irmen
t = 5
; m
oder
ate
prod
uctio
n im
pairm
ent =
4; s
ever
e pr
oduc
tion
impa
irmen
t = 3
.5; l
imit
to a
void
acu
te m
orta
lity
= 3
(mod
ified
from
the
U.S
. EPA
Am
bien
t Wat
er Q
ualit
y C
riter
ia
for D
isso
lved
Oxy
gen,
198
6. (*
) = T
hree
WQ
C v
alue
s exi
st in
New
Mex
ico
and
they
app
ly to
bot
h EL
S an
d O
LS
Deg
ree
of P
rodu
ctio
n/G
row
th Im
pair
men
t
Wat
er
Cla
ssifi
catio
n St
ate
Cri
teri
a V
alue
Tot
al N
umbe
r of
D
isso
lved
O
xyge
n W
QC
N
o (0
%)
Slig
ht (1
0%)
Mod
erat
e (2
0%)
Seve
re (4
0%)
Acu
te (>
50%
)
EL
S O
LS
EL
S O
LS
EL
S O
LS
EL
S O
LS
EL
S O
LS
EL
S O
LS
Col
d W
ater
s A
R
Min
imum
1
2 -
- -
2 -
- -
- 1
-
Col
d W
ater
s LA
M
inim
um
- -
- -
- -
- -
- -
- -
Col
d W
ater
s N
M
Min
imum
*3
-
- -
3 -
- -
- 3
-
Col
d W
ater
s O
K
Min
imum
1
2 -
- -
2 -
- 1
- -
-
Col
d W
ater
s TX
M
inim
um
- -
- -
- -
- -
- -
- -
Col
d W
ater
s TX
M
ean
- -
- -
- -
- -
- -
- -
War
m W
ater
s
AR
M
inim
um
2 36
1
11
- 15
1
1 -
- -
9
War
m W
ater
s
LA
Min
imum
1
- -
- 1
1
-
-

27
War
m W
ater
s
NM
M
inim
um
3 -
- -
3 3
- -
- -
-
War
m W
ater
s
OK
M
inim
um
2 4
- -
1 2
- -
- -
1 2
War
m W
ater
s
TX
Min
imum
4
5 -
1 -
1 1
1 1
- 2
2
War
m W
ater
s
TX
Mea
n 4
5 -
- 2
- 1
1 -
- 1
3

28
Discussion
Because the occurrence of worldwide hypoxia may increase in both freshwater
(Watson et al. 2016) and marine environments (Brewer and Peltzer 2009; Pörtner 2010),
the present study examined variability in acute and chronic DO thresholds among
freshwater species. We found experimental designs and study protocols (e.g.,
experimental exposure temperatures, species life stages) for low DO toxicity studies to
vary considerably among fish and invertebrates. For a number of studies, potential
confounding factors could not be resolved in large part due to data paucity and
experimental conditions. For example, Elshout et al. (2013) previously identified juvenile
fish to have higher DO tolerances compared to adults based on LOEC values yet we
could not identify adequate data to further explore such relationships in the present study.
In addition, we were unable to conclude whether the DO toxicity data that formed the
basis for derivation of the 1986 AWQC (U.S. Environmental Protection Agency 1986)
were confounded by differences among wild and hatchery fish, seasonal conditions,
acclimation to laboratory conditions, or by an exceptionally wide range of experimental
conditions including varied feeding regimes and age of organisms. For example, time of
the year is known to play an important role controlling food consumption and growth rate
of both chinook and coho salmon were higher in June than July (and October for coho
salmon) at temperatures near 18 °C (Warren et al. 1973).
As noted above, when additional acute toxicity data for invertebrates were
incorporated in our analyses, the likelihood of encountering species threshold to DO
above the recommended US EPA AWQC increased. Such observations are likely
explained by the selection of species and experimental endpoints studied since 1986. As

29
indicated by our DO sensitivity metrics (i.e., SSDs, HC ratios), invertebrates, particularly
EPT and lotic taxa compared to non-EPT and lentic species, were more sensitive to acute
DO than fish. EPT taxa are commonly used as sensitive bioindicators of environmental
quality in aquatic ecosystems (Cairns and Pratt 1993) because these organisms are quite
sensitive to reduced DO and other types of pollution, which tends to be correlated with
specific habitat types (Jacobsen et al. 2003). Elevated DO sensitivity of invertebrates was
also observed in a study of marine benthic organisms, especially crustaceans and
mollusks (Vaquer-Sunyer and Duarte 2008). Based on the data availability examined in
the present study, we observed lotic taxa to be more sensitive than lentic species, largely
because EPT taxa primarily contributed to lotic distributions. Robust DO thresholds were
not available for numerous benthic invertebrates and fish species, including threatened
and endangered organisms. Thus, whether existing DO WQC and WQS are protective of
most of these imperiled species has not been examined (Woods et al. 2010). Additional
high-quality low DO toxicity data is needed for freshwater fish and invertebrates from
lotic and lentic habitats to more effectively understand differences in DO sensitivity
among freshwater organisms and support more sustainable environmental quality
assessment and management.
When chronic data is not available for contaminants, acute-to-chronic (ACR)
ratios have been used to predict sublethal responses from acute toxicity data. For hypoxia
in freshwater systems, the DO concentration where ≥50% growth impairments occur has
historically been reported to accompany the onset of fish mortality (Doudoroff and
Shumway 1970; U.S. Environmental Protection Agency 1986). In the present study, we
derived a novel ACR of 2.63 from the 80th percentile of warm water fish LC50 and

30
warm water fish growth EC10 distributions (Supplementary: Figure: 23). This ratio
supports the hypothesis that the sensitivity of fish growth and potentially other chronic
responses occur at DO concentrations almost three times the LC50 value (Vaquer-Sunyer
and Duarte 2008). An SSD derived ACR from cold water fish or freshwater invertebrates
could not be calculated due to a lack of available data. However, we derived an ACR of
3.8 for rainbow trout using a geometric LC50 and available EC10 data for growth. Prior
to 1986, DO chronic toxicity data were mostly available for fish, especially those in the
family Salmonidae based on economical and sociological reasons (U.S. Environmental
Protection Agency 1986). Most of the studies used to derive the AWQC predominantly
investigated growth along with some studies of embryonic development and swimming
behavior. Most chronic DO toxicity studies prior to 1986 failed to include a full life
cycle, examine both embryo and larval stages, or encompass an adequate period of post-
larval feeding and growth (U.S. Environmental Protection Agency 1986). Further, studies
of the effects of DO to cold water fish reproduction, fecundity, or fertility, which are
important endpoints relevant to ecological risk assessment and management (Ankley et
al. 2010; U.S. Environmental Protection Agency 1986), were also lacking. Prior to 1986,
two studies were conducted with warm water fish that investigated the effects of DO on
reproduction with fathead minnows and black crappie, but the quality of a life cycle
experiment with fathead minnows is uncertain due to 50% mean larval survival in some
experimental controls (U.S. Environmental Protection Agency 1986; Brungs 1971).
Clearly, future studies are necessary to understand reproductive thresholds of DO to
freshwater fish, amphibians, and invertebrates.

31
To assess the likelihood of acute DO hazards to freshwater communities, we
performed aquatic hazard assessments, which indicated 7, 15, 20, and 28% of
invertebrates, and fish are expected to be adversely affected at 8.0, 5.0, 4.0, and 3.0 mg
DO/L, respectively (Fig. 1f). A similar assessment was conducted by Vaquer-Sunyer and
Duarte (2008) with marine benthic organisms in which cumulative distributions were
created utilizing median lethal concentrations, sublethal thresholds, and median lethal
times that were classified by organism types ranging from echinoderms to fish. Vaquer-
Sunyer and Duarte (2008) identified that the most sensitive groups of organisms
exhibiting the highest LC50 and lowest LT50 90th percentiles were the crustaceans and
mollusks, respectively. In the present study, including the acute warm and cold water fish
LC50 values with the acute invertebrate LC50 values decreased the predicted affects by
4–5% and illustrated the invertebrate community was more sensitive to DO than fish.
Conversely, fish exhibited the highest sublethal response to DO of the compiled marine
benthic organisms, which included endpoints such as avoidance of hypoxic waters,
behavior, and increased ventilation, which differs from the type of fish chronic toxicity
data used in the current study. However, in both assessments, fish chronic responses were
the most sensitive to DO. In the present study, the 50th and 90th percentile warm and
cold water fish LC50 values were 1.26 and 4.01 mg DO/L, respectively, which are
similar concentrations from two different water types. Freshwater to saltwater and vice
versa toxicity extrapolations were previously investigated by Wheeler et al. (2002) who
indicated differences in toxicity sensitivity depending on the chemical (e.g., ammonia,
metals, pesticides, narcotics) that could be accounted for with an appropriate adjustment
factor. Regardless, DO sensitivities across saltwater and freshwater organisms require

32
further research to develop a comparative understanding of DO thresholds among fish
and invertebrates, and support ecosystem protection goals related to biodiversity.
It appears possible that DO effects to marine and freshwater organisms have been
underestimated. For example, Vaquer-Sunyer and Duarte (2008) illustrated the effects of
DO to marine benthic organisms were above the conventional 2 mg DO/L definition of
hypoxia; such predictions for marine invertebrates are consistent with fish and
invertebrate SSDs and corresponding 80th percentile values in the present study (Table
1). Further, Vaquer-Sunyer and Duarte (2008) predicted a 90th percentile median LC50
value for marine organisms of 4.59 mg DO/L, which is similar to the 80th percentile
concentration of 4.64 mg DO/L predicted to adversely affect 20% of freshwater species
from a community SSD for acute DO toxicity data to invertebrates and fish (Fig. 1).
Therefore, DO concentrations approximately twice the 2 mg DO/L hypoxia threshold are
expected to cause significant mortality in marine and freshwater organisms. These DO
thresholds are in direct contrast to the 2.3 mg DO/L ASWQC derived limit to avoid
juvenile and adult mortality. Such a difference may be due to the small range of DO
LC50 values available (~1.29) for both juvenile and adults used in the EPA saltwater
criteria recommendations, while the LC50 range in our present study was 8.72. The
conventional 2 mg DO/L threshold is commonly used to indicate the potential risk to
fisheries, but again, to conserve diversity and avoid mortality events, higher DO levels
are predicted necessary to maintain most aquatic life populations (Vaquer-Sunyer and
Duarte 2008). In fact, the ASWQC recommends a general 4.8 mg DO/L level to prevent
no more than a 25% chronic growth reduction in species (U.S. Environmental Protection
Agency 2000). In comparison, this value is twice as high as our predicted 75th percentile

33
values of 2.41 and 3.21 mg DO/L from warm and cold water fish growth (25% growth
reduction) EC50 SSDs, respectively. Given the global decline of species, particularly
invertebrates, during the Anthropocene (Dirzoet al. 2014), future studies are necessary to
experimentally examine such predictions of DO thresholds for inland waters.
We further examined temperature influences on DO thresholds to freshwater
organisms. Oxygen plays a critical role influencing acute temperature limits of organisms
and relationships among temperature limits of physiological and biochemical pathways
associated with the oxygen supply cascade. For example, the oxygen-limited thermal
tolerance (OLTT) model describes physiological activities of ectotherms when exposed
to various temperatures (Frederich and Pörtner 2000; Pörtner 2001). This model suggests
that aquatic ectotherms, like fishes, generally live within a confined range of
temperatures where they function aerobically without displaying any sign of stress (e.g.,
behavioral disorders). Beyond the optimum temperature range, however, ectotherms
encounter a mismatch of energy demand and supply and eventually shift to anaerobic
respiration at extreme high or low temperatures to increase energy supply for sustaining
essential cellular and physiological functions (Pörtner 2010). When such changes in
temperature and oxygen concentration are introduced, total metabolism, basal
metabolism, and scope of activity of aquatic organisms’ decreases, while the frequency of
locomotory acts and mechanical power decline (Svetlichny et al. 2000). Therefore,
oxygen deficiency (e.g., hypoxia) within body tissues results in changes in growth,
survival, reproduction and even population distribution and abundance under thermal
stress (Perry et al. 2005; Pörtner 2010).

34
Previous studies have compared temperature-dependent chemical toxicity alone
(Zhou et al. 2014) and between geological regions (e.g., temperate, tropical) to the same
chemicals (Wang et al. 2014), but fewer studies have compared stressor-dependent
toxicity to other abiotic factors such as pH (Wang et al. 2016). For the majority of
ectotherms, their physiological performances (e.g., metabolism, appetite, behavior)
follow a thermal curve and experience increased mortality when temperature deviates
from optimum (Bao et al. 2008; Pörtner 2002; Schulte et al. 2011). While the derived US
EPA AWQC were designed to be protective of high seasonal surface water temperatures,
most organisms used to derive the criteria were studied at optimal thermal conditions
during acute and chronic exposures. To examine temperature-dependent DO thresholds
of freshwater organisms, a total of nine invertebrate and two fish species were found to
be studied across at least three different temperatures within the same study
(Supplementary: Figure: 21 and Supplementary: Figure: 22). For invertebrates, only five
species emphemeropterans were studied across the same three temperatures (15, 20, and
25 °C). HC80 values for this temperature-dependent SSD were 3.94, 6.36, and 12.5 mg
DO/L at 15, 20, and 25 °C, respectively. Clearly, the HC80 values increased with
increasing temperature but, again, are only representative of five species within the order.
Coho and Chinook salmon were two additional species studied across more than three
different temperatures (Supplementary: Figure: 22). A temperature-dependent DO
toxicity relationship with growth was clearly observed in Chinook salmon while the
relationship was less clear for cohos. However, these studies were conducted with
juveniles at different developmental stages, weights, diets, and months of the year that
could confound the results. In fact, as mentioned above, time of year was observed to

35
play an important role in controlling the food consumption and growth rate of both
chinook and coho salmon (Warren et al. 1973). Additional research is clearly needed to
understand the influences of temperature on DO thresholds of freshwater organisms,
particularly when considering predictions of climate change.
Divergent implementation practice efforts in surface water quality assessment and
management of DO was observed in a region characterized by diverse watersheds,
experiencing population growth, and susceptible to climate change. We specifically
observed surface water quality practices to differ across habitats, seasons, and aquatic life
relative to the US EPA AWQC in the south central US (Table 2). For example, New
Mexico and Oklahoma have derived criteria based on cold and warm water aquatic
life/communities and both states even derive specific aquatic life/community values for
cool water organisms (New Mexico Environment Department 2000; Oklahoma Water
Resources Board 2007). Similarly, Arkansas derives DO WQS based on the presence of
trout and by habitat categories specific to different stream watershed sizes throughout the
state, and has specific DO standards derived for lakes and reservoirs (Arkansas Pollution
Control and Ecology Commission 2011). Some states (Texas, Oklahoma, Arkansas) have
specific seasonal DO criteria for at least the spring season (March to June depending on
the state), yet routine monitoring for surface water quality parameters, including DO,
largely occurs in summer months. Further, Louisiana does not have specific DO criteria
for habitats or seasons (Louisiana Department of Environmental Quality 2012). Though
the US EPA AWQC recommended instantaneous minimum DO concentrations to be
achieved at all times (U.S. Environmental Protection Agency 1986), our analysis reveals
some DO criteria within the south central US appear inadequate to prevent species from

36
adverse mortality (Table 3). These observations are salient given challenges to develop,
implement and enforce criteria and standards elsewhere in developed and developing
countries. For example, as of 2014, 27 states within the US did not have numeric criteria
for total nitrogen or phosphorus (Manuel 2014), despite influences of nutrient enrichment
on surface water quality and the development of harmful algal blooms (Watson et al.
2015; Brooks et al. 2016). Given such nutrient enrichment, population growth, rising
surface water temperatures, and potential climate-induced sensitivity of organisms
(Heathwaite 2010; Hooper et al. 2013; Solomon et al. 2007), additional studies
examining whether current DO criteria and standards are adequate to protect freshwater
organisms across seasons, habitats, and life history stages are warranted.
References Ankley G, Bennett RS, Erickson RJ, Hoff DJ, Hornung MW, Johnson RD, Mount DR,
Nichols JW, Russom CL, Schmieder PK, Serrrano JA, Tietge JE, Villeneuve DL (2010) Adverse outcome pathways: a conceptual framework to support ecotoxicology research and risk assessment. Environ Toxicol Chem 29:730–741
Arkansas Pollution Control and Ecology Commission (2011) Regulation establishing water quality standards for surface waters of the state of Arkansas. 014.00–002 regulation no. 2. Arkansas Pollution Control and Ecology Commission, Little Rock, p 124
Bao VWW, Koutsaftis A, Leung KMY (2008) Temperature-dependent toxicities of chlorothalonil and copper pyrithione to the marine copepod Tigriopus japonicus and dinoflagellate Pyrocystis lunula. Australas J Ecotoxicol 14:45–54
Brett J, Blackburn J (1981) Oxygen requirements for growth of your coho salmon (Orconhynchus kisutch) and sockey (O. nerka) salmon at 15 degrees Celsius. Can J Fish Aquat Sci 38:399–404
Brewer PG, Peltzer ET (2009) Limits to marine life. Science 324: 347–348 Brooks BW, Riley TM, Taylor RD (2006) Water quality of effluent-dominated
ecosystems: ecotoxicological, hydrological, and management considerations. Hydrobiologia 556:365–379
Brooks BW, Scott JT, Forbes MG, Valenti TW, Stanley JK, Doyle RD, Dean KE, Patek J, Palachek RM, Taylor RD, Koenig L (2008) Reservoir zonation and water quality: science, management and regulations. LakeLine 28:39–43

37
Brooks BW, Valenti TW, Cook-Lindsay BA, Forbes MG, Scott JT, Stanley JK, Doyle RD (2011) Influence of climate change on reservoir water quality assessment and management: effects of reduced inflows on Diel pH and site-specific contaminant hazards. In:
Linkov I, Bridges TS (eds) Climate: global change and local adaptation. NATO Science for Peace and Security Series C: Environmental Security, Springer, New York, pp 491–522
Brooks BW, Lazorchak JM, Howard MDA, Johnson MV, Morton SL, Perkins DAK, Reavie ED, Scott GI, Smith SA, Steevens JA (2016) Are harmful algal blooms becoming the greatest inland water quality threat to public health and aquatic ecosystems? Environ Toxicol Chem 35:6–13
Brungs WA (1971) Chronic effects of low dissolved oxygen concentrations on the fathead minnow (Pimephales promelas). J Fish Res Board Can 28:1119–1123
Cairns J Jr, Pratt JR (1993) A history of biological monitoring using benthic macroinvertebrates. In: Rosenberg DM, Resh VH (eds) Freshwater biomonitoring and benthic macroinvertebrates. Chapman and Hall, New York, pp 10–27
Canadian Council of Ministers of the Environment (2001) Introduction. Updated. In: Canadian environmental quality guidelines, 1999. Canadian Council of Ministers of the Environment, Winnipeg, p 4
Chambers PA, Scrimgeour GJ, Pietroniro A (1997) Winter oxygen conditions in ice-covered rivers: the impact of pulp mill and municipal effluents. Can J Fish Aquat Sci 54:2796–2806
Committee on Environment and Natural Resources (2003) An assessment of coastal hypoxia and eutophication in U.S. waters. National Science Technology Council Committee on Environment and Natural Resources, Washington, DC, p 74
Cooper SR, Brush GS (1991) Long-term history of Chesapeake Bay anoxia. Science 254:992–996
Delorme L (1982) Lake Erie oxygen; the prehistoric record. Can J Fish Aquat Sci 39:1021–1029
Diaz RJ (2001) Overview of hypoxia around the world. J Environ Qual 30:275–281 Diaz RJ, Breitburg DL (2009) The hypoxic environment. Fish Physiol 27: 1–23 Dirzo R, Young HS, Galetti M, Ceballos G, Isaac NJB, Collen B (2014) Defaunation in
the Anthropocene. Science 345:401–406 Doudoroff O, Shumway DL (1970) Dissolved oxygen requirements of freshwater fishes
vol FAO technical paper no. 86. Food Agriculture Organization, United Nations, Rome
Elshout PMF, Dionisio Pires LM, Leuven RSEW, Wendelaar Bonga SE, Hendriks AJ (2013) Low oxygen tolerance of different life stages of temperate freshwater fish species. J Fish Biol 83:190–206
Frederich M, Pörtner HO (2000) Oxygen limitation of thermal tolerance defined by cardiac and ventilatory performance in spider crab, Maja squinado. Am J Phys 279:R1531–R1538
Grist EP, Leung KM, Wheeler JR, Crane M (2002) Better bootstrap estimation of hazardous concentration thresholds for aquatic assemblages. Environ Toxicol Chem 21:1515–1524

38
Heathwaite AL (2010) Multiple stressors on water availability at global to catchment scales: understanding human impact on nutrient cycles to protect water quality and water availability in the long term. Fresh Biol 55:241–257
Hooper MJ, Ankley GT, Cristol DA, Maryoung LA, Noyes PD, Pinkerton KE (2013) Interactions between chemical and climate stressors: a role for mechanistic toxicology in assessing climate change risks. Environ Toxicol Chem 32:32–48
Jacob U, Hendrik W, Reinhard K (1984) Aquatic insect larvae as indicators of limiting minimal contents of dissolved oxygen part II. Aquat Insect 6:185–190
Jacobsen D, Rostgaard S, Vásconez JJ (2003) Are macroinvertebrates in high altitude streams affected by oxygen deficiency? Freshw Biol 48:2025–2032
Lind OT, Terrell TT, Kimmel BL (1993) Problems in reservoir trophic state classification and implications for reservoir management. Comparative Reservoir Limnology and Water Quality Management. Springer, New York, pp 57–67
Louisiana Department of Environmental Quality (2012) Water pollution control. Title 33 Environmental quality park IX water quality subpart 1. Louisiana Department of Environmental Quality, Baton Rouge, p 398
Manuel J (2014) Nutrient pollution: a persistent threat to waterways. Environ Health Perspect 122:A304
Merritt RW, Cummins KW (1996) An introduction to the aquatic insects of North America. Kendall Hunt Nebeker AV, Dominguez SE, Chapman GA, Onjukka ST, Stevens DG (1992) Effects of low dissolved oxygen on survival, growth and reproduction of Daphnia, Hyalella and Gammarus. Environ Toxicol Chem 11:373–379
Nebeker AV, Onjukka ST, Stevens DG, Chapman GA (1996) Effect of low dissolved oxygen on aquatic life stages of the caddisfly Clistoronia magnifica (Limnephilidae). Arch Environ Con Tox 31: 453–458
New Mexico Environment Department (2000) Water quality part: standards for interstate and intrastate surface waters. Title 20 Environment protection. New Mexico Environment Department, Santa Fe, p 48
Oklahoma Water Resources Board (2007) Oklahoma’s water quality standards. OAC Title 785 chapter 45. Oklahoma Water Resources Board, Oklahoma City, p 114
Perry AL, Low PJ, Ellis JR, Reynolds JD (2005) Climate change and distribution shifts in marine fishes. Science 308:1912–1915
Pollock MS, Clarke LMJ, Dube MG (2007) The effects of hypoxia on fishes: from ecological relevance to physiological effects. Environ Rev 15:1–14
Pörtner HO (2001) Climate change and temperature-dependent biogeography: oxygen limitation of thermal tolerance in animals. Naturwissenschaften 88:137–146
Pörtner HO (2002) Climate variations and the physiological basis of temperature dependent biogeography: systemic to molecular hierarchy of thermal tolerance in animals. Comp Biochem Physiol A Mol Integr Physiol 132:739–761
Pörtner H-O (2010) Oxygen-and capacity-limitation of thermal tolerance: a matrix for integrating climate-related stressor effects in marine ecosystems. J Exp Biol 213:881–893
Posthuma L, Traas TP, Sutter II GW (eds) (2002) Species sensitivity distributions in ecotoxicology. Lewis, Boca Raton

39
Schulte PM, Healy TM, Fangue NA (2011) Thermal performance curves, phenotypic plasticity, and the time scales of temperature exposure. Integr Comp Biol 51:691–702
Solomon S, Qin D, Manning M, Chen Z, Marquis M, Averyt KB, Tignor M, Miller HL (2007) Contribution of working group I to the fourth assessment report of the intergovernmental panel on climate change. Cambridge University Press, Cambridge, p 996
Sprague JB (1963) Resistance of four freshwater crustaceans to lethal high temperature and low oxygen. J Fish Res Board Can 20:387–415
Sprague JB (1973) The ABC’s of pollutant bioassay using fish. ASTM International 528:6–30
Stiff MJ, Cartwright NG, Crane RI (1992) Environmental quality standards for dissolved oxygen. National Rivers Authority, Almondsbury Bristol, p 58
Svetlichny LS, Hubareva ES, Erkan F, Gucu AC (2000) Physiological and behavioral aspects of Calanus euxinus females (Copepoda: Calanoida) during vertical migration across temperature and oxygen gradients. Mar Biol 137:963–971
Texas Commission on Environmental Quality (2003) Guidance for assessing Texas surface and finished drinking water quality data, 2004. Surface Water Quality Monitoring Program, Texas Commission on Environmental Quality, Austin, TX
Texas Commission on Environmental Quality (2010) Chapter 307—Texas surface water quality standards. Texas Commission on Environmental Quality 307:1–307.10
Thornton KW, Kimmel BL, Payne FE (1990) Reservoir limnology: ecological perspectives. John Wiley & Sons, Inc., New York, p 256
U.S. Environmental Protection Agency (1986) Ambient water quality criteria for dissolved oxygen. EPA-440/5–86-003. Environmental Protection Agency, Washington, DC, p 46
U.S. Environmental ProtectionAgency (2000) Ambient aquatic life water quality criteria for dissolved oxygen (saltwater): Cape Cod to Cape Hatteras. EPA-822-R-00-012. Environmental Protection Agency, Washington, DC p 49
U.S. Environmental Protection Agency (2012) National Coastal Condition Report IV. EPA-842-R-10-003. Environmental Protection Agency, Washington, DC, p 368
Valenti TW, Taylor JM, Back JA, King RS, BrooksBW (2011) Influence of drought and total phosphorus on diel pH in wadeable streams: implications for ecological risk assessment of ionizable contaminants. Integr Enviro Assess Manage 7:636–647
Vaquer-Sunyer R, Duarte CM (2008) Thresholds of hypoxia for marine biodiversity. Proc Natl Acad Sci U S A 105:15452–15457
Wang Z, Kwok KW, Lui GC, Zhou G-J, Lee J-S, Lam MH, Leung KM (2014) The difference between temperate and tropical saltwater species’ acute sensitivity to chemicals is relatively small. Chemosphere 105:31–43
Wang Z, Meador JP, Leung KM (2016) Metal toxicity to freshwater organisms as a function of pH: a meta-analysis. Chemosphere 144: 1544–1552
Warren C, Doudoroff P, Shumway D (1973) Development of dissolved oxygen criteria for freshwater fish. EPA-R3–73-019. Ecological Research Series Report, Washington, DC, USA, p 121
Watson SB, Whitton BA, Higgins SN, Paerl HW, Brooks BW, Wehr J (2015) Harmful Algal Blooms. In: J Wehr, RG Sheath, JP Kociolek (Eds). Freshwater Algae of

40
North America: Ecology and Classification, 2nd Edition. Academic Press, Amsterdam. pp. 871- 918.
Wheeler JR, Grist EPM, Leung KMY, Morritt D, Crane M (2002) Species sensitivity distributions: data and model choice. Marine Poll Bull 45:192–202
Watson SB, Miller C, Arhonditsis G, Boyer GL, Carmichael W, Charlton MN, Confesor R, Depew DC, Höök TO, Ludsin SA, Matisoff G (2016) The re-eutrophication of Lake Erie: harmful algal blooms and hypoxia. Harmful Algae 56:44–66
Woods HA, Poteet MF, Hitchings PD, Brain RA, Brooks BW (2010) Conservation physiology of the Plethodontid salamanders Eurycea nana and E. sosorum: response to declining dissolved oxygen. Copeia 2010(4):540–553
Zhou Y, Obenour DR, Scavia D, Johengen TH, Michalak AM (2013) Spatial and temporal trends in Lake Erie hypoxia, 1987-2007. Environ Sci Technol 47:899–905
Zhou G-J, Wang Z, Lau ETC, Xu X-R, Leung KMY (2014) Can wepredict temperature- dependent chemical toxicity to marine organisms and set appropriate water quality guidelines for protecting marine ecosystems under different thermal scenarios? Mar Pollut Bull 87:11–21

41
CHAPTER THREE Global Scanning Assessment of Calcium Channel Blockers in the Environment: Review
and Analysis of Occurrence, Ecotoxicology and Hazards in Aquatic Systems
This chapter published as: Saari GN, Scott WC, Brooks BW. 2017. Global scanning assessment of calcium channel blockers in the environment: Review and analysis of
occurrence, ecotoxicology and hazards in aquatic systems. Chemosphere 189:466-478.
Abstract As an urban water cycle is increasingly realized, aquatic systems are influenced
by sewage and wastewater effluent discharges of variable quality. Such urbanization
results in exposures of non-target aquatic organisms to medicines and other contaminants.
In the present study, we performed a unique global hazard assessment of calcium channel
blockers (CCB) in multiple environmental matrices. Effluent and freshwater observations
were primarily from North America (62% and 76%, respectively) and Europe (21% and
10%, respectively) with limited-to-no information from rapidly urbanizing regions of
developing countries in Asia-Pacific, South America, and Africa. Only 9% and 18% of
occurrence data were from influent sewage and marine systems, though developing
countries routinely discharge poorly treated wastewater to heavily populated coastal
regions. Probabilistic environmental exposure distribution (EED) 5th and 95th percentiles
for all CCBs were 1.5 and 309.1 ng/L in influent, 5.0 and 448.7 ng/L for effluent, 1.3 and
202.3 ng/L in freshwater, and 0.17 and 12.9 ng/L in saltwater, respectively.
Unfortunately, global hazards and risks of CCBs to non-target organisms remain poorly
understood, particularly for sublethal exposures. Thus, therapeutic hazard values (THV)
were calculated and employed during probabilistic hazard assessments with EEDs when

42
sufficient data was available. Amlodipine and verapamil in effluents and freshwater
systems exceeded THVs 28% of the time, highlighting the need to understand ecological
consequences of these CCBs. This global scanning approach demonstrated the utility of
global assessments to identify specific CCBs, chemical mixtures with common
mechanisms of action, and geographic locations for which environmental assessment
efforts appear warranted.
1. Introduction
Whereas unprecedented growth and concentration of human populations is
occurring in urban areas, resource consumption, including chemical use, is also
concentrating (Brooks, 2014; Postel, 2010). Advancing sustainable water management is
increasingly important as global access to chemical products is increasing faster than
wastewater management systems and infrastructure are being implemented. For example,
80% of global sewage production remains untreated. Consumption of consumer goods,
including human pharmaceuticals, varies worldwide, while the number of persons above
age 60 is expected to double by 2050 (Gaw and Brooks, 2016; Kookana et al., 2014).
Coincidentally, 70% of the human population reside in coastal cities where local water
resources are stressed from insufficient waste management, climate change, and
contaminant loadings (Hooper, 2013; Vorosmarty et al., 2010; Water, 2009). Herein,
potential risks of pharmaceuticals in the aquatic environment are of increasing concern to
water resources, wildlife, and public health (Arnold et al., 2014; Ashbolt et al., 2013),
particularly in developing countries (Kookana et al., 2014). Pharmaceuticals are often
continuously released from wastewater treatment plants (WWTP) resulting in potential

43
life cycle exposures to non-target aquatic organisms, especially in arid to semi-arid
geographic regions where effluent-dominated or dependent systems are common (Ankley
et al., 2007; Brooks et al., 2006). Around 98% of published literature on pharmaceuticals
in the environment (PiE) has been published since 1995 and has increased by 5- and 10-
fold in the past two decades (Daughton, 2016). This research growth has been spurred by
an increasing ability to detect human and veterinary medicines in the environment, which
has provided information to support exposure assessments and to consider their potential
toxicological effects to non-target organisms (Halling-Soensen et al., 1998; Monteiro and
Boxall, 2010; Ternes, 1998). However, various classes of pharmaceuticals have received
differential attention. For example, initial studies emphasized endocrine disrupting
compounds while more recent assessments have focused on antibiotics, antidepressants,
antihistamines, and others (Brooks, 2014; Gaw and Brooks, 2016; Kookana et al., 2014;
Kristofco and Brooks, 2017). Unfortunately, environmental hazards and risks of calcium
channel blockers (CCB) to non-target aquatic organisms remain poorly examined. CCBs
represent a class of compounds previously identified to pose potential risks to ecosystems
(Berninger and Brooks, 2010). These commonly prescribed substances are reported to
accumulate in tissues of freshwater and terrestrial wildlife (Fick et al., 2010b; Lazarus et
al., 2015; Scott et al., 2016). Calcium antagonists were discovered in the 1960s (Spedding
and Paoletti, 1992) and then introduced to the market as medicines in the 1980s. These
antagonists are intended to elicit therapeutic benefits through voltage dependent calcium
channel inhibition for treatment of hypertension and angina (Law et al., 2013). Similar to
other pharmaceuticals and down the drain compounds, CCBs are primarily introduced to
the environment through reclaimed wastewater discharges following excretion as parent

44
compounds or metabolites from patients. For example, approximately 30% of verapamil
is excreted as the parent compound without metabolism while other CCBs can be almost
entirely excreted as inactive metabolites (Law et al., 2013). As urbanizing aquatic
systems are increasingly influenced by WWTP effluent discharges and untreated sewage,
understanding environmental hazards and risks of chronic low dose CCB exposures to
non-target organisms is necessary for effective water management (Ankley et al., 2007;
Brooks et al., 2006). For example, understanding differential hazards and risks of specific
pharmaceuticals across geographic regions has recently been reported and emphasized as
a critical research need (Boxall et al., 2012; Rudd et al., 2014). In the present study, we
performed a novel global scanning assessment for CCBs in the environment. The
objectives of this study were to critically review the current knowledge of CCB
occurrence and to initially assess associated hazards in various environmental water
matrices. We specifically examined the refereed literature for CCB occurrence and
ecotoxicology data. When data availability was sufficient, environmental exposure
distributions for specific CCBs were developed. These distributions were then used to
predict the probability of exceeding individual CCB therapeutic hazard values (THV) in
surface waters and effluents among geographic regions.
2. Materials and methods 2.1 Literature review of calcium channel blockers
A list of CCBs was compiled from the Mammalian Pharmacokinetic Prioritization
for Aquatic Species Targeting (MaPPFAST) database (Berninger et al., 2016). Literature
searches through March 12, 2017 returned approximately 143 relevant publications from

45
almost 2800 hits. A similar search was conducted for CCB ecotoxicity data. In these
publications, quantitative data on CCBs was collated based on standard study parameters,
analytical instrumentation, and geographic region (e.g., Africa, Asia-Pacific, Europe,
North America, and South America) as previously described (Corrales et al., 2015;
Kristofco and Brooks, 2017).
2.2 Probabilistic environmental hazard assessments 2.2.1 Environmental exposure distributions
After CCB occurrence data was compiled and collated, probabilistic
environmental exposure distributions (EEDs) were created using maximum measured
environmental concentrations (MEC) for each water matrix when greater than occurrence
observations were available (Wheeler et al., 2002) for a matrix. MECs were used due to
differential data reporting to represent conservative exposure conditions. All graphs were
created in Sigmaplot 11.0 (Systat Software, Inc.). Distributions were then used to perform
probabilistic environmental hazard assessments (PEHAs) to estimate probabilities of
encountering environmental occurrence of each CCB at or above a threshold
concentration. This approach generally followed those methods previously described
(Corrales et al., 2015; Kristofco and Brooks, 2017; Solomon and Takacs, 2001). MECs
were ranked in ascending order and assigned percentiles using the Weibull formula (Eq.
(1)):
j = (i x 100)/(n + 1) (1)
where j is the percent rank, i is the rank assigned to a MEC, n is the number of chemicals
examined, and n+1 accounts for the assumption that there is always one less than all

46
occurrences measured (Posthuma et al., 2010). EEDs were then constructed with CCB
concentrations as the x-axis and percent rank as the y-axis (log common and probability
transformed, respectively). Linear regression analyzes were performed and the slope and
y-intercept were extracted to calculate centile values (Microsoft Excel 2016 Microsoft
Corp, Richmond, WA, USA) using the equation:
Centile value = NORMDIST((b x log 10(x)) + a) (2)
where the NORMSDIST returns a standard normal cumulative distribution function of a
selected value, and b and a represent the slope and intercept, respectively, from a linear
regression. These exceedance values were derived from each EED for various water
matrices and geographic regions.
2.2.2 Therapeutic hazard values
To identify whether CCB concentrations in water matrices may adversely affect
fish, THVs were calculated for each compound to estimate therapeutic hazards relative to
various EEDs. A THV is a predicted pharmaceutical water concentration expected to
bioaccumulate in fish plasma to a human therapeutic level (Cmax or Cmin; Eq. (3);
(Brooks, 2014)).
THV = Cmin/PBlood:Water (3)
Despite some previously noted limitations (Brooks, 2014), plasma modeling approaches
have been employed by our research group (Berninger et al., 2011; Valenti et al., 2012;
Du et et al., 2014; Scott et al., 2016) and others (Fick et al., 2010a; Margiotta-Casaluci et
al., 2014, 2016) to predict fish internal doses of pharmaceuticals. These concepts were

47
initially derived from fish uptake modeling performed by Fitzsimmons et al. (2001) (Eq.
(4)) and incorporated by Huggett et al. (2003) to prioritize pharmaceuticals of
LogPBlood:Water = log ((100.73 x logKOW
x 0.16) + 0.84) (4)
environmental concern by estimating fish plasma steady state drug concentrations (Eq.
(5)).
Fish plasma concentration = [Aqueous] x logPBlood:Water (5)
2.3 Concentration addition modeling
To determine whether occurrence of individual components in CCB mixtures with
a common mode of action may exceed a combined therapeutic hazard concentration,
studies that quantitated multiple CCBs within the same study and location were collated.
Concentration addition (CA) is generally considered an appropriate approach to
approximate ecological effects when compounds exert toxicity through a common mode
of action. Additionally, CA has been suggested as a ‘worst case’ assumption to
conservatively overestimate mixture responses and has successfully been applied for
prediction of mixture effects for estrogenic agents, pesticides, herbicides, and other
pollutants (Kortenkamp et al., 2009). Herein, MECs were combined within the same
dataset, ranked, and plotted as described above. Distributions and associated MECs were
calculated for each compound at the 5th, 20th, 50th, 80th, and 95th centiles, which were
then divided by THVs to create an additive Therapeutic Hazard Ratio (∑THR; Gaw and
Brooks, 2016) similar to previous CA methods ((Faust et al., 2001; Kortenkamp et al.,
2009); Eq. (6)).
Additive THR = ∑(MECn/THVi) + (MECn/THVi) + … (6)

48
where ∑ is the sum of each ratio at MECn, n is the percentile from each distribution (e.g.,
diltiazem, verapamil), and i is the compound specific THV for each CCB. Ratios per
compound and MEC were summed. For example, if values exceeding 1 were observed,
then CA modeling predicted an additive CCB THR exceedance from environmental
occurrence studies examining multiple CCB in a specific matrix.
3. Results and discussion 3.1 Global occurrence of calcium channel blockers
Published articles detecting CCBs in environmental water matrices have steadily
increased over the past 15 years (Figure 2). Ground water, influent sewage, effluent
discharge, freshwater, and saltwater/estuarine surface waters represented the primary
media studied though others investigations have included invertebrates, fish, birds,
sludge, and sediments (Supplementary: Table 17). Similar CCBs were detected in
influent, effluent, freshwater, and saltwater (Tables 4-7), which allowed for comparative
study of these water matrices. When data availability was sufficient (e.g., >5 data values),
distributions of CCBs across all global (Figure 3) and specific geographic regions by
matrix identified diverse geographic hazard profiles (Figs. 3A-E & 4A-F). Unfortunately,
the occurrence of CCBs were not available for multiple regions. In fact, the majority of
occurrence data have been studied in North America, Europe and parts of Asia-Pacific.
Limited data was available from South America. Further, the occurrence of CCBs in
large geographic regions such as Africa and Antarctica, and specific regions (e.g., the
Middle East), were not available, and thus remain poorly understood.

49
Figure 2: Peer-reviewed studies measuring the occurrence of calcium channel blockers in environmental matrices through time (until March 2017).

50
Tabl
e 4.
Det
ectio
n fr
eque
ncy
and
geog
raph
ic d
istri
butio
n of
cal
cium
cha
nnel
blo
cker
s in
influ
ent s
ewag
e.
In
fluen
t Det
ectio
ns (n
g/L)
Geo
grap
hic
Dis
trib
utio
n
Com
poun
d #
Tim
es
Stud
ied
# T
imes
D
etec
ted
Rat
io
Min
M
ax
A
fric
a A
sia-
Paci
fic
Eur
ope
Nor
th
Am
eric
a So
uth
Am
eric
a
*Am
lodi
pine
4
2 2/
4 N
D
247
-
1 3
1 -
Cle
vidi
pine
0
0 0/
0 N
D
ND
- -
- -
-
Deh
ydro
nife
dipi
ne
2 1
1/2
ND
< 10.0
- -
- 2
-
Des
met
hyld
iltia
zem
1
1 1/
1 20
.3
32.1
- -
- 1
-
Dilt
iaze
m
15
15
15/1
5 N
D
1800
- 2
5 8
-
Felo
dipi
ne
0 0
0/0
ND
N
D
-
- -
- -
Flun
ariz
ine
0 0
0/0
ND
N
D
-
- -
- -
Isra
dipi
ne
0 0
0/0
ND
N
D
-
- -
- -
Mib
efra
dil
0 0
0/0
ND
N
D
-
- -
- -
Nic
ardi
pine
0
0 0/
0 N
D
ND
- -
- -
-
Nife
dipi
ne
7 3
3/7
ND
44
0
2
2 2
1
Nim
odip
ine
0 0
0/0
ND
N
D
-
- -
- -
Nis
oldi
pine
0
0 0/
0 N
D
ND
- -
- -
-
Nitr
endi
pine
0
0 0/
0 N
D
ND
- -
- -
-
Nor
vera
pam
il 1
0 0/
1 N
D
ND
- -
1 -
-
Ver
apam
il 9
8 8/
9 N
D
72
-
2 6
1 -
* H
uber
et a
l (20
16)
mea
sure
d am
lodi
pine
in e
fflu
ent f
rom
two
coun
tries
(Eu
rope
and
Nor
th A
mer
ica)
; the
refo
re, t
he to
tal s
tudi
es th
roug
hout
the
geog
raph
ic
regi
ons (
5) d
oes n
ot m
atch
the
# tim
es st
udie
d (4
).

51
Tabl
e 5.
Det
ectio
n fr
eque
ncy
and
geog
raph
ic d
istri
butio
n of
cal
cium
cha
nnel
blo
cker
s in
efflu
ent w
aste
wat
er.
E
fflu
ent D
etec
tions
(ng/
L)
G
eogr
aphi
c D
istr
ibut
ion
Com
poun
d #
Tim
es
Stud
ied
# T
imes
D
etec
ted
Rat
io
Min
M
ax
A
fric
a A
sia-
Paci
fic
Eur
ope
Nor
th
Am
eric
a So
uth
Am
eric
a
*Am
lodi
pine
7
4 4/
7 N
D
448
-
2 4
2 -
Cle
vidi
pine
0
0 0/
0 N
D
ND
- -
- -
-
Deh
ydro
nife
dipi
ne
5 4
4/5
ND
15
- -
- 5
-
Des
met
hyld
iltia
zem
2
2 2/
2 14
.1
110
-
- -
2 -
Dilt
iaze
m
30
29
29/3
0 N
D
425
-
2 10
18
-
Felo
dipi
ne
0 0
0/0
ND
N
D
-
- -
- -
Flun
ariz
ine
0 0
0/0
ND
N
D
-
- -
- -
Isra
dipi
ne
0 0
0/0
ND
N
D
-
- -
- -
Mib
efra
dil
0 0
0/0
ND
N
D
-
- -
- -
Nic
ardi
pine
0
0 0/
0 N
D
ND
- -
- -
-
Nife
dipi
ne
9 5
5/9
ND
89
3
2 3
1
Nim
odip
ine
0 0
0/0
ND
N
D
-
- -
- -
Nis
oldi
pine
0
0 0/
0 N
D
ND
- -
- -
-
Nitr
endi
pine
0
0 0/
0 N
D
ND
- -
- -
-
Nor
vera
pam
il 5
2 2/
5 N
D
71
-
- 3
2 -
Ver
apam
il 14
12
12
/14
ND
19
0
- 1
9 4
- *
Hub
er e
t al (
2016
) m
easu
red
amlo
dipi
ne in
eff
luen
t fro
m tw
o co
untri
es (
Euro
pe a
nd N
orth
Am
eric
a); t
here
fore
, the
tota
l stu
dies
thro
ugho
ut th
e ge
ogra
phic
re
gion
s (8)
doe
s not
mat
ch th
e #
times
stud
ied
(7).

52
Tabl
e 6.
Det
ectio
n fr
eque
ncy
and
geog
raph
ic d
istri
butio
n of
cal
cium
cha
nnel
blo
cker
s in
fres
hwat
er.
Fr
eshw
ater
Det
ectio
ns (n
g/L
)
Geo
grap
hic
Dis
trib
utio
n
Com
poun
d #
Tim
es
Stud
ied
# T
imes
D
etec
ted
Rat
io
Min
M
ax
A
fric
a A
sia-
Paci
fic
Eur
ope
Nor
th
Am
eric
a So
uth
Am
eric
a
*Am
lodi
pine
8
6 6/
8 N
D
25
-
3 3
2 -
Cle
vidi
pine
0
0 0/
0 N
D
ND
- -
- -
-
Dilt
iaze
m
37
30
30/3
7 N
D
173
-
2 7
28
-
Deh
ydro
nife
dipi
ne
11
6 6/
11
ND
30
- -
- 11
-
Des
met
hyld
iltia
zem
4
4 4/
4 <
0.14
9 65
- -
- 4
-
Felo
dipi
ne
0 0
0/0
ND
N
D
-
- -
- -
Flun
ariz
ine
0 0
0/0
ND
N
D
-
- -
- -
Isra
dipi
ne
0 0
0/0
ND
N
D
-
- -
- -
Mib
efra
dil
0 0
0/0
ND
N
D
-
- -
- -
Nic
ardi
pine
0
0 0/
0 N
D
ND
- -
- -
-
Nife
dipi
ne
8 2
2/8
ND
50
- 3
3 2
-
Nim
odip
ine
0 0
0/0
ND
N
D
-
- -
- -
Nis
oldi
pine
0
0 0/
0 N
D
ND
- -
- -
-
Nitr
endi
pine
0
0 0/
0 N
D
ND
- -
- -
-
Nor
vera
pam
il 7
3 3/
7 N
D
0.9
-
- 4
3 -
Ver
apam
il 13
8
8/13
N
D
319
-
- 8
5 -
* H
uber
et a
l (20
16)
mea
sure
d am
lodi
pine
in e
fflu
ent f
rom
two
coun
tries
(Eu
rope
and
Nor
th A
mer
ica)
; the
refo
re, t
he to
tal s
tudi
es th
roug
hout
the
geog
raph
ic
regi
ons (
5) d
oes n
ot m
atch
the
# tim
es st
udie
d (4
).

53
Tabl
e 7.
Det
ectio
n fr
eque
ncy
and
geog
raph
ic d
istri
butio
n of
cal
cium
cha
nnel
blo
cker
s in
saltw
ater
.
Sa
ltwat
er D
etec
tions
(ng/
L)
G
eogr
aphi
c D
istr
ibut
ion
Com
poun
d #
Tim
es
Stud
ied
# T
imes
D
etec
ted
Rat
io
Min
M
ax
A
fric
a A
sia-
Paci
fic
Eur
ope
Nor
th
Am
eric
a So
uth
Am
eric
a
*Am
lodi
pine
5
1 1/
5 N
D
< 4.17
- -
4 2
Cle
vidi
pine
0
0 0/
0 N
D
ND
- -
- -
-
Deh
ydro
nife
dipi
ne
1 0
0/1
ND
N
D
-
- -
1 -
Des
met
hyld
iltia
zem
2
1 1/
2 N
D
1.7
-
- -
2 -
Dilt
iaze
m
6 6
6/6
ND
23
.5
-
1 2
3 -
Felo
dipi
ne
0 0
0/0
ND
N
D
-
- -
- -
Flun
ariz
ine
0 0
0/0
ND
N
D
-
- -
- -
Isra
dipi
ne
0 0
0/0
ND
N
D
-
- -
- -
Mib
efra
dil
0 0
0/0
ND
N
D
-
- -
- -
Nic
ardi
pine
0
0 0/
0 N
D
ND
- -
- -
-
Nife
dipi
ne
1 1
1/1
ND
3.
7
- -
- 1
-
Nim
odip
ine
0 0
0/0
ND
N
D
-
- -
- -
Nis
oldi
pine
0
0 0/
0 N
D
ND
- -
- -
-
Nitr
endi
pine
0
0 0/
0 N
D
ND
- -
- -
-
Nor
vera
pam
il 2
0 0/
2 N
D
ND
- -
1 1
-
Ver
apam
il 4
2 2/
4 N
D
3
- -
2 2
- *
Hub
er e
t al (
2016
) m
easu
red
amlo
dipi
ne in
sal
twat
er f
rom
two
coun
tries
(Eur
ope
and
Nor
th A
mer
ica)
; the
refo
re, t
he to
tal s
tudi
es th
roug
hout
the
geog
raph
ic
regi
ons (
6) d
oes n
ot m
atch
the
# tim
es st
udie
d (5
).

54
Figure 3: Global calcium channel blocker (CCB) environmental exposure distributions of maximum measured environmental concentrations in influent sewage, effluent, freshwater, and saltwater. Numbers within parenthesis indicate the number of detections in each matrix. Four different CCBs, which were detected throughout different geographic regions, are included in each matrix EED.

55
Figure 4: Environmental exposure distributions of maximum measured effluent concentrations for diltiazem, verapamil, and amlodipine across all and within specific geographic regions. Numbers within parenthesis indicate the number of detections in each geographic region. Vertical short dashed lines (red) represent the therapeutic hazard value (THV) for a calcium channel blocker.
Figure 5: Environmental exposure distributions of maximum measured freshwater and saltwater concentrations for diltiazem, verapamil, and nifedipine and its metabolite dehydronifedipine across all and within specific geographic regions. Numbers within parenthesis indicate the number of detections in each geographic region. Vertical short dashed lines (red) represent the therapeutic hazard value (THV) for a calcium channel blocker.

56
3.2 Calcium channel blockers in influent
Four CCBs and several metabolites were studied in influent sewage, and only
three were detected several times throughout all geographic regions (Table 4;
Supplementary: Table 17). The most frequently studied compounds in influent were
diltiazem (15), verapamil (9), and nifedipine (7). Most of the publications studying
occurrence of CCBs in influent were from Europe (17) and North America (15). No
refereed studies were found detailing the investigation of these compounds in Africa or
Antarctica; only one publication was observed from South America. Diltiazem and
verapamil were the most frequently studied CCBs in North America and Europe,
respectively (Table 4). Additionally, over half of the studies evaluating amlodipine were
from Europe. Concentrations of all CCBs in influent ranged from no detects to 1800 ng/L
(diltiazem; Du et al., 2014). Whereas exposure to pharmaceuticals from untreated
wastewater influent (e.g., sewage) is less commonly observed in developed countries, as
noted above the majority (80%) of global sewage is released untreated to the environment
(http://www.unesco.org/new/en/natural-sciences/environment/water/wwap/wwdr/).
3.3 Calcium channel blockers in effluent
Seven CCBs, including metabolites, have been reported in reclaimed wastewater
effluents (Supplementary: Table 17). All seven of these compounds were detected in at
least one study. Similar to influent, the most studied CCBs were diltiazem (30),
verapamil (14), nifedipine (9), and amlodipine (7; Table 5). Interestingly, the primary
metabolite of all four of these compounds except amlodipine have been examined (e.g.,
5-2) and detected (e.g., 4-2; Table 5). Though several CCBs were studied globally,

57
regional occurrence differences were evident. In North America, the number of studies
examining diltiazem exceeded other CCBs by a magnitude of three while other
compounds were similarly studied in wastewater effluent. Diltiazem and verapamil were
equally the two most studied compounds in Europe, while nifedipine was slightly more
extensively examined in Asia-Pacific. Similar to influent sewage, only one study
examined a CCB, nifedipine, in South America. Though amlodipine was less frequently
studied among geographic regions, it had the highest occurrence concentration in effluent
(448 ng/L; Huber et al., 2016) followed by diltiazem (425 ng/L; Meador et al., 2016).
Subsequently, both of the highest CCB concentrations discharged in effluent were to
marine systems in which elevated amlodipine was reported from a Faroe Island hospital
with limited treatment before discharging to the ocean (Huber et al., 2016).
3.4 Calcium channel blockers in surface water
Similar to effluent, a total of seven CCBs and metabolites have been analyzed in
global freshwater ecosystems; all were detected in at least two studies (Table 6;
Supplementary: Table 17). Here again, the number of studies (37) and detections of
diltiazem (30) were more than twice any other compound, followed by verapamil when
compared to amlodipine and nifedipine. CCBs in freshwater were examined more often
in North America (55) followed by Europe (25) (Supplementary: Table 17). However,
CCBs sans diltiazem were studied more frequently in Europe (e.g., amlodipine,
nifedipine, verapamil) and in Asia-Pacific (e.g., amlodipine, nifedipine) than in North
America. Interestingly, in North America, more papers analyzed dehydronifedipine, the
nifedipine metabolite, than the parent compound. Whereas diltiazem received the

58
majority of attention in total across all geographic regions, verapamil was detected at the
highest concentration in freshwater (319 ng/L; Choy et al., 2016).
Though most of the global surface water occurrences of CCBs resulted from
freshwater studies, seven compounds and metabolites were also reported in coastal and
marine systems (Table 7). A total of 21 different studies analyzed CCBs, including
diltiazem (6), amlodipine (5), and verapamil (4) (Supplementary: Table 17). All seven
compounds were examined in North America followed by four substances reported from
Europe. Diltiazem was the most commonly studied compound in North American coastal
and marine systems, while amlodipine (4) was more commonly examined in Europe.
Diltiazem was detected in six studies with the highest occurrence (23.5 ng/L; Cantwell et
al., 2016) among CCBs in coastal and marine waters.
3.5 Aquatic toxicology of calcium channel blockers
Toxicity of three CCBs have been studied in non-target aquatic organisms,
including amlodipine, diltiazem, and verapamil (Supplementary: Table 18). The majority
of these studies have been conducted with verapamil followed by diltiazem and
amlodipine. A number of standardized and non-standard experimental methods and
endpoints have been employed to characterize the effects of CCBs to bacteria,
invertebrates, and fish. However, the majority of these studies evaluated standard
ecotoxicity endpoints (e.g., survival, growth, or reproduction), while others aimed to
determine biochemical and subcellular responses to CCBs. Thus, most studies reported
standard calculated toxicity threshold values (e.g., NOEC, LOEC, or EC/LC50) because
the majority of these papers examined multiple CCB concentrations; conversely, several

59
studies evaluated less than three CCB concentrations or reported inconsistent dose-
response relationships.
In the present study, sufficient data allowed for development of a species
sensitivity distribution (SSD) for verapamil, but this SSD included only acute toxicity
data (e.g., 96 h) (Supplementary: Table 17, Supplementary: Table 18). The 5th and 20th
centiles of the verapamil SSD predicted 95% and 80% of the species would be protected
from acute lethality at 0.134 mg/L and 0.895 mg/L, respectively (Supplementary: Figure:
24). Interestingly, invertebrates were more sensitive than vertebrates following acute
exposures to amlodipine, verapamil and diltiazem (Supplementary: Table 18). For
example, Brachionus calyciflorus was the most sensitive species of the reported acute
verapamil toxicity studies (Supplementary: Table 18). Verapamil was the most acutely
toxic CCB to vertebrates (Oncorhynchus mykiss 96 h LC50 = 2.72 mg/L) and
invertebrates (Streptocephalus proboscideus 24 h LC50 = 0.5 mg/L). However, such an
exercise may have limited utility because environmental concentrations of human
pharmaceuticals, as confirmed here with CCBs, are well below acutely lethal levels
(Berninger and Brooks, 2010).
Various sublethal endpoints were evaluated, ranging from standard growth and
reproduction bioassays to feeding/ingestion rate, luminescence inhibition, and
morphological changes (Supplementary: Table 18). Additionally, a number of studies
reported antioxidant enzyme activity (Li et al., 2010; Steinbach et al., 2016), and
haematological and blood biochemical (Keller, 2017; Steinbach et al., 2016), behavior
(Kania et al., 2015) and histology (Keller, 2017; Steinbach et al., 2016) responses
following acute and chronic exposures to verapamil and diltiazem. Across all endpoints

60
studied, verapamil, a first generation CCB, was observed to cause responses in aquatic
organisms at concentrations ranging from 0.3 mg/L to 1704.8 mg/L (Supplementary:
Table 18) (Lilius et al., 1994; Overturf et al., 2012). Chronic studies examining verapamil
induced effects on Pimephales promelas growth were as sensitive as acute lethality
studies (e.g., 0.6 mg/L 28 d growth LOEC; Overturf et al., 2012). Chronic exposures to
verapamil elicited the most sensitive responses by vertebrates (Pimephales promelas 28 d
growth LOEC ¼ 0.6 mg/L), while amlodipine caused the most sensitive responses by
invertebrates (Hydra vulgaris 17 d regeneration LOEC ¼ 0.01 mg/L; Supplementary:
Table 18). Unfortunately, insufficient sublethal and chronic toxicity data was available to
develop chronic SSDs for CCBs. Further, CCB studies robustly examining sublethal
responses linked mechanistically to therapeutic modes and mechanisms of action
(Berninger and Brooks, 2010) within an adverse outcome framework (Ankley et al.,
2010), which has been recommended for ecotoxicology studies of pharmaceuticals
(Brausch et al., 2012), are lacking.
3.6 Probabilistic environmental hazard assessments
Sufficient CCB occurrence data for several environmental matrices among
multiple geographic regions allowed for PEHAs to be conducted. EEDs were created for
diltiazem and verapamil occurrences in influent sewage (Figure 4A and B) and
amlodipine, diltiazem, and verapamil in effluent (Figure 4C-E). Diltiazem (109) and
verapamil (22) had the highest number of occurrences followed by amlodipine (15).
When comparing each CCB distribution across all geographic regions, the 20th centile
value for diltiazem (22.43 ng/L) was approximately four times higher than either

61
amlodipine (6.10 ng/L) or verapamil (4.73 ng/L). Based on the available reported MECs,
amlodipine, diltiazem, and verapamil were subsequently examined among various
geographic regions. Herein, the 20th centile (29.95 ng/L) of amlodipine from Europe was
three times higher than the 20th percentile (5.26 ng/L) for Asia-Pacific (Table 8).
Similarly, ~5 x and ~18 x differences were observed for diltiazem and verapamil 20th
values in North America compared to Europe, respectively. Subsequently, there was a
greater likelihood of observing diltiazem compared to amlodipine or verapamil across all
geographic regions examined (Table 8). Interestingly, sufficient data were reported for
three CCB metabolites including desmethyldiltiazem (19), norverapamil (7), and
dehydronifedipine (6) in WWTP effluent, but these detections were only published from
North America (Table 8).
Environmental exposure distributions were created for CCBs in surface waters
separately for freshwater and saltwater PEHAs (Table 8). Diltiazem had the greatest
number of detections in freshwater (85) followed by verapamil (17) across all geographic
regions; however, these two distributions in freshwater were very similar (20th centile
values of 4.54 ng/L and 4.08 ng/L, respectively). 20th centile values were slightly higher
in Europe (6.46 ng/L) compared to North America (4.17 ng/L). Sufficient verapamil
occurrences were only available to create an additional distribution for North America; its
20th centile value was slightly higher than that from across all geographic regions. Here
again, occurrence of desmethyldiltiazem (51) was only reported in North American
freshwaters (Table 8). In saltwater systems, diltiazem (53) had the greatest number of
detections followed by verapamil (10) and nifedipine (6). The 20th centile value from
each CCB saltwater distribution was the lowest predicted concentration of all the

62
environmental matrices. Across all geographic regions, the 20th value for nifedipine (2.75
ng/L) was approximately 6 x and 9 x higher than diltiazem (0.48 ng/L) and verapamil
(0.31 ng/L), respectively. Only one diltiazem detection each was reported in Europe and
Asia-Pacific (Table 8).
To consider the aquatic hazards of sublethal CCB exposure to fish, PEHAs were
performed to identify the probability of exceeding THVs, because mechanistic sublethal
studies associated with evolutionarily conserved pharmacological targets and molecular
initiation events are lacking for CCBs (Supplementary: Table 18). As noted above, THVs
are predicted pharmaceutical water concentrations expected to bioaccumulate in fish
plasma at a human therapeutic level (Brooks, 2014). THVs appear to present a useful
diagnostic approach to identify pharmaceuticals for future research (Caldwell et al., 2014;
Brooks, 2014), to examine water quality hazards of effluents from different technologies
(Du et al., 2014), to monitor spatiotemporal surface water quality changes (Scott et al.,
2016), and to perform global chemical scanning of environmental matrices among
geographic regions (Kristofco and Brooks, 2017). Future studies are needed to examine
the usefulness of this THV approach for other classes of pharmaceuticals and aquatic
organisms. PEHAs using THV values for CCBs were thus initially performed across all
geographic regions in all environmental water matrices (e.g., influent, effluent,
freshwater, and saltwater; Table 9). While approximately 85% of all medicines are
ionizable and the pH specific influence on bioaccumulation and toxicity of ionizable
pharmaceuticals have been demonstrated (Valenti et al., 2009; Berninger et al., 2011;
Nichols et al., 2015), we could not account for site specific pH conditions based on
inconsistent information provided in the literature; thus, log KOW were used for fish

63
plasma modeling. Recent studies have demonstrated that measured pharmaceutical
uptake was better predicted by using log KOW than log D (Patel et al., 2016; Nichols et
al., 2015). However, multiple factors have been demonstrated to influence comparative
pharmacokinetics (e.g., metabolic enzymes; Connors et al., 2013) and pharmacodynamics
in fish, which presents uncertainty during environmental assessments of pharmaceuticals
(Brooks, 2014; Facciolo et al., 2012; Huerta et al., 2016; Margiotta-Casaluci et al., 2014).
Thus, an assessment factor of 1000 has been suggested by Huggett et al. (2003) to
account for such uncertainties within and among species. Though we did not employ this
recommended assessment factor in the current study, doing so would have appreciably
increased the percent exceedance of CCB THVs in effluent discharges and surface
waters. Future research is clearly necessary to understand ionizable chemical
bioaccumulation and associated hazards to non-target aquatic organisms.
In the present study, THVs were calculated based on both minimum (Cmin) and
maximum (Cmax) human therapeutic concentrations; these values ranged from 3 to 30
ng/mL and 15-250 ng/mL, respectively, for four CCBs (Table 9). Based on sufficient
MEC data availability, predicted percent exceedances were estimated in all four water
matrices for diltiazem and verapamil, but only for amlodipine and nifedipine in effluent
and saltwater, respectively. CCB THVs (Cmin, Cmax) with the greatest likelihood of
exceedance in influent was verapamil (14.4, 1.3) followed by amlodipine in effluent
(28.1, 6.5) and verapamil in freshwater (27.5, 9.2). However, almost no exceedances
were observed in saltwater for diltiazem, nifedipine and verapamil. Of the four CCBs
examined, a THV (based on Cmin) for amlodipine had the highest predicted percent
exceedance in effluent of all the water matrices assessed. Though effluent was the only

64
matrix with sufficient data availability for amlodipine, detections were reported in
freshwater ranging from 0.26 to 25 ng/L (de Solla et al., 2016; Huerta-Fontela et al.,
2011; Varga et al., 2012). Future research should examine the aquatic hazards of this
second generation CCB to non-target species based on such PEHA observations, which
are influenced by its relatively high log KOW, low Cmin and Cmax values, and the lowest
THV of the four CCBs examined (Table 9).
Percent exceedances of diltiazem and verapamil THVs were observed; however, a
relatively larger number of reported occurrences of diltiazem was available within all
four water matrices. Though diltiazem THV exceedance was only minimally predicted in
influent (1.9, 0.2), effluent (0.3, ~0), and freshwater and marine systems, its detection in
fish plasma near or exceeding the Cmin and Cmax has been reported (Fick et al., 2010a;
Scott et al., 2016; Tanoue et al, 2015; Lazarus et al., 2015; Du et al., 2014). Specifically,
diltiazem and verapamil represent the only CCBs that have been examined in plasma
from multiple fish species in effluents and surface waters (Table 10). Only one study was
found examining the occurrence of verapamil and diltiazem in fish plasma from
wastewater effluent in Europe (verapamil 0.7 ng/mL; diltiazem 0.9 ng/mL (Fick et al.,
2010b)). Though the occurrence of diltiazem in fish plasma sampled from both
freshwater and marine systems were predominantly reported from North America, the
exceedance probability of a human Cmin (30 ng/mL) in fish plasma from all available
surface water data was 18% (Figure 6); however, such observations were strongly
influenced by data from saltwater studies (Table 10; Figure 6). Thus, future research is
warranted to understand the comparative pharmacokinetics and dynamics of diltiazem
and other CCBs in aquatic organisms, particularly in coastal and marine systems.

65
Similar research appears necessary for verapamil. In the present study, predicted
verapamil THV percent exceedances in influent, effluent, and freshwater were between
14.4-27.5% and 1.2-9.2% for Cmin and Cmax, respectively, compared to a nearly zero
percent exceedance likelihood in saltwater (Table 9). The highest percent exceedance for
verapamil was predicted in freshwater systems (Cmin = 27.5%, Cmax = 9.2%). However,
only Fick et al. (2010b) has studied the occurrence of verapamil in fish plasma following
exposure to WWTP effluent. In this previous effort, detections ranged from below the
limit of quantification to 0.7 ng/mL (Fick et al., 2010b). Previous laboratory studies have
examined bioconcentration of verapamil in freshwater fish species, in which measures in
plasma and relevant pharmacological tissues were reported (Nallani et al., 2016;
Steinbach et al., 2013). Here again, CCB THV exceedances of verapamil were only
identified in the present study when occurrence data was sufficiently available. Future
studies are necessary to address the aforementioned data gaps to enhance CCB and other
pharmaceutical bioaccumulation hazards, especially in rapidly developing regions of
developing countries where access to medicines are occurring faster than sustainable
water resource management systems, including WWTP treatment infrastructure and
resource recovery, are being implemented.

66
Tabl
e 8:
Equ
atio
ns fo
r reg
ress
ion
lines
and
con
cent
ratio
n va
lues
cor
resp
ondi
ng to
var
ious
cen
tiles
for v
ario
us e
nviro
nmen
tal e
xpos
ure
dist
ribut
ions
of m
axim
um
repo
rted
calc
ium
cha
nnel
blo
cker
(CC
B) c
once
ntra
tions
(ng/
L) in
influ
ent,
efflu
ent,
fres
hwat
er, a
nd s
altw
ater
. For
eac
h di
stri
butio
n, ‘n
’ rep
rese
nts
the
num
ber o
f C
CB
s re
porte
d an
d us
ed i
n th
at s
peci
fic w
ater
mat
rix.
Bas
ed o
n da
ta a
vaila
bilit
y, g
eogr
aphi
c re
gion
s an
d in
divi
dual
CC
Bs
wer
e ca
tego
rized
and
equ
atio
n de
scrip
tors
are
pro
vide
d.
C
entil
e va
lue
(ng/
L)
Mat
rix
Com
poun
d G
eogr
aphi
c re
gion
n
r2 Sl
ope
Inte
rcep
t 1%
5%
10
%
20%
50
%
95%
99
%
Influ
ent
All
Com
poun
ds
All
regi
ons
33
0.97
1.
26
-1.8
6 0.
43
1.49
2.
88
6.43
29
.85
309.
07
2077
.86
D
iltia
zem
A
ll re
gion
s 20
0.
96
1.27
-2
.00
0.56
1.
92
3.71
8.
22
37.7
1 74
0.63
25
43.2
0
Asi
a-Pa
cific
6
0.90
1.
10
-1.0
0 0.
06
0.26
0.
55
1.39
8.
05
250.
52
1041
.01
Euro
pe
8 0.
93
1.94
-3
.16
2.69
6.
06
9.33
15
.75
42.8
8 30
3.60
68
3.09
Nor
th
Am
eric
a 6
0.88
2.
72
-6.2
5 27
.54
48.9
9 66
.59
96.5
7 19
6.65
78
9.42
14
04.1
1
V
erap
amil
All
regi
ons
10
0.97
1.
05
-1.2
2 0.
09
0.40
0.
88
2.32
14
.75
547.
89
2450
.08
Efflu
ent
All
com
poun
ds
All
regi
ons
159
0.93
1.
67
-2.8
2 1.
97
5.01
8.
23
15.0
1 47
.41
448.
73
1138
.72
A
mlo
dipi
ne
All
regi
ons
15
0.92
1.
33
-1.8
9 0.
47
1.52
2.
85
6.10
26
.19
451.
53
1468
.86
Asi
a-Pa
cific
5
0.96
18
.44
-14.
13
4.37
4.
76
4.98
5.
26
5.84
7.
17
7.81
Euro
pe
7 0.
91
1.67
-3
.28
3.74
9.
57
15.7
9 28
.95
92.3
2 89
0.40
22
77.1
6
D
iltia
zem
A
ll re
gion
s 10
9 0.
92
1.95
-3
.48
3.90
8.
71
13.3
6 22
.43
60.4
5 41
9.58
93
6.34
Euro
pe
20
0.97
1.
85
-2.5
8 1.
37
3.20
5.
03
8.70
24
.84
192.
93
451.
09
Nor
th
Am
eric
a 85
0.
99
3.09
-5
.98
15.2
4 25
.33
33.2
1 46
.09
86.2
9 29
4.02
48
8.61
D
esm
ethy
ldilt
iaze
m
All
regi
ons
19
0.89
2.
82
-4.3
9 5.
39
9.40
12
.64
18.0
9 35
.95
137.
54
239.
81
Nor
th
Am
eric
a 19
0.
89
2.82
-4
.39
5.39
9.
40
12.6
4 18
.09
35.9
5 13
7.54
23
9.81
N
orve
rapa
mil
All
regi
ons
7

67
Nor
th
Am
eric
a 7
V
erap
amil
All
regi
ons
22
0.84
1.
19
-1.6
4 0.
27
1.00
2.
02
4.73
24
.14
584.
45
2188
.44
Euro
pe
6 0.
91
0.83
-0
.97
0.02
0.
15
0.42
1.
41
14.7
0 14
30.1
7 95
29.4
7
Nor
th
Am
eric
a 14
0.
96
2.83
-4
.84
7.73
13
.46
18.0
9 25
.87
51.3
2 19
5.76
34
0.90
D
ehyd
roni
fedi
pine
A
ll re
gion
s 6
0.98
1.
00
-0.5
4 0.
02
0.08
0.
18
0.48
3.
33
145.
44
695.
26
Nor
th
Am
eric
a 6
0.98
1.
00
-0.5
4 0.
02
0.08
0.
18
0.48
3.
33
145.
44
695.
26
Fres
hwat
er
All
com
poun
ds
All
regi
ons
114
0.97
1.
51
-1.8
3 0.
47
1.34
2.
33
4.55
16
.44
202.
29
572.
29
D
iltia
zem
A
ll re
gion
s 85
0.
96
1.62
-1
.91
0.55
1.
45
2.43
4.
54
14.9
7 15
4.36
40
5.91
Euro
pe
11
0.95
2.
17
-2.6
0 1.
34
2.75
4.
05
6.46
15
.80
90.6
0 18
6.80
Nor
th
Am
eric
a 73
0.
95
1.53
-1
.79
0.45
1.
24
2.15
4.
17
14.8
2 17
6.62
49
3.12
D
esm
ethy
ldilt
iaze
m
All
regi
ons
51
0.75
2.
07
-1.0
5 0.
24
0.51
0.
77
1.26
3.
22
20.1
1 42
.98
Nor
th
Am
eric
a 51
0.
75
2.07
-1
.05
0.24
0.
51
0.77
1.
26
3.22
20
.11
42.9
8
V
erap
amil
All
regi
ons
17
0.91
0.
99
-1.4
5 0.
13
0.64
1.
47
4.08
28
.68
1293
.38
6267
.35
Nor
th
Am
eric
a 14
0.
78
0.94
-1
.54
0.15
0.
78
1.89
5.
57
44.0
0 24
97.5
2 13
312.
24
Saltw
ater
A
ll co
mpo
unds
A
ll re
gion
s 69
0.
99
1.75
-0
.30
0.07
0.
17
0.27
0.
49
1.48
12
.93
31.7
6
D
iltia
zem
A
ll re
gion
s 53
0.
98
1.63
-0
.31
0.06
0.
15
0.26
0.
48
1.55
15
.78
41.2
1
Nor
th
Am
eric
a 51
0.
97
1.61
-0
.29
0.05
0.
14
0.24
0.
45
1.52
16
.09
42.7
7
N
ifedi
pine
A
ll re
gion
s 6
0.78
8.
31
-4.4
9 1.
82
2.20
2.
43
2.75
3.
47
5.47
6.
61
Nor
th
Am
eric
a 6
0.78
8.
31
-4.4
9 1.
82
2.20
2.
43
2.75
3.
47
5.47
6.
61
V
erap
amil
All
regi
ons
10
0.95
2.
31
0.32
0.
07
0.14
0.
20
0.31
0.
72
3.74
7.
38

68
Nor
th
Am
eric
a 10
0.
95
2.31
0.
32
0.07
0.
14
0.20
0.
31
0.72
3.
74
7.38
Ta
ble
9: E
xcee
danc
e pe
rcen
tage
s of
ther
apeu
tic h
azar
d va
lues
(TH
V)
by m
easu
red
conc
entra
tions
of
four
cal
cium
cha
nnel
blo
cker
s in
diff
eren
t env
ironm
enta
l m
atric
es. P
redi
cted
per
cent
exc
eeda
nces
of t
he T
HV
s w
ere
calc
ulat
ed u
sing
bot
h th
e m
inim
um a
nd m
axim
um h
uman
ther
apeu
tic le
vel (
Cm
in, C
max
). (-
) ind
icat
es
an e
nviro
nmen
tal e
xpos
ure
dist
ribut
ion
cont
aine
d <
5 da
ta v
alue
s and
ther
efor
e th
e TH
V p
erce
nt e
xcee
danc
e w
as n
ot b
e ca
lcul
ated
.
Pred
icte
d pe
rcen
t exc
eeda
nce
of T
HV
acr
oss a
ll
regi
ons (
%)
Com
poun
d L
og K
OW
P B
:W
Cm
in
(ng/
mL
) C
max
(n
g/m
L)
TH
V
(ng/
L)
Influ
ent
Eff
luen
t Fr
eshw
ater
Sa
ltwat
er
Am
lodi
pine
3.
30
41.9
3.
0 15
.0
71.6
-
28.1
, 6.5
-
-
Dilt
iaze
m
2.80
18
.5
30.0
13
0.0
1617
.6
1.9,
0.2
0.
3, ~
0 ~0
/~0
~0/~
0
Nife
dipi
ne
3.27
39
.9
25.0
15
0.0
627.
3 -
- -
~0/~
0
Ver
apam
il 3.
97
127.
4 20
.0
250.
0 15
7.0
14.4
, ,1.
3 16
.7, 1
.2
27.5
, 9.2
~0
/~0

69
Tabl
e 10
: Eq
uatio
ns f
or r
egre
ssio
n lin
es a
nd c
once
ntra
tion
valu
es c
orre
spon
ding
to
vario
us c
entil
es f
or i
nter
nal
dilti
azem
fis
h pl
asm
a le
vels
(ng
/L)
from
all
avai
labl
e su
rfac
e w
ater
dat
a, o
r fr
om f
resh
wat
er o
r sa
ltwat
er s
yste
ms.
For
each
dis
tribu
tion,
‘n’
rep
rese
nts
the
num
ber
of r
epor
ted
fish
plas
ma
conc
entra
tions
. B
ased
on
data
ava
ilabi
lity,
geo
grap
hic
regi
ons
and
indi
vidu
al C
CB
s w
ere
cate
goriz
ed a
nd e
quat
ion
desc
ripto
rs a
re r
epor
ted.
Exc
eeda
nce
prob
abili
ties
of
min
imum
hum
an th
erap
eutic
dos
e (C
min
) in
fish
plas
ma
are
incl
uded
.
Cen
tile
valu
e (n
g/m
l)
Mat
rix
Com
poun
d G
eogr
aphi
c re
gion
n
r2 Sl
ope
Inte
rcep
t
Cm
in
Exc
eeda
nce
(%)
5%
10%
20
%
50%
80
%
90%
95
%
Plas
ma-
Su
rfac
e W
ater
D
iltia
zem
A
ll re
gion
s 51
0.
82
0.59
0.
06
17.9
0.00
1 0.
005
0.02
9 0.
803
21.9
7 12
3.8
516.
5 Pl
asm
a-
Fres
hwat
er
Dilt
iaze
m
All
regi
ons
23
0.86
2.
59
4.32
~0
0.00
5 0.
007
0.01
0 0.
021
0.04
5 0.
067
0.09
Pl
asm
a-
Saltw
ater
D
iltia
zem
A
ll re
gion
s 28
0.
90
2.23
-2
.61
24.6
2.70
5 3.
935
6.19
4 14
.76
35.1
6 55
.35
80.5
1

70
.
Figure 6: Probabilistic hazard assessment of mean measured fish plasma diltiazem concentrations from several freshwater and saltwater species across all geographic regions. Numbers within parenthesis indicate the number of detected diltiazem concentrations across all geographic regions within each water matrix. The vertical small dashed line (red) represents the diltiazem minimum human therapeutic plasma level (Cmin = 30 ng/mL). 3.7 Probabilistic hazard assessments of CCB mixtures
Though seventy-nine studies have examined the occurrence of CCBs in global
water matrices, only six studies examined the same CCBs within a common matrix.
Diltiazem and verapamil were specifically examined 39 and 24 times in studies analyzing
their occurrence in effluent in which the number of detections were 27 and 20,
respectively. Geographically, the majority of studies examining and detecting both
diltiazem and verapamil of effluent were from North America (3) followed by Europe (2)

71
and Asia (1). Across all percentiles, diltiazem effluent hazard concentrations were almost
3 times higher than verapamil (Table 11). However, the calculated THV for verapamil
(157 ng/L) was approximately 10 times lower than diltiazem (1618 ng/L) and thus
contributed a greater percentage to the additive THR (Table 11; Figure 7). At the 80th
percentile of diltiazem and verapamil distributions, the additive THR exceeded 1.0
corresponding to 321.2 and 127.1 ng/L, respectively. At these two concentrations,
diltiazem and verapamil contributed 19.9 and 81.0%, respectively, to the THR of 1.0,
corresponding to 425 and 190 ng/L, respectively. Conversely, at the 20th centile of
diltiazem and verapamil distributions, the additive THRs were 0.06 or 6%, respectively
(Table 11). CA predictions have been reported for pharmaceutical mixtures with
compounds of the same mechanism of action (Backhaus, 2014; Christensen et al., 2007;
Cleuvers, 2004, 2005; Fent et al., 2006). These studies used standard model organisms
and endpoints with crustaceans, algae, and in vitro assays to support CA modeling, while
few studies have characterized the alternative sub-lethal effects (e.g., therapeutic) of these
pharmaceutical mixtures. Clearly future research should assess pharmacological sub-
lethal endpoints corresponding to therapeutic and side effect mechanisms and modes of
action (Boxall et al., 2012; Rudd et al., 2014).

72
Tabl
e 11
: Dilt
iaze
m a
nd v
erap
amil
5th, 2
0th, 5
0th, 8
0th, a
nd 9
5th p
erce
ntile
s w
ith c
orre
spon
ding
con
cent
ratio
ns (n
g/L)
are
pre
sent
ed fr
om e
nviro
nmen
tal e
xpos
ure
dist
ribut
ions
. The
rape
utic
haz
ard
ratio
s (T
HR
) of p
redi
cted
cal
cium
cha
nnel
blo
cker
con
cent
ratio
ns to
com
poun
d sp
ecifi
c th
erap
eutic
haz
ard
valu
es (T
HV
) wer
e ca
lcul
ated
. A T
HR
val
ue >
1.0
indi
cate
s an
exce
edan
ce o
f an
addi
tive
THR
. Dilt
iaze
m T
HV
(ng/
L) =
161
8; V
erap
amil
THV
(ng/
L) =
157
.
Pred
icte
d ca
lciu
m c
hann
el b
lock
er
conc
entr
atio
n (n
g/L
) Pr
edic
ted
calc
ium
cha
nnel
blo
cker
co
ncen
trat
ion:
TH
V r
atio
Perc
entil
e D
iltia
zem
V
erap
amil
Dilt
iaze
m
Ver
apam
il A
dditi
ve T
HR
s (%
) 5th
4.
7 1.
7 0.
003
0.01
1 0.
014
20th
18.5
6.
9 0.
011
0.04
4 0.
055
50th
77.1
29
.7
0.04
8 0.
189
0.23
7 80
th
321.
2 12
7.1
0.19
9 0.
810
1.00
9 95
th
1254
.5
510.
2 0.
776
3.24
9 4.
025

73
Figure 7: Probabilistic hazard assessment of maximum measured environmental concentrations for diltiazem and verapamil in effluent reported from the same study across all geographic regions. Numbers within parenthesis indicate the number of each detected CCB across all geographic regions. Vertical dotted lines (black) represents the therapeutic hazard value (THV) for verapamil (157 ng/L) and the vertical short dashed line (black) represents the THV for diltiazem (1618 ng/L). Horizontal short-short-long dashed lines (gray) represent percentile value when an additive therapeutic hazard ratio (THR) equaled 1.
4. Conclusions
Here we examined refereed literature on the occurrence and ecotoxicology of
CCBs in wastewater and surface water matrices. One hundred and sixty one primary
literature articles reported the examination, occurrence, and effects of four CCBs in
effluent, sediment, sludge, and aquatic systems. Approximately half of the matrices
studied for the occurrence of CCBs were for water from North America, Europe, and
Asia-Pacific. Environmental occurrence of these compounds were scarce and nonexistent
in South America and Africa, respectively. In addition, studies examining CCBs in
influent and coastal and marine systems were relatively limited. Whereas occurrence of
diltiazem and verapamil have been routinely examined in water matrices, studies of other

74
first and second generation CCBs (e.g., nifedipine, amlodipine) are lacking.
Concentrations of CCBs in non-target organism were minimally examined, except for
diltiazem (e.g., tissue and plasma), which has been reported to accumulate in fish plasma
above human therapeutic plasma levels. Thus, further studies are necessary to understand
comparative bioaccumulation and toxicity of CCBs in nontarget aquatic organisms.
Unfortunately, very few studies have examined the pharmacological
cardiovascular effects of CCBs in non-target aquatic organisms, but recent efforts have
investigated tissue specific oxidative, metabolic, antioxidant, or histological induce
effects in several teleosts. Calcium and calcium channels play a role in multiple
biological processes within all organisms (Reuter, 1983). As medications for treatment of
high blood pressure and cardiac arrhythmias CCBs have been specifically designed to
target smooth muscle tissue calcium channels and elicit therapeutic benefits in humans
(Goodman, 1996). However, a common drug target for CCBs (e.g., diltiazem) is
predicted to be 70-76% conserved in teleost species (Gunnarsson et al., 2008). Such
functional conservation of drug targets in non-target organisms remains an understudied
topic, yet the application of mammalian to fish biological read across (Brooks et al.,
2009) has been demonstrated with select pharmaceuticals (Brodin et al., 2013; Huerta et
al., 2016; Huggett et al., 2003; Margiotta-Casaluci et al., 2014, 2016; Rand-Weaver et al.,
2013; Valenti et al., 2012). It is important to note, however, that each CCB has multiple
targets, varying with known and relatively unstudied pharmacological actions (Wishart et
al., 2006). Therefore, while CCBs are specifically designed to elicit cardiac therapeutic
effects in humans, these diverse molecular initiation events require future comparative

75
ecotoxicological study, particularly focusing on linkages (or lack thereof) to ecologically
important adverse outcomes.
When data availability was sufficient, assessments estimating aquatic hazards of
CCBs were performed. EED 5th and 95th percentiles for all CCBs were 1.5 and 309.1
ng/L in influent, 5.0 and 448.7 ng/L for effluent, 1.3 and 202.3 ng/L in freshwater, and
0.17 and 12.9 ng/L in saltwater, respectively. Because sublethal chronic toxicity
information for CCBs were limited, we employed THVs during PEHAs. We observed
both amlodipine in effluents and verapamil in freshwaters to exceed THVs without a
safety factor 28% of the time, highlighting the need to understand ecological
consequences of exposure to these CCBs. We then employed an additive THR approach
to examine CCB mixtures. Based on currently available data, an additive THR exceeded
1 approximately 20% of the time, which suggests these CCBs and other pharmaceutical
mixtures with common molecular initiation events deserve future investigation.
Ecological implications of such occurrence and toxicity gaps for CCBs are unknown but
deserve further study, particularly in rapidly urbanizing regions that are vulnerable to
climate change. This global scanning approach identified the utility of global assessments
to identify specific CCBs, mixtures with common mechanisms of action, and geographic
locations for which environmental monitoring and assessment efforts appear warranted.
Acknowledgement
This research was supported by a U.S. Environmental Protection Agency STAR
Fellowship (FP-91767201-0) and the C. Gus Glasscock Jr. Endowed Fund for Excellence
in Environmental Sciences to GNS. Additional support was provided by the Department

76
of Environmental Science and Center for Reservoir and Aquatic Systems Research at
Baylor University.
References Ankley, G.T., Brooks, B.W., Huggett, D.B., Sumpter, J.P., 2007. Repeating history:
pharmaceuticals in the environment. Environ. Sci. Technol. 41, 8211e8217. Ankley, G.T., Bennett, R.S., Erickson, R.J., Hoff, D.J., Hornug, M.W., Johnson, R.D.,
Mount, D.R., Nichols, J.W., Russom, C.L., Schmieder, P.K., Serrano, J.A., Tietge, J.E., Villeneuve, D.L., 2010. Adverse outcome pathways: a conceptual framework to support ecotoxicology research and risk assessment. Environ. Toxicol. Chem. 29, 730e741.
Arnold, K.E., Brown, A.R., Ankley, G.T., Sumpter, J.P., 2014. Medicating the environment: assessing risks of pharmaceuticals to wildlife and ecosystems. Philos. Trans. R. Soc. B Biol. Sci. 369, 20130569.
Ashbolt, N.J., Amezquita, A., Backhaus, T., Borriello, P., Brandt, K.K., Collignon, P., Coors, A., Finley, R., Gaze,W.H., Heberer, T., 2013. Human health risk assessment (HHRA) for environmental development and transfer of antibiotic resistance. Environ. Health Perspect. 121, 993.
Backhaus, T., 2014. Medicines, shaken and stirred: a critical review on the ecotoxicology of pharmaceutical mixtures. Philos. Trans. R. Soc. B Biol. Sci. 369, 20130585.
Berninger, J.P., Brooks, B.W., 2010. Leveraging mammalian pharmaceutical toxicology and pharmacology data to predict chronic fish responses to pharmaceuticals. Toxicol. Lett. 193, 69-78.
Berninger, J.P., LaLone, C.A., Villeneuve, D.L., Ankley, G.T., 2016. Prioritization of pharmaceuticals for potential environmental hazard through leveraging a large-scale mammalian pharmacological dataset. Environ. Toxicol. Chem. 35, 1007-1020.
Berninger, J.P., Du, B., Connors, K.A., Eytcheson, S.A., Kolkmeier, M.A., Prosser, K.N., Valenti Jr., T.W., Chambliss, C.K., Brooks, B.W., 2011. Effects of the antihistamine diphenhydramine on selected aquatic organisms. Environ. Toxicol. Chem. 30, 2065-2072.
Boxall, A.B.A., Rudd, M.A., Brooks, B.W., Caldwell, D.J., Choi, K., Hickmann, S., Innes, E., Ostapyk, K., Staveley, J.P., Verslycke, T., Ankley, G.T., Beazley, K.F., Belanger, S.E., Berninger, J.P., Carriquiriborde, P., Coors, A., DeLeo, P.C., Dyer, S.D., Ericson, J.F., Gagna, F., Giesy, J.P., Gouin, T., Hallstrom, L., Karlsson, M.V., Joakim Larsson, D.G., Lazorchak, J.M., Mastrocco, F., McLaughlin, A., McMaster, M.E., Meyerhoff, R.D., Moore, R., Parrott, J.L., Snape, J.R., Murray-Smith, R., Servos, M.R., Sibley, P.K., Straub, J.O., Szabo, N.D., Topp, E., Tetreault, G.R., Trudeau, V.L., Van Der Kraak, G., 2012. Pharmaceuticals and personal care products in the environment: what are the big questions? Environ. Health Perspect. 120, 1221-1229.

77
Brausch, J.M., Connors, K.A., Brooks, B.W., Rand, G.M., 2012. Human pharmaceuticals in the aquatic environment: a critical review of recent toxicological studies and considerations for toxicity testing. Rev. Environ. Contam. Toxicol. 218, 1-99.
Brodin, T., Fick, J., Jonsson, M., Klaminder, J., 2013. Dilute concentrations of a psychiatric drug alter behavior of fish from natural populations. Science 339, 814-815.
Brooks, B.W., 2014. Fish on Prozac (and Zoloft): ten years later. Aquat. Toxicol. 151, 61-67.
Brooks, B.W., Huggett, D.B., Boxall, A.B.A., 2009. Pharmaceuticals and personal care products: Research needs for the next decade. Environ. Toxicol. Chem. 28,
2469-2472. Brooks, B.W., Riley, T.M., Taylor, R.D., 2006. Water quality of effluent-dominated
ecosystems: ecotoxicological, hydrological, and management considerations. Hydrobiologia 556, 365-379.
Caldwell, D.J., Mastrocco, F., Margiotta-Castaluci, L., Brooks, B.W., 2014. An integrated approach for prioritizing pharmaceuticals found in the environment for risk assessment, monitoring and advanced research. Chemosphere 115, 4-12.
Cantwell, M.G., Katz, D.R., Sullivan, J.C., Ho, K., Burgess, R.M., Cashman, M., 2016. Selected pharmaceuticals entering an estuary: concentrations, temporal trends, partitioning, and fluxes. Environ. Toxicol. Chem. 35, 2665-2673.
Choy, S.J., Annis, M.L., Banda, J.A., Bowman, S.R., Brigham, M.E., Elliott, S.M., Gefell, D.J., Jankowski, M.D., Jorgenson, Z.G., Lee, K.E., Moore, J.N., Tucker, W.A., 2016. Contaminants of Emerging Concern in the Great Lakes Basin: a Report on Sediment, Water, and Fish Tissue Chemistry Collected in 2010-2012. U.S. Geological Survey BTP-R3017e2013. U.S. Fish and Wildlife Service.
Christensen, A.M., Faaborg-Andersen, S., Flemming, I., Baun, A., 2007. Mixture and single-substance toxicity of selective serotonin reuptake inhibitors toward algae and crustaceans. Environ. Toxicol. Chem. 26, 85-91.
Cleuvers, M., 2004. Mixture toxicity of the anti-inflammatory drugs diclofenac, ibuprofen, naproxen, and acetylsalicylic acid. Ecotoxicol. Environ. Saf. 59, 309-315.
Cleuvers, M., 2005. Initial risk assessment for three b-blockers found in the aquatic environment. Chemosphere 59, 199-205.
Connors, K.A., Du, B., Fitzsimmons, P.N., Hoffman, A.D., Chambliss, C.K., Nichols, J.W.,
Brooks, B.W., 2013. Comparative pharmaceutical metabolism by rainbow trout (Oncorhynchus mykiss) liver S9 fractions. Environ. Toxicol. Chem. 32, 1810e1818.
Corrales, J., Kristofco, L.A., Steele, W.B., Yates, B.S., Breed, C.S., Williams, E.S., Brooks, B.W., 2015. Global assessment of bisphenol a in the environment review and analysis of its occurrence and bioaccumulation. Dose-Response 13, 1559325815598308.
Daughton, C.G., 2016. Pharmaceuticals and the Environment (PiE): evolution and impact of the published literature revealed by bibliometric analysis. Sci. Total Environ. 562, 391-426.
de Solla, S.R., Gilroy, E.A.M., Klinck, J.S., King, L.E., McInnis, R., Struger, J., Backus, S.M., Gillis, P.L., 2016. Bioaccumulation of pharmaceuticals and personal

78
care products in the unionid mussel Lasmigona costata in a river receiving wastewater effluent. Chemosphere 146, 486-496.
Du, B., Price, A.E., Scott, W.C., Kristofco, L.A., Ramirez, A.J., Chambliss, C.K., Yelderman, J.C., Brooks, B.W., 2014. Comparison of contaminants of emerging concern removal, discharge, and water quality hazards among centralized and on-site wastewater treatment system effluents receiving common wastewater influent. Sci. Total Environ. 466, 976-984.
Facciolo, R.M., Crudo, M., Zizza, M., Giusi, G., Canonaco, M., 2012. a GABAA subunitorexin receptor interactions activate learning/motivational pathways in the goldfish. Behav. Brain Res. 234, 349-356.
Faust, M., Altenburger, R., Backhaus, T., Blanck, H., Boedeker, W., Gramatica, P., Hamer, V., Scholze, M., Vighi, M., Grimme, L.H., 2001. Predicting the joint algal toxicity of multi-component s-triazine mixtures at low-effect concentrations of individual toxicants. Aquat. Toxicol. 56, 13-32.
Fent, K., Escher, C., Caminada, D., 2006. Estrogenic activity of pharmaceuticals and pharmaceutical mixtures in a yeast reporter gene system. Reprod. Toxicol. 22, 175-185.
Fick, J., Lindberg, R.H., Tysklind, M., Larsson, D.G.J., 2010a. Predicted critical environmental concentrations for 500 pharmaceuticals. Regul. Toxicol. Pharmacol. 58, 516-523.
Fick, J., Lindberg, R.H., Parkkonen, J., Arvidsson, B. r., Tysklind, M., Larsson, D.J., 2010b. Therapeutic levels of levonorgestrel detected in blood plasma of fish: results from screening rainbow trout exposed to treated sewage effluents. Environ. Sci. Technol. 44, 2661-2666.
Fitzsimmons, P.N., Fernandez, J.D., Hoffman, A.D., Butterworth, B.C., Nichols, J.W., 2001. Branchial elimination of superhydrophobic organic compounds by rainbow trout Oncorhynchus mykiss. Aquat. Toxicol. 55, 23e34.
Gaw, S., Brooks, B.W., 2016. Changing tides: adaptive monitoring, assessment, and management of pharmaceutical hazards in the environment through time. Environ. Toxicol. Chem. 35, 1037-1042.
Goodman, L.S., 1996. Goodman and Gilman's the Pharmacological Basis of Therapeutics, vol. 1549. McGraw-Hill, New York.
Gunnarsson, L., Jauhiainen, A., Kristiansson, E., Nerman, O., Larsson, D.G.J., 2008. Evolutionary conservation of human drug targets in organisms used for environmental risk assessments. Environ. Sci. Technol. 42, 5807e5813.
Halling-Soensen, B., Nors Nielsen, S., Lanzky, P.F., Ingerslev, F., Lutzhoft, H.C.H., Jorgensen, S.E., 1998. Occurrence, fate and effects of pharmaceutical substances in the environment-a review. Chemosphere 36, 357-393.
Hooper, M.J., 2013. Interactions between chemical and climate stressors: a role for mechanistic toxicology in assessing climate change risks. Environ. Toxicol. Chem. 32, 32-48.
Huber, S., Remberger, M., Kaj, L., Schlabach, M., Jorundsdottir, H.O., Vester, J., Arnorsson, M., Mortensen, I., Schwartson, R., Dam, M., 2016. A first screening and risk assessment of pharmaceuticals and additives in personal care products in waste water, sludge, recipient water and sediment from Faroe Islands, Iceland and Greenland. Sci. Total Environ. 562, 13-25.

79
Huerta-Fontela, M., Galceran, M.T., Ventura, F., 2011. Occurrence and removal of pharmaceuticals and hormones through drinking water treatment. Water Res. 45, 1432-1442.
Huerta, B., Margiotta-Casaluci, L., Rodríguez-Mozaz, S., Scholze, M., Winter, M.J., Barcelo, D., Sumpter, J.P., 2016. Anti-anxiety drugs and fish behaviour: establishing the link between internal concentrations of oxazepam and behavioural effects. Environ. Toxicol. Chem. 25, 2782-2790.
Huggett, D.B., Cook, J.C., Ericson, J.F., Williams, R.T., 2003. A theoretical model for utilizing mammalian pharmacology and safety data to prioritize potential impacts of human pharmaceuticals to fish. Hum. Ecol. Risk Assess. 9, 1789-1799.
Kania, B.F., De˛ bski, B., Wro nska, D., Zawadzka, E., 2015. Verapamil - L type voltage gated calcium channel inhibitor diminishes aggressive behavior in male Siamese fighting fish. Pol. J. Vet. Sci. 18, 401-406.
Keller, A.G. F. d. S., 2017. The Effects of Multiple Stressors (Diltiazem, Hypoxia, and Temperature) on the Cardiovascular Function of Rainbow Trout. University of Lethbridge, Dept. of Biological Sciences, Lethbridge, Alta.
Kookana, R.S., Williams, M., Boxall, A.B., Larsson, D.J., Gaw, S., Choi, K., Yamamoto, H., Thatikonda, S., Zhu, Y.-G., Carriquiriborde, P., 2014. Potential ecological footprints of active pharmaceutical ingredients: an examination of risk factors in low-, middle-and high-income countries. Philos. Trans. R. Soc. B Biol. Sci. 369, 20130586.
Kortenkamp, A., Backhaus, T., Faust, M., 2009. State of the Art Report on Mixture Toxicity. Directorate General for the Environment: report to the EU Commission.
Kristofco, L.A., Brooks, B.W., 2017. Global scanning of antihistamines in the environment: analysis of occurrence and hazards in aquatic systems. Sci. Total Environ. 592, 477-487.
Law, V., Knox, C., Djoumbou, Y., Jewison, T., Guo, A.C., Liu, Y., Maciejewski, A., Arndt, D., Wilson, M., Neveu, V., 2013. DrugBank 4.0: shedding new light on drug metabolism. Nucleic acids Res. 42, D1091-D1097.
Lazarus, R.S., Rattner, B.A., Brooks, B.W., Du, B., McGowan, P.C., Blazer, V.S., Ottinger, M.A., 2015. Exposure and food web transfer of pharmaceuticals in ospreys (Pandion haliaetus): predictive model and empirical data. Integr. Environ. Assess. Manag. 11, 118-129.
Li, Z.-H., Li, P., Randak, T., 2010. Ecotoxocological effects of short-term exposure to a human pharmaceutical Verapamil in juvenile rainbow trout (Oncorhynchus mykiss). Comp. Biochem. Physiol. Part C Toxicol. Pharmacol. 152, 385-391.
Lilius, H., Isomaa, B., Holmstr€om, T., 1994. A comparison of the toxicity of 50 reference chemicals to freshly isolated rainbow trout hepatocytes and Daphnia magna. Aquat. Toxicol. 30, 47-60.
Margiotta-Casaluci, L., Owen, S.F., Cumming, R.I., de Polo, A., Winter, M.J., Panter, G.H., Rand-Weaver, M., Sumpter, J.P., 2014. Quantitative cross-species extrapolation between humans and fish: the case of the anti-depressant fluoxetine. PloS One 9, e110467.
Margiotta-Casaluci, L., Owen, S.F., Huerta, B., Rodríguez-Mozaz, S., Kugathas, S., Barcelo, D., Rand-Weaver, M., Sumpter, J.P., 2016. Internal Exposure Dynamics

80
Drive the Adverse Outcome Pathways of Synthetic Glucocorticoids in Fish. Scientific Reports 6. http://dx.doi.org/10.1038/srep21978.
Meador, J.P., Yeh, A., Young, G., Gallagher, E.P., 2016. Contaminants of emerging concern in a large temperate estuary. Environ. Pollut. 213, 254-267.
Monteiro, S.C., Boxall, A.B., 2010. Occurrence and Fate of Human Pharmaceuticals in the Environment. Reviews of Environmental Contamination and Toxicology. Springer, pp. 53-154.
Nallani, G.C., Edziyie, R.E., Paulos, P.M., Venables, B.J., Constantine, L.A., Huggett, D.B., 2016. Bioconcentration of two basic pharmaceuticals, verapamil and clozapine, in fish. Environ. Toxicol. Chem. 35, 593-603.
Nichols, J.W., Du, B., Berninger, J.P., Connors, K.A., Chambliss, C.K., Erickson, R.J., Hoffman, A.D., Brooks, B.W., 2015. Observed and modeled effects of pH on bioconcentration of diphenhydramine, a weakly basic pharmaceutical, in fathead minnows. Environ. Toxicol. Chem. 34, 1425-1435.
Overturf, M., Overturf, C., Baxter, D., Hala, D., Constantine, L., Venables, B., Huggett, D., 2012. Early life-stage toxicity of eight pharmaceuticals to the fathead minnow, Pimephales promelas. Arch. Environ. Contam. Toxicol. 62, 455-464.
Patel, A., Panter, G.H., Trollope, H.T., Glennon, Y.C., Owen, S.F., Sumpter, J.P., Rand-Weaver, M., 2016. Testing the “read-across hypothesis” by investigating the effects of ibuprofen on fish. Chemosphere 163, 592-600.
Postel, S., 2010. Water Adapting to a New Normal. The Post Carbon Reader: Managing the 21st Century's Sustainability Crises. Watershed Media, Healdsburg, CA.
Posthuma, L., Suter Ii, G.W., Traas, T.P., 2010. Species Sensitivity Distributions in Ecotoxicology. CRC Press.
Rand-Weaver, M., Margiotta-Casaluci, L., Patel, A., Panter, G.H., Owen, S.F., Sumpter, J.P., 2013. The read-across hypothesis and environmental risk assessment of pharmaceuticals. Environ. Sci. Technol. 47, 11384-11395.
Reuter, H., 1983. Calcium channel modulation by neurotransmitters, enzymes and drugs. Nature 301, 569-574.
Rudd, M.A., Ankley, G.T., Boxall, A., Brooks, B.W., 2014. International scientists' priorities for research on pharmaceutical and personal care products in the environment. Integr. Environ. Assess. Manag. 10, 576-587.
Scott, W.C., Du, B., Haddad, S.P., Breed, C.S., Saari, G.N., Kelly, M., Broach, L., Chambliss, C.K., Brooks, B.W., 2016. Spatiotemporal influences on traditional and emerging water quality indicators: predicted and observed therapeutic dose exceedences of ionizable pharmaceuticals in fish plasma from urban coastal systems. Environ. Toxicol. Chem. 35, 983-995.
Solomon, K.R., Takacs, P., 2001. Probabilistic Risk Assessment Using Species Sensitivity Distributions. Species Sensitivity Distributions in Ecotoxicology. CRC Press.
Spedding, M., Paoletti, R., 1992. Classification of calcium channels and the sites of action of drugs modifying channel function. Pharmacol. Rev. 44, 363e376.
Steinbach, C., Fedorova, G., Prokes, M., Grabicova, K., Machova, J., Grabic, R., Valentova, O., Kroupova, H.K., 2013. Toxic effects, bioconcentration and depuration of verapamil in the early life stages of common carp (Cyprinus carpio L.) Sci. Total Environ. 461, 198-206.

81
Steinbach, C., Burkina, V., Schmidt-Posthaus, H., Stara, A., Kolarova, J., Velisek, J., Randak, T., Kroupova, H.K., 2016. Effect of the human therapeutic drug diltiazem on the haematological parameters, histology and selected enzymatic activities of rainbow trout Oncorhynchus mykiss. Chemosphere 157, 57-64.
Tanoue, R., Nomiyama, K., Nakamura, H., Kim, J.W., Isobe, T., Shinohara, R., Kunisue, T., Tanabe, S., 2015. Uptake and tissue distribution of pharmaceuticals and personal care products in wild fish from treated-wastewater impacted streams. Environ. Sci. Technol. 49, 11649-11658.
Ternes, T.A., 1998. Occurrence of drugs in German sewage treatment plants and rivers. Water Res. 32, 3245-3260.
Valenti, T.W., Perez-Hurtado, P., Chambliss, C.K., Brooks, B.W., 2009. Aquatic toxicity of sertraline to Pimephales promelas at environmentally relevant surface water pH. Environ. Toxicol. Chem. 28, 2685-2694.
Valenti, T.W., Gould, G.G., Berninger, J.P., Connors, K.A., Keele, N.B., Prosser, K.N., Brooks, B.W., 2012. Human therapeutic plasma levels of the selective serotonin reuptake inhibitor (SSRI) sertraline decrease serotonin reuptake transporter binding and shelter-seeking behavior in adult male fathead minnows. Environ. Sci. Technol. 46, 2427e2435.
Varga, R., Somogyvari, I., Eke, Z., Torkos, K., 2012. Seasonal monitoring of cardiovascular and antiulcer agents' concentrations in stream waters encompassing a capital city. J. Pharm. 2013, 753928.
Vorosmarty, C.J., McIntyre, P.B., Gessner, M.O., Dudgeon, D., Prusevich, A., Green, P., Glidden, S., Bunn, S.E., Sullivan, C.A., Liermann, C.R., Davies, P.M., 2010. Global threats to human water security and river biodiversity. Nature 467, 555-561.
Water, U.N., 2009. The United Nations World Water Development Report 3eWater in a Changing World. United Nations Educational Scientific and Cultural Organization, Paris.
Wheeler, J.R., Grist, E.P.M., Leung, K.M.Y., Morritt, D., Crane, M., 2002. Species sensitivity distributions: data and model choice. Mar. Pollut. Bull. 45, 192-202.
Wishart, D.S., Knox, C., Guo, A.C., Shrivastava, S., Hassanali, M., Stothard, P., Chang, Z., Woolsey, J., 2006. DrugBank: a comprehensive resource for in silico drug discovery and exploration. Nucleic acids Res. 34, D668-D672.

82
CHAPTER FOUR
Influence of Diltiazem on Fathead Minnows Across Dissolved Oxygen Gradients
This chapter is published (In Press) as: Saari GN, Corrales J, Haddad S, Chambliss CK, Brooks BW. Influence of diltiazem on fathead minnows across dissolved oxygen
gradients. Environmental Toxicology and Chemistry https://doi.org/10.1002/etc.4242
ABSTRACT
Water resources in many arid to semi-arid regions are stressed by population
growth and drought. Growing populations and climatic changes are influencing
contaminant and water chemistry dynamics in urban inland waters where flows can be
dominated by, or even dependent on, wastewater effluent discharge. In these watersheds,
interacting stressors such as dissolved oxygen (DO) and environmental contaminants
(e.g., pharmaceuticals) have the potential to affect fish physiology and populations.
Recent field observations from our group identified the calcium channel blocker
diltiazem in fish plasma exceeding human therapeutic doses (e.g., Cmin) in aquatic
systems impaired due to nonattainment of DO water quality standards (WQS) and
criteria. Thus, our study objectives examined: 1) standard acute and chronic effects of
DO and diltiazem to fish, 2) influences of DO, at criteria levels deemed protective of
aquatic life, on diltiazem toxicity to fish, and 3) whether sublethal effects occur at
diltiazem water concentrations predicted to cause a human therapeutic level in fish
plasma (therapeutic hazard value, THV). DO x diltiazem co-exposures significantly
decreased survival at typical stream, lake, and reservoir WQS of 5.0 and 3.0 mg DO/L.
DO and diltiazem growth effects were observed at 2x and 10x their LC50 values (1.7 and

83
28.2 mg/L, respectively). Larval fathead minnow swimming behavior following all DO
and diltiazem exposures generally decreased and significantly reduced light:dark bursting
distance traveled, number of movements, and duration at concentrations as low as the
THV. Individual and population level consequences of such responses are not yet
understood; however, these observations suggest that assessments with pharmaceuticals
and other contaminants may underestimate the effects in fish across DO levels considered
protective of aquatic life.
INTRODUCTION
Surface water quality assessment and management in urban areas is challenging,
particularly in watersheds receiving wastewater treatment plant (WWTP) discharges and
nutrient enrichment (Brooks et al., 2006; Berninger et al., 2011; Haggard et al., 2005;
Nakamura et al., 2008; Taylor, 2002; Valenti et al., 2009; Waiser et al., 2011). Excessive
nutrients in conjunction with climate change exacerbates select harmful algal blooms and
causes eutrophication that depletes dissolved oxygen (DO) levels in freshwater and
marine ecosystems (Breitburg, 2002; Waiser et al., 2011). In these urban systems, diverse
organic contaminants, including pharmaceuticals, are continuously released from
WWTP, which results in life cycle exposures to aquatic organisms especially in effluent-
dominated and dependent ecosystems (Brooks et al., 2006). Such watersheds often
experience hypoxic events, which has received increasing attention in marine and coastal
systems. Unfortunately, hypoxia events have received relatively little attention in
freshwater ecosystems (Pollock et al., 2007). Our recent research (Saari et al., 2018)
identified exceedances of low DO thresholds and differential implementation of DO

84
criteria in a geographic region experiencing rapid population growth and severe droughts
over the past decade. Unfortunately, interactive effects of low DO and pharmaceuticals
have received even less study.
Understanding aquatic responses to chemical and nonchemical stressors was recently
highlighted as a priority research question to understand risks of pharmaceuticals in the
environment (Boxall et al., 2012). Fish responses to chemical stressors (e.g., ammonia,
metals, polycyclic aromatic hydrocarbons) have been shown to be influenced by low DO
(Fleming and Di Giulio, 2011; Hattlink et al., 2005; Lyu et al., 2013; Matson et al., 2008;
Prokkola et al., 2015). Recently, our group and others have observed concentrations of
the calcium channel blocker diltiazem in fish plasma approaching and even exceeding
human therapeutic plasma levels (Du et al., 2014; Fick et al., 2010a; Scott et al., 2016;
Tanoue et al., 2015). Consequences of such observations are unknown, but indicate
therapeutic risks to fish. For example, approaches have been developed to predict steady
state fish plasma uptake and internal doses of pharmaceuticals. These approaches were
developed from physiological-based pharmacokinetic modeling and the functional
conservation of pharmaceutical targets across vertebrates (Brooks, 2014; Du et al., 2014;
Fitzsimmons et al., 2001; Gunnarsson et al., 2008; Huggett et al., 2003). Using these
models, therapeutic hazard values (THV) can be derived to identify water concentrations
predicted to result in fish plasma levels of medicines equaling human therapeutic doses
(Berninger et al., 2011; Brooks, 2014; Fick et al., 2010b). Recently, Saari et al (2017)
examined global occurrence and associated hazards of calcium channel blockers in
multiple environmental matrices. Interestingly, environmental exposure distributions of
untreated sewage was the only matrix predicted to exceed the diltiazem THV (Cmin =

85
1.9%; Cmax = 0.2%), yet diltiazem in fish plasma levels from the field exceeded Cmin
doses 17% of the time (Saari et al., 2017). Whether such human therapeutic plasma
concentrations in fish result in adverse outcomes are unknown, particularly in urbanized
watersheds already impaired due to nonattainment of DO water quality standards (Brooks
et al., 2006; Scott et al., 2016).
The objectives of the present study were to examine whether DO influences
toxicity of diltiazem in fish. We initially investigated individual responses of the larval
fathead minnow (Pimephales promelas), a common fish model, to DO and diltiazem. We
then examined whether DO, at current water quality criterion values for inland waters,
influenced acute and chronic toxicity of diltiazem.
MATERIAL AND METHODS
To address our study objectives, the following subsections describe how
experimental conditions were maintained and traditional morphometric (e.g., mortality,
growth) and nontraditional sublethal (e.g., heart rate, feeding rate, photo-locomotor
behavior) responses of Pimephales promelas to DO, diltiazem or DO x diltiazem
mixtures were designed and measured. Standard DO experimental systems and protocols
are lacking and thus typical acute and chronic toxicity methods were used with minor
modifications. Herein, appropriately manipulating DO represented a critically important
experimental consideration. DO water concentrations were regulated by mixing both
nitrogen gas and air that were then infused in each experimental chamber, conceptually
similar to approaches described by Ho and Burggren (2012) and Zhou et al (2000). Gas
was regulated using RiteFlow meters (Scienceware Bel-Art Products, Wayne, NJ, USA).

86
Two to five different DO concentrations were maintained consistently and continually
with individual nitrogen and air Riteflow meters per treatment level. Each N2-air
regulator pair delivered gas that was mixed in sealed PVC chambers (10.2 x 61.0 x 0.3
cm; 4” x 24” x 1/8”) filled with bioballs. A single outflow line ran mixed gas to a climate
controlled walk-in incubator to a 6-port manifold where gas infusion levels were
manually adjusted to achieve desired DO treatment levels. Gas was then bubbled in semi-
sealed experimental chambers (e.g., 750 mL Mason jars, 20 L glass tanks).
Larval Pimephales promelas Experiments
In the present study, all acute and chronic experiments were performed with
reconstituted hard water (RHW) made according to U.S. Environmental Protection
Agency (EPA) methods (U.S., 2002a; b). All experiments were carried out in a climate
controlled environmental chamber at a constant temperature of 25 ± 1 C with a 16:8 h
light-dark cycle on a backup power supply. Water chemistry analyses were performed at
initiation of each study and on renewal days of chronic studies according to standard
methods (Association, 1989). For experiments with DO, measurements were taken
multiple times daily with a YSI ProODO optical DO sensor (YSI Inc., Yellow Springs,
Ohio, USA). Experimental treatment levels of DO and diltiazem were informed from the
literature and preliminary acute range finding studies with larval Pimephales promelas
reared at Baylor University in accordance with Institutional Animal Care and Use
Committee guidelines.

87
Acute studies
Triplicate 48 h toxicity studies were conducted individually with DO and
diltiazem (U.S. EPA, 2002a). Briefly, each experiment was carried out using 750 mL
glass chambers (semi-sealed Mason jars) with 10 organisms per unit and four replicates
per treatment level. Nominal DO (mg/L) treatment levels included 8.2 (control), 5.0, 3.0,
2.0, 1.0, and 0.5. Nominal diltiazem treatment levels were 0, 0.00015 (diltiazem THV),
15, 30, 45, 60 mg/L. Primary endpoints for these acute studies with either DO or
diltiazem included mortality and heart rate. Photo-locomotor behavioral responses (PLR)
to these DO treatment levels were also examined.
After completing these triplicate experiments with either DO or diltiazem,
individual acute 48 h studies examining DO x diltiazem interactions were then separately
completed with identical diltiazem treatment levels (0, 0.00015, 15, 30, 45 mg/L), under
normoxic DO levels (8.2 mg DO/L) and DO manipulated at either 5.0 or 3.0 mg DO/L.
Hereafter, 8.2 mg DO/L, 5.0 mg DO/L, and 3.0 mg DO/L treatment levels will be
described as normal, moderate, and low DO when referring to interactive studies. The
0.00015 mg/L diltiazem treatment level was equal to the THV, which is a water
concentration predicted to bioconcentrate in fish plasma to a human therapeutic level
(Berninger et al., 2011; Brooks, 2014). This conceptual approach was first proposed by
Huggett et al (2003) to estimate fish plasma steady state pharmaceutical levels resulting
from aqueous exposures. Initial plasma modeling by Fitzsimmons et al. (2001) predicted
fish blood:water partition coefficeints of hydrophobic compounds. Diltiazem is a weak
base; therefore, the initial fish uptake model in the present study was modified to account
for the experimental pH (8.3) by using log D instead of log P (Berninger et al., 2011).

88
The human diltiazem minimum (Cmin = 30 ng/mL) therapeutic level was obtained from
Schulz et al (2012). Thus, for diltiazem THV calculations, a water concentration
predicted to bioconcentrate to the human Cmin was employed (Brooks, 2014; Du et al.,
2014).
Experimental units for acute studies were each filled with 500 mL of treatment
water. Less than 24 h post hatch (hph) P. promelas were used in each study. Fish were
fed newly hatched brine shrimp (Artemia sp.) nauplii 2 hours before each study and were
not fed throughout each experiment. After 48 h exposure, 5 fish from each replicate were
randomly selected for heart rate measurements. Fish were anesthetized with 50 mg/L
MS-222 and 100 mg/L sodium bicarbonate for 3 minutes. When unresponsive, fish heart
rates were counted visually via dissection microscope by recording ventricular beats for
10 seconds during three separate measurements (Finn et al., 2012). Preliminary studies
indicated no significant differences in fish heart rates between 3 minute anesthetized and
non-anesthetized fish. Replicate units were examined individually within approximately
five minutes. The remaining 5 fish in each replicate were used for PLR behavior
evaluations under a 2-cycle light-dark assay.
Similar to previously published methods from our laboratory by Kristofco et al
(2016) and Steele et al. (2018), behavioral observations were recorded in quantization
mode using Zebrabox and accompanying Zebralab tracking software (ViewPoint, Lyon,
France). Calibration parameters for the plate and pixel detection thresholds were: plate
width = 125 mm; pixel detection thresholds = black; movement thresholds: resting = < 5
mm/s; cruising = 5-20 mm/s; bursting = > 20 mm/s; data bin = one minute. To reduce
background noise from reflections on well walls, tracking was set to refresh after each

89
one minute bin and movement thresholds were set at ≥ 2 pixels. Treatment water from
each replicate was added (2 mL) to respective plate wells and one fish per well was added
randomly from each treatment replicate to a 24-well plate. All treatment levels were
included on each plate. Fish behavior was recorded for 50 minutes and included a 10
minute dark acclimation period followed by 2 light-dark cycles, 10 minutes per light or
dark period. Data recorded during the 10 minute acclimation period were not included in
analyses. All observations were collected in afternoon to evening hours.
Chronic studies
Short-term 7 day chronic P. promelas studies were then conducted using 24 hph
fish according to U.S. EPA methods with minor modifications (U.S. EPA, 2002b).
Individual experiments were conducted separately for DO, diltiazem, and DO x
diltiazem. Initial P. promelas chronic studies were conducted with DO in 20 L tanks
with 3 L water volumes. These observations informed diltiazem and DO x diltiazem
interactive studies, which were performed in 750 mL experimental units. Chronic studies
consisted of daily static renewals with either DO adjusted water or diltiazem stock
solutions (prepared at time zero, stored in the dark at 4 °C). For the chronic DO study,
nominal DO treatment levels (mg/L) were 8.2 (control), 5.0, 4.0, 3.0, and 2.0. Chronic
diltiazem treatments were derived from a mean 48 h LC50 value, based on the triplicate
studies described above, and subsequent nominal concentrations were determined
following 10-fold dilution, including 0, 0.03394, 0.3394, 3.394, 33.94, 339.4, 3394,
33940 μg/L.

90
Two interactive nominal DO x diltiazem studies were conducted at normal control
(8.2 mg DO/L) and either moderate (5.0 mg DO/L) or low (3.0 mg DO/L) treatment
levels across five diltiazem treatment levels including 0, 0.3394, 33.94, 339.4, and 3394
μg/L. Fish were fed newly hatched brine shrimp (Artemia sp.) nauplii twice daily. Study
endpoints included survival, growth, heart rate, and feeding and PLR behavior. Briefly,
heart rates were observed as described above with four fish from each replicate and
anesthetized with 67 mg/L MS-222 and 133 mg/L sodium bicarbonate for 3 minutes.
Again, each beaker was processed within approximately five minutes. Four fish from
each replicate were then used for PLR observations under a 2-cycle light-dark assay
following the methods introduced above or feeding rates. Fish from heart rate and PLR
observations were then employed for traditional growth (dry weight) measurements
following previously reported methods (Stanley et al., 2007; U.S. EPA, 2002b).
Feeding rates were assessed following 7 days of exposure according to previous
methods (Stanley et al., 2007). Food was withheld from fish 24 h prior to study initiation.
Feeding rates were determined by enumerating brine shrimp nauplii consumed over 15
minutes. Two fish per treatment were randomly selected from each of four replicates.
Individual fish from each treatment were placed in 100 mL beakers of clean RHW for an
hour before adding 25 brine shrimp nauplii. After 15 minutes, fish were removed and the
remaining brine shrimp were recorded. Feeding rates were calculated as the number of
consumed brine shrimp nauplii per minute. The number of artemia consumed by two
randomly selected fish per replicate was used to calculate mean feeding rate. Fish used in
feeding rate studies were not included in growth measurements.

91
Chemical and Analytical Quantification of Treatment Levels
Diltiazem hydrochloride was obtained from Sigma-Aldrich (St. Louis, MO, USA;
CAS # 33286-22-5; purity: ≥ 99%). Experimental treatment levels in each acute and
chronic diltiazem experiment were analytically verified by liquid chromatography
tandem mass spectrometry (LC-MS/MS) on an Agilent Infinity 1260
autosampler/quaternary pumping system, Agilent jet stream thermal gradient electrospray
ionization source, and model 6420 triple quadrupole mass analyzer. Briefly, a 500 μL
aliquot of undiluted or diluted stock solution were combined with 450 μL of 0.1% formic
acid (w/w) and spiked with 50 μL of an internal standard (diltiazem-d3) in a standard 2
mL analytical vial (Agilent Technologies, Santa Clara, CA, USA) before analyses. A
gradient mobile phase condition that resulted in the elution of diltiazem at 4.2 minutes
was identified. Salts and other highly polar sample constituents were diverted to waste
and away from the MS/MS during the first minute of each sample run. Chromatography
was performed using a 10 cm × 2.1 mm Poroshell 120 SB-AQ column (120Å, 2.7 μm,
Agilent Technologies, Santa Clara, CA, USA) preceded by a 5 mm × 2.1 mm Poroshell
120 SB-C18 attachable guard column (120Å, 2.7 μm, Agilent Technologies, Santa Clara,
CA, USA). The ionization mode, monitored transitions, and instrumental parameters for
diltiazem/diltiazem-d3 were as follows: ESI+ diltiazem 415.2 > 150, fragmentor = 140,
collision energy = 50, and diltiazem-d3 418 > 177.9, fragmentor = 135, collision energy
= 28.
Limit of detection (LOD) and limit of quantification (LOQ) were determined by
running several method blanks and calculating the standard deviation. LOD and LOQ for
diltiazem were determined to be 0.009 μg/L and 0.026 μg/L respectively. Ten standards,

92
ranging in concentration from below LOQ to 500 μg/L, were used to construct a linear
calibration curve (r2 ≥ 0.998). Instrument calibration was monitored over time via
analysis of continuing calibration verification (CCV) samples, which were run every five
samples, with an acceptability criterion of ±20%. Calibration standards were prepared in
RHW and calibration verification samples were prepared in 0.1% formic acid (v/v).
Ultrapure water, Thermo Barnstead Nanopure Diamond UV (Dubuque, IA, USA) water
purification system with 18 MΩ, RHW, and 0.1% formic acid were run to validate the
purity of solutions and as method blanks.
Statistical analyses
Diltiazem and DO lethal concentration (LC50) values, based on analytically
verified observations, were calculated using the Toxicity Relationship Analysis Program
(TRAP; version 1.30). Sigma Plot 11.0 software (Systat Software 323 Inc., San Jose, CA,
USA) was used for all other statistical analyses. Prior to analysis, data normality and
equal variance tests were performed. If normality and equal variance assumptions were
not met, data values were transformed (e.g., log, square root). Experimental responses
were evaluated using α = 0.05. Lowest-observable-effect concentrations (LOEC) were
identified using one-way analysis of variance (ANOVA) with Dunnett’s post hoc test to
identify treatment level effects. Mean behavioral responses such as distance traveled,
number of movements (counts), and duration were calculated across 1 minute intervals
(bins). Total (e.g., distance traveled and count) and individual behavioral responses of
separate and interactive DO and diltiazem studies were determined across light and dark
photoperiods and compared. For data not meeting ANOVA assumptions following

93
transformation, ANOVA on ranks were performed. Interactive effects of DO x diltiazem
exposure were determined by Two-Way ANOVA with Holm-Sidak post-hoc tests
relative to treatment control.
RESULTS Acute studies
Treatment levels of DO and diltiazem were verified within 95-140% and 17-92%
(Supplementary: Table 19), respectively, of nominal concentrations. Therefore, all
toxicity point estimates were calculated using measured concentrations of diltiazem and
DO. Water quality parameters from each study were within acceptable ranges
(Supplementary: Table 20). Control survival was 100% for all 48 h acute studies. Acute
toxicity studies showed dose-dependent responses to DO, diltiazem, and DO x diltiazem
treatment levels. For individual studies with DO or diltiazem, mean (±SD; n=3 studies)
48 h LC50 values were 1.7 (±0.1) and 35.1 (±0.9) mg/L, respectively (Figure 8A-B). For
interactive DO x diltiazem studies, LC50 values at normal and moderate DO levels were
30.5 mg/L and 16.0 mg/L, whereas diltiazem LC50 values were 28.2 mg/L and 8.3 mg/L
at normal and low DO levels, respectively (Figure 8C). No significant differences in heart
rate were observed in DO treatments down to 2.3 mg/L (< 90% survival at 1.1 mg/L; SI
Figure 25A) but 12 mg/L diltiazem significantly (p<0.05) decreased fish heart rates
(LOEC; Table 12; SI Figure 25B). Decreases in heart rate were similarly reproduced at
13 mg/L diltiazem (LOEC) at both normal and moderate DO concentrations, and at 12.5
mg/L at normal and low DO levels. Interactive effects of DO on heart rate across
diltiazem treatments were insignificant (SI Figure 26A-B; p > 0.05; Two-way ANOVA).

94
Mean PLR behavioral responses of unexposed or naïve P. promelas were
visualized from five acute studies across multiple speed categories and endpoints/metrics
(e.g., total distance and count, resting duration) over 2-cycle light:dark periods. Mean
(±SE) naïve fish distance traveled across 2-light cycles was slightly greater (13.4±1.1
mm/s) than dark (11.2±1.2; Figure 9A). Similar light and dark trends were observed in
distance traveled, total number of movements (counts), and duration of activity across
stimulatory, cruising and refractory speed categories. Fish behavioral responses across all
DO conditions were generally significant different from controls (p > 0.05), although
decreasing trends were observed for fish activity in the light and dark (e.g., total number
of movements, duration, bursting distance traveled; Figure 10A-C, SI Figure 27A-C and
28A-C). Interactive DO x diltiazem significantly (p< 0.05) decreased activity (e.g.,
distance traveled, counts, duration) across both light and dark, although responses in the
light and dark were not always monotonic (e.g., normal and moderate DO; Figure 12A-F
and 13A-F, SI Figure 31-34A-F). Significant differences in activity were generally more
sensitive in the dark (e.g., LOEC) than the light with significant responses observed at the
THV and 26297 μg/L, respectively (Table 13).

95
Tabl
e: 1
2. A
cute
(48
h)
LC50
val
ues,
and
chro
nic
(7 d
) Lo
wes
t Obs
erve
d Ef
fect
Con
cent
ratio
ns (
LOEC
) an
d N
o O
bser
ved
Effe
ct C
once
ntra
tions
(N
OEC
) fo
r he
art r
ate,
feed
ing
rate
and
gro
wth
resp
onse
s fol
low
ing
diss
olve
d ox
ygen
(DO
), di
ltiaz
em (D
ZM),
and
DO
x D
ZM st
udie
s with
Pim
epha
les p
rom
elas
.
LO
EC
, NO
EC
con
cent
ratio
ns (μ
g/L
)
M
ean
48 h
L
C50
(mg/
L)
48 h
Hea
rt R
ate
(bea
ts/m
in)
7 d
Gro
wth
(m
g/or
g)
7 d
Feed
ing
Rat
e (p
rey/
min
) 7
d H
eart
Rat
e (b
eats
/min
) D
O
a 1.7
±0.1
b N
A, 2
.3
4.3,
5.1
b N
A, <
3.2
4.
3, 5
.1
DZM
a 35
.1 ±
0.9
c 1200
0, 0
.1
2356
, 278
>2
356,
>23
56
d NA
8.
2 m
g D
O/L
x D
ZM
30.5
13
000,
0.1
1 22
15, 2
59
>221
5, >
2215
e 25
9, 2
3
5.0
mg
DO
/L x
DZM
16
.0
1300
0, 0
.11
2215
, 259
>2
215,
>22
15
259,
23
8.2
mg
DO
/L x
DZM
28
.2
1250
6, 0
.084
23
48, 2
77
>234
8, >
2348
27
7, 2
6
3.0
mg
DO
/L x
DZM
8.
3 >0
.084
, >0.
084
2348
, 277
>2
348,
>23
48
2348
, 277
(a
) Ind
icat
es m
ean
(±SD
, N=3
stud
ies)
. (b)
Indi
cate
s a
LOEC
was
not
cal
cula
ted
beca
use
the
conc
entra
tion
abov
e th
e N
OEC
resu
lted
in s
igni
fican
t mor
talit
y (1
.1
mg/
L). (
c) I
ndic
ates
mea
n he
art r
ates
for 3
stu
dies
. (d)
Insu
ffici
ent d
ata
for s
tatis
tical
ana
lysi
s (N
=2 p
er c
once
ntra
tion)
. (e)
Sig
nific
ant i
ncre
ase
in h
eart
rate
at
0.25
9 μg
/L (L
OEC
), th
us th
e N
OEC
was
23
μg/L
; how
ever
, a si
gnifi
cant
dec
reas
e in
hea
rt ra
te w
as o
bser
ved
at 2
215
μg/L
.

96
Tabl
e: 1
3. A
cute
(48
h)
LC50
val
ues,
and
chro
nic
(7 d
) Lo
wes
t Obs
erve
d Ef
fect
Con
cent
ratio
ns (
LOEC
) an
d N
o O
bser
ved
Effe
ct C
once
ntra
tions
(N
OEC
) fo
r ph
oto-
loco
mot
or b
ehav
iors
fol
low
ing
diss
olve
d ox
ygen
(D
O),
dilti
azem
(D
ZM),
and
DO
x D
ZM s
tudi
es w
ith P
imep
hale
s pr
omel
as. A
rrow
s in
dica
te w
heth
er
resp
onse
s wer
e si
gnifi
cant
ly (p
< 0.
05) i
ncre
ased
or d
ecre
ased
rela
tive
to c
ontro
l.
Acu
te B
ehav
iora
l Res
pons
e L
OE
Cs (
Lig
ht /
Dar
k; μ
g/L
)
TD
R
D
CD
B
D
TC
R
C
CC
B
C
RD
C
D
BD
D
O
- / -
- / -
- / -
- / -
- / -
- / -
- / -
- / -
(↓) 3
.4
/ -
- / -
- / -
DZM
N
A
NA
N
A
NA
N
A
NA
N
A
NA
N
A
NA
N
A
8.2
mg
DO
/L x
D
ZM
(↓)
2629
7 /
(↑)
1300
0
(↓)
2629
7 /
(↓)
2629
7
(↓)
2629
7 /
(↓)
0.11
2
(↓)
2629
7 /
(↓)
2629
7
(↓)
2629
7 /
(↓)
0.11
2
- / -
(↓)
2629
7 /
(↓)
0.11
2
- / (↓)
26
297
- / -
(↓)
2629
7 /
(↓)
0.11
2
- / (↓)
26
297
5.0
mg
DO
/L x
D
ZM
- / -
- / -
- / -
- / -
- / -
- / -
- / -
- / -
- / -
- / -
- / -
8.2
mg
DO
/L x
D
ZM
(↓)
1250
6 /
-
(↓)
2041
8 /
(↓)
1250
6
(↓)
1250
6 /
(↓)
0.08
4
- / -
(↓)
1250
6 /
(↓)
0.08
4
(↓)
1250
6 /
(↓)
0.08
4
(↓)
1250
6 /
(↓)
0.08
4
(↓) 1
2505
/ -
- /
(↑)
0.08
4 (↓
) 12
506
/ (↓
) 0.
084
(↓)
1250
6 / -
3.0
mg
DO
/L x
D
ZM
- / -
- / -
- / -
- / -
- / -
- / -
- / -
- / -
- / -
- / -
- / -
Chr
onic
Beh
avio
ral R
espo
nse
LO
EC
s (L
ight
/ D
ark;
μg/
L)
DO
(↑
) 3.4
/
- /
- - /
- - /
- - /
- - /
- - /
- - /
- - /
- - /
- - /
-
DZM
(↑
) 26
/ -
- / -
(↑) 2
6 / -
- /
- (↓
) 235
6 / (↓)
23
56
- / (↓)
23
56
(↓) 2
356
/ (↓)
23
56
- / (↓)
23
56
(↓)
2356
/ (↓
) 23
56
- / -
- / (↓)
23
56
8.2
mg
- / -
- / (↑)
- /
- - /
- - /
- - /
- - /
- (↓
) 23
/ - /
- - /
- (↓
) 23
/ -

97
DO
/L x
D
ZM
23
(↓) 2
215
5.0
mg
DO
/L x
D
ZM
- / -
- / -
- / -
- / -
- / -
- / -
- / -
(↓) 0
.1 /
- - /
- - /
- (↓
) 23
/ -
8.2
mg
DO
/L x
D
ZM
- / -
(↑) 2
6 /
(↑) 2
77
- / -
- / -
- / -
- / -
- / -
- / -
- / -
- / -
- / -
3.0
mg
DO
/L x
D
ZM
- / -
- / -
- / -
- / -
- / -
- / -
- / -
(↓) 0
.1 /
(↓) 0
.1
- / -
- / -
(↓) 0
.1 /
(↓) 0
.1
DO
: dis
solv
ed o
xyge
n; D
ZM: d
iltia
zem
; 8.2
: nor
mal
8.2
mg
DO
/L; 5
.0: m
oder
ate
5.0
mg
DO
/L; 3
.0: l
ow 3
.0 m
g D
O/L
. (-)
: ind
icat
es n
o si
gnifi
cant
eff
ects
ob
serv
ed. T
D: s
um to
tal d
ista
nce
trave
led
per m
inut
e ac
ross
all
spee
d ca
tego
ries;
RD
: res
ting
(<5
mm
/s) d
ista
nce
trave
led
per
min
ute;
CD
: cru
isin
g (5
-20
mm
/s)
dist
ance
tra
vele
d pe
r m
inut
e; B
D:
burs
ting
(>20
mm
/s)
dist
ance
tra
vele
d pe
r m
inut
e. T
C:
tota
l nu
mbe
r of
mov
emen
ts (
coun
ts)
per
min
ute
acro
ss a
ll sp
eed
thre
shol
ds;
RC
: re
stin
g (<
5 m
m/s
) nu
mbe
r of
mov
emen
ts (
coun
ts)
per
min
ute;
CC
: cr
uisi
ng (
5-20
mm
/s)
num
ber
of m
ovem
ents
(co
unts)
per
min
ute;
BC
: bu
rstin
g (>
20
mm
/s) n
umbe
r of m
ovem
ents
(cou
nts)
per
min
ute.
RD
: res
ting
(<5
mm
/s) d
urat
ion
(sec
.) pe
r min
ute;
CD
: cru
isin
g (5
-20
mm
/s) d
urat
ion
(sec
.) pe
r m
inut
e; B
D: b
urst
ing
(>20
mm
/s) d
urat
ion
(sec
.) pe
r min
ute.

98
Figure: 8. Mean (±SD, N=3 studies) percent survival by Pimephales promeals larvae following 48 h A) dissolved oxygen (DO), B) diltiazem or C) DO x diltiazem studies. Moderate and low DO x diltiazem studies were conducted in separate experiments (C) with a normal DO treatment (black circles = normal and moderate DO x diltiazem study; gray circles = normal and low DO x diltiazem study). *: p < 0.05.
Figure: 9. Baseline behavior activity of unexposed Pimephales promelas larvae. Mean (±SE) total distance traveled per minute by P. promelas larvae following A) 48 h or B) 7 d studies. Two dark and two light photoperiod responses were measured. A total of 72 (18 replicates each of 4 larvae) and 64 (16 replicates of 4 fish) P. promelas from 48 h and 7 d studies, respectively, were used for each baseline behavioral observation. Data presented as total distance traveled by unexposed larval fish across three speed categories in the light (white background) or dark (gray background).

99
Figure 10. Mean (±SE) distance traveled per minute by Pimephales promelas larvae following 48 h (panels A, B, C; N=3 studies) or 7 d (panels D, E, F; N=4, n=4-5) studies across dissolved oxygen (DO) gradients. Data presented as distance traveled in speed (mm/s) categories for resting (< 5 mm/s; panels A, D), cruising (5-20 mm/s; B,E), and bursting (>20 mm/s; C, F) behaviors. Distance traveled was observed over two alternating 10 minute periods of light (white bars) and dark (black bars) conditions. No behavioral observations were recorded (N.M.: Not Measured) at DO concentrations causing significant mortality. *: p < 0.05.
Figure: 12. Mean (±SE) distance traveled per minute by Pimephales promelas larvae following 48 h (panels A, B, C, D, E, F; N=4, n=4-5) or 7 d (panels G, H, I, J, K, L; N=4, n=4-5) studies across normal and moderate dissolved oxygen (DO) x diltiazem interaction treatments. Data presented as distance traveled in speed (mm/s) categories for resting (< 5 mm/s; panels A, D, G, J), cruising (5-20 mm/s; B, E, H, K), and bursting (>20 mm/s; C, F, I, L) behaviors. Distance traveled was observed over two alternating 10 minute periods of light (white bars) and dark (black bars) conditions. No behavioral observations were recorded (N.M.: Not Measured) at DO concentrations causing significant mortality. *: p < 0.05. Normal DO: 8.2 mg DO/L; Moderate DO: 5.0 mg DO/L.

100
Figure: 13. Mean (±SE) distance traveled per minute by Pimephales promelas larvae following 48 h (panels A, B, C, D, E, F; N=4, n=4-5) or 7 d (panels G, H, I, J, K, L; N=4, n=4-5) studies across normal and low dissolved oxygen (DO) x diltiazem interaction treatments. Data presented as distance traveled in speed (mm/s) categories for resting (< 5 mm/s; panels A, D, G, J), cruising (5-20 mm/s; B, E, H, K), and bursting (>20 mm/s; C, F, I, L) behaviors. Distance traveled was observed over two alternating 10 minute periods of light (white bars) and dark (black bars) conditions. No behavioral observations were recorded (N.M.: Not Measured) at DO concentrations causing significant mortality. *: p < 0.05. Normal DO: 8.2 mg DO/L; Low DO: 3.0 mg DO/L. Chronic studies
Similar to acute studies, treatment levels of DO and diltiazem were measured or
analytically verified within 100-113% and 17-82% of nominal concentrations,
respectively (Supplementary: Table 19). Therefore, all toxicity point estimates were
calculated using measured concentrations of diltiazem and DO. Similar to acute
experiments, water quality parameters from each study were within acceptable ranges
(Supplementary: Table 20) and control survival was 100% in each chronic experiment.
Interactive DO x diltiazem experiments resulted in significant decreases in mean (±SD;
55.0±33.2) survival at low DO and 2348 μg/L diltiazem. Additionally, chronic endpoints
such as growth demonstrated dose-dependent reduction across all individual and
interactive studies. Individual DO and diltiazem fish growth LOEC values were 4.3 mg

101
DO/L and 2356 μg/L diltiazem, respectively (Figure 14A-B). DO x diltiazem treatments
across normoxic, moderate (5.4 mg DO/L) DO levels significantly (p < 0.05) decreased
growth only in the highest diltiazem treatments at 2215 and 2348 μg/L, respectively;
however, no interactive effects of DO were observed (p = 0.254; Table 12; Figure 15A-
B). Similar to individual DO influences on growth, heart rates were significantly (p <
0.05) reduced by low DO (SI Figure 35A-B). Interactive DO x diltiazem studies also
significantly (p < 0.05) altered heart rates across diltiazem concentrations at low DO and
2348 μg/L (SI Figure 36A-B), and no significant differences in feeding rates were
observed in either chronic studies (SI Figure 37A-B and 38A-B).
Similar to acute studies, mean PLR behavioral responses of unexposed or naïve P.
promelas were visualized from four chronic studies across multiple speed categories and
endpoints/metrics (e.g., total distance and count, resting duration) across 2-cycle
light:dark periods. In each chronic study, distances traveled across light:dark cycles were
inverted, relative to 48 hph light:dark fish behavior (Figure 9B), with greater activity in
the dark than the light. Mean (±SE) total distances traveled of unexposed fish across 2-
light cycles were lower (15.9±1.1 mm/s) than distances traveled in the dark (25.0±2.3;
Figure 9B). This preferential dark activity was consistent across all behavioral speed
categories and endpoints/metrics. In individual DO studies, low oxygen levels
significantly increased (p< 0.05) total distance traveled in the light, while nonmonotonic
responses were observed in the dark and across other endpoints (Figure 10D-F, SI Figure
27D-F and 28D-F). Individual diltiazem behavior responses were also nonmonotonic yet
light and dark activity was significantly reduced across several endpoints (p< 0.05;
Figure 11A-C, SI Figure 29A-C and 30A-C) Likewise, interactive DO x diltiazem

102
treatments significantly (p< 0.05) decreased activity (e.g., distance traveled, counts,
duration) across both light and dark, although responses in the light and dark were not
always monotonic (e.g., normal and moderate DO; Figure 12G-L and 13G-L; SI Figure
31-34G-L). LOEC values indicated activity in the dark (e.g., LOEC) was generally more
sensitive than the light. Light and dark differences in sensitivity were demonstrated by
significant ng/L (THV) level effects observed in the dark versus higher (μg/L) diltiazem
concentrations in the light (Table 13). Dissolved oxygen did not significantly affect
behavioral responses to diltiazem.
Figure: 11. Mean (±SE) distance traveled per minute by Pimephales promelas larvae following 7 d (panels A, B, C; N=4, n=4-5) diltiazem studies. Data presented as distance traveled in speed (mm/s) categories for resting (< 5 mm/s; panels A), cruising (5-20 mm/s; B), and bursting (>20 mm/s; C) behaviors. Distance traveled was observed over two alternating 10 minute periods of light (white bars) and dark (black bars) conditions. No behavioral observations were recorded (N.M.: Not Measured) at DO concentrations causing significant mortality. *: p < 0.05.
Figure: 14. Mean (±SE, N=4, n=6-8) dry weights (growth) by Pimephales promeals larvae following 7 d A) dissolved oxygen (DO) and B) diltiazem studies. No growth measurements were observed (N.M.: Not Measured) at DO or diltiazem concentrations causing significant mortality. *: p < 0.05.

103
Figure: 15. Mean (±SE, N=4, n=6-8) dry weight (growth) by Pimephales promeals larvae following 7 d experiments across A) normal and moderate dissolved oxygen x diltiazem and B) normal and low DO x diltiazem studies. No growth measurements were observed (N.M.: Not Measured) at DO or diltiazem concentrations causing significant mortality. *: p < 0.05. Normal DO: 8.2 mg DO/L; Moderate DO: 5.0 mg DO/L; Low DO: 3.0 mg DO/L. DISCUSSION
In the present study we employed standard acute and chronic toxicity studies to
examine individual and interactive toxicological effects of DO and diltiazem to larval P.
promelas. Few studies have characterized the effects of diltiazem in fish. Although the
effects of DO have been reported over the last six decades, previous DO studies failed to
calculate standard toxicity endpoints following standardized procedures. The present
study reports individual DO and diltiazem LC50 values and demonstrates DO x diltiazem
markedly decreases P. promelas survival across both acute and chronic studies at typical
DO water quality criteria (WQC) levels. Neither 48 h acute nor 7 day chronic traditional
or nontraditional endpoints consistently showed significant interactive effects across
normal, moderate, or low DO levels at diltiazem concentrations below levels decreasing
survival (< 90%). 48 h DO x diltiazem LC50 values decreased at moderate (5.0 mg/L)
and low (3.0 mg/L) DO concentrations relative to normoxic levels by a factor of 2.1 and
3.5, respectively. Both moderate and low DO concentrations are common freshwater high

104
aquatic life use WQC values for streams and reservoirs in Texas, USA, often dominated
or dependent on WWTP effluent containing pharmaceuticals such as diltiazem (Brooks et
al., 2006; Du et al., 2015; Scott et al., 2016). Inland waters of Texas and other U.S. states
are notorious for being listed on the U.S. Clean Water Act 303(d) list due to non-
attainment of DO WQC (Brooks et al., 2008; CRASR, 2006). Therefore, the present
study demonstrates the toxicological influence of DO to a model contaminant and
pharmaceutical in fish, which deserves further attention at a time of increasing global
hypoxia (Breitburg et al., 2018; Watson et al., 2016).
The necessity of DO to aquatic life, such as teleosts, has been reviewed
previously (Wu, 2002) and has been suggested to be the major factor, coinciding with
temperature, impacting fish populations under global climate change (Pörtner, 2010;
Pörtner, 2002; Pörtner and Knust, 2007). Literature reviews and studies have outlined the
physiological and biochemical strategies fish employ to cope with less than optimal DO
concentrations (Richards, 2009; Wu, 2002). Too little oxygen initiates a well-coordinated
response to increase DO uptake and a subsequent defense against the metabolic
consequences of limited ATP production leading to a finite substrate-dependent duration
of survival (Richards, 2009). Initially, the ventilator response accompanies detected
decreased DO levels in fish to enhance respiratory water flow across the gills. Previous
studies have shown increased oxygen uptake positively correlating with higher chemical
accumulation (e.g., endrin, tetrachlorobenzene, EE2; Blewett et al., 2013; McKim and
Goeden, 1982; Yang et al., 2000). Increasing chemical uptake at less than optimal DO
levels can thus add to the physiological and biochemical perturbations already occurring
in fish trying to maintain and/or cope with a lack of oxygen. Multiple aquatic organism

105
(e.g., daphnia, fish) have been shown to have greater chemical sensitivity at less than
optimal DO concentrations across multiple levels of biological organization. For
example, similar DO x chemical experiments with ammonia, 1, 2, 4-trichlorobenzene,
sweet crude oil, cadmium, and copper in daphnia and several fish species (Carlson, 1987;
Dasgupta et al., 2015; Fitzgerald et al., 2016; Hattlink et al., 2005; Lyu et al., 2013) have
been shown to decrease survival consistent with our observations. At the subcellular
level, hypoxia and the pharmaceutical diclofenac were shown to induce CYP1A activity
(EROD) above diclofenac activity alone in the three-spined stickleback, which is
opposite to other studies predominantly reporting an inhibitory effect on CYP1A activity
(Matson et al., 2008; Prokkola et al., 2015; Rahman and Thomas, 2012). Conversely,
LDH activity increased in response to hypoxia but was suppressed to control levels
following co-exposures. To date, enzymatic specific responses to DO x chemical
exposures are commonly studied with PAHs but remain understudied with contaminants
of emerging concern like pharmaceuticals. A few studies, for example, with hypoxia x
bisphenol A (BPA) and cardiovascular responses were altered and caused significant
decreases in survival, red blood cell density, tissue vascularization, and development in
Danio rerio embryos (Cypher et al., 2015). Clearly these studies demonstrate empirical
evidence indicating DO can significantly increase fish sensitivity to chemical
perturbations under co-exposure conditions.
To our knowledge, this is the first P. promelas 48 h acute study to assess the
effect of DO to this common model aquatic organism. An LC50 of 2.00 (± 0.23) mg/L
for P. promelas is greater than that of Daphnia magna (0.6-0.7 mg/L) (Nebeker et al.,
1992) but similar to that reported for adult common smelt (1.83 mg/ L), and rainbow

106
trout parr (1.62 mg/L) (Landman et al., 2005). Few standard calculated DO LC50 values
in freshwater fish have been reported because most lethal studies only report DO
concentrations causing mortality. Similarly, few diltiazem and other CCB standard
toxicity values have previously been reported. Acute diltiazem 48 h LC50 values of 25.6
and 28.0 mg/L for Oryzias latipes and Daphnia. magna, respectively, are similar to mean
(±SD) 48 h LC50 of 30.5±1.2 mg/L estimated in the present study (Kim, 2007). The
acute toxicity of other CCBs such as verapamil have been similarly reported in embryo
and larval common carp (Cyprinus carpio) and juvenile rainbow trout (Oncorhynchus
mykiss), in which 96 h LC50 values reported by Steinbach et al (2013) and Li et al (2010)
were 16.3-4.8 mg/L and 2.7 mg/L, respectively. Short-term survival and growth of early
life stage fish (e.g., fathead minnow) have been predictive endpoints to determine
contaminant concentrations causing adverse effects relevant to ecological risk assessment
(Norberg and Mount, 1985; U.S. EPA, 2002b). Further, the present study reports the first
individual DO and diltiazem standard lethal toxicity value for larval Pimephales
promelas, a common regulatory model organism. While extreme DO and diltiazem
levels can cause impacts to fish survival, 7 d chronic growth effects were far more
sensitive than mortality.
Long term low dose effects of DO have been broadly reported in the literature and
particularly used to derive national ambient WQC guidelines. Short and long-term growth
studies have been extensively conducted in cold water (salmonid) teleosts with fewer
conducted in warm water (non-salmonid) species (Saari et al., 2018). The P. promelas
chronic growth LOEC (4.3 mg DO/L) in the present study is comparable to the reduced
growth EC10 for juvenile largemouth bass (4.4 mg DO/L) (JRB, 1984; Saari et al., 2018).

107
Non-salmonid or warm freshwater fish laboratory and field studies reviewed in the
development of the U.S. Ambient WQC for Dissolved Oxygen concluded fish production
to be moderately impaired at 4.0 mg DO/L (U.S., 1986). DO dependent decreases in
growth have been observed in many species such as plaice (Pleuronectes platessa), dab
(Limanada limanada) (Petersen and Pihl, 1995), Atlantic cod (Gadus morhua) (Chabot
and DUTIL, 1999), sockeye salmon (Oncorhynchus nerka) (Brett and Blackburn, 1981),
northern pike (Esox lucius) (Adelman and Smith, 1970), largemouth bass (Micropterus
salmoides) (Brake, 1972; Stewart et al., 1967), coho salmon (Oncorhynchus kisutch)
(Brett and Blackburn, 1981; Herrmann et al., 1962), channel catfish (Ictalurus punctatus)
and yellow perch (Perca flavescens) (Carlson et al., 1980); however, the interactive
effects of DO x chemical on growth and across other levels of biological organization are
poorly understood .
Interactive DO x diltiazem chronic studies indicated significant DO influences on
fish growth and heart rate. Chronic growth decreases measured in DO studies were
replicated in interactive experiments and similar significant reductions in growth at
moderate and low DO treatments were measured only in diltiazem controls. The effects
of diltiazem on larval fish growth were not dependent on the DO level. Again, survival
was the most sensitive endpoint measured across acute DO x diltiazem studies, and
similarly significant interactive effects on survival were observed at low DO and the
highest diltiazem treatment level. Percent survival under normal DO levels throughout
chronic interactive exposures were 100% even up to 2215-2348 μg/L diltiazem. Very few
chronic fish studies with early life stages have focused on the growth effects of CCBs. A
study by Steinbach et al (2013) observed no significant effects of verapamil in common

108
carp following 31 day exposure at 0.463-463 μg/L. Conversely, Overturf et al. (2012)
reported 28 day chronic exposure to 600 μg/L verapamil significantly decreased larval
fathead minnow growth rate (Overturf et al., 2012).
Diltiazem, a benzothiazepine, and verapamil, a phenylalkylamine, belong to the
group of CCBs highly prescribed to treat angina, hypertension, and arrhythmia (Romero
et al., 2003). Both diltiazem and verapamil have small bioconcentration potentials but of
the two the physiochemical properties of verapamil relative to diltiazem would predict
higher bioaccumulation potentials with a higher log P (4.2 and 2.8, respectively). Thus,
diltiazem and verapamil bioconcentration factors (BCF) from laboratory studies range
between 0.5-194 (Steinbach et al., 2016b) and 0.7-75 (Nallani et al., 2016; Steinbach et
al., 2013), respectively in various fish tissues. Whether hypoxia increased CCB
bioconcentration is not known. Internal fish plasma modeling predicts the hazard of
biologically active pharmaceuticals in fish based on the conservation of drug targets
between mammalian and teleost species (Brooks, 2014; Fick et al., 2010b; Gunnarsson et
al., 2008; Huggett et al., 2003). Internal fish plasma levels of diltiazem have been
reported approaching and even exceeding human therapeutic levels (Fick et al., 2010a;
Scott et al., 2016; Tanoue et al., 2015). Several compounds have linked internal fish
tissue concentrations to specific pharmacological effects (e.g. antidepressants, steroids,
anxiolytics, and nonsteroidal anti-inflammatory) (Cuklev et al., 2011; Huerta et al., 2016;
Margiotta-Casaluci et al., 2014; Patel et al., 2016; Runnalls et al., 2015; Valenti et al.,
2012), while others lack sufficient data necessary to validate fish plasma modeling and
read-across approaches (Rand-Weaver et al., 2013).

109
Other non-traditional sublethal endpoints (e.g. heart rate, locomotor activity,
enzyme activity) predictive of adverse effects to toxicants have also been reported (U.S.
EPA, 2002b). In the present study, heart rates displayed a dose-dependent trend in acute
DO x diltiazem studies at normal and moderate DO levels similar to previous CCB
studies with verapamil (Steinbach et al., 2013). Conversely, nonmonotonic trends in 7
day DO x diltiazem exposures were observed with significant decreases in heart rate at
2215-2348 μg/L diltiazem across all three interactive DO treatment levels and significant
increases observed at 259-277 μg/L at normal and moderate DO. Decreasing heart rates
are consistent with the pharmacological action of diltiazem. Studies with other CCBs in
larval zebrafish have shown reduced heart rate following exposure to mg/L verapamil
concentrations and thus demonstrate a pharmacological effect in fish. Similar effects
were seen in 4 dpf zebrafish following exposure to verapamil resulting in decreased heart
rate, surrogate stroke volumes and even cessation of blood flow at higher concentrations
(Parker et al., 2014). Steinbach et al (2016a) demonstrated histological changes in the
heart and blood vessels of rainbow trout livers suggesting vasodilation following long-
term μg/L diltiazem concentrations (Steinbach et al., 2016a). Vasodilation can lead to
reflex tachycardia triggered by the sympathetic nervous system in mammals to re-
establish normal blood pressure (Scholz, 1997). Whether increased heart rates observed
in separate chronic DO x diltiazem exposures at 259-277 μg/L at normal and moderate
DO levels represent tachycardia is unknown. Diltiazem represents an intermediate
vasodilator and cardio depressant in humans and while the drug target is relatively
conserved its complete function in fish is understudied (Gunnarsson et al., 2008;
Rottbauer et al., 2001). Using the ECOdrug (http://www.ecodrug.org/) database, the

110
diltiazem drug target (voltage-dependent calcium channel L-type α-1C, α-1D, α-1F, α-1s
subunits) is predicted to be 70.4-78.3% and 64.1-81.1% conserved in zebrafish (Danio
rerio) and Japanese medaka (Oryzias latipes), respectively (Gunnarsson et al., 2008;
Verbruggen et al., 2017). Thus, pharmacological responses in fish referenced above can
be expected. Additional research with non-traditional regulatory endpoints relevant to the
biological activity of pharmaceuticals is necessary to advance ecotoxicological read-
across models with highly conserved fish drug targets.
Fish behavior relative to other standardized toxicity metrics can be a sensitive
indicator of chemical exposure in which effects often occur at lower concentrations
(Little and Finger, 1990; Melvin and Wilson, 2013). Therefore, PLR behavior following
acute and chronic exposures were measured to detect potential alterations in behavior.
The use of zebrafish as a model system for developmental, biomedical, and toxicological
research has spurred the need to understand their behavior and have been the typical
model organism studied (MacPhail et al., 2009). P. promelas, on the other hand, have
been typically used by U.S. regulatory agencies focused on survival and growth
endpoints but recent studies have begun to investigate their behavioral sensitivity
following contaminant exposures) (Colón-Cruz et al., 2018; Steele et al., 2018). Colon-
Ruiz et al. (2018) demonstrated naive 6 dpf fathead minnows, similarly used in our study,
displayed high activity in the light compared to the dark following observations of their
photo-dependent swimming activity. This general light:dark behavior was identical to
that observed in our acute studies and similarly identified for fathead minnows by Steele
et al. (2018) following acute 96 h behavior toxicity studies. In contrast, larval zebrafish,
display high activity in the dark than light and with less variability (Kristofco et al., 2016;

111
MacPhail et al., 2009). Remarkably, the present study demonstrates naïve 7 dph (11 dpf)
fathead minnow behavior changes and mimics the light:dark photo-dependent behavior in
zebrafish. The cause of this behavioral change in fathead minnow with development is
unclear but may be related to an early life stage lack of innervation leading to minimal
light:dark sensory perception and/or circadian rhythm (Farrell, 2011). The light:dark
activity preference of 7 dph fish is consistent with adult fathead minnow behavior
reported by Valenti et al (2012). In the Valenti et al (2012) study, adult male fathead
minnow shelter-seeking behavior similarly demonstrated movement preferences in the
dark versus the light in which sertraline increased light cruising activity consistent with
its human therapeutic effect (Valenti et al., 2012).
Behavioral observations in both acute and chronic experiments displayed a
general decrease in activity. Acute behavior following DO exposure tended to decrease
larval activity in both the light and dark, although few observations were statistically
significant. Fish activity under minimal DO conditions varies depending on
developmental stage, species-specific strategies to increase oxygen uptake, and metabolic
tolerance (Chapman and McKenzie, 2009; Pelster, 2002; Wu, 2002). If mechanisms to
increase oxygen uptake and/or avoid hypoxia fail, reductions in activity are typically used
to conserve energy (Chapman and McKenzie, 2009; Richards, 2009). In the present
study, acute DO exposure behavior is generally consistent with the aforementioned trend
and were reproducible as observed in DO x diltiazem studies. Consistent patterns from
chronic behavior measurements following DO and diltiazem exposures were difficult to
determine. Regardless, both DO and diltiazem chronic observations demonstrated
decreasing trends and/or significant decreases in bursting distance traveled, number of

112
movements (counts), and duration per minute. Bursting activity, on average, comprises <
1.0 second/minute of their activity in which fish travel 1-3 mm/minute, which is divided
into 2-10 individual movements (greater activity in dark than light). Whether decreases in
the above mentioned activity demonstrates physiological or ecological adverse outcomes
deserves additional attention, but decreases in spontaneous swimming activity at minimal
DO concentrations is consistent with previously published literature (Chapman and
McKenzie, 2009; Domenici et al., 2013). Again, this type of decreased activity merits
additional study, especially when Robb and Abrahams (Robb and Abrahams, 2002)
reported fathead minnow feeding response in the presence of a predator (yellow perch)
were reduced under non-lethal hypoxic versus normoxic conditions.
The present study also investigated whether THV concentrations of diltiazem
exhibited toxicological or pharmacological effects in larval fish following acute and
chronic exposures. The THV describes the water concentration predicted to
bioconcentrate in fish plasma to an equivalent human therapeutic level (Berninger et al.,
2011; Brooks, 2014). In acute and chronic studies containing the diltiazem THV, no
significant effects were observed across acute or chronic exposure endpoints except
behavior. Both 48 h and 7 day studies, significant decreases and decreasing trends in
number of movements (counts), distance traveled, and duration across both light and dark
conditions were observed. Kristofco et al [43] observed the antihistamine
diphenhydramine (DPH) significantly decreased distance traveled below THV
concentrations (18.6 μg/L at pH 7) across specific larval zebrafish development stages. It
is not clear why larval fish behavioral responses below THVs are markedly more
sensitive than other toxicological endpoints. Feeding behavior has also been shown to

113
decrease following chronic DPH exposure below its THV (Berninger et al., 2011), and as
introduced above Valenti et al (2012) observed significant increases in adult fathead
minnow light activity well below other standard ecotoxicological endpoints and above
human therapeutic plasma levels (Valenti et al., 2012). Although internal diltiazem
plasma concentrations of fish larvae could not be measured in the current study, literature
associating pharmaceutical tissue concentrations to relevant human therapeutic effects is
growing. As previously mentioned, the effects of low dose pharmaceutical exposure have
been linked to sublethal non-standard pharmacological endpoints with numerous
compounds (e.g. antidepressants, steroids) (Cuklev et al., 2011; Huerta et al., 2016;
Margiotta-Casaluci et al., 2014; Patel et al., 2016; Runnalls et al., 2015; Valenti et al.,
2012). These effects have been shown to be pH-dependent, another abiotic factor, in
which uptake and toxicity has been shown to increase with increasing pH related to the
non-ionized chemical species (Berninger et al., 2011; Nichols et al., 2015; Valenti et al.,
2009).
Diltiazem uptake into the gulf killifish (Fundulus grandis) has similarly been
demonstrated to be pH-dependent (Scott et al. unpublished data) with rapid gill uptake
occurring within hours. Bioconcentration and metabolism of diltiazem in juvenile
rainbow trout indicated the highest and lowest accumulated doses were in the kidney and
plasma, respectively (Steinbach et al., 2016b). The calculated half-life for diltiazem
across whole body tissues analyzed ranged from 1.5 h (liver) to 49 h (muscle) [33]. In the
same and follow up studies, 17 phase I diltiazem metabolites were detected in rainbow
trout (Koba et al., 2016; Steinbach et al., 2016b). In humans, diltiazem has three main
metabolites that are produced by phase I cytochrome p450 enzymes (CYP) 3A4 and 2D6

114
among others (Law et al., 2013; Wishart et al., 2006). Hypoxia has been shown to inhibit
CYP activity (e.g. CYP1A) in multiple fish (Fleming and Di Giulio, 2011; Rahman and
Thomas, 2012) and mammalian model species (Fradette et al., 2007; Fradette and Souich,
2004). The toxicokinetic effects of hypoxia were not investigated in this study but
deserve future research to understand potential influences on internal pharmaceutical
bioavailability, clearance, and ensuing potential affects in fish.
Though acute and chronic survival were the most sensitive endpoints in the
present study, the long term low dose effects of diltiazem are yet to be understood.
Similar pharmacological effects in fish have been observed following diltiazem or other
CCB exposures illustrating conservation of CCB drug targets exists between mammals
and telesosts (Berghmans et al., 2008; Li et al., 2011; Steinbach et al., 2016a; Steinbach
et al., 2013; Verbruggen et al., 2017). Saari et al (2017) recently performed a global
hazard assessment of CCB in multiple environmental matrices to predict their
concentration across geographic regions. Environmental exposure distribution 5th and
95th centiles for all CCBs were 5.0 and 448.7 ng/L in effluent and 1.3 and 202.3 ng/L in
freshwater, respectively (Saari et al., 2017). Furthermore, based on the publicly reported
diltiazem fish plasma concentrations from freshwater and marine systems, the human
minimum therapeutic plasma level (Cmin = 30 ng/mL) was shown to be exceeded 17% of
the time. The full pharmacological and toxicological effects of diltiazem to aquatic
organisms, particularly in adult fish, in environmental matrices is unknown. While
several studies have reported the effects of CCBs and other heart medications (e.g. β-
blockers), additional research is necessary especially with co-exposures involving other
pharmaceuticals and stressors.

115
Human population growth and climate-induced physical habitat changes are
altering the physical, chemical, and biological characteristics of aquatic ecosystems
(Hartmann et al., 2013; Staudt et al., 2013). Global hypoxic occurrences in marine and
freshwater ecosystems introduce physiological constrains on fish populations (Breitburg
et al., 2018; Pörtner and Farrell, 2008; Pörtner and Knust, 2007; Whitney et al., 2016). In
the United States WQC are established to protect surface waters and their designated
uses, which include aquatic life. Recently published articles have demonstrated surface
water DO thresholds affecting organism growth and survival above the typical hypoxic
threshold (e.g. 2.0 mg DO/L) (Elshout et al., 2013; Saari et al., 2018; Vaquer-Sunyer and
Duarte, 2008). The DO concentrations used in the present study demonstrate typical high
aquatic life use WQC in the State of Texas, USA for streams and reservoirs which are
consistently impaired due to noncompliance of DO regulatory standards (Saari et al.,
2018). Multiple nonchemical and chemical stressors interacting in these aquatic systems
represent uncertainties to water quality assessments and thus ecosystem protection goals.
The present study evaluated the impacts of two common stressors in fish which represent
natural field conditions in urbanized surface waters throughout the world (Saari et al.,
2017).
ACKNOWLEDGMENTS
This research was supported by a U.S. Environmental Protection Agency STAR
Fellowship (FP-91767201-0) and the C. Gus Glasscock Jr. Endowed Fund for Excellence
in Environmental Sciences to GNS. Additional support was provided by the U.S.
National Science Foundation (CHE-1339637) and the U.S. Environmental Protection

116
Agency to BWB through the Molecular Design Research Network (modrn.yale.edu), and
the Department of Environmental Science and Center for Reservoir and Aquatic Systems
Research at Baylor University.
REFERENCES
Adelman I and Smith L (1970) Effect of oxygen on growth and food conversion
efficiency of northern pike. Progressive Fish-Culturist 32:93-96. American Public Health Association, et al (1989) Standard Methods for the Examination
of Water and Wastewater, American Public Health Association, Washington, D.C.
Bean TG, Rattner BA, Lazarus RS, Day DD, Burket SR, Brooks BW, Haddad SP and Bowerman WW (2018) Pharmaceuticals in water, fish and osprey nestlings in Delaware River and Bay. Environ Pollut 232:533-545.
Berghmans S, Butler P, Goldsmith P, Waldron G, Gardner I, Golder Z, Richards FM, Kimber G, Roach A, Alderton W and Fleming A (2008) Zebrafish based assays for the assessment of cardiac, visual and gut function — potential safety screens for early drug discovery. J Pharmacol Toxicol Methods 58:59-68.
Berninger JP, Du B, Connors KA, Eytcheson SA, Kolkmeier MA, Prosser KN, Valenti TW, Chambliss CK and Brooks BW (2011) Effects of the antihistamine diphenhydramine on selected aquatic organisms. Environ Toxicol Chem 30:2065-2072.
Blewett TA, Robertson LM, MacLatchy DL and Wood CM (2013) Impact of environmental oxygen, exercise, salinity, and metabolic rate on the uptake and tissue-specific distribution of 17α-ethynylestradiol in the euryhaline teleost Fundulus heteroclitus. Aquat Toxicol 138:43-51.
Boxall ABA, Rudd MA, Brooks BW, Caldwell DJ, Choi K, Hickmann S, Innes E, Ostapyk K, Staveley JP, Verslycke T, Ankley GT, Beazley KF, Belanger SE, Berninger JP, Carriquiriborde P, Coors A, DeLeo PC, Dyer SD, Ericson JF, Gagne F, Giesy JP, Gouin T, Hallstrom L, Karlsson MV, Joakim Larsson DG, Lazorchak JM, Mastrocco F, McLaughlin A, McMaster ME, Meyerhoff RD, Moore R, Parrott JL, Snape JR, Murray-Smith R, Servos MR, Sibley PK, Straub JO, Szabo ND, Topp E, Tetreault GR, Trudeau VL and Van Der Kraak G (2012) Pharmaceuticals and personal care products in the environment: What are the big questions? Environ Health Perspect 120:1221-1229.
Brake L (1972) Influence of dissolved oxygen and temperature on the growth of a juvenile largemouth bass held in artificial ponds, p 45 p, Oregon State University, Oregon State University, Corvallis.
Breitburg D (2002) Effects of hypoxia, and the balance between hypoxia and enrichment, on coastal fishes and fisheries. Estuaries 25:767-781.

117
Breitburg D, Levin LA, Oschlies A, Grégoire M, Chavez FP, Conley DJ, Garçon V, Gilbert D, Gutiérrez D, Isensee K, Jacinto GS, Limburg KE, Montes I, Naqvi SWA, Pitcher GC, Rabalais NN, Roman MR, Rose KA, Seibel BA, Telszewski M, Yasuhara M and Zhang J (2018) Declining oxygen in the global ocean and coastal waters. Science 359.
Brett J and Blackburn J (1981) Oxygen requirements for growth of your coho salmon (Orconhynchus kisutch) and sockey (O. nerka) salmon at 15 degrees Celsius. Can J Fish Aquat Sci 38:399-404.
Brooks B, Scott JT, Margaret GF, Theodore WV, Jacob KS, Robert DD, Kirk ED, Jim P, Randy MP, Ritchie DT and Larry K (2008) Reservoir Zonation and Water Quality. Lakeline 39.
Brooks BW (2014) Fish on Prozac (and Zoloft): ten years later. Aquat Toxicol 151:61-67. Brooks BW, Riley TM and Taylor RD (2006) Water quality of effluent-dominated
ecosystems: Ecotoxicological, hydrological, and management considerations. Hydrobiologia 556:365-379.
Carlson A, Blocker J and Herman L (1980) Growth and survival of channel catfish and yellow perch exposed to lowered constant and diurnally fluctuating dissolved oxygen concentrations. Progressive Fish-Culturist 42:73-78.
Carlson AR (1987) Effects of lowered dissolved oxygen concentration on the toxicity of 1, 2, 4-trichlorobenzene to fathead minnows. Environ Contam Toxicol 38:667-673.
Center for Reservoir and Aquatic Systems Research (2006) Conceptual Approach for Characterizing Reservoir Transitional Areas (RTSs). Transition Zone Index Development and Validation Project. Work Order No. 582-4-65584-03 Task #2. Center for Reservoir and Aquatic Systems Research, Waco, Texas, USA.
Chabot D and DUTIL JD (1999) Reduced growth of Atlantic cod in non lethal hypoxic conditions. J Fish Biol 55:472-491.
Chapman LJ and McKenzie DJ (2009) Chapter 2 Behavioral Responses and Ecological Consequences, in Fish Physiology (Richards JG, Farrell AP and Brauner CJ eds) pp 25-77, Academic Press.
Colón-Cruz L, Kristofco L, Crooke-Rosado J, Acevedo A, Torrado A, Brooks BW, Sosa MA and Behra M (2018) Alterations of larval photo-dependent swimming responses (PDR): New endpoints for rapid and diagnostic screening of aquatic contamination. Ecotoxicol Environ Saf 147:670-680.
Connors KA, Du B, Fitzsimmons PN, Hoffman AD, Chambliss CK, Nichols JW and Brooks BW (2013) Comparative pharmaceutical metabolism by rainbow trout (Oncorhynchus mykiss) liver S9 fractions. Environ Toxicol Chem 32:1810-1818.
Cuklev F, Kristiansson E, Fick J, Asker N, Förlin L and Larsson DJ (2011) Diclofenac in fish: Blood plasma levels similar to human therapeutic levels affect global hepatic gene expression. Environ Toxicol Chem 30:2126-2134.
Cypher AD, Ickes JR and Bagatto B (2015) Bisphenol A alters the cardiovascular response to hypoxia in Danio rerio embryos. Comp Biochem Phys C 174-175:39-45.
Dasgupta S, Huang IJ and McElroy AE (2015) Hypoxia enhances the toxicity of Corexit EC9500A and chemically dispersed Southern Louisiana Sweet Crude Oil (MC-242) to sheepshead minnow (Cyprinodon variegatus) larvae. PLoS ONE 10.

118
Daughton CG and Ternes TA (1999) Pharmaceuticals and personal care products in the environment: agents of subtle change? Environ Health Perspect 107:907.
Domenici P, Herbert N, Lefrançois C, Steffensen JF and McKenzie D (2013) The effect of hypoxia on fish swimming performance and behaviour, in Swimming physiology of fish pp 129-159, Springer.
Du B, Haddad SP, Luek A, Scott WC, Saari GN, Kristofco LA, Connors KA, Rash C, Rasmussen JB and Chambliss CK (2014) Bioaccumulation and trophic dilution of human pharmaceuticals across trophic positions of an effluent-dependent wadeable stream. Philos Trans R Soc Lond B 369:20140058.
Du B, Haddad SP, Scott WC, Chambliss CK and Brooks BW (2015) Pharmaceutical bioaccumulation by periphyton and snails in an effluent-dependent stream during an extreme drought. Chemosphere 119:927-934.
Elshout P, Dionisio Pires L, Leuven R, Wendelaar Bonga S and Hendriks A (2013) Low oxygen tolerance of different life stages of temperate freshwater fish species. J Fish Biol 83:190-206.
Farrell AP (2011) Encyclopedia of fish physiology: from genome to environment, Academic Press.
Fick J, Lindberg RH, Parkkonen J, Arvidsson Br, Tysklind M and Larsson DJ (2010a) Therapeutic levels of levonorgestrel detected in blood plasma of fish: results from screening rainbow trout exposed to treated sewage effluents. Environ Sci Technol 44:2661-2666.
Fick J, Lindberg RH, Tysklind M and Larsson DGJ (2010b) Predicted critical environmental concentrations for 500 pharmaceuticals. Regul Toxicol Pharmacol 58:516-523.
Finn J, Hui M, Li V, Lorenzi V, de la Paz N, Cheng SH, Lai-Chan L and Schlenk D (2012) Effects of propranolol on heart rate and development in Japanese medaka (Oryzias latipes) and zebrafish (Danio rerio). Aquat Toxicol 122:214-221.
Fitzgerald JA, Jameson HM, Dewar Fowler VH, Bond GL, Bickley LK, Uren Webster TM, Bury NR, Wilson RJ and Santos EM (2016) Hypoxia suppressed copper toxicity during early development in zebrafish embryos in a process mediated by the activation of the HIF signalling pathway. Environ Sci Technol 50:4502-4512.
Fitzsimmons PN, Fernandez JD, Hoffman AD, Butterworth BC and Nichols JW (2001) Branchial elimination of superhydrophobic organic compounds by rainbow trout (Oncorhynchus mykiss). Aquat Toxicol 55:23-34.
Fleming CR and Di Giulio RT (2011) The role of CYP1A inhibition in the embryotoxic interactions between hypoxia and polycyclic aromatic hydrocarbons (PAHs) and PAH mixtures in zebrafish (Danio rerio). Ecotoxicology 20:1300-1314.
Fradette C, Batonga J, Teng S, Piquette-Miller M and du Souich P (2007) Animal models of acute moderate hypoxia are associated with a down-regulation of CYP1A1, 1A2, 2B4, 2C5, and 2C16 and up-regulation of CYP3A6 and P-glycoprotein in liver. Drug Metab Dispos 35:765-771.
Fradette C and Souich Pd (2004) Effect of hypoxia on cytochrome P450 activity and expression. Curr Drug Metab 5:257-271.
Gunnarsson L, Jauhiainen A, Kristiansson E, Nerman O and Larsson DGJ (2008) Evolutionary conservation of human drug targets in organisms used for environmental risk assessments. Environ Sci Technol 42:5807-5813.

119
Haggard BE, Stanley EH and Storm DE (2005) Nutrient retention in a point-source-enriched stream. J N Amer Benthol Soc 24:29-47.
Hartmann DL, Tank AMK, Rusticucci M, Alexander LV, Brönnimann S, Charabi YAR, Dentener FJ, Dlugokencky EJ, Easterling DR and Kaplan A (2013) Observations: atmosphere and surface, in Climate Change 2013 the Physical Science Basis: Working Group I Contribution to the Fifth Assessment Report of the Intergovernmental Panel on Climate Change, Cambridge University Press.
Hattlink J, De Boeck G and Blust R (2005) The toxicokinetics of cadmium in carp under normoxic and hypoxic conditions. Aquat Toxicol 75:1-15.
Herrmann J, Warren C and Doudoroff P (1962) Influence of oxygen concentration on the growth of juveline coho salmon. Trans Am Fish Soc 91:155-167.
Ho DH and Burggren WW (2012) Parental hypoxic exposure confers offspring hypoxia resistance in zebrafish (Danio rerio). J Exp Biol 215:4208-4216.
Huerta B, Margiotta Casaluci L, Rodríguez Mozaz S, Scholze M, Winter MJ, Barceló D and Sumpter JP (2016) Anti anxiety drugs and fish behaviour: Establishing the link between internal concentrations of oxazepam and behavioural effects. Environ Toxicol and Chem 35:2782-2790.
Huggett DB, Cook JC, Ericson JF and Williams RT (2003) A theoretical model for utilizing mammalian pharmacology and safety data to prioritize potential impacts of human pharmaceuticals to fish. Hum Ecol Risk Assess 9:1789-1799.
JRB Associates (1984) Analysis of dada relating dissolved oxygen and fish growth. Work Assignment 85. JRB Project No. 2-813-03-852-85. JRB Associates, McLean, Virginia.
Kim Y (2007) Aquatic toxicity of acetaminophen, carbamazepine, cimetidine, diltiazem and six major sulfonamides, and their potential ecological risks in Korea. Environ Int 33:370; 370-375; 375.
Koba O, Steinbach C, Kroupová HK, Grabicová K, Randák T and Grabic R (2016) Investigation of diltiazem metabolism in fish using a hybrid quadrupole/orbital trap mass spectrometer. Rapid Commun Mass Sp 30:1153-1162.
Kolpin DW, Furlong ET, Meyer MT, Thurman EM, Zaugg SD, Barber LB and Buxton HT (2002) Pharmaceuticals, hormones, and other organic wastewater contaminants in US streams, 1999-2000: A national reconnaissance. Environ Sci Technol 36:1202-1211.
Kristofco LA, Cruz LC, Haddad SP, Behra ML, Chambliss CK and Brooks BW (2016) Age matters: Developmental stage of Danio rerio larvae influences photomotor response thresholds to diazinion or diphenhydramine. Aquat Toxicol 170:344-354.
Landman MJ, Van Den Heuvel MR and Ling N (2005) Relative sensitivities of common freshwater fish and invertebrates to acute hypoxia. N Z J Mar Freshw Res 39:1061-1067.
Law V, Knox C, Djoumbou Y, Jewison T, Guo AC, Liu Y, Maciejewski A, Arndt D, Wilson M and Neveu V (2013) DrugBank 4.0: shedding new light on drug metabolism. Nucleic Acids Res 42:D1091-D1097.
Lazarus RS, Rattner BA, Brooks BW, Du B, McGowan PC, Blazer VS and Ottinger MA (2015) Exposure and food web transfer of pharmaceuticals in ospreys (Pandion haliaetus): Predictive model and empirical data. Integr Enviro Assess Manage 11:118-129.

120
Li Z-H, Li P and Randak T (2010) Ecotoxocological effects of short-term exposure to a human pharmaceutical Verapamil in juvenile rainbow trout (Oncorhynchus mykiss). Comp Biochem Phys C 152:385-391.
Li Z-H, Velisek J, Zlabek V, Grabic R, Machova J, Kolarova J, Li P and Randak T (2011) Chronic toxicity of verapamil on juvenile rainbow trout (Oncorhynchus mykiss): Effects on morphological indices, hematological parameters and antioxidant responses. J Hazard Mater 185:870-880.
Little EE and Finger SE (1990) Swimming behavior as an indicator of sublethal toxicity in fish. Environ Toxicol Chem 9:13-19.
Lyu K, Cao H, Chen R, Wang Q and Yang Z (2013) Combined effects of hypoxia and ammonia to Daphnia similis estimated with life-history traits. Environ Sci Pollut R 20:5379-5387.
MacPhail RC, Brooks J, Hunter DL, Padnos B, Irons TD and Padilla S (2009) Locomotion in larval zebrafish: Influence of time of day, lighting and ethanol. NeuroToxicology 30:52-58.
Margiotta-Casaluci L, Owen SF, Cumming RI, de Polo A, Winter MJ, Panter GH, Rand-Weaver M and Sumpter JP (2014) Quantitative cross-species extrapolation between humans and fish: the case of the anti-depressant fluoxetine. PloS ONE 9:e110467.
Matson CW, Timme-Laragy AR and Di Giulio RT (2008) Fluoranthene, but not benzo [a] pyrene, interacts with hypoxia resulting in pericardial effusion and lordosis in developing zebrafish. Chemosphere 74:149-154.
McKim JM and Goeden HM (1982) A direct measure of the uptake efficiency of a xenobiotic chemical across the gills of brook trout (Salvelinus fontinalis) under normoxic and hypoxic conditions. Comp Biochem Phys C 72:65-74.
Melvin SD and Wilson SP (2013). The utility of behavioral studies for aquatic toxicology testing: A meta-analysis. Chemosphere 93:2217-2223.
Metcalfe CD, Miao XS, Koenig BG and Struger J (2003) Distribution of acidic and neutral drugs in surface waters near sewage treatment plants in the lower Great Lakes, Canada. Environ Toxicol Chem 22:2881-2889.
Nakamura Y, Yamamoto H, Sekizawa J, Kondo T, Hirai N and Tatarazako N (2008) The effects of pH on fluoxetine in Japanese medaka (Oryzias latipes): acute toxicity in fish larvae and bioaccumulation in juvenile fish. Chemosphere 70:865-873.
Nallani GC, Edziyie RE, Paulos PM, Venables BJ, Constantine LA and Huggett DB (2016) Bioconcentration of two basic pharmaceuticals, verapamil and clozapine, in fish. Environ Toxicol Chem 35:593-603.
Nebeker AV, Dominguez SE, Chapman GA, Onjukka ST and Stevens DG (1992) Effects of low dissolved oxygen on survival, growth and reproduction of Daphnia, Hyalella and Gammarus. Environ Toxicol Chem 11:373-379.
Nichols JW, Du B, Berninger JP, Connors KA, Chambliss CK, Erickson RJ, Hoffman AD and Brooks BW (2015) Observed and modeled effects of pH on bioconcentration of diphenhydramine, a weakly basic pharmaceutical, in fathead minnows. Environ Toxicol Chem 34:1425-1435.
Norberg TJ and Mount DI (1985) A new fathead minnow (Pimephales promelas) subchronic toxicity test. Environ Toxicol Chem 4:711-718.

121
Overturf M, Overturf C, Baxter D, Hala D, Constantine L, Venables B and Huggett D (2012) Early life-stage toxicity of eight pharmaceuticals to the fathead minnow, Pimephales promelas. Arch Environ Contam Toxicol 62:455-464.
Parker T, Libourel P-A, Hetheridge MJ, Cumming RI, Sutcliffe TP, Goonesinghe AC, Ball JS, Owen SF, Chomis Y and Winter MJ (2014) A multi-endpoint in vivo larval zebrafish (Danio rerio) model for the assessment of integrated cardiovascular function. J Pharmacol Toxicol 69:30-38.
Patel A, Panter GH, Trollope HT, Glennon YC, Owen SF, Sumpter JP and Rand-Weaver M (2016) Testing the “read-across hypothesis” by investigating the effects of ibuprofen on fish. Chemosphere 163:592-600.
Pelster B (2002) Developmental plasticity in the cardiovascular system of fish, with special reference to the zebrafish. Comp Biochem Phys A 133:547-553.
Petersen JK and Pihl L (1995) Responses to hypoxia of plaice, Pleuronectes platessa, and dab, Limanda limanda, in the south-east Kattegat: distribution and growth. Environ Biol Fish 43:311-321.
Pollock MS, Clarke LMJ and Dube MG (2007). The effects of hypoxia on fishes: from ecological relevance to physiological effects. Environ Rev 15:1-14.
Pörtner H-O (2010) Oxygen-and capacity-limitation of thermal tolerance: a matrix for integrating climate-related stressor effects in marine ecosystems. J Exp Biol 213:881-893.
Pörtner HO (2002) Climate variations and the physiological basis of temperature dependent biogeography: systemic to molecular hierarchy of thermal tolerance in animals. Comp Biochem Phys A 132:739-761.
Pörtner HO and Farrell AP (2008) Physiology and climate change. Science:690-692. Pörtner HO and Knust R (2007) Climate change affects marine fishes through the oxygen
limitation of thermal tolerance. Science 315:95-97. Prokkola JM, Nikinmaa M, Lubiana P, Kanerva M, McCairns RS and Götting M (2015)
Hypoxia and the pharmaceutical diclofenac influence the circadian responses of three-spined stickleback. Aquat Toxicol 158:116-124.
Rahman MS and Thomas P (2012) Effects of hypoxia exposure on hepatic cytochrome P450 1A (CYP1A) expression in Atlantic croaker: molecular mechanisms of CYP1A down-regulation. PloS ONE 7:e40825.
Rand-Weaver M, Margiotta-Casaluci L, Patel A, Panter GH, Owen SF and Sumpter JP (2013) The read-across hypothesis and environmental risk assessment of pharmaceuticals. Environ Sci Technol 47:11384-11395.
Richards JG (2009) Chapter 10 Metabolic and Molecular Responses of Fish to Hypoxia, in Fish Physiology (Jeffrey G. Richards APF and Colin JB eds) pp 443-485, Academic Press.
Robb T and Abrahams MV (2002) The influence of hypoxia on risk of predation and habitat choice by the fathead minnow, Pimephales promelas. Behav Ecol Sociobiol 52:25-30.
Romero M, Sanchez I and Pujol M (2003) New advances in the field of calcium channel antagonists: cardiovascular effects and structure-activity relationships. Current Medicinal Chemistry Cardiovascular and Hematological Agents 1:113-141.

122
Rottbauer W, Baker K, Wo ZG, Mohideen M-APK, Cantiello HF and Fishman MC (2001) Growth and Function of the Embryonic Heart Depend upon the Cardiac-Specific L-Type Calcium Channel α1 Subunit. Dev Cell 1:265-275.
Runnalls TJ, Beresford N, Kugathas S, Margiotta-Casaluci L, Scholze M, Scott AP and Sumpter JP (2015) From single chemicals to mixtures—Reproductive effects of levonorgestrel and ethinylestradiol on the fathead minnow. Aquat Toxicol 169:152-167.
Saari GN, Scott WC and Brooks BW (2017) Global assessment of calcium channel blockers in the environment: Review and analysis of occurrence, ecotoxicology and hazards in aquatic systems. Chemosphere 189:466-478.
Saari GN, Wang Z and Brooks BW (2018) Revisiting inland hypoxia: diverse exceedances of dissolved oxygen thresholds for freshwater aquatic life. Environ Sci Pollut Res 25:3139-3150.
Scholz H (1997) Pharmacological aspects of calcium channel blockers. Cardiovasc Drugs Ther 10:869-872.
Schulz M, Iwersen-Bergmann S, Andresen H and Schmoldt A (2012) Therapeutic and toxic blood concentrations of nearly 1,000 drugs and other xenobiotics. Crit Care 16:R136.
Scott WC, Du B, Haddad SP, Breed CS, Saari GN, Kelly M, Broach L, Chambliss CK and Brooks BW (2016) Predicted and Observed Therapeutic Dose Exceedences of Ionizable Pharmaceuticals in Fish Plasma from Urban Coastal Systems. Environ Toxicol Chem 35:983-995.
Stanley JK, Ramirez AJ, Chambliss CK and Brooks BW (2007) Enantiospecific sublethal effects of the antidepressant fluoxetine to a model aquatic vertebrate and invertebrate. Chemosphere 69:9-16.
Staudt A, Leidner AK, Howard J, Brauman KA, Dukes JS, Hansen LJ, Paukert C, Sabo J and Solórzano LA (2013) The added complications of climate change: understanding and managing biodiversity and ecosystems. Front Ecol Environ 11:494-501.
Steele WB, Kristofco LA, Corrales J, Saari GN, Haddad SP, Gallagher EP, Kavanagh TJ, Kostal J, Zimmerman JB, Voutchkova-Kostal A, Anastas P and Brooks BW (2018b) Comparative behavioral toxicology with two common larval fish models: Exploring relationships among modes of action and locomotor responses. Sci Total Environ 640–641:1587-1600.
Steinbach C, Burkina V, Schmidt-Posthaus H, Stara A, Kolarova J, Velisek J, Randak T and Kroupova HK (2016a) Effect of the human therapeutic drug diltiazem on the haematological parameters, histology and selected enzymatic activities of rainbow trout Oncorhynchus mykiss. Chemosphere 157:57-64.
Steinbach C, Fedorova G, Prokes M, Grabicova K, Machova J, Grabic R, Valentova O and Kroupova HK (2013) Toxic effects, bioconcentration and depuration of verapamil in the early life stages of common carp (Cyprinus carpio L.). Sci Total Environ 461:198-206.
Steinbach C, Grabic R, Fedorova G, Koba O, Golovko O, Grabicova K and Kroupova HK (2016b) Bioconcentration, metabolism and half-life time of the human therapeutic drug diltiazem in rainbow trout Oncorhynchus mykiss. Chemosphere 144:154-159.

123
Stewart N, Shumway D and Doudoroff P (1967) Influence of oxygen concentration on the growth of juvenile largemouth bass. J Fish Res Board Can 24:475-494.
Tanoue R, Nomiyama K, Nakamura H, Kim JW, Isobe T, Shinohara R, Kunisue T and Tanabe S (2015) Uptake and tissue distribution of pharmaceuticals and personal care products in wild fish from treated-wastewater-impacted streams. Environ Sci Technol 49:11649-11658.
Taylor RD (2002) Water Quality Aspects of an Intermittent Stream and Backwaters in an Urban North Texas Watershed: Pecan Creek, Denton County, Texas, University of North Texas.
U.S. Environmental Protection Agency (1986) Ambient Water Quality Criteria for Dissolved Oxygen, Office of Water Regulations and Standards Criteria and Standards Division. EPA-440/5-86-003, Washington, D.C.
U.S. Environmental Protection Agency (2002a) Methods for measuring acute toxicity of effluents and receiving waters to freshwater and marine organisms, Office of Research and Development. EPA-821-R-02-012, Washington, D.C.
U.S. Environmental Protection Agency (2002b) Short-term methods for estimating the chronic toxicity of effluents and receiving waters to freshwater organisms, Office of Research and Development. EPA-821-R-02-013, Washington, D.C.
Valenti TW, Gould GG, Berninger JP, Connors KA, Keele NB, Prosser KN and Brooks BW (2012) Human therapeutic plasma levels of the selective serotonin reuptake inhibitor (SSRI) sertraline decrease serotonin reuptake transporter binding and shelter-seeking behavior in adult male fathead minnows. Environ Sci Technol 46:2427-2435.
Valenti TW, Perez-Hurtado P, Chambliss CK and Brooks BW (2009) Aquatic toxicity of sertraline to Pimephales promelas at environmentally relevant surface water pH. Environ Toxicol Chem 28:2685-2694.
Vaquer-Sunyer R and Duarte CM (2008) Thresholds of hypoxia for marine biodiversity. P Natl Acad Sci USA 105:15452-15457.
Verbruggen B, Gunnarsson L, Kristiansson E, Österlund T, Owen SF, Snape JR and Tyler CR (2017) ECOdrug: a database connecting drugs and conservation of their targets across species. Nucleic Acids Res 46:D930-D936.
Waiser MJ, Tumber V and Holm J (2011) Effluent-dominated streams. Part 1: Presence and effects of excess nitrogen and phosphorus in Wascana Creek, Saskatchewan, Canada. Environ Toxicol Chem 30:496-507.
Watson SB, Miller C, Arhonditsis G, Boyer GL, Carmichael W, Charlton MN, Confesor R, Depew DC, Höök TO, Ludsin SA, Matisoff G, McElmurry SP, Murray MW, Peter Richards R, Rao YR, Steffen MM and Wilhelm SW (2016) The re-eutrophication of Lake Erie: Harmful algal blooms and hypoxia. Harmful Algae 56:44-66.
Whitney JE, Al-Chokhachy R, Bunnell DB, Caldwell CA, Cooke SJ, Eliason EJ, Rogers M, Lynch AJ and Paukert CP (2016) Physiological Basis of Climate Change Impacts on North American Inland Fishes. Fisheries 41:332-345.
Wishart DS, Knox C, Guo AC, Shrivastava S, Hassanali M, Stothard P, Chang Z and Woolsey J (2006) DrugBank: a comprehensive resource for in silico drug discovery and exploration. Nucleic Acids Res 34:D668-D672.

124
Wu RSS (2002) Hypoxia: from molecular responses to ecosystem responses. Mar Pollut Bull 45:35-45.
Yang R, Brauner C, Thurston V, Neuman J and Randall DJ (2000) Relationship between toxicant transfer kinetic processes and fish oxygen consumption. Aquat Toxicol 48:95-108.
Zhou B, Randall D, Lam P, Ip Y and Chew S (2000) Metabolic adjustments in the common carp during prolonged hypoxia. J Fish Biol 57:1160-1171.

125
CHAPTER FIVE
Low Dissolved Oxygen Increases Uptake of a Model Calcium Channel Blocker By its Effects on Adult Pimephales promelas
Abstract
Human population growth accompanied with urbanization has created an urban
water cycle where surface waters in some regions are dominated or dependent on
wastewater treatment plant discharges. These watersheds represent worst case scenarios
for exposure to multiple stressors such as down the drain chemicals (e.g.,
pharmaceuticals) and other environmental stressors (e.g., temperature, dissolved oxygen
(DO)). Multiple stressors have the potential to affect chemical exposure dynamics and
fish cardiac physiology leading to undesirable population trajectories. Recent field
observations from my laboratory group identified the calcium channel blocker diltiazem
in fish plasma exceeding human therapeutic doses (e.g., Cmin) in coastal estuaries
impaired due to nonattainment of DO water quality standards (WQS). Thus, objectives of
the present study were two-fold: 1) to examine whether DO influences diltiazem uptake
by fish; and 2) to determine whether changes in DO-dependent toxicokinetics influence
fish physiological and biochemical responses. My results identified that internal steady
state diltiazem concentrations in adult fathead minnows were reached at ~6 h versus ~24
h under low (3.0 mg DO/L) and normal (8.2 mg DO/L) DO conditions, respectively. Low
DO levels approximately doubled diltiazem uptake in fish relative to normoxic
conditions. Increased internal diltiazem concentrations were associated with significant
(p<0.05) increases in fish ventilation rate to enhance oxygen uptake at these low DO

126
levels. During a subsequent study, decreased burst swim performance (Uburst) of adult
fathead minnows was significantly (p<0.05) altered by low versus normal DO. DO x
diltiazem studies resulted in Uburst reductions between 13-31% from controls, though
diltiazem effects were not dependent on DO (p = 0.06). Significant (p<0.05) increases in
plasma lactate levels between DO treatments was indicative of alterations in aerobic
metabolic energy demand-supply dynamics and supports the observed reductions in fish
swim performance. Physiological responses in fish exposed to diltiazem alone were
minimal; however, in co-exposure with low DO, decreasing trends in Uburst were
measured and were inversely related to plasma lactate levels. The physiological
consequences of such trends in adult fathead minnows remain unknown but may indicate
potential interactive cardiac effects under low DO conditions at human therapeutic
diltiazem plasma concentrations. Such physiological responses to these multiple
stressors, when paired with internal tissue concentrations, identify the utility of
employing biological read across approaches to identify adverse outcomes of heart
medications and potentially other cardiotoxicants impacting fish cardiovascular function
across DO gradients.
Introduction
The continued global growth of the human population has created an urban water
cycle characterized by high chemical use, which enters the environment through
wastewater treatment plant (WWTP) effluent discharge to surface waters (Brooks, 2014;
Brooks et al., 2006; Postel, 2010). Coincidentally, 70% of the human population reside in
cities, typically located in close proximity to waterbodies, where local water resources are

127
stressed from climate change, nutrient enrichment and contaminant loading (Brooks et
al., 2006; Heathwaite, 2010; Hooper, 2013). These stressors have been demonstrated to
influence chemical exposure scenarios and toxicological effects in aquatic organisms
(McKim and Erickson, 1991). Effluent-dominated or dependent aquatic systems
represent worst case scenarios for exposure to pharmaceuticals and other environmental
stressors (e.g., low dissolved oxygen; DO). Unfortunately, pharmaceutical occurrence in
surface waters (Halling-Sorensen et al., 1998; Kolpin et al., 2002; Ternes, 1998) and
biota (Brooks et al., 2005; Lazarus et al., 2015; Ramirez et al., 2009) are increasingly
reported in the literature causing concern to environmental managers due to their
physiochemical attributes and high biological activity (Ankley et al., 2007). Effective
water management is essential as our access to medicine is increasing faster than WWTP
infrastructure is implemented, particularly in developing regions. Further, excessive
nutrients accompanied with climate change exacerbates eutrophication and harmful algal
blooms that deplete DO in freshwater and marine ecosystems (Breitburg, 2002; Waiser et
al., 2011). Therefore, surface water integrity is often challenged by multiple stressors.
Unfortunately, influence of multiple stressors on chemical exposure dynamics and effects
in fish remain understudied (Armitage et al., 2017; Boxall et al., 2012; McKim and
Erickson, 1991).
Understanding how environmental factors influence partitioning of chemicals to
fish and how these organisms respond to multiple stressors has been previously examined
with persistent organic pollutants (POPs; McKim and Erickson, 1991) and then more
recently with pharmaceuticals (Nichols et al., 2015). My laboratory research group and
others also recently identified concentrations of the calcium channel blocker (CCB)

128
diltiazem in fish tissue approaching and exceeding human therapeutic levels in fish
plasma sampled from urbanized watersheds (Du et al., 2014a; Fick et al., 2010a; Scott et
al., 2016; Tanoue et al., 2015). The extent of such conditions were examined in a global
probabilistic hazard assessment of CCBs, in which diltiazem was reported to exceed
minimum human therapeutic plasma levels (Cmin) in fish 17% of the time in fish from the
field (Saari et al., 2017). Consequences of such observations remain unknown but
predictive pharmaceutical assessment approaches (Huggett et al., 2003; Brooks, 2014)
indicate therapeutic risks to fish are likely due to drug target conservation of CCBs across
vertebrates.
Fish plasma modeling approaches, which were developed from physiological
based toxicokinetic modeling from empirically derived blood:water partition coefficients
(PB:W) in rainbow trout (Oncorhynchus mykiss) (Fitzsimmons et al., 2001; Huggett et al.,
2003) have been used to predict steady state internal pharmaceutical concentrations.
Using these models, therapeutic hazard values (THV) can identify water concentrations
predicted to bioconcentrate in fish plasma to a human therapeutic dose (Berninger et al.,
2011; Brooks, 2014; Fick et al., 2010b), and then can be employed to examine hazards of
surface waters, sewage and effluent discharges (Du et al., 2014; Kristofco et al., 2017;
Saari et al., 2017). In fact, I recently reported the global occurrence and hazards of CCBs
in various aquatic matrices (Saari et al., 2017). Diltiazem environmental exposure
distributions (EEDs) indicated WWTP effluent concentrations were the only water matrix
(e.g., freshwater, saltwater, influent) predicted to exceed a THV but only in
approximately 2.0% of the scenarios. However, diltiazem fish plasma concentrations
sampled in the field exceeded the minimum human therapeutic dose 17% of the time,

129
suggesting that a more advanced understanding of diltiazem uptake and sublethal effects
to fish is necessary. The significance of such therapeutic plasma concentrations in fish are
unknown, particularly when such exposures co-occur with other environmental stressors
typically found in urbanized watersheds historically impaired due to nonattainment of
DO water quality standards (Scott et al., 2016).
The development of medicines altering ion entry to cells has enhanced our basic
understanding of calcium’s role in important biological processes and has been
instrumental for various disease treatments (Braunwald, 1982; Reuter, 1983). Diltiazem
is a CCB regularly prescribed to treat hypertension and angina, which acts as a
vasodilator and cardiodepressant (Spedding and Paoletti, 1992; Wishart et al., 2006).
Similar to verapamil, diltiazem shows greater sensitivity and activity in cardiac cells than
the peripheral vasculature thereby making it applicable for use to treat arrhythmias in
addition to hypertension (Spedding and Paoletti, 1992; Wishart et al., 2006). This
therapeutic agent primarily targets one of five-calcium channels in humans by blocking
the L-type channel, the major channel in muscle cells mediating contraction, and
preventing an influx of calcium into cardiomyocytes (Braunwald, 1982; Wishart et al.,
2006). Calcium influx inhibition decreases the contractile activity of cardiomyocytes
resulting in decreased force of contraction by the heart. Additionally, calcium channel
antagonism affects cardiac action potentials by decreasing conduction and increasing the
refractory period between contractions, which thus results in its use for treatment of atrial
fibrillations (Wishart et al., 2006). Thus, CCBs have the ability to treat a broad array of
cardiovascular disorders in humans. Based on comparative physiology and the
conservation of CCB drug targets in vertebrates, the plausibility of diltiazem to interact

130
with fish calcium channels exists, particularly when levels approach and exceed human
Cmin plasma levels in fish plasma (Scott et al., 2016).
Several comprehensive reviews are available for the molecular and biochemical,
metabolic, physiological, and adaptive strategies in fish to oxygen limitations (Farrell and
Richards, 2009; Perry et al., 2009; Richards, 2009; Wells, 2009). Fish cardiovascular
responses to reduced oxygen are specific to individual fish regulation strategies that are
ultimately coordinated to balance cardiac metabolic energy supply and demand (e.g.,
adenosine triphosphate; ATP), including mechanisms to cope with metabolic waste
products (Richards, 2009; Stecyk, 2017). Mismatch ATP production and demand leads to
ATP-dependent ion pump failure (e.g., Na+/K+-ATPase) resulting in a disruption of
cellular membrane resting potentials and ionic integrity (Boutilier, 2001). Uncontrolled
calcium influx through voltage-gated channels initiates calcium-dependent breakdown of
proteins and phospholipids, ultimately leading to cell death (Boutilier, 2001). Thus,
disruption of calcium ion channels and homeostasis can lead to cardiac failure, reduced
swimming performance, and adverse outcomes in fish (Claireaux et al., 1995; Claireaux
et al., 2000; Herbert and Steffensen, 2005; van Raaij et al., 1996a; van Raaij et al.,
1996b).
Recent studies examining the acute and chronic effects of DO x diltiazem
exposure to larval fathead minnows showed significant decreases in survival and growth
at typical water quality standard levels, including 3.0 mg DO/L (Saari et al, Accepted
with revision). Swim behavior studies with larval fish indicated general decreases in
swim behavior and significantly reduced bursting distance traveled, number of
movements, and duration in response to low DO or mg/L diltiazem concentrations. Other

131
studies have reported pharmacological action following acute and chronic diltiazem and
verapamil exposures in larval zebrafish (Danio rerio) and fathead minnows (Pimephales
promelas) and juvenile rainbow trout (Oncorhynchus mykiss) at μg/L to mg/L
concentrations. Such effects observed were in CCB target tissues and were plausibly
similar to the mode of actions of these CCBs, resulting in reduced fish heart rate (Saari et
al, Accepted with revision; Parker et al., 2014) and stroke volume (Parker et al., 2014)
and histological changes in heart and liver blood vessels that were suggestive of
vasodilation (Steinbach et al., 2016). The cardiovascular and organism level
consequences of such responses in fish are poorly understood, particularly in conjunction
with environmental factors such as DO, which share molecular and biochemical
perturbation pathways in fish. Therefore, the objective of the present study was two-fold:
1) to examine whether DO influences diltiazem uptake by fish; and 2) to determine
whether changes in DO-dependent toxicokinetics result in changes in adult fathead
minnow burst swim performance and biochemical endpoints.
Materials and Methods Experimental Animals
Fathead minnows (P. promelas) used in all studies were obtained from cultures at
Baylor University originating from the U.S. Environmental Protection Agency (EPA)
laboratories in Duluth, MN and Cincinatti, OH and Environmental Consulting & Testing
in Superior, WI. Adult male fathead minnows were cultured in dechlorinated tap water
according to US EPA recommendations. Fish were cultured at 25 ± 1 ͦC on a 16:8-h
light:dark cycle and were daily fed flake food (~ 1.5% body weight) in the morning

132
followed by artemia and flake food in the evening. A summary of the ages and mean
weight of fish used from each treatment is provided in Table 14.
Dissolved Oxygen Regulation and Diltiazem Treatment Levels
Waterborne DO x diltiazem exposures were conducted with multiple semi-flow
through exposure systems previously employed in our laboratory (Nichols et al., 2015)
under identical light and temperature conditions used during culture. Dechlorinated tap
water, as noted above, was used for all experiments due to large volumes requirements.
Routine water chemistry parameters were measured throughout each study including DO,
temperature, pH, conductivity, chlorine, ammonia, nitrite, alkalinity, and hardness
according to established methods (American Public Health Association et al., 1998).
Diltiazem hydrochloride was obtained from Sigma-Aldrich (St. Louis, MO, USA; CAS #
33286-22-5; 99% purity).
DO water concentrations were regulated by mixing both nitrogen gas and air that
were then infused in each experimental chamber as detailed previously (Saari et al.,
Accepted with revision). Briefly, gas was regulated using RiteFlow meters (Scienceware
Bel-Art Products, Wayne, NJ, USA). DO treatment levels were maintained consistently
and continually with individual nitrogen and air Riteflow meters per treatment level.
Each N2-air regulator pair delivered gas that was mixed in sealed PVC chambers (4” x
24” x 1/8”) filled with bioballs. A single effluent line ran gas to a climate controlled
walk-in incubator where gas infusion levels were manually adjusted from a 6-port
manifold to achieve desired DO treatment levels. Gas was then bubbled into experimental
exposure headboxes. DO x diltiazem control and chemical exposures were conducted in
semiflow-through recirculating exposure systems. Headboxes were infused with gas, as

133
described above, to maintain desired DO levels. Each exposure system headbox provided
a single diltiazem concentration to 3 (bioconcentration study) or 4 (swim performance
study) replicate aquariums. To maintain stable pH and aqueous concentrations of
diltiazem, study solutions were partially renewed every 12 h by approximately 50%.
Daily water replacement was approximately 100%. Samples for traditional water
chemistry parameters and for analytical verification of diltiazem treatment levels were
taken at the start and end of each study and before and after each water renewal. DO and
diltiazem water concentrations were selected from preliminary uptake experiments and
previous acute and chronic studies with juvenile fathead minnows (Saari et al., Accepted
with revision). Diltiazem water treatments were based on empirical data, fish plasma
modeling, and therapeutic hazard values (THV) employed previously in our laboratory
(Brooks, 2014; Du et al., 2014a). The THV is the pharmaceutical water concentration
expected to bioconcentrate in fish plasma within the human therapeutic range (e.g., Cmin -
Cmax; Brooks, 2014).
Fathead minnows were acclimated to DO conditions prior to introduction to
experimental systems. Fish from culture tanks were transported to experimental systems
in 10 gallon aquaria. Thus, acclimations were done in 10 gallon tanks with 30 L
dechlorinated tap water. An airstone bubbling a mixture of N2-air gas (described below)
was placed in each tank and DO levels were decreased by 0.8 mg/L per 15 minutes to
approximately 3.25 mg DO/L. Based on preliminary study observations of fathead
minnows to decreasing DO, DO conditions for fish were lowered to 3.25 mg DO/L over
1.5 h, similar to previous fathead minnow hypoxia studies (Robb et al, 2003). Fathead
minnows have been reported to initiate aquatic surface respiration at 9% DO saturation

134
(Gee et al, 1978). Further, we previously identified 48 h DO LC50 values at 1.7 mg DO/L
in larval P. promelas; therefore, experimental DO levels were selected above such values
to prevent fish mortality.
Dissolved Oxygen x Diltiazem 96 h Bioconcentration Study
Two experiments were performed to determine whether DO influences diltiazem
uptake by adult fathead minnows. These conditions included either 8.2 or 3.0 mg DO/L
during separate experiments. Since water pH has been demonstrated to influence the
uptake of weak base pharmaceuticals by fish, pH was monitored during this study. As
mentioned above, DO levels were maintained by infusing air or mixed gas in headboxes
of the experimental system. Headboxes circulated normal (8.2 mg DO/L) or low (3.0 mg
DO/L) oxygenated water via submersible pumps in 3 replicate 20 liter glass aquaria
according to previously described methods in our laboratory (Nichols et al., 2015).
Experiments were initiated at identical times with the same batch of water and conducted
for 96 h. Fish from 3 replicate aquaria were sampled at 0, 1, 6, 24 and 96 h, then
anesthetized with tricaine methanesulfonate (MS-222), weighed, measured for total
length, and blood collected from the caudal artery using heparinized microhematocrit
capillary tubes. Plasma was separated via centrifugation at 8,000 x g for 10 minutes at
4˚C and was stored at -80 ˚C until processed. Fish plasma and tissue were pooled from
two fish per experimental unit giving 3 replicate samples for each exposure system and
duration.
To compare the differences in diltiazem accumulation across DO treatments,
bioconcentration factors (BCFs) were calculated from whole body homogenates as

135
previously described (Arnot and Gobas, 2006). BCFs are defined as the ratio of target
analyte (diltiazem) detected in biota and the associated water concentration. Furthermore,
blood-water partition coefficients (PB:W) were predicted and calculated for each exposure
duration from analytically verified plasma levels and mean exposure water
concentrations, similar to previous studies (Margiotta et al, 2014). Using the whole body
tissue BCF and PB:W values (VD) was calculated in 96 h studies similar to previous
methods (Nichols et al., 2015) examining the utility of pharmacokinetics.
Measured fish plasma concentrations were compared to predicted internal
concentrations by the fish plasma model. This model predicts fish steady state plasma
concentrations (FSSPC) starting from a given water concentration, which is based on
equations previously described (Huggett et al, 2003), to calculate the Log PBlood:Water
partition coefficient using the Log KOW. However, pH has been previously reported to
significantly affect ionization, bioavailability, and toxicity of model weak base
pharmaceuticals (Valenti et al, 2009; Berninger et al, 2011). For this reason, Log Dn (n =
mean experimental pH) was used to run the model instead of Log KOW. FSSPC were
determined by multiplying the water concentrations and PBlood:Water. Then, the analytically
verified diltiazem water concentration was used to compare measured versus predicted
plasma concentrations.
Dissolved Oxygen x Diltiazem Swim Tunnel Studies
DO and diltiazem exposures were conducted in identical experimental systems
mentioned above, and all studies were performed separately due to the intensive time
requirement of swim performance observations. DO and diltiazem concentrations were

136
similarly sampled as mentioned above. Experiments were conducted over 24 h and were
performed on separated days due to the intensive time requirements of swim performance
observations. Two fish from 4 separate aquaria were sampled and measured for
ventilation rate, burst swimming performance, hematocrit, L-lactate, and diltiazem tissue
accumulation. Each specific endpoint and measurement protocol are described in detail
below. Plasma was sampled and separated as previously described above. Individual fish
plasma samples were split into two aliquots for biochemical analysis and analytical
determination. Analytical fish plasma samples were then pooled from each replicate and
stored at -80 ˚C until processed.
Ventilation rates were examined after 24 h exposure to DO and diltiazem by
GoPro (Hero black 5; GoPro Inc. 2017) video recording each fish from all replicate
aquaria prior to swim performance trials for 15 minutes. Fish videos were individually
observed using VLC Media Player (3.0.3 Vetinari; VideoLAN Organization) to slow
down (e.g., 40-50%) normal video speed to accurately quantify opercular movement.
Videos were observed and after a five-minute camera acclimation time, individual fish
opercular movements were recorded 3 times approximately 1 minute apart at 10-15
second intervals (depending on fish orientation in tanks) to calculate ventilation rates
(beats/second). After video recording ventilation rates, fish were individually exercised to
determine burst swimming performance.
After recording fish ventilation rates, one fish was randomly selected per replicate
to measure burst swimming performance (Uburst) in a Brett-type swim tunnel (Brett, 1964)
previously described in our laboratory (Brooks, 2002; Stanley, 2006). Briefly, a single
swim tunnel was immersed in a 40-gallon aquarium of water corresponding to the studied

137
exposure conditions. The swim tunnel consisted of a 450 mm x 75 diameter acrylic tube
with 1 mm mesh at each end. Water was pumped through the tunnel using a 0.5
horsepower centrifugal pump at a maximum speed of ~70 cm/s. Fish were anesthetized
with 60 mg/L MS-222 buffered with 120 mg/L sodium bicarbonate for 1 minute and
transferred into a black tarp enclosed swim tunnel to acclimate undisturbed for 30
minutes (Tierney et al, 2011). Flow rates were determined using a March-McBirney
(Frederick, MD, USA) flow meter. The acclimation flow rate was set at 2.3 cm/s (e.g.,
0.08 ft./s) or ~0.3 BL/s (e.g., 7.0 cm total length) in order to remove waste while allowing
fish to rest on the bottom (Tierney et al, 2011).
To examine fathead minnow burst swimming performance, a constant
acceleration test was used at a 10 cm/s and 1 minute step height and length, respectively.
The initial flow rate was 10 cm/s and fish were exercised until fatigued. Fatigue was
determined by the fish ceasing to swim and being caught against the mesh after several
gentle prods (Brett, 1964). Critical burst swimming speed was calculated as
Uburst = u1 + (t1 / t2 x u2) (1)
where u1 = last step height completed by fish (cm/s), u2 = the step height (cm/s), t1 = the
time fish swum at fatigue speed, and t2 = the step length (seconds; Brett, 1964, Tierney et
al, 2011). Critical burst swimming speed of each fish was normalized to body length (cm;
Brett, 1964; Tierney et al, 2011). After swim performance trials, fish were anesthetized in
200 mg/L MS-222 and 400 mg/L sodium bicarbonate and measured for total length and
weight. Fish blood was collected, as mentioned above, and separated into red blood cells
and plasma which was aliquoted into two microcentrifuge tubes prior to storage at -80 ˚C
for analytical and biochemical (e.g., lactate) analysis. Immediately after centrifugation,

138
red blood cells were used to determine hematocrit according to previously methods
(Hesser, 1960).
L-Lactate Plasma Concentration
Individual fish plasma samples collected after swim performance trials were
analyzed for L-lactate using an assay kit from Cayman Chemical Company (Ann Arbor,
MI, USA). Fish plasma from three tank replicates were examined for L-lactate. In this
assay, lactate was measured by NADH production and reaction with a fluorescent
substrate yielding a highly fluorescent product. Lactate dehydrogenase catalyzes the
oxidation of lactate to pyruvate and reduces NAD+ to NADH. Fathead minnow plasma
samples were removed from storage at -80 ˚C and prepared for assaying according to kit
manufacturer instructions. Based on preliminary plasma lactate examinations, samples
were diluted 1:7 using Ultrapure water (Cayman Chemical Company). Fluorescence was
analyzed using an excitation and emission wavelengths at 530 and 590 nm, respectively.
Plasma lactate (units) was then calculated and compared across treatment levels.
Analytical Methods for Water and Tissue
Experimental water treatments and tissue samples from each uptake and swim
performance study were analytically verified following previously reported methods
(Saari et al, In Press; Haddad et al., In press). Water and tissue (e.g., plasma and whole
body-homogenates) samples were analyzed following extraction by isotope-dilution
liquid chromatography tandem mass spectrometry (LC-MS/MS) using previously
reported instrumental parameters (Bean et al., 2018; Haddad et al., In press).

139
Statistical Analyses
Data is presented as mean ± standard deviation (SD; x studies) or standard error
(SEM; x studies). Differences in uptake across time, treatments, and DO conditions were
examined using general linear models in SPSS (IBM SPSS Statistics 25, Chicago, IL,
USA). Significant differences within each DO or diltiazem treatment were determined
using one-way analysis of variance (ANOVA) in Sigma Plot 11.0 software (Systat
Software 323 Inc., San Jose, CA, USA). Similarly, differences in physiological endpoints
across DO x diltiazem studies were determined using Two-way ANOVA with multi-
comparison Holm-Sidak Test to examine whether DO significantly influenced fish
responses across diltiazem treatment levels.
Results DO x Diltiazem 96 h Bioconcentration Studies
Water quality parameters among all exposure systems were within acceptable
levels (Supplementary: Table 21). Fish survival in normal DO x diltiazem studies was
100% but mortalities were observed under low DO x diltiazem conditions in three
separate studies (Table 14). Mean (±SE) normal and low DO concentrations across all
four experimental durations were 7.23 ± 0.2 mg DO/L and 3.07 ± 0.1 mg DO/L (Table
15). For normal and low DO treatments, measured diltiazem concentrations were 0.84 ±
0.03 μg/L and 0.83 ± 0.04 μg/L, respectively (Table 15). Fig 16A and 16B describe the
bioconcentration of diltiazem in plasma and whole-body tissues of fathead minnow
following the uptake experiments. Fish exposed to both DO treatments significantly (p <
0.05) accumulated diltiazem across nearly all experimental durations, even after 1 h

140
exposure (Fig. 16A and Fig. 16B). Internal steady state levels of diltiazem were rapidly
established at 24 h and 6h at normal and low DO conditions, respectively (Table 15).
Diltiazem accumulation in fish plasma and whole-body tissues were significantly (p <
0.05) different across DO conditions. Time specific diltiazem accumulation data was
used to calculate whole-body bioconcentration factors (BCFs), blood:water partition
coefficients (PB:W), and volume of distribution (VD) values. Measured BCF values
increased with increasing exposure duration and low DO treatment ranging from 2.0-6.2
and 3.7-16.8 for normal and low DO levels, respectively (Table 15). At steady state, fish
at low DO levels had ~2X higher BCF values than fish at normal DO concentrations.
PB:W values also increased with increasing exposure duration at low DO levels compared
to normoxic conditions. Conversely to BCF and PB:W value trends at normal and low DO
concentrations, apparent VD were similar across in fish under normal DO levels (1.8-3.4)
and low DO conditions (1.0-2.7; Table 15)

141
Table 14. Mean (±SE) values for fathead minnow (Pimephales promelas) weight, total body length (BL), and age of fish used in DO x diltiazem bioconcentration (N=3, n=2) and burst swim performance (N=4, n=2) studies. Fish in DO x diltiazem studies were measured immediately after each bioconcentration study or swim tunnel trial. Normal: 8.2 mg DO/L. Low: 3.0 mg DO/L.
Time Point
(h) Weight (g) BL (cm) Age
(months) N/n Bioconcentration study Normal DO x DZM
0 a3.77 ± 0.3 6.51 ± 0.1 18 3/9 1 12.8 ± 0.8 9.62 ± 0.3 18 3/6 6 10.8 ± 0.9 9.38 ± 0.4 18 3/6 24 10.0 ± 1.3 8.83 ± 0.2 18 3/6 96 11.7 ± 0.8 9.28 ± 0.3 18 3/6
Low DO x DZM
0 b11.5 ± 0.8 8.90 ± NA 18 1/1 1 12.5 ± 1.8 9.64 ± 0.5 18 c3/5 6 8.20 ± 0.5 8.52 ± 0.2 18 d3/5 24 14.4 ± 2.0 9.78 ± 0.3 18 e3/3 96 11.2 ± 0.3 9.79 ± 0.2 18 3/6
DO x diltiazem burst swim performance study
Normal DO x DZM control
24 5.41 ± 0.2 7.65 ± 0.2 8 4/8
Normal DO x DZM 3.0 μg/L
24 5.61 ± 0.4 7.61 ± 0.2 8 4/8
Normal DO x DZM 30 μg/L
24 6.19 ± 0.1 7.81 ± 0.0 8 4/8
Low DO x DZM control
24 5.74 ± 0.3 7.74 ± 0.1 8 f4/7
Low DO x DZM 3.0 μg/L
24 6.34 ± 0.5 8.06 ± 0.2 8 g4/7
Normal DO x DZM 30 μg/L
24 6.20 ± 0.3 7.76 ± 0.1 8 4/8
(a) Indicates female fish were used as controls for tissue analyses. (b) Indicates one male fish was used control for tissue analyses due to a limited supply of male fathead minnows. (c) One fish euthanized after handling error (flopped out of net onto floor) during 0 h introduction to exposure tank. (d) One fish died approximately 3 hours into exposure. (e) One fish from each replicate died approximately 6 h into 24 h DO x diltiazem exposure. The remaining fish in replicate tanks displayed normal fish behavior; therefore, the remaining fish were included in the study. (f) One fish was euthanized while loading into replicate tank #3 due to 0 h loading error (fish flopped out of net onto floor). (g) One fish died overnight after ~12 h exposure to low DO x diltiazem 3.0 μg/L.

142
Tabl
e 15
: Con
cent
ratio
ns o
f dilt
iaze
m (D
ZM) i
n ex
posu
re w
ater
, pla
sma,
and
who
le-b
ody
tissu
e of
adu
lt m
ale
fath
ead
min
now
(Pim
epha
les p
rom
elas
) fol
low
ing
norm
al a
nd lo
w d
isso
lved
oxy
gen
(DO
) x
DZM
bio
conc
entra
tion
and
burs
t sw
im p
erfo
rman
ce s
tudi
es. C
alcu
late
d bi
ocon
cent
ratio
n fa
ctor
s (B
CF)
, blo
od;w
ater
pa
rtitio
n co
effic
ient
s (P
B:W
) and
app
aren
t vol
ume
of d
istri
butio
n (V
D) v
alue
s ar
e al
so p
rovi
ded.
In b
ioco
ncen
tratio
n (n
omin
al 1
μg/
L di
ltiaz
em) a
nd b
urst
sw
im
perf
orm
ance
(nom
inal
0, 3
, 30
μg/L
dilt
iaze
m) s
tudi
es, f
ish
wer
e sa
mpl
ed a
t 0, 1
, 6, 2
4, a
nd 9
6 h
and
24 h
, res
pect
ivel
y. N
orm
al: 8
.2 m
g D
O/L
; Low
: 3.0
mg
DO
/L; N
A: s
ampl
e si
ze (n
) ins
uffic
ient
to c
alcu
late
stan
dard
dev
iatio
n. S
D: s
tand
ard
devi
atio
n. N
: num
ber o
f rep
licat
es. n
: num
ber o
f sam
ples
.
Mea
n M
easu
red
DO
(m
g/L
; SD
, N)
Tim
e Po
int
(h)
DZM
Mea
n M
easu
red
Wat
er
(μg/
L, S
D, n
) W
hole
-Bod
y D
ZM
(ug/
kg; S
D, n
) Pl
asm
a D
ZM
(ng/
mL
; SD
, n)
BC
F P B
:W
VD
Bioc
once
ntra
tion
stud
y
7.
23 (0
.5, 4
) 0
0 0
0 -
- -
1 0.
81 (N
A, 2
) 1.
6 (0
.5, 3
) 0.
9 (0
.2, 3
) 2.
0 1.
1 1.
8 6
0.89
(NA
, 2)
3.3
(0.7
, 3)
1.2
(0.2
, 3)
3.7
1.3
2.8
24
0.87
(0.1
1, 4
) 5.
4 (0
.4, 3
) 1.
6 (0
.2, 3
) 6.
2 1.
8 3.
4 96
0.
77 (0
.09,
16)
4.
6 (0
.7, 3
) 1.
9 (0
.1, 3
) 6.
0 2.
5 2.
4 M
ean
a 0.8
4 (0
.03,
4)
3.07
(0.2
, 4)
0 0
0 0
- -
-
1 0.
94 (N
A, 2
) 3.
5 (0
.2, 3
) 2.
6 (1
.1, 3
) 3.
7 2.
8 1.
3
6 0.
73 (N
A, 2
) 8.
3 (1
.1, 3
) 8.
6 (2
.8, 3
) 11
.4
11.8
1.
0
24
0.84
(0.0
5, 6
) 14
.1 (5
.4, 3
) 5.
2 (2
.6, 3
) 16
.8
6.2
2.7
96
0.
81 (0
.09,
16)
10
.1 (1
.9, 3
) 6.
4 (0
.8, 3
) 12
.5
7.9
1.6
M
ean
a 0.8
3 (0
.09,
4)
Mea
n M
easu
red
DO
(mg/
L; S
D, N
) T
ime
Poin
t (h)
D
ZM M
ean
Mea
sure
d W
ater
(μ
g/L
, SD
, n)
Plas
ma
DZM
(n
g/m
L; S
D, n
) Bu
rst s
wim
per
form
ance
stud
y
7.83
(0.4
, 3)
24
0 0
24
3.
2 (0
.6, 4
) 19
.8 (8
.8, 4
)
24
36.5
(3.4
, 4)
112.
7 (2
4.9,
4)
3.19
(0.1
, 3)
24
0 0
24
3.
1 (0
.5, 3
) 49
.7 (1
7.4,
4)
24
33
.5 (2
.9, 4
) 28
8.1
(67.
6, 4
)

143
Figure 16: Mean (±SD, N=4, n=1-2) measured concentration of diltiazem in A) plasma and B) whole-body tissue of male adult fathead minnows (Pimephales promelas) following 96 h normal and low dissolved oxygen (DO) x diltiazem (1 μg/L) studies. Normal and low DO x diltiazem studies were conducted separately. Tissue samples were collected across five time points throughout each 96 h DO x diltiazem uptake experiment (0, 1, 6, 24, 96 h). Black and white circles represent normal (8.2 mg DO/L) and low (3.0 mg DO/L) levels, respectively. Different letters in the same group (capitalized or not capitalized) correspond to significant (p < 0.05) differences. #: significant (p < 0.05) influence of DO. Dissolved Oxygen x Diltiazem Swim Tunnel Studies
Water quality for all experimental units were within acceptable ranges
(Supplementary: Table 21). Fish survival in normal DO x diltiazem studies were 100%
and one mortality occurred under low DO x diltiazem 3.0 μg/L conditions (Table 14).
Mean (±SE) normal and low DO concentrations across all three diltiazem studies were
7.83 ± 0.2 mg DO/L and 3.19 ± 0.1 mg DO/L, respectively (Table 15). For normal and
low DO treatments, mean (±SD) measured diltiazem concentrations were 0 (control), 3.2
± 0.6 μg/L, and 36.5 ± 3.4 μg/L and 0 (control), 3.1 ± 0.5 μg/L, and 33.5 ± 2.9 μg/L,
respectively (Table 15). The highest diltiazem treatment is ~70% lower than the 100 μg/L
nominal diltiazem concentration, yet still in the human therapeutic range described
above. Concentrations of diltiazem in fathead minnow plasma and whole-body tissue are
represented in Fig. 17A and 17B, respectively. Similar to the bioconcentration study, fish
exposed to both DO conditions accumulated diltiazem at all treatments levels, except

144
control. Internal diltiazem levels of fish exposed at low DO concentrations were higher
than those in normal DO treatments (Table 15). Like the bioconcentration study, data
from each diltiazem treatment were used to calculate mean fish tissue BCFs, and PB:W
and VD values. Measured BCF values were higher in low DO treatments ranging from
4.4-5.2 and 9.2-11.6 at normal and low DO levels, respectively. In 24 h exposures, fish at
low DO levels had approximately 2X higher BCF values than fish at normal DO
conditions. Similarly, PB:W values were higher at low DO concentrations compared to
normal DO levels (Table 15). Diltiazem apparent VD was not different in fish exposed at
normal DO levels (0.7-1.7) relative to low DO treatments (0.6-1.3) across all treatments
(Table 15).
Fish exposed to 3.1-3.2 μg/L diltiazem at normal and low DO conditions resulted
in plasma concentrations below and above the minimum human therapeutic plasma level,
respectively. However, both DO treatments levels at 33.5-36.5 μg/L diltiazem resulted in
fish plasma levels near and above the maximum human therapeutic level in normal and
low DO treatments, respectively. Interestingly, when measured and predicted fish plasma
diltiazem levels were compared, models overestimated internal plasma concentrations by
15x and 30x and 6x and 11x at both low and high diltiazem treatment levels under normal
and low DO conditions, respectively. Therefore, low DO exposure conditions resulted in
fish plasma concentrations above human therapeutic levels and decreased the difference
between predicted versus measured fish plasma concentrations.
Ventilation rates measured prior to swim tunnel trials revealed a significant (p <
0.001) increase in fish operculum frequency exposed to low DO (Fig. 18A). Low DO
increased fish ventilation rates by 143% relative to normal DO conditions when

145
comparing diltiazem controls. Diltiazem slightly increased ventilation rates across
treatment levels at normal DO levels by 5.0% and 32% relative to control (3.2 and 36.5
μg/L, respectively), but such potential increases were not statistically significant (p =
0.112; Fig. 18). A significant interactive effect of diltiazem and DO on ventilation rate
was not observed (p = 0.074); however, rates were lower with increasing diltiazem
concentration under low DO conditions by 15% and 61% at 3.1 and 3.5 μg/L diltiazem,
respectively.
Burst swimming performance (Uburst) was evaluated using an acceleration test to
determine whether 24 h exposure to DO x diltiazem impaired fathead minnow bursting
ability. DO significantly (p < 0.001) decreased Uburst relative to normal DO conditions
(Fig. 18B). Low DO decreased fish bursting performance by 12.8% relative to normal
DO conditions when comparing diltiazem controls. Diltiazem did not significantly (p =
0.687) increase Uburst across treatment levels at normal DO levels (Fig. 19). Here again, a
significant interactive effect of diltiazem and DO on swim performance was not observed
(p = 0.085), although Uburst was lower by 16.4% and 14.5% at 3.1 and 33.5 μg/L at low
DO levels relative to diltiazem controls.
Hematocrit was evaluated to determine whether 24 h exposure to DO x diltiazem
altered adult fathead minnow red blood cell volume. The effect of diltiazem on
hematocrit was dependent on DO conditions (p = 0.041; Fig. 19A). In 3.2 and 3.1 μg/L
diltiazem treatments, hematocrit significantly (p = 0.022) increased by 23% at normal and
low DO concentrations. Additionally, under low DO conditions, 3.1 μg/L diltiazem was
significantly higher than 0 (control) and 33.5 μg/L by 30.3% and 27.1%, respectively.
Fish hematocrit was unchanged (p = 0.752) under normal DO conditions (Fig. 19A).

146
Figure 17: Mean (±SD, N=4, n=1-2) measured concentration of diltiazem in plasma of male adult fathead minnows (Pimephales promelas) following 24 h normal and low dissolved oxygen (DO) x diltiazem (0, 3, 30 μg/L) studies. Normal and low DO x diltiazem studies were conducted separately. Black and white circles represent normal (8.2 mg DO/L) and low (3.0 mg DO/L) levels, respectively. Different letters in the same group (capitalized or not capitalized) correspond to significant (p<0.05) differences between diltiazem water concentrations. #: significant difference between DO conditions (p<0.05).

147
Figure 18: Mean (±SE, N=4, n=1-2) ventilation rate (beats/minute; A) and burst swimming performance (BL/sec.; B) by male adult fathead minnows (Pimephales promelas) following 24 h normal and low dissolved oxygen (DO) x diltiazem (0, 3, 30 μg/L) experiments. Normal and low DO x diltiazem studies were conducted separately. DO and diltiazem concentrations are nominal to increase clarity but measured concentrations are in Table 15. Black and gray bars represent normal (8.2 mg DO/L) and low (3.0 mg DO/L) levels, respectively. *: p < 0.05 (diltiazem). #: p < 0.05 (DO). BL/sec.: body length per second.
Figure 19: Mean (±SE, N=4, n=1-2) hematocrit (%; A) and plasma lactate (μM; B) of male adult fathead minnows (Pimephales promelas) following 24 h normal and low dissolved oxygen (DO) x diltiazem experiments. Normal and low DO x diltiazem studies were conducted separately. DO and diltiazem concentrations are nominal to increase clarity but measured concentrations are in Table 15. Black and gray bars represent normal (8.2 mg DO/L) and low (3.0 mg DO/L) levels, respectively. *: p < 0.05 (diltiazem). #: p < 0.05 (DO). L-Lactate Plasma Concentrations
L-lactate (lactate) was measured in plasma to determine whether DO x diltiazem
altered energy supply-demand dynamics in fathead minnows. Low DO conditions

148
significantly (p = 0.002) increased lactate concentrations relative to normal DO levels
(Fig. 19B) by 92.4% when comparing diltiazem controls. A slight though insignificant (p
= 0.165) increase in plasma lactate was observed across diltiazem treatments under
normal DO conditions relative to control. No significant (p = 0.131) interaction effects
were observed between diltiazem and DO; however, lactate was lower by 10.7% and
40.3% at 3.1 and 33.5 μg/L diltiazem at low DO levels relative to the low DO diltiazem
control (Fig. 19B).
Discussion
Urbanized watersheds represent worst case scenarios for fish exposure to multiple
stressors including pharmaceuticals (e.g., diltiazem) and low DO (Breitburg, 2002;
Brooks et al., 2006; Waiser et al., 2011). While our understanding of ionizable chemical
toxicokinetics and toxicodynamics is growing, empirical evidence demonstrating how
environmental factors (e.g., DO, temperature) influence their uptake and toxicity remains
poorly understood. In the present study, we examined whether low DO influences the
bioconcentration of diltiazem, a model weak base cardioactive medicine, and the
physiological effects in adult fathead minnows. Numerous field sampling studies have
reported diltiazem accumulation in fish and birds inhabiting urbanized watersheds (Du et
al., 2014b; Fick et al., 2010a; Lazarus et al., 2015; Ramirez et al., 2009; Tanoue et al.,
2015). Furthermore, this CCB has approached and exceeded minimum human therapeutic
levels in fish plasma sampled from urban estuaries along the Texas Gulf of Mexico (Scott
et al., 2016). These same watersheds have a history of fish kills attributed to hypoxic
conditions and have been registered on the Texas 303(d) list for nonattainment of DO

149
water quality criteria (Brooks et al., 2008; Thronson, 2008). Unfortunately, the influence
of low DO on chemical exposure dynamics and effects in fish remain understudied. The
present study demonstrated that DO influences diltiazem uptake and altered some
physiological responses in fish.
Bioconcentration of diltiazem in fathead minnows was highly dependent on DO
conditions in the present study. Steady state plasma and tissue concentrations were
achieved by approximately 24 h in normal conditions, but were observed in just 6 h in
low DO treatments. Measured internal diltiazem concentrations were significantly
(p<0.05) higher in fish under low DO conditions, but similar to diltiazem muscle
concentrations in 21 d and 42 d normoxic bioconcentration studies with rainbow trout
(Steinbach et al, 2016). Whole body BCFs were ~2X higher at low DO levels relative to
normal DO conditions. Thus, low DO conditions influenced the bioconcentration of
diltiazem, a model weak base, similar to previous studies with POPs (Blewett et al, 2013;
Brauner et al., 1994; McKim and Erickson, 1991; McKim and Goeden, 1982; Yang et al.,
2000). Metabolic oxygen consumption (MO2) has been positively correlated with
increased chemical uptake of ethinylestradiol (EE2), 1,2,4,5-tetrachlorobenzene, and
endrin (Blewett et al, 2013; Brauner et al., 1994; McKim and Goeden, 1982; Yang et al.,
2000). Killifish (Fundulus heteroclitus) MO2 was positively associated with increased
EE2 uptake during exercise trials but only slight increases were measured following 2 h
hypoxia exposure studies (Blewett et al, 2013). Killifish are tolerant to hypoxia and the
results reported by Blewett et al. (2013) support this classification; however, EE2 tissue
accumulation slightly increased under hypoxic conditions and decreased MO2. McKim
and Goeden (1982) demonstrated brook trout oxygen utilization and endrin uptake

150
efficiency decreased with increasing ventilation volume under various short term hypoxic
studies. Interestingly, endrin uptake increased with decreasing DO and uptake efficiency
but plateaued between 50 and 30% oxygen saturation at 11-12 ˚C.
Fish use various physiological and biochemical strategies to cope with less than
optimal DO concentrations. Initially, when decreased oxygen levels are detected, fish
increase ventilation frequency or amplitude to boost water flow across the gills and
perfuse additional gill lamellae to increase oxygen uptake (Randall, 1982). Thus, low DO
levels can result in increased ventilation, which increases water flow to gill lamellae, and
has been suggested to be one factor influencing chemical uptake for compounds with log
P values < 6.0 under normoxic conditions (McKim and Erickson, 1991). As DO levels
decrease, fish oxygen consumption and chemical uptake increases but eventually plateaus
despite high respiratory volumes due to shorter water residence time in gill lamellar
channels (McKim and Erickson, 1991). Under maximum respiratory volumes, chemical
uptake shifts and is dictated by chemical diffusivity parameters instead of water flow
across gill epithelium (McKim and Erickson, 1991; McKim and Goeden, 1982). It is
unknown whether oxygen and diltiazem uptake plateaued in the present study (~36%
saturations at 25 ˚C). Fathead minnows are relatively tolerable to hypoxia in comparison
to salmonids; for example, aquatic surface respiration by fathead minnows was reported
to occur at 9% DO saturation at 24 ˚C (Gee et al., 1978). Therefore, lower DO conditions
than those examined in the present study may further influence diltiazem uptake in
fathead minnows. Additional studies are necessary to determine modes of increased
chemical uptake across fish species (e.g., warm and cold water species) to examine

151
whether enhanced uptake is attributed to one or both strategies to increase oxygen
consumption (e.g., increased water flow or gill lamellae surface area).
Previous studies with environmental factors have also reported differential
chemical uptake due to bulk water pH level and pH at the gill microenvironment. In the
present study, mean (±SE) bulk exposure water pH was 8.1±0.02 and 8.4±0.01 under
normal and low DO levels, respectively. Our laboratory previously demonstrated that
uptake of the ionizable weak base diphenhydramine was elevated with increasing pH in
96 h adult male fathead minnow studies (Nichols et al., 2015). Furthermore, pH
conditions at the gill microenvironment were reported to influence chemical uptake of
weak acids due to the elimination of metabolic acids at gill lamellae, which altered
chemical ionization (Erickson et al, 2006). Fish ventilation rates were not measured in 96
h bioconcentration studies of the present manuscript, although visual observations
indicated increased ventilation at low DO. Enhanced respiratory volumes increase water
flow across gill lamellar channels, which has been suggested to be one of the limiting
factors for chemical uptake (McKim and Erickson, 1991). Elevated ventilation rates will
result in increased water flow across gill lamellae and minimize the metabolic acid
induced decrease in pH at the gill microenvironment. In the present study, bulk water pH
conditions in exposure aquaria resulted in 52% and 66% of diltiazem to be non-ionized
(pKa = 8.06) at normal and low DO levels, respectively. However, the fish plasma model
with log D calculated PB:W values predicted nearly identical internal fish plasma
concentrations (53.9 and 53.2 μg/L at normal and low DO levels, respectively) when
empirical study conditions were incorporated (e.g., mean pH, mean 96 h water
concentration). Therefore, differences in uptake across DO conditions are potentially due

152
to other factors besides bulk water pH, such as increased water flow, metabolic acid
elimination, and lamellae perfusion at the gills. Additional studies using identical bulk
water pH conditions across multiple DO levels is necessary to determine which key
factor predominantly influences ionizable weak base uptake. This research appears
particularly important since diltiazem has been reported to approach and even exceed
Cmin levels in saltwater more frequently than freshwater systems (Saari et al, 2017; Scott
et al, 2016).
When oxygen uptake fails to sufficiently match aerobic metabolic demand,
reductions in fish activity commonly occur to minimize the metabolic consequences
resulting from a lack of oxygen and limited ATP production (Dutil et al., 2007; Jones,
1971; Richards, 2009). Results from the present study revealed impaired fish Uburst at low
DO levels (~13%; 3.19 ± 0.1 mg DO/L) following 24 h acute studies. Conversely, fish
Uburst in acute diltiazem studies remained unchanged; however, decreased fish swim
performance was observed in DO x diltiazem co-exposures, though insignificantly (p =
0.085), and thus requires additional study to determine if higher diltiazem exposure levels
would adversely affect this important physiological endpoint. Reductions in swim
performance is commonly associated with decreased metabolic scope (Dutil et al., 2007).
Such responses have been attributed to increased metabolic stress by either adding costs
to routine maintenance (e.g., basal metabolism) or limiting the maximum oxygen
consumption (Brett, 1958). Atlantic cod exposed to low DO conditions similarly
experienced decreased swim performance which corresponded to measurable metabolic
constraints (Chabot and Claireaux, 2008; Claireaux et al., 1995; Dutil et al., 2007;
Herbert and Steffensen, 2005). Changes in fish blood constituents and metabolites (e.g.,

153
lactate, glucose) during hypoxic exposures reflect metabolic constraints to aerobic
respiration and are indicative of shifts in energy supply and demand dynamics (Burton
and Heath, 1980; Ishibashi et al., 2002; Muusze et al., 1998; van Raaij et al., 1996a; van
Raaij et al., 1996b). In support of the above mentioned blood metabolite changes, fathead
minnow plasma lactate levels were significantly higher at low versus normal DO levels
(Fig. 19), while diltiazem had no significant (p = 0.165) effect on plasma lactate. Fathead
minnows are moderately tolerant to low DO conditions. Gee et al (1978) reported 50% of
fathead minnows exposed to declining DO at 16.5 ˚C initiated surface respiration and
decreased activity declined at 13.7 Torr. Saari et al (2018, In press) reported a 48 h LC50
value of 1.7 mg DO/L for larval fish. In the present study, plasma lactate levels in fish
exposed to DO x diltiazem were not significantly (p = 0.131) decreased with increasing
diltiazem concentration, contrary to previous results demonstrating DO-dependent lactate
tissue accumulation (Burton and Heath, 1980; van Raaij et al, 1996b; Muusze et al,
1998). Interestingly, metabolic alterations were similarly observed in rats under
hemorrhagic shock following diltiazem intravenous injection (Maitra et al, 1991).
Diltiazem treated rats experienced beneficial reductions in plasma glucose levels and
heart rates but were accompanied with increased plasma lactate levels. Whether diltiazem
provides similar beneficial effects in fish are unknown. Additional studies examining
temporal metabolic metabolite fluctuations is necessary to pinpoint the physiological
responses in fish, particularly under the above described conditions. Furthermore,
additional research is needed to understand the pharmacodynamic mechanism of these
potential physiological responses (e.g., adverse or beneficial). The present study results
suggest decreases in swim performance may be due to pharmacological effects in fish,

154
similarly observed in other fish models following diltiazem exposure (Steinbach et al,
2016). In the present study, such physiological responses were observed at fish plasma
concentrations within and above human therapeutic level. The consequences of such
responses in fish remain unknown but deserve further research, particularly when
pharmacological activity of diverse medicines has been previously reported in fish
(Brodin et al, 2013; Cuklev et al, 2011; Huerta et al, 2016; Margiotta-Casaluci et al,
2014; Runnalls et al, 2015; Valenti et al, 2012).
Diltiazem displays cardioselectivity in humans when prescribed to treat
hypertension and angina acting both as a vasodilator and cardiodepressant (Law et al.,
2013; Wishart et al., 2006). Diltiazem antagonizes smooth epithelium L-type calcium
channels to increase blood flow and deliver sufficient oxygen and nutrients to the heart.
Additionally, diltiazem decreases the heart workload by inhibiting an influx of calcium
into cardiomyocytes thereby reducing cardiac contractility and contractive force (Law et
al., 2013). Whether diltiazem is decreasing the fathead minnow contractive force of
cardiomyocytes is unknown. However, decreases in fish heart rate have been reported
following acute mg/L CCB exposures (e.g., diltiazem, verapamil) in larval zebrafish
(Parker et al., 2014) and fathead minnows (Saari et al, 2018, In Press). Steinbach et al.
(2016) reported histological changes of heart and liver blood vessels in rainbow trout
suggesting vasodilation following long-term studies at μg/L diltiazem levels. Thus,
research examining the cardiovascular effects in fish following long term low dose
diltiazem exposure is warranted. The present study measured significant increases in
hematocrit at low DO x 3.1 μg/L diltiazem, which may indicate hypotensive conditions in
fish, although changes in hematocrit were not observed in other DO x diltiazem

155
treatments. Thus, diltiazem pharmacological effects have been reported in fish at various
doses, exposure durations, and species. Further research is needed to determine whether
similar mammalian pharmacodynamic mechanisms are occurring in fish, and, if so, how
such responses relate to internal plasma doses.
In humans and mammals, CCBs like diltiazem and verapamil have distinct
calcium channel binding sites while other CCBs are less specific (Spedding and Paoletti,
1992). The diltiazem target, the voltage-dependent calcium channel L-type α-1C, α-1D,
α-1F, α-1s subunits, is approximately 70-78% and 64-81% conserved in zebrafish (Danio
rerio) and Japanese medaka (Oryzias latipes; Gunnarsson et al., 2008; Verbruggen et al.,
2017), respectively. Whether genetic conservation of diltiazem and other CCB drug
targets correspond to similar pharmacological activity in fish remains unknown. As noted
above, pharmacological read-across studies have demonstrated comparative physiological
responses in fish for several pharmaceuticals (Brodin et al., 2013; Cuklev et al., 2011;
Huerta et al., 2016; Margiotta-Casaluci et al., 2014; Margiotta-Casaluci et al., 2016;
Runnalls et al., 2015; Valenti et al., 2012). The present study demonstrated a lack in
organism level responses to diltiazem alone; however, in DO x diltiazem co-exposures,
multiple physiological responses were observed. Similar studies examining the effects of
interacting stressors is necessary to determine the interacting effects of other heart
medication in fish. As the present study demonstrates, a failure to consider low DO in
toxicological assessments of cardioactive pharmaceuticals and potentially other
cardiotoxicants may underestimate their impact to non-target organisms. Here again, the
present study results demonstrate the predictive ability of the fish plasma model to
prioritize compounds for additional study by linking human therapeutic fish plasma

156
levels to physiological and pharmacological responses in fish (Brooks, 2014; Fick et al.,
2010b; Huggett et al., 2003). Additional studies with other pharmaceutical classes are
necessary to support and validate the fish plasma model, particularly under
environmentally relevant exposure scenarios. Including the influence of DO during
pharmaceutical ecological hazard and risk assessment appears necessary due to their
influence on bioconcentration and biological effects in fish. Particular research attention
should be given to urban eutrophic systems experiencing diel fluctuations in DO, pH, and
temperature (Scott et al, 2016; Valenti et al, 2011; Van Wezel, 1998). Under such
scenarios, oxygen levels plummet in parallel with decreases in pH, creating less than
optimal DO conditions for fish and increasing the percent neutral weak acid in solution.
Therefore, ecological hazard assessment of ionizable chemicals failing to consider
environmental factors will likely underestimate the fate and biological effects of these
contaminants in fish.
Conclusion
Our experimental results suggest low DO influences the uptake and physiological
effects of diltiazem in adult fathead minnows. These observed effects may be dictated by
physiological responses in fish to enhance oxygen uptake, which increases diltiazem
inhalation by increasing respiratory volume and altering pH conditions at the gill
microenvironment. Once diffusion across the gills has occurred, diltiazem distribution in
fish tissue (VD) is minimal, similar to humans, as indicated by the steady state BCFs (9
and 16) under normal and low DO conditions, respectively. Exposure water and internal
diltiazem plasma concentrations were linked to physiological responses in adult fathead

157
minnows but only at low DO conditions. Low DO minimized the time to steady state
conditions in 96 h bioconcentration studies, which corresponded to increased ventilation
rates and water flow across the gills under low DO conditions. Fish swim performance
trials indicated alterations in aerobic respiration energy supply-demand dynamics in 24 h
DO x diltiazem studies, which corresponded to nonsignificant decreases in fathead
minnow Uburst and decreasing plasma lactate levels with increasing diltiazem
concentration. While the effects of environmental factors on fish toxicity (Lloyd, 1961)
and physiological mechanisms of chemical uptake across the gill (McKim and Goeden,
1982) were first studied ~six decades ago, empirical data examining these key factors and
associated mechanisms of uptake are limited and largely dependent on previous work
with persistent organic pollutants (e.g., endrin, DDT, halogenated benzenes, etc.).
Predicting chemical uptake across the gill is complex and is dependent on environmental
factors, experimental conditions, and fish species (Blewett et al., 2013b; McKim and
Goeden, 1982; Opperhuizen and Schrap, 1987); therefore, additional research is
necessary to predict ionizable chemical uptake and physiological responses in fish across
multiple environmental exposure scenarios. Studies and assessments failing to consider
low DO influences on cardiotoxicants may underestimate ecological risks to fish.
Acknowledgment
Support for this study was provided by the U.S. National Science Foundation
(Project #: CHE-1339637) with additional support from the U.S. Environmental
Protection Agency. A special thanks to Baylor Steele, Bridgett Hill, Bekah Burket, Sam
Haddad, Rachel Mole, Zach Reynolds and Adam McLaughlin for general lab support.

158
References American Public Health Association et al (1998) Standard Methods for the Examination
of Water and Wastewater, American Public Health Association Washington, DC. Ankley GT, Brooks BW, Huggett DB and Sumpter JP (2007) Repeating history:
Pharmaceuticals in the environment. Environ Sci Technol 41:8211-8217. Armitage JM, Erickson RJ, Luckenbach T, Ng CA, Prosser RS, Arnot JA, Schirmer K
and Nichols JW (2017) Assessing the bioaccumulation potential of ionizable organic compounds: current knowledge and research priorities. Environ Toxicol Chem 36:882-897.
Bean TG, Rattner BA, Lazarus RS, Day DD, Burket SR, Brooks BW, Haddad SP and Bowerman WW (2018) Pharmaceuticals in water, fish and osprey nestlings in Delaware River and Bay. Environ Pollut 232:533-545.
Berninger JP, Du B, Connors KA, Eytcheson SA, Kolkmeier MA, Prosser KN, Valenti Jr TW, Chambliss CK and Brooks BW (2011) Effects of the antihistamine diphenhydramine on selected aquatic organisms. Environ Toxicol Chem 30:2065-2072.
Blewett T, MacLatchy DL and Wood CM (2013a) The effects of temperature and salinity on 17-α-ethynylestradiol uptake and its relationship to oxygen consumption in the model euryhaline teleost (Fundulus heteroclitus). Aquat Toxicol 127:61-71.
Blewett TA, Robertson LM, MacLatchy DL and Wood CM (2013b) Impact of environmental oxygen, exercise, salinity, and metabolic rate on the uptake and tissue-specific distribution of 17α-ethynylestradiol in the euryhaline teleost Fundulus heteroclitus. Aquat Toxicol 138:43-51.
Boutilier RG (2001) Mechanisms of cell survival in hypoxia and hypothermia. J Exp Biol 204:3171-3181.
Boxall ABA, Rudd MA, Brooks BW, Caldwell DJ, Choi K, Hickmann S, Innes E, Ostapyk K, Staveley JP, Verslycke T, Ankley GT, Beazley KF, Belanger SE, Berninger JP, Carriquiriborde P, Coors A, DeLeo PC, Dyer SD, Ericson JF, Gagne F, Giesy JP, Gouin T, Hallstrom L, Karlsson MV, Joakim Larsson DG, Lazorchak JM, Mastrocco F, McLaughlin A, McMaster ME, Meyerhoff RD, Moore R, Parrott JL, Snape JR, Murray-Smith R, Servos MR, Sibley PK, Straub JO, Szabo ND, Topp E, Tetreault GR, Trudeau VL and Van Der Kraak G (2012) Pharmaceuticals and personal care products in the environment: What are the big questions? Environ Health Perspect 120:1221-1229.
Brauner C, Randall D, Neuman J and Thurston R (1994) The effect of exposure to 1, 2, 4, 5 tetrachlorobenzene and the relationship between toxicant and oxygen uptake in rainbow trout (Oncorhynchus mykiss) during exercise. Environ Toxicol Chem 13:1813-1820.
Braunwald E (1982) Mechanism of action of calcium-channel-blocking agents. N Engl J Med 307:1618-1627.
Breitburg D (2002) Effects of hypoxia, and the balance between hypoxia and enrichment, on coastal fishes and fisheries. Estuaries 25:767-781.
Brett J (1958) Implications and assessments of environmental stress. The Investigation of Fish-Power Problems:69-93.

159
Brett J (1964) The respiratory metabolism and swimming performance of young sockeye salmon. J Fish Res Board Can 21:1183-1226.
Brodin T, Fick J, Jonsson M and Klaminder J (2013) Dilute concentrations of a psychiatric drug alter behavior of fish from natural populations. Science 339:814-815.
Brooks B, Scott JT, Margaret GF, Theodore WV, Jacob KS, Robert DD, Kirk ED, Jim P, Randy MP, Ritchie DT and Larry K (2008) Reservoir Zonation and Water Quality. Lakeline 39.
Brooks BW (2002) Ecotoxicological investigations in effluent-dominated stream mesocosms, University of North Texas.
Brooks BW (2014) Fish on Prozac (and Zoloft): ten years later. Aqua Toxicol 151:61-67. Brooks BW, Chambliss CK, Stanley JK, Ramirez A, Banks KE, Johnson RD and Lewis
RJ (2005) Determination of select antidepressants in fish from an effluent dominated stream. Environ Toxicol Chem 24:464-469.
Brooks BW, Riley TM and Taylor RD (2006) Water quality of effluent-dominated ecosystems: Ecotoxicological, hydrological, and management considerations. Hydrobiologia 556:365-379.
Burton DT and Heath AG (1980) Ambient Oxygen Tension and Transition to Anaerobic Metabolism in Three Species of Freshwater Fish. Can J Fish Aquat Sci 37:1216-1224.
Chabot D and Claireaux G (2008) Environmental hypoxia as a metabolic constraint on fish: the case of Atlantic cod, Gadus morhua. Marine Poll Bull 57:287-294.
Claireaux G, Webber D, Kerr S and Boutilier R (1995) Physiology and behaviour of free-swimming Atlantic cod (Gadus morhua) facing fluctuating salinity and oxygenation conditions. J Exp Biol 198:61-69.
Claireaux G, Webber DM, Lagardère JP and Kerr SR (2000) Influence of water temperature and oxygenation on the aerobic metabolic scope of Atlantic cod (Gadus morhua). J Sea Res 44:257-265.
Cuklev F, Kristiansson E, Fick J, Asker N, Förlin L and Larsson DJ (2011) Diclofenac in fish: Blood plasma levels similar to human therapeutic levels affect global hepatic gene expression. Environ Toxicol Chem 30:2126-2134.
Du B, Haddad SP, Luek A, Scott WC, Saari GN, Kristofco LA, Connors KA, Rash C, Rasmussen JB and Chambliss CK (2014a) Bioaccumulation and trophic dilution of human pharmaceuticals across trophic positions of an effluent-dependent wadeable stream. Philos Trans R Soc Lond B 369:20140058.
Du B, Haddad SP, Luek A, Scott WC, Saari GN, Kristofco LA, Connors KA, Rash C, Rasmussen JB and Chambliss CK (2014b) Bioaccumulation and trophic dilution of human pharmaceuticals across trophic positions of an effluent-dependent wadeable stream. Phil Trans R Soc B 369:20140058.
Dutil JD, Sylvestre EL, Gamache L, Larocque R and Guderley H (2007) Burst and coast use, swimming performance and metabolism of Atlantic cod Gadus morhua in sub lethal hypoxic conditions. J Fish Biol 71:363-375.
Erickson RJ, McKim JM, Lien GJ, Hoffman AD, Batterman SL (2006) Uptake and elimination of ionizable organic chemicals at fish gills: II. Observed and predicted effects of pH, alkalinity, and chemical properties. Environ Toxicol Chem 25:1522-1532.

160
Evans DH, Piermarini PM and Choe KP (2005) The multifunctional fish gill: dominant site of gas exchange, osmoregulation, acid-base regulation, and excretion of nitrogenous waste. Physiol Rev 85:97-177.
Farrell AP and Richards JG (2009) Chapter 11 Defining Hypoxia: An Integrative Synthesis of the Responses of Fish to Hypoxia, in Fish Physiology (Richards JG, Farrell AP and Brauner CJ eds) pp 487-503, Academic Press.
Fick J, Lindberg RH, Parkkonen J, Arvidsson Br, Tysklind M and Larsson DJ (2010a) Therapeutic levels of levonorgestrel detected in blood plasma of fish: results from screening rainbow trout exposed to treated sewage effluents. Environ Sci Technol 44:2661-2666.
Fick J, Lindberg RH, Tysklind M and Larsson DGJ (2010b) Predicted critical environmental concentrations for 500 pharmaceuticals. Regul Toxicol Pharmacol 58:516-523.
Fitzsimmons PN, Fernandez JD, Hoffman AD, Butterworth BC and Nichols JW (2001) Branchial elimination of superhydrophobic organic compounds by rainbow trout (Oncorhynchus mykiss ). Aquat Toxicol 55:23-34.
Gee JH, Tallman RF and Smart HJ (1978) Reactions of some great plains fishes to progressive hypoxia. Can J Zool 56:1962-1966.
Gunnarsson L, Jauhiainen A, Kristiansson E, Nerman O and Larsson DGJ (2008) Evolutionary conservation of human drug targets in organisms used for environmental risk assessments. Environ Sci Technol 42:5807-5813.
Halling-Sorensen B, Nors Nielsen S, Lanzky PF, Ingerslev F, Holten Lützhøft HC and Jørgensen SE (1998) Occurrence, fate and effects of pharmaceutical substances in the environment-a review. Chemosphere 36:357-393.
Heathwaite AL (2010) Multiple stressors on water availability at global to catchment scales: Understanding human impact on nutrient cycles to protect water quality and water availability in the long term. Fresh Biol 55:241-257.
Herbert N and Steffensen J (2005) The response of Atlantic cod, Gadus morhua, to progressive hypoxia: fish swimming speed and physiological stress. Mar Biol 147:1403-1412.
Hesser EF (1960) Methods for routine fish hematology. The Progressive Fish Culturist 22:164-171.
Hooper MJ (2013) Interactions between chemical and climate stressors: A role for mechanistic toxicology in assessing climate change risks. Environ Toxicol Chem 32:32; 32-48; 48.
Huerta B, Margiotta Casaluci L, Rodríguez Mozaz S, Scholze M, Winter MJ, Barceló D and Sumpter JP (2016) Anti anxiety drugs and fish behaviour: Establishing the link between internal concentrations of oxazepam and behavioural effects. Environ Toxicol Chem 35: 2782-2790.
Huggett DB, Cook JC, Ericson JF and Williams RT (2003) A theoretical model for utilizing mammalian pharmacology and safety data to prioritize potential impacts of human pharmaceuticals to fish. Hum Ecol Risk Assess 9:1789-1799.
Ishibashi Y, Ekawa H, Hirata H and Kumai H (2002) Stress response and energy metabolism in various tissues of Nile tilapia Oreochromis niloticus exposed to hypoxic conditions. Fish Sci 68:1374-1383.

161
Jones DR (1971) The effect of hypoxia and anaemia on the swimming performance of rainbow trout (Salmo gairdneri). J Exp Biol 55:541-551.
Kolpin DW, Furlong ET, Meyer MT, Thurman EM, Zaugg SD, Barber LB and Buxton HT (2002) Pharmaceuticals, hormones, and other organic wastewater contaminants in US streams, 1999-2000: A national reconnaissance. Environ Sci Technol 36:1202-1211.
Law V, Knox C, Djoumbou Y, Jewison T, Guo AC, Liu Y, Maciejewski A, Arndt D, Wilson M and Neveu V (2013) DrugBank 4.0: shedding new light on drug metabolism. Nucleic Acids Res 42:D1091-D1097.
Lazarus RS, Rattner BA, Brooks BW, Du B, McGowan PC, Blazer VS and Ottinger MA (2015) Exposure and food web transfer of pharmaceuticals in ospreys (Pandion haliaetus): Predictive model and empirical data. Integr Environ Assess Manag 11:118-129.
Lloyd R (1961) Effect of dissolved oxygen concentrations on the toxicity of several poisons to rainbow trout (Salmo gairdnerii Richardson). J Exp Biol 38:447-455.
Maitra SR, Krikhely M, Dulchavsky SA, Geller ER, Kreis Jr DJ. (1991) Beneficial effects of diltiazem in hemorrhagic shock. Circ Shock 33:121-125.
Margiotta-Casaluci L, Owen SF, Cumming RI, de Polo A, Winter MJ, Panter GH, Rand-Weaver M and Sumpter JP (2014) Quantitative cross-species extrapolation between humans and fish: the case of the anti-depressant fluoxetine. PloS ONE 9:e110467.
Margiotta-Casaluci L, Owen SF, Huerta B, Rodríguez-Mozaz S, Kugathas S, Barceló D, Rand-Weaver M and Sumpter JP (2016) Internal exposure dynamics drive the Adverse Outcome Pathways of synthetic glucocorticoids in fish. Scientific Reports 6.
McKim JM and Erickson RJ (1991) Environmental impacts on the physiological mechanisms controlling xenobiotic transfer across fish gills. Physiological Zoology 64:39-67.
McKim JM and Goeden HM (1982) A direct measure of the uptake efficiency of a xenobiotic chemical across the gills of brook trout (Salvelinus fontinalis) under normoxic and hypoxic conditions. Comp Biochem Phys C 72:65-74.
Muusze B, Marcon J, van den Thillart G and Almeida-Val V (1998) Hypoxia tolerance of Amazon fish: Respirometry and energy metabolism of the cichlid Astronotus Ocellatus. Comp Biochem Phys A 120:151-156.
Nichols JW, Du B, Berninger JP, Connors KA, Chambliss CK, Erickson RJ, Hoffman AD and Brooks BW (2015) Observed and modeled effects of pH on bioconcentration of diphenhydramine, a weakly basic pharmaceutical, in fathead minnows. Environ Toxicol Chem 34: 1425-1435
Nilsson GE (2007) Gill remodeling in fish–a new fashion or an ancient secret? J Exp Biol 210:2403-2409.
Opperhuizen A and Schrap SM (1987) Relationships between aqueous oxygen concentration and uptake and elimination rates during bioconcentration of hydrophobic chemicals in fish. Environ Toxicol Chem 6:335-342.
Parker T, Libourel P-A, Hetheridge MJ, Cumming RI, Sutcliffe TP, Goonesinghe AC, Ball JS, Owen SF, Chomis Y and Winter MJ (2014) A multi-endpoint in vivo

162
larval zebrafish (Danio rerio) model for the assessment of integrated cardiovascular function. J Pharmacol Toxicol 69:30-38.
Perry SF, Jonz MG and Gilmour KM (2009) Chapter 5 Oxygen Sensing And The Hypoxic Ventilatory Response, in Fish Physiology (Richards JG, Farrell AP and Brauner CJ eds) pp 193-253, Academic Press.
Postel S (2010) Water adapting to a new normal. The Post Carbon Reader: Managing the 21st Century’s Sustainability Crises, Healdsburg, CA: Watershed Media.
Ramirez AJ, Brain RA, Usenko S, Mottaleb MA, O'Donnell JG, Stahl LL, Wathen JB, Snyder BD, Pitt JL and Perez Hurtado P (2009) Occurrence of pharmaceuticals and personal care products in fish: results of a national pilot study in the United States. Environ Toxicol Chem 28:2587-2597.
Rand-Weaver M, Margiotta-Casaluci L, Patel A, Panter GH, Owen SF and Sumpter JP (2013) The read-across hypothesis and environmental risk assessment of pharmaceuticals. Environ Sci Technol 47:11384-11395.
Randall D (1982) The control of respiration and circulation in fish during exercise and hypoxia. J Exp Biol 100:275-288.
Reuter H (1983) Calcium channel modulation by neurotransmitters, enzymes and drugs. Nature 301:569-574.
Richards JG (2009) Chapter 10 Metabolic and Molecular Responses of Fish to Hypoxia, in Fish Physiology (Jeffrey G. Richards APF and Colin JB eds) pp 443-485, Academic Press.
Runnalls TJ, Beresford N, Kugathas S, Margiotta-Casaluci L, Scholze M, Scott AP and Sumpter JP (2015) From single chemicals to mixtures—Reproductive effects of levonorgestrel and ethinylestradiol on the fathead minnow. Aquat Toxicol 169:152-167.
Saari GN, Scott WC and Brooks BW (2017) Global assessment of calcium channel blockers in the environment: Review and analysis of occurrence, ecotoxicology and hazards in aquatic systems. Chemosphere.
Saari GN, Corrales J, Haddad SP, Chambliss CK, Brooks BW (2018) Influence of diltiazem on fathead minnows across dissolved oxygen gradients. Environmental Toxicology and Chemistry https://doi.org/10.1002/etc.4242
Scott WCC, Du B, Haddad SP, Breed CS, Saari GN, Kelly M, Broach L, Chambliss CK and Brooks BW (2016) Predicted and observed therapeutic dose exceedences of ionizable pharmaceuticals in fish plasma from urban coastal systems. Environ Toxicol Chem 35:983-995.
Sørhus E, Incardona JP, Karlsen Ø, Linbo T, Sørensen L, Nordtug T, van der Meeren T, Thorsen A, Thorbjørnsen M and Jentoft S (2016) Crude oil exposures reveal roles for intracellular calcium cycling in haddock craniofacial and cardiac development. Scientific Reports 6.
Spedding M and Paoletti R (1992) Classification of calcium channels and the sites of action of drugs modifying channel function. Pharmacol Rev 44:363-376.
Stanley JK (2006) Effects of chiral contaminants to aquatic organisms: pharmaceuticals as model compounds for enantiomer specific ecological hazard assessment, Baylor University.

163
Stecyk JAW (2017) 5 - Cardiovascular Responses to Limiting Oxygen Levels, in Fish Physiology (Gamperl AK, Gillis TE, Farrell AP and Brauner CJ eds) pp 299-371, Academic Press.
Steinbach C, Burkina V, Schmidt-Posthaus H, Stara A, Kolarova J, Velisek J, Randak T and Kroupova HK (2016) Effect of the human therapeutic drug diltiazem on the haematological parameters, histology and selected enzymatic activities of rainbow trout Oncorhynchus mykiss. Chemosphere 157:57-64.
Tanoue R, Nomiyama K, Nakamura H, Kim JW, Isobe T, Shinohara R, Kunisue T and Tanabe S (2015) Uptake and Tissue Distribution of Pharmaceuticals and Personal Care Products in Wild Fish from Treated-Wastewater-Impacted Streams. Environ Sci Technol 49:11649-11658.
Ternes TA (1998) Occurrence of drugs in German sewage treatment plants and rivers. Water Research 32:3245-3260.
Thronson A (2008) Fifty-Five Years of Fish Kills in Coastal Texas. Estuaries and Coasts 31:802; 802-813; 813.
Valenti Jr TW, Taylor JM, Back JA, King RS, Brooks BW (2011) Influence of drought and total phosphorus on diel pH in wadeable streams: implications for ecological risk assessment of ionizable contaminants. Integr Environ Assess Manag 7:636-647.
Valenti Jr TW, Gould GG, Berninger JP, Connors KA, Keele NB, Prosser KN and Brooks BW (2012) Human therapeutic plasma levels of the selective serotonin reuptake inhibitor (SSRI) sertraline decrease serotonin reuptake transporter binding and shelter-seeking behavior in adult male fathead minnows. Environ Sci Technol 46:2427-2435.
van Raaij M, Van den Thillart G, Vianen G, Pit D, Balm P and Steffens A (1996a) Substrate mobilization and hormonal changes in rainbow trout (Oncorhynchus mykiss) and common carp (Cyprinus carpio) during deep hypoxia and subsequent recovery. J Comp Phys B 166:443-452.
van Raaij MT, Pit DS, Balm PH, Steffens AB and van den Thillart GE (1996b) Behavioral strategy and the physiological stress response in rainbow trout exposed to severe hypoxia. Hormones and Behavior 30:85-92.
Verbruggen B, Gunnarsson L, Kristiansson E, Österlund T, Owen SF, Snape JR and Tyler CR (2017) ECOdrug: a database connecting drugs and conservation of their targets across species. Nucleic Acids Res 46:D930-D936.
Waiser MJ, Tumber V and Holm J (2011) Effluent-dominated streams. Part 1: Presence and effects of excess nitrogen and phosphorus in Wascana Creek, Saskatchewan, Canada. Environ Toxicol Chem 30:496-507.
Wells RMG (2009) Chapter 6 Blood Gas Transport and Hemoglobin Function: Adaptations for Functional and Environmental Hypoxia, in Fish Physiology (Richards JG, Farrell AP and Brauner CJ eds) pp 255-299, Academic Press.
Wezel AP (1998) Chemical and biological aspects of ecotoxicological risk assessment of ionizable and neutral organic compounds in fresh and marine waters: a review. Environ Rev 6: 123-137
Wishart DS, Knox C, Guo AC, Shrivastava S, Hassanali M, Stothard P, Chang Z and Woolsey J (2006) DrugBank: a comprehensive resource for in silico drug discovery and exploration. Nucleic Acids Res 34:D668-D672.

164
Wood CM (2011) 1 - An introduction to metals in fish physiology and toxicology: basic principles, in Fish Physiology (Wood CM, Farrell AP and Brauner CJ eds) pp 1-51, Academic Press.
Yang R, Brauner C, Thurston V, Neuman J and Randall DJ (2000) Relationship between toxicant transfer kinetic processes and fish oxygen consumption. Aquat Toxicol 48:95-108.

165
APPENDICES

166
APPENDIX A
Supplemental Information for Chapter Two

167
Supp
lem
enta
ry T
able
16:
Dis
solv
ed o
xyge
n to
xici
ty v
alue
s us
ed to
cre
ate
spec
ies
sens
itivi
ty d
istri
butio
ns fr
om b
oth
pre-
1986
and
rece
ntly
pub
lishe
d da
ta o
n th
e ef
fect
s of
low
DO
to f
resh
wat
er f
ish
and
inve
rtebr
ates
. Ref
eren
ces
are
give
n fo
r ea
ch s
tudy
use
d in
SSD
s in
clud
ing
the
type
of
orga
nism
s, sp
ecie
s, co
mm
on
nam
e, li
fe st
age,
test
dur
atio
n, e
xper
imen
tal t
empe
ratu
re, m
edia
n le
thal
con
cent
ratio
n or
50%
eff
ectiv
e co
ncen
tratio
n (L
C50
/EC
50),
and
the
para
met
er c
alcu
late
d.
Not
e: G
M, (
-), a
nd M
CT
repr
esen
t geo
met
ric m
ean,
an
unkn
own
mea
sure
of c
entra
l ten
denc
y, a
nd m
easu
re o
f cen
tral t
ende
ncy,
resp
ectiv
ely.
Spec
ies
Com
mon
N
ame
Life
Sta
ge
Tes
t D
urat
ion
Tem
pera
ture
(°
C)
End
poin
t
Tox
icity
V
alue
(m
g D
O/L
) M
CT
R
efer
ence
Ac
ute
Inve
rteb
rate
Tox
icity
Dat
a
Ac
rone
uria
ly
cori
as
Ston
efly
La
rvae
96
h
19
LC50
3.
60
Med
ian
Neb
eker
19
72
Acro
neur
ia
paci
fica
Ston
efly
-
96 h
6
LC50
1.
60
- G
aufin
19
73
Anab
olia
ne
rvos
a C
addi
sfly
N
early
gro
wn
nym
phs
5 h
25
LC50
0.
66
- Ja
cob
et
al, 1
984
Arcy
nopt
eryx
au
rea
Ston
efly
-
96 h
6
LC50
3.
30
- G
aufin
19
73
Asel
lus
inte
rmed
ius
Am
phip
od
- 24
h
20
LC50
0.
03
- Sp
ragu
e 19
63
Baet
is a
lpin
us
May
fly
Nea
rly g
row
n ny
mph
s 5
h 12
LC
50
8.13
-
Jaco
b et
al
, 198
4
Baet
is a
lpin
us
May
fly
Nea
rly g
row
n ny
mph
s 5
h 15
LC
50
8.31
-
Jaco
b et
al
, 198
4
Baet
is n
iger
M
ayfly
N
early
gro
wn
nym
phs
5 h
20
LC50
3.
87
- Ja
cob
et
al, 1
984
Baet
is v
ernu
s M
ayfly
N
early
gro
wn
nym
phs
5 h
12
LC50
2.
99
- Ja
cob
et
al, 1
984
Baet
isca
la
uren
tina
May
fly
Larv
ae
96 h
19
LC
50
3.50
M
edia
n N
ebek
er
1972
Br
achy
tron
ha
fnie
nse
Dra
gonf
ly
Nea
rly g
row
n ny
mph
s 5
h 30
LC
50
1.99
-
Jaco
b et
al
, 198
4 C
allib
aetis
m
onta
nus
May
fly
- 96
h
6 LC
50
4.40
-
Gau
fin
1973
C
listo
roni
a m
anifi
ca
Cad
disf
ly
Inst
ar I
96 h
17
LC
50
1.95
-
Neb
eker
et
al, 1
996

168
Clis
toro
nia
man
ifica
C
addi
sfly
In
star
IV
96 h
18
LC
50
1.30
-
Neb
eker
et
al, 1
996
Clo
eon
sim
ile
May
fly
Nea
rly g
row
n ny
mph
s 5
h 15
LC
50
1.12
-
Jaco
b et
al
, 198
4
Clo
eon
sim
ile
May
fly
Nea
rly g
row
n ny
mph
s 5
h 20
LC
50
2.13
-
Jaco
b et
al
, 198
4
Clo
eon
sim
ile
May
fly
Nea
rly g
row
n ny
mph
s 5
h 25
LC
50
2.64
-
Jaco
b et
al
, 198
4
Clo
eon
sim
ile
May
fly
Nea
rly g
row
n ny
mph
s 5
h 30
LC
50
3.44
-
Jaco
b et
al
, 198
4
Dap
hnia
mag
na
Wat
er fl
ea
4 d
old
48 h
13
LC
50
0.65
G
M
Neb
eker
et
al, 1
992
Dap
hnia
pul
ex
Wat
er fl
ea
5-6
d 48
-96
h 17
LC
50
0.51
G
M
Neb
eker
et
al, 1
992
Diu
ra k
now
ltoni
St
onef
ly
- 96
h
6 LC
50
3.60
-
Gau
fin
1973
Dru
sinu
s sp.
C
addi
sfly
-
96 h
6
LC50
1.
80
- G
aufin
19
73
Epeo
rus
sylv
icol
a M
ayfly
N
early
gro
wn
nym
phs
5 h
12
LC50
8.
07
- Ja
cob
et
al, 1
984
Epeo
rus
sylv
icol
a M
ayfly
N
early
gro
wn
nym
phs
5 h
15
LC50
8.
08
- Ja
cob
et
al, 1
984
Epeo
rus
sylv
icol
a M
ayfly
N
early
gro
wn
nym
phs
5 h
20
LC50
8.
75
- Ja
cob
et
al, 1
984
Ephe
mer
a da
nica
M
ayfly
N
early
gro
wn
nym
phs
5 h
15
LC50
0.
06
- Ja
cob
et
al, 1
984
Ephe
mer
a da
nica
M
ayfly
N
early
gro
wn
nym
phs
5 h
20
LC50
0.
34
- Ja
cob
et
al, 1
984
Ephe
mer
a vu
lgat
a M
ayfly
N
early
gro
wn
nym
phs
5 h
15
LC50
0.
03
- Ja
cob
et
al, 1
984
Ephe
mer
a vu
lgat
a M
ayfly
N
early
gro
wn
nym
phs
5 h
20
LC50
0.
03
- Ja
cob
et
al, 1
984
Ephe
mer
a vu
lgat
a M
ayfly
N
early
gro
wn
nym
phs
5 h
25
LC50
0.
04
- Ja
cob
et
al, 1
984

169
Ephe
mer
ella
m
ucro
nata
M
ayfly
N
early
gro
wn
nym
phs
5 h
15
LC50
1.
22
- Ja
cob
et
al, 1
984
Ephe
mer
ella
m
ucro
nata
M
ayfly
N
early
gro
wn
nym
phs
5 h
20
LC50
1.
74
- Ja
cob
et
al, 1
984
Ephe
mer
ella
m
ucro
nata
M
ayfly
N
early
gro
wn
nym
phs
5 h
25
LC50
4.
08
- Ja
cob
et
al, 1
984
Ephe
mer
illa
dodd
si M
ayfly
-
96 h
6
LC50
5.
20
- G
aufin
19
73
Ephe
mer
illa
gran
dis
May
fly
- 96
h
6 LC
50
3.00
-
Gau
fin
1973
Ep
hem
erill
a su
bvar
ia
May
fly
Larv
ae
96 h
19
LC
50
3.90
M
edia
n N
ebek
er
1972
G
amm
arus
fa
scia
tus
Am
phip
od
- 24
h
20
LC50
4.
30
- Sp
ragu
e 19
63
Gam
mar
us
pseu
dolim
naeu
s A
mph
ipod
-
24 h
20
LC
50
2.20
-
Spra
gue
1963
Gam
mar
us
pseu
dolim
naeu
s A
mph
ipod
ad
ult
24h
15
LC50
1.
80
GM
Hob
ack
and
Bar
nhar
t 19
96
Gam
mar
us
pseu
dolim
naeu
s A
mph
ipod
Ju
veni
le
24h
15
LC50
1.
03
GM
Hob
ack
and
Bar
nhar
t 19
96
Hex
agen
ia
limba
ta
May
fly
- 96
h
6 LC
50
1.80
-
Gau
fin
1973
H
exag
enia
lim
bata
M
ayfly
La
rvae
96
h
19
LC50
1.
40
Med
ian
Neb
eker
19
72
Hya
lella
azt
eca
Am
phip
od
- 24
h
20
LC50
0.
70
- Sp
ragu
e 19
63
Hyd
rops
yche
be
tteri
Cad
disf
ly
Larv
ae
96 h
21
LC
50
2.90
M
edia
n N
ebek
er
1972
H
ydro
psyc
he
bette
ri C
addi
sfly
La
rvae
96
h
19
LC50
2.
60
Med
ian
Neb
eker
19
72

170
Hyd
rops
yche
be
tteri
Cad
disf
ly
Larv
ae
96 h
17
LC
50
2.30
M
edia
n N
ebek
er
1972
H
ydro
psyc
he
bette
ri C
addi
sfly
La
rvae
96
h
10
LC50
1.
00
Med
ian
Neb
eker
19
72
Hyd
rops
yche
sp.
Cad
disf
ly
- 96
h
6 LC
50
3.60
-
Gau
fin
1973
Le
ptop
hleb
ia
nebu
losa
M
ayfly
La
rvae
96
h
19
LC50
2.
20
Med
ian
Neb
eker
19
72
Lept
pohl
ebia
m
argi
nata
M
ayfly
N
early
gro
wn
nym
phs
5 h
15
LC50
0.
14
- Ja
cob
et
al, 1
984
Lept
pohl
ebia
m
argi
nata
M
ayfly
N
early
gro
wn
nym
phs
5 h
20
LC50
0.
15
- Ja
cob
et
al, 1
984
Lept
pohl
ebia
m
argi
nata
M
ayfly
N
early
gro
wn
nym
phs
5 h
25
LC50
0.
91
- Ja
cob
et
al, 1
984
Lept
pohl
ebia
m
argi
nata
M
ayfly
N
early
gro
wn
nym
phs
5 h
30
LC50
1.
92
- Ja
cob
et
al, 1
984
Lest
es sp
onsa
D
amse
lfly
Nea
rly g
row
n ny
mph
s 5
h 20
LC
50
0.92
-
Jaco
b et
al
, 198
4 Li
mne
philu
s or
natu
s C
addi
sfly
-
96 h
6
LC50
3.
40
- G
aufin
19
73
Nem
oura
ci
nctip
es
Ston
efly
-
96 h
6
LC50
3.
30
- G
aufin
19
73
Nem
oura
ci
nere
a St
onef
ly
Nea
rly g
row
n ny
mph
s 5
h 12
LC
50
1.13
-
Jaco
b et
al
, 198
4 N
emou
ra
cine
rea
Ston
efly
N
early
gro
wn
nym
phs
5 h
25
LC50
2.
68
- Ja
cob
et
al, 1
984
Neo
phyl
ax sp
. C
addi
sfly
-
96 h
6
LC50
3.
80
- G
aufin
19
73
Neo
thre
mm
a al
icia
C
addi
sfly
-
96 h
6
LC50
1.
70
- G
aufin
19
73
Ony
chog
omph
us
forc
ipat
us
Dra
gonf
ly
Nea
rly g
row
n ny
mph
s 5
h 25
LC
50
1.18
-
Jaco
b et
al
, 198
4 O
nych
ogom
phus
fo
rcip
atus
D
rago
nfly
N
early
gro
wn
nym
phs
5 h
30
LC50
1.
14
- Ja
cob
et
al, 1
984

171
Para
neph
rops
pl
anifr
ons
Cra
yfis
h A
dult/
Juve
nile
48
h
17
LC50
0.
77
Mea
n La
ndm
an
et a
l, 20
05
Para
tya
curv
iros
tris
C
rayf
ish
Adu
lt/Ju
veni
le
48 h
15
LC
50
0.82
M
ean
Land
man
et
al,
2005
Pt
eron
arce
lla
badi
a St
onef
ly
- 96
h
6 LC
50
2.40
-
Gau
fin
1973
Pt
eron
arcy
s ca
lifor
nica
St
onef
ly
- 96
h
6 LC
50
3.53
G
M
Gau
fin
1973
Pt
eron
arcy
s do
rsat
a St
onef
ly
Larv
ae
96 h
19
LC
50
2.20
M
edia
n N
ebek
er
1972
Rham
dia
quel
en
Silv
er
catfi
sh
Juve
nile
24
-96
h 27
LC
50
0.52
G
M
Wei
ss a
nd
Zani
boni
-Fi
lho,
20
10
Rham
dia
quel
en
Silv
er
catfi
sh
Juve
nile
96
h
26
LC50
0.
52
- B
raun
et
al, 2
006
Rhith
roge
na
irid
ina
May
fly
Nea
rly g
row
n ny
mph
s 5
h 12
LC
50
5.36
-
Jaco
b et
al
, 198
4 Rh
yaco
phila
ob
liter
ata
Cad
disf
ly
Nea
rly g
row
n ny
mph
s 5
h 15
LC
50
7.07
-
Jaco
b et
al
, 198
4
Sial
is lu
tari
a A
lder
fly
Nea
rly g
row
n ny
mph
s 5
h 20
LC
50
0.96
-
Jaco
b et
al
, 198
4
Sial
is lu
tari
a A
lder
fly
Nea
rly g
row
n ny
mph
s 5
h 25
LC
50
0.89
-
Jaco
b et
al
, 198
4
Sial
is lu
tari
a A
lder
fly
Nea
rly g
row
n ny
mph
s 5
h 30
LC
50
0.95
-
Jaco
b et
al
, 198
4
Silo
pal
lipes
C
addi
sfly
N
early
gro
wn
nym
phs
5 h
12
LC50
7.
87
- Ja
cob
et
al, 1
984
Silo
pal
lipes
C
addi
sfly
N
early
gro
wn
nym
phs
5 h
15
LC50
7.
99
- Ja
cob
et
al, 1
984
Sim
uliu
m
vitta
tum
M
idge
-
96 h
6
LC50
3.
20
- G
aufin
19
73
Siph
lonu
rus
aest
ival
is M
ayfly
N
early
gro
wn
nym
phs
5 h
20
LC50
0.
48
- Ja
cob
et
al, 1
984

172
Siph
lonu
rus
aest
ival
is M
ayfly
N
early
gro
wn
nym
phs
5 h
25
LC50
0.
54
- Ja
cob
et
al, 1
984
Siph
lonu
rus
lacu
stri
s M
ayfly
N
early
gro
wn
nym
phs
5 h
15
LC50
2.
83
- Ja
cob
et
al, 1
984
Siph
lonu
rus
lacu
stri
s M
ayfly
N
early
gro
wn
nym
phs
5 h
20
LC50
3.
17
- Ja
cob
et
al, 1
984
Siph
lonu
rus
lacu
stri
s M
ayfly
N
early
gro
wn
nym
phs
5 h
25
LC50
3.
39
- Ja
cob
et
al, 1
984
Sym
pecm
a fu
sca
Dam
selfl
y N
early
gro
wn
nym
phs
5 h
20
LC50
0.
79
- Ja
cob
et
al, 1
984
Sym
pecm
a fu
sca
Dam
selfl
y N
early
gro
wn
nym
phs
5 h
25
LC50
1.
27
- Ja
cob
et
al, 1
984
Sym
pecm
a fu
sca
Dam
selfl
y N
early
gro
wn
nym
phs
5 h
30
LC50
1.
71
- Ja
cob
et
al, 1
984
Chr
onic
Inve
rteb
rate
Tox
icity
Dat
a Ba
etis
ca
laur
entin
a M
ayfly
La
rvae
30
d
19
LC50
5.
00
Med
ian
Neb
eker
19
72
Clis
toro
nia
man
ifica
C
addi
sfly
Em
bryo
21
d
17
LC50
2.
00
- N
ebek
er e
t al
, 199
6 Ep
hem
era
sim
ulan
s M
ayfly
La
rvae
30
d
19
LC50
4.
50
Med
ian
Neb
eker
19
72
Gam
mar
us
lacu
stri
s A
mph
ipod
A
dult
168
h 13
LC
50
0.49
G
M
Neb
eker
et
al, 1
992
Pter
onar
cys
dors
ata
Ston
efly
La
rvae
30
d 19
LC
50
4.80
M
edia
n N
ebek
er
1972
Pt
eron
arcy
s do
rsat
a St
onef
ly
Larv
ae
30d
19
LC50
4.
40
Med
ian
Neb
eker
19
72
Acut
e Fi
sh T
oxic
ity D
ata
Angu
illa
aust
ralis
Sh
ortfi
n ee
l El
vers
48
h
15
LC50
0.
54
Mea
n La
ndm
an
et a
l, 20
05
Cha
smis
tes
brev
iros
tris
Sh
ortn
ose
suck
er
Larv
al
24-9
6 h
32
LC50
2.
09
GM
Sa
iki e
t al,
1999
C
hasm
iste
s br
evir
ostr
is
Shor
tnos
e su
cker
Ju
veni
le
24-9
6 h
30
LC50
1.
34
Mea
n Sa
iki e
t al,
1999

173
Del
tiste
s lux
atus
Lo
st R
iver
Su
cker
La
rval
(35
d ol
d)
24-9
6 h
32
LC50
2.
10
GM
Sa
iki e
t al,
1999
Del
tiste
s lux
atus
Lo
st R
iver
Su
cker
Ju
veni
le (3
-7
mon
ths o
ld)
24-9
6 h
31
LC50
1.
62
GM
Sa
iki e
t al,
1999
G
alax
ias
mac
ulat
us
Inan
ga
Whi
teba
it 48
h
15
LC50
2.
65
Mea
n La
ndm
an
et a
l, 20
05
Gob
iom
orph
us
cotid
ianu
s C
omm
on
bully
Ju
veni
le/F
ry
48 h
15
LC
50
0.84
G
M
Land
man
et
al,
2005
Not
ropi
s top
eka
Tope
ka
shin
er
Adu
lt 96
h
28
LC50
1.
26
Mea
n
Koe
hle
and
Ade
lman
, 20
07
Onc
orhy
nchu
s m
ykis
s R
ainb
ow
trout
Pa
rr
48 h
15
LC
50
1.62
M
ean
Land
man
et
al,
2005
O
ncor
hync
hus
myk
iss
Rai
nbow
tro
ut
Swim
-up-
fry
48 h
15
LC
50
1.59
M
ean
Land
man
et
al,
2005
Re
trop
inna
re
tropi
nna
Com
mon
sm
elt
Adu
lt 48
h
15
LC50
1.
83
Mea
n La
ndm
an
et a
l, 20
05
Chr
onic
Fish
Tox
icity
Dat
a
Esox
luci
us
Nor
ther
n Pi
ke
Juve
nile
42
-48
d 19
EC
50
1.73
-
Ade
lman
an
d Sm
ith,
1970
Ic
talu
rus
punc
tatu
s C
hann
el
Cat
fish
Juve
nile
69
-71
d 25
EC
50
0.79
-
Car
lson
et
al, 1
980
Mic
ropt
erus
sa
lmoi
des
Larg
emou
th
Bas
s Ju
veni
le
14 d
19
EC
50
1.53
G
M
Bra
ke,
1972
M
icro
pter
us
salm
oide
s La
rgem
outh
B
ass
Juve
nile
11
-15.
5 d
25
EC50
2.
38
- St
ewar
t, 19
67
Mic
ropt
erus
sa
lmoi
des
Larg
emou
th
Bas
s Ju
veni
le
11-1
5.5
d 26
EC
50
2.28
-
Stew
art,
1967
Pe
rca
flave
scen
s Y
ello
w
Perc
h Ju
veni
le
25 d
25
EC
50
0.55
-
Car
lson
et
al, 1
980
Esox
luci
us
Nor
ther
n Pi
ke
Juve
nile
42
-48
d 19
EC
10
4.95
-
Ade
lman
an
d Sm
ith,
1970

174
Icta
luru
s pu
ncta
tus
Cha
nnel
C
atfis
h Ju
veni
le
69-7
1 d
25
EC10
4.
54
- C
arls
on e
t al
, 198
0 M
icro
pter
us
salm
oide
s La
rgem
outh
B
ass
Juve
nile
14
d
25
EC10
3.
92
- B
rake
, 19
72
Mic
ropt
erus
sa
lmoi
des
Larg
emou
th
Bas
s Ju
veni
le
11-1
5.5
d 26
EC
10
4.51
-
Stew
art,
1967
M
icro
pter
us
salm
oide
s La
rgem
outh
B
ass
Juve
nile
11
-15.
5 d
19
EC10
6.
41
- St
ewar
t, 19
67
Perc
a fla
vesc
ens
Yel
low
Pe
rch
Juve
nile
25
d
25
EC10
4.
74
- C
arls
on e
t al
, 198
0
Onc
orhy
nchu
s ki
sutc
h C
oho
Salm
on
Fing
erlin
gs
42 d
15
EC
50
1.92
-
Bre
tt an
d B
lack
burn
, 19
81
Onc
orhy
nchu
s ki
sutc
h C
oho
Salm
on
Juve
nile
18
-20
d 13
EC
50
2.26
G
M
War
ren,
19
73
Onc
orhy
nchu
s ki
sutc
h C
oho
Salm
on
Juve
nile
13
d
18
EC50
1.
38
- W
arre
n,
1973
O
ncor
hync
hus
kisu
tch
Coh
o Sa
lmon
Ju
veni
le
20 d
9
EC50
1.
68
- W
arre
n,
1973
O
ncor
hync
hus
kisu
tch
Coh
o Sa
lmon
Ju
veni
le
20 d
22
EC
50
0.72
-
War
ren,
19
73
Onc
orhy
nchu
s ki
sutc
h C
oho
Salm
on
Fing
erlin
gs
18 d
18
EC
50
2.13
G
M
Fish
er,
1963
O
ncor
hync
hus
kisu
tch
Coh
o Sa
lmon
Ju
veni
le
21 d
20
EC
50
3.08
G
M
Her
rman
n,
1962
O
ncor
hync
hus
myk
iss
Rai
nbow
tro
ut
- 54
-71
d 12
EC
50
2.04
G
M
Spoo
r, 19
81
Onc
orhy
nchu
s ne
rka
Sock
eye
Salm
on
Fing
erlin
gs
42 d
15
EC
50
3.03
-
Bre
tt an
d B
lack
burn
, 19
81
Onc
orhy
nchu
s ts
haw
ytsc
ha
Chi
nook
Sa
lmon
Ju
veni
le
20 d
13
EC
50
1.77
G
M
War
ren,
19
73
Onc
orhy
nchu
s ts
haw
ytsc
ha
Chi
nook
Sa
lmon
Ju
veni
le
20 d
8
EC50
1.
98
- W
arre
n,
1973

175
Onc
orhy
nchu
s ts
haw
ytsc
ha
Chi
nook
Sa
lmon
Ju
veni
le
20 d
18
EC
50
3.65
G
M
War
ren,
19
73
Onc
orhy
nchu
s ts
haw
ytsc
ha
Chi
nook
Sa
lmon
Ju
veni
le
20 d
22
EC
50
4.44
-
War
ren,
19
73
Salm
o tr
utta
B
row
n tro
ut
- 60
d
12
EC50
2.
26
- Sp
oor,
1981
Sa
lvel
inus
fo
ntin
alis
Bro
ok tr
out
- 62
d
12
EC50
1.
96
- Sp
oor,
1981
Sa
lvel
inus
na
may
cush
La
ke tr
out
- 96
-131
d
12
EC50
1.
93
GM
Sp
oor,
1981
O
ncor
hync
hus
kisu
tch
Coh
o Sa
lmon
Fi
nger
lings
18
d
18
EC10
5.
18
GM
Fi
sher
, 19
63
Onc
orhy
nchu
s ki
sutc
h C
oho
Salm
on
Juve
nile
21
d
20
EC10
4.
48
GM
H
errm
ann,
19
62
Onc
orhy
nchu
s ki
sutc
h C
oho
Salm
on
Juve
nile
18
-20
d 13
EC
10
4.33
G
M
War
ren,
19
73
Onc
orhy
nchu
s ki
sutc
h C
oho
Salm
on
Juve
nile
13
d
18
EC10
7.
79
- W
arre
n,
1973
O
ncor
hync
hus
kisu
tch
Coh
o Sa
lmon
Ju
veni
le
20 d
9
EC10
4.
78
- W
arre
n,
1973
O
ncor
hync
hus
kisu
tch
Coh
o Sa
lmon
Ju
veni
le
20 d
22
EC
10
0.97
-
War
ren,
19
73
Onc
orhy
nchu
s ki
sutc
h C
oho
Salm
on
Fing
erlin
gs
42 d
15
EC
10
5.35
-
Bre
tt an
d B
lack
burn
, 19
81
Onc
orhy
nchu
s m
ykis
s R
ainb
ow
trout
-
54-7
1 d
12
EC10
6.
13
GM
Sp
oor,
1981
Onc
orhy
nchu
s ne
rka
Sock
eye
Salm
on
Fing
erlin
gs
42 d
15
EC
10
4.41
-
Bre
tt an
d B
lack
burn
, 19
81
Onc
orhy
nchu
s ts
haw
ytsc
ha
Chi
nook
Sa
lmon
Ju
veni
le
20 d
13
EC
10
4.74
G
M
War
ren,
19
73
Onc
orhy
nchu
s ts
haw
ytsc
ha
Chi
nook
Sa
lmon
Ju
veni
le
20 d
8
EC10
3.
76
- W
arre
n,
1973

176
Onc
orhy
nchu
s ts
haw
ytsc
ha
Chi
nook
Sa
lmon
Ju
veni
le
20 d
18
EC
10
6.09
G
M
War
ren,
19
73
Onc
orhy
nchu
s ts
haw
ytsc
ha
Chi
nook
Sa
lmon
Ju
veni
le
20 d
22
EC
10
6.15
-
War
ren,
19
73
Salm
o tr
utta
B
row
n tro
ut
- 60
d
12
EC10
5.
39
- Sp
oor,
1981
Sa
lvel
inus
fo
ntin
alis
Bro
ok tr
out
- 62
d
12
EC10
7.
57
- Sp
oor,
1981
Sa
lvel
inus
na
may
cush
La
ke tr
out
- 96
-131
d
12
EC10
6.
08
GM
Sp
oor,
1981

177
Dissolved Oxygen (mg/L)
0.01 0.1 1 10 100
Prob
abilit
y
0.10.20.5
12
510
2030
50
7080
9095
9899
All Invertebratespost-1986 invertebrates
Supplemental: Figure: 20. Aquatic hazard assessment for dissolved oxygen with acute invertebrate data. The distribution represents all of the available acute invertebrate data compared to those newly published acute invertebrate data values within the dataset (red circles).

178
Temperature (Celsius)
10 15 20 25 30
Dis
solv
ed O
xyge
n LC
50 (m
g/L)
0
2
4
6
8
10 Cloeon simileEpeorus sylvicolaEphemera vulgataEphemerella mucronataHydropsyche betteniLeptpohlebia marginataSialis lutaria Siphlonurus lacustrisSympecma fusca
Dissolved Oxygen (mg/L)
0.01 0.1 1 10
Prob
abilit
y
0.10.20.5
12
510
2030
50
7080
9095
9899
152025
A B
Temperature (Celsius)
0 5 10 15 20 25
HC
80 (m
g D
O/L
)
0
2
4
6
8
10
12
14 y = 0.851x + -9.437r2 = 0.942
C
Supplemental: Figure: 21. Acute (2-96h) temperature-dependent dissolved oxygen (DO) toxicity relationships for A) invertebrates within the orders Ephemeroptera, Trichoptera, Megaloptera, and Odonata. Solid lines represent linear regression lines fitted for each species (C. simile, H. betteri, S. fusca; p < 0.05). B) The acute (2-96h) temperature-dependent dissolved oxygen (DO) toxicity SSD for five ephemeroptera species studied across the same three temperatures and C) the HC80 values of the five ephemeroptera species across three temperatures. Dose-response curves were plotted based on data availability when a species were studied across at least three different temperatures by the same researcher. All species inhabit either lotic (Ephemerella mucronata, Hydropsyche betteni, Leptpohlebia marginata), lentic (Cloeon simile), or both lotic and lentic (Epeorus sylvicola, Ephemera vulgate, Sialis lutaria, Siphlonurus lacustris, Sympecma fusca) habitats.

179
Temperature (Celsius)
10 15 20 25 30
Dis
solv
ed O
xyge
n Ef
fect
Con
cent
ratio
n (m
g/L)
0
2
4
6
8
10 O. kisutch EC90 O. kisutch EC50 O. tshawytscha EC90 O. tshawytscha EC50
Supplemental: Figure: 22. Temperature-dependent chronic fish growth effect concentration (EC) data to illicit 10% (EC90) and 50% (EC50) decreased growth for Oncorhynchus kisutch and Oncorhynchus tshawytscha. Effect concentrations were calculated from log-linear normalized growth rates for each species across multiple temperatures (JRB Associates, 1984; Warren et al, 1973). Solid and long dashed lines represent Oncorhynchus tshawytscha fitted linear regressions for EC90 and EC50 values, respectively (p < 0.05). Short and long-dot-dot-long dashed lines represent Oncorhynchus kisutch fitted polynomial regressions describing the relationship between temperature and EC values.

180
80th Percentile
Log Dissolved Oxygen (mg/L)
0.01 0.1 1 10 100
Prob
abilit
y
0.10.20.5
125
10
2030
50
7080
90959899
Warm water fish LC50 Warm water fish EC10
Supplemental: Figure: 23. Aquatic hazard assessment for dissolved oxygen with acute invertebrate data. The distribution represents all of the available acute invertebrate data compared to those newly published acute invertebrate data values within the dataset (red circles).

181
APPENDIX B
Supplementary Information for Chapter Three
Supplementary: Table 17. Download additional supplemental data related to Chapter Three (214 KB spreadsheet) at https://doi.org/10.1016/j.chemosphere.2017.09.058

182
Supp
lem
enta
ry: T
able
18:
Sum
mar
y of
stud
ies e
valu
atin
g ad
vers
e ef
fect
s of c
alci
um c
hann
el b
lock
ers i
n aq
uatic
org
anis
ms.
Com
poun
d T
est o
rgan
ism
R
espo
nse
(mg/
L)
Stan
dard
en
dpoi
nt
Bio
assa
y/E
ndpo
int
Ref
eren
ce
Am
lodi
pine
H
ydra
vul
gari
s 1
7 d
LOEC
M
ean
num
ber o
f Arte
mia
inge
sted
Pa
scoe
et a
l. 20
03
H
ydra
vul
gari
s 0.
1 7
d LO
EC
Clu
bbed
tent
acle
s, bo
dy sl
ight
ly c
ontra
cted
Pa
scoe
et a
l. 20
03
H
ydra
vul
gari
s 0.
01
17 d
LO
EC
Reg
ener
atio
n of
dig
estiv
e re
gion
(obs
erve
d fo
r 24-
72 h
) Pa
scoe
et a
l. 20
03
Br
achi
onus
cal
ycifl
orus
0.
6 24
h L
C50
M
orta
lity
Del
laG
reca
et a
l, 20
07
Th
amno
ceph
alus
pl
atyu
rus
2.6
24 h
LC
50
Mor
talit
y D
ella
Gre
ca e
t al,
2007
Dap
hnia
mag
na
26.4
24
h L
C50
M
orta
lity
Del
laG
reca
et a
l, 20
07
D
aphn
ia m
agna
17
.9
24 h
LC
50
Mor
talit
y D
ella
Gre
ca e
t al,
2007
Cer
ioda
phni
a du
bia
0.3
7 d
EC50
Po
pula
tion
grow
th in
hibi
tion
Del
laG
reca
et a
l, 20
07
Dilt
iaze
m
Dap
hnia
mag
na
28.0
48
h E
C50
Im
mob
iliza
tion
Kim
et a
l. 20
07
D
aphn
ia m
agna
8.
2 96
h E
C50
Im
mob
iliza
tion
Kim
et a
l. 20
07
O
ryzi
as la
tipes
15
.0
48 h
LC
50
Mor
talit
y K
im e
t al.
2007
Ory
zias
latip
es
25.6
96
h L
C50
M
orta
lity
Kim
et a
l. 20
07
Th
amno
ceph
alus
pl
atyu
rus
10.2
1
h EC
50
Food
inge
stio
n; R
apid
toxk
it (2
004)
Nal
ecz-
Jaw
ecki
and
Pe
rsoo
ne 2
006
Th
amno
ceph
alus
pl
atyu
rus
73.0
24
h L
C50
M
orta
lity
Nal
ecz-
Jaw
ecki
and
Pe
rsoo
ne 2
006
Vi
brio
fisc
heri
15
2.0
24 h
B
iolu
min
esce
nce
inhi
bitio
n; C
hron
ic
biol
umin
esce
nce
assa
y B
ackh
aus a
nd G
rimm
e 19
99
Vi
brio
fisc
heri
26
3.7
15 m
in
Alte
ratio
n in
ligh
t out
put;
Mic
roto
x To
xici
ty A
naly
zer
Kim
et a
l. 20
07
Vi
brio
fisc
heri
40
7.0
5 m
in
Alte
ratio
n in
ligh
t out
put;
Mic
roto
x To
xici
ty A
naly
zer
Kim
et a
l. 20
07
Ver
apam
il Ar
tem
ia sa
lina
329.
6 24
h L
C50
M
orta
lity
Cal
leja
et a
l. 19
94 (a
)
Arte
mia
salin
a 1.
3 24
h L
C50
M
orta
lity
Cal
leja
et a
l. 19
94 (b
)
Br
achi
onus
cal
ycifl
orus
0.
6 24
h L
C50
M
orta
lity
Cal
leja
et a
l. 19
94 (b
)
Brac
hion
us c
alyc
iflor
us
10.1
24
h L
C50
M
orta
lity
Cal
leja
et a
l. 19
94 (a
)
Dap
hnia
mag
na
302.
3 24
h E
C50
Im
mob
iliza
tion
Liliu
s et a
l. 19
94
D
aphn
ia m
agna
7.
0 48
h L
C50
Im
mob
iliza
tion
Vill
egas
-Nav
arro
et a
l. 20
03
D
aphn
ia m
agna
51
.3
24 h
EC
50
Imm
obili
zatio
n C
alle
ja e
t al.
1994
(a)

183
D
aphn
ia m
agna
0.
9 24
h E
C50
Im
mob
ility
C
alle
ja e
t al.
1994
(b)
Le
mna
min
or
24.3
7
d EC
50
Gro
wth
inhi
bitio
n K
aza
et a
l. 20
07
O
ncor
hync
hus m
ykis
s (h
epat
ocyt
es)
1704
.8
3 h
EC50
Ex
trace
llula
r rad
ioac
tivity
Li
lius e
t al.
1994
Ph
otob
acte
rium
ph
osph
oreu
m
403.
2 5
or 1
5 m
in
EC50
B
iolu
min
esce
nce
inhi
bitio
n; M
icro
tox
test
C
alle
ja e
t al.
1994
(a)
Ph
otob
acte
rium
ph
osph
oreu
m
1.3
15 m
in E
C50
Lu
min
esce
nce
inhi
bitio
n; M
icro
tox
test
C
alle
ja e
t al.
1994
(b)
Sp
iros
tom
um
ambi
guum
9.
8 24
h L
C50
M
orph
olog
ical
cha
nges
; Spi
roto
x N
alec
z-Ja
wec
ki a
nd
Saw
icki
200
3
Sp
iros
tom
um
ambi
guum
7.
8 24
h E
C50
Sp
heric
al d
efor
mat
ion
and
auto
lysi
s;
Spiro
tox
Nal
ecz-
Jaw
ecki
and
Sa
wic
ki 2
003
St
rept
ocep
halu
s pr
obos
cide
us
5.8
mg/
L 24
h L
C50
M
orta
lity;
Stre
ptox
kit F
(with
slig
ht
mod
ifica
tions
) C
alle
ja e
t al.
1994
(a)
St
rept
ocep
halu
s pr
obos
cide
us
0.5
mg/
L 24
h L
C50
M
orta
lity;
Stre
ptox
kit F
(with
slig
ht
mod
ifica
tions
) C
alle
ja e
t al.
1994
(b)
Te
trah
ymen
a te
rmop
hila
35
8.0
mg/
L 24
h E
C50
G
row
th in
hibi
tion;
Pro
toxk
it FT
M
Nal
ecz-
Jaw
ecki
and
Sa
wic
ki 2
003
Th
amno
ceph
alus
pl
atyu
rus
9.3
mg/
L 24
h L
C50
M
orta
lity
Nal
ecz-
Jaw
ecki
and
Pe
rsoo
ne 2
006
Th
amno
ceph
alus
pl
atyu
rus
9.1
mg/
L 1
h EC
50
Food
inge
stio
n N
alec
z-Ja
wec
ki a
nd
Pers
oone
200
6
Pim
epha
les p
rom
elas
0.
6 28
d N
OEC
Su
rviv
al
Ove
rturf
et a
l, 20
12
Pi
mep
hale
s pro
mel
as
> 0.
6 28
d L
OEC
Su
rviv
al
Ove
rturf
et a
l, 20
12
Pi
mep
hale
s pro
mel
as
> 0.
6 28
d L
C50
Le
thal
ity
Ove
rturf
et a
l, 20
12
Pi
mep
hale
s pro
mel
as
0.3
28 d
NO
EC
Gro
wth
O
vertu
rf e
t al,
2012
Pim
epha
les p
rom
elas
0.
6 28
d L
OEC
G
row
th
Ove
rturf
et a
l, 20
12
O
ncor
hync
hus m
ykis
s 2.
72
96 h
LC
50
Leth
ality
Li
et a
l, 20
10
O
reoc
hrom
is n
ilotic
us
2.29
96
h L
C50
Le
thal
ity
Ajim
a et
al,
2017
Dap
hnia
mag
na
21.0
96
h L
C50
Le
thal
ity
Le e
t al,
2011
Dap
hnia
mag
na
15.0
96
h L
C20
Le
thal
ity
Le e
t al,
2011
Dap
hnia
mag
na
11.0
96
h L
C10
Le
thal
ity
Le e
t al,
2011
Dap
hnia
mag
na
8.2
96 h
LC
5 Le
thal
ity
Le e
t al,
2011
Dap
hnia
mag
na
2.1
21 d
LO
EC
Rep
rodu
ctio
n Le
et a
l, 20
11
D
aphn
ia m
agna
1.
1 21
d N
OEC
R
epro
duct
ion
Le e
t al,
2011
Dap
hnia
mag
na
4.2
21 d
LO
EC
Gro
wth
Le
et a
l, 20
11
D
aphn
ia m
agna
2.
1 21
d N
OEC
G
row
th
Le e
t al,
2011
Dap
hnia
mag
na
4.2
21 d
LO
EC
Surv
ival
Le
et a
l, 20
11

184
D
aphn
ia m
agna
2.
1 21
d N
OEC
Su
rviv
al
Le e
t al,
2011
Cyp
rinu
s car
pio
16.4
96
h L
C50
Le
thal
ity
Stei
nbac
h et
al,
2013
Cyp
rinu
s car
pio
4.8
96 h
LC
50
Leth
ality
St
einb
ach
et a
l, 20
13

185
.
Supplementary: Figure: 24. Species sensitivity distribution of acute (≤ 96 h) LC50 toxicity values following exposure to verapamil. Nine different LC50 values were reported for verapamil from six different aquatic species (e.g., Artemia salina, Brachionus calyciflorus, Daphnia magna, Oncorhynchus mykiss, Oreochromis niloticus, Thamnocephalus platyurus).

186
APPENDIX C
Supplementary Information for Chapter Four

187
Supp
lem
enta
ry: T
able
: 19.
Mea
n (±
SE) d
isso
lved
oxy
gen
(DO
; mg/
L) a
nd d
iltia
zem
(μg/
L) c
once
ntra
tions
mea
sure
d an
d an
alyt
ical
ly v
erifi
ed in
acu
te (4
8 h)
and
ch
roni
c (7
d) s
tudi
es w
ith P
imep
hale
s pro
mel
as. S
E: st
anda
rd e
rror
; Acu
te: 4
8 ho
ur; I
nter
actio
n: D
O x
dilt
iaze
m; C
hron
ic: 7
day
.
Dilt
iaze
m (μ
g/L)
D
isso
lved
Oxy
gen
(mg/
L)
Stud
y-#
Nom
inal
A
naly
tical
ly
Ver
ified
(SD
) %
Nom
inal
N
omin
al
Mea
n (±
SE)
Mea
sure
d %
Nom
inal
a Acu
te-1
0 0.15
15
000
3000
0 45
000
6000
0
0.0
0.09
4 12
765
2505
9 39
066
4300
8
100
62.8
85
.1
83.5
86
.8
71.7
8.2
5.0
3.0
2.0
1.0
0.5
8.25
±0.0
1 4.
82±0
.07
3.62
±0.0
4 2.
08±0
.09
0.95
±0.0
3 0.
58±0
.01
100.
6 96
.4
120.
7 10
4.0
95.0
11
6.0
a Acu
te-2
0 0.15
15
000
3000
0 45
000
6000
0
0.0
0.09
9 11
892.
3 25
804.
0 39
018.
3 45
603.
9
- 66
.1
79.3
86
.0
86.7
76
.0
8.2
5.0
3.0
2.0
1.0
0.5
8.12
±0.0
5 5.
70±0
.03
3.38
±0.1
5 2.
09±0
.08
1.12
±0.0
3 0.
65±0
.03
99.0
11
4.0
112.
7 10
4.5
112.
0 13
0.0
a Acu
te-3
0 0.15
15
000
3000
0 45
000
6000
0
14.5
4.
6 11
341.
8 22
489.
2 33
145.
1 40
531.
2
-*
3044
.9*
75.6
75
.0
73.7
67
.6
8.2
5.0
3.0
2.0
1.0
0.5
8.12
±0.0
4 5.
38±0
.06
3.06
±0.0
7 2.
64±0
.2
1.28
±0.0
3 0.
70±0
.09
99.0
10
7.6
102.
0 13
2.0
128.
0 14
0.0
a Acu
te
Inte
ract
ion-
1
0 0.15
15
000
3000
0 45
000
0.0
0.11
2 13
000.
2 26
296.
7 41
297.
0
- 56
.3
83.4
68
.1
83.9
8.2
5.0
8.6
5.0
104.
9 10
0.0

188
a Acu
te
Inte
ract
ion-
1
0 0.15
15
000
3000
0 45
000
0.00
0.
084
1250
5.8
2041
7.9
3777
6.2
- 74
.8
86.7
87
.7
91.8
8.2
3.0
8.5
3.4
103.
7 11
3.3
b Chr
onic
-1
0 0.
0339
4 0.
3394
3.
394
33.9
4 33
9.4
3394
33
940
0.0
(0)
0.0
(0)
0.2
(0.0
2)
2.5
(0.1
) 25
.7 (0
.5)
277.
8 (5
.7)
2355
.7 (8
1.1)
24
883.
2 (2
070)
0.0
0.0
51.2
69
.5
74.0
80
.2
66.7
66
.9
8.2
5.0
4.0
3.0
2.0
8.4±
0.02
5.
1±0.
03
4.3±
0.05
3.
2±0.
04
2.3±
0.04
102.
4 10
2.0
107.
5 10
6.7
115.
0
b Chr
onic
In
tera
ctio
n-1
0 0.
3394
33
.94
339.
4 33
94
0.0
(0)
0.1
(0.0
09)
23.2
(2.0
) 25
8.8
(19.
0)
2215
.4 (7
5.6)
- 17
.4
68.5
76
.2
65.3
8.2
5.0
8.3±
0.02
5.
4±0.
03
101.
2 10
8.0
b Chr
onic
In
tera
ctio
n-1
0 0.
3394
33
.94
339.
4 33
94
0.0
(0)
0.1
(0.0
04)
26.4
(0.7
) 27
7.2
(13.
6)
2348
.1 (7
0.0)
- 21
.6
77.7
81
.7
69.2
8.2
3.0
8.3±
0.01
3.
2±0.
04
101.
2 10
6.7
* A
naly
tical
ver
ifica
tion
indi
cate
d 0
(con
trol)
and
0.15
μg/
L tre
atm
ents
wer
e co
ntam
inat
ed;
how
ever
, si
gnifi
cant
effe
cts
wer
e no
t ob
serv
ed i
n Pi
mep
hale
s pr
omel
as a
t the
se le
vels
. (a
) Ind
icat
es w
ater
con
cent
ratio
ns w
ere
anal
ytic
ally
ver
ified
at t
ime
0 h
(b) M
ean
(±SD
) wat
er c
once
ntra
tions
wer
e an
alyt
ical
ly v
erifi
ed o
n da
ys 0
, 3, a
nd 6
.

189
Supp
lem
enta
ry: T
able
: 20.
Mea
n w
ater
che
mis
try m
easu
rem
ents
from
acu
te (4
8h) a
nd c
hron
ic (7
d) s
tudi
es w
ith P
imep
hale
s pr
omel
as. D
O: d
isso
lved
oxy
gen;
D
ZM: d
iltia
zem
; Acu
te: 4
8 ho
urs;
Chr
onic
: 7 d
ay
Stud
y T
ype
(N=
# st
udie
s)
Nom
inal
DO
(mg/
L)
pH
Con
duct
ivity
(μ
S)
Alk
alin
ity (m
g/L
C
aCO
3)
Har
dnes
s (m
g/L
C
aCO
3)
Acu
te D
O (N
=3)
8.2,
5.0
, 3.0
, 2.0
, 1.0
, 0.5
8.
31
606.
7 10
9.3
174.
1
Acu
te D
ZM (N
=3)
8.2
8.26
58
2.2
103.
4 17
4.9
Acu
te D
O x
DZM
(N
=1)
8.2,
5.0
8.
22
598.
6 11
1.9
173.
6
Acu
te D
O x
DZM
(N
=1)
8.2,
3.0
8.
22
598.
6 11
1.9
173.
6
Chr
onic
DO
(N=1
) 8.
2, 5
.0, 4
.0, 3
.0, 2
.0
8.36
59
9.0
109.
9 17
1.5
Chr
onic
DZM
(N=1
) 8.
2 8.
19
620.
8 10
7.9
173.
6
Chr
onic
DO
x D
ZM
(N=1
) 8.
2, 5
.0
8.3
581.
5 11
1.7
175.
7
Chr
onic
DO
-D
iltia
zem
(N=1
) 8.
2, 3
.0
8.3
581.
5 11
1.7
175.
7

190
Supplementary: Figure: 25. Mean (±SE, N=3 studies) heart rate (beats/minute) by Pimephales promeals larvae following 48 h A) dissolved oxygen (DO) and B) diltiazem studies. Mean larval survival at 2.3 mg DO/L and 24451 μg/L diltiazem were 80 and 88%, respectively, while other experimental treatments with significant decreases in survival were not measured (N.M.: Not Measured). *: p < 0.05.
Supplementary: Figure: 26. Mean (±SE, N=4, n=4) heart rate (beats/minute) by Pimephales promelas larvae following 48 h A) normal and moderate dissolved oxygen (DO) x diltiazem and B) normal and low DO x diltiazem studies. In experimental treatments with significant decreases in survival, heart rates were not measured (N.M.: Not Measured). Normal DO: 8.2 mg DO/L; Moderate DO: 5.0 mg DO/L; Low DO: 3.0 mg DO/L. *: p < 0.05.

191
Supplementary: Figure: 27. Mean (±SE) total number of movements (counts) per minute by Pimephales promelas larvae following 48 h (A, B, C; N=3 studies) and 7 d (D, E, F; N=4, n=4-5) dissolved oxygen (DO) studies. Data presented as number of movements in speed (mm/s) categories for resting (< 5 mm/s; A,D), cruising (5-20 mm/s; B, E), and bursting (>20 mm/s; C, F). Number of movements were observed over two alternating 10 minute periods of light (white bars) and dark (black bars) conditions. No behavioral observations were recorded (N.M.: Not Measured) at DO concentrations causing significant mortality. *: p < 0.05.
Supplementary: Figure: 28. Mean (±SE) duration per minute (60 sec.) by Pimephales promelas larvae following 48 h (A, B, C; N=3 studies) and 7 d (D, E, F; N=4, n=4-5) dissolved oxygen (DO) studies. Data presented as duration in speed (mm/s) categories for resting (< 5 mm/s; A, D), cruising (5-20 mm/s; B, E), and bursting (>20 mm/s; C, F). Duration was observed over two alternating 10 minute periods of light (white bars) and dark (black bars) conditions. No behavioral observations were recorded (N.M.: Not Measured) at DO concentrations causing significant mortality. *: p < 0.05.

192
Supplementary: Figure: 29. Mean (±SE) total number of movements (counts) per minute by Pimephales promelas larvae following and 7 d (A, B, C; N=4, n=4-5) diltiazem studies. Data presented as number of movements in speed (mm/s) categories for resting (< 5 mm/s; A), cruising (5-20 mm/s; B), and bursting (>20 mm/s; C). Number of movements were observed over two alternating 10 minute periods of light (white bars) and dark (black bars) conditions. No behavioral observations were recorded (N.M.: Not Measured) at DO concentrations causing significant mortality. *: p < 0.05.
Supplementary: Figure: 30. Mean (±SE) duration per minute (60 sec.) by Pimephales promelas larvae following 7 d (A, B, C; N=4, n=4-5) diltiazem studies. Data presented as duration in speed (mm/s) categories for resting (< 5 mm/s; A, D), cruising (5-20 mm/s; B, E), and bursting (>20 mm/s; C, F). Duration was observed over two alternating 10 minute periods of light (white bars) and dark (black bars) conditions. No behavioral observations were recorded (N.M.: Not Measured) at DO concentrations causing significant mortality. *: p < 0.05.

193
Supplementary: Figure: 31. Mean (±SE; N=4, n=4-5) total number of movements (counts) per minute by Pimephales promelas larvae following 48 h (panels A, B, C, D, E, F) or 7 d (panels G, H, I, J, K, L) studies across normal and moderate dissolved oxygen (DO) x diltiazem interaction treatments. Data presented as number of movements in speed (mm/s) categories for resting (< 5 mm/s; panels A, D, G, J), cruising (5-20 mm/s; B, E, H, K), and bursting (>20 mm/s; C, F, I, L) behaviors. Number of movements were observed over two alternating 10 minute periods of light (white bars) and dark (black bars) conditions. No behavioral observations were recorded (N.M.: Not Measured) at concentrations causing significant mortality. *: p < 0.05. Normal DO: 8.2 mg DO/L; Moderate DO: 5.0 mg DO/L.
Supplementary: Figure: 32. Mean (±SE; N=4, n=4-5) duration per minute by Pimephales promelas larvae following 48 h (panels A, B, C, D, E, F) or 7 d (panels G, H, I, J, K, L) studies across normal and moderate dissolved oxygen (DO) x diltiazem interaction treatments. Data presented as duration in speed (mm/s) categories for resting (< 5 mm/s; panels A, D, G, J), cruising (5-20 mm/s; B, E, H, K), and bursting (>20 mm/s; C, F, I, L) behaviors. Duration was observed over two alternating 10 minute periods of light (white bars) and dark (black bars) conditions. No behavioral observations were recorded (N.M.: Not Measured) at DO concentrations causing significant mortality. *: p < 0.05. Normal DO: 8.2 mg DO/L; Moderate DO: 5.0 mg DO/L.

194
Supplementary: Figure: 33. Mean (±SE; N=4, n=4-5) total number of movements (counts) per minute by Pimephales promelas larvae following 48 h (panels A, B, C, D, E, F) or 7 d (panels G, H, I, J, K, L) studies across normal and low dissolved oxygen (DO) x diltiazem interaction treatments. Data presented as number of movements in speed (mm/s) categories for resting (< 5 mm/s; panels A, D, G, J), cruising (5-20 mm/s; B, E, H, K), and bursting (>20 mm/s; C, F, I, L) behaviors. Number of movements were observed over two alternating 10 minute periods of light (white bars) and dark (black bars) conditions. No behavioral observations were recorded (N.M.: Not Measured) at concentrations causing significant mortality. *: p < 0.05. Normal DO: 8.2 mg DO/L; Low DO: 3.0 mg DO/L.

195
Supplementary: Figure: 34. Mean (±SE; N=4, n=4-5) duration per minute by Pimephales promelas larvae following 48 h (panels A, B, C, D, E, F) or 7 d (panels G, H, I, J, K, L) studies across normal and low dissolved oxygen (DO) x diltiazem interaction treatments. Data presented as duration in speed (mm/s) categories for resting (< 5 mm/s; panels A, D, G, J), cruising (5-20 mm/s; B, E, H, K), and bursting (>20 mm/s; C, F, I, L) behaviors. Duration was observed over two alternating 10 minute periods of light (white bars) and dark (black bars) conditions. No behavioral observations were recorded (N.M.: Not Measured) at DO concentrations causing significant mortality. *: p < 0.05. N.M.: Not Measured. Normal DO: 8.2 mg DO/L; Low DO: 3.0 mg DO/L.
Supplementary: Figure: 35. Mean heart rate (beats/minute) by Pimephales promelas larvae following 7 d A) dissolved oxygen (DO; ±SE N=4, n=4) and B) diltiazem (N=2, n=4) studies. In experimental treatments with significant decreases in survival, heart rates were not measured (N.M.: Not Measured). *: p < 0.05.

196
Supplementary: Figure: 36. Mean (±SE, N=4, n=4) heart rate (beats/minute) by Pimephales promelas larvae following 7 d A) normal and moderate dissolved oxygen (DO) x diltiazem and B) normal and low DO x diltiazem studies. Low DO x 2348 μg/L diltiazem decreased survival but were measured to demonstrate concomitant DO x diltiazem reduced heart rates. Normal DO: 8.2 mg DO/L; Moderate DO: 5.0 mg DO/L; Low DO: 3.0 mg DO/L. *: p < 0.05. #: p < 0.05, significant influence of DO across diltiazem concentrations.
Supplementary: Figure: 37. Mean (±SE, N=4, n=2) feeding rate (artemia/minute) by Pimephales promelas larvae following 7 d A) dissolved oxygen (DO) and B) diltiazem studies. In experimental treatments with significant decreases in survival, feeding rates were not measured (N.M.: Not Measured). *: p < 0.05.

197
Supplementary: Figure: 38. Mean (±SE, N=4, n=6-8) dry weight (growth) by Pimephales promelas larvae following 7 d experiments across A) normal and moderate dissolved oxygen x diltiazem and B) normal and low DO x diltiazem studies. No growth measurements were observed (N.M.: Not Measured) at DO or diltiazem concentrations causing significant mortality. *: p < 0.05. Normal DO: 8.2 mg DO/L; Moderate DO: 5.0 mg DO/L; Low DO: 3.0 mg DO/L.

198
APPENDIX D
Supplementary Information for Chapter Five

199
Supp
lem
enta
ry: T
able
21:
Mea
n (±
SE, N
=3-4
) wat
er c
hem
istry
mea
sure
men
ts fr
om n
orm
al a
nd lo
w d
isso
lved
oxy
gen
(DO
) x d
iltia
zem
(DZM
) bio
conc
entra
tion
(96
h) a
nd b
urst
sw
im p
erfo
rman
ce (
24 h
) st
udie
s w
ith a
dult
mal
e Pi
mep
hale
s pr
omel
as.
Nor
mal
DO
: 8.
2 m
g D
O/L
. Lo
w D
O:
3.0
mg
DO
/L.
Tem
p:
Tem
pera
ture
. Con
d: C
ondu
ctiv
ity. C
l 2: C
hlor
ine.
NH
3: am
mon
ia. N
M: n
ot m
easu
red.
Stud
y T
ype
a Mea
sure
d D
ZM
(μg/
L)
Tem
p (
C)
pH
Con
d (μ
S)
Alk
alin
ity
(mg/
L
CaC
O3)
Har
dnes
s (m
g/L
C
aCO
3)
Free
Cl 2
(mg/
L)
Tot
al
NH
3 (m
g/L
) N
O2
(mg/
L)
Bioc
once
ntra
tion
Stud
ies
8.2
mg
DO
/L x
D
ZM
0.84
24
.3±0
.04
8.1±
0.02
37
0±0.
1 b 11
0 b 14
0 b 0
b 0.07
N
M
3.0
mg
DO
/L x
D
ZM
0.83
25
.5±0
.2
8.4±
0.01
37
1±1.
6 b 85
b 11
6 b 0
b 0.07
N
M
Burs
t Sw
im P
erfo
rman
ces
Stud
ies
8.2
mg
DO
/L x
D
ZM
0, 3
.2, 3
6.5
24.2
±0.1
8.
3±0.
00
381±
2.2
109±
2.2
140±
4.0
0.02
±0.0
0.
03±0
.01
0.03
±0.0
3.0
mg
DO
/L x
D
ZM
0, 3
.1, 3
3.5
24.9
±0.1
8.
5±0.
02
368±
4.6
103±
2.7
141±
5.5
0.02
±0.0
0.
02±0
.01
0.02
±0.0
(a) E
xact
mea
n (±
SE) m
easu
red
dilti
azem
con
cent
ratio
ns a
re li
sted
in T
able
2. (
b) A
lkal
inity
, har
dnes
s, fr
ee c
hlor
ine,
tota
l am
mon
ia m
easu
red
at 9
6 h
sam
plin
g tim
e po
int o
nly.

200
COMBINED REFERENCES
Ankley G, Bennett, RS, Erickson, RJ, Hoff, DJ, Hornung, MW, Johnson, RD, Mount, DR, Nichols, JW, Russom, CL, Schmieder, PK, Serrrano, JA, Tietge, JE, Villeneuve, DL. (2010) Adverse outcome pathways: A conceptual framework to support ecotoxicology research and risk assessment. Environ Toxicol Chem 29:730-741.
Ankley GT, Brooks BW, Huggett DB and Sumpter JP (2007) Repeating history:
Pharmaceuticals in the environment. Environ Sci Technol 41:8211-8217. Armitage JM, Erickson RJ, Luckenbach T, Ng CA, Prosser RS, Arnot JA, Schirmer K
and Nichols JW (2017) Assessing the bioaccumulation potential of ionizable organic compounds: current knowledge and research priorities. EnvironToxicol Chem 36:882-897.
Batt AL, Kostich MS and Lazorchak JM (2008) Analysis of Ecologically Relevant
Pharmaceuticals in Wastewater and Surface Water Using Selective Solid-Phase Extraction and UPLC− MS/MS. Anal Chem 80:5021-5030.
Berninger JP and Brooks BW (2010) Leveraging mammalian pharmaceutical toxicology
and pharmacology data to predict chronic fish responses to pharmaceuticals. Toxicol Lett 193:69-78.
Berninger JP, Du B, Connors KA, Eytcheson SA, Kolkmeier MA, Prosser KN, Valenti Jr
TW, Chambliss CK and Brooks BW (2011) Effects of the antihistamine diphenhydramine on selected aquatic organisms. Environ Toxicol Chem 30:2065-2072.
Berninger JP, LaLone CA, Villeneuve DL and Ankley GT (2016) Prioritization of
pharmaceuticals for potential environmental hazard through leveraging a large scale mammalian pharmacological dataset. Environ Toxicol Chem 35:1007-1020.
Blewett T, MacLatchy DL and Wood CM (2013) The effects of temperature and salinity
on 17-α-ethynylestradiol uptake and its relationship to oxygen consumption in the model euryhaline teleost (Fundulus heteroclitus). Aquat Toxicol 127:61-71.

201
Boxall ABA, Rudd MA, Brooks BW, Caldwell DJ, Choi K, Hickmann S, Innes E, Ostapyk K, Staveley JP, Verslycke T, Ankley GT, Beazley KF, Belanger SE, Berninger JP, Carriquiriborde P, Coors A, DeLeo PC, Dyer SD, Ericson JF, Gagne F, Giesy JP, Gouin T, Hallstrom L, Karlsson MV, Joakim Larsson DG, Lazorchak JM, Mastrocco F, McLaughlin A, McMaster ME, Meyerhoff RD, Moore R, Parrott JL, Snape JR, Murray-Smith R, Servos MR, Sibley PK, Straub JO, Szabo ND, Topp E, Tetreault GR, Trudeau VL and Van Der Kraak G (2012) Pharmaceuticals and personal care products in the environment: What are the big questions? Environ Health Perspect 120:1221-1229.
Brauner C, Randall D, Neuman J and Thurston R (1994) The effect of exposure to 1, 2, 4,
5 tetrachlorobenzene and the relationship between toxicant and oxygen uptake in rainbow trout (Oncorhynchus mykiss) during exercise. Environ Toxicol Chem 13:1813-1820.
Breitburg D (2002) Effects of hypoxia, and the balance between hypoxia and enrichment,
on coastal fishes and fisheries. Estuaries 25:767-781. Breitburg D, Levin LA, Oschlies A, Grégoire M, Chavez FP, Conley DJ, Garçon V,
Gilbert D, Gutiérrez D, Isensee K, Jacinto GS, Limburg KE, Montes I, Naqvi SWA, Pitcher GC, Rabalais NN, Roman MR, Rose KA, Seibel BA, Telszewski M, Yasuhara M and Zhang J (2018) Declining oxygen in the global ocean and coastal waters. Science 359.
Breitburg DL, Hondorp DW, Davias LA and Diaz RJ (2009) Hypoxia, nitrogen, and
fisheries: Integrating effects across local and global landscapes. Annu Rev Mar Sci 1:329-349.
Brodin T, Fick J, Jonsson M and Klaminder J (2013) Dilute concentrations of a
psychiatric drug alter behavior of fish from natural populations. Science 339:814-815.
Brooks B, Scott JT, Margaret GF, Theodore WV, Jacob KS, Robert DD, Kirk ED, Jim P,
Randy MP, Ritchie DT and Larry K (2008) Reservoir Zonation and Water Quality. Lakeline 39.
Brooks BW (2014) Fish on Prozac (and Zoloft): ten years later. Aquat Toxicol 151:61-67. Brooks BW (2018) Urbanization, environment and pharmaceuticals: advancing
comparative physiology, pharmacology and toxicology. Conserv Physiol 6:cox079.
Brooks BW, Berninger JP, Kristofco LA, Ramirez AJ, Stanley JK and Valenti TW
(2012) Pharmaceuticals in the Environment: Lessons Learned for Reducing Uncertainties in Environmental Risk Assessment. Prog Mol Biol Transl Sci 112:231.

202
Brooks BW, Chambliss CK, Stanley JK, Ramirez A, Banks KE, Johnson RD and Lewis RJ (2005) Determination of select antidepressants in fish from an effluent dominated stream. Environ Toxicol Chem 24:464-469.
Brooks BW, Huggett DB and Boxall A (2009) Pharmaceuticals and personal care products: research needs for the next decade. Environ Toxicol Chem 28:2469-2472.
Brooks BW, Lazorchak JM, Howard MD, Johnson MVV, Morton SL, Perkins DA, Reavie ED, Scott GI, Smith SA and Steevens JA (2016) Are harmful algal blooms becoming the greatest inland water quality threat to public health and aquatic ecosystems? Environ Toxicol Chem 35:6-13.
Brooks BW, Riley TM and Taylor RD (2006) Water quality of effluent-dominated ecosystems: Ecotoxicological, hydrological, and management considerations. Hydrobiologia 556:365-379.
Brooks BW, Valenti TW, Cook-Lindsay BA, Forbes MG, Doyle RD, Scott JT and Stanley JK (2011) Influence of Climate Change on Reservoir Water Quality Assessment and Management: Effects of Reduced Inflows on Diel pH and Site-specific Contaminant Hazards, in Climate: Global Change and Local Adaptation (Linkov and Bridges TS eds) pp 491 - 522, Springer, Netherlands.
Center for Reservoir and Aquatic Science Research (2006) Conceptual Approach for Characterizing Reservoir Transitional Areas (RTSs), Transition Zone Index Development and Validation Project. Work Order No. 582-4-65584-03 Task #2. Center for Reservoir and Aquatic Systems Research, Waco, Texas, USA.
Cooper SR and Brush GS (1991) Long-term history of Chesapeake Bay anoxia. Science 254:992-996.
Cuklev F, Kristiansson E, Fick J, Asker N, Förlin L and Larsson DJ (2011) Diclofenac in fish: Blood plasma levels similar to human therapeutic levels affect global hepatic gene expression. Environ Toxicol Chem 30:2126-2134.
Cypher AD, Ickes JR and Bagatto B (2015) Bisphenol A alters the cardiovascular response to hypoxia in Danio rerio embryos. Comp Biochem Phys C 174-175:39-45.
Dasgupta S, DiGiulio RT, Drollette BD, L. Plata D, Brownawell BJ and McElroy AE (2016) Hypoxia depresses CYP1A induction and enhances DNA damage, but has minimal effects on antioxidant responses in sheepshead minnow (Cyprinodon variegatus) larvae exposed to dispersed crude oil. Aquat Toxicol 177:250-260.

203
Dasgupta S, Huang IJ and McElroy AE (2015) Hypoxia enhances the toxicity of Corexit EC9500A and chemically dispersed Southern Louisiana Sweet Crude Oil (MC-242) to sheepshead minnow (Cyprinodon variegatus) larvae. PLoS ONE 10.
Daughton CG (2016) Pharmaceuticals and the Environment (PiE): Evolution and impact of the published literature revealed by bibliometric analysis. Sci Total Environ 562:391-426.
Daughton CG and Ternes TA (1999) Pharmaceuticals and personal care products in the environment: agents of subtle change? Environ Health Perspect 107:907.
Delorme L (1982) Lake Erie oxygen; the prehistoric record. Can J Fish Aquat Sci 39:1021-1029.
Diaz RJ (2001) Overview of hypoxia around the world. J Environ Qual 30:275-281.
Diaz RJ and Rosenberg R (2008) Spreading dead zones and consequences for marine ecosystems. Science 321:926-929.
Du B, Haddad SP, Luek A, Scott WC, Saari GN, Burket SR, Breed CS, Kelly M, Broach L and Rasmussen JB (2016) Bioaccumulation of human pharmaceuticals in fish across habitats of a tidally influenced urban bayou. Environ Toxicol Chem 35:966-974.
Du B, Haddad SP, Luek A, Scott WC, Saari GN, Kristofco LA, Connors KA, Rash C, Rasmussen JB and Chambliss CK (2014) Bioaccumulation and trophic dilution of human pharmaceuticals across trophic positions of an effluent-dependent wadeable stream. Philos Trans R Soc Lond B 369:20140058.
Erickson RJ, McKim JM, Lien GJ, Hoffman AD and Batterman SL (2006) Uptake and elimination of ionizable organic chemicals at fish gills: I. Model formulation, parameterization, and behavior. Environ Toxicol Chem 25:1512-1521.
Fick J, Lindberg RH, Parkkonen J, Arvidsson Br, Tysklind M and Larsson DJ (2010a) Therapeutic levels of levonorgestrel detected in blood plasma of fish: results from screening rainbow trout exposed to treated sewage effluents. Environ Sci Technol 44:2661-2666.
Fick J, Lindberg RH, Tysklind M and Larsson DGJ (2010b) Predicted critical environmental concentrations for 500 pharmaceuticals. Regul Toxicol Pharmacol 58:516-523.
Fitzgerald JA, Jameson HM, Dewar Fowler VH, Bond GL, Bickley LK, Uren Webster TM, Bury NR, Wilson RJ and Santos EM (2016) Hypoxia suppressed copper toxicity during early development in zebrafish embryos in a process mediated by the activation of the HIF signalling pathway. Environ Sci Technol.

204
Fitzsimmons PN, Fernandez JD, Hoffman AD, Butterworth BC and Nichols JW (2001) Branchial elimination of superhydrophobic organic compounds by rainbow trout (Oncorhynchus mykiss). Aquat Toxicol 55:23-34.
Gaw S and Brooks BW (2016) Changing tides: Adaptive monitoring, assessment, and management of pharmaceutical hazards in the environment through time. Environ Toxicol Chem.
Glassmeyer ST, Furlong ET, Kolpin DW, Cahill JD, Zaugg SD, Werner SL, Meyer MT and Kryak DD (2005) Transport of chemical and microbial compounds from known wastewater discharges: potential for use as indicators of human fecal contamination. Environ Sci Technol 39:5157-5169.
Gunnarsson L, Jauhiainen A, Kristiansson E, Nerman O and Larsson DGJ (2008) Evolutionary conservation of human drug targets in organisms used for environmental risk assessments. Environ Sci Technol 42:5807-5813.
Haggard BE, Stanley EH and Storm DE (2005) Nutrient retention in a point-source-enriched stream. J N Amer Benthol Soc 24:29-47.
Halling-Sorensen B, Nors Nielsen S, Lanzky PF, Ingerslev F, Holten Lützhøft HC and Jørgensen SE (1998) Occurrence, fate and effects of pharmaceutical substances in the environment-a review. Chemosphere 36:357-393.
Halling-Sørensen B, Nors Nielsen S, Lanzky PF, Ingerslev F, Holten Lützhøft HC and Jørgensen SE (1998) Occurrence, fate and effects of pharmaceutical substances in the environment- A review. Chemosphere 36:357-393.
Hattlink J, De Boeck G and Blust R (2005) The toxicokinetics of cadmium in carp under normoxic and hypoxic conditions. Aquat Toxicol 75:1-15.
Heathwaite AL (2010) Multiple stressors on water availability at global to catchment scales: Understanding human impact on nutrient cycles to protect water quality and water availability in the long term. Fresh Biol 55:241-257.
Hooper MJ, Ankley GT, Cristol DA, Maryoung LA, Noyes PD, Pinkerton KE MJ (2013) Interactions between chemical and climate stressors: A role for mechanistic toxicology in assessing climate change risks. Environ Toxicol Chem 32:32-48.
Hu M, Wu F, Yuan M, Li Q, Gu Y, Wang Y and Liu Q (2015) Antioxidant responses of triangle sail mussel Hyriopsis cumingii exposed to harmful algae Microcystis aeruginosa and hypoxia. Chemosphere 139:541-549.

205
Huerta B, Margiotta Casaluci L, Rodríguez Mozaz S, Scholze M, Winter MJ, Barceló D and Sumpter JP (2016) Anti anxiety drugs and fish behaviour: Establishing the link between internal concentrations of oxazepam and behavioural effects. Environ Toxicol and Chem.
Huggett DB, Cook JC, Ericson JF and Williams RT (2003) A theoretical model for
utilizing mammalian pharmacology and safety data to prioritize potential impacts of human pharmaceuticals to fish. Hum Ecol Risk Assess 9:1789-1799.
Kolpin DW, Furlong ET, Meyer MT, Thurman EM, Zaugg SD, Barber LB and Buxton
HT (2002) Pharmaceuticals, hormones, and other organic wastewater contaminants in US streams, 1999-2000: A national reconnaissance. Environ Sci Technol 36:1202-1211.
Kookana RS, Williams M, Boxall AB, Larsson DJ, Gaw S, Choi K, Yamamoto H,
Thatikonda S, Zhu Y-G and Carriquiriborde P (2014) Potential ecological footprints of active pharmaceutical ingredients: an examination of risk factors in low-, middle-and high-income countries. Phil Trans R Soc B 369:20130586.
Kristofco LA, Cruz LC, Haddad SP, Behra ML, Chambliss CK and Brooks BW (2016)
Age matters: Developmental stage of Danio rerio larvae influences photomotor response thresholds to diazinion or diphenhydramine. Aquat Toxicol 170:344-354.
LaLone CA, Villeneuve DL, Burgoon LD, Russom CL, Helgen HW, Berninger JP,
Tietge JE, Severson MN, Cavallin JE and Ankley GT (2013) Molecular target sequence similarity as a basis for species extrapolation to assess the ecological risk of chemicals with known modes of action. Aquat Toxicol 144–145:141-154.
Lazarus RS, Rattner BA, Brooks BW, Du B, McGowan PC, Blazer VS and Ottinger MA
(2015) Exposure and food web transfer of pharmaceuticals in ospreys (Pandion haliaetus): Predictive model and empirical data. Integr Enviro Assess Manage 11:118-129.
Lyu K, Cao H, Chen R, Wang Q and Yang Z (2013) Combined effects of hypoxia and
ammonia to Daphnia similis estimated with life-history traits. Environ Sci Pollut R 20:5379-5387.
Malekpouri P, Peyghan R, Mahboobi-Soofiani N and Mohammadian B (2016) Metabolic
capacities of common carp (Cyprinus carpio) following combined exposures to copper and environmental hypoxia. Ecotoxicol Environ Saf 127:1-11.
Margiotta-Casaluci L, Owen SF, Cumming RI, de Polo A, Winter MJ, Panter GH, Rand-
Weaver M and Sumpter JP (2014) Quantitative cross-species extrapolation between humans and fish: the case of the anti-depressant fluoxetine. PloS ONE 9:e110467.

206
McKim JM and Erickson RJ (1991) Environmental impacts on the physiological mechanisms controlling xenobiotic transfer across fish gills. Physiol Zool 64:39-67.
McKim JM and Goeden HM (1982) A direct measure of the uptake efficiency of a
xenobiotic chemical across the gills of brook trout (Salvelinus fontinalis) under normoxic and hypoxic conditions. Comp Biochem Phys C 72:65-74.
Metcalfe CD, Miao XS, Koenig BG and Struger J (2003) Distribution of acidic and
neutral drugs in surface waters near sewage treatment plants in the lower Great Lakes, Canada. Environ Toxicol Chem 22:2881-2889.
Mimeault C, Woodhouse A, Miao X-S, Metcalfe C, Moon T and Trudeau V (2005) The
human lipid regulator, gemfibrozil bioconcentrates and reduces testosterone in the goldfish, Carassius auratus. Aquat Toxicol 73:44-54.
Monteiro SC and Boxall AB (2010) Occurrence and fate of human pharmaceuticals in the
environment, in Reviews of Environmental Contamination and Toxicology pp 53-154, Springer, New York, NY.
Nakamura Y, Yamamoto H, Sekizawa J, Kondo T, Hirai N and Tatarazako N (2008) The
effects of pH on fluoxetine in Japanese medaka (Oryzias latipes): acute toxicity in fish larvae and bioaccumulation in juvenile fish. Chemosphere 70:865-873.
Nichols JW, Du B, Berninger JP, Connors KA, Chambliss CK, Erickson RJ, Hoffman
AD and Brooks BW (2015) Observed and modeled effects of pH on bioconcentration of diphenhydramine, a weakly basic pharmaceutical, in fathead minnows. Environ Toxicol Chem 34:1425-1435.
Overturf M, Overturf C, Baxter D, Hala D, Constantine L, Venables B and Huggett D
(2012) Early life-stage toxicity of eight pharmaceuticals to the fathead minnow, Pimephales promelas. Arch Environ Contam Toxicol 62:455-464.
Owen SF, Huggett DB, Hutchinson TH, Hetheridge MJ, Kinter LB, Ericson JF and
Sumpter JP (2009) Uptake of propranolol, a cardiovascular pharmaceutical, from water into fish plasma and its effects on growth and organ biometry. Aquat Toxicol 93:217-224.
Parker T, Libourel P-A, Hetheridge MJ, Cumming RI, Sutcliffe TP, Goonesinghe AC,
Ball JS, Owen SF, Chomis Y and Winter MJ (2014) A multi-endpoint in vivo larval zebrafish (Danio rerio) model for the assessment of integrated cardiovascular function. J Pharmacol Toxicol 69:30-38.
Patel A, Panter GH, Trollope HT, Glennon YC, Owen SF, Sumpter JP and Rand-Weaver
M (2016) Testing the “read-across hypothesis” by investigating the effects of ibuprofen on fish. Chemosphere 163:592-600.

207
Pollock MS, Clarke LMJ and Dube MG (2007) The effects of hypoxia on fishes: from ecological relevance to physiological effects. Environ Rev 15:1-14.
Postel S (2010) Water adapting to a new normal. The Post Carbon Reader: Managing the
21st Century’s Sustainability Crises, Healdsburg, CA: Watershed Media. Prokkola JM, Nikinmaa M, Lubiana P, Kanerva M, McCairns RS and Götting M (2015)
Hypoxia and the pharmaceutical diclofenac influence the circadian responses of three-spined stickleback. Aquat Toxicol 158:116-124.
Ramirez AJ, Brain RA, Usenko S, Mottaleb MA, O'Donnell JG, Stahl LL, Wathen JB,
Snyder BD, Pitt JL and Perez Hurtado P (2009) Occurrence of pharmaceuticals and personal care products in fish: results of a national pilot study in the United States. Environ Toxicol Chem 28:2587-2597.
Rand-Weaver M, Margiotta-Casaluci L, Patel A, Panter GH, Owen SF and Sumpter JP
(2013) The read-across hypothesis and environmental risk assessment of pharmaceuticals. Environ Sci Technol 47:11384-11395.
Runnalls TJ, Beresford N, Kugathas S, Margiotta-Casaluci L, Scholze M, Scott AP and
Sumpter JP (2015) From single chemicals to mixtures—Reproductive effects of levonorgestrel and ethinylestradiol on the fathead minnow. Aquat Toxicol 169:152-167.
Saari G, Corrales, J, Haddad, SP, Chambliss, CK, Brooks, BW (Accepted) Influence of
diltiazem on fathead minnows across dissolved oxygen gradients. Environ Toxicol Chem.
Saari GN, Scott WC and Brooks BW (2017) Global assessment of calcium channel
blockers in the environment: Review and analysis of occurrence, ecotoxicology and hazards in aquatic systems. Chemosphere 189:466-478.
Saari GN, Wang Z and Brooks BW (2018) Revisiting inland hypoxia: diverse
exceedances of dissolved oxygen thresholds for freshwater aquatic life. Environ Sci Pollut Res 25:3139-3150.
Schaafsma G, Kroese E, Tielemans E, Van de Sandt J and Van Leeuwen C (2009)
REACH, non-testing approaches and the urgent need for a change in mind set. Regul Toxicol Pharmacol 53:70-80.
Scott WCC, Du B, Haddad SP, Breed CS, Saari GN, Kelly M, Broach L, Chambliss CK
and Brooks BW (2016) Predicted and observed therapeutic dose exceedences of ionizable pharmaceuticals in fish plasma from urban coastal systems. Environ Toxicol Chem 35:983-995.

208
Sedlak D (2014) Water 4.0: the past, present, and future of the world's most vital resource, Yale University Press.
Steele WB, Kristofco LA, Corrales J, Saari GN, Haddad SP, Gallagher EP, Kavanagh TJ,
Kostal J, Zimmerman JB, Voutchkova-Kostal A, Anastas P and Brooks BW (2018) Comparative behavioral toxicology with two common larval fish models: Exploring relationships among modes of action and locomotor responses. Sci Total Environ 640–641:1587-1600.
Steinbach C, Burkina V, Schmidt-Posthaus H, Stara A, Kolarova J, Velisek J, Randak T
and Kroupova HK (2016) Effect of the human therapeutic drug diltiazem on the haematological parameters, histology and selected enzymatic activities of rainbow trout Oncorhynchus mykiss. Chemosphere 157:57-64.
Subedi B, Balakrishna K, Sinha RK, Yamashita N, Balasubramanian VG and Kannan K
(2015) Mass loading and removal of pharmaceuticals and personal care products, including psychoactive and illicit drugs and artificial sweeteners, in five sewage treatment plants in India. J Environ Chem Engineer 3:2882-2891.
Subedi B and Kannan K (2015) Occurrence and fate of select psychoactive
pharmaceuticals and antihypertensives in two wastewater treatment plants in New York State, USA. Sci Total Environ 514:273-280.
Tanoue R, Nomiyama K, Nakamura H, Kim JW, Isobe T, Shinohara R, Kunisue T and
Tanabe S (2015) Uptake and Tissue Distribution of Pharmaceuticals and Personal Care Products in Wild Fish from Treated-Wastewater-Impacted Streams. Environ Sci Technol 49:11649-11658.
Taylor RD (2002) Water Quality Aspects of an Intermittent Stream and Backwaters in an
Urban North Texas Watershed: Pecan Creek, Denton County, Texas, University of North Texas.
Ternes TA (1998) Occurrence of drugs in German sewage treatment plants and rivers.
Water Res 32:3245-3260. Thomas P, Rahman MS, Kummer JA and Lawson S (2006) Reproductive endocrine
dysfunction in Atlantic croaker exposed to hypoxia. Mar Environ Res 62:S249-S252.
Thornton KW, Kimmel BL and Payne FE (1990) Reservoir limnology: ecological
perspectives, John Wiley and Sons. U.S. Environmental Protection Agency (1986) Ambient Water Quality Criteria for
Dissolved Oxygen, Office of Water Regulations and Standards Criteria and Standards Division. EPA-440/5-86-003, Washington, D.C.

209
Valenti Jr TW, Gould GG, Berninger JP, Connors KA, Keele NB, Prosser KN and Brooks BW (2012) Human therapeutic plasma levels of the selective serotonin reuptake inhibitor (SSRI) sertraline decrease serotonin reuptake transporter binding and shelter-seeking behavior in adult male fathead minnows. Environ Sci Technol 46:2427-2435.
Valenti Jr TW, Perez-Hurtado P, Chambliss CK and Brooks BW (2009) Aquatic toxicity
of sertraline to Pimephales promelas at environmentally relevant surface water pH. Environ Toxicol Chem 28:2685-2694.
Valenti TW, Taylor JM, Back JA, King RS and Brooks BW (2011) Influence of drought
and total phosphorus on diel pH in wadeable streams: Implications for ecological risk assessment of ionizable contaminants. Integr Enviro Assess Manage 7:636-647.
Vaquer-Sunyer R and Duarte CM (2008) Thresholds of hypoxia for marine biodiversity.
P Natl Acad Sci USA 105:15452-15457. Verbruggen B, Gunnarsson L, Kristiansson E, Österlund T, Owen SF, Snape JR and
Tyler CR (2017) ECOdrug: a database connecting drugs and conservation of their targets across species. Nucleic Acids Res 46:D930-D936.
Waiser MJ, Tumber V and Holm J (2011) Effluent-dominated streams. Part 1: Presence
and effects of excess nitrogen and phosphorus in Wascana Creek, Saskatchewan, Canada. Environ Toxicol Chem 30:496-507.
Watson SB, Miller C, Arhonditsis G, Boyer GL, Carmichael W, Charlton MN, Confesor
R, Depew DC, Höök TO, Ludsin SA, Matisoff G, McElmurry SP, Murray MW, Peter Richards R, Rao YR, Steffen MM and Wilhelm SW (2016) The re-eutrophication of Lake Erie: Harmful algal blooms and hypoxia. Harmful Algae 56:44-66.
Winter MJ, Lillicrap AD, Caunter JE, Schaffner C, Alder AC, Ramil M, Ternes TA,
Giltrow E, Sumpter JP and Hutchinson TH (2008a) Defining the chronic impacts of atenolol on embryo-larval development and reproduction in the fathead minnow (Pimephales promelas). Aquat Toxicol 86:361-369.
Winter MJ, Owen SF, Murray Smith R, Panter GH, Hetheridge MJ and Kinter LB (2010)
Using data from drug discovery and development to aid the aquatic environmental risk assessment of human pharmaceuticals: Concepts, considerations, and challenges. Integr Environ Assess Manag 6:38-51.
Winter MJ, Redfern WS, Hayfield AJ, Owen SF, Valentin J-P and Hutchinson TH
(2008b) Validation of a larval zebrafish locomotor assay for assessing the seizure liability of early-stage development drugs. J Pharmacol Toxicol Methods 57:176-187.

210
Wu RSS (2002) Hypoxia: from molecular responses to ecosystem responses. Mar Pollut Bull 45:35-45.
Yang R, Brauner C, Thurston V, Neuman J and Randall DJ (2000) Relationship between
toxicant transfer kinetic processes and fish oxygen consumption. Aquat Toxicol 48:95-108.