S A L O TTERIES ANNU AL REPOR T 20 10-11
100
SA LOTTERIES ANNUAL REPORT 2010-11
-
Upload
khangminh22 -
Category
Documents
-
view
3 -
download
0
Transcript of S A L O TTERIES ANNU AL REPOR T 20 10-11

SA LO
TT
ER
IES
AN
NU
AL
RE
PO
RT
2010
-11

SA Lotteries Annual Report 2010-11
Additional copies of this annual report can be obtained by:
• visitingwww.salotteries.com.au;
• visitingSALotteriesHeadOfficeat 24-25GreenhillRoad,Wayville,SouthAustralia;
• telephoning+61(8)82084100;
• [email protected];or
• writingtoSALotteriesatGPOBox2277, Adelaide, South Australia 5001.
This report is printed to ISO 14001 International Environmental Standards.

OUR MISSIONTo benefit the community of South Australia through the responsible promotion and conduct of lotteries.
OUR VALUESIn the promotion and conduct of lotteries and the way we conduct our business, we will operate with:
• integrity;• accountability;and• respect.
OUR GOALS1. To promote, conduct and distribute
lotteries games for the benefit of the South Australian community.
2. To be a corporately responsible and respected organisation that has a broad base of community support.
3. To optimise profits through the e�ective allocation of resources.
SA LOTTERIES ANNUAL REPORT 2010-11
i

In 2010-11, SA Lotteries returned 97 cents of every $1 received from game sales of $388.9 million to the South Australian community via:
• $235.4 million in prize money to players, taking the total since 1967 to more than $4.7 billion.
• $93.9 million to develop and improve public hospitals via the Hospitals Fund, taking the total contributed since the Fund was established in 1967 to $2.2 billion.
• $29.0 million in commission earnings to our agency network, comprised predominantly of small businesses, from the sale of SA Lotteries games.
• $10.3 million to local suppliers in exchange for goods and services.
• $7.5 million to employ local South Australians at SA Lotteries head o� ce and warehouse.
• $233 913 to support and develop sporting facilities and services via the Recreation and Sport Fund, taking the total contributed since the Fund was established in 1987 to $8.9 million.
HIGHLIGHTS
ii

We are pleased to present the Annual Report of the Lotteries Commission of South Australia for the year ended 30 June 2011, in accordance with Section 18B of the State Lotteries Act 1966, as amended.
SA Lotteries’ mission to benefit the South Australian community resulted in near record revenue of $388.9 million in the 2010-11 financial year. Of this amount SA Lotteries returned $376 million to the South Australian community. Distribution of prize moneywas$235million;ouragentsreceived commission payments, and local suppliers benefited through the goods and services they provided to SA Lotteries. The South Australian Government collected gambling tax, income tax equivalents, and dividend payments.
Return to the State Government amounted to $94.2 million, with $93.9 million directed toward developing and improving public hospitals, and more than $230 000 for recreation and sporting facilities.
Since 1967, the year SA Lotteries commenced operations, the organisation has contributed $2.2 billion to the South Australian Government’s Hospitals Fund and almost $9 million to the Recreation and Sport Fund.
The new online computer system marked its first full year of operation in 2010-11. It has provided the expected reliable service to our agencies by processing more than 62 million transactions including 51.9 million ticket sales.
Research undertaken recently for SA Lotteries confirms high customer satisfaction. It is a reflection on the reliable and friendly service the newsagencies, chemists, supermarkets, kiosks, delicatessens, service stations, hotels and clubs provided to customers when selling our games.
SA Lotteries spent $10.3 million on goods and services sourced from South Australian businesses, which comprised 73 per cent of the total value paid to all suppliers.
On 9 June 2011 the Government announced an intention to sub-license SA Lotteries operations. The Commission is working with the State Government to achieve an optimal outcome for the benefit of all South Australians, and to ensure a smooth transition for SA Lotteries sta�, agents and customers.
The dedication and professionalism of our sta� and the 550 small businesses translates into the solid performance of SA Lotteries over the past year. We thank them for their loyalty and commitment.
Hans J Oh� Presiding Member
June Roache Chief Executive
29 September 2011
PRESIDING MEMBER ANDCHIEF EXECUTIVE REPORT
THE HONOURABLE GAIL GAGO, MLC MINISTER FOR GOVERNMENT ENTERPRISES PARLIAMENT HOUSE ADELAIDE SA 5000
SA LOTTERIES ANNUAL REPORT 2010-11
iii

Returns to South Australia 2
Ten-year fi nancial summary 4
Performance measures 5
Corporate Governance 6
Winning Games 12
Services, Security and Responsibility 18
Our People 24
Business Partners 34
Community Benefi ts 40
Minimising our environmental impact 46
Financial statements 52
iv

SA LO
TTE
RIE
S A
NN
UA
L RE
PO
RT
2010
-11 CO
NT
EN
TS
1

THE HOSPITALS FUND RECEIVED $93.9 MILLION IN 2010-11
FOR THE DEVELOPMENT AND IMPROVEMENT OF SOUTH
AUSTRALIAN PUBLIC HOSPITALS.

RETURNS TO SOUTH AUSTRALIA

Year ended 30 June 2011$’000
2010$’000
2009$’000
2008$’000
2007$’000
2006$’000
2005$’000
2004$’000
2003$’000
2002$’000
GROSS SALES
Saturday X Lotto 137 897 125 764 131 280 128 336 135 042 132 388 135 176 130 825 129 603 123 632
Monday and Wednesday X Lotto *
34 684 37 133 36 718 31 782 32 607 35 936 40 670 41 706 28 931 23 380
Oz Lotto 36 871 44 530 58 789 34 709 22 234 16 495 14 641 15 467 16 575 17 127
Powerball 42 740 48 673 35 414 49 972 42 034 46 519 42 248 44 760 51 379 44 526
Keno 95 866 92 566 90 753 79 506 78 523 76 581 73 821 70 425 67 155 64 838
Instant Scratchies 39 113 40 189 38 886 39 929 37 139 38 383 40 343 39 812 39 864 37 920
Super 66 1 138 1 184 1 171 1 108 1 149 1 228 1 333 1 479 1 662 1 828
The Pools 631 665 694 581 518 558 586 622 742 605
Lucky SA - - - 660 - - - - - -
TOTAL GROSS SALES 388 940 390 704 393 705 366 583 349 246 348 088 348 818 345 096 335 911 313 856
COST OF SALES
Agents' commission 29 010 29 179 29 310 26 938 25 779 25 755 25 795 25 443 24 694 23 100
Prizes 235 412 233 407 236 931 221 283 211 236 209 439 207 172 207 886 202 336 187 217
% of gross sales 60.5 59.7 60.2 60.4 60.5 60.2 59.4 60.2 60.2 59.7
Gambling tax on NGR # 62 946 64 492 64 277 59 573 56 584 56 846 58 074 56 256 54 766 51 922
% of gross sales 16.2 16.5 16.3 16.3 16.2 16.3 16.6 16.3 16.3 16.5
GST on NGR # 13 957 14 300 14 252 13 209 12 546 12 604 12 877 12 474 12 143 11 513
% of gross sales 3.6 3.7 3.6 3.6 3.6 3.6 3.7 3.6 3.6 3.7
TOTAL COST OF SALES 341 325 341 378 344 770 321 003 306 145 304 644 303 918 302 059 293 939 273 752
GROSS MARGIN 47 615 49 326 48 935 45 580 43 101 43 444 44 900 43 037 41 972 40 104
Other revenue 7 141 6 821 7 610 6 603 7 487 7 039 7 294 6 944 6 878 6 204
TOTAL INCOME 54 756 56 147 56 545 52 183 50 588 50 483 52 194 49 981 48 850 46 308
Operating expenses 25 294 26 734 25 921 25 313 23 602 23 249 25 978 24 926 24 421 22 756
% of gross sales 6.5 6.8 6.6 6.9 6.8 6.7 7.4 7.2 7.3 7.3
PROFIT BEFORE INCOME TAX EQUIVALENT
29 462 29 413 30 624 26 870 26 986 27 234 26 216 25 055 24 429 23 552
% of gross sales 7.6 7.5 7.8 7.3 7.7 7.8 7.5 7.3 7.3 7.5
RETURN TO GOVERNMENT
Gambling tax 63 018 64 571 64 344 59 619 56 616 56 888 58 412 56 256 54 766 51 922
Income tax equivalent 8 839 8 824 9 187 8 061 8 096 8 170 7 799 7 516 7 542 7 066
Dividend ## 20 298 21 968 19 446 21 703 19 476 18 956 22 911 17 869 17 673 15 369
Unclaimed prizes 2 041 1 610 2 152 2 271 1 905 1 291 1 839 1 639 1 551 1 656
94 196 96 973 95 129 91 654 86 093 85 305 90 961 83 280 81 532 76 013
% of gross sales 24.2 24.8 24.2 25.0 24.7 24.5 26.1 24.1 24.3 24.2
GST on NGR 13 957 14 300 14 252 13 209 12 546 12 604 12 877 12 474 12 143 11 513
TOTAL RETURN TO GOVERNMENT
108 153 111 273 109 381 104 863 98 639 97 909 103 838 95 754 93 675 87 526
% of gross sales 27.8 28.5 27.8 28.6 28.2 28.1 29.8 27.7 27.9 27.9
TEN-YEAR FINANCIAL SUMMARY
*Monday and Wednesday X Lotto replaced SA Lotto from 27 April 2006. SA Lotto twice weekly draws on Monday and Wednesday commenced November 2003. # State Gambling Tax at the rate of 41% of Net Gambling Revenue (NGR=Gross sales less monetary prizes) paid to the Hospitals Fund/Recreation and Sport Fund. GST at the rate of 9.09% of NGR paid to the Commonwealth Government. ## Includes Special Dividend of $6 527 000 in 2005 resulting from proceeds on sale of SA Lotteries’ former Head O�ce in Rundle Mall.

SOUTH AUSTRALIA’S STRATEGIC PLAN OBJECTIVE
PERFORMANCE MEASURE TARGET 2010-11 ACTUAL 2010-11
Goal 1: To promote, conduct and distribute lotteries games for the benefi t of the South Australian community.
Strategy 1: Grow revenue by enhancing existing games and introducing new games and initiatives.
Growing Prosperity Gross sales $369.0M $388.9M
Sales per capita $287.75 $302.51
Tickets sold 51.0 M 51.9M
SA Lotteries’ proportion of Australian Bloc sales 7.0% 6.7%
Strategy 2: Exceed customer expectations by providing an accessible and reliable service.
Fostering Creativity and Innovation
Selling system down time: central system 0.04 %170 mins
0.03%123mins
Point of Sale terminal reliability (MTBF) 240 000 533 452
Number of visits to corporate website 4 680 800 3 075 702
Easiplay Club Membership 190 000 188 463
Goal 2: To be a corporately responsible and respected organisation that has a broad base of community support.
Strategy 3: Ensure community and stakeholder trust and support.
Improving Wellbeing Non-compliance (Codes of Practice and other) 6.0% 6.8%
Customer satisfaction 98% 99%
Awareness of SA Lotteries’ benefi ciaries 40% 39%
Strategy 4: Adopt sound environmental practices (12 months to 31 March)
Attaining Sustainability Greenhouse gas emissions 779 Tonnes 810 Tonnes
Goal 3: To optimise profi ts through the e� ective allocation of resources.
Strategy 5: Ensure a high performance and ethical culture.
Expanding Opportunity Average Full-Time Equivalents (FTEs) employed during the year 83.82 80.24
Training and development costs as a percentage of base salary costs 2.94% 1.82%
Employee retention – sta� turnover 15.68% 12.52%
Employees understanding of SA Lotteries’ values 100% 96%
Strategy 6: Ensure sustainable growth opportunities are pursued.
Growing Prosperity EBITDA $24.3M $31.8M
EBITDA per FTE $0.290M $0.392M
Total operating expenses as % of gross sales 8.1 %$30.0M
6.5%$25.3M
Cost per FTE $0.358M $0.312M
Building Communities Return to Government(Hospitals Fund and Recreation and Sport Fund) $82.3M $94.2M
Improving Wellbeing $ value of SA suppliers as a % of total suppliers 64% 73%
PERFORMANCEMEASURES
Sales per capita - based on South Australian adult (18+) population. EBITDA - Earnings Before Interest, Tax, Depreciation and Amortisation. FTE - Average Operating Full-time Equivalent employee numbers during the year. MTBF - Average number of Transactions Between Failures.
SA LOTTERIES ANNUAL REPORT 2010-11

SA LOTTERIES’ CORPORATE VALUES OF INTEGRITY,
ACCOUNTABILITY AND RESPECT UNDERPIN ITS OPERATIONS.

SA Lotteries’ approach to corporate governance is based on a defined set of values and behaviours that underpin its operations, earning SA Lotteries a reputation of integrity and trustworthiness among its stakeholders. Also inherent in SA Lotteries’ business purpose and strategy is a commitment to balancing high returns with contributions to the broader community. Not just an add-on, Corporate Social Responsibility is integral to SA Lotteries’ entire business operations.
ROLE OF THE SHAREHOLDER As a statutory authority established under the State Lotteries Act 1966, SA Lotteries’ shareholder is the Government of South Australia. The Honourable Gail Gago, MLC was the Minister responsible for SA Lotteries for the period 1 July 2010 to 30 June 2011 as part of the Government Enterprises portfolio. SA Lotteries is responsible for ensuring that the Government, via the Minister, is informed of all major developments a�ecting SA Lotteries’ operations.
A Government Observer is invited to attend meetings of the Lotteries Commission of South Australia (Commission) and its Committees.
THE COMMISSION The Commission has a formal charter that provides a framework for the e�ective operation of SA Lotteries. The Commission generally meets monthly to deliver strategic guidance and monitor the performance of the organisation.
The Chief Executive is accountable to the Commission and is responsible for the day-to-day management of SA Lotteries’ business in accordance with the directions set by the Commission. The Commission clearly defines management accountabilities through approved management operating authorities.
The Commission is appointed by the Governor of South Australia and consists of not less than three nor more than five members, one of whom shall be nominated by the Governor as the Presiding Member.
Membership as at 30 June 2011 comprised:
Name: H J Oh�, PhD, BA (Hons), FIEAust, CP Eng Position: Presiding Member Expertise: Engineering
Name: S J Mackenzie, B Comm (Accounting), LLB (Hons) Position: Member Expertise: Law
Name: W R Jackson, BEc, FASA Position: Member Expertise: Business Management Consultant
Name: A E Lindsay, BA (Hons), LLB (Hons) Position: Member Expertise: Law
Name: A E Heyworth, BA (Acc), MBA (AGSM), SF Fin, FAICD Position: Member Expertise: Finance and Business Strategy
A member is appointed for a term of o�ce not exceeding five years. On expiration of his or her term, a member will be eligible for reappointment.
Remuneration for a qualifying member is $24 765 per annum. The Presiding Member receives $37 148 per annum. Further details of members’ remuneration payments are set out in Note 8 to the Annual Financial Statements.
CORPORATEGOVERNANCE
Han
s J Oh
�
Su
zann
e J Macken
zie
Wayn
e R Jackso
n
An
ne E
Lin
dsay
Am
and
a E H
eyw
orth

AUDIT COMMITTEE The Audit Committee assists the Commission to fulfi l its responsibilities by identifying areas of signifi cant business risk.
The Audit Committee has a charter outlining its formal responsibilities including:
• reviewingtheGeneralPurposeFinancial Report prior to its approvalbytheCommission;
• liaisingwithSA Lotteries’externalauditor, the Auditor-General, on all matters concerning the outcomeofaudits;
• reviewingtheadequacyoftheaccounting, internal auditing, reporting and other fi nancial management systems and practices;and
• performingtheroleofanexecutive remuneration committee for the Commission.
The Audit Committee comprises three Commission members. During the year, membership comprised:
• WRJackson,Chair;
• AELindsay,Member;and
• AEHeyworth,Member.
Audit Committee members receive a fee of $3 715 per annum and the Chair receives a fee of $5 572 per annum.
The internal auditor, KPMG, and external auditor, the Auditor-General, may be invited to Audit Committee meetings at the discretion of the Committee.
INFORMATION TECHNOLOGY COMMITTEE The Information Technology (IT) Committee assists the Commission to oversee the use of information technology within SA Lotteries. The IT Committee has a formal charter to:
• monitorthedevelopmentandimplementation of major technologyprojects;
• evaluateriskmanagementstrategies designed to minimise interruption to online selling activities;and
• provideadvicetotheCommissionon all matters associated with major technology projects.
The IT Committee comprises one Commission member who is the Chair of the Committee, H J Oh� , and members of the executive management team. The Chair receives a fee of $5 572 per annum. A representative from the Auditor-General’s Department is invited to attend IT Committee meetings.
ATTENDANCE AT MEETINGS 2010-11
Commission Meeting (12 held)
Audit Committee Meeting (4 held)
IT CommitteeMeeting (6 held)
Hans J Oh� 11 # 6
Suzanne J Mackenzie 10 # #
Wayne R Jackson 12 4 #
Anne E Lindsay 12 4 #
Amanda E Heyworth 10 4 #
# Not a member.
SA LOTTERIES ANNUAL REPORT 2010-11

CORPORATE POLICY FRAMEWORK SA Lotteries maintains a corporate policy framework, which is approved by the Commission. This framework is supported by divisional policies, guidelines and procedures that are reviewed by management on an ongoing basis.
INTERNAL COST CONTROL FRAMEWORK The Commission’s internal cost control framework assists in the preclusion of errors and irregularities across the business and is described under the following headings:
Financial reporting A comprehensive budgeting system with an annual budget approved by the Commission prior to submission to Government. Monthly actual results are reported against budget.
Quality and integrity of personnel Employees are bound by the Code of Ethics for the South Australian Public Sector and SA Lotteries’ Code of Ethics.
Operating division controls Financial controls and procedures, including information systems controls, are in place. A Commission questionnaire details compliance with these controls and procedures to ensure sound principles of corporate governance and accountability.
Functional specialty reporting Performance measures are identified and regularly reported in a corporate scorecard.
Capital investment appraisal SA Lotteries has clearly defined guidelines for capital expenditure.
These include levels of authority, annual budgets, detailed cost benefit analyses and post-implementation reviews of major expenditure.
RISK MANAGEMENTSA Lotteries undertakes risk assessment on an ongoing basis and includes all strategic and operating risks in its Risk Management Program. During 2010-11, management completed an annual review of SA Lotteries’ Risk Register.
CRISIS PLANNING SA Lotteries has undertaken business continuity planning to ensure that business activities are, to the greatest extent possible, protected and maintained during a crisis. SA Lotteries’ Crisis Plan and departmental Business Continuity Plans were reviewed by management in 2010-11.
ETHICS AND CULTURE COMMITTEE To ensure that SA Lotteries’ values of integrity, accountability and respect are upheld, an Ethics and Culture
Committee meets regularly with the purpose of ensuring that policy objectives are met.
Ethical conduct is regularly reinforced via education, induction and performance management processes. An annual survey monitors employee awareness of ethical standards of behaviour. Trend analysis and future actions are also guided by feedback from ‘On-boarding’ and ‘Exit’ surveys.
FRAUD SA Lotteries has a Fraud and Corruption Control Policy to minimise exposure to fraudulent and corrupt conduct. The policy establishes processes to identify potential risk areas and implement controls to reduce the risk of fraudulent action occurring. Suspected incidents of fraud are investigated immediately. There were no instances of fraud during 2010-11.
BUSINESS MANAGEMENT
SA
Lo
tteries’ Execu
tive Team: (b
ack row
, from
left) Joh
n Favretto
, C
hris M
cSp
orran
, David
Hard
y and
(fron
t row
, from
left) Callu
m M
ulvih
ill an
d Ju
ne R
oach
e.

FREEDOM OF INFORMATION SA Lotteries complies with the Freedom of Information Act 1991 (FOI Act) and ensures appropriate and timely action is taken when access to information is requested. Information is provided on request in accordance with the requirements of the FOI Act, including:
• SA Lotteries’organisationalstructureandbroadfunctions;and
• SA Lotteries’policydocumentsand operating manuals covering all areas of its operations.
The functions of SA Lotteries have an e� ect on the general public in that they:
• createprosperitythroughtheresponsible promotion and conductoflotteries;and
• contributetotheSouthAustraliancommunity with the provision of prizes to players and profi ts to hospitals and recreation and sport.
Members of the public may obtain access to documents or seek amendments of SA Lotteries’ records by written request to SA Lotteries.
The prescribed application fee under the FOI Act must accompany the application. One request for information was received during 2010-11.
SA Lotteries publishes the above Freedom of Information Statement on its website.
QUALITY MANAGEMENTSA Lotteries is committed to the implementation of quality practices and systems in all aspects of its operations. A Quality Management System documents the processes and controls in place to achieve the objectives described in the organisation’s Quality Policy Statement and maintains certifi cation to the Quality Standard AS/NZS ISO 9001. Regular internal reviews ensure a focus on continual improvement of practices and systems and the Quality Management System is audited biannually by external sources.
CORPORATE SECURITY MANAGEMENT SA Lotteries has developed a Protective Security Policy that identifi es all aspects of corporate security that impact on day-to-day business operations.
The policy provides a framework for the implementation of strategies to protect assets, operations, information and personnel against all possible security breaches.
SECURITY STANDARDS During the year, SA Lotteries continued to focus on projects that will lead to compliance and formal accreditation under the following security standards:
• InformationSecurityStandardAS/NZSISO/IEC27001;
• WorldLotteryAssociationSecurityControlStandard;and
• theStateGovernment‘sProtective Security Management Framework.
INTELLECTUAL ASSETS MANAGEMENT SA Lotteries regards the protection of its intellectual property as important to its ongoing success. A register of all protected trademarks and names is maintained and monitored on an ongoing basis.
SA Lotteries has fi nalised Trade Mark Management Agreements and Trade Mark Licence Agreements with its interstate Bloc counterparts.
ORGANISATIONAL STRUCTURE
THE COMMISSION
CHIEF EXECUTIVE
General ManagerInformation and Communication
Technology
Chief Financial O� cer
Audit Committee
Information Technology Committee
General ManagerMarketing
and Sales
General ManagerLegal and Risk Management/
Company Secretary
COMMISSION COMMITTEES
SA LOTTERIES ANNUAL REPORT 2010-11

SOUTH AUSTRALIANS WON $235.4 MILLION
IN PRIZE MONEY PLAYING SA LOTTERIES’ GAMES IN 2010-11.


WINNING GAMES SA Lotteries’ eight games of chance continued to provide South Australian players with a choice of purchase price, play option and prize o�er. Thousands of players shared $235.4 million in prize money, including 86 players who shared $63.1 million in Division One prize money.
Saturday X Lotto remains SA Lotteries’ flagship game, representing 35 per cent of sales and 2010-11 saw an increase of 9.6 per cent in sales from last year. This record result in 2010-11 was driven by two major promotions and the successful introduction of a sixth prize division in January 2011.
Although the record jackpot activity of the previous two financial years was not repeated, Oz Lotto and Powerball benefited from a cross-promotion in June and delivered strong sales at each jackpot level throughout the year.
Keno’s 3.6 per cent increase on 2009-10 sales is largely attributable to the game’s prior expansion to SA TAB outlets, and the introduction of the add-on game, Keno Coin Toss in May 2010.
The inaugural $5 Deal or No Deal Instant Scratchies ticket was successful in selling out 75 per cent faster than previous $5 tickets.
Each year, SA Lotteries partners with Australian Lottery operators Tatts Lotteries and Lotterywest in multi-jurisdictional (Bloc) arrangements for all games, except Keno and Instant Scratchies.
SA Lotteries improved its national sales share of Bloc games from 6.51 per cent in 2009-10 to 6.74 per cent in 2010-11.
SATURDAY X LOTTO In Saturday X Lotto, six numbers and two supplementary numbers are randomly drawn from a barrel of 45 every Saturday. To win Saturday X Lotto, players need to match their selection of numbers with those drawn, and the more numbers matched, the greater their prize.
Saturday X Lotto o�ers players Australia-wide the chance to share in an estimated Division One prize pool of $4 million every Saturday, with seven Megadraw prize pools of $20 million or more also o�ered in 2010-11.
Sales Performance• 2010-11 result: $137.9 million
• % of total: 35.5
• 2009-10 comparison: Increase of $12.1 million or 9.6 per cent
Highlights• The 31 December Megadraw was
moved to a Friday to coincide with New Year’s Eve. This change, along with a buy-one-get-one-free ticket and an interactive Facebook promotion, generated record sales.
In the Australian Marketing Institute’s 2011 Awards for Marketing Excellence, SA Lotteries’ Facebook promotion was the State Winner in the Multimedia and Interactive category and is a finalist in the National Awards to be announced in October 2011.
• Introduction of a sixth prize division on 29 January, enabling local players to win more than 29 000 additional prizes on average each week.
• A buy-one-get-one-free promotion in May resulted in a 53.6 per cent sales increase on the previous year’s draw.
Prizes won • Total: 1 715 824 totalling
$75.9 million
• Division One: 27 totalling $25.3 million
Most memorable moment: A Barossa Valley couple discovered in June that a $462 129 prize was worth the e�ort of getting out of bed.
“After a long Sunday sleep-in, we checked our ticket and were stunned to see we’d matched all six numbers,” the woman said upon presenting her ticket at SA Lotteries Head O�ce.
“Needless to say, my husband and I were both wide awake when we realised our ticket was worth $462 000,” she said.
The couple planned to use the prize money to upgrade the family car, embark on some travel, and financially assist some of their close friends.
The pair’s winning entry, an Easi-Pick, was sold by the team at Nuriootpa Newsagency.
WINNINGGAMES
Nu
rioo
tpa N
ewsag
ency celeb
rates the sale o
f a win
nin
g
Satu
rday X
Lo
tto ticket. C
ou
rtesy of T
he Lead
er New
spap
er. P
ho
tog
raph
er Alicia L
ud
i-Sch
utz.
Photo previous page: Steph Mavrogiannis celebrating her $200 000 Instant Scratchies top prize win. Photo courtesy of The Advertiser. Photographer Tait Schmaal.

MONDAY AND WEDNESDAY X LOTTO In Monday and Wednesday X Lotto, six numbers and two supplementary numbers are randomly drawn from a barrel of 45 every Monday and Wednesday. To win Monday and Wednesday X Lotto, players need to match their selection of numbers with those drawn, and the more numbers matched, the greater their prize.
Monday and Wednesday X Lotto o� ers players in all Australian States and Territories, except Queensland, the chance to share in a guaranteed Division One prize pool of $1 million every Monday and Wednesday which jackpots progressively if not won.Three $5 million Superdraws were also o� ered in 2010-11.
Sales Performance• 2010-11 result: $34.7 million
• % of total: 8.9
• 2009-10 comparison: Decrease of $2.4 million or 6.6 per cent
Highlight• A ‘Double Dividends’ promotion
in May, which doubled division 2 to 5 prize values for South Australian players.
Prizes won• Total: 388 481 totalling
$19.5 million
• Division One: 9 totalling $11.3 million
Most memorable moment: The results of a Monday X Lotto draw in July gave an Adelaide man something to ‘Crow’ about.
The man’s lottery selections, based on the numbers of his favourite Adelaide Crows footballers, won him $1 million.
“Maybe this is a sign that the Crows will make the fi nals,” the man said.
While his wish for the Crows didn’t come to fruition, the western suburbs resident used his prize money to fulfi l his own dream of travelling around Australia.
OZ LOTTO In Oz Lotto, seven numbers and two supplementary numbers are randomly drawn from a barrel of 45 numbers every Tuesday. To win Oz Lotto, players need to match their selection of numbers with those drawn, and the more numbers matched, the greater their prize.
Each week, Oz Lotto o� ers players Australia-wide the chance to share in a multi-million dollar prize pool, which jackpots progressively if not won.
Sales Performance• 2010-11 result: $36.9 million
• % of total: 9.5
• 2009-10 comparison: Decrease of $7.7 million or 17.2 per cent
Highlight• Cross-promotion with Powerball
in June.
Prizes won• 619 835,totalling$11.7million
SA LOTTERIES ANNUAL REPORT 2010-11

POWERBALL In Powerball, fi ve numbers are randomly drawn from one barrel of 45, and a sixth ‘Powerball’ number is drawn from a separate barrel of 45, every Thursday. To win Powerball, players need to match their selection of numbers with those drawn, and the more numbers matched, the greater their prize.
Each week, Powerball o� ers players Australia-wide the chance to share in a multi-million dollar prize pool, which jackpots if not won.
Sales Performance• 2010-11 result: $42.7 million
• % of total: 11.0
• 2009-10 comparison: Decrease of $5.9 million or 12.2 per cent
Highlight• Cross-promotion with Oz Lotto
in June.
Prizes won• Total: 507 340 totalling
$33.6 million
• Division One: 4 totalling $20.5 million
Most memorable moment: A man from Adelaide’s northern suburbs claimed South Australia’s largest prize for the year in Powerball in October.
Having registered his winning entry on his Easiplay Club membership card, the man was able to be contacted by SA Lotteries with the news that he was $15 million richer.
“After checking my ticket, I thought it was all a big mistake,” the man said at the time.
“I really didn’t get much sleep that night,” he said, “I was just in total disbelief.”
The man became the sixth largest winner in SA Lotteries’ history.
KENO In Keno, 20 numbers are randomly generated from a possible 80 every 3.5 minutes. To play Keno, players can choose to select one number (Spot 1) up to 10 numbers (Spot 10). Players can also select “Heads”, “Tails” or “Evens” in the add-on game, Keno Coin Toss. Every 3.5 minutes, Keno o� ers a guaranteed Spot 10 prize of $1 million which jackpots if not won.
Sales Performance• 2010-11 result: $95.9 million
• % of total: 24.6
• 2009-10 comparison: Increase of $3.3 million or 3.6 per cent
Highlights• Record sales result achieved.
• Record Spot 10 jackpot of $2 145 158 won in August.
Prizes won• Total: $69.7 million
• Top prizes (Spots 8, 9 & 10): 22 totalling $3.2 million
Most memorable moment: A Wallaroo man “couldn’t be happier” after collecting South Australia’s largest Keno jackpot prize of $2 145 158 in August. He has spent much time deliberating on international travel and is “thoroughly enjoying life” since winning.
Kym
and
Tamm
ie Read
, pro
prieto
rs of W
allaroo
N
ewsag
ency, celeb
rate on
e of th
eir custo
mers w
inn
ing
S
ou
th Au
stralia’s largest K
eno
jackpo
t. Ph
oto
cou
rtesy of
Th
e Yo
rke Pen
insu
la Co
untry T
imes.

INSTANT SCRATCHIES An Instant Scratchies game is a series of themed scratch lottery tickets that give South Australians the chance to win instant prizes up to a maximum of $750 000. At least 10 Instant Scratchies games are o� ered at any one time.
Sales Performance• 2010-11 result: $39.1 million
• % of total: 10.0
• 2009-10 comparison: Decrease of $1.1 million or 2.7 per cent
Highlights• Inaugural $5 Deal or No Deal
ticket sold out in 10 weeks.
• Introduction of new generation tickets with barcodes compatible with self-service ticket checkers.
Prizes won• Total: 4 305 986 totalling
$24.4 million
• Top prizes: 22 totalling $2.6 million
Most memorable moment: Christmas was exceptionally merry for 20-year-old Steph Mavrogiannis when she discovered a $200 000 treasure hidden beneath the latex of an Instant Scratchies ticket.
The Forestville resident couldn’t believe her luck when she discovered her top prize win on a $5 Tropical Treasure ticket she received as a Christmas gift.
“My brother gave Instant Scratchies tickets as presents to the family on Christmas Day – mine turned out to be a slightly bigger gift than expected,” Steph said. “Of course I shared the prize with my generous brother, and I’ve banked the remainder for safe-keeping,” she said.
SUPER 66 In Super 66, six numbered balls are randomly drawn from six separate compartments that each contain ten balls numbered zero to nine. To win Super 66, players need to match their selection of numbers with those drawn in the order drawn, and the more numbers matched, the greater their prize.
Each week, Super 66 o� ers players in all Australian States and Territories, except New South Wales, the chance to win a guaranteed Division One prize of $16 666, which jackpots if not won.
Sales Performance• 2010-11 result: $1.1 million
• % of total: 0.3
• 2009-10 comparison: Decrease of $0.05 million or 3.9 per cent
Prizes won• Total: 20 612 totalling $0.6 million
• Division One: 2 totalling $0.2 million
Most memorable moment: A father from Adelaide’s northern suburbs received a wake-up call with a di� erence when SA Lotteries called him with the $130 386 winning news. “Is this a hoax, because I can’t say I believe this?” the man asked SA Lotteries.
Not yet having checked the Super 66 entry that he had registered on his Easiplay Club membership card, the man was overjoyed to see the proof on his ticket.
“I’ve matched all six numbers? You little ripper!”
With his winnings, the man planned to fi nish his home renovations and travel to Europe for a holiday.
THE POOLS In The Pools, six winning numbers and one supplementary number are determined by the results of a pre-determined list of 38 soccer matches. To win The Pools, players need to match their selection of numbers with those determined by the results of the soccer games specifi ed on the relevant weekly Match List. The more numbers matched, the greater the prize.
Each week, The Pools o� ers players Australia-wide the chance to win an estimated Division One prize pool of $65 000, which jackpots if not won.
Sales Performance• 2010-11 result: $0.6 million
• % of total: 0.2
• 2009-10 comparison: Decrease of $30 000 or 5.2 per cent
Prizes won• Total: 7 459 totalling $0.1 million
SA LOTTERIES ANNUAL REPORT 2010-11

MEMBERS OF SA LOTTERIES’ EASIPLAY CLUB AUTOMATICALLY
RECEIVED $5.9 MILLION IN PRIZES DURING 2010-11.


Approximately 70 per cent of South Australian adults choose to play an SA Lotteries game at least once per year.
A range of services and stringent security measures ensure a quality playing experience for customers who, in 2010-11, purchased 51.9 million tickets and claimed 10.4 million prizes.
CUSTOMER SATISFACTION In 2010-11, SA Lotteries received a total of 1 382 enquiries and complaints, including suggestions for improvement, and responded within an average time of 2.89 days.
Annual research conducted to evaluate the level of satisfaction among SA Lotteries’ customers revealed 99 per cent to be either satisfied or extremely satisfied with the service they received in 2010-11.
EASIPLAY CLUB SA Lotteries’ Easiplay Club is a free service that allows players to safeguard their prizes won on lost, damaged or stolen tickets. Easiplay Club membership was 188 463 as at 30 June 2011, representing 15 per cent of the South Australian adult population. Throughout the year, Easiplay Club members automatically received $5.9 million in uncollected prize money via cheque or direct bank deposit. In 2010-11, 24 Easiplay Club members were notified by SA Lotteries of a Division One prize win.
ONLINE LOTTERIES SYSTEMDuring the year, the online lotteries system continued to deliver a reliable service to customers with 99.97 per cent availability of our central online lotteries system at agencies across South Australia.
In 2010-11, more than 62 million transactions were processed with accuracy and integrity through the online lotteries system, including 51.9 million ticket sales.
WEBSITESA Lotteries’ corporate website, www.salotteries.com.au continues to be an immediate and comprehensive source of information for approximately 256 000 SA Lotteries players each month.
In 2010-11, the website attracted 3.1 million visits, representing an increase of 6.5 per cent on the previous year.
While more than 90 per cent of visitors access game results, the website also assists players in:
• viewingthelatestdrawbroadcasts;
• generatingthemostfrequentlydrawnnumbers;
• assessingwhethergamblingmaybeaffectingtheirhealth;
• sharingawinningstoryviatheonlineWinnersGallery;and
• findingthenearestSA Lotteriesagency by postcode or by agency name via the Google maps search tool.
The site was announced as the number one website, for the fourth consecutive year, in the 2010 Hitwise Online Performance Awards program, Government-South Australia Category. The program recognises excellence in online performance through public popularity and bases its results on the Internet usage of approximately three million Australian Internet users.
iPHONE APP SA Lotteries’ iPhone Application (App) launched in December 2009 gives players access to game results anywhere, anytime.
App users can easily check recent dividend information for their favourite game via direct in-App access to SA Lotteries’ website. In addition, players can generate a set of lucky numbers for their favourite game, find their nearest SA Lotteries agency and view all current Instant Scratchies tickets for sale.
TELEPHONE RESULTS LINES SA Lotteries continued to provide players with convenient access to results and dividend information via its telephone and SMS results services.
In 2010-11, there were more than 365 000 requests for results and dividend information via the telephone and SMS services.
POINT OF SALE EXPERIENCEFull-colour customer display screens and self-service ticket checking units continued to o�er players prize transparency and security during the year.
SERVICES, SECURITYAND RESPONSIBILITY

PRIZE CLAIMS
✓ Validation slips are provided to players to confi rm status of ticket.
✓ Non-winning tickets are returned to customers.
✓ Unregistered Division One and Two prizes can only be claimed at SA Lotteries Head O� ce.
✓ Easiplay Club registered tickets are unable to be validated without the originating membership card.
✓ Easiplay Club registered tickets bear the primary member’s name.
✓ Ex gratia prize claims can be lodged for lost or damaged unregistered tickets.
✓ SA Lotteries Head O� ce o� ers secure prize payment such as electronic funds transfer (EFT).
PLAYER AWARENESS
✓ Large customer display screens show purchase and prize validation information at point of sale.
✓ Self-service ticket checkers are installed in all agencies to enable players to check their own tickets for prizes.
✓ Sales summary slips are provided to every player to itemise transactions.
✓ Free-of-charge ticket registration service, Easiplay Club, guarantees prize security.
✓ Active awareness campaign promotes Easiplay Club and encourages the registration of tickets.
✓ Information dedicated to the prize claim process is included on the website.
✓ Player security measures are detailed on the website.
✓ Dedicated lottery scam alert area on the website.
✓ List of unclaimed prizes is updated weekly on the website.
✓ Draw broadcasts for Saturday X Lotto, Oz Lotto and Powerball are available on the website.
RESULTS AVAILABILITY
✓ Registered Division One prize winners informed via telephone.
✓ Game results broadcast on free-to-air television.
✓ Game results immediately published on the website.
✓ Game results immediately disseminated via iPhone Application.
✓ Game results immediately disseminated to SA Lotteries’ o� cial results telephone hotlines.
✓ Results disseminated to mass media.
✓ Results emailed to subscribers.
✓ Results sent via SMS.
SECURITY AND INTEGRITY SA Lotteries applies a range of measures to ensure the prize claim process remains transparent, secure and reliable:
SA LOTTERIES ANNUAL REPORT 2010-11

AGENT INTEGRITY AND SECURITY
✓ Prize claims greater than $5 000 (at SA Lotteries Head O�ce) require a signed Statutory Declaration declaring if the prize claimant is an SA Lotteries employee, agent, agent employee or relative of an agent or employee.
✓ Agents must obtain a prescribed range of business insurances.
✓ Agents are regularly reminded to return non-winning tickets, validation slips and sales summary slips to players.
✓ All applicants for an agency undergo National Police Checks.
✓ Agents provided with South Australia Police fraud and scam alerts.
✓ Agents encouraged to notify SA Lotteries of any suggested improvements to security procedures.
✓ Incidents of suspected fraud investigated and, if necessary, referred to SA Police.
✓ Disciplinary process applied to agents or agency employees in breach of security policies.
✓ Regular, random and comprehensive compliance audits conducted at all agencies at least once a year.
✓ Dedicated player security website page encourages reports of agency deficiencies.
✓ A defined customer complaints process applies to allow for the identification and escalation of security-based issues.
✓ A confidential questionnaire, ‘Can We Help You?’ is available at all agencies for customers to provide feedback on agent service and integrity.
✓ Senior management position responsible for security-based issues.
✓ Monthly reviews undertaken to ensure that responses to, and investigations of, customer complaints are conducted in a timely manner.
PROMOTING RESPONSIBLE PLAYSA Lotteries remains steadfast in the responsible promotion and conduct of its games to ensure a safe playing environment for customers.
SA Lotteries’ problem gambling harm minimisation program is underpinned by the provisions of the State Lotteries Responsible Gambling Code of Practice and the State Lotteries Advertising Code of Practice (the Codes).
GLOBAL CERTIFICATIONSA Lotteries is one of 23 lottery jurisdictions worldwide — and the only jurisdiction in Australia — to have received global recognition for operating at the highest level of responsible gambling standards. In 2009 SA Lotteries was awarded the highest accreditation under the World Lottery Association (WLA) Responsible Gambling Framework for a mature and well-established responsible gambling program inherent in its day-to-day operations.
Verified by the WLA Independent Assessment Panel, the Level 4 accreditation was awarded on the basis of SA Lotteries’ social responsibility initiatives, which include stakeholder engagement, retailer training, player education, third party assessment, expert consultation, participation in industry initiatives, and public reporting. These standards were maintained in 2010-11.
COMPLIANCE A comprehensive compliance program involving an audit of all SA Lotteries agencies against 28 checks of compliance with the Codes is undertaken annually. In 2010-11, 94 per cent of the 768 audits conducted during the year found agents to be compliant with the requirements of the Codes. In all instances of non-compliance, SA Lotteries worked with the agencies to ensure issues were adequately addressed to achieve compliance at a subsequent reaudit.

PROACTIVE BARRING SA Lotteries proactively facilitates barring arrangements upon direct request from a person at risk or via a gambling help service representative on their behalf. As at 30 June 2011, nine SA Lotteries agencies had arrangements in place to facilitate barring from the service of lottery products for fi ve self-identifi ed problem gamblers.
TRAINING SA Lotteries conducts various responsible gambling training modules via accredited provider, Business SA, to ensure all key stakeholders are educated in identifying problem gambling.
SA Lotteries’ EmployeesEach SA Lotteries’ employee is required to undertake training in responsible gambling upon commencement of employment. In 2010-11, 15 employees completed training.
SA Lotteries’ Agents and Agency EmployeesSA Lotteries requires all agents and agency sta� members to complete responsible gambling training prior to operating the lottery terminal. In 2010-11, 382 agents and agency employees completed responsible gambling training.
Agency Employees (under 18 years)SA Lotteries continues to o� er a responsible gambling training module tailored to agency employees aged less than 18 years. The training ensures that younger individuals are appropriately prepared for their role in a responsible gambling environment. In 2010-11, 16 agency employees aged less than 18 years completed the dedicated training.
Refresher moduleAgents and agency employees are required to refresh their training in responsible gambling at least every two years. In 2010-11, 517 agents and agency sta� completed this module for responsible gambling training.
PROBLEM GAMBLINGAll agents and employees are trained to identify problem gambling behaviours among SA Lotteries’ players, and to provide appropriate referral advice where relevant. Agents immediately report all instances of customer contact in relation to problem gambling to SA Lotteries’ Head O� ce.
SA Lotteries’ Internal Problem Gambling Report Group continues to assess all problem gambling reports to determine the best course of action, if any. Nine issues were addressed by the Group in 2010-11, with appropriate action undertaken on each occasion.
On
eSto
p N
ewsag
ency sta� celeb
rating
a cu
stom
er’s X L
otto
$1.6
millio
n win in Jan
uary.
Ph
oto
cou
rtesy of W
hyalla New
s.
SA LOTTERIES ANNUAL REPORT 2010-11

SA LOTTERIES CREATED TRAINING AND DEVELOPMENT
OPPORTUNITIES FOR ALL EMPLOYEES IN 2010-11.


SA Lotteries’ success in achieving its goals continues to depend on its people. A team of 86 employees remained dedicated to achieving business excellence in 2010-11, driven by a high performance and ethical organisational culture.
ATTRACTING AND RETAINING STAFF To attract and retain the right people for the job, SA Lotteries provides career training and development opportunities;performancefeedbackandrecognition;andaworkingenvironment supported by organisational values of integrity, accountability and respect.
Raising the profile of SA Lotteries as an employer that provides a culture of development and innovation is a core focus for the organisation to ensure its valued employees remain dedicated to achieving SA Lotteries’ business objectives.
EMPLOYEE RECOGNITION SA Lotteries formally recognises service longevity at monthly employee celebrations. In 2010-11, 18 employees were recognised for service milestones:
• 5years–4employees
• 10years–3employees
• 15years–5employees
• 20years–4employees
• 25years–2employees
Long-serving employees are presented with a commemorative gift.
QUALIFIED WORKFORCE SA Lotteries’ workforce comprises a high level of qualified personnel, with 68 per cent of employees having completed vocational or higher education qualifications.
MANAGEMENT DEVELOPMENT PROGRAM A new Management Development Program was implemented in 2010-11, allowing for managers to participate in workshops relating to performance development, organisational change and communication.
This program is designed to build a leadership-based performance culture and to ensure adequate succession planning. The framework incorporates competencies in leadership, strategy, people management and relationships.
TRAINING AND DEVELOPMENT To meet planned training and development requirements, 1.8 per cent of base salary costs was expended on training during 2010-11, with 85 employees (99 per cent of sta�) participating in training courses throughout the period.
Study assistance and study leave is also available to SA Lotteries’ full-time and permanent part-time employees, subject to the relevance of the proposed study and operational requirements.
PERFORMANCE DEVELOPMENT SA Lotteries implemented a new performance management system in 2010-11, encompassing an online forum that provides employees with a better understanding of their roles and allows for regular performance feedback and recognition.
During the year, 100 per cent of employees participated in a documented individual performance plan.
OUR PEOPLE
SA
Lo
tteries’ Ag
ency S
ervices sta�.

EMPLOYEE GRADUATE PROGRAM Each year, SA Lotteries o� ers an internship opportunity for a University of South Australia (UniSA) marketing graduate. In January 2011, Bachelor of Management (Marketing) graduate Katherine Mullan joined SA Lotteries’ marketing team to commence her 12-month placement.
SA Lotteries promoted its employee benefi ts and workplace opportunities to university graduates at the 2011 UniSA Employment and Careers Expo in March.
EQUAL EMPLOYMENT OPPORTUNITY SA Lotteries is an equal opportunity employer, ensuring that all persons seeking employment are treated fairly and equitably and are not subjected to discrimination or harassment.
AN ETHICAL CULTUREA survey conducted in June 2011 revealed that 100 per cent of employees are familiar with SA Lotteries’ values of integrity, accountability and respect, and 96 per cent have a clear understanding of the behaviour expected by SA Lotteries.
LIFESTYLE PROGRAM SA Lotteries’ Lifestyle Program is designed to improve employee health and wellbeing through awareness and participation. The program is reviewed on a regular basis to ensure relevance and interest to employees. The program encompasses:
• fullysubsidisedfluvaccinations;
• quarterlyonsitehealtheducationandawarenesssessions;
• fullysubsidisedfirstaidtraining;
• accesstodiscountedcorporatehealth premiums and special healthplanoffers;and
• tipsonhealthyliving.
FLEXIBLE WORKING ARRANGEMENTS SA Lotteries provides a fl exible working environment to assist employees to balance work and family responsibilities. During the year, 32 per cent of sta� members benefi ted from a voluntary fl exible working arrangement.
SA
Lo
tteries’ Techn
ical Services an
d
Qu
ality Assu
rance sta� .
Marketin
g train
ee Kath
erine M
ullan w
ith mem
bers
of S
A L
otteries’ M
arketing
Bran
d Team
.
SA LOTTERIES ANNUAL REPORT 2010-11

ENTERPRISE AGREEMENT In support of employee wages and conditions, SA Lotteries has implemented an Enterprise Bargaining Agreement that allows for the negotiation of workplace conditions and organisational change. SA Lotteries’ current Enterprise Bargaining Agreement expires in September 2012.
LEAVE MANAGEMENT All sta� are encouraged to take their full 20-day annual leave entitlement over the financial year.
DISABILITY DISCRIMINATION ACTION PLANSA Lotteries undertook a review of its Disability Discrimination Action Plan in 2010-11. Implemented in July 1998, the Plan identifies barriers for employees with a disability and recommends strategies for eliminating
those barriers. These strategies have been implemented and are ongoing. The plan can be accessed on SA Lotteries’ corporate website.
OCCUPATIONAL HEALTH AND SAFETYSA Lotteries is committed to ensuring, so far as is reasonably practicable, that all employees are safe from injury and risk to health while at work. This is achieved by striving to continually improve health and safety systems and practices, and by comparing those against industry standards. During 2010-11, the following health and safety activities took place:
• anannualoccupationalhealthandsafetyinspectionofpremises;
• drivertrainingandeducationforemployees who drive fleet vehicles;
• ergonomicassessmentsofemployeeworkstations;
• firstaidtrainingforrelevantemployees;
• quarterlyoccupationalhealthandsafetycommitteemeetings;
• reviewofalloccupationalhealthand safety policies, guidelines andprocedures;
• subsidisedfluvaccinationsforemployees;and
• firewardentrainingforrelevantemployees.
WORKERS’ COMPENSATIONThrough the e�ective management of safe work practices, there were no workers’ compensation claims during 2010-11, assisting SA Lotteries in achieving a further reduction in the WorkCover levy rate for 2010-11.
EMPLOYEE ASSISTANCESA Lotteries o�ers an Employee Assistance Program, which provides confidential guidance and advice for personal and work-related matters.
SA
Lo
tteries’ Pu
blic R
elation
s sta�.
SA
Lo
tteries’ Execu
tive Ad
min
istration sta�
.
AVERAGE DAYS LEAVE TAKEN PER FULL-TIME EQUIVALENT EMPLOYEE
Leave Type 2007-08 2008-09 2009-10 2010-11
Sick leave taken* 7.0 7.0 6.6 10.2
Family carer’s leave taken 0.8 1.0 1.3 1.4
Miscellaneous special leave 0.8 0.2 0.3 0.3
* Figures incorporate paid and unpaid sick leave.

EMPLOYEE GENDER
% Persons % FTEs
53.49 50.1546.51 49.85
SA LOTTERIES’ EMPLOYEES
Persons (as at 30 June 2011) 86
Full-Time Equivalent employee numbers as at 30 June 2011
80.24
Number of persons separated from SA Lotteries during the 2010-11 fi nancial year
16
Number of persons recruited to SA Lotteries during the 2010-11 fi nancial year
14
Number of persons on leave without pay at 30 June 2011
2
EXECUTIVES BY GENDER, CLASSIFICATION AND STATUS
Classifi cation Contract Tenured Contract Untenured Total
Male Female Male Female Male Female Total
Level D 0 0 0 1 0 1 1
Level B 0 0 2 0 2 0 2
Level A 0 0 2 0 2 0 2
Total 0 0 4 1 4 1 5
Part time and casuals refl ected as what they would earn if they worked full time.Two (2) employees on unpaid leave.
EMPLOYEE SALARY BRACKET
30
25
20
15
10
5
0$0-$50 399
Male 40
Female 46
Total 86
$50 400 - $64 099 $64 100 - $82 099 $82 100 - $103 599 $103 600 +
4 11 15 1515 30 9 13 22 8 6 14 4 1 5
Female
Male
SA LOTTERIES ANNUAL REPORT 2010-11

STATUS OF EMPLOYEES IN CURRENT POSITION (AS AT 30 JUNE 2011)
Full-Time Equivalents
Ongoing Short-Term Contract
Long-Term Contract
Other (Casual) Total
Female 36.4 2.8 1 0 40.2
Male 36.0 0 4 0 40.0
Total 72.4 2.8 5 0 80.2
STATUS OF EMPLOYEES IN CURRENT POSITION (AS AT 30 JUNE 2011)
Employees Ongoing Short-Term Contract
Long-Term Contract
Other (Casual) Total
Female 41 4 1 0 46
Male 36 0 4 0 40
Total 77 4 5 0 86
* Precludes employees on unpaid leave.
NUMBER OF ABORIGINAL AND/OR TORRES STRAIT ISLANDER EMPLOYEES
Male Female Total % of Agency Target *
Aboriginal/Torres Strait Islander 0 0 0 0 2.0%
* Target from South Australia’s Strategic Plan.
EMPLOYEES BY AGE BRACKET BY GENDER
Age Bracket Male Female Total % Total Workforce Benchmark*
15-19 0 0 0 0 6.1
20-24 2 2 4 4.65 10.6
25-29 2 10 12 13.96 10.5
30-34 6 5 11 12.79 9.4
35-39 9 6 15 17.44 11.2
40-44 5 6 11 12.79 11.1
45-49 5 6 11 12.79 12.2
50-54 5 5 10 11.63 11.0
55-59 3 1 4 4.65 9.2
60-64 3 4 7 8.14 6.0
65+ 0 1 1 1.16 2.9
Total 40 46 86 100 100.0
* Source: Australian Bureau of Statistics Australian Demographic Statistics 6291.0.55.001, Labour Force Status (ST LM8) by sex, age, state, marital status – employed – total from Feb 78 Supertable, South Australia at May 2010.

SA
Lo
tteries sta� , meetin
g at H
ead O
� ce.SA LOTTERIES ANNUAL REPORT 2010-11

CULTURAL AND LINGUISTIC DIVERSITY
Male Female Total % of Agency SA Community*
Number of employees born overseas 10 9 19 22.09 20.3
Number of employees who speak language(s) other than English at home
3 5 8 9.30 16.6
* Benchmarks from ABS Publication Basic Community Profile (SA) Cat No. 2001.0, 2006 census.
TYPES OF EMPLOYEE DISABILITIES
Disability Male Female Total % of Agency
Disability Requiring Workplace Adaptation 0 1 1 1.1
Physical 0 0 0
Intellectual 0 0 0
Sensory 0 0 0
Psychological/Psychiatric 0 0 0
Other 0 0 0
TOTAL 0 1 1 1.1
VOLUNTARY FLEXIBLE WORKING ARRANGEMENTS
Male Female Total
Purchased leave 0 0 0
Flexible hours 2 4 6
Compressed weeks 0 2 2
Part-time (as calculated by FTE) 0 16 16
Job Share 0 4 4
Working from home 0 0 0
PERFORMANCE DEVELOPMENT
Employees with: % Total Workforce
A plan or review within the past 12 months 100
No plan or review within the past 12 months 0
LEADERSHIP AND MANAGEMENT TRAINING EXPENDITURE
Training and Development Total Cost % of Total Remuneration Expenditure*
Total training and development expenditure** $234 368.14 3.16
Total leadership and management development expenditure $74 728.53 1.00
*Total remuneration expenditure is based on gross salaries plus employer superannuation and payroll tax. ** Total training and development expenditure is based on course fees plus all associated costs.

OCCUPATIONAL HEALTH AND SAFETY
Occupational health, safety and injury management 2010-11 2009-10 2008-09
1 OH&S LEGISLATIVE REQUIREMENTS
Number of notifi able occurrences pursuant to OHS&W Regulations Division 6.6
Nil Nil Nil
Number of notifi able injuries pursuant to OHS&W Regulations Division 6.6 Nil Nil Nil
Number of notices served pursuant to OHS&W Act s35, s39 and s40 Nil Nil Nil
2 INJURY MANAGEMENT LEGISLATIVE REQUIREMENTS
Total number of employees who participated in the rehabilitation program Nil Nil Nil
Total number of employees rehabilitated and reassigned to alternative duties Nil Nil Nil
Total number of employees rehabilitated back to their original work Nil Nil Nil
Number of open claims as at 30 June 2011 Nil 1 1
Percentage of workers’ compensation expenditure over gross remuneration 0.03 0.03 Nil
3 NUMBER OF CLAIMS
Number of new workers’ compensation claims Nil 2 Nil
Number of fatalities (F) Nil Nil Nil
Number of lost time injuries (LTI) Nil Nil Nil
Number of medical treatment only (MTO) Nil 2 Nil
Total number of whole working days lost Nil Nil Nil
4 COST OF WORKERS’ COMPENSATION
Cost of new claims for fi nancial year Nil $1 914 Nil
Cost of all claims excluding lump sum payments $2 074 $1 914 Nil
Amount paid for lump sum payments on the settlement of a claim (s42, s43, s44)
Nil $85 000 Nil
Total amount recovered from external sources (s54) including from a negligent third party
Nil Nil Nil
Budget allocation for workers’ compensation $89 036 $86 678 $78 826
5 TRENDS
Injury frequency rate for new lost-time injury/disease for each million hours worked
Nil Nil Nil
Most frequent cause (mechanism) of injury Repetitive strain
Repetitive strain/
Laceration
Nil
Most expensive cause (mechanism) of injury Repetitive strain
Repetitive strain
Nil
SA LOTTERIES ANNUAL REPORT 2010-11

SOUTH AUSTRALIAN-BASED BUSINESSES EARNED $29 MILLION
FROM THE SALE OF SA LOTTERIES’ GAMES.


AGENCY NETWORKSA Lotteries has the most diversified agency network in Australia, o�ering the highest number of agencies per head of population in convenient locations across the State. SA Lotteries’ agency network is the trusted customer interface for our games.
Comprising 553 businesses as at 30 June 2011, SA Lotteries’ agency network extends throughout regional and metropolitan South Australia.
The agency network represents a variety of business types such as newsagencies, kiosks, supermarkets, chemists and hotels, with SA Lotteries’ Keno game also available at 165 SA TAB agencies.
In 2010-11, SA Lotteries’ agency network earned $29 million in commission from the sale of tickets.
AGENT TRAINING SA Lotteries makes a significant annual investment, with accredited training provider Business SA to provide training for every new member of our agency network in business management, customer service, lottery terminal operation, and responsible gambling promotion. In 2010-11, 121 agency employees and 111 agency managers or owners successfully completed the dedicated training modules.
AGENT ENGAGEMENTThe Agent Reference Group was established in January 1996 to strengthen the relationship between SA Lotteries and its agency network via an ongoing consultation process. Comprising representatives from SA Lotteries’ Marketing and Sales team and agents from regional and metropolitan South Australia and business channels, the Group met on four occasions in 2010-11 to facilitate network feedback on business promotions, ideas and concepts.
SA Lotteries acknowledges the e�orts of members whose term expired during 2010-11:
• AlfSpronk (Giftland,NoarlungaCentre);
• CameronTaylor (ParaHillsCommunityClub);
• DianneDissel (Dissel’s Findon Road Newsagency);
• PaulWright (OakPlazaNewsagency,Stirling);
• RosePogas (VirginiaLotteriesKiosk);and
• AndrewWilliamson (IGA Everyday Morphett Vale).
AGENCY NETWORK
Go
olw
a Ch
emm
art sta� celeb
rating
the sale o
f a D
vision O
ne w
inn
ing
X L
otto
entry. C
ou
rtesy of
Th
e Tim
es, Victo
r Harb
or.
COMPOSITION OF NETWORK BY BUSINESS TYPE
Number of Outlets as at June 2011
Total $ Sales 2010-11 (’000)
Total Retail 335 $323 295
Total Licensed 218 $58 648
SA TAB (Keno only) 165 $6 997
TOTAL 718 $388 940

SA Lotteries welcomed the following agents to the Agent Reference Group in 2010-11:
• GeorgeTong(ElizabethParkNewsagency&Lotto);
• GeorgeChin(ChinatownEspresso,Adelaide);
• GregSaunders(Parafi eld Gardens CommunityClub);
• ChrisWoodman(PeterboroughNewsagency);
• NeilCole(SeafordNewsagency);
• GeoffRoberts(HappyValleyNewsagency);
• MarkKinsley(BridgewaterNewsagency);
• AnthonyAntoniadis(ParabanksNewsagency);
• MaryKitson(HiltonPlazaLotteryKiosk);and
• CharlieZucco(West Lakes Shore Foodland).
RECOGNISING BUSINESS EXCELLENCE SA Lotteries’ annual Agency Excellence Awards program recognises and rewards excellence within the retail and licensed agency network.
The 2009-10 Agency Excellence Awards gala presentation dinner was held at the InterContinental Adelaide in October 2010. Based on set performance criteria, winners were determined across eight award categories:
• BestRetailAgency-GoldVirginiaLotteriesKiosk;
• BestLicensedAgency-GoldWestland Hotel Motel, WhyallaNorrie;
• BestRetailAgency-SilverRostrevorPharmacy;
• BestLicensedAgency–SilverCastleTavern,Edwardstown;
• BestRetailAgency-BronzeBirdwoodNewsagency;
• BestLicensedAgency–BronzeHotelElliot,PortElliot;
• CommunityServiceAwardParaHillsCommunityClub;and
• AgencyEmployeeoftheYearJayne Taylor of Para Hills Community Club.
The following agencies were recognised for attaining 20 years of service as an SA Lotteries agent at the event:
• ArdrossanNewsagency;
• BritishWorkingMen’sClub,Wingfield;
• BuckinghamArmsHotel,Gilberton;
• CentralDistrictFootballersClub,Elizabeth;
• Cobdogla&DistrictClub;
• DN’sNewsagency,Waikerie;
• EastGambierSportsmen’sFootballClub,MountGambier;
• ExtraNewsagency,HydePark;
• FlagstaffHillGolfClub;
• GlenelgFootballersClub;
• KeithNewsagency;
• LoxtonClub;
• LyrupCommunityClub;
• MannumClub;
• MarionHotel,MitchellPark;
• MarionSports&CommunityClub,OaklandsPark;
• Millicent&DistrictCommunityClub;
• MonashClub;
• ParaHillsCommunityClub;
• ParafieldGardensCommunityClub;
• PlushPharmacy,HoldenHill;
• PortAdelaideFootballClub,Alberton;
• RenmarkClub;
• RoxbyDownsClub;
• SalisburyNorthFootballClubInc.;
• SouthAdelaideFootballersClub,NoarlungaDowns;and
• WestAdelaideFootballersClub,Richmond.
Ag
ency E
xcellence A
ward
s win
ners w
ith Ch
ief E
xecutive, Ju
ne R
oach
e.
SA LOTTERIES ANNUAL REPORT 2010-11
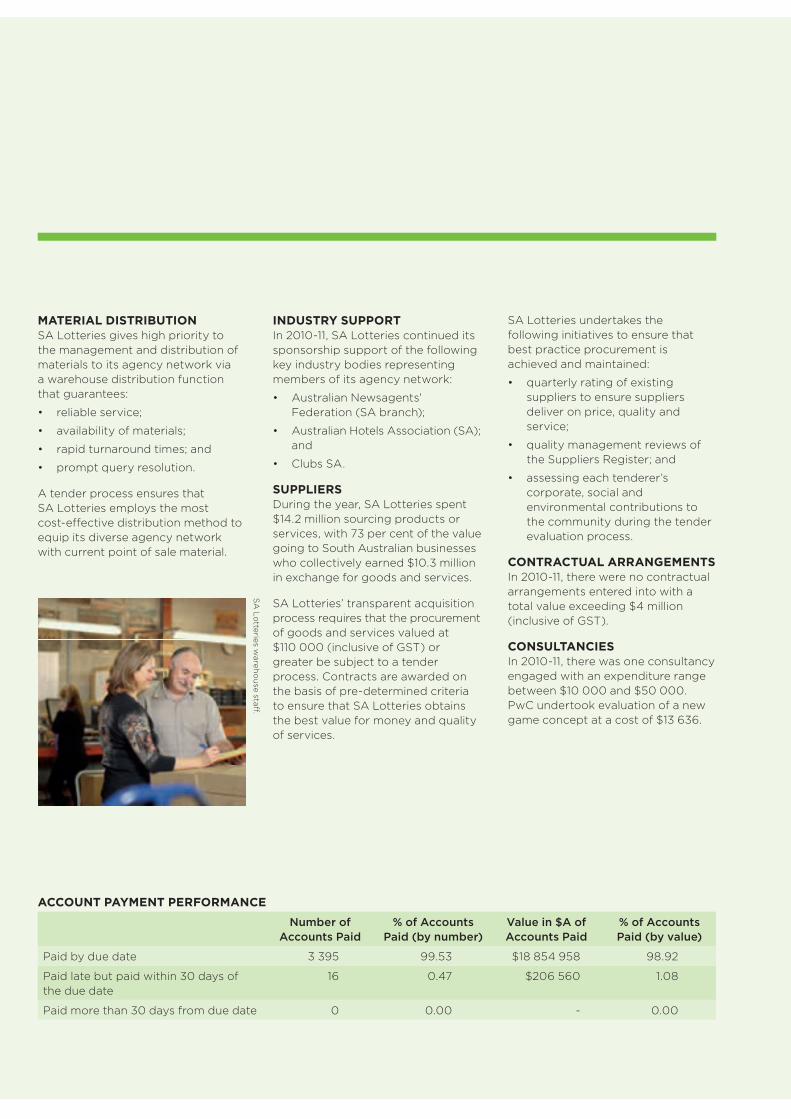
MATERIAL DISTRIBUTIONSA Lotteries gives high priority to the management and distribution of materials to its agency network via a warehouse distribution function that guarantees:
• reliableservice;
• availabilityofmaterials;
• rapidturnaroundtimes;and
• promptqueryresolution.
A tender process ensures that SA Lotteries employs the most cost-e� ective distribution method to equip its diverse agency network with current point of sale material.
INDUSTRY SUPPORTIn 2010-11, SA Lotteries continued its sponsorship support of the following key industry bodies representing members of its agency network:
• AustralianNewsagents’Federation(SAbranch);
• AustralianHotelsAssociation(SA);and
• ClubsSA.
SUPPLIERSDuring the year, SA Lotteries spent $14.2 million sourcing products or services, with 73 per cent of the value going to South Australian businesses who collectively earned $10.3 million in exchange for goods and services.
SA Lotteries’ transparent acquisition process requires that the procurement of goods and services valued at $110 000 (inclusive of GST) or greater be subject to a tender process. Contracts are awarded on the basis of pre-determined criteria to ensure that SA Lotteries obtains the best value for money and quality of services.
SA Lotteries undertakes the following initiatives to ensure that best practice procurement is achieved and maintained:
• quarterlyratingofexistingsuppliers to ensure suppliers deliver on price, quality and service;
• qualitymanagementreviewsoftheSuppliersRegister;and
• assessingeachtenderer’scorporate, social and environmental contributions to the community during the tender evaluation process.
CONTRACTUAL ARRANGEMENTSIn 2010-11, there were no contractual arrangements entered into with a total value exceeding $4 million (inclusive of GST).
CONSULTANCIESIn 2010-11, there was one consultancy engaged with an expenditure range between $10 000 and $50 000. PwC undertook evaluation of a new game concept at a cost of $13 636.
ACCOUNT PAYMENT PERFORMANCE
Number of Accounts Paid
% of Accounts Paid (by number)
Value in $A of Accounts Paid
% of Accounts Paid (by value)
Paid by due date 3 395 99.53 $18 854 958 98.92
Paid late but paid within 30 days of the due date
16 0.47 $206 560 1.08
Paid more than 30 days from due date 0 0.00 - 0.00
SA
Lo
tteries wareh
ou
se sta� .

THE BLOCSA Lotteries’ multi-jurisdictional (Bloc) arrangements continued in 2010-11 with the following Australian lottery operators:
• TattsLotteries(Victoria,New South Wales, Queensland, Australian Capital Territory, NorthernTerritoryandTasmania);and
• Lotterywest(WesternAustralia).
The Bloc pools money to allow for larger jackpots for Australia’s favourite lottery games, while the licensing structure and operations of each lottery operator remain independent and autonomous.
During the year, Bloc Executive Committees met regularly, with SA Lotteries hosting the March meeting. SA Lotteries also continued its role as Bloc Secretariat Administrator and Game Administrator of the Australian Soccer Pools Bloc.
INTERNATIONAL ASSOCIATIONSMembership of international lottery industry associations provides valuable information sharing and networking opportunities. During the year, SA Lotteries continued to benefi t from membership of the following two key international associations:
Asia Pacifi c Lottery Association (APLA) APLA is one of fi ve regional lottery industry associations worldwide and represents 25 lottery organisations from 10 countries within the Asia Pacifi c region.
SA Lotteries’ Chief Executive, June Roache, has chaired the APLA Executive Committee since September 2008 and was re-elected as Chair in November 2010.
World Lottery Association (WLA)WLA is a global professional association of lottery and gambling organisations from more than 80 countries on six continents. As Chair of APLA, SA Lotteries’ Chief Executive, June Roache, represents the Asia Pacifi c lottery region on the WLA Executive Committee. SA Lotteries is also an APLA representative on the Legal Network Committee.
LOTTERY INDUSTRY PARTNERS
AP
LA
/WL
A S
emin
ar in Ph
uket, T
hailan
d, A
ug
ust 20
10.
Overseas Travel By SA Lotteries Employees
Destination Reason for travel No. of employees Total cost*
Shanghai, China APLA Executive Committee Meeting and APLA/WLA Seminar
1 $9 01 1.44
Phuket, Thailand APLA Executive Committee Meeting and APLA/WLA Seminar
2 $9 956.88
* Total cost includes airfares and, as applicable, accommodation, meals and registration fees. It does not include any salary or salary-related costs.
SA LOTTERIES ANNUAL REPORT 2010-11

MORE THAN 120 000 FOOTBALL FANS ENJOYED FREE TRANSPORT
TO AND FROM AAMI STADIUM ABOARD THE SA LOTTERIES
FOOTY EXPRESS.


SA Lotteries has been creating prosperity for the State of South Australia for almost 45 years. Since 1967, SA Lotteries’ games have generated more than $4.7 billion in prize money for local players and another $2.2 billion for public hospitals.
In 2010-11, $93.9 million, equating to approximately $1.8 million each week, was distributed to South Australia’s Hospitals Fund for the provision, maintenance, development and improvement of public hospitals. The Recreation and Sport Fund received $233 913 to support and develop State sporting facilities and services, taking the total contributed since the Fund was established in 1987 to $8.9 million.
Annual survey results reveal that 39 per cent of adult South Australians are aware of SA Lotteries’ profit distribution to hospitals, with 65 per cent of South Australian adults aware that SA Lotteries’ profits benefit the local community.
Strengthening its vision to benefit the community of South Australia, SA Lotteries extends further support to a range of sponsorship and community initiatives.
$50 000 DONATION TO UPGRADE FACILITIES AT FLINDERS MEDICAL CENTRESA Lotteries started a community fundraising drive with radio station Mix 102.3 in June to upgrade accommodation facilities for rural families using the Flinders Medical Centre (FMC). SA Lotteries’ $25 000 donation led to numerous pledges from other South Australian organisations to support the renovation of housing units for regional parents with infants in neonatal care.
Each year, more than 400 babies are cared for in the FMC Neonatal Intensive Care Unit - one of only two in South Australia - with many premature infants requiring around-the-clock breathing support, close monitoring and intravenous feeding. Regional families experience the added financial burden - during an already trying time - of having to find accommodation near the Centre.
In order to benefit those directly using the neonatal facilities, SA Lotteries increased its donation to $50 000 to allow for the purchase of essential cardio-respiratory monitors for the unit. SA Lotteries’ donation was in addition to its annual profit distribution to South Australian hospitals.
SA LOTTERIES FOOTY EXPRESS SA Lotteries continued its partnership with the South Australian National Football League to ensure the operation of the SA Lotteries Footy Express in 2010-11.
The free bus service for South Australians travelling to AAMI Stadium for Adelaide Crows and Port Power Australian Football League matches, transported more than 120 000 fans (18 per cent of match attendees) from 146 bus stops across metropolitan Adelaide and, more recently, some regional areas. By reducing the number of vehicles travelling to AAMI Stadium, the service also results in a 6 000-tonne reduction in greenhouse gas emissions.
DRIVING A HEALTHY STATE WITH ST JOHN AMBULANCEAn inaugural partnership with St John Ambulance Australia (SA) Inc benefited more than 14 000 South Australians receiving first aid treatment at public events. SA Lotteries’ support ensured that St John volunteers were able to provide first aid assistance at many major and local events, such as Clipsal 500, Santos Tour Down Under and the Big Day Out music festival.
COMMUNITY BENEFITS
St Jo
hn vo
lun
teers with S
A L
otteries’ F
irst Aid
Veh
icle.

PATIENT PERFORMANCESTo more directly support SA Lotteries’ primary profi t benefi ciary, partnerships with high-profi le South Australian arts organisations bring the healing power of music and comedy to patients in hospital wards across the State.
SA Lotteries Symphony Sessions with the Adelaide Symphony OrchestraSA Lotteries Symphony Sessions is a program aimed at promoting the positive e� ects of music on health and wellbeing in the hospital community.
Adelaide Symphony Orchestra (ASO) string and wind ensembles played eight ensemble performances in a variety of wards at the Royal Adelaide Hospital throughout the year for patients being treated for burns, cancer and spinal and facial injuries.
More than 3 000 patients, sta� and members of the public attended the ASO performances in the hospital.
Hospital Hilarity with the Adelaide FringeSA Lotteries partnered with the Adelaide Fringe to bring the fun of Australia’s largest arts festival to the Women’s & Children’s Hospital and Royal Adelaide Hospital. This year, over two days of the Adelaide Fringe, improvisation theatre group On The Fly brought smiles to those not well enough to attend shows.
SA Lotteries String Sessions with the Australian String QuartetSA Lotteries’ partnership with the Australian String Quartet brought music to regional hospitals and health centres to brighten the spirits of patients and nursing sta� across regional South Australia.
SA Lotteries State Opera Arts in Health with the State Opera South AustraliaThe partnership with State Opera South Australia presents leading local opera singers Joanna McWaters and Andrew Turner at various Adelaide hospitals, including the Flinders Medical Centre, Queen Elizabeth Hospital and Modbury Hospital. Ten performances were presented to eight hospitals and health centres throughout 2010-11.
SA Lotteries Footy Tipping SA Lotteries continued to support the South Australian National Football League Footy Tipping Competition during the 2011 season. The competition attracted more than 9 000 participants.
Theatre SupportAs Corporate Partner, SA Lotteries continued to assist the State Theatre Company of South Australia to provide quality live performances bringing cultural inspiration to audiences and artists across South Australia.
Extended Health SupportOver and above its profi t returns to State hospitals, SA Lotteries extended support to the Flinders Medical Centre Foundation, Queen Elizabeth Hospital Research Foundation, Women’s & Children’s Hospital Foundation and Royal Flying Doctor Service via sponsorship initiatives in 2010-11.
SPONSORSHIP
Ad
elaide F
ring
e Ho
spital H
ilarity perfo
rman
ce tro
up
e - On th
e fl y.A
delaid
e Frin
ge H
osp
ital Hilarity.
Ph
oto
cou
rtesy Gio
vann
i Lo
russo
.
SA LOTTERIES ANNUAL REPORT 2010-11

ROTARY MEMBERSHIPSA Lotteries continued its association with Rotary through the year to enable Executives to attend regular networking functions and participate in community initiatives. One such initiative is the Community Mentoring Program – Inner North East. As part of this program, SA Lotteries’ General Manager – Marketing and Sales works with a high school student to maximise their chances of Year 12 completion.
CHRISTMAS GIVINGWhile SA Lotteries’ spirit of giving applies all year round, Christmas presents an opportune time to help those less fortunate by making wishes come true.
Granting Christmas wishesSA Lotteries’ Christmas Wishes promotion, broadcast with radio partner Mix 102.3, fulfilled the dreams of South Australians in December. The two-week promotion encouraged adult listeners to register their wishes on Mix 102.3’s website in the lead-up to Christmas, with nine locals winning $1 000.
Christmas Wishing TreeSA Lotteries employees extended generous support to The Smith Family’s Wishing Tree project by donating 24 presents, including new books and toys, as Christmas gifts for South Australians in need.
CORPORATE VOLUNTEERINGSA Lotteries’ employees continued to be granted one day a year at full pay to volunteer their time and skills for a not for profit organisation. In June, a team of nine employees volunteered a day out of the o�ce to erect perimeter fencing and repaint interior facilities at Hills Community Options, a not for profit organisation supporting adults with intellectual disabilities.
SA
Lo
tteries’ corp
orate vo
lun
teers erecting
perim
eter fencin
g fo
r H
ills Co
mm
un
ity Op
tion
s.

FUNDRAISINGSupport for community groupsSA Lotteries provided 70 Community Support Kits to assist clubs, schools, sporting groups and charities with their fundraising e� orts.
Community event participationThroughout the year, SA Lotteries reimbursed registration fees for employees participating in community-based fundraising events including fun runs, walks and cycling events.
Charity fundraisingSA Lotteries’ employees facilitated fundraising events for four nominated charities during the year. SA Lotteries matched employee donations dollar-for-dollar to contribute a total of $3 426 to the following not for profi t organisations:
• MaryPotterFoundation;
• HeartKidsSA;
• GuideDogsSA/NT;and
• RonaldMcDonaldHouse.
In addition to SA Lotteries’ quarterly fundraising activities, sta� held a special ‘Proud to be Australian’ fundraiser, held on Australia Day, to benefi t victims of the devastating Queensland fl oods. Sta� raised $640, which was matched by SA Lotteries to take the total contributed to the Queensland Premier’s Disaster Relief Appeal to $1 280.
Workplace givingA number of charities continue to receive regular donations from employees as a part of SA Lotteries’ ongoing Workplace Giving program.
Blood donor programDuring 2010-11, employees donated blood to Red Cross as part of SA Lotteries’ Corporate Blood Donor Program.
SA LOTTERIES ANNUAL REPORT 2010-11

100 PER CENT OF RECYCLABLE WASTE AT HEAD OFFICE IS RECYCLED UNDER
A NEW WASTE PROGRAM LAUNCHED IN 2010-11.


MINIMISING OUR ENVIRONMENTAL IMPACTSA Lotteries embraces sound environmental practices across its business operations, including using e�cient and sustainable energy to reduce greenhouse gas emissions, reducing waste, and encouraging recycling of its supplies. These practices achieved an overall reduction in energy consumption of 0.2 per cent on the previous year.
REDUCING ENERGY CONSUMPTIONSouth Australia’s Strategic Plan targets a reduction in energy consumption of 25 per cent in government buildings from 2000-01 levels by 2014.
SA Lotteries’ increased energy use during 2009-10 was due to the installation of the replacement online lottery system, which still impacted on energy consumption in 2010-11. However, SA Lotteries continues to focus on energy consumption at both its head o�ce and warehouse operating sites.
SENSOR LIGHTINGSensor lighting installed throughout SA Lotteries’ Head O�ce and warehouse distribution areas has resulted in an estimated 14 per cent reduction in energy consumption for the lighting component of energy usage.
MINIMISING OURENVIRONMENTAL IMPACT
Year Energy Consumption kWhrs
Greenhouse Gas Emissions KgCO2
2006-07 811 702 813 082
2007-08 787 612 733 494
2008-09 734 330 651 849
2009-10 914 020 811 358
2010-11 912 363 809 886
ENVIRONMENTAL IMPACTENERGY & GREENHOUSE GAS EMISSIONS
1,000,000
800,000
600,000
400,000
200,000
02006 - 07
Energy Consumption kWhrs Greenhouse Gas Emissions KgCO2
2007 - 08 2008 - 09 2009 - 10 2010 - 11

RECYCLING SA Lotteries launched a recycling program in February to ensure that 100 per cent of recyclable waste, generated across its two operations sites, is recycled. The program complements SA Lotteries’ commitment to waste reduction via the use of recyclable products and materials obtained from renewable sources, where possible. SA Lotteries also encourages recycling among members of its agency network, with 100 per cent of the agency network equipped with recycling facilities.
To encourage recycling and the responsible disposal of SA Lotteries’ tickets a ‘100% recyclable’ logo is incorporated on all terminal-generated tickets. A message promoting the responsible disposal of tickets is also included on the reverse of all SA Lotteries’ Instant Scratchies tickets. A similar message has been applied to game coupons.
In addition, in 2010-11 SA Lotteries donated 63 computers to the State Procurement area of Government for re-use by charitable organisations.
BUSINESS CLEAN UP DAYIn March, SA Lotteries’ employees once again participated in Business Clean Up Day by collecting rubbish from the parklands area opposite SA Lotteries Head O� ce.
CLEANER AND FEWER VEHICLESDuring 2010-11, SA Lotteries reviewed the size and mix of vehicles in its fl eet with a view to reducing emissions and operational costs. As a result, a program commenced to replace identifi ed vehicles with locally produced, fuel e� cient, four cylinder vehicles, benefi ting both the environment and the community.
EARTH HOURSA Lotteries’ annual participation in Earth Hour continued to demonstrate a commitment to the environment and to assist further in the reduction of greenhouse gases by switching o� non-critical systems and lighting.
REDUCING WORKPLACE LITTERIn 2010-11, SA Lotteries provided each employee with a re-usable, barista-standard co� ee cup.
SA
Lo
tteries sta� at Bu
siness C
lean up
day.
SA LOTTERIES ANNUAL REPORT 2010-11

SOUTH AUSTRALIA’S2011 STRATEGIC PLAN
SA LOTTERIES’ 2011-12 OUTLOOK
Goal 1: To promote, conduct and distribute lotteries games for the benefit of the South Australian community.
Strategy 1: Grow revenue by enhancing existing games and introducing new games and initiatives.
OUR PROSPERITY Continue to exceed targets for gross sales and number of tickets sold
Maximise market share for Australian Bloc games
Optimise the distribution network and value of SA Lotteries
Strategy 2: Exceed customer expectations by providing an accessible and reliable service.
OUR IDEAS Expansion of corporate website functionality to ensure growth in number of visits and greater engagement
Maintain system and point of sale terminal reliability
Ensure growth in Easiplay customer registration membership
Goal 2: To be a corporately responsible and respected organisation that has a broad base of community support.
Strategy 3: Ensure community and stakeholder trust and support.
OUR HEALTH
OUR COMMUNITY
Continue to benefit the community of South Australia through returns to the Hospital’s Fund and Recreation and Sport Fund.
Ensure adherence to Responsible Gambling and Advertising Codes of Practice
Build on gains made in 2010-11 to achieve accreditation with Information Security Control Standard AS/NZS ISO 27001
Accreditation with World Lottery Association Security Control Standards
Achieve 99% customer satisfaction
Continue to build the Corporate Social Responsibility Program
THE FUTURE

SOUTH AUSTRALIA’S2011 STRATEGIC PLAN
SA LOTTERIES’ 2011-12 OUTLOOK
Strategy 4: Adopt sound environmental practices
OUR ENVIRONMENT Target further reduction in gas emissions and energy consumption
Continued promotion of recycling initiatives
Replace existing fl eet cars with more e� cient four cylinder vehicles and ongoing review of number of vehicles required.
Goal 3: To optimise profi ts through the e� ective allocation of resources.
Strategy 5: Ensure a high performance and ethical culture.
OUR EDUCATION Maintain 100% involvement of sta� in new Performance Management System with monitoring against documented individual performance plans
Maintain investment in training and development
Support sta� through transition to a private sector operator
Strategy 6: Ensure sustainable growth opportunities are pursued.
OUR PROSPERITY Pursue projects that give consumers greater choice and convenience
Provide excellent support to all agencies during transition to a private sector operator
Retain and build on percentage of South Australian suppliers
SA LOTTERIES ANNUAL REPORT 2010-11

GAME SALES REACHED$388.9 MILLION IN 2010-11


STATEMENT OF COMPREHENSIVE INCOME FOR THE YEAR ENDED 30 JUNE 2011
Note 2011 2010
$’000 $’000
Income
Sales revenue 5 388 940 390 704
Cost of sales 6 341 325 341 378
Gross Margin 47 615 49 326
Interest revenue 2 465 2 242
Other revenues 7 4 676 4 579
Total Income 54 756 56 147
Expenses
Employee benefits expenses 8 7 315 8 029
Supplies and services 9 15 646 16 542
Depreciation and amortisation expense 10 2 315 2 163
Net loss on disposal of non-current assets 11 18 -
Total Expenses 25 294 26 734
Profit before income tax equivalent 29 462 29 413
Income tax equivalent expense 8 839 8 824
Profit after income tax equivalent 20 623 20 589
Total Comprehensive Result 20 623 20 589
The profit after income tax equivalent and comprehensive result are attributable to the SA Government as owner.
The above statement should be read in conjunction with the accompanying notes.
STATEMENT OFCOMPREHENSIVE INCOME

STATEMENT OF FINANCIAL POSITION AS AT 30 JUNE 2011
Note 2011 2010
$’000 $’000
Current Assets
Cash and cash equivalents 13 52 546 50 089
Receivables 14 2 783 19 567
Inventories 635 699
Total Current Assets 55 964 70 355
Non-Current Assets
Receivables 14 133 186
Property, plant and equipment 15 13 888 15 552
Intangible assets 16 - 3
Total Non-Current Assets 14 021 15 741
Total Assets 69 985 86 096
Current Liabilities
Payables 17 24 948 41 693
Employee benefi ts 18 666 869
Other current liabilities 19 10 397 8 898
Total Current Liabilities 36 011 51 460
Non-Current Liabilities
Payables 17 1 448 1 068
Employee benefi ts 18 1 341 1 363
Other non-current liabilities 19 6 939 8 586
Total Non-Current Liabilities 9 728 11 017
Total Liabilities 45 739 62 477
Net Assets 24 246 23 619
Equity
Funds retained for capital purposes 636 636
Asset revaluation surplus 1 151 849
Reserves 22 459 22 134
Total Equity 24 246 23 619
The Total Equity is attributable to the SA Government as owner.
Unrecognised contractual commitments 21
Contingent assets and liabilities 22
The above statement should be read in conjunction with the accompanying notes.
STATEMENT OFFINANCIAL POSITION
SA LOTTERIES ANNUAL REPORT 2010-11

Funds Asset Building Capital Keno Prize Retained Total Retained Revaluation Maint- Asset Reserve Earnings for Capital Surplus enance Reserve Purposes Reserve (Note 20)
$’000 $’000 $’000 $’000 $’000 $’000 $’000
Balance at 30 June 2009 636 5 474 65 17 337 1 486 - 24 998
Profit after income tax equivalent
for 2009-10 - - - - - 20 589 20 589
Total comprehensive result for 2009-10 - - - - - 20 589 20 589
Transfers:
• from Retained earnings - - - 2 000 2 749 (4 749) -
• to Retained earnings - (4 625) - (1 503) - 6 128 -
Dividend contribution to SA Government - - - - - (21 968) (21 968)
Balance at 30 June 2010 636 849 65 17 834 4 235 - 23 619
Profit after income tax equivalent for 2010-11 - - - - - 20 623 20 623
Total comprehensive result for 2010-11 - - - - - 20 623 20 623
Transfers:
• from Retained earnings - - - 2 000 2 771 (4 771) -
• to Retained earnings - - ( 24) (2 277) (2 145) 4 446 -
Gain on revaluation of property in 2010-11 (Note 15) 302 - - - - - 302
Dividend contribution to SA Government - - - - - (20 298) (20 298)
Balance at 30 June 2011 636 1 151 41 17 557 4 861 - 24 246
All changes in equity are attributable to the SA Government as owner.
The above statement should be read in conjunction with the accompanying notes.
STATEMENT OF CHANGES IN EQUITY

STATEMENT OF CASH FLOWS FOR THE YEAR ENDED 30 JUNE 2011
Note 2011 2010
$’000 $’000
Cash Flows from Operating Activities
Cash Infl ows
Receipts from customers 360 906 367 268
Interest received 1 743 2 239
GST received from the Australian Taxation O� ce 5 022 5 385
Cash generated from operations 367 671 374 892
Cash Outfl ows
Prizes paid (230 559) (239 579)
Payments to suppliers and employees (24 217) (28 172)
GST paid to the Australian Taxation O� ce (14 476) (15 347)
Distribution to the Hospitals Fund and Recreation and Sport Fund
• Gambling tax 24 (63 228) (67 227)
• Dividends 24 (20 160) (23 977)
• Unclaimed prizes 24 (2 072) (1 804)
Distribution to the Hospitals Fund for income tax equivalent 24 (8 899) (8 867)
Cash used in operations (363 611) (384 973)
Net cash provided by (used in) operating activities 23 4 060 (10 081)
Cash Flows from Investing Activities
Cash Infl ows
Proceeds from sale of property, plant and equipment 1 -
Cash Outfl ows
Purchase of property, plant and equipment (1 604) (10 644)
Net cash used in investing activities (1 603) (10 644)
Net Increase (Decrease) in Cash and Cash Equivalents 2 457 (20 725)
Cash and Cash Equivalents at the beginning of the fi nancial year 50 089 70 814
Cash and Cash Equivalents at the end of the fi nancial year 23 52 546 50 089
The above statement should be read in conjunction with the accompanying notes.
STATEMENT OF CASH FLOWS
SA LOTTERIES ANNUAL REPORT 2010-11

INDEX TO NOTES TO AND FORMING PART OF THE FINANCIAL STATEMENTS
Establishment and Function of SA Lotteries Note 1
Summary of Significant Accounting Policies Note 2
New and Revised Accounting Standards and Policies Note 3
Related Party Note 4
Income Notes
Sales revenue Note 5
Cost of sales Note 6
Other revenues Note 7
Expense Notes
Employee benefits expenses Note 8
Supplies and services Note 9
Depreciation and amortisation expense Note 10
Net loss on derecognition of non-current assets Note 11
Auditor’s remuneration Note 12
Asset Notes
Cash and cash equivalents Note 13
Receivables Note 14
Property, plant and equipment Note 15
Intangible assets Note 16
Liabilities Notes
Payables Note 17
Employee benefits Note 18
Other liabilities Note 19
Other Notes
Capital asset reserve Note 20
Unrecognised contractual commitments Note 21
Contingent assets and liabilities Note 22
Cash flow reconciliation Note 23
Distribution of funds to SA Government Note 24
Financial risk management Note 25
Superannuation Note 26
Transactions with SA Government Note 27
INDEX TO NOTES

NOTES TO THE FINANCIAL STATEMENTS
1. Establishment and Function of SA Lotteries
The Lotteries Commission of South Australia (SA Lotteries), established under the State Lotteries Act 1966, commenced operations on 15 May 1967 with the primary function of promoting and conducting lotteries in South Australia.
2. Summary of Signifi cant Accounting Policies
(a) Statement of Compliance
The fi nancial statements are general purpose fi nancial statements. The accounts have been prepared in accordance with relevant Australian Accounting Standards and Treasurer’s Instructions and Accounting Policy Statements promulgated under the provisions of the Public Finance and Audit Act 1987.
SA Lotteries has early adopted AASB 2009-12 Amendments to Accounting Standards, which mainly relates to terminology changes. Refer to Note 3.
(b) Basis of Preparation
The preparation of the fi nancial statements requires:
• the use of certain accounting estimates and requires management to exercise its judgement in the process of applying SA Lotteries’ accounting policies. The areas involving a higher degree of judgement or where assumptions and estimates are signifi cant to the fi nancial statements are outlined in the applicable notes;
• accounting policies are selected and applied in a manner which ensures that the resulting financial information satisfies the concepts of relevance and reliability, thereby ensuring that the substance of the underlying transactions or other events are reported; and
• compliance with Accounting Policy Statements issued pursuant to section 41 of the Public Finance and Audit Act 1987. In the interest of public accountability and transparency the Accounting Policy Statements require the following note disclosures that have been included in this fi nancial report:
(a) revenues, expenses, fi nancial assets and liabilities where the counterparty/transaction is with an entity within the SA Government as at the reporting date, classifi ed according to their nature;
(b) expenses incurred as a result of engaging consultants (as reported in the Statement of Comprehensive Income and Note 9). (The term Consultant is defi ned in Accounting Policy Framework APF II General Purpose Financial Reporting Framework, APS 4.6.);
(c) employee targeted voluntary separation package information;
(d) employees whose normal remuneration is $130 744 or more (within $10 000 bandwidths) and the aggregate of the remuneration paid or payable or otherwise made available, directly or indirectly by the entity to those employees; and
(e) Commission members and remuneration information, where a Commission member is entitled to receive income from membership other than a direct out-of-pocket reimbursement.
SA Lotteries’ Statement of Comprehensive Income, Statement of Financial Position, and Statement of Changes in Equity have been prepared on an accrual basis and are in accordance with the historical cost convention, except for certain assets that were valued in accordance with the valuation policy applicable.
The Statement of Cash Flows has been prepared on a cash basis.
The fi nancial statements have been prepared based on a twelve month period and are presented in Australian currency.
The accounting policies set out below have been applied consistently in preparing the fi nancial statements for the year ended 30 June 2011 and the comparative information presented.
NOTES TO THEFINANCIAL STATEMENTS
SA LOTTERIES ANNUAL REPORT 2010-11

(c) Reporting Entity
The reporting entity comprises the Lotteries Commission of South Australia only.
(d) Comparative Information
The presentation and classification of items in the financial statements are consistent with prior periods except where adjusted to reflect the early adoption of AASB 2009-12 Amendments to Accounting Standards and/or where specific revised Accounting Standards and Accounting Policy Statements have required change.
The restated comparative amounts do not replace the original financial statements for the preceding period.
(e) Rounding
All amounts in the financial statements and accompanying notes have been rounded to the nearest thousand dollars ($’000).
(f) Taxation
Tax Equivalent Regime In accordance with Treasurer’s Instruction 22 Tax Equivalent Payments, SA Lotteries is required to pay to the State
Government an income tax equivalent. The income tax liability is based on the State Taxation Equivalent Regime which applies the accounting profits method. This requires that the corporate income tax rate be applied to profit. The current income tax equivalent liability (included in undistributed funds liability) relates to the income tax equivalent expense outstanding for the current period.
SA Lotteries is liable for payroll tax, fringe benefits tax, goods and services tax, emergency services levy, land tax equivalent and local government rate equivalents.
Goods and Services Tax (GST) SA Lotteries, as a gambling operator, is required to pay GST of one eleventh of net gambling revenue (NGR), defined as gross
sales less total monetary prizes, direct to the Australian Taxation O�ce (ATO). The GST on NGR is treated as a cost of sales.
Income, expenses and assets are recognised net of the amount of GST except:
• when the GST incurred on a purchase of goods or services is not recoverable from the ATO, in which case the GST is recognised as part of the cost of acquisition of the asset or as part of the expense item applicable; and
• receivables and payables that include GST.
The net amount of GST recoverable from, or payable to, the ATO is included as part of receivables or payables in the Statement of Financial Position.
Cash flows are included in the Statement of Cash Flows on a gross basis and the GST component of cash flows arising from investing and financing activities which is recoverable from, or payable to, the ATO is classified as part of operating cash flows.
Unrecognised contractual commitments and contingencies are disclosed net of the amount of GST recoverable from, or payable to, the ATO. If GST is not payable to, or recoverable from, the ATO, the commitments and contingencies are disclosed on a gross basis.
(g) Income
Income is recognised to the extent that it is probable that the flow of economic benefits to SA Lotteries will occur and can be reliably measured.
Income has been aggregated according to its nature and has not been o�set unless required or permitted by a specific Accounting Standard, or where o�setting reflects the substance of the transaction or other event.
Note 27 discloses income where the counterparty/transaction is with an entity within the SA Government as at the reporting date, classified according to their nature.
The following are specific recognition criteria:
• Sales revenue for Saturday X Lotto, Monday/Wednesday X Lotto, Oz Lotto, Powerball, Keno, Super 66 and The Pools is recognised as at the date of the draw or competition. For these games, sales revenue as at 30 June for draws or competitions subsequent to that date is treated as sales in advance. Sales revenue for Instant Scratchies is recognised as tickets are sold.

• Interest revenue is recognised on a time proportionate basis as it accrues, taking into account the effective yield on the fi nancial asset.
• Revenues from services, fees and charges are derived from the provision of goods and services predominantly to agents. This revenue is recognised upon delivery of the goods or services to the recipients.
(h) Expenses
Expenses are recognised to the extent that it is probable that the fl ow of economic benefi ts from SA Lotteries will occur and can be reliably measured.
Expenses have been aggregated according to their nature and have not been o� set unless required or permitted by a specifi c Accounting Standard, or where o� setting refl ects the substance of the transaction or other event.
Note 27 discloses expenses where the counterparty/transaction is with an entity within the SA Government as at the reporting date, classifi ed according to their nature.
The following are specifi c recognition criteria:
Employee Benefi ts Expenses Employee benefi ts expenses include all costs related to employment, including salaries and leave entitlements. These are
recognised when incurred.
Superannuation expenses charged in the Statement of Comprehensive Income represent:
• Defined contributions made by SA Lotteries to the superannuation plans in respect of current employees; and
• Defined benefits accrued during the reporting period.
Note 2(o) provides further details.
Supplies and Services Supplies and services generally represent the day-to-day running costs, including maintenance and occupancy costs,
incurred in the normal operations of SA Lotteries. These items are recognised as an expense in the reporting period in which they are incurred.
Depreciation and Amortisation of Non-Current Assets All non-current assets having a limited useful life are systematically depreciated/amortised over their useful lives in a
manner that refl ects the consumption of their service potential. Amortisation is used in relation to leasehold improvements and intangible assets (software), while depreciation is applied to tangible assets such as property, plant and equipment.
Assets’ residual values, useful lives and depreciation/amortisation methods are reviewed and adjusted if appropriate, on an annual basis.
Changes in the expected useful life or the expected pattern of consumption of future economic benefi ts embodied in the asset are accounted for prospectively by changing the time period or method, which is a change in accounting estimate.
The value of leasehold improvements is amortised over the estimated useful life of each improvement, or the unexpired period of the relevant lease, whichever is shorter.
Land is not depreciated.
Depreciation/amortisation is calculated on a straight line basis over the estimated useful life of the following classes of assets as follows:
Class of Assets Estimated Useful Life
Buildings 22 yearsPlant and Equipment 3 - 10 yearsCurrent Online Lotteries System up to 7 yearsLeasehold Improvements up to 10 yearsIntangibles (software) 3 years
SA LOTTERIES ANNUAL REPORT 2010-11

(i) Current and Non-Current Classification
Assets and liabilities are characterised as either current or non-current in nature. SA Lotteries has a clearly identifiable operating cycle of twelve months. Assets and liabilities that are sold, consumed or realised as part of the normal operating cycle, even when they are not expected to be realised within twelve months after the reporting date, have been classified as current assets or current liabilities. All other assets and liabilities are classified as non-current.
(j) Assets
Assets have been classified according to their nature and have not been o�set unless required or permitted by a specific Accounting Standard, or where o�setting reflects the substance of the transaction or other event.
Note 27 discloses financial assets where the counterparty/transaction is with an entity within the SA Government as at the reporting date, classified according to their nature.
Cash and Cash Equivalents Cash and cash equivalents in the Statement of Financial Position and the Statement of Cash Flows includes cash on hand,
deposits held at call and other short-term, highly liquid investments that are readily converted to cash, are subject to insignificant risk of changes in value and are used in the cash management function on a day-to-day basis.
Short term deposits are held with the South Australian Government Financing Authority (SAFA) in At Call Deposit and Cash Management Fund accounts. Bank balances are held with Westpac Banking Corporation in At Call Deposit accounts.
For the purposes of the Statement of Cash Flows, cash and cash equivalents consist of cash equivalents as defined above.
Cash is measured at nominal value.
Receivables Receivables include amounts receivable from agents and other parties, prize settlements receivable from lottery operators
in other States participating in inter-jurisdictional prize pooling arrangements, and prepayments. Receivables (other than prepayments) arise in the normal course of selling goods and services to agents and other parties and through prize settlement arrangements with other Bloc members.
Agent Debtors and Sundry Receivables Agent debtors and sundry receivables are generally receivable within 7 days and 14 days respectively and are carried at
amounts due.
Collectability of agent debtors and sundry receivables are reviewed on an ongoing basis. Debts that are known to be uncollectible are written o� when identified. An allowance for doubtful debts is raised when there is objective evidence that SA Lotteries will not be able to collect the debt.
Prize Settlements Receivable from Blocs Saturday X Lotto, Monday/Wednesday X Lotto, Oz Lotto, Powerball, Super 66 and The Pools are games supported by
inter-jurisdictional prize pooling arrangements. Lottery operators participating in individual games form Blocs for the relevant games. Amounts receivable from Blocs represent monies due from other jurisdictions for prizes won in South Australia. Settlement of amounts receivable from Bloc members are normally due 14 days after the date of the draw.
Inventories Inventories are held for distribution and include Instant Scratchies tickets, game entry coupons and ticket rolls.
Inventories are measured at the lower of actual cost or their net realisable value.
Instant Scratchies ticket costs are allocated when the tickets are settled by the Agent. Costs of game entry coupons and ticket rolls are allocated upon distribution to the Agent.
Non-Current Asset Acquisition and Recognition Non-current assets are initially recorded at cost, plus any incidental cost involved with the acquisition. Non-current assets
are subsequently measured at fair value less accumulated depreciation/amortisation.
All non-current assets with a value of $2 000 or more are capitalised.
Componentisation of the online lotteries system (a complex asset) has been performed as the asset’s fair value at the time of acquisition was greater than $1 million.

Revaluation of Non-Current Assets All non-current tangible assets are valued at written down current cost (a proxy for fair value). Revaluation of non-current
assets or groups of assets is only performed when their fair value is greater than $1 million and estimated useful life is greater than three years.
SA Lotteries obtains an independent valuation of such assets at least every fi ve years. However, if at any time management considers that the carrying amount of an asset materially di� ers from its fair value then the asset will be revalued regardless of when the last valuation took place. Non-current tangible assets that are acquired between revaluations are held at cost until the next valuation, where they are revalued to fair value.
SA Lotteries has taken the exemption available under Accounting Policy Framework III Asset Accounting Framework paragraph APS 3.8 to take asset revaluation adjustments to the asset revaluation surplus on a class basis rather than an individual asset basis.
Any revaluation increase is credited to the asset revaluation reserve, except to the extent that it reverses a revaluation decrease of the same asset class previously recognised as an expense, in which case the increase is recognised as income. Any revaluation decrease is recognised as an expense, except to the extent that it o� sets a previous revaluation increase for the same asset class, in which case the decrease is debited directly to the asset revaluation reserve to the extent of the credit balance existing in the revaluation reserve for that asset class.
Any accumulated depreciation as at the revaluation date is eliminated against the gross carrying amounts of the assets and the net amounts are restated to the revalued amounts of the asset.
Upon disposal or derecognition, any revaluation surplus is transferred to retained earnings.
Impairment All non-current tangible and intangible assets are tested for indication of impairment at each reporting date. If there was an
indication of impairment, the recoverable amount would be estimated. An amount by which the asset’s carrying amount exceeds the recoverable amount would be recorded as an impairment loss. For revalued assets, an impairment loss would be o� set against the asset revaluation surplus.
Intangible Assets An intangible asset is an identifi able non-monetary asset without physical substance. Intangible assets are measured at
cost. Following initial recognition, intangible assets are carried at cost less any accumulated amortisation and any accumulated impairment losses.
The useful lives of intangible assets are assessed as either fi nite or indefi nite. SA Lotteries only has intangible assets with fi nite lives.
(k) Liabilities
Liabilities have been classifi ed according to their nature and have not been o� set unless required or permitted by a specifi c Accounting Standard, or where o� setting refl ects the substance of the transaction or other event.
Note 27 discloses fi nancial liabilities where the counterparty/transaction is with an entity within the SA Government as at the reporting date, classifi ed according to their nature.
Payables Payables include creditors, accrued expenses, prizes payable, undistributed funds (owing to SA Government), and
employment on-costs.
Creditors and Accrued Expenses Creditors represent the amounts owing for goods and services received prior to the end of the reporting period that are
unpaid at the end of the reporting period. Creditors include all unpaid invoices received relating to the normal operations of SA Lotteries.
Accrued expenses represent goods and services provided by other parties during the period that are unpaid at the end of the reporting period and where an invoice has not been received.
All payables are measured at their nominal amount and are normally settled within 30 days from the date of the invoice or date the invoice is fi rst received.
SA LOTTERIES ANNUAL REPORT 2010-11

Prizes Payable Prizes payable represent amounts due to be paid to customers for prizes won in South Australia and settlements due to
lottery operators in other States participating in inter-jurisdictional prize pooling arrangements.
Amounts payable for prizes won in South Australia are generally available for settlement the day following the draw, or in the case of Instant Scratchies and minor Keno prizes, on the date of sale or draw. Division 1 and 2 prizes for lotto matrix type games are normally settled 14 days after the date of draw in accordance with the Lotteries Rules. Amounts payable to Blocs represent monies due to other lottery operators for prizes won in interstate jurisdictions. Settlement of amounts payable to Bloc members are normally due 14 days after the date of the draw.
Non-current prizes payable relate to outstanding annuity-style Instant Scratchies prizes where the total prize is payable in instalments over a number of years in accordance with the terms and conditions of each game. The liability is measured at the undiscounted amount expected to be paid.
Employment On-Costs Employment on-costs include superannuation contributions, payroll tax and workers compensation with respect to
outstanding liabilities for salaries, long service leave and annual leave. Employment on-costs are settled when the respective employee benefit that they relate to is discharged.
Employee Benefits These benefits accrue for employees as a result of services provided up to the reporting date and remain unpaid. Long-term
employee benefits are measured at present value and short-term employee benefits are measured at nominal amounts.
Salaries, Annual Leave and Sick Leave The liability for salaries is measured as the amount unpaid at the reporting date at rates current at the reporting date.
The annual leave liability is expected to be payable within twelve months and is measured at the undiscounted amount expected to be paid. No salaries or annual leave are expected to be payable later than twelve months.
No provision has been made for sick leave as all sick leave is non-vesting and the average sick leave taken in future years by employees is estimated to be less than the annual entitlement of sick leave.
Long Service Leave The liability for long service leave is recognised after an employee has completed 5 years of service. The benchmark for
measurement of the long service leave liability has been revised from 5½ years based on an actuarial assessment performed by the Department of Treasury and Finance.
An actuarial assessment of long service leave undertaken by the Department of Treasury and Finance based on a significant sample of employees throughout the South Australian public sector determined that the liability measured using the short hand method was not materially di�erent from the liability measured using the present value of expected future payments. This calculation is consistent with SA Lotteries’ experience of employee retention and leave taken.
The portion of the long service leave liability classified as current represents the amount that may be expected to be paid as leave taken or paid on termination of employment during SA Lotteries’ normal operating cycle.
Unclaimed Prizes Reserve Other than a prize in a Special Appeal Lottery (note 2(l)), any prize in a lottery that has not been collected or taken
delivery of within 12 months of the date of the draw or relevant day is forfeited to SA Lotteries and transferred into the Unclaimed Prizes Reserve. Subsection 16C(4) of the State Lotteries Act 1966 requires SA Lotteries to pay:
• 50 per cent of the amount derived from unclaimed prizes in The Pools (and other sports lotteries or special lotteries) to the Recreation and Sport Fund; and
• 50 per cent of the amount derived from unclaimed prizes in other lotteries to the Hospitals Fund.
The balance in the Reserve is applied by SA Lotteries from time to time for the purposes of providing additional or increased prizes in a subsequent lottery or lotteries, providing prizes in promotional lotteries or making ex gratia payments.
The State Lotteries Act 1966 provides for an ex gratia payment to a person who satisfies SA Lotteries that they are a winner of a prize in a lottery conducted by SA Lotteries, despite the fact that a prize has been forfeited to SA Lotteries, the winning ticket has been lost or destroyed or the period of notice of a claim for the prize has not been complied with.

Ex gratia payments are charged to the Unclaimed Prizes Reserve. The next payment to either the Hospitals Fund or Recreation and Sport Fund, depending on the game played, is then reduced by an amount equivalent to 50 per cent of the ex gratia payment.
Distribution of Funds to Government In accordance with Subsection 16(3) of the State Lotteries Act 1966, SA Lotteries is required to pay to the Hospitals Fund
the balance of surplus funds remaining after:
• payment of gambling tax and GST on NGR;
• making allowances for operating and capital expenses;
• applying the net proceeds and gambling tax of The Pools to the Recreation and Sport Fund;
• in respect of Special Appeal Lotteries (note 2(l)), applying the net proceeds and unclaimed prizes less the GST on NGR to the benefi ciary(s) of those lotteries; and
• retaining funds for certain designated purposes.
As detailed in note 2(f), SA Lotteries is required to make tax equivalent payments as a result of the application of the tax equivalent regime. In recognition of the provisions of the State Lotteries Act 1966, and in accordance with Treasurer’s Instruction 22 Tax Equivalent Payments, the transfer of funds to the Hospitals Fund is refl ected in the fi nancial statements in the form of:
(i) a gambling tax of 41 per cent on NGR in respect of all lotteries conducted by SA Lotteries except sports lotteries, special lotteries and special appeal lotteries;
(ii) an income tax equivalent payment (calculated on the accounting profi ts method), recorded as an expense item in the Statement of Comprehensive Income;
(iii) a dividend, represented by net profi t after income tax equivalent payment and increased/decreased by funds retained for certain designated purposes; and
(iv) unclaimed prizes.
The composition of all amounts due and payable to Government on account of the Hospitals Fund and Recreation and Sport Fund is detailed in note 24.
(l) Special Appeal Lotteries
Section 13AB of the State Lotteries Act 1966 enables SA Lotteries to conduct Special Appeal Lotteries.
No Special Appeal Lotteries were conducted during the fi nancial year.
(m) Foreign Currency
Exchange di� erences arising up to the date of purchase are included in the measurement of the purchase and are reported in the Statement of Comprehensive Income.
(n) Operating Leases
SA Lotteries has an accommodation lease agreement for its Head O� ce premises at 24-25 Greenhill Road, Wayville and an operating lease for the remote computer site at Glenside (Kidman Park remote site lease expired 28 October 2010). In respect of these operating leases, the lessor e� ectively retains substantially the entire risks and benefi ts incidental to ownership of the leased assets.
Operating lease payments are recognised as an expense in the Statement of Comprehensive Income on a straight line basis over the lease term. The straight line basis is representative of the pattern of benefi ts derived from the leased assets.
(o) Superannuation
SA Lotteries has an established superannuation plan for its employees, being the Lotteries Commission of South Australia Superannuation Plan (the Plan), which is a sub-plan of the Mercer Super Trust. The Plan provides lump sum benefi ts on retirement, death, disablement and withdrawal. Some categories of members receive only defi ned contribution, accumulation style benefi ts. The defi ned benefi t section of the Plan is closed to new members. All new members receive accumulation only benefi ts. The defi ned contribution (accumulation style) section receives fi xed contributions from SA Lotteries and SA Lotteries’ obligation is limited to these contributions. The withdrawal benefi t for defi ned benefi t members may be taken immediately or deferred until preservation age.
SA LOTTERIES ANNUAL REPORT 2010-11

The liability for the defined benefit section of the Plan has been determined via an actuarial valuation by Stuart Mules, FIAA (Mercer Investment Nominees Limited) using the projected unit credit method. The report was dated 11 July 2011.
Actuarial gains and losses are recognised in full, directly in profit and loss in the period in which they occur, and are presented in the Statement of Comprehensive Income.
The superannuation expense of the defined benefit section of the Plan is recognised as and when the contributions become payable and consist of current service cost, interest cost, actuarial gains and losses, and past service cost.
The defined benefit superannuation plan asset/liability recognised in the Statement of Financial Position represents the surplus/deficit of the fair value of the defined benefit superannuation plan assets over the present value of the defined benefit obligation to members. The expected payment to settle the obligation has been determined using national government bond market yields with terms and conditions that match, as closely as possible, to estimated cash outflows.
SA Lotteries also contributes to other externally managed superannuation plans. These contributions are expensed when they fall due and SA Lotteries’ obligation is limited to these contributions.
(p) Funds Retained for Capital Purposes
SA Lotteries has retained funds which represent the historical cost of the investment in land and buildings at 24-26 Payneham Road, Stepney.
(q) Asset Revaluation Surplus
This surplus is used to record increments and decrements in relation to the fair value of land and buildings and the online lotteries system to the extent that they o�set one another. Relevant amounts are transferred to retained earnings when an asset is disposed of or derecognised.
(r) Reserves
Building Maintenance Reserve This reserve was established to meet future major building maintenance costs.
Capital Asset Reserve This reserve was established to contribute to the financing of the cost of replacement of the online lotteries system
hardware and software, and the purchase of other non-current assets.
Keno Prize Reserve This reserve was established to meet Keno Spot 10 prizes. The reserve has been funded from retained earnings as a
proportion of all Keno Spot 10 gross sales through SA Lotteries’ agents and ACTTAB Limited. To the extent possible, the value of the Keno Spot 10 prize won is transferred from the reserve to retained earnings and paid to the Hospitals Fund.
(s) Unrecognised Contractual Commitments
Commitments include those from capital and operating commitments arising from contractual sources and are disclosed at their nominal value.
(t) Insurance
SA Lotteries has arranged, through the SAICORP Division of the South Australian Government Financing Authority, to insure all major risks of the organisation. The excess payable under this arrangement varies depending on each class of insurance held.
(u) Sub-licence to Private Operator
On 9 June 2011 the South Australian Government announced that it intended to create a sub-licence to operate lotteries in South Australia. Further, it is intended that the sub-licence will be available to a private sector operator. The licensing details, including the term and when the arrangement will take e�ect are still being determined. As of the reporting date, SA Lotteries is unable to make an assessment of the impact on the reported values of assets and liabilities contained within this financial report. All assets and obligations are reported in accordance with the information disclosed in note 2 (j) and (k), note 21 and note 22.

3. New and Revised Accounting Standards and Policies
In accordance with amendments to APS 4.8 within Accounting Policy Framework II, e� ective 1 July 2010, SA Lotteries has disclosed all employees whose normal remuneration is equal to or greater than the base executive level remuneration of $130 744. Previously APS 4.8 within APF II required the disclosure of all employees whose normal remuneration was equal to or greater than $100 000.
SA Lotteries did not voluntarily change any of its accounting policies in 2010-11.
Except for early adoption of AASB 2009-12 Amendments to Accounting Standards which mainly relates to terminology changes, the Australian Accounting Standards and interpretations that have recently been issued or amended, but are not yet e� ective, have not been adopted for the reporting period ended 30 June 2011. SA Lotteries has assessed the impact of the new and amended standards and interpretations and considers there will be no impact on the accounting policies or the fi nancial statements of SA Lotteries.
4. Related Party
SA Lotteries is controlled by the SA Government. Transactions and balances between SA Lotteries and related parties (ie other SA Government controlled entities) are disclosed in Note 27.
5. Sales Revenue
2011 2010
$’000 $’000
Saturday X Lotto 137 897 125 764
Monday and Wednesday X Lotto 34 684 37 133
Oz Lotto 36 871 44 530
Powerball 42 740 48 673
Keno 95 866 92 566
Instant Scratchies 39 113 40 189
Super 66 1 138 1 184
The Pools 631 665
Total sales revenue 388 940 390 704
Sales revenue includes agents’ commission.
6. Cost of Sales
2011 2010
$’000 $’000
Prizes 235 412 233 407
Gambling tax on net gambling revenue 62 946 64 492
Agents’ commission 29 010 29 179
GST on net gambling revenue paid to the ATO 13 957 14 300
Total cost of sales 341 325 341 378
SA LOTTERIES ANNUAL REPORT 2010-11

7. Other Revenues
2011 2010
$’000 $’000
Agents’ fees and charges 3 649 3 577
Easiplay Club service fees 442 374
Sundry 585 628
Total other revenues 4 676 4 579
8. Employee Benefits Expenses
2011 2010
$’000 $’000
Salaries (including annual leave) 5 997 6 419
Long service leave 137 204
Employment on-costs - superannuation contributions (note 26(j)) 641 677
Decrease in carrying value of defined benefit superannuation plan net asset/liability (note 26(e)) ( 7) 102
Employment on-costs - other 426 490
Commission Members’ fees 121 137
Total employee benefits expenses 7 315 8 029
Remuneration of employeesThe table covers all employees who received remuneration of $130 700 or more during the year. Remuneration reflects all costs of employment including salaries, superannuation contributions, fringe benefits tax, any other salary sacrifice benefits, and payment of any leave entitlements on ceasing employment. Employer contributions for employees who are members of the defined benefit section of the Lotteries Commission of South Australia Superannuation Plan were reduced from 1 July 2007 and subsequently increased from 5 January 2009 in accordance with actuarial advice and Commission endorsement.
2011 2010
No. No.
The number of employees whose remuneration received or receivable falls within the following bands:
$140 700 to $150 699 - 1
$150 700 to $160 699 1 1
$160 700 to $170 699 1 1
$170 700 to $180 699 1 1
$320 700 to $330 699 1 1
Total number of Employees 4 5
In accordance with the revised Accounting Policy Framework II General Purpose Financial Statements Framework, SA Lotteries has changed its accounting policy and now discloses all employees who receive remuneration equal to or greater than the base executive remuneration level rather than all employees who receive remuneration equal to or greater than $100,000. The impact of this change in accounting policy is the number of employees disclosed has reduced by 10 for 2011 and 7 for 2010.
2011 2010 $’000 $’000
Total remuneration received or receivable by employees whose remuneration was $130 700 or more 822 948

Key Management Personnel Compensation
The key management personnel are the Commission Members and the Senior Management Team (including the Chief Executive) who have responsibility for the strategic direction and management of SA Lotteries.
Commission Members
The following persons held the position of Member of the Lotteries Commission of South Australia for the full fi nancial year unless otherwise stated:
H J Oh� , PhD, BA (Hons), B Com, FIEAust, CPEng (Presiding Member)
S J Mackenzie, B Comm (Accounting), LLB (Hons)
W R Jackson, BEc, FASA
A E Lindsay, BA (Hons), LLB (Hons)
A E Heyworth, BA (Acc), MBA (AGSM), SF Fin, FAICD **
Commission Members’ remuneration
The total remuneration received and receivable by Commission Members includes fees, superannuation contributions, fringe benefi ts tax and professional indemnity insurance paid on behalf of Commission Members.
2011 2010
No. No.
The number of Commission Members whose remuneration received or receivable falls within the following bands:
$0 to $9 999 1 1
$20 000 to $29 999 - 1
$30 000 to $39 999 3 3
$40 000 to $49 999 1 1
Total number of Commission Members 5 6
2011 2010
$’000 $’000
The total remuneration received or receivable by Commission Members 148 165
** In accordance with DPC Circular 16, government employees did not receive any remuneration for Commission duties during the fi nancial year.
No Commission Member has entered into a contract with SA Lotteries since the end of the previous fi nancial year and there were no material contracts with Commission Members’ interests at the end of the fi nancial year.
SA LOTTERIES ANNUAL REPORT 2010-11

Senior Management TeamThe Senior Management Team comprised the following persons for the full financial year unless otherwise stated:
J R Roache BAcc, CPA, Grad Cert Mgt (Monash) FAICD, FAIM - Chief Executive I D Clayfield BEc, FCA - General Manager Financial and Corporate Services 1 July 2010 to 12 November 2010 C J Yeeles BComm, CPA - Acting General Manager Financial and Corporate Services 15 November 2010 to 7 December 2010 C I McSporran BEc - Chief Financial O�cer 8 December 2010 to 30 June 2011 J F Favretto BA - General Manager Information and Communications Technology D G Hardy LLB, BA GDLP - General Manager Legal and Risk Management/Company Secretary C M Mulvihill BComm, CPA, MBA - General Manager Marketing and Sales
The compensation of key management personnel included in Employee Benefits Expenses is as follows:
2011 2010 $’000 $’000
The compensation of key management personnel included in Employee Benefits Expenses is as follows:
Short-term employee benefits 865 951
Post-employment benefits * 181 191
Long-term employee benefits 18 18
Total key management personnel compensation 1 064 1 160
* Post-employment benefits include an allocation of the change in the defined benefit superannuation plan liability to key management personnel based on the share of the defined benefit obligation.
Targeted Voluntary Separation Packages (TVSPs)No employees were paid TVSPs during the reporting period.

9. Supplies and Services
2011 2010
$’000 $’000
Marketing and promotions 6 471 6 176
Computer operations 2 998 3 235
Tickets, coupons, terminal rolls and ribbons 1 787 1 937
Operating leases 933 835
Other occupancy costs 635 626
Temporary sta� and contractors 212 483
Agent distribution costs 242 271
Consultancies 19 8
Motor vehicle fl eet costs 224 243
Insurance 132 124
External audit fees (note 12) 151 129
Internal audit fees 171 223
Training costs 141 670
Gambling tax - other 72 79
Other 1 458 1 503
Total Supplies and Services 15 646 16 542
2011 2010 2011 2010
Consultancies No. No. $’000 $’000
The number and dollar amount of consultancies paid/payable (included in Supplies and Services) that fell within the following bands:
Below $10 000 2 2 5 8
$10 000 to $50 000 1 - 14 -
Above $50 000 - - - -
Total paid/payable to consultants engaged 3 2 19 8
SA LOTTERIES ANNUAL REPORT 2010-11

10. Depreciation and Amortisation Expense
2011 2010
$’000 $’000
Depreciation
Buildings 38 38
Plant and equipment 174 155
Online lotteries system 1 855 1 681
Total depreciation 2 067 1 874
Amortisation
Leasehold improvements 245 248
Intangible assets - Software 3 41
Total amortisation 248 289
Total depreciation and amortisation 2 315 2 163
11. Net Gain (Loss) on Derecognition of Non-current Assets
2011 2010
$’000 $’000
Proceeds from disposal 1 -
Less: Net book value of assets derecognised 19 -
Net gain (loss) on derecognition of non-current assets ( 18) -
Assets are derecognised on disposal or when no future economic benefits are expected from the asset’s use or disposal.
12. Auditor’s Remuneration
2011 2010
$’000 $’000
Audit Services
Audit fees payable for the financial year 151 153
(Over) under accrual - ( 24)
External audit fees expense 151 129
The Auditor-General is the auditor of SA Lotteries.
Other Services No other services were provided by the Auditor-General.

13. Cash and Cash Equivalents
2011 2010
$’000 $’000
Bank balances and cash on hand 10 546 8 089
Short-term deposits 42 000 42 000
Total cash and cash equivalents 52 546 50 089
Bank balances comprise unpresented cheques net of outstanding deposits and cash on hand.
Short-term deposits are with the South Australian Government Financing Authority.
Interest Rate RiskCash on hand is non-interest bearing. Bank balances and short-term deposits earn a fl oating interest rate based on daily bank deposit rates. The weighted average interest rate earned was 4.93% (2010: 3.75%).
Net Fair ValuesThe carrying amount of cash and cash equivalents represents fair value.
14. Receivables
2011 2010
$’000 $’000
Current
Agent debtors 1 489 2 251
Prize settlements receivable from Blocs 611 16 622
Sundry receivables 339 363
Prepayments 344 331
Total current receivables 2 783 19 567
Non-currentPrepayments 133 186
Total non-current receivables 133 186
Total receivables 2 916 19 753
Interest Rate RiskAll receivables are non-interest bearing.
Credit RiskCredit risk represents the loss that would be recognised if parties owing monies to SA Lotteries at the reporting date fail to honour their obligations. SA Lotteries minimises its credit risk in relation to agents by undertaking its sales transactions with a large number of agents and, in accordance with policy, requiring those agents to remit outstandings on a twice weekly basis. It is not anticipated that counterparties will fail to discharge their obligations. In addition, there is no concentration of credit risk.
Net Fair ValuesThe carrying amount of receivables approximates net fair value due to being receivable on demand.
SA LOTTERIES ANNUAL REPORT 2010-11

15. Property, Plant and Equipment
2011 2010
$’000 $’000
Land and buildings
Land at fair value 920 700
Buildings at fair value 580 650
Accumulated depreciation - ( 114)
Total land and buildings 1 500 1 236
Plant and equipment
Plant and equipment at cost (deemed fair value) 2 101 2 111
Accumulated depreciation (1 596) (1 661)
Total plant and equipment 505 450
Online lotteries system
Online lotteries system at cost (deemed fair value) 13 038 12 981
Accumulated depreciation (2 164) ( 310)
Total online lotteries system 10 874 12 671
Leasehold improvements
Leasehold improvements at cost (deemed fair value) 2 532 2 476
Accumulated amortisation (1 523) (1 281)
Total leasehold improvements 1 009 1 195
Total property, plant and equipment 13 888 15 552
Reconciliation of Property, Plant and Equipment
The following table shows the movement of Property, Plant and Equipment during 2010-11 and 2009-10.
Online Leasehold Plant & Lotteries Improve- Land Buildings Equipment System ments Total
$’000 $’000 $’000 $’000 $’000 $’000
Carrying amount at 1 July 2010 700 536 450 12 671 1 195 15 552
Additions - - 246 58 61 365
Assets derecognised (including disposals) - - ( 17) - ( 2) ( 19)
Revaluation increment 220 82 - - - 302
Depreciation and amortisation - ( 38) ( 174) (1 855) ( 245) (2 312)
Carrying amount at 30 June 2011 920 580 505 10 874 1 009 13 888
Carrying amount at 1 July 2009 700 574 368 2 750 1 436 5 828
Additions - - 237 11 602 7 11 846
Assets derecognised (including disposals) - - - - - -
Depreciation and amortisation - ( 38) ( 155) (1 681) ( 248) (2 122)
Carrying amount at 30 June 2010 700 536 450 12 671 1 195 15 552

Valuation of property, plant and equipment
The valuation of the 24-26 Payneham Road, Stepney property was performed by Simon Hickin AAPI, Certifi ed Practising Valuer, an independent valuer from Jones Lang LaSalle, as at 30 June 2011. The valuer arrived at fair value based on recent market transactions for similar land and buildings in the area taking into account zoning and restricted use and was determined on an in-use value, assuming a fully tenanted (subject to a notional fi ve plus fi ve year lease back) basis.
2011 2010
$’000 $’000
The carrying amount of property, plant and equipment that would have been recognised if these assets were stated at cost is:
Land and buildings 335 346
Plant and equipment 505 450
Online lotteries system 10 818 12 671
Leasehold improvements 1 009 1 195
Total carrying amount of property, plant and equipment that would have been recognised if these assets were stated at cost 12 667 14 662
ImpairmentThere were no indications of impairment of property, plant and equipment assets at 30 June 2011.
16. Intangible Assets
2011 2010
$’000 $’000
Software
Software at cost 182 182
Accumulated amortisation ( 182) ( 179)
Total Intangible Assets - 3
2011 2010
$’000 $’000
Reconciliation of Intangible AssetsThe following table shows the movement of Intangible Assets during 2010-11 and 2009-10.
Carrying amount at 1 July 3 44
Additions - -
Amortisation ( 3) ( 41)
Carrying amount at 30 June - 3
Impairment
There were no indications of impairment of intangible assets at 30 June 2011.
SA LOTTERIES ANNUAL REPORT 2010-11

17. Payables
2011 2010
$’000 $’000
Current
Creditors and accrued expenses 2 539 3 241
Prizes payable 13 427 29 623
GST payable 790 455
Undistributed funds (note 24) 8 090 8 253
Employment on-costs 102 121
Total current payables 24 948 41 693
Non-current
Prizes payable 1 356 960
Employment on-costs 92 108
Total non-current payables 1 448 1 068
Total payables 26 396 42 761
Based on an actuarial assessment performed by the Department of Treasury and Finance, the percentage of long service leave expected to be taken as leave is 35 per cent (45 per cent in 2010). This rate is used in the calculation of employment on-costs. The net financial e�ect of the change on employment on-costs in the current financial year is a decrease of $4 000.
Interest Rate RiskAll payables are non-interest bearing.
Net Fair ValuesThe carrying amount of payables represents fair value due to the amounts being payable on demand.

18. Employee Benefi ts
2011 2010
$’000 $’000
Current
Annual Leave 542 666
Long Service Leave 124 95
Accrued Salaries - 108
Total current employee benefi ts 666 869
Non-Current
Long Service Leave 920 935
Defi ned benefi t superannuation plan liability (note 26(d)) 421 428
Total non-current employee benefi ts 1 341 1 363
Total employee benefi ts 2 007 2 232
The total current and non-current employee liability (ie aggregate employee benefi t (above) plus related employment on-costs (note 17)) is: 2 201 2 461
Based on an actuarial assessment by the Department of Treasury and Finance the benchmark for measurement of the long service leave liability has changed from the 2010 benchmark of 5½ years to 5 years in 2011. The net fi nancial e� ect of the change in the current fi nancial year is an increase in employee benefi ts plus related employment on-costs liability and employee benefi ts expenses of $14 000.
One day of salaries for the pay period ended 1 July 2011 are prepaid and are included in Note 14 Receivables.
SA LOTTERIES ANNUAL REPORT 2010-11

19. Other Liabilities
2011 2010 $’000 $’000
Current
Prize reserve fund (a) 8 349 7 434
Unearned revenue - sales in advance 2 048 1 464
Total current other liabilities 10 397 8 898
Non-current
Unclaimed prizes reserve (b) 6 939 8 586
Total non-current other liabilities 6 939 8 586
Total other liabilities 17 336 17 484
(a) Prize Reserve Fund
Balance at 1 July 7 434 8 700
Allocated to prize reserve fund 10 675 11 021
Applied to additional or increased prizes (9 760) (12 287)
Balance at 30 June 8 349 7 434
SA Lotteries sets aside a proportion of the total amount of net sales (gross sales revenue less agents’ commission) for X Lotto, Oz Lotto, Powerball, Super 66 and The Pools in the prize reserve fund in accordance with the Rules of each game. These funds are available for distribution at any time as additional or increased prizes in subsequent lottery draws in the respective games or as prizes in respect of missed prize entries for previous lottery draws.
2011 2010 $’000 $’000
(b) Unclaimed Prizes Reserve
Balance at 1 July 8 586 8 020
Unclaimed monies forfeited 4 102 3 220
12 688 11 240
Monies provided for distribution to the Hospitals Fund (2 040) (1 608)
Monies provided for distribution to the Recreation and Sport Fund ( 1) ( 2)
Applied to additional or increased prizes in subsequent lottery draws, prizes in promotional lotteries or ex gratia payments (3 708) (1 044)
Balance at 30 June 6 939 8 586

20. Capital Asset Reserve
2011 2010 $’000 $’000
Capital asset reserve comprises:
• Capital fund account 4 396 2 761
• Capital fund assets (at written down value) 13 161 15 073
17 557 17 834
Capital fund account
Balance at 1 July 2 761 12 607
Transfer from retained earnings 2 000 2 000
Assets fi nanced ( 365) (11 846)
Balance at 30 June 4 396 2 761
Capital fund assets
Written down value at 1 July 15 073 4 730
Assets fi nanced 365 11 846
Depreciation (2 258) (1 503)
Written down value of assets disposed of ( 19) -
Written down value at 30 June 13 161 15 073
SA LOTTERIES ANNUAL REPORT 2010-11

21. Unrecognised Contractual Commitments
2011 2010 $’000 $’000
Capital commitments
Capital expenditure contracted for at the reporting date but not recognised as liabilities are payable as follows:
Within one year - 2 557
Later than one year but not longer than five years - -
Total capital commitments - 2 557
Operating lease commitments
Commitments in relation to operating leases contracted for at the reporting date but not recognised as liabilities are payable as follows:
Within one year 793 758
Later than one year but not longer than five years 1 528 2 148
Later than five years - -
Total operating lease commitments 2 321 2 906
Representing:
Non-cancellable operating leases 2 321 2 906
The 10-year accommodation operating lease at 24-25 Greenhill Road (head o�ce) is non-cancellable with rent payable monthly in advance. Rental provisions within the lease agreement require future lease payments to be increased by 3 per cent per annum. The lease term expires 3 May 2014.
A memorandum of administrative arrangement with the Department of Transport, Energy and Infrastructure for the remote computer site at Glenside is non-cancellable with rent payable monthly in advance. Rent payable is fixed for the term of the lease agreement. The 5 year term expires 30 June 2014.
2011 2010 $’000 $’000
Other Commitments
Other expenditure contracted for at the reporting date but not recognised as liabilities are payable as follows:
Within one year 2 323 2 480
Later than one year but not longer than five years 4 980 6 428
Later than five years 517 1 125
Total other commitments 7 820 10 033
SA Lotteries’ other commitments are for existing and new agreements relating to online lotteries system software, hardware, communications and associated services and other fixed services.

22. Contingent Assets and Liabilities
SA Lotteries is not aware of any contingent assets.
A claim for damages was received by SA Lotteries on 15 July 2008 for alleged loss of potential winnings. Proceedings were served on SA Lotteries in October 2010. The claim is for unspecifi ed damages, interest and costs. At this time it is not possible to make a reasonable estimate of the fi nancial e� ect of this claim or whether the claim will be successful.
Other than this claim, SA Lotteries is not aware of any contingent liabilities.
SA Lotteries has made no guarantees.
23. Cash Flow Reconciliation
2011 2010 $’000 $’000
Reconciliation of cash and cash equivalents
Statement of Financial Position 52 546 50 089
Statement of Cash Flows 52 546 50 089
Reconciliation of Net Profi t after income tax equivalent to Net Cash provided by (used in) Operating Activities:
Profi t after income tax equivalent 20 623 20 589
Less: Dividend contribution provided (20 298) (21 968)
Less: Unclaimed prizes distribution provided (2 041) (1 610)
Add (less): Non-cash items
Depreciation and amortisation expense 2 315 2 163
Net (gain) loss on derecognition of non-current assets 18 -
Increase (Decrease) in carrying value of defi ned benefi t superannuation plan net liability ( 7) 102
Changes in Assets/Liabilities
Decrease in Receivables 16 837 42 092
Decrease (Increase) in Inventories 63 ( 217)
(Decrease) in Payables (including Undistributed funds) (15 125) (52 340)
(Decrease) Increase in Employee benefi ts ( 218) 137
Increase in Other liabilities 1 893 971
Net cash provided by (used in) operating activities 4 060 (10 081)
Financing FacilitySA Lotteries has the following arrangement with SAFA:Working capital facility 8 000 8 000 Amount used - -
Unused working capital facility 8 000 8 000
The working capital facility was established on 22 June 2010 as a general operations contingency measure only.
SA LOTTERIES ANNUAL REPORT 2010-11
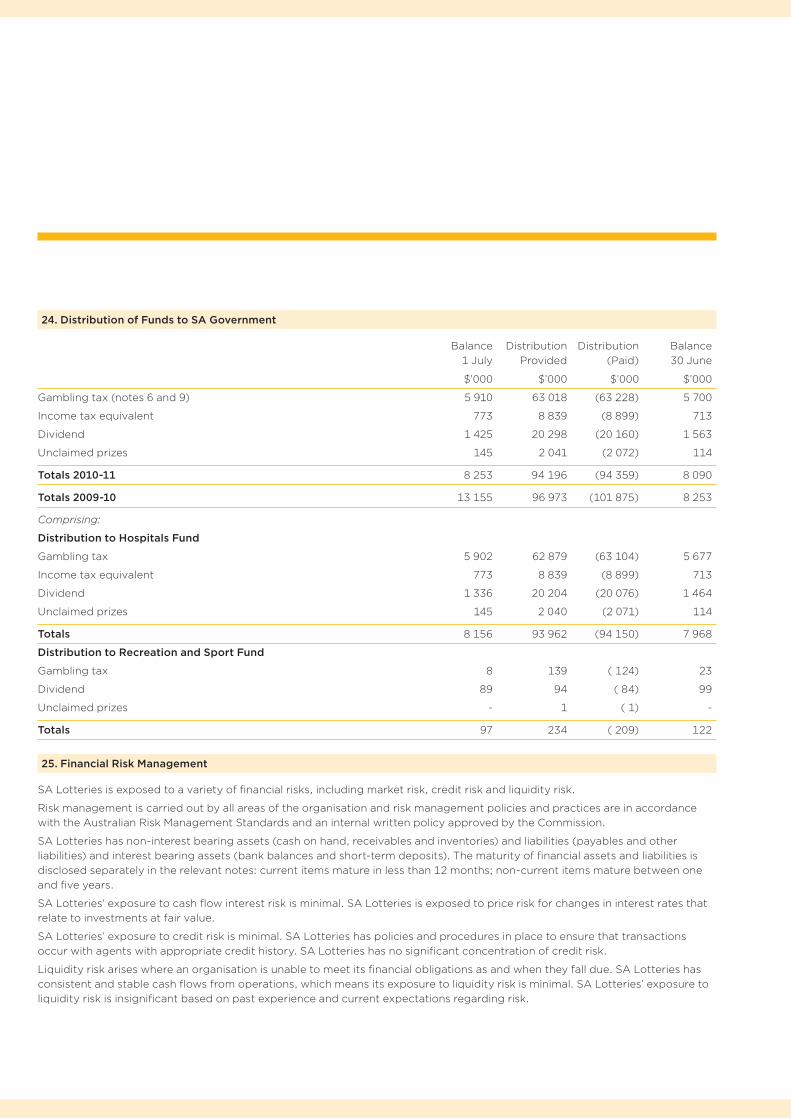
24. Distribution of Funds to SA Government
Balance Distribution Distribution Balance 1 July Provided (Paid) 30 June
$’000 $’000 $’000 $’000
Gambling tax (notes 6 and 9) 5 910 63 018 (63 228) 5 700
Income tax equivalent 773 8 839 (8 899) 713
Dividend 1 425 20 298 (20 160) 1 563
Unclaimed prizes 145 2 041 (2 072) 114
Totals 2010-11 8 253 94 196 (94 359) 8 090
Totals 2009-10 13 155 96 973 (101 875) 8 253
Comprising:
Distribution to Hospitals Fund
Gambling tax 5 902 62 879 (63 104) 5 677
Income tax equivalent 773 8 839 (8 899) 713
Dividend 1 336 20 204 (20 076) 1 464
Unclaimed prizes 145 2 040 (2 071) 114
Totals 8 156 93 962 (94 150) 7 968
Distribution to Recreation and Sport Fund
Gambling tax 8 139 ( 124) 23
Dividend 89 94 ( 84) 99
Unclaimed prizes - 1 ( 1) -
Totals 97 234 ( 209) 122
25. Financial Risk Management
SA Lotteries is exposed to a variety of financial risks, including market risk, credit risk and liquidity risk.
Risk management is carried out by all areas of the organisation and risk management policies and practices are in accordance with the Australian Risk Management Standards and an internal written policy approved by the Commission.
SA Lotteries has non-interest bearing assets (cash on hand, receivables and inventories) and liabilities (payables and other liabilities) and interest bearing assets (bank balances and short-term deposits). The maturity of financial assets and liabilities is disclosed separately in the relevant notes: current items mature in less than 12 months; non-current items mature between one and five years.
SA Lotteries’ exposure to cash flow interest risk is minimal. SA Lotteries is exposed to price risk for changes in interest rates that relate to investments at fair value.
SA Lotteries’ exposure to credit risk is minimal. SA Lotteries has policies and procedures in place to ensure that transactions occur with agents with appropriate credit history. SA Lotteries has no significant concentration of credit risk.
Liquidity risk arises where an organisation is unable to meet its financial obligations as and when they fall due. SA Lotteries has consistent and stable cash flows from operations, which means its exposure to liquidity risk is minimal. SA Lotteries’ exposure to liquidity risk is insignificant based on past experience and current expectations regarding risk.

26. Superannuation
2011 2010 $’000 $’000
(a) Expense (Income) Recognised in the Statement of Comprehensive Income
Amounts recognised as expense (income) in respect of the defi ned benefi t superannuation plan as follows:
Current service cost 300 308
Interest cost 286 283
Expected return on plan assets ( 390) ( 357)
Actuarial loss (gain) 95 179
Superannuation expense (income) 291 413
The expense (income) is recognised in the following item in
the Statement of Comprehensive Income:
• Employee benefits expenses (note 26(e)) 291 413
(b) Reconciliation of the Present Value of the Defi ned Benefi t Obligation
Present value of defi ned benefi t obligation at beginning of fi nancial year 6 588 5 717
Current service cost 300 308
Interest cost 286 283
Contributions by plan participants 200 244
Actuarial losses (gains) 153 254
Benefi ts paid ( 777) ( 107)
Taxes, premiums and expenses paid ( 109) ( 111)
Transfers in - -
Present value of defi ned benefi t obligation at end of fi nancial year 6 641 6 588
(c) Reconciliation of the Fair value of Defi ned Benefi t Plan Assets
Fair value of plan assets at beginning of fi nancial year 6 160 5 391
Expected return on plan assets 390 357
Actuarial gains (losses) 58 75
Employer contributions 298 311
Contributions by plan participants 200 244
Benefi ts paid ( 777) ( 107)
Taxes, premiums and expenses paid ( 109) ( 111)
Transfers in - -
Fair value of plan assets at end of fi nancial year 6 220 6 160
The fair value of Plan assets includes no investments over which SA Lotteries retains ownership control relating to:
• any of SA Lotteries’ own financial instruments; or
• any property occupied by, or other assets used by, SA Lotteries.
SA LOTTERIES ANNUAL REPORT 2010-11

2011 2010 $’000 $’000
(d) Reconciliation of the Asset (Liability) Recognised in the Statement of Financial Position
Defined benefit obligation 6 641 6 588
Fair value of plan assets 6 220 6 160
Surplus (Deficit) ( 421) ( 428)
Net superannuation asset (liability) ( 421) ( 428)
The amount included in the Statement of Financial Position arising from SA Lotteries’ net superannuation asset/liability in respect of its defined benefit plan is shown in Note 18: Employee Benefits (Non-current) - Defined benefit superannuation plan liability 421 428
(e) Movement in Asset (Liability) Recognised in the Statement of Financial Position
Net superannuation asset (liability) at beginning of financial year ( 428) ( 326)
Income (expense) recognised in Statement of Comprehensive Income ( 291) ( 413)
Employer contributions 298 311
Net movement 7 ( 102)
Net superannuation asset (liability) at end of financial year ( 421) ( 428)
(f) Plan Assets
The percentage invested in each asset class at the reporting date:
Percentage Invested * Plan Assets
2011 2010 2011 2010
$’000 $’000
Australian equity 27% 29% 1 679 1 786
Overseas equity 27% 32% 1 679 1 971
Fixed interest and bonds 14% 12% 871 739
Property 10% 10% 622 616
Alternative assets ** 11% 10% 684 616
Cash 11% 7% 685 432
Total Plan Assets 100% 100% 6 220 6 160
* Asset allocation as at 30 June 2011 was not available. The asset allocation at 31 December 2010 has been used as an approximation of the allocation as at the reporting date.
** Alternative assets generally comprise those investments which do not fit within the traditional broad asset classes (such as shares, property, fixed interest and cash).

(g) Expected Rate of Return on Plan Assets
The expected return on assets assumption is determined by weighting the expected long-term return for each asset class by the target allocation of assets in each class and allowing for the correlations of the investment returns between asset classes. The returns used for each asset class are net of investment tax, investment fees, and asset-based administration fees.
Expected Rate of Return 2011 2010
The expected rate of return for each asset class at the end of the fi nancial year is as follows:
Australian equity 7.5% 7.5%
Overseas equity 6.7% 6.7%
Fixed interest and bonds 4.7% 4.7%
Property 6.1% 6.1%
Alternative assets 5.7% 5.7%
Cash 3.8% 3.8%
Weighted average expected return 6.75% 6.75%
(h) Actual Return on Plan Assets 2011 2010 $‘000 $‘000
Actual return on plan assets 448 432
(i) Principal Actuarial Assumptions
The principal actuarial assumptions at the reporting date (expressed as weighted averages): 2011 2010
Discount rate (active members) 4.6% pa 4.5% pa
Expected rate of return on plan assets (active members) 6.75% pa 6.75% pa
Expected salary increase rate 2.5% pa for 1 year, 2.5% pa for 2 years, 3.5% pa thereafter 3.5% pa thereafter
(j) Contributions 2011 2010 $‘000 $‘000
Contributions paid/payable by SA Lotteries to superannuation plans:
Defi ned benefi t members 262 294
Defi ned contribution (accumulation) members 376 378
Private funds 3 5
Total contributions 641 677
(k) Expected Employer Contributions
The estimated employer contributions expected to be paid to the plan during the year beginning after the reporting date: 272 289
The estimated employer contributions are based on a contribution rate of 14.4% of defi ned benefi t members’ salaries (see note 26(m)(ii)).
SA LOTTERIES ANNUAL REPORT 2010-11

2011 2010 2009 2008 2007 $’000 $’000 $’000 $’000 $’000
(l) Historical Information Present value of defined benefit obligation 6 641 6 588 5 717 5 385 6 323
Fair value of plan assets 6 220 6 160 5 391 5 927 7 405
Surplus (deficit) in plan ( 421) ( 428) ( 326) 542 1 082
Experience adjustments - gain/(loss):• plan assets 58 75 (1 220) (1 110) 655 • plan liabilities ( 188) ( 86) 379 540 ( 561)
(m) Funding Arrangements for Employer Contributions
(i) Surplus/Deficit The following is a summary of the most recent financial position of the Lotteries Commission of South Australia
Superannuation Plan calculated in accordance with AAS25 Financial Reporting by Superannuation Plans.
as at 30 June 2009 $’000 Defined benefit members: Accrued benefits 4 807
Net market value of plan assets 4 653
Net surplus (deficit) ( 154)
Accumulation members and additional accumulation accounts for defined benefit members:Assets and benefits 2 402
(The Plan is subject to a triennial review and is externally managed. The last full actuarial investigation was conducted as at 30 June 2009 by Stuart Mules, FIAA, of Mercer (Australia) Pty Limited. The report was dated 31 May 2010.)
(ii) Current Contribution Rates As at 30 June 2011, the current contribution rates, in accordance with actuarial advice and Commission
endorsement, are:
• 14.4% of defined benefit members’ salaries effective from 6 July 2009;
• at the Superannuation Guarantee rate of 9% of accumulation members’ salaries.
(iii) Funding Method The method used to determine the employer contribution recommendations at the last actuarial review was the
“target” funding method. The method adopted a�ects the timing of the cost to SA Lotteries.
Under the “target” funding method, the employer contribution rate is determined with the aim of maintaining the assets at or close to the value of Accrued Benefits and above the total of the Vested Benefits (leaving service benefits) by a margin su�cient to give security against adverse circumstances.
(iv) Economic Assumptions The long-term economic assumptions adopted for the last triennial actuarial review of the Plan as at
30 June 2009 were: Weighted-Average Assumptions • Expected rate of return on assets (discount rate) 6.75% pa • Expected salary increase rate 2.5% pa for 3 years to 2011-12 3.5% pa thereafter
(n) Nature of Asset/Liability SA Lotteries has recognised a liability in the Statement of Financial Position in respect of its defined benefit superannuation arrangements. If a surplus exists in the Plan, SA Lotteries is able to take advantage of it in the form of a reduction in the required contribution rate, depending on the advice of the Plan’s actuary.

27. Transactions with SA Government
As required by APS 4.1 of Accounting Policy Framework II General Purpose Financial Reporting Framework, the following table discloses revenues, expenses, fi nancial assets and liabilities where the counterparty/transaction is with an entity within the SA Government as at the reporting date, classifi ed according to their nature.
SA Government Non-SA Government TotalNote 2011 2010 2011 2010 2011 2010
$’000 $’000 $’000 $’000 $’000 $’000INCOME
5. Sales Revenue - - 388 940 390 704 388 940 390 704
6. Cost of Sales
Prizes - - (235 412) (233 407) (235 412) (233 407)
Gambling tax on NGR (62 946) (64 492) - - (62 946) (64 492)
Agents’ commission - - (29 010) (29 179) (29 010) (29 179)
GST on NGR paid to the ATO - - (13 957) (14 300) (13 957) (14 300)
Total cost of sales (62 946) (64 492) (278 379) (276 886) (341 325) (341 378)
Interest Revenue 2 100 1 835 365 407 2 465 2 242
7. Other Revenues 18 30 4 658 4 549 4 676 4 579
TOTAL INCOME (60 828) (62 627) 115 584 118 774 54 756 56 147
EXPENSES
8. Employee Benefi ts Expenses 365 430 6 950 7 599 7 315 8 029
9. Supplies and Services
Marketing and promotions - - 6 471 6 176 6 471 6 176
Computer operations 52 - 2 946 3 235 2 998 3 235
Tickets, coupons, terminal rolls and ribbons - - 1 787 1 937 1 787 1 937
Operating leases 131 132 802 703 933 835
Other occupancy costs 22 16 613 610 635 626
Temporary sta� and contractors - - 212 483 212 483
Agent distribution costs - - 242 271 242 271
Consultancies - - 19 8 19 8
Motor vehicle fl eet costs 223 234 1 9 224 243
Insurance 72 124 60 - 132 124
External audit fees 151 129 - - 151 129
Internal audit fees - - 171 223 171 223
Training costs - - 141 670 141 670
Gambling tax - other 72 79 - - 72 79
Other 22 19 1 436 1 484 1 458 1 503
Total Supplies and Services 745 733 14 902 15 809 15 646 16 542
TOTAL EXPENSES (excluding Depreciation and Amortisation) 1 110 1 163 21 852 23 408 22 961 24 571
SA LOTTERIES ANNUAL REPORT 2010-11

SA Government Non-SA Government TotalNote 2011 2010 2011 2010 2011 2010
$’000 $’000 $’000 $’000 $’000 $’000FINANCIAL ASSETS
14. Receivables
Current
Agent debtors - - 1 489 2 251 1 489 2 251
Prize settlements receivable from Blocs - - 611 16 622 611 16 622
Sundry receivables 175 171 164 192 339 363
Prepayments - - 344 331 344 331
Total current receivables 175 171 2 608 19 396 2 783 19 567
Non-current
Prepayments - - 133 186 133 186
Total non-current receivables - - 133 186 133 186
Total receivables 175 171 2 741 19 582 2 916 19 753
FINANCIAL LIABILITIES
17. Payables
Current
Creditors and accrued expenses 242 282 2 297 2 959 2 539 3 241
Prizes payable - - 13 427 29 623 13 427 29 623
GST payable - - 790 455 790 455
Undistributed funds 8 090 8 253 - - 8 090 8 253
Employment on-costs 42 49 60 72 102 121
Total current payables 8 374 8 584 16 574 33 109 24 948 41 693
Non-current
Prizes payable - - 1 356 960 1 356 960
Employment on-costs 51 54 41 54 92 108
Total non-current payables 51 54 1 397 1 014 1 448 1 068
Total payables 8 425 8 638 17 971 34 123 26 396 42 761

CERTIFICATION OF THE FINANCIAL STATEMENTSWe certify that the attached general purpose fi nancial statements for the Lotteries Commission of South Australia:
• comply with relevant Treasurer’s Instructions issued under section 41 of the Public Finance and Audit Act 1987 and relevant Australian Accounting Standards;
• are in accordance with the accounts and records of the Lotteries Commission of South Australia; and
• present a true and fair view of the financial position of the Lotteries Commission of South Australia as at 30 June 2011 and the results of its operations and cash fl ows for the fi nancial year.
In our opinion the internal controls employed by the Lotteries Commission of South Australia for the fi nancial year over its fi nancial reporting and its preparation of the general purpose fi nancial statements have been e� ective throughout the reporting period and there are reasonable grounds to believe the Lotteries Commission of South Australia will be able to pay its debts as and when they become due and payable.
Signed in accordance with a resolution of the Commission.
Hans J Oh� Presiding Member
June Roache
Chief Executive
Chris McSporran
Chief Financial O� cer
25 August 2011
SA LOTTERIES ANNUAL REPORT 2010-11

REPORT OF THEAUDITOR-GENERAL

SA LOTTERIES ANNUAL REPORT 2010-11

AGENT Entity appointed under an Agent Agreement to operate an SA Lotteries agency.
AGENCY Distribution outlet selling SA Lotteries’ games.
APLA The Asia Pacific Lottery Association currently representing 25 lotteries, and 14 associate members from the supplier industry, in the Asia Pacific region.
BLOC Multi-jurisdictional arrangement with other Australian lottery operators to allow pooling for larger jackpots for select games.
CSR Corporate Social Responsibility.
DIVISION ONE The top prize in Saturday X Lotto, Monday and Wednesday X Lotto, Oz Lotto, Powerball, Super 66 and The Pools. Keno Spot 8, 9 and 10 and Instant Scratchies Top Prizes are also classed as Division One wins.
EASIPLAY CLUB SA Lotteries’ free player registration service for ticket purchases which provides players with the ability to safeguard their winnings and store favourite numbers.
EBITDA Earnings Before Interest, Tax, Depreciation and Amortisation.
EX GRATIA PAYMENTS Made to persons who are prize winners even though the prize may have been forfeited, tickets lost or damaged or a claim not made within the statutory period of 12 months from the date of the game draw.
INSTANT SCRATCHIES Instant lottery tickets whereby players can win a prize by scratching or removing the latex on the ticket to reveal symbols or prize amounts.
JACKPOT Occurs when there are no Division One winning entries recorded for a draw, resulting in the Division One prize pool cascading to the Division One prize for the next draw.
KENO A numbers game of chance whereby 20 numbers are randomly generated from a possible 80 every 3.5 minutes. Players can choose to select one number (Spot 1) up to ten numbers (Spot 10).
LUCKYSA LOTTERY A traditional raÍe-style lottery with tickets generated via SA Lotteries’ online terminal, conducted in 2008.
MEGADRAW Saturday X Lotto draw that o�ers an augmented Division One prize pool, often exceeding $20 million.
MONDAY AND WEDNESDAY X LOTTO A game of chance in which six numbered balls and two supplementary balls are randomly drawn from a barrel of 45 every Monday and Wednesday.
MTBF The average number of transactions processed by terminals before there is a terminal failure. A measure of the reliability of agent terminals.
ONLINE LOTTERIES SYSTEM The central computer system operating SA Lotteries’ games, which is connected to a Statewide network of approximately 700 Point of Sale terminals.
OZ LOTTO A game of chance in which seven numbered balls and two supplementary balls are randomly drawn from a barrel of 45 balls every Tuesday.
PERFORMANCE MEASURES TABLE A report linking targets with the corporate strategic intent.
POS Point of Sale at SA Lotteries agencies.
POWERBALL A game of chance in which five numbered balls are randomly drawn from one barrel of 45 balls, and one numbered ball (the Powerball) is drawn from a second barrel of 45 balls.
REPONSIBLE GAMBLING Individuals making informed decisions about their gambling participation in lotteries games and play without harm to themselves, others and their communities.
RETURN TO GOVERNMENT Total payments to Government from SA Lotteries’ activities comprising Gambling Tax, Income Tax Equivalent, Dividend and Unclaimed Prizes.
SA TAB South Australian Totalisator Agency Board.
SATURDAY X LOTTO A game of chance in which six numbered balls and two supplementary balls are randomly drawn from a barrel of 45 every Saturday.
SHAREHOLDER The Government of South Australia, on behalf of the community of South Australia.
SPOT 10 JACKPOT The top prize in a game of Keno that is won when a player correctly matches 10 of the 20 numbers drawn.
STATE LOTTERIES CODES OF PRACTICE Mandatory codes for responsible gambling and advertising approved by the Independent Gambling Authority.
SUPER 66 A game of chance in which the player selects a six-digit number combination in the range of 000000 to 999999. To win Division One, players match their selected numbers in the order of those drawn every Saturday.
SUPERDRAW Monday and Wednesday X Lotto draw that o�ers an augmented Division One prize pool of $5 million.
THE POOLS A game of chance in which the winning numbers are based on the results of soccer matches played in either the Northern Hemisphere or Southern Hemisphere.
TOP PRIZE The highest prize available on the Instant Scratchies ticket, and the largest prize available in Keno Spots 8, 9 and 10.
WLA World Lottery Association is a global professional association of State lottery and gaming organisations from more than 80 countries and six continents.
GLOSSARY