2020 ANNU AL REPORT - :: HKEX :: HKEXnews ::
304
-
Upload
khangminh22 -
Category
Documents
-
view
7 -
download
0
Transcript of 2020 ANNU AL REPORT - :: HKEX :: HKEXnews ::

20
20
AN
NU
AL
RE
PO
RT
�e Artisanal Movement is a cultural vision, a celebration of the human values of cra�smanship, heritage and imagination. Today, as our business evolves in step with the society, we look ahead to bring a new purpose to this vision: create shared value for all stake-holders in communities that we serve, in order to make a positive impact on the world. It is our belief of using the power of business and innovation to give back to the society. �rough three core areas - culture and creativity, sustainability, and social innovation - we will forge new paths that tie our business success to social progress. Because together we create, we are artisans, we are CSV.

Annual Report 2020 2

DisclaimerThe photographs, images, drawings or sketches shown in this annual report represent an artist’s impression of the development concerned only. They are not drawn to scale and/or may have been edited and processed with computerised imaging techniques. Prospective purchasers should make reference to the sales brochure for details of the development. The vendor also advises prospective purchasers to conduct an on-site visit for a better understanding of the development site, its surrounding environment and the public facilities nearby.
All parties engaged in the production of this annual report have made their best efforts to ensure the highest accuracy of all information, photographs, images, drawings or sketches herein contained as to the printing of this annual report and to minimise the existence of clerical errors. Readers are invited to make enquires to sales personnel or consult relevant professionals for verification of doubts or particulars of specific items.
If there is any inconsistency or conflict between the English and the Chinese versions, the English version shall prevail.
24 Corporate Structure25 Financial Highlights26 Chairman’s Statement28 CEO’s Report44 Major Property Projects in Hong Kong46 Major Property Projects in Mainland China48 Directors’ Profile57 Senior Management Profile58 Corporate Sustainability98 Corporate Governance Report122 Investor Relations124 Corporate Information125 Report of the Directors150 Management Discussion and Analysis161 Independent Auditor’s Report170 Consolidated Income Statement171 Consolidated Statement of Comprehensive Income172 Consolidated Statement of Financial Position174 Consolidated Statement of Changes in Equity178 Consolidated Statement of Cash Flows180 Notes to the Financial Statements299 Five-year Financial Summary301 Principal Projects Summary316 Glossary of Terms
Content


New World Development Company Limited4

2020年報 5

New World Development Company Limited6 Annual Report 2020 7

New World Development Company Limited8

Annual Report 2020 9

New World Development Company Limited10

Annual Report 2020 11

New World Development Company Limited12 Annual Report 2020 13

New World Development Company Limited14

Annual Report 2020 15

New World Development Company Limited16

Annual Report 2020 17

New World Development Company Limited18 Annual Report 2020 19

New World Development Company Limited20 Annual Report 2020 Annual Report 202021 22
1970 1978
Victoria Dockside
thanniversary
When Tsim Sha Tsui waterfront was still known as Holt’s Wharf in the early
20th century, it already played a pivotal role in the city’s rise to the busiest port
in the world, establishing Hong Kong’s reputation as the Gateway to the East.
In 1971, New World Development bought the site of Holt’s Wharf from Swire
Group and Blue Funnel Line. Following the opening of New World Centre in
1978, this area became a stronghold for international brands in the city and
hosted some of the most innovative “happenings” Hong Kong ever witnessed.
Forty years on, now as Victoria Dockside created by the cultural enterprise New
World Group, it is set to trigger a new wave of disruptions in design, the arts,
culture and sustainability. It will be the game-changer that will once again, break
through traditions to create a new paradigm for the world.

Annual Report 2020 23
Victoria DocksideA GAME-CHANGING GLOBAL ART AND DESIGN DISTRICT
Victoria Dockside is a 3 million-square-foot art and design district, and a US$2.6
billion redevelopment project on Hong Kong's iconic Tsim Sha Tsui waterfront
by New World Development. Fully opened in August 2019 after a 10-year
redevelopment, Victoria Dockside is now anchored by cultural-retail destination
K11 MUSEA, and is home to luxury residences and artisanal home K11 ARTUS,
next-generation workspace K11 ATELIER, and ultra-luxury hotel Rosewood Hong
Kong. The district is fringed by two redesigned public spaces Avenue of Stars and
Salisbury Garden to form a full waterfront community.
The history of this site dates back to 1910 when it was Hong Kong’s most important
freight and logistics hub Holt’s Wharf. In 1978, it was redeveloped into New World
Centre, Hong Kong’s first multiplex and a landmark that turned Tsim Sha Tsui into a
tourism and cultural hotspot. Victoria Dockside has been described by media outlets
as “Hong Kong’s most anticipated opening”.

New World Development Company Limited24
Corporate Structure
New World Group
* The percentage of interest held by the Group as at 30 June 2020
New World Development Company Limited( HK Stock Code: 0017 )
Property Development and Investment in Hong Kong
Roads
Construction
Aviation
Insurance
Property Development and Investmentin Mainland China
61%* 100%
NWS Holdings Limited( HK Stock Code: 0659 )
New World China Land Limited

Annual Report 2020 25
Financial Highlights
FY2020 FY2019HK$ m HK$ m
Revenues 59,007.8 76,763.6
Segment results(1) 13,918.7 19,977.8
Changes in fair value of and gain on transfer to investment properties 1,653.2 10,305.7
Underlying profit 6,588.9 8,814.1
Dividend per share (HK$)(2)
Interim 0.56 0.56
Final 1.48 1.48
Full-year 2.04 2.04
As at30 June
2020
As at30 June
2019HK$ m HK$ m
Total assets 600,195.9 503,284.9
Cash and bank balances (including restricted bank balances) 67,435.6 63,731.6
Undrawn facilities from banks 39,303.3 31,435.5
Net debt(3) 116,458.6 88,288.0
Net gearing ratio(4) (%) 41.6 32.1
RESULTS HIGHLIGHTS• Underlying profit amounted to HK$6,588.9 million notwithstanding a very challenging operating environment due
to social incidents in 1H FY2020 and COVID-19 in 2H FY2020• Maintain prevailing sustainable and progressive dividend policy• Robust 19% year-on-year growth in revenues of property investment segment of the Group following the
opening of K11 MUSEA and K11 ATELIER King’s Road in FY2020 despite rental concessions granted to tenants• High property development gross margin of 57% achieved in both Hong Kong and Mainland China, reflecting the
strong brand equity of the Group• Stringent cost control efforts evidenced by the 8% year-on-year decrease in recurring administrative and other
operating expenses• Non-core asset disposals amounted to approximately HK$10.6 billion in FY2020, exceeded target for the year,
will continue non-core assets disposal to unlock value and enhance asset portfolio
Remarks:
(1) Include share of results of joint ventures and associated companies, but exclude changes in fair value of and gain on transfer to investment
properties
(2) On 23 June 2020, every four issued shares of the Company were consolidated into one share of the Company (each a “Consolidated Share”)
and the number of Consolidated Shares was rounded down to the nearest whole number by disregarding each and every fractional Consolidated
Share which would otherwise arise (the “Share Consolidation”). The impact of share consolidation is reflected on the interim, final and full-year
dividend per share in FY2019 and the interim dividend per share in FY2020
(3) The aggregate of bank loans, other loans, fixed rate bonds and other borrowings less cash and bank balances
(4) Net debt divided by total equity

New World Development Company Limited26
Chairman’s Statement
The Group is fully confident in the development of the Nation and has a strategic focus on the Greater Bay Area.
By completing its unique ecosystem through its old city redevelopment projects in Mainland China and major projects and premium residences in Hong Kong, it promotes society development and enhances quality of life, creating more shared value for shareholders and the society.

Annual Report 2020 27
Chairman’s Statement
TO OUR SHAREHOLDERS
Xunzi, a thinker in the Warring States Period in China, once mentioned the importance of learning. In “Xunzi, An
Exhortation to Learning”, the gentleman says, “In learning there can be no respite.” Blue derives from indigo plant
yet it is bluer than the plant. Ice comes from water yet it is colder than water. Through steaming and bending, you
can make wood as straight as an ink-line into a wheel. And after its curve conforms to the compass, even when
parched under the sun it will never become straight again as the steaming and bending have made it a certain way.
Hence wood becomes straight when it comes under the ink-line, and metal becomes sharp when it is brought to the
whetstone. Likewise, the gentleman will become keen minded and his conduct will be without fault when he learns
extensively and examines himself thrice a day.
To gain a firm foothold in today’s fickle world, apart from a solid foundation, one must also have a humble attitude
and the courage to challenge, and keep learning and making progress.
2020 marks the 50th anniversary of the founding of New World Group. Since its founding in 1970, the Group has
been rooted in Hong Kong with the backing of the Nation, and has been through thick and thin during which it has
established milestones one after another through laying a solid foundation of core property business and constantly
pursing innovations and changes with a human-centric corporate philosophy and a dedicated team.
In the 1970s, the Group developed the New World Centre, the then new landmark in Hong Kong at the former site
of the Holt’s Wharf on the waterfront of Tsim Sha Tsui. It received wide popularity and brought fresh vibe to Tsim
Sha Tsui and became a cultural melting pot. Despite the passing of time and changes taken place in society and
culture, New World has always upheld its humility and remained focus, learnt trends through the tiniest details and
embraced innovation boldly on the foundation of its success in the property development market.
Half a century later, while preserving and inheriting the culture, we recreated the New World Centre. With a new
look and orientation towards the cultural tastes of the new generation, the brand-new and groundbreaking Victoria
Dockside has once again become a landmark of culture and arts in Hong Kong, reimagining different aspects of life
such as shopping, commerce, housing.
2020 is also the final year of the National 13th Five-Year Plan and the year designated to attain the well-rounded
goal of building a society of moderate prosperity. At the same time, the plan also demanded acceleration in the
development of the Guangdong-Hong Kong-Macao Greater Bay Area. Despite the threat posed by the epidemic,
the Group is fully confident in the development of the Nation. In recent years, it has increased its investments in the
Greater Bay Area. While strengthening the growth momentum of its business, the Group has been completing its
unique ecosystem by injecting art and cultural elements into its old city redevelopment projects in Mainland China
and major projects and premium residences in Hong Kong, in order to promote society development and enhance
quality of life, creating more shared value for shareholders and the society.
Dr. Cheng Kar-Shun, Henry
Chairman
Hong Kong, 30 September 2020

New World Development Company Limited28
CEO’s Report

Annual Report 2020 29
CEO’s Report
BUSINESS REVIEW
Hong Kong Property DevelopmentLast year, the COVID-19 outbreak overshadowed
Hong Kong’s economy which was already challenged
on multiple fronts. Nevertheless, under such tough
circumstances, the Hong Kong property development
market benefited from the strong pent-up demand
for local housing, the raise of mortgage cap under the
mortgage insurance, quantitative easing in the U.S. and
U.S. interest rate cut to near zero. Such factors, together
with tight land supply in Hong Kong, expedited home
buyers’ pace of home purchase and facilitated the stable
development of property market.
In FY2020, the Group’s revenues and segment results
of property development in Hong Kong, including joint
development projects, amounted to HK$4,541.9 million
and HK$2,592.1 million, respectively. The contributions
were attributable to residential projects including
MOUNT PAVILIA, The Masterpiece, FLEUR PAVILIA and
the Double Cove series.
Hong Kong Landbank Total Attributable GFAAs at 30 June 2020
Hong Kong Agricultural LandbankTotal Attributable Land AreaAs at 30 June 2020
Approximately 9,081,000 sq ft Approximately 16,509,000 sq ft
Hong Kong Island Yuen Long District andTuen Mun District
7%
11%
13%
69%
2%
32%
66%
New Territories Sha Tin District andTai Po District
Kowloon North District
Sai Kung District

New World Development Company Limited30
CEO’s Report
During the year under review, the Group’s attributable
c o n t r a c t e d s a l e s i n H o n g K o n g a m o u n t e d t o
HK$13,162.6 million. The attributable contracted sales
were contributed by residential projects including
MOUNT PAVILIA, FLEUR PAVILIA, ATRIUM HOUSE
and The Masterpiece.
The Group owns rare and superior saleable resources
in the market. Its key major residential project involving
more than 3,000 units at Tai Wai Station in Sha Tin,
Hong Kong will be launched in phases in 2020 and 2021.
Its first two phases, comprising a total of approximately
2,200 units, will be launched after the issue of pre-sale
consent, of which the pre-sale consent for the 783 units
of the project’s first phase has been obtained, garnering
extensive interests from the market. Furthermore, two
Grade A office projects in West Kowloon with a total
GFA of approximately 900,000 sq ft are also planned
to be launched in 2020 and 2021. In addition, as at 30
June 2020, the Group had a total of 144 residential units
available for sale in Hong Kong.
The Group has been actively reviewing its business and
asset portfolios, and works to identify opportunities of
non-core asset disposal to unlock values. During the
year under review, the Group completed the disposal of
non-core assets with total considerations over HK$10
billion, including two shopping malls located in Kowloon
Bay and Tseung Kwan O respectively, 45% interest in
a company that holds certain properties at Shun Tak
Centre in Sheung Wan, and the Group’s interest in
serviced apartment EIGHT KWAI FONG in Happy Valley
which was completed in 2015. Going forward, the Group
will remain focused on developing its core business and
optimise its businesses and assets through non-core
disposal which can provide more resources for its core
business continuously.
Annual Report 2020 31
CEO’s Report
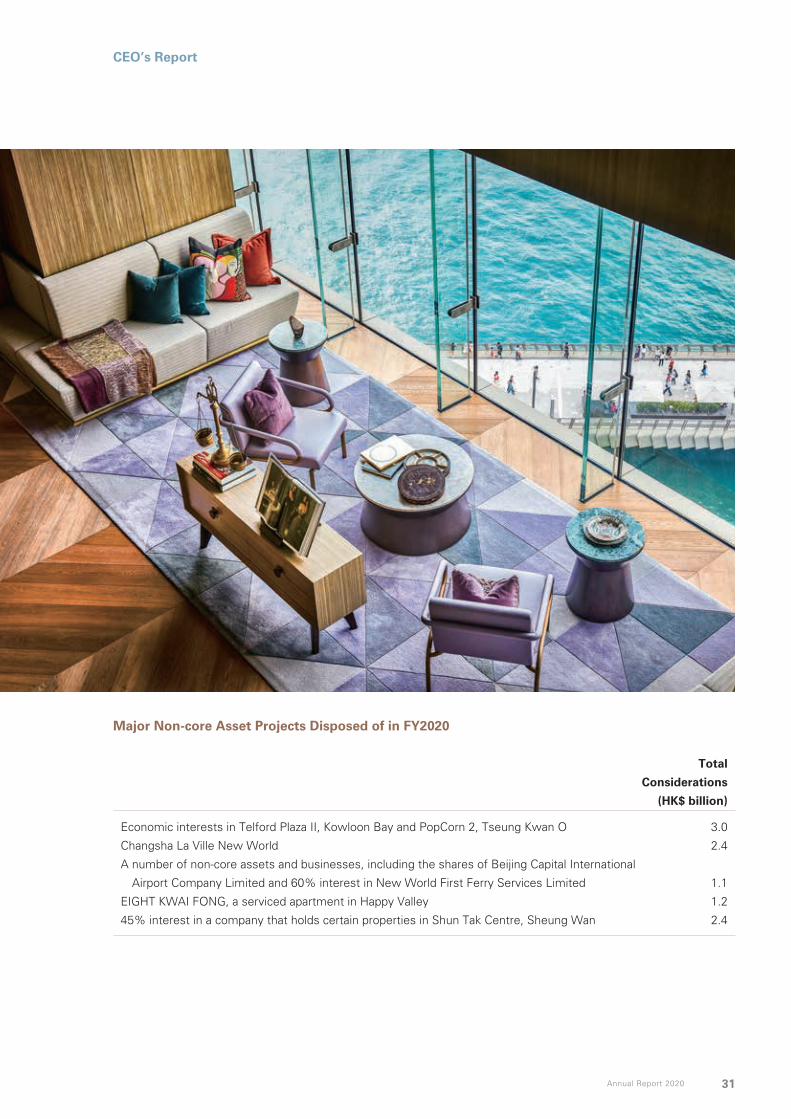
Major Non-core Asset Projects Disposed of in FY2020
Total
Considerations
(HK$ billion)
Economic interests in Telford Plaza II, Kowloon Bay and PopCorn 2, Tseung Kwan O 3.0
Changsha La Ville New World 2.4
A number of non-core assets and businesses, including the shares of Beijing Capital International
Airport Company Limited and 60% interest in New World First Ferry Services Limited 1.1
EIGHT KWAI FONG, a serviced apartment in Happy Valley 1.2
45% interest in a company that holds certain properties in Shun Tak Centre, Sheung Wan 2.4

New World Development Company Limited32
CEO’s Report
As at 30 June 2020, unrecognised attributable income
from contracted sales of properties in Hong Kong
amounted to HK$12,295.2 million, of which HK$7,029.2
million, HK$1,173.0 million and HK$4,093.0 million
were to be booked in FY2021, FY2022 and FY2024,
respectively. Key projects expected to be booked
in FY2021 include ATRIUM HOUSE in Yuen Long,
ARTISAN GARDEN in Ma Tau Kok and Reach Summit
in Yuen Long, and key project expected to be booked
in FY2022 includes TIMBER HOUSE in Ho Man Tin.
Among the projects mentioned, ARTISAN GARDEN and
TIMBER HOUSE were sold out and over 90% of the
units at ATRIUM HOUSE and Reach Summit were sold
already. Key projects expected to be booked in FY2024
include MOUNT PAVILIA and FLEUR PAVILIA.
Hong Kong Property Investment and OthersTension in international geopolitical relations prompted
enterpr ises to rev is i t the i r development p lans.
Meanwhile, the epidemic outbreak since early 2020
dealt a heavy blow to economy, forcing countries to
impose different levels of social distancing measures
to suppress the virus spread and leaving quite a few
businesses to suspend operations.
enticed many tenants for the advantages of newly
completed commercial buildings with reasonable rentals.
Meanwhile, the retail industry was hit hard by social
distancing measures, rising unemployment rate due to
corporate redundancy, as well as plummeting tourist
arrivals under travel restrictions. The impact was even
greater for shopping malls and brands targeting tourists.
In response, many landlords offered rental concessions
to support their tenants. Recently, Hong Kong has
witnessed an easing epidemic situation, as local
consumer sentiment gradually recovers with rebounding
footfall in shopping malls catering to local customers.
This has propped up the performance of retail and rental
properties.
During the year under review, the Group’s revenues
of property investment in Hong Kong amounted to
HK$2,590.5 million, representing an increase of 33%,
mainly due to a broader rental income base after the full
commencement of operation of its large-scale integrated
project Victoria Dockside in Tsim Sha Tsui, Kowloon and
the Grade A office building K11 ATELIER King’s Road in
Quarry Bay during the year under review.
Victoria Dockside, a new global landmark located in the
core area of Tsim Sha Tsui Waterfront in Kowloon, was
fully opened during the year under review. Created by
100 local and international creative powers, K11 MUSEA
formally commenced its operation as a new cultural
retail landmark in late August 2019, presenting brand
Affected by the epidemic, various sectors responded
to worsening market conditions with stricter cost
management, redundancies and office space downsizing,
which led to the shrinking demand for office space.
The significant rental climb over the years in traditional
business districts such as Central bore the brunt of
economic headwinds. Tenants reduced their rented
area or relocated to fringe areas, driving the vacancy
rate higher in Central. Nonetheless, owing to this trend
of decentralisation, West Kowloon and Island East have
Annual Report 2020 33
CEO’s Report
new museum-retail experience adored by the local
younger generation. Over 90% has been leased. Despite
the social events and epidemic situation in Hong Kong,
K11 MUSEA still recorded an average monthly footfall of
1.4 million, with a strong quarter-on-quarter rebound of
12% in footfall in the second quarter of 2020, marking
its success. As for Grade A office K11 ATELIER, about
80% has been rented out.
Adjacent to Quarry Bay MTR Station on Island East,
K11 ATELIER King’s Road is one of the first buildings
in the world to be awarded three platinum level green
and healthy building certifications, including the WELL
Certified™ Platinum, the LEED Platinum® and the BEAM
Plus New Buildings V1.2 Provisional Platinum. The Grade
A office building, with a total GFA of approximately
490,000 sq ft, commenced operation during the year
under review, currently around 50% has been leased.
The operation commencement of K11 MUSEA and K11
ATELIER King’s Road has brought about a total area
of more than 1.5 million sq ft to the Group’s property
investment flagships portfolio in Hong Kong. Both
property projects will provide full year contribution in
FY2021, with the remaining leasable area to generate
more growth momentum to the rental income which
has entered an acceleration stage.
Hong Kong LandbankLand supply is dwindling in Hong Kong. According to
the Land Sale Programme announced by the Hong
Kong Government, only 15 residential sites can be
launched in 2020, of which five are rolled over land
parcels, to provide only 7,530 flats, together with
only six commercial sites amounting to a total GFA of
approximately 830,000 sq ft. The Government works
to promote a multifaceted land policy, such as Land
Sharing Pilot Scheme and New Development Areas. The
Group is carefully studying relevant policies to pursue
suitable land and continuously provide quality resources
for the long-term development of its core business.
On the other hand, the Group made use of diversified
channels to replenish its landbank, by participating
in public tenders, actively undertaking old building
acquisitions and farmland conversions in order to provide
sustainable development resources for its core business.
In August 2020, State Theatre Building, a residential
and commercial property located at 277–291 King’s
Road, North Point, which the Group’s non-wholly owned
subsidiary holds over 90% ownership, was approved
for a compulsory sale by the Lands Tribunal. The project
covers a site area of approximately 36,000 sq ft.
As at 30 June 2020, the Group had a landbank with a
total attributable GFA of approximately 9.08 million sq
ft in Hong Kong available for immediate development,
of which approximately 4.21 mil l ion sq ft was for
property development use. Meanwhile, the Group had
an agricultural landbank with a total attributable land area
of approximately 16.51 million sq ft pending land use
conversion.
Eight projects with a total GFA of approximately 1.8
mill ion sq ft located in Yuen Long and Fanling are
under active negotiation with the authority on land use
conversion, of which a total GFA of approximately 0.5
million sq ft has entered the final stages.
Rooted in Hong Kong, the Group takes driving social
advancement and contributing to Hong Kong’s long-term
development as an important part of its vision of creating
shared value. Hence, the Group is actively partnering
with social enterprises to develop transitional social
housing, to provide appropriate assistance to families in
need of housing in Hong Kong.
New World Development Company Limited34
CEO’s Report
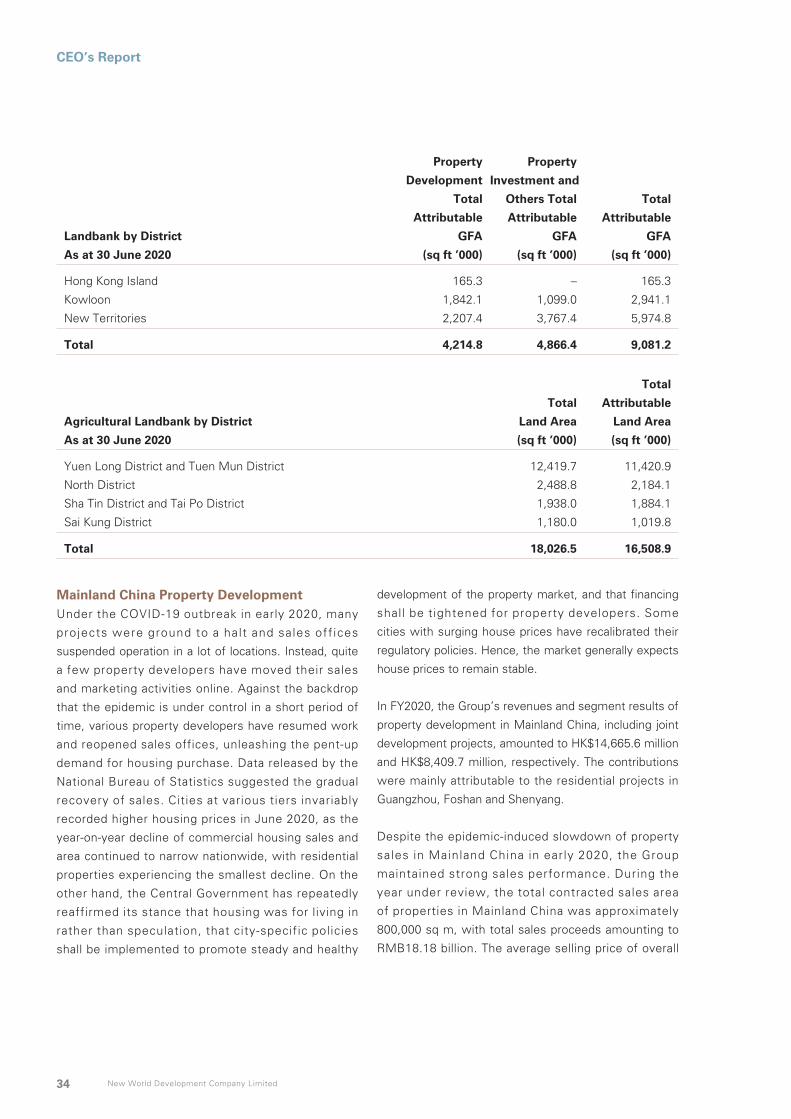
Landbank by District
Property
Development
Total
Attributable
GFA
Property
Investment and
Others Total
Attributable
GFA
Total
Attributable
GFA
As at 30 June 2020 (sq ft ’000) (sq ft ’000) (sq ft ’000)
Hong Kong Island 165.3 – 165.3
Kowloon 1,842.1 1,099.0 2,941.1
New Territories 2,207.4 3,767.4 5,974.8
Total 4,214.8 4,866.4 9,081.2
Agricultural Landbank by District
Total
Land Area
Total
Attributable
Land Area
As at 30 June 2020 (sq ft ’000) (sq ft ’000)
Yuen Long District and Tuen Mun District 12,419.7 11,420.9
North District 2,488.8 2,184.1
Sha Tin District and Tai Po District 1,938.0 1,884.1
Sai Kung District 1,180.0 1,019.8
Total 18,026.5 16,508.9
Mainland China Property DevelopmentUnder the COVID-19 outbreak in early 2020, many
projects were ground to a halt and sales off ices
suspended operation in a lot of locations. Instead, quite
a few property developers have moved their sales
and marketing activities online. Against the backdrop
that the epidemic is under control in a short period of
time, various property developers have resumed work
and reopened sales offices, unleashing the pent-up
demand for housing purchase. Data released by the
National Bureau of Statistics suggested the gradual
recovery of sales. Cities at various tiers invariably
recorded higher housing prices in June 2020, as the
year-on-year decline of commercial housing sales and
area continued to narrow nationwide, with residential
properties experiencing the smallest decline. On the
other hand, the Central Government has repeatedly
reaffirmed its stance that housing was for living in
rather than speculation, that city-specific policies
shall be implemented to promote steady and healthy
development of the property market, and that financing
shall be tightened for property developers. Some
cities with surging house prices have recalibrated their
regulatory policies. Hence, the market generally expects
house prices to remain stable.
In FY2020, the Group’s revenues and segment results of
property development in Mainland China, including joint
development projects, amounted to HK$14,665.6 million
and HK$8,409.7 million, respectively. The contributions
were mainly attributable to the residential projects in
Guangzhou, Foshan and Shenyang.
Despite the epidemic-induced slowdown of property
sales in Mainland China in early 2020, the Group
maintained strong sales performance. During the
year under review, the total contracted sales area
of properties in Mainland China was approximately
800,000 sq m, with total sales proceeds amounting to
RMB18.18 billion. The average selling price of overall

Annual Report 2020 35
CEO’s Report
residential contracted sales exceeded RMB38,000 per
sq m. As for the geographical distribution of contracted
sales proceeds, Southern region led by the Greater Bay
Area was the largest contributor, accounting for over
60%, followed by North-eastern and Central regions
which accounted for 16% and 14%, respectively.
Contribution was mainly delivered by sales of residential
projects in the Greater Bay Area, including Shenzhen
Prince Bay BAYHOUSE, Guangzhou Park Paradise and
Guangzhou Covent Garden. For the Shenzhen Prince
Bay BAYHOUSE project, the Group staged an innovative
move by launching online sales services during the
epidemic period, delivering desirable sales results.
FY2020
Residential
Contracted Sales
Non-residential
Contracted Sales
Area Proceeds Area Proceeds
Region (sq m ’000) (RMB m) (sq m ’000) (RMB m)
Southern Region (i.e. the Greater Bay Area) 120.3 6,089.2 110.6 5,270.3
Central Region 370.1 2,530.7 4.9 19.2
Eastern Region 11.1 534.2 – –
Northern Region 17.2 225.4 16.4 590.9
North-eastern Region 74.2 2,008.1 78.4 912.2
Total 592.9 11,387.6 210.3 6,792.6
On the other hand, the Group continued with its
strategy to dispose of non-core assets. In September
2019, the Group entered into an agreement to dispose
of the entire interest in Hunan Success New Century
Investment Company Limited at the consideration of
RMB2,185 million subject to the terms and conditions
contained therein. The asset of this company is
Changsha La Ville New World. The disposal enables the
Group to realise cash resources and unlock asset value
at fair market value.
As of 30 June 2020, the Group’s unrecognised gross
income from contracted sales of properties in Mainland
China amounted to RMB9,129.1 mill ion, of which
RMB4,985.9 million was to be booked in FY2021 and
RMB4,143.2 million to be booked in FY2022.
During the year under review, the total area of projects
completed in Mainland China (excluding carpark)
amounted to approximately 400,000 sq m, which was
mainly located in the Greater Bay Area and Shenyang.
The area of completion is expected to reach 1.37 million
sq m in FY2021.

New World Development Company Limited36
CEO’s Report
FY2020 Project Completion in Mainland China – Property Development
Region Project/Total GFA (sq m) Residential Commercial
Total
(excluding
carpark)
Total
(including
carpark)
Guangzhou Guangzhou Park Paradise District 5 Land No. 2 – 2,920 2,920 2,920
Foshan Guangzhou Foshan Canton First Estate CF30 21,325 – 21,325 21,325
Guangzhou Foshan Canton First Estate CF31 44,020 – 44,020 44,020
Wuhan Wuhan New World • Times Site B 55,073 – 55,073 114,229
Shenyang Shenyang New World Garden Phase 2E Building 14 55,235 – 55,235 55,235
Anshan Anshan New World Garden Phase 1B2 60,438 7,573 68,011 68,011
Total 236,091 10,493 246,584 305,740
FY2020 Project Completion in Mainland China – Property Investment, Hotel and Others
Region Project/Total GFA (sq m) Commercial Hotel
Total
(excluding
carpark)
Total
(including
carpark)
Guangzhou Guangzhou Park Paradise District 5 Land No. 1 22,763 – 22,763 35,365
KHOS Guangzhou 6,787 53,594 60,381 80,672
Shenyang Shenyang New World Garden Phase 2E – – – 40,878
KHOS Shenyang – 69,751 69,751 69,751
Anshan Anshan New World Garden Phase 1B2 – – – 18,316
Total 29,550 123,345 152,895 244,982

Annual Report 2020 37
CEO’s Report
FY2021 Project Completion Plan in Mainland China – Property Development
Region Project/Total GFA (sq m) Residential Apartment Commercial Office
Total
(excluding
carpark)
Total
(including
carpark)
Guangzhou Guangzhou Park Paradise
District 3 Batch B
42,586 – – – 42,586 48,388
Foshan Guangzhou Foshan Canton First
Estate CF27B
30,210 – – – 30,210 30,210
Guangzhou Foshan Canton First
Estate CF07
4,328 – – – 4,328 4,328
Guangzhou Foshan Canton First
Estate CF19C
59,860 – – – 59,860 63,560
Shenzhen Prince Bay Land DY02-02 – – – 54,789 54,789 54,789
Prince Bay Land DY02-04 – 55,000 – – 55,000 55,000
Ningbo Ningbo New World Plaza Land No. 7-10 137,652 – 25,973 – 163,625 269,790
Ningbo New World Plaza Land No. 11 – – 9,702 57,055 66,757 90,010
Ningbo New World Plaza Land No. 12 – – 8,085 12,331 20,416 52,900
Ningbo New World Plaza Land No. 5 – – 1,400 85,306 86,706 128,198
Beijing Beijing New View Commercial Centre – – 9,063 12,231 21,294 25,367
Shenyang Shenyang New World Centre – SA1 – 107,589 – – 107,589 107,589
Shenyang New World Centre – SA2 – 104,142 – – 104,142 104,142
Shenyang New World Centre – SA3 – 75,354 – – 75,354 75,354
Shenyang New World Garden
Phase 2C – 1
108,954 – – – 108,954 108,954
Anshan Anshan New World Garden Phase 1B3 91,830 – 14,358 – 106,188 133,636
Anshan New World • The Grandiose
Phase 1B1
9,297 – – – 9,297 9,297
Anshan New World • The Grandiose
Phase 1B2
19,367 – – – 19,367 19,367
Total 504,084 342,085 68,581 221,712 1,136,462 1,380,879
FY2021 Project Completion Plan in Mainland China – Property Investment, Hotel and Others
Region Project/Total GFA (sq m) Commercial Office Hotel
Total
(excluding
carpark)
Total
(including
carpark)
Shenzhen Prince Bay Land DY02-02 25,000 – – 25,000 58,857
Prince Bay Land DY02-04 24,840 – – 24,840 64,642
Ningbo Ningbo New World Plaza Land No. 5 – – 41,269 41,269 41,269
Wuhan Wuhan New World Centre Phase 3 – Wuhan K11 32,294 59,434 – 91,728 140,969
Shenyang Shenyang New World Garden Phase 2C – 1 21,160 – – 21,160 21,160
pentahotel Shenyang – – 29,924 29,924 29,924
Total 103,294 59,434 71,193 233,921 356,821

New World Development Company Limited38
CEO’s Report
Mainland China Property Investment and OthersFor the purpose of containing the spread of the
epidemic, the Central Government promptly adopted
prevention and control measures to various degrees,
including closure of some venues and suspension of
work and classes to avoid crowding. The resulting
decline in footfall and even suspension of operation
in shopping malls led commercial property owners to
shift parts of their business online, where marketing
took place in the form of live broadcast to stimulate
consumption desire and maintain customer loyalty.
Shopping malls saw a gradual uptick in footfall after
reopened in various places.
The Group’s unique brand K11 has also taken the
initiative to develop a new digital operation model
by launching the online membership WeChat mini
programme “K11 GO”. The programme engages
over 100 tenant brands under K11 nationwide, which
collaborated with the K11 operations team to host
a number of live broadcast events to diversify sales
channels. In the meantime, the Group fully capitalised
on its unique ecosystem and presence in both Mainland
China and Hong Kong, to provide mainland consumers
with one-stop cross-border shopping experience of Hong
Kong products via the WeChat mini programme “Hong
Kong K11 × Shop Express”.
In FY2020, the Group’s revenues of property investment
in Mainland China amounted to HK$1,759.0 million,
representing a 2% increase mainly due to full-year
contribution from Guangzhou New World • NEW PARK,
which opened at the end of December in 2018 and the
increase in average rent of Shenyang K11, whereas
major projects in the Group’s investment properties
portfolio recorded solid performance in overall occupancy
rate.
Wuhan K11, the Group’s second shopping mall project in
Wuhan, is scheduled to commence operation in phases
starting from the end of 2020. The project covers a
total area of approximately 240,000 sq m, including an
83,000 sq m art mall, a 56,000 sq m K11 ATELIER office
building and 11th Avenue, K11’s first outdoor block for
leisure and downshifting, which renews its leadership in
the retail consumer market of Central China.
Being an active investor on the Mainland and a creator
of new consumption and office models, the Group will
have a series of K11 and D • PARK commercial projects
complete construction and commence operation
successively. Among them are a number of key projects
in the Greater Bay Area, such as Prince Bay and Qianhai
in Shenzhen as well as Panyu in Guangzhou, which will
broaden the Group’s recurring rental income base and
consolidate its development in the Greater Bay Area.
Mainland China LandbankIn the Report on the Work of the Government, the
Central Government mentioned development initiatives
such as promoting new urbanisation and urban renewal,
and fast-tracking regional development strategies such
as the Guangdong-Hong Kong-Macao Greater Bay Area,
integration of the Yangtze River Delta and coordinated
development of the Beij ing-Tianjin-Hebei Region.
Following the acceleration of new urbanisation and
regional development, population movement has further
gravitated towards core cities in metropolitan areas,
such as Guangzhou and Shenzhen in the Greater Bay
Area. This has ramped up local housing demand, albeit
in tandem with sluggish land supply in these core areas.
Hence, urban renewal plays an important role by offering
mainly residential land at reasonable cost in prime
locations.
With strategic coverage in key cities of the Greater Bay
Area and other metropolitan areas in Mainland China,
the Group relied on its superior brand and seasoned
professional team to obtain or jointly develop premium
land parcels and projects in Guangzhou and Shenzhen,
the hearts of the Greater Bay Area, celebrating fruitful
results. Currently, landbank in the Greater Bay Area
accounts for half of the Group’s core landbank in
Mainland China.
The Group stands out as the most active Hong Kong
developer in the market of old city redevelopment in
Mainland China which was traditionally dominated
by Main land property g iants. In June 2020, the
Group renewed its presence in Zengcheng District
of Guangzhou as it became the intended cooperative
enterprise for Xiajie Village in Licheng Street, following
the remodelling project of Economic Belt at Man Kam To

Annual Report 2020 39
CEO’s Report
Crossing in Lo Wu District of Shenzhen, the Xili Project
in Nanshan District of Shenzhen, the Shancun Project
in Liwan District of Guangzhou, the Nanji Village Project
in Haizhu District of Guangzhou, and the Tagang Village
Project in Zengcheng District of Guangzhou. Located in
downtown Zengcheng, the new project is designated
as the future district public service centre with a total
area of over one million sq m after redevelopment.
The project will develop into an integrated residential
and industrial zone that accommodates quality living,
business office, distinctive commerce and top class
hotel. The above old city redevelopment projects
are expected to be included in the Group’s landbank
successively starting in 2022, which will significantly
boost its sustainable development resources.
The Group has a wide range of channels to expand its
landbank. In addition to old city redevelopment, land
is also acquired through public auction and tender and
cooperation with different enterprises. In September
2019, the Group obtained the Tagang Village Project on
Yongning Street in Zengcheng District of Guangzhou
with the reserve price of RMB3.4 billion. The project
covers a total GFA of over 320,000 sq m in Zengcheng
Economic and Technological Development Zone, an
important node of the Guangzhou-Shenzhen Science
and Technology Innovation Corridor. The Zone features
a cluster of new infrastructure industries such as new
energy vehicles, IT and fintech, presenting tremendous
development potential for the future.
Other than the Greater Bay Area, the Group has also
extended its coverage to Ningbo and Hangzhou in the
Yangtze River Delta as well as its central city Shanghai,
in an effort to complete the Group’s strategic layout
in Eastern China and make it another growth driver
besides the Guangdong-Hong Kong-Macao Greater Bay
Area. In July 2019, the Group acquired the remaining
51% interest in the commercial and residential complex
project Ningbo New World. Meanwhile, the Group
also successfully acquired a land parcel for commercial
and residential purpose in Wangjiang New Town,
Shangcheng District, Hangzhou with a total GFA of
more than 450,000 sq m through public tender. The
land parcel is planned to develop into a large-scale urban
complex integrating commerce, office and residential
buildings and hotels, where K11 Art Mall and Rosewood
Hotel will be introduced for the first time in Hangzhou.
In August 2020, the Group successfully acquired a
land parcel in Huaihai Middle Road of Huangpu District,
Shanghai with approximately RMB4.1 billion. Covering
a total GFA of approximately 130,000 sq m, the project
sits at the heart of the Huaihai Middle Road Business
District and constitutes the first land parcel launched
in Huaihai Road in more than two decades. The project
is designed to be a high-end commercial complex that
embodies both artistry and modernity.
As at 30 June 2020, the Group had a landbank (excluding
carpark) with a total GFA of approximately 6.48 million
sq m available for immediate development in Mainland
China, of which approximately 3.39 million sq m was for
residential use. In particular, core property development
projects were primarily located in Guangzhou, Shenzhen,
Foshan, Wuhan, Ningbo, Hangzhou, Bei j ing and
Shenyang, constituting a landbank (excluding carpark)
with a total GFA of approximately 5.71 million sq m, of
which 50% was located in the Greater Bay Area and
approximately 1.84 million sq m was for residential use.
New World Development Company Limited40
CEO’s Report
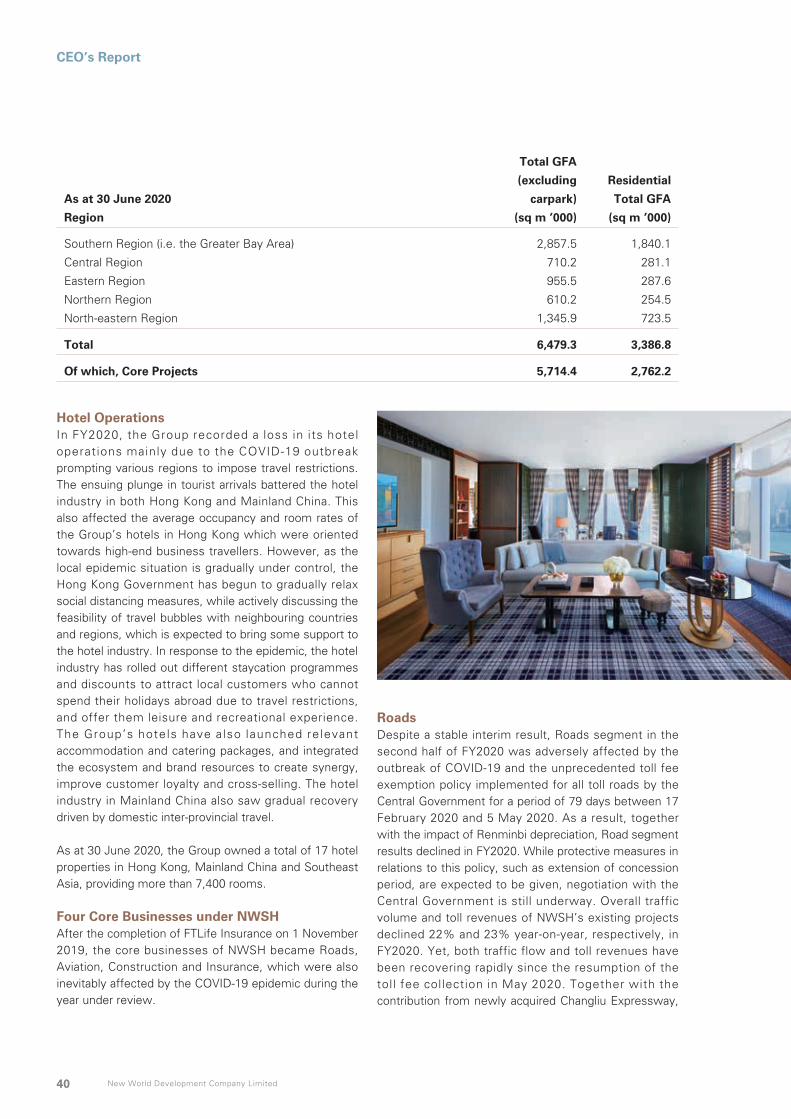
As at 30 June 2020
Total GFA
(excluding
carpark)
Residential
Total GFA
Region (sq m ’000) (sq m ’000)
Southern Region (i.e. the Greater Bay Area) 2,857.5 1,840.1
Central Region 710.2 281.1
Eastern Region 955.5 287.6
Northern Region 610.2 254.5
North-eastern Region 1,345.9 723.5
Total 6,479.3 3,386.8
Of which, Core Projects 5,714.4 2,762.2
Hotel OperationsIn FY2020, the Group recorded a loss in its hotel operations mainly due to the COVID-19 outbreak prompting various regions to impose travel restrictions. The ensuing plunge in tourist arrivals battered the hotel industry in both Hong Kong and Mainland China. This also affected the average occupancy and room rates of the Group’s hotels in Hong Kong which were oriented towards high-end business travellers. However, as the local epidemic situation is gradually under control, the Hong Kong Government has begun to gradually relax social distancing measures, while actively discussing the feasibility of travel bubbles with neighbouring countries and regions, which is expected to bring some support to the hotel industry. In response to the epidemic, the hotel industry has rolled out different staycation programmes and discounts to attract local customers who cannot spend their holidays abroad due to travel restrictions, and offer them leisure and recreational experience. The Group’s hotels have also launched relevant accommodation and catering packages, and integrated the ecosystem and brand resources to create synergy, improve customer loyalty and cross-selling. The hotel industry in Mainland China also saw gradual recovery driven by domestic inter-provincial travel.
As at 30 June 2020, the Group owned a total of 17 hotel properties in Hong Kong, Mainland China and Southeast Asia, providing more than 7,400 rooms.
Four Core Businesses under NWSHAfter the completion of FTLife Insurance on 1 November 2019, the core businesses of NWSH became Roads, Aviation, Construction and Insurance, which were also inevitably affected by the COVID-19 epidemic during the year under review.
RoadsDespite a stable interim result, Roads segment in the second half of FY2020 was adversely affected by the outbreak of COVID-19 and the unprecedented toll fee exemption policy implemented for all toll roads by the Central Government for a period of 79 days between 17 February 2020 and 5 May 2020. As a result, together with the impact of Renminbi depreciation, Road segment results declined in FY2020. While protective measures in relations to this policy, such as extension of concession period, are expected to be given, negotiation with the Central Government is still underway. Overall traffic volume and toll revenues of NWSH’s existing projects declined 22% and 23% year-on-year, respectively, in FY2020. Yet, both traffic flow and toll revenues have been recovering rapidly since the resumption of the toll fee collection in May 2020. Together with the contribution from newly acquired Changliu Expressway,

Annual Report 2020 41
CEO’s Report
June 2020’s overall traffic volume of the NWSH’s roads portfolio grew approximately 3% year-on-year with toll fee income of the portfolio almost reaching the same level as the month of December 2019.
The four anchor expressways, including Hangzhou Ring Road, Tangjin Expressway (Tianjin North Section), Guangzhou City Northern Ring Road and Beijing-Zhuhai Expressway (Guangzhou-Zhuhai Section) collectively contributed over 80% for the Roads segment. While the traffic flow during FY2020 was hit by the outbreak of COVID-19, Beijing-Zhuhai Expressway (Guangzhou-Zhuhai Section) was further impacted by the traffic diversion of Nansha Bridge and prohibition of certain types of large size vehicles using Humen Bridge. In June 2020, excluding Beijing-Zhuhai Expressway (Guangzhou-Zhuhai Section), the overall traffic volume for the other three expressways resumed to a growth of close to 1% year-on-year. As for the three expressways in Central China acquired in recent years, namely Suiyuenan Expressway (acquired in January 2018), Sui-Yue Expressway (acquired in December 2018) and Changliu Expressway (acquired in July 2019), aggregately contributed approximately HK$100 million in FY2020.
AviationAviation segment principally engages in commercial aircraft leasing business through NWSH’s full service leasing platform Goshawk Aviation Limited (“Goshawk”) after the divestment of the remaining interest in Beijing Capital International Airport Co., Ltd. (“BCIA”).
In FY2020, Aviation segment results declined. In addition to the absence of dividend income from BCIA, less gain was recorded from aircraft trading in FY2020 given the current market condition.
As at 30 June 2020, together with the direct orders of 40 narrow-body aircraft delivering in 2023-2025 from the two major aircraft manufacturers, the number of aircraft owned, managed and committed by Goshawk increased from 223 as at 30 June 2019 to 233, with combined appraised value amounted to approximately US$11.7 bil l ion. Goshawk continues to be a global leading commercial aircraft lessor in terms of fleet value with one of the youngest fleet and one of the longest average remaining lease term in the industry. The 162 aircraft on book, which increased from 154 as at 30 June 2019, has an average age of 4.4 years and an average remaining lease term of 6.3 years.
Given the diversified portfolio that comprises of 62 airlines in 35 countries, as well as stringent measures on
risk management, including but not limited to maintaining an appropriate mix of aircraft assets, monitoring lessees’ operational and financial performance for prompt risk identification, and engaging lessees proactively on collection issues/lease restructuring with necessary and adequate actions taken, risks arising from COVID-19 outbreak have been well-managed. The collection rate from airline customers during the first half of year 2020 was 78%.
ConstructionConstruction segment results decreased, mainly due to challenging business environment and rising competit ion. As at 30 June 2020, gross value of contracts on hand of the Construction segment edged down 5% to approximately HK$52.6 billion, while the remaining works to be completed decreased HK$5.5 billion to HK$36.1 billion. About 62% of the remaining works to be completed are from private sector that includes both commercial and residential projects, and the remaining 38% are government and institutional related projects. New projects contracted in FY2020 amounted to approximately HK$8.8 bil l ion, which included but not limited to, the commercial development in Kai Tak Area, the office development at Murray Road and foundation works for public housing development at Long Bin Phase 1, Yuen Long and at Ko Chiu Road, Yau Tong.
InsuranceThe acquisition of FTLife Insurance by NWSH was completed on 1 November 2019, marking NWSH’s important step in entering the insurance industry. Eight-month segment results amounted to HK$819.2 million was recorded subsequent to the completion of acquisition. During the year under review, while bus iness f rom Ma in land Ch inese V is i to rs was severely impacted by the border closure and epidemic containment measures, sales targeting the Hong Kong market remained resilient and well-supported by new products, such as Voluntary Health Insurance Scheme, Qualifying Deferred Annuity Policy, Reward Pro, Fortune Saver, Regent Prime and Regent El ite insurance products. With the early signs of positive contribution from the synergies and support from the Group, Annual Premium Equivalent (“APE”) dropped 12% year-on-year in the first half of year 2020, outperforming Hong Kong overall industry’s drop of 44%. Agency business and partnership contributed 51% and 49% of FTLife Insurance’s total APE respectively. Total gross written premium grew 19% and Value of New Business (“VONB”) margin, representing VONB as a percentage of APE, was 22% in the first half of year 2020.

New World Development Company Limited42
CEO’s Report
Despite industry-wide disruptions and a persistently low interest rate environment, FTLife Insurance’s financial position remains sound. As at 30 June 2020, solvency ratio was 542%, which is well above the minimum regulatory requirement of 150%. Embedded value was HK$17.7 billion, compared to HK$17.3 billion as at 31 December 2019. Total asset value and net asset value (excluding the goodwill arising from business combination) were HK$69.5 billion and HK$18.0 billion, respectively.
OUTLOOK
Last year, the global economy was battered by a host of factors such as U.S.– China tensions, geopolitics and the COVID-19 epidemic. Countries plunged into economic recession and many businesses resorted to downsizing to cut costs. Some even closed down or went bankrupt. Soaring unemployment rates and shrinking consumption forced governments to launch different economic relief initiatives to support corporate operation and safeguard people’s livelihood.
Even as countr ies devoted massive amounts of manpower and material in a race against t ime to develop vaccines, the pandemic sustained its sprawling spread, prompting governments of various localities to adopt stringent social distancing measures and travel restrictions. This exerted varying degrees of impact on different sectors, with those centred on tourists, including retai l , hospital ity and aviation, mired in predicament. Such impact also extended to the relevant operations of the Group. Nevertheless, as a constant advocate of creating shared value, the Group took the initiative to shoulder its social responsibility by offering tenants rental concessions to weather the difficult times together.
Looking ahead, the uncertainties and negative factors are expected to linger, as market sentiments remain dominated by the ebb and flow of U.S.– China relations and the evolving pandemic. Given the unpredictability of when these factors will subside, New World Group will actively examine its development directions and market conditions, leverage its edge and extensive resources under the prevailing development strategy, and proactively identify areas of breakthrough to turn crises into opportunities and create growth opportunities in adverse conditions.
Owning a portfolio of premium saleable resources in Hong Kong and Mainland China, the Group plans to launch its key residential project by phase at Tai Wai MTR Station in Sha Tin, Hong Kong that involves over 3,000 residential units, as well as its Grade A office projects in Cheung Shun Street and Wing Hong Street in West Kowloon. Phases 1 and 2 of the Tai Wai Station project are well poised to be launched and will make its debut upon the issue of pre-sale consent. Shenzhen Prince Bay BAYHOUSE, a commercial apartment project located at Prince Bay of Shenzhen in the heart of the Greater Bay Area, attained stellar sales results through online sales services during the epidemic, showcasing the Group’s product quality, sales execution and innovation capabilities. In FY2021, the Group will successively launch its Zengcheng Comprehensive Development Project in the eastern transport hub of Zengcheng District of Guangzhou which will extend the exceptional results of the Prince Bay Project.
Through act ive disposal of non-core assets and businesses, the Group concentrates on developing its core business, continuously optimising its asset portfolio and returns, enhancing corporate efficiency and creating more value for shareholders. Following its disposal of non-core assets worth over HK$10 billion in FY2020, the Group has an excess of HK$13 to HK$15 billion of assets available for disposal in FY2021, which will generate extra cash flow to support its core business development.
Annual Report 2020 43
CEO’s Report
The new cultural retail landmark K11 MUSEA in Victoria Dockside of Tsim Sha Tsui Waterfront and K11 ATELIER King’s Road, a Grade A office project adjacent to Quarry Bay MTR Station in Island East Business District commenced operation in FY2020, which enhanced the Group’s investment property portfolio and brought about an additional area of more than 1.5 million sq ft. Both projects will make full year contribution in FY2021, marking the harvest period of growth in recurring rental income that the Group is entering. In the future, the Group will see the successive completion of investment property projects such as Hong Kong SKYCITY, as well as a pipeline of K11 projects in the Greater Bay Area and in key cities of Mainland China. Such completion will add about five million sq ft to the area of investment property portfolio in Hong Kong, and offer an impressive boost of more than 10 million sq ft to the area of investment property portfolio in Mainland China, thereby elevating the Group’s recurring income and providing more stable growth momentum to its business performance.
Dedicated to its development in key cities of the Greater Bay Area and other metropolitan areas, the Group has been an early mover with strategic presence in cities such as Guangzhou and Shenzhen. Through old city redevelopment, the Group can secure land at prime locations at more reasonable costs, whilst improving the experience of life for local citizens. Leveraging an outstanding team with extensive experience, the Group managed to become the most active Hong Kong developer in the old city redevelopment market with a proven track record. As of this fiscal year, the Group became the intended cooperative enterprise of six old city redevelopment projects across the Greater Bay Area, the land of which will be successively included in the landbank from 2022 onwards, to offer a continuous stream of saleable resources to propel the Group’s development in the Greater Bay Area.
Having completed the acquisition of FTLife Insurance during this fiscal year, NWSH has been providing steady cash flow to the Group with their four core businesses including Roads, Aviation, Construction and Insurance. NWSH, boasting ample resource and adequate financing capability, has been executing the Group’s strategy of non-core assets disposal to inject momentum into its core business. Stepping into FY2021, NWSH already successfully disposed of its entire interest in New World First Bus Services Limited and Citybus Limited, at the consideration of HK$3.2 billion, as an extension of the Group’s strategy to sell non-core assets.
Financially strong and healthy, the Group had total capital resources of approximately HK$106.7 billion as at 30 June 2020, including approximately HK$67.4 billion of cash and bank balances (including restricted bank balances) and approximately HK$39.3 billion of undrawn facilities from banks. The Group manages cash flow in an active and prudent manner, and works to attain higher cost efficiency, diversify financing channels, balance risks and lower operating costs. As a result, its recurring administrative and other operating expenses declined by approximately 8% during the year under review. All refinancing of borrowings due in FY2021 has been taken care of. In the foreseeable future, equity raising is not necessary for the Company.
Rooted in Hong Kong and Greater China for five decades, the Group has surmounted numerous challenges and difficulties with well-established foundation and innovative thinking. Confronted with prevailing adversity, the Group shares the weal and woe with society and stakeholders via a number of social projects, including partnering with social enterprises to develop transitional homes for citizens in need of housing. The Group also tapped into its talents and technology to produce medical masks and distribute them to the public via “Mask To Go” dispensers, with a view to giving back to society through its strengths and technology. Confident that Hong Kong is bound to pull through and regain its former glory, the Group will remain committed to Hong Kong, engage in the Greater Bay Area and employ innovative and sustainable means to drive its growth, creating more shared value to shareholders and society at large.
Dr. Cheng Chi-Kong, AdrianExecutive Vice-chairman and Chief Executive OfficerHong Kong, 30 September 2020

New World Development Company Limited44 Annual Report 2020 45
Major Property Projects in Hong Kong
Major Property Projects in Hong Kong
4
16
17
18141311
1015
16
5
12
19
1
39
6
87
2
11819
23
24 5
8
6
73
12
17
14 21
11
22
910
13
15
20
New Territories
Lantau IslandHong Kong Island
Kowloon
1 4A-4P Seymour Road, Mid-levels
2 ARTISAN GARDEN, 68 Kowloon City Road, Ma Tau Kok
3 TIMBER HOUSE, 74 Waterloo Road, Ho Man Tin
4 New Kowloon Inland Lot No. 6582, Cheung Shun Street, Cheung Sha Wan
5 New Kowloon Inland Lot No. 6572, Wing Hong Street, Cheung Sha Wan
6 New Kowloon Inland Lot No. 6574, 4B3, Kai Tak
7 New Kowloon Inland Lot No. 6552, 4C2, Kai Tak
8 New Kowloon Inland Lot No. 6576, 4B1, Kai Tak
9 Yau Tong Redevelopment Project, Kowloon East
10 Reach Summit, Sereno Verde Phase 5, 99A Tai Tong Road, Yuen Long
11 ATRIUM HOUSE, 99 Shap Pat Heung Road, Yuen Long
12 Tai Wai Station Property Development, STTL No. 520, Sha Tin
13 Lung Tin Tsuen (Phase 2), Yuen Long
14 Lung Tin Tsuen (Phase 4), Yuen Long
15 Tong Yan San Tsuen (Phase 3), Yuen Long
16 Tong Yan San Tsuen (Phase 4), Yuen Long
17 Sha Po North (Phase 2), Yuen Long
18 DD110, Kam Tin, Yuen Long
19 DD221, Sha Ha, Sai Kung
1 Manning House, Central
2 New World Tower, Central
3 K11 ATELIER King’s Road, North Point
4 Hong Kong Convention and Exhibition Centre, Shopping Arcade, Wan Chai
5 Grand Hyatt Hong Kong
6 Renaissance Harbour View Hotel
7 Pearl City, Causeway Bay
8 Methodist House, Wan Chai
9 K11 ATELIER of Victoria Dockside, Tsim Sha Tsui Rosewood Hong Kong & Residences of Victoria Dockside,
Tsim Sha Tsui K11 ARTUS of Victoria Dockside, Tsim Sha Tsui K11 MUSEA of Victoria Dockside, Tsim Sha Tsui
10 K11, Tsim Sha Tsui Hyatt Regency Hong Kong, Tsim Sha Tsui
11 pentahotel Hong Kong, Kowloon
12 KOHO, Kwun Tong
13 THE FOREST, Mong Kok
14 ARTISAN HUB, San Po Kong
15 ATL Logistic Centre, Kwai Chung
16 D•PARK, Tsuen Wan
17 Hyatt Regency Hong Kong, Sha Tin
18 Citygate, Tung Chung Novotel Citygate Hong Kong
19 Tung Chung Town Lot No. 11, Tung Chung
20 PARK SIGNATURE, Yuen Long
21 21 Luk Hop Street, San Po Kong
22 New Kowloon Inland Lot No. 6505, King Lam Street, Cheung Sha Wan
23 SKYCITY Project
Major Property Development Projects Major Property Investment and Other Projects

New World Development Company Limited46 Annual Report 2020 47
Major Property Projects in Mainland China
Major Property Projects in Mainland China
1
6
2
4
3
7
5 9
8
13
14
12
1011
18
17
16
15
21
19
22
20
1 Guangzhou Covent Garden Phase 3 Remaining Portion
Guangzhou Covent Garden Remaining Phases
2 Guangzhou Park Paradise Phase 5B Guangzhou Park Paradise Remaining Phases
3 Guangzhou Zengcheng Comprehensive Development Project
4 Guangzhou Panyu Hanxi Comprehensive Development Project
5 Guangzhou Zengcheng International Community Project
6 Canton First Estate CF27B Canton First Estate CF07 Canton First Estate CF19C Canton First Estate CF03 Canton First Estate CF21 Canton First Estate CF32 Canton First Estate CF35 Canton First Estate Remaining Phases
7 Shenzhen Qianhai Project
8 Shenzhen Prince Bay Project DY04-01 Shenzhen Prince Bay Project DY04-02 Shenzhen Prince Bay Project DY04-04 Shenzhen Prince Bay Project DY02-02 Shenzhen Prince Bay Project DY02-04
9 Huizhou Changhuyuan Phase 4
10 Wuhan New World Centre Phase 3
11 Wuhan New World • Times Phase 2
Major Property Development Projects
12 Yiyang New World Scenic Heights Phase 1G Yiyang New World Scenic Heights Phase 1F Yiyang New World Scenic Heights Phase 2B Yiyang New World Scenic Heights Phase 2C Yiyang New World Scenic Heights Phase 2A Yiyang New World Scenic Heights Remaining
Phases
13 Ningbo New World Plaza Land No.7-10 Ningbo New World Plaza Land No.11 Ningbo New World Plaza Land No.12 Ningbo New World Plaza Land No.5 Ningbo New World Plaza Land No.4 Ningbo New World Plaza Land No.6 Ningbo New World Plaza Land No.1 Ningbo New World Plaza Land No.2 Ningbo New World Plaza Land No.3
14 Hangzhou Wangjiang New Town Project
15 Beijing New View Commercial Centre Beijing New View Commercial Centre
Remaining Phases
16 Beijing Xin Yu Commercial Centre Beijing Xin Yu Commercial Centre
Remaining Phases
17 Langfang New World Garden District 2
18 Jinan New World Sunshine Garden District BC
19 Shenyang New World Garden Phase 2C1 Shenyang New World Garden Phase 2C2 Shenyang New World Garden Phase 2FG
20 Shenyang New World Centre
21 Anshan New World Garden Phase 1B3
22 New World • The Grandiose Phase 1B1 New World • The Grandiose Phase 1B2
and 1B3 New World • The Grandiose Phase 2C

New World Development Company Limited48
Directors’ Profile
Dr. Cheng Kar-Shun, HenryGBM, GBS (Aged 73)
Appointed as Director in October 1972, Executive Director in 1973, became Managing Director from 1989 and Chairman from March 2012. Dr. Cheng is the chairman of the Executive Committee and Nomination Committee and a member of the Remuneration Committee of the Board of Directors of the Company. Dr. Cheng is the chairman and executive director of NWS Holdings Limited and Chow Tai Fook Jewellery Group Limited, the chairman and non-executive director of New World Department Store China Limited and FSE Services Group Limited, the vice-chairman and non-executive director of i-CABLE Communications Limited, and a non-executive director of DTXS Silk Road Investment Holdings Company Limited, all of them are listed public companies in Hong Kong. He was an independent non-executive director of HKR International Limited and Hang Seng Bank Limited up to his resignation on 31 March 2018 and retirement on 10 May 2018 respectively, the chairman and non-executive director of Newton Resources Ltd up to his resignation on 9 April 2018 and a non-executive director of SJM Holdings Limited up to his retirement on 11 June 2019, all of them are listed pubic companies in Hong Kong. Dr. Cheng is a director and honorary chairman of New World China Land Limited and a director of certain subsidiaries of the Group. He is a director of Cheng Yu Tung Family (Holdings) Limited, Cheng Yu Tung Family (Holdings II) Limited, Chow Tai Fook Capital Limited, Chow Tai Fook (Holding) Limited and Chow Tai Fook Enterprises Limited, all of them are substantial shareholders of the Company. Dr. Cheng is the chairman of the Advisory Council for The Better Hong Kong Foundation. He was a Standing Committee Member of the Twelfth Chinese People’s Political Consultative Conference of The People’s Republic of China. Dr. Cheng was awarded the Gold Bauhinia Star and the Grand Bauhinia Medal in 2001 and 2017 respectively by the Government of the Hong Kong Special Administrative Region. Dr. Cheng is the father of Dr. Cheng Chi-Kong, Adrian and Ms. Cheng Chi-Man, Sonia, the brother-in-law of Mr. Doo Wai-Hoi, William, the brother of Mr. Cheng Kar-Shing, Peter and the uncle of Mr. Cheng Chi-Heng.
Mr. Doo Wai-Hoi, WilliamJP (Aged 76)
Appointed as the Vice-chairman and Non-executive Director in July 2013. Mr. Doo is a non-executive director of Lifestyle International Holdings Limited and an independent non-executive director of Shanghai Industrial Urban Development Group Limited, both being listed public companies in Hong Kong. Mr. Doo is also a director of certain subsidiaries of the Group. He is the chairman and director of Fungseng Prosperity Holdings Limited. Mr. Doo is a Justice of the Peace appointed by the Government of the Hong Kong Special Administrative Region. He is also the Honorary Consul General of the Kingdom of Morocco in Hong Kong and Macau, and a Governor of the Canadian Chamber of Commerce in Hong Kong. He was promoted to the Officier de l’Ordre National de la Légion d’Honneur by the Republic of France in 2019. Mr. Doo is the brother-in-law of Dr. Cheng Kar-Shun, Henry and Mr. Cheng Kar-Shing, Peter, and the uncle of Dr. Cheng Chi-Kong, Adrian, Ms. Cheng Chi-Man, Sonia and Mr. Cheng Chi-Heng.

Annual Report 2020 49
Directors’ Profile
Dr. Cheng Chi-Kong, AdrianJP (Aged 40)
Appointed as an Executive Director in March 2007, became Executive Director and Joint General Manager from March 2012, re-designated as Executive Vice-chairman and Joint General Manager from April 2015, re-designated as Executive Vice-chairman and General Manager from March 2017 and re-designated as Executive Vice-chairman and Chief Executive Officer from May 2020. Dr. Adrian Cheng is a member of the Executive Committee and the chairman of the Sustainability Committee of the Board of Directors of the Company. Dr. Cheng is an executive director of NWS Holdings Limited, New World Department Store China Limited and Chow Tai Fook Jewellery Group Limited, and a non-executive director of Giordano International Limited and New Century Healthcare Holding Co. Limited, all being listed public companies in Hong Kong. Dr. Cheng is also a director and executive chairman of New World China Land Limited, the chairman of New World Group Charity Foundation Limited and a director of certain subsidiaries of the Group. In addition, he is a director of Chow Tai Fook (Holding) Limited and Chow Tai Fook Enterprises Limited, both are substantial shareholders of the Company. He was a non-executive director of i-CABLE Communications Limited, a listed public company in Hong Kong, up to his resignation on 2 July 2019.
Dr. Cheng oversees the strategic direction for the Company’s property development and investment activities. He has launched New World’s The Artisanal Movement since January 2015, and is currently overseeing the Company’s large-scale developments including Victoria Dockside and Skycity. In 2008, Dr. Cheng launched the K11 brand, a museum-retail complex that is at the nexus of art and commerce and has since extended K11’s reach across retail, hospitality, offices and non-profit art education through K11 Art Foundation and K11 Craft & Guild Foundation. He also directs early-stage funding to start-ups and technology-driven platforms.
Dr. Cheng is a member of the Tianjin Municipal Committee of The Chinese People’s Political Consultative Conference of The People’s Republic of China, the chairman of China Young Leaders Foundation and the honorary chairman of K11 Art Foundation. He was the vice-chairman of the 11th and 12th committee of the All-China Youth Federation. He was acknowledged by Fortune as one of “40 Under 40” global business stars and a “Young Global Leader” by the World Economic Forum in 2012. Dr. Cheng is a Justice of Peace appointed by the Government of the Hong Kong Special Administrative Region since 2016 and was made an Officier in the Ordre des Arts et des Lettres by the French Government in 2017. Dr. Cheng holds a Bachelor of Arts Degree (cum laude) from Harvard University, and was conferred the Honorary Doctorate of Humanities by the Savannah College of Art and Design in 2014. Dr. Cheng worked in a major international bank prior to joining the Group in September 2006 and has substantial experience in corporate finance. He is the son of Dr. Cheng Kar-Shun, Henry, the brother of Ms. Cheng Chi-Man, Sonia, the nephew of Mr. Doo Wai-Hoi, William and Mr. Cheng Kar-Shing, Peter, and the cousin of Mr. Cheng Chi-Heng.
New World Development Company Limited50
Directors’ Profile
Mr. Yeung Ping-Leung, Howard
(Aged 63)
Mr. Cha Mou-Sing, PaysonJP (Aged 78)
Appointed as a Director in November 1985 and became an Independent Non-executive Director in 1999. Mr. Yeung is a member of the Audit Committee and the Remuneration Committee of the Board of Directors of the Company. He is also an independent non-executive director of Miramar Hotel and Investment Company, Limited, a listed public company in Hong Kong.
Appointed as a Director in April 1989 and became an Independent Non-executive Director in 1999. Mr. Cha is a member of the Audit Committee, the Remuneration Committee and the Sustainability Committee of the Board of Directors of the Company. Mr. Cha is the chairman of HKR International Limited, the non-executive chairman of Hanison Construction Holdings Limited and Million Hope Industries Holdings Limited, all of them are listed public companies in Hong Kong. He is also an independent non-executive director of Eagle Asset Management (CP) Limited – Manager of Champion Real Estate Investment Trust which is listed on The Stock Exchange of Hong Kong Limited, the chairman of Mingly Corporation and an independent non-executive director of Hong Kong International Theme Parks Limited. Mr. Cha is a Justice of Peace in Hong Kong.
Annual Report 2020 51
Directors’ Profile
Mr. Cheng Kar-Shing, Peter(Aged 67)
Mr. Cha Mou-Zing, Victor(Alternate Director to
Mr. Cha Mou-Sing, Payson)
(Aged 71)
Appointed as a Director in October 1994. Mr. Cheng is a lso an independent non-executive director of King Fook Holdings Limited, a listed public company in Hong Kong. He is a director of Cheng Yu Tung Family (Holdings) Limited, Cheng Yu Tung Family (Holdings II) Limited, Chow Tai Fook Capital Limited, Chow Tai Fook (Holding) Limited and Chow Tai Fook Enterprises Limited, all of them are substantial shareholders of the Company. Mr. Cheng is a director of New World China Land Limited, New World Hotels (Holdings) Limited, NWS Service Management Limited and certain subsidiaries of the Group. Mr. Cheng is committed to community services and is serving as the chairman of Chow Tai Fook Charity Foundation, the chairman of Chow Tai Fook Medical Foundation Limited, the chairman of Antonia Welfare Fund Limited, the vice-chairman of Hong Kong Economic Exchange and a director of Green Council. He is the University Assembly member of University of Macau. He is a Fellow of The Hong Kong Institution of Engineers, Hong Kong Institute of Arbitrators, Hong Kong Construction Arbitration Centre and The Chartered Institute of Arbitrators. He is a CEDR Accredited Mediator and on the lists of the Mediators of Hong Kong Mediation Accreditation Association Limited, Hong Kong International Arbitration Centre, Hong Kong Mediation Centre and Financial Dispute Resolution Centre. He is on the Panel of Arbitrators of South China International Economic and Trade Arbitration Commission/Shenzhen Court of International Arbitration, an Arbitrator of Huizhou Arbitration Commission, a member of Society of Construction Law Hong Kong and a member of Hong Kong Institute of Mediation. Mr. Cheng is the brother of Dr. Cheng Kar-Shun, Henry, the brother-in-law of Mr. Doo Wai-Hoi, William, the father of Mr. Cheng Chi-Heng, and the uncle of Dr. Cheng Chi-Kong, Adrian and Ms. Cheng Chi-Man, Sonia.
Appointed as an Alternate Director to Mr. Cha Mou-Sing, Payson in September 2000. Mr. Cha is the deputy chairman and managing director of HKR International Limited, a listed public company in Hong Kong. He was an independent non-executive director of SOHO China Limited, a listed public company in Hong Kong, up to his resignation on 17 August 2018. He has extensive experience in the textile manufacturing and real estate businesses.

New World Development Company Limited52
Directors’ Profile
Mr. Ho Hau-Hay, Hamilton(Aged 69)
Mr. Lee Luen-Wai, JohnBBS, JP (Aged 71)
Appointed as a Non-executive Director in August 2004 and was re-designated as Independent Non-executive Director in November 2007. Mr. Ho was an Alternate Director of the Company from 7 January 2004 to 29 August 2004. Mr. Ho is the chairman of the Remuneration Committee and a member of the Audit Committee of the Board of Directors of the Company. He is also an independent non-executive director of King Fook Holdings Limited (a listed public company in Hong Kong), and an executive director of Honorway Investments Limited and Tak Hung (Holding) Company Limited.
Appointed as an Independent Non-executive Director in August 2004. Mr. Lee is the chairman of the Audit Committee, and a member of the Remuneration Committee and the Nomination Committee of the Board of Directors of the Company. Mr. Lee is the managing director and chief executive officer of Lippo Limited, an executive director and the chief executive officer of Lippo China Resources Limited and Hongkong Chinese Limited, as well as an independent non-executive director of UMP Healthcare Holdings Limited, all being listed public companies in Hong Kong. Mr. Lee was a non-executive non-independent chairman of Healthway Medical Corporation Limited, a company listed on the sponsor-supervised listing platform of the Singapore Exchange Securities Trading Limited, up until his retirement on 26 April 2019. Mr. Lee is a Fellow of The Institute of Chartered Accountants in England and Wales, the Association of Chartered Certified Accountants and the Hong Kong Institute of Certified Public Accountants. He was a partner of Price Waterhouse (now PricewaterhouseCoopers) in Hong Kong and has extensive experience in corporate finance and capital markets. Mr. Lee is an Honorary Fellow of the City University of Hong Kong, a Justice of Peace in Hong Kong and was awarded the Bronze Bauhinia Star by the Government of the Hong Kong Special Administrative Region. He serves as a member on a number of Public Boards and Committees including the Chairman of the Investment Committee of the Hospital Authority Provident Fund Scheme, a member of the Public Service Commission and the Chairman of the Hospital Governing Committee of Hong Kong Children’s Hospital.

Annual Report 2020 53
Directors’ Profile
Mr. Liang Cheung-Biu, Thomas
(Aged 73)
Appointed as a Non-executive Director in August 2004 and was re-designated as Independent Non-executive Director in March 2012. Mr. Liang is a member of the Audit Committee and the Nomination Committee of the Board of Directors of the Company. Mr. Liang is an independent non-executive director of Miramar Hotel and Investment Company, Limited (a listed public company in Hong Kong), a director and the group chief executive of Wideland Investors Limited and a member of the Board of Trustees of Wei Lun Foundation Limited. Mr. Liang is a member of the Council of The Chinese University of Hong Kong, a member of the Court of the Hong Kong Baptist University and a member of the Board of Governors, The Hang Seng University of Hong Kong. He has extensive experience in financial management, corporate finance, banking, real estate development and equity investment.
Appointed as a Non-executive Director in December 2008 and was re-designated as Executive Director in March 2012 and re-designated as Non-executive Director in June 2018. Ms. Ki has been the managing director of New World China Enterprises Projects Limited (a subsidiary of the Company) since 1997 and is also a director of certain subsidiaries of the Group. Ms. Ki is an independent non-executive director of Sa Sa International Holdings Limited, a listed public company in Hong Kong. She was an independent non-executive director of Clear Media Limited, a listed public company in Hong Kong, up to her retirement on 7 September 2019. Ms. Ki is also a director of Chow Tai Fook Charity Foundation. Ms. Ki has more than 30 years’ experience in integrated communication and marketing services. She was the founder, partner and chairman/chief executive officer of Grey Hong Kong Advertising Limited and Grey China Advertising Limited. Ms. Ki is committed to the community and public services. She was the first chief executive of The Better Hong Kong Foundation. She is currently a director of PMQ Management Company Limited, founder and honorable president of Wu Zhi Qiao Charitable Foundation, a member of the Asian Advisory Board of Cheng Yu Tung Management Institute, Richard Ivey School of Business (University of Western Ontario, Canada), a member of the Advisory Board of the EMBA Programme of The Chinese University of Hong Kong, the honorary consultant for the School of Hip Hop of Youth Outreach and a member of Hong Kong Institute of Construction Management Board. Ms. Ki is a recipient of Honorary University Fellowship from The Open University of Hong Kong and The University of Hong Kong. She has been awarded the honour of Beta Gamma Sigma by the Faculty of Business Administration of The Chinese University of Hong Kong, and Justice of the Peace, the Silver Bauhinia Star and the Gold Bauhinia Star by the Government of the Hong Kong Special Administrative Region. She was a National Committee Member of the 12th Chinese People’s Political Consultative Conference of The People’s Republic of China and a member of the 10th, 11th and 12th CPPCC of Yunnan Provincial Committee. She will retire as Non-executive Director on 1 October 2020.
Ms. Ki Man-Fung, LeonieGBS, SBS, JP (Aged 73)

New World Development Company Limited54
Directors’ Profile
Mr. Cheng Chi-Heng(Aged 42)
Appointed as an Executive Director in June 2010. Mr. Cheng is a member of the Executive Committee of the Board of Directors of the Company. He also acts as director of certain subsidiaries of the Group. Mr. Cheng is an executive director of Chow Tai Fook Jewellery Group Limited, a listed public company in Hong Kong. Mr. Cheng is a director of Chow Tai Fook (Holding) Limited and Chow Tai Fook Enterprises Limited, both are substantial shareholders of the Company. Mr. Cheng worked in Yu Ming Investment Management Limited from 1999 to 2000 as a corporate finance executive. He obtained his Bachelor of Arts Degree majoring in Economics from the University of Western Ontario, Canada in 1999. He is the son of Mr. Cheng Kar-Shing, Peter, the nephew of Dr. Cheng Kar-Shun, Henry and Mr. Doo Wai-Hoi, Will iam, and the cousin of Dr. Cheng Chi-Kong, Adrian and Ms. Cheng Chi-Man, Sonia.
Ms. Cheng Chi-Man, Sonia(Aged 39)
Appointed as an Executive Director in March 2012. Ms. Cheng is a member of the Executive Committee of the Board of Directors of the Company. She currently oversees the hotel division and the project management division of the Group. She is a director of New World China Land Limited and certain subsidiar ies of the Group. Ms. Cheng is a non-execut ive d i rector of Chow Tai Fook Jewel lery Group Limited, a listed public company in Hong Kong. Before joining the Group in 2008, Ms. Cheng worked in a major international investment bank and a global US private equity firm specialising in real estate investments. Ms. Cheng holds a Bachelor of Arts Degree with a concentration in Applied Mathematics from Harvard University in the U.S.A.. Ms. Cheng is the chief executive officer of Rosewood Hotel Group and chairman of the advisory committee of the School of Hotel and Tourism Management at The Chinese University of Hong Kong. She is a member of the Y. Elites Association, the Young Presidents’ Organization, the Hong Kong United Youth Association and a non-official member of the Family Council and the Advisory Committee on Gifted Education. She is also a member of the Thirteenth Guangzhou Municipal Committee of The Chinese People’s Political Consultative Conference of The People’s Republic of China. Ms. Cheng is the daughter of Dr. Cheng Kar-Shun, Henry, the sister of Dr. Cheng Chi-Kong, Adrian, the niece of Mr. Doo Wai-Hoi, William and Mr. Cheng Kar-Shing, Peter, and the cousin of Mr. Cheng Chi-Heng.

Annual Report 2020 55
Directors’ Profile
Mr. Sitt Nam-Hoi(Aged 66)
Appointed as an Executive Director in June 2018. Mr. Sitt is a member of the Executive Committee and the Sustainability Committee of the Board of Directors of the Company. Mr. Sitt joined the Group and was appointed as Head of Projects (Hong Kong) of the Company in February 2011. He is currently the senior director of the Project Management Department of the Company, director and chief design officer of New World China Land Limited and director of certain subsidiaries of the Group. Before joining the Company, he was the project director of a listed public company in Hong Kong which he worked for over 25 years. Before that, Mr. Sitt had been working in Buildings Department of the Government of the Hong Kong Special Administrative Region. Mr. Sitt obtained his Bachelor of Architecture and Bachelor of Arts in Architectural Studies from the University of Hong Kong. He is a Registered Architect, an Authorised Person and is responsible for overseeing all project management matters for all property development projects of the Group in Hong Kong. He has extensive project management experience and participated in various significant projects in Hong Kong and mainland China.
Mr. Ip Yuk-Keung, Albert(Aged 68)
Appointed as an Independent Non-executive Director in June 2018. Mr. Ip is a member of the Audit Committee, the Nomination Committee and the Sustainability Committee of the Board of Directors of the Company. Mr. Ip is an independent non-executive director of Power Assets Holdings Limited, Lifestyle International Holdings Limited and Hutchison Telecommunications Hong Kong Holdings Limited, all being listed public companies in Hong Kong. He is also a non-executive director of Eagle Asset Management (CP) Limited, as manager of Champion Real Estate Investment Trust (a listed real estate investment trust). He was the executive director and chief executive officer of LHIL Manager Limited which is the trustee-manager of Langham Hospitality Investments (a listed fixed single investment trust) and Langham Hospitality Investments Limited until his resignation on 1 April 2019. In addition, he was an independent non-executive director of Shenzhen Investment Holdings Bay Area Development Company Limited (a listed public company in Hong Kong), Hopewell Holdings Limited (a listed public company in Hong Kong until its delisting on 3 May 2019) and TOM Group Limited (a listed public company in Hong Kong) up to his resignation in May 2018, May 2019 and August 2020 respectively. Mr. Ip is an international banking and real estate executive with 33 years of experience at Citigroup, First National Bank of Chicago, Wells Fargo and Merrill Lynch in Hong Kong, Asia and the United States. His areas of expertise are in real estate, corporate banking, risk management, transaction banking and wealth management. Mr. Ip is an Adjunct Professor of City University of Hong Kong, The Hong Kong University of Science and Technology, The Hang Seng University of Hong Kong and the School of Hotel and Tourism Management at The Chinese University of Hong Kong, an Adjunct Distinguished Professor in Practice of University of Macau, a Council Member of The Hong Kong University of Science and Technology, Honorary Advisor of School of Humanities and Social Science at The Hong Kong University of Science and Technology, a trustee of the Board of Trustees at Washington University in St. Louis, and a Vice Chairman of the Board of Governors of World Green Organisation. Mr. Ip holds a Bachelor of Science degree at Washington University in St. Louis (summa cum laude) and Master of Science degrees at Cornell University and Carnegie-Mellon University. He is an Honorary Fellow of Vocational Training Council.

New World Development Company Limited56
Directors’ Profile
Ms. Huang Shaomei, Echo(Aged 51)
Ms. Chiu Wai-Han, Jenny(Aged 49)
Appointed as an Executive Director in May 2020. Ms. Huang is a member of the Executive Committee of the Board of Directors of the Company. She joined the Group as the deputy chief executive officer of New World China Land Limited in October 2015 and promoted to Director & Chief Executive Officer of New World China Land Limited in February 2020. Ms. Huang is also a director of certain subsidiaries of the Group. She has over 20 years of experience in the real estate sector, having served in a consulting capacity for large-scale urban infrastructures, urban planning and urban renewal in mainland China for extensive periods, providing the Government of The People’s Republic of China with professional recommendations on property development and urban planning. Prior to joining the Group, Ms. Huang held senior position with an international consulting firm. She was appointed as managing director (Southern China) of a Hong Kong-listed property developer, overseeing its property development throughout the southern China region. She has proven experience in China’s real estate sector. Ms. Huang is a member of Guangdong Province Committee of the Chinese People’s Political Consultative Conference of The People’s Republic of China, and a Deputy Secretary-General of Silk Road Chamber of International Commerce.
Appointed as an Executive Director in May 2020. Ms. Chiu is a member of the Executive Committee of the Board of Directors of the Company. She joined the Group in 2004 and is currently the Senior Director – Human Resources of the Company. Ms. Chiu is responsible for planning and driving full spectrum of strategic human resources direction, including talent acquisition, talent development and management, reward management and human resources partnering services. Prior to joining the Group, she had taken up managerial role in renowned corporations in information and communications technology services and property development industries. Ms. Chiu was graduated from The Chinese University of Hong Kong. She is an Associate Member of The Hong Kong Institute of Chartered Secretaries and The Chartered Governance Institute. Ms. Chiu possesses over 20 years of experience in human resources and corporate management.

Annual Report 2020 57
Senior Management Profile
Mr. Wong Man-HoiBSc(Eng)(Hon), LLB(Hon)
(Aged 61)
Ms. Lo Pui-Ying(Aged 70)
Appointed as the Company Secretary of the Company in January 2011. Mr. Wong joined the Company in November 2000 and has headed the Legal Department (now Legal and Company Secretarial Department) since November 2001. He is currently the Senior Director – Legal of the Company. Mr. Wong is a member of the Law Society of Hong Kong and has been a qualified solicitor in Hong Kong since 1994. Before joining the Company, Mr. Wong worked as a solicitor specialising in real estate practice. Mr. Wong obtained his Bachelor of Science (Engineering) Degree from the University of Hong Kong in 1981 and Bachelor of Laws Degree from the University of London in 1990.
Ms. Lo is currently the Owners’ Representative-Hotel Division of the Company. Ms. Lo has been in the hotel industry since 1969 and held various positions in the Hyatt Regency and Excelsior hotels before joining the Group in 1978. Ms. Lo acted as the financial controller of the New World Hotel in Kowloon for three years before joining New World Harbour View Hotel (later renamed Renaissance Harbour View Hotel) in 1988 as Director of Finance. She also held a group controller position for New World Hotels International Limited (a former hotel management company of the Company) until 1997 when the position ceased to exist. Ms. Lo joined Foreign Holiday Philippines, Inc. and Marina Square Properties, Inc. in 2003 and 2005, respectively, as group financial controller, treasurer and co-leader of the pre-opening and operation team for a hotel and casino property investment in the Philippines. She rejoined the Company in 2007. Ms. Lo has previously been certified as a Certified Hotel Administrator (CHA) in the American Hotel and Motel Association (AHMA) from November 1990 to October 2000. She has also previously acted as a Fellow and Founder Member of the Hotel Controllers & Accountants Association (Hong Kong) founded in 1991. She has served respectively a member of Management Committee and Executive Committee of The Federation of Hong Kong Hotel Owners in 2012 and 2014 till now.
Note: The above members of the senior management are senior functional directors of the Company. Various businesses and corporate functions of
the Group are under the responsibility of other heads of business units and functional departments.

ESG REPORTING STANDARDSThis section references the following ESG standards and frameworks:
• Environmental, Social and Governance Reporting Guide (ESG Reporting Guide) set out in Appendix 27 of the Rules Governing the Listing of Securities on the Stock Exchange of Hong Kong Limited (“HKEx”)
• Global Reporting Initiative Sustainability Reporting Standards (“GRI Standards”) – Core Option
• Recommendations of the Task Force on Climate-related Financial Disclosures (“TCFD”)
• The Ten Principles of the United Nations Global Compact (“UNGC”)
REPORT ASSURANCEData and information contained in this section as well as the environmental and social performance data on our website have been independently assured by the Hong Kong Quality Assurance Agency (“HKQAA”) in accordance with the ISAE 3000 (Revised), Assurance Engagements Other Than Audits or Reviews of Historical Financial Information and the ISAE 3410, Assurance Engagements on Greenhouse Gas Statements issued by the International Auditing and Assurance Standards Board to ensure accuracy and credibility. Additionally, HKQAA has conducted an independent verification of the Greenhouse Gas emissions inventory for our commercial and retail properties with reference to ISO 14064-1:2006. Please refer to p.96–97 for the independent assurance statement.
CONTACT USWe welcome your feedback on this Corporate Sustainability section and other sustainability related matters. Please contact us at [email protected].
REPORTING PERIODThis section provides an overview of the Group’s Environmental, Social and Governance (“ESG”) performance during the reporting period of 1 July 2019 to 30 June 2020 and, where specified, the latest initiatives after FY2020 as well.
REPORTING SCOPEOur “Sustainability Reporting Scope” includes NWD’s businesses over which the Group has majority financial ownership and operational control. This coverage includes our businesses under NWD, NWCL and K11 Group Limited, as well as individually listed subsidiaries NWSH1 and NWDS1, which have more comprehensive sustainability disclosures in their respective reports. FTLife Insurance is newly added to the Sustainability Reporting Scope during the reporting period.
New World Sustainability Vision 2030 (“SV2030”) targets cover the majority of the “Sustainability Reporting Scope”. “SV2030 Green Targets Scope” focuses primarily on the major businesses with mature performance data and over which we can exert operational influence for developing environmental impact reduction roadmaps. Wellness and caring targets have a broader group focus to ensure our businesses create shared value for all stakeholders.
SUSTAINABILITY WEBSITEIn the past, NWD published a standalone sustainability report on the Company’s website annually. Starting from FY2020, we will no longer issue an online sustainability report in order to focus on impact reporting in this annual report section. Supplementary information is available on the Company’s website under the sustainability section (https://sustainability.nwd.com.hk/).
Corporate Sustainability
About This Section
New World Development Company Limited 58
1 Please refer to these companies’ sustainability reports for their scoping definition.

In FY2020, the global community saw unprecedented challenges from the COVID-19, signs of an economic downturn, and a climate emergency. While their full impact is yet to be captured, corporates must naturally evolve from “business as usual” and adapt to the new normal.
It has always been New World Group’s goal to contribute to society through the power of business. Today, more than ever, we are committed to building sustainable communities through our business ecosystem, for all stakeholders. These communities and, in fact, our businesses are built for the people, by the people. Integrating ESG into our businesses via SV2030 in the past few years has enabled us to stay aligned to our Group and the world’s priorities and be accountable to all stakeholders. At our Group’s 50th anniversary this year, our commitment to Creating Shared Value (“CSV”) for all stakeholders is particularly relevant as we define our way forward.
Climate emergency is a business risk. To better position ourselves, we are taking systematic actions to eventually decarbonise our portfolio towards required level of science-based targets (“SBT”), as well as managing and disclosing our climate risks according to the TCFD's recommendations. As a responsible business, we are also inviting tenants and business partners to take part in this decarbonisation journey to reduce our environmental impact together. Key performance indicators (“KPIs”) under the SV2030 pillars of Green, Wellness and Caring have also been established for our leadership team and employees to ensure the Group is acting towards these common goals. As Hong Kong’s first real estate developer to have joined the World Business Council for Sustainable Development (“WBCSD”) and a new signatory of the UNGC, we will leverage global insights and partnerships to realise sustainable cities and communities and improve the overall well-being of our stakeholders.
It is also our hope to foster a diverse and inclusive community culture. Last year, we announced that we would donate farmland for developing an innovative social project that would alleviate housing problems in Hong Kong. More
recently, we have appointed two female executives as board members and are introducing workplace initiatives to encourage a more gender-diverse and fair environment.
During the COVID-19 outbreak, our Group demonstrated resilience, unity and love for the world, and the will to innovate, through swift responses such as becoming the first blue-chip in Hong Kong to set up a relief fund, procuring protective masks and sanitising supplies for our employees, partners and tenants, as well as donating funds and emergency supplies to the epicentres around the world. To create shared value with stakeholders in need, we also repurposed our Hong Kong facilities and began to manufacture masks for different communities. These Made-in-Hong Kong masks were then distributed through smart-technology dispensers to those in need via Non-Governmental Organisations (“NGO”) partners. To minimise business disruptions, digitalisation of our internal work processes and sales channels has become the new norm. These initiatives were made possible by our dedicated teams and growing network of ecosystem partners. The global pandemic offers us a window to learn, innovate, collaborate and grow together. I would like to take this opportunity, to thank my team for their dedication to excellence, innovation and unity during these challenging times.
Stepping into a new year with unknown challenges, our team remains hopeful – when others see crisis, we see opportunity. By adopting a growth mindset, connecting with all stakeholders and aligning to our long-term sustainability vision and other Group priorities, we are confident that our commitment to CSV, together with striving for best practice in ESG, will allow our Group to stay ahead and thrive for many more decades.
Dr. Cheng Chi-Kong, Adrian
Executive Vice-chairman and Chief Executive OfficerChairperson, Sustainability Committee andGroup Sustainability Steering Committee
Corporate Sustainability
Message From Management
Annual Report 2020 59

Corporate Sustainability
WELLNESS - Promoting health in body and mindSDG 3.4 Promote physical / mental health and well-beingSDG 3.9 Promote healthy built environments which reduce hazardous chemicals and pollution
CARING - Creating shared value for our communities and cultureSDG 4.4 Upskill individuals for employment, decent jobs and entrepreneurshipSDG 4.7 Promote education on sustainable development, sustainable lifestyles and global citizenshipSDG 11.3 Enhance inclusive and sustainable urbanisationSDG 11.4 Protect cultural and natural heritage
SMART - Using innovation to unlock potentialSDG 17.16 Enhance global and multi-stakeholder partnerships to support the SDGs through knowledge,
technology and resource sharing
GREEN - Moving us towards a greener futureSDG 11.6 Reduce adverse environmental impact of cities
New World Group - Halve our environmental impact in energy and carbon emissions intensity (against baseline year FY20151)
FY2020:
WELL Buildings:8 building certificates9, with 7 of those achieving Gold or aboveSDG 3.4, 3.9
Occupational Health & Safety training 37,309 hoursSDG 3.4
Lost-time injury rate (LTIR)8 1.7 per 100 employeesSDG 3.4(FY2030 target: maintain at/below 3.0)
Improved the well-being of 10 million stakeholders7
SDG 3.4(FY2030 target: 20 million)
Enhanced the quality of life of 107 million stakeholders7
SDG 11.3, 11.4(FY2030 target: 300 million)
138 active patents10
Provided >190,000 volunteering hours7
SDG 4.4(FY2030 target: >340,000 hours)
Average 18.9 training hours per employee SDG 4.4
Sustainability-related training 12,399 hours SDG 4.7
New World Construction (against baseline year FY20152)
FY2020:
Green Buildings SDG 11.6• 27 BEAM Plus building certificates3, with 20 of those achieving Very Good/Gold or above4
• 17 LEED building certificates5 achieved Gold or above• 3 China Green Building Evaluation Labels (“Two-Star” or above)6
• 2 SITES certificates at Gold level
Energy intensity (MWh/million HK$ revenue)1
SDG 11.6(FY2030 target: 50%)
Waste-to-landfill intensity (tonnes/million HK$ revenue)2
SDG 11.6(FY2030 target: 15%)
Water intensity (m3/million HK$ revenue)2
SDG 11.6(FY2030 target: 25%)
Carbon emissions intensity (tCO2e/million HK$ revenue)1
SDG 11.6(FY2030 target: 50%)
17% 22%
46% 9%
Overview of SV2030
1 Covers the SV2030 Green Targets Scope. NWSH and NWDS also disclose their environmental targets in their annual sustainability report. Using revenue as the intensity metrics was due to the diverse business nature of the Group’s portfolio and that revenue is the common thread that can be adopted across sectors.
2 Covers New World Construction Company Limited only.3 Counting the number of Provisional Assessment and Final Assessment certificates for both New Buildings and Existing Buildings as at 30 June 2020.4 This number was adjusted due to inadvertent clerical errors in our Sustainability Report 2019 regarding the BEAM Plus certification levels of Victoria Dockside
properties namely, K11 ATELIER, K11 MUSEA and K11 ARTUS – all should be Provisional Silver rating under BEAM Plus New Buildings V1.1 as at 30 June 2019. A clarification announcement has been posted on HKEx website.
5 Counting both pre-certified and certified projects as at 30 June 2020. This number excludes expired pre-certificates.6 This number excludes expired labels as at 30 June 2020.7 Cumulative number from baseline year FY2015 to FY2020 covering the Sustainability Reporting Scope.8 Lost-time injury rate represents the number of injuries per 100 employees per year.9 Counting both pre-certified and certified projects as at 30 June 2020.10 Counting the number of active patents granted since FY2015 and held by New World Group under the Sustainability Reporting Scope as at 30 June 2020,
excluding design registrations/patents.New World Development Company Limited 60 Annual Report 2020 61

1 THE INCLUSION OF NEW WORLD DEVELOPMENT COMPANY LIMITED IN ANY MSCI INDEX, AND THE USE OF MSCI LOGOS, TRADEMARKS, SERVICE MARKS OR INDEX NAMES HEREIN, DO NOT CONSTITUTE A SPONSORSHIP, ENDORSEMENT OR PROMOTION OF NEW WORLD DEVELOPMENT COMPANY LIMITED BY MSCI OR ANY OF ITS AFFILIATES. THE MSCI INDEXES ARE THE EXCLUSIVE PROPERTY OF MSCI. MSCI AND THE MSCI INDEX NAMES AND LOGOS ARE TRADEMARKS OR SERVICE MARKS OF MSCI OR ITS AFFILIATES.
NWD • Established sustainability KPIs for senior executives and employees in 2020
• Appointed two new female executive directors to join the Board and empower women leadership and gender diversity in May 2020
• First Hong Kong blue-chip to set up a pandemic relief fund of HK$10 million to support local communities and offer over 11 million masks donations as of FY2020 through #LoveWithoutBorders
• Impact Kommons, Hong Kong’s 1st startup accelerator focused on the United Nations Sustainable Development Goals (“UN SDGs”) admitted five startups out of over 50 international applicants and secured seven ongoing/successful integrations within the New World Ecosystem
• Raised a five-year HK$1 billion sustainability-linked loan, 1st in Asia to link with GRESB performance in November 2019
NWSH • Announced its 1st sustainability-linked loan of HK$1 billion in June 2020
K11 • Launched Nature Discovery Park – Hong Kong’s 1st urban biodiversity museum and sustainability-themed education park at K11 MUSEA, with over 26,000 visitors since its opening in late 2019
• Launched nation-wide community caring effort, Love Power, to provide customers with telehealth support, mental well-being activities, as well as access to healthcare supplies, resulting in over RMB5 million and 200,000 masks donated and over 200,000 customers engaged
NWCL • Published its 1st green property management guide for residential properties to enhance environmental management
• Held a series of climate change workshops for about 200 employees across different regions in Mainland China from July to October 2019
1st listed on Dow Jones Sustainability Asia Pacific Index in 2019
Sustainalytics Rated as an ESG “Outperformer”
in 2018 and 2019A constituent of the
FTSE4Good Index Series
Ranked 1st among 12 diversified listed businesses in Eastern Asia in 2019
Member since 2014-2015
FY2020 Major Achievements & ESG HighlightsCorporate Sustainability
ESG HIGHLIGHTS
Major Recognitions from Sustainability Benchmarks and Indices
NWD Became a Signatory of:
NWD is the First Real Estate Company in Hong Kong to join
A constituent of MSCI HK-Listed Southbound Country ESG Leaders Index1
New World Development Company Limited 60 Annual Report 2020 61
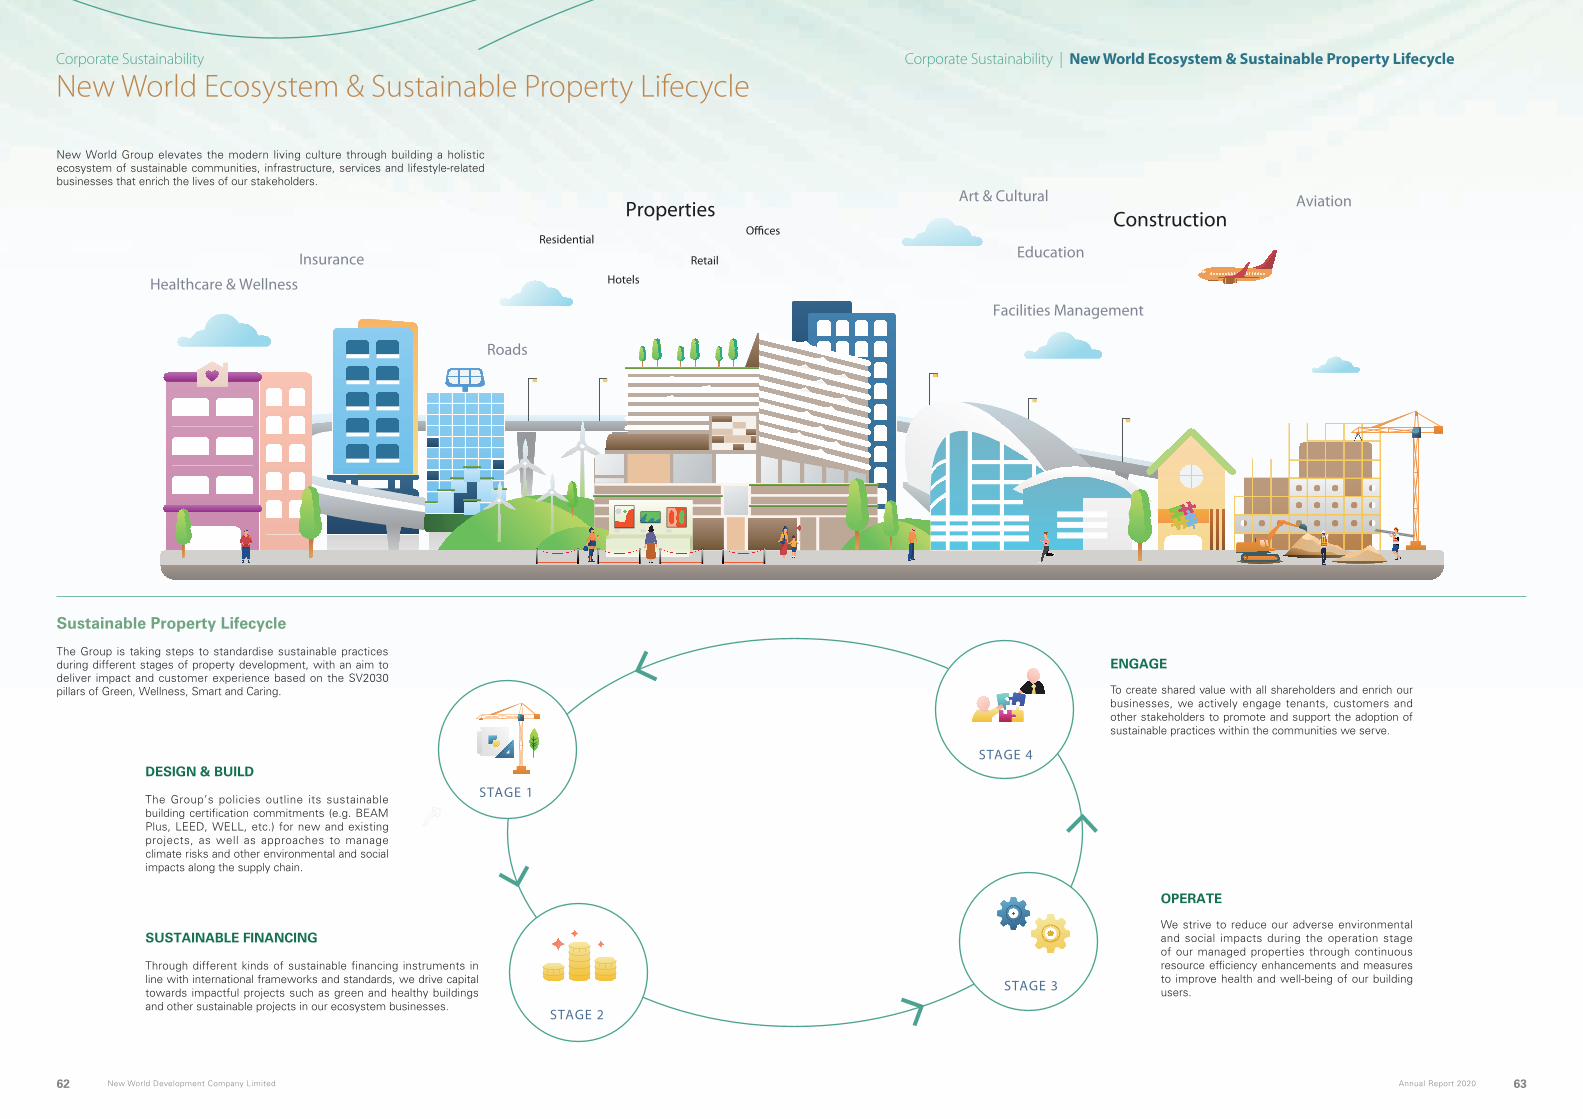
New World Ecosystem & Sustainable Property LifecycleCorporate Sustainability Corporate Sustainability | New World Ecosystem & Sustainable Property Lifecycle
Aviation
Facilities Management
Education
Roads
ResidentialO�ces
Hotels
Retail
Properties Construction
Insurance
Healthcare & Wellness
Art & Cultural
Sustainable Property Lifecycle
The Group is taking steps to standardise sustainable practices during different stages of property development, with an aim to deliver impact and customer experience based on the SV2030 pillars of Green, Wellness, Smart and Caring.
ENGAGE
To create shared value with all shareholders and enrich our businesses, we actively engage tenants, customers and other stakeholders to promote and support the adoption of sustainable practices within the communities we serve.
OPERATE
We strive to reduce our adverse environmental and social impacts during the operation stage of our managed properties through continuous resource efficiency enhancements and measures to improve health and well-being of our building users.
STAGE 4
STAGE 3
STAGE 2
STAGE 1
Property Lifecycle
STAGE 4
STAGE 3
STAGE 2
STAGE 1
Property Lifecycle
STAGE 4
STAGE 3
STAGE 2
STAGE 1
Property Lifecycle
STAGE 4
STAGE 3
STAGE 2
STAGE 1
Property Lifecycle
New World Development Company Limited 62 Annual Report 2020 63
New World Group elevates the modern living culture through building a holistic ecosystem of sustainable communities, infrastructure, services and lifestyle-related businesses that enrich the lives of our stakeholders.
SUSTAINABLE FINANCING
Through different kinds of sustainable financing instruments in line with international frameworks and standards, we drive capital towards impactful projects such as green and healthy buildings and other sustainable projects in our ecosystem businesses.
DESIGN & BUILD
The Group’s policies outline its sustainable building certification commitments (e.g. BEAM Plus, LEED, WELL, etc.) for new and existing projects, as well as approaches to manage climate risks and other environmental and social impacts along the supply chain.

Sustainable FinanceCorporate Sustainability
New World Development Company Limited 64 Annual Report 2020 65
Sustainable finance is a core part of our approach to integrating sustainability considerations into our business and property lifecycle. Through a broad application of sustainable finance including sustainability-linked instruments, we support projects that deliver both environmental and social impacts. These impacts are monitored and reported regularly with the help of integrating ESG and standardising sustainability into corporate policies and procedures. Further details and updates are available on the Sustainable Finance section on our sustainability website.
Sustainability-linked LoanNWD raised a five-year sustainability-linked loan of HK$1 billion in November 2019, with interest rate discount linked to the annual achievement of environmental impact reduction targets (refer to the table below) and GRESB performance indicators.
NWD’S ENVIRONMENTAL IMPACT REDUCTION PERFORMANCE
Baseline Performance(FY2018)
FY2020 Performance
% change against the baseline
Greenhouse gas (GHG) emissions1
(tonnes CO2e/sq m)0.09 0.06 -33%
Energy consumption1 (MWh/sq m) 0.14 0.10 -29%
Water consumption1 (m3/sq m) 0.90 0.83 -8%
Waste from New World Construction Company Limited (“NWCON”) in Hong Kong (tonnes/million HK$ revenue)
2.56 1.09 -57%
NWSH also announced its first sustainability-linked loan2 of HK$1 billion in June 2020 to support its ongoing ESG integration.
Green BondUnder the New World Development Green Finance Framework (September 2018), NWCL issued a US$310 million green bond in December 2018 at a coupon rate of 4.75% due 2023. In FY2020, the bond received the Green Finance Certificate (Post-issuance Stage) from the HKQAA.
ALLOCATION OF GREEN BOND PROCEEDS
Category Projects Proceeds Allocated
Green Buildings NEW WORLD ZENGCHENG COMPREHENSIVEDEVELOPMENT PROJECT3
US$206.4 million (67%)
Green Buildings QIANHAI CTF FINANCE TOWER3 US$101.7 million (33%)
Total Allocated Proceeds US$308.1 million (100%)
Total Net Proceeds4 US$308.1 million (100%)
Project NEW WORLD ZENGCHENG COMPREHENSIVE DEVELOPMENT PROJECT3
Location Guangzhou, China
GFA 284,328 sq m
Nature Office, retail, serviced apartments and hotel
Funding Transaction Aggregated amount of proceeds earmarked: US$194.2 million
Remaining balance: US$12.2 million
Certifications • China Green Building Evaluation Standard — Certificate of Green Building Design Label “Two-Star” obtained for the whole project in December 2019
• LEED® for Building Design and Construction: Core and Shell Development precertification Gold – Commercial portion (two office towers including retail, hotel and serviced apartments) obtained in November 2018
Energy Performance Estimated annual energy savings exceeding LEED baseline performance5 by 12% or more
Water Efficiency and Savings
Estimated annual potable water savings exceeding LEED baseline performance by over 40%
1 GHG emissions, energy and water consumption cover NWD’s existing buildings. New buildings will be counted within the target scope after two years of operation.2 For further information, visit https://sr.nws.com.hk/pdf/en/NWS%20sustainability%20linked%20loan.Eng.pdf3 The project names are subject to finalisation before official opening.4 Total net proceeds received are US$308.1 million out of the US$310 million green bond.5 Using ASHRAE 90.1-2010 as baseline (LEED v4 Building Design and Construction: Core and Shell Development).

Corporate Sustainability | Sustainable Finance
Annual Report 2020 65New World Development Company Limited 64 Annual Report 2020 65
Project QIANHAI CTF FINANCE TOWER1
Location Shenzhen, China
GFA 176,300 sq m
Nature Office and retail
Funding Transaction Aggregated amount of proceeds earmarked: US$96.0 million
Remaining balance: US$5.7 million
Certifications • China Green Building Evaluation Standard — Certificate of Green Building Design Label “Three-Star” obtained for the whole project in June 2020
• LEED® for Building Design and Construction: Core and Shell Development precertification Gold — South Tower and North Tower plus Retail Podium obtained in October 2018
• WELL PrecertifiedTM Gold — North Tower plus Retail Podium obtained in November 2018
Energy Performance Estimated annual energy savings exceeding LEED baseline performance2 by 18% or more
Water Efficiency and Savings
Estimated annual potable water savings exceeding LEED baseline performance by over 45%
Green Loan
Terms for NWD’s first green loan for K11 ATELIER King’s Road dated March 2018 were renegotiated in December 2019, resulting in an increased loan size from HK$3.6 billion to HK$5.0 billion due 2024. Under the New World Development Green Finance Framework (September 2018), a second three-year green loan was also obtained in May 2020 to support new green building projects.
ALLOCATION OF NWD’S GREEN LOAN (2018)
Category Projects Amount
Green Buildings K11 ATELIER KING’S ROAD HK$2.5 billion3
Total Drawdown Amount HK$2.5 billion
Loan Facility HK$5.0 billion
Project K11 ATELIER KING’S ROAD
Location Hong Kong
GFA 487,504 sq ft
Nature Office
Certifications • BEAM Plus New Buildings V1.2 Provisional Platinum obtained in September 2016
• LEED Platinum® obtained in August 2019
• WELL CertifiedTM Platinum obtained in December 2019
ALLOCATION OF NWD'S GREEN LOAN (2020)
Category Projects Amount
Green Buildings CHEUNG SHUN STREET, CHEUNG SHA WAN1 HK$500 million3
Total Drawdown Amount HK$500 million
Loan Facility HK$500 million
Project CHEUNG SHUN STREET, CHEUNG SHA WAN1
Location Hong Kong
GFA 529,185 sq ft
Nature Office
Certification • BEAM Plus New Buildings V1.2 Provisional Gold obtained in February 2019
• LEED® for Building Design and Construction: Core and Shell Development precertification Gold obtained in January 2019
• WELL PrecertifiedTM Platinum obtained in April 2019
1 The project names are subject to finalisation before official opening.2 Using ASHRAE 90.1-2007 as baseline (LEED v2009 Building Design and Construction: Core and Shell Development).3 Figure represents amount utilised in specified project.

While long-term business strategy is the backbone of the sustainable growth of every corporation, so much of the ESG advancement also depends on its commitment to responding quickly to new challenges and pivoting for the good of the society.
At the end of January 2020, when the COVID-19 outbreak triggered a severe shortage of medical supplies, NWD – understanding the importance of CSV, and committed to giving back – set up a HK$10 million anti-epidemic fund to support our overseas partners, the underprivileged in Hong Kong, and our employees across the Group. Since the outbreak, a total of RMB50 million has been donated to those in need in Hong Kong and to the healthcare sector in Mainland China.
Response to COVID-19Corporate Sustainability
At the height of Hong Kong’s second wave of COVID-19, NWD through #LoveWithoutBorders also made available its Pentahotel Hong Kong, Kowloon to medical staff in public hospitals. Free accommodation for professionals, including doctors, nurses and other health-care workers, was opened up as a salute to the unsung heroes.
Another important milestone of #LoveWithoutBorders was a worldwide donation of our face masks. As the pandemic continued to affect people’s livelihood globally, our steady supply of self-made face masks was proved a timely innovation to help alleviate the chronic shortage of medical supplies. An expedited shipment of over two million face masks to UNICEF and countries including France, Italy, South Korea and the United Kingdom was quickly made. By June 2020, through #LoveWithoutBorders and together with over 100 NGOs in Hong Kong and abroad, we have distributed over 11 million masks to our employees and those in need. We plan to continue with our benevolent efforts until we have seen this through together.
A task force, led by Executive Vice-chairman and CEO Adrian Cheng, was also formed overnight to devise creative business solutions to battle the pandemic. Its first initiative was the launch of the #LoveWithoutBorders campaign, a shared support platform that aims to bring love to the needy and share resources with local communities amidst the pandemic.
Through #LoveWithoutBorders, NWD adapted quickly and set up multiple local face mask production lines to produce over 200,000 Made-in-Hong Kong adult and kid face masks per day. In May 2020, the first batches were distributed in Hong Kong for free via our innovative “Mask To Go” dispensers. Debuting these automated dispensers meant that low-income families could for the first time gain easy, safe and stable access to the much-needed face masks through a simple scan-and-collect design over a period of 20 weeks. With the help of our NGO partners such as Society for Community Organisation, St. James’ Settlement, and The Salvation Army, our face masks have reached over 40,000 beneficiaries across 18 districts, adding colours and positive energy to the lives of those in need.
New World Development Company Limited 66 Annual Report 2020 67

Corporate Sustainability | Response to COVID-19
Having made these face masks available to the general public in Hong Kong, we also initiated a “You Buy a Box, We Donate a Box” campaign in August 2020 to make positive social progress with every purchase.
It is our long-term vision to use the power of business to give back to the society. In these unprecedented times, this vision has become all the more important and is the guiding star of our work. We must support each other and share resources whenever and in whichever way we are able to, because acts of benevolence not only benefit businesses, but the overall well-being of our community. It is therefore of utmost importance to give every stakeholder the same degree of attention as our shareholders, which we believe is at the core of CSV. In CSV and eliminating boundaries to resources, we at NWD look forward to creating a better community for the society and the long-term growth of our business for many more generations to come.
#LoveWithoutBorders embodies our vision of using the power of business to give back to society. It has led us to set up our own mask production lines, to invent the first “Mask To Go”
dispensers and smart redemption card system in Hong Kong, and to collaborate with non-profit organisations in finding an easy and convenient way of distributing face masks to low-income
families for free.
– Dr. Adrian Cheng, Executive Vice-chairman and Chief Executive Officer
New World Development Company Limited 66 Annual Report 2020 67

Sustainability GovernanceCorporate Sustainability
Audit Committee
Group Risk Management Committee
Group SustainabilitySteering Committee
Group Audit and Management Services Department
Group SustainabilityDepartment
NWD Departments &Heads of Business Units
Group SustainabilityTask Force
Sustainability Committee
BOARD OF DIRECTORS
Risk Management &Internal Control
Sustainability Governance & ESG Risk Management
New World Development Company Limited 68 Annual Report 2020 69
We believe the integration of sustainability principles and considerations into our governance framework is critical to our long-term success. ESG risks and their impact to the Group and its stakeholders are managed by policies and procedures, with regular performance monitoring, training and disclosures to ensure a high level of accountability.
Multiple Channels for Flagging Different ESG Risks
While our Group Risk Management Framework, which requires NWD departments and other major BUs to assess risk levels for a final review by the Audit Committee still applies, there are short and medium term ESG risks that demand more prompt flagging and responses. As such, we have launched a mobile-friendly “Issue Alert System”, which categorises an incident’s risk level based on user’s input and immediately alerts relevant departments and management by real-time notification and email to take actions. Risk-flagging training sessions are held regularly to increase all employees’ awareness and sensitivity to risk management. These measures have allowed us to address and mitigate reputational risks, health and safety impacts and provide better customer service. Issues logged by the alert system are compiled and assessed for management and board reporting.
To help employees better understand ESG risks, new and existing employees are assigned to take mandatory e-learning modules on the Group’s ESG policies including those related to bribery and corruption, health and safety, whistleblowing and sustainable procurement. All employees are required to pass the corresponding policy quizzes to ensure effective implementation.
For further information on our risk management framework, please refer to p.110–115.
Strengthening Governance of Sustainability Issues
While the organisational structure of sustainabil ity management from board to operational levels remains unchanged compared to last year’s (see the chart below and details on our sustainability website), we have reinforced SV2030 as a Group-wide exercise and strengthened our accountability by establishing relevant KPIs for our CEO, business units (“BUs”) and NWD departments and their teams. We believe this will motivate our employees to take concerted efforts towards our SV2030 targets and also bring our Group closer to linking the remuneration of top management to sustainability performance. Empowered by our Sustainability Committee and Group Sustainability Steering Committee, regular training and support in action plan development and budgeting are provided to all parts of the Group.
Given the climate emergency and our Group’s responsibilities to mitigate climate impacts in our operations, the Board of Directors has endorsed our ongoing assessment and disclosure of climate risks as per TCFD recommendations. The Board will also be updated regularly on the latest climate risks and opportunities, so as to provide guidance and support to our teams.
MATERIAL TOPICS• Bribery and Corruption• Corporate Governance

Employees
Tenants
Customers
Local Communities
Supply Chain Partners
Shareholders and Investors
Media
Academic and Professional Institutions
Corporate Sustainability | Sustainability Governance
Ways We EngageStakeholder Groups
• Surveys, interviews and focus groups • Intranet, employees’ mobile apps and e-newsletters• Training activities and talent development programmes • Employees’ competitions and team-building activities • Town hall meetings and forums • Task forces and committees • SV2030 action plan development and implementation facilitation • Volunteering in the community • Early risk flagging mechanism and semi-annually key risk reporting mechanism • Whistleblowing system
• Sustainable Tenancy Pledge (guidance on fitting-out, energy-saving, waste reduction and employee/customer engagement)
• Surveys and interviews • Meetings, seminars and visits • Tenant mobile apps such as WorkPro (NWCL), K11 ATELIER (within K11 app) and
Nework (within Artisanal Living app)
• Surveys and customer service hotlines • Company events and visits • Club memberships such as New World CLUB, NWCL Club, KLUB 11 and Donut Kids Club • Customer mobile apps such as Artisanal Living and K11 app• Social media• Corporate websites
• Corporate websites • Public/community events • Community initiatives such as New World Springboard Programme• Volunteering
• Tendering and procurement processes • Training and briefings • Audits and performance review • Surveys and meetings
• Annual General Meetings and results announcements • Annual and interim reports • Corporate websites • Roadshows and investor meetings • Regular newsletters • ESG awards and ratings
• Surveys • Media interviews and releases • Company events and visits • Feedback and responses to media enquiries
• Technical site visits • Membership• Regular meetings and dialogues• Conference presentations and participation
Government and Regulators
Peer Companies
• Responses to public consultations via professional institutions • Regular meetings and dialogues
• Surveys • Company events and visits • Exchange in professional institutions
Non-governmental Organisations
• Joint projects • Surveys • Regular meetings and dialogues • Company events and visits
New World Development Company Limited 68 Annual Report 2020 69
Proactive Engagement For Deeper Stakeholder Relationships
Understanding our stakeholders’ needs and concerns improves our business resilience and helps us stay relevant. We proactively seek stakeholders’ feedback on how well we integrate SV2030 into our sustainability initiatives with the objective of CSV.

Corporate Sustainability | Sustainability Governance
Finding Strategic Focus Among Priority ESG Issues
We conducted a stakeholder engagement and materiality assessment in FY2020 to identify our latest ESG priorities among 20 broad issues which are also addressed by our industry peers. Approximately 540 responses to our online surveys from both internal and external stakeholders in Hong Kong and Mainland China were assessed by our third-party consultant. Ten in-depth interviews were also conducted by the consultant with our global partner organisations and contractors and suppliers to gain further insights into their expectations for our performance, as well as our potential opportunities and barriers to drive ESG from their perspectives.
The findings of the assessment are communicated internally with the Sustainability Committee, senior management and Group Sustainability Steering Committee to inform our regular strategy review. The top three material issues to internal and external stakeholders, namely bribery and corruption, corporate governance and occupational health and safety, are consistent with FY2019 results. The rankings are outlined in the table below.
Material Topics (1 being the most important)
How We Address Boundary
Inside the Group Outside the Group
1. Bribery and Corruption Sustainability Governance p.68–71Influencing the Supply Chain p.85
2. Corporate Governance Sustainability Governance p.68–71Empowering Our People p.84
3. Occupational Health and Safety Empowering our People p.83Influencing the Supply Chain p.85
4. Talent Management Empowering our People p.81
5. Innovation Safeguarding the Environment p.75–77, 79Empowering our People p.81Caring for the Customers p.86Fostering Sustainable Communities p.88–89
6. Financial Performance Financial Highlights p.25
7. Customer Wellness, Health and Safety Caring for the Customers p.86–87
8. Employee Wellness and Engagement Empowering our People p.82–83
9. Energy and Carbon Management Safeguarding the Environment p.75–77Influencing the Supply Chain p.85Caring for the Customers p.87
10. Responsible Supply Chain Management Influencing the Supply Chain p.85
11. Human Rights and Grievance Mechanisms Empowering our People p.84
12. Community Development and Engagement Fostering Sustainable Communities p.88–89
13. Customer and Tenant Engagement Caring for the Customers p.86–87
14. Waste Disposal and Recycling Safeguarding the Environment p.79Caring for the Customers p.87
15. Use of Materials and Biodiversity Safeguarding the Environment p.80
16. Diversity and Equal Opportunities Empowering our People p.84
17. Adaptability to Climate Change Impacts (Emerging Topic) Safeguarding the Environment p.75–78
18. Community Wellness (Emerging Topic) Fostering Sustainable Communities p.88
19. Ageing Population Caring for the Customers p.86
20. Water Consumption (Emerging Topic) Safeguarding the Environment p.78
New World Development Company Limited 70 Annual Report 2020 71

Top Priorities
Imp
ort
ance
to
sta
keh
old
ers
#
Importance to business continuity and development ^
20
19
18
17
15
16 13
12
14 4
9
11
10
7
8
6
5
32
1
Corporate Sustainability | Sustainability Governance
NEW AND UPDATED ESG-RELATED POLICIES
Implementation progress of our ESG-related policies is checked yearly with a major review to be conducted by our Group Audit and Management Services Department every three years. Review findings will be shared with the Group Sustainability Steering Committee and board-level Sustainability Committee and Audit Committee. A review was initiated in FY2020 which resulted in updates on existing policies and drafting of new ones based on the latest industry standards and operational needs. Approved policies are available on our sustainability website. Ongoing training is provided to all employees on these policies and processes.
New policies have also been published to ensure that we keep up with the latest requirements:
• Biodiversity Policy states our commitment to safeguarding the health of our ecosystem and measures to minimise adverse environment impacts in our operation.
• Climate Change Policy states our commitment to combating climate change, improving resilience, our alignment to the recommendations of TCFD and our ambition to set SBT.
• Waste Management Policy illustrates the areas of focus in waste management and promotes a circular economy.
• Water Policy acknowledges that water is an essential but a constrained resource to our business and society and therefore we will introduce water efficiency measures and standardise water management.
Significant changes to existing policies include:
• Human Rights Policy now recognises human rights as defined by international standards and local regulation and aligns with the UNGC’s principles.
• Sustainable Building Policy reflects our elaborated lifecycle approach to manage environmental impacts in new and existing buildings, climate change actions, tenant engagement efforts, as well as smart, caring and wellness initiatives concerning the built environment.
Green Wellness Smart Caring Transversal
MATERIALITY MATRIX
ModeratelyImportant Highly Important CriticalImportant
# Importance to stakeholders is determined by external stakeholders’ rating of the material issues in terms of their importance to the society/environment and their relevance to NWD.
^ Importance to business continuity and development is determined by internal stakeholders’ rating of the likelihood and level of potential impact of the issues affecting NWD’s business continuity and development.
New World Development Company Limited 70 Annual Report 2020 71

Corporate Sustainability
Project Highlights - Taking Sustainable Building and Craftsmanship to New Heights
BUILDING A NEW LANDMARK FOR OLD CITY ZENGCHENG, GUANGZHOU
The Group has been engaged in Greater Bay Area redevelopment projects including Xili in Nanshan, Shenzhen; Shancun in Liwan, Guangzhou; Nanji Village in Haizhu, Guangzhou and Tagang Village in Zengcheng, Guangzhou. On 8 June 2020, NWCL announced that it will invest RMB20 billion as the intended cooperative enterprise for the redevelopment project of Xiajie Village on Licheng Street of Zengcheng, Guangzhou.
Xiajie Village is one of the oldest in Zengcheng to have maintained classic architectural elements such as ancient brick residences and large ancestral hall. The Xiajie Village project actively preserves these elements and historical passageways of the neighbourhood while injecting modern elements to engage new residents and visitors, including hotel, residence, office, retail and other leisure amenities. The Group also dedicates efforts to revitalise olive kernel carving — a national intangible heritage craftsmanship originated in Zengcheng.
Promoting Sustainable Cities and Communities by Preserving Cultural Heritage
Our properties provide a platform for promoting sustainable cities and communities, in support of SDG 11. Our aim is not only to strategically reduce our operational environmental impact but also to preserve the cultural and natural heritage of our business locations. This approach is reflected in NWCL’s brand positioning — “Soul of the City”. Under the guidance of the Central Government and Greater Bay Area pol ic ies, and through community partnerships, NWCL balances sustainability, innovation and cultural preservation in urban renewal.
Zengcheng Project, Guangzhou
Olive Kernal Carving1
1 Guangzhou Olive Kernel Carving Heritage Base listed in Licheng, Gucunzhiyou, 30th August 2017, <http://gucunzhiyou.com/gczy/2960.html>
New World Development Company Limited 72 Annual Report 2020 73

Corporate Sustainability | Project Highlights
REBUILDING A HISTORICAL RESIDENCE IN BEIJING
A city’s future development is anchored in its cultural heritage. Qing Dynasty official records revealed the historical residence of the famous Chinese writer Cao Xueqin in Beijing. In 2019, NWCL confirmed to launch this unique rebuilding project.
Given the historical value of the site, NWCL introduced Building Information Modeling (“BIM”) technology to simulate design scenarios for visualisation before actual works began, and to preserve comprehensive project data for future learning. Offsite pre-installation processes also took place to ensure the accuracy of on-site installation, improve project quality and reduce resource wastage.
The project embodies the Group’s cultural aspirations by bringing traditional culture to life and promoting sustainable development building on our heritage.
Cao Xueqin Residence in Beijing
New World Development Company Limited 72 Annual Report 2020 73

Corporate Sustainability
Safeguarding the Environment
Reinforcing our Support for the TCFDHaving adopted TCFD’s recommendations since FY2019, NWD pledged its support to the TCFD officially in FY2020. We will continue to follow closely any status reports and relevant materials published by the TCFD and align our disclosures with market best practices. Below is a summary of our climate-related risks disclosure.
Focus Area
Governance
Our Approach
Strategy
Risk Management
Metrics and Targets
Board oversight: The Sustainability Committee meets at least twice a year to oversee climate-related strategies, policies, actions and disclosure.
Management’s role: The Group Sustainability Steering Committee supports climate action planning and internal policy setting, as well as coordinates responses to climate-related risks and opportunities across BUs for disclosure.
Group Sustainability Department: Coordinates Group-wide efforts to assess physical and transition climate risks and opportunities for strategic planning by the Management and the Board.
Please refer to p.68 for our sustainability governance structure.
Policies and guidelines: The Group’s latest Climate Change Policy and updated Sustainable Building Policy outline our commitments to addressing climate-related risks and opportunities in our businesses, raising climate change awareness among our internal and external stakeholders and incorporating protection measures and resilient designs against local climate risks over building lifespan. We are currently forming more partnerships through industry groups and developing climate resilient building design guidelines to capture these opportunities.
Generally, NWD addresses sustainability issues throughout the property lifecycle from design and build, financing, operation to building user engagement stages. With reference to TCFD’s recommendations, we are actively identifying viable pathways to decarbonise under the 1.5°C scenario and fulfil SBT requirements by increasing renewable energy adoption and reducing Scope 3 emissions1. Please refer to p.77 for details.
Physical risks: In FY2019, we assessed the impact of climate-related risks (flooding, extreme wind, water stress and heat stress) on 14 major properties in the Greater Bay Area under two Intergovernmental Panel on Climate Change (“IPCC”) Representative Concentration Pathway (“RCP”) scenarios: a medium-risk scenario where global average temperature increases by no less than 2.5°C (RCP 6.0) and an extreme scenario where temperature increases by over 4.0°C (RCP 8.5). Based on our project locations, no severe climate risks were identified. We have implemented quick wins related to regular inspections, maintenance and audits, and have developed a hardware enhancement plan for flood risk prevention. Please refer to p.77 for details.
Transition risks: We developed an internal climate change policy to better manage our risk responses. The policy states our approach to climate change as well as our adaptation and resilience measures. We will actively monitor and respond to regulatory changes and industry standards related to our business locations.
Opportunities: Based on the insights from our risk assessments, we will capture the opportunities to incorporate climate-friendly building and service designs, engage our tenants, customers and suppliers to take climate actions, promote innovative technologies to reduce our environmental impact and utilise sustainable finance to accelerate our efforts to combat climate change.
Climate-related risks are incorporated into the Group’s risk management framework and ESG materiality assessment by different stakeholders. The Group Sustainability Department initiates the monitoring and follow-up of both transition and physical climate-related risks and suggests strategic responses with relevant sites to BUs’ management. At the end of FY2020, an assessment was conducted to quantify the financial impacts of climate risks. Findings and updates are reported regularly to the management and the Board. For details, please refer to p.68.
In FY2019, we established 2030 reduction targets based on FY2015 levels for carbon, energy, water and waste on an intensity basis (denominated per million HK$ revenue) and started to disclose our progress annually. For details, please refer to p.75, 78–79.
Departmental contributions towards reduction targets are linked to yearly performance evaluations and employee remuneration. We will explore the possibility of linking the management’s remuneration with these targets.
We have completed a feasibility assessment in order to set SBT for NWD’s property and construction businesses within the next three years. Please refer to p.77 for details of our roadmap.
1 Scope 3 emissions: indirect emissions (not in Scope 2) that occur in the value chain of the reporting company, including both upstream and downstream emissions (Corporate Value Chain (Scope 3) Accounting and Reporting Standard).
New World Development Company Limited 74 Annual Report 2020 75

Corporate Sustainability | Safeguarding the Environment
Towards a Decarbonised Future
Climate change poses unprecedented challenges for business operations and human survival. Our core property business has opportunities as well as responsibilities to reduce its carbon footprint and therefore operating costs through energy efficiency improvements. While we are working towards our SV2030 energy and carbon emissions intensity reduction targets, we are also exploring viable ways to further decarbonise under the Paris Agreement’s 1.5ºC scenario.
MATERIAL TOPICS• Energy and Carbon Management• Adaptability to Climate Change Impacts• Innovation
2015
0%
-10%
-20%
-30%
-40%
-50%
-60%
2016
2017
2018
2019
2020
2021
2022
2023
2024
2025
2026
2027
2028
2029
2030
2020 Progress
-22% -39% -50%2025 Milestone 2030 Target
Carbon Emissions lntensity Reduction %
Baseline year
(Unit: tCO2e/million HK$ revenue)
Sustainability Reporting Scope - Total Energy and Carbon Emissions
For the Sustainability Reporting Scope, the Group’s total energy consumption and carbon emissions in FY2020 reduced by 7% and 4%, respectively, compared to FY2019. We believe this is a combined result of our sustainability initiatives and COVID-19 impacts.
By FY2020, energy intensity and carbon emissions intensity of the SV2030 Green Targets Scope reduced by 17% (MWh/million HK$ revenue) and 22% (tCO2e/million HK$ revenue), respectively, compared to the FY2015 baseline. The reduction percentage as at FY2020 is lower than that of FY2019. Given SV2030 Green Targets were projected based on a business-as-usual scenario, we will continue to monitor our business operations under the new normal and update the carbon reduction trajectory as needed.
FY2020 Performance Compared to FY20151
1 Covers the SV2030 Green Targets Scope. NWSH and NWDS also disclose their environmental targets in their annual sustainability reports. Revenue was selected as the intensity metric due to the diverse business nature of the Group’s portfolio and that revenue is the common thread across sectors.
Energy intensity (MWh/million HK$ revenue)(FY2030 target: 50%)
Carbon emissions intensity (tCO2e/million HK$ revenue)(FY2030 target: 50%)
17%
22%
ENERGY
12% 4% 73% 11%
13% 3% 73% 11%
10% 3% 74% 13%
NWD NWCL NWSH NWDS
FY2020 TOTAL: 5,877,063 GJ
FY2019 TOTAL: 6,336,786 GJ
FY2018 TOTAL: 6,378,720 GJ
CARBON EMISSIONS
19% 7% 57% 17%
17% 5% 60% 18%
13% 5% 60% 22%
NWD NWCL NWSH NWDS
FY2020 TOTAL: 589,299 tCO2e
FY2019 TOTAL: 615,518 tCO2e
FY2018 TOTAL: 623,039 tCO2e
New World Development Company Limited 74 Annual Report 2020 75

Corporate Sustainability | Safeguarding the Environment
Key Initiatives in FY2020
• PROPERTY & CONSTRUCTION
SV2030 Green Targets Scope Properties’ Performance
FY2020 FY2019
Energy intensity (kWh/sq m)
99 136
Carbon emissions intensity (kgCO2e/sq m)
57 76
Significant reductions in the energy intensity (kWh/sq m) and carbon emissions intensity (kgCO2e/sq m) of our properties in SV2030 Green Targets Scope were recorded in FY2020 due to lower usage during COVID-19. This scope has saved over HK$11.3 million in utilities, compared to FY2019. Various measures have been implemented to improve our building energy efficiency, including chiller system enhancement, building management system (“BMS”) upgrade, installation of our patented real-time building energy monitoring system – Eco-World at new sites, sensors and energy valves installation, etc.
Our Group supports the transition towards a low carbon future. We will explore further adoption of Renewable Energy (“RE”) in our premises and relevant investments offsite. During FY2020, two of our signature projects within the Sustainability Reporting Scope have installed rooftop solar systems and joined the Feed-in Tariff (FiT) schemes of the power companies:
Hong Kong Golf & Tennis Academy (“HKGTA”):
• Generation capacity of 110 kWp• Joined FiT scheme of CLP Power Hong Kong Limited• Generated over 22,000 kWh of RE since installation
in April 2020
Hong Kong Convention and Exhibition Centre (“HKCEC”):
• Generation capacity of 10 kWp• Joined FiT scheme of HK Electric• Generated over 4,000 kWh RE since installation in
February 2020
Hong Kong Golf & Tennis Academy
New World Development Company Limited 76 Annual Report 2020 77

solar panels generating 1,500 watts power, to supply electricity for lighting system and passenger information facilities for as long as 7.5 hours a day. Additionally, we are taking steps to install chargers at bus terminals to facilitate mid-day charging for electric buses.
Future Plans and Ongoing Measures
• Set SBT for NWD’s construction and property portfolio within the next three years:
o We will continue to drive down Scope 1 and 2 emissions according to the energy efficiency initiatives planned under SV2030.
o For Scope 3 emissions, we will install sub-meters to further understand tenant energy consumption and work with our supply chain partners to track embodied carbon in construction materials in both Hong Kong and Mainland China, using local tools and relevant methodologies. Please refer to Influencing the Supply Chain on p.85 for more details.
o To reduce our unavoidable emissions, we are looking to increase investment in renewables, such as enhancing onsite renewable generation capacity by installing more solar panels or wind turbines onsite as well as procuring offsite renewable energy.
• Enhance our properties’ climate resilience and adaptability in the next two years:
o Flood risk protection hardware such as flood gates will be installed for selected properties covered in our climate risk scenario analysis according to consultant’s recommendations.
o Climate resilience design guidelines for new buildings will be established.
• Provide training and engagement in energy and carbon management and climate issues:
o Different internal stakeholders ranging from board executives to individual employees have been engaged in various trainings on climate change, SV2030 progress, energy and carbon reduction initiatives, etc. Please refer to Empowering our People section for more details on p.81.
Corporate Sustainability | Safeguarding the Environment
For our construction businesses, Hip Hing Construction Co., Ltd. (“Hip Hing”) has replaced traditional diesel generators with the Enertainer, a connected battery system, to power construction activities at various project sites. This innovative system can avoid direct air pollutants, improve energy efficiency and significantly reduce carbon emissions, noise level and fire hazards during construction. For example, at one of the project sites, the Enertainer achieved about 80% reduction of net carbon footprint and up to 85% energy savings.
Climate risk resilience is being considered throughout the property lifecycle. Please refer to the TCFD section for more details on p.74.
To accelerate our alignment to the Paris Agreement, we have completed a feasibility study of developing SBT and identified downstream leased assets and embodied carbon1 in building materials as the sources of our material scope 3 emissions.
In light of the global industry’s ambition of “Advancing Net Zero”, we pledged our support for Hong Kong Green Building Council’s relevant initiative and will monitor recommended best practices to achieve the goal for all buildings to operate at net zero by 2050.
• TRANSPORTATIONThe transportation sector remains a major contributor to our Group’s overall energy consumption and carbon emissions. Our bus companies in Hong Kong introduced the first double-decker equipped with 20 pieces of
1 Embodied carbon: carbon emissions associated with materials and construction processes throughout the whole lifecycle of a building or infrastructure (World Green Building Council).
New World Development Company Limited 76 Annual Report 2020 77

Managing Water Resources and Climate-related Risks
Water is recognised to be a constrained but essential resource, both for business sustainability and more broadly, for society and the environment – especially within the Greater Bay Area which faces a triple threat of water shortage, climate change and population growth. A recent study1 has shown that eight of 11 Greater China cities, including Guangzhou and Hong Kong, are dry and face extremely high levels of water pollution in the Dongjiang River. Given that the Dongjiang supplies water to five Greater Bay Area cities including Hong Kong, its ongoing pollution will have a devastating impact on our freshwater availability.
As early as 2030, these rising risks could threaten key sectors that drive the region’s GDP, including real estate. To prepare and align ourselves with global standards and best practices, careful water management, planning and cohesive resilience strategies will need to be implemented. We aim to set a group-level water target in the near future.
Compared to FY2019, the Group’s water consumption increased by almost 1,000,000 m3. The increase was mainly due to the inclusion of new construction sites that were undergoing water-intensive foundation works as well as new properties in operation. Additionally, NWDS’ decrease in water consumption from FY2019 was mainly due to temporary closure of some of the department stores, shortening of business hours and restricted business for Food and Beverage (“F&B”) tenants during COVID-19.
Key Initiatives in FY2020
• RISK ASSESSMENT AND RESPONSESAs part of the climate risk scenario analysis of our building portfolio in the Greater Bay Area, climate-related water risks, namely flooding and water stress, are evaluated.
• Flooding: Only minor impacts related to flood risk are observed in the long-run for properties in Hong Kong that are located close to the coastline (i.e. susceptible to sea-level rise). This is predominantly due to Hong Kong’s robust drainage network and sufficiently high seawalls. To become more flood-resilient, we have implemented quick-win measures for each site, such as regular inspections, audits and maintenance and have identified hardware enhancement plan for flood risk prevention.
• Water stress: No immediate and significant risks were identified relating to the location of our assessed properties.
• “SPONGE CITY” DESIGN STRATEGYWe implement sponge city features in our properties to redistribute water and tackle flooding. Ningbo New World is one of the latest examples in Mainland China with features include a bio-retention pond, a rain-water garden, permeable pavements and ecological rooftop, making this a green landmark in the city. Collectively, these sponge city design features contribute a water retention capacity of approximately 1,800 m3 and ease the burden of the municipal water drainage. More importantly, they help delay the peak discharge during flooding by 10-15 minutes.
Corporate Sustainability | Safeguarding the Environment
Future Plans and Ongoing Measures
• Install flood risk protection hardware such as flood gates for selected properties covered in the climate risk scenario analysis according to consultant’s recommendations.
• Install water-efficient fixtures to reduce our consumption.
• Install sub-meters at new projects and major refurbishments to collect more comprehensive water data for preparation of setting a Group-wide water target in the future.
1 China Water Risk, 2019, Thirsty And Underwater: Rising Risks in Greater Bay Area <http://www.chinawaterrisk.org/resources/analysis-reviews/thirsty-and-underwater-rising-risks-in-greater-bay-area/>2 The water intensity target covers NWCON only.
MATERIAL TOPICS• Water Consumption• Adaptability to Climate Change Impacts
Water intensity (m3/million HK$ revenue)(FY2030 target: 25%)
9%
FY2020 Performance Compared to FY20152
Sustainability Reporting Scope – Total Water Consumption
29% 35% 22% 14%
26% 26% 27% 21%
17% 21% 34% 28%
NWD NWCL NWSH NWDS
FY2020 TOTAL: 5,687,628 m3
FY2019 TOTAL: 4,679,137 m3
FY2018 TOTAL: 4,324,609 m3
Ningbo New World
New World Development Company Limited 78 Annual Report 2020 79
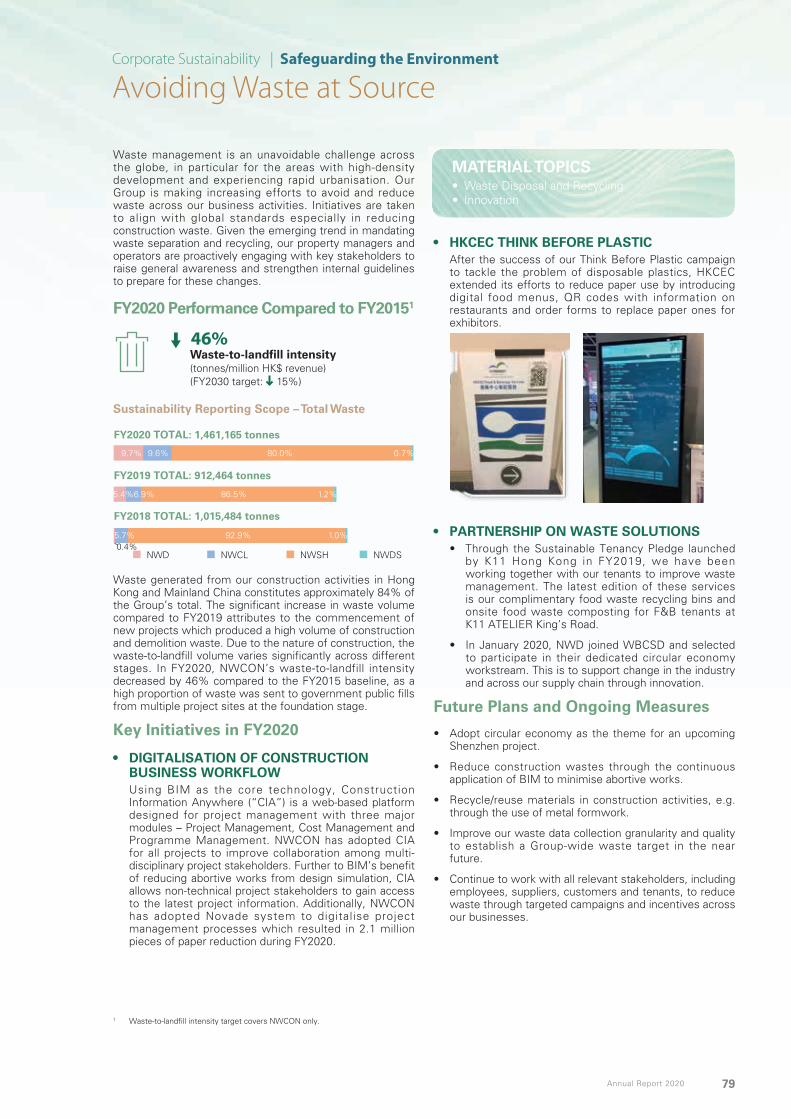
Avoiding Waste at Source
MATERIAL TOPICS• Waste Disposal and Recycling • Innovation
Waste management is an unavoidable challenge across the globe, in particular for the areas with high-density development and experiencing rapid urbanisation. Our Group is making increasing efforts to avoid and reduce waste across our business activities. Initiatives are taken to align with global standards especially in reducing construction waste. Given the emerging trend in mandating waste separation and recycling, our property managers and operators are proactively engaging with key stakeholders to raise general awareness and strengthen internal guidelines to prepare for these changes.
• HKCEC THINK BEFORE PLASTICAfter the success of our Think Before Plastic campaign to tackle the problem of disposable plastics, HKCEC extended its efforts to reduce paper use by introducing digital food menus, QR codes with information on restaurants and order forms to replace paper ones for exhibitors.
Corporate Sustainability | Safeguarding the Environment
46%Waste-to-landfill intensity(tonnes/million HK$ revenue)(FY2030 target: 15%)
FY2020 Performance Compared to FY20151
Waste generated from our construction activities in Hong Kong and Mainland China constitutes approximately 84% of the Group’s total. The significant increase in waste volume compared to FY2019 attributes to the commencement of new projects which produced a high volume of construction and demolition waste. Due to the nature of construction, the waste-to-landfill volume varies significantly across different stages. In FY2020, NWCON’s waste-to-landfill intensity decreased by 46% compared to the FY2015 baseline, as a high proportion of waste was sent to government public fills from multiple project sites at the foundation stage.
Key Initiatives in FY2020
• DIGITALISATION OF CONSTRUCTION BUSINESS WORKFLOWUsing BIM as the core technology, Construction Information Anywhere (“CIA”) is a web-based platform designed for project management with three major modules – Project Management, Cost Management and Programme Management. NWCON has adopted CIA for all projects to improve collaboration among multi-disciplinary project stakeholders. Further to BIM’s benefit of reducing abortive works from design simulation, CIA allows non-technical project stakeholders to gain access to the latest project information. Additionally, NWCON has adopted Novade system to digitalise project management processes which resulted in 2.1 million pieces of paper reduction during FY2020.
• PARTNERSHIP ON WASTE SOLUTIONS• Through the Sustainable Tenancy Pledge launched
by K11 Hong Kong in FY2019, we have been working together with our tenants to improve waste management. The latest edition of these services is our complimentary food waste recycling bins and onsite food waste composting for F&B tenants at K11 ATELIER King’s Road.
• In January 2020, NWD joined WBCSD and selected to participate in their dedicated circular economy workstream. This is to support change in the industry and across our supply chain through innovation.
Future Plans and Ongoing Measures
• Adopt circular economy as the theme for an upcoming Shenzhen project.
• Reduce construction wastes through the continuous application of BIM to minimise abortive works.
• Recycle/reuse materials in construction activities, e.g. through the use of metal formwork.
• Improve our waste data collection granularity and quality to establish a Group-wide waste target in the near future.
• Continue to work with all relevant stakeholders, including employees, suppliers, customers and tenants, to reduce waste through targeted campaigns and incentives across our businesses.
Sustainability Reporting Scope – Total Waste
9.7% 9.6% 80.0% 0.7%
5.4%6.9% 86.5% 1.2%
5.7%0.4%
92.9% 1.0%
NWD NWCL NWSH NWDS
FY2020 TOTAL: 1,461,165 tonnes
FY2019 TOTAL: 912,464 tonnes
FY2018 TOTAL: 1,015,484 tonnes
1 Waste-to-landfill intensity target covers NWCON only.
New World Development Company Limited 78 Annual Report 2020 79

MATERIAL TOPICS• Use of Materials* and Biodiversity * Refer to p.85 Influencing the Supply Chain
Protecting Biodiversity
The World Economic Forum 2020 listed major biodiversity loss and ecosystem collapse as one of the top five global risks for the next ten years1. Extraction of natural resources and pollution are among the key drivers of biodiversity loss, with severe implications for the economy and public health and well-being, as well as for our supply chain. Hong Kong, despite its urban density, is one of the most biodiverse cities in the world. Starting with our Group’s headquarters, we hope to protect biodiversity by enhancing our operations and raising public awareness.
SUSTAINABLE LANDSCAPE FOR THE COMMUNITYWith this in mind, a Group-level Biodiversity Policy is introduced to illustrate our commitment to protecting the natural environment throughout the design and operation of our products and services. We strive for Sustainable SITES Initiative (“SITESTM”) certification by the U.S. Green Building Council where possible – a framework for sustainable landscape development projects with a focus on landscape, ecosystems and biodiversity. Salisbury Garden and Avenue of Stars of the Tsim Sha Tsui Waterfront Revitalisation have achieved SITESTM v2 Gold certification.
PROMOTING BIODIVERSITY TO FUTURE GENERATIONS
Nature Discovery Park’s vision is recognised by the HKSAR Government which held a public exhibition there in October 2019 during the annual Hong Kong Biodiversity Festival and attracted more than 5,000 visitors.
1 World Economic Forum, 2020, Burning Planet: Climate Fires and Political Flame Wars Rage <https://www.weforum.org/press/2020/01/burning-planet-climate-fires-and-political-flame-wars-rage>.
Nature Discovery Park, Hong Kong’s first urban biodiversity museum and sustainability-themed education park at K11 MUSEA, has engaged over 26,000 visitors since opening last year. The Park offers guided green tours, urban farming workshops and farm-to-table experiences. The Park hosts over 180 plants with a majority of local species and butterfly food plants to maintain the integrity of urban butterfly habitats. The farm at the Park supports the local and organic food movement by sharing agricultural knowledge with the community and tenants. To educate future generations on the importance of local biodiversity in Hong Kong, the Park launched the Little Nature Ambassador Programme in partnership with The Jane Goodall Institute (Hong Kong) and local social enterprises – a programme suited for children aged 2-6 with four online modules covering various aspects of biodiversity in August 2020. The Park is also supporting the University of Hong Kong’s School of Biological Sciences in their local species research and development of education tools and leadership programmes to educate the public about the abundance of local insect species and the ecosystem of Hong Kong.
We will continue to consider biodiversity protection in our operational practices through setting in-house guidelines and promoting public awareness in Greater China with reference to international standards.
Learning about nature with a multi-sensory learning kit in the Little Nature Ambassador Programme.
Corporate Sustainability | Safeguarding the Environment
New World Development Company Limited 80 Annual Report 2020 81

We are motivated to create a working context where people thrive and talents are well-developed. Ultimately, we aim to foster a culture that empowers employees to create shared value for different stakeholders and prepares our team for the future of work.
Grooming an Innovative and Resilient WorkforceWe are committed to supporting our people to realise their career ambitions. We welcome talents that are entrepreneurial and demonstrate a growth mindset. Aspiring to become the employer of choice, we invest in training and development to build a productive and future-ready workforce.
Key talent attraction initiatives in FY2020:
• A. Entrepreneur Park held in Guangzhou engaged about 90 entrepreneurs on the topics of wellness, sustainability and shared value and drove potential synergies and col laborat ions between these entrepreneurs and the Group.
• New World Group’s first-ever Virtual Internship Programme 2020 during COVID-19 welcomed around 100 interns to join our virtual tours and e-learning during their onboarding journey.
Key training initiatives in FY2020:
• All employees are encouraged to join design thinking workshops, to promote a human-centric approach to understanding customers’ unarticulated needs and generating new ideas beyond customers’ expectation.
• E-learning platform is launched to cover all BUs of the Group. A total of 134 modules on themes such as corporate policies and guidelines (including ESG policy quizzes), business focus and productivity are offered. In the first year, around 88,000 courses were completed.
• Senior executives from major BUs joined our first Sustainability Forum in January 2020, Activating Change in A New World Order, to connect with experts on climate change.
• Over 10,000 employees in Hong Kong and Mainland China participated in a series of CSV and ESG training with additional strategy development sessions for senior executives.
• Briefings on SV2030 progress and climate resilience for the Sustainability Committee, as well as for relevant operation teams.
• NWCL organised its first workshop for some 200 department representatives across different regions in China to deepen their understanding of climate issues.
Employee appraisal is an essential part of sustainable employee development. Our key approaches include:
• Conducting a 360-degree evaluation of employees’ core competencies.
• Evaluating line managers on their abilities to manage and lead team performance, to uphold our priority on talent grooming.
• Establishing SV2030 KPIs for the Group, departments and individual managerial employees. These KPIs include green targets, the number of sustainability events organised or attended, and other measurable goals and performance will be considered in year-end appraisal and bonus calculation.
• Establishing Objectives and Key Results (“OKR”) for the Group and BUs to encourage employees to be ambitious and think about their long-term impact.
MATERIAL TOPICS• Talent Management• Innovation
GROUP EMPLOYEE PROFILE
Corporate Sustainability
Empowering Our People
Age Group
Geographical Region
AVERAGE TRAINING HOURS
18.9 hrs per employee (26% from last year)
12,399 hrsSustainability-related training hours
Under 30 years old 30-50 years old Over 50 years old
Hong Kong Mainland China Others
Moving forward, e-learning will be a key mode of training. To equip our employees with the mentality to overcome new challenges, we will launch a new initiative, “From Question to Innovation”, which empowers employees to adopt a growth mindset, develop an inquisitive mind and find new solutions in a volatile business environment.
Male
17.8 hrs
Management
19.4 hrs
Female
20.9 hrs
Non-management
18.8 hrs
16.4%
57.2%
55.8%44.1%
0.1%
26.4%
New World Development Company Limited 80 Annual Report 2020 81

Listening to the Needs of EmployeesCorporate Sustainability | Empowering Our People
After a few years of promoting SV2030, our employees at different levels of responsibility, demonstrate an awareness of the Group’s priority in sustainability and understand their input contributes to the greater good. Our success depends on them, and so we keep an open dialogue and try out new forms of engagement to nurture a sense of belonging and address their ever-changing needs.
Adrian Cheng shared the Group’s strategic priorities during the New World Group Town Hall.
A culture of alertness is fostered across the Group through online and offline learning to encourage all corporate and frontline employees to communicate proactively on any potential issues, from operational risks to unsatisfactory customer service, or ways to improve the working environment.
We will conduct an employee satisfaction survey by the end of 2020 to understand the needs and expectations of employees to help the Group improve, for example, in the areas of company strategy, corporate culture and employee compensation and benefit. We will also continue to keep employees abreast of the Group’s sustainability initiatives through e-newsletter, website and social media and support our employees to translate awareness into actions as we move forward with SV2030.
Empowering our people and developing their leadership skills will strengthen the resilience of our workforce. We believe in pursuing excellent performance by staying focused, aligned and ambitious.
Employees participated in New World Group Town Hall from different office locations.
MATERIAL TOPICS• Employee Wellness* and Engagement * Refer to the next page (p.83)
Group Strategic Workshop – “New World Ecosystem Co-Creation @ GBA”
CSV Cultivation Journeys
New World Group Town Hall – “New World. New Growth”
Over 300 senior executives exchanged ideas on the business strategy in the Greater Bay Area – the Group’s core development location, on 12 September 2019.
Across the Group, 200 ambassadors were recruited to propagate CSV as our corporate strategy. Up to 30 business visits have been organised since late 2019 to help employees understand this concept. Together with online activities, around 10,000 participants were engaged in FY2020.
Over 5,500 employees in Hong Kong and Mainland China joined and had an interactive dialogue with our CEO on 18 June 2020, to understand the latest strategic priorities in response to the challenging business environment due to COVID-19. Major BUs such as NWSH and K11 also held their town hall meetings to cascade the key messages after.
KEY EMPLOYEE ENGAGEMENT INITIATIVES IN FY2020:
New World Development Company Limited 82 Annual Report 2020 83

Corporate Sustainability | Empowering Our People
Putting Our Employees’ Health First
Our employees are our greatest assets: their safety and well-being are our priority. We are committed to providing our employees with the safest working environment possible. Our Health and Safety Policy1 outlines our approaches towards managing and monitoring health and safety risks. For the long-term, investing in initiatives that improve employees’ health and well-being makes good business sense.
We closely monitor the impact of COVID-19 on our workforce to ensure business continuity and prioritise our people’s health and well-being. A cornerstone of our approach to employees’ health and well-being in these challenging times is to rely on innovation and knowledge-sharing to take people out of fear and uncertainty through different initiatives and measures.
MATERIAL TOPICS• Employee Wellness and Engagement• Occupational Health and Safety
COVID-19 Responses:
NWCON was the1st Company in Hong Kong to
halt construction work for two weeks to protect employees and their families
20,000 Protective Kits distributed to employees in February 2020 as pandemic relief
A one-month online programme to encourage employees to keep up their fitness routines by exercising anywhere.
Key activities during COVID-19:
• Ongoing communication and information are given to employees regarding the Prevention of Pneumonia and Respiratory Infections since late December 2019.
• One of the first corporates in Hong Kong to implement flexible work arrangement in January 2020, install automated hand disinfectant at the workplaces, and distribute masks to all employees weekly since the first months of the outbreak.
• A mandatory health declaration form to monitor the health status of all employees daily was made available via our internal smart office app, and we extended its coverage to our visitors in April 2020.
• Online web conferencing tools are used to minimise the risk for our employees for meetings and visitors arrangements.
• Frequent disinfecting is conducted in high footfall areas such as public corridors, pantries and reception areas, whereas carpets and air filters were cleaned every two weeks to foster a healthy workplace.
• FTLife Insurance offers free medical insurance coverage to the Group’s employees in Hong Kong and Macau offices until 31 December 2020.
• In places where food hygiene is a concern, such as NWDS’ four branches of “New World Supermarket”, enhanced precautionary measures have been taken, with all our employees required to wear masks and rubber gloves, as well as check their temperatures every four hours.
Lost-Time Injury Rate2
1 Details are available on our Corporate Website – Sustainability > Sustainability Governance & Policies.2 Lost-time injury rate represents the number of injuries per 100 employees per year.
1.7FY2020
2.5FY2019
VS
Key employee wellness programmes in FY2020:
• Organised two well-being campaigns – Mindful New World and New World Group Well-being Challenge, which promote the mental and physical health of our colleagues through online meditation and fitness programme during social distancing.
• Hiking trips led by professional hiking coach and social worker to Kamikochi in Japan, Lau Shui Heung, Sai Kung and outlying islands in Hong Kong were organised by Humansa for the Group’s colleagues to promote physical and mental health.
• NWSH offered “Workout within Limits” – a collaboration with OnBoard For Good. Professional fitness trainers were engaged to provide a series of eight office workouts (15 minutes each), via Zoom during office hours in April and May 2020 to promote employee wellness and health.
• Since 1 July 2019, medical benefits under an outpatient plan have been enhanced by increasing our medical insurance and dental scheme coverage.
New World Development Company Limited 82 Annual Report 2020 83

Corporate Sustainability | Empowering Our People
Sustainable communities consider the needs of different stakeholders. For us to better address these needs, our workforce must understand different perspectives and bring unique values to our stakeholders. We also want our employees to feel respected and encouraged to grow in the workplace. This is why our Group strives to improve our workplace diversity and inclusion.
We are dedicated to recruiting talents from all races, backgrounds and experiences, irrespective of individual differences, such as gender, ethnicity, age, physical abilities, sexual preferences, family status, religion, or gender expression. Employees are also informed about our Human Rights Policy1 and Whistleblowing Policy1 for reporting relevant violation. We are one of the 12 diversified companies in Greater China to have signed the UNGC and the first real estate holding and development company in Hong Kong to endorse the UN-backed Women’s Empowerment Principles and are committed to respecting and implementing the principles at all levels of our business. As at 30 June 2020, 35.6% of our workforce is female. With our ongoing commitment to empowering women’s leadership, two new female executives joined the NWD board in May 2020, occupying 25% of the seats.
As a caring employer, we echoed the Employment (Amendment) Bill 2019 from the HKSAR Government, which highlights that mothers deserve extra time to recover and that fathers should look after their wives and new-borns. While we have introduced five-day full paid paternity leave in 2018 ahead of the statutory requirement, fully paid maternity leave has also been increased from ten to 14 weeks from FY2020 onwards.
1 Details are available on our Corporate Website – Sustainability > Sustainability Governance & Policies.
GENDER DIVERSITY
Board Level
FY2020 FY2019
25% 11.8%
75% 88.2%
Employee Level
35.6% 36.4%
64.4% 63.6%
Female Male
Embracing a Diversified and Inclusive Workforce
MATERIAL TOPICS• Diversity and Equal Opportunities• Human Rights and Grievance Mechanisms• Corporate Governance
FY2020 FY2019
New World Development Company Limited 84 Annual Report 2020 85

Influencing the Supply ChainCorporate Sustainability
Through a proactive and standardised supply chain management approach, we ensure ESG considerations are applied fairly and consistently at different stages. As construction remains a core business to our ecosystem, we manage its related risks with a higher level of attention through policies, training and management frameworks. The Group’s Sustainability Policy, Sustainable Procurement Policy and Supplier Code of Conduct (“SCoC”) are the overarching policies to standardise our practices. During FY2020, we focused on responsible sourcing and established the data infrastructure required for SBT setting by communicating with construction suppliers closely. In addition, we implemented responsible sourcing and green procurement.
Key Initiatives in FY2020BUILDING CAPACITY FOR SUSTAINABLE CONSTRUCTION PROJECT MANAGEMENTThroughout FY2020, NWCON and Hip Hing continued to successfully implement the internationally recognised systems for quality, environmental, energy and occupational health and safety, certified in accordance with ISO 9001, ISO 14001, ISO 50001 and OHSAS 18001. We encourage more suppliers and contractors to seek these certification to safeguard the health and well-being of all our stakeholders, as well as the environment.
NWCON and Hip Hing conducted annual assessments of all their critical suppliers and contractors on health, safety, environmental and other governance aspects. Assessment parameters include environmental impact reduction, fatalities, working conditions of factories, anti-bribery and corruption, and prohibition of child labour and other types of illegal labour. In case of non-compliance, corrective actions are required to be duly implemented. Recurring cases of non-compliance are subject to further actions including suspension from work and tender invitations and re-evaluation of supplier status.
To strengthen ESG awareness and integration throughout the Group’s supply chain, a series of training has been rolled out in June 2020 across all seven active construction sites under NWCON. Approximately 1,000 subcontractor workers attended the training to learn about key ESG issues and policies including anti-corruption, human rights, whistleblowing and other topics within the SCoC.
MINIMISING ENVIRONMENTAL IMPACTS THROUGH SUSTAINABLE PROCUREMENTStarting in FY2020, we imposed explicit requirements to source printing and copying paper certified by the Forest Stewardship Council (“FSC”). All of the temporary wood used by NWCON and all wood used by Hip Hing is either certified by FSC or Program for the Endorsement of Forest Certification Schemes (“PEFC”). All of thermal insulation and fire retardant materials sourced by NWCON have zero ozone-depleting potential, and are free of CFC and HCFC, which minimises climate change impacts. Currently, Hip Hing uses 93.3% biodiesel onsite to reduce their emissions. Additionally, both NWCON and Hip Hing have adopted the Novade system to digitalise construction project management processes, from Environment, Health and Safety (“EHS”) management, progress reporting, quality control to documentation maintenance, which results in paper reduction. NWD’s central procurement obtained a Level 2 certification from the Hong Kong Green Council’s Sustainable Procurement Charter – with reference to ISO 20400 for their practices applied to office supplies purchases.
TRACKING EMBODIED CARBON AND COMMITTING TO SBTWe will continue to deepen our efforts to decarbonise construction activities. Embodied carbon from construction materials is one of the major sources of our Group’s Scope 3 emissions. Moving towards SBT, we will track and reduce embodied carbon. During FY2020, six construction projects under NWCON have joined a pilot project using the Construction Industry Council (“CIC”) Carbon Assessment Tool to track their embodied carbon. Through this exercise, we have liaised with our supply chain partners and other industry peers, contributing to the local construction industry benchmarking data pool and carbon emissions reduction from building lifecycle with collaborative efforts.
Future Plans and Ongoing Measures• Further standardise our supply chain management practices across Hong Kong and Mainland China and especially those
related to construction activities.• Start to track Scope 3 embodied carbon data from our construction projects in Hong Kong (through CIC Carbon Assessment
Tool) and Mainland China (follow the Chinese Construction Industry Carbon Emission Calculation Standard (GBT 51366-2019)) in preparation for setting SBT.
• Roll out ESG training for Mainland China construction activities to help colleagues and suppliers better understand their professional responsibilities and rights as outlined in the Group’s SCoC and ESG policies.
MATERIAL TOPICS• Responsible Supply Chain Management• Energy and Carbon Management• Occupational Health and Safety• Bribery and Corruption
New World Development Company Limited 84 Annual Report 2020 85

Voices of customers are our core drivers of innovation and product development under fast-changing market conditions. In particular, we focus on a few customer-related areas – their well-being, how we engage and educate them, their data privacy and our product responsibility.
Promoting Customer Well-being with a Healthy EnvironmentSV2030 prioritises wellness as one of its four pillars given the connection between the holistic well-being of individuals, a healthy environment and a healthy community. In FY2020, we launched our first WELL CertifiedTM Platinum building, K11 ATELIER King’s Road. The project has utilised a multi-stage air filtration system (including MERV1 14) to maintain top indoor air quality for the health of building occupants. K11 ATELIER King’s Road also has a sky garden with a jogging trail to promote an active lifestyle. Each office floor of the project has a nursing room to provide for the needs and protect the privacy of working mothers. Through K11 ATELIER ACADEMY, the project offers group fitness and mindfulness activities to all tenants. Similarly, K11 KULTURE ACADEMY engages retail customers in shopping malls through group activities that promote their overall well-being and foster a sustainable community.
COVID-19 Responses:
• K11 MUSEA – implemented hourly disinfection of high-touch surfaces and public facilities; customers receiving hand sanitisers and employees wearing masks during operating hours.
• Humansa – introduced an exclusive Japan-patented Nano Titanium Photocatalytic Coating service for indoor service areas, which is proven to be harmless to humans and can kill 99.99% of viruses and bacteria, remove odour and stay effective for over one year. It has been widely adopted by the Group’s properties in Hong Kong. Humansa also activated emergency response level at the early stage of COVID-19 in all of its elderly homes and substituted physical visits by family members with video calls.
• NWDS – carried out frequent disinfection at every corner, entry and shopping trolley to ensure customers are protected.
Online-to-Offline (“O2O”) Customer Engagement and EducationWhile public transit was restricted in Mainland China during the early 2020 pandemic, K11 developed a digital platform, K11 Go, to adapt to the new normal within a month. K11 Go offers a seamless digital shopping experience for more than one million KLUB 11 Mainland members and creates additional revenue channels through multimedia content and membership privileges to support our tenants, all consolidated within a WeChat mini-application. The platform will continue to be upgraded to deliver an “online to offline to online” user experience. For both Hong Kong and Mainland China, virtual reality was introduced to support K11 office and mall leasing, shopping and exhibitions. In these ways, innovation has enabled us to stay connected with our customers.
Through the following initiatives, we continue to expand our educational and sustainable lifestyle offerings for different generations:
K11 KULTURE ACADEMY
Offers courses and workshops to the general public to cultivate lifelong learning in culture and art. During the year, 70,354 participants were recorded, including online viewership.
K11 ATELIER ACADEMY
Offered to K11 ATELIER office tenants, programmes that promote work-life integration, wellness and cultural activities. During the year, 18,117 participants were recorded, including online viewership.
Nature Discovery Park, K11 MUSEA
Offers guided green tours, workshops and urban farming experiences to raise awareness among the general public of Hong Kong’s ecological importance, rich urban biodiversity and to promote a sustainable lifestyle. During the year, 26,000 visitors were recorded.
D Mind Education Launched “D Mind & the Prince” – an English learning programme for children aged 0 to 6 which helps parents to build an immersive learning environment for their children to acquire the language.
Donut and Ah Meow
Aims to promote fun learning through storytelling, it introduced an animation series on the English language and science exploration to help children learn from home during the pandemic.
Corporate Sustainability
Caring for the Customers
MATERIAL TOPICS• Customer Wellness, Health and Safety• Ageing Population
MATERIAL TOPICS• Customer and Tenant Engagement• Innovation
1 MERV: Minimum Efficiency Reporting Values is derived from a test method developed by the ASHRAE.2 Cumulative number from baseline year FY2015 to FY2020 covering the Sustainability Reporting Scope.
Education business
>500,000stakeholders2
New World Development Company Limited 86 Annual Report 2020 87
Engaging Tenants on Sustainable Practices and Lifestyle
With a fast-growing portfolio of investment properties in Greater China, sharing sustainable practices with tenants is becoming a higher priority.
Since K11 launched the Sustainable Tenancy Pledge (the “Pledge”) in Hong Kong in FY2019 to help tenants track their energy usage, save costs and reduce wastage from fitting-out to operation, a mix of office and retail tenants including F&B tenants have joined the Pledge. At K11 MUSEA, the Pledge supported two retail tenants with planning sustainable operations, and commended their sustainability achievements by facilitating their LEED® certifications. While at K11 ATELIER Victoria Dockside, our anchor tenant was the first onboard to install smart energy meters to further analyse the usage of electricity in different areas of their offices. Within six months after installation, they are on track to save HK$6,000 per year in electricity bills and have engaged 10% of their employees to participate in energy-saving actions. These positive outcomes will prepare us for green lease discussion with our tenants.
A Mechanism to Uphold Product Responsibility and Data Privacy
Upholding product responsibility, quality delivery of our services and products, and respecting the privacy of our customers helps us build trusting relationships. We protect the rights and well-being of our customers with our quality assurance and recall processes. We regularly gauge our customer satisfaction across our operations through, for example, surveys and mystery shoppers. Our operation teams have established policies and mechanisms to ensure accurate and complete information on our products and services. Employees concerned from, for example, sales and marketing, retail and digital marketing functions, have attended training about responsible marketing and advertising practices as well. Additionally, internal audit would be performed on businesses related to responsible marketing. Hong Kong K11 Art Mall and New World Tower have adopted the ISO 10002 certified procedures to handle customer complaints. We have designated personnel, policies and procedures as well as regular training to uphold data privacy. We have set the procedures to protect and handle proprietary information and intellectual property rights. Cybersecurity measures are introduced gradually to raise employee awareness and strengthen our digital infrastructure. We comply with data privacy laws and regulations and have zero complaints relating to customer data privacy.
MATERIAL TOPICS• Customer and Tenant Engagement• Energy and Carbon Management• Waste Disposal and Recycling• Customer Wellness, Health and Safety
K11 Sustainable Tenancy Pledge
25 pledged tenants
96% satisfied tenants
100% surveyed and responded at K11 ATELIER Victoria Dockside
Corporate Sustainability | Caring for the Customers
A new initiative, Nework, was launched in New World Tower in Hong Kong as a platform to enhance the experience of tenants. Through an app, tenants can book or access a series of value-added facilities such as exclusive common space, nursing rooms and lunch box vending machines. More than 1,000 uses of nursing rooms were recorded since their launch in late 2019, and 14 tenant events were held during the year.
Market uncertainties, as well as the global pandemic, are expected to burden our business as well as our tenants. By prioritising innovative solutions, we hope to stay engaged with our tenants and customers, raise their awareness of driving sustainable business models and improve their well-being. With the initial success of various tenant engagement initiatives, we plan to extend these offerings to more tenants and customers in Greater China.
New World Development Company Limited 86 Annual Report 2020 87

MATERIAL TOPICS• Community Development and Engagement• Community Wellness• Innovation
Fostering Sustainable CommunitiesCorporate Sustainability
#LoveWithoutBorders
K11 Love Power Campaign
THE FOREST x Sew On Studio Mask Exhibition
OnBoard For Good
New World Spring-board Programme
NWSH Catch Your 5** Programme
ThemeInitiative Impact
A shared support platform that brings love to those in need and shares resources with local communities amidst the COVID-19 pandemic
A nation-wide campaign in Mainland China to provide customers health consultation by phone, activities to improve their mental well-being, as well as access to healthcare supplies during COVID-19
THE FOREST, a shopping mall in Hong Kong, partnered with Sew on Studio, a social enterprise which supports young designers and women to find second employment, to host a reusable cloth mask exhibition
Empowers Hong Kong retired athletes to develop their second careers in the business field
Continues to improve the social mobility of students from under- resourced families while helping teenage beneficiaries plan their future careers in addition to providing sports training
Collaborated with The Salvation Army and Dustykid to arouse public awareness to the Special Education Needs (“SEN”) children
• Over two million face masks donated to partners and local communities in South Korea, France, Italy and the United Kingdom
• First pandemic relief fund by a Hong Kong blue-chip company of HK$10 million to support local communities
• Producing 400,000 face masks a week in Hong Kong• Set up the first “Mask To Go” dispensers aiming to benefit
over 40,000 beneficiaries across 18 districts in Hong Kong• Over 10,000 preventative kits containing face masks,
hand sanitiser gels and disinfecting wipes distributed to low-income families in Hong Kong
Please read p.66–67 for details.
• Over RMB5 million and 200,000 face masks were donated and over 200,000 customers engaged
• 54 designers engaged• 22 unemployed women
deployed for sewing works
• 927 reusable cloth masks redeemed
• 4 athletes’ startups incubated• 80 job matches (14 full-time and 66 part-time)• 38 internships and job shadowing opportunities• Over 3,300 attendance
Cumulative impact since the programme launched in 2012:• 2,600 student beneficiaries• 359,000 training hours
• 329 beneficiaries• Provided non-academic training to SEN children• Parents supporting groups formed in Chai Wan and
Lung Hang areas of Hong Kong
KEY COMMUNITY ADVANCEMENT AND ENGAGEMENT INITIATIVES IN FY2020:
1 Cumulative number from baseline year FY2015 to FY2020 covering the Sustainability Reporting Scope.
We actively discover, empower and connect with untapped talents and resources in the community through partnerships to build a better society.
Unveiling Potential to Nurture CommunitiesThe Group leverages partnerships with different community organisations to serve the diverse needs of stakeholders.
THE FOREST reusable cloth mask exhibition.
Community/Employee Programmes & Events
>800,000 stakeholders1
New World Development Company Limited 88 Annual Report 2020 89

K11 Art Foundation
K11 Craft & Guild Foundation
HighlightsOrganisation Impact
Incubates young contemporary artists and promotes public art education in Greater China. Several exhibitions have been hosted.Co-organised “Carbon’s Casualties” – a climate-themed photography exhibition with The New York Times and launched “Disruptive Matter” (a circular economy themed art exhibition) in Hong Kong
Asia’s first and unique creative platform to conserve and rejuvenate fast-disappearing Chinese craftsmanship.An exhibition was hosted to display two types of antique crafts: baibaoqian (semi-precious stone inlays) and guangcai (Canton enamel porcelains).
• 641 cumulative number of artists/curators supported since 2013
• 1,170 exhibition visitors• About 1,000 visits in the virtual tour online
• 10 craftsmen supported since 2018• HK$1.1 million of donation received• HK$2.6 million of craftwork sales through
K11 platforms
Corporate Sustainability | Fostering Sustainable Communities
The Group continues to expand our volunteering services across Mainland China. New chapters of NWS Volunteer Alliance were set up in Guangzhou, Hangzhou and Changsha in December 2019. In FY2020, more than 28,000 volunteering hours were recorded across the Group.
Activating Change in SocietyRecognising the increasing expectations for the private sector to lead change, we forge partnerships with local and international organisations across sectors to help them scale and identify innovative solutions to drive sustainable development via our daily operations.
Eureka Nova, our Group’s startup incubator, launched two accelerator programmes last year. First, by working with our tenant Mizuho Bank, Mizuho Crowd Brain Accelerator was launched to groom 25 startups in fintech, insurance, wellness and other innovative sectors, and offer opportunities to integrate with Mizuho Bank’s clients and our Group.
Eureka Nova and the Group Sustainability Department also co-founded Impact Kommons, Hong Kong’s first UN SDG-focused accelerator, to help high potential startups align their business models to the four UN SDGs endorsed by our Group, as well as gain access to Business-to-Business (“B2B”) partnerships with our BUs and exclusive introductions to investors. The programme selected five startups (listed below) from over 50 global applications and offered eight weeks of intensive workshops, mentorship and consultation.
AESIR Supports the learning of children with SEN through mixed reality technologies
Catalyser Provides software for employers to manage their community activities and report on their social impact
En-trak Develops Internet of Things (“IoT”) solutions for commercial buildings to improve energy efficiency
Lify Wellness Offers the Smart Wellness Beverage Ecosystem – a personalised recommendation supported by IoT and Artificial Intelligence technology
Urban Spring Reduces the consumption of single-use plastic bottle by installing its Well (井), a smart water station
Impact Kommons fostered initiatives in contribution to the UN SDGs and realised business integrations across our ecosystem with each of the startups, resulting in seven successful projects, including a pilot of En-trak’s building efficiency technology for engaging tenants, wellness workshops and product consignment by Lify Wellness and education programme co-development between AESIR and Nature Discovery Park at K11 MUSEA.
In January 2020, Culture for Tomorrow, our Group’s non-profit organisation which actualises design and architectural innovation, presented the Sustainability Forum, which convened 30 business leaders to inspire and build knowledge capital on sustainable impact through cross-sector and cross-generational dialogues. As a new member to WBCSD, the event featured her President & CEO Peter Bakker as keynote speaker and different panel discussions aiming to rethink cities, redefine cultures and communities, and realign finance and technology for the purpose. Following the forum, young changemakers in Hong Kong have partnered with Nature Discovery Park and K11 MUSEA to promote sustainable living in the community. We also joined WBCSD projects to exchange industry experience in decarbonising the built environment and gain insights into circular economy standard development.
We see ourselves as part of the global movement to drive systemic change and do so by forming partnerships aligned to SV2030 and our business priorities. Please visit our sustainability website for all of our public commitments and membership.
Embracing Art and CultureIt is equally important to preserve fast-disappearing cultural heritage as it is to incubate young artists and popularise art to the community.
Through its pioneering blend of three core values of Art • People • Nature, K11’s products and services are rooted in showcasing local and international emerging artists and allowing the public to appreciate art and culture during their customer journey through, for example, connecting artworks with mall merchandise or decoration. These are facilitated by the organisations below:
Sustainability Forum held at HACC – a multipurpose art and cultural space at K11 ATELIER King’s Road.
New World Development Company Limited 88 Annual Report 2020 89

Content Index for Reporting GuidelinesCorporate Sustainability
This Report has been prepared in accordance with the GRI Standards: Core option and complies with all “Comply or Explain” provisions on General Disclosures (“GD”) and environmental KPIs of HKEx ESG Reporting Guide.
During the reporting period, there were no confirmed non-compliance incidents or grievances about environmental protection or anti-corruption that would have a significant impact on the Group.
GRIIndicator
HKEx ESG Guide Description References and Remarks
GRI 102: General Disclosures 2016
Organisational Profile
102-1 Name of the organisation • Sections “Corporate Information” and “Management Discussion and Analysis” (p.124, 150–160)
• “Principal Subsidiaries”, “Principal Joint Ventures” and “Principal Associated Companies” under section “Notes to the Financial Statements” contain information about our principal activities (p.282–298)
• Section “Principal Projects Summary” provides information on quantity of products and services provided including major property development and investment projects in Hong Kong and Mainland China, hotels and infrastructure projects (p.301–315).
102-2 Activities, brands, products and services
102-3 Location of headquarters
102-4 Location of operations
102-5 Ownership and legal form
102-6 Markets served
102-7 Scale of the organisation • Sections “Financial Highlights”, “CEO’s Report” and “Management Discussion and Analysis” contain information on segment revenues, group capitalisation and vacancy rates (p.25, 28–43, 150–160)
• Section “Principal Projects Summary” provides information on major property development and investment projects in Hong Kong and Mainland China, hotels and infrastructure projects (p.301–315).
102-8 KPI B1.1 Information on employees and other workers
• Empowering Our People (p.81)• Corporate Website – Sustainability >
Performance & Reporting
102-9 Supply chain • Influencing the Supply Chain (p.85)
102-10 Significant changes to the organisation and its supply chain
• Influencing the Supply Chain (p.85)• Sections “CEO’s Report”, “Report of the Directors”
and “Management Discussion and Analysis” contain information about changes in operations and share capital in the. Data on significant changes in the supply chain is not available (p.28–43, 125–160).
102-11 Precautionary Principle or approach
• Sustainability Governance (p.68–71)
102-12 External initiatives • Major Achievements and ESG Highlights (p.61)
102-13 Membership of associations • Corporate Website – Sustainability > Performance & Reporting
Strategy
102-14 Statement from senior decision-maker
• Message from Management (p.59)
102-15 Key impacts, risks, and opportunities
• Sustainability Governance (p.68–71)• Section “Corporate Governance Report” (p.110–119)
Ethics and Integrity
102-16 Values, principles, standards, and norms of behaviour
• Message from Management (p.59)
Governance
102-18 Governance structure • Sustainability Governance (p.68)
New World Development Company Limited 90 Annual Report 2020 91

Corporate Sustainability | Content Index for Reporting Guidelines
GRIIndicator
HKEx ESG Guide Description References and Remarks
Stakeholder Engagement
102-40 List of stakeholder groups • Sustainability Governance (p.69)102-41 Collective bargaining
agreements• Within the scope of the Report, none of our
employees are covered by collective bargaining agreements.
102-42 Identifying and selecting stakeholders
• Sustainability Governance (p.68–71)
102-43 Approach to stakeholder engagement
102-44 Key topics and concerns raised
• Message from Management (p.59)• Sustainability Governance (p.70–71)
Reporting Practice
102-45 Entities included in the consolidated financial statements
• “Principal Subsidiaries”, “Principal Joint Ventures”, “Principal Associated Companies” under section “Notes to the Financial Statements” (p.282-298)
102-46 Defining report content and topic Boundaries
• About This Section (p.58)
102-47 List of material topics • Sustainability Governance (p.70–71)102-48 Restatements of information • Corporate Website – Sustainability >
Performance & Reporting102-49 Changes in reporting • About This Section (p.58)
• Corporate Website – Sustainability > Performance & Reporting
102-50 Reporting period • About This Section (p.58)102-51 Date of most recent report • Sustainabi l i ty Report 2019 was publ ished in
December 2019.102-52 Reporting cycle • The report is published on an annual basis.102-53 Contact point for questions
regarding the report• About This Section (p.58)
102-54 Claims of reporting in accordance with the GRI Standards
102-55 GRI content index • Content Index for Reporting Guidelines (p.90–95)102-56 External assurance • About This Section (p.58)
• Verification Statement (p.96–97)
Material TopicsEconomic Performance
GRI 103: Management Approach 2016
103-1 Explanation of the material topic and its boundary
• Message from Management (p.59)• Sustainability Governance (p.69–71)
103-2 The management approach and its components
103-3 Evaluation of the management approach
GRI 201: Economic Performance 2016
201-1 Direct economic value generated and distributed
• Section “Consolidated Income Statement” (p.170)
Indirect Economic Impacts
GRI 103: Management Approach 2016
103-1 Explanation of the material topic and its boundary
• Sustainability Governance (p.69–71)
103-2 The management approach and its components
103-3 Evaluation of the management approach
GRI 203: Indirect Economic Impacts 2016
203-1 Infrastructure investments and services supported
• New World Ecosystem & Sustainable Property Lifecycle (p.62–63)
New World Development Company Limited 90 Annual Report 2020 91

Corporate Sustainability | Content Index for Reporting Guidelines
GRIIndicator
HKEx ESG Guide Description References and Remarks
Anti-corruption
GRI 103: Management Approach 2016
103-1 Explanation of the material topic and its Boundary
• Sustainability Governance (p.69–71)The Group had zero concluded legal cases regarding corrupt practices brought against the Group or its employees during the reporting period.
103-2 GD-B7 The management approach and its components
103-3 KPI B7.1 Evaluation of the management approach
GRI 205: Anti-corruption 2016
205-1 KPI B7.2 Operations assessed for risks related to corruption
• Sustainability Governance (p.69–71)• Empowering Our People (p.81)
KPI B7.3 Description of anti-corruption training
Environmental PerformanceMaterials Use
GRI 103: Management Approach 2016
103-1 Explanation of the material topic and its boundary
• Sustainability Governance (p.69–71)• Safeguarding the Environment (p.79)
103-2 GD-A2 The management approach and its components
103-3 Evaluation of the management approach
GRI 301: Materials 2016
301-1 KPI A2.5 Materials used by weight or volume
• Corporate Website – Sustainability > Performance & Reporting
• Packaging materials were not considered material for the Group’s businesses hence such data are not disclosed.
Energy
GRI 103: Management Approach 2016
103-1 Explanation of the material topic and its boundary
• Sustainability Governance (p.69–71)• Safeguarding the Environment (p.75)
103-2 GD-A2 The management approach and its components
103-3 KPI A2.3 Evaluation of the management approach
GRI 302: Energy 2016
302-1 KPI A2.1 Energy consumption within the organisation
• Safeguarding the Environment (p.75)• Corporate Website – Sustainability >
Performance & ReportingWater and Effluents
GRI 103: Management Approach 2016
103-1 Explanation of the material topic and its boundary
• Sustainability Governance (p.69–71)• Safeguarding the Environment (p.78)
103-2 GD-A2 The management approach and its components
103-3 Evaluation of the management approach
GRI 303: Water and Effluents 2018
303-1 KPI A2.2 Water consumption • Safeguarding the Environment (p.78)• Corporate Website – Sustainability >
Performance & ReportingKPI A2.4 Issue in sourcing water that
is fit for purpose, water efficiency initiatives and results achieved
New World Development Company Limited 92 Annual Report 2020 93

Corporate Sustainability | Content Index for Reporting Guidelines
GRIIndicator
HKEx ESG Guide Description References and Remarks
Emissions
GRI 103: Management Approach 2016103-1 Explanation of the material
topic and its boundary• Sustainability Governance (p.69–71)• Safeguarding the Environment (p.75–77)There were no confirmed instances of non-compliances or grievances during the reporting period.
103-2 GD-A1 The management approach and its components
103-3 Evaluation of the management approach
GRI 305: Emissions 2016305-1 KPI A1.2 Direct (Scope 1) GHG
emissions• Safeguarding the Environment (p.75–76)• Corporate Website – Sustainability >
Performance & Reporting305-2 KPI A1.2 Indirect (Scope 2) GHG emissions
305-5 KPI A1.5 Reduction of GHG emissions305-7 KPI A1.1 Nitrogen oxides (NOX),
Sulphur oxides (SOX), and other significant air emissions
Waste
GRI 103: Management Approach 2016103-1 Explanation of the material
topic and its boundary• Sustainability Governance (p.69–71)• Safeguarding the Environment (p.79)There were no confirmed instances of non-compliances or grievances during the reporting period.
103-2 GD-A1 The management approach and its components
103-3 Evaluation of the management approach
GRI 306: Effluents and Waste 2016306-2 KPI A1.3 &
A1.4Waste by type and disposal method
• Safeguarding the Environment (p.79)• Corporate Website – Sustainability >
Performance & ReportingKPI A1.6 Reduction of wasteEnvironmental Compliance
GRI 103: Management Approach 2016103-1 Explanation of the material
topic and its boundary• Sustainability Governance (p.69–71)• Safeguarding the Environment (p.74–80)
103-2 GD-A3 & KPI A3.1
The management approach and its components
103-3 Evaluation of the management approach
GRI 307: Environmental Compliance 2016307-1 GD-A1 Non-compliance with
environmental laws and regulations
There were no significant fines or sanctions for non-compliance with laws and regulations during the reporting period.
Supplier Environmental Assessment
GRI 103: Management Approach 2016103-1 Explanation of the material
topic and its boundary• Sustainability Governance (p.69–71)• Influencing the Supply Chain (p.85)
103-2 GD-B5 The management approach and its components
103-3 Evaluation of the management approach
GRI 308: Supplier Environmental Assessment 2016308-1 KPI B5.2,
B5.3 & B5.4
New suppliers that were screened using environmental criteria
• Influencing the Supply Chain (p.85)
Climate ChangeGD-A4 Identification and mitigation
of significant climate-related issues
• Sustainability Governance (p.71)• Safeguarding the Environment (p.74–78)
KPI A4.1 Significant climate-related issues
New World Development Company Limited 92 Annual Report 2020 93

Corporate Sustainability | Content Index for Reporting Guidelines
Social PerformanceEmployment
GRI 103: Management Approach 2016103-1 Explanation of the material
topic and its boundary• Sustainability Governance (p.69–71)• Empowering Our People (p.82)There were eight non-compliance and 14 grievance cases during the reporting period.
103-2 GD-B1 The management approach and its components
103-3 Evaluation of the management approach
GRI 401: Employment 2016401-1 KPI B1.2 New employee hires and
employee turnover• Corporate Website – Sustainability >
Performance & ReportingOccupational Health and Safety
GRI 103: Management Approach 2016103-1 Explanation of the material
topic and its boundary• Sustainability Governance (p.69–71)• Empowering Our People (p.83)
103-2 GD-B2 The management approach and its components
103-3 Evaluation of the management approach
GRI 403: Occupational Health and Safety 2018403-1 KPI B2.3 Occupational health and
safety management system• Empowering Our People (p.83)• Influencing the Supply Chain (p.85)
403-3 Occupational health services403-4 Worker participation,
consultation, and communication on occupational health and safety
403-5 Worker training on occupational health and safety
403-6 Promotion of worker health403-7 Prevention and mitigation of
occupational health and safety impacts
• Influencing the Supply Chain (p.85)
403-9 KPI B2.1, B2.2 & B2.3
Work-related injuries • Empowering Our People (p.83)• Influencing the Supply Chain (p.85)• Corporate Website – Sustainability >
Performance & ReportingTraining and Education
GRI 103: Management Approach 2016103-1 Explanation of the material
topic and its boundary• Sustainability Governance (p.69–71)• Empowering Our People (p.81)
103-2 GD-B3 The management approach and its components
103-3 Evaluation of the management approach
GRI 404: Training and Education 2016404-1 KPI B3.2 Average hours of training per
year per employee• Empowering Our People (p.81)• Corporate Website – Sustainability >
Performance & Reporting404-3 Percentage of employees receiving regular performance and career development reviews
Non-discrimination
GRI 103: Management Approach 2016103-1 Explanation of the material
topic and its boundary• Sustainability Governance (p.69–71)
103-2 GD-B1 The management approach and its components
103-3 Evaluation of the management approach
New World Development Company Limited 94 Annual Report 2020 95

Corporate Sustainability | Content Index for Reporting Guidelines
GRIIndicator
HKEx ESG Guide Description References and Remarks
GRI 406: Non-discrimination 2016406-1 GD-B1 Incidents of discrimination
and corrective actions takenThere were no confirmed instances of non-compliances or grievances during the reporting period.
Labour StandardsGD-B4 Policies and compliance on
child and forced labour• Sustainability Governance (p.69–71)• Influencing the Supply Chain (p.85)There were no confirmed instances of non-compliances or grievances during the reporting period.
KPI B4.1 Measures to review employment practices to avoid child and forced labour
• Influencing the Supply Chain (p.85)
KPI B4.2 Steps taken to eliminate such practices when discovered
Community InvestmentGD-B8, KPI B8.1 & B8.2
Focus areas of contribution and resources contributed
• Fostering Sustainable Communities (p.88–89)
Supplier Social Assessment
GRI 103: Management Approach 2016103-1 Explanation of the material
topic and its boundary• Sustainability Governance (p.69–71)• Influencing the Supply Chain (p.85)
103-2 GD-B5 The management approach and its components
103-3 Evaluation of the management approach
GRI 414: Supplier Social Assessment 2016414-1 KPI B5.2 &
B5.3New suppliers that were screened using social criteria
• Influencing the Supply Chain (p.85)
Customer Health and Safety
GRI 103: Management Approach 2016103-1 Explanation of the material
topic and its boundary• Sustainability Governance (p.69–71)• Caring for the Customers (p.86–87)There were two non-compliance cases during the reporting period.
103-2 GD-B6 The management approach and its components
103-3 Evaluation of the management approach
GRI 416: Customer Health & Safety 2016416-1 Assessment of the health and
safety impacts of products and service categories
• Caring for the Customers (p.86–87)
Customer Privacy
GRI 103: Management Approach 2016103-1 Explanation of the material
topic and its boundary• Sustainability Governance (p.69–71)
103-2 KPI B6.5 The management approach and its components
103-3 Evaluation of the management approach
GRI 418: Customer Privacy418-1 KPI B6.2 Substantiated complaints
concerning breaches of customer privacy and loss of customer data
There were no confirmed substantiated complaints or losses of customer data during the reporting period.
Product ResponsibilityKPI B6.1 Percentage of total products
sold or shipped subject to recalls for safety and health reasons
• Caring for the Customers (p.87)We were not made aware of any recall of products for health and safety reasons that have a significant impact on the Group during the reporting period.
KPI B6.3 Practices relating to observing and protecting intellectual property rights
KPI B6.4 Quality assurance process and recall procedures
New World Development Company Limited 94 Annual Report 2020 95

Verification Statement – Corporate Sustainability ReportCorporate Sustainability
Scope and ObjectivesHong Kong Quality Assurance Agency (“HKQAA”) performed a limited assurance engagement on the sustainability disclosures stated in the Corporate Sustainability section of Annual Report 2020 of New World Development Company Limited (“NWD”) and the supplementary information on NWD’s website under the sustainability section (collectively “The Report”) for the period from 1st July 2019 to 30th June 2020.
The Report has been prepared in accordance with the Global Reporting Initiative Sustainability Reporting Standards (“GRI Standards”) – Core option and the requirements stipulated in the latest Environmental, Social and Governance Reporting Guide (“ESG Reporting Guide”) set out in Appendix 27 of the Rules Governing the Listing of Securities on the Stock Exchange of Hong Kong Limited (“HKEx”) as well as making reference to the Task Force on Climate-related Financial Disclosures (“TCFD”) requirements for disclosing climate change actions.
Our responsibility is to express an assurance conclusion on the completeness, accuracy and reliability of the sustainability data and information stated in the Report. The objectives are to:
• assess whether the scope of the Report covers all significant aspects;
• verify whether the Report addresses the Core option of the GRI Standards, the ESG Reporting Guide and the TCFD’s recommendations;
• evaluate accuracy of the selected data and information presented in the Report including Environmental Performance Data, Social Performance Data, numbers on Overview of SV2030, sustainability-linked loan environmental impact reduction performance, etc.; and
• review whether the data and information management mechanism for preparing the Report is reliable.
Level of Assurance and MethodologyWe conducted our assurance engagement in accordance with the International Standard on Assurance Engagements (ISAE) 3000 (Revised), Assurance Engagements Other Than Audits or Reviews of Historical Financial Information and the International Standard on Assurance Engagements (ISAE) 3410, Assurance Engagements on Greenhouse Gas Statements issued by the International Auditing and Assurance Standards Board. The verification procedure was designed for devising opinions and conclusions to obtain a limited level of assurance. The extent of this verification process undertaken covered the criteria specified in the GRI Standards: Core Option, the ESG Reporting Guide and TCFD’s recommendations.
Within the scope of our verification, we conducted the following procedures and activities:
• reviewing internal systems and processes for collecting, analysing, aggregating and reporting of the performance data,
• verifying performance data including Environmental Performance Data, Social Performance Data, numbers on Overview of SV2030, sustainability-linked loan environmental impact reduction performance, etc.,
• interviewing responsible personnel with accountability for preparing the Report, and
• examining raw data and supporting evidence of the selected samples according to the risk-based sampling plan.
IndependenceNWD is responsible for the collection and presentation of the information. HKQAA did not involve in the collection and calculation of data or the compilation of the reporting contents where HKQAA’s verification activities are entirely independent from NWD.
ConclusionBased on the verification procedures performed and evidence obtained, nothing has come to our attention that causes us to believe that the information and data stated in the Report has not been prepared, in all material aspects, in accordance with the GRI Standards: Core Option, the ESG Reporting Guide and TCFD’s recommendations. The data and information verified are regarded as accurate, consistent, reliable and complete.
Signed on behalf of Hong Kong Quality Assurance Agency
Connie ShamHead of AuditHong Kong Quality Assurance AgencySeptember 2020
New World Development Company Limited 96 Annual Report 2020 97

Verification Statement – Carbon AuditCorporate Sustainability | Verification Statement
Scope and Objectives
Hong Kong Quality Assurance Agency (“HKQAA”) conducted an independent verification of the Greenhouse Gas (“GHG”) emissions inventory (“Emissions Inventory”) of New World Development Company Limited (“NWD”). The GHG Emissions Inventory comprised of 20 Assets and covered the period from 1st July 2019 to 30th June 2020. The aim of this verification was to provide a limited assurance on the completeness and accuracy of the data consolidated in the GHG Emissions Inventory by NWD. The quantification approach is reference to ISO 14064-1:2006 ‘Specification with guidance at the organisation level for quantification and reporting of greenhouse gas emissions and removals’.
The 20 commercial and retail assets included in the GHG Emissions Inventory are 1) Guangzhou K11 Art Mall, 2) Guangzhou K11 ATELIER, 3) Shanghai K11 ATELIER and Art Mall, 4) Wuhan K11 Select, 5) D•PARK, 6) Hong Kong K11 Art Mall, 7) K11 ATELIER Victoria Dockside, 8) Beijing Boading Building Shopping Arcade, 9) Langfang New World Centre, 10) Tangshan New World Centre, 11) Guangzhou Park Paradise, 12) Wuhan New World Centre, 13) Wuhan New World International Trade Tower 1 & 2, 14) Artisan Hub, 15) Hong Kong Golf and Tennis Academy (HKGTA), 16) KOHO, 17) Manning House, 18) New World Tower 1 & 2, 19) The Forest and 20) Youth Square.
Methodology
Within the verification scope, HKQAA reviewed the activity data and supporting evidence of the selected samples out of the 20 assets. The verification was conducted in accordance with ISO 14064-3:2006 ‘Specification with guidance for the validation and verification of greenhouse gas assertions’. The process included an assessment of:
• The reporting boundaries;
• The quantification methodology and emission factors;
• The integrity of the activity data and supporting evidence; and
• The accuracy and completeness of the GHG calculations.
Integrity and accuracy of the aggregated data was tested by tracing the selected sample data back to its source. The underlying processes for data collection, aggregation, estimation, calculation and internal checking were reviewed and undergone reliability test. Materiality threshold of 10% was adopted for this verification. HKQAA verification team did not partake in the GHG data preparation process.
Conclusion
Based on the verification results, the verification team concluded that no material error or omission was identified in the GHG Emissions Inventory. There is no evidence that the GHG Emissions Inventory is not materially correct and is not a fair representation GHG data and information.
Total GHG emissions of the 20 Assets of NWD from 1 July 2019 to 30 June 2020:
FY2020 GHG Emissions Tonnes of CO2 equivalent
Scope 1 1,368
Scope 2 83,172
Total (Scope 1 + Scope 2) 84,540
Scope 3 Not Reported
Total (Scope 1 + Scope 2 + Scope 3) 84,540
Signed on behalf of Hong Kong Quality Assurance Agency:
Ms. Connie ShamLead VerifierDate of issuance: 9 September 2020Hong Kong Quality Assurance Agency19/F., K. Wah Centre, 191 Java Road, North Point, Hong KongContact detail www.hkqaa.org
New World Development Company Limited 96 Annual Report 2020 97
New World Development Company Limited98
Corporate Governance Report
All along, the Company is committed to maintain a high standard of corporate governance practices to safeguard the
interests of its shareholders and enhance the performance of the Group. From time to time, the board of Directors (the
“Board”) reviews and improves its corporate governance practices in order to ensure that the Group is under the
leadership of an effective board so as to optimise return for its shareholders.
CORPORATE GOVERNANCE CODE
Throughout the year ended 30 June 2020, the Company has complied with all the applicable code provisions of the
Corporate Governance Code (the “CG Code”) as set out in Appendix 14 of the Listing Rules, with the exception of
code provisions A.6.4 and E.1.2.
Code provision A.6.4 is in relation to guidelines for securities dealings by relevant employees. Under code provision
A.6.4, the Board should establish written guidelines on no less exacting terms than the Model Code for Securities
Transactions by Directors of Listed Issuers (the “Model Code”) set out in Appendix 10 of the Listing Rules for its
relevant employees in respect of their dealings in the securities of the Company. Instead of following the Model
Code strictly, the Board has established its own guidelines which are not on no less exacting terms than the Model
Code. Such deviation from the CG Code is considered necessary because of the huge size of employees of the
Group which is around 44,000 and the Group’s diversified businesses. For these reasons, to follow the exact
guidelines of the Model Code will cause immense administrative burden to the Company in processing written
notifications from the relevant employees who deal in the securities of the Company, which can be avoided under
the Company’s own guidelines.
Code provision E.1.2 provides that the chairman of the board should attend the annual general meeting. Dr. Cheng
Kar-Shun, Henry, the Chairman of the Board, was unable to attend the annual general meeting of the Company held
on 19 November 2019 (the “AGM”) due to his other engagement. Dr. Cheng Chi-Kong, Adrian, Executive Vice-
chairman & General Manager (the Executive Vice-chairman & Chief Executive Officer effective from 1 May 2020) of
the Company who took the chair of the AGM, together with other members of the Board who attended the AGM,
were of sufficient calibre for answering questions at the AGM and had answered questions at the AGM competently.
DIRECTORS’ SECURITIES TRANSACTIONS
The Company has adopted the Model Code as its own code of conduct for securities transactions by its Directors.
Specific enquiries have been made with all Directors who confirmed that they had complied with the required
standard set out in the Model Code during the year ended 30 June 2020.

Annual Report 2020 99
Corporate Governance Report
BOARD GOVERNANCE
Board of Directors
to provide leadership and oversee the management, businesses, strategic directions and �nancial performance of the Group
Executive Committee
to oversee the management function and day-to-day operations with the Board's delegated authority; and to monitor the execution of strategic plans and operations of all business units
Audit Committee
to review and supervise the Group’s �nancial reporting process and risk management and internal control systems; to monitor external auditor’s independence and objectivity and effectiveness of the audit process; and to ensure effectiveness of internal audit programme and internal audit function
Remuneration Committee
to review and recommend to the Board on remuneration policy and structure of all Directors and senior management, and on the remuneration packages of individual Executive Director and senior management
Nomination Committee
to review the structure, size and composition of the Board; to assess the independence of Independent Non-executive Directors; and to make recommendations to the Board on appointment and re-appointment of Directors
Sustainability Committee
to oversee sustainability and environmental, social and governance ("ESG") issues and risks; and to monitor the integrity and compliance of the disclosure on sustainability and ESG information in the Company's annual sustainability reporting
Risk Management Committee
to assist the Audit Committee in deciding the Group’s risk level and risk appetite; and to ensure soundness and effectiveness of the Group’s risk management and internal control systems
Group Sustainability Steering Committee
to support the Sustainability Committee on identi�cation, evaluation and management of material ESG related issues and to guide group companies to attain ESG related goals
Corporate Functions
Finance & Accounts, Legal & Company Secretarial, Human Resources, Information Technology, Investor Relations, Corporate Communication, Training and Administration
Core Businesses
Property development, property investment, roads, aviation, construction and insurance
Strategic Development
Creation of a more sustainable and diversi�ed ecosystem of the New World Group by tapping on synergy among various cross-sector interaction such as education, culture, innovative technologies, medical care and health care, adding value to core businesses as well as enhancement of the unique experience of the consumers
Executive Vice-chairman & Chief Executive Ofcer

New World Development Company Limited100
Corporate Governance Report
BOARD OF DIRECTORS
CompositionMr. So Chung-Keung, Alfred and Mr. Au Tak-Cheong resigned as Executive Directors with effect from 1 January
2020 and 1 April 2020 respectively. With effect from 1 May 2020, Dr. Cheng Chi-Kong, Adrian was re-designated
from the Executive Vice-chairman & General Manager to Executive Vice-chairman & Chief Executive Officer. Further,
Ms. Huang Shaomei, Echo and Ms. Chiu Wai-Han, Jenny were appointed as Executive Directors (the “Board
Changes”), both with effect from 1 May 2020.
As at 30 September 2020, the Board comprises a total of 16 Directors, being seven Executive Directors, three
Non-executive Directors and six Independent Non-executive Directors. The number of Independent Non-executive
Directors represents more than one-third of the Board as required by Rule 3.10A of the Listing Rules. The biographies
of the Directors are set out from pages 48 to 56 of this annual report.
As disclosed in the announcement of the Company issued on 25 September 2020, Ms. Ki Man-Fung, Leonie
(“Ms. Ki”) had tendered her resignation as Non-executive Director with effect from 1 October 2020. Subsequent
to Ms. Ki’s resignation, the Board will comprise a total of 15 Directors, being seven Executive Directors, two Non-
executive Directors and six Independent Non-executive Directors.
All Directors have entered into formal letters of appointment with the Company, each for a term of three years,
subject to retirement by rotation in accordance with the articles of association of the Company (the “Articles of
Association”).
Article 103(A) of the Articles of Association provides that at each annual general meeting, one-third of the Directors
for the time being (or if their number is not a multiple of three, the number nearest to but not less than one-third)
shall retire from office by rotation, provided that every Director (including those appointed for a specific term) shall
be subject to retirement by rotation at least once every three years. Also, pursuant to Article 94 of the Articles of
Association, any Director appointed to fill a casual vacancy or as an addition to the Board is subject to re-election at
the next following general meeting or next following annual general meeting of the Company respectively.
To ensure that Directors have spent sufficient time on the affairs of the Company, all Directors have annually
disclosed to the Company the level of time involved in performing the duties of his/her position held in the Company
and other public companies or organisations or other major appointments.
Chairman, Executive Vice-chairman & Chief Executive Officer and Other Executive DirectorsDr. Cheng Kar-Shun, Henry, the Chairman, has led the Board and ensured that the Board works effectively and that
all important issues are discussed in a timely manner. Dr. Cheng Chi-Kong, Adrian, the Executive Vice-chairman
& General Manager (re-designated as the Executive Vice-chairman & Chief Executive Officer from 1 May 2020),
oversees the Company’s day-to-day businesses and the implementation of major strategies and policies of the
Company. Each of the other Executive Directors takes up different responsibilities according to their own expertise.
The responsibilities of the Chairman, the Executive Vice-chairman & General Manager / the Executive Vice-
chairman & Chief Executive Officer, and the other Executive Directors are clearly set out in their respective letters
of appointment. The positions of the Chairman and the Executive Vice-chairman & General Manager / the Executive
Vice-chairman & Chief Executive Officer, are held by separate individuals so as to maintain an effective segregation
of duties.
Annual Report 2020 101
Corporate Governance Report
Non-executive DirectorsNon-executive Directors (including the Independent Non-executive Directors) serve the relevant function of bringing
independent judgement on the development, performance and risk management of the Company. They have the
same duties of care and skill and fiduciary duties as the Executive Directors.
Independence of Independent Non-executive DirectorsThe Company has received annual confirmation of independence from all Independent Non-executive Directors
in accordance with Rule 3.13 of the Listing Rules. The Board is of the view that all Independent Non-executive
Directors are independent in accordance with the Listing Rules.
During the year, Independent Non-executive Directors met quarterly with members of senior management and
representatives from major business units, which provided a good opportunity for Independent Non-executive
Directors to better understand the businesses of the Group and to discuss a wide range of issues concerning the
business of the Group.
Role of the BoardThe Board oversees the management, businesses, strategic directions and financial performance of the Group. It
is collectively responsible for the management and operation of the Company. The Board is the ultimate decision
making body of the Company except for matters requiring the approval of the shareholders in accordance with the
Articles of Association, the Listing Rules or other applicable laws and regulations.
Day-to-day businesses of the Company are delegated to the management team which works under the leadership
and supervision of the Executive Vice-chairman & General Manager / the Executive Vice-chairman & Chief Executive
Officer and the Executive Committee of the Board as discussed in sections below.
Corporate Governance FunctionsThe Board is responsible for performing the corporate governance duties of the Company including:
(a) to develop and review the Company’s policies and practices on corporate governance;
(b) to review and monitor the training and continuous professional development of the Directors and senior
management;
(c) to review and monitor the Company’s policies and practices in compliance with legal and regulatory
requirements;
(d) to develop, review and monitor the code of conduct and compliance manual (if any) applicable to employees and
the Directors; and
(e) to review the Company’s compliance with Appendix 14 of the Listing Rules (Corporate Governance Code and
Corporate Governance Report).
The Group complied with all major aspects of laws and regulations that are significant to its business operations.
There were no threatened or concluded cases of material nature in connection with legal compliance during the year.

New World Development Company Limited102
Corporate Governance Report
Board MeetingsRegular Board meetings are held at least four times a year with at least 14 days’ notices and additional meetings
with reasonable notices are held as and when the Board considers appropriate. The Company Secretary assists the
Chairman in preparing agenda for each meeting. Draft agenda for each Board meeting is circulated to all Directors to
enable them to include other matters into the agenda. Agenda accompanying board papers are sent to all Directors
at least three days before each regular Board meeting. Board decisions are voted upon at the Board meetings. The
Company Secretary records all matters considered by the Board, decisions reached and any concerns raised or
dissenting views expressed by the Directors. Minutes of meetings are kept by the Company Secretary with copies
circulated to all Directors for information and records.
Directors’ TrainingEach newly appointed Director is provided with the necessary induction and information to ensure that he/she has
a proper understanding of the Company’s operations and businesses as well as his/her responsibilities under the
relevant statues, laws, rules and regulations. From time to time, the Company Secretary also provides the Directors
with updates on the latest development and changes in the Listing Rules and other relevant legal and regulatory
requirements.
The Executive Vice-chairman and General Manager / the Executive Vice-chairman & Chief Executive Officer reports
Group business activities including operations review, segment performance, strategies and new initiatives at
regular Board meetings. In addition, all Directors are provided with monthly updates on major business segments
performance and year-to-date financials. All these give the Board a balanced and understandable assessment of the
Group’s performance, position and prospects and enable the Board as a whole and each Director to discharge their
duties.

Annual Report 2020 103
Corporate Governance Report
All Directors are encouraged to participate in continuous professional development activities to develop and refresh their knowledge and skills. From time to time, the Company has arranged in-house trainings for the Directors in the form of seminars and reading materials. A summary of training received by the Directors for the year ended 30 June 2020 according to the records provided by the Directors is as follows:
Type of Continuous Professional Development
Name of Directors
Training on corporate governance,
regulatory development and other relevant topics
Attending corporate events or visits
Executive Directors
Dr. Cheng Kar-Shun, Henry ✓ –
Dr. Cheng Chi-Kong, Adrian ✓ ✓
Mr. Cheng Chi-Heng ✓ –
Ms. Cheng Chi-Man, Sonia ✓ –
Mr. Au Tak-Cheong* ✓ ✓
Mr. Sitt Nam-Hoi ✓ ✓
Mr. So Chung-Keung, Alfred* ✓ –
Ms. Huang Shaomei, Echo# ✓ –
Ms. Chiu Wai-Han, Jenny# ✓ ✓
Non-executive Directors
Mr. Doo Wai-Hoi, William ✓ –
Mr. Cheng Kar-Shing, Peter ✓ –
Ms. Ki Man-Fung, Leonie ✓ –
Independent Non-executive Directors
Mr. Yeung Ping-Leung, Howard ✓ ✓
Mr. Cha Mou-Sing, Payson ✓ –
Mr. Cha Mou-Zing, Victor (Alternate Director to Mr. Cha Mou-Sing, Payson) ✓ –
Mr. Ho Hau-Hay, Hamilton ✓ ✓
Mr. Lee Luen-Wai, John ✓ ✓
Mr. Liang Cheung-Biu, Thomas ✓ ✓
Mr. Ip Yuk-Keung, Albert ✓ ✓
* Mr. Au Tak-Cheong and Mr. So Chung-Keung, Alfred resigned as Directors with effect from 1 April 2020 and 1 January 2020 respectively# appointed as Director with effect from 1 May 2020

New World Development Company Limited104
Corporate Governance Report
BOARD COMMITTEES
The Board discharges some of its responsibilities through delegation to respective Board-level committees, namely
the Executive Committee, the Audit Committee, the Remuneration Committee, the Nomination Committee and
the Sustainability Committee. All the Board committees are empowered by the Board under their own terms of
reference which have been posted on HKEx’s website and/or the Company’s website.
Executive CommitteeMembers:
Executive Directors Dr. Cheng Kar-Shun, Henry (Chairman)
Dr. Cheng Chi-Kong, Adrian
Mr. Cheng Chi-Heng
Ms. Cheng Chi-Man, Sonia
Mr. Au Tak-Cheong*
Mr. Sitt Nam-Hoi
Mr. So Chung-Keung, Alfred*
Ms. Huang Shaomei, Echo#
Ms. Chiu Wai-Han, Jenny#
* Mr. Au Tak-Cheong and Mr. So Chung-Keung, Alfred resigned as Directors with effect from 1 April 2020 and 1 January 2020 respectively# appointed as Director with effect from 1 May 2020
The Board has delegated to the Executive Committee comprising all Executive Directors with authority and
responsibility for handling the management functions and day-to-day operations of the Company, while reserving
certain key matters such as the declaration of interim dividend, making recommendation of final dividend or other
distributions for the approval by the Board. The Executive Committee monitors the execution of the Company’s
strategic plans and the operations of all business units of the Company, and manages and develops generally the
businesses of the Company. The Executive Committee meets regularly as and when necessary.
Audit CommitteeMembers:
Independent Non-executive Directors Mr. Lee Luen-Wai, John (Chairman)
Mr. Yeung Ping-Leung, Howard
Mr. Cha Mou-Sing, Payson
Mr. Ho Hau-Hay, Hamilton
Mr. Liang Cheung-Biu, Thomas
Mr. Ip Yuk-Keung, Albert
The Audit Committee, which comprises of all Independent Non-executive Directors, is responsible for reviewing the
Group’s financial controls and its risk management and internal control systems. The Audit Committee is empowered
to review and monitor the external auditor’s independence and objectivity and the effectiveness of the audit process
in accordance with applicable standards. It also reviews the internal audit programme and ensures the internal audit
function is adequately resourced and effective.

Annual Report 2020 105
Corporate Governance Report
During the year, the Audit Committee met twice and reviewed the audited financial statements of the Company for
the year ended 30 June 2019 and the unaudited interim financial statements of the Company for the six months
ended 31 December 2019 with recommendations to the Board for approval, reviewed reports on risk management
and internal control systems of the Group, and discussed with the management and the external auditors on the
accounting policies and practices which may affect the Group and the financial reporting matters. Furthermore,
the Audit Committee reviewed the framework and policy of risk management, the system of internal control and
the financial statements for the year ended 30 June 2020 of the Company with recommendation to the Board for
approval.
Remuneration CommitteeMembers:
Independent Non-executive Directors Mr. Ho Hau-Hay, Hamilton (Chairman)
Mr. Yeung Ping-Leung, Howard
Mr. Cha Mou-Sing, Payson
Mr. Lee Luen-Wai, John
Executive Director Dr. Cheng Kar-Shun, Henry
The Remuneration Committee is responsible for making recommendations to the Board on the Company’s policy
and structure on the remuneration of all Directors and senior management of the Company and on the establishment
of a formal and transparent procedure for developing remuneration policy for the Company for approval by the Board.
It shall also make recommendations to the Board on the remuneration packages of individual Executive Director and
senior management.
The remuneration of individual Executive Director and senior management is determined with reference to his/her
duties and responsibilities with the Company, the Company’s performance as well as remuneration benchmarks in
the industry and the prevailing market condition. The Company’s Human Resources Department provides materials
on relevant remuneration data, remuneration benchmarks, market analysis and proposals to the Remuneration
Committee for consideration. The remuneration package is performance-based and linked to the Company’s
profitability, aimed to be competitive to attract and retain talented employees.
During the year, the Remuneration Committee met once and reviewed the remuneration policy of the Company,
including that for the Directors and senior management of the Company. The remuneration for the Executive
Directors comprises basic salary, pensions and discretionary bonus. Share options have been granted to all Directors
and senior management to subscribe for shares in the Company under the Company’s share option scheme. In
addition, a Director was granted options under share option scheme of a listed subsidiary of the Group to subscribe
for shares in that listed subsidiary. Details of the remuneration paid to the Directors and members of senior
management for the financial year ended 30 June 2020 are disclosed in the notes to the financial statements.

New World Development Company Limited106
Corporate Governance Report
Nomination CommitteeMembers:
Executive Director Dr. Cheng Kar-Shun, Henry (Chairman)
Independent Non-executive Directors Mr. Lee Luen-Wai, John
Mr. Liang Cheung-Biu, Thomas
Mr. Ip Yuk-Keung, Albert
The Nomination Committee is responsible for reviewing the structure, size and composition of the Board, assessing
the independence of Independent Non-executive Directors taking into account the independence requirements set
out in Rule 3.13 of the Listing Rules, and making recommendations to the Board on appointment and re-appointment
of Directors.
The Nomination Committee met once during the year and recommended to the Board on the Board Changes. It also
reviewed the structure, size and composition of the Board and considered that the Board consists of a diverse mix of
members and has provided a good balance of skills and experience appropriate to the business needs of the Group.
For the retiring Directors standing for re-election at 2020 annual general meeting of the Company, the Nomination
Committee also met in August 2020 and reviewed their biographical details against relevant requirements under
the Listing Rules and the nomination criteria set out in the Company’s Nomination Policy and considered they have
the required character, integrity and professional knowledge and experience to continue fulfilling their role and
contributing to the Company.
The Board has adopted a Nomination Policy since November 2018 which sets out the criteria and procedures to
be adopted when considering candidates to be appointed as Directors and re-appointment of existing Directors. In
the case of identifying candidate(s) to be appointed as Director, the Nomination Committee shall hold a meeting to
consider the candidate(s) identified or selected pursuant to the nomination criteria and make recommendation to the
Board if appropriate. The Board shall deliberate and decide on the appointment based upon the recommendation
of the Nomination Committee. In the case of re-appointment of existing Director, the Nomination Committee shall
review the overall contribution and service of the retiring Director to the Company and determine whether the retiring
Director continues to meet the nomination criteria set out in the Nomination Policy, and if appropriate, recommend
the retiring Director to the Board for consideration and recommendation to shareholders for the proposed re-election
of Director at a general meeting. The factors considered in assessing the suitability of a proposed candidate for
appointment as Director or re-appointment of existing Director are as follows:
• Contribution to the Board with due regard to the Board’s diversity policy;
• Reputation for integrity;
• Commitment to devote sufficient time to discharge duties as a Board member;
• Potential conflicts of interest with the Company; and
• Satisfaction of independence requirements of the Listing Rules in the case of a candidate for Independent Non-
executive Director.

Annual Report 2020 107
Corporate Governance Report
The Board has adopted a Board Diversity Policy (the “Policy”) since August 2013 which sets out the approach by the
Company to achieve diversity on the Board. Under the Policy, the Company recognises and embraces the benefits
of having a diverse Board and sees increasing diversity at Board level as an essential element in maintaining its
competitive advantage and supporting its sustainable development. In determining an optimum composition of the
Board, the Company will consider all aspects of diversity and will also take into account factors based on its own
business model and specific needs from time to time. Board members’ appointment will be based on meritocracy
and candidates will be considered against objective criteria, having due regard for the benefits of diversity on the
Board. Selection of candidates will be based on a range of diversity perspectives, including but not limited to gender,
age, skills, regional and industry experience and expertise, cultural and educational background, and professional
experience. The ultimate decision will be based on merit and contribution that the selected candidates will bring to
the Board.
The current Board composition reflects diverse mix of educational background, professional knowledge, industry
experience and length of service. The diversity mix of the Board as at 30 September 2020 is summarised in the
following charts:
Diversity Mix
ED
Female30-40
0-10
NED
Male
41-50
11-20
INED
Over 60
21-30
Over 30
0
2
4
6
8
10
12
14
16
Designation
Remarks: ED – Executive Director NED – Non-executive Director INED – Independent NED
Gender Age Group Length of Service(No. of years)
Num
ber
of D
irect
ors
Diversity Mix
51-60
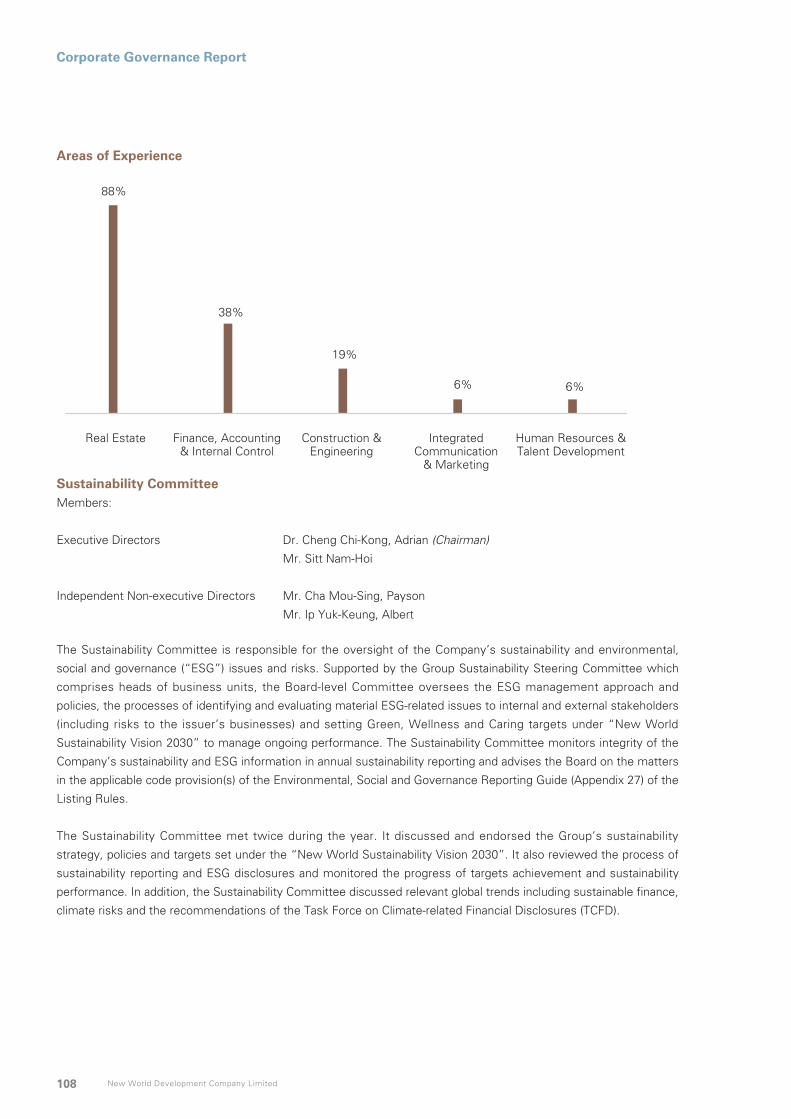
New World Development Company Limited108
Corporate Governance Report
Sustainability CommitteeMembers:
Executive Directors Dr. Cheng Chi-Kong, Adrian (Chairman)
Mr. Sitt Nam-Hoi
Independent Non-executive Directors Mr. Cha Mou-Sing, Payson
Mr. Ip Yuk-Keung, Albert
The Sustainability Committee is responsible for the oversight of the Company’s sustainability and environmental,
social and governance (“ESG”) issues and risks. Supported by the Group Sustainability Steering Committee which
comprises heads of business units, the Board-level Committee oversees the ESG management approach and
policies, the processes of identifying and evaluating material ESG-related issues to internal and external stakeholders
(including risks to the issuer’s businesses) and setting Green, Wellness and Caring targets under “New World
Sustainability Vision 2030” to manage ongoing performance. The Sustainability Committee monitors integrity of the
Company’s sustainability and ESG information in annual sustainability reporting and advises the Board on the matters
in the applicable code provision(s) of the Environmental, Social and Governance Reporting Guide (Appendix 27) of the
Listing Rules.
The Sustainability Committee met twice during the year. It discussed and endorsed the Group’s sustainability
strategy, policies and targets set under the “New World Sustainability Vision 2030”. It also reviewed the process of
sustainability reporting and ESG disclosures and monitored the progress of targets achievement and sustainability
performance. In addition, the Sustainability Committee discussed relevant global trends including sustainable finance,
climate risks and the recommendations of the Task Force on Climate-related Financial Disclosures (TCFD).
Real Estate Finance, Accounting& Internal Control
Construction &Engineering
IntegratedCommunication
& Marketing
Human Resources &Talent Development
Areas of Experience
38%
19%
6% 6%
88%
Areas of Experience

Annual Report 2020 109
Corporate Governance Report
ATTENDANCE AT BOARD MEETINGS, BOARD COMMITTEE MEETINGS AND GENERAL MEETINGS
Number of Meetings Attended/
Eligible to attend for the year ended 30 June 2020
Name of Directors
Board
Meeting
Audit
Committee
Meeting
Remuneration
Committee
Meeting
Nomination
Committee
Meeting
Sustainability
Committee
Meeting
Annual
General
Meeting
Extra-
ordinary
General
Meeting
Executive Directors
Dr. Cheng Kar-Shun, Henry 2/5 – 1/1 1/1 – 0/1 0/2
Dr. Cheng Chi-Kong, Adrian 5/5 – – – 2/2 1/1 2/2
Mr. Cheng Chi-Heng 4/5 – – – – 0/1 2/2
Ms. Cheng Chi-Man, Sonia 4/5 – – – – 1/1 2/2
Mr. Au Tak-Cheong* 4/4 – – – – 1/1 2/2
Mr. Sitt Nam-Hoi 5/5 – – – 2/2 1/1 2/2
Mr. So Chung-Keung, Alfred* 2/2 – – – – 1/1 0/0
Ms. Huang Shaomei, Echo# 0/0 – – – – 0/0 0/2
Ms. Chiu Wai-Han, Jenny# 0/0 – – – – 0/0 2/2
Non-executive Directors
Mr. Doo Wai-Hoi, William 5/5 – – – – 1/1 2/2
Mr. Cheng Kar-Shing, Peter 4/5 – – – – 0/1 2/2
Ms. Ki Man-Fung, Leonie 5/5 – – – – 1/1 2/2
Independent Non-executive Directors
Mr. Yeung Ping-Leung, Howard 5/5 2/2 1/1 – – 1/1 2/2
Mr. Cha Mou-Sing, Payson 5/5 2/2 1/1 – 1/2 0/1 0/2
Mr. Ho Hau-Hay, Hamilton 4/5 1/2 1/1 – – 1/1 2/2
Mr. Lee Luen-Wai, John 5/5 2/2 1/1 1/1 – 1/1 2/2
Mr. Liang Cheung-Biu, Thomas 5/5 2/2 – 1/1 – 1/1 2/2
Mr. Ip Yuk-Keung, Albert 5/5 2/2 – 1/1 2/2 1/1 2/2
* Mr. Au Tak-Cheong and Mr. So Chung-Keung, Alfred resigned as Directors with effect from 1 April 2020 and 1 January 2020 respectively# appointed as Director with effect from 1 May 2020

New World Development Company Limited110
Corporate Governance Report
AUDITORS’ REMUNERATION
During the year ended 30 June 2020, the total fee paid/payable in respect of audit and non-audit services provided by
the Group’s external auditors is set out below:
Fee paid/payable
for the year ended 30 June
Type of services 2020 2019
HK$m HK$m
Audit services 62.8 63.8
Non-audit services 19.6 32.0
Total 82.4 95.8
Non-audit services comprise primarily accounting, tax advisory, circular works related to capital market transactions, as
well as other related services.
DIRECTORS’ RESPONSIBILITY FOR THE FINANCIAL STATEMENTS
The Board, supported by the finance and accounts department, is responsible for the preparation of the financial
statements of the Company and the Group. The Board has prepared the financial statements in accordance with
the Hong Kong Financial Reporting Standards issued by the Hong Kong Institute of Certified Public Accountants.
Appropriate accounting policies have also been used and applied consistently except the adoption of revised
standards, amendments to standards and interpretation. The Directors have not been aware of any material
uncertainties relating to events or conditions which may cast significant doubt upon the Group’s ability to continue as
a going concern.
The statement by the auditor of the Company and the Group regarding its reporting responsibilities on the financial
statements of the Company and the Group is set out in the Independent Auditor’s Report in this annual report.
RISK MANAGEMENT AND INTERNAL CONTROL
Governance, Risk and ControlRobust and effective management of risks is an essential and integral part of corporate governance. The
management of the Group proactively manages the risks by establishing an Enterprise Risk Management (“ERM”)
framework to assist the Audit Committee and the Board in discharging its risk management responsibilities and
individual business units in managing their key risks. With reference to the “Internal Control – Integrated Framework”
issued by the Committee of Sponsoring Organizations of the Treadway Commission (“COSO”), the main features of
the ERM system are illustrated below:

Annual Report 2020 111
Corporate Governance Report
Objectives
‧ Demonstrate a commitment to integrity and ethical values.‧ A set of standards, processes and structures that lays the foundation of internal controls.‧ Cover organisational structure, reporting lines, and appropriate authorities and responsibilities.
Control Environment
‧ Involve a dynamic and iterative process for identifying and assessing risks to the achievement of objectives.‧ Form the basis for determining how risks should be mitigated and managed.
Risk Assessment
‧ Obtain or generate and use relevant, quality information to support the functioning of risk management and internal control systems.‧ The Group is provided with the required information for carrying out day-to-day controls through effective communication channels.
Information and Communication
‧ Select, develop, and perform periodic and/or timely evaluations to ascertain whether the components of internal control are present and functioning.‧ Identify and communicate internal control de�ciencies in an effective and timely manner to those parties responsible for taking corrective action.
Monitoring
‧ Deploy a diverse range of policies and procedures that help ensure the management directives to mitigate risks are carried out.‧ Preventive or detective in nature, and involving authorisations and approvals, veri�cations, reconciliations, business performance review, segregation of duties, etc.
Control Activities
Operation
Effectiveness and ef�ciency
Reporting
Reliability, timeliness and transparency
Compliance
Adherence to laws and regulations

New World Development Company Limited112
Corporate Governance Report
The Board has the overall responsibility for evaluating and determining the nature and extent of the risks it is
willing to take in achieving the Group’s strategic objectives, and ensuring that the Group establishes and maintains
appropriate and effective risk management and internal control systems. The Audit Committee is delegated with the
authority from the Board to oversee the Group’s management in the design, implementation and monitoring of the
risk management and internal control systems. It also advises the Board on the Group’s risk-related matters.
Sound and effective risk management and internal control systems have been established and maintained for
safeguarding assets against unauthorised use or disposition, ensuring the maintenance of proper accounting records
for the provision of reliable financial information for internal use or for publication, and ensuring compliance of
applicable laws, rules and regulations. It should be acknowledged that such systems are designed to manage rather
than eliminate the risk of failure to achieve business objectives, and can only provide reasonable and not absolute
assurance against material misstatement or loss.
The Risk Management Committee assists the Audit Committee in discharging its corporate governance
responsibilities for risk management. It is responsible for ensuring that the risk management system is adequate
and effective and that the ERM framework is implemented consistently throughout the Group. It also monitors the
Group’s overall risk profiles by reviewing the key risks relating to individual business units and the key risks that are
enterprise-wide, and ensures alignment with the approved risk appetite.
An internal audit department has been established to conduct internal audit of the Company and its subsidiaries,
joint ventures and associated companies. The internal audit department performs risk-based audits to review the
effectiveness of the Group’s material internal controls so as to provide assurance that all key risks are identified and
managed, and to ensure that the risk management and internal control measures are carried out appropriately and
functioning as intended. Major audit findings and recommendations are reported to the Audit Committee, which in
turn reports to the Board. The implementation of the agreed actions in response to the identified audit issues are
tracked and followed up regularly, and the status is reported to the Audit Committee.
The Audit Committee receives the report from the internal audit department and takes such report into consideration
when it makes recommendation to the Board for approval of the half-yearly or annual results of the Group.

Annual Report 2020 113
Corporate Governance Report
Risk Governance Structure
Board of Directors
Risk Management Committee
ManagementControl
Financial Control
Risk Management and
Internal Control
Compliance Internal Audit
Whistleblow
ing System
External A
uditor
Data Privacy andInformation Security
Sustainability
1st Line ofDefence
2nd Line ofDefence
3rd Line ofDefence
Risk Managementand Internal
Control Measures
Audit Committee
The Group’s risk governance structure is guided by the “Three Lines of Defence” model. As the first line of defence,
risk owners of all corporate departments and business units of the Group identify and evaluate the risks which
may potentially impact the achievement of their business objectives, mitigate and monitor the risks (including but
not limited to business, operation as well as environmental, social and governance (“ESG”) risks) by designing
and executing control procedures in their day-to-day operations. They conduct risk assessment and control self-
assessment on a regular basis to evaluate the adequacy and effectiveness of controls that are in place to mitigate
the identified risks.
As the second line of defence, the Group establishes specific functions to effectuate risk management and ensure
the first line of defence is properly in place and operating as intended. The responsibilities of these functions include
but not limited to financial control, risk management and internal control, compliance, data protection and information
security, sustainability, and so forth. The Risk Management Committee also oversees and monitors the overall
operation of the risk management and internal control systems.

New World Development Company Limited114
Corporate Governance Report
As the third line of defence, the internal audit department acts as an independent assessor. It is responsible for
reviewing the major operational, financial, compliance and risk management controls of the Group on a continuous
basis. It schedules its work in an annual audit plan which is reviewed by the Audit Committee every year. The audit
plan is derived from risk assessment basis and is aimed at covering each significant corporate department and
business unit in which the Group involves in day-to-day management within a reasonable period. The internal audit
department also carries out independent and timely review or investigation works, where and when necessary, on
risks and control related incidents identified from time to time.
On top of the “Three Lines of Defence”, through independent audit and review, the external auditor provides
reasonable assurance on the effectiveness of the risk management and internal control systems. Whistleblowing
System is established for staff and other relevant parties to report misconduct cases. Every reported case will
be handled in confidentiality and followed through in accordance with the Whistleblowing Policy and its related
procedures.
Risk Management Approach
RiskStrategy
RiskGovernance
(1) Establish the context
(7) Communicate
and consult
(6) Monitorand review
(2) Identify risks
(3) Analyse risks
(4) Evaluate risks
(5) Treat risks
Internalaudit
Half-yearlykey risk
reportingmechanism
Early risk�agging
mechanismTraining Whistleblowing
Risk Appetite
Risk ReportingStructures,Roles andResponsibilities
RiskManagementProcess
Risk Assurance

Annual Report 2020 115
Corporate Governance Report
The Group adopts both top-down and bottom-up approaches in relation to risk management. It involves collating and
appraising bottom-up inputs from risk owners of all corporate departments and business units of the Group, with
refinements and adjustments through top-down inputs from the Board in an iterative manner.
The risk management process is integrated into our daily operations and is an ongoing process involving all parts of
the Group from the Board down to each individual staff. The risk owners and risk oversight parties are clearly defined
across the Group. They are required to identify, analyse and evaluate the risks (including but not limited to business,
operation as well as ESG risks) facing their businesses with proper management execution to avoid, reduce or
transfer those risks accordingly.
Risk Management Policy is established for enhancing the effective implementation of the risk management and
internal control exercises within the Group. To ensure that all major risks are properly identified, evaluated and
monitored for achieving a sound and effective risk management system, risk owners across the Group are required
to report the risk review exercises to the internal audit department by submitting the “Risk Management and Internal
Control Assessment Checklist” half-yearly. They need to report the effectiveness of the risk management and
internal control systems and set out details of the key risks including the risk description, change of risk level, current
risk level and the corresponding key risk control or mitigation action in the “Key Risks Reporting Table”.
Besides, an early risk flagging mechanism is established which enables the Group to proactively identify and assess
emerging risks and broad areas of changes, emanating from both internal and external factors (including but not
limited to business, operation as well as ESG risks), and act on them in a timely manner. Risk owners have to flag
and report immediately to the corresponding risk oversight parties when a potential risk is perceived and significant
impact is expected in any business areas.
After consolidation with a holistic review of the Group, the internal audit department submits a written report on the
effectiveness of the Group’s risk management and internal control systems to the Risk Management Committee
and the Audit Committee for review on a half-yearly basis. The Board, through the Risk Management Committee and
the Audit Committee, has put in place effective risk management and internal control systems which will enable the
Group to respond appropriately to significant business, operational, financial, compliance, ESG related and other risks
in achieving its objectives. The Group strives to continually improve its ERM framework in order to keep pace with
the dynamic business environment. The Board, therefore, considers that the risk management and internal control
systems of the Group are effective and adequate.

New World Development Company Limited116
Corporate Governance Report
Key Risks of the GroupThrough our combined top-down and bottom-up risk review processes, the Group has identified the following key
risks of various business segments for the year:
Risk Description Risk Trends* Key Mitigation Measures
Economic Risk
1 Adverse changes in macroeconomic
environment due to the uncertainties
associated with the US-China trade war and
global financial conditions.
• Closely monitor economic conditions
and respond with suitable strategies in a
timely manner.
• Perform stress test and sensitivity
analysis for different scenarios.
• Conduct regular performance review of
business units and projects.
• Maintain healthy financial position.
Social and Environmental Risk
2 Threats to public health and disruptions in
operations due to outbreak of coronavirus
pandemic or other pandemic diseases,
as well as instability resulted from social
unrest.
• Heighten employees’ vigilance and take
comprehensive precautionary measures.
• Employee work flexibility empowerment
and arrangements for better manpower
management.
• Continuous improvement on overall
health and safety matters and review the
safety working procedures regularly.
• Formulate and execute contingency /
business continuity plans developed
for critical business processes and
functions to mitigate the risk of business
disruptions.
• Proper insurance coverage for the
Group’s properties and business
operations.
Political and Regulatory Risk
3 Unfavourable changes of government
policies and regulatory requirements.
• Continuously monitor the change of
government policies, laws and regulatory
requirements.
• Regularly review the compliance of
regulations.
• Provide regulatory compliance training to
employees.
• Maintain timely communication with
the community and key stakeholders to
enhance transparency.

Annual Report 2020 117
Corporate Governance Report
Risk Description Risk Trends* Key Mitigation Measures
Operational Risk
4 Increase in development costs, including
construction costs, and delay in project
completion.
• Closely monitor and manage construction
progress and performance of contractors
in order to avoid delays in project
development.
• Implement cost management strategies
including central procurement, stringent
review on capital expenditure, etc.
• Cost monitoring through budgetary
control mechanism.
• Tender procedures in place to ensure
best prices are achieved through
competitive bidding.
• Negotiate with project owner to adjust
project timetable.
• Implement stringent pre-qualification
assessments of contractors and approval
mechanisms for design changes.
5 Critical incidents (e.g. health and safety
issues, business disruptions and natural
disasters) affecting business operation and
damaging reputation.
• Conduct regular monitoring to keep track
of issues related to the Group’s different
businesses.
• Deliver quick and effective responses
according to crisis management
procedures, communication and
escalation protocols.
• Recognise the impact of climate change
and promote sustainability within the
Group.
• Raise awareness through periodic safety
training and drills.
• Ensure sufficient insurance coverage.
Strategic Risk
6 Keen industry competition and adverse
changes in the property market in Hong
Kong and China such as new competitors,
increasing land cost, property cooling
measures, etc.
• Constantly enhance quality of products
and services to strengthen our brand and
market position.
• Regularly review existing service and
products and their pricing strategies,
and formulate appropriate strategies in
response to market change.
• Closely monitor the changes of property
market trends and other factors which
may pose an adverse impact on the
Group’s property development business.
• Selective land bank replenishment to
maximise earning potential.

New World Development Company Limited118
Corporate Governance Report
Risk Description Risk Trends* Key Mitigation Measures
7 Business investment risk due to long-term
commitment to unprofitable projects and
deviation from desired return of investment.
• Adopt careful and pragmatic investment
strategies and maintain a balanced and
diversified portfolio.
• Perform risk assessment and due
diligence by internal professionals and
external consultants prior to project
bidding.
• Monitor the operation and financial
performance of project companies to
ensure that the projects are carried out as
planned.
• Regularly review the investment and
explore divestment opportunities if
needed.
8 Business partnership risk due to limited
controls in minority interest investment.
• Perform detailed due diligence before
establishment of long term partnership.
• Carefully select business partners with
good reputation, industrial background
and operational experience.
• Set up minority protection mechanism.
• Build our own expertise in the industry
to reduce reliance on business partners.
Technology Risk
9 Cyber-attacks on networks and systems
which may cause business interruption,
leakage of confidential information, etc.
• Regular review and update of information
technology infrastructure and systems.
• Establish policies and procedures for the
uses of information technology.
• Implementation of security measures
such as firewall, antispam and anti-virus
protection.
• Provide training on information security
awareness.

Annual Report 2020 119
Corporate Governance Report
Risk Description Risk Trends* Key Mitigation Measures
Financial Risk
10 Unfavourable fluctuation of foreign
currencies and interest rates.
• Closely monitor the movement of foreign
currency and interest rate and quantify
their impact.
• Maintain an appropriate mix of fixed rate
and floating rate borrowings to mitigate
the Group’s interest rate risk.
• To finance part of the business
operations in Mainland China by
Renminbi borrowings to mitigate the
Group’s exchange rate risk.
• Enter into interest rate swaps, forward
exchange contracts, etc. for hedging
purpose, if needed.
• Review the financing strategy and debt
structure of the Group regularly.
* Risk Trend
Risk level increased during FY2020 Risk level remained similar as FY2019
COMPANY SECRETARY
The Company Secretary is a full time employee of the Company and has day-to-day knowledge of the Company’s
affairs. The Company Secretary reports to the Chairman and is responsible for advising the Board on governance
matters. For the year under review, the Company Secretary has confirmed that he has taken no less than 15 hours of
relevant professional training. The biography of the Company Secretary is set out on page 57 of this annual report.
CONSTITUTIONAL DOCUMENTS
No change has been made to the Company’s Articles of Association during the year.
ENVIRONMENTAL, SOCIAL AND GOVERNANCE
The “Corporate Sustainability” section from pages 58 to 97 in this annual report was prepared in accordance
with the Core option of the Global Reporting Initiative (“GRI”) Sustainability Reporting Standards, as well as the
Environmental, Social and Governance Reporting Guide issued by the Stock Exchange, which provides an overview
of the Group’s efforts and performance in pursuing corporate sustainability. Supplementary information is available
on the Company’s website under Sustainability section.

New World Development Company Limited120
Corporate Governance Report
SHAREHOLDERS’ RIGHTS
Convening Extraordinary General Meeting (“EGM”) and Putting Forward Proposals at General MeetingsShareholders representing at least 5% of the total voting rights of all the shareholders of the Company having a
right to vote at general meetings can deposit a written request to convene an EGM at the registered office of the
Company for the attention of the Company Secretary. Such requisition, signed by the shareholders concerned, must
state the general nature of the business to be dealt with at the meeting and may include the text of a resolution that
may properly be moved and is intended to be moved at the meeting. If the Directors do not within 21 days from
the date of the deposit of a request (after being verified to be valid) proceed to convene an EGM on a day not more
than 28 days after the date on which the notice convening the EGM is given, the shareholders concerned, or any of
them representing more than one-half of the total voting rights of all of them, may themselves convene an EGM, but
any EGM so convened shall not be held after the expiration of three months after the date on which the Directors
become subject to the requirement to call a meeting.
To put forward proposals at general meeting, a request in writing must be made by:
(i) shareholders representing at least 2.5% of the total voting rights of all shareholders of the Company having the
right to vote at general meeting; or
(ii) at least 50 shareholders of the Company having the right to vote at the meeting,
to the Company to give to shareholders notice of any resolution which may properly be moved and is intended to
be moved at an annual general meeting, or to circulate to shareholders any statement of not more than 1,000 words
with respect to the matter referred to in any proposed resolution or the business to be dealt with at any general
meeting.
The written request must be signed by all the shareholders concerned in one or more documents in like form and
deposited at the registered office of the Company for the attention of the Company Secretary not less than six
weeks before the meeting in the case of a requisition requiring notice of a resolution at annual general meeting,
and not less than seven days before the meeting in the case of requiring circulation of statement. Upon the request
verified to be valid, the Company will give notice of the resolution or circulate the statement.
If a shareholder of the Company intends to propose a person other than a Director of the Company for election as a
Director of the Company at any general meeting, the shareholder concerned shall lodge with the registered office of
the Company for the attention of the Company Secretary (i) a written notice of his intention to propose that person
for election as a Director; and (ii) a written notice by that person of his/her willingness to be elected as a Director
together with the necessary information within the period commencing no earlier than the day after the dispatch of
the notice of the general meeting and ending no later than seven days prior to the date of such general meeting.
Detailed procedures can be found in the following documents which are available on the Company’s website:
• “Procedures for Shareholders to convene Extraordinary General Meetings and putting forward proposals at
General Meetings”; and
• “Procedures for Shareholders to propose a person for election as a Director”.
Annual Report 2020 121
Corporate Governance Report
Enquiries to the BoardEnquiries may be put to the Board through the Company’s investor relations department at 30/F., New World Tower,
16-18 Queen’s Road Central, Hong Kong (email: [email protected]).
DIVIDEND POLICY
The Board adopted a Dividend Policy in November 2018 which sets out the guidelines for the Board to determine the
frequency of dividend payment and target dividend payout ratio for a financial year. The Company would distribute
to its shareholders funds surplus to the operating needs of the Company and its subsidiaries twice for each financial
year as determined by the Board, subject to its shareholders’ approval, where applicable. In general, it is the policy of
the Company to maintain a balance between meeting shareholders’ expectations and prudent capital management
with a sustainable dividend policy. The following factors will be taken into account for determining the Company’s
target dividend payout ratio:
• Any restrictions under the Hong Kong Companies Ordinance;
• Any banking or other funding covenants by which the Company is bound from time to time;
• The capital expenditure and operating requirements of the Group; and
• The external economic and market situation.
COMMUNICATION WITH SHAREHOLDERS
The Board and management maintain a continuing dialogue with the Group’s shareholders and investors through
various channels including the Company’s annual general meeting. The Chairman, Chief Executive Officer, other
members of the Board and the external auditor attend the annual general meeting to meet the shareholders. The
Directors will answer questions raised by the shareholders on the performance of the Group. The Group holds
press conferences and analyst briefings at least twice a year following the release of interim and full year results
announcements at which the executive directors and management of the Group are available to answer questions
and listen feedbacks regarding the performance of the Group. Our corporate websites which contains corporate
information, interim and annual reports, announcements and circulars issued by the Group as well as the recent
developments of the Group enables the Group’s shareholders to have timely and updated information of the Group.
Shareholders can refer to the “Shareholders’ Communication Policy” posted on the Group’s websites for more
details.
INVESTOR RELATIONS
To ensure that the investors have a comprehensive and thorough understanding of the Group, with the establishment
of timely and effective two-way communications, the management and investor relations team of the Group
participate in different international investment conferences and arranges local and overseas non-deal roadshows
on a regular basis to elaborate the Group’s business development and market movement to investors in different
locations. For details, please refer to the “Investor Relations” section from pages 122 and 123 of this annual report.

New World Development Company Limited122
Investor Relations
The year of 2020 is the 50th anniversary of the Group. Since its listing on the main board of Hong Kong Stock Exchange in 1972, the Group has maintained close communication with its shareholders and the capital market. In compliance with pertinent laws and regulatory requirements, the Group has provided swift, impartial and timely disclosure of information for various stakeholders to ensure investors can make effective assessments and informed investment decisions.
HIGH PRIORITY FOR THE BOARD
The Board has approved and adopted the Shareholders’ Communication Policy, which will be reviewed in due course to ensure its appropriateness and effectiveness, highly recognising the Board’s strong emphasis on accountability to and right to information of shareholders and stakeholders.
Information disclosed on the HKEXnews platform of The Stock Exchange of Hong Kong Limited or the Group’s website include the Group’s financial reports, announcements, corporate governance policies, terms of reference of the Board committees, press releases and newsletters (ARTISANAL CONNECT). Other than shareholders’ services provided by the share registrar and transfer office, the Group also addresses general enquiries from shareholders and stakeholders via email and online forms available on the corporate website.
The annual general meeting is an important annual event for members of the Board to engage and communicate with shareholders in person. Members of the Board, together with the representatives of the independent auditor, attend the meeting and answer questions raised by shareholders on the spot. On the day of the results announcement, the Group typically holds press conference and analyst briefing, at which the Executive Directors and senior management elaborate on the Group’s operating conditions, development prospects and strategic layout. In this fiscal year, due to the COVID-19 pandemic, the results presentations were held via live streaming and feedback and queries of stakeholders were heard and answered directly online. Three languages were provided so that investors with different language backgrounds could participate.
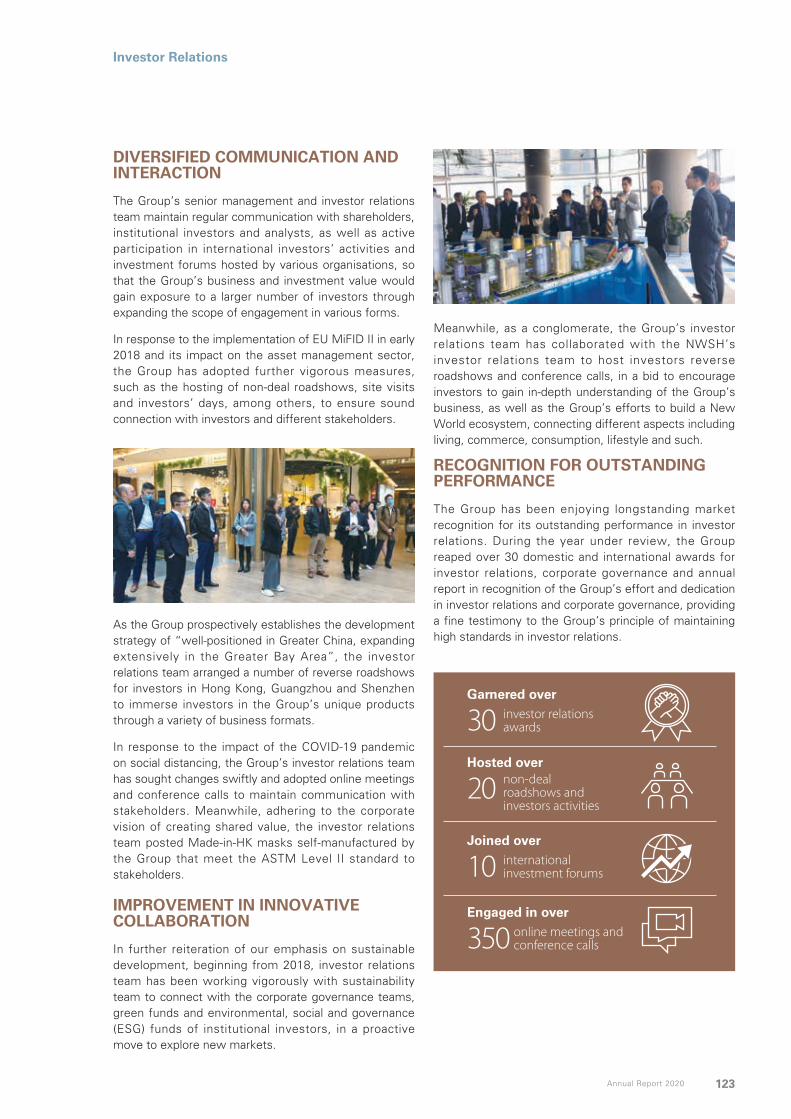
Annual Report 2020 123
Investor Relations
As the Group prospectively establishes the development strategy of “well-positioned in Greater China, expanding extensively in the Greater Bay Area”, the investor relations team arranged a number of reverse roadshows for investors in Hong Kong, Guangzhou and Shenzhen to immerse investors in the Group’s unique products through a variety of business formats.
In response to the impact of the COVID-19 pandemic on social distancing, the Group’s investor relations team has sought changes swiftly and adopted online meetings and conference calls to maintain communication with stakeholders. Meanwhile, adhering to the corporate vision of creating shared value, the investor relations team posted Made-in-HK masks self-manufactured by the Group that meet the ASTM Level II standard to stakeholders.
IMPROVEMENT IN INNOVATIVE COLLABORATION
In further reiteration of our emphasis on sustainable development, beginning from 2018, investor relations team has been working vigorously with sustainability team to connect with the corporate governance teams, green funds and environmental, social and governance (ESG) funds of institutional investors, in a proactive move to explore new markets.
DIVERSIFIED COMMUNICATION AND INTERACTION
The Group’s senior management and investor relations team maintain regular communication with shareholders, institutional investors and analysts, as well as active participation in international investors’ activities and investment forums hosted by various organisations, so that the Group’s business and investment value would gain exposure to a larger number of investors through expanding the scope of engagement in various forms.
In response to the implementation of EU MiFID II in early 2018 and its impact on the asset management sector, the Group has adopted further vigorous measures, such as the hosting of non-deal roadshows, site visits and investors’ days, among others, to ensure sound connection with investors and different stakeholders.
Engaged in over
350 online meetings and conference calls
Garnered over
30 investor relationsawards
Hosted over
20 non-dealroadshows andinvestors activities
Joined over
10 internationalinvestment forums
Meanwhile, as a conglomerate, the Group’s investor relations team has collaborated with the NWSH’s investor relations team to host investors reverse roadshows and conference calls, in a bid to encourage investors to gain in-depth understanding of the Group’s business, as well as the Group’s efforts to build a New World ecosystem, connecting different aspects including living, commerce, consumption, lifestyle and such.
RECOGNITION FOR OUTSTANDING PERFORMANCE
The Group has been enjoying longstanding market recognition for its outstanding performance in investor relations. During the year under review, the Group reaped over 30 domestic and international awards for investor relations, corporate governance and annual report in recognition of the Group’s effort and dedication in investor relations and corporate governance, providing a fine testimony to the Group’s principle of maintaining high standards in investor relations.
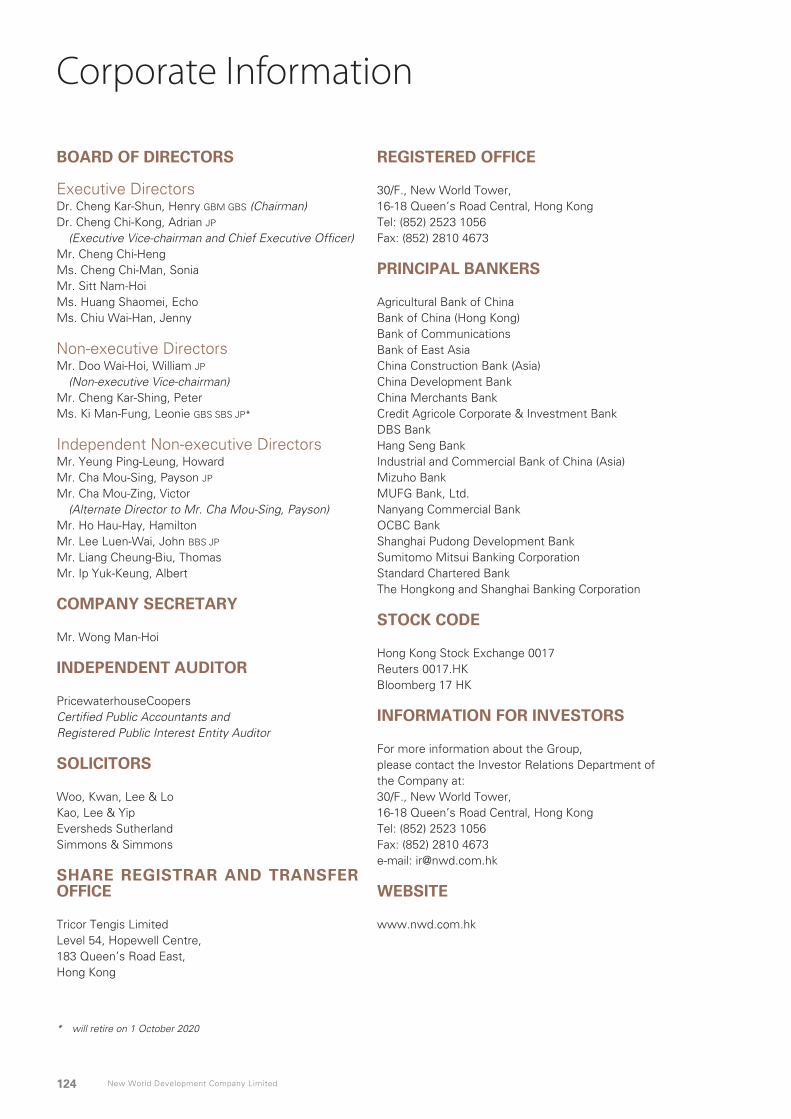
New World Development Company Limited124
Corporate Information
BOARD OF DIRECTORS
Executive DirectorsDr. Cheng Kar-Shun, Henry GBM GBS (Chairman)Dr. Cheng Chi-Kong, Adrian JP
(Executive Vice-chairman and Chief Executive Officer)Mr. Cheng Chi-Heng Ms. Cheng Chi-Man, Sonia Mr. Sitt Nam-Hoi Ms. Huang Shaomei, Echo Ms. Chiu Wai-Han, Jenny
Non-executive DirectorsMr. Doo Wai-Hoi, William JP (Non-executive Vice-chairman) Mr. Cheng Kar-Shing, PeterMs. Ki Man-Fung, Leonie GBS SBS JP*
Independent Non-executive DirectorsMr. Yeung Ping-Leung, Howard Mr. Cha Mou-Sing, Payson JP
Mr. Cha Mou-Zing, Victor (Alternate Director to Mr. Cha Mou-Sing, Payson)Mr. Ho Hau-Hay, Hamilton Mr. Lee Luen-Wai, John BBS JP Mr. Liang Cheung-Biu, Thomas Mr. Ip Yuk-Keung, Albert
COMPANY SECRETARY
Mr. Wong Man-Hoi
INDEPENDENT AUDITOR
PricewaterhouseCoopersCertified Public Accountants andRegistered Public Interest Entity Auditor
SOLICITORS
Woo, Kwan, Lee & Lo Kao, Lee & Yip Eversheds SutherlandSimmons & Simmons
SHARE REGISTRAR AND TRANSFER OFFICE
Tricor Tengis Limited Level 54, Hopewell Centre, 183 Queen’s Road East, Hong Kong
REGISTERED OFFICE
30/F., New World Tower, 16-18 Queen’s Road Central, Hong Kong Tel: (852) 2523 1056 Fax: (852) 2810 4673
PRINCIPAL BANKERS
Agricultural Bank of China Bank of China (Hong Kong) Bank of Communications Bank of East Asia China Construction Bank (Asia) China Development Bank China Merchants Bank Credit Agricole Corporate & Investment Bank DBS Bank Hang Seng Bank Industrial and Commercial Bank of China (Asia) Mizuho Bank MUFG Bank, Ltd.Nanyang Commercial Bank OCBC Bank Shanghai Pudong Development Bank Sumitomo Mitsui Banking Corporation Standard Chartered Bank The Hongkong and Shanghai Banking Corporation
STOCK CODE
Hong Kong Stock Exchange 0017 Reuters 0017.HK Bloomberg 17 HK
INFORMATION FOR INVESTORS
For more information about the Group, please contact the Investor Relations Department of the Company at:30/F., New World Tower, 16-18 Queen’s Road Central, Hong Kong Tel: (852) 2523 1056 Fax: (852) 2810 4673 e-mail: [email protected]
WEBSITE
www.nwd.com.hk
* will retire on 1 October 2020

Annual Report 2020 125
Report of the Directors
The Directors have pleasure in presenting their annual report and financial statements for the year ended 30 June 2020.
GROUP ACTIVITIES
The principal activities of the Company remain investment holding and property development and investment. The principal activities of the principal subsidiaries, joint ventures and associated companies are shown in notes 54, 55 and 56 to the financial statements.
SHARE CONSOLIDATION
On 23 June 2020, (i) every four issued shares of the Company were consolidated into one share of the Company (each a “Consolidated Share”) and the number of Consolidated Shares was rounded down to the nearest whole number by disregarding each and every fractional Consolidated Share which would otherwise arise (the “Share Consolidation”); and (ii) no shareholders of the Company were allocated with any fractional Consolidated Shares which they would otherwise be entitled to receive and were disregarded as aforesaid, but instead each registered shareholder of the Company concerned was paid a sum equivalent to the closing price per Consolidated Share on the Stock Exchange on 23 June 2020, being the effective date of the Share Consolidation, multiplied by a fraction same as the fraction of the Consolidated Share to which such shareholder of the Company would otherwise be entitled; and (iii) all of the Consolidated Shares shall rank pari passu in all respects with each other.
As at 30 June 2020, the total number of shares of the Company in issue was 2,549,116,921.
RESULTS AND APPROPRIATION
The results of the Group for the year ended 30 June 2020 are set out in the consolidated income statement on page 170 of this annual report.
The Directors have resolved to recommend a final cash dividend for the year ended 30 June 2020 of HK$1.48 per share (2019: HK$0.37 (before Share Consolidation)/HK$1.48 (after Share Consolidation) per share) to shareholders whose names appear on the register of members of the Company on 1 December 2020. Together with the interim dividend of HK$0.14 (before Share Consolidation)/HK$0.56 (after Share Consolidation) per share (2019: HK$0.14 (before Share Consolidation)/HK$0.56 (after Share Consolidation) per share), the total dividend for the financial year ended 30 June 2020 is HK$2.04 per share (2019: HK$0.51 (before Share Consolidation)/HK$2.04 (after Share Consolidation) per share).
Subject to the passing of the relevant resolutions at the annual general meeting of the Company to be held on 26 November 2020, it is expected that the proposed final dividend will be distributed to shareholders on or about 21 December 2020.
BUSINESS REVIEW
A fair review of the business of the Group, a discussion and analysis of the Group’s performance during the year including analysis using financial key performance indicators, particulars of important events affecting the Group that have occurred since the end of the financial year, description of the principal risks and uncertainties facing the Group, and a discussion on the Group’s environmental policies and performance and the Group’s compliance with relevant laws and regulations that have a significant impact on the Group, and an account of the Group’s key relationships with its stakeholders are provided throughout this annual report, particularly in the sections headed “Financial Highlights”, “CEO’s Report”, “Corporate Sustainability”, “Corporate Governance Report” and “Management Discussion and Analysis” of this annual report. These discussions form part of this Directors’ Report.
SHARES ISSUED
During the year, as a result of the exercise of share options under the share option scheme of the Company, a total of 45,752,065 shares (before Share Consolidation) of the Company, fully paid, were issued for a total consideration of HK$350,397,213.06.
Details of the shares issued during the year are set out in note 38 to the financial statements.

New World Development Company Limited126
Report of the Directors
DEBENTURES ISSUED
Certain subsidiaries of the Company had issued notes for the purpose of financing the general working capital requirement of the Group during the year as follows:
1. On 3 July 2019, US$300.0 million (equivalent to approximately HK$2,340.0 million) 5.750% guaranteed senior perpetual capital securities were issued by Celestial Miles Limited and listed on the Stock Exchange at a price of 104.000% of the principal amount with net proceeds (excluding accrued interest) of US$309.2 million (equivalent to approximately HK$2,411.7 million);
2. On 18 July 2019, US$950.0 million (equivalent to approximately HK7,410.0 million) 4.125% guaranteed notes due 2029 were issued by NWD (MTN) Limited and listed on the Stock Exchange at a price of 98.718% of the principal amount with net proceeds of US$928.3 million (equivalent to approximately HK$7,240.7 million);
3. On 24 July 2019, US$400.0 million (equivalent to approximately HK$3,120.0 million) 6.250% guaranteed senior perpetual capital securities were issued by NWD Finance (BVI) Limited and listed on the Stock Exchange at a price of 101.389% of the principal amount with net proceeds (excluding accrued interest) of US$401.6 million (equivalent to approximately HK$3,132.5 million);
4. On 1 November 2019, US$400.0 million (equivalent to approximately HK$3,120.0 million) 6.250% guaranteed senior perpetual capital securities were issued by NWD Finance (BVI) Limited and listed on the Stock Exchange at a price of 101.412% of the principal amount with net proceeds (excluding accrued interest) of US$402.4 million (equivalent to approximately HK$3,138.7 million);
5. On 17 March 2020, HK$150.0 million 1.500% guaranteed notes due 2022 were issued by NWD (MTN) Limited at a price of 99.319% of the principal amount with net proceeds of HK$149.0 million;
6. On 17 April 2020, HK$300.0 million 3.830% guaranteed notes due 2030 were issued by NWD (MTN) Limited at a price of 100.000% of the principal amount with net proceeds of HK$296.3 million;
7. On 19 May 2020, US$600.0 million (equivalent to approximately HK$4,680.0 million) 4.500% guaranteed notes due 2030 were issued by NWD (MTN) Limited and listed on the Stock Exchange at a price of 99.920% of the principal amount with net proceeds of US$595.6 million (equivalent to approximately HK$4,645.7 million);
8. On 22 June 2020, US$650.0 million (equivalent to approximately HK$5,070.0 million) guaranteed senior perpetual capital securities at an initial distribution rate of 5.250% per annum were issued by NWD Finance (BVI) Limited and listed on the Stock Exchange at a price of 100.000% of the principal amount with net proceeds of US$645.8 million (equivalent to approximately HK$5,037.2 million); and
9. On 30 June 2020, US$200.0 million (equivalent to approximately HK$1,560.0 million) guaranteed senior perpetual capital securities at an initial distribution rate of 5.250% per annum were issued by NWD Finance (BVI) Limited and listed on the Stock Exchange at a price of 100.200% of the principal amount with net proceeds (excluding accrued interest) of US$200.0 million (equivalent to approximately HK$1,560.0 million).
In addition, on 31 December 2019, HK$1,500.0 million 4.890% guaranteed notes due 2049 were issued by NWD (MTN) Limited to FTLife Insurance Company Limited (“FTLife Insurance”, a subsidiary of the Company). Such notes were listed on the Stock Exchange at a price of 100.000% of the principal amount with net proceeds of HK$1,500.0 million.
Save as disclosed above, the Group has not issued any debenture during the year.
EQUITY-LINKED AGREEMENTS
Save for the share option schemes of the Group as set out on pages 139 to 146, no equity-linked agreements were entered into by the Group, or existed during the year.

Annual Report 2020 127
Report of the Directors
DISTRIBUTABLE RESERVES
Distributable reserves of the Company as at 30 June 2020, calculated under Part 6 of the Hong Kong Companies Ordinance (Cap. 622), amounted to HK$23,440.0 million (2019: HK$23,004.5 million).
FIVE-YEAR FINANCIAL SUMMARY
A summary of the results and the assets and liabilities of the Group for the last five financial years is set out on pages 299 and 300.
EMPLOYEES AND REMUNERATION POLICIES
At 30 June 2020, around 44,000 staff was employed by entities under the Group’s management. Remuneration policies are reviewed annually. Remuneration and bonuses are awarded to employees based on individual performances and are in line with market practices. Education subsidies are granted to employees who are taking job-related courses. Periodic in-house training programs are also offered. Under the share options schemes of the Company and all the listed subsidiaries of the Group, options may be granted to certain Directors of the Company and certain employees of the Group to subscribe for shares in the Company and/or the respective subsidiaries.
PURCHASE, SALE OR REDEMPTION OF LISTED SECURITIES
During the year, the Company bought back a total of 72,089,000 shares (before Share Consolidation) of the Company on the Hong Kong Stock Exchange at an aggregate consideration of HK$612,671,700 (before expenses). All such bought back shares were subsequently cancelled during the year.
Details of the shares bought back during the year are as follows:
Month
Number of shares
bought back (before Share
Consolidation) Price paid per share
Aggregate consideration
(before expenses)
Highest Lowest HK$ HK$ HK$
December 2019 4,000,000 10.42 10.16 41,125,380March 2020 42,767,000 9.50 7.46 354,893,490April 2020 25,322,000 9.10 8.22 216,652,830
72,089,000 612,671,700
The above share buy-backs were made with a view to enhancing the earnings per share of the Company and thus benefit the shareholders as a whole.
New World China Land Limited (“NWCL”) redeemed the USD575,359,000 (equivalent to approximately HK$4,487,800,200) 5.375% notes due 2019 (stock code: 5824) at principal amount upon maturity on 6 November 2019.
Fita International Limited redeemed the USD750,000,000 (equivalent to approximately HK$5,850,000,000) 7.000% notes due 2020 (stock code: 4315) at principal amount upon maturity on 10 February 2020.
During the year, the Company has not redeemed any of its listed securities. Save as disclosed above, neither the Company nor any of its subsidiaries has purchased or sold any of the Company’s listed securities during the year.

New World Development Company Limited128
Report of the Directors
DONATIONS
The Group made charitable and other donations during the year of HK$86.7 million (2019: HK$93.8 million).
MAJOR ACQUISITIONS AND DISPOSALS
1. On 27 December 2018, Earning Star Limited, an indirect wholly owned subsidiary of NWS Holdings Limited (“NWSH”), entered into a share purchase agreement to acquire the entire issued share capital of FTLife Insurance at a total consideration of HK$21.812 billion (after adjustments). FTLife Insurance is a life insurance company operating in Hong Kong, providing a broad range of protection and savings-related life and medical insurance products. This acquisition was completed on 1 November 2019 and FTLife Insurance became an indirect wholly owned subsidiary of NWSH since then.
2. On 19 July 2019, NWS (Guangdong) Investment Company Limited (formerly known as Guangdong Xin Chuan Co., Ltd.), an indirect wholly owned subsidiary of NWSH, won a bid for acquiring the concession rights (and other related rights and assets) to operate Changliu Expressway in Hunan Province, the PRC at the bid purchase price of RMB4,571.0 million (equivalent to approximately HK$5,099.1 million). The bid purchase price had been fully paid. Up to the date of this report, NWSH is in the process of negotiating with the Department of Transportation of Hunan Province, the PRC for the concession right agreement.
3. On 26 July 2019, Esteemed Sino Limited (“Esteemed Sino”), an indirect wholly owned subsidiary of NWCL, entered into a sale and purchase agreement with Praiseworth International Limited and Property Giant Investments Limited (collectively the “Vendors”, which are wholly owned by Chow Tai Fook Enterprises Limited (“CTFE”)), and CTFE as guarantor of the Vendors, whereby the Vendors agreed to sell and assign, and Esteemed Sino agreed to acquire 51% interest of the entire issued share capital of Silvery Yield Development Limited (“Silvery Yield”) and accept the assignment of shareholders’ loans owing from Silvery Yield to the Vendors, for a total consideration of RMB4,010.0 million (equivalent to approximately HK$4,556.8 million) (the “Acquisition”). Silvery Yield and its subsidiaries are principally engaged in the business of property development of Ningbo New World Plaza in Ningbo City, Zhejiang Province, the PRC. The Acquisition was completed on 26 July 2019.
4. On 30 July 2019, Honour Team International Limited, an indirect wholly owned subsidiary of NWCL, acquired through listing-for-sale the state-owned construction land use right of a parcel of land located at Wangjiang New Town, Shangcheng District, Hangzhou, Zhejiang Province, the PRC, for the development of a residential and commercial complex at a consideration of approximately RMB9,791.9 million (equivalent to approximately HK$11,127.1 million).
5. In September 2019, Guangzhou Zengpei Properties Development Co., Ltd., an indirect wholly owned subsidiary of NWCL, won the bidding in respect of the state-owned construction land use right of a parcel of land located at Tagang Village, Yongning Street, Zengcheng District, Guangzhou, the PRC, through listing-for-sale at a consideration of RMB3,400.0 million (equivalent to approximately HK$3,863.6 million) for residential and carparking development.
6. On 5 September 2019, NWSH disposed of 120 million issued H shares of Beijing Capital International Airport Co., Ltd. (“BCIA”) at the price of HK$6.50 per H share of BCIA and thereafter, NWSH no longer holds any interest in BCIA.
CONNECTED TRANSACTIONS
Connected transactions of the Company during the year and up to the date of this report are set out on pages 134 to 137.
RULES 13.20 AND 13.22 OF THE LISTING RULES
The disclosure pursuant to Rules 13.20 and 13.22 of the Listing Rules is set out on page 149.

Annual Report 2020 129
Report of the Directors
DIRECTORS
The Directors of the Company during the year and up to the date of this report are:
Executive DirectorsDr. Cheng Kar-Shun, Henry GBM GBS (Chairman)Dr. Cheng Chi-Kong, Adrian JP (Executive Vice-chairman &
Chief Executive Officer)(re-designated from Executive Vice-chairman &
General Manager on 1 May 2020)Mr. Cheng Chi-HengMs. Cheng Chi-Man, SoniaMr. Au Tak-Cheong (resigned on 1 April 2020)Mr. Sitt Nam-HoiMr. So Chung-Keung, Alfred (resigned on 1 January 2020)Ms. Huang Shaomei, Echo (appointed on 1 May 2020)Ms. Chiu Wai-Han, Jenny (appointed on 1 May 2020)
Non-executive DirectorsMr. Doo Wai-Hoi, William JP (Non-executive Vice-chairman)Mr. Cheng Kar-Shing, PeterMs. Ki Man-Fung, Leonie GBS SBS JP
Independent Non-executive DirectorsMr. Yeung Ping-Leung, HowardMr. Cha Mou-Sing, Payson JPMr. Cha Mou-Zing, Victor (Alternate Director to Mr. Cha Mou-Sing, Payson)Mr. Ho Hau-Hay, HamiltonMr. Lee Luen-Wai, John BBS JPMr. Liang Cheung-Biu, ThomasMr. Ip Yuk-Keung, Albert
Mr. So Chung-Keung, Alfred and Mr. Au Tak-Cheong resigned as Directors on 1 January 2020 and 1 April 2020 respectively. Each of them had confirmed that he has no disagreement with the Board and there are no matters in respect of his resignation that needs to be brought to the attention of the shareholders of the Company.
In accordance with Article 94 of the Company’s Articles of Association, Ms. Huang Shaomei, Echo and Ms. Chiu Wai-Han, Jenny retire and, being eligible, offer themselves for re-election.
In accordance with Article 103(A) of the Company’s Articles of Association, Dr. Cheng Kar-Shun, Henry, Mr. Doo Wai-Hoi, William, Mr. Cheng Kar-Shing, Peter, Mr. Liang Cheung-Biu, Thomas and Ms. Cheng Chi-Man, Sonia shall retire by rotation and, being eligible, offer themselves for re-election.
No Director has a service contract which is not determinable by the Company within one year without payment of compensation other than statutory compensation.
A list of names of all the directors who have served on the boards of the Company’s subsidiaries during the year is available on the Company’s website at www.nwd.com.hk.
AUDIT COMMITTEE
An Audit Committee has been established and the members of the Committee as at the date of this report are Mr. Lee Luen-Wai, John, Mr. Yeung Ping-Leung, Howard, Mr. Cha Mou-Sing, Payson, Mr. Ho Hau-Hay, Hamilton, Mr. Liang Cheung-Biu, Thomas and Mr. Ip Yuk-Keung, Albert. The principal responsibilities of the Audit Committee include the review and supervision of the Group’s financial reporting process and risk management (including but not limited to business, operation as well as environmental, social and governance related risks) and internal control systems.

New World Development Company Limited130
Report of the Directors
DIRECTORS’ INTERESTS IN TRANSACTIONS, ARRANGEMENTS OR CONTRACTS
Save as disclosed in the section headed “Connected Transactions” on pages 134 to 137 of this annual report and contracts amongst group companies, no other transactions, arrangements or contracts of significance to which the Company or any of its subsidiaries was a party and in which a Director of the Company and the Director’s connected entity had a material interest, whether directly or indirectly, subsisted at the end of the year or at any time during the year.
DIRECTORS’ INTERESTS IN SHARES, UNDERLYING SHARES AND DEBENTURES
As at 30 June 2020, interests of the Directors in shares, underlying shares and debentures of the Company and its associated corporations which were recorded in the register to be kept by the Company under Section 352 of the Securities and Futures Ordinance (“SFO”) are set out on pages 138 to 148.
PERMITTED INDEMNITY PROVISION
The Company’s Articles of Association provides that every Director is entitled to be indemnified out of the assets of the Company against all losses or liabilities which he/she may sustain or incur in or about the execution of the duties of his/her office or otherwise in relation thereto.
The Company and its listed subsidiaries have taken out and maintained directors’ liability insurance throughout the year, which provides appropriate cover for the Directors and directors of the subsidiaries of the Group.
DIRECTORS’ INTERESTS IN COMPETING BUSINESSES
During the year, according to the Listing Rules, the following Directors have interests in the following businesses which are considered to compete or are likely to compete, either directly or indirectly, with the businesses of the Group other than those businesses where the Directors of the Company were appointed as directors to represent the interests of the Company and/or the Group:
Businesses which are considered to compete or likely to compete with the businesses of the Group Nature of interest of
the Director in the entity
Name of Director Name of entity Description of businesses Dr. Cheng Kar-Shun, Henry Chow Tai Fook Enterprises
Limited (“CTF”) group of companies
Property investment and development, hotel operations, commercial aircraft leasing and healthcare investment
Director
FSE Holdings Limited group of companies
Property and carpark management and landscaping
Shareholder
Supreme Harvest Development Limited group of companies
Property investment and development
Director
Shanghai New World Shangxian Lane Development Limited
Property investment and development
Director
Silver City International Limited group of companies
Property investment Director
Sunshine Dragon Group Limited group of companies
Property investment Director
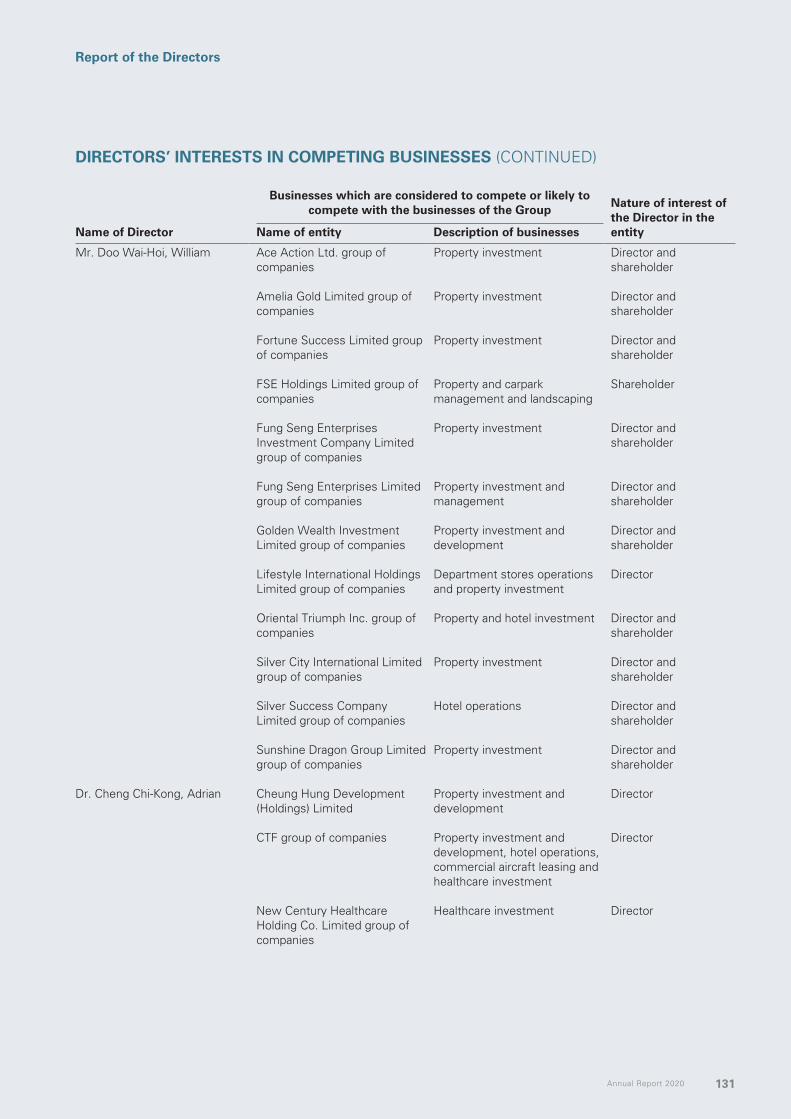
Annual Report 2020 131
Report of the Directors
Businesses which are considered to compete or likely to compete with the businesses of the Group Nature of interest of
the Director in the entity
Name of Director Name of entity Description of businesses Mr. Doo Wai-Hoi, William Ace Action Ltd. group of
companiesProperty investment Director and
shareholder
Amelia Gold Limited group of companies
Property investment Director and shareholder
Fortune Success Limited group of companies
Property investment Director and shareholder
FSE Holdings Limited group of companies
Property and carpark management and landscaping
Shareholder
Fung Seng Enterprises Investment Company Limited group of companies
Property investment Director and shareholder
Fung Seng Enterprises Limited group of companies
Property investment and management
Director and shareholder
Golden Wealth Investment Limited group of companies
Property investment and development
Director and shareholder
Lifestyle International Holdings Limited group of companies
Department stores operations and property investment
Director
Oriental Triumph Inc. group of companies
Property and hotel investment Director and shareholder
Silver City International Limited group of companies
Property investment Director and shareholder
Silver Success Company Limited group of companies
Hotel operations Director and shareholder
Sunshine Dragon Group Limited group of companies
Property investment Director and shareholder
Dr. Cheng Chi-Kong, Adrian Cheung Hung Development (Holdings) Limited
Property investment and development
Director
CTF group of companies Property investment and development, hotel operations, commercial aircraft leasing and healthcare investment
Director
New Century Healthcare Holding Co. Limited group of companies
Healthcare investment Director
DIRECTORS’ INTERESTS IN COMPETING BUSINESSES (CONTINUED)

New World Development Company Limited132
Report of the Directors
Businesses which are considered to compete or likely to compete with the businesses of the Group Nature of interest of
the Director in the entity
Name of Director Name of entity Description of businesses Mr. Cheng Kar-Shing, Peter CTF group of companies Property investment and
development, hotel operations, commercial aircraft leasing and healthcare investment
Director
Long Vocation Investments Limited group of companies
Property investment Director and shareholder
Mr. Cheng Chi-Heng CTF group of companies Property investment and development, hotel operations, commercial aircraft leasing and healthcare investment
Director
As the Board of Directors of the Company is independent of the boards of the above-mentioned entities and none of the above Directors can control the Board of the Company, the Group is therefore capable of carrying on its businesses independently of, and at arm’s length from the businesses of these entities.
MANAGEMENT CONTRACTS
No contracts concerning the management and administration of the whole or any substantial part of the business of the Company were entered into or existed during the year.
DIRECTORS’ RIGHTS TO ACQUIRE SHARES OR DEBENTURES
Save as disclosed under the section headed “Share Option Schemes” below, at no time during the year was the Company or any of its subsidiaries a party to any arrangements to enable the Directors of the Company or chief executives or any of their spouse or children under the age of 18 to acquire benefits by means of the acquisition of shares in, or debentures of, the Company or any other body corporate.
SHARE OPTION SCHEMES
Share option schemes of the Group are set out on pages 139 to 146.
DIRECTORS’ INTERESTS IN COMPETING BUSINESSES (CONTINUED)

Annual Report 2020 133
Report of the Directors
SUBSTANTIAL SHAREHOLDERS’ INTERESTS IN SECURITIES
As at 30 June 2020, the interests or short positions of substantial shareholders (as defined in the Listing Rules) in the shares and underlying shares of the Company as recorded in the register required to be kept under Section 336 of the SFO were as follows:
Long positions in shares
Number of shares heldApproximate
% of shareholding
NameBeneficial interests
Corporate interests Total
Cheng Yu Tung Family (Holdings) Limited (“CYTFH”)(1) – 1,133,908,609 1,133,908,609 44.48
Cheng Yu Tung Family (Holdings II) Limited (“CYTFH-II”)(2) – 1,133,908,609 1,133,908,609 44.48
Chow Tai Fook Capital Limited (“CTFC”)(3) – 1,133,908,609 1,133,908,609 44.48Chow Tai Fook (Holding) Limited (“CTFHL”)(4) – 1,133,908,609 1,133,908,609 44.48Chow Tai Fook Enterprises Limited (“CTF”)(5) 1,030,872,823 103,035,786 1,133,908,609 44.48
Notes:
(1) CYTFH holds 48.98% direct interest in CTFC and is accordingly deemed to have an interest in the shares deemed to be interested by CTFC.
(2) CYTFH-II holds 46.65% direct interest in CTFC and is accordingly deemed to have an interest in the shares deemed to be interested by CTFC.
(3) CTFC holds 81.03% direct interest in CTFHL and is accordingly deemed to have an interest in the shares deemed to be interested by CTFHL.
(4) CTFHL holds 100% direct interest in CTF and is accordingly deemed to have an interest in the shares interested by or deemed to be interested by CTF.
(5) CTF together with its subsidiaries.
Save as disclosed above, there is no other interest recorded in the register that is required to be kept under Section 336 of the SFO as at 30 June 2020.
SUFFICIENCY OF PUBLIC FLOAT
According to information that is available to the Company, the percentage of the Company’s shares which are in the hands of the public exceeds 25.0% of the Company’s total number of issued shares.
MAJOR CUSTOMERS AND SUPPLIERS
During the year, less than 30.0% of the Group’s turnover and less than 30.0% of the Group’s purchases were attributable to the Group’s five largest customers and five largest suppliers respectively.
AUDITOR
The financial statements have been audited by Messrs. PricewaterhouseCoopers, who retire and, being eligible, offer themselves for re-appointment.
On Behalf of the Board
Dr. Cheng Kar-Shun, HenryChairmanHong Kong, 30 September 2020

New World Development Company Limited134
Report of the Directors
CONNECTED TRANSACTIONS
(1) The Company and Chow Tai Fook Enterprises Limited (“CTF”), severally in the proportions of 64.0% and 36.0%, have on 29 August 1995 issued an indemnity (the “Indemnity”) to Renaissance Hotel Group N.V. (“RHG”), a former subsidiary of New World Hotels (Holdings) Limited (“NWHH”), which is now an independent third party, in respect of any obligations of RHG or its subsidiaries may have in respect of certain lease payment obligations under originally 25 leases or guarantees of leases (now one lease remaining) held by Hotel Property Investments (B.V.I.) Ltd. (“HPI”) and its subsidiaries.
On 25 July 1997, NWHH sold its entire interests in HPI to CTF Holdings Ltd.(“CTFH”), a company then controlled by Dr. Cheng Kar-Shun, Henry and Mr. Doo Wai-Hoi, William (“Mr. Doo”), and currently wholly owned by CTF. Under the sale, the Indemnity will continue. Arrangements have therefore been entered into whereby CTF will counter-indemnify the Company fully against any liability arising under the Indemnity in respect of the said lease obligations and guarantees of leases. The final lease expired at the end of August 2019 and all obligations have been satisfied and the guarantee has been returned. Up to the date of this report, no payment has ever been made by the Company or CTF under the Indemnity.
(2) On 22 March 2012, New World Department Store China Limited (“NWDS”) and Chow Tai Fook Jewellery Group Limited (“CTFJ”) entered into a master concessionaire counter agreement (the “Master Concessionaire Counter Agreement”) commencing from 24 April 2012 up to and including 30 June 2014, pursuant to which members of the NWDS Group (i.e. NWDS and its subsidiaries) and the CTFJ Group (i.e. CTFJ and its subsidiaries) may from time to time enter into definitive concessionaire agreements in relation to any transactions arising from the concessionaire arrangements or rental agreements in respect of retailing counters for the sale of jewellery products and watches by the CTFJ Group at properties in the PRC owned by, or leased to the NWDS Group or at which the NWDS Group operates its business.
The Master Concessionaire Counter Agreement will be automatically renewed for a successive period of three years after the initial term or subsequent renewal term subject to compliance with relevant requirements of the Listing Rules. Upon expiry of its initial term, the Master Concessionaire Counter Agreement was automatically renewed twice for two successive periods of three years commencing from 1 July 2014. Details of the second renewal of the Master Concessionaire Counter Agreement and the annual caps set for each of the three financial years ending 30 June 2020 were set out in the announcement of the Company dated 10 April 2017.
For the year ended 30 June 2020, the aggregate amount of the transactions under the Master Concessionaire Counter Agreement amounted to approximately RMB42.0 million (equivalent to approximately HK$46.7 million), which is within the annual cap of RMB159.902 million (equivalent to approximately HK$177.669 million).
In anticipation of the expiry of the second renewal term on 30 June 2020, NWDS and CTFJ agreed to further renew the Master Concessionaire Counter Agreement for further three years commencing from 1 July 2020 up to and including 30 June 2023. Details of the third renewal of the Master Concessionaire Counter Agreement and the annual caps set for each of the three financial years ending 30 June 2023 were set out in the announcement of the Company dated 4 May 2020.
As CTFJ is a fellow subsidiary of CTF which is a substantial shareholder of the Company, CTFJ is therefore a connected person of the Company under the Listing Rules. Accordingly, the renewal of the Master Concessionaire Counter Agreement and all the transactions contemplated thereunder constitute continuing connected transactions for the Company under the Listing Rules.

Annual Report 2020 135
Report of the Directors
CONNECTED TRANSACTIONS (CONTINUED)
(3) On 10 April 2017, the Company and Mr. Doo entered into a master services agreement (the “Mr. Doo MSA”) for a term of three years commencing from 1 July 2017 up to and including 30 June 2020 in respect of the provision of certain operational and rental services which include contracting services, cleaning and landscaping services, facilities management services, property management services, security and guarding services and rental services between members of the Group and members of the Services Group (being Mr. Doo and any company in the equity capital of which Mr. Doo is or will be directly or indirectly interested so as to exercise or control the exercise of 30.0% (or such other amount as may from time to time be specified in the Code on Takeovers and Mergers (the “Takeovers Code”) as being the level for triggering a mandatory general offer) or more of the voting power at general meetings, or to control the composition of a majority of the board of directors and any other company which is its subsidiary). Subject to compliance with the relevant requirements under the Listing Rules, upon expiration of the initial term or subsequent renewal term, the Mr. Doo MSA will be automatically renewed for a successive period of three years thereafter (or such other period permitted under the Listing Rules). The Mr. Doo MSA and the annual caps set for each of the three financial years ending 30 June 2020 were disclosed in the announcement of the Company dated 10 April 2017 and were approved by the independent shareholders of the Company on 26 May 2017.
For the year ended 30 June 2020, the aggregate amount of the transactions under the Mr. Doo MSA amounted to approximately HK$1,567.8 million, which is within the annual cap of HK$5,837.1 million.
On 24 April 2020, the Company and Mr. Doo entered into a new master services agreement (the “New Mr. Doo MSA”) for a term of three years commencing from 1 July 2020 up to and including 30 June 2023 in respect of the provision of the aforesaid operational and rental services, as well as insurance, medical and health care services and procurement services, and agreed to terminate the Mr. Doo MSA on the commencement date of the New Mr. Doo MSA. Subject to compliance with the relevant requirements under the Listing Rules, upon expiration of the initial term or subsequent renewal term, the New Mr. Doo MSA will be automatically renewed for a successive period of three years thereafter (or such other period permitted under the Listing Rules). The New Mr. Doo MSA and the annual caps set for each of the three financial years ending 30 June 2023 were disclosed in the announcement of the Company dated 24 April 2020 and were approved by the independent shareholders of the Company on 19 June 2020.
Mr. Doo is the Non-executive Vice-chairman of the Company and a director of certain subsidiaries of the Company, and hence a connected person of the Company under the Listing Rules. Accordingly, the entering into of the Mr. Doo MSA and the New Mr. Doo MSA and all the transactions contemplated thereunder constitute continuing connected transactions for the Company under the Listing Rules.
(4) On 10 April 2017, the Company and CTF entered into a master services agreement (the “CTF MSA”) for a term of three years commencing from 1 July 2017 up to and including 30 June 2020 in respect of the provision of services including administrative services, contracting services, general and rental services, and project management and consultancy services between members of the Group and members of the CTF Services Group (being CTF, (a) any other company which is its subsidiary or holding company or is a fellow subsidiary of any such holding company, and/or (b) any other company in the equity capital of which CTF and such other companies referred to in (a) above taken together are directly or indirectly interested so as to exercise or control the exercise of 30.0% (or such other amount as may from time to time be specified in the Takeovers Code as being the level for triggering a mandatory general offer) or more of the voting power at general meetings or to control the composition of a majority of the board of directors, and any other company which is its subsidiary, but excluding members of the Group).
Subject to compliance with the relevant requirements under the Listing Rules, upon expiration of the initial term or subsequent renewal term, the CTF MSA will be automatically renewed for a successive period of three years thereafter (or such other period permitted under the Listing Rules). Details of the CTF MSA and the annual caps set for each of the three financial years ending 30 June 2020 were set out in the announcement of the Company dated 10 April 2017.
For the year ended 30 June 2020, the aggregate amount of the transactions under the CTF MSA amounted to approximately HK$536.7 million, which is within the annual cap of HK$1,920.4 million.
On 24 April 2020, the Company and CTF entered into a new master services agreement (the “New CTF MSA”) for a term of three years commencing from 1 July 2020 up to and including 30 June 2023 in respect of the provision of services including the aforesaid services, as well as insurance, medical and health care services, and agreed to terminate the CTF MSA on the commencement date of the New CTF MSA. Subject to compliance with the relevant requirements under the Listing Rules, upon expiration of the initial term or subsequent renewal term, the New CTF MSA will be automatically renewed for a successive period of three years thereafter (or such other period permitted under the Listing Rules). Details of the New CTF MSA and the annual caps set for each of the three financial years ending 30 June 2023 were set out in the announcement of the Company dated 24 April 2020.
As CTF is a connected person of the Company, the entering into of the CTF MSA and the New CTF MSA and all the transactions contemplated thereunder constitute continuing connected transactions for the Company under the Listing Rules.

New World Development Company Limited136
Report of the Directors
CONNECTED TRANSACTIONS (CONTINUED)
(5) On 11 April 2014, the Company and CTFJ entered into a master leasing agreement (the “Master Leasing Agreement”) regarding the leasing of premises between members of the Group and members of the CTFJ Group for an initial term of three years commencing from 1 July 2014. Subject to compliance with the relevant requirements under the Listing Rules, upon expiration of the initial term or subsequent renewal term, the Master Leasing Agreement will be automatically renewed for a successive period of three years thereafter.
Upon expiry of its initial term, the Master Leasing Agreement was automatically renewed in accordance with its terms and conditions for three years commencing from 1 July 2017 up to and including 30 June 2020. Details of the renewal of the Master Leasing Agreement and the annual caps set for each of the three financial years ending 30 June 2020 were set out in the announcement of the Company dated 13 April 2017.
For the year ended 30 June 2020, the aggregate amount of the transactions under the Master Leasing Agreement amounted to approximately HK$97.3 million, which is within the annual cap of HK$261.2 million.
On 28 April 2020, the Company and CTFJ entered into the master leasing and licensing agreement (the “Master Leasing and Licensing Agreement”) for a term of three years commencing from 1 July 2020 up to and including 30 June 2023 in relation to transactions arising from the leases or tenancy agreements, licensing agreements, concession agreements, other similar collaboration agreements or any other agreements in relation to any real properties (including without limitation retail shops, shops-in-shops and counters) between members of the Group and members of the CTFJ Group, and agreed to terminate the Master Leasing Agreement on the date of commencement of the Master Leasing and Licensing Agreement. Subject to compliance with the relevant requirements under the Listing Rules, upon expiration of the initial term or subsequent renewal term, the Master Leasing and Licensing Agreement will be automatically renewed for a successive period of three years thereafter (or such other period permitted under the Listing Rules). Details of the Master Leasing and Licensing Agreement and the annual caps set for each of the three financial years ending 30 June 2023 were set out in the announcement of the Company dated 28 April 2020.
As CTFJ is a fellow subsidiary of CTF which is a substantial shareholder of the Company, CTFJ is therefore a connected person of the Company under the Listing Rules. Accordingly, the entering into of the Master Leasing Agreement and the Master Leasing and Licensing Agreement, and all the transactions contemplated thereunder constitute continuing connected transactions for the Company under the Listing Rules.
(6) On 10 April 2017, the Company and CTF entered into a master hotel management services agreement (the “Master Hotel Management Services Agreement”) regarding the provision of hotel management and consultancy services by members of the CTF Group (i.e. CTF and its subsidiaries) to members of the Group. The Master Hotel Management Services Agreement is for a term of 10 years commencing from 1 July 2017 up to and including 30 June 2027 and will be automatically renewed for a further term of 10 years upon expiration of the initial term subject to compliance with the relevant requirements under the Listing Rules. Details of the Master Hotel Management Services Agreement and the annual caps set for each of the three financial years ending 30 June 2020 were set out in the announcement of the Company dated 10 April 2017.
For the year ended 30 June 2020, the aggregate amount of the transactions under the Master Hotel Management Services Agreement amounted to approximately HK$95.0 million, which is within the annual cap of HK$249.3 million.
In anticipation of the expiry of the existing annual caps for the transactions under the Master Hotel Management Services Agreement on 30 June 2020, the Board has determined new annual caps for the three financial years ending 30 June 2023 as set out in the announcement of the Company dated 8 May 2020.
As CTF is a connected person of the Company, the entering into of the Master Hotel Management Services Agreement and all the transactions contemplated thereunder constitute continuing connected transactions for the Company under the Listing Rules.

Annual Report 2020 137
Report of the Directors
CONNECTED TRANSACTIONS (CONTINUED)
(7) On 10 April 2017, the Company and CTF entered into a master hotel leasing agreement (the “Master Hotel Leasing Agreement”) regarding the leasing of hotels and licensing of related licences to members of the CTF Group from members of the Group for a term of 10 years commencing from 1 July 2017 up to and including 30 June 2027. The Master Hotel Leasing Agreement will be automatically renewed for a further term of 10 years upon expiration of the initial term subject to compliance with the relevant requirements under the Listing Rules.
As the annual cap amount for the transactions under the Master Hotel Leasing Agreement for each of the three financial years ending 30 June 2020 is de minimis, the entering into of the Master Hotel Leasing Agreement is fully exempt from the reporting, announcement and independent shareholders’ approval requirements under the Listing Rules.
In anticipation of the expiry of the existing annual caps for the transactions under the Master Hotel Leasing Agreement on 30 June 2020, the Board has determined new annual caps for the three financial years ending 30 June 2023. Details of the Master Hotel Leasing Agreement and the said new annual caps were set out in the announcement of the Company dated 8 May 2020.
As CTF is a connected person of the Company, the entering into of the Master Hotel Leasing Agreement and all the transactions contemplated thereunder constitute continuing connected transactions for the Company under the Listing Rules.
(8) On 26 July 2019, Esteemed Sino Limtied (“Esteemed Sino”, an indirect wholly owned subsidiary of the Company), Praiseworth International Limited (“First Vendor”), Property Giant Investments Limited (“Second Vendor”) and CTF as guarantor entered into a sale and purchase agreement (the “SP Agreement”) pursuant to which Esteemed Sino agreed to acquire 51.0% interest of the entire issued share capital of Silvery Yield Development Limited (“Silvery Yield”) and the related shareholders’ loans from the First Vendor and the Second Vendor (collectively the “Vendors”, which are wholly owned by CTF beneficially) at the total consideration (“Consideration”) of RMB4,010.0 million (equivalent to approximately HK$4,556.8 million) (the “Acquisition”). Silvery Yield and its subsidiaries are principally engaged in the business of property development of Ningbo New World Plaza in Ningbo City, Zhejiang Province, the PRC.
Completion of the Acquisition (“Completion”) took place immediately after the signing of the SP Agreement and Silvery Yield became an indirect wholly owned subsidiary of the Company.
In accordance with the SP Agreement, 20.0% of the Consideration was paid by Silvery Yield to the Vendors upon Completion, and 80.0% of the Consideration was paid in November 2019.
As CTF is a connected person of the Company, each of the Vendors is a connected person of the Company by virtue of being wholly owned by CTF beneficially and the Acquisition constitutes a connected transaction for the Company under the Listing Rules. Details of the Acquisition were set out in the announcement of the Company dated 26 July 2019.
The price and terms of the continuing connected transactions mentioned in paragraphs (2) to (6) above were determined in accordance with the pricing policies and guidelines as set out in the relevant announcements of the Company. These continuing connected transactions have been reviewed by the Independent Non-executive Directors of the Company who have confirmed that the transactions have been entered into:
(a) in the ordinary and usual course of business of the Group;
(b) on normal commercial terms or better; and
(c) in accordance with the relevant agreements governing them on terms that are fair and reasonable and in the interests of the shareholders of the Company as a whole.
The Company’s auditor was engaged to report on the Group’s continuing connected transactions stated in paragraphs (2) to (6) above in accordance with Hong Kong Standard on Assurance Engagements 3000 (Revised) “Assurance Engagements Other Than Audits or Reviews of Historical Financial Information” and with reference to Practice Note 740 “Auditor’s Letter on Continuing Connected Transactions under the Hong Kong Listing Rules” issued by the Hong Kong Institute of Certified Public Accountants. The auditor has issued his unqualified letter containing his findings and conclusions in respect of the continuing connected transactions disclosed by the Group in accordance with paragraph 14A.56 of the Listing Rules. A copy of the auditor’s letter has been provided by the Company to the HKEx.
Save as disclosed above, a summary of significant related party transactions that did not constitute connected transactions made during the year was disclosed in note 52 to the financial statements.

New World Development Company Limited138
Report of the Directors
DIRECTORS’ INTERESTS IN SHARES, UNDERLYING SHARES AND DEBENTURES
As at 30 June 2020, the interests of the Directors in shares, underlying shares and debentures of the Company or any of its associated corporations which were recorded in the register required to be kept by the Company under Section 352 of the SFO were as follows:
(A) Long position in shares
Number of sharesApproximate
% of shareholding
Personal interests
Spouse interests
Corporate interests Total
New World Development Company Limited(Ordinary shares)Dr. Cheng Kar-Shun, Henry 2,668,909 – – 2,668,909 0.10Mr. Doo Wai-Hoi, William – 1,300,000 7,279,271(1) 8,579,271 0.34Dr. Cheng Chi-Kong, Adrian 2,059,118 – – 2,059,118 0.08Mr. Yeung Ping-Leung,
Howard 133,444 – – 133,444 0.01Mr. Cheng Kar-Shing, Peter 133,444 141,641 – 275,085 0.01Mr. Ho Hau-Hay, Hamilton – – 219,588(2) 219,588 0.01Mr. Liang Cheung-Biu,
Thomas 2,607 – – 2,607 0.00Ms. Ki Man-Fung, Leonie 22,500 – – 22,500 0.00Mr. Cheng Chi-Heng 133,444 – – 133,444 0.01Ms. Cheng Chi-Man, Sonia 800,672 – – 800,672 0.03Ms. Chiu Wai-Han, Jenny 29,899 – – 29,899 0.00
New World Department Store China Limited(Ordinary shares of HK$0.10
each)Ms. Ki Man-Fung, Leonie 20,000 – – 20,000 0.00Ms. Cheng Chi-Man, Sonia 92,000 – – 92,000 0.01
NWS Holdings Limited(Ordinary shares of HK$1.00
each)Dr. Cheng Kar-Shun, Henry 18,349,571 – 12,000,000(3) 30,349,571 0.78Mr. Cheng Kar-Shing, Peter 320,097 – 6,463,227(4) 6,783,324 0.17Ms. Ki Man-Fung, Leonie 15,000 – – 15,000 0.00
Sun Legend Investments Limited(Ordinary shares)Mr. Cheng Kar-Shing, Peter – – 7,500,500(5) 7,500,500 50.00
Notes:
(1) These shares are beneficially owned by companies which are wholly owned by Mr. Doo Wai-Hoi, William.
(2) These shares are beneficially owned by a company in which Mr. Ho Hau-Hay, Hamilton owns 40.0% of its issued share capital.
(3) These shares are beneficially owned by a company which is wholly owned by Dr. Cheng Kar-Shun, Henry.
(4) These shares are beneficially owned by a company which is wholly owned by Mr. Cheng Kar-Shing, Peter.
(5) These shares are beneficially owned by a controlled corporation of Mr. Cheng Kar-Shing, Peter.

Annual Report 2020 139
Report of the Directors
DIRECTORS’ INTERESTS IN SHARES, UNDERLYING SHARES AND DEBENTURES (CONTINUED)
(B) Long position in underlying shares – share optionsDuring the year ended 30 June 2020, certain Directors of the Company have interest in share options to subscribe for shares in the Company and certain of its subsidiaries. Details of such interests and summaries of share option schemes of the Company and its subsidiaries are shown below.
Share Option Schemes of the CompanyOn 24 November 2006, the Company adopted a share option scheme (the “2006 Scheme”) and certain rules of such scheme were amended on 13 March 2012. Under the 2006 Scheme, the Directors of the Company may at their discretion grant options to any eligible participant (as explained hereinafter) to subscribe for shares in the Company. In anticipation of the expiry of the 2006 Scheme on 24 November 2016, the Company adopted a new share option scheme (the “2016 Scheme”) at the annual general meeting of the Company held on 22 November 2016. Share options granted under the 2006 Scheme prior to its expiry on 24 November 2016 shall continue to be valid and exercisable in accordance with the terms of the 2006 Scheme.
Summary of the 2006 Scheme and the 2016 Scheme disclosed in accordance with the Listing Rules is as follows:
2006 Scheme and 2016 Scheme
Purpose of the schemes To reward directors and employees of the Group for past service or performance, to provide incentive, motivation or reward to eligible participants for increasing performance or making contribution to the Group, to attract and retain persons of right caliber with the necessary experience to work for or make contribution to the Group, to foster a sense of corporate identity and to allow the eligible participants to enjoy the results of the Company attained through their relationship, efforts and/or contribution.
Participants of the schemes Eligible participant may be a person or an entity belonging to any of the following classes:
(i) any eligible employee (including directors) of the Group or any invested entity of the Group (the “Invested Entity”);
(ii) any person seconded or nominated by the Group to represent the Group’s interest in any of the Invested Entity or any other company or organisation;
(iii) any supplier of goods or services to any member of the Group or any Invested Entity;
(iv) any customer of any member of the Group or any Invested Entity;
(v) any person or entity that provides research, development or other technological support to the Group or any Invested Entity;
(vi) any adviser (professional or otherwise) or consultant to any area of business or business development of any member of the Group or any Invested Entity; and
(vii) any joint venture partner or business alliance that co-operates with any member of the Group or any Invested Entity in any area of business operation or development.

New World Development Company Limited140
Report of the Directors
2006 Scheme and 2016 Scheme
Total number of shares available for issue under the schemes and percentage of issued shares as at the date of this annual report
The Company had granted share options to subscribe for 425,987,928 shares (before Share Consolidation)/106,496,982 shares (after Share Consolidation) of the Company under the 2006 Scheme up to the date of this report. No further share option was granted under the 2006 Scheme since the adoption of the 2016 Scheme on 22 November 2016. Share options were granted to subscribe for 139,250,000 shares (before Share Consolidation)/34,812,500 shares (after Share Consolidation) of the Company under the 2016 Scheme up to the date of this report.
The total number of shares (after Share Consolidation) available for issue under the 2016 Scheme is 205,358,161 representing approximately 8.06% of the Company’s total number of issued shares as at the date of this report.
Max imum en t i t l emen t o f each participant under the schemes
Unless approved by shareholders of the Company, the total number of shares issued and to be issued upon exercise of the share options granted to each eligible participant (including both exercised and outstanding options) in any 12-month period must not exceed 1.0% of the total number of shares of the Company in issue.
The period within which the shares must be taken up under an option
A period to be specified by the Directors and not to exceed 10 years from the date of grant of options.
The minimum period for which an option must be held before it can be exercised
Any period as determined by the Directors.
The amount payable on application or acceptance of the option and the period within which payments or calls must or may be made or loans for such purposes must be paid
HK$10.0 is to be paid as consideration for the grant of option within 14 days from the date of offer.
The basis of determining the exercise price
The exercise price is determined by the Directors which must be at least the higher of (i) the closing price of the shares on the HKEx as stated in the HKEx’s daily quotations sheets on the date of grant, which must be a dealing day; and (ii) the average closing price of the shares as stated in the HKEx’s daily quotation sheets for the five dealing days immediately preceding the date of grant.
The remaining life of the schemes The schemes shall be valid and effective for a period of 10 years from the date of adoption. The 2006 Scheme which was adopted on 24 November 2006 expired on 24 November 2016. The 2016 Scheme which was adopted on 22 November 2016 will expire on 22 November 2026.
DIRECTORS’ INTERESTS IN SHARES, UNDERLYING SHARES AND DEBENTURES (CONTINUED)
(B) Long position in underlying shares – share options (continued)Share Option Schemes of the Company (continued)

Annual Report 2020 141
Report of the Directors
DIRECTORS’ INTERESTS IN SHARES, UNDERLYING SHARES AND DEBENTURES (CONTINUED)
(B) Long position in underlying shares – share options (continued)Share Option Schemes of the Company (continued)Share options granted to Directors
Number of share options
Name Date of grantExercisable
period
Balance as at 1 July
2019
Transferred from other
category(9)
Transferred to other
category(10)
Exercised during
the year
Lapsed during
the year
Adjusted during
the year(25)
Balance as at 30 June
2020
Exercise price per
share(25) (Note) HK$
Dr. Cheng Kar-Shun, Henry 10 June 2016 (1) 10,675,637 – – (10,675,637)(11) – – – 7.5403 July 2017 (2) 2,000,000 – – – – (1,500,000) 500,000 40.144
Mr. Doo Wai-Hoi, William 3 July 2017 (2) 100,000 – – – – (75,000) 25,000 40.144Dr. Cheng Chi-Kong, Adrian 9 March 2016 (3) 3,800,000 – – (3,800,000)(12) – – – 7.200
10 June 2016 (1) 3,736,471 – – (3,736,471)(13) – – – 7.5403 July 2017 (2) 2,000,000 – – – – (1,500,000) 500,000 40.144
Mr. Yeung Ping-Leung, Howard
10 June 2016 (1) 533,779 – – (533,779)(14) – – – 7.5403 July 2017 (2) 100,000 – – – – (75,000) 25,000 40.144
Mr. Cha Mou-Sing, Payson 10 June 2016 (1) 533,779 – – (533,000)(15) (779) – – 7.5403 July 2017 (2) 100,000 – – – – (75,000) 25,000 40.144
Mr. Cheng Kar-Shing, Peter 10 June 2016 (1) 533,779 – – (533,779)(16) – – – 7.5403 July 2017 (2) 100,000 – – – – (75,000) 25,000 40.144
Mr. Ho Hau-Hay, Hamilton 10 June 2016 (4) 333,779 – – (333,779)(17) – – – 7.5403 July 2017 (2) 100,000 – – – – (75,000) 25,000 40.144
Mr. Lee Luen-Wai, John 10 June 2016 (1) 533,779 – – (533,779)(18) – – – 7.5403 July 2017 (2) 100,000 – – – – (75,000) 25,000 40.144
Mr. Liang Cheung-Biu, Thomas
10 June 2016 (1) 533,779 – – (533,779)(19) – – – 7.5403 July 2017 (2) 100,000 – – – – (75,000) 25,000 40.144
Ms. Ki Man-Fung, Leonie 10 June 2016 (5) 1,202,016 – – (1,202,016)(20) – – – 7.5403 July 2017 (2) 100,000 – – – – (75,000) 25,000 40.144
Mr. Cheng Chi-Heng 10 June 2016 (1) 533,779 – – (533,779)(17) – – – 7.5403 July 2017 (2) 100,000 – – – – (75,000) 25,000 40.144
Ms. Cheng Chi-Man, Sonia 10 June 2016 (1) 3,202,688 – – (3,202,688)(21) – – – 7.5403 July 2017 (2) 100,000 – – – – (75,000) 25,000 40.144
Mr. Sitt Nam-Hoi 10 June 2016 (5) 574,827 – – (574,000)(22) (827) – – 7.5403 July 2017 (2) 300,000 – – – – (225,000) 75,000 40.1446 July 2018 (6) 600,000 – – – – (450,000) 150,000 44.160
Mr. Ip Yuk-Keung, Albert 6 July 2018 (6) 600,000 – – – – (450,000) 150,000 44.160Ms. Huang Shaomei, Echo(9) 3 July 2017 (7) – 1,150,000 – – – (862,500) 287,500 40.144
6 July 2018 (8) – 150,000 – – – (112,500) 37,500 44.160Ms. Chiu Wai-Han, Jenny(9) 10 June 2016 (5) – 119,597 – (119,597)(23) – – – 7.540
6 July 2018 (6) – 300,000 – – – (225,000) 75,000 44.160Mr. Au Tak-Cheong(10) 10 June 2016 (5) 336,693 – (136,693) (200,000)(24) – – – 7.540(10)
3 July 2017 (7) 200,000 – (100,000) (100,000)(24) – – – 10.036(10)
Mr. So Chung-Keung, Alfred(10)
3 July 2017 (2) 2,300,000 – (2,300,000) – – – – 10.036(10)
6 July 2018 (6) 600,000 – (600,000) – – – – 11.040(10)
36,664,785 1,719,597 (3,136,693) (27,146,083) (1,606) (6,075,000) 2,025,000
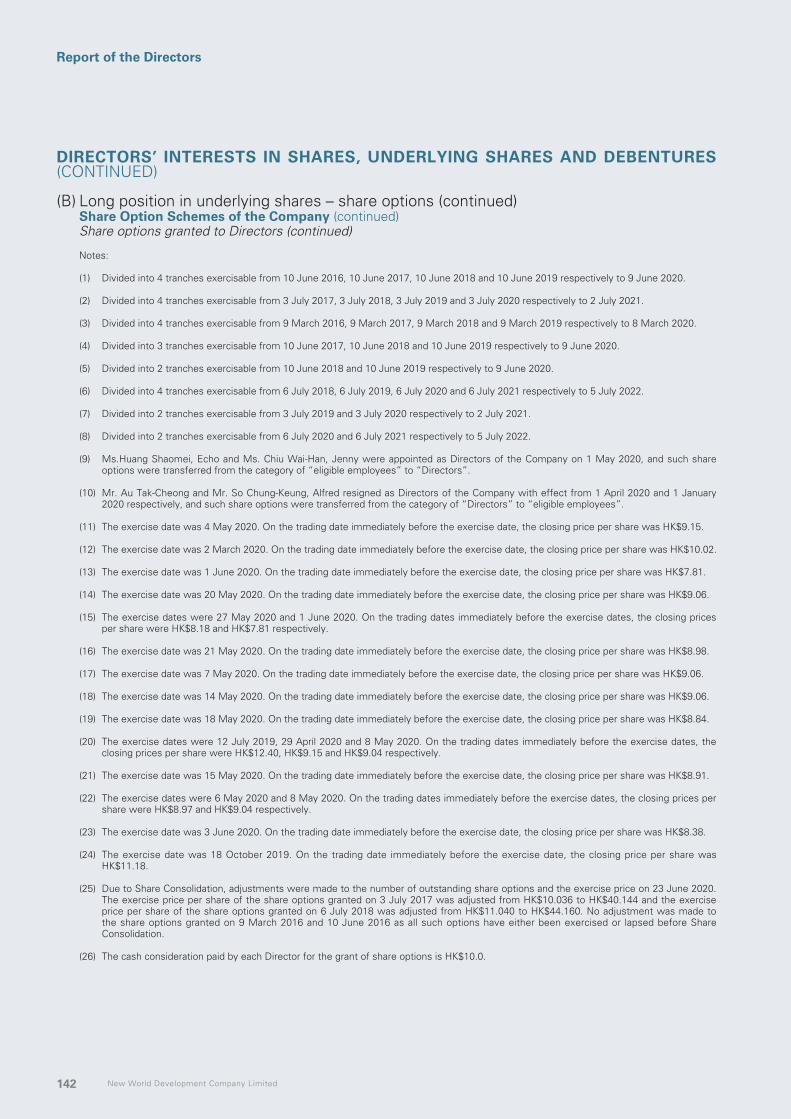
New World Development Company Limited142
Report of the Directors
DIRECTORS’ INTERESTS IN SHARES, UNDERLYING SHARES AND DEBENTURES (CONTINUED)
(B) Long position in underlying shares – share options (continued)Share Option Schemes of the Company (continued)Share options granted to Directors (continued)
Notes:
(1) Divided into 4 tranches exercisable from 10 June 2016, 10 June 2017, 10 June 2018 and 10 June 2019 respectively to 9 June 2020.
(2) Divided into 4 tranches exercisable from 3 July 2017, 3 July 2018, 3 July 2019 and 3 July 2020 respectively to 2 July 2021.
(3) Divided into 4 tranches exercisable from 9 March 2016, 9 March 2017, 9 March 2018 and 9 March 2019 respectively to 8 March 2020.
(4) Divided into 3 tranches exercisable from 10 June 2017, 10 June 2018 and 10 June 2019 respectively to 9 June 2020.
(5) Divided into 2 tranches exercisable from 10 June 2018 and 10 June 2019 respectively to 9 June 2020.
(6) Divided into 4 tranches exercisable from 6 July 2018, 6 July 2019, 6 July 2020 and 6 July 2021 respectively to 5 July 2022.
(7) Divided into 2 tranches exercisable from 3 July 2019 and 3 July 2020 respectively to 2 July 2021.
(8) Divided into 2 tranches exercisable from 6 July 2020 and 6 July 2021 respectively to 5 July 2022.
(9) Ms.Huang Shaomei, Echo and Ms. Chiu Wai-Han, Jenny were appointed as Directors of the Company on 1 May 2020, and such share options were transferred from the category of “eligible employees” to “Directors”.
(10) Mr. Au Tak-Cheong and Mr. So Chung-Keung, Alfred resigned as Directors of the Company with effect from 1 April 2020 and 1 January 2020 respectively, and such share options were transferred from the category of “Directors” to “eligible employees”.
(11) The exercise date was 4 May 2020. On the trading date immediately before the exercise date, the closing price per share was HK$9.15.
(12) The exercise date was 2 March 2020. On the trading date immediately before the exercise date, the closing price per share was HK$10.02.
(13) The exercise date was 1 June 2020. On the trading date immediately before the exercise date, the closing price per share was HK$7.81.
(14) The exercise date was 20 May 2020. On the trading date immediately before the exercise date, the closing price per share was HK$9.06.
(15) The exercise dates were 27 May 2020 and 1 June 2020. On the trading dates immediately before the exercise dates, the closing prices per share were HK$8.18 and HK$7.81 respectively.
(16) The exercise date was 21 May 2020. On the trading date immediately before the exercise date, the closing price per share was HK$8.98.
(17) The exercise date was 7 May 2020. On the trading date immediately before the exercise date, the closing price per share was HK$9.06.
(18) The exercise date was 14 May 2020. On the trading date immediately before the exercise date, the closing price per share was HK$9.06.
(19) The exercise date was 18 May 2020. On the trading date immediately before the exercise date, the closing price per share was HK$8.84.
(20) The exercise dates were 12 July 2019, 29 April 2020 and 8 May 2020. On the trading dates immediately before the exercise dates, the closing prices per share were HK$12.40, HK$9.15 and HK$9.04 respectively.
(21) The exercise date was 15 May 2020. On the trading date immediately before the exercise date, the closing price per share was HK$8.91.
(22) The exercise dates were 6 May 2020 and 8 May 2020. On the trading dates immediately before the exercise dates, the closing prices per share were HK$8.97 and HK$9.04 respectively.
(23) The exercise date was 3 June 2020. On the trading date immediately before the exercise date, the closing price per share was HK$8.38.
(24) The exercise date was 18 October 2019. On the trading date immediately before the exercise date, the closing price per share was HK$11.18.
(25) Due to Share Consolidation, adjustments were made to the number of outstanding share options and the exercise price on 23 June 2020. The exercise price per share of the share options granted on 3 July 2017 was adjusted from HK$10.036 to HK$40.144 and the exercise price per share of the share options granted on 6 July 2018 was adjusted from HK$11.040 to HK$44.160. No adjustment was made to the share options granted on 9 March 2016 and 10 June 2016 as all such options have either been exercised or lapsed before Share Consolidation.
(26) The cash consideration paid by each Director for the grant of share options is HK$10.0.

Annual Report 2020 143
Report of the Directors
DIRECTORS’ INTERESTS IN SHARES, UNDERLYING SHARES AND DEBENTURES (CONTINUED)
(B) Long position in underlying shares – share options (continued)Share Option Schemes of the Company (continued)Share options granted to eligible employees
Number of share options
Date of grantExercisable
period
Balance as at 1 July
2019
Transferred from other
category(7)
Transferred to other
category(8)
Exercised during
the year
Lapsed during
the year
Adjusted during
the year(14)
Balance as at 30 June
2020
Exercise price
per share(14)
(Note) HK$
7 July 2015 (1) 1,968,857 – – (360,406)(9) (1,608,451) – – 9.9669 March 2016 (2) 3,665,000 – – (3,015,000)(10) (650,000) – – 7.20010 June 2016 (3) 12,720,081 136,693 (119,597) (12,733,076)(11) (4,101) – – 7.5403 July 2017 (4) 29,940,000 2,400,000 (1,150,000) (2,113,000)(12) (2,065,750) (20,279,250) 6,732,000 40.1446 July 2018 (5) 33,386,500 600,000 (450,000) (384,500)(13) (2,891,000) (22,695,750) 7,565,250 44.16022 May 2019 (6) 46,550,000 – – – (3,650,000) (32,175,000) 10,725,000 49.376
128,230,438 3,136,693 (1,719,597) (18,605,982) (10,869,302) (75,150,000) 25,022,250
Notes:
(1) Divided into 4 tranches exercisable from 7 July 2015, 7 July 2016, 7 July 2017 and 7 July 2018 respectively to 6 July 2019.
(2) Divided into 4 tranches exercisable from 9 March 2016, 9 March 2017, 9 March 2018 and 9 March 2019 respectively to 8 March 2020.
(3) Divided into 4 tranches exercisable from 10 June 2016, 10 June 2017, 10 June 2018 and 10 June 2019 respectively to 9 June 2020.
(4) Divided into 4 tranches exercisable from 3 July 2017, 3 July 2018, 3 July 2019 and 3 July 2020 respectively to 2 July 2021.
(5) Divided into 4 tranches exercisable from 6 July 2018, 6 July 2019, 6 July 2020 and 6 July 2021 respectively to 5 July 2022.
(6) Divided into 4 tranches exercisable from 22 May 2019, 22 May 2020, 22 May 2021 and 22 May 2022 respectively to 21 May 2023.
(7) Mr. Au Tak-Cheong and Mr. So Chung-Keung, Alfred resigned as Directors of the Company with effect from 1 April 2020 and 1 January 2020 respectively, and such share options were transferred from the category of “Directors” to “eligible employees”.
(8) Ms.Huang Shaomei, Echo and Ms. Chiu Wai-Han, Jenny were appointed as Directors of the Company on 1 May 2020, and such share options were transferred from the category of “eligible employees” to “Directors”.
(9) The weighted average closing price of the shares immediately before the dates on which share options were exercised was HK$12.530.
(10) The weighted average closing price of the shares immediately before the dates on which share options were exercised was HK$10.587.
(11) The weighted average closing price of the shares immediately before the dates on which share options were exercised was HK$9.276.
(12) The weighted average closing price of the shares immediately before the dates on which share options were exercised was HK$11.481.
(13) The weighted average closing price of the shares immediately before the dates on which share options were exercised was HK$11.873.
(14) Due to Share Consolidation, adjustments were made to the number of outstanding share options and the exercise price on 23 June 2020. The exercise price per share of the share options granted on 3 July 2017 was adjusted from HK$10.036 to HK$40.144, the exercise price per share of the share options granted on 6 July 2018 was adjusted from HK$11.040 to HK$44.160, and the exercise price per share of the share options granted on 22 May 2019 was adjusted from HK$12.344 to HK$49.376. No adjustment was made to the share options granted on 7 July 2015, 9 March 2016 and 10 June 2016 as all such options have either been exercised or lapsed before Share Consolidation.
(15) The cash consideration paid by each eligible employee for the grant of share options is HK$10.0.

New World Development Company Limited144
Report of the Directors
DIRECTORS’ INTERESTS IN SHARES, UNDERLYING SHARES AND DEBENTURES (CONTINUED)
(B) Long position in underlying shares – share options (continued)Share Option Scheme of NWS Holdings Limited (“NWSH”)The existing share option scheme of NWSH (“NWSH Share Option Scheme”) was adopted at the annual general meeting of NWSH held on 21 November 2011. A summary of the share option scheme of NWSH disclosed in accordance with the Listing Rules is as follows:
NWSH Share Option Scheme
Purpose of the scheme To reward directors and employees of NWSH and its subsidiaries (“NWSH Group”) for their past service or performance; providing incentive and motivation or reward to eligible participants for optimising their performance or making contribution to NWSH Group; attracting and retaining persons of right caliber with the necessary experience to work for or make contribution to NWSH Group; and fostering a sense of corporate identity.
Participants of the scheme Eligible participant may be a person or an entity belonging to any of the following classes:
(i) any eligible employee (including executive directors but excluding non-executive directors) of NWSH Group or any invested entity of NWSH Group (the “Invested Entity”);
(ii) any non-executive director (including independent non-executive director) of NWSH Group or any Invested Entity;
(iii) any supplier of goods or services to any member of NWSH Group or any Invested Entity;
(iv) any customer of any member of NWSH Group or any Invested Entity;
(v) any person or entity that provides research, development or other technological support to NWSH Group or any Invested Entity;
(vi) any shareholder of any member of NWSH Group or any Invested Entity or any holder of any securities issued by any member of NWSH Group or any Invested Entity;
(vii) any adviser (professional or otherwise) or consultant to any area of business or business development of any member of NWSH Group or any Invested Entity; and
(viii) any joint venture partner or business alliance that co-operates with any member of NWSH Group or any Invested Entity in any area of business operation or development.

Annual Report 2020 145
Report of the Directors
NWSH Share Option Scheme
Total number of shares available for issue under the scheme and percentage of issued shares of NWSH as at the date of this annual report
NWSH had granted share options to subscribe for a total of 55,623,705 shares of NWSH under the NWSH Share Option Scheme, which include certain adjustments made pursuant to the rules of the NWSH Share Option Scheme, up to the date of this report.
The total number of shares of NWSH available for issue under the NWSH Share Option Scheme is 310,957,666 representing approximately 7.95% of the total number of shares of NWSH as at the date of this report.
Max imum en t i t l emen t o f each participant under the scheme
Unless approved by shareholders of NWSH, the total number of shares issued and to be issued upon exercise of the share options granted to each eligible participant (including both exercised and outstanding options) in any 12-month period must not exceed 1.0% of the share capital of NWSH in issue.
The period within which the shares must be taken up under an option
At any time during a period as specified by NWSH’s directors, however in any event the share options must be exercised within 10 years from the date of grant.
The minimum period for which an option must be held before it can be exercised
Any period as determined by NWSH’s directors.
The amount payable on application or acceptance of the option and the period within which payments or calls must or may be made or loans for such purposes must be paid
HK$10.0 is to be paid as consideration for the grant of option within 14 days from the date of offer.
The basis of determining the exercise price
The exercise price is determined by NWSH’s directors which must be at least the highest of: (i) the closing price of the shares as stated in the HKEx’s daily quotations sheet on the date of grant; (ii) the average closing price of the shares as stated in the HKEx’s daily quotations sheets for the five dealing days immediately preceding the date of grant; and (iii) the nominal value of the shares.
The remaining life of the scheme The NWSH Share Option Scheme shall be valid and effective for a period of 10 years from the date of adoption, i.e. 21 November 2011.
DIRECTORS’ INTERESTS IN SHARES, UNDERLYING SHARES AND DEBENTURES (CONTINUED)
(B) Long position in underlying shares – share options (continued)Share Option Scheme of NWS Holdings Limited (“NWSH”) (continued)

New World Development Company Limited146
Report of the Directors
DIRECTORS’ INTERESTS IN SHARES, UNDERLYING SHARES AND DEBENTURES (CONTINUED)
(B) Long position in underlying shares – share options (continued)Share Option Scheme of NWS Holdings Limited (“NWSH”) (continued)Share options granted to Director
Number of share options
Name Date of grantExercisable
period
Balance as at 1 July
2019
Exercised during
the year
Lapsed during
the year
Balance as at 30 June
2020
Exercise price per
share
(Note) HK$
Dr. Cheng Kar-Shun, Henry 9 March 2015 (1) 7,420,739 – (7,420,739) – 14.120
Notes:
(1) 60.0% of the share options are exercisable from 9 May 2015 to 8 March 2020 while the remaining 40.0% of the share options are divided into 2 tranches exercisable from 9 March 2016 and 9 March 2017 respectively to 8 March 2020.
(2) The cash consideration paid by the above Director for the grant of share options is HK$10.0.
Share options granted to eligible participants
Number of share options
Date of grantExercisable
period
Balance as at 1 July
2019
Adjusted during
the year
Exercised during
the year
Lapsed during
the year
Balance as at 30 June
2020
Exercise price per
share (Note) HK$
9 March 2015 (1) 18,626,863(2) – – (18,626,863) – 14.120
Notes:
(1) 60.0% of the share options are exercisable from 9 May 2015 to 8 March 2020 while the remaining 40.0% of the share options are divided into 2 tranches exercisable from 9 March 2016 and 9 March 2017 respectively to 8 March 2020.
(2) Such balance includes 17,222,941 share options of eligible employees and 1,403,922 share options of a retired independent non-executive director of NWSH.
(3) The cash consideration paid by each eligible participant for each grant of share options is HK$10.0.
(C) Long position in debentures(1) Celestial Dynasty Limited (“CDL”)
Amount of debentures in US$ issued by CDL
Approximate % to the
total amount of debentures in issue as at 30 June 2020
NamePersonal interests
Family interests
Corporate interests Total
US$ US$ US$ US$
Mr. Doo Wai-Hoi, William – – 2,800,000(1) 2,800,000 0.43
Note:
(1) These debentures are beneficially owned by companies which are wholly owned by Mr. Doo Wai-Hoi, William.

Annual Report 2020 147
Report of the Directors
DIRECTORS’ INTERESTS IN SHARES, UNDERLYING SHARES AND DEBENTURES (CONTINUED)
(C) Long position in debentures (continued)(2) Celestial Miles Limited (“CML”)
Amount of debentures in US$ issued by CML
Approximate % to the
total amount of debentures in issue as at 30 June 2020
NamePersonal interests
Family interests
Corporate interests Total
US$ US$ US$ US$
Mr. Doo Wai-Hoi, William – – 34,600,000(1) 34,600,000 2.66Mr. Cheng Kar-Shing, Peter 2,000,000 – – 2,000,000 0.15Mr. Lee Luen-Wai, John – 61,000 – 61,000 0.00
2,000,000 61,000 34,600,000 36,661,000
Note:
(1) These debentures are beneficially owned by companies which are wholly owned by Mr. Doo Wai-Hoi, William.
(3) NWCL
Amount of debentures issued by NWCL
Approximate % to the
total amount of debentures in issue as at 30 June 2020
NamePersonal interests
Family interests
Corporate interests Total
HK$ HK$ HK$ HK$
Mr. Doo Wai-Hoi, William – – 538,500,000(1) 538,500,000 6.59
Note:
(1) These debentures are held by companies which are wholly owned by Mr. Doo Wai-Hoi, William, of which HK$390,000,000 debentures were issued in US$ and had been translated into HK$ using the rate of US$1.0=HK$7.8.
(4) NWD Finance (BVI) Limited (“NWD Finance”)
Amount of debentures issued in US$ by NWD Finance
Approximate % to the
total amount of debentures in issue as at 30 June 2020
NamePersonal interests
Family interests
Corporate interests Total
US$ US$ US$ US$
Mr. Doo Wai-Hoi, William – 3,075,000 56,150,000(1) 59,225,000 1.77Ms. Ki Man-Fung, Leonie 1,000,000 – – 1,000,000 0.03
1,000,000 3,075,000 56,150,000 60,225,000
Note:
(1) These debentures are beneficially owned by companies which are wholly owned by Mr. Doo Wai-Hoi, William.

New World Development Company Limited148
Report of the Directors
DIRECTORS’ INTERESTS IN SHARES, UNDERLYING SHARES AND DEBENTURES (CONTINUED)
(C) Long position in debentures (continued)(5) NWD (MTN) Limited (“NWD (MTN)”)
Amount of debentures issued by NWD (MTN)
Approximate % to the
total amount of debentures in issue as at 30 June 2020
NamePersonal interests
Family interests
Corporate interests Total
HK$ HK$ HK$ HK$
Mr. Doo Wai-Hoi, William – 23,400,000(1) 234,000,000(2) 257,400,000 0.69Ms. Ki Man-Fung, Leonie 11,800,000(3) – – 11,800,000 0.03
11,800,000 23,400,000 234,000,000 269,200,000
Notes:
(1) These debentures were issued in US$ and had been translated into HK$ using the rate of US$1.0=HK$7.8.
(2) These debentures are beneficially owned by companies which were wholly owned by Mr. Doo Wai-Hoi, William and were issued in US$ and had been translated into HK$ using the rate of US$1.0=HK$7.8.
(3) This amount includes HK$7,800,000 debentures which were issued in US$ and had been translated into HK$ using the rate of US$1.0=HK$7.8.
Save as disclosed above, as at 30 June 2020, none of the Directors or chief executive had or deemed to have any interest or short positions in the shares, underlying shares and debentures of the Company or any of its associated corporations as defined in the SFO that were required to be entered into the register kept by the Company pursuant to Section 352 of the SFO or were required to be notified to the Company and the Stock Exchange pursuant to the Model Code for Securities Transactions by Directors of Listed Issuers.

Annual Report 2020 149
Report of the Directors
DISCLOSURE PURSUANT TO RULES 13.20 AND 13.22 OF THE LISTING RULES
At 30 June 2020, the Group had given financial assistance and guarantees to its joint ventures and associated companies (collectively “affiliated companies”) as set out below:
2020 2019HK$m HK$m
Amounts due by affiliated companies (note) 35,302.3 42,714.4Guarantees given for affiliated companies in respect of banking and other credit facilities 6,937.3 6,908.5Commitments to capital injections and loan contributions 1,065.6 958.1
43,305.2 50,581.0
Note:
The advances were unsecured and were interest free except for an aggregate amount of HK$13,045.7 million (2019: HK$13,105.4 million) which carried interest ranging from 1.5% below Hong Kong Prime rate to 12.2% above LIBOR per annum (2019: from 2.0% below Hong Kong Prime rate to 12.2% above LIBOR per annum). The advances had no fixed repayment terms.
Pursuant to Rule 13.22 of the Listing Rules, a combined statement of financial position of those affiliated companies with financial assistance from the Group and the Group’s attributable interests in those affiliated companies as at 30 June 2020 are presented as follows:
Combinedstatement of
financialposition
Group’sattributable
interestsHK$m HK$m
Non-current assets 183,780.7 81,290.5Current assets 77,840.4 28,489.4Current liabilities (71,474.6) (29,923.7)
Total assets less current liabilities 190,146.5 79,856.2
Non-current liabilities (139,060.1) (66,283.6)
Net assets 51,086.4 13,572.6
The combined statement of financial position of the affiliated companies was prepared by combining their statements of financial position, after making adjustments to conform with the Group’s significant accounting policies and re-grouping into significant classification in the statement of financial position, as at 30 June 2020.

New World Development Company Limited150
Management Discussion and Analysis
In FY2020, the Group recorded consolidated revenues of HK$59,007.8 million, decreased by 23%. It was mainly attributable
to the decline in contribution from the Hong Kong property development segment.
During the year under review, after excluding mainly changes in the fair value of investment properties net of taxation,
the Group’s underlying profit amounted to HK$6,588.9 million, a decrease of 25%. This was mainly due to the decline in
contribution from NWSH and greater losses from the hotel operation segment under the impact of COVID-19 epidemic
and the decrease in contribution from Hong Kong property development due to no new project completion in FY2020. The
underlying profit of the Group in FY2019 was HK$8,814.1 million.
The core earnings per share of the Group’s underlying profit was HK$2.58, dropped by 25%. As at 30 June 2020, the net
gearing ratio was 41.6%, representing a decrease of 0.6 percentage point from 31 December 2019.
In FY2020, the Group’s EBITDA amounted to HK$15,730.7 million, of which EBITDA from Hong Kong and property-related
segments accounted for 25% and 94% respectively. In FY2019, EBITDA from Hong Kong and property-related segments
accounted for 62% and 93% respectively.
In order to make a fair statement of its current core businesses, the Group has adopted new business segment
classification (i.e. Property Development, Property Investment, Roads, Aviation, Construction, Insurance, Hotel Operations
and Others) in FY2020. The following provides analysis on performance of each segment under the new classification.
REVENUES – ANALYSED BY BUSINESS SEGMENTS
FY2020 FY2019
HK$ m HK$ m
Property Development 19,207.5 38,511.5
Property Investment 4,349.5 3,669.4
Roads 2,070.5 2,529.0
Aviation – 161.6
Construction 16,691.0 17,368.0
Insurance 6,180.0 –
Hotel Operations 1,212.2 1,490.9
Others 9,297.1 13,033.2
Total 59,007.8 76,763.6

Annual Report 2020 151
Management Discussion and Analysis
REVENUES – GEOGRAPHIC CONTRIBUTION (PROPERTY RELATED SEGMENTS)
FY2020 FY2019
HK$ m HK$ m
Property Development
Hong Kong 4,541.9 23,189.1
Mainland China 14,665.6 15,322.4
Total 19,207.5 38,511.5
FY2020 FY2019
HK$ m HK$ m
Property Investment
Hong Kong 2,590.5 1,942.3
Mainland China 1,759.0 1,727.1
Total 4,349.5 3,669.4
FY2020 FY2019
HK$ m HK$ m
Hotel Operations
Hong Kong 708.0 781.8
Mainland China 278.9 414.0
Southeast Asia 225.3 295.1
Total 1,212.2 1,490.9
Revenues from the property development segment fell by 50%, mainly due to no new project completion and handover in
Hong Kong during this fiscal year.
Compared to the FY2019, the completion and handover of multiple projects such as The PAVILIA BAY, MOUNT PAVILIA
and ARTISAN HOUSE drove the performance of the Hong Kong property development segment.
The revenues of the property investment segment increased by 19%, mainly due to the operation commencement of the
K11 MUSEA at Victoria Dockside in Tsim Sha Tsui, Hong Kong, and K11 ATELIER King’s Road, a Grade A office building in
Quarry Bay, Hong Kong, which started to provide contributions.
The Group’s revenues of property investment in Hong Kong during the year under review was HK$2,590.5 million,
representing an increase of 33%. Revenues of property investment in Mainland China reached HK$1,759.0 million,
representing an increase of 2%.
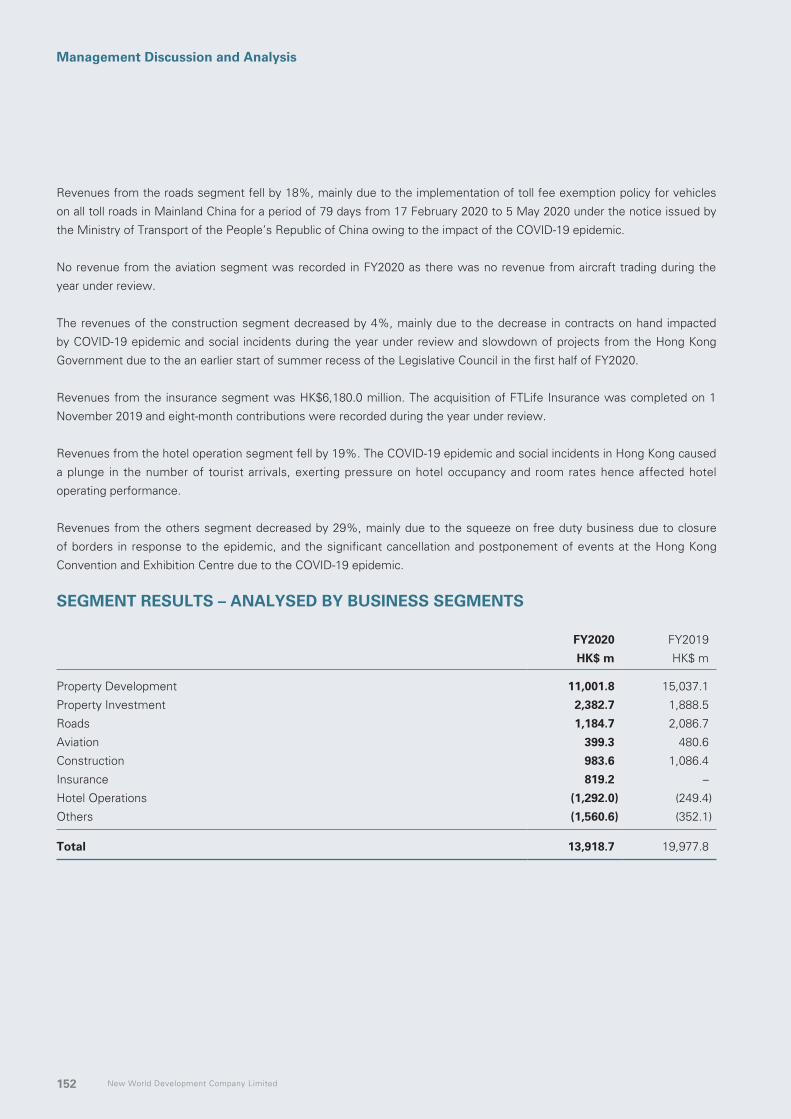
New World Development Company Limited152
Management Discussion and Analysis
Revenues from the roads segment fell by 18%, mainly due to the implementation of toll fee exemption policy for vehicles
on all toll roads in Mainland China for a period of 79 days from 17 February 2020 to 5 May 2020 under the notice issued by
the Ministry of Transport of the People’s Republic of China owing to the impact of the COVID-19 epidemic.
No revenue from the aviation segment was recorded in FY2020 as there was no revenue from aircraft trading during the
year under review.
The revenues of the construction segment decreased by 4%, mainly due to the decrease in contracts on hand impacted
by COVID-19 epidemic and social incidents during the year under review and slowdown of projects from the Hong Kong
Government due to the an earlier start of summer recess of the Legislative Council in the first half of FY2020.
Revenues from the insurance segment was HK$6,180.0 million. The acquisition of FTLife Insurance was completed on 1
November 2019 and eight-month contributions were recorded during the year under review.
Revenues from the hotel operation segment fell by 19%. The COVID-19 epidemic and social incidents in Hong Kong caused
a plunge in the number of tourist arrivals, exerting pressure on hotel occupancy and room rates hence affected hotel
operating performance.
Revenues from the others segment decreased by 29%, mainly due to the squeeze on free duty business due to closure
of borders in response to the epidemic, and the significant cancellation and postponement of events at the Hong Kong
Convention and Exhibition Centre due to the COVID-19 epidemic.
SEGMENT RESULTS – ANALYSED BY BUSINESS SEGMENTS
FY2020 FY2019
HK$ m HK$ m
Property Development 11,001.8 15,037.1
Property Investment 2,382.7 1,888.5
Roads 1,184.7 2,086.7
Aviation 399.3 480.6
Construction 983.6 1,086.4
Insurance 819.2 –
Hotel Operations (1,292.0) (249.4)
Others (1,560.6) (352.1)
Total 13,918.7 19,977.8
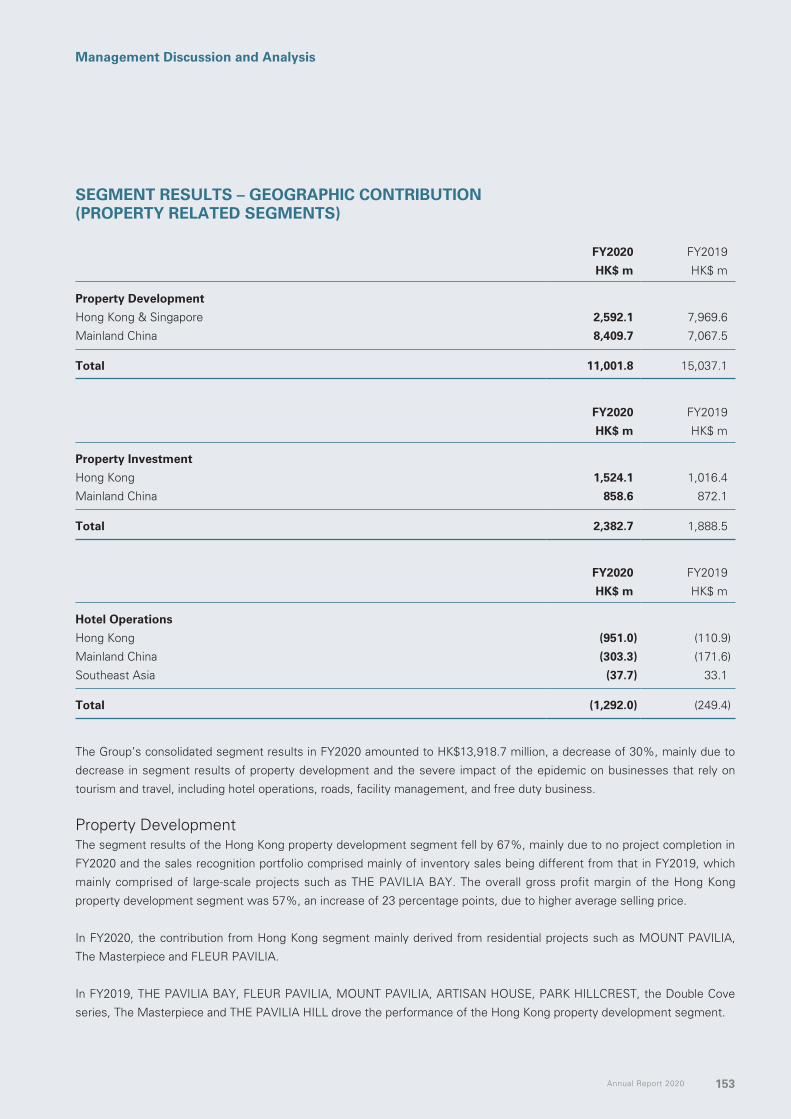
Annual Report 2020 153
Management Discussion and Analysis
SEGMENT RESULTS – GEOGRAPHIC CONTRIBUTION(PROPERTY RELATED SEGMENTS)
FY2020 FY2019
HK$ m HK$ m
Property Development
Hong Kong & Singapore 2,592.1 7,969.6
Mainland China 8,409.7 7,067.5
Total 11,001.8 15,037.1
FY2020 FY2019
HK$ m HK$ m
Property Investment
Hong Kong 1,524.1 1,016.4
Mainland China 858.6 872.1
Total 2,382.7 1,888.5
FY2020 FY2019
HK$ m HK$ m
Hotel Operations
Hong Kong (951.0) (110.9)
Mainland China (303.3) (171.6)
Southeast Asia (37.7) 33.1
Total (1,292.0) (249.4)
The Group’s consolidated segment results in FY2020 amounted to HK$13,918.7 million, a decrease of 30%, mainly due to
decrease in segment results of property development and the severe impact of the epidemic on businesses that rely on
tourism and travel, including hotel operations, roads, facility management, and free duty business.
Property DevelopmentThe segment results of the Hong Kong property development segment fell by 67%, mainly due to no project completion in
FY2020 and the sales recognition portfolio comprised mainly of inventory sales being different from that in FY2019, which
mainly comprised of large-scale projects such as THE PAVILIA BAY. The overall gross profit margin of the Hong Kong
property development segment was 57%, an increase of 23 percentage points, due to higher average selling price.
In FY2020, the contribution from Hong Kong segment mainly derived from residential projects such as MOUNT PAVILIA,
The Masterpiece and FLEUR PAVILIA.
In FY2019, THE PAVILIA BAY, FLEUR PAVILIA, MOUNT PAVILIA, ARTISAN HOUSE, PARK HILLCREST, the Double Cove
series, The Masterpiece and THE PAVILIA HILL drove the performance of the Hong Kong property development segment.
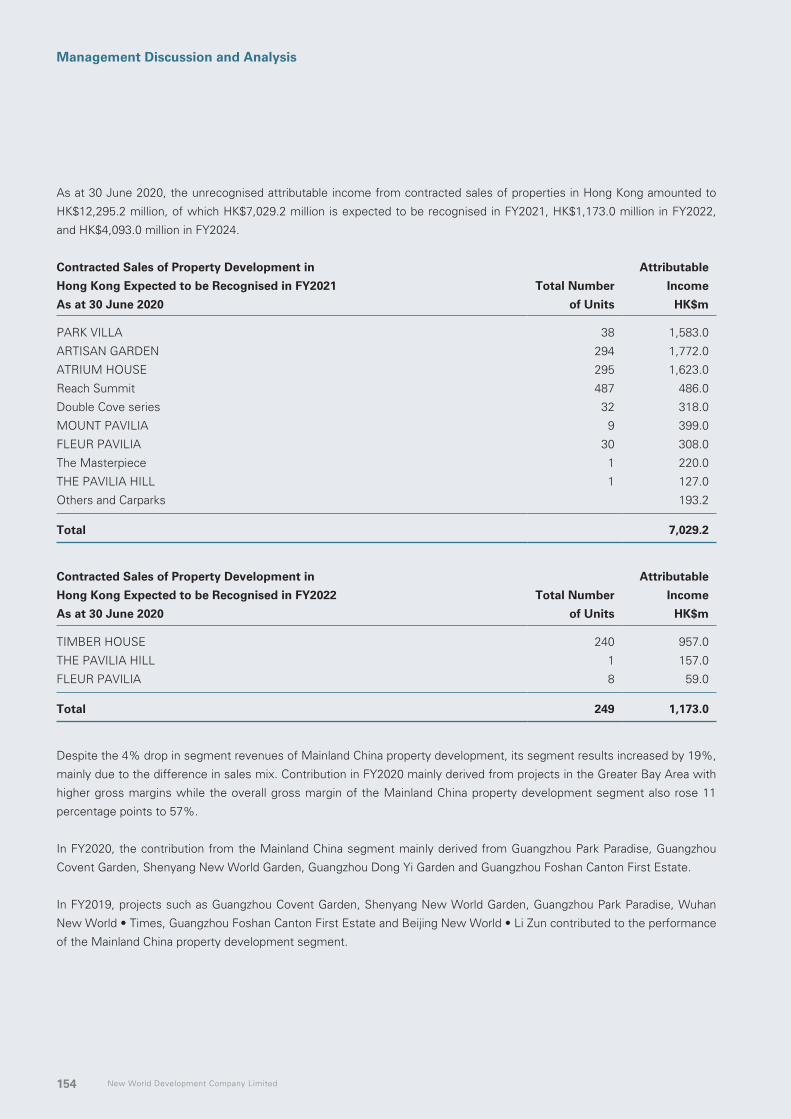
New World Development Company Limited154
Management Discussion and Analysis
As at 30 June 2020, the unrecognised attributable income from contracted sales of properties in Hong Kong amounted to
HK$12,295.2 million, of which HK$7,029.2 million is expected to be recognised in FY2021, HK$1,173.0 million in FY2022,
and HK$4,093.0 million in FY2024.
Contracted Sales of Property Development in
Hong Kong Expected to be Recognised in FY2021
As at 30 June 2020
Total Number
of Units
Attributable
Income
HK$m
PARK VILLA 38 1,583.0
ARTISAN GARDEN 294 1,772.0
ATRIUM HOUSE 295 1,623.0
Reach Summit 487 486.0
Double Cove series 32 318.0
MOUNT PAVILIA 9 399.0
FLEUR PAVILIA 30 308.0
The Masterpiece 1 220.0
THE PAVILIA HILL 1 127.0
Others and Carparks 193.2
Total 7,029.2
Contracted Sales of Property Development in
Hong Kong Expected to be Recognised in FY2022
As at 30 June 2020
Total Number
of Units
Attributable
Income
HK$m
TIMBER HOUSE 240 957.0
THE PAVILIA HILL 1 157.0
FLEUR PAVILIA 8 59.0
Total 249 1,173.0
Despite the 4% drop in segment revenues of Mainland China property development, its segment results increased by 19%,
mainly due to the difference in sales mix. Contribution in FY2020 mainly derived from projects in the Greater Bay Area with
higher gross margins while the overall gross margin of the Mainland China property development segment also rose 11
percentage points to 57%.
In FY2020, the contribution from the Mainland China segment mainly derived from Guangzhou Park Paradise, Guangzhou
Covent Garden, Shenyang New World Garden, Guangzhou Dong Yi Garden and Guangzhou Foshan Canton First Estate.
In FY2019, projects such as Guangzhou Covent Garden, Shenyang New World Garden, Guangzhou Park Paradise, Wuhan
New World • Times, Guangzhou Foshan Canton First Estate and Beijing New World • Li Zun contributed to the performance
of the Mainland China property development segment.

Annual Report 2020 155
Management Discussion and Analysis
As at 30 June 2020, the Group’s unrecognised gross income from contracted sales of properties in Mainland China was
RMB9,129.1 million, of which RMB4,985.9 million is expected to be recognised in FY2021 and RMB4,143.2 million is
expected to be recognised in FY2022.
Contracted Sales of Property Development in
Mainland China Expected to be Recognised
As at 30 June 2020
FY2021 FY2022
Gross Income Gross Income
RMB m RMB m
Southern Region (i.e. the Greater Bay Area) 1,719.8 4,143.2
Central Region 599.9 –
Eastern Region 1,745.3 –
North-eastern Region 920.9 –
Total 4,985.9 4,143.2
Property InvestmentIn FY2020, the property investment segment recorded a contribution of HK$2,382.7 million, increased by 26%. It was
mainly attributable to the operation commencement of K11 MUSEA and at Victoria Dockside in Tsim Sha Tsui and K11
ATELIER King’s Road in Quarry Bay during this fiscal year which started to bring in contribution, as well as the decrease
in pre-opening and marketing expenses of K11 MUSEA and K11 ARTUS following their respective opening. However,
the increased contributions were partially offset by decline in rental income resulted from the disposal of non-core rental
properties (such as Telford Plaza II, Kowloon Bay and PopCorn II, Tseung Kwan O, and EIGHT KWAI FONG, a serviced
apartment in Happy Valley) during the year under review.
The overall performance of Hong Kong’s investment properties was stable, with contributions mainly attributable to Victoria
Dockside, Hong Kong K11 Art Mall, D • PARK, New World Tower and Manning House. Among them, performance of
Victoria Dockside was particularly outstanding. K11 MUSEA at Victoria Dockside, which was completed and opened during
the year under review, had an occupancy rate above 90%, and about 80% of the Grade A office building K11 ATELIER has
been leased.
The performance of the investment property segment in Mainland China fell slightly by 2%, mainly due to the full-year
contribution from Guangzhou New World • NEW PARK, which opened at the end of December in 2018 and the increase in
average rent of Shenyang K11 during the year under review being offset by the impact of the epidemic.
RoadsThe roads segment’s contribution decreased by 43% to HK$1,184.7 million, mainly due to absence of toll fee income from
toll roads and expressways during a period of 79 days between 17 February 2020 and 5 May 2020 in which the Ministry
of Transport of the People’s Republic of China imposed toll fee exemption policy in view of the COVID-19 epidemic,
resulting in a significant decrease in the contribution of the roads segment. However the impact has been mitigated by the
contribution from the Hunan Changliu Expressway acquired by NWSH in August 2019.
AviationThe aviation segment’s contribution was HK$399.3 million, decreased by 17%, mainly due to the absence of dividend
income from Beijing Capital International Airport Company Limited and no revenue from aircraft trading during the year
under review. However, Sky Aviation Leasing International Limited’s full-year contribution and expansion of Goshawk
Aviation’s fleet size provided some support for the segment contribution.

New World Development Company Limited156
Management Discussion and Analysis
ConstructionThe contribution from construction segment amounted to HK$983.6 million, decreased by 9%, mainly due to COVID-19
epidemic and social incidents during the year under review, resulting in the reduction in contracts on hand and the
slowdown of projects from the Hong Kong Government due to the earlier start of summer recess of the Legislative Council
in the first half of FY2020.
InsuranceThe acquisition of FTLife Insurance was completed on 1 November 2019, and the newly added insurance segment recorded
eight-month segment results of HK$819.2 million. Despite the closure of borders leading to a decline in business from
Mainland Chinese Visitors, Hong Kong market remained resilient given the support from new products such as Voluntary
Health Insurance Scheme and Qualifying Deferred Annuity Policy.
Hotel OperationsDuring the year under review, the hotel operations segment’s loss rose to HK$1,292.0 million. In FY2019, the loss from
hotel operations segment was HK$249.4 million. This was mainly attributable to plunge in number of tourist arrivals due
to COVID-19 epidemic, as well as the pre-opening expenses of individual newly completed hotel projects such as KHOS
Langfang and KHOS Shenyang.
OthersOthers segment recorded a loss of HK$1,560.6 million. According to the new business segment classification, the loss of
others segment in FY2019 would be HK$352.1 million. The increase in loss was mainly due to the impact of the COVID-19
epidemic on various businesses. Among them, contribution from free duty business declined as most of the free duty shops
have been closed since late January or early February 2020 due to closure of borders. In terms of facility management
business, nearly all events at the Hong Kong Convention and Exhibition Centre were cancelled or postponed due to
the COVID-19 outbreak. The transportation business saw a drop in patronage due to the COVID-19 outbreak and social
incidents. The Group has disposed of 60% of its equity interest in New World First Ferry Services Limited, which operates
the inner harbour and outlying island ferry routes, in May 2020 for a total consideration of HK$232.8 million.
Other (Losses)/Gains, NetThe Group recorded a net loss of HK$92.5 million in FY2020, compared to a net gain of HK$571.8 million in FY2019. The
recognised gain on remeasuring previously held assets of a joint venture at fair value arising from the acquisition of the
remaining 51% interest in Ningbo New World in July 2019 contributed to most of the Group’s gain in FY2020. The losses
incurred were mainly from the impairment loss on goodwill, property, plant and equipment of approximately HK$700 million
recognised during the year under review in NWS Transport Services Limited which was subsequently disposed of in August
2020, and the impairment loss on assets, including goodwill for the department store business.
Changes in Fair Value of Investment PropertiesThe Group’s changes in the fair value of investment properties (including share of associated companies and joint ventures)
in FY2020 were HK$998.9 million, a decrease of 91%, mainly due to third-party valuers’ estimation of market rents being
affected by corrections in the current Hong Kong property market.
TaxationTaxation in FY2020 increased slightly by 0.5%, mainly due to the increase in property sales in prime locations in Mainland
China resulting in an increase in land appreciation tax. While taxation from Hong Kong’s property development segment
reduced due to no new project completion.

Annual Report 2020 157
Management Discussion and Analysis
LIQUIDITY AND CAPITAL RESOURCES
Net Debt
As at
30 June
2020
As at
30 June
2019
HK$m HK$m
Consolidated net debt 116,458.6 88,288.0
NWS Holdings Limited (“NWSH”) (stock code: 0659) 15,787.0 10.5
New World Department Store China Limited (“NWDS”)
– net cash and bank balances (stock code: 0825) (740.9) (741.2)
Net debt (exclude listed subsidiaries) 101,412.5 89,018.7
The Group’s funding and treasury policy is designed to maintain a diversified and balanced debt profile and financing
structure. The Group’s debts were primarily denominated in Hong Kong Dollar, United States Dollar and Renminbi. In
respect of the Group’s operations in Mainland China, the Group maintains an appropriate level of external borrowings in
Renminbi for natural hedging. The Renminbi currency exposure of the Group is mainly derived from the translation of non-
current assets and liabilities of the subsidiaries, associated companies and joint ventures in Mainland China with functional
currency of Renminbi and the Renminbi deposits held for future development costs to Hong Kong Dollar. As at 30 June
2020, the translation of non-current assets and liabilities of subsidiaries, associated companies and joint ventures with
functional currency other than Hong Kong Dollar to Hong Kong Dollar by using exchange rates at that day resulted a loss
of HK$4,997.3 million is recognised in equity. Apart from this, the Group does not have any material foreign exchange
exposure.
The Group’s borrowings were arranged on both floating rate and fixed rate basis. The net debt had increased and the
financing costs had increased to HK$4,837.9 million. The Group used interest rate swaps, cross currency swaps and foreign
exchange forward contracts to hedge part of the Group’s underlying interest rate and foreign exchange exposure. Fuel price
swap contracts are also used to hedge against the fuel price rises of the Group’s transport business in the Others segment.
The Group’s Insurance segment enters into cross currency swaps and forward starting swaps to hedge against its foreign
currency risk from bond investments and its interest rate risk for bonds to be purchased respectively. As at 30 June 2020,
the Group had outstanding cross currency swaps and foreign exchange forward contracts in the amounts of HK$10,016.6
million, and had other outstanding derivative instruments in the amounts of HK$7,100.0 million (including interest rate swap
for hedging of HK$6,600.0 million) and US$800.0 million (equivalent to approximately HK$6,240.0 million).
As at 30 June 2020, other than two green loans with total facility amount of HK$5,500.0 million (of which HK$3,000.0 million
has been drawdown), for reinforcing the Group’s commitment to improve sustainability performance in our businesses, the
Group has entered into two sustainability-linked loans of total HK$2,000.0 million, of which interest rates will be reduced
according to improvement targets on the Group’s annual sustainability performance.

New World Development Company Limited158
Management Discussion and Analysis
For the year ended 30 June 2020, the Group redeemed the following notes:
Month Principal (equivalent to HK$) Stock Code Interest Rate
November 2019 US$575.3 million (HK$4,487.8 million) 5824 5.375%
February 2020 US$750.0 million (HK$5,850.0 million) 4315 7.000%
For the year ended 30 June 2020, the Group issued the following notes and perpetual capital securities:
Month Category
Principal
(equivalent to HK$)
Interest
Rate
Due
Date Price
Net Proceed
(equivalent to HK$)
July 2019 P US$300.0 million
(HK$2,340.0 million)
5.750% N/A 104.000% US$309.2 million *
(HK$2,411.7 million)
July 2019 NL US$950.0 million
(HK$7,410.0 million)
4.125% 2029 98.718% US$928.3 million
(HK$7,240.7 million)
July 2019 P US$400.0 million
(HK$3,120.0 million)
6.250% N/A 101.389% US$401.6 million *
(HK$3,132.5 million)
November 2019 P US$400.0 million
(HK$3,120.0 million)
6.250% N/A 101.412% US$402.4 million *
(HK$3,138.7 million)
March 2020 N HK$150.0 million 1.500% 2022 99.319% HK$149.0 million
April 2020 N HK$300.0 million 3.830% 2030 100.000% HK$296.3 million
May 2020 NL US$600.0 million
(HK$4,680.0 million)
4.500% 2030 99.920% US$595.6 million
(HK$4,645.7 million)
June 2020 P US$650.0 million
(HK$5,070.0 million)
5.250% N/A 100.000% US$645.8 million
(HK$5,037.2 million)
June 2020 P US$200.0 million
(HK$1,560.0 million)
5.250% N/A 100.200% US$200.0 million *
(HK$1,560.0 million)
P: Guaranteed senior perpetual capital securities listed on the Stock Exchange of Hong Kong Limited (the “Stock Exchange”)N: Guaranteed notesNL: Guaranteed notes listed on the Stock ExchangeN/A: Not applicable* excluding accrued interest
The proceeds from the issuance of the bonds were for general working capital purpose including the acquisition and
development of property projects in Hong Kong and Mainland China and the acquisition of FTLife Insurance Company
Limited (“FTLife Insurance”) and the concession rights of Changliu Expressway.
As at 30 June 2020, the Group’s cash and bank balances (including restricted bank balances) stood at HK$67,435.6 million
(2019: HK$63,731.6 million) and the consolidated net debt amounted to HK$116,458.6 million (2019: HK$88,288.0 million).
Following the acquisition of FTLife Insurance and various property projects in the Mainland China, including the Ningbo New
World Plaza project and the Wangjiang New Town project in Hangzhou, the net debt to equity ratio was 41.6%; an increase
of 9.5 percentage points as compared to 30 June 2019.
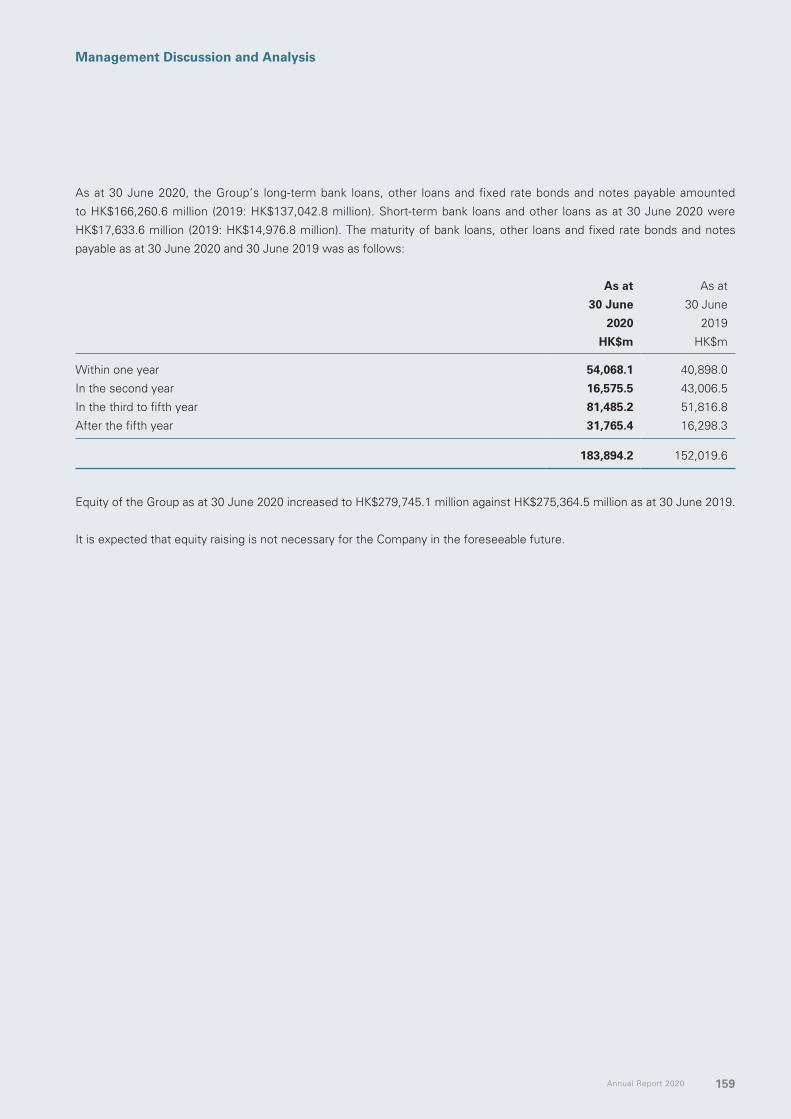
Annual Report 2020 159
Management Discussion and Analysis
As at 30 June 2020, the Group’s long-term bank loans, other loans and fixed rate bonds and notes payable amounted
to HK$166,260.6 million (2019: HK$137,042.8 million). Short-term bank loans and other loans as at 30 June 2020 were
HK$17,633.6 million (2019: HK$14,976.8 million). The maturity of bank loans, other loans and fixed rate bonds and notes
payable as at 30 June 2020 and 30 June 2019 was as follows:
As at
30 June
2020
As at
30 June
2019
HK$m HK$m
Within one year 54,068.1 40,898.0
In the second year 16,575.5 43,006.5
In the third to fifth year 81,485.2 51,816.8
After the fifth year 31,765.4 16,298.3
183,894.2 152,019.6
Equity of the Group as at 30 June 2020 increased to HK$279,745.1 million against HK$275,364.5 million as at 30 June 2019.
It is expected that equity raising is not necessary for the Company in the foreseeable future.

New World Development Company Limited160
Management Discussion and Analysis
Floating/Fixed Rate and Maturity Profile of
Borrowings as at 30 June 2020 (HK$ billion)
48.2
5.9
14.6
2.0
63.2
18.325.46.4
Within 1year
After 5thyear
In 3rd to 5thyear
In 2ndyear
Fixed Rate Floating Rate
Currency Profile of Borrowings
6% 5%23%
72%
22%
72%
USD & OthersHKD RMB
As at 30 June 2019
As at 30 June 2020
Source of Borrowings
Long-term loans
Fixed rate bonds and notes payable
Short-term loans
29% 27%
42%
31%
43%
28%
As at 30 June 2019
As at 30 June 2020
Nature of Debts
88% 88%
12%12%
As at 30 June 2019
As at 30 June 2020
Secured Unsecured

Annual Report 2020 161
Independent Auditor’s Report
INDEPENDENT AUDITOR’S REPORTTO THE MEMBERS OF NEW WORLD DEVELOPMENT COMPANY LIMITED(incorporated in Hong Kong with limited liability)
OPINION
What we have auditedThe consolidated financial statements of New World Development Company Limited (the “Company”) and its subsidiaries (the “Group”) set out on pages 170 to 298, which comprise:
• the consolidated statement of financial position as at 30 June 2020;
• the consolidated income statement for the year then ended;
• the consolidated statement of comprehensive income for the year then ended;
• the consolidated statement of changes in equity for the year then ended;
• the consolidated statement of cash flows for the year then ended; and
• the notes to the consolidated financial statements, which include a summary of significant accounting policies.
Our opinionIn our opinion, the consolidated financial statements give a true and fair view of the consolidated financial position of the Group as at 30 June 2020, and of its consolidated financial performance and its consolidated cash flows for the year then ended in accordance with Hong Kong Financial Reporting Standards (“HKFRSs”) issued by the Hong Kong Institute of Certified Public Accountants (“HKICPA”) and have been properly prepared in compliance with the Hong Kong Companies Ordinance.
BASIS FOR OPINION
We conducted our audit in accordance with Hong Kong Standards on Auditing (“HKSAs”) issued by the HKICPA. Our responsibilities under those standards are further described in the Auditor’s Responsibilities for the Audit of the Consolidated Financial Statements section of our report.
We believe that the audit evidence we have obtained is sufficient and appropriate to provide a basis for our opinion.
IndependenceWe are independent of the Group in accordance with the HKICPA’s Code of Ethics for Professional Accountants (“the Code”), and we have fulfilled our other ethical responsibilities in accordance with the Code.
KEY AUDIT MATTERS
Key audit matters are those matters that, in our professional judgement, were of most significance in our audit of the consolidated financial statements of the current period. These matters were addressed in the context of our audit of the consolidated financial statements as a whole, and in forming our opinion thereon, and we do not provide a separate opinion on these matters.
Key audit matters identified in our audit are summarised as follows:
• Valuation of investment properties held by the Group and its joint ventures and associated companies;
• Recoverability of properties for/under development and properties held for sale held by the Group and its joint ventures;
• Impairment of the Group’s interests in joint ventures and associated companies;
• Business combination of FTLife Insurance Company Limited and its subsidiaries; and
• Assessment on (a) valuation of insurance contract liabilities and (b) amortisation of value of business acquired and deferred acquisition costs.
New World Development Company Limited162
Independent Auditor’s Report
Key Audit Matter How our audit addressed the Key Audit Matter
Valuation of investment properties held by the Group and its joint ventures and associated companies
Refer to notes 6(b), 7 and 17 to the consolidated financial statements.
Our procedures in relation to the valuation of investment properties included:
As at 30 June 2020, the investment properties held by the Group were stated at fair value of HK$169,717.5 million with fair value gain of HK$1,653.2 million recognised in the consolidated income statement. The Group also has significant investment properties held by its joint ventures and associated companies.
Independent external valuers were engaged to determine the fair value of the investment properties held by the Group and its joint ventures and associated companies as at 30 June 2020.
For completed investment properties, fair value was generally derived by the income capitalisation method and where appropriate, by direct comparison method. Income capitalisation method was based on the capitalisation of the net income and reversionary income potential by adopting appropriate capitalisation rates and prevailing market rents. Direct comparison method was based on comparable market transactions, as adjusted by the property-specific qualitative factors.
For investment properties under development, fair value was derived using the residual method by deducting development costs together with developer’s profit and risk margins from the estimated capital value of the proposed development assuming completed as at the date of valuation.
We focused on this area due to the fact that there are significant judgements and estimates involved in the valuation of investment properties.
• We assessed the competence, capability and objectivity of the independent external valuers;
• We obtained the valuation reports and met the independent external valuers to discuss the valuation methodologies and key assumptions;
• We involved our in-house valuation experts and assessed the valuation methodologies and the reasonableness of the key assumptions used in the valuation of investment properties, based on our knowledge of the property industry, research evidence of capitalisation rates, prevailing market rents and comparable market transactions for similar properties, where applicable; and
• We tested, on a sample basis, the data used in the valuation of investment properties, including rental rates from existing tenancies and estimated cost to complete, by agreeing them to the underlying agreements with the tenants and approved budgets, respectively. We also compared the estimated developer’s profit and risk margins to properties with comparable stage of development, where appropriate.
Based on the procedures performed, we found the methodologies used in preparing the valuations were appropriate and the key assumptions were supportable in light of available evidence.
KEY AUDIT MATTERS (CONTINUED)

Annual Report 2020 163
Independent Auditor’s Report
Key Audit Matter How our audit addressed the Key Audit Matter
Recoverability of properties for/under development and properties held for sale held by the Group and its joint ventures
Refer to notes 6(c) and 30 to the consolidated financial statements.
Our procedures in relation to management’s assessment of recoverability of properties for/under development and properties held for sale included:
As at 30 June 2020, the carrying values of the Group’s properties for development, properties under development and properties held for sale amounted to HK$35,424.0 million, HK$48,657.7 million and HK$17,724.1 million respectively. The Group also has significant property development projects for sale held by its joint ventures.
Management assessed the recoverability of the property portfolios held for sale by the Group and its joint ventures based on estimates of the net realisable values of the underlying properties. These involved the estimation of selling prices of the properties based on current market prices of properties of comparable locations and conditions. For properties for/under development, management estimated the construction costs to complete based on the existing development plans. Management concluded that the current level of provision for the properties for/under development and properties held for sale as at 30 June 2020 was appropriate.
If the estimated net realisable values of the underlying properties were significantly different from their carrying values as a result of changes of market conditions and/or significant variation in the budgeted development costs, material reversal or impairment provision for properties for/under development and properties held for sale may result. Accordingly, the existence of significant estimates warrants specific audit focus and attention on this area.
• We evaluated and tested the operating effectiveness of key controls around the property development cycle with particular focus on, but not limited to, controls over cost budgeting for estimated costs to completion, where applicable;
• We evaluated management’s assessment on the recoverability of property portfolios, with particular focus on properties with relatively low gross profit margins or those with cost exceeding the net realisable value; and
• We assessed the reasonableness of key assumptions and estimates in management’s assessment including:
(i) For the est imated sel l ing pr ices, we compared, on a sample basis, to the contracted selling prices of the underlying properties or current market prices of properties of comparable locations and conditions, where applicable; and
(ii) For the estimated costs to completion, we assessed the reasonableness of the latest budgets of total construction costs and tested, on a sample basis, the construction costs to committed contracts and other supporting documentation.
Based on the procedures performed, we found the key assumptions in the recoverability assessment were supportable in light of available evidence.
KEY AUDIT MATTERS (CONTINUED)
New World Development Company Limited164
Independent Auditor’s Report
Key Audit Matter How our audit addressed the Key Audit Matter
Impairment of the Group’s interests in joint ventures and associated companies
Refer to notes 6(d), 25 and 26 to the consolidated financial statements.
Our procedures in assessing the management’s judgement for the impairment assessments of the Group’s interests in joint ventures and associated companies included:
As at 30 June 2020, the carrying values of the Group’s interests in joint ventures and associated companies amounted to HK$43,013.3 million and HK$21,143.7 million respectively. Management reviewed regularly whether there are any indicators of impairment of the investments by reference to the requirements under HKAS 28 (2011) “Investments in Associates and Joint Ventures” and HKAS 36 “Impairment of Assets”.
For investments where relevant impairment indicators exist, management estimated the recoverable amounts of those investments, being higher of value in use or fair value less costs of disposal. The value in use is determined based on the discounted cash flow projections. Significant judgements are required to determine the key assumptions used in the discounted cash flow models, such as revenue growth, unit price and discount rates. Independent external valuers were also involved in certain value in use assessments, where management considered necessary. Based on the results of these impairment assessments, management concluded that the current level of impairment provision for the Group’s interests in joint ventures and associated companies as at 30 June 2020 was appropriate.
As the impairment assessment involves signif icant judgements and estimates, we regard this as a key audit matter.
• We evaluated the competence, capabilities and objectivity of the independent external valuers, where applicable;
• We involved our in-house valuation experts, where applicable, and assessed the appropriateness of the valuation methodology and the reasonableness of the key assumptions adopted in the cash flow projections;
• We assessed the reasonableness of the discount rates applied by the management in the discounted cash flow models by comparing to external market data and publicly available information;
• We checked the key assumptions to external market data or other supporting evidence, where available; and
• We performed sensi t iv i ty ana lys is on the key assumptions adopted in the impairment assessments to understand the impact of reasonable changes in assumptions on the estimated recoverable amounts.
Based on the procedures performed, we found management’s impairment assessments relating to the Group’s interests in joint ventures and associated companies were supported by available evidence.
KEY AUDIT MATTERS (CONTINUED)
Annual Report 2020 165
Independent Auditor’s Report
Key Audit Matter How our audit addressed the Key Audit Matter
Business combination of FTLife Insurance Company Limited and its subsidiaries
Refer to notes 6(n) and 50(a) to the consolidated financial statements.
Our procedures to assess management’s identification and valuation of assets acquired and liabilities assumed of FTLife Insurance included the following:
In November 2019, the Group completed the acquisition of 100% equity interest of FTLife Insurance Company Limited and its subsidiaries (collectively “FTLife Insurance”) at a consideration of approximately HK$21,812.2 million.
The Group accounted for the acquisition as a business combination in accordance with HKFRS 3 (Revised) “Business Combinations” which requires identifiable assets acquired and liabilities and contingent liabilities assumed in business combinations measured initially at their fair values at the acquisition date.
The Group has made a provisional assessment of the fair value of the assets and liabilities as at the acquisition date with assistance from independent external experts. The fair value of identifiable net assets amounted to HK$16,235.9 million. A provisional goodwill of HK$5,576.3 million has been recognised by the Group as a result of this transaction.
We focused on this area due to significant management judgements and estimates required for identification and valuation of assets acquired and liabilities assumed of FTLife Insurance.
• We inspected the share purchase agreement and agreed related terms to assets and liabilities identified;
• We evaluated the competence, capabilities and objectivity of the independent external experts; and
• We involved our in-house actuarial and valuation experts and reviewed the purchase price allocation report prepared by independent external experts and applied our industry and business knowledge in:
(i) assessing the appropriateness of the valuation methodology and key parameters used in relation to the assets acquired and liabilities assumed at the acquisition date;
(ii) assessing the reasonableness of key assumptions used in the valuation and checked to external market data or other supporting evidence where available.
Based on the procedures performed, we found management’s assessments relating to identification and valuation of assets acquired and liabilities assumed of FTLife Insurance to be reasonable.
KEY AUDIT MATTERS (CONTINUED)

New World Development Company Limited166
Independent Auditor’s Report
Key Audit Matter How our audit addressed the Key Audit Matter
Assessment on (a) valuation of insurance contract liabilities and (b) amortisation of value of business acquired and deferred acquisition costs
(a) Valuation of insurance contract liabilities (a) Valuation of insurance contract liabilities
Refer to notes 4(b), 5(g), 6(l), 35 and 44 to the consolidated financial statements.
The Group had insurance contract liabilities (including those classified as liabilities related to unit-linked contracts) of HK$32,227.3 million as at 30 June 2020.
The valuation of insurance contract liabilities requires the use of appropriate actuarial methodologies and various economic and operational assumptions that are subject to a high degree of management’s judgements. The key assumptions used in measuring the insurance contract liabilities include discount rates, mortality rates, lapse rates, and expenses.
We focused on this area due to significant management judgements and estimates required in the valuation of insurance contract liabilities at the end of reporting period.
We involved our in-house actuarial experts in performing the following audit procedures:
• We evaluated whether the methodologies are consistent with recognised actuarial practices in the insurance industry. We built independent models to test, on a sampling basis, the algorithm within the actuarial models applied;
• We assessed the reasonableness of the key assumptions made by management including discount rates, mortality rates, lapse rates, and expenses based on the Group’s own historical data and experience study, market-observable data, and our industry knowledge and experience;
• We performed analysis of the movements in insurance contract liabilities to assess whether the changes are in line with our understanding of the assumptions and any developments and changes during the period; and
• We reviewed the calculation of the l iabil ity adequacy test to assess the adequacy of insurance contract liabilities.
Based on the procedures performed above, we found the methodologies and assumptions used by management in the valuation of insurance contract liabilities to be reasonable.
KEY AUDIT MATTERS (CONTINUED)

Annual Report 2020 167
Independent Auditor’s Report
Key Audit Matter How our audit addressed the Key Audit Matter
Assessment on (a) valuation of insurance contract liabilities and (b) amortisation of value of business acquired and deferred acquisition costs (continued)
(b) Amortisation of value of business acquired and deferred acquisition costs
(b) Amortisation of value of business acquired and deferred acquisition costs
Refer to notes 4(b), 6(m), 23 and 24 to the consolidated financial statements.
As at 30 June 2020, the carrying value of value of business acquired (“VOBA”) and deferred acquisition costs (“DAC”) amounting to HK$5,651.5 million and HK$688.2 million respectively. Amortisation of VOBA and DAC amounting to HK$173.5 million and HK$136.1 million, respectively, was recognised in the consolidated income statement for the year ended 30 June 2020.
VOBA is amortised over the estimated life of the contracts in the acquired portfolio on a systematic basis primarily based on expected future profits which involved significant management judgements and estimates.
DAC of new business is amortised according to the expected future premiums or expected future profits, which are projected based on the Group’s best estimate assumptions and actual persistency.
We focused on this area due to the high degree of management judgements and estimates required.
With the assistance of our in-house actuarial experts, we evaluated the basis of amortisation of VOBA and DAC determined by management and assessed the reasonableness of key assumptions used by management, including discount rates, mortality rates, lapse rates and expenses in determining the expected future profits.
Based on the procedures performed above, we found the assumptions used in the amortisation of VOBA and DAC to be appropriate.
KEY AUDIT MATTERS (CONTINUED)

New World Development Company Limited168
Independent Auditor’s Report
OTHER INFORMATION
The directors of the Company are responsible for the other information. The other information comprises all of the information included in the annual report other than the consolidated financial statements and our auditor’s report thereon.
Our opinion on the consolidated financial statements does not cover the other information and we do not express any form of assurance conclusion thereon.
In connection with our audit of the consolidated financial statements, our responsibility is to read the other information and, in doing so, consider whether the other information is materially inconsistent with the consolidated financial statements or our knowledge obtained in the audit or otherwise appears to be materially misstated.
If, based on the work we have performed, we conclude that there is a material misstatement of this other information, we are required to report that fact. We have nothing to report in this regard.
RESPONSIBILITIES OF DIRECTORS AND THE AUDIT COMMITTEE FOR THE CONSOLIDATED FINANCIAL STATEMENTS
The directors of the Company are responsible for the preparation of the consolidated financial statements that give a true and fair view in accordance with HKFRSs issued by the HKICPA and the Hong Kong Companies Ordinance, and for such internal control as the directors determine is necessary to enable the preparation of consolidated financial statements that are free from material misstatement, whether due to fraud or error.
In preparing the consolidated financial statements, the directors are responsible for assessing the Group’s ability to continue as a going concern, disclosing, as applicable, matters related to going concern and using the going concern basis of accounting unless the directors either intend to liquidate the Group or to cease operations, or have no realistic alternative but to do so.
The Audit Committee is responsible for overseeing the Group’s financial reporting process.
AUDITOR’S RESPONSIBILITIES FOR THE AUDIT OF THE CONSOLIDATED FINANCIAL STATEMENTS
Our objectives are to obtain reasonable assurance about whether the consolidated financial statements as a whole are free from material misstatement, whether due to fraud or error, and to issue an auditor’s report that includes our opinion. We report our opinion solely to you, as a body, in accordance with Section 405 of the Hong Kong Companies Ordinance and for no other purpose. We do not assume responsibility towards or accept liability to any other person for the contents of this report. Reasonable assurance is a high level of assurance, but is not a guarantee that an audit conducted in accordance with HKSAs will always detect a material misstatement when it exists. Misstatements can arise from fraud or error and are considered material if, individually or in the aggregate, they could reasonably be expected to influence the economic decisions of users taken on the basis of these consolidated financial statements.
As part of an audit in accordance with HKSAs, we exercise professional judgement and maintain professional scepticism throughout the audit. We also:
• Identify and assess the risks of material misstatement of the consolidated financial statements, whether due to fraud or error, design and perform audit procedures responsive to those risks, and obtain audit evidence that is sufficient and appropriate to provide a basis for our opinion. The risk of not detecting a material misstatement resulting from fraud is higher than for one resulting from error, as fraud may involve collusion, forgery, intentional omissions, misrepresentations, or the override of internal control.
• Obtain an understanding of internal control relevant to the audit in order to design audit procedures that are appropriate in the circumstances, but not for the purpose of expressing an opinion on the effectiveness of the Group’s internal control.

Annual Report 2020 169
Independent Auditor’s Report
AUDITOR’S RESPONSIBILITIES FOR THE AUDIT OF THE CONSOLIDATED FINANCIAL STATEMENTS (CONTINUED)
• Evaluate the appropriateness of accounting policies used and the reasonableness of accounting estimates and related disclosures made by the directors.
• Conclude on the appropriateness of the directors’ use of the going concern basis of accounting and, based on the audit evidence obtained, whether a material uncertainty exists related to events or conditions that may cast significant doubt on the Group’s ability to continue as a going concern. If we conclude that a material uncertainty exists, we are required to draw attention in our auditor’s report to the related disclosures in the consolidated financial statements or, if such disclosures are inadequate, to modify our opinion. Our conclusions are based on the audit evidence obtained up to the date of our auditor’s report. However, future events or conditions may cause the Group to cease to continue as a going concern.
• Evaluate the overall presentation, structure and content of the consolidated financial statements, including the disclosures, and whether the consolidated financial statements represent the underlying transactions and events in a manner that achieves fair presentation.
• Obtain sufficient appropriate audit evidence regarding the financial information of the entities or business activities within the Group to express an opinion on the consolidated financial statements. We are responsible for the direction, supervision and performance of the group audit. We remain solely responsible for our audit opinion.
We communicate with the Audit Committee regarding, among other matters, the planned scope and timing of the audit and significant audit findings, including any significant deficiencies in internal control that we identify during our audit.
We also provide the Audit Committee with a statement that we have complied with relevant ethical requirements regarding independence, and to communicate with them all relationships and other matters that may reasonably be thought to bear on our independence, and where applicable, actions taken to eliminate threats or safeguards applied.
From the matters communicated with the Audit Committee, we determine those matters that were of most significance in the audit of the consolidated financial statements of the current period and are therefore the key audit matters. We describe these matters in our auditor’s report unless law or regulation precludes public disclosure about the matter or when, in extremely rare circumstances, we determine that a matter should not be communicated in our report because the adverse consequences of doing so would reasonably be expected to outweigh the public interest benefits of such communication.
The engagement partner on the audit resulting in this independent auditor’s report is Mr. Ho Chiu Ping, Dennis.
PricewaterhouseCoopersCertified Public Accountants
Hong Kong, 30 September 2020

New World Development Company Limited
Consolidated Income StatementFor the year ended 30 June 2020
170
2020 2019Note HK$m HK$m
Revenues 7 59,007.8 76,763.6Cost of sales (39,076.6) (51,742.1)
Gross profit 19,931.2 25,021.5Other income 8 243.8 121.4Other gains, net 9 344.5 338.8Selling and marketing expenses (1,937.2) (2,161.0)Expenses of department store’s operation (1,286.8) (2,125.6)Administrative and other operating expenses (7,121.5) (6,298.7)Overlay approach adjustments on financial assets 4(b)(xiii) 208.2 —Changes in fair value of and gain on transfer to investment properties 17 1,653.2 10,305.7
Operating profit 10 12,035.4 25,202.1Financing income 2,827.0 1,716.2Financing costs 11 (4,837.9) (2,472.5)
10,024.5 24,445.8Share of results of
Joint ventures 1,007.3 3,670.3Associated companies (237.4) 1,012.8
Profit before taxation 10,794.4 29,128.9Taxation 12 (7,528.0) (7,489.8)
Profit for the year 3,266.4 21,639.1
Attributable to:Shareholders of the Company 41 1,096.2 18,160.1Holders of perpetual capital securities 1,688.3 803.0Non-controlling interests 481.9 2,676.0
3,266.4 21,639.1
Earnings per share 13 (Adjusted)Basic HK$0.43 HK$7.11Diluted HK$0.43 HK$7.11

Annual Report 2020
Consolidated Statement of Comprehensive IncomeFor the year ended 30 June 2020
171
2020 2019Note HK$m HK$m
Profit for the year 3,266.4 21,639.1
Other comprehensive incomeItems that will not be reclassified to profit or loss
Fair value changes of equity instruments as financial assets at fair value through other comprehensive income (1,011.1) (192.7)
Revaluation of investment properties upon reclassification from property, plant and equipment and right-of-use assets (2019: property, plant and equipment and land use rights) 11.4 54.4— deferred tax arising from revaluation thereof (1.9) (12.4)
Remeasurement of post-employment benefit obligation 32.0 (8.3)
Items that had been reclassified/may be reclassified subsequently to profit or lossNet fair value changes and other net movements of debt instruments as
financial assets at fair value through other comprehensive income 1,768.6 —Release of reserve upon disposal of debt instruments as
financial assets through other comprehensive income (306.6) —Release of reserves upon disposal of subsidiaries (68.4) 0.1Release of reserves upon disposal of interests in joint ventures and
associated companies (13.9) (56.7)Release of reserves upon deregistration of subsidiaries — 11.8Share of other comprehensive income of joint ventures and
associated companies (1,499.0) (997.9)Cash flow/fair value hedges 147.3 (919.2)Amount reported in other comprehensive income applying overlay
approach adjustments on financial assets 4(b)(xiii) (208.2) —Translation differences (3,837.3) (5,030.3)
Other comprehensive income for the year (4,987.1) (7,151.2)
Total comprehensive income for the year (1,720.7) 14,487.9
Attributable to:Shareholders of the Company (3,490.6) 12,394.6Holders of perpetual capital securities 1,688.3 803.0Non-controlling interests 81.6 1,290.3
(1,720.7) 14,487.9

New World Development Company Limited
Consolidated Statement of Financial PositionAs at 30 June 2020
172
2020 2019Note HK$m HK$m
AssetsNon-current assets
Investment properties 17 169,717.5 173,326.7Property, plant and equipment 18 30,099.9 31,024.1Right-of-use assets 19 8,514.7 —Land use rights 20 — 1,213.9Intangible concession rights 21 14,005.1 9,973.0Intangible assets 22 8,427.6 3,464.5Value of business acquired 23 5,651.5 —Deferred acquisition costs 24 688.2 —Interests in joint ventures 25 43,013.3 50,865.5Interests in associated companies 26 21,143.7 25,331.9Financial assets at fair value through profit or loss 33 13,488.4 8,420.9Financial assets at fair value through other comprehensive income 34 39,131.2 5,038.8Derivative financial instruments 27 2,154.2 130.8Properties for development 35,424.0 28,922.3Deferred tax assets 28 1,120.0 763.5Other non-current assets 29 25,344.7 14,644.3
417,924.0 353,120.2
Current assetsProperties under development 30 48,657.7 34,145.5Properties held for sale 17,724.1 23,130.0Inventories 31 685.1 805.7Debtors, prepayments, premium receivables and contract assets 32 35,188.9 25,722.0Investments related to unit-linked contracts 35 9,053.6 —Financial assets at fair value through profit or loss 33 1,140.5 818.5Financial assets at fair value through other comprehensive income 34 528.1 —Derivative financial instruments 27 0.7 6.5Restricted bank balances 36 144.4 2.5Cash and bank balances 36 67,291.2 63,729.1
180,414.3 148,359.8Non-current assets classified as assets held for sale 37 1,857.6 1,804.9
182,271.9 150,164.7
Total assets 600,195.9 503,284.9
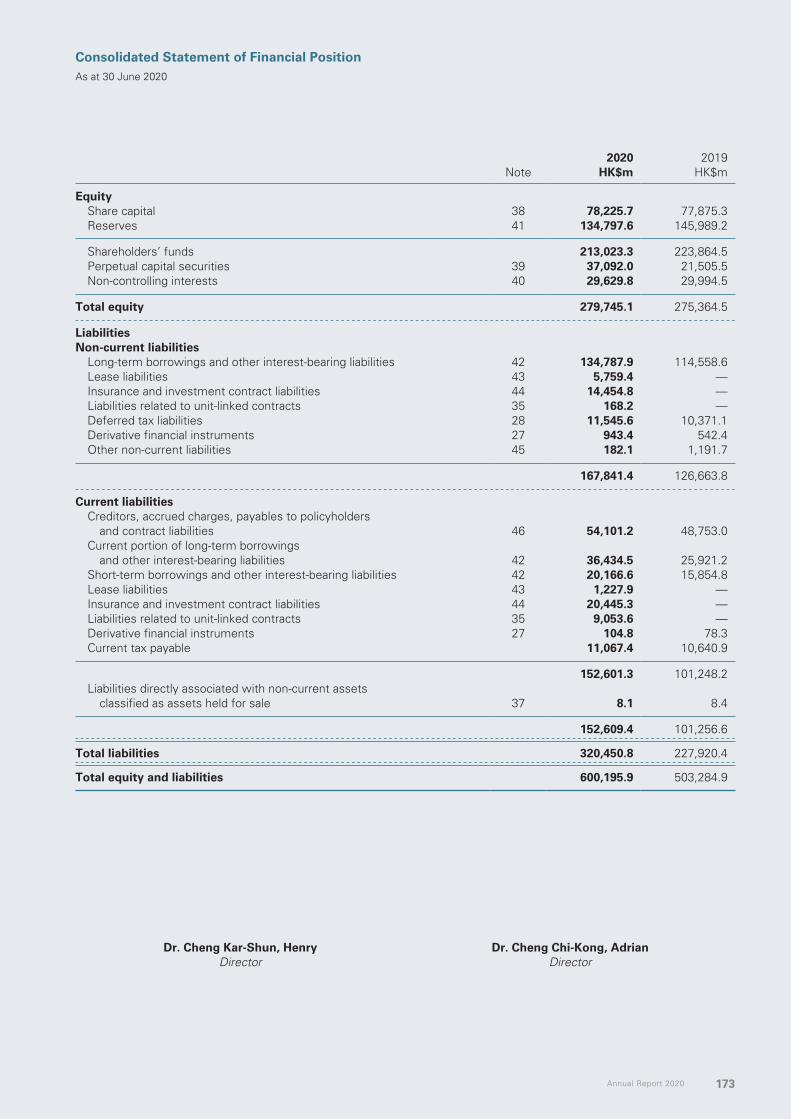
Annual Report 2020 173
Consolidated Statement of Financial PositionAs at 30 June 2020
2020 2019Note HK$m HK$m
EquityShare capital 38 78,225.7 77,875.3Reserves 41 134,797.6 145,989.2
Shareholders’ funds 213,023.3 223,864.5Perpetual capital securities 39 37,092.0 21,505.5Non-controlling interests 40 29,629.8 29,994.5
Total equity 279,745.1 275,364.5
LiabilitiesNon-current liabilities
Long-term borrowings and other interest-bearing liabilities 42 134,787.9 114,558.6Lease liabilities 43 5,759.4 —Insurance and investment contract liabilities 44 14,454.8 —Liabilities related to unit-linked contracts 35 168.2 —Deferred tax liabilities 28 11,545.6 10,371.1Derivative financial instruments 27 943.4 542.4Other non-current liabilities 45 182.1 1,191.7
167,841.4 126,663.8
Current liabilitiesCreditors, accrued charges, payables to policyholders
and contract liabilities 46 54,101.2 48,753.0Current portion of long-term borrowings
and other interest-bearing liabilities 42 36,434.5 25,921.2Short-term borrowings and other interest-bearing liabilities 42 20,166.6 15,854.8Lease liabilities 43 1,227.9 —Insurance and investment contract liabilities 44 20,445.3 —Liabilities related to unit-linked contracts 35 9,053.6 —Derivative financial instruments 27 104.8 78.3Current tax payable 11,067.4 10,640.9
152,601.3 101,248.2Liabilities directly associated with non-current assets
classified as assets held for sale 37 8.1 8.4
152,609.4 101,256.6
Total liabilities 320,450.8 227,920.4
Total equity and liabilities 600,195.9 503,284.9
Dr. Cheng Kar-Shun, Henry Dr. Cheng Chi-Kong, AdrianDirector Director

New World Development Company Limited
Consolidated Statement of Changes in EquityFor the year ended 30 June 2020
174
Sharecapital
Retained profits
Other reserves
Shareholders’ funds
Perpetual capital
securities
Non-controlling
interests TotalHK$m HK$m HK$m HK$m HK$m HK$m HK$m
At 30 June 2019 77,875.3 136,730.0 9,259.2 223,864.5 21,505.5 29,994.5 275,364.5Adjustment on changes in
accounting policies (note 4(a)) — (1,832.3) — (1,832.3) — (278.8) (2,111.1)
Restated balance as at 1 July 2019 77,875.3 134,897.7 9,259.2 222,032.2 21,505.5 29,715.7 273,253.4
Profit for the year — 1,096.2 — 1,096.2 1,688.3 481.9 3,266.4
Other comprehensive incomeFair value changes of
equity instruments as financial assets at fair value through other comprehensive income — — (713.0) (713.0) — (298.1) (1,011.1)
Net fair value changes and other net movements of debt instruments as financial assets at fair value through other comprehensive income — — 1,032.3 1,032.3 — 736.3 1,768.6
Release of reserve upon disposal of debt instruments as financial assets at fair value through other comprehensive income — — (185.4) (185.4) — (121.2) (306.6)
Release of reserves upon disposal of subsidiaries — — 8.2 8.2 — (76.6) (68.4)
Release of reserves upon disposal of interests in joint ventures and associated companies — — (8.2) (8.2) — (5.7) (13.9)
Revaluation of investment properties upon reclassification from property, plant and equipment and right-of-use assets, net of taxation — — 8.1 8.1 — 1.4 9.5
Release of reserve upon disposal of equity instruments as financial assets at fair value through other comprehensive income — (666.1) 666.1 — — — —
Share of other comprehensive income of joint ventures and associated companies — (13.1) (1,037.6) (1,050.7) — (448.3) (1,499.0)
Remeasurement of post-employment benefit obligation — 19.5 — 19.5 — 12.5 32.0
Cash flow/fair value hedges — — (24.3) (24.3) — 171.6 147.3Amount reported in other
comprehensive income applying overlay approach adjustments on financial assets — — (126.7) (126.7) — (81.5) (208.2)
Translation differences — — (3,546.6) (3,546.6) — (290.7) (3,837.3)
Other comprehensive income for the year — (659.7) (3,927.1) (4,586.8) — (400.3) (4,987.1)
Total comprehensive income for the year — 436.5 (3,927.1) (3,490.6) 1,688.3 81.6 (1,720.7)

Annual Report 2020 175
Consolidated Statement of Changes in EquityFor the year ended 30 June 2020
Sharecapital
Retained profits
Other reserves
Shareholders’ funds
Perpetual capital
securities
Non-controlling
interests TotalHK$m HK$m HK$m HK$m HK$m HK$m HK$m
Transactions with ownersContributions by/(distributions to) owners
Dividends — (5,216.5) — (5,216.5) — (1,153.9) (6,370.4)Contributions from
non-controlling interests — — — — — 706.2 706.2Issue of new shares
upon exercise of share options 350.4 — — 350.4 — — 350.4Employees’ share-based payments — — 29.8 29.8 — — 29.8Share options lapsed — 177.9 (177.9) — — — —Issuance of perpetual capital securities — — — — 15,449.3 — 15,449.3Transaction costs in relation to the
issuance of perpetual capital securities — (110.8) — (110.8) — (8.7) (119.5)
Distribution to perpetual capital securities holders — — — — (1,551.1) — (1,551.1)
Repayment of capital to non-controlling interests — — — — — (103.3) (103.3)
Buyback of shares — (614.8) — (614.8) — — (614.8)Transfer of reserves — (94.7) 94.7 — — — —
350.4 (5,858.9) (53.4) (5,561.9) 13,898.2 (559.7) 7,776.6
Changes in ownership interests in subsidiariesAcquisition of subsidiaries — — — — — 340.4 340.4Acquisition of additional interest
in a subsidiary — — (0.9) (0.9) — 0.9 —Disposal of a subsidiary — 43.4 — 43.4 — 50.2 93.6Deemed disposal of interest
in a subsidiary — 1.1 — 1.1 — 0.7 1.8
— 44.5 (0.9) 43.6 — 392.2 435.8
Total transactions with owners 350.4 (5,814.4) (54.3) (5,518.3) 13,898.2 (167.5) 8,212.4
At 30 June 2020 78,225.7 129,519.8 5,277.8 213,023.3 37,092.0 29,629.8 279,745.1

New World Development Company Limited176
Consolidated Statement of Changes in EquityFor the year ended 30 June 2020
Sharecapital
Retained profits
Other reserves
Shareholders’ funds
Perpetual capital
securities
Non-controlling
interests TotalHK$m HK$m HK$m HK$m HK$m HK$m HK$m
As at 30 June 2018 77,525.9 123,585.9 15,138.1 216,249.9 9,451.8 29,480.2 255,181.9Adjustment on adoption of HKFRS 9 — 678.7 (545.6) 133.1 — 120.6 253.7
Restated balance as at 1 July 2018 77,525.9 124,264.6 14,592.5 216,383.0 9,451.8 29,600.8 255,435.6
Profit for the year — 18,160.1 — 18,160.1 803.0 2,676.0 21,639.1
Other comprehensive incomeFair value changes of equity
instruments as financial assets at fair value through other comprehensive income — — (26.7) (26.7) — (166.0) (192.7)
Release of reserve upon disposal of subsidiaries — — 0.1 0.1 — — 0.1
Release of reserve upon deregistration of subsidiaries — — (8.9) (8.9) — 20.7 11.8
Release of reserves upon disposal of interests in associated companies — — (34.4) (34.4) — (22.3) (56.7)
Revaluation of investment properties upon reclassification from property, plant and equipment and land use rights, net of taxation — — 31.7 31.7 — 10.3 42.0
Release of reserve upon disposal of equity instruments as financial assets at fair value through other comprehensive income — (405.3) 405.3 — — — —
Share of other comprehensive income of joint ventures and associated companies — (2.9) (660.6) (663.5) — (334.4) (997.9)
Remeasurement of post-employment benefit obligation — (5.1) — (5.1) — (3.2) (8.3)
Cash flow hedges — — (705.4) (705.4) — (213.8) (919.2)Translation differences — — (4,353.3) (4,353.3) — (677.0) (5,030.3)
Other comprehensive income for the year — (413.3) (5,352.2) (5,765.5) — (1,385.7) (7,151.2)
Total comprehensive income for the year — 17,746.8 (5,352.2) 12,394.6 803.0 1,290.3 14,487.9
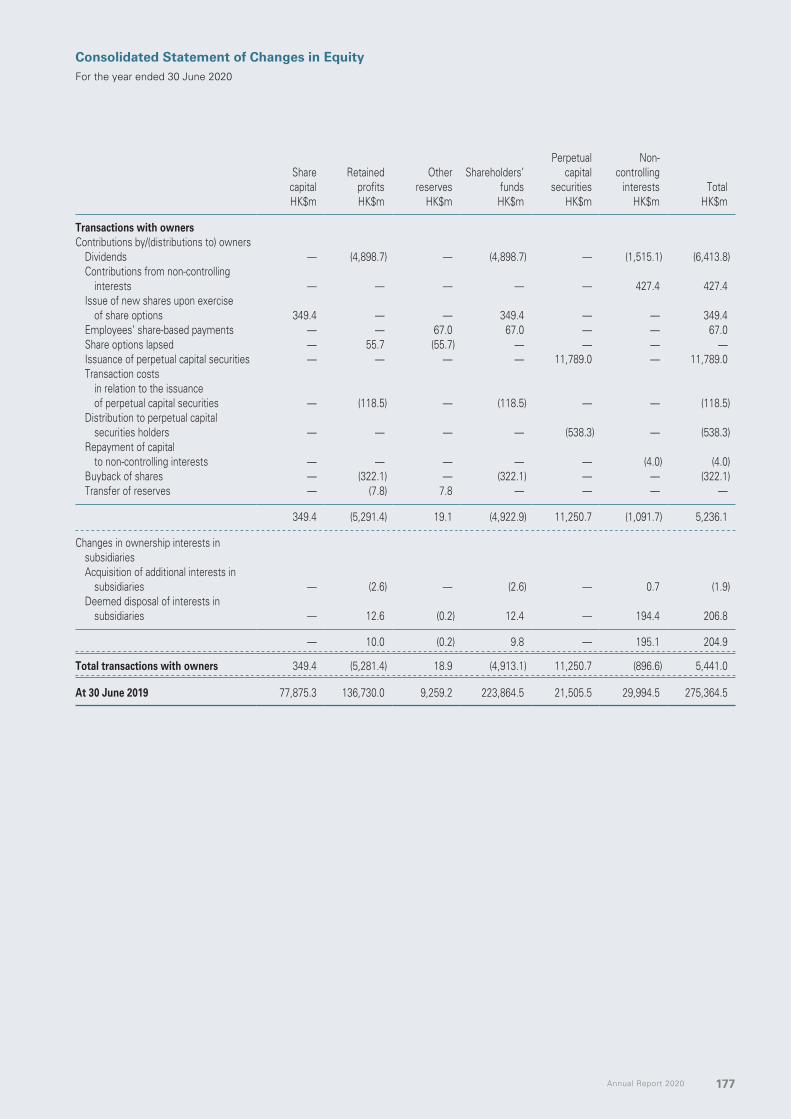
Annual Report 2020 177
Consolidated Statement of Changes in EquityFor the year ended 30 June 2020
Sharecapital
Retained profits
Other reserves
Shareholders’ funds
Perpetual capital
securities
Non-controlling
interests TotalHK$m HK$m HK$m HK$m HK$m HK$m HK$m
Transactions with ownersContributions by/(distributions to) owners
Dividends — (4,898.7) — (4,898.7) — (1,515.1) (6,413.8)Contributions from non-controlling
interests — — — — — 427.4 427.4Issue of new shares upon exercise
of share options 349.4 — — 349.4 — — 349.4Employees’ share-based payments — — 67.0 67.0 — — 67.0Share options lapsed — 55.7 (55.7) — — — —Issuance of perpetual capital securities — — — — 11,789.0 — 11,789.0Transaction costs
in relation to the issuance of perpetual capital securities — (118.5) — (118.5) — — (118.5)
Distribution to perpetual capital securities holders — — — — (538.3) — (538.3)
Repayment of capital to non-controlling interests — — — — — (4.0) (4.0)
Buyback of shares — (322.1) — (322.1) — — (322.1)Transfer of reserves — (7.8) 7.8 — — — —
349.4 (5,291.4) 19.1 (4,922.9) 11,250.7 (1,091.7) 5,236.1
Changes in ownership interests in subsidiariesAcquisition of additional interests in
subsidiaries — (2.6) — (2.6) — 0.7 (1.9)Deemed disposal of interests in
subsidiaries — 12.6 (0.2) 12.4 — 194.4 206.8
— 10.0 (0.2) 9.8 — 195.1 204.9
Total transactions with owners 349.4 (5,281.4) 18.9 (4,913.1) 11,250.7 (896.6) 5,441.0
At 30 June 2019 77,875.3 136,730.0 9,259.2 223,864.5 21,505.5 29,994.5 275,364.5

New World Development Company Limited
Consolidated Statement of Cash FlowsFor the year ended 30 June 2020
178
2020 2019Notes HK$m HK$m
Cash flows from operating activitiesNet cash generated from operations 51(a) 1,339.3 12,192.5Hong Kong profits tax paid (1,222.5) (657.9)Mainland China and overseas taxation paid (7,576.1) (4,523.8)
Net cash (used in)/from operating activities before net purchases of financial assets in relation to insurance business (7,459.3) 7,010.8
Purchases of financial assets in relation to insurance business (12,632.9) —Disposal of financial assets in relation to insurance business 9,802.5 —
Net purchase of financial assets in relation to insurance business (2,830.4) —
Net cash (used in)/from operating activities (10,289.7) 7,010.8
Cash flows from investing activitiesInterest received 2,784.3 1,614.5Dividends received from
Joint ventures 2,256.7 2,332.1Associated companies 348.8 490.0Financial assets at fair value through other comprehensive income
(“FVOCI”) and financial assets at fair value through profit or loss (“FVPL”) 243.8 121.4
Additions of investment properties, property, plant and equipment, intangible assets and intangible concession rights (16,795.9) (10,144.9)
Decrease/(increase) in interests in joint ventures and advances to joint ventures 1,178.8 (2,503.7)
Increase in interests in associated companies and advances to associated companies (396.4) (614.0)
Increase in short-term bank deposits maturing after more than three months (2,749.9) (545.8)
Deposit paid for acquisition of a subsidiary — (3,120.0)Acquisition of subsidiaries (net of cash and cash equivalents) 51(d) (10,611.7) (7,702.6)Purchase of financial assets at FVOCI and financial assets at FVPL (3,251.4) (3,723.4)Proceeds from disposal/partial disposal of
Associated companies 1,103.2 134.4Financial assets at FVOCI and financial assets at FVPL 2,711.1 2,469.6Investment properties, property, plant and equipment
and intangible concession rights 4,338.7 382.6Non-current assets classified as assets held for sale — 54.8Subsidiaries (net of cash and cash equivalents) 51(f) 1,822.2 1,599.3Increase in other non-current assets (56.7) —
Net cash used in investing activities (17,074.4) (19,155.7)

Annual Report 2020 179
Consolidated Statement of Cash FlowsFor the year ended 30 June 2020
2020 2019Notes HK$m HK$m
Cash flows from financing activitiesIssue of fixed rate bonds, net of transaction costs 14,361.2 8,974.2Redemption of fixed rate bonds and notes payable (10,337.8) —Drawdown of bank and other loans 69,826.3 31,644.4Repayment of bank and other loans and financing received
under a financial reinsurance arrangement (45,541.3) (27,033.7)Decrease in loans from non-controlling shareholders (281.3) (983.8)Principal elements of lease liabilities payments (874.7) —Increase in cash collateral received from counterparties 423.9 —(Increase)/decrease in restricted bank balances (141.9) 65.2Increase in interests in subsidiaries — (4.0)Issue of shares 350.4 349.4Contributions from non-controlling interests 706.2 427.4Interest paid (6,647.9) (5,348.4)Dividends paid to shareholders of the Company (5,216.5) (4,898.7)Dividends paid to non-controlling shareholders (1,153.9) (1,308.5)Repayment of capital to non-controlling interests (103.3) —Proceeds from issuance of perpetual capital securities,
net of transaction costs 15,329.8 11,670.5Distribution to holders of perpetual capital securities (1,551.1) (538.3)Buyback of shares (614.8) (322.1)
Net cash from financing activities 28,533.3 12,693.6
Net increase in cash and cash equivalents 1,169.2 548.7
Cash and cash equivalents at beginning of the year 62,389.6 62,597.3Translation differences (241.5) (756.4)
Cash and cash equivalents at end of the year 63,317.3 62,389.6
Analysis of cash and cash equivalentsCash at banks and on hand 36 36,628.4 36,759.8Cash and bank balances attributable to investments related to
unit-linked contracts 35 169.4 —Short-term bank deposits maturing within three months 36 26,519.5 25,575.9Cash and bank balances of a subsidiary reclassified as non-current assets
classified as assets held for sale — 53.9
63,317.3 62,389.6

New World Development Company Limited180
Notes to the Financial Statements
1 GENERAL INFORMATION
New World Development Company Limited (the “Company”) is a limited liability company incorporated in Hong Kong. The address of its registered office is 30/F, New World Tower, 16-18 Queen’s Road Central, Hong Kong. The shares of the Company are listed on the Main Board of The Stock Exchange of Hong Kong Limited (the “Stock Exchange”).
The Company and its subsidiaries (together the “Group”) are principally engaged in property development and investment, development of, investment in and/or operation of roads, commercial aircraft leasing, construction and insurance, and other businesses (including facilities management, transport, environment, logistic, department store, media and technology and other strategic businesses).
These consolidated financial statements have been approved by the Board of Directors on 30 September 2020.
2 BASIS OF PREPARATION
The consolidated financial statements have been prepared in accordance with Hong Kong Financial Reporting Standards (“HKFRS”) issued by the Hong Kong Institute of Certified Public Accountants (“HKICPA”). The consolidated financial statements have been prepared under the historical cost convention, as modified by the revaluation of investment properties, certain financial assets and financial liabilities (including financial assets at fair value through profit or loss, financial assets at fair value through other comprehensive income and derivative financial instruments), which have been measured at fair value.
The preparation of consolidated financial statements in conformity with HKFRS requires the use of certain critical accounting estimates. It also requires management to exercise its judgement in the process of applying the Group’s accounting policies. The areas involving a higher degree of judgement or complexity, or areas where assumptions and estimates are significant to the consolidated financial statements are disclosed in note 6 below.
(a) Adoption of new standard, amendments to standards and interpretationThe Group has adopted the following new standard, amendments to standards and interpretation which are relevant to the Group’s operations and are mandatory for the financial year ended 30 June 2020:
HKFRS 16 LeasesAmendments to HKFRS 9 Prepayment Features with Negative CompensationAmendments to HKAS 19 Plan Amendment, Curtailment or SettlementAmendments to HKAS 28 Long-term Interests in Associates and Joint VenturesHK (IFRIC) — Interpretation 23 Uncertainty over Income Tax TreatmentsHKFRS Amendments Annual Improvements to HKFRSs 2015-2017 Cycle
Except for the impact of adoption of HKFRS 16 “Leases” (“HKFRS 16”) and amendments to Hong Kong Accounting Standard 28 “Long term interests in associates and joint venture” (“Amendments to HKAS 28”), the adoption of other amendments to standards and interpretation above does not have significant effect on the results and financial position of the Group.
(b) Adoption of HKFRS 16 and amendments to HKAS 28HKFRS 16 and amendments to HKAS 28 as issued by the HKICPA is effective for the financial year beginning on or after 1 January 2019.
The Group has adopted HKFRS 16 and amendments to HKAS 28 retrospectively from 1 July 2019, but has not restated comparatives for the year ended 30 June 2019 as permitted under the specific transition provisions in the standards. The effects of the adoption are set out in note 4 below.
Annual Report 2020 181
Notes to the Financial Statements
2 BASIS OF PREPARATION (CONTINUED)
(c) Early adoption of amendments to standardsThe Group has early adopted Amendment to HKFRS 16 “COVID-19 Related Rent Concessions” from 1 July 2019. The amendment provides an optional practical expedient allowing lessees to elect not to assess whether a rent concession related to COVID-19 is a lease modification. Lessees adopting this election may account for qualifying rent concessions in the same way as they would if they were not lease modifications. The practical expedient only applies to rent concessions occurring as a direct consequence of the COVID-19 pandemic and only if all of the following conditions are met:
• the change in lease payments results in revised consideration for the lease that is substantially the same as, or less than, the consideration for the lease immediately preceding the change;
• any reduction in lease payments affects only payments due on or before 30 June 2021; and
• there is no substantive change to other terms and conditions of the lease.
The Group has applied this practical expedient to all qualifying COVID-19-related rent concessions. Rent concessions have been accounted for as negative variable lease payments and recognised in the consolidated income statement for the year ended 30 June 2020, with a corresponding adjustment to the lease liabilities. There is no impact on the opening balance of equity at 1 July 2019.
(d) New standards and amendments to standards which are not yet effectiveThe following new standards and amendments to standards are mandatory for accounting periods beginning on or after 1 July 2020 or later periods but which the Group has not early adopted:
HKFRS 17 Insurance ContractsAmendments to HKAS 1 Classification of Liabilities as Current or Non-CurrentAmendments to HKAS 1 and HKAS 8 Definition of MaterialAmendments to HKAS 16 Property, Plant and Equipment: Proceeds before Intended UseAmendments to HKAS 37 Onerous Contracts — Cost of Fulfilling a ContractAmendments to HKAS 39, HKFRS 7 and
HKFRS 9Hedge Accounting
Amendments to HKFRS 3 Definition of a BusinessAmendments to HKFRS 3 Reference to the Conceptual FrameworkAmendments to HKFRS 10 and HKAS 28 Sale or Contribution of Assets between an Investor and
its Associate or Joint VentureConceptual Framework for Financial
Reporting 2018Revised Conceptual Framework for Financial Reporting
HKFRS Amendments Annual Improvements to HKFRSs 2018-2020 Cycle
HKFRS 17 “Insurance Contracts” (“HKFRS 17”)HKFRS 17 will replace the current HKFRS 4, “Insurance Contracts”. HKFRS 17 includes some fundamental differences to current accounting in both insurance contract measurement and profit recognition. The general model is based on a discounted cash flow model with a risk adjustment and deferral of unearned profits. A separate approach applies to insurance contracts that are linked to returns on underlying items and meet certain requirements. Additionally, HKFRS 17 requires more granular information and a new presentation format for the statement of comprehensive income as well as extensive disclosures. The Group is yet to undertake a detailed assessment of the new standard. The standard is mandatorily effective for accounting periods beginning on or after 1 January 2021. International Accounting Standards Board has issued amendments to International Financial Reporting Standards 17 in June 2020 to defer the effective date to 1 January 2023, however, HKICPA has yet to adopt the amendments as of the date of approval of these consolidated financial statements.
The Group has already commenced an assessment of the impact of other new standards and amendments to standards, certain of which may be relevant to the Group’s operations and may give rise to changes in accounting policies, changes in disclosures and remeasurement of certain items in the consolidated financial statements.

New World Development Company Limited182
Notes to the Financial Statements
2 BASIS OF PREPARATION (CONTINUED)
(e) Hong Kong Companies Ordinance (Cap.622)The consolidated financial statements comply with the applicable requirements of Hong Kong Companies Ordinance (Cap. 622), with the exception of section 381 which requires a company to include all its subsidiary undertakings (within the meaning of Schedule 1 to Cap. 622) in the company’s annual consolidated financial statements. Section 381 is inconsistent with the requirements of HKFRS 10 “Consolidated Financial Statements” (“HKFRS 10”) so far as Section 381 applies to subsidiary undertakings which are not controlled by the Group in accordance with HKFRS 10. For this reason, under the provisions of section 380(6), the Company has departed from section 381 and has not treated such companies as subsidiaries but they are accounted for in accordance with the accounting policies in notes 3(a)(ii) and 3(a)(iii). Those excluded subsidiary undertakings of the Group are disclosed in notes 55 and 56.
3 PRINCIPAL ACCOUNTING POLICIES
The principal accounting policies adopted for the preparation of these consolidated financial statements, which have been consistently applied to all the years presented, unless otherwise stated, are set out in this note.
The Group has adopted new accounting policy upon the acquisition of insurance business during the year ended 30 June 2020. Details of the accounting policies are summarised in note 4(b).
(a) ConsolidationThe consolidated financial statements incorporate the financial statements of the Company and all its subsidiaries made up to 30 June.
(i) SubsidiariesA subsidiary is an entity (including a structured entity) over which the Group has control. The Group controls an entity when the Group is exposed to, or has rights to, variable returns from its involvement with the entity and has the ability to affect those returns through its power over the entity. Subsidiaries are consolidated from the date on which control is transferred to the Group. They are deconsolidated from the date that control ceases.
The acquisition method of accounting is used to account for business combinations by the Group. The consideration transferred for the acquisition of a subsidiary is the fair values of the assets transferred, the liabilities incurred to the former owners of the acquiree and the equity interests issued by the Group. The consideration transferred includes the fair value of any asset or liability resulting from a contingent consideration arrangement at the acquisition date. Acquisition-related costs are expensed as incurred. Identifiable assets acquired and liabilities and contingent liabilities assumed in a business combination are measured initially at their fair values at the acquisition date. There is a choice, on the basis of each acquisition to measure the non-controlling interest in the acquiree either at fair value or at the non-controlling interest’s proportionate share of the recognised amount of acquiree’s identifiable net assets. If the business combination is achieved in stages, the acquirer’s previously held equity interest in the acquiree is remeasured to fair value at the acquisition date through consolidated income statement.
The excess of the consideration transferred, the amount of any non-controlling interest in the acquiree and the fair value of any previous equity interest in the acquiree at the date of acquisition over the fair value of the Group’s share of the identifiable net assets acquired is recorded as goodwill. If this consideration is less than the fair value of the net assets of the subsidiary acquired in the case of a bargain purchase, the difference is recognised directly in the consolidated income statement.
Inter-company transactions, balances and unrealised gains on transactions between group companies are eliminated. Unrealised losses are also eliminated, unless the transaction provides evidence of an impairment of the transferred asset. Accounting policies of subsidiaries have been changed where necessary to ensure consistency with the policies adopted by the Group.

Annual Report 2020 183
Notes to the Financial Statements
3 PRINCIPAL ACCOUNTING POLICIES (CONTINUED)
(a) Consolidation (continued)(i) Subsidiaries (continued)
When the Group ceases to have control, any retained interest in the entity is remeasured to its fair value at the date when control is lost, with the change in carrying amount recognised in the consolidated income statement. The fair value is the carrying amount for the purposes of subsequently accounting for the retained interest as associated companies, joint ventures or financial assets. In addition, any amounts previously recognised in other comprehensive income in respect of that entity are accounted for as if the Group had directly disposed of the related assets or liabilities. It means the amounts previously recognised in other comprehensive income are reclassified to the consolidated income statement or transferred to another category of equity as specified/permitted by applicable HKFRSs.
The Company’s investments in subsidiaries are stated at cost less provision for impairment losses. The results of subsidiaries are accounted for by the Company on the basis of dividend received and receivable.
(ii) Joint arrangementsUnder HKFRS 11, investments in joint arrangements are classified as either joint ventures or joint operations depending on the contractual rights and obligations each investor.
(1) Joint venturesThe Group recognises its interests in joint ventures using equity method of accounting. Interests in joint ventures are stated in the consolidated financial statements at cost (including goodwill on acquisition) plus the share of post-acquisition results and movements in other comprehensive income less provision for impairment losses. Goodwill represents the excess of the cost of an acquisition over the fair value of the Group’s share of the net identifiable assets of the acquired joint ventures at the date of acquisition.
The Group’s interests in joint ventures include the loans and advances to the joint ventures which, in substance, form part of the Group’s net investments in the joint ventures. The loans and advances to the joint ventures are a form of commercial arrangement between the parties to the joint ventures to finance the development of projects and viewed as a mean by which the Group invests in the relevant projects. These loans and advances have no fixed repayment terms and will be repaid when the relevant joint venture has surplus cash flow. Please refer to note 3(i) for the impairment of loans and advances to joint ventures.
The share of post-acquisition results and other comprehensive income is based on the relevant profit sharing ratios which vary according to the nature of the joint ventures set out as follows:
(a) Equity joint ventures/joint ventures in wholly foreign owned enterprisesEquity joint ventures/joint ventures in wholly foreign owned enterprises are joint ventures in respect of which the capital contribution ratios of the venturers are defined in the joint venture contracts and the profit sharing ratios and share of net assets of the venturers are in proportion to the capital contribution ratios.
(b) Co-operative joint venturesCo-operative joint ventures are joint ventures in respect of which the profit sharing ratios of the venturers and share of net assets upon the expiration of the joint venture periods are not in proportion to their capital contribution ratios but are as defined in the joint venture contracts.

New World Development Company Limited184
Notes to the Financial Statements
3 PRINCIPAL ACCOUNTING POLICIES (CONTINUED)
(a) Consolidation (continued)(ii) Joint arrangements (continued)
(1) Joint ventures (continued)(c) Companies limited by shares
Companies limited by shares are limited liability companies in respect of which each shareholder’s beneficial interests therein is in accordance with the amount of the voting share capital held thereby.
When the Group’s share of losses in a joint venture equals or exceeds its interests in the joint venture (which includes any long-term interests that, in substance, form part of the Group’s net investments in the joint ventures), the Group does not recognise further losses, unless it has incurred obligations or made payments on behalf of the joint ventures.
The Group recognises the portion of gains or losses on the sale of assets by the Group to the joint venture that is attributable to the other venturers. The Group does not recognise its share of profits or losses from the joint venture that result from the purchase of assets from the joint venture until it resells the assets to an independent party. However, a loss on the transaction is recognised immediately if the loss provides evidence of a reduction in the net realisable value of current assets, or an impairment loss.
For equity accounting purpose, accounting policies of joint ventures have been changed where necessary to ensure consistency with the policies adopted by the Group.
The Company’s interests in joint ventures are stated at cost less provision for impairment losses. The results of joint ventures are accounted for by the Company on the basis of dividend received and receivable.
(2) Joint operationsThe assets that the Group has the rights and the liabilities that the Group has the obligations in relation to the joint operations are recognised in the consolidated statement of financial position on an accrual basis and classified according to the nature of the item. The share of expenses that the Group incurs and its share of income that it earns from the joint operations are included in the consolidated income statement.
(iii) Associated companiesAn associated company is a company other than a subsidiary and a joint venture, in which the Group has significant influence, but not control, exercised through representatives on the board of directors.
Interests in associated companies are accounted for by the equity method of accounting and are initially recognised at cost. The Group’s interests in associated companies include goodwill (net of any accumulated impairment loss) identified on acquisition. Goodwill represents the excess of the cost of an acquisition over the fair value of the Group’s share of the net identifiable assets of the acquired associated companies at the date of acquisition. The interests in associated companies also include long-term receivables that, in substance, form part of the Group’s net investments in the associated companies. Please refer to note 3(i) for the impairment of long-term receivables.
The Group’s share of its associated companies’ post acquisition profits or losses is recognised in the consolidated income statement, and the share of post-acquisition movements in other comprehensive income is recognised in the consolidated statement of comprehensive income. The cumulative post-acquisition movements are adjusted against the carrying amount of the investment. When the share of losses in an associated company equals or exceeds its interests in the associated company, including any other unsecured receivable, the Group does not recognise further losses, unless it has incurred legal and constructive obligations or made payments on behalf of the associated company.

Annual Report 2020 185
Notes to the Financial Statements
3 PRINCIPAL ACCOUNTING POLICIES (CONTINUED)
(a) Consolidation (continued)(iii) Associated companies (continued)
Unrealised gains on transactions between the Group and its associated companies are eliminated to the extent of the Group’s interests in the associated companies. Unrealised losses are also eliminated unless the transaction provides evidence of an impairment of the asset transferred. For equity accounting purpose, accounting policies of associated companies have been changed where necessary to ensure consistency with the policies adopted by the Group.
The Company’s interests in associated companies are stated at cost less provision for impairment losses. The results of associated companies are accounted for by the Company on the basis of dividend income received and receivable.
Gains or losses on deemed disposal on dilution arising from interests in associated companies are recognised in the consolidated income statement.
The cost of an associated company acquired in stages is measured as the sum of consideration paid for each purchase plus a share of investee’s profits and other equity movements.
The Group ceases to use the equity method from the date an investment ceases to be an associated company that is the date on which the Group ceases to have significant influence over the associated company or on the date it is classified as held for sale.
(iv) Transactions with non-controlling interestsNon-controlling interests is the equity in a subsidiary which is not attributable, directly or indirectly, to a parent. The Group treats transactions with non-controlling interests (namely, acquisitions of additional interests and disposals of partial interests in subsidiaries that do not result in a loss of control) as transactions with equity owners of the Group. For purchases of additional interests in subsidiaries from non-controlling shareholders, the difference between any consideration paid and the relevant share acquired of the carrying value of net assets of the subsidiary is recorded in equity. Gains or losses on disposals of partial interests to non-controlling shareholders are also recorded in equity.
(b) Intangible assets(i) Goodwill
Goodwill arising on acquisitions of subsidiaries is included in intangible assets. Goodwill arising on acquisitions of joint ventures and associated companies is included in interests in joint ventures and associated companies respectively and is tested for impairment as part of overall balance. Separately recognised goodwill is tested annually for impairment and carried at cost less accumulated impairment losses. Impairment losses on goodwill are not reversed. Gains or losses on the disposal of all or part of an entity include the carrying amount of goodwill relating to the entity sold.
Goodwill is allocated to cash-generating units for the purpose of testing for impairment. The allocation is made to those cash-generating units or groups of cash-generating units that are expected to benefit from the business combination in which the goodwill arose.
(ii) TrademarksSeparately acquired trademarks are initially recognised at initial cost. Trademarks acquired in a business combination are recognised at fair value at the date of acquisition. Trademarks have a finite useful life and are subsequently carried at cost less accumulated amortisation and impairment losses. Amortisation is calculated using the straight-line method to allocate the cost of trademarks over their estimated useful lives.

New World Development Company Limited186
Notes to the Financial Statements
3 PRINCIPAL ACCOUNTING POLICIES (CONTINUED)
(b) Intangible assets (continued)(iii) Operating right
Operating right primarily resulted from the acquisition of right to operate facilities rental and other businesses. Separately acquired operating rights are initially recognised at cost. Operating rights acquired in a business combination are initially recognised at fair value at the acquisition date. Operating right is carried at cost less accumulated amortisation and impairment. Amortisation is calculated using the straight-line method to allocate the cost over the period of the operating right.
(iv) Intangible concession rightsThe Group has entered into various service arrangements (“Service Concessions”) with local government authorities for its participation in the development, financing, operation and maintenance of infrastructural projects (the “Infrastructures”). The Group carries out the construction or upgrade work of Infrastructures from the granting authorities in exchange for the right to operate the Infrastructures concerned and the right to change users of the respective Infrastructures. The fees collected during the operating periods are attributable to the Group. The relevant Infrastructures are required to be returned to the local government authorities upon the expiry of the operating rights without significant compensation to the Group.
The Group applies the intangible asset model to account for the Infrastructures where they are paid by the users of the Infrastructures and the concession grantors (the respective local governments) have not provided any contractual guarantees in respect of the amounts of construction costs incurred to be recoverable. The consideration to be received during the construction or the upgrade period is classified as contract assets and reclassified as intangible concession rights upon completion.
Land use rights acquired in conjunction with the Service Concessions which the Group has no discretion or latitude to deploy for other services other than the use in the Service Concessions are treated as intangible assets acquired under the Service Concessions.
Amortisation of intangible concession rights is calculated to write off their costs, where applicable, on an economic usage basis for roads whereby the amount of amortisation is provided based on the ratio of actual volume compared to the total projected volume or on a straight-line basis for water treatment plants over the periods which the Group is granted the rights to operate these Infrastructures. The total projected volume of the respective Infrastructures is reviewed regularly with reference to both internal and external sources of information and appropriate adjustments will be made should there be a material change.
(v) Other intangible assetsOther intangible assets mainly represent computer software. Expenditure on development activities is capitalised if the product or process is technically and commercially feasible and the Group has sufficient resources and the intention to complete development. The expenditure capitalised includes the costs of materials, direct labour, and an appropriate proportion of overheads and borrowing costs, where applicable. Capitalised development costs are stated at cost less accumulated amortisation and impairment losses.
Amortisation of intangible assets with finite useful lives is charged to consolidated income statement on a straight-line basis over the assets’ estimated useful lives or 3 to 5 years, whichever is shorter.
(c) Non-current assets classified as assets held for saleNon-current assets are classified as assets held for sale when their carrying amount is to be recovered principally through a sale transaction rather than through continuing use and a sale is considered highly probable. They are measured at the lower of carrying amount and fair value less costs to sell if their carrying amount is to be recovered principally through a sale transaction rather than through continuing use. Investment properties classified as assets held for sale are stated at fair value at the end of reporting period.

Annual Report 2020 187
Notes to the Financial Statements
3 PRINCIPAL ACCOUNTING POLICIES (CONTINUED)
(d) Investment propertiesProperty that is held for long-term rental yields or for capital appreciation or both, and that is not occupied by the Group, is classified as investment property. Investment property also includes property that is being constructed or developed for future use as investment property.
Property held by the lessee as a right-of-use asset for long-term rental yields or for capital appreciation or both is classified as investment property.
Investment property is measured initially at its cost, including related transaction costs and where applicable borrowing costs. After initial recognition, investment property is carried at fair value. Fair value is determined by professional qualified valuers on an open market value basis at the end of each reporting period. Changes in fair value are recognised in the consolidated income statement.
Subsequent expenditure is included in the carrying amount of the asset only when it is probable that future economic benefits associated with the asset will flow to the Group and the cost of the asset can be measured reliably. All other repairs and maintenance costs are expensed in the consolidated income statement during the financial period in which they are incurred.
If an investment property becomes owner-occupied, it is reclassified as property, plant and equipment, and its fair value at the date of reclassification becomes its cost for accounting purposes.
Where an investment property undergoes a change in use, evidenced by commencement of development with a view to sale, the property is transferred to properties for/under development. The property’s deemed cost for subsequent accounting as properties for/under development is its fair value at the date of change in use.
If an owner-occupied property becomes an investment property because its use has changed, any difference resulting between the carrying amount and the fair value of this property at the date of transfer is recognised in equity as a revaluation of property, plant and equipment. However, if the fair value of the property at the date of transfer which results in a reversal of the previous impairment loss, the write-back is recognised in the consolidated income statement.
For a transfer from properties for/under development or property held for sale to investment properties that will be carried at fair value, any difference between the fair value of the property at that date and its previous carrying amount shall be recognised in the consolidated income statement. Transfers to investment properties shall be made when, and only when, there is a change in use. The inception of a lease to another party is generally an evidence of a change in use. A change in use has occurred is based on an assessment of all relevant facts and circumstances. The relevant facts include but not limited to the Group’s business plan, financial resources and legal requirements.
(e) Property, plant and equipmentProperty, plant and equipment are stated at historical cost less accumulated depreciation and impairment losses. Historical cost includes expenditure that is directly attributable to the acquisition of assets. Subsequent costs are included in the carrying amount of the assets or recognised as a separate asset, as appropriate, only when it is probable that future economic benefits associated with the asset will flow to the Group and the cost of the asset can be measured reliably. The carrying amount of the replaced part is derecognised. All other repair and maintenance costs are charged in the consolidated income statement during the financial period in which they are incurred. The carrying amount of an asset is written down immediately to its recoverable amount if the carrying value of an asset is greater than its estimated recoverable amount.

New World Development Company Limited188
Notes to the Financial Statements
3 PRINCIPAL ACCOUNTING POLICIES (CONTINUED)
(e) Property, plant and equipment (continued)(i) Assets under construction
All direct costs relating to the construction of property, plant and equipment, including borrowing costs during the construction period are capitalised as the costs of the assets.
(ii) DepreciationNo depreciation is provided on assets under construction until such time when the relevant assets are completed and available for intended use. No depreciation is provided on land.
Until 30 June 2019, leasehold land classified as finance lease commenced amortisation from the time when the land interest became available for its intended use. Amortisation on leasehold land classified as finance lease was calculated using the straight-line method to allocate their cost to their residual values over the shorter of remaining lease term of 10 to over 50 years or their estimated useful lives.
Depreciation on other assets is calculated using the straight-line method to allocate their cost to their residual values over their estimated useful lives as follows:
Buildings 20 to 40 yearsOther assets 2 to 25 years
The residual values and useful lives of the assets are reviewed, and adjusted if appropriate, at the end of each reporting period.
(iii) Gain or loss on disposalThe gain or loss on disposal of property, plant and equipment is determined by comparing the difference between the net sales proceeds and the carrying amount of the relevant asset, and is recognised in the consolidated income statement.
(f) Impairment of investments in subsidiaries, joint ventures, associated companies and non-financial assetsNon-financial assets that have an indefinite useful life, for example goodwill, or have not yet been available for use are not subject to amortisation and are tested annually for impairment. Other assets are reviewed for impairment whenever events or changes in circumstances indicate that the carrying amount may not be recoverable. The carrying amount of an asset is written down immediately to its recoverable amount if the carrying amount of the asset is greater than its estimated recoverable amount. An impairment loss is recognised in the consolidated income statement for the amount by which the carrying amount of an asset exceeds its recoverable amount. The recoverable amount is the higher of its fair value less costs of disposal and value in use. For the purpose of assessing impairment, assets are grouped as cash-generating units for which there are separately identifiable cash flows. Non-financial assets other than goodwill that suffered an impairment are reviewed for possible reversal of the impairment at the end of each reporting period.
Impairment testing of the interests in subsidiaries, joint ventures or associated companies is required upon receiving dividends from these interests if the dividend exceeds the total comprehensive income of the subsidiaries, joint ventures or associated companies in the period the dividend is declared or if the carrying amount of the interest in the separate financial statements exceeds the carrying amount in the consolidated financial statements of the investee’s net assets including goodwill.
Annual Report 2020 189
Notes to the Financial Statements
3 PRINCIPAL ACCOUNTING POLICIES (CONTINUED)
(g) Investments and other financial assets(i) Classification
The Group classifies its financial assets in the following measurement categories:
(a) those to be measured subsequently at fair value (either through other comprehensive income (“OCI”), or through profit or loss); and
(b) those to be measured at amortised cost.
The classification depends on the entity’s business model for managing the financial assets and the contractual terms of the cash flows.
For assets measured at fair value, gains and losses will either be recorded in the consolidated income statement or OCI. For investments in debt instruments, this will depend on the business model in which the investment is held. For investments in equity instruments that are not held for trading, this will depend on whether the Group has made an irrevocable election at the time of initial recognition to account for the equity instrument at fair value through OCI.
The Group reclassifies debt instruments when and only when its business model for managing those assets changes.
(ii) Recognition and derecognitionRegular way purchases and sales of financial assets are recognised on trade-date, the date on which the Group commits to purchase or sell the asset. Financial assets are derecognised when the rights to receive cash flows from the financial assets have expired or have been transferred and the Group has transferred substantially all the risks and rewards of ownership.
(iii) MeasurementExcept for trade debtors that do not have a significant financing component, at initial recognition, the Group measures a financial asset at its fair value plus, in the case of a financial asset not at fair value through profit or loss, transaction costs that are directly attributable to the acquisition of the financial asset. Transaction costs of financial assets carried at fair value through profit or loss are expensed in the consolidated income statement.
Financial assets with embedded derivatives are considered in their entirety when determining whether their cash flows are solely payment of principal and interest.
Debt instrumentsSubsequent measurement of debt instruments depends on the Group’s business model for managing the asset and the cash flow characteristics of the asset. There are three measurement categories into which the Group classifies its debt instruments:
(a) Amortised costAssets that are held for collection of contractual cash flows where those cash flows represent solely payments of principal and interest are measured at amortised cost. A gain or loss on a debt instrument that is subsequently measured at amortised cost and is not part of a hedging relationship is recognised in the consolidated income statement when the asset is derecognised or impaired. Interest income from these financial assets is recognised in the consolidated income statement using the effective interest method.
(b) Financial assets at FVOCIAssets that are held for collection of contractual cash flows and for selling the financial assets, where the assets’ cash flows represent solely payments of principal and interest, are measured at FVOCI. Movements in the carrying amount are taken through OCI, except for the recognition of impairment gains or losses, interest revenue and foreign exchange gains and losses which are recognised in the consolidated income statement. When the financial asset is derecognised, the cumulative gain or loss previously recognised in OCI is reclassified from equity to the consolidated income statement. Interest income from these financial assets is recognised in the consolidated income statement using the effective interest method.

New World Development Company Limited190
Notes to the Financial Statements
3 PRINCIPAL ACCOUNTING POLICIES (CONTINUED)
(g) Investments and other financial assets (continued)(iii) Measurement (continued)
(c) Financial assets at FVPLAssets that do not meet the criteria for amortised cost or FVOCI are measured at FVPL. A gain or loss on a debt instrument that is subsequently measured at FVPL and is not part of a hedging relationship is recognised in the consolidated income statement and presented in the period in which it arises.
Equity instrumentsThe Group subsequently measures all equity instruments at fair value. Where the Group’s management has elected to present fair value gains and losses on equity instruments in other comprehensive income, there is no subsequent reclassification of fair value gains and losses to the consolidated income statement following the derecognition of the investments. Dividends from such investments continue to be recognised in the consolidated income statement as other income when the Group’s right to receive payments is established.
Changes in the fair value of financial assets at FVPL are recognised in the consolidated income statement. Impairment losses (and reversal of impairment losses) on equity instruments measured at FVOCI are not reported separately from other changes in fair value.
(h) Derivative financial instruments and hedging activitiesA derivative is initially recognised at fair value on the date a derivative contract is entered into and is subsequently remeasured at its fair value at the end of each reporting period. The accounting for subsequent changes in fair value depends on whether the derivative is designated as a hedging instrument, and if so, the nature of the item being hedged. The Group designates certain derivatives as hedges of a particular risk associated with the cash flows of recognised assets and liabilities and highly probable forecast transactions (cash flow hedges) or the changes in fair value of recognised assets or liabilities (fair value hedges).
At the inception of the hedging, the Group documents the economic relationship between hedging instruments and hedged items, including whether changes in the cash flows of the hedging instruments are expected to offset changes in the cash flows of hedges items. The Group documents its risk management objective and strategy for undertaking its hedge transactions.
The fair values of derivative financial instruments designated in hedge relationships are disclosed in note 27. The full fair value of a hedging derivative is classified as a non-current asset or liability when the remaining maturity of the hedged item is more than 12 months; it is classified as a current asset or liability when the remaining maturity of the hedged item is less than 12 months. Trading derivatives are classified as a current asset or liability.
Cash flow hedge that quantity for hedge accountingThe effective portion of changes in the fair value of derivatives that are designated and qualify as cash flow hedges is recognised in the other reserves within equity. The gain or loss relating to the ineffective portion is recognised immediately in the consolidated income statement.
Amounts accumulated in equity are transferred to the consolidated income statement in the periods when the hedged item affects profit or loss. The gain or loss relating to the effective portion of the hedging instrument is recognised in the consolidated income statement at the same time as the expense on the hedged items.
When a hedging instrument expires, or is sold or terminated, or when a hedge no longer meets the criteria for hedge accounting, any cumulative deferred gain or loss in equity at that time remains in equity until the forecast transaction occurs. When the forecast transaction is no longer expected to occur, the cumulative gain or loss that were reported in equity are immediately reclassified to the consolidated income statement.
Annual Report 2020 191
Notes to the Financial Statements
3 PRINCIPAL ACCOUNTING POLICIES (CONTINUED)
(h) Derivative financial instruments and hedging activities (continued)Cash flow hedge that quantity for hedge accounting (continued)Hedge effectiveness is determined at the inception of the hedge relationship, and through periodic prospective effectiveness assessments to ensure that an economic relationship exists between the hedged item and hedging instrument.
The Group enters into hedge relationships where the critical terms of the hedging instrument match exactly with the terms of the hedged item. The Group therefore performs a qualitative assessment of effectiveness. If changes in circumstances affect the terms of the hedged item such that the critical terms no longer match exactly with the critical terms of the hedging instrument, the Group uses the hypothetical derivative method to assess effectiveness.
Hedge ineffectiveness may occur due to:
• the credit/debit value adjustment on the hedging instrument which is not matched by the hedged item; and
• differences in critical terms between the hedged item and hedging instrument.
Fair value hedgesChange in the fair value on hedging instrument is recognised in OCI when the hedged item is an equity instrument for which the Group has elected to present changes in fair value in OCI.
Derivatives that do not qualify for hedge accountingCertain derivative instruments do not qualify for hedge accounting. Changes in the fair value of any derivative instruments that do not qualify for hedge accounting are recognised immediately in the consolidated income statement.
(i) Impairment/loss allowance of financial assetsThe Group has the following types of financial assets subject to expected credit loss (“ECL”) model:
• trade debtors and contract assets;
• amounts due from associated companies, amounts due from joint ventures and amounts due from non-controlling shareholders; and
• other debt instruments carried at amortised cost and at FVOCI.
The impairment methodology applied depends on whether there has been a significant increase in credit risk. Note 5(b) details how the Group determines whether there has been a significant increase in credit risk.
(i) Trade debtors and contract assetsThe Group applies the simplified approach to providing for ECLs, which requires the use of the lifetime expected loss provision.
(ii) Amounts due from associated companies, amounts due from joint ventures and amounts due from non-controlling shareholdersImpairment on financial assistance provided to associated companies, joint ventures and non-controlling shareholders is measured as either 12-month ECLs or lifetime ECLs, depending on whether there has been a significant increase in credit risk since initial recognition. If a significant increase in credit risk of a receivable has occurred since initial recognition, then loss allowance is measured as lifetime ECLs.
(iii) Other debt instruments carried at amortised cost and at FVOCIDebt instruments at amortised cost and at FVOCI are considered to be low risk, and thus the impairment provision is determined as 12 months ECLs using general ECL model.
(j) Properties for/under developmentProperties for/under development comprise leasehold land and land use rights, development expenditure and borrowing costs capitalised, and are carried at the lower of cost and net realisable value. Net realisable value takes into account the proceeds ultimately expected to be realised, less applicable variable selling expenses and the anticipated costs to complete. Upon completion, the properties are transferred to properties held for sale. Properties under development included in the current assets are expected to be realised in, or is intended for sale in the Group’s normal operating cycle.
New World Development Company Limited192
Notes to the Financial Statements
3 PRINCIPAL ACCOUNTING POLICIES (CONTINUED)
(k) Properties held for saleProperties held for sale are initially measured at the carrying amount of the property at the date of reclassification from properties under development. Subsequently, properties held for sale are carried at the lower of cost and net realisable value. Net realisable value is determined by reference to management estimates based on prevailing market conditions.
(l) InventoriesInventories are stated at the lower of cost and net realisable value. Cost is calculated on the weighted average basis. Net realisable value is determined on the basis of anticipated sales proceeds less estimated selling expenses.
(m) Trade and other debtorsTrade and other debtors are amounts due from customers for merchandise sold or services performed in the ordinary course of business. If collection of trade and other debtors is expected in one year or less (or in the normal operating cycle of the business if longer), they are classified as current assets. If not, they are presented as non-current assets.
Trade and other debtors are recognised initially at fair value and subsequently measured at amortised cost using the effective interest method, less provision for impairment. Details of impairment of trade debtors is disclosed in note 3(i).
(n) Contract assets and contract liabilitiesUpon entering into a contract with a customer, the Group obtains rights to receive consideration from the customer and assumes performance obligations to transfer goods or provide services to the customer.
The combination of those rights and performance obligations gives rise to a net contract asset or a net contract liability depending on the relationship between the remaining rights and the performance obligations. The contract is an asset and recognised as contract assets if the cumulative revenue recognised in the consolidated income statement exceeds cumulative payments made by customers. Conversely, the contract is a liability and recognised as contract liabilities if the cumulative payments made by customers exceeds the revenue recognised in the consolidated income statement.
Contract assets are assessed for impairment under the same approach adopted for impairment assessment of financial assets carried at amortised cost. Contract liabilities are recognised as revenue when the Group transfers the goods or services to the customers and therefore satisfies its performance obligation.
The incremental costs of obtaining a contract with a customer are capitalised and presented as contract related assets, if the Group expects to recover those costs, and are subsequently amortised on a systematic basis that is consistent with the transfer to the customers of the goods or services to which the assets relate. The Group recognises an impairment loss in the consolidated income statement to the extent that the carrying amount of the contract related assets recognised exceeds the remaining amounts of consideration that the Group expects to receive less the costs that directly relate to those goods or services and have not been recognised as expenses. Details of impairment of contract assets are disclosed in note 3(i).
(o) Cash and cash equivalentsIn the consolidated statement of cash flows, cash and cash equivalents include cash in hand, deposits held at call with banks, other short-term highly liquid investments with original maturities of three months or less and bank overdrafts. Bank overdrafts are shown within borrowings under current liabilities in the consolidated statement of financial position.
(p) Share capitalOrdinary shares are classified as equity.
Incremental costs directly attributable to the issue of new shares or options are shown in equity as a deduction, net of tax, from the proceeds.
(q) Perpetual capital securitiesPerpetual capital securities with no contractual obligation to repay its principal or to pay any distribution are classified as part of equity.

Annual Report 2020 193
Notes to the Financial Statements
3 PRINCIPAL ACCOUNTING POLICIES (CONTINUED)
(r) Trade and other payablesTrade and other payables are obligations to pay for goods or services that have been acquired in the ordinary course of business from suppliers. Trade and other payables are classified as current liabilities if payment is due within one year or less (or in the normal operating cycle of the business if longer). If not, they are presented as non-current liabilities.
Trade and other payables are recognised initially at fair value and subsequently measured at amortised cost using the effective interest method.
(s) ProvisionsProvisions are recognised when the Group has a present legal or constructive obligation as a result of past events; it is probable that an outflow of resources will be required to settle the obligation; and the amount has been reliably estimated.
Where there are a number of similar obligations, the likelihood that an outflow will be required in settlement is determined by considering the class of obligations as a whole. A provision is recognised even if the likelihood of an outflow with respect to any one item included in the same class of obligations may be small.
Provisions are measured at the present value of the expenditures expected to be required to settle the obligation using a pre-tax rate that reflects current market assessments of the time value of money and the risks specific to the obligation. The increase in the provision due to passage of time is recognised as interest expense.
(t) Contingent liabilities and contingent assetsA contingent liability is a possible obligation that arises from past events and whose existence will only be confirmed by the occurrence or non-occurrence of one or more uncertain future events not wholly within the control of the Group. It can also be a present obligation arising from past events that is not recognised because it is not probable that outflow of economic resources will be required or the amount of obligation cannot be measured reliably.
A contingent liability, other than that assumed in a business combination, is not recognised but is disclosed in the notes to the consolidated financial statements. When a change in the probability of an outflow occurs so that outflow is probable, it will then be recognised as a provision.
A contingent asset is a possible asset that arises from past events and whose existence will be confirmed only by the occurrence or non-occurrence of one or more uncertain events not wholly within the control of the Group.
A contingent asset is not recognised but is disclosed in the notes to the consolidated financial statements when an inflow of economic benefits is probable. When inflow is virtually certain, an asset is recognised.
(u) Current and deferred income taxThe income tax expense or credit for the period is the tax payable on the current period’s taxable income based on the applicable income tax rate for each jurisdiction adjusted by changes in deferred tax assets and liabilities attributable to temporary differences and to unused tax losses.
The current income tax charge is calculated on the basis of the tax laws enacted or substantively enacted at the end of the reporting period in the countries where the Group, joint ventures and associated companies operate and generate taxable income. Management periodically evaluates positions taken in tax returns with respect to situations in which applicable tax regulation is subject to interpretation and establishes provisions where appropriate on the basis of amounts expected to be paid to the tax authorities.
Deferred income tax is provided in full, using the liability method, on temporary differences arising between the tax bases of assets and liabilities and their carrying amounts in the consolidated financial statements. However, the deferred tax liabilities are not recognised if they arise from the initial recognition of goodwill. Deferred income tax is also not accounted for if it arises from initial recognition of an asset or liability in a transaction other than a business combination that at the time of transaction affects neither accounting nor taxable profit or loss. Deferred income tax is determined using tax rates and laws that have been enacted or substantively enacted by the end of the reporting period and are expected to apply when the related deferred income tax asset is realised or the deferred income tax liability is settled.

New World Development Company Limited194
Notes to the Financial Statements
3 PRINCIPAL ACCOUNTING POLICIES (CONTINUED)
(u) Current and deferred income tax (continued)The deferred tax liability in relation to investment property that is measured at fair value is determined assuming the property will be recovered entirely through sale.
Deferred income tax assets are recognised to the extent that it is probable that future taxable profit will be available against which the temporary differences can be utilised.
Deferred income tax is provided on temporary differences arising on investments in subsidiaries, joint ventures and associated companies, except where the timing of the reversal of the temporary difference can be controlled and it is probable that the temporary difference will not reverse in the foreseeable future.
Deferred income tax assets and liabilities are offset when there is a legally enforceable right to offset current tax assets and liabilities and when the deferred tax balances relate to the same taxation authority. Current tax assets and tax liabilities are offset where the entity has a legally enforceable right to offset and intends either to settle on a net basis, or to realise the asset and settle the liability simultaneously.
Current and deferred tax is recognised in consolidated income statement, except to the extent that it relates to items recognised in other comprehensive income or directly in equity. In this case, the tax is also recognised in other comprehensive income or directly in equity, respectively.
(v) BorrowingsBorrowings are recognised initially at fair value, net of transaction costs incurred. Borrowings are subsequently stated at amortised cost; any difference between the proceeds (net of transaction costs) and the redemption value is recognised in the consolidated income statement or capitalised on the basis set out in note 3(y) over the period of the borrowings using the effective interest method where appropriate.
Borrowings are classified as current liabilities unless the Group has an unconditional right to defer settlement of the liability for at least 12 months after the end of the reporting period.
(w) Revenue recognitionRevenue comprises the fair value of the consideration received or receivable for the sale of goods and services rendered in the ordinary course of the Group’s activities. Revenue is shown net of value-added tax, returns, rebates and discounts, allowances for credit and other revenue reducing factors after eliminating sales within the Group.
Revenue is recognised when it is probable that future economic benefits will flow to the Group and specific criteria for each of the activities have been met. Estimates are based on historical results, taking into consideration the type of customers, the type of transactions and the specifics of each arrangement.
(i) Rental incomeRental income is recognised in the consolidated income statement on a straight-line basis over the lease term.
(ii) Property salesRevenue is recognised when or as the control of the asset is transferred to the customer. Depending on the terms of the contract and the laws that apply to the contract, control of the asset may be transferred over time or at a point in time. If properties have no alternative use to the Group contractually and the Group has an enforceable right to payment from the customers for performance completed to date, the Group satisfies the performance obligation over time and therefore, recognises revenue over time in accordance with the input method for measuring progress. Otherwise, revenue is recognised at a point in time when the customer obtains control of the completed property.
The progress towards complete satisfaction of the performance obligation is measured based on the Group’s efforts or inputs to the satisfaction of the performance obligation, by reference to the contract costs incurred up to the end of reporting period as a percentage of total estimated costs for each contract.
For property development and sales contract for which the control of the property is transferred at a point in time, revenue is recognised when the customer obtains the physical possession or the legal title of the completed property and the Group has present right to payment and the collection of the consideration is probable.
In determining the transaction price, the Group adjusts the promised amount of consideration for the effect of a financing component if it is significant.

Annual Report 2020 195
Notes to the Financial Statements
3 PRINCIPAL ACCOUNTING POLICIES (CONTINUED)
(w) Revenue recognition (continued)(iii) Construction revenue
Revenue from construction service contract is recognised over the period of the contract by reference to the progress towards complete satisfaction of that performance obligation using input method.
(iv) Toll revenueToll revenue from road operations is recognised at a point in time when services are rendered.
(v) Service fee incomeProperty and facilities management service fees and property letting agency fee are recognised over time and at a point in time respectively when services are rendered.
(vi) Sales of goodsIncome from sales of goods is recognised at a point in time when the goods are delivered to customers and title has passed.
(vii) Fare revenueFare revenue from bus and ferry services is recognised at a point in time when the services are rendered.
(viii) Advertising incomeAdvertising income is recognised over time when the advertisement or commercial appears before the public.
(ix) Hotel operationsRevenue from hotel and restaurant operations is recognised upon provision of the services.
(x) Department store operationsRevenue from sale of goods to retail customers is recognised when the Group sells the product to the customers and the revenue from sale of goods to wholesalers is recognised when control of the products has transferred, being when the products are delivered to the wholesaler. The Group recognises commission income from concessionaire sales upon sale of goods or provision of services by counter suppliers. Payments received in advance that are related to sales of goods or provision of services not yet delivered to customers are deferred and recognised as contract liabilities. Revenue is recognised when goods or services are delivered to customers.
Marketing or promotional offer made to customers at the time of the sale of goods is a separate performance obligation, and the likelihood of settlement of the outstanding performance obligation must be estimated and allocated to the consideration received.
(xi) Interest incomeInterest income is calculated by applying the effective interest rate to the gross carrying amount of a financial asset except for financial assets that subsequently become credit-impaired. For credit-impaired financial assets, the effective interest rate is applied to the net carrying amount of the financial asset (after deduction of the loss allowance).
(xii) Dividend incomeDividend income is recognised when the right to receive payment is established.
(xiii) Revenue related to insurance businessAccounting policies of revenue recognition in relation to insurance business are set out in note 4(b)(viii) and 4(b)(ix).

New World Development Company Limited196
Notes to the Financial Statements
3 PRINCIPAL ACCOUNTING POLICIES (CONTINUED)
(x) LeasesAccounting policies applied from 1 July 2019Assets and liabilities arising from a lease are initially measured on a present value basis. Lease liabilities include the net present value of the following lease payments:
• fixed payments (including in-substance fixed payments), less any lease incentives receivable;
• variable lease payments that are based on an index or a rate;
• amounts expected to be payable by the lessee under residual value guarantees;
• the exercise price of a purchase option if the lessee is reasonably certain to exercise that option; and
• payments of penalties for terminating the lease, if the lease term reflects the lessee exercising that option.
The lease payments are discounted using the interest rate implicit in the lease, if that rate can be determined, or the lessee’s incremental borrowing rate.
Right-of-use assets are measured at cost comprising the following:
• the amount of the initial measurement of lease liability;
• any lease payments made at or before the commencement date less any lease incentives received;
• any initial direct costs; and
• restoration costs.
Payments associated with short-term leases and leases of low-value assets are recognised on a straight-line basis as an expense in the consolidated income statement. Short-term leases are leases with a lease term of 12 months or less.
Extension and termination options are included in a number of property and equipment leases across the Group. These terms are used to maximise operational flexibility in terms of managing contracts. The majority of extension and termination options held are exercisable only by the Group and not by the respective lessors.
Accounting policies applied before 1 July 2019(i) Finance leases
Leases that transfer to the Group, as lessee, substantially all the risks and rewards of ownership of assets were classified as finance leases. Finance leases were capitalised at the lease’s inception at the fair value of the leased assets or, if lower, the present value of minimum lease payments. Each lease payment was allocated between the liability and finance cost so as to achieve a constant rate on the finance balance outstanding. The corresponding rental obligations, net of finance charges, were included in liabilities, as creditors, accrued charges and contract liabilities. The finance charges were charged to the consolidated income statement over the lease period so as to produce a constant periodic rate of interest on the remaining balance of the liability for each period.
Assets held under finance leases were depreciated on the basis described in note 3(e)(ii) above.
(ii) Operating leasesLeases in which a significant portion of the risks and rewards of ownership were not transferred to the Group as lessee were classified as operating leases. Payments made under operating leases (net of any incentives received from the lessor) were charged to the consolidated income statement on a straight-line basis over the period of the lease.

Annual Report 2020 197
Notes to the Financial Statements
3 PRINCIPAL ACCOUNTING POLICIES (CONTINUED)
(y) Borrowing costBorrowing costs incurred for the construction of any qualifying assets are capitalised during the period of time that is required to complete and prepare the asset for its intended use. Other borrowing costs are expensed as incurred.
Borrowing costs include interest expense, finance charges in respect of finance lease and exchange differences arising from foreign currency borrowings to the extent that they are regarded as an adjustment to interest costs. The exchange gains and losses that are an adjustment to interest costs include the interest rate differential between borrowing costs that would be incurred if the entity had borrowed funds in its functional currency, and the borrowing costs actually incurred on foreign currency borrowings. Such amounts are estimated based on forward currency rates at the inception of the borrowings.
When the construction of the qualifying assets takes more than one accounting period, the amount of foreign exchange differences eligible for capitalisation is determined on a cumulative basis based on the cumulative amounts of interest expenses that would have been incurred had the entity borrowed in its functional currency. The total amount of foreign exchange differences capitalised cannot exceed the amount of total net foreign exchange differences incurred on a cumulative basis at the end of the reporting period.
(z) Employee benefits(i) Employee leave entitlements
Employee entitlements to annual leave are recognised when they accrue to employees. A provision is made for the estimated liability for annual leave as a result of services rendered by employees up to the end of the reporting period. Employee entitlements to sick leave and maternity leave are not recognised until the time of leave.
(ii) Bonus plansProvision for bonus plans are recognised when the Group has a present legal or constructive obligation as a result of services rendered by employees and a reliable estimate of the obligation can be made.
(iii) Defined contribution plansA defined contribution plan is a pension plan under which the Group pays contributions into a separate entity. The Group has no legal or constructive obligations to pay further contributions if the fund does not hold sufficient assets to pay all employees the benefits relating to employee service in the current and prior periods. Contributions to defined contribution plans, including the Mandatory Provident Fund Scheme and employee pension schemes established by municipal government in The People’s Republic of China (“PRC”) are expensed as incurred. Contributions are reduced by contributions forfeited by those employees who leave the schemes prior to vesting fully in the contributions, where applicable.
(iv) Defined benefit plansDefined benefit plans define an amount of pension benefit that an employee will receive on retirement, usually dependent on one or more factors such as age, years of service and compensation.
The liability recognised in the consolidated statement of financial position in respect of defined benefit pension plans is the present value of the defined benefit obligation at the end of the reporting period less the fair value of plan assets. The defined benefit obligation is calculated annually by independent actuaries using the projected unit credit method. The present value of the defined benefit obligation is determined by discounting the estimated future cash outflows using interest rates of high-quality corporate bonds that are denominated in the currency in which the benefits will be paid, and that have terms to maturity approximating to the terms of the related pension obligation. In countries where there is no deep market in such bonds, the market rates on government bonds are used.
Actuarial gains and losses arising from experience adjustments and changes in actuarial assumptions are charged or credited to equity in other comprehensive income in the period in which they arise. Past-service costs are recognised immediately in the consolidated income statement.

New World Development Company Limited198
Notes to the Financial Statements
3 PRINCIPAL ACCOUNTING POLICIES (CONTINUED)
(z) Employee benefits (continued)(v) Share-based compensation
The Group operates a number of equity-settled, share-based compensation plans. The fair value of the employee services received in exchange for the grant of share options is recognised as an expense. The total amount to be expensed over the vesting period is determined by reference to the fair value of the options granted at the date of grant, excluding the impact of any non-market vesting conditions. At the end of each reporting period, the Group revises its estimates of the number of options that are expected to vest. It recognises the impact of the revision of original estimates, if any, in the consolidated income statement, with a corresponding adjustment to equity.
The proceeds received net of any directly attributable transaction costs are credited to share capital (nominal value) when the options are exercised.
On lapse of share options according to the plan, corresponding amount recognised in employees’ share-based compensation reserve is transferred to retained profits.
The grant by the Company of options over its equity instruments to the employees of subsidiary undertakings in the Group is treated as a capital contribution. The fair value of employee services received, measured by reference to the grant date fair value, is recognised over the vesting period as an increase to investment in subsidiary undertakings, with a corresponding credit to equity in the parent entity accounts.
(aa) Foreign currencies(i) Functional and presentation currency
Items included in the financial statements of each of the Group’s entities are measured using the currency of the primary economic environment in which the entity operates (the “functional currency”). The consolidated financial statements are presented in Hong Kong dollar, which is the Company’s functional and presentation currency.
(ii) Transactions and balancesForeign currency transactions are translated into the functional currency using the exchange rates at the dates of the transactions. Foreign exchange gains and losses resulting from the settlement of such transactions and from the translation of monetary assets and liabilities denominated in foreign currencies at the exchange rates ruling at the end of the reporting period are recognised in the consolidated income statement.
Non-monetary items that are measured at fair value in a foreign currency are translated using the exchange rates at the date when the fair value was determined. Translation differences on assets and liabilities carried at fair value are reported as part of fair value gain or loss. For example, translation differences on non-monetary assets and liabilities such as equities held at fair value through profit or loss are recognised in the consolidated income statement as part of the fair value gain or loss and translation differences on non-monetary assets such as equities classified as fair value through other comprehensive income are recognised in the consolidated statement of comprehensive income.

Annual Report 2020 199
Notes to the Financial Statements
3 PRINCIPAL ACCOUNTING POLICIES (CONTINUED)
(aa) Foreign currencies (continued)(iii) Group companies
The results and financial position of foreign operations that have a functional currency different from the presentation currency are translated into the presentation currency as follows:
(1) assets and liabilities for each consolidated statement of financial position presented are translated at the exchange rate ruling at the date of that consolidated statement of the financial position;
(2) income and expenses for each consolidated income statement are translated at the average exchange rate during the period covered by the consolidated income statement;
(3) all resulting translation differences are recognised as a separate component of equity; and
(4) on the disposal of the Group’s entire interest in a foreign operation, or a disposal involving loss of control over a subsidiary that includes a foreign operation, all of the translation differences accumulated in equity in respect of that operation attributable to the equity holders of the company are reclassified to the consolidated income statement.
In the case of a partial disposal that does not result in the Group losing control over a subsidiary that includes a foreign operation, the proportionate share of accumulated translation differences are re-attributed to non-controlling interests and are not recognised in the consolidated income statement. For all other partial disposals (that is, reductions in the Group’s ownership interest in associated companies or joint ventures that do not result in the Group losing significant influence or joint control), the proportionate share of the accumulated translation difference is reclassified to the consolidated income statement.
Goodwill and fair value adjustments arising on the acquisition of a foreign operation are treated as assets and liabilities of the foreign operation and translated at the exchange rate ruling at the end of the reporting period.
(ab) Segment reportingOperating segments are reported in a manner consistent with the internal reporting provided to the chief operating decision-maker. The Board of Directors of the Company has appointed an Executive Committee which assess the financial performance and position of the Group, and makes strategic decisions. The Executive Committee, which has been identified as being the chief operating decision-maker, consists of executive directors of the Company.
Segment assets consist primarily of property, plant and equipment, right-of-use assets, land use rights, investment properties, intangible concession rights, intangible assets, VOBA, DAC, financial assets at FVOCI, financial assets at FVPL, properties for development, other non-current assets, properties under development, properties held for sale, inventories, receivables and non-current assets classified as assets held for sale and exclude interests in joint ventures and associated companies, derivative financial instruments, deferred tax assets, restricted bank balances and cash and bank balances. Segment liabilities comprise operating liabilities and exclude items such as current tax payable, deferred tax liabilities, liabilities related to unit-linked contracts and borrowings.
(ac) Dividend distributionDividend distribution to the Company’s shareholders is recognised as a liability in the financial statements in the financial period when the dividends are approved by the Company’s shareholders/directors, where appropriate.
(ad) Insurance contractsThe Group assesses at the end of each reporting period the liabilities under its insurance contracts using current estimates of future cash flows. If the carrying amount of the relevant insurance liabilities is less than the best estimate of the expenditure required to settle the relevant insurance liabilities at the end of the reporting period, the Group recognises the entire difference in the consolidated income statement. These estimates are recognised only when the outflow is probable and the estimates can be reliably measured.
The Group regards its financial guarantee contracts in respect of mortgage facilities provided to certain property purchasers and guarantees provided to its related parties as insurance contracts.

New World Development Company Limited200
Notes to the Financial Statements
3 PRINCIPAL ACCOUNTING POLICIES (CONTINUED)
(ae) Government grantsGrants from the government are recognised at their fair value where there is a reasonable assurance that the grant will be received and the Group will comply with all attached conditions. Government grants relating to costs are deferred and recognised in the consolidated income statement over the period necessary to match them with the costs that they are intended to compensate.
(af) Land use rightsAccounting policies applied before 1 July 2019The upfront prepayments made for the land use rights held under operating leases were expensed in the consolidated income statement on a straight-line basis over the period of the lease or when there was impairment, the impairment was expensed in the consolidated income statement.
4 CHANGES IN AND ADOPTION OF ACCOUNTING POLICIES
(a) Changes in accounting policiesAs explained in note 2 above, the Group has adopted HKFRS 16 and amendments to HKAS 28 from 1 July 2019, which resulted in changes in accounting policies and adjustments to the amounts recognised in the consolidated financial statements. As allowed in the specific transition provision in the standards, comparative figures is not restated.
Effects of adoption of HKFRS 16On adoption of HKFRS 16 using modified retrospective approach on lease-by-lease basis, the Group recognised lease liabilities in relation to leases which had previously been classified as “operating leases” under the principles of HKAS 17 Leases. These liabilities were measured at the present value of the remaining lease payments, discounted using the lessee’s incremental borrowing rate as of 1 July 2019. The cumulative effect of initial application has been recognised as an adjustment to the opening balance of equity at 1 July 2019. Comparative information has not been restated and continues to be reported under HKAS 17.
Right-of-use assets at initial recognition is measured at either:
• the carrying amount of lease as if HKFRS 16 had been applied since the lease commencement date, discounted using the lessee’s incremental borrowing rate as at 1 July 2019; or
• an amount equal to lease liability, adjusted by the prepaid or accrued lease payments relating to the lease immediately before 1 July 2019.
As a result of adoption of HKFRS 16, the obligations under finance leases recognised and the operating lease commitments as disclosed at 30 June 2019, adjusted by the effect of discounting and changes in index or rates affecting variable payments, exclusion of short-term leases and low-value asset leases and assessment of extension and termination options and contracts being reassessed as service agreements are combined as lease liabilities of HK$6,452.6 million and recognised as at 1 July 2019. The amount of lease liabilities was split into current portion and non-current portion of HK$988.5 million and HK$5,464.1 million respectively. The weighted average lessee’s incremental borrowing rates applied to the lease liabilities on 1 July 2019 were 3.79% for leases in Hong Kong and 5.06% for leases in Mainland China.

Annual Report 2020 201
Notes to the Financial Statements
4 CHANGES IN AND ADOPTION OF ACCOUNTING POLICIES (CONTINUED)
(a) Changes in accounting policies (continued)Effects of adoption of HKFRS 16 (continued)In applying HKFRS 16 for the first time, the Group has used the following practical expedients permitted by the standard:
• the use of a single discount rate to a portfolio of leases with reasonably similar characteristics;
• the accounting for operating leases with a remaining lease term of less than 12 months as at 1 July 2019 as short-term leases;
• the exclusion of initial direct costs for the measurement of the right-of-use asset at the date of initial application; and
• the use of hindsight in determining the lease term where the contract contains options to extend or terminate the lease.
As permitted by the amendments to HKFRS 16, which has been early adopted during the year, the Group has also used the practical expedient allowing lessees to elect not to assess whether a rent concession related to COVID-19 is a lease modification. Lessees accounts for qualifying rent concessions in the same way as they would if they were not lease modifications. The application of this practical expedient has no impact on the opening balance of consolidated statement of financial position as at 1 July 2019.
Effects of adoption of amendments to HKAS 28The amendments clarify the accounting for long-term interests in an associated company or joint venture, which in substance form part of the net investment in the associated company or joint venture, but to which equity accounting is not applied. The Group is required to account for such interests under HKFRS 9 before applying the loss allocation and impairment requirements in HKAS 28.
On the adoption of amendments to HKAS 28, the Group has recognised a loss allowance of HK$1,075.7 million as at 1 July 2019 against the non-current receivables from the joint ventures. The loss allowance is measured as either 12-month expected credit loss or lifetime expected credit losses, depending on whether there has been a significant increase in credit risk since initial recognition.

New World Development Company Limited202
Notes to the Financial Statements
4 CHANGES IN AND ADOPTION OF ACCOUNTING POLICIES (CONTINUED)
(a) Changes in accounting policies (continued)Effects of changes in accounting policiesThe effects of the adoption of HKFRS 16 and amendments to HKAS 28 are as follows:
As at 30 June 2019
Effects of adoption of HKFRS 16
Effects of adoption of
amendments to HKAS 28
As at 1 July 2019
HK$m HK$m HK$m HK$m
Consolidated statement of financial position (extract)
Non-current assetsProperty, plant and equipment 31,024.1 (1,862.4) — 29,161.7Right-of-use assets — 7,813.1 — 7,813.1Land use rights 1,213.9 (1,213.9) — —Interests in joint ventures 50,865.5 (10.8) (1,075.7) 49,779.0Interests in associated companies 25,331.9 (0.7) — 25,331.2Deferred tax assets 763.5 34.3 — 797.8Other non-current assets 14,644.3 59.1 — 14,703.4
Current assetsDebtors, prepayments, premium receivables and
contract assets 25,722.0 116.6 — 25,838.6
EquityReserves — Retained profits 136,730.0 (756.6) (1,075.7) 134,897.7Non-controlling interests 29,994.5 (278.8) — 29,715.7
Non-current liabilitiesLease liabilities — 5,464.1 — 5,464.1Deferred tax liabilities 10,371.1 13.9 — 10,385.0Other non-current liabilities 1,191.7 (439.1) — 752.6
Current liabilitiesCreditors, accrued charges, payables to policyholders
and contract liabilities 48,753.0 (56.7) — 48,696.3Lease liabilities — 988.5 — 988.5

Annual Report 2020 203
Notes to the Financial Statements
4 CHANGES IN AND ADOPTION OF ACCOUNTING POLICIES (CONTINUED)
(b) Adoption of accounting policies upon acquisition of insurance businessThe Group completed its acquisition of the entire equity interest in FTLife Insurance on 1 November 2019 which resulted in adoption of the following accounting policies used in the preparation of the consolidated financial statements.
(i) Product classificationThe Group’s insurance business issues contracts that transfer insurance risk or financial risk or both.
Insurance contracts are those contracts for which the Group has accepted significant insurance risk from policyholders providing insurance coverage at the inception of the contract. As a general guideline, the Group determines whether it has significant insurance risk by comparing benefits paid with benefits payable if the insured event did not occur. The Group also accepts financial risk on insurance contracts. Financial risk is the risk of a possible future change in a specified interest rate, security price, commodity price, foreign exchange rate, index of price or rate, credit rating or credit index or other variables.
Investment contracts are those contracts on which the Group accepts financial risk but that do not transfer significant insurance risk.
Once a contract has been classified as an insurance contract, it remains an insurance contract for the remainder of its lifetime, even if the insurance risk reduces significantly during this period, unless all rights and obligations are extinguished or expired.
(ii) Insurance contract liabilitiesInsurance contract liabilities represent net future policy liabilities as determined by the appointed actuary of the Group using a net level premium approach.
The provision for life insurance contracts with fixed level premiums is calculated on the basis of the prospective actuarial valuation method where the assumptions used depend on the circumstances prevailing. The liability is determined as the sum of the expected discounted value of the benefit payments, less the expected discounted value of the theoretical premiums that would be required to meet the benefits, based on the valuation assumptions as to discount rates, mortality and morbidity rates, lapse and partial lapse rates, persistency, expense, inflation, policy dividend and fund growth rate that are appropriate at the time of valuation. Changes to the liabilities at each reporting date are recorded in the profit or loss or other comprehensive income for the year as appropriate. The liabilities on yearly renewable premium contracts are the liabilities for the unexpired risks carried at the end of the reporting period. The liability is derecognised when the contract expires, is discharged or is cancelled.
For insurance with pure risk coverage such as accident benefit, dread disease, medical insurance and disability insurance, the liabilities are the unearned gross premiums.
(iii) Investment contract liabilitiesLiabilities for investment contracts are carried at fair values.
Deposits and withdrawals are recorded directly as an adjustment to the liability in the consolidated statement of financial position.
The liability is derecognised when the contract expires, is discharged or is cancelled. For a contract that can be cancelled by the policyholder, the fair value cannot be less than the surrender value.

New World Development Company Limited204
Notes to the Financial Statements
4 CHANGES IN AND ADOPTION OF ACCOUNTING POLICIES (CONTINUED)
(b) Adoption of accounting policies upon acquisition of insurance business (continued)(iv) Reinsurance
The Group cedes insurance risk in the normal course of business for its insurance contracts. Reinsurance assets represent balances due from reinsurance companies. Recoverable amounts are estimated in a manner consistent with the insurance contract liabilities and are in accordance with the reinsurance contract and are accounted for in the same period as the underlying claim.
An impairment review is performed at each reporting date or more frequently when an indication of impairment arises during the reporting year. Impairment occurs when objective evidence exists that the Group may not recover outstanding amounts under the terms of the contract and when the impact on the amounts that the Group will receive from the reinsurer can be measured reliably. The impairment loss is recorded in the consolidated income statement for the year.
Reinsurance arrangements do not relieve the Group from its obligations to policyholders.
(v) Value of business acquired (“VOBA”)VOBA, in respect of a portfolio of long-term insurance and investment contracts, is an intangible asset that reflects the estimated fair value of in-force contracts in acquisition of an insurance company and represents the portion of the purchase price that is allocated to the value of the right to receive future cash flows from the business in-force at the acquisition date. VOBA is based on actuarially determined projections, by each block of business, of future policy and contract charges, premiums, mortality and morbidity, separate account performance, surrenders, operating expenses, investment returns and other factors. VOBA is amortised over the estimated life of the contracts in the acquired portfolio on a systematic basis primarily based on expected future profits. The carrying value of VOBA is reviewed annually for impairment and any reduction is charged to the consolidated income statement.
(vi) Deferred acquisition costs (“DAC”)The direct acquisition costs and a portion of indirect acquisition costs relating to the production of new business are deferred so far as there are sufficient margins in the future profits of the new business to fund the amortisation of DAC. DAC include first year commissions and other costs related to the acquisition of new business. All other acquisition costs and all maintenance costs are expensed as and when incurred. The Group has adopted an approach by which DAC of new business is amortised according to the expected future premiums or expected future profits, which are projected based on the Group’s best estimate assumptions and actual persistency.
(vii) Liability adequacy testA liability adequacy test is performed at each reporting date to verify whether the insurance contract liabilities, net of DAC and VOBA, are adequate using current estimates of future cash flows under the insurance contracts. The liability value is adjusted if insufficient to meet future obligations, taking into account the future premiums, investment income, benefits and expenses and cash flows from embedded options and guarantees. If the test shows that a deficiency exists, the shortfall is immediately recorded in the consolidated income statement for the year.
(viii) PremiumsPremiums arising from insurance contracts in respect of traditional policies and group policies are recognised as income as when they fall due, whereas those in respect of universal life and unit-linked contracts are accounted for as they are received.
Premiums on reinsurance contracts held which related to direct insurance contracts are recognised in profit or loss over the insurance coverage to policyholders.

Annual Report 2020 205
Notes to the Financial Statements
4 CHANGES IN AND ADOPTION OF ACCOUNTING POLICIES (CONTINUED)
(b) Adoption of accounting policies upon acquisition of insurance business (continued)(ix) Fees and commission income
Insurance and investment contract policyholders are charged for policy administration services and investment management services. The policy administration fee is recognised as revenue over time when services are rendered. Investment management fees related to asset management services are recognised over time when services are rendered.
(x) Benefits and insurance claimsDeath claims and surrenders are recorded when notifications have been received. Maturities and annuity payments are recorded when due.
Ceded reinsurance recoveries are accounted for in the same period as the underlying claim.
(xi) Commissions and bonusesCommissions and bonuses payable to agents for the first policy year are included as a component of DAC.
Commissions from reinsurance policies that transfer underwriting risk are recognised as income at the same time as the reinsurance premiums are accounted for.
(xii) Premium receivablesPremium receivables represent premiums which are due for payment. The Group normally allows policyholders to make payment within a grace period of one month from the due date. The grace period may be extended by management purely on a discretionary basis. Insurance policies continue in force if default premiums are settled before the expiry of the grace period.
Premium receivables are stated at amortised cost using the effective interest rate method less provision for impairment.
(xiii) Adoption of overlay approach in accordance with HKFRS 4 (Amendment)The Group elected to apply an “overlay approach” in accordance with HKFRS 4 (Amendments) “Applying HKFRS 9 Financial Instruments with HKFRS 4 Insurance Contracts” which allows the Group to reclassify fair value gain or loss from profit or loss to other comprehensive income for those eligible financial assets previously classified as available-for-sale financial assets under HKAS 39 but currently classified as financial assets at FVPL under HKFRS 9.

New World Development Company Limited206
Notes to the Financial Statements
5 FINANCIAL RISK MANAGEMENT AND FAIR VALUE ESTIMATION
The Group’s activities expose it to a variety of financial risks: market risk (including foreign exchange risk, interest rate risk and price risk), credit risk and liquidity risk. The Group has centralised treasury function for all of its subsidiaries except for listed subsidiaries which arrange their financial and treasury affairs on a stand-alone basis and in a manner consistent with the overall policies of the Group.
(a) Market risk(i) Foreign exchange risk
The Group’s operations are mainly in Hong Kong and Mainland China. Entities within the Group are exposed to foreign exchange risk from future commercial transactions and monetary assets and liabilities that are denominated in a currency that is not the entity’s functional currency.
The Group manages its foreign currency risk by closely monitoring the movement of the foreign currency rates and will consider to enter into foreign exchange forward contracts and foreign exchange swaps to reduce the exposure should the need arises.
At 30 June 2020, the Group’s entities with functional currency of Hong Kong dollar had aggregate United States dollar net monetary assets of HK$7,070.2 million (2019: HK$5,586.7 million). Under the Linked Exchange Rate System in Hong Kong, Hong Kong dollar is pegged to the United States dollar, management therefore considers that there are no significant foreign exchange risk with respect to the United States dollar.
At 30 June 2020, the Group’s entities with functional currency of Hong Kong dollar had aggregate Renminbi net monetary assets of HK$2,402.0 million (2019: HK$3,328.9 million). If Hong Kong dollar had strengthened/weakened by 5% (2019: 5%) against Renminbi with all other variables unchanged, the Group’s profit before taxation would have been HK$120.1 million (2019: HK$166.4 million) lower/higher.
At 30 June 2020, the Group’s entities with functional currency of Renminbi had aggregate United States dollar net monetary assets of HK$299.3 million (2019: HK$237.8 million). If Renminbi had strengthened/weakened by 5% (2019: 5%) against United States dollar with all other variables unchanged, the Group’s profit before taxation would have been HK$15.0 million (2019: HK$11.9 million) lower/higher.
At 30 June 2020, the Group’s entities with functional currency of Renminbi had aggregate Hong Kong dollar net monetary liabilities of HK$575.1 million (2019: net monetary assets of HK$571.9 million). If Renminbi had strengthened/weakened by 5% (2019: 5%) against Hong Kong dollar with all other variables unchanged, the Group’s profit before taxation would have been HK$28.8 million higher/lower (2019: HK$28.6 million lower/higher).
This sensitivity analysis ignores any offsetting foreign exchange factors and has been determined assuming that the change in foreign exchange rates had occurred at the end of the reporting period. The stated change represents management’s assessment of reasonably possible changes in foreign exchange rates over the period from the end of the reporting period until the end of next reporting period. There are no other significant monetary balances held by group companies at 30 June 2020 and 2019 that are denominated in a non-functional currency. Currency risks as defined by HKFRS 7 arise on account of monetary assets and liabilities being denominated in a currency that is not the functional currency, differences resulting from the translation of financial statements into the Group’s presentation currency are not taken into consideration.
Annual Report 2020 207
Notes to the Financial Statements
5 FINANCIAL RISK MANAGEMENT AND FAIR VALUE ESTIMATION (CONTINUED)
(a) Market risk (continued)(ii) Interest rate risk
The Group is exposed to interest rate risk through the impact of rate changes on interest bearing assets and liabilities. Cash flow interest rate risk is the risk that changes in market interest rates will impact cash flows arising from variable rate financial instruments. The Group’s interest bearing assets on a floating rate basis mainly include deposits at bank and amounts due from joint ventures and associated companies. The Group’s floating rate borrowings will be affected by fluctuation of prevailing market interest rates and will expose the Group to cash flow interest rate risk. The Group’s borrowings issued at fixed rates exposed the Group to fair value interest rate risk.
The Group is also exposed to fair value interest risk mainly in relation to the financial assets at FVOCI (debt instruments) and derivative financial instruments. Fair value interest rate risk is the risk that the fair value of the future cash flows of the financial instruments will fluctuate because of changes in market interest rates.
To mitigate the risk, the Group has maintained an appropriate mix of fixed and floating rate interests. To match with underlying risk faced by the Group, the level of fixed rate instrument for the Group is decided after taking into consideration the potential impact of higher interest rates on the consolidated income statement, interest cover and the cash flow cycles of the Group’s businesses and investments. Variance interest bearing financial assets and liabilities are mainly subject to an interest repricing risk of one year or below.
If interest rates had been 100 basis points (2019: 100 basis points) higher/lower with all other variables held constant, the Group’s profit before taxation would have been HK$129.7 million higher or lower (2019: HK$211.1 million higher or lower) respectively and the Group’s FVOCI reserve would have been HK$5.5 billion lower/higher (2019: nil) respectively. The sensitivity analysis has been determined assuming that the change in rates had occurred throughout the year and had been applied to the exposure to interest rate risk for financial instruments in existence at the end of the reporting period. The 100 basis points (2019: 100 basis points) increase or decrease represents management’s assessment of a reasonably possible change in those interest rates which have the most impact on the Group over the period until the end of next reporting period. Changes in market interest rates affect the interest income or expense of non-derivative variable-interest financial instruments. As a consequence, they are included in the calculation of profit before taxation sensitivities.
(iii) Price riskThe Group is exposed to securities price risk arising from the listed and unlisted investments held by the Group. Gains or losses arising from changes in the fair value of financial assets at FVOCI and financial assets at FVPL are dealt with in equity and the consolidated income statement respectively. The performance of the Group’s listed and unlisted investments are monitored regularly, together with an assessment of their relevance to the Group’s strategic plans. The Group is also exposed to other price risk arising from fair value of certain interest rate swaps which is determined based on the in-house indexes of banks. Changes in fair value of these interest rate swaps are dealt with in the consolidated income statement. The Group is not exposed to commodity price risk.
At 30 June 2020, if the price of listed and unlisted investments in financial assets at FVOCI, excluding the investments in bonds had been 25% (2019: 25%) higher/lower with all other variables held constant, the Group’s financial assets at FVOCI reserve would have been HK$9,914.8 million (2019: HK$1,259.7 million) higher/lower. The sensitivity analysis has been determined based on a reasonable expectation of possible valuation volatility over the next 12 months.
At 30 June 2020, if the price of listed and unlisted investments in financial assets at FVPL had been 25% (2019: 25%) higher/lower with all other variables held constant, the Group’s profit before taxation would have been HK$3,657.2 million (2019: HK$2,309.9 million) higher/lower. The sensitivity analysis has been determined based on a reasonable expectation of possible valuation volatility over the next 12 months and assumed no impact from overlay approach adjustments.

New World Development Company Limited208
Notes to the Financial Statements
5 FINANCIAL RISK MANAGEMENT AND FAIR VALUE ESTIMATION (CONTINUED)
(b) Credit riskThe credit risk of the Group mainly arises from trade and other receivables, debt securities, other non-current assets, balances receivable from investee companies, joint ventures and associated companies, and deposits with banks.
The Group considers the probability of default from initial recognition of assets and whether there has been a significant increase in credit risk on an ongoing basis by close monitoring against established credit policies in each of its core business. To assess whether there is a significant increase in credit risk, the Group compares the risk of a default occurring on the assets, generally on individual basis, as at the reporting date with the risk of default as at the date of initial recognition. It considers available reasonable and supportive forward-looking information. The following indicators are generally incorporated:
• external credit rating (if any);
• average default rate by independent external parties;
• actual or expected significant adverse changes in business, financial or economic conditions that are expected to cause a significant change to the counterparties’ ability to meet their obligations; and
• significant actual and expected changes in the performance and behaviour of the counterparties, including changes in the payment status of counterparties in the Group and changes in the operating results of the counterparties.
A default on a financial asset is when the counterparty fails to make contractual payments when they fall due. Financial assets are considered to be credit-impaired and written off when there is no reasonable expectation of recovery.
For trade debtors and contract assets in relation to provision of services and infrastructure operations, no significant impairment allowance had been provided under lifetime expected credit loss assessment with reference to the historical credit loss experience with counterparties and ageing analysis, adjusted for forward-looking factors specific to the counterparties and the economic environment.
For trade debtors in relation to property sales, the Group normally receives deposits or progress payments from individual customers and possesses the control of the property unit prior to the completion of sales transaction. Taking into account the historical settlement of contractual payment and forward-looking factors, management considered the lifetime expected credit loss surrounding property sales receivables is immaterial.
For trade debtors in relation to rental income, the Group carries out regular review on these balances and follow-up action on any overdue amounts to minimise exposures to credit risk. The Group measures the lifetime expected credit losses based on the outstanding balances with debtors, offset with the deposit placed to the Group by the counterparties or the assets held by the counterparties expected to be frozen by the court for confiscation, and historical credit loss experience adjusted by the current and forecast economic conditions that may affect the ability of the counterparties to settle receivables.
For mortgage loans receivables, similar to other financial institutions, credit assessments are part of the normal process before approving loans to applicants. Regular review is carried out and stringent monitoring procedures are in place to deal with overdue debts. At the end of each reporting period, the Group reviews the recoverable amount of each individual receivable, taking into account the historical settlement of contractual payments and forward-looking factors under general approval, to ensure that adequate provisions for impairment are made for irrecoverable amounts, if any.
In relation to premium receivables from insurance business, the credit risk in respect of policyholder balances, incurred on the non-payment of premiums or contributions, will only persist during the grace period specified in the policy documents or trust deed on the expiry of which either the premium is paid or the policy will be terminated or changed to reduced paid-up or term cover according to the provision of the policy.
Annual Report 2020 209
Notes to the Financial Statements
5 FINANCIAL RISK MANAGEMENT AND FAIR VALUE ESTIMATION (CONTINUED)
(b) Credit risk (continued)In addition, the Group monitors the exposure to credit risk in respect of the financial assistance provided to investee companies, associated companies and joint ventures through exercising joint control or influence over their financial and operating policy decisions and reviewing their financial positions on a regular basis.
Impairment on financial assistance provided to investee companies, joint ventures and associated companies, other debtors and other non-current assets such as loans receivables, is measured as either 12-month expected credit losses or lifetime expected credit losses, depending on whether there has been a significant increase in credit risk since initial recognition, through the management’s critical assessment on the recoverable amounts based on underlying assets, historical repayment pattern, the actual and expected changes in business performance and general market default rate. If a significant increase in credit risk of a receivable has occurred since initial recognition, then impairment is measured as lifetime expected credit losses.
For deposits with banks mainly placed with high-credit-quality financial institutions, such balances are considered to be of low credit risk as they have an investment credit rating with at least one major agency. No impairment had been provided under general expected credit loss assessment.
Debt securities are limited to financial institutions or investment counterparties with high quality. Aaa and AAA are the highest credit ratings in the Moody’s and Standard & Poor’s credit rating systems, respectively. The Group classifies its investment in bonds below ratings of Baa3 and BBB- in the Moody’s and Standard & Poor’s credit rating systems respectively as non-investment grade bonds. As at 30 June 2020, the amount of the non-investment grade bonds held by the Group was approximately 1.5% of its invested assets.
There is no concentration of credit risk with respect to trade debtors and contract assets from third party customers as the customer bases are widely dispersed in different sectors and industries.
The Group provides guarantees to banks in connection with certain property purchasers’ borrowing of mortgage loans to finance their purchase of the properties until the issuance of the official property title transfer certificates by the relevant authority in the Mainland China. If a purchaser defaults on the payment of its mortgage during the term of the guarantee, the bank holding the mortgage may demand the Group to repay the outstanding amount under the loan and any accrued interest thereon. Under such circumstances, the Group is able to retain the purchaser’s deposit and sell the property to recover any amounts paid by the Group to the bank. Therefore the Group’s credit risk is significantly reduced. Nevertheless, the net realisable values of the relevant properties are subject to the fluctuation of the property market in general, the Group assesses at the end of each reporting period the liabilities based on the current estimates of future cash flows. As at 30 June 2020 and 2019, no provision on the above guarantees to banks had been made in the consolidated financial statements.
As at 30 June 2020 and 2019, the carrying amounts of these balances represent the Group’s maximum exposure to credit risk in relation to the financial assets.
(c) Liquidity riskPrudent liquidity risk management includes managing the profile of debt maturities and funding sources, maintaining sufficient cash and marketable securities, and ensuring the availability of funding from an adequate amount of committed credit facilities and the ability to close out market positions. It is the policy of the Group to regularly monitor current and expected liquidity requirements and to ensure that adequate funding is available for operating, investing and financing activities. The Group also maintains adequate undrawn committed credit facilities to further reduce liquidity risk in meeting funding requirements (including financing for the Group’s capital commitments as detailed in note 48(b)(i). The Directors of the Company are of the view that the Group has sufficient resources to meet the Group’s commitments and liabilities as and when they fall due.
The table below analyses the Group’s non-derivative financial liabilities into relevant maturity groupings based on the remaining period at the end of the reporting period to the contractual maturity date. Except for the liabilities related to unit-linked contracts where these unit-linked contracts typically include options for policyholders to surrender early, often subject to surrender or other penalties. The Group’s investment related to unit-linked contracts are held to back the liabilities to the policyholders. The amounts disclosed in the table are the contractual undiscounted cash flows.

New World Development Company Limited210
Notes to the Financial Statements
5 FINANCIAL RISK MANAGEMENT AND FAIR VALUE ESTIMATION (CONTINUED)
(c) Liquidity risk (continued)Non-derivative financial liabilities:
Carrying amount
Total contractual
undiscounted cash flow
Within 1 year or
on demand
Over 1 year but within
5 yearsAfter
5 years Unit-linkedHK$m HK$m HK$m HK$m HK$m HK$m
At 30 June 2020Creditors, accrued charges and
payables to policyholders 39,862.2 39,862.2 36,429.8 3,380.7 51.7 —Short-term borrowings and other
interest-bearing liabilities 20,166.6 20,871.6 20,727.8 143.8 — —Long-term borrowings and other
interest-bearing liabilities 171,222.4 191,597.6 41,377.1 113,729.5 36,491.0 —Liabilities related to unit-linked
contracts (note 35) 8,554.9 8,554.9 — — — 8,554.9Lease liabilities 6,987.3 8,050.9 1,341.8 4,032.5 2,676.6 —
At 30 June 2019Creditors and accrued charges 37,565.0 37,565.0 33,518.7 3,982.2 64.1 —Short-term borrowings 15,854.8 16,544.8 16,544.8 — — —Long-term borrowings 140,479.8 156,778.3 32,299.8 105,549.4 18,929.1 —
Derivative financial liabilities:
Total contractual
undiscounted cash flow
Within 1 year or
on demand
Over 1 year
but within 5 years
After 5 years
HK$m HK$m HK$m HK$m
At 30 June 2020Derivative financial instruments (net settled) 911.1 206.7 543.3 161.1Derivative financial instruments (gross settled)
cash inflow (1,127.9) (249.4) (647.8) (230.7)cash outflow 1,141,4 250.5 657.4 233.5
13.5 1.1 9.6 2.8
At 30 June 2019Derivative financial instruments (net settled) 523.5 83.5 214.7 225.3
The major liquidity risks the Group’s insurance business confronts are the daily calls on its available cash resources in respect of claims arising from insurance and investment contracts and the maturity of debt securities.
The Group’s insurance business manages liquidity through its liquidity risk policy which includes determining what constitutes liquidity risk and the minimum proportion of funds to meet emergency calls, the setting up of contingency funding plans, specifying the sources of funding and the events that would trigger the plan, specifying the concentration of funding sources, the reporting of liquidity risk exposures and breaches to the monitoring authority, monitoring the compliance with liquidity risk policy and the reviewing of liquidity risk policy for pertinence and changing environment.

Annual Report 2020 211
Notes to the Financial Statements
5 FINANCIAL RISK MANAGEMENT AND FAIR VALUE ESTIMATION (CONTINUED)
(c) Liquidity risk (continued)The table below presents the estimated amounts (on a discounted basis) and timing of cash outflow/(inflow) arising from liabilities under insurance contracts, projected based on the Group’s best estimate assumptions. The Group’s insurance business has to meet daily calls on its cash resources, notably from claims arising on its insurance contracts and early surrender of policies for surrender value. There is therefore a risk that cash will not be available to settle liabilities when due at a reasonable cost. The Group’s insurance business manages this risk by monitoring and setting an appropriate level of cash position to settle these liabilities.
Total discounted
cash flowWithin1 year
Over 1 year
but within 5 years
After 5 years
HK$m HK$m HK$m HK$m
At 30 June 2020Insurance contract liabilities (note 44) 34,894.7 3,200.5 (2,332.1) 34,026.3
No comparative figure as at 30 June 2019 for the above table was showed as the acquisition of insurance business by the Group was completed in November 2019.
(d) Asset liability management frameworkUpon completion of acquisition of insurance business, financial risks also arise from open positions in interest rate, currency and equity products, all of which are exposed to general and specific market movements. The main risks that the Group’s insurance business faces due to the nature of its investments and liabilities are interest rate risk and duration risk. The Group’s insurance business manages these positions within an asset liability management (“ALM”) framework that has been developed to achieve long term investment returns in excess of its obligations under insurance and investment contracts. The principal technique of ALM is to match assets to the liabilities arising from insurance and investment contracts by reference to the type of benefits payable to contract holders.
ALM also forms an integral part of the insurance risk management policy in order to ensure in each period sufficient cash flows are available to meet liabilities arising from insurance and investment contracts.
(e) Regulatory framework of the Group’s insurance businessThe operations of the Group’s insurance business are subject to local regulatory requirements in Hong Kong. The Group’s insurance business is required to maintain an appropriate solvency position to meet unforeseen liabilities arising from economic shocks and/or natural disasters.

New World Development Company Limited212
Notes to the Financial Statements
5 FINANCIAL RISK MANAGEMENT AND FAIR VALUE ESTIMATION (CONTINUED)
(f) Capital managementThe Group’s objectives when managing capital are to safeguard the Group’s ability to continue as a going concern in order to provide returns for shareholders and benefits for other stakeholders and to maintain an optimal capital structure to reduce the cost of capital.
The Group generally obtains long-term financing to on-lend or contribute as equity to its subsidiaries, joint ventures and associated companies to meet their funding needs in order to provide more cost efficient financing. In order to maintain or adjust the capital structure, the Group may adjust the amount of dividends paid to shareholders, issue or repurchase shares, raise new debt financing or sell assets to reduce debt.
The Group monitors capital on the basis of the Group’s gearing ratio and makes adjustments to it in light of changes in economic conditions and business strategies. The gearing ratio is calculated as net debt divided by total equity. Net debt is calculated as total long-term and short-term borrowings and other interest-bearing liabilities (excluding loans from non-controlling shareholders) less cash and bank balances and restricted bank balances.
The Group’s insurance business has an internal risk management framework for identifying risks to its business it exposed to. The internal framework estimates and indicates how much capital is needed to mitigate the risk of insolvency.
The Group’s insurance business always maintains a solvency position higher than 150% of the solvency margin required by the Insurance Authority (“IA”) to ensure an adequate surplus position. Further objectives are set by the Group’s insurance business to maintain a strong credit rating and healthy capital ratios in order to support its business.
The Group’s insurance business manages its capital requirements by assessing probable shortfalls between reported and required capital levels on a regular basis. Adjustments to current capital levels are made in light of changes in economic conditions and risk characteristics of the Group’s insurance business activities.
The Group’s insurance business fully complied with capital requirements imposed by the IA throughout the period since acquisition to the reporting date.
The gearing ratios were as follows:
2020 2019HK$m HK$m
Consolidated total borrowings* 183,894.2 152,019.6Less: cash and bank balances and restricted bank balances (67,435.6) (63,731.6)
Consolidated net debt 116,458.6 88,288.0
Total equity 279,745.1 275,364.5
Gearing ratio 41.6% 32.1%
* Excluding loans from non-controlling shareholders, financing received under a financial reinsurance arrangement and cash collateral received for cross currency swap and forward starting interest rate swap contracts.

Annual Report 2020 213
Notes to the Financial Statements
5 FINANCIAL RISK MANAGEMENT AND FAIR VALUE ESTIMATION (CONTINUED)
(g) Insurance riskThe Group’s insurance business is in the business of insuring against the risk of mortality, morbidity, disability, critical illness, accidents and related risks. The Group’s insurance business retains a maximum of US$150,000 for each risk it insures, with the excess being reinsured through surplus treaties, coinsurance treaties, facultative reinsurance, catastrophe treaties and quota share arrangements with reputable international reinsurers. Consequently, total claims payable in any given year can be predicted with a higher degree of precision. As part of the quality control process, the Group’s insurance business regularly invites reinsurers to audit its underwriting and claim practices and procedures, to ensure that it meets the highest industry standards.
As at 30 June 2020
Gross insurance
contract liabilities
(note 44(b))
Reinsurer’s share of
insurance contract
liabilities
Insurance contract
liabilities, net of reinsurer’s
shareHK$m HK$m HK$m
Type of productsWhole life 29,069.6 (23.8) 29,045.8Term 97.0 (0.3) 96.7Dread disease 1,890.3 (0.1) 1,890.2Medical 226.1 — 226.1Disability 11.1 (0.1) 11.0Accident 21.6 (0.1) 21.5
31,315.7 (24.4) 31,291.3
Coinsurance liabilities 244.7 — 244.7
31,560.4 (24.4) 31,536.0
No comparative figure as at 30 June 2019 for the above table was showed as the acquisition of insurance business by the Group was completed in November 2019.
(i) Key assumptionsLiabilities on insurance contracts offered by the Group are predominantly conventional whole life insurance for which premiums are paid for a limited period of time or the whole life, with fixed benefits paid upon death and surrender benefits increasing with the duration of policy.
Some plans provide for guaranteed periodic payments. Most of the whole life insurance products are entitled to annual dividends and some with terminal dividend upon policy termination.
The key assumptions used for the determination of future liabilities for most products is detailed below:
As at 30 June 2020 Mortality rates For products with full underwriting, 62% of 2001 Hong Kong Assured Life Mortality
tables for males and females, with selection factor 50% at year 1 and 75% at year 2.
For products without full underwriting, 62% of 2001 Hong Kong Assured Life Mortality tables for males and females.
Discount rates Range between 2.00% to 4.10%, depending on the insurance plan policies
Lapse rates Based on Group’s experience.
Expenses Based on Group’s experience.
The method of calculating the liabilities is the net level premium reserve, with an adjustment to remove premium deficiency.
The Group’s actual claims compared to the mortality experience assumed in the calculation of future insurance contract liabilities, for the current year, is 114%.

New World Development Company Limited214
Notes to the Financial Statements
5 FINANCIAL RISK MANAGEMENT AND FAIR VALUE ESTIMATION (CONTINUED)
(g) Insurance risk (continued)(ii) Sensitivities
The sensitivity analyses below have been determined based on reasonably possible changes in the respective key assumptions occurring at the end of the reporting period, while holding all the other assumptions constant.
As at 30 June 2020
Assumption change
(Decrease)/increase in
profit for the year
and equityHK$m
Mortality rates +10% (217.7)Discount rates –50 basis points (2,378.5)Lapse rates +20% 221.1Expenses +10% (56.4)
(h) Fair value estimationThe Group’s financial instruments that are measured at fair value are disclosed by levels of the following fair value measurement hierarchy:
• Quoted prices (unadjusted) in active markets for identical assets or liabilities (level 1).
• Inputs other than quoted prices included within level 1 that are observable for the asset or liability, either directly (that is, as prices) or indirectly (that is, derived from prices) (level 2).
• Inputs for the asset or liability that are not based on observable market data (that is, unobservable inputs) (level 3).
Management determined the fair value of these financial assets within level 2 and level 3 as follows:
• The fair value of forward starting swap contracts and forward exchange agreements is determined by discounting the contractual future cash flows, The discount rate used is derived from the relevant swap curve as at the reporting date with potential adjustment made for various collateralization agreement;
• The fair value of cross currency swap contracts is determined by discounting the contractual future cash flows. The exchange rate and discount rate used are derived from the relevant foreign exchange forward rates and swap curve as at the reporting date, with potential adjustment made for various collateralization agreement;
• For investments in investment funds, management discussed with the respective fund managers to understand the performance of the underlying investments and fair value measurement basis conducted by the respective fund managers in order to evaluate whether the fair values as stated in the fund statements at the end of reporting period is appropriate;
• For investments in unlisted equity and debt securities with recent transactions, management determined the fair value at the end of reporting period with reference to latest transaction prices of these financial assets;
• Financial assets at FVOCI (debt instruments) are classified as level 2 if there was no active market for such investments;
• For investments in unlisted equity and debt securities without recent transactions, management has established fair values of these investments by using appropriate valuation techniques such as discounted cash flow with the credit risk of the issuer taken into consideration for financial assets at FVOCI (debt instruments). Independent external valuer has been involved in determining the fair value, when appropriate;
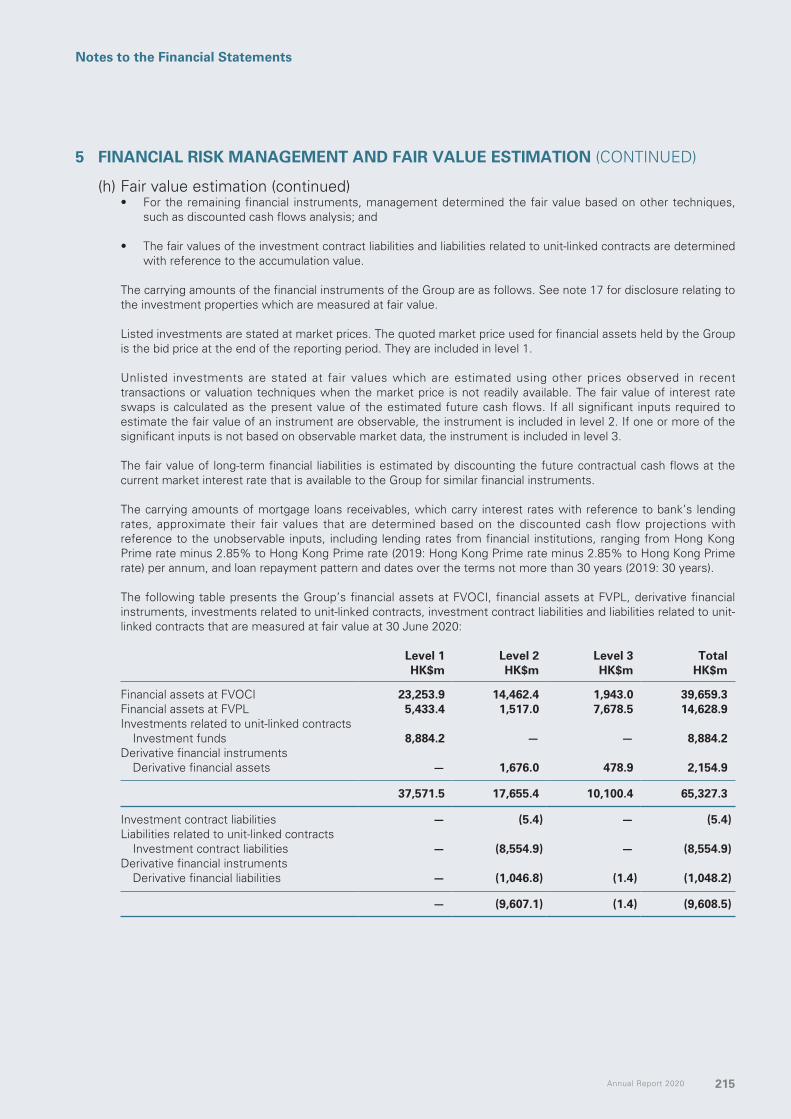
Annual Report 2020 215
Notes to the Financial Statements
5 FINANCIAL RISK MANAGEMENT AND FAIR VALUE ESTIMATION (CONTINUED)
(h) Fair value estimation (continued)• For the remaining financial instruments, management determined the fair value based on other techniques,
such as discounted cash flows analysis; and
• The fair values of the investment contract liabilities and liabilities related to unit-linked contracts are determined with reference to the accumulation value.
The carrying amounts of the financial instruments of the Group are as follows. See note 17 for disclosure relating to the investment properties which are measured at fair value.
Listed investments are stated at market prices. The quoted market price used for financial assets held by the Group is the bid price at the end of the reporting period. They are included in level 1.
Unlisted investments are stated at fair values which are estimated using other prices observed in recent transactions or valuation techniques when the market price is not readily available. The fair value of interest rate swaps is calculated as the present value of the estimated future cash flows. If all significant inputs required to estimate the fair value of an instrument are observable, the instrument is included in level 2. If one or more of the significant inputs is not based on observable market data, the instrument is included in level 3.
The fair value of long-term financial liabilities is estimated by discounting the future contractual cash flows at the current market interest rate that is available to the Group for similar financial instruments.
The carrying amounts of mortgage loans receivables, which carry interest rates with reference to bank’s lending rates, approximate their fair values that are determined based on the discounted cash flow projections with reference to the unobservable inputs, including lending rates from financial institutions, ranging from Hong Kong Prime rate minus 2.85% to Hong Kong Prime rate (2019: Hong Kong Prime rate minus 2.85% to Hong Kong Prime rate) per annum, and loan repayment pattern and dates over the terms not more than 30 years (2019: 30 years).
The following table presents the Group’s financial assets at FVOCI, financial assets at FVPL, derivative financial instruments, investments related to unit-linked contracts, investment contract liabilities and liabilities related to unit-linked contracts that are measured at fair value at 30 June 2020:
Level 1 Level 2 Level 3 TotalHK$m HK$m HK$m HK$m
Financial assets at FVOCI 23,253.9 14,462.4 1,943.0 39,659.3Financial assets at FVPL 5,433.4 1,517.0 7,678.5 14,628.9Investments related to unit-linked contracts
Investment funds 8,884.2 — — 8,884.2Derivative financial instruments
Derivative financial assets — 1,676.0 478.9 2,154.9
37,571.5 17,655.4 10,100.4 65,327.3
Investment contract liabilities — (5.4) — (5.4)Liabilities related to unit-linked contracts
Investment contract liabilities — (8,554.9) — (8,554.9)Derivative financial instruments
Derivative financial liabilities — (1,046.8) (1.4) (1,048.2)
— (9,607.1) (1.4) (9,608.5)

New World Development Company Limited216
Notes to the Financial Statements
5 FINANCIAL RISK MANAGEMENT AND FAIR VALUE ESTIMATION (CONTINUED)
(h) Fair value estimation (continued)The following table presents the Group’s financial assets at FVOCI, financial assets at FVPL and derivative financial instruments that are measured at fair value at 30 June 2019:
Level 1 Level 2 Level 3 TotalHK$m HK$m HK$m HK$m
Financial assets at FVOCI 2,766.3 321.6 1,950.9 5,038.8Financial assets at FVPL 1,002.7 1,576.2 6,660.5 9,239.4Derivative financial instruments
Derivative financial assets — 124.8 12.5 137.3
3,769.0 2,022.6 8,623.9 14,415.5
Derivative financial instrumentsDerivative financial liabilities — (613.4) (7.3) (620.7)
During the year, there were transfer of financial assets at FVOCI (debt instruments) relating to the Group’s insurance business with fair value of HK$1,650.5 million (2019: nil) from Level 1 to Level 2 fair value hierarchy classifications. Assets are transferred out of Level 1 when they are no longer transacted with sufficient frequency and volume in an active market.
The following table presents the changes in financial assets at FVOCI, financial assets at FVPL and derivative financial instruments in Level 3 financial instruments for the year ended 30 June 2020:
Financial assets
at FVOCI
Financial assets
at FVPL
Derivative financial
assets
Derivative financial
liabilitiesHK$m HK$m HK$m HK$m
At 1 July 2019 1,950.9 6,660.5 12.5 (7.3)Additions — 1,303.6 — —Acquisition of a subsidiary — 471.2 283.0 —Transfer to level 1 investments — (39.0) — —Transfer to level 2 instruments — (169.6) (12.5) —Net gain recognised in the consolidated
statement of comprehensive income/income statement (7.9) 49.6 195.9 5.9
Disposals — (597.8) — —
At 30 June 2020 1,943.0 7,678.5 478.9 (1.4)

Annual Report 2020 217
Notes to the Financial Statements
5 FINANCIAL RISK MANAGEMENT AND FAIR VALUE ESTIMATION (CONTINUED)
(h) Fair value estimation (continued)The following table presents the changes in financial assets at FVOCI, available-for-sale financial assets, financial assets at FVPL and derivative financial instruments in Level 3 financial instruments for the year ended 30 June 2019:
Financial assets
at FVOCI
Available-for-sale
financial assets
Financial assets
at FVPL
Derivative financial
assets
Derivative financial liabilities
HK$m HK$m HK$m HK$m HK$m At 30 June 2018 — 5,712.6 684.3 — (13.1)Adjustment on adoption of HKFRS 9 2,132.0 (5,712.6) 3,890.6 — — Restated balance as at 1 July 2018 2,132.0 — 4,574.9 — (13.1)Additions 1.6 — 2,570.0 — —Transfer to level 1 investments — — (200.8) — —Transfer (to)/from level 2 instruments (317.3) — 459.8 — —Net gain recognised in the consolidated
statement of comprehensive income/income statement 134.6 — 289.6 12.5 5.8
Disposals — — (1,033.0) — — At 30 June 2019 1,950.9 — 6,660.5 12.5 (7.3)
In determining the fair values of financial assets at FVOCI and financial assets at FVPL included in level 3:
• The fair value of financial assets relating to property investment industry of HK$928.5 million (2019: HK$952.7 million) will be determined with reference to the reported net asset value at the end of the reporting period;
• Majority of other Level 3 instruments is comprised of investment funds, unlisted debt and equity securities. The fair value of the investment funds are mainly determined based on the net asset value, representing the fair value of the funds reported by respective fund managers and relevant factors if deemed necessary. Fair value of unlisted debt and equity securities is determined primarily based on the purchase price paid by the Group and taking into account of the analysis of the investees’ financial position and results, risk profile, prospects, industry trend and other factors. Recent transaction prices, if any, are referenced or independent external valuer is involved, where appropriate, to determine the fair value.
Fair value of Level 3 derivative financial assets/liabilities is estimated by independent external valuers. Valuation techniques used involve the use of current market based or independently sourced market parameters such as interest rates, currency rates and option volatilities. Amount represents a put option to sell or dispose of an entity investment held by the Group (classified as financial assets at FVOCI) at a specific price within a specific price within a specific transaction period. Fair value measurement of the underlying investments is negatively correlated with the derivative valuation.
6 CRITICAL ACCOUNTING ESTIMATES AND JUDGEMENTS
Estimates and judgements are continually evaluated by the Group and are based on historical experience and other factors, including expectations of future events that are believed to be reasonable under the circumstance.
The Group has considered the existing and potential impacts arising from the COVID-19 when preparing the consolidated financial statements. Assumptions and estimates are based on circumstances and conditions available when the consolidated financial statements were prepared and in particular, assumed that the current market condition as a result of the COVID-19 is not a long-term norm. Given the severity, duration and economic consequences of the COVID-19 are uncertain, actual results may differ significantly from those assumptions and estimates. The Group will remain alert and cautious on the ongoing development of COVID-19 that may cause further volatility and uncertainty in the global financial market, economy and business environment, and will take necessary measures to address the impact arising therefrom.
New critical accounting estimates and judgements adopted by the Group after the acquisition of insurance business are detailed in note 6(k) to 6(n) below.

New World Development Company Limited218
Notes to the Financial Statements
6 CRITICAL ACCOUNTING ESTIMATES AND JUDGEMENTS (CONTINUED)
The estimates and assumptions that have a significant effect on carrying amounts of assets and liabilities are as follows:
(a) Revenue recognitionRevenue from property development activities is recognised over time when the Group’s performance does not create an asset with an alternative use to the Group and the Group has an enforceable right to payment for performance completed to date; otherwise, revenue is recognised at a point in time when the buyer obtains control of the completed property. The properties contracted for pre-sale to customers have generally no alternative use for the Group due to contractual restrictions. However, whether there is an enforceable right to payment and hence the related contract revenue should be recognised over time, depends on the terms of each contract and the relevant laws that apply to that contract. To assess the enforceability of right to payment, the Group has reviewed the terms of its contracts and the relevant local laws, considered the local regulators’ views and obtained legal advice, where necessary.
For property development revenue that is recognised over time, the Group recognises such property development revenue by reference to the progress of satisfying the performance obligation at the reporting date. This is measured based on the Group’s costs incurred up to the reporting date and budgeted costs which depict the Group’s performance towards satisfying the performance obligation. Significant estimates and judgements are required in determining the accuracy of the budgets, the extent of the costs incurred and the allocation of costs to each property unit. In making the above estimation, the Group conducts periodic review on the budgets and make reference to past experience and work of contractors and surveyors.
For property development and sales contracts for which the control of the property is transferred at a point in time, revenue is recognised when the underlying completed property unit is legally and/or physically transferred to the customer.
(b) Valuation of investment propertiesThe fair value of each completed investment property is individually determined at the end of each reporting period by independent valuers based on a market value assessment. The valuers have relied on the capitalisation of income approach as their primary methods, supported by the direct comparison method. Management also determines fair value based on active market prices and adjusted if necessary for any difference in nature, location or conditions of the specific asset, and uses alternative valuation methods such as recent prices on less active markets. These methodologies are based upon estimates of future results and a set of assumptions specific to each property to reflect its tenancy and cash flow profile. The fair value of each investment property reflects, among other things, rental income from current leases and assumptions about rental income from future leases in light of current market conditions. The fair value also reflects, on a similar basis, any cash outflows that could be expected in respect of the property.
The fair values of investment properties under development are determined by reference to independent valuations. For majority of the Group’s investment properties under development, their fair value reflects the expectations of market participants of the value of the properties when they are completed, less deductions for the costs required to complete the projects and appropriate adjustments for profit and risk. The valuation and all key assumptions used in the valuation should reflect market conditions at the end of each reporting period. The key assumptions include value of completed properties, period of development, outstanding construction costs, finance costs, other professional costs, risk associated with completing the projects and generating income after completion and investors’ return as a percentage of value or cost.
At 30 June 2020, if the market value of investment properties had been 5% (2019: 5%) higher/lower with all other variables held constant, the carrying value of the Group’s investment properties would have been HK$8,485.9 million (2019: HK$8,666.3 million) higher/lower.
(c) Recoverability of properties for/under development and properties held for saleThe Group assesses the carrying amounts of properties for/under development and properties held for sale according to their estimated net realisable value based on the realisability of these properties, taking into account construction costs to completion based on the existing development plans and the estimation of selling prices of the properties of comparable locations and conditions. Provision is made when events or changes in circumstances indicate that the carrying amounts may not be realised. The assessment requires the use of significant estimates.
Annual Report 2020 219
Notes to the Financial Statements
6 CRITICAL ACCOUNTING ESTIMATES AND JUDGEMENTS (CONTINUED)
(d) Impairment of interests in joint ventures and associated companiesThe Group determines whether interests in joint ventures and associated companies are impaired by regularly review whether there are any indicators of impairment of the investments by reference to the requirements under HKAS 28 (2011) “Investments in Associates and Joint Ventures” and HKAS 36 “Impairment of Assets”.
For investments where impairment indicators exist, management estimated the recoverable amounts of the investments, being higher of fair value less costs of disposal and value in use. The value in use of the underlying businesses is determined based on the discounted cash flow projections. Significant judgements are required to determine the key assumptions used in the discounted cash flow models, such as revenue growth, unit price and discount rates. Independent external valuers were also involved in the fair value and value in use assessments, where appropriate. Based on the results of these impairment assessments, management concluded that the current level of impairment provision for the Group’s interests in joint ventures and associated companies as at 30 June 2020 was appropriate.
For the measurement of expected credit losses of the amounts receivable from joint ventures and associated companies, please refer to Note 5(b).
(e) Impairment of assetsThe Group tests annually whether goodwill has suffered any impairment according to their recoverable amounts determined by the cash-generating units based on value in use calculations. These calculations require the use of estimates which are subject to change of economic environment in future. Details are set out in note 22.
Property, plant and equipment and right-of-use assets are regularly reviewed for impairment whenever there are any indications of impairment and will recognise an impairment loss if the carrying amount of an asset is higher than its estimated recoverable amount. The recoverable amounts of property, plant and equipment have been determined based on the higher of their fair values less costs of disposal and value in use, taking into account the latest market information and past experience.
In determining the value in use, management assesses the present value of the estimated future cash flows expected to arise from the continuing use of the asset and from its disposal at the end of its useful life. Estimates and judgements are applied in determining these future cash flows and the discount rate. Management estimates the future cash flows based on certain assumptions, such as market competition and development and the expected growth in business.
The Group assesses whether there is objective evidence as stated in note 3(i) that trade debtors, contract assets, amounts due from associated companies, amounts due from joint venture, amounts due from non-controlling shareholders and debt instruments at amortised cost are impaired.
(f) Fair value of financial assets at FVPL and financial assets at FVOCIThe fair value of financial assets at FVPL and financial assets at FVOCI that are not traded in an active market is determined by using valuation techniques. The Group uses its judgement to select a variety of methods and determine the fair values primarily based on the purchase price paid by the Group, net asset value and taking into account of the analysis of the investees’ financial trends and results, risk profile, prospects, industry trends and other factors. Recent transaction prices, if any, are referenced and independent external valuer has been involved in determining fair value of certain unlisted investments. The key assumptions adopted on projected cash flow are based on management’s best estimates.
(g) Estimate of revenue for construction contractsFor revenue from construction work that is recognised over time, the Group recognised such revenue by reference to the progress of satisfying the performance obligation at the reporting date. This is measured based on the Group’s costs incurred up to the reporting date and budgeted costs which depict the Group’s performance towards satisfying the performance obligation. Significant estimates and judgements are required in determining the accuracy of the budgets. In making the above estimation, the Group conducts periodic review on the budgets and makes reference to past experience and work of internal quantity surveyors.
New World Development Company Limited220
Notes to the Financial Statements
6 CRITICAL ACCOUNTING ESTIMATES AND JUDGEMENTS (CONTINUED)
(h) Estimated volume of infrastructures of public servicesThe amortisation for intangible concession rights and impairment assessment of infrastructures for public services using discounted cash flow model are affected by the estimated volume for public services, such as toll roads. Management performs annual reviews to assess the appropriateness of estimated volume by making reference to independent professional studies, if necessary.
The traffic volume is directly and indirectly affected by a number of factors, including the availability, quality, proximity and toll rate differentials of alternative roads and the existence of other means of transportation. The growth of the traffic flow is also highly tied to the future economic and transportation network development of the area in which the infrastructures serve. The growth in future traffic flow projected by the management is highly dependent on the realisation of the aforementioned factors.
(i) Distinction between property development projects, investment properties and owner-occupied propertiesWhen the Group determines whether a property qualifies as an investment property, the Group considers whether the property generates cash flows largely independently of the other assets held by an entity. Owner-occupied properties generate cash flows that are attributable not only to property but also to other assets used in the production or supply process. Properties for/under development and properties held for sale are assets under development and held for sale in the ordinary course of business. The Group shall reclassify a property when, and only when, there is evidence of a change in use.
Some properties comprise a portion that is held to earn rentals or for capital appreciation and another portion that is held for use in the production or supply of goods or services or for administrative purposes. If these portions can be sold or leased out separately, the Group accounts for the portions separately. If the portions cannot be sold separately, the property is accounted as an investment property only if an insignificant portion is held for use in the production or supply of goods or services or for administrative purposes. Judgement is applied in determining whether ancillary services are so significant that a property does not qualify as investment property. The Group considers each property separately in making its judgement.
(j) Judgement in determining the lease term for lease contracts with renewal optionThe Group applies judgement to determine the lease term for lease contracts in which it is a lessee that include renewal option. The assessment of whether the Group is reasonably certain to exercise such options impacts the lease term, which significantly affects the amount of lease liabilities and right-of-use assets recognised.
(k) Product classificationContracts are classified as insurance contracts where they transfer significant insurance risk from the holder of the contract to the Group. The Group’s accounting policy for the classification of insurance and investment contracts is discussed in more detail in note 4(b)(i).
There are a number of contracts sold where the Group exercises judgement about the level of insurance risk transferred. Typically, these are contracts which contain a significant savings component. The level of insurance risk is assessed by considering whether there are any scenarios with commercial substance in which the Group is required to pay significant additional benefits. These benefits are those which exceed the amounts payable if no insured event were to occur. These additional amounts include claims liability and assessment costs, but exclude the loss of the ability to charge the holder of the contract for future services.

Annual Report 2020 221
Notes to the Financial Statements
6 CRITICAL ACCOUNTING ESTIMATES AND JUDGEMENTS (CONTINUED)
(l) Estimate of life insurance contract liabilitiesThe estimation of the ultimate liabilities arising from claims made under life insurance contracts is one of the most critical accounting estimate for the Group’s insurance business. There are sources of uncertainty that need to be considered in the estimation of the liabilities that the Group will ultimately pay for those claims.
The valuation of insurance contract liabilities requires the use of appropriate actuarial methodologies and also various economic and operational assumptions. The assumptions used in measuring the insurance contract liabilities include discount rates, mortality and morbidity rates, lapse and partial lapse rates, persistency, expenses, inflation, policy dividend and fund growth rate. Estimates are made as to the expected number of deaths for each of the years in which the Group is exposed to risk. The Group bases these estimates on standard industry and national mortality tables that reflect historical mortality experience, adjusted, where appropriate, to reflect the Group’s unique risk exposure. The estimated number of deaths determines the value of possible future benefits to be paid out which will be factored into ensuring sufficient cover by reserves, which in return is monitored against the current and future premiums. Lapse rates are based on the historical experience of the Group. Expenses are based on the renewal compensation cost structure and the maintenance expenses level of the Group. Discount rates are based on the investment strategy of the Group, with due regard to the expected recurring return on assets backing the insurance contracts.
Estimates for discount rates, mortality rates, lapse rates and expenses are determined at the date of acquisition, where applicable, and at the inception of the contract and are used to calculate the liability over the term of the contract. At each reporting date, these estimates are reassessed for adequacy with margin and changes will be reflected in adjustments to the liability.
(m) Amortisation of DAC and VOBAThe Group adopted an approach by which DAC of new business is amortised according to the expected future premiums or expected future profits, which are projected based on the Group’s best estimate assumptions and actual persistency. Assumptions as to projected future premiums or expected future profits are made at the date of policy issue and are applied during the lives of the contracts consistently.
VOBA is amortised over the estimated life of the contracts in the acquired portfolio on a systematic basis primarily based on expected future profits. Judgements are exercised in making appropriate estimate of future premiums or expected future profits.
(n) Business combination of FTLife InsuranceIn November 2019, the Group completed the acquisition of the entire equity interest of FTLife Insurance at a consideration of HK$21,812.2 million.
The Group accounted for the acquisition as a business combination in accordance with HKFRS 3 (Revised) “Business Combinations” which requires significant judgement and estimates for identification and valuation of assets acquired and liabilities and contingent liabilities assumed at the acquisition date.
The Group has made an assessment of the fair value of the assets and liabilities as at the acquisition date with assistance from an independent external expert. The fair value of identifiable net assets amounted to HK$16,235.9 million. A provisional goodwill of HK$5,576.3 million has been recognised by the Group as a result of this transaction. Further details of the acquisition are set out in note 50(a).

New World Development Company Limited222
Notes to the Financial Statements
7 REVENUES AND SEGMENT INFORMATION
Revenues recognised during the year are as follows:
2020 2019HK$m HK$m
RevenuesProperty development 19,207.5 38,511.5Property investment 4,349.5 3,669.4Roads 2,070.5 2,529.0Aviation — 161.6Construction 16,691.0 17,368.0Insurance (note (a)) 6,180.0 —Hotel operations 1,212.2 1,490.9Others 9,297.1 13,033.2
Total 59,007.8 76,763.6
Note a:
Revenues from insurance business are further analysed as follows:
2020 2019HK$m HK$m
Gross premiums on life insurance contracts 5,991.9 –Less: premiums ceded to reinsurers (224.7) – Premiums, net of reinsurance 5,767.2 – Fee income on insurance and investment contracts 411.2 –Reinsurance commission income and refund (2.0) –General insurance commission under agency agreements 3.6 – Fee and commission income 412.8 –
6,180.0 –
The Executive Committee of the Company, being the chief operating decision-maker, determines and reviews the Group’s internal reporting in order to assess performance and allocate resources. The operating segments are determined based on the afore-mentioned internal reporting and are reviewed regularly.
During the financial year ended 30 June 2020, following the completion of acquisition of FTLife Insurance and to better reflect the nature of the income streams and group strategies, the Group reclassified its reporting segments. The Executive Committee considers the business from products and services perspectives, which comprises property development, property investment, roads, aviation, construction, insurance, hotel operations and others (including facilities management, transport, environment, logistic, department store, media and technology and other strategic businesses) segments. The comparative segment information for the year ended 30 June 2019 has been restated to conform with the current period presentation accordingly.
The Executive Committee assesses the performance of the operating segments based on each segment’s operating profit. The measurement of segment operating profit excludes the effect of unallocated items (including corporate expenses, corporate financing income and corporate financing costs). In addition, taxation is not allocated to segments.
Sales between segments are carried out in accordance with terms agreed by the parties involved.

Annual Report 2020 223
Notes to the Financial Statements
7 REVENUES AND SEGMENT INFORMATION (CONTINUED)
Property development
Property investment Roads Aviation Construction Insurance
Hotel operations Others Consolidated
HK$m HK$m HK$m HK$m HK$m HK$m HK$m HK$m HK$m
2020Total revenues 19,208.7 4,521.9 2,070.5 — 24,832.2 6,180.0 1,212.2 9,453.4 67,478.9Inter-segment (1.2) (172.4) — — (8,141.2) — — (156.3) (8,471.1)
Revenues – external 19,207.5 4,349.5 2,070.5 — 16,691.0 6,180.0 1,212.2 9,297.1 59,007.8
Revenues from contracts with customers:— Recognised at a point in time 18,089.4 — 2,070.5 — — — 565.7 6,615.7 27,341.3— Recognised over time 1,118.1 — — — 16,691.0 412.8 646.5 2,681.4 21,549.8
19,207.5 — 2,070.5 — 16,691.0 412.8 1,212.2 9,297.1 48,891.1
Revenues from other source:— Rental income — 4,349.5 — — — — — — 4,349.5— Insurance income — — — — — 5,767.2 — — 5,767.2
— 4,349.5 — — — 5,767.2 — — 10,116.7
19,207.5 4,349.5 2,070.5 — 16,691.0 6,180.0 1,212.2 9,297.1 59,007.8
Segment results (note (a)) 10,504.2 2,175.1 811.1 (24.2) 674.7 819.2 (907.6) (1,995.0) 12,057.5Other gains/(losses), net (notes (b),(c)) 1,218.1 (111.1) (27.2) — (8.8) 48.0 — (774.5) 344.5Changes in fair value of investment
properties — 1,676.1 — — — — — (22.9) 1,653.2Unallocated items
Corporate expenses (1,222.4)Financing income (note (a)) 1,949.7Financing costs (note (a)) (4,758.0)
10,024.5Share of results
Joint ventures (note (d)) 482.8 (117.7) 276.1 316.5 — — (384.4) 434.0 1,007.3Associated companies (note (e)) 14.8 (329.0) 97.5 — 308.9 — — (329.6) (237.4)
Profit before taxation 10,794.4Taxation (7,528.0)
Profit for the year 3,266.4
Segment assets 131,858.2 178,379.4 14,991.4 6,332.7 14,283.0 54,973.2 19,289.0 36,167.9 456,274.8Interests in joint ventures 14,038.3 10,201.4 3,984.3 978.1 — — 4,789.7 9,021.5 43,013.3Interests in associated companies 5,471.3 1,791.1 2,530.9 — 2,009.4 — — 9,341.0 21,143.7Unallocated assets 79,764.1
Total assets 600,195.9
Segment liabilities 31,389.9 3,150.5 765.4 — 10,755.6 37,948.4 728.0 11,441.0 96,178.8Unallocated liabilities 224,272.0
Total liabilities 320,450.8
Additions to non-current assets (note (g)) 19,763.9 4,511.6 5,387.6 — 2,264.3 3,446.4 1,586.0 783.6 37,743.4Depreciation and amortisation 104.4 45.2 756.4 — 94.1 316.5 519.7 1,859.0 3,695.3Impairment charge and provision 16.8 26.0 — — 7.0 42.9 — 1,627.8 1,720.5

New World Development Company Limited224
Notes to the Financial Statements
7 REVENUES AND SEGMENT INFORMATION (CONTINUED)
Property development
Property investment Roads Aviation Construction Insurance
Hotel operations Others Consolidated
HK$m HK$m HK$m HK$m HK$m HK$m HK$m HK$m HK$m
2019Total revenues 38,511.5 3,851.0 2,529.0 161.6 25,774.4 — 1,490.9 13,256.3 85,574.7Inter-segment — (181.6) — — (8,406.4) — — (223.1) (8,811.1)
Revenues – external 38,511.5 3,669.4 2,529.0 161.6 17,368.0 — 1,490.9 13,033.2 76,763.6
Revenues from contracts with customers:— Recognised at a point in time 38,252.1 — 2,529.0 161.6 — — 576.5 10,497.0 52,016.2— Recognised over time 259.4 — — — 17,368.0 — 914.4 2,536.2 21,078.0
38,511.5 — 2,529.0 161.6 17,368.0 — 1,490.9 13,033.2 73,094.2
Revenues from other source:— Rental income — 3,669.4 — — — — — — 3,669.4— Insurance income — — — — — — — — —
— 3,669.4 — — — — — — 3,669.4
38,511.5 3,669.4 2,529.0 161.6 17,368.0 — 1,490.9 13,033.2 76,763.6
Segment results 13,438.2 1,617.6 1,199.5 47.4 736.2 — (261.3) (995.5) 15,782.1Other gains/(losses), net 156.2 43.9 27.6 2.6 (0.7) — (9.9) 119.1 338.8Changes in fair value and gain on
transfer to investment properties (note (f)) — 10,272.0 — — 0.8 — — 32.9 10,305.7
Unallocated itemsCorporate expenses (1,224.5)Financing income 1,716.2Financing costs (2,472.5)
24,445.8Share of results
Joint ventures 1,603.0 326.2 700.3 433.2 1.7 — 11.8 594.1 3,670.3Associated companies (4.1) 199.1 186.9 — 348.5 — — 282.4 1,012.8
Profit before taxation 29,128.9Taxation (7,489.8)
Profit for the year 21,639.1
Segment assets 104,877.6 178,943.2 10,204.8 6,592.0 7,926.7 3,120.0 18,225.0 32,565.8 362,455.1Interests in joint ventures 18,456.5 10,465.0 4,829.4 1,612.9 0.1 — 5,200.9 10,300.7 50,865.5Interests in associated companies 6,200.5 4,581.6 2,573.1 — 2,029.0 — — 9,947.7 25,331.9Unallocated assets 64,632.4
Total assets 503,284.9
Segment liabilities 29,567.2 2,411.4 475.1 — 8,877.8 — 438.4 8,183.2 49,953.1Unallocated liabilities 177,967.3
Total liabilities 227,920.4
Additions to non-current assets (note (g)) 11,490.6 10,859.1 34.0 — 31.9 3,120.0 848.5 769.3 27,153.4Depreciation and amortisation 53.6 55.3 888.0 — 49.7 — 347.3 1,060.2 2,454.1Impairment charge and provision 293.3 2.9 — — — — 8.8 457.7 762.7

Annual Report 2020 225
Notes to the Financial Statements
7 REVENUES AND SEGMENT INFORMATION (CONTINUED)
Hong KongMainland
China Others TotalHK$m HK$m HK$m HK$m
2020Revenues
Property development 4,541.9 14,665.6 — 19,207.5Property investment 2,590.5 1,759.0 — 4,349.5Roads — 2,070.5 — 2,070.5Aviation — — — —Construction 16,416.1 271.8 3.1 16,691.0Insurance 6,180.0 — — 6,180.0Hotel operations 708.0 278.9 225.3 1,212.2Others 6,139.3 2,934.4 223.4 9,297.1
36,575.8 21,980.2 451.8 59,007.8
Non-current assets (note (g)) 169,232.5 110,854.9 1,355.7 281,443.1
Hong KongMainland
China Others TotalHK$m HK$m HK$m HK$m
2019Revenues
Property development 23,189.1 15,322.4 — 38,511.5Property investment 1,942.3 1,727.1 — 3,669.4Roads — 2,529.0 — 2,529.0Aviation — — 161.6 161.6Construction 16,910.9 457.1 — 17,368.0Insurance — — — —Hotel operations 781.8 414.0 295.1 1,490.9Others 7,884.8 4,458.7 689.7 13,033.2
50,708.9 24,908.3 1,146.4 76,763.6
Non-current assets (note (g)) 159,669.2 89,955.5 1,419.8 251,044.5
Notes:
(a) For the year ended 30 June 2020, segment results of insurance segment included overlay approach adjustments on financial assets of HK$208.2 million, insurance related financing income of HK$877.3 million and financing costs of HK$79.9 million.
(b) For the year ended 30 June 2020, property development segment included one-off gain on remeasuring previously held equity interest of a joint venture at fair value upon further acquisition as a subsidiary of HK$925.8 million.
(c) For the year ended 30 June 2020, others segment included impairment loss on property, plant and equipment and goodwill in relation to transport business of HK$375.0 million and HK$386.9 million respectively.
(d) For the year ended 30 June 2020, the share of results of joint ventures within aviation segment included the Group’s share of impairment loss/loss allowance of HK$107.7 million in relation to Goshawk Aviation Limited’s assets impairment and provision for expected credit loss on receivables.
(e) For the year ended 30 June 2020, the share of results of associated companies within others segment included an impairment loss of HK$330.0 million in relation to the Group’s interest in Tharisa plc, a listed associated company.
(f) For the year ended 30 June 2019, properties held for sale had been transferred to investment properties at fair value and the related changes have been included in the changes in fair value of and gain on transfer to investment properties amounted to HK$1,916.3 million.
(g) Non-current assets represent non-current assets other than financial instruments, interests in joint ventures, interests in associated companies, deferred tax assets, value of business acquired, deferred acquisition costs and long-term loans and receivables, long-term prepayments and deposits and policy loans within other non-current assets.

New World Development Company Limited226
Notes to the Financial Statements
8 OTHER INCOME
2020 2019HK$m HK$m
Dividend income from financial assets at FVOCI and financial assets at FVPL 243.8 121.4
9 OTHER GAINS, NET
2020 2019HK$m HK$m
Gain on remeasuring of previously held interest of a joint venture at fair value upon further acquisition to become a subsidiary 925.8 —
Gain associated with investments related to unit-linked contracts 122.2 —Charges related to unit-linked contracts (133.9) —Net (loss)/gain on fair value of financial assets at FVPL (139.1) 219.7Net gain on fair value of derivative financial instruments 444.5 20.0Write back the loss allowance on loans and other receivables 57.5 240.0Net gain/(loss) on disposal of
Debt instruments as financial assets at FVOCI 306.6 —Financial assets at FVPL 78.8 103.5Investment properties, property, plant and equipment, right-of-use assets and
intangible concession rights 82.0 35.6Subsidiaries 357.4 549.2Joint ventures (35.2) 0.6Associated companies (110.0) 49.0
Impairment loss/loss allowance onLoans, debtors, premium receivables and other receivables (131.3) (344.1)Debt instruments as financial assets at FVOCI (32.2) —Interests in associated companies (334.8) —Goodwill (775.9) (165.0)Inventories (47.1) —Properties under development — (237.6)Property, plant and equipment (386.9) (16.0)Right-of-use assets (12.3) —
Provision for onerous contract (230.0) —Rent concession, government grants and subsidies 368.7 —Loss on lease modification of lease receivables (34.1) —Net exchange gains/(losses) 3.8 (116.1)
344.5 338.8
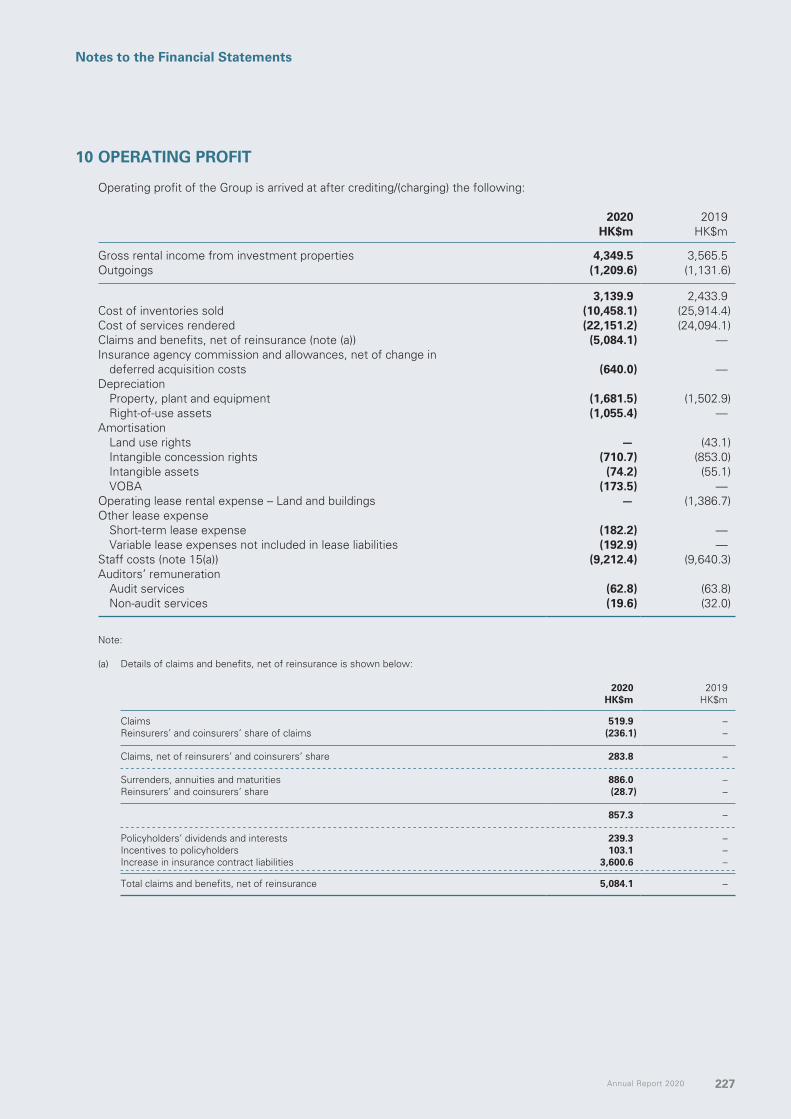
Annual Report 2020 227
Notes to the Financial Statements
10 OPERATING PROFIT
Operating profit of the Group is arrived at after crediting/(charging) the following:
2020 2019HK$m HK$m
Gross rental income from investment properties 4,349.5 3,565.5Outgoings (1,209.6) (1,131.6)
3,139.9 2,433.9Cost of inventories sold (10,458.1) (25,914.4)Cost of services rendered (22,151.2) (24,094.1)Claims and benefits, net of reinsurance (note (a)) (5,084.1) —Insurance agency commission and allowances, net of change in
deferred acquisition costs (640.0) —Depreciation
Property, plant and equipment (1,681.5) (1,502.9)Right-of-use assets (1,055.4) —
AmortisationLand use rights — (43.1)Intangible concession rights (710.7) (853.0)Intangible assets (74.2) (55.1)VOBA (173.5) —
Operating lease rental expense – Land and buildings — (1,386.7)Other lease expense
Short-term lease expense (182.2) —Variable lease expenses not included in lease liabilities (192.9) —
Staff costs (note 15(a)) (9,212.4) (9,640.3)Auditors’ remuneration
Audit services (62.8) (63.8)Non-audit services (19.6) (32.0)
Note:
(a) Details of claims and benefits, net of reinsurance is shown below:
2020 2019HK$m HK$m
Claims 519.9 –Reinsurers’ and coinsurers’ share of claims (236.1) – Claims, net of reinsurers’ and coinsurers’ share 283.8 – Surrenders, annuities and maturities 886.0 –Reinsurers’ and coinsurers’ share (28.7) –
857.3 – Policyholders’ dividends and interests 239.3 –Incentives to policyholders 103.1 –Increase in insurance contract liabilities 3,600.6 – Total claims and benefits, net of reinsurance 5,084.1 –

New World Development Company Limited228
Notes to the Financial Statements
11 FINANCING COSTS
2020 2019HK$m HK$m
Interest on bank loans and overdrafts 4,238.9 3,754.0Interest on fixed rate bonds and notes payable 2,563.3 2,179.4Interest on loans from non-controlling shareholders 171.5 119.3Interest on lease liabilities (note 51(b)) 298.7 —
7,272.4 6,052.7
Capitalised as (note):Cost of properties for/under development (1,813.4) (1,903.3)Cost of assets under construction and investment properties under development (621.1) (1,676.9)
4,837.9 2,472.5
Note:
To the extent funds are borrowed generally and used for the purpose of financing certain properties for/under development, assets under construction and investment properties under development, the capitalisation rate used to determine the amounts of borrowing costs eligible for the capitalisation is 3.7% (2019: 4.1%) per annum.
12 TAXATION
2020 2019HK$m HK$m
Current taxationHong Kong profits tax 1,307.8 1,798.5Mainland China and overseas taxation 3,120.8 2,057.7Mainland China land appreciation tax 4,800.6 3,703.4
Deferred taxation (note 28)Valuation of investment properties 120.6 175.0Other temporary differences (1,821.8) (244.8)
7,528.0 7,489.8
Hong Kong profits tax has been provided at the rate of 16.5% (2019: 16.5%) on the estimated assessable profit for the year.
The assessable profits of the Group’s insurance business are computed in accordance with the special provisions of the Hong Kong Inland Revenue Ordinance (“IRO”). Profits tax for the long-term insurance business, as defined by IRO, is computed at a rate of 16.5% of 5% of net premiums (gross premiums received less reinsurance premiums ceded) of the life insurance business in accordance with Section 23(1)(a) of IRO.
Taxation on Mainland China and overseas profits has been calculated on the estimated taxable profit for the year at the rates of taxation prevailing in the countries in which the Group operates. These rates range from 12% to 28% (2019: 12% to 25%).
Withholding tax on dividends is mainly provided at the rate of 5% or 10% (2019: 5% or 10%).
Mainland China land appreciation tax is provided at progressive rates ranging from 30% to 60% (2019: 30% to 60%) on the appreciation of land value, being the proceeds of sale of properties less deductible expenditures including costs of land use rights and property development expenditures.
Share of results of joint ventures and associated companies is stated after deducting the share of taxation of joint ventures and associated companies of HK$422.1 million and HK$156.1 million (2019: HK$954.8 million and HK$178.3 million) respectively.

Annual Report 2020 229
Notes to the Financial Statements
12 TAXATION (CONTINUED)
The taxation on the Group’s profit before taxation differs from the theoretical amount that would arise using the taxation rate of Hong Kong as follows:
2020 2019HK$m HK$m
Profit before taxation and share of results of joint ventures and associated companies 10,024.5 24,445.8
Calculated at a taxation rate of 16.5% (2019: 16.5%) 1,654.0 4,033.6Effect of different taxation rates in other countries 960.8 992.6Tax on 5% of net premium of life insurance business 51.2 —Results of life insurance business not taxable at the statutory rate (143.3) —Income not subject to taxation (1,419.6) (1,779.0)Expenses not deductible for taxation purposes 2,158.3 870.2Tax losses not recognised 580.7 527.2Temporary differences not recognised 39.1 144.0Utilisation of previously unrecognised tax losses (168.7) (94.6)Deferred taxation on undistributed profits 36.2 164.5Recognition of previously unrecognised temporary differences (32.8) (10.4)Recognition of previously unrecognised tax losses (13.3) (14.9)Under/(over) provision in prior years 211.2 (121.0)Land appreciation tax deductible for calculation of income tax purpose (1,186.4) (925.8)
2,727.4 3,786.4Mainland China land appreciation tax 4,800.6 3,703.4
Taxation charge 7,528.0 7,489.8
13 EARNINGS PER SHARE
The calculation of basic and diluted earnings per share for the year is based on the following:
2020 2019HK$m HK$m
Profit attributable to shareholders of the Company for calculating basic earnings per share 1,096.2 18,160.1
Adjustment on the effect of dilution in the results of subsidiaries (note (b)) — (5.7)
Profit attributable to shareholders of the Company for calculating diluted earnings per share 1,096.2 18,154.4
Number of shares (million)2020 2019
Adjusted
Weighted average number of shares for calculating basic earnings per share 2,554.9 2,553.0Effect of dilutive potential ordinary shares upon the exercise of share options
(note (b)) — 2.1
Weighted average number of shares for calculating diluted earnings per share 2,554.9 2,555.1
Notes:
(a) For the year ended 30 June 2019, diluted earnings per share is calculated by adjusting the weighted average number of ordinary shares outstanding to assume conversion of all dilutive potential ordinary shares.
(b) On 23 June 2020, every four issued shares of the Company were consolidated into one share of the Company (each a “Consolidated Share”) and the number of Consolidated Shares was rounded down to the nearest whole number by disregarding each and every fractional Consolidated Share which would otherwise arise (the “Share Consolidation”).
Comparative figures of the weighted average number of shares for calculating basic earnings per share and diluted earnings per share have been adjusted on the assumption that the Share Consolidation have been effective in the prior year.

New World Development Company Limited230
Notes to the Financial Statements
14 DIVIDENDS
2020 2019HK$m HK$m
Interim dividend of HK$0.14 per share (before Share Consolidation)/HK$0.56 per share (after Share Consolidation) (2019: HK$0.14 (before Share Consolidation)/HK$0.56 (after Share Consolidation) per share) 1,431.3 1,430.1
Final dividend proposed of HK$1.48 per share (2019: HK$0.37 (before Share Consolidation)/HK$1.48 (after Share Consolidation) per share) 3,772.7 3,783.6
5,204.0 5,213.7
At a meeting held on 30 September 2020, the Directors recommended a final dividend of HK$1.48 per share. This proposed dividend was not reflected as a dividend payable in these financial statements, but will be reflected as an appropriation of retained profits for the year ending 30 June 2021.
Subject to the passing of the relevant resolutions at the annual general meeting of the Company to be held on 26 November 2020, it is expected that the proposed final dividend will be distributed to shareholders on or about 21 December 2020.
15 STAFF COSTS
(a) Staff costs
2020 2019HK$m HK$m
Wages, salaries and other benefits 9,879.0 10,442.5Pension costs – defined benefit plans 6.4 46.1Pension costs – defined contribution plans 384.1 353.1Share options (note (b)) 29.8 67.0
10,299.3 10,908.7Less: Amounts capitalised in investment properties under development and
properties for/under development (1,086.9) (1,268.4)
9,212.4 9,640.3
Staff costs include directors’ remuneration.
(b) Share optionsDuring the year, the Company and its subsidiary, NWS Holdings Limited (“NWSH”), operate share option schemes whereby options may be granted to eligible employees and directors, to subscribe for shares of the Company and NWSH respectively.
Details of share options are as follows:
Grantor Date of grant Exercise price At 1 July 2019 ExercisedLapsed/
cancelled AdjustedAt 30 June
2020
Number of share options
exercisable as at 30 June
2020 NoteHK$
The Company 27 October 2014 to 22 May 2019 Note (i) 164,895,223 (45,752,065) (10,870,908) (81,225,000) 27,047,250 14,719,121 (i)Weighted average exercise price of
each category (HK$)– Before Share Consolidation — 10.228 7.659 10.897 — — —– After Share Consolidation — — — — — 44.988 44.516
NWSH 9 March 2015 14.120 26,047,602 — (26,047,602) — — — (ii)Weighted average exercise price of
each category (HK$) — 14.120 — 14.120 — — —
Annual Report 2020 231
Notes to the Financial Statements
15 STAFF COSTS (CONTINUED)
(b) Share options (continued)
Notes:
(i) A share option scheme was adopted by the Company on 24 November 2006 (“2006 Scheme”) and amended on 13 March 2012 which will be valid and effective for a period of ten years from the date of adoption. On 27 October 2014, 7 July 2015, 9 March 2016, 10 June 2016, 34,400,000, 20,100,000, 20,200,000, and 68,037,928 share options were granted to Directors and certain eligible participants at the exercise price of HK$9.510, HK$9.976, HK$7.200, HK$7.540 per share respectively.
A share option scheme was adopted by the Company on 22 November 2016 (“2016 Scheme”) which will be valid and effective for a period of ten years from the date of adoption. On 3 July 2017, 6 July 2018 and 22 May 2019, 53,450,000, 39,250,000 and 46,550,000 share options were granted to Directors and certain eligible participants at the exercise price of HK$10.036, HK$11.040 and HK$12.344 per share before Share Consolidation respectively.
As a result of the Share Consolidation, adjustments were made to the number of shares subject to, and exercise price of, the outstanding share options under the 2016 Scheme (the “Share Options Adjustments”). The Share Option Adjustments took effect on 23 June 2020.
The exercise price of the outstanding share option granted on 3 July 2017, 6 July 2018 and 22 May 2019 have been adjusted to HK$40.144, HK$44.160 and HK$49.376 per share respectively as a result of Share Consolidation.
All share options under the 2006 Scheme were either exercised or lapsed before the Share Consolidation took effect. Therefore, no Share Options Adjustments are made to these figures.
The share options granted on 7 July 2015 were divided into 4 tranches exercisable from 7 July 2015, 7 July 2016, 7 July 2017 and 7 July 2018 respectively to 6 July 2019.
The share options granted on 9 March 2016 were divided into 4 tranches exercisable from 9 March 2016, 9 March 2017, 9 March 2018 and 9 March 2019 respectively to 8 March 2020.
The share options granted on 10 June 2016 were divided into 4 tranches exercisable from 10 June 2016, 10 June 2017, 10 June 2018 and 10 June 2019 respectively to 9 June 2020.
The share options granted on 3 July 2017 were divided into 4 tranches exercisable from 3 July 2017, 3 July 2018, 3 July 2019 and 3 July 2020 respectively to 2 July 2021.
The share options granted on 6 July 2018 were divided into 4 tranches exercisable from 6 July 2018, 6 July 2019, 6 July 2020 and 6 July 2021 respectively to 5 July 2022.
The share options granted on 22 May 2019 were divided into 4 tranches exercisable from 22 May 2019, 22 May 2020, 22 May 2021 and 22 May 2022 respectively to 21 May 2023.
For the year ended 30 June 2020, the weighted average share price at the time of exercise was HK$9.397 per share before Share Consolidation (2019: HK$11.861 per share), no share option was exercised after Share Consolidation.
(ii) The share option scheme of NWSH (“NWSH Share Option Scheme”), which was adopted on 21 November 2011, is valid and effective for a period of ten years from the date of adoption. The Board may, at their discretion, grant options to any eligible participant as defined under the share option scheme to subscribe for the shares of NWSH. The total number of shares which may be issued upon exercise of all options to be granted under the share option scheme must not in aggregate exceed 10% of the share capital of NWSH in issue as at 21 November 2011, i.e. 3,388,900,598 shares.
On 9 March 2015, 55,470,000 share options were granted to directors and certain eligible participants at the exercise price of HK$14.160 per share, which represents the average closing price of NWSH’s shares in the daily quotations sheets of the Hong Kong Stock Exchange for the five trading days immediately preceding 9 March 2015. All unexercised share options were lapsed on 8 March 2020.
Pursuant to the NWSH Share Option Scheme, the number of unexercised share options and the exercise price may be subject to adjustment in case of alteration in the capital structure of NWSH. Due to the distribution of dividends of NWSH in scrip form, several adjustments had been made to the number and the exercise price of outstanding share options in accordance with the Share Option Scheme in prior years. With effect from 15 May 2017, the exercise price per share for the share options granted was adjusted to HK$14.120.
The share options were vested according to the NWSH Share Option Scheme and the terms of grant provided that for the vesting to occur the grantee has to remain as an eligible participant on such vesting date.
All share options outstanding as at 30 June 2019 are fully vested.
(iii) The Binomial pricing model requires input of subjective assumptions such as the expected stock price volatility. Change in the subjective input may materially affect the fair value estimates.
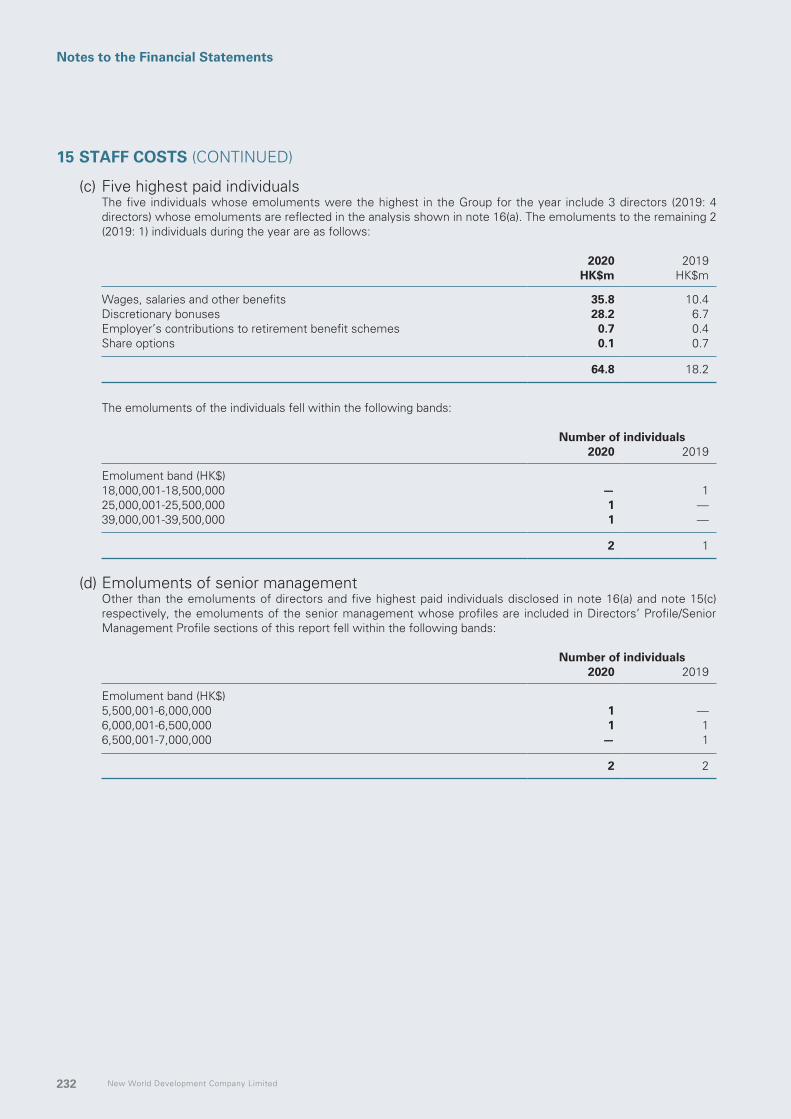
New World Development Company Limited232
Notes to the Financial Statements
15 STAFF COSTS (CONTINUED)
(c) Five highest paid individualsThe five individuals whose emoluments were the highest in the Group for the year include 3 directors (2019: 4 directors) whose emoluments are reflected in the analysis shown in note 16(a). The emoluments to the remaining 2 (2019: 1) individuals during the year are as follows:
2020 2019HK$m HK$m
Wages, salaries and other benefits 35.8 10.4Discretionary bonuses 28.2 6.7Employer’s contributions to retirement benefit schemes 0.7 0.4Share options 0.1 0.7
64.8 18.2
The emoluments of the individuals fell within the following bands:
Number of individuals2020 2019
Emolument band (HK$)18,000,001-18,500,000 — 125,000,001-25,500,000 1 —39,000,001-39,500,000 1 —
2 1
(d) Emoluments of senior managementOther than the emoluments of directors and five highest paid individuals disclosed in note 16(a) and note 15(c) respectively, the emoluments of the senior management whose profiles are included in Directors’ Profile/Senior Management Profile sections of this report fell within the following bands:
Number of individuals2020 2019
Emolument band (HK$)5,500,001-6,000,000 1 —6,000,001-6,500,000 1 16,500,001-7,000,000 — 1
2 2

Annual Report 2020 233
Notes to the Financial Statements
16 BENEFITS AND INTERESTS OF DIRECTORS
(a) Directors’ emoluments
As director (note(i))
Name of Directors Fees SalariesDiscretionary
bonuses
Estimated money value of other benefits
(note (iii))
Employer’s contribution
to a retirement benefit scheme
As management
(note (ii)) TotalHK$m HK$m HK$m HK$m HK$m HK$m HK$m
Year ended 30 June 2020Dr. Cheng Kar-Shun, Henry 1.8 — — 0.5 — 54.3 56.6
Paid by the Company and its unlisted subsidiaries 0.9 — — 0.5 — 38.3 39.7
Paid by NWSH 0.8 — — — — 16.0 16.8Paid by NWDS 0.1 — — — — — 0.1
Mr. Doo Wai-Hoi, William 0.4 — — — — — 0.4Dr. Cheng Chi-Kong, Adrian 1.0 — — 0.5 — 47.5 49.0
Paid by the Company and its unlisted subsidiaries 0.4 — — 0.5 — 42.5 43.4
Paid by NWSH 0.4 — — — — 5.0 5.4Paid by NWDS 0.2 — — — — — 0.2
Mr. Yeung Ping-Leung, Howard 0.7 — — — — — 0.7Mr. Cha Mou-Sing, Payson 0.8 — — — — — 0.8
Paid by the Company and its unlisted subsidiaries 0.7 — — — — — 0.7
Paid by a subsidiary of NWSH 0.1 — — — — — 0.1
Mr. Cheng Kar-Shing, Peter 0.4 8.0 0.7 — 0.8 — 9.9Paid by the Company and
its unlisted subsidiaries 0.3 8.0 0.7 — 0.8 — 9.8Paid by a subsidiary of NWSH 0.1 — — — — — 0.1
Mr. Ho Hau-Hay, Hamilton 0.8 — — — — — 0.8Mr. Lee Luen-Wai, John 0.9 — — — — — 0.9Mr. Liang Cheung-Biu, Thomas 0.7 — — — — — 0.7Mr. Ip Yuk-Keung, Albert 0.7 — — 0.2 — — 0.9Ms. Ki Man-Fung, Leonie 0.4 6.2 0.5 — 0.6 — 7.7Mr. Cheng Chi-Heng 0.4 — — — — 2.1 2.5Ms. Cheng Chi-Man, Sonia 0.4 — — — — 17.8 18.2Mr. Au Tak-Cheong* 0.4 — — 0.1 — 8.5 9.0
Paid by the Company and its unlisted subsidiaries 0.3 — — 0.1 — 8.5 8.9
Paid by NWDS 0.1 — — — — — 0.1
Mr. Sitt Nam-Hoi 0.5 — — 0.3 — 18.7 19.5Mr. So Chung-Keung, Alfred* 0.2 — — 0.8 — 16.0 17.0Ms. Huang Shaomei, Echo 0.1 — — 0.7 — 20.8 21.6Ms. Chiu Wai-Han, Jenny 0.1 — — 0.1 — 4.7 4.9
Total 10.7 14.2 1.2 3.2 1.4 190.4 221.1
* resigned during the year

New World Development Company Limited234
Notes to the Financial Statements
16 BENEFITS AND INTERESTS OF DIRECTORS (CONTINUED)
(a) Directors’ emoluments (continued)
As director (note(i))
Name of Directors Fees SalariesDiscretionary
bonuses
Estimated money value of
other benefits (note (iii))
Employer’s contribution
to a retirement benefit scheme
As management
(note (ii)) TotalHK$m HK$m HK$m HK$m HK$m HK$m HK$m
Year ended 30 June 2019Dr. Cheng Kar-Shun, Henry 1.9 — — 3.1 — 63.0 68.0
Paid by the Company and its unlisted subsidiaries 1.0 — — 3.1 — 43.1 47.2
Paid by NWSH 0.8 — — — — 19.9 20.7Paid by NWDS 0.1 — — — — — 0.1
Mr. Doo Wai-Hoi, William 0.3 — — — — — 0.3Dr. Cheng Chi-Kong, Adrian 0.6 — — 2.6 — 41.0 44.2
Paid by the Company and its unlisted subsidiaries 0.4 — — 2.6 — 41.0 44.0
Paid by NWSH — — — — — — —Paid by NWDS 0.2 — — — — — 0.2
Mr. Yeung Ping-Leung, Howard 0.6 — — 0.2 — — 0.8Mr. Cha Mou-Sing, Payson 0.8 — — 0.2 — — 1.0
Paid by the Company and its unlisted subsidiaries 0.7 — — 0.2 — — 0.9
Paid by a subsidiary of NWSH 0.1 — — — — — 0.1
Mr. Cheng Kar-Shing, Peter 0.4 7.6 1.7 0.2 0.8 — 10.7Paid by the Company and
its unlisted subsidiaries 0.3 7.6 1.7 0.2 0.8 — 10.6Paid by a subsidiary of NWSH 0.1 — — — — — 0.1
Mr. Ho Hau-Hay, Hamilton 0.7 — — 0.2 — — 0.9Mr. Lee Luen-Wai, John 0.8 — — 0.2 — — 1.0Mr. Liang Cheung-Biu, Thomas 0.7 — — 0.2 — — 0.9Mr. Ip Yuk-Keung, Albert 0.7 — — 0.2 — — 0.9Ms. Ki Man-Fung, Leonie 0.3 6.0 1.5 0.8 0.6 — 9.2Mr. Cheng Chi-Heng 0.4 — — 0.2 — 2.3 2.9Ms. Cheng Chi-Man, Sonia 0.4 — — 0.7 — 18.0 19.1Mr. Au Tak-Cheong 0.6 — — 0.4 — 9.2 10.2
Paid by the Company and its unlisted subsidiaries 0.5 — — 0.4 — 9.2 10.1
Paid by NWDS 0.1 — — — — — 0.1
Mr. Sitt Nam-Hoi 0.4 — — 0.6 — 14.9 15.9Mr. So Chung-Keung, Alfred 0.5 — — 0.7 — 18.5 19.7
Total 10.1 13.6 3.2 10.5 1.4 166.9 205.7
Annual Report 2020 235
Notes to the Financial Statements
16 BENEFITS AND INTERESTS OF DIRECTORS (CONTINUED)
(a) Directors’ emoluments (continued)Notes:
(i) The amounts represented emoluments paid or receivable in respect of a person’s services as a director, whether of the Company or its subsidiary undertakings.
(ii) The amounts represented emoluments paid or receivable in respect of a person’s other services in connection with the management of the affairs of the Company or its subsidiary undertakings and included salaries, discretionary bonuses, employer’s contributions to retirement benefit schemes and housing allowance.
(iii) Other benefits represented share options. The value of the share options granted to the directors of the Company under the share option schemes of the Company and its subsidiaries represents the fair value of these options charged to the consolidated income statement for the year in accordance with HKFRS 2.
(iv) No director waived or agreed to waive any emoluments during the year.
(b) Directors’ material interests in transactions, arrangements or contracts
On 10 April 2017, a master services agreement (the “Mr. Doo MSA”) was entered into between the Company and Mr. Doo Wai-Hoi, William, Non-executive Vice-chairman (“Mr. Doo”) for a term of three years commencing from 1 July 2017 up to and including 30 June 2020 in respect of the provision of the operational and rental services by companies owned by Mr. Doo to the Group, and vice versa. Subject to compliance with the relevant requirements under the Listing Rules, upon expiration of the initial term or subsequent renewal term, the Mr. Doo MSA will be automatically renewed for a successive period of three years thereafter (or such other period permitted under the Listing Rules). The Mr. Doo MSA and the annual caps set for each of the three financial years ending 30 June 2020 were approved by the independent shareholders of the Company on 26 May 2017. For the year ended 30 June 2020, the aggregate amount of the transactions amounted to approximately HK$1,567.8 million (2019: HK$1,711.8 million).
Same as mentioned above, no other significant transactions, arrangements or contracts in relation to the Group’s business to which the Company was a party and in which a director of the Company had a material interest, whether directly or indirectly, subsisted at the end of the year or at any time during the year.

New World Development Company Limited236
Notes to the Financial Statements
17 INVESTMENT PROPERTIES
2020 2019HK$m HK$m
Completed investment properties 148,072.6 110,474.5Investment properties under development 21,644.9 62,852.2
169,717.5 173,326.7
Completed investment properties
Investment properties
under development Total
HK$m HK$m HK$m
At 1 July 2019 110,474.5 62,852.2 173,326.7Translation differences (1,546.5) (313.2) (1,859.7)Acquisition of a subsidiary — 320.5 320.5Disposal of subsidiaries (1,506.4) — (1,506.4)Additions 2,653.9 1,213.3 3,867.2Transfer between investment properties, property, plant and
equipment and right-of-use assets (40.3) — (40.3)Transfer between investment properties and properties under
development 21.9 (1,900.7) (1,878.8)Disposals (4,164.9) — (4,164.9)Changes in fair value 1,305.6 347.6 1,653.2Transfer upon completion 40,874.8 (40,874.8) —
At 30 June 2020 148,072.6 21,644.9 169,717.5
Completed investment properties
Investment properties
under development Total
HK$m HK$m HK$m
At 1 July 2018 86,254.8 63,472.9 149,727.7Translation differences (2,275.3) (356.1) (2,631.4)Acquisition of a subsidiary — 2,672.0 2,672.0Disposal of a subsidiary (59.2) — (59.2)Additions 132.0 8,904.9 9,036.9Transfer between investment properties, property, plant and
equipment and land use rights (321.8) — (321.8)Transfer between investment properties, properties under
development and properties held for sale 3,482.9 1,361.3 4,844.2Disposals (247.4) — (247.4)Changes in fair value and gain on transfer (note) 7,972.8 2,332.9 10,305.7Transfer upon completion 15,535.7 (15,535.7) —
At 30 June 2019 110,474.5 62,852.2 173,326.7
Note: The amount included HK$1,916.3 million in respect of the gain on transfer of properties held for sale to investment properties during the year ended 30 June 2019.

Annual Report 2020 237
Notes to the Financial Statements
17 INVESTMENT PROPERTIES (CONTINUED)
Valuation processes of the GroupThe Group measures its investment properties at fair value. The investment properties were revalued by Jones Lang LaSalle Corporate Appraisal and Advisory Limited, Savills Valuation and Professional Services Limited and Knight Frank Petty Limited, independent qualified valuers, who hold recognised relevant professional qualification and have recent experience in the locations and segments of the investment properties valued, at 30 June 2020 on an open market value basis. For all investment properties, their current use equates to the highest and best use.
The Group’s finance department includes a team that review the valuation performed by the independent valuers for financial reporting purposes. This team reports directly to the senior management and the Audit Committee. Discussions of valuation processes and results are held between the management and valuers at least once every six months, in line with the Group’s interim and annual reporting dates.
At each financial period end, the finance department verifies all major inputs to the independent valuation reports; assesses property valuation movements when compared to the prior year valuation reports; and holds discussions with the independent valuers.
Valuation techniquesFair value of completed investment properties for commercial, residential and carparks in Hong Kong and Mainland China is generally derived using the income capitalisation method and wherever appropriate, by direct comparison method. Income capitalisation method is based on capitalisation of the net income and reversionary income potential by adopting appropriate capitalisation rates, which are derived from analysis of sale transactions and valuers’ interpretation of prevailing investor requirements or expectations. The prevailing market rents adopted in the valuation have reference to recent lettings, within the subject properties and other comparable properties.
Direct comparison method is based on comparing the property to be valued directly with other comparable properties, which have recently transacted. However, given the heterogeneous nature of real estate properties, appropriate adjustments are usually required to allow for any qualitative differences that may affect the price likely to be achieved by the property under consideration.
Fair value of commercial properties and carpark under development is generally derived using the residual method and wherever appropriate, by direct comparison method. Residual method is essentially a means of valuing the completed properties by reference to its development potential by deducting development costs together with developer’s profit and risk from the estimated capital value of the proposed development assuming completed as at the date of valuation.
At 30 June 2020 and 2019, all investment properties are included in level 3 in the fair value hierarchy.
There were no changes to the valuation techniques during the year and there were no transfers among the fair value hierarchy during the year.

New World Development Company Limited238
Notes to the Financial Statements
17 INVESTMENT PROPERTIES (CONTINUED)
Valuation techniques (continued)Information about fair value measurements using significant unobservable inputs:
Range of significant unobservable inputs
2020Fair value
HK$mValuation techniques
Prevailingmarket rent
per month Unit priceCapitalisation
rate
Completed investment properties Hong Kong
Commercial 86,233.6 Income capitalisation HK$23-HK$450per square feet
N/A 1.5%-5.2%
16,362.7 Direct comparison N/A HK$9,500–HK$23,200
per square feet
N/A
Carparks 3,277.0 Income capitalisation HK$2,700-HK$7,180
per carpark space
N/A 3.25%-4.0%
Mainland China and othersCommercial 32,178.5 Income capitalisation HK$11-HK$619
per square metreN/A 2.0%– 9.0%
175.6 Direct comparison N/A HK$10,400–HK$17,000
per square metre
N/A
Serviced apartment 2,229.1 Income capitalisation HK$107–HK$203per square metre
N/A 3.0%–6.25%
Carparks 7,616.1 Direct comparison N/A HK$143,000–HK$659,000
per carpark space
N/A
Total 148,072.6
Range of significant unobservable inputs
2020Fair value
HK$mValuation techniques
Prevailingmarket rent
per month Unit price
Estimateddeveloper’s profitand risk margins
Investment properties under development
Commercial 21,591.2 Residual N/A HK$1,300–HK$58,500
per square feet
4.2%–15.0%
Carparks 53.7 Residual N/A HK$242,000per carpark space
4.2%
Total 21,644.9
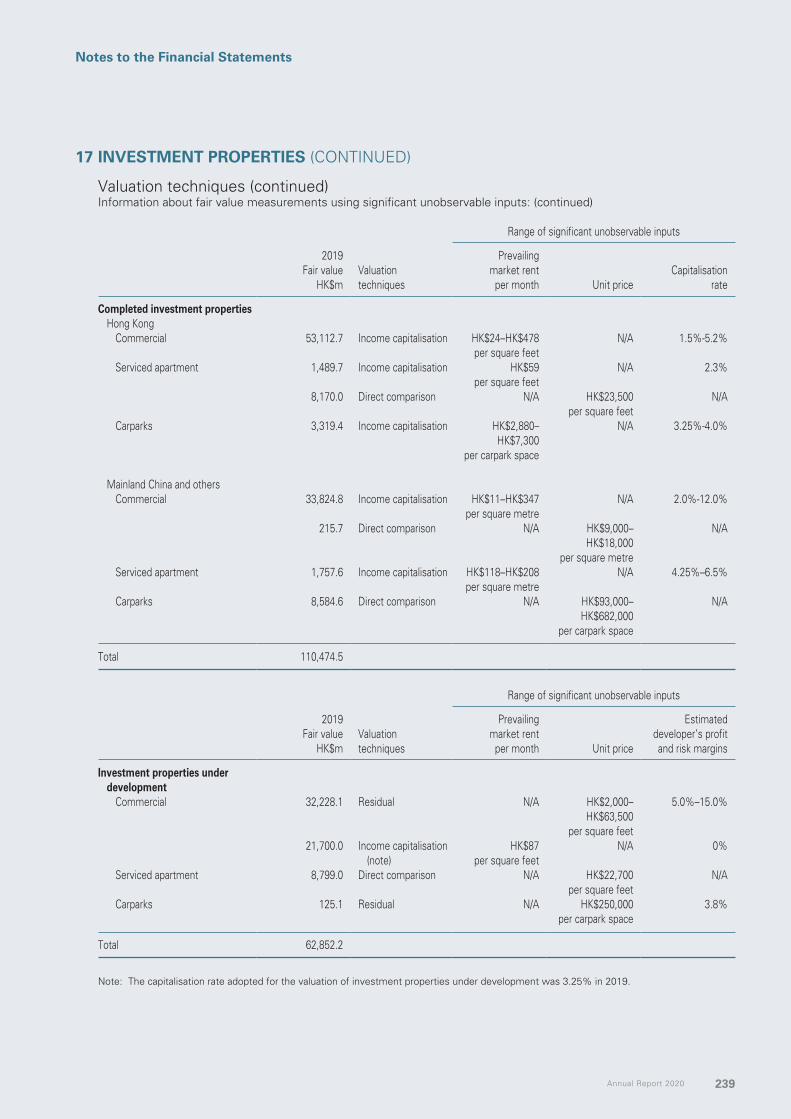
Annual Report 2020 239
Notes to the Financial Statements
17 INVESTMENT PROPERTIES (CONTINUED)
Valuation techniques (continued)Information about fair value measurements using significant unobservable inputs: (continued)
Range of significant unobservable inputs
2019Fair value
HK$mValuation techniques
Prevailingmarket rentper month Unit price
Capitalisationrate
Completed investment properties Hong Kong
Commercial 53,112.7 Income capitalisation HK$24–HK$478per square feet
N/A 1.5%-5.2%
Serviced apartment 1,489.7 Income capitalisation HK$59per square feet
N/A 2.3%
8,170.0 Direct comparison N/A HK$23,500per square feet
N/A
Carparks 3,319.4 Income capitalisation HK$2,880–HK$7,300
per carpark space
N/A 3.25%-4.0%
Mainland China and othersCommercial 33,824.8 Income capitalisation HK$11–HK$347
per square metreN/A 2.0%-12.0%
215.7 Direct comparison N/A HK$9,000–HK$18,000
per square metre
N/A
Serviced apartment 1,757.6 Income capitalisation HK$118–HK$208per square metre
N/A 4.25%–6.5%
Carparks 8,584.6 Direct comparison N/A HK$93,000–HK$682,000
per carpark space
N/A
Total 110,474.5
Range of significant unobservable inputs
2019Fair value
HK$mValuation techniques
Prevailingmarket rentper month Unit price
Estimateddeveloper’s profitand risk margins
Investment properties under development
Commercial 32,228.1 Residual N/A HK$2,000–HK$63,500
per square feet
5.0%–15.0%
21,700.0 Income capitalisation (note)
HK$87per square feet
N/A 0%
Serviced apartment 8,799.0 Direct comparison N/A HK$22,700per square feet
N/A
Carparks 125.1 Residual N/A HK$250,000per carpark space
3.8%
Total 62,852.2
Note: The capitalisation rate adopted for the valuation of investment properties under development was 3.25% in 2019.

New World Development Company Limited240
Notes to the Financial Statements
17 INVESTMENT PROPERTIES (CONTINUED)
Valuation techniques (continued)Prevailing market rents are estimated based on independent valuers’ view of recent lettings, within the subject properties and other comparable properties. The higher the rents, the higher the fair value.
Capitalisation rates and developer’s profit and risk margins are estimated by independent valuers based on the risk profile of the properties being valued and the market conditions. The lower the rates and the margins, the higher the fair value.
The valuations of investment properties were based on the economic, market and other conditions as they exist on, and with information available to management as of 30 June 2020. Given the outbreak of COVID-19 which has caused high volatility to the global economy and uncertainties to the property market, this disruption has increased the uncertainty of the assumptions adopted in the valuation process. Consequently, the on-going development of COVID-19 may cause unexpected volatility in the future fair value of the investment properties subsequent to 30 June 2020.
At 30 June 2020, the aggregate fair value of completed investment properties and investment properties under development pledged as securities for the Group’s borrowings amounted to HK$41,419.0 million (2019: HK$35,154.7 million) and HK$1,145.0 million (2019: HK$10,200.0 million) respectively.

Annual Report 2020 241
Notes to the Financial Statements
18 PROPERTY, PLANT AND EQUIPMENT
Land BuildingsOthers
(note (a))Assets under construction Total
HK$m HK$m HK$m HK$m HK$m
CostAt 30 June 2019 2,251.8 19,658.6 14,145.6 4,157.9 40,213.9Adjustment on changes in accounting policies (note 4(a)) (1,986.1) (32.6) — — (2,018.7)
Restated balance as at 1 July 2019 265.7 19,626.0 14,145.6 4,157.9 38,195.2Translation differences — (207.6) (115.0) (146.9) (469.5)Acquisition of subsidiaries — — 111.3 — 111.3Additions — 309.6 1,326.4 1,189.2 2,825.2Transfer between property, plant and equipment,
right-of-use assets and investment properties— 57.7 (2.7) (143.6) (88.6)
Transfer between property, plant and equipment and property for/under development
— 67.8 — 656.6 724.4
Transfer upon completion — — 89.3 (89.3) —Disposal of subsidiaries — (25.8) (262.6) — (288.4)Disposals — — (445.7) — (445.7)
At 30 June 2020 265.7 19,827.7 14,846.6 5,623.9 40,563.9
Accumulated depreciation and impairmentAt 30 June 2019 148.9 2,563.3 6,477.6 — 9,189.8Adjustment on changes in accounting policies (note 4(a)) (148.9) (7.4) — — (156.3)
Restated balance as at 1 July 2019 — 2,555.9 6,477.6 — 9,033.5Translation differences — (63.8) (97.4) — (161.2)Transfer between property, plant and equipment,
right-of-use assets and investment properties— (4.3) (1.0) — (5.3)
Depreciation — 569.9 1,111.6 — 1,681.5Impairment — 84.5 302.4 — 386.9Disposal of subsidiaries — (7.5) (101.0) — (108.5)Disposals — — (362.9) — (362.9)
At 30 June 2020 — 3,134.7 7,329.3 — 10,464.0
Net book value (note (b))At 30 June 2020 265.7 16,693.0 7,517.3 5,623.9 30,099.9

New World Development Company Limited242
Notes to the Financial Statements
18 PROPERTY, PLANT AND EQUIPMENT (CONTINUED)
Land BuildingsOthers
(note (a))Assets under construction Total
HK$m HK$m HK$m HK$m HK$m
CostAt 1 July 2018 2,251.8 13,959.5 11,952.8 10,091.5 38,255.6Translation differences — (179.8) (151.7) (159.8) (491.3)Additions — 106.7 932.6 877.4 1,916.7Transfer between property, plant and equipment, land
use rights and investment properties— 424.8 (19.6) — 405.2
Transfer between property, plant and equipment and property for/under development
— 591.6 — 30.9 622.5
Transfer upon completion — 4,761.4 1,920.7 (6,682.1) —Disposal of subsidiaries — — (8.7) — (8.7)Disposals — (5.6) (480.5) — (486.1)
At 30 June 2019 2,251.8 19,658.6 14,145.6 4,157.9 40,213.9
Accumulated depreciation and impairmentAt 1 July 2018 114.4 2,149.2 6,051.8 — 8,315.4Translation differences — (37.2) (113.6) — (150.8)Transfer between property, plant and equipment, land
use rights and investment properties— (30.5) (6.2) — (36.7)
Depreciation 34.5 485.2 983.2 — 1,502.9Impairment — 0.1 15.9 — 16.0Disposal of subsidiaries — — (4.0) — (4.0)Disposals — (3.5) (449.5) — (453.0)
At 30 June 2019 148.9 2,563.3 6,477.6 — 9,189.8
Net book value (note (b))At 30 June 2019 2,102.9 17,095.3 7,668.0 4,157.9 31,024.1
Notes:
(a) Others mainly represented leasehold improvements for department stores, plant and machinery, buses, vessels, motor vehicles, furniture and fixtures, office equipment and computer.
(b) At 30 June 2020, the aggregate net book value of property, plant and equipment pledged as securities for the Group’s borrowings amounted to HK$6,004.8 million (2019: HK$3,681.6 million).

Annual Report 2020 243
Notes to the Financial Statements
19 RIGHT-OF-USE ASSETS
At 30 June 2020 At 1 July 2019HK$m HK$m
Leasehold land (note (a)) 2,329.7 2,470.6Land use rights (note (a)) 1,431.6 1,213.9Buildings, plant and equipment 4,045.1 3,337.6Others 708.3 791.0
8,514.7 7,813.1
Notes:
(a) As at 30 June 2020, the aggregate net book value of leasehold land and land use rights pledged as securities for the Group’s borrowings amounted to HK$151.4 million and HK$668.8 million (as at 1 July 2019: HK$151.6 million and HK$209.3 million) respectively.
(b) For the year ended 30 June 2020, additions to the right-of-use assets were HK$1,162.1 million and total cash outflows for leases was HK$1,574.6 million.
(c) Depreciation of right-of-use assets
2020 2019HK$m HK$m
Leasehold land (172.1) —Land use rights (29.3) —Buildings, plant and equipment (768.2) —Others (85.8) —
(1,055.4) —
Rental contracts are typically made for fixed periods range from 21 months to 19 years for buildings, plant and equipment and others, but may have extension options which majority of these options are exercisable only by the Group and not by the respective lessors. Lease term for leasehold land ranges from 3 years to 982 years.
Lease terms are negotiated on an individual basis and contain a wide range of different terms and conditions. The lease agreements do not impose any covenants other than the security interests in the leased assets that are held by the lessor.
Some property leases contain variable payment terms that are linked to revenue generated from leased assets, or the higher of a guaranteed rent or revenue rent throughout the lease terms. Revenue rent represents a percentage of gross revenue derived from the leased properties ranging from 3% to 34%.
20 LAND USE RIGHTS
2020 2019HK$m HK$m
At beginning of the year 1,213.9 1,064.0Adjustment on changes in accounting policies (note 4(a)) (1,213.9) —
Restated balance at beginning of the year — 1,064.0Translation differences — (40.6)Transfer between land use rights and properties under development — 299.3Transfer between land use rights, property, plant and equipment and
investment properties — (65.7)Amortisation — (43.1)
At end of the year — 1,213.9
Interests in land use rights represented prepaid operating lease payments.
As at 30 June 2019, the aggregate net book value of land use rights pledged as securities for the Group’s borrowings amounted to HK$209.3 million.

New World Development Company Limited244
Notes to the Financial Statements
21 INTANGIBLE CONCESSION RIGHTS
2020 2019HK$m HK$m
CostAt beginning of the year 16,193.6 17,190.1Translation differences (669.3) (865.1)Additions 5,167.4 —Disposals (233.2) (131.4)
At end of the year 20,458.5 16,193.6
Accumulated amortisation and impairmentAt beginning of the year 6,220.6 5,786.6Translation differences (269.9) (354.1)Amortisation 710.7 853.0Disposals (208.0) (64.9)
At end of the year 6,453.4 6,220.6
Net book valueAt end of the year 14,005.1 9,973.0
22 INTANGIBLE ASSETS
Goodwill TrademarksOperating right
and others TotalHK$m HK$m HK$m HK$m
CostAt 1 July 2019 3,635.6 73.6 760.2 4,469.4Translation differences (13.1) — — (13.1)Additions — — 45.5 45.5Acquisition of subsidiaries 5,814.9 — 90.5 5,905.4Disposal of subsidiaries (38.8) — (122.9) (161.7)Disposals (8.9) — — (8.9)
At 30 June 2020 9,389.7 73.6 773.3 10,236.6
Accumulated amortisation and impairmentAt 1 July 2019 607.1 14.5 383.3 1,004.9Translation differences (10.2) — — (10.2)Amortisation — 5.2 69.0 74.2Impairment 775.9 — — 775.9Disposal of subsidiaries (29.0) — (6.8) (35.8)
At 30 June 2020 1,343.8 19.7 445.5 1,809.0
Net book valueAt 30 June 2020 8,045.9 53.9 327.8 8,427.6
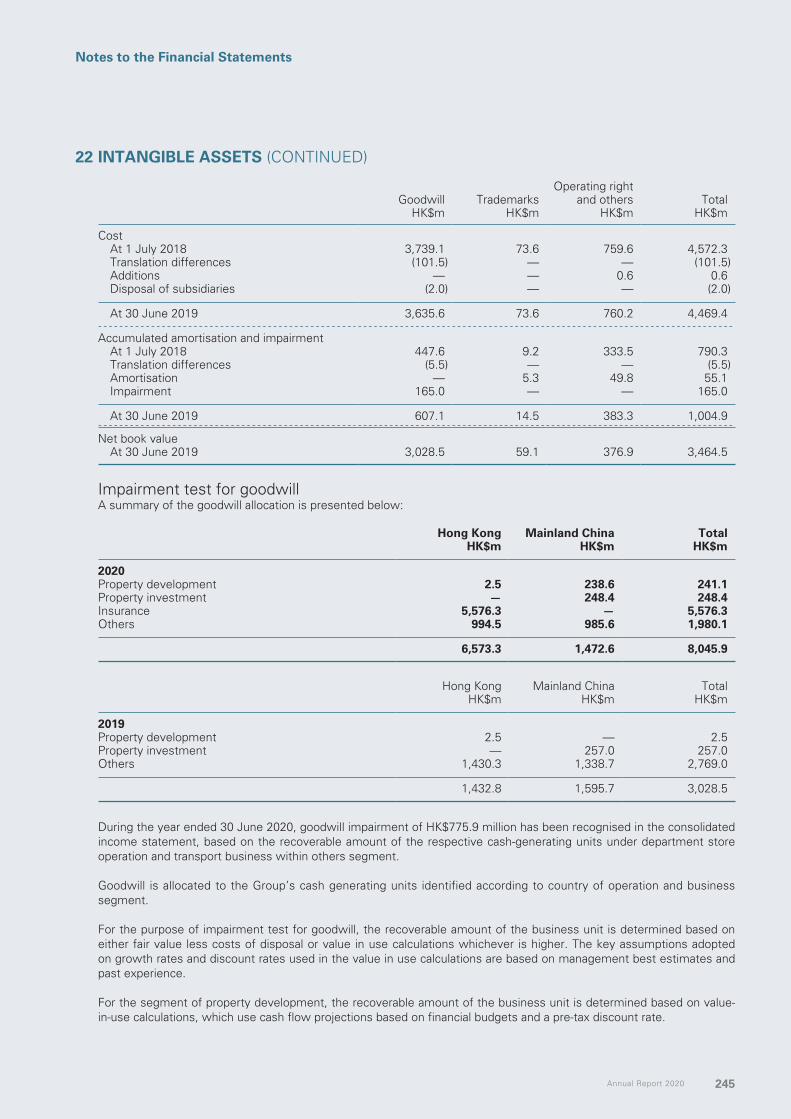
Annual Report 2020 245
Notes to the Financial Statements
22 INTANGIBLE ASSETS (CONTINUED)
Goodwill TrademarksOperating right
and others TotalHK$m HK$m HK$m HK$m
CostAt 1 July 2018 3,739.1 73.6 759.6 4,572.3Translation differences (101.5) — — (101.5)Additions — — 0.6 0.6Disposal of subsidiaries (2.0) — — (2.0)
At 30 June 2019 3,635.6 73.6 760.2 4,469.4
Accumulated amortisation and impairment
At 1 July 2018 447.6 9.2 333.5 790.3Translation differences (5.5) — — (5.5)Amortisation — 5.3 49.8 55.1Impairment 165.0 — — 165.0
At 30 June 2019 607.1 14.5 383.3 1,004.9
Net book valueAt 30 June 2019 3,028.5 59.1 376.9 3,464.5
Impairment test for goodwillA summary of the goodwill allocation is presented below:
Hong Kong Mainland China TotalHK$m HK$m HK$m
2020Property development 2.5 238.6 241.1Property investment — 248.4 248.4Insurance 5,576.3 — 5,576.3Others 994.5 985.6 1,980.1
6,573.3 1,472.6 8,045.9
Hong Kong Mainland China TotalHK$m HK$m HK$m
2019Property development 2.5 — 2.5Property investment — 257.0 257.0Others 1,430.3 1,338.7 2,769.0
1,432.8 1,595.7 3,028.5
During the year ended 30 June 2020, goodwill impairment of HK$775.9 million has been recognised in the consolidated income statement, based on the recoverable amount of the respective cash-generating units under department store operation and transport business within others segment.
Goodwill is allocated to the Group’s cash generating units identified according to country of operation and business segment.
For the purpose of impairment test for goodwill, the recoverable amount of the business unit is determined based on either fair value less costs of disposal or value in use calculations whichever is higher. The key assumptions adopted on growth rates and discount rates used in the value in use calculations are based on management best estimates and past experience.
For the segment of property development, the recoverable amount of the business unit is determined based on value-in-use calculations, which use cash flow projections based on financial budgets and a pre-tax discount rate.
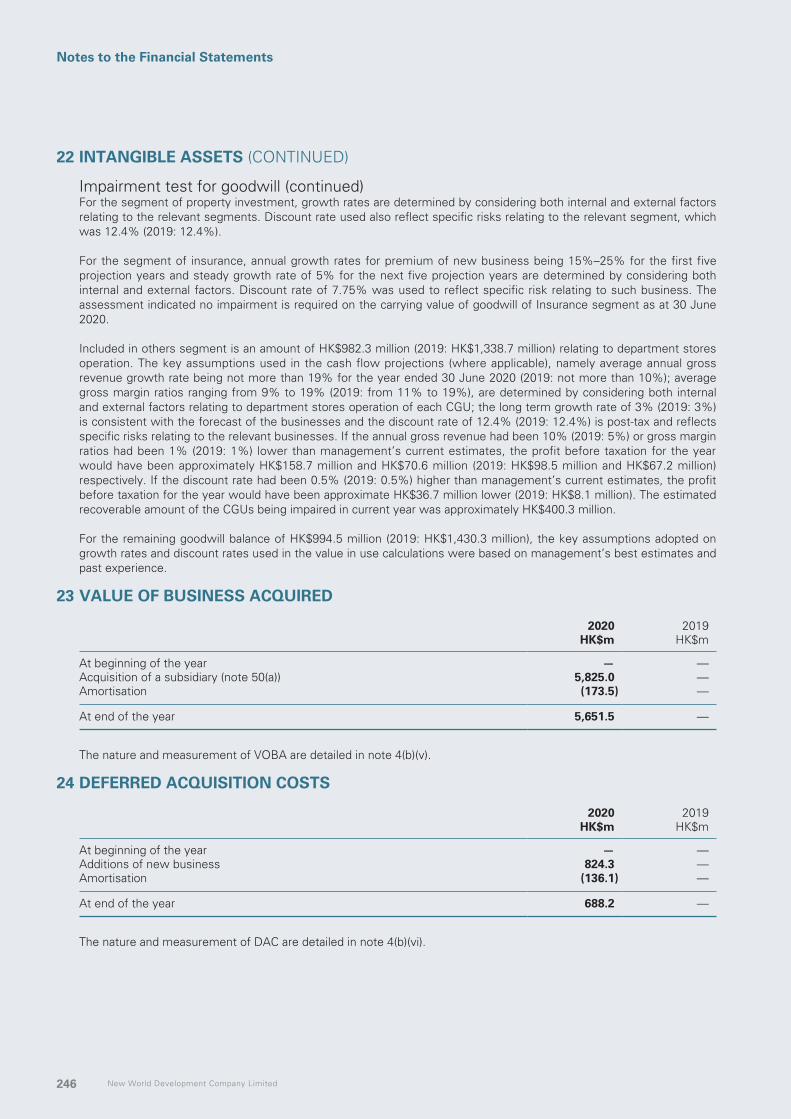
New World Development Company Limited246
Notes to the Financial Statements
22 INTANGIBLE ASSETS (CONTINUED)
Impairment test for goodwill (continued)For the segment of property investment, growth rates are determined by considering both internal and external factors relating to the relevant segments. Discount rate used also reflect specific risks relating to the relevant segment, which was 12.4% (2019: 12.4%).
For the segment of insurance, annual growth rates for premium of new business being 15%–25% for the first five projection years and steady growth rate of 5% for the next five projection years are determined by considering both internal and external factors. Discount rate of 7.75% was used to reflect specific risk relating to such business. The assessment indicated no impairment is required on the carrying value of goodwill of Insurance segment as at 30 June 2020.
Included in others segment is an amount of HK$982.3 million (2019: HK$1,338.7 million) relating to department stores operation. The key assumptions used in the cash flow projections (where applicable), namely average annual gross revenue growth rate being not more than 19% for the year ended 30 June 2020 (2019: not more than 10%); average gross margin ratios ranging from 9% to 19% (2019: from 11% to 19%), are determined by considering both internal and external factors relating to department stores operation of each CGU; the long term growth rate of 3% (2019: 3%) is consistent with the forecast of the businesses and the discount rate of 12.4% (2019: 12.4%) is post-tax and reflects specific risks relating to the relevant businesses. If the annual gross revenue had been 10% (2019: 5%) or gross margin ratios had been 1% (2019: 1%) lower than management’s current estimates, the profit before taxation for the year would have been approximately HK$158.7 million and HK$70.6 million (2019: HK$98.5 million and HK$67.2 million) respectively. If the discount rate had been 0.5% (2019: 0.5%) higher than management’s current estimates, the profit before taxation for the year would have been approximate HK$36.7 million lower (2019: HK$8.1 million). The estimated recoverable amount of the CGUs being impaired in current year was approximately HK$400.3 million.
For the remaining goodwill balance of HK$994.5 million (2019: HK$1,430.3 million), the key assumptions adopted on growth rates and discount rates used in the value in use calculations were based on management’s best estimates and past experience.
23 VALUE OF BUSINESS ACQUIRED
2020 2019HK$m HK$m
At beginning of the year — —Acquisition of a subsidiary (note 50(a)) 5,825.0 —Amortisation (173.5) — At end of the year 5,651.5 —
The nature and measurement of VOBA are detailed in note 4(b)(v).
24 DEFERRED ACQUISITION COSTS
2020 2019HK$m HK$m
At beginning of the year — —Additions of new business 824.3 —Amortisation (136.1) — At end of the year 688.2 —
The nature and measurement of DAC are detailed in note 4(b)(vi).

Annual Report 2020 247
Notes to the Financial Statements
25 INTERESTS IN JOINT VENTURES
2020 2019HK$m HK$m
Equity joint ventures/joint ventures in wholly foreign owned enterprisesGroup’s share of net assets 3,444.6 4,204.9Goodwill on acquisition 89.4 2.2Amounts receivable less provision (note (a)) 425.6 3,707.8
3,959.6 7,914.9 Co-operative joint ventures
Cost of investments less provision 4,649.9 5,291.6Share of undistributed post-acquisition results 1,476.4 1,721.3Amounts receivable less provision (note (a)) 7,541.0 7,062.8
13,667.3 14,075.7 Companies limited by shares
Group’s share of net assets 8,378.9 8,155.7Goodwill on acquisition 441.0 518.0Amounts receivable less provision (note (a)) 16,566.5 20,201.2
25,386.4 28,874.9 43,013.3 50,865.5
Notes:
(a) Amounts receivable less provisions are analysed as follows:
2020 2019HK$m HK$m
Interest bearingFixed rates (note (i)) 4,905.5 373.3Floating rates (note (ii)) 5,291.1 9,842.4
Non-interest bearing 14,336.5 20,756.1
24,533.1 30,971.8
note (i) Carry interest rates ranging from 4.0% to 10.0% (2019: 4.0% to 10.0%) per annum.
note (ii) Carry interest rates ranging from 1.5% below Hong Kong Prime rate to 2.0% over HIBOR (2019: 2.0% below Hong Kong Prime rate to 1.0% over Hong Kong Prime rate) per annum.
As at 1 July 2019, a provision of HK$1,075.7 million has been recognised as a result of the adoption of amendments to HKAS 28. Please refer to note 4(a) for details.
As at 30 June 2020, the net carrying value of amounts receivable included provision of HK$2,946.2 million.
The amounts were unsecured. Their carrying amounts are not materially different from their fair values.
The amounts receivable form part of the Group’s net interests in joint ventures.
(b) There is no joint venture that is individually material to the Group. The Group’s share of results of the joint ventures are as follows:
2020 2019HK$m HK$m
For the year ended 30 JuneProfit for the year 1,007.3 3,670.3Other comprehensive income for the year (853.9) (1,022.9)
Total comprehensive income for the year 153.4 2,647.4
(c) Management regularly reviews whether there are any indications of impairments of the Group’s interests in joint ventures based on value in use calculations, as detailed in note 6(d).
(d) Details of principal joint ventures are stated in note 55.

New World Development Company Limited248
Notes to the Financial Statements
26 INTERESTS IN ASSOCIATED COMPANIES
2020 2019HK$m HK$m
Group’s share of net assetsHong Kong listed shares 3,149.9 2,627.4Overseas listed shares 633.6 1,025.0Unlisted shares 13,187.3 15,967.0
16,970.8 19,619.4Goodwill 703.3 378.5Amounts receivable less provision (note (a)) 3,469.6 5,334.0
21,143.7 25,331.9
Market value of listed shares (note (b)) 2,938.7 2,214.5
Notes:
(a) Amounts receivable less provision are analysed as follows:
2020 2019HK$m HK$m
Interest bearingFixed rate (note (i)) 109.7 104.7Floating rate (note (ii)) 2,458.6 2,504.2
Non-interest bearing 901.3 2,725.1 3,469.6 5,334.0
note (i) Carry interest rate of 8.0% (2019: 8.0%) per annum.
note (ii) An aggregate amount of HK$2,351.8 million (2019: HK$2,393.8 million) which carries interest at HIBOR plus a margin of 1.025% to 1.3% (2019: HIBOR plus a margin of 1.025% to 1.3%) per annum, and an amount of HK$106.8 million (2019: HK$110.4 million) which carries interest of 1-5 year Renminbi benchmark lending rate published by People’s Bank of China.
As at 30 June 2020, the net carrying value of amounts receivable included provision of HK$1,288.5 million.
The amounts were unsecured and not repayable within 12 months. Their carrying amounts were not materially different from their fair values.
The amounts receivable form part of the Group’s net interests in associated companies.
(b) The market value of the Group’s listed associated companies in Hong Kong and overseas amounted to HK$2,938.7 million (2019: HK$2,214.5 million).
(c) Management regularly reviews whether there are any relevant indications of impairments of the Group’s interests in associated companies based on value in use calculations, as detailed in note 6(d).
(d) There is no associated company that is individually material to the Group. The Group’s share of results of the associated companies are as follows:
2020 2019HK$m HK$m
For the year ended 30 June(Loss)/profit for the year (237.4) 1,012.8Other comprehensive income for the year (645.1) (487.2)
Total comprehensive income for the year (882.5) 525.6
The share of results for the year ended 30 June 2020 included an impairment loss of HK$330.0 million in relation to the Group’s interest in Tharisa plc, a listed associated company.
The share of results for the year ended 30 June 2019 included a share of a one-off fair value gain from SUEZ NWS Limited (“SUEZ NWS”), an associated company of the Group, amounted to approximately HK$232.5 million arising from remeasurement of its previously held in a joint venture of SUEZ NWS. Such joint venture has been accounted by SUEZ NWS as a subsidiary with effect from July 2018.
(e) Details of principal associated companies are stated in note 56.

Annual Report 2020 249
Notes to the Financial Statements
27 DERIVATIVE FINANCIAL INSTRUMENTS
2020 2019HK$m HK$m
Non-current assetsForeign currency forward contracts, foreign currency and interest rate swaps
– cash flow hedges (notes (a) and (b)) 1,526.5 12.5– others 148.8 118.3
Put option (note (c)) 478.9 —
2,154.2 130.8
Current assetsForeign currency forward contracts and fuel price swaps
– cash flow hedges (note (a)) 0.7 5.6– others — 0.9
0.7 6.5
2,154.9 137.3
Non-current liabilitiesForeign currency, fuel price and interest rate swaps
– cash flow hedges (note (a)) (813.7) (352.3)– others (129.7) (190.1)
(943.4) (542.4)
Current liabilitiesInterest rate swaps (8.5) (58.9)Foreign currency forward contracts, foreign currency and fuel price swaps
– cash flow hedges (note (a)) (96.3) (19.4)
(104.8) (78.3)
(1,048.2) (620.7)
The total notional principal amounts of the outstanding derivative financial instruments as at 30 June 2020 was HK$27,229.3 million (2019: HK$33,705.5 million).
Notes:
(a) The total notional principal amount of the outstanding financial instruments designated as cash flow hedges as at 30 June 2020 was US$122.9 million (2019: nil) and HK$14,819.3 million (2019: HK$8,341.1 million).
The Group enters into the hedging instruments that have similar critical terms as the hedged item.
The Group does not hedge all of its loans, therefore the hedged item is identified as a proportion of the outstanding hedged items up to the notional amount of the hedging instruments with one-to-one hedge ratio. As all critical terms matched substantially, the economic relationship was highly effective during the year.
During the years ended 30 June 2020 and 2019, there were insignificant ineffectiveness in relation to these hedging instruments.
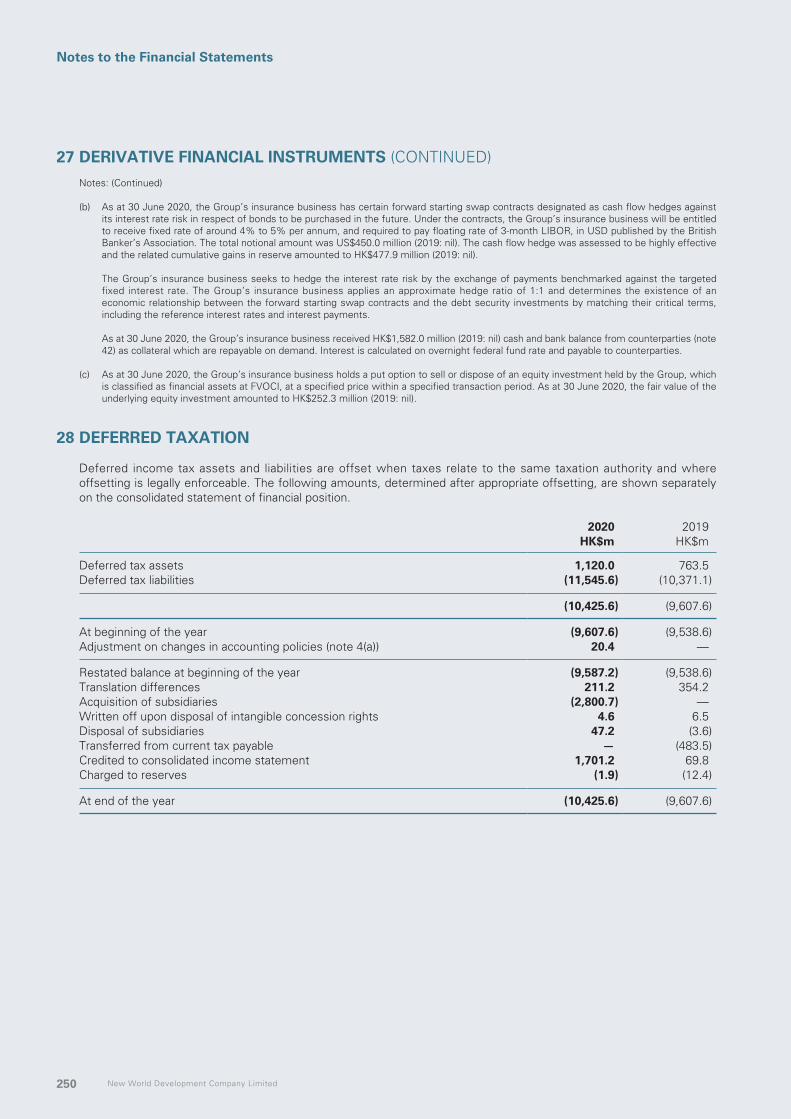
New World Development Company Limited250
Notes to the Financial Statements
27 DERIVATIVE FINANCIAL INSTRUMENTS (CONTINUED)Notes: (Continued)
(b) As at 30 June 2020, the Group’s insurance business has certain forward starting swap contracts designated as cash flow hedges against its interest rate risk in respect of bonds to be purchased in the future. Under the contracts, the Group’s insurance business will be entitled to receive fixed rate of around 4% to 5% per annum, and required to pay floating rate of 3-month LIBOR, in USD published by the British Banker’s Association. The total notional amount was US$450.0 million (2019: nil). The cash flow hedge was assessed to be highly effective and the related cumulative gains in reserve amounted to HK$477.9 million (2019: nil).
The Group’s insurance business seeks to hedge the interest rate risk by the exchange of payments benchmarked against the targeted fixed interest rate. The Group’s insurance business applies an approximate hedge ratio of 1:1 and determines the existence of an economic relationship between the forward starting swap contracts and the debt security investments by matching their critical terms, including the reference interest rates and interest payments.
As at 30 June 2020, the Group’s insurance business received HK$1,582.0 million (2019: nil) cash and bank balance from counterparties (note 42) as collateral which are repayable on demand. Interest is calculated on overnight federal fund rate and payable to counterparties.
(c) As at 30 June 2020, the Group’s insurance business holds a put option to sell or dispose of an equity investment held by the Group, which is classified as financial assets at FVOCI, at a specified price within a specified transaction period. As at 30 June 2020, the fair value of the underlying equity investment amounted to HK$252.3 million (2019: nil).
28 DEFERRED TAXATION
Deferred income tax assets and liabilities are offset when taxes relate to the same taxation authority and where offsetting is legally enforceable. The following amounts, determined after appropriate offsetting, are shown separately on the consolidated statement of financial position.
2020 2019HK$m HK$m
Deferred tax assets 1,120.0 763.5Deferred tax liabilities (11,545.6) (10,371.1)
(10,425.6) (9,607.6)
At beginning of the year (9,607.6) (9,538.6)Adjustment on changes in accounting policies (note 4(a)) 20.4 —
Restated balance at beginning of the year (9,587.2) (9,538.6)Translation differences 211.2 354.2Acquisition of subsidiaries (2,800.7) —Written off upon disposal of intangible concession rights 4.6 6.5Disposal of subsidiaries 47.2 (3.6)Transferred from current tax payable — (483.5)Credited to consolidated income statement 1,701.2 69.8Charged to reserves (1.9) (12.4)
At end of the year (10,425.6) (9,607.6)
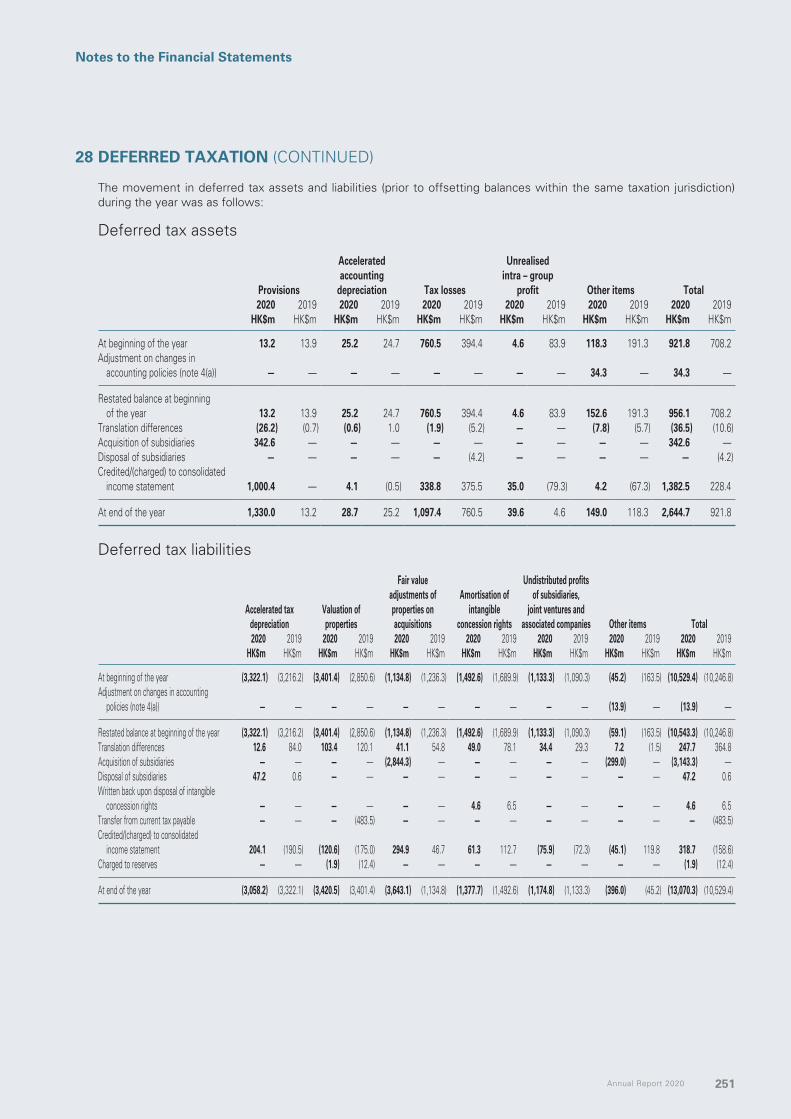
Annual Report 2020 251
Notes to the Financial Statements
28 DEFERRED TAXATION (CONTINUED)
The movement in deferred tax assets and liabilities (prior to offsetting balances within the same taxation jurisdiction) during the year was as follows:
Deferred tax assets
Provisions
Accelerated accounting
depreciation Tax losses
Unrealised intra – group
profit Other items Total2020 2019 2020 2019 2020 2019 2020 2019 2020 2019 2020 2019
HK$m HK$m HK$m HK$m HK$m HK$m HK$m HK$m HK$m HK$m HK$m HK$m
At beginning of the year 13.2 13.9 25.2 24.7 760.5 394.4 4.6 83.9 118.3 191.3 921.8 708.2Adjustment on changes in
accounting policies (note 4(a)) — — — — — — — — 34.3 — 34.3 —
Restated balance at beginning of the year 13.2 13.9 25.2 24.7 760.5 394.4 4.6 83.9 152.6 191.3 956.1 708.2
Translation differences (26.2) (0.7) (0.6) 1.0 (1.9) (5.2) — — (7.8) (5.7) (36.5) (10.6)Acquisition of subsidiaries 342.6 — — — — — — — — — 342.6 —Disposal of subsidiaries — — — — — (4.2) — — — — — (4.2)Credited/(charged) to consolidated
income statement 1,000.4 — 4.1 (0.5) 338.8 375.5 35.0 (79.3) 4.2 (67.3) 1,382.5 228.4
At end of the year 1,330.0 13.2 28.7 25.2 1,097.4 760.5 39.6 4.6 149.0 118.3 2,644.7 921.8
Deferred tax liabilities
Accelerated tax depreciation
Valuation of properties
Fair value adjustments of properties on acquisitions
Amortisation of intangible
concession rights
Undistributed profits of subsidiaries,
joint ventures and associated companies Other items Total
2020 2019 2020 2019 2020 2019 2020 2019 2020 2019 2020 2019 2020 2019HK$m HK$m HK$m HK$m HK$m HK$m HK$m HK$m HK$m HK$m HK$m HK$m HK$m HK$m
At beginning of the year (3,322.1) (3,216.2) (3,401.4) (2,850.6) (1,134.8) (1,236.3) (1,492.6) (1,689.9) (1,133.3) (1,090.3) (45.2) (163.5) (10,529.4) (10,246.8)Adjustment on changes in accounting
policies (note 4(a)) — — — — — — — — — — (13.9) — (13.9) —
Restated balance at beginning of the year (3,322.1) (3,216.2) (3,401.4) (2,850.6) (1,134.8) (1,236.3) (1,492.6) (1,689.9) (1,133.3) (1,090.3) (59.1) (163.5) (10,543.3) (10,246.8)Translation differences 12.6 84.0 103.4 120.1 41.1 54.8 49.0 78.1 34.4 29.3 7.2 (1.5) 247.7 364.8Acquisition of subsidiaries — — — — (2,844.3) — — — — — (299.0) — (3,143.3) —Disposal of subsidiaries 47.2 0.6 — — — — — — — — — — 47.2 0.6Written back upon disposal of intangible
concession rights — — — — — — 4.6 6.5 — — — — 4.6 6.5Transfer from current tax payable — — — (483.5) — — — — — — — — — (483.5)Credited/(charged) to consolidated
income statement 204.1 (190.5) (120.6) (175.0) 294.9 46.7 61.3 112.7 (75.9) (72.3) (45.1) 119.8 318.7 (158.6)Charged to reserves — — (1.9) (12.4) — — — — — — — — (1.9) (12.4)
At end of the year (3,058.2) (3,322.1) (3,420.5) (3,401.4) (3,643.1) (1,134.8) (1,377.7) (1,492.6) (1,174.8) (1,133.3) (396.0) (45.2) (13,070.3) (10,529.4)
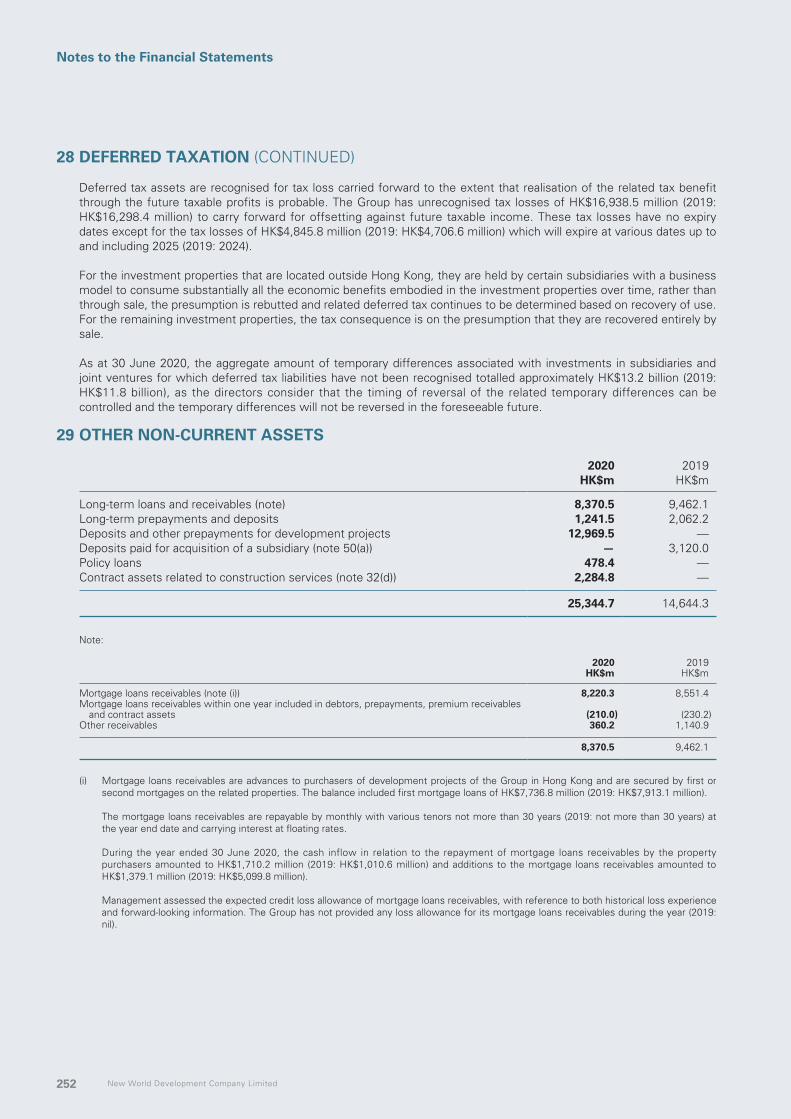
New World Development Company Limited252
Notes to the Financial Statements
28 DEFERRED TAXATION (CONTINUED)
Deferred tax assets are recognised for tax loss carried forward to the extent that realisation of the related tax benefit through the future taxable profits is probable. The Group has unrecognised tax losses of HK$16,938.5 million (2019: HK$16,298.4 million) to carry forward for offsetting against future taxable income. These tax losses have no expiry dates except for the tax losses of HK$4,845.8 million (2019: HK$4,706.6 million) which will expire at various dates up to and including 2025 (2019: 2024).
For the investment properties that are located outside Hong Kong, they are held by certain subsidiaries with a business model to consume substantially all the economic benefits embodied in the investment properties over time, rather than through sale, the presumption is rebutted and related deferred tax continues to be determined based on recovery of use. For the remaining investment properties, the tax consequence is on the presumption that they are recovered entirely by sale.
As at 30 June 2020, the aggregate amount of temporary differences associated with investments in subsidiaries and joint ventures for which deferred tax liabilities have not been recognised totalled approximately HK$13.2 billion (2019: HK$11.8 billion), as the directors consider that the timing of reversal of the related temporary differences can be controlled and the temporary differences will not be reversed in the foreseeable future.
29 OTHER NON-CURRENT ASSETS
2020 2019HK$m HK$m
Long-term loans and receivables (note) 8,370.5 9,462.1Long-term prepayments and deposits 1,241.5 2,062.2Deposits and other prepayments for development projects 12,969.5 —Deposits paid for acquisition of a subsidiary (note 50(a)) — 3,120.0Policy loans 478.4 —Contract assets related to construction services (note 32(d)) 2,284.8 —
25,344.7 14,644.3
Note:
2020 2019HK$m HK$m
Mortgage loans receivables (note (i)) 8,220.3 8,551.4Mortgage loans receivables within one year included in debtors, prepayments, premium receivables
and contract assets (210.0) (230.2)Other receivables 360.2 1,140.9
8,370.5 9,462.1
(i) Mortgage loans receivables are advances to purchasers of development projects of the Group in Hong Kong and are secured by first or second mortgages on the related properties. The balance included first mortgage loans of HK$7,736.8 million (2019: HK$7,913.1 million).
The mortgage loans receivables are repayable by monthly with various tenors not more than 30 years (2019: not more than 30 years) at the year end date and carrying interest at floating rates.
During the year ended 30 June 2020, the cash inflow in relation to the repayment of mortgage loans receivables by the property purchasers amounted to HK$1,710.2 million (2019: HK$1,010.6 million) and additions to the mortgage loans receivables amounted to HK$1,379.1 million (2019: HK$5,099.8 million).
Management assessed the expected credit loss allowance of mortgage loans receivables, with reference to both historical loss experience and forward-looking information. The Group has not provided any loss allowance for its mortgage loans receivables during the year (2019: nil).

Annual Report 2020 253
Notes to the Financial Statements
30 PROPERTIES UNDER DEVELOPMENT
2020 2019HK$m HK$m
Properties under developmentExpected to be completed after 12 months 22,272.9 21,623.5Expected to be completed within 12 months 26,384.8 12,522.0
48,657.7 34,145.5
At 30 June 2020, the aggregate carrying value of properties under development pledged as securities for the Group’s borrowings amounted to HK$6,930.4 million (2019: HK$2,366.8 million).
31 INVENTORIES
2020 2019HK$m HK$m
Raw materials 110.2 118.1Finished goods 574.9 687.6
685.1 805.7
32 DEBTORS, PREPAYMENTS, PREMIUM RECEIVABLES AND CONTRACT ASSETS
2020 2019HK$m HK$m
Trade debtors (note (a)) 3,102.1 2,949.8Premium receivables 344.4 —Retention receivables for contract works 1,646.5 1,624.3Contract assets (note (d)) 3,505.6 2,095.7Prepayment for purchase of land and land preparatory costs 251.3 1,054.3Deposits, prepayments and other debtors (note (f)) 18,588.7 11,078.0Amounts due from associated companies (note (g)) 215.1 37.7Amounts due from joint ventures (note (h)) 7,084.5 6,370.9Amounts due from non-controlling shareholders (note (i)) 450.7 511.3
35,188.9 25,722.0
Notes:
(a) The Group has different credit policies for different business operations depending on the requirements of the markets and businesses in which the subsidiaries operate. They are settled in accordance with the terms of respective contracts.
Aging analysis of trade debtors based on invoice date is as follows:
2020 2019HK$m HK$m
Less than 30 days 2,229.7 2,293.531 to 60 days 252.9 103.9Over 60 days 619.5 552.4
3,102.1 2,949.8
There is no concentration of credit risk with respect to trade debtors as the customer bases are widely dispersed in different sectors and industries.

New World Development Company Limited254
Notes to the Financial Statements
32 DEBTORS, PREPAYMENTS, PREMIUM RECEIVABLES AND CONTRACT ASSETS (CONTINUED)Notes: (Continued)
(b) Movements on the provision for impairment of trade debtors are as follows:
2020 2019HK$m HK$m
At beginning of the year 119.3 85.1Translation differences (3.7) (2.7)Increase in provision recognised in consolidated income statement 106.3 56.9Amounts recovered (6.8) (2.4)Amount written off (65.6) (17.6)Disposal of a subsidiary (4.4) — At end of the year 145.1 119.3
(c) The carrying amounts of the debtors, prepayments, premium receivables and contract assets, which approximate their fair values, are denominated in the following currencies:
2020 2019HK$m HK$m
Hong Kong dollar 16,507.5 11,616.1Renminbi 9,997.2 7,526.9United States dollar 8,585.6 6,525.3Others 98.6 53.7
35,188.9 25,722.0
(d) The Group has recognised the following revenue-related contract assets:
2020 2019HK$m HK$m
Current:Contract acquisition cost related to property sales (note (i)) 871.9 476.6Contract assets related to construction services (note (ii)) 2,633.7 1,619.1
3,505.6 2,095.7 Non-current:
Contract assets related to construction services (note (ii)) 2,284.8 — 5,790.4 2,095.7
note (i) Contract acquisition cost related to property sales consists of sales commissions incurred directly attributable to obtaining contract.
note (ii) Contract assets related to construction services consist of unbilled amount resulting from construction when the cost-to-cost method of revenue recognised exceeds the amount billed to the customer.
There is no concentration of credit risk with respect to contract assets as the customer bases are widely dispersed in different sectors and industries.
(e) Except for certain collaterals held as securities for other debtors, the Group does not hold other collateral as securities for the debtors and prepayments. The maximum exposure to credit risk at the end of the reporting period is the carrying value mentioned above.
(f) As at 30 June 2020, the balances included construction-related receivables amounted to HK$2,789.2 million (2019: HK$2,901.1 million) which have not yet been billed at year end.
As at 30 June 2020, the balances included an amount of HK$1,136.4 million (2019: nil), which carried interest at 4.75% per annum, is unsecured and due in June 2021.
(g) As at 30 June 2020, the amounts due from associated companies of the Group are interest free, unsecured and repayable on demand.
(h) As at 30 June 2020, the amounts due from joint ventures of the Group are interest free, unsecured and repayable on demand except for an aggregate amount of HK$280.8 million (2019: HK$280.8 million) due from joint ventures which carries interest at London Interbank Offered Rate (“LIBOR”) plus a margin of 12.2% (2019: LIBOR plus a margin of 12.2%) per annum.
(i) The balances are interest-free, unsecured and repayable on demand.

Annual Report 2020 255
Notes to the Financial Statements
33 FINANCIAL ASSETS AT FAIR VALUE THROUGH PROFIT OR LOSS
2020 2019HK$m HK$m
Non-currentEquity securities
Unlisted (note (a)) 1,131.7 1,680.4Listed
Hong Kong 203.7 117.1Overseas 82.1 67.1
Debt securitiesUnlisted (note (a)) 2,814.6 2,900.8Listed
Hong Kong 254.6 —Overseas 568.1 —
Investment funds (notes (b) and (c))Unlisted (note (a)) 4,943.7 3,655.5Listed
Hong Kong 261.6 —Overseas 3,228.3 —
13,488.4 8,420.9
CurrentDebt securities
Unlisted (note (a)) 833.3 818.5Listed
Hong Kong 15.9 —Overseas 258.1 —
Investment funds (notes (b) and (c))Unlisted (note (a)) 29.2 —Listed
Hong Kong 0.4 —Overseas 3.6 —
1,140.5 818.5
14,628.9 9,239.4
Notes:
(a) Unlisted investments are stated at fair values which are estimated using a variety of valuation methods or assessed the reasonableness with reference to market comparables, with the assistance of independent external valuers, when necessary.
(b) As at 30 June 2020, the Group holds certain investment funds with fair value of HK$3,976.5 million (2019: HK$2,856.6 million) which are managed by the general partner while the Group participated in the funds as a limited partner. Management considered that the Group has neither significant influence nor joint control over the fund and therefore it is classified as financial assets at FVPL.
(c) As at 30 June 2020, the Group holds participating shares of an investment fund with fair value of HK$776.7 million (2019: HK$658.4 million). Given all relevant investment decision making power is rested with the management shareholder and investment manager. There is no mechanism in place that allow participating shareholder to participate in investment related decision making. Management considered that the Group has neither significant influence nor joint control over this investment and therefore accounted for this investment as financial assets at FVPL.

New World Development Company Limited256
Notes to the Financial Statements
33 FINANCIAL ASSETS AT FAIR VALUE THROUGH PROFIT OR LOSS (CONTINUED)
Notes: (Continued)
(d) As mentioned in note 4(b)(xiii), the Group elected to apply the overlay approach for certain designated eligible financial assets according to HKFRS 4 (Amendment), the financial assets elected by the Group applying the overlay approach are equity securities and investment funds that are managed as underlying assets supporting the insurance contracts issued and those fair values are generally expected to be volatile. The designated eligible financial assets applying the overlay approach, which are included in the financial assets at FVPL, as at 30 June 2020 are analysed below:
2020 2019HK$m HK$m
Equity securities 97.6 —Investment funds 3,922.0 —
4,019.6 —
During the year, the total amount of overlay approach adjustments reclassified between profit or loss and other comprehensive income was derived from:
2020 2019HK$m HK$m
The amount of losses reported in profit or loss and presented in consolidated income statement within other gains, net under HKFRS 9 for the designated financial assets (202.3) —
Overlay approach adjustments on financial assets in profit or loss 208.2 — The amount of gains that would have been reported in profit or loss for the designated financial
assets as if HKAS 39 had been applied 5.9 —
(e) Financial assets at FVPL related to unit-linked contracts is detailed in Note 35.
(f) Financial assets at FVPL are denominated in the following currencies:
2020 2019HK$m HK$m
United States dollar 12,317.4 7,415.6Hong Kong dollar 1,135.9 389.1Renminbi 819.9 1,370.2Others 355.7 64.5
14,628.9 9,239.4
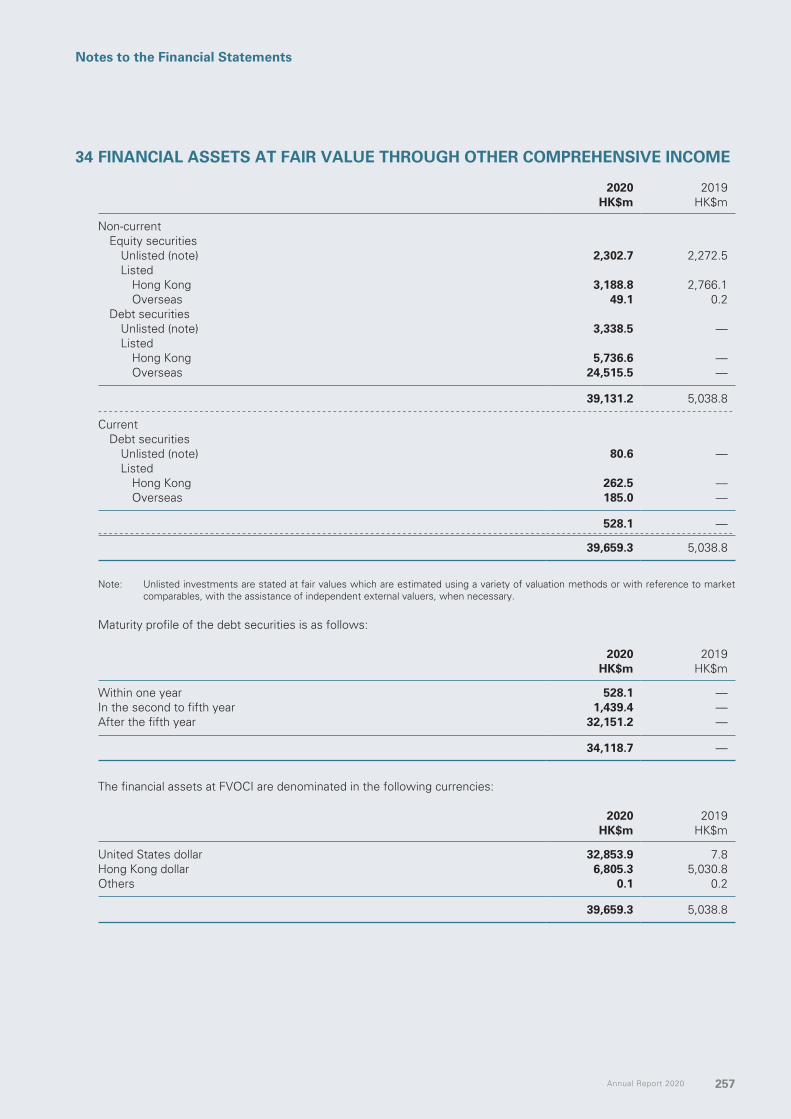
Annual Report 2020 257
Notes to the Financial Statements
34 FINANCIAL ASSETS AT FAIR VALUE THROUGH OTHER COMPREHENSIVE INCOME
2020 2019HK$m HK$m
Non-currentEquity securities
Unlisted (note) 2,302.7 2,272.5Listed
Hong Kong 3,188.8 2,766.1Overseas 49.1 0.2
Debt securitiesUnlisted (note) 3,338.5 —Listed
Hong Kong 5,736.6 —Overseas 24,515.5 —
39,131.2 5,038.8
CurrentDebt securities
Unlisted (note) 80.6 —Listed
Hong Kong 262.5 —Overseas 185.0 —
528.1 —
39,659.3 5,038.8
Note: Unlisted investments are stated at fair values which are estimated using a variety of valuation methods or with reference to market comparables, with the assistance of independent external valuers, when necessary.
Maturity profile of the debt securities is as follows:
2020 2019HK$m HK$m
Within one year 528.1 —In the second to fifth year 1,439.4 —After the fifth year 32,151.2 —
34,118.7 —
The financial assets at FVOCI are denominated in the following currencies:
2020 2019HK$m HK$m
United States dollar 32,853.9 7.8Hong Kong dollar 6,805.3 5,030.8Others 0.1 0.2
39,659.3 5,038.8

New World Development Company Limited258
Notes to the Financial Statements
35 INVESTMENTS/LIABILITIES RELATED TO UNIT-LINKED CONTRACTS
Investments related to unit-linked contracts as analysed as follows:
2020 2019HK$m HK$m
Financial assets at FVPL – Investment funds, at fair value 8,884.2 —Cash and bank balances 169.4 —
9,053.6 —
The classification and measurement of financial assets at FVPL related to unit-linked contracts are in accordance with HKFRS 9.
Liabilities related to unit-linked contracts as analysed as follows:
2020 2019HK$m HK$m
Insurance contract liabilities 666.9 —Investment contract liabilities 8,554.9 —
9,221.8 —
Represented byNon-current liabilities 168.2 —Current liabilities 9,053.6 —
9,221.8 —
The classification and measurement of insurance contract liabilities and investment contract liabilities related to unit-linked contracts are detailed in notes 4(b)(ii) and 4(b)(iii), respectively.
36 CASH AND BANK BALANCES
2020 2019HK$m HK$m
Cash at banks and on hand 36,628.4 36,759.8Bank deposits – unrestricted and maturing within three months 26,519.5 25,575.9
63,147.9 62,335.7Bank deposits – unrestricted and maturing after more than three months 4,143.3 1,393.4
Cash and bank balances 67,291.2 63,729.1Bank deposits – restricted 144.4 2.5
67,435.6 63,731.6
The effective interest rates on bank deposits range from 0.01% to 4.45% (2019: 0.02% to 4.40%) per annum and these deposits have maturities ranging from 1 to 366 days (2019: 1 to 360 days).
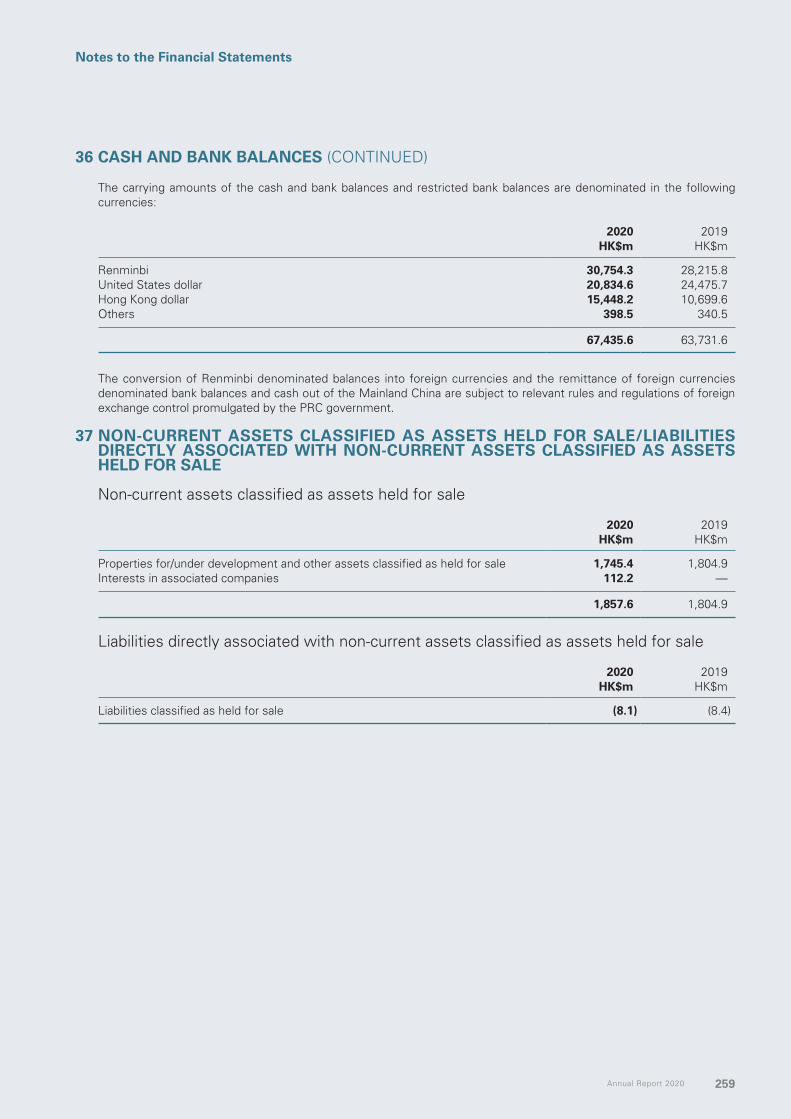
Annual Report 2020 259
Notes to the Financial Statements
36 CASH AND BANK BALANCES (CONTINUED)
The carrying amounts of the cash and bank balances and restricted bank balances are denominated in the following currencies:
2020 2019HK$m HK$m
Renminbi 30,754.3 28,215.8United States dollar 20,834.6 24,475.7Hong Kong dollar 15,448.2 10,699.6Others 398.5 340.5
67,435.6 63,731.6
The conversion of Renminbi denominated balances into foreign currencies and the remittance of foreign currencies denominated bank balances and cash out of the Mainland China are subject to relevant rules and regulations of foreign exchange control promulgated by the PRC government.
37 NON-CURRENT ASSETS CLASSIFIED AS ASSETS HELD FOR SALE/LIABILITIES DIRECTLY ASSOCIATED WITH NON-CURRENT ASSETS CLASSIFIED AS ASSETS HELD FOR SALE
Non-current assets classified as assets held for sale
2020 2019HK$m HK$m
Properties for/under development and other assets classified as held for sale 1,745.4 1,804.9Interests in associated companies 112.2 —
1,857.6 1,804.9
Liabilities directly associated with non-current assets classified as assets held for sale
2020 2019HK$m HK$m
Liabilities classified as held for sale (8.1) (8.4)
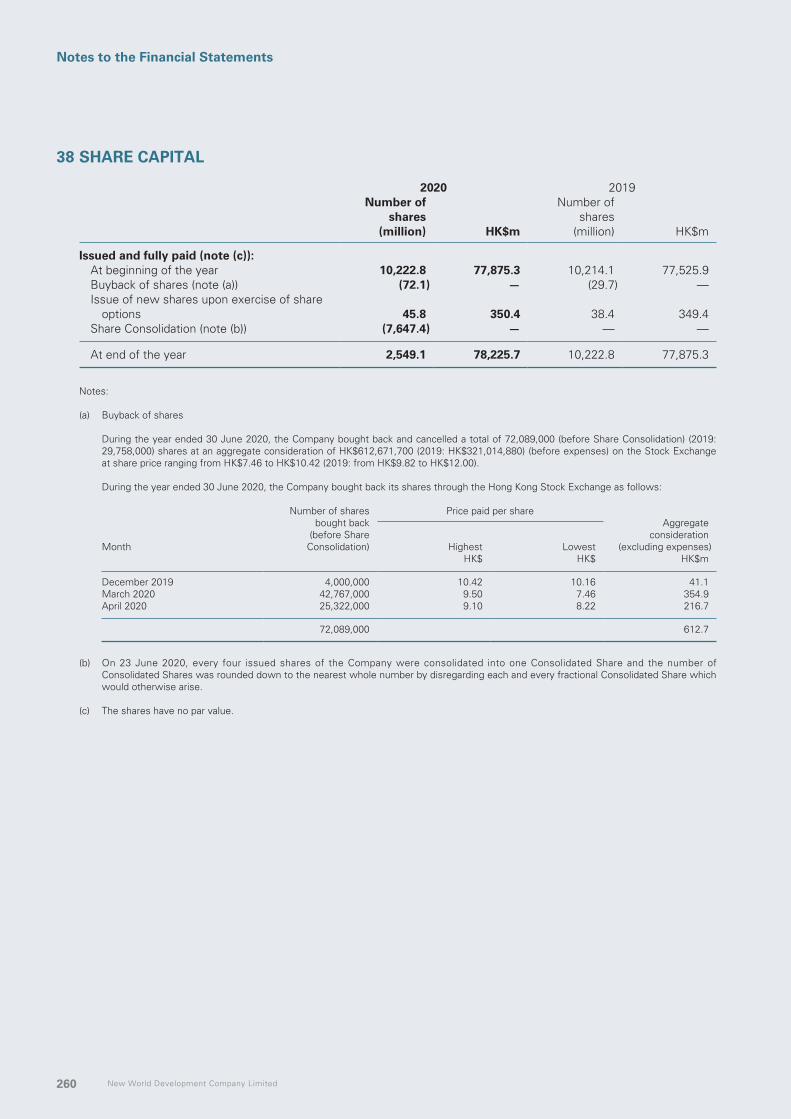
New World Development Company Limited260
Notes to the Financial Statements
38 SHARE CAPITAL
2020 2019Number of
sharesNumber of
shares(million) HK$m (million) HK$m
Issued and fully paid (note (c)):At beginning of the year 10,222.8 77,875.3 10,214.1 77,525.9Buyback of shares (note (a)) (72.1) — (29.7) —Issue of new shares upon exercise of share
options 45.8 350.4 38.4 349.4Share Consolidation (note (b)) (7,647.4) — — —
At end of the year 2,549.1 78,225.7 10,222.8 77,875.3
Notes:
(a) Buyback of shares
During the year ended 30 June 2020, the Company bought back and cancelled a total of 72,089,000 (before Share Consolidation) (2019: 29,758,000) shares at an aggregate consideration of HK$612,671,700 (2019: HK$321,014,880) (before expenses) on the Stock Exchange at share price ranging from HK$7.46 to HK$10.42 (2019: from HK$9.82 to HK$12.00).
During the year ended 30 June 2020, the Company bought back its shares through the Hong Kong Stock Exchange as follows:
Number of shares bought back
(before Share Consolidation)
Price paid per shareAggregate
consideration (excluding expenses)
Month Highest LowestHK$ HK$ HK$m
December 2019 4,000,000 10.42 10.16 41.1March 2020 42,767,000 9.50 7.46 354.9April 2020 25,322,000 9.10 8.22 216.7
72,089,000 612.7
(b) On 23 June 2020, every four issued shares of the Company were consolidated into one Consolidated Share and the number of Consolidated Shares was rounded down to the nearest whole number by disregarding each and every fractional Consolidated Share which would otherwise arise.
(c) The shares have no par value.

Annual Report 2020 261
Notes to the Financial Statements
39 PERPETUAL CAPITAL SECURITIES
2020 2019HK$m HK$m
Issued by a wholly owned subsidiary of the Company (the “NWD Issuer”)US$1,200.0 million 5.75% guaranteed senior perpetual securities issued in 2016 9,490.1 9,488.2US$1,300.0 million 6.25% guaranteed senior perpetual securities issued in 2019
(As of 30 June 2019: US$500.0 million) 10,431.6 3,977.5US$850.0 million 5.25% guaranteed senior perpetual securities issued in 2020 6,641.8 —
26,563.5 13,465.7
Issued by a wholly owned subsidiary of NWSH (the “NWSH Issuer”)US$1,300.0 million 5.75% guaranteed senior perpetual securities issued in 2019
(As of 30 June 2019: US$1,000.0 million) 10,528.5 8,039.8
37,092.0 21,505.5
In March 2019, the NWD Issuer issued US$500.0 million 6.25% guaranteed senior perpetual capital securities with the aggregate net proceeds after transaction cost of HK$3,857.5 million. In July and November 2019, the NWD Issuer further issued US$400.0 million and US$400.0 million 6.25% guaranteed senior perpetual capital securities respectively, with the aggregate net proceeds after transaction cost of HK$6,271.2 million, which were consolidated and formed a single series with the original issue in March 2019.
In June 2020, the NWD Issuer issued US$850.0 million 5.25% guaranteed senior perpetual capital securities with the aggregate net proceeds after transaction cost of HK$6,597.2 million.
In January 2019, the NWSH Issuer issued US$1.0 billion 5.75% guaranteed senior perpetual capital securities of which US$800.0 million was issued at 100% and US$200.0 million were issued at 100.4%, with the aggregate net proceeds after transaction cost of HK$7,776.9 million. In July 2019, the NWSH Issuer further issued US$300.0 million 5.75% guaranteed senior perpetual capital securities at 104% with the aggregate net proceeds after transaction cost of HK$2,411.7 million, which was consolidated and formed a single series with the original issue in January 2019.
The perpetual capital securities issued by the NWD Issuer and the NWSH Issuer (together the “Issuers”) are listed on the Stock Exchange and guaranteed by the Company and NWSH respectively. There is no maturity of the securities and the payments of distribution can be deferred at the discretion of the Issuers, and there is no limit as to the number of times of deferral of distribution. The perpetual capital securities are callable. When the Company or NWSH elects to declare dividends to their respective ordinary shareholders, the Issuers shall make distribution to the holders of perpetual capital securities at the distribution rate as defined in the subscription agreements.
40 NON-CONTROLLING INTERESTS
The total non-controlling interests as at 30 June 2020 is HK$29,629.8 million (2019: HK$29,994.5 million), of which HK$18,662.6 million (2019: HK$19,229.4 million) is attributable to NWSH. The total comprehensive income attributable to non-controlling interests for the year ended 30 June 2020 is HK$81.6 million (2019: HK$1,290.3 million), of which HK$127.3 million (2019: HK$704.1 million) is attributable to NWSH. The non-controlling interests in respect of other subsidiaries are not material to the Group.
Set out below is the summarised financial information for NWSH which is a subsidiary with material non-controlling interest to the Group.

New World Development Company Limited262
Notes to the Financial Statements
40 NON-CONTROLLING INTERESTS (CONTINUED)
Summarised consolidated statement of financial position of NWSH as at 30 June 2020 and 2019 are as follows:
2020 2019HK$m HK$m
Non-current assets 110,226.3 56,579.8Current assets 39,713.5 29,485.2Assets held for sale 112.2 —
Total assets 150,052.0 86,065.0Current liabilities (46,888.6) (13,729.1)Non-current liabilities (45,705.7) (15,089.3)
Net assets 57,457.7 57,246.6Perpetual capital securities (10,528.5) (8,039.8)Non-controlling interests (562.2) (160.8)
Net assets after perpetual capital securities and non-controlling interests 46,367.0 49,046.0
Summarised consolidated statement of comprehensive income of NWSH for the year ended 30 June 2020 and 2019 are as follows:
2020 2019HK$m HK$m
Revenues 25,920.5 26,833.5
Profit before taxation 1,285.1 4,910.5Taxation (457.6) (651.8)
Profit for the year 827.5 4,258.7Other comprehensive loss for the year (543.4) (2,465.7)
284.1 1,793.0Total comprehensive income attributable to:
— Holders of perpetual capital securities (581.9) (186.9)— Non-controlling interests 16.1 (23.4)
Total comprehensive (loss)/income after holders of perpetual capital securities and non-controlling interests (281.7) 1,582.7
Dividends paid to non-controlling interests 35.2 36.4
Summarised consolidated statement of cash flows of NWSH for the year ended 30 June 2020 and 2019 are as follows:
2020 2019HK$m HK$m
Net cash (used in)/from operation activities (228.7) 2,116.7Net cash used in investing activities (13,388.7) (3,515.6)Net cash from financing activities 12,059.2 9,871.4
Net (decrease)/increase in cash and cash equivalents (1,558.2) 8,472.5Translation differences (119.6) (70.3)Cash and cash equivalents at beginning of the year 15,045.4 6,643.2
Cash and cash equivalents at end of the year 13,367.6 15,045.4
The information above represents balances before inter-company eliminations, reclassification of assets and remeasurement of assets on group level.

Annual Report 2020 263
Notes to the Financial Statements
41 RESERVES
Property revaluation
reserve
Financial assets
at FVOCI reserve
(non-recycling)
Financial assets
at FVOCI reserve
(recycling)General reserve
Employees’ share-based
compensation reserve
Exchange reserve
Retained profits Total
HK$m HK$m HK$m HK$m HK$m HK$m HK$m HK$m
At 30 June 2019 7,588.5 1,320.7 — 417.0 281.6 (348.6) 136,730.0 145,989.2Adjustment on changes in accounting policies
(note 4(a)) — — — — — — (1,832.3) (1,832.3)
Restated balance as at 1 July 2019 7,588.5 1,320.7 — 417.0 281.6 (348.6) 134,897.7 144,156.9Fair value changes of equity instruments as
financial assets at FVOCI — (713.0) — — — — — (713.0)Net fair value changes and other net movements
of debt instruments as financial assets at FVOCI — — 1,032.3 — — — — 1,032.3
Employees’ share-based payments — — — — 29.8 — — 29.8Share options lapsed — — — — (177.9) — 177.9 —Acquisition of additional interest in a subsidiary — — — (0.9) — — — (0.9)Disposal of a subsidiary — — — — — — 43.4 43.4Deemed disposal of interest in a subsidiary — — — — — — 1.1 1.1Release of reserves upon disposal of
subsidiaries — (1.1) — 16.2 — (6.9) — 8.2Release of reserves upon disposal of interests
in joint ventures and associated companies — — — (5.2) — (3.0) — (8.2)Profit attributable to shareholders — — — — — — 1,096.2 1,096.2Share of other comprehensive income of joint
ventures and associated companies — (7.6) — (187.9) — (842.1) (13.1) (1,050.7)Cash flow/fair value hedges — — — (24.3) — — — (24.3)Remeasurement of post-employment benefit
obligation — — — — — — 19.5 19.5Transfer of reserves — — — 94.7 — — (94.7) —Revaluation of investment properties upon
reclassification from property, plant and equipment and right-of-use assets, net of taxation 8.1 — — — — — — 8.1
Amount reported in other comprehensive income applying overlay approach adjustments on financial assets — — (126.7) — — — — (126.7)
Release of reserve upon disposal of equity instruments as financial assets at FVOCI — 666.1 — — — — (666.1) —
Release of reserve upon disposal of debt instruments as financial assets at FVOCI — — (185.4) — — — — (185.4)
Transaction costs in relation to the issuance of perpetual capital securities — — — — — — (110.8) (110.8)
Translation differences — — — — — (3,546.6) — (3,546.6)2019 final dividend paid — — — — — — (3,785.2) (3,785.2)2020 interim dividend paid — — — — — — (1,431.3) (1,431.3)Buyback of shares — — — — — — (614.8) (614.8)
At 30 June 2020 7,596.6 1,265.1 720.2 309.6 133.5 (4,747.2) 129,519.8 134,797.6

New World Development Company Limited264
Notes to the Financial Statements
41 RESERVES (CONTINUED)
Property revaluation
reserve
Investment revaluation
reserve
Financial assets
at FVOCI reserve
(non-recycling)General reserve
Employees’ share-based
compensation reserve
Exchange reserve
Retained profits Total
HK$m HK$m HK$m HK$m HK$m HK$m HK$m HK$m
As at 30 June 2018 7,556.8 1,468.1 — 1,068.6 270.3 4,774.3 123,585.9 138,724.0Adjustment on adoption of HKFRS 9 — (1,468.1) 922.5 — — — 678.7 133.1
Restated balance as at 1 July 2018 7,556.8 — 922.5 1,068.6 270.3 4,774.3 124,264.6 138,857.1Fair value changes of equity instruments as
financial assets at FVOCI — — (26.7) — — — — (26.7)Employees’ share-based payments — — — — 67.0 — — 67.0Share options lapsed — — — — (55.7) — 55.7 —Deemed disposal of interests in subsidiaries — — — (0.2) — — 12.6 12.4Acquisition of additional interests in
subsidiaries — — — — — — (2.6) (2.6)Release of reserves upon disposal of
interests in associated companies — — — (25.5) — (8.9) — (34.4)Release of reserve upon disposal of
subsidiaries — — — — — 0.1 — 0.1Reversal of reserve upon deregistration of
subsidiaries — — — — — (8.9) — (8.9)Profit attributable to shareholders — — — — — — 18,160.1 18,160.1Share of other comprehensive income of
joint ventures and associated companies — — 19.6 71.7 — (751.9) (2.9) (663.5)Cash flow hedges — — — (705.4) — — — (705.4)Remeasurement of post-employment
benefit obligation — — — — — — (5.1) (5.1)Transfer of reserves — — — 7.8 — — (7.8) —Revaluation of investment properties upon
reclassification from property, plant and equipment and land use rights, net of taxation 31.7 — — — — — — 31.7
Release of reserve upon disposal of equity instruments as financial assets at FVOCI — — 405.3 — — — (405.3) —
Transaction costs in relation to the issuance of perpetual capital securities — — — — — — (118.5) (118.5)
Translation differences — — — — — (4,353.3) — (4,353.3)2018 final dividend paid — — — — — — (3,468.6) (3,468.6)2019 interim dividend paid — — — — — — (1,430.1) (1,430.1)Buyback of shares — — — — — — (322.1) (322.1)
At 30 June 2019 7,588.5 — 1,320.7 417.0 281.6 (348.6) 136,730.0 145,989.2
Note:
Effect on net transfer to the non-controlling interests of the Group:
2020 2019HK$m HK$m
Total comprehensive income for the year attributable to the shareholders of the Company (3,490.6) 12,394.6 Transfer between shareholders’ funds and non-controlling interestsAcquisition of additional interests in subsidiaries (0.9) (2.6)Deemed disposal of interests in subsidiaries 1.1 12.4 Net transfer to the non-controlling interests 0.2 9.8 Total comprehensive income for the year attributable to the shareholders of the Company and
net transfer to the non-controlling interests (3,490.4) 12,404.4

Annual Report 2020 265
Notes to the Financial Statements
42 BORROWINGS AND OTHER INTEREST-BEARING LIABILITIES
2020 2019HK$m HK$m
Long-term borrowings and other interest-bearing liabilitiesSecured bank loans 20,646.3 16,782.9Unsecured bank loans 94,141.0 71,573.4Other unsecured loans 0.2 1,250.4Fixed rate bonds and notes payable 51,473.1 47,436.1Loans from non-controlling shareholders (note (b)) 4,712.2 3,437.0Financing received under a financial reinsurance arrangement (note (c)) 249.6 —
171,222.4 140,479.8Current portion of long-term borrowings and other interest-bearing liabilities (36,434.5) (25,921.2)
134,787.9 114,558.6
Short-term borrowings and other interest-bearing liabilitiesSecured bank loans 998.1 1,157.6Unsecured bank loans 16,630.5 13,814.2Other unsecured loans 5.0 5.0Loans from non-controlling shareholders (note (b)) 835.8 878.0Financing received under a financial reinsurance arrangement (note (c)) 115.2 —Cash collateral received for cross currency swap and forward starting interest rate
swap contracts (note 27(b)) 1,582.0 —
20,166.6 15,854.8Current portion of long-term borrowings and other interest-bearing liabilities 36,434.5 25,921.2
56,601.1 41,776.0
Total borrowings and other interest-bearing liabilities 191,389.0 156,334.6
Notes:
(a) Bank loans, other loans and fixed rate bonds and notes payable are repayable as follows:
Bank loans Other loansFixed rate bonds
and notes payable2020 2019 2020 2019 2020 2019
HK$m HK$m HK$m HK$m HK$m HK$m Within one year 48,272.1 29,349.4 5.1 1,255.1 5,790.9 10,293.5In the second year 14,566.8 37,197.3 0.1 0.1 2,008.6 5,809.1In the third to fifth year 63,211.3 33,573.2 — 0.2 18,273.9 18,243.4After the fifth year 6,365.7 3,208.2 — — 25,399.7 13,090.1
132,415.9 103,328.1 5.2 1,255.4 51,473.1 47,436.1
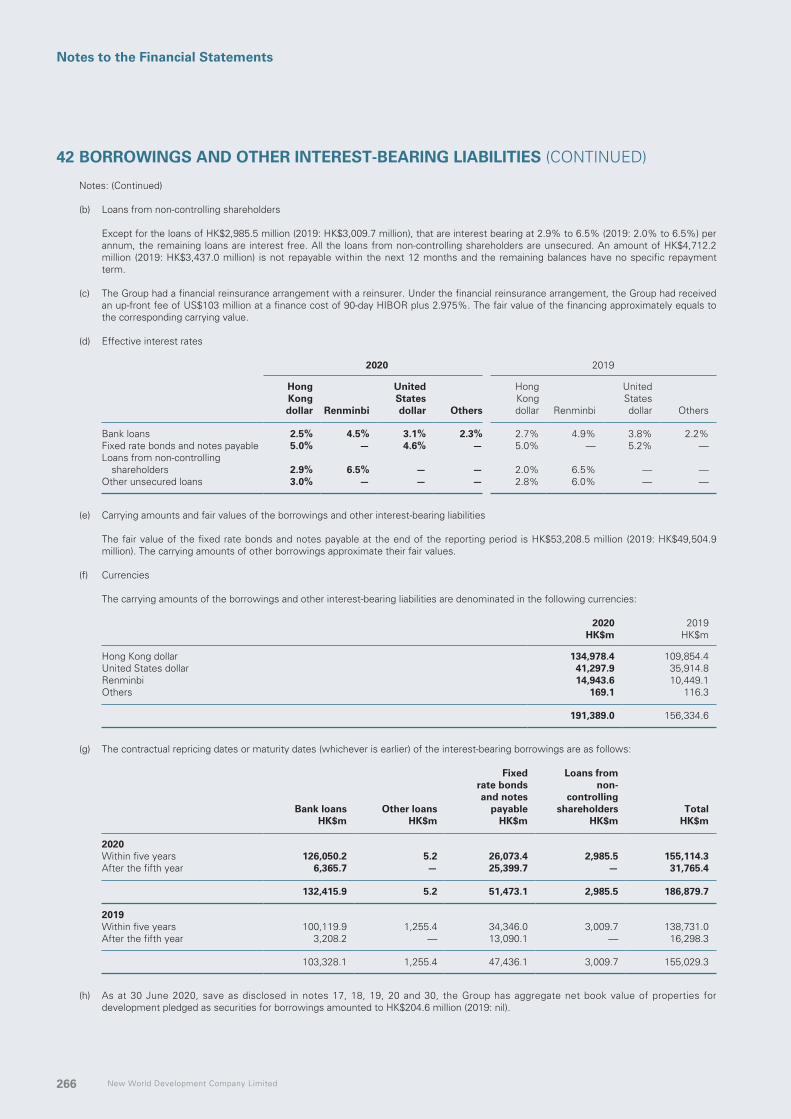
New World Development Company Limited266
Notes to the Financial Statements
42 BORROWINGS AND OTHER INTEREST-BEARING LIABILITIES (CONTINUED)
Notes: (Continued)
(b) Loans from non-controlling shareholders
Except for the loans of HK$2,985.5 million (2019: HK$3,009.7 million), that are interest bearing at 2.9% to 6.5% (2019: 2.0% to 6.5%) per annum, the remaining loans are interest free. All the loans from non-controlling shareholders are unsecured. An amount of HK$4,712.2 million (2019: HK$3,437.0 million) is not repayable within the next 12 months and the remaining balances have no specific repayment term.
(c) The Group had a financial reinsurance arrangement with a reinsurer. Under the financial reinsurance arrangement, the Group had received an up-front fee of US$103 million at a finance cost of 90-day HIBOR plus 2.975%. The fair value of the financing approximately equals to the corresponding carrying value.
(d) Effective interest rates
2020 2019 Hong Kong dollar Renminbi
United States dollar Others
Hong Kong dollar Renminbi
United States dollar Others
Bank loans 2.5% 4.5% 3.1% 2.3% 2.7% 4.9% 3.8% 2.2%Fixed rate bonds and notes payable 5.0% — 4.6% — 5.0% — 5.2% —Loans from non-controlling
shareholders 2.9% 6.5% — — 2.0% 6.5% — —Other unsecured loans 3.0% — — — 2.8% 6.0% — —
(e) Carrying amounts and fair values of the borrowings and other interest-bearing liabilities
The fair value of the fixed rate bonds and notes payable at the end of the reporting period is HK$53,208.5 million (2019: HK$49,504.9 million). The carrying amounts of other borrowings approximate their fair values.
(f) Currencies
The carrying amounts of the borrowings and other interest-bearing liabilities are denominated in the following currencies:
2020 2019HK$m HK$m
Hong Kong dollar 134,978.4 109,854.4United States dollar 41,297.9 35,914.8Renminbi 14,943.6 10,449.1Others 169.1 116.3
191,389.0 156,334.6
(g) The contractual repricing dates or maturity dates (whichever is earlier) of the interest-bearing borrowings are as follows:
Bank loans Other loans
Fixed rate bonds and notes
payable
Loans from non-
controlling shareholders Total
HK$m HK$m HK$m HK$m HK$m 2020Within five years 126,050.2 5.2 26,073.4 2,985.5 155,114.3After the fifth year 6,365.7 — 25,399.7 — 31,765.4
132,415.9 5.2 51,473.1 2,985.5 186,879.7 2019Within five years 100,119.9 1,255.4 34,346.0 3,009.7 138,731.0After the fifth year 3,208.2 — 13,090.1 — 16,298.3
103,328.1 1,255.4 47,436.1 3,009.7 155,029.3
(h) As at 30 June 2020, save as disclosed in notes 17, 18, 19, 20 and 30, the Group has aggregate net book value of properties for development pledged as securities for borrowings amounted to HK$204.6 million (2019: nil).

Annual Report 2020 267
Notes to the Financial Statements
43 LEASE LIABILITIES
The maturity of lease liabilities is as follows:
2020HK$m
CurrentWithin 1 year 1,227.9
Non-currentIn the second to fifth year 3,614.6After the fifth year 2,144.8
5,759.4
6,987.3
As at 30 June 2020, the weighted average lessee’s incremental borrowing rates applied was 4.49%.
As at 30 June 2020, the balance included the lease liabilities payable to joint ventures and related companies of HK$288.5 million.
44 INSURANCE AND INVESTMENT CONTRACT LIABILITIES
2020 2019HK$m HK$m
Insurance contract liabilities (notes (a) and (b)) 34,894.7 —Investment contract liabilities 5.4 —
34,900.1 —
Represented by:Non-current liabilities 14,454.8 —Current liabilities 20,445.3 —
34,900.1 —
Insurance and investment contract liabilities related to unit-linked contracts are detailed in Note 35.
Notes:
(a) The maturity profile of insurance contract liabilities based on estimated amounts on a discounted basis and the timing of cash flows is stated as below:
2020 2019HK$m HK$m
Payable within one year 3,200.5 —Payable after one year 31,694.2 —
34,894.7 —
(b) Insurance contract liabilities comprised:
2020 2019HK$m HK$m
Liabilities for guaranteed benefits 31,246.0 —Liabilities for coinsurance payments 244.7 —Provision for annual dividends 69.7 — Insurance contract liabilities excluding policyholders’ dividends and bonuses (note 5(g)) 31,560.4 —Policyholders’ dividends and bonuses 3,334.3 — Total insurance contract liabilities 34,894.7 —
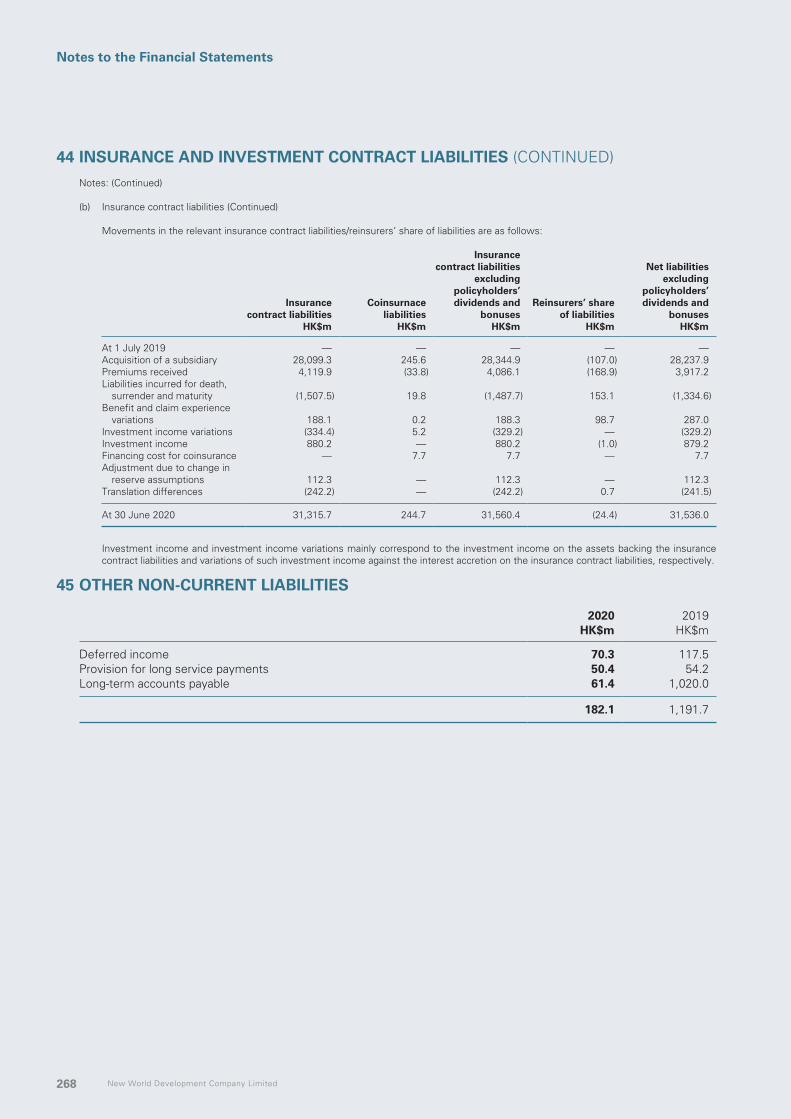
New World Development Company Limited268
Notes to the Financial Statements
44 INSURANCE AND INVESTMENT CONTRACT LIABILITIES (CONTINUED)Notes: (Continued)
(b) Insurance contract liabilities (Continued)
Movements in the relevant insurance contract liabilities/reinsurers’ share of liabilities are as follows:
Insurance contract liabilities
Coinsurnace liabilities
Insurance contract liabilities
excluding policyholders’ dividends and
bonusesReinsurers’ share
of liabilities
Net liabilities excluding
policyholders’ dividends and
bonusesHK$m HK$m HK$m HK$m HK$m
At 1 July 2019 — — — — —Acquisition of a subsidiary 28,099.3 245.6 28,344.9 (107.0) 28,237.9Premiums received 4,119.9 (33.8) 4,086.1 (168.9) 3,917.2Liabilities incurred for death,
surrender and maturity (1,507.5) 19.8 (1,487.7) 153.1 (1,334.6)Benefit and claim experience
variations 188.1 0.2 188.3 98.7 287.0Investment income variations (334.4) 5.2 (329.2) — (329.2)Investment income 880.2 — 880.2 (1.0) 879.2Financing cost for coinsurance — 7.7 7.7 — 7.7Adjustment due to change in
reserve assumptions 112.3 — 112.3 — 112.3Translation differences (242.2) — (242.2) 0.7 (241.5) At 30 June 2020 31,315.7 244.7 31,560.4 (24.4) 31,536.0
Investment income and investment income variations mainly correspond to the investment income on the assets backing the insurance contract liabilities and variations of such investment income against the interest accretion on the insurance contract liabilities, respectively.
45 OTHER NON-CURRENT LIABILITIES
2020 2019HK$m HK$m
Deferred income 70.3 117.5Provision for long service payments 50.4 54.2Long-term accounts payable 61.4 1,020.0
182.1 1,191.7

Annual Report 2020 269
Notes to the Financial Statements
46 CREDITORS, ACCRUED CHARGES, PAYABLES TO POLICYHOLDERS AND CONTRACT LIABILITIES
2020 2019HK$m HK$m
Trade creditors (note (a)) 10,597.8 11,127.4Payables to policyholders (note (b)) 1,468.8 —Contract liabilities (note (c)) 13,532.7 10,553.3Amounts due to joint ventures (note (f)) 570.1 1,670.0Amounts due to associated companies (note (f)) 3,620.8 2,181.7Other creditors and accrued charges 24,311.0 23,220.6
54,101.2 48,753.0
Notes:
(a) Aging analysis of trade creditors based on invoice date is as follows:
2020 2019HK$m HK$m
Less than 30 days 6,079.1 6,331.831 to 60 days 201.1 403.5Over 60 days 4,317.6 4,392.1
10,597.8 11,127.4
(b) Payables to policyholders are as follows:
2020 2019HK$m HK$m
Claims payable 254.1 —Premium deposits 1,094.1 —Other payables 120.6 —
1,468.8 —
The carrying amounts disclosed above reasonably approximate their fair values as at 30 June 2020.
Claims payable represents provision for claims reported by policyholders and claims incurred but not reported, while premium deposits represent amounts left in deposits with the Group for the payment of future premiums. Both balances are expected to be settled or utilised within the next 12 months from the end of the reporting period.
(c) The Group has recognised the following revenue-related contract liabilities:
2020 2019HK$m HK$m
Contract liabilities related to property sales (note) 11,636.8 8,823.1Contract liabilities related to construction services (note) 1,390.4 1,380.6Contract liabilities related to other operations 505.5 349.6
13,532.7 10,553.3
Note:
The Group receives payments from customers based on billing schedule as established in contracts. Payments are usually received in advance of the performance under the contracts which are mainly from sales of properties and construction services.

New World Development Company Limited270
Notes to the Financial Statements
46 CREDITORS, ACCRUED CHARGES, PAYABLES TO POLICYHOLDERS AND CONTRACT LIABILITIES (CONTINUED)
Notes: (continued)
(d) The following table shows the amount of the revenue recognised in the current reporting period relates to contract liabilities at the beginning of the year and the amount relates to performance obligations that were satisfied in prior year.
2020 2019HK$m HK$m
Revenue recognised that was included in contract liabilities at the beginning of the year— Property sales 8,762.4 22,326.3— Construction services 1,064.5 2,791.6— Other operations 182.9 204.1
10,009.8 25,322.0 Revenue recognised from performance obligations satisfied/partially satisfied in previous periods
— Construction services 272.2 900.0
(e) The following table shows the amount of unsatisfied performance obligations resulting from property sales, construction services and other operations for contracts with an original expected duration of one year or more:
2020 2019HK$m HK$m
Expected to be recognised within one year 38,302.2 32,223.8Expected to be recognised after one year 20,560.3 25,366.8
58,862.5 57,590.6
For all other contracts with an original expected duration of one year or less or are billed based on time incurred, as permitted under HKFRS 15, the transaction price allocated to these unsatisfied contracts is not disclosed.
(f) The amounts payable are interest free, unsecured and have no fixed terms of repayment.
(g) The carrying amounts of creditors, accrued charges, payable to policyholders and contract liabilities, which approximate their fair values, are denominated in the following currencies:
2020 2019HK$m HK$m
Renminbi 28,059.6 26,905.3Hong Kong dollar 24,161.4 21,225.9United States dollars 1,640.2 328.1Others 240.0 293.7
54,101.2 48,753.0
47 FINANCIAL INSTRUMENTS BY CATEGORY
In accordance with HKFRS 7, the financial assets and financial liabilities of the Group as shown in the consolidated statements of financial position are classified as follows:
(a) Financial assets measured at fair value are disclosed in Note 5(h);
(b) Amounts receivable included in interests in joint ventures and interests in associated companies, other receivables, long-term deposits, policy loans and contract assets included in other non-current assets, trade and other debtors, contracted assets, deposits and amounts due from associated companies, joint ventures and non-controlling shareholders included in debtors, prepayments, premium receivable and contract assets, restricted bank balances and cash and bank balances are categorised as financial assets at amortised cost and carried at amortised cost using the effective interest method; and
(c) Borrowings and other interest-bearing liabilities, lease liabilities, trade and other creditors and contract liabilities are categorised as financial liabilities and carried at amortised cost using the effective interest method.

Annual Report 2020 271
Notes to the Financial Statements
48 COMMITMENTS
(a) Operating lease receivableThe future minimum rental receivable under non-cancellable operating leases are as follows:
2020 2019HK$m HK$m
In the first year 3,247.5 3,011.8In the second to fifth year 4,723.4 4,889.1After the fifth year 1,485.0 1,455.2
9,455.9 9,356.1
The Group’s operating leases are for terms ranging from 1 to 12 years (2019: 1 to 20 years).
(b) Other commitments(i) Capital expenditure contracted for at the end of the year but not yet provided for is as follows:
2020 2019HK$m HK$m
Contracted but not provided forProperty, plant and equipment 428.3 977.3Acquisition of a subsidiary (note 50(a)) — 18,380.0Investment properties 934.9 2,803.5Intangible concession rights 3.3 62.4Joint ventures and associated companies 1,065.6 958.1Other investments 1,405.1 1,207.0
3,837.2 24,388.3
The Group’s share of capital commitments of the joint ventures not included above are as follows:
2020 2019HK$m HK$m
Contracted but not provided for 11,676.2 11,127.6
(ii) Future aggregate lease payments under non-cancellable operating leases are as follows:
2020 2019HK$m HK$m
Land and buildingsIn the first year 10.4 1,087.0In the second to fifth year — 2,789.3After the fifth year — 1,879.0
10.4 5,755.3
As at 30 June 2019, the Group leased various retail outlets under non-cancellable operating lease agreements. The leases had varying terms ranging from 1 to 30 years. Certain of these leases had escalation clauses and renewal rights.
From 1 July 2019, the Group has recognised right-of-use assets for these leases, except for short-term and low-value leases. The commitments as at 30 June 2020 represented the future aggregate lease payments under short-term leases or committed but not commenced leases. Please refer to note 4(a) for the changes in accounting policies.
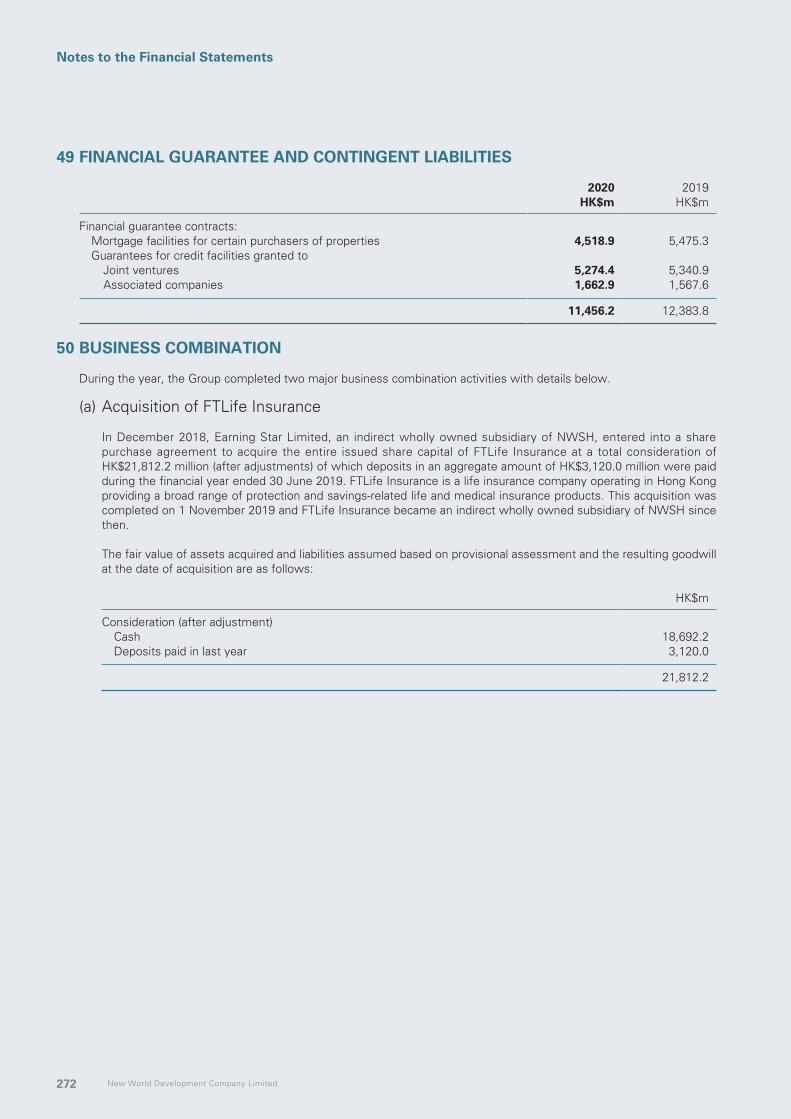
New World Development Company Limited272
Notes to the Financial Statements
49 FINANCIAL GUARANTEE AND CONTINGENT LIABILITIES
2020 2019HK$m HK$m
Financial guarantee contracts:Mortgage facilities for certain purchasers of properties 4,518.9 5,475.3Guarantees for credit facilities granted to
Joint ventures 5,274.4 5,340.9Associated companies 1,662.9 1,567.6
11,456.2 12,383.8
50 BUSINESS COMBINATION
During the year, the Group completed two major business combination activities with details below.
(a) Acquisition of FTLife Insurance
In December 2018, Earning Star Limited, an indirect wholly owned subsidiary of NWSH, entered into a share purchase agreement to acquire the entire issued share capital of FTLife Insurance at a total consideration of HK$21,812.2 million (after adjustments) of which deposits in an aggregate amount of HK$3,120.0 million were paid during the financial year ended 30 June 2019. FTLife Insurance is a life insurance company operating in Hong Kong providing a broad range of protection and savings-related life and medical insurance products. This acquisition was completed on 1 November 2019 and FTLife Insurance became an indirect wholly owned subsidiary of NWSH since then.
The fair value of assets acquired and liabilities assumed based on provisional assessment and the resulting goodwill at the date of acquisition are as follows:
HK$m
Consideration (after adjustment)Cash 18,692.2Deposits paid in last year 3,120.0
21,812.2

Annual Report 2020 273
Notes to the Financial Statements
50 BUSINESS COMBINATION (CONTINUED)
(a) Acquisition of FTLife Insurance (continued)
Provisional fair value
HK$m
Property, plant and equipment 110.8Intangible assets 90.5Value of business acquired 5,825.0Right-of-use assets 557.5Financial assets at FVOCI 33,569.5Financial assets at FVPL 2,803.6Derivatives financial instruments (net) 1,512.3Other non-current assets 724.3Debtors, prepayments, premium receivables and contract assets 1,125.9Investments related to unit-linked contracts 9,168.3Cash and bank balances and restricted bank balances 8,586.8Borrowings and other interest-bearing liabilities (3,548.8)Deferred tax liabilities (299.0)Insurance and investment contract liabilities (31,543.4)Liabilities related to unit-linked contracts (9,330.8)Lease liabilities (559.8)Other non-current liabilities (64.5)Creditors, accrued charges, payables to policyholders and contract liabilities (2,411.4)Tax payable (80.9)
Identifiable assets acquired and liabilities assumed 16,235.9Provisional goodwill on acquisition 5,576.3
21,812.2
Purchase consideration settled in cash during the year 18,692.2Less: Cash and cash equivalents of the subsidiaries acquired
Cash and bank balances (8,576.8)Cash and bank balances attributable to investments related to unit-linked contracts (17.7)
Net cash outflow on acquisition during the year 10,097.7
A provisional goodwill of HK$5,576.3 million arising from the acquisition is attributable mainly to the benefit of talents and experience of the management and workforce of the acquired insurance business and integration of the Group’s existing premium products and services into the attractive insurance sector.
The measurement of goodwill, identifiable assets acquired and liabilities assumed at the acquisition date will be subject to finalisation within one year from the acquisition date in accordance with Hong Kong Financial Reporting Standard 3 “Business Combination” (“HKFRS 3”). Any adjustment to the provisional amount, if necessary, will be reflected in the upcoming condensed consolidated interim financial statements of the Group.
For the purpose of disclosing the revenue and results of the combined entity for the current reporting period if the acquisition occurred at the beginning of the current reporting period, it is considered impracticable to quantify the impact as the valuation of certain balances including insurance contract liabilities and VOBA is based on assumptions made on the acquisition date which are not applicable to that of the beginning of the current reporting period. As a result, the information is considered not being a fair indicator to illustrate the full period financial impact of FTLife Insurance could have been contributed to the Group.
Up to 30 June 2020, acquisition-related costs of HK$194.1 million was incurred, in which HK$45.3 million are recognised as administrative and other operating expenses in the consolidated income statement for the current year and the remaining HK$148.8 million was recognised in the year ended 30 June 2019.
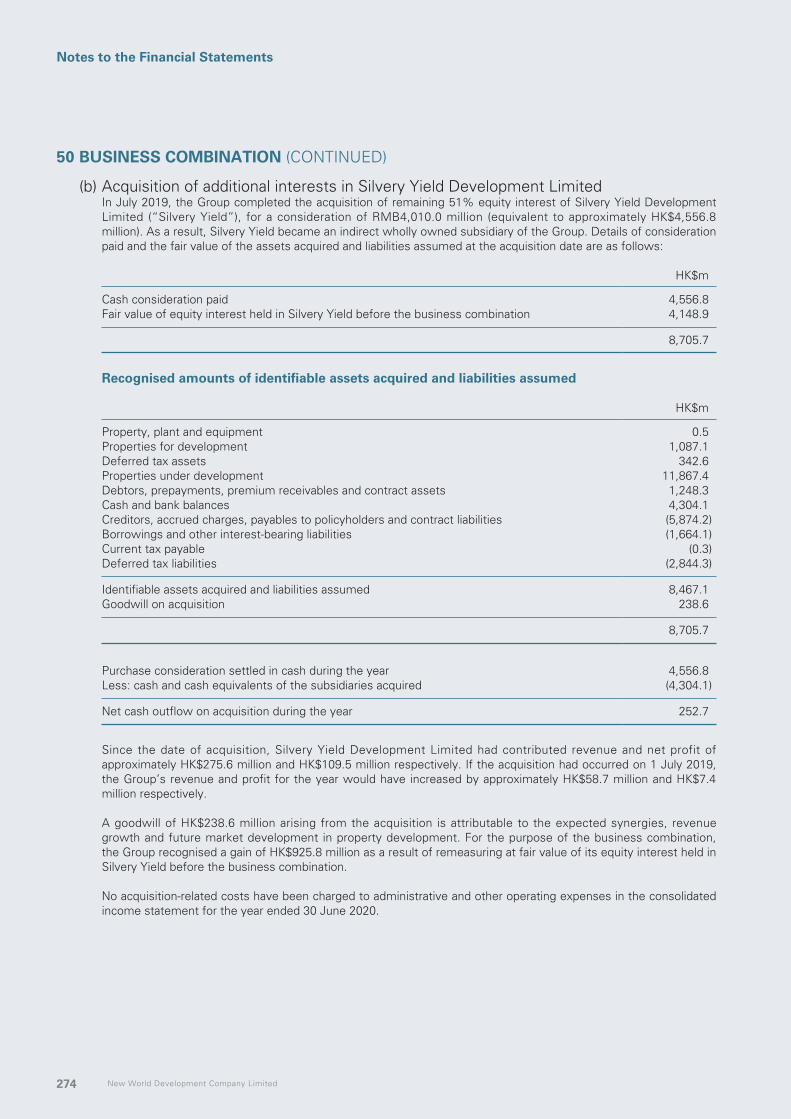
New World Development Company Limited274
Notes to the Financial Statements
50 BUSINESS COMBINATION (CONTINUED)
(b) Acquisition of additional interests in Silvery Yield Development LimitedIn July 2019, the Group completed the acquisition of remaining 51% equity interest of Silvery Yield Development Limited (“Silvery Yield”), for a consideration of RMB4,010.0 million (equivalent to approximately HK$4,556.8 million). As a result, Silvery Yield became an indirect wholly owned subsidiary of the Group. Details of consideration paid and the fair value of the assets acquired and liabilities assumed at the acquisition date are as follows:
HK$m
Cash consideration paid 4,556.8Fair value of equity interest held in Silvery Yield before the business combination 4,148.9
8,705.7
Recognised amounts of identifiable assets acquired and liabilities assumed
HK$m
Property, plant and equipment 0.5Properties for development 1,087.1Deferred tax assets 342.6Properties under development 11,867.4Debtors, prepayments, premium receivables and contract assets 1,248.3Cash and bank balances 4,304.1Creditors, accrued charges, payables to policyholders and contract liabilities (5,874.2)Borrowings and other interest-bearing liabilities (1,664.1)Current tax payable (0.3)Deferred tax liabilities (2,844.3)
Identifiable assets acquired and liabilities assumed 8,467.1Goodwill on acquisition 238.6
8,705.7
Purchase consideration settled in cash during the year 4,556.8Less: cash and cash equivalents of the subsidiaries acquired (4,304.1)
Net cash outflow on acquisition during the year 252.7
Since the date of acquisition, Silvery Yield Development Limited had contributed revenue and net profit of approximately HK$275.6 million and HK$109.5 million respectively. If the acquisition had occurred on 1 July 2019, the Group’s revenue and profit for the year would have increased by approximately HK$58.7 million and HK$7.4 million respectively.
A goodwill of HK$238.6 million arising from the acquisition is attributable to the expected synergies, revenue growth and future market development in property development. For the purpose of the business combination, the Group recognised a gain of HK$925.8 million as a result of remeasuring at fair value of its equity interest held in Silvery Yield before the business combination.
No acquisition-related costs have been charged to administrative and other operating expenses in the consolidated income statement for the year ended 30 June 2020.

Annual Report 2020 275
Notes to the Financial Statements
51 NOTES TO CONSOLIDATED STATEMENT OF CASH FLOWS
(a) Reconciliation of operating profit to net cash generated from operations
2020 2019HK$m HK$m
Operating profit 12,035.4 25,202.1Depreciation 2,736.9 1,502.9Amortisation 958.4 951.2Changes in fair value of and gain on transfer to investment properties (1,653.2) (10,305.7)Write back the loss allowance on loans and other receivables (57.5) (240.0)Gain on remeasuring of previously held interest of a joint venture at fair value
upon further acquisition to become a subsidiary (925.8) —Gain associated with investments related to unit-linked contracts (122.2) —Net gain on fair value of financial assets at FVPL and derivative financial
instruments (305.4) (239.7)Net gain on disposal of
Debt instruments as financial assets at FVOCI (306.6) —Financial assets at FVPL (78.8) (103.5)Investment properties, property, plant and equipment, right-of-use assets and
intangible concession rights (82.0) (35.6)Subsidiaries, joint ventures and associated companies (212.2) (598.8)
Impairment loss/loss allowance onLoans, debtors, premium receivables and other receivables 131.3 344.1Financial assets at FVOCI 32.2 —Interests in associated companies 334.8 —Goodwill 775.9 165.0Inventories 47.1 —Properties under development — 237.6Property, plant and equipment 386.9 16.0Right-of-use assets 12.3 —
Dividend income from financial assets at FVOCI and financial assets at FVPL (243.8) (121.4)Share option expenses 29.8 67.0Provision for onerous contract 230.0 —Loss on lease modification of lease receivables 34.1 —Net exchange (gains)/losses (3.8) 116.1Overlay approach adjustments on financial assets (208.2) —
Operating profit before working capital changes 13,545.6 16,957.3Decrease in inventories 42.9 25.8(Increase)/decrease in properties for/under development and properties
held for sale (1,170.0) 12,195.8Increase in debtors, prepayments, premium receivables and
contract assets and other non-current assets (12,234.1) (693.7)Decrease in creditors, accrued charges, payables to policyholders and
contract liabilities (2,052.6) (16,292.7)Increase in deferred acquisition costs (688.2) —Increase in insurance and investment contract liabilities 3,618.4 —Decrease in liabilities related to unit-linked contracts (18.1) —Additions of financial assets at FVPL associated with investments related to
unit-linked contracts (4,600.1) —Disposal of financial assets at FVPL associated with investments related to unit-
linked contracts 4,895.5 —
Net cash generated from operations 1,339.3 12,192.5

New World Development Company Limited276
Notes to the Financial Statements
51 NOTES TO CONSOLIDATED STATEMENT OF CASH FLOWS (CONTINUED)
(b) Reconciliation of liabilities arising from financing activities:
Borrowings and other interest-bearing liabilities
Long-term Short-termLease
liabilities TotalHK$m HK$m HK$m HK$m
At 30 June 2019 140,479.8 15,854.8 — 156,334.6Adjustment on changes in
accounting policies (note 4(a)) — — 6,452.6 6,452.6
Restated balance at 1 July 2019 140,479.8 15,854.8 6,452.6 162,787.2Changes from cash flows
Proceeds from new borrowings 66,458.4 17,745.6 — 84,204.0Repayment of borrowings (41,263.5) (14,913.4) — (56,176.9)Increase in cash collateral received from
counterparties — 423.9 — 423.9Other changes
Acquisition of subsidiaries 5,584.8 1,071.5 559.8 7,216.1Disposal of subsidiaries — — (4.2) (4.2)Principal elements of lease liabilities payments — — (874.7) (874.7)New leases entered/lease modified — — 979.3 979.3Interest expenses (note 11) — — 298.7 298.7Interest elements of lease liabilities payments — — (293.9) (293.9)Translation differences (133.6) (89.6) (130.3) (353.5)Amortisation of front-end fee 96.5 73.8 — 170.3
At 30 June 2020 171,222.4 20,166.6 6,987.3 198,376.3
Borrowings and other interest-bearing liabilities
Long-term Short-term TotalHK$m HK$m HK$m
At 30 June 2018 131,975.1 8,777.6 140,752.7Adjustment on adoption of HKFRS 9 43.2 — 43.2
Restated balance at 1 July 2018 132,018.3 8,777.6 140,795.9Changes from cash flows
Proceeds from new borrowings 31,707.6 9,024.0 40,731.6Repayment of borrowings (26,153.9) (1,976.6) (28,130.5)
Other changesAcquisition of subsidiaries 2,810.6 — 2,810.6Translation differences (389.7) (4.7) (394.4)Amortisation of front-end fee 486.9 34.5 521.4
At 30 June 2019 140,479.8 15,854.8 156,334.6

Annual Report 2020 277
Notes to the Financial Statements
51 NOTES TO CONSOLIDATED STATEMENT OF CASH FLOWS (CONTINUED)
(c) Acquisition of subsidiaries
2020 2019HK$m HK$m
Net assets acquiredInvestment properties 320.5 2,672.0Property, plant and equipment 111.3 —Right-of-use assets 557.5 —Intangible assets, other than goodwill 90.5 —Value of business acquired 5,825.0 —Financial assets at FVOCI 33,569.5 —Financial assets at FVPL 2,803.6 —Derivative financial instruments 1,512.3 —Properties for development 1,087.1 —Deferred tax assets 342.6 —Other non-current assets 724.3 —Properties under development 13,568.4 7,758.7Debtors, prepayments, premium receivables and contract assets 2,374.2 198.5Investments related to unit-linked contracts 9,168.3 —Cash and bank balances 13,215.3 12.4Borrowings and other interest-bearing liabilities (6,656.4) (2,810.6)Lease liabilities (559.8) —Insurance and investment contract liabilities (31,543.4) —Liabilities related to unit-linked contracts (9,330.8) —Deferred tax liabilities (3,143.3) —Other non-current liabilities (64.5) —Creditors, accrued charges, payable to policyholders and contract liabilities (8,285.6) (116.0)Current tax payable (81.2) —
Net assets acquired 25,605.4 7,715.0Interests originally held by the Group as a joint venture (3,223.1) —
22,382.3 7,715.0Goodwill on acquisition 5,814.9 —Gain on remeasurement of previously held interest of a joint venture at fair
value upon further acquisition to become a subsidiary (925.8) —Non-controlling interests (324.4) —
Cash consideration 26,947.0 7,715.0
(d) Analysis of net cash flows of cash and cash equivalents in respect of acquisition of subsidiaries
2020 2019HK$m HK$m
Cash consideration (26,947.0) (7,715.0)Deposits paid in last year 3,120.0 —Cash and cash equivalents acquired 13,215.3 12.4
(10,611.7) (7,702.6)

New World Development Company Limited278
Notes to the Financial Statements
51 NOTES TO CONSOLIDATED STATEMENT OF CASH FLOWS (CONTINUED)
(e) Disposal of subsidiaries
2020 2019HK$m HK$m
Net assets disposedInvestment properties 1,506.4 59.2Property, plant and equipment 179.9 4.7Right-of-use assets 4.2 —Intangible assets, other than goodwill 116.1 —Goodwill 9.8 2.0Interests in joint venture — 56.1Deferred tax assets — 4.2Other non-current assets 4.5 —Non-current assets classified as assets held for sale — 820.7Financial assets at FVOCI 1.8 —Properties for development 704.8 —Properties under development 1,023.0 —Properties held for sale 728.7 —Inventories 30.6 —Debtors, prepayments, premium receivables and contract assets 1,966.9 172.6Cash and bank balances 199.4 19.2Creditors, accrued charges, payable to policyholders and contract liabilities (1,725.8) (35.2)Derivative financial instruments (24.7) —Current tax payable (16.5) (0.1)Other non-current liabilities (15.9) —Deferred tax liabilities (47.2) (0.6)Lease liabilities (4.2) —
Net assets disposed 4,641.8 1,102.8Release of reserves upon disposal of subsidiaries (68.4) 0.1Interest retained by the Group as an associated company (140.5) —Net gain on disposal of subsidiaries 357.4 549.1
Consideration 4,790.3 1,652.0
Represented byCash consideration 4,790.3 1,618.5Consideration settled by additional equity interest in an associated company
by the Group — 33.5
4,790.3 1,652.0
(f) Analysis of net inflow of cash and cash equivalents in respect of disposal of subsidiaries
2020 2019HK$m HK$m
Cash consideration 4,790.3 1,618.5Consideration receivable (2,768.7) —Cash and cash equivalents disposed (199.4) (19.2)
1,822.2 1,599.3

Annual Report 2020 279
Notes to the Financial Statements
52 RELATED PARTY TRANSACTIONS
In addition to those disclosed in other sections of the consolidated financial statements, the following significant related party transactions have been entered into by the Group during the year:
2020 2019HK$m HK$m
Joint ventures and associated companiesProvision of construction work services (note (a)) 44.5 226.2Interest income (note (b)) 428.7 301.4Interest expense on lease liabilities (note (b)) 14.8 —Rental expenses (note (c)) 110.4 203.8Additions to right-of-use assets (note (c)) 2.1 —Management services fee income (note (d)) 32.3 27.2
2020 2019HK$m HK$m
Related companies (note (h))Provision of construction work services (note (a)) 7.9 81.7Rental income (note (c)) 125.1 122.0Rental expense (note (c)) 30.1 44.7Additions to right-of-use assets (note (c)) 12.5 —Management services fee expenses (note (d)) 30.8 51.2Concessionaires commissions (note (e)) 46.7 74.0Sales of goods, prepaid shopping cards and vouchers (note (f)) 51.3 86.8Engineering and mechanical services (note (g)) 1,292.5 1,391.1Security services expenses (note (g)) 29.6 19.0Cleaning and landscaping services (note (g)) 33.3 22.6
Notes:
(a) Revenue from provision of construction work services is principally charged in accordance with relevant contracts.
(b) Interest income is charged at interest rates as specified in notes 25(a) and 26(a) on the outstanding amounts. Interest expense on lease liabilities is charged at interest rates as specified in note 43.
(c) Rental income and expenses are charged and additions to right-of-use assets are measured in accordance with respective tenancy agreements.
(d) Management services fee income and expenses are charged in accordance with the terms of respective management service agreements.
(e) The income is charged in accordance with concessionaire counter agreements with Chow Tai Fook Jewellery Group Limited (“CTFJ”) and its subsidiaries (collectively “CTFJ Group”). The commission is mainly calculated by pre-determined percentages of gross sales value in accordance with respective agreements.
(f) This represents the amounts received in respect of the sales of goods, prepaid shopping cards and vouchers to the Group as payment of purchase of goods and settlement of the relevant value CTF and its subsidiaries (collectively “CTF Group”), CTFJ Group and companies owned by Mr. Doo.
(g) Engineering and mechanical services, security services expenses and cleaning and landscaping expenses are charged in accordance with relevant contracts.
(h) Related companies are subsidiaries and joint ventures of CTF Group, CTFJ Group and companies owned by Mr. Doo.
(i) The balances with joint ventures and associated companies are disclosed in notes 25, 26, 32 and 46.
(j) No significant transactions have been entered with the Directors of the Company (being the key management personnel) during the year other than the emoluments paid to them as disclosed in note 16.

New World Development Company Limited280
Notes to the Financial Statements
53 COMPANY STATEMENT OF FINANCIAL POSITION
2020 2019HK$m HK$m
AssetsNon-current assets
Investment property 140.0 150.0Property, plant and equipment 12.9 6.9Right-of-use assets 25.8 —Interests in subsidiaries 95,034.0 68,294.7Interests in joint ventures 171.8 177.2Interests in associated companies 14.2 7.5Amounts receivable from associated companies and joint ventures 4,402.8 5,823.4Financial assets at fair value through profit or loss 1,061.6 —Financial assets at fair value through other comprehensive income 1.0 1.3
100,864.1 74,461.0
Current assetsProperties held for sale 52.9 137.7Debtors, prepayments and contract assets 1,000.8 187.5Amounts receivable from subsidiaries 81,755.1 69,973.4Financial assets at fair value through profit or loss 35.2 —Cash and bank balances 2,435.0 610.7
85,279.0 70,909.3
Total assets 186,143.1 145,370.3
EquityShare capital 78,225.7 77,875.3Reserves (note) 23,526.4 24,121.0
Total equity 101,752.1 101,996.3
LiabilitiesNon-current liabilities
Lease liabilities 10.2 —
Current liabilitiesCreditors, accrued charges and contract liabilities 348.0 617.8Amounts payable to subsidiaries 84,015.9 42,756.2Lease liabilities 16.9 —
84,380.8 43,374.0
Total liabilities 84,391.0 43,374.0
Total equity and liabilities 186,143.1 145,370.3
Dr. Cheng Kar-Shun, Henry Dr. Cheng Chi-Kong, AdrianDirector Director

Annual Report 2020 281
Notes to the Financial Statements
53 COMPANY STATEMENT OF FINANCIAL POSITION (CONTINUED)
Note:
Reserves
Investment revaluation
reserve
Financial assets at
FVOCI reserve (non-recycling)
Employees’ share-based
compensation reserve
Retained profits Total
HK$m HK$m HK$m HK$m HK$m At 30 June 2019 — (9.8) 205.4 23,925.4 24,121.0Adjustment on adoption of HKFRS 16 — — — (0.6) (0.6) Restated balance as at 1 July 2019 — (9.8) 205.4 23,924.8 24,120.4Employees’ share-based payment — — 29.8 — 29.8Share options lapsed — — (101.7) 101.7 —Buyback of shares — — — (614.8) (614.8)Fair value changes of equity instruments as
financial assets at FVOCI — (0.2) — — (0.2)Profit for the year — — — 5,207.7 5,207.72019 final dividend paid — — — (3,785.2) (3,785.2)2020 interim dividend paid — — — (1,431.3) (1,431.3) At 30 June 2020 — (10.0) 133.5 23,402.9 23,526.4
Investment revaluation
reserve
Financial assets at
FVOCI reserve (non-recycling)
Employees’ share-based
compensation reserve
Retained profits Total
HK$m HK$m HK$m HK$m HK$m
At 30 June 2018 0.2 — 194.1 24,141.0 24,335.3Adjustment on adoption of HKFRS 9 (0.2) (7.8) — 8.0 —
Restated balance as at 1 July 2018 — (7.8) 194.1 24,149.0 24,335.3Employees’ share-based payment — — 67.0 — 67.0Share options lapsed — — (55.7) 55.7 —Buyback of shares — — — (322.1) (322.1)Fair value changes of equity instruments as
financial assets at FVOCI — (2.0) — — (2.0)Profit for the year — — — 4,941.5 4,941.52018 final dividend paid — — — (3,468.6) (3,468.6)2019 interim dividend paid — — — (1,430.1) (1,430.1)
At 30 June 2019 — (9.8) 205.4 23,925.4 24,121.0

New World Development Company Limited282
Notes to the Financial Statements
54 PRINCIPAL SUBSIDIARIES
As at 30 June 2020
Share capital issued#
Number of shares
Issued and paid up share
capital
Attributable interest to the Group Principal activities
HK$ (%)
Incorporated and operate in Hong Kong
Ace Island Limited 1 1 100 Property investmentAddlight Investments Limited 9,998 9,998 63 Property development
21 2 63Adwin Top Limited 2 2 100 Property investmentAll Speed Investment Limited 2 2 100 Property investmentAnway Limited 1 1 61 Duty free operation and general tradingBillion Huge (International) Limited 950,001 950,001 100 Investment holdingBillion Park Investment Limited 1,000,000 1,000,000 80 Investment holdingBillionoble Investment Limited 4,998 4,998 61 Investment holding
21 2 61Bonson Holdings Limited 1 1 100 Property investmentBounty Gain Limited 1 1 61 Investment holdingBright Moon Company, Limited 100,000 1,000,000 75 Property investmentCare & Services Elderly Home (North Point) Limited 1 1 100 Provision of elderly residential places and
servicesCare & Services Elderly Home (Tai Po) Limited 10,000 10,000 100 Provision of elderly residential places and
servicesCare & Services Elderly Home (Tai Wai) Limited 1 1 100 Provision of elderly residential places and
servicesCare & Services Elderly Home (Yuen Long) Limited 10,000 10,000 100 Provision of elderly residential places and
servicesCare U Professional Nursing Service Limited 10,000 10,000 75 Provision of healthcare and nursing
servicesCheer Best Enterprises Limited 2 2 100 Property investmentCheering Step Investments Limited 1 1 61 Investment holdingCheong Sing Company Limited 10,000 10,000 100 Property investmentChi Lam Investment Company Limited 7,000 700,000 100 Investment holdingChinese Future Limited 1,300,000,000 1,300,000,000 61 Investment holdingCiF Solutions Limited 10
160,0001
1,00016,000,000
100100
Provision of information technology solutions
Citybus Limited 37,500,000 376,295,750 61 Provision of franchised and non-franchised bus services
Come City Limited 2 2 100 Property investmentDaily Land Limited 1 1 100 Property investmentDP Properties Limited 4,000 1,000 100 Property investmentDynamic Ally Limited 1 1 61 Investment holdingEarning Star Limited 1 1 61 Investment holdingEminent Elite Limited 1 1 100 Investment holdingFook Hang Trading Company Limited 100 10,000 85 Property developmentFook Hong Enterprises Company, Limited 10,000 1,000,000 100 Property investmentFortune Kingdom Development Limited 2 2 100 Property developmentFortune Land Development Limited 1 1 100 Property investmentFull Asset Enterprises Limited 1 1 100 Property investmentGood Sense Development Limited 1 1 100 Property investmentGrace Crystal Limited 1 1 61 Investment holding

Annual Report 2020 283
Notes to the Financial Statements
Share capital issued#
Number of shares
Issued and paid up share
capital
Attributable interest to the Group Principal activities
HK$ (%)
Incorporated and operate in Hong Kong (continued)
Grace Sky Creation Limited 10,000 10,000 100 Investment holdingGracejoy Investments Limited 1 1 100 Property developmentGrand Express International Limited 1 1 61 Investment holdingGuidetone Investments Limited 100,000 100,000 80 Property investmentHappy Champion Limited 2 2 100 Investment holdingHappy Growth Investment Limited 1 1 75 Investment holding and provision of
management servicesHead Step Limited 2 2 100 Hotel operationHighness Land Investment Company Limited 10 100 100 Property investmentHip Hing Builders Company Limited 40,000 40,000,000 61 Construction
10,0001 10,000,000 61Hip Hing Construction Company Limited 400,000 40,000,000 61 Construction and civil engineering
600,000¹ 60,000,000 61Hip Hing Engineering Company Limited 2,000,000 200,000,000 61 Building constructionHip Seng Builders Limited 20,000 20,000,000 100 ConstructionHip Seng Construction Company Limited 1 1 100 ConstructionHip Seng Engineering Company Limited 1 1 100 Construction and civil engineeringHip Seng Manufacturing Company Limited 1 1 100 Production of surgical masksHong Kong Convention and Exhibition Centre
(Management) Limited311
31
6161
Management of Hong Kong Convention and Exhibition Centre (“HKCEC”)
Hong Kong Exhibition and Convention Venue Management China Limited
1 1 61 Investment holding
Hong Kong Golf & Tennis Academy Management Company Limited
1,000,000 1,000,000 100 Operation of golf and tennis academy
Hong Kong Island Development Limited 33,400,000 167,000,000 100 Property investmentHong Kong Jing-Guang Development Limited 100,000 1,000,000 82 Investment holdingHong Kong Multiple Intelligence Education Company
Limited1 1 100 Provision of training courses
Hong Kong Ticketing (International) Limited 1 1 100 Provision of ticketing servicesHonour Shares Limited 100 100 100 Investment holdingHousing Finance Limited 2 2 100 Financial servicesIstaron Limited 4 4 100 Investment holdingJoin Base Development Limited 1 1 100 Property investmentK11 Art Mall Properties Company Limited 1 1 100 Property investmentK11 (China) Limited 1 1 100 Investment holdingK11 Concepts Limited 1 1 100 Provision of property management
consultancy servicesK11 Cultural & Creation Company Limited 1 1 100 Culture and recreationK11 Sales & E-Commerce Company Limited 1 1 100 Retail and corporate salesKai Tak Sports Park Limited 300 906,666,900 90 Development and operation of sports
parkKin Kiu Enterprises, Limited 10,000 10,000,000 100 Investment holdingKiu Lok Property Services (China) Limited 2 2 61 Property agency, management and
consultancy21 2 61
54 PRINCIPAL SUBSIDIARIES (CONTINUED)
As at 30 June 2020

New World Development Company Limited284
Notes to the Financial Statements
Share capital issued#
Number of shares
Issued and paid up share
capital
Attributable interest to the Group Principal activities
HK$ (%)
Incorporated and operate in Hong Kong (continued)
Kwong On Nursing Center Limited 10,000 10,000 100 Provision of elderly residential places and services
La Tune Limited 2 200 100 Property investmentLand Chain Limited 2 2 100 Property investmentLingal Limited 1,800 1,800 100 Investment holding
2001 200 —Legarleon Finance Limited 4,400,000 44,000,000 100 FinancingLucrative Venture Limited 1,500,000 15,000,000 100 Property developmentMagic Sign Limited 2 2 100 Property developmentMillion Noble Investments Limited 1 1 100 Investment holdingMillion World Development Limited 100 100 100 Property investmentNew Advent Limited 1 1 61 Property investmentNew World China Construction Limited 1 1 100 Investment holdingNew World Construction Company Limited 1 1 100 ConstructionNew World Construction Management Company
Limited1 1 100 Construction
New World Department Store (Investment) Limited 3 410,045,794 75 Investment holdingNew World Department Stores Limited 2 2 75 Provision of management services to
department storesNew World Development (China) Limited 2 4 100 Investment holdingNew World Dynamics Holdings Limited 200 200 71 Sales of LED lighting products and
systemsNew World Facade Engineering Company Limited 1 1 100 Facade operationNew World Finance Company Limited 200,000 20,000,000 100 Financial servicesNew World - Guangdong Highway 999,900 99,990,000 61 Investment holding
Investments Co. Limited 1001 10,000 80New World Hotels (Holdings) Limited 576,000,000 510,795,731 100 Investment holdingNew World (Login) Company Limited
(formerly Login SCM Hong Kong Limited)1 1 100 Supply chain management
New World Loyalty Programme Limited 1 1 100 Loyalty programmeNew World Port Investments Limited 2 2 61 Investment holdingNew World Project Management (China) Limited 1 1 100 Project managementNew World Property Management Company Limited 1 1 100 Property managementNew World Real Estate Agency Limited 2 2 100 Estate agencyNew World Strategic Partnerships Company Limited 200 200 100 AgencyNew World Tower Company Limited 2 20 100 Property investmentNew World (Xiamen) Port Investments Limited 2 2 61 Investment holdingNW Project Management (HK) Limited 1 1 100 Project managementNW Project Management Limited 2 2 100 Project managementNWS Asset Management (China) Limited 1 1 61 Investment holdingNWS (Finance) Limited 2 2 61 Financial servicesNWS Holdings (Finance) Limited 1 1 61 FinancingNWS Hong Kong Investment Limited 1 1 61 Investment holdingNWS Infrastructure Renewables (Italy) Limited 1 1 61 Investment holdingOrient Sea Investments Limited 1 1 100 Property investmentPacific Great Investment Limited 50,000,000 50,000,000 100 Investment holdingPaterson Plaza Properties Limited 10,000 10,000 100 Property investment
54 PRINCIPAL SUBSIDIARIES (CONTINUED)
As at 30 June 2020

Annual Report 2020 285
Notes to the Financial Statements
Share capital issued#
Number of shares
Issued and paid up share
capital
Attributable interest to the Group Principal activities
HK$ (%)
Incorporated and operate in Hong Kong (continued)
Peterson Investment Company Limited 10,000 10,000 100 Property investmentPine Harvest Limited 1 1 80 Property developmentPolytown Company Limited 2
100,0001
201,000,000
6161
Property investment, operation, marketing, promotion and management of HKCEC
Pontiff Company Limited 10,000,000 10,000,000 100 Property developmentPridemax Limited 2 2 100 Property investmentProfit Now Limited 1 1 61 Investment holdingQueen’s Land Investment Limited 1,000 1,000 100 Property developmentRainbow Dream Limited 1 1 100 Property investmentRealray Investments Limited 2 2 100 Property investmentRegent Star Investment Limited 1,000 1,000 100 Property developmentRichglows Limited 2 2 100 Property investmentRosy Page Limited 15,000,000 15,000,000 100 Property developmentRoxy Limited 1 1 100 Construction and operation of SkycityScienward Fashion and Luxury Limited 10,000 10,000 100 Investment holding and fashion tradingScienward Sports and Casual Limited 100 100 100 Provision of management servicesSeaworthy Investments Limited 1 1 100 Property investmentSilver Rich Holdings Limited 2 2 85 Property developmentSilver World H.K. Development Limited 1 1 100 Investment holdingSky Connection Limited 100 100 61 Duty free operation and general tradingSpeed Star Development Limited 2 2 100 Property investmentSpotview Development Limited 10 10 100 Financial servicesSuper Memory Limited 2 2 100 Property investmentSuper Record Limited 1 1 100 Property investmentSuper Value Development Limited 10,000 10,000 100 Property investmentTop Flash Investments Limited 10,000 10,000 100 Property investmentTrade Jet Investments Limited 1 1 100 Provision of wellness and rehabilitation
servicesTreasure Tower Holdings Limited 1,000,000 1,000,000 100 Property investmentTrue Hope Investment Limited 299,999,998 299,999,998 61 Investment holding
21 2 61Trinity Link Limited 1 1 86 Provision of endoscopic servicesUltimate Vantage Limited 100 100 80 Property developmentUp Fair Limited 2 2 100 Property developmentUrban Parking Limited 15,000,000 15,000,000 61 Carpark managementVibro Construction Company Limited 1,630,000 163,000,000 61 Civil engineering
20,0001 2,000,000 61Vibro (H.K.) Limited 20,000,004 60,328,449 61 Piling, ground investigation and civil
engineeringVictory Succeed Limited 1 1 100 Property investmentWah Fu Elderly Centre Limited 1 1 100 Provision of elderly residential places and
servicesWaygent Investment Limited 2 2 100 Property investmentWinpo Development Limited 2 2 100 Property investmentWisemec Enterprises Limited 2 2 61 Investment holdingWorld Empire Property Limited 2 2 100 Property investment
54 PRINCIPAL SUBSIDIARIES (CONTINUED)
As at 30 June 2020

New World Development Company Limited286
Notes to the Financial Statements
Share capital issued#
Attributable interest to the Group
Number of
sharesPar value per share Principal activities
(%)
Incorporated in the Cayman Islands
Chinese Future Corporation 1,000,000 US$0.01 61 Investment holding
Incorporated in the Cayman Islands and operate in Hong Kong
New World China Land Limited 8,702,292,242 HK$0.1 100 Investment holdingNew World Department Store China Limited 1,686,145,000 HK$0.1 75 Investment holdingNew World TMT Limited 952,180,007 HK$1 100 Investment holdingNWS Service Management Limited 1,323,943,165 HK$0.1 61 Investment holding
Incorporated and operates in Italy
NWS Infrastructure Renewables (Italy) S.r.l. 10,000 EUR1 61 Investment holding
Incorporated and operates in the Philippines
New World International Development Philippines, Inc.
6,988,016 Peso100 62 Hotel operation
Incorporated and operates in Malaysia
Taipan Eagle Sdn. Bhd. 1,000,000 MYR1 71 Property development
# Represented ordinary share capital, unless otherwise stated
1 Non-voting deferred shares
54 PRINCIPAL SUBSIDIARIES (CONTINUED)
As at 30 June 2020

Annual Report 2020 287
Notes to the Financial Statements
54 PRINCIPAL SUBSIDIARIES (CONTINUED)
As at 30 June 2020
Registered/ fully paid capital
Attributableinterestø
to the Group Principal activities(%)
Incorporated and operate in the PRC
Beijing Chong Yu Real Estate Development Co., Ltd. US$171,840,000W 100 Property investment and development
Beijing Dongfang Huamei Real Estate Development Co., Ltd.
RMB200,000,000E 75 Land development
Beijing Enjia Youpin Business Management Co., Ltd. RMB1,000,000W 75 Household goods shop operation
Beijing New World Huamei Real Estate Development Co. Ltd.
RMB748,000,000E 75 Property development
Beijing New World Liying Department Store Co., Ltd. RMB18,000,000W 75 Department store operationBeijing New World Qianzi Department Store Co., Ltd. HK$60,000,000W 75 Department store operationBeijing New World Trendy Department Store Co., Ltd. RMB25,000,000W 75 Department store operationBeijing NW Project Management Consultancy Services
LimitedRMB1,000,000W 100 Project management and
consultancyBeijing Wanya Department Store Co., Ltd. RMB100,000α 75 Department store operationBeijing Xinpeng Enjia Business Management Co., Ltd. RMB2,800,000α 75 Convenience store operationBeijing Xintong Media & Advertising Co., Ltd. RMB100,000,000E 83 Provision of advertising and
media related servicesBeijing Yixi New World Department Store Co., Ltd. RMB65,000,000W 75 Department store operationChangsha New World Trendy Plaza Co., Ltd. RMB60,000,000W 75 Department store operationChengdu New World Department Store Co., Ltd. RMB70,000,000W 75 Department store operationChongqing New World Department Store Co., Ltd. RMB100,000,000W 75 Department store operationDalian New World Plaza International Co., Ltd. RMB58,000,000E 88 Property investment and
developmentDalian New World Tower Co., Ltd. US$197,324,700W 100 Property investment and
developmentFoshan Da Hao Hu Real Estate Development Co., Ltd. RMB1,364,500,500W 85 Property developmentFoshan International Country Club Company Ltd. US$52,923,600C 85 Golf club operationGuangzhou Fong Chuen-New World Property Development
Ltd.RMB330,000,000C 100 Property development
Guangzhou Jixian Zhuang New World City Garden Development Limited
US$24,000,000C 100 Property development
Guangzhou Xin Hua Chen Real Estate Co., Ltd. RMB200,000,000C 100 Property developmentGuangzhou Xin Hua Jian Real Estate Co., Ltd. RMB244,000,000C 100 Property developmentGuangzhou Xinqi Enterprises Co., Ltd. RMB10,000,000L 51 Property developmentGuangzhou Xinrui Enterprises Development Co., Ltd. RMB100,000,000L 51 Property developmentGuangzhou Xinsui Tourism Centre Ltd. HK$350,000,000W 100 Property developmentGuangzhou Xin Yi Development Limited HK$286,000,000C 90 Property investment and
developmentGuangzhou Xinpei Enterprises Management Co., Ltd. RMB50,000,000W 100 Investment holdingGuangzhou Xinpei Investment Co. Ltd. RMB200,000,000W 100 Investment holdingGuangzhou Yao Ce Enterprises Management Consultancy
Co. Ltd.RMB10,000,000W 100 Investment holding
Guangzhou Yao Sheng Real Estate Development Co., Ltd. RMB170,000,000E 65 Property developmentGuangzhou Yibo Real Estate Development Co., Ltd. RMB392,500,000W 100 Property developmentGuangzhou Yong Pei Properties Development Co., Ltd. RMB2,384,000,000W 100 Property developmentGuangzhou Yongjun Enterprises Co., Ltd RMB100,000,000W 100 Property developmentGuangzhou Zengpei Properties Development Co., Ltd. RMB10,000,000W 100 Property developmentHangzhou Xinyu Industrial Development Co. Ltd. RMB10,200,000,000W 100 Property developmentHarbin New World Department Store Co., Ltd. RMB126,000,000W 75 Department store operation

New World Development Company Limited288
Notes to the Financial Statements
Registered/ fully paid capital
Attributableinterestø
to the Group Principal activities(%)
Incorporated and operate in the PRC (continued)
Huamei Wealth (Beijing) Technology Co., Ltd. RMB640,000,000W 100 Property investmentHunan Fortune Lake Property Development Co., Ltd. RMB255,724,318W 100 Property developmentHunan NWS Expressway Management Co., Ltd. RMB1,600,000,000W 61 Operation of toll roadJiangsu New World Department Store Co., Ltd. RMB16,000,000W 75 Department store operationJinan New World Sunshine Development Ltd. US$69,980,000W 100 Property developmentK11 Business Management (Wuhan) Co., Ltd RMB2,500,000,000W 100 Property investmentK11 Concepts (Beijing) Limited RMB20,000,000W 100 Business consultancyK11 Concepts (Shanghai) Limited RMB50,000,000W 100 Business consultancyKHOS Shenyang Limited RMB70,000,000W 100 Hotel operationLangfang New World Properties Development Co., Ltd. US$145,300,000W 100 Property developmentLangfang Xin Zhong Properties Development Co., Ltd. US$98,200,000W 100 Property developmentLanzhou New World Department Store Co., Ltd. RMB30,000,000W 75 Department store operationLogin SCM (Shenzhen) Co. Ltd. RMB50,000,000W 100 Supply chain managementMianyang New World Department Store Co., Ltd. RMB14,000,000W 75 Department store operationMiaogou (Beijing) Department Store Co., Ltd. RMB1,000,000α 75 Department store operationNanjing New World Real Estate Co., Ltd. US$45,339,518W 100 Property investmentNew World Anderson (Tianjin) Development Co., Ltd. US$5,500,000W 100 Property investmentNew World (Anshan) Property Development Co., Ltd. RMB1,420,000,000W 100 Property developmentNew World (China) Co., Ltd. RMB50,513,400W 100 Investment holdingNew World (China) Investment Limited US$130,000,000W 100 Investment holdingNew World China Land Investments Company Limited US$80,000,000W 100 Investment holdingNew World Department Stores Investment (China) Co.,
Ltd.US$150,000,000W 75 Investment holding
New World Development (Wuhan) Co., Ltd US$128,500,000W 100 Property investment and development
New World Dynamics (Shenzhen) Company Limited RMB18,880,000W 71 Sales of LED lighting products and systems
New World Goodtrade (Wuhan) Limited US$219,500,000W 100 Property investment and development
New World HHC Construction Limited RMB53,000,000W 100 ConstructionNew World New Land Real Estate (Wuhan) Co., Ltd. US$590,900,000W 100 Property developmentNew World (Shenyang) Property Development Limited RMB5,647,800,000W 100 Property investment and
developmentNew World Strategic (Beijing) Investment Consultancy
LimitedUS$2,400,000W 100 Investment consultancy
Ningbo Gong Tai Properties Co., Ltd. RMB235,000,000W 100 Property developmentNingbo Xin Li Real Estate Co., Ltd. US$856,000,000W 100 Property developmentNWS (Guangong) Investment Company Limited
(formerly Guangdong Xin Chuan Co., Ltd.)RMB3,184,853,600W 61 Investment holding
Peak Moral High Commercial Development (Shanghai) Co., Ltd.
US$40,000,000W 75 Property investment and shopping mall operation
Sanhe New World Department Store Co., Ltd. RMB2,000,000W 75 Department store operationScienward Fashion and Luxury (Shanghai) Co., Ltd. US$16,800,000W 100 Fashion retailing and tradingShang Ji Properties (Shenzhen) Co. Ltd. RMB1,478,000,000W 51 Property developmentShang Shun Properties (Shenzhen) Co. Ltd. RMB1,216,000,000W 51 Property developmentShanghai Luxba Trading Ltd. US$7,150,000W 100 Properties investment and
fashion trading
54 PRINCIPAL SUBSIDIARIES (CONTINUED)
As at 30 June 2020
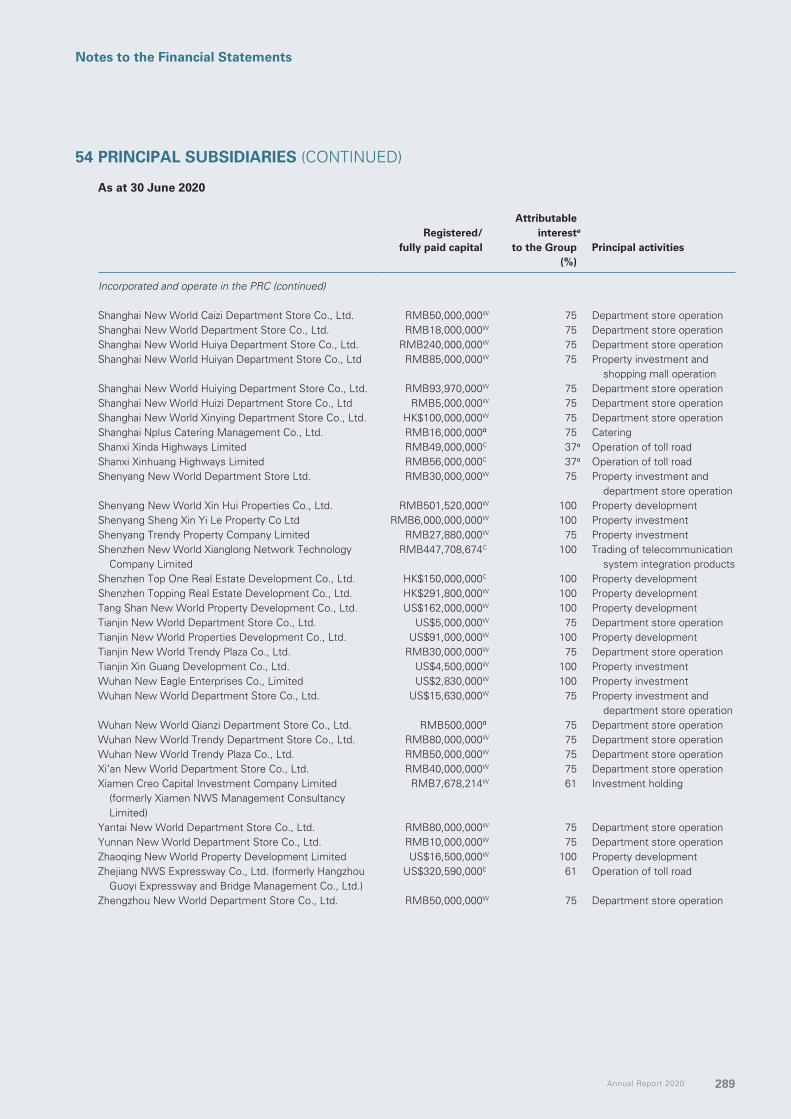
Annual Report 2020 289
Notes to the Financial Statements
Registered/ fully paid capital
Attributableinterestø
to the Group Principal activities(%)
Incorporated and operate in the PRC (continued)
Shanghai New World Caizi Department Store Co., Ltd. RMB50,000,000W 75 Department store operationShanghai New World Department Store Co., Ltd. RMB18,000,000W 75 Department store operationShanghai New World Huiya Department Store Co., Ltd. RMB240,000,000W 75 Department store operationShanghai New World Huiyan Department Store Co., Ltd RMB85,000,000W 75 Property investment and
shopping mall operationShanghai New World Huiying Department Store Co., Ltd. RMB93,970,000W 75 Department store operationShanghai New World Huizi Department Store Co., Ltd RMB5,000,000W 75 Department store operationShanghai New World Xinying Department Store Co., Ltd. HK$100,000,000W 75 Department store operationShanghai Nplus Catering Management Co., Ltd. RMB16,000,000α 75 CateringShanxi Xinda Highways Limited RMB49,000,000C 37α Operation of toll roadShanxi Xinhuang Highways Limited RMB56,000,000C 37α Operation of toll roadShenyang New World Department Store Ltd. RMB30,000,000W 75 Property investment and
department store operationShenyang New World Xin Hui Properties Co., Ltd. RMB501,520,000W 100 Property developmentShenyang Sheng Xin Yi Le Property Co Ltd RMB6,000,000,000W 100 Property investmentShenyang Trendy Property Company Limited RMB27,880,000W 75 Property investmentShenzhen New World Xianglong Network Technology
Company LimitedRMB447,708,674C 100 Trading of telecommunication
system integration productsShenzhen Top One Real Estate Development Co., Ltd. HK$150,000,000C 100 Property developmentShenzhen Topping Real Estate Development Co., Ltd. HK$291,800,000W 100 Property developmentTang Shan New World Property Development Co., Ltd. US$162,000,000W 100 Property developmentTianjin New World Department Store Co., Ltd. US$5,000,000W 75 Department store operationTianjin New World Properties Development Co., Ltd. US$91,000,000W 100 Property developmentTianjin New World Trendy Plaza Co., Ltd. RMB30,000,000W 75 Department store operationTianjin Xin Guang Development Co., Ltd. US$4,500,000W 100 Property investmentWuhan New Eagle Enterprises Co., Limited US$2,830,000W 100 Property investmentWuhan New World Department Store Co., Ltd. US$15,630,000W 75 Property investment and
department store operationWuhan New World Qianzi Department Store Co., Ltd. RMB500,000α 75 Department store operationWuhan New World Trendy Department Store Co., Ltd. RMB80,000,000W 75 Department store operationWuhan New World Trendy Plaza Co., Ltd. RMB50,000,000W 75 Department store operationXi’an New World Department Store Co., Ltd. RMB40,000,000W 75 Department store operationXiamen Creo Capital Investment Company Limited
(formerly Xiamen NWS Management Consultancy Limited)
RMB7,678,214W 61 Investment holding
Yantai New World Department Store Co., Ltd. RMB80,000,000W 75 Department store operationYunnan New World Department Store Co., Ltd. RMB10,000,000W 75 Department store operationZhaoqing New World Property Development Limited US$16,500,000W 100 Property developmentZhejiang NWS Expressway Co., Ltd. (formerly Hangzhou
Guoyi Expressway and Bridge Management Co., Ltd.)US$320,590,000E 61 Operation of toll road
Zhengzhou New World Department Store Co., Ltd. RMB50,000,000W 75 Department store operation
54 PRINCIPAL SUBSIDIARIES (CONTINUED)
As at 30 June 2020
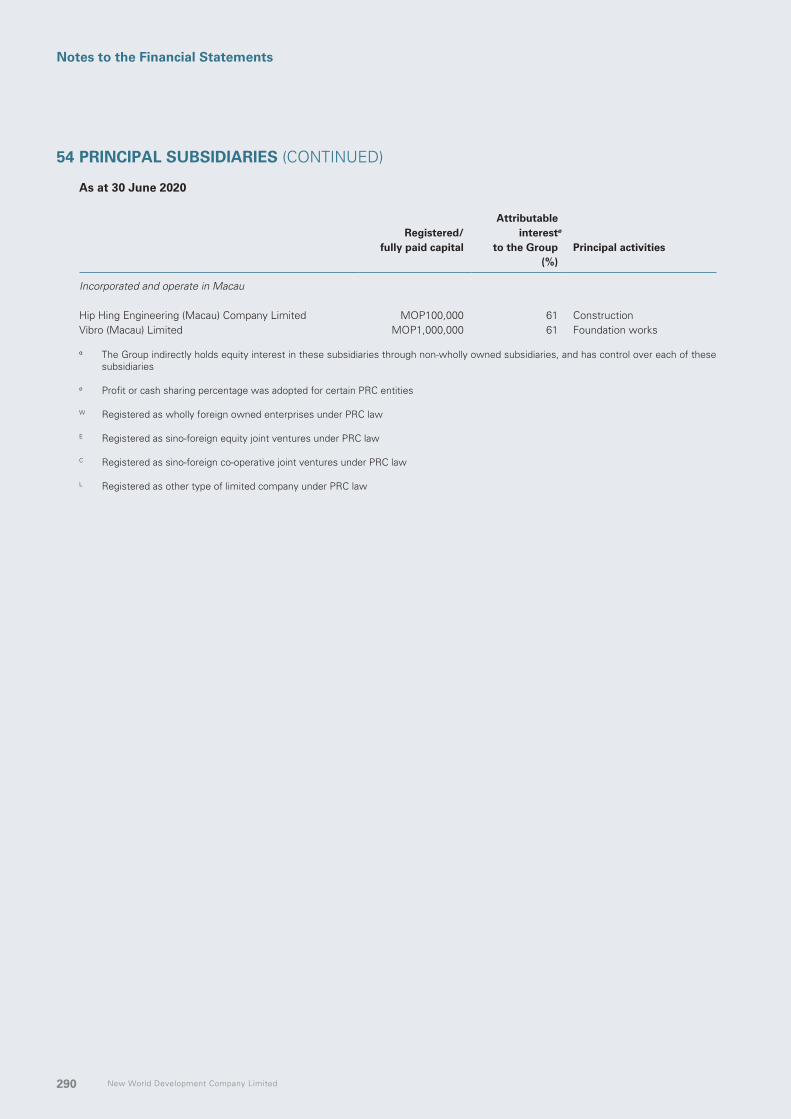
New World Development Company Limited290
Notes to the Financial Statements
Registered/ fully paid capital
Attributableinterestø
to the Group Principal activities(%)
Incorporated and operate in Macau
Hip Hing Engineering (Macau) Company Limited MOP100,000 61 ConstructionVibro (Macau) Limited MOP1,000,000 61 Foundation works
α The Group indirectly holds equity interest in these subsidiaries through non-wholly owned subsidiaries, and has control over each of these subsidiaries
ø Profit or cash sharing percentage was adopted for certain PRC entities
W Registered as wholly foreign owned enterprises under PRC law
E Registered as sino-foreign equity joint ventures under PRC law
C Registered as sino-foreign co-operative joint ventures under PRC law
L Registered as other type of limited company under PRC law
54 PRINCIPAL SUBSIDIARIES (CONTINUED)
As at 30 June 2020

Annual Report 2020 291
Notes to the Financial Statements
54 PRINCIPAL SUBSIDIARIES (CONTINUED)
As at 30 June 2020
Share capital issued#
Attributableinterest tothe Group
Number of
sharesPar value per share Principal activities
(%)
Incorporated in Bermuda and operates in Hong Kong
NWS Holdings Limited 3,911,137,849 HK$1 61 Investment holding
Incorporated in Bermuda and operates in Hong Kong and Mainland China
FTLife Insurance Company Limited 506,100,141 US$1 61 Life insurance9,000,0001 US$1 61
10,000,0002 US$1 61
Incorporated in the British Virgin Islands
Beauty Ocean Limited 1 US$1 61 Investment holdingCreo Capital Limited 1 US$1 61 Investment holdingCrown Success Limited 100 US$1 100 Investment holdingEagle Eyes Development Limited 1 US$1 100 Investment holdingFine Reputation Incorporated 10,000 US$1 100 Investment holdingFlying Gravity Limited 1 US$1 61 Investment holdingFotoland Limited 1 US$1 100 Investment holdingGigantic Global Limited 2 US$1 100 Investment holdingGravy Train Investments Limited 1 US$1 61 Investment holdingHH Holdings Corporation 600,000 HK$1 61 Investment holdingHing Loong Limited 20,010,000 US$1 100 Investment holdingHumansa Limited 1 US$1 100 Investment holdingIdeal Global International Limited 1 US$1 61 Investment holdingK11 Group Limited 1 HK$1 100 Investment holdingK11 Investment Company Limited 1 US$1 100 Investment holdingKarnival Limited 1 US$1 100 Investment holdingKee Shing Investments Limited 1,000 US$1 100 Investment holdingLotsgain Limited 100 US$1 100 Investment holdingMagic Chance Limited 1 US$1 100 Investment holdingMoscan Developments Limited 1 US$1 61 Investment holdingNatal Global Limited 1 US$1 61 Investment holdingNew World Hotels Corporation Limited 1 US$1 100 Investment holdingNWS CON Limited 1 HK$1 61 Investment holdingNWS Construction Limited 190,000 US$0.10 61 Investment holding
7,225A US$0.10 —6,022B US$0.10 —
NWS Infrastructure Bridges Limited 1 US$1 61 Investment holdingNWS Infrastructure Power Limited 1 US$1 61 Investment holdingNWS Infrastructure Water Limited 1 US$1 61 Investment holdingPenta Enterprises Limited 1 US$1 100 Investment holdingRadiant Glow Limited 1 US$1 100 Investment holdingRight Choice International Limited 200 US$1 52 Property investmentRight Heart Associates Limited 4 US$1 61 Investment holdingRighteous Corporation 1 US$1 61 Investment holdingSteadfast International Limited 2 US$1 100 Investment holdingStockfield Limited 1 US$1 61 Investment holdingSweet Prospects Enterprises Limited 1 US$1 100 Investment holdingTrue Blue Developments Limited 1 US$1 100 Investment holdingWinner World Group Limited 10 US$1 100 Investment holding

New World Development Company Limited292
Notes to the Financial Statements
Share capital issued#
Attributableinterest tothe Group
Number of
sharesPar value per share Principal activities
(%)
Incorporated in the British Virgin Islands and operate in Hong Kong
Allied Win Investments Limited 1 US$1 100 Investment holdingBellwood Group Limited 100 US$1 61 Investment holdingBest Star (BVI) Investments Limited 1 US$1 61 Investment holdingCelestial Dynasty Limited 1 US$1 61 Bond issuerCelestial Miles Limited 1 US$1 61 Bond issuerCitiplus Investment Limited 1 US$1 100 Investment holdingConstar Investment Limited 1 US$1 75 FinancingEconomic Velocity Limited 1 US$1 61 Investment holdingEsteemed Sino Limited 1 US$1 100 Investment holdingGreat Start Group Corporation 1 US$1 61 Investment holdingHetro Limited 101 US$1 61 Investment holdingLucky Strong Limited 1 US$1 61 Investment holdingNew World Capital Finance Limited 1 US$1 100 Bond issuerNew World First Bus Services Limited 200,000,000 HK$1 61 Provision of franchised bus
servicesNew World Strategic Investment Limited 1 US$1 100 Investment holdingNoonday Limited 100 US$1 61 Investment holdingNWD Finance (BVI) Limited 1 US$1 100 Bond issuerNWD (MTN) Limited 1 US$1 100 Bond issuerNWS Financial Management Services Limited 1 US$1 61 Investment holdingNWS Infrastructure Management Limited 2 US$1 61 Investment holdingNWS Infrastructure Roads Limited 1 US$1 61 Investment holdingNWS Ports Management Limited 2 US$1 61 Investment holdingNWS Transport Services Limited 500,000,016 HK$1 61 Investment holdingPark New Astor Hotel Limited 101 US$1 100 Property investmentSilvery Yield Development Limited 100 US$1 100 Investment holdingSouth Scarlet Limited 1 US$1 100 Hotel operationTotal Partner Holdings Limited 1 US$1 100 Investment holdingWhitecroft Gate Limited 1 US$1 100 Financing
Incorporated in the British Virgin Islands and operates in the PRC
Nacaro Developments Limited 2 US$1 100 Property Investment
Incorporated and operates in Thailand
Emerald Bay Resort Co., Ltd. 7,380,000 THB100 100 Hotel operation
# Represented ordinary share capital, unless otherwise stated
A Redeemable, non-convertible and non-voting A preference shares
B Redeemable, non-convertible and non-voting B preference shares
1 Class A redeemable preference shares (non-convertible)
2 Class C redeemable preference shares (convertible)
54 PRINCIPAL SUBSIDIARIES (CONTINUED)
As at 30 June 2020

Annual Report 2020 293
Notes to the Financial Statements
55 PRINCIPAL JOINT VENTURES
As at 30 June 2020
Registered/ fully paid capital
AttributableinterestΩ
to the Group Principal activities(%)
Equity joint ventures
Incorporated and operate in the PRC
China United International Rail Containers Co., Limited RMB4,200,000,000 18 Operation of rail container terminals and related business
Chongqing Suyu Business Development Company Limited RMB650,000,000 30 Investment holdingGuangzhou Oriental Power Company Limited RMB990,000,000 15 Generation and supply of
electricityGuangzhou Pearl River Electric Power Fuel Co., Ltd. RMB613,361,800 21 Wholesale, assembling and
storage of fuelGuodian Chengdu Jintang Power Generation Co., Ltd. RMB924,000,000 21 Generation and supply of
electricity
Co-operative joint ventures
Incorporated and operate in the PRC
Beijing Chong Wen • New World Properties Development Co., Ltd.
US$225,400,000 70s Property investment, development and hotel operation
Beijing-Zhuhai Expressway Guangzhou – Zhuhai Section Company Limited
RMB580,000,000 15 Operation of toll road
Beijing Xin Lian Hotel Co., Ltd. US$12,000,000 55s Hotel operationChina New World Electronics Ltd. US$57,200,000 70s Property investment and
developmentGuangzhou Northring Intelligent Transportation Technology
Company Limited (formerly Guangzhou Northring Freeway Company Limited)
US$19,255,000 40s Operation of toll road
Huizhou City Huixin Expressway Company Limited RMB34,400,000 30 Investment holdingHuizhou New World Housing Development Limited RMB80,000,000 62s Property developmentTianjin Xinzhan Expressway Company Limited RMB2,539,100,000 37@s Operation of toll roadWuhan Wuxin Hotel Co., Ltd. US$49,750,000 60s Hotel operation
Wholly foreign owned enterprises
Incorporated and operate in the PRC
Guangzhou Bosson Real Estate Co., Ltd. RMB50,003,000 62s Property developmentGuangzhou Hemsell Real Estate Development Co., Ltd. RMB79,597,000 62s Property developmentGuangzhou Shengpei Enterprises Co. Ltd. RMB500,000,000 40 Property developmentWuhan New World Hotel Properties Co., Ltd. RMB83,507,110 60s Property investment
Ω Percentage of equity interest, in the case of equity joint ventures or profit sharing percentage, in the case of co-operative joint ventures
@ Represented cash sharing ratio
s The Group through its subsidiaries holds more than 50% interests in these joint ventures. Under the respective contractual agreements, the Group does not control these joint ventures as the decisions about relevant activities require the unanimous consent of the parties sharing the control.

New World Development Company Limited294
Notes to the Financial Statements
55 PRINCIPAL JOINT VENTURES (CONTINUED)
As at 30 June 2020
Share capital issued#
Number of shares
Issued and paid up share
capital
Attributable interest to the Group Principal activities
HK$ (%)
Companies limited by shares
Incorporated and operate in Hong Kong
ATL Logistics Centre Hong Kong Limited 100,000’A’20,000’B’2
54,9181
100,00020,00054,918
34&
48100
Operation of cargo handling and storage facilities
Calpella Limited 2 20 50 Property investmentChina Aerospace New World Technology Limited 30,000,000 165,000,000 50 Investment holdingChow Tai Fook Qianhai Investments Company
Limited700 700 29 Shopping mall operation
Earning Yield Limited 1 1 51& Property developmentGH Hotel Company Limited 1,001 64,109,750 50 Hotel operationGlobal Perfect Development Limited 1,000,000 1,000,000 50 Investment holdingGlobal Trinity China Limited 1 1 40 Financial servicesGolden Kent International Limited 1 1 40 Property developmentGreat TST Limited 2 863,878,691 50 Hotel operationHotelier Finance Limited 1 1 50 FinancingInfinite Sun Limited 1 1 10 Property developmentLoyalton Limited 2 20 50 Property investmentMarble Edge Investments Limited 1 1 18 Property developmentNew World Harbourview Hotel Company Limited 1,001 109,109,750 50 Hotel operationVoyage Mile Limited 1 1 29 Property developmentWincon International Limited 300,000,000 300,000,000 30 Investment holdingWise Come Development Limited 30 30 50 Property investment

Annual Report 2020 295
Notes to the Financial Statements
Share capital issued#
Attributable interest to the Group
Number of
sharesPar value per share Principal activities
(%)
Incorporated in the British Virgin Islands and operate in the PRC
Holicon Holdings Limited 2 US$1 50 Property InvestmentJaidan Profits Limited 2 US$1 50 Property InvestmentJorvik International Limited 2 US$1 50 Property InvestmentOrwin Enterprises Limited 2 US$1 50 Property Investment
Incorporated in the British Virgin Islands
DP World New World Limited 2,000 US$1 30 Investment holdingGreat Hotels Holdings Limited 6 US$1 50 Investment holdingGroup Program Limited 1 US$1 40 Loyalty programmeLandso Investment Limited 100 — 35 Investment holdingNewfoundworld Investment Holdings Limited 5 US$1 20 Investment holdingSilverway Global Limited 2 US$1 30 Investment holdingSuccess Concept Investments Limited 1,000 US$1 55& Investment holding
Incorporated and operates in the Netherlands
Hyva I B.V. 19,000 EUR1 30 Manufacturing and supply of components used in hydraulic loading and unloading systems
Incorporated in the Cayman Islands and operates globally
Goshawk Aviation Limited 362,026,264*** US$0.001 30 Commercial aircraft leasing
Incorporated and operate in Singapore
Cuscaden Homes Pte. Ltd. 2,000,000 — 45 Property developmentFEC Skyline Pte. Ltd. 4,000,000 — 30 Property development
# Represented ordinary share capital, unless otherwise stated
1 Non-voting deferred shares
2 Non-voting preference shares
*** Preference shares
& The directors of the Company considered the Group does not have unilateral control governing the financial and operating activities over these joint ventures
55 PRINCIPAL JOINT VENTURES (CONTINUED)
As at 30 June 2020

New World Development Company Limited296
Notes to the Financial Statements
56 PRINCIPAL ASSOCIATED COMPANIES
As at 30 June 2020
Share capital issued#
Number of shares
Issued and paid up
share capital
Attributable interest to the Group Principal activities
HK$ (%)
Incorporated and operate in Hong Kong
Conduit Road Development Limited 100 10,000 30 Property developmentEver Light Limited 1,000 1,000 40 Property investmentGHK Hospital Limited 10 10 24 HealthcareJoy Fortune Investments Limited 10,000 10,000 30 Investment holdingPure Jade Limited 1,000,000 1,000,000 27 Property investmentQuon Hing Concrete Company Limited 200,000 20,000,000 30 Production and sales of
ready-mixed concreteRanex Investments Limited 100 100 10^ Property investmentShoucheng Holdings Limited
(formerly Shougang Concord International Enterprises Company Limited)
6,925,576,780 11,832,426,000 7^ Investment holding
Sky Treasure Development Limited 10 10 30 Investment holding
Incorporated in Hong Kong and operates in Hong Kong, Macau and Mainland China
SUEZ NWS Limited 20,256,429 5,134,005,207 26 Investment holding and operation of water, wastewater and waste management business

Annual Report 2020 297
Notes to the Financial Statements
Share capital issued#
Attributable interest to the Group
Number of
sharesPar value per share Principal activities
(%)
Incorporated in the British Virgin Islands and operates in Hong Kong
New World First Ferry Services Limited 1,000 US$1 24 Provision of ferry services
Incorporated in Bermuda and operates in Hong Kong
Wai Kee Holdings Limited 793,124,034 HK$0.1 14 Construction
Incorporated in Bermuda and operates in Hong Kong and Mainland China
DTXS Silk Road Investment Holdings Company Limited
111,187,538 HK$0.5 17 Investment holding
Incorporated in Cyprus and operates in South Africa
Tharisa plc 266,610,951 US$0.001 9^ Platinum group metals and chrome mining, processing and trading
56 PRINCIPAL ASSOCIATED COMPANIES (CONTINUED)
As at 30 June 2020

New World Development Company Limited298
Notes to the Financial Statements
56 PRINCIPAL ASSOCIATED COMPANIES (CONTINUED)
As at 30 June 2020
Registered/ fully paid capital
AttributableinterestΩ
to the Group Principal activities(%)
Incorporated and operate in the PRC
Chongqing Silian Optoelectronics Science And Technology Co., Ltd.
RMB500,000,000 12 Manufacturing and sale of sapphire substrate and wafer, LED packaging and application
Hangzhou Ring Road Expressway Petroleum Development Co., Ltd.
RMB10,000,000 24 Operation of gasoline station
Hubei Suiyuenan Expressway Co., Ltd. RMB1,770,000,000 18 Operation of toll roadHunan Daoyue Expressway Industry Co., Ltd. RMB600,950,000 24 Operation of toll roadJiangxi Selon Industrial Co., Ltd. RMB240,000,000 12 Manufacturing and sale of
chemical productsShenzhen City Prince Bay Lewan Properties Co. Ltd. RMB2,147,876,079 49 Property developmentShenzhen City Prince Bay Shangding Properties Co. Ltd. RMB2,036,732,549 49 Property developmentShenzhen Tiande Property Development Co. Ltd. RMB4,530,000,000 30 Property developmentXiamen Container Terminal Group Co., Ltd. RMB2,436,604,228 12^ Operation of container
terminalsZhaoqing Yuezhao Expressway Co., Ltd. RMB818,300,000 15 Operation of toll road
# Represented ordinary share capital, unless otherwise stated
Ω Percentage of equity interest, in the case of equity joint ventures or profit sharing percentage, in the case of co-operative joint ventures
* Voting, non-participating, non-redeemable management shares
** Non-voting, redeemable participating shares
^ The directors of the Company considered the Group has significant influence over these companies through its representatives on the board of directors of each of these companies
57 EVENTS SUBSEQUENT TO YEAR END
In August 2020, NWSH entered into a sale and purchase agreement with Bravo Transport Holdings Limited (a company in which Templewater Bravo Holdings Limited, Hans Energy Company Limited and Ascendal Group Limited hold approximately 90.8%, 8.6% and 0.6% shareholding interest respectively) to dispose of the entire issued share capital of NWS Transport Services Limited (an indirect wholly owned subsidiary of NWSH) at a consideration of HK$3,200 million (subject to instalment arrangements). The transaction is yet to complete up to the date of this report. Upon completion of the disposal, it is anticipated that no further material disposal gain or loss will be recognised by the Group for the year ending 30 June 2021.

Annual Report 2020 299
Five-year Financial Summary
CONSOLIDATED INCOME STATEMENTFor the years ended 30 June
2020 2019 2018 2017 2016HK$m HK$m HK$m HK$m HK$m
Revenues 59,007.8 76,763.6 60,688.7 56,628.8 59,570.0
Operating profit 12,035.4 25,202.1 30,975.3 11,751.3 16,583.3Net financing costs (2,010.9) (756.3) (704.3) (446.1) (536.7)Share of results of joint ventures and
associated companies 769.9 4,683.1 3,082.6 3,925.1 2,660.5
Profit before taxation 10,794.4 29,128.9 33,353.6 15,230.3 18,707.1Taxation (7,528.0) (7,489.8) (6,272.4) (4,755.6) (6,423.7)
Profit for the year 3,266.4 21,639.1 27,081.2 10,474.7 12,283.4Profit attributable to holders of perpetual
capital securities (1,688.3) (803.0) (536.6) (395.9) —Profit attributable to non-controlling
interests (481.9) (2,676.0) (3,206.5) (2,403.1) (3,617.1)
Profit attributable to shareholders of the Company 1,096.2 18,160.1 23,338.1 7,675.7 8,666.3
Dividend per share (HK$)Interim 0.56 0.56 0.56 0.52 0.52Final 1.48 1.48 1.36 1.32 1.24
Full year 2.04 2.04 1.92 1.84 1.76
Earnings per share (HK$)Basic 0.43 7.11 9.36 3.21 3.79Diluted 0.43 7.11 9.34 3.21 3.79
Dividend per share and earnings per share for the years ended 30 June 2016, 2017, 2018 and 2019 had been adjusted on the assumption that the share consolidation had been effective in the prior years.

New World Development Company Limited300
Five-year Financial Summary
CONSOLIDATED STATEMENT OF FINANCIAL POSITIONAs at 30 June
2020 2019 2018 2017 2016HK$m HK$m HK$m HK$m HK$m
AssetsInvestment properties, property, plant and
equipment and land use rights, right-of-use assets and intangible concession rights 222,337.2 215,537.7 192,135.4 150,125.1 125,308.1
Intangible assets, value of business acquired and deferred acquisition costs 14,767.3 3,464.5 3,782.0 3,423.8 2,702.3
Interests in joint ventures, associated companies, other investments and other non-current assets 180,819.5 134,118.0 113,482.3 104,526.4 105,160.5
Current assets 182,271.9 150,164.7 172,055.1 178,981.0 158,937.7
Total assets 600,195.9 503,284.9 481,454.8 437,056.3 392,108.6
EquityShare capital 78,225.7 77,875.3 77,525.9 73,233.6 69,599.8Reserves 134,797.6 145,989.2 138,724.0 112,857.6 109,973.6
Shareholders’ funds 213,023.3 223,864.5 216,249.9 186,091.2 179,573.4Perpetual capital securities 37,092.0 21,505.5 9,451.8 9,451.8 —Non-controlling interests 29,629.8 29,994.5 29,480.2 25,401.5 21,321.9
Total equity 279,745.1 275,364.5 255,181.9 220,944.5 200,895.3
Current liabilities 152,609.4 101,256.6 94,689.3 79,500.6 66,522.5Non-current liabilities 167,841.4 126,663.8 131,583.6 136,611.2 124,690.8
Total equity and liabilities 600,195.9 503,284.9 481,454.8 437,056.3 392,108.6

Annual Report 2020 301
Principal Projects Summary
HOTEL
No. Name of Project Total Number of Rooms
Hong Kong
1 Grand Hyatt Hong Kong 542
2 Renaissance Harbour View Hotel 858
3 Rosewood Hong Kong(1) 599
4 Hyatt Regency Hong Kong, Tsim Sha Tsui 381
5 pentahotel Hong Kong, Kowloon 695
6 Hyatt Regency Hong Kong, Sha Tin 562
7 Novotel Citygate Hong Kong 440
Subtotal 4,077
Mainland China
8 Rosewood Beijing 283
9 New World Beijing Hotel 309
10 pentahotel Beijing 307
11 KHOS Langfang 294
12 New World Shunde Hotel 370
13 New World Wuhan Hotel 327
Subtotal 1,890
Southeast Asia
14 New World Makati Hotel, The Philippines 578
15 New World Saigon Hotel, Vietnam 533
16 Renaissance Riverside Hotel Saigon, Vietnam 336
17 Rosewood Phuket, Thailand 71
Subtotal 1,518
Grand Total 7,485
Remark:(1) Rosewood Hong Kong: 413 rooms; Rosewood Residences: 186 rooms

New World Development Company Limited302 Annual Report 2020 303
Principal Projects SummaryPrincipal Projects Summary
MAJOR PROPERTY DEVELOPMENT PROJECTS IN HONG KONG
No. Name of Project
Site Area
(sq ft)
Total GFA
(sq ft)
The
Group’s
Interest
Attributable GFA Total
Attributable
GFA
(sq ft)
Stage of
Completion(1)
Residential
(sq ft)
Retail
(sq ft)
Office
(sq ft)
Others
(sq ft)
Hong Kong Island 1 4A-4P Seymour Road, Mid-levels 52,466 472,186 35.00%
Phase 1 78,381 78,381 SPhase 2 86,884 86,884 S
Subtotal 52,466 472,186 165,265 165,265
Kowloon
2 ARTISAN GARDEN, 68 Kowloon City Road, Ma Tau Kok(2) 14,897 111,730 100.00% 111,730 111,730 S3 TIMBER HOUSE, 74 Waterloo Road, Ho Man Tin 11,256 94,974 51.00% 43,055 5,382 48,437 S4 New Kowloon Inland Lot No. 6582, Cheung Shun Street, Cheung Sha Wan 44,897 529,185 100.00% 415 492,333 36,437(3) 529,185 S5 New Kowloon Inland Lot No. 6572, Wing Hong Street, Cheung Sha Wan 30,925 363,392 100.00% 6,008 353,064 4,320 363,392 S6 New Kowloon Inland Lot No. 6574, 4B3, Kai Tak 104,475 574,615 29.30% 168,362 168,362 F7 New Kowloon Inland Lot No. 6552, 4C2, Kai Tak 105,110 641,169 18.00% 111,624 3,786 115,410 F8 New Kowloon Inland Lot No. 6576, 4B1, Kai Tak 103,151 722,060 10.00% 72,206 72,206 F9 Yau Tong Redevelopment Project, Kowloon East 808,397 3,982,722 10.88% 422,607 10,793 433,400 LE
Subtotal 1,223,108 7,019,847 929,584 26,384 845,397 40,757 1,842,122
New Territories
10 Reach Summit, Sereno Verde Phase 5, 99A Tai Tong Road, Yuen Long 48,933 171,265 20.97% 35,914 35,914 C11 ATRIUM HOUSE, 99 Shap Pat Heung Road, Yuen Long 24,230 121,148 100.00% 121,148 121,148 S12 Tai Wai Station Property Development, STTL No. 520, Sha Tin(2) 521,107 2,050,327 100.00%
Phase 1 495,323 495,323 SPhase 2 871,965 871,965 SPhase 3 683,039 683,039 S
13 Lung Tin Tsuen (Phase 2), Yuen Long 88,157 440,785 100.00% 440,785 440,785 LE14 Lung Tin Tsuen (Phase 4), Yuen Long 56,285 281,425 100.00% 281,425 281,425 LE15 Tong Yan San Tsuen (Phase 3), Yuen Long 88,658 88,658 100.00% 88,658 88,658 LE16 Tong Yan San Tsuen (Phase 4), Yuen Long 193,591 193,591 100.00% 193,591 193,591 –17 Sha Po North (Phase 2), Yuen Long TBC 373,240 34.81% 129,925 129,925 –18 DD110, Kam Tin, Yuen Long 170,071 68,029 100.00% 68,029 68,029 LE19 DD221, Sha Ha, Sai Kung 593,635 890,452 76.00% 676,744 676,744 P
Subtotal 4,678,920 4,086,546 4,086,546
Grand total 12,170,953 5,181,395 26,384 845,397 40,757 6,093,933
Remarks:(1) P=Planning; D=Demolition; SP=Site Preparation; F=Site Formation/Foundation; S=Superstructure; C=Completed (OP Issued); LE=Land
Exchange; TBC=To Be Confirmed(2) Property in which the Group is entitled to a share of development profits in accordance with the terms and conditions of the respective
development agreement(3) Includes public carpark, but excludes government accommodations (i.e. children care centre and elderly care centre)

New World Development Company Limited304 Annual Report 2020 305
Principal Projects SummaryPrincipal Projects Summary
MAJOR PROPERTY INVESTMENT AND OTHER PROJECTS IN HONG KONG
No. Name of ProjectTotal GFA
(sq ft)
Total Attributable
GFA(sq ft)
Retail(sq ft)
Office(sq ft)
Hotel(sq ft)
Others(sq ft)
Total Number of
CarparkLand Lease
Expiry
COMPLETED Hong Kong Island
1 Manning House, Central 110,040 110,040 63,383 46,657 28432 New World Tower, Central 640,135 640,135 77,948 562,187 385 28633 K11 ATELIER King’s Road, 704-730 King’s Road, North Point 487,504 487,504 7,160 480,344 2083/2088/20904 Hong Kong Convention and Exhibition Centre, Shopping Arcade, Wan Chai 87,999 87,999 69,173 18,826(2) 1,070 20605 Grand Hyatt Hong Kong 524,928 262,464 262,464 20606 Renaissance Harbour View Hotel 544,518 272,259 272,259 20607 Pearl City, Causeway Bay – Ground Floor to 4th Floor 53,691 21,476 21,476 2868
Pearl City, Causeway Bay – Ground Floor to Basement 24,682 24,682 24,682 28688 Methodist House, Wan Chai(1) 40,813 40,405 40,405 2084
Subtotal 2,514,310 1,946,964 263,822 1,129,593 534,723 18,826 1,455
Kowloon
9 K11 ATELIER of Victoria Dockside, Tsim Sha Tsui 435,145 435,145 435,145 2052Rosewood Hotel & Residences of Victoria Dockside, Tsim Sha Tsui 1,105,644 1,105,644 1,105,644 2052K11 MUSEA of Victoria Dockside, Tsim Sha Tsui 1,156,356 1,156,356 1,156,356 1,116(7) 2052K11 ARTUS of Victoria Dockside, Tsim Sha Tsui 379,720 379,720 379,720 2052
10 K11, Tsim Sha Tsui 335,939 335,939 335,939 240 2057Hyatt Regency Hong Kong, Tsim Sha Tsui 277,877 138,939 138,939 2057
11 pentahotel Hong Kong, Kowloon 285,601 285,601 285,601 205712 KOHO, Kwun Tong 204,514 204,514 1,567 202,947 28 204713 THE FOREST, Mong Kok(1) 53,337 26,669 26,669 7 206214 ARTISAN HUB, San Po Kong 64,519 64,519 31,087 33,432 2047
Subtotal 4,298,652 4,133,046 1,551,618 671,524 1,530,184 379,720 1,391
New Territories
15 ATL Logistic Centre, Kwai Chung 9,329,000 3,190,518 3,190,518(3) 204716 D • PARK, Tsuen Wan 466,400 466,400 466,400 1,000 204717 Hyatt Regency Hong Kong, Sha Tin(1) 538,000 538,000 538,000 100 204718 Citygate, Tung Chung(4) 659,003 131,801 99,697 32,104 1,231 2047
Novotel Citygate Hong Kong 236,758 47,352 47,352 7 204719 Tung Chung Town Lot No. 11, Tung Chung 473,655 94,731 68,231 26,393 107 127 206320 PARK SIGNATURE, Yuen Long 24,155 24,155 24,155 2058
Subtotal 11,726,971 4,492,957 658,483 32,104 611,745 3,190,625 2,465
Grand Total 18,539,933 10,572,967 2,473,923 1,833,221 2,676,652 3,589,171 5,311
TO BE COMPLETED/UNDER CONSTRUCTION
21 21 Luk Hop Street, San Po Kong 100,798 100,798 100,798(5) 204722 New Kowloon Inland Lot No. 6505, King Lam Street, Cheung Sha Wan 998,210 998,210 38,062 960,148 206723 SKYCITY Project(1) 3,767,400 3,767,400 2,707,491 562,311 497,598(6) 2066
Grand Total 4,866,408 4,866,408 2,745,553 1,522,459 598,396
Remarks:(1) Properties in which the Group has a development interests: other parties provide the land whilst the Group finances the construction costs and
occasionally land costs, and is entitled to a share of the rental income or a share of the development profits in accordance with the terms and conditions of the respective joint development agreements after completion
(2) Meeting rooms(3) Logistics centre(4) Includes Tung Chung Crescent (5) Industrial(6) Includes carparking and transport terminal(7) Total number of carpark of Victoria Dockside

New World Development Company Limited306 Annual Report 2020 307
Principal Projects SummaryPrincipal Projects Summary
MAJOR PROPERTY DEVELOPMENT PROJECTS IN MAINLAND CHINA
No. Region Name of Project
The Group’s
Accounting
Classification
The Group’s
Interest
Total GFA
(excl. carpark
and others)
(sq m)
Residential
(sq m)
Commercial
(sq m)
Office
(sq m)
Hotel
(sq m)
Carpark
and Others
(sq m)
Development
Status
Expected
Completion
Date
The Greater Bay Area and Southern Region
1 Guangzhou Guangzhou Covent Garden Phase 3 Remaining Portion Subsidiary 100% 105,590 95,302 10,288 – – 27,834 Under development Jan-2022
Guangzhou Guangzhou Covent Garden Remaining Phases Subsidiary 100% 239,936 220,737 19,199 – – 28,315 Planning completed Jun-2025
2 Guangzhou Guangzhou Park Paradise Phase 5B Subsidiary 100% 42,369 42,369 – – – 10,860 Under development Jun-2021
Guangzhou Guangzhou Park Paradise Remaining Phases Subsidiary 100% 112,372 87,339 25,033 – – 15,518 Under planning TBC
3 Guangzhou Guangzhou Zengcheng Comprehensive Development Project Subsidiary 100% 284,328 99,077 13,787 142,305 29,159 104,399 Under development Jun-2022
4 Guangzhou Guangzhou Panyu Hanxi Comprehensive Development Project Subsidiary 65% 307,189 164,657 81,000 61,532 – 201,589 Under planning May-2024
5 Guangzhou Guangzhou Zengcheng International Community Project Subsidiary 100% 311,152 276,411 34,741 – – 150,451 Planning completed Dec-2022
6 Foshan Canton First Estate CF27B Subsidiary 85% 30,210 30,210 – – – 487 Under development Jul-2020
Foshan Canton First Estate CF07 Subsidiary 85% 4,328 4,328 – – – – Planning completed Dec-2020
Foshan Canton First Estate CF19C Subsidiary 85% 59,860 59,860 – – – 14,821 Under development Mar-2021
Foshan Canton First Estate CF03 Subsidiary 85% 37,192 37,192 – – – 11,570 Planning completed Apr-2022
Foshan Canton First Estate CF21 Subsidiary 85% 52,854 52,854 – – – 28,742 Planning completed May-2022
Foshan Canton First Estate CF32 Subsidiary 85% 77,722 76,629 1,093 – – 28,047 Under development Jun-2022
Foshan Canton First Estate CF35 Subsidiary 85% 2,720 2,720 – – – 714 Under development Dec-2025
Foshan Canton First Estate Remaining Phases Subsidiary 85% 558,229 473,338 – – 84,891 185,211 Under planning TBC
7 Shenzhen Shenzhen Qianhai Project Associated Company 30% 176,300 – 27,940 148,360 – 55,212 Under development Aug-2022
8 Shenzhen Shenzhen Prince Bay Project DY04-01 Subsidiary 51% 122,749 – 98,000 24,749 – 61,551 Under development Mar-2024
Shenzhen Shenzhen Prince Bay Project DY04-02 Subsidiary 51% 6,900 – 6,900 – – 2,100 Under development Mar-2024
Shenzhen Shenzhen Prince Bay Project DY04-04 Subsidiary 51% 96,307 – 96,307 – – 48,593 Under development Jul-2024
Shenzhen Shenzhen Prince Bay Project DY02-02 Associated Company 49% 79,840 – 25,000 54,840 – 33,857 Under development Dec-2020
Shenzhen Shenzhen Prince Bay Project DY02-04 Associated Company 49% 79,566 54,726 24,840 – – 39,802 Under development Jun-2021
9 Huizhou Huizhou Changhuyuan Phase 4 Joint venture 63% 69,769 62,329 7,440 – – 26,309 Under planning TBC
Subtotal 2,857,482 1,840,078 471,568 431,786 114,050 1,075,982
Central Region
10 Wuhan Wuhan New World Centre Phase 3 Subsidiary 100% 91,728 – 32,294 59,434 – 49,241 Under development Dec-2020
11 Wuhan Wuhan New World • Times Phase 2 Subsidiary 100% 273,834 – 31,950 241,884 – 139,047 Under planning Jun-2025
12 Yiyang Yiyang New World Scenic Heights Phase 1G Subsidiary 100% 11,124 11,124 – – – – Planning completed Dec-2020
Yiyang Yiyang New World Scenic Heights Phase 1F Subsidiary 100% 17,990 17,990 – – – – Planning completed May-2021
Yiyang Yiyang New World Scenic Heights Phase 2B Subsidiary 100% 7,334 7,334 – – – – Planning completed May-2021
Yiyang Yiyang New World Scenic Heights Phase 2C Subsidiary 100% 112,969 106,391 6,578 – – – Planning completed Jul-2022
Yiyang Yiyang New World Scenic Heights Phase 2A Subsidiary 100% 56,897 – 56,897 – – – Planning completed Mar-2023
Yiyang Yiyang New World Scenic Heights Remaining Phases Subsidiary 100% 138,305 138,305 – – – 48,570 Under planning TBC
Subtotal 710,181 281,144 127,719 301,318 – 236,858

New World Development Company Limited308 Annual Report 2020 309
Principal Projects SummaryPrincipal Projects Summary
No. Region Name of Project
The Group’s
Accounting
Classification
The Group’s
Interest
Total GFA
(excl. carpark
and others)
(sq m)
Residential
(sq m)
Commercial
(sq m)
Office
(sq m)
Hotel
(sq m)
Carpark
and Others
(sq m)
Development
Status
Expected
Completion
Date
Eastern Region
13 Ningbo Ningbo New World Plaza Land No.7-10 Subsidiary 100% 163,625 137,652 25,973 – – 106,165 Under development Aug-2020
Ningbo Ningbo New World Plaza Land No.11 Subsidiary 100% 66,757 – 9,702 57,055 – 23,253 Under development Nov-2020
Ningbo Ningbo New World Plaza Land No.12 Subsidiary 100% 20,416 – 8,085 12,331 – 32,484 Under development Nov-2020
Ningbo Ningbo New World Plaza Land No.5 Subsidiary 100% 127,975 – 1,400 85,306 41,269 41,492 Under development Jan-2021
Ningbo Ningbo New World Plaza Land No.4 Subsidiary 100% 57,115 – 23,331 33,784 – 24,727 Under development Apr-2022
Ningbo Ningbo New World Plaza Land No.6 Subsidiary 100% 7,983 – 7,983 – – 58,565 Under development Apr-2022
Ningbo Ningbo New World Plaza Land No.1 Subsidiary 100% 14,633 – 14,633 – – 19,384 Under development Jul-2023
Ningbo Ningbo New World Plaza Land No.2 Subsidiary 100% 28,132 – 19,692 8,440 – 18,149 Planning completed Jul-2023
Ningbo Ningbo New World Plaza Land No.3 Subsidiary 100% 18,223 – 18,223 – – 13,572 Planning completed Jul-2023
14 Hangzhou Hangzhou Wangjiang New Town Project Subsidiary 100% 450,654 149,997 166,100 89,625 44,932 289,530 Under planning Apr-2024
Subtotal 955,513 287,649 295,122 286,541 86,201 627,321
Northern Region
15 Beijing Beijing New View Commercial Centre Joint venture 70% 21,294 – 9,063 12,231 – 13,513 Under development Jan-2021
Beijing Beijing New View Commercial Centre Remaining Phases Joint venture 70% 16,400 – 1,960 14,440 – 5,420 Under planning TBC
16 Beijing Beijing Xin Yu Commercial Centre Joint venture 70% 60,925 – 60,925 – – 48,689 Under planning May-2023
Beijing Beijing Xin Yu Commercial Centre Remaining Phases Joint venture 70% 431,314 236,590 180,224 14,500 – 319,340 Under planning TBC
17 Langfang Langfang New World Garden District 2 Subsidiary 100% 17,860 17,860 – – – 23,378 Under development TBC
18 Jinan Jinan New World Sunshine Garden District BC Subsidiary 100% 62,404 – 5,697 37,162 19,545 18,433 Under development TBC
Subtotal 610,197 254,450 257,869 78,333 19,545 428,773
North-eastern Region
19 Shenyang Shenyang New World Garden Phase 2C1 Subsidiary 100% 203,862 182,702 21,160 – – 42,396 Under development Aug-2021
Shenyang Shenyang New World Garden Phase 2C2 Subsidiary 100% 228,052 215,216 12,836 – – 41,690 Planning Completed Aug-2023
Shenyang Shenyang New World Garden Phase 2FG Subsidiary 100% 67,789 – 67,789 – – 28,386 Planning Completed Aug-2023
20 Shenyang Shenyang New World Centre Subsidiary 100% 506,241 – 287,086 189,231 29,924 – Under development TBC
21 Anshan Anshan New World Garden Phase 1B3 Subsidiary 100% 106,188 91,830 14,358 – – 27,448 Planning Completed Jun-2021
Anshan New World • The Grandiose Phase 1B1 Subsidiary 100% 9,297 9,297 – – – – Under development Jul-2020
Anshan New World • The Grandiose Phase 1B2 and 1B3 Subsidiary 100% 35,491 35,491 – – – – Planning Completed Jun-2023
Anshan New World • The Grandiose Phase 2C Subsidiary 100% 189,000 189,000 – – – – Under planning TBC
Subtotal 1,345,920 723,536 403,229 189,231 29,924 139,920
Grand Total 6,479,293 3,386,857 1,555,507 1,287,209 249,720 2,508,854
Remarks:(1) TBC: To Be Confirmed(2) Certain property development projects will be classified as investment properties upon completion

New World Development Company Limited310 Annual Report 2020 311
Principal Projects SummaryPrincipal Projects Summary
MAJOR PROPERTY INVESTMENT PROJECTS AND HOTELS IN MAINLAND CHINA
No. Region Name of Completed Project
The Group’s
Accounting
Classification
The Group’s
Interest
Total GFA
(excl. carpark
and others)
(sq m)
Serviced
Apartment
(sq m)
Commercial
(sq m)
Office
(sq m)
Hotel
(sq m)
Carpark
and Others
(sq m)
The Greater Bay Area and Southern Region
1 Guangzhou Guangzhou Covent Garden Subsidiary 100% 23,752 – 23,752 – – 24,437
2 Guangzhou Guangzhou Park Paradise Subsidiary 100% 142,965 22,112 57,447 – 63,406 100,435
3 Guangzhou Guangzhou Xintang New World Garden Joint venture 63% 27,299 – 27,299 – – 10,346
4 Guangzhou Guangzhou Central Park-view Area L8 Subsidiary 91% 47,277 29,869 17,408 – – 5,157
5 Guangzhou Guangzhou New World Oriental Garden Phase 1 Subsidiary 100% 21,654 – 21,654 – – 829
6 Guangzhou Guangzhou Dong Yi Garden Phase 2 Subsidiary 100% 7,443 – 7,443 – – 520
7 Foshan Canton First Estate CF19A (T5, T6) Subsidiary 85% 11,043 11,043 – – – –
8 Shunde Shunde New World Centre Joint venture 42% 26,098 – 26,098 – – 14,940
9 Shunde New World Shunde Hotel Joint venture 25% 36,524 – – – 36,524 –
Subtotal 344,055 63,024 181,101 – 99,930 156,664
Eastern Region
10 Wuhan Wuhan Guanggu New World A Subsidiary 100% 140,485 – – 81,771 58,714 21,971
Wuhan Wuhan Guanggu New World B Subsidiary 100% 2,159 – 2,159 – – –
11 Wuhan Wuhan K11 Select Subsidiary 100% 57,155 – 56,354 801 – 55,437
12 Wuhan Wuhan New World International Trade Tower 1 Subsidiary 100% 104,556 – – 104,556 – 17,272
Wuhan Wuhan New World International Trade Tower 2 Subsidiary 100% 10,005 – – 10,005 – –
13 Wuhan Wuhan New World Centre Subsidiary 100% 48,270 – 45,766 2,504 – 27,894
14 Wuhan Wuhan K11 Gourmet Tower Subsidiary 100% 10,367 – 10,367 – – 10,580
15 Wuhan New World Wuhan Hotel Joint venture 60% 29,974 – – 563 29,411 5,639
Subtotal 402,971 – 114,646 200,200 88,125 138,793
Eastern Region
16 Nanjing Nanjing New World Centre Subsidiary 100% 41,712 – 41,712 – – 11,082
17 Shanghai Shanghai Hong Kong New World Tower Subsidiary 50% 116,023 – 35,474 80,549 – 14,362
157,735 – 77,186 80,549 – 25,444

New World Development Company Limited312 Annual Report 2020 313
Principal Projects SummaryPrincipal Projects Summary
No. Region Name of Completed Project
The Group’s
Accounting
Classification
The Group’s
Interest
Total GFA
(excl. carpark
and others)
(sq m)
Serviced
Apartment
(sq m)
Commercial
(sq m)
Office
(sq m)
Hotel
(sq m)
Carpark
and Others
(sq m)
Northern Region
18 Beijing Beijing New World Centre Phase 1 Joint venture 70% 74,232 – 74,232 – – 19,956
Beijing Beijing New World Centre Phase 2 Subsidiary 100% 47,345 – 47,345 – – 27,014
19 Beijing Beijing New View Garden Joint venture 70% 4,030 – 4,030 – – 15,988
20 Beijing Beijing Xin Yu Garden Joint venture 70% 3,603 – 3,603 – – 21,197
21 Beijing Beijing Xin Kang Garden Joint venture 70% 12,011 – 12,011 – – 28,185
22 Beijing Beijing Baoding Building Shopping Arcade Subsidiary 100% 40,286 – 40,286 – – 22,000
23 Beijing pentahotel Beijing Joint venture 55% 23,988 – – – 23,988 –
24 Beijing New World Beijing Hotel Joint venture 70% 53,998 – – – 53,998 –
25 Beijing Rosewood Beijing Subsidiary 82% 143,000 – – – 143,000 –
26 Tianjin Tianjin Xin An New World Plaza Subsidiary 100% 87,054 – 80,440 6,614 – 11,284
27 Tianjin Tianjin Xin Hui Hua Ting Subsidiary 100% 25,876 – 25,876 – – –
28 Langfang KHOS Langfang Subsidiary 100% 46,421 – – – 46,421 –
29 Langfang Langfang New World Centre B Subsidiary 100% 7,016 – 7,016 – – –
30 Tangshan Tangshan New World Centre Phase 2 Subsidiary 100% 86,061 – 37,776 48,285 – –
31 Jinan Jinan New World Sunshine Garden East District 2 Subsidiary 100% 1,009 – 1,009 – – 10,282
Jinan Jinan New World Sunshine Garden West Subsidiary 100% 4,498 – 4,498 – – –
Subtotal 660,428 – 338,122 54,899 267,407 155,906
North-eastern Region
32 Shenyang Shenyang New World Garden Phase 1E Subsidiary 100% 5,026 – 5,026 – – 22,517
Shenyang Shenyang New World Garden Phase 2A Subsidiary 100% 4,601 – 4,601 – – 125,864
Shenyang Shenyang New World Garden Phase 1XA Subsidiary 100% 5,862 – 3,859 2,003 – –
Shenyang Shenyang New World Garden Phase 2D1 Subsidiary 100% 1,325 – 1,325 – – 47,684
Shenyang Shenyang New World Garden Phase 2D2 Subsidiary 100% 9,499 – 9,499 – – 54,283
33 Shenyang Shenyang New World Centre Subsidiary 100% 333,789 – 264,038 – 69,751 237,934
34 Anshan Anshan New World Garden Subsidiary 100% 2,349 – 2,349 – – 160,838
35 Dalian Dalian New World Plaza Subsidiary 88% 49,413 – 49,413 – – 19,783
36 Dalian Dalian New World Tower Subsidiary 100% 52,835 – – – 52,835 21,915
Subtotal 464,699 – 340,110 2,003 122,586 690,818
Grand Total 2,029,888 63,024 1,051,165 337,651 578,048 1,167,625

New World Development Company Limited314
Principal Projects Summary
MAJOR BUSINESS OF NWSH
A. Roads
No. Project Name Length
NWSH’s
Attributable
Interest
NWSH’s Form
of Investment Operation Date
Year of
Expiry
Guangdong Province
1 Guangzhou City Northern Ring Road 22 km 65.29% CJV January 1994 2023
2 Beijing-Zhuhai Expressway (Guangzhou-Zhuhai
Section)
Section 1: 8.6 km
Section 2: 49.59 km
25.00% CJV December 1999 2030
3 Beijing-Zhuhai Expressway (Guangzhou-Zhuhai
Northern Section)
27 km 15.00% CJV December 2005 2032
4 Guangzhou-Zhaoqing Expressway Phase 1: 48 km
Phase 2: 5.39 km
25.00% CJV Phase 1: September 2002
Phase 2: September 2010
2031
5 Shenzhen-Huizhou Expressway (Huizhou Section) 34.7 km 33.33% CJV June 1993 2023
6 Guangzhou Dongxin Expressway 46.22 km 45.90% Equity December 2010 2035
7 Guangzhou City Nansha Port Expressway 72.4 km 22.50% Equity December 2004 2030
8 Guangdong E-serve United Co., Ltd. N/A 1.02% Equity January 2013 N/A
Zhejiang Province
9 Hangzhou Ring Road 103.4 km 100.00% Equity January 2005 2029
Shanxi Province
10 Shanxi Taiyuan – Gujiao Roadway (Gujiao Section) 36.02 km 60%† CJV April 1999 2025
11 Roadway No. 309 (Changzhi Section) 22.2 km 60%† CJV July 2000 2023
12 Taiyuan – Changzhi Roadway (Changzhi Section) 18.3 km 60%† CJV August 2000 2023
Tianjin Municipality
13 Tangjin Expressway (Tianjin North Section) Section 1: 43.45 km
Section 2: 17.22 km
60%†† CJV Section 1: December 1998
Section 2: December 2000
2039
Hubei Province
14 Hubei Suiyuenan Expressway 98.06 km 30.00% EJV March 2010 2040
Hunan Province
15 Hunan Sui-Yue Expressway 24.08 km 40.00% EJV December 2011 2038
16 Hunan Changliu Expressway 65 km 100.00% Equity October 2013 2043
Remarks:† Cash sharing ratio of 90% for the first 12 years from the operation date and thereafter 60%†† Cash sharing ratio of 90% for the first 15 years from the operation date and thereafter 60%CJV: Co-operative Joint Venture (profit sharing percentage)EJV: Equity Joint Venture (percentage of equity interest)N/A: Not applicable

Annual Report 2020 315
Principal Projects Summary
B. Aviation
No. Name of Company No. of Aircraft Owned
NWSH’s
Attributable
Interest
NWSH’s Form of
Investment
1 Goshawk Aviation Limited 2018: 105 50.00% Equity
2019: 154
2020: 162
C. Construction
No. Name of Company Services Offered
NWSH’s
Attributable
Interest Total Value of Contracts
1 Hip Hing Group General contracting,
construction
management, civil
engineering works
and foundation works
100.00% Contracts awarded this year: HK$8.8 billion
Contracts on hand: HK$52.6 billion
(works to be completed: HK$36.1 billion)
D. Insurance
No. Name of Company Services Offered
NWSH’s
Attributable
Interest No. of Agents Solvency Ratio
1 FTLife Insurance Company
Limited
Provision of financial
protection
and wealth
management
services to
individual and
institutional clients
from a diverse
portfolio
100.00% Over 3,000 542%
New World Development Company Limited316
Glossary of Terms
GENERAL TERMS
CEO Chief Executive OfficerFY Fiscal year, 1 July to 30 JuneGroup NWD and its subsidiariesHIBOR Hong Kong Interbank Offered RateHK Hong KongHK$ Hong Kong dollar(s), the lawful currency of Hong KongHK$m million of Hong Kong dollar(s)HKEx or Stock Exchange The Stock Exchange of Hong Kong LimitedLIBOR London Interbank Offered RateListing Rules Rules Governing the Listing of Securities on the HKExMainland China The People’s Republic of China excluding Hong Kong, Macau and Taiwan for the
purposes of this annual reportN/A or n/a not applicableNew World or NWD or New World
Development or CompanyNew World Development Company Limited (新世界發展有限公司)
NWCL or New World China Land New World China Land LimitedNWDS or New World Department
StoresNew World Department Store China Limited
NWSH or NWS Holdings NWS Holdings LimitedPRC The People’s Republic of ChinaRMB Renminbi, the lawful currency of PRCTBC To be confirmedUS The United States of AmericaUS$ or USD United States dollar(s), the lawful currency of USMOP Macau Pataca, the lawful currency of MacauEUR Euro, the official currency of EurozoneTHB Thailand Baht, the official currency of ThailandPeso Philippine Peso, the official currency of the PhilippinesMYR Malaysian Ringgit, the official currency of Malaysia
FINANCIAL TERMS
EBITDA Operating profit before depreciation and amortisationGearing Ratio Net Debt divided by total equityNet Debt The aggregate of bank loans, other loans and fixed rate bonds and notes payable
less cash and bank balancesTotal Debt Net Debt plus cash and bank balancesHKFRS Hong Kong Financial Reporting StandardsHKAS Hong Kong Accounting StandardsFVPL Fair value through profit or lossFVOCI Fair value through other comprehensive incomeVOBA Value of business acquiredDAC Deferred acquisition costs
TECHNICAL TERMS
CJV Co-operative joint ventureEJV Equity joint ventureJV Joint ventureWFOE Wholly foreign owned enterprise
MEASUREMENTS
km kilometre(s)m3 cubic metreMW megawatt(s), equal to 1,000kWsq ft square foot (feet)sq m square metre(s)

20
20
AN
NU
AL
RE
PO
RT
�e Artisanal Movement is a cultural vision, a celebration of the human values of cra�smanship, heritage and imagination. Today, as our business evolves in step with the society, we look ahead to bring a new purpose to this vision: create shared value for all stake-holders in communities that we serve, in order to make a positive impact on the world. It is our belief of using the power of business and innovation to give back to the society. �rough three core areas - culture and creativity, sustainability, and social innovation - we will forge new paths that tie our business success to social progress. Because together we create, we are artisans, we are CSV.