Repor and Au c, Reve - rt of th uditor G on enue a - CAG
257
C Socia Comptr al, Eco roller a onomic fo GOVE Re Repor and Au c, Reve or the ye ERNMEN eport N rt of th uditor G on enue a ear 2012 NT OF T No.1 of 2 he Genera and Gen 2-13 TRIPUR 2014 al of In neral S RA ndia Sectors s
-
Upload
khangminh22 -
Category
Documents
-
view
7 -
download
0
Transcript of Repor and Au c, Reve - rt of th uditor G on enue a - CAG

C
Socia
Comptr
al, Eco
roller a
onomicfo
GOVERe
Reporand Au
c, Revefor the ye
ERNMENeport N
rt of thuditor Gon enue aear 2012
NT OF TNo.1 of 2
he Genera
and Gen2-13
TRIPUR2014
al of In
neral S
RA
ndia
Sectorss

Report of the Comptroller and Auditor General of India
on Social, Economic, Revenue and General
Sectors
for the year 2012-13
GOVERNMENT OF TRIPURA
Report No.1 of 2014

i
TABLE OF CONTENTS
Paragraph(s) Page(s) Preface vii Executive Summary ix
CHAPTER I: SOCIAL SECTOR Introduction 1.1 1 Planning and conduct of Audit 1.2 2 EDUCATION (SCHOOL) DEPARTMENTImplementation of Information and Communication Technology in Schools
1.3 3
RURAL DEVELOPMENT DEPARTMENT Wasteful Expenditure 1.4 13 Doubtful execution of works 1.5 14
CHAPTER II: ECONOMIC SECTOR Introduction 2.1 17 Planning and conduct of Audit 2.2 18 AGRICULTURE DEPARTMENTRashtriya Krishi Vikas Yojana (RKVY) 2.3 19 PUBLIC WORKS (ROADS AND BUILDINGS) DEPARTMENT Roads & Bridges Projects funded by Non-Lapsable Central Pool of Resources (NLCPR) and North Eastern Council (NEC)
2.4 34
AGRICULTURE DEPARTMENTSuspected misappropriation 2.5 64 PUBLIC WORKS (ROADS AND BUILDINGS) DEPARTMENT Infructous expenditure 2.6 65 Extra expenditure 2.7 66 Idle and extra expenditure 2.8 69 PUBLIC WORKS (WATER RESOURCES) DEPARTMENT Unfruitful expenditure 2.9 71
CHAPTER III: ECONOMIC SECTOR (State Public Sector Undertakings) Overview of State Public Sector Undertakings 3.1 73 INDUSTRIES AND COMMERCE DEPARTMENT (Tripura Handloom and Handicrafts Development Corporation Limited) Working of Tripura Handloom and Handicrafts Development Corporation Limited
3.2 84
INDUSTRIES AND COMMERCE DEPARTMENT (Tripura Industrial Development Corporation Limited) Loss of revenue 3.3 107 Loss due to injudicious investments 3.4 108

ii
Paragraph(s) Page(s) INFORMATION, CULTURAL AFFAIRS AND TOURISM DEPARTMENT (Tripura Tourism Development Corporation Limited)Non-implementation of tourism project 3.5 109
CHAPTER IV: REVENUE SECTOR General 4.1 111 Trend of revenue receipts 4.1.1 111 Variations between the budget estimates and actuals 4.1.2 113 Cost of collection 4.1.3 114 Analysis of arrears of revenue 4.1.4 114 Arrears in assessment 4.1.5 115 Evasion of tax 4.1.6 115 Refunds 4.1.7 116 Response of the Departments/Government towards audit 4.1.8 116 Failure of senior officials to enforce accountability and protect the interest of the State Government
4.1.8 (a) 116
Departmental Audit Committee Meetings 4.1.8 (b) 117 Response of the Departments to the draft audit paragraphs 4.1.8 (c) 118 Follow up on Audit Reports – summarised position 4.1.8 (d) 118 Compliance with the earlier Audit Reports 4.1.8 (e) 118 Analysis of the mechanism for dealing with the issues raised by Audit
4.1.9 119
Position of Inspection Reports 4.1.9 (a) 119 Assurances given by the Department/Government on the issues highlighted in the Audit Reports
4.1.9 (b) 119
Recovery of accepted cases 4.1.9 (b) (i) 119 Action taken on the recommendations accepted by the Departments/Government
4.1.9 (b) (ii) 120
Results of audit 4.1.10 120 Position of local audit conducted during the year 4.1.10 (a) 120 This Report 4.1.10 (b) 120 FINANCE (EXCISE & TAXATION) DEPARTMENT (SALES TAX /VALUE ADDED TAX) Short levy of tax 4.2 121
CHAPTER V: GENERAL SECTOR Introduction 5.1 123 Planning and conduct of Audit 5.2 123 HOME (POLICE) DEPARTMENT Audit of Home (Police) Department 5.3 125
CHAPTER VI: FOLLOW UP OF AUDIT OBSERVATIONS Follow up action on earlier Audit Reports 6.1 161 Monitoring 6.2 162 Outstanding Inspection Reports 6.3 163

iii
APPENDICES Appendix No. Page(s)
Statement showing the calculation of inadmissible payment made/due to the agencies
1.1 167
Statement showing the sector-wise number of projects sanctioned, taken up for implementation and dropped under RKVY
2.1 169
Statement showing the delay release of funds by the Finance Department and Nodal Department
2.2 170
Statement showing the details of unspent amount lying with the DDOs
2.3 171
Statement showing the unadjusted amount lying with the Implementing Officers
2.4 172
Statement showing the observations relating to the selected projects pertaining to Animal Husbandry under RKVY
2.5 173
Statement showing the observations relating to the selected projects pertaining to Horticulture under RKVY
2.6 176
Statement showing the observations relating to the selected projects pertaining to Development of Agricultural Market under RKVY
2.7 178
Statement showing the observations relating to the selected projects pertaining to Fisheries under RKVY
2.8 180
Statement showing details of cost escalation due to revision of DPR
2.9 182
Statement showing change in specification for construction of RCC bridge under NLCPR
2.10 183
Statement showing details of fund released by GOI, State Finance Department as well as CE
2.11 184
Statement showing the details of delay in submission of Utilisation Certificates
2.12 186
Statement showing details of calculation of damaged quantity of outer layer of road of Dharmanagar-Tilthai-Damcherra-Khedacherra road
2.13 188
Statement showing excess collection of material in violation of estimated quantity
2.14 190
Statement showing loss of interest against mobilisation advance 2.15 191 Extra expenditure of ` 1.11 crore due to execution of agreement item through another agreement as an extra item
2.16 192
Statement showing details of Doubtful execution of work 2.17 193 Statement showing loss of interest against mobilisation advance 2.18 194

iv
Appendix No. Page(s) Statement showing the extra expenditure incurred by the Department in awarding works to the private sector construction agencies
2.19 195
Statement showing the details of works awarded to local contractor under NLCPR and NEC
2.20 196
Statement showing the detailed position of nine bridges awarded to private sector construction agencies
2.21 197
Statement showing particulars of up-to-date capital, loans outstanding and manpower as on 31 March 2013 in respect of Government Companies and Statutory Corporations
3.1 198
Statement showing grants and subsidy received/receivable, guarantees received, waiver of dues, loans written off and loans converted into equity during the year and guarantee commitment at the end of March 2013
3.2 202
Summarised financial results of Government companies and Statutory corporation for the latest year for which accounts were finalised
3.3 206
Statement showing financial position of Statutory Corporation (Tripura Road Transport Corporation)
3.4 209
Statement showing working results of Statutory Corporation (Tripura Road Transport Corporation)
3.5 210
Statement showing investment made by State Government in PSUs whose accounts are in arrears
3.6 211
Emporium-wise sales performance against target 3.7 212 Emporium-wise profitability statement for the year 2012-13 3.8 216 Details of emporium-wise turnover per employee during the period 2008-09 to 2012-13
3.9 219
Statement on production and distribution of silk sarees 3.10 222 Operational performance of the Company during the period from 2008-09 to 2012-13
3.11 223
Statement showing details of avoidable loss of revenue towards lease rent and premium from October 2008 to December 2013
3.12 224
Statement showing avoidable loss of income due to Fixed Deposits made on the same dates/nearer date at varied interest rates
3.13 225
Statement showing short levy of Sales Tax/VAT, interest, penalty and Additional Sales Tax due to concealment of turnover by the dealers
4.1(A) 232
Statement showing short levy of Sales Tax/VAT, interest and penalty due to incorrect application of taxable rates
4.1(B) 235
Statement showing non levy of penalty due to non submission of audited balance sheet
4.1(C) 236
Units selected by using Random Table (Page No. 23) 5.1 237

v
Appendix No. Page(s) Details of savings against revised budget estimates during 2008-09 to 2012-13
5.2 239
Statement showing expenditure incurred in March vis-a-vis total expenditure under Non-salary during 2008-13
5.3 241
Statement showing differences of closing balances as per Cash Book and Bank statement
5.4 242
Statement showing the organisation-wise position of outstanding deployment cost of Police Personnel upto May 2013
5.5 243
Statement showing items reported as procured under MoPF but in reality not procured till September 2013
5.6 246

vii
1. This Report of the Comptroller and Auditor General of India has been prepared for submission to the Governor under Article 151 of the Constitution of India.
2. This Report presents the results of the audit of the Departments of the Government of Tripura under Social, Economic, Revenue and General Sectors.
3. The cases mentioned in this Report are those which came to notice in the course of test audit during the year 2012-13 as well as those which came to notice in earlier years but could not be dealt with in the previous Reports. Matters relating to the period subsequent to 2012-13 have also been included, wherever necessary.
4. The audits have been conducted in conformity with the Auditing Standards issued by the Comptroller and Auditor General of India.
PREFACE
Executive Summary
ix
Executive Summary
This Audit Report has been prepared in six chapters. Chapters I to V deal with Social, Economic, State Public Sector Undertakings, Revenue and General Sectors and Chapter VI deals with Follow up of Audit observations.
This Report contains 23 audit paragraphs (including 11 general paragraphs and one paragraph on Implementation of Information and Communication Technology in Schools) and four Performance Audits. According to the existing arrangements, copies of the draft paragraphs and draft performance audit were sent to the Secretary of the departments concerned with a request to furnish replies within six weeks. However, in respect of eight audit paragraphs included in the Report, no replies were received till the time of finalisation of the Report (January 2014). A synopsis of the important findings contained in the Report is presented below:
SOCIAL SECTOR
Implementation of Information and Communication Technology in Schools
The Information and Communication Technology scheme implemented at the cost of ` 21.90 crore (till March 2013) was plagued by inordinate delay leading to non-achievement of targets, non fulfilment of objectives, inadequate utilisation, lack of monitoring, non-follow up action on the report of NIT and also failed to ensure capacity building by arranging all-important training for the school teachers. As a result, the Education (School) Department had failed to continue the computer education programme after the agreement period. Thus, the objectives of computer education to students and training to teachers using information and computer technology did not yield the results as envisaged in the scheme.
(Paragraph 1.3)
Compliance Audit Paragraphs
Failure in planning by the Rural Development Department led to non-completion of nine staff quarters in Mungiakami RD Block even after five years from the scheduled date of completion and the expenditure of ` 61.69 lakh incurred on them had become wasteful. Moreover, further deterioration of the materials due to prolonged suspension of work would require additional cost for completing the work.
(Paragraph 1.4)
The actual procurement and plantations of saplings at a cost of ` 45.91 lakh under MGNREGA scheme in seven ADC villages in Jampui Hill RD Block was doubtful as there were no pre-plantation works, post-plantation works and supporting documentation.
(Paragraph 1.5)

Audit Report for the year ended 31 March 2013
x
ECONOMIC SECTOR
PERFORMANCE AUDIT
Performance Audit of Rashtriya Krishi Vikas Yojana (RKVY)
The implementation of RKVY in Tripura produced mixed results in terms of both achievements and failures. The Department did not prepare the overall State comprehensive agricultural plan in time. The District level agricultural plans were prepared without preparing the plan at Panchayat level planning units. Therefore, involvement of the Panchayats in planning process could not be ensured by the Department. There were considerable delays in release of funds at every level and the completion of the projects was delayed in many cases. No criteria for selection of beneficiaries under the scheme were prescribed. Though the beneficiaries interviewed during the course of audit accepted availing benefits of the projects, no mechanism was in place to assess the benefits actually accruing to the beneficiaries in terms of their economic well being. The nodal department as well as SLSC did not monitor and review the progress and implementation/achievement of the projects. The internal control mechanism was weak and the required records were not maintained. Data reliability was not ensured. No evaluation or impact assessment of RKVY was done by the State Government.
(Paragraph 2.3)
Performance Audit of Roads & Bridges Projects funded by Non-Lapsable Central Pool of Resources (NLCPR) and North Eastern Council (NEC)
Government of India (GOI) created the Non-lapsable Central Pool of Resources (NLCPR) and North Eastern Council (NEC) with the aim of speeding up the execution of infrastructure projects in the North Eastern States by increasing the flow of budgetary financing for specific viable infrastructure projects in various sectors as well as to reduce the critical gaps in basic minimum services. A Performance Audit of Roads and Bridges projects funded from NLCPR and NEC during 2008-13 in the State revealed that projects were taken up without adequate planning and prioritisation. Consequently, out of 24 projects approved by the GOI during 2008-09 to 2012-13 and which were scheduled to be completed by March 2013, only nine projects (38 per cent) were completed in Roads and Bridges sector as of March 2013. The State had neither carried out gap analysis nor evaluated the extent of achievement of the objective of reducing the gap between the required and available infrastructure facilities in the State and its impact on the economy and social fabric of the State.
(Paragraph 2. 4)

Executive Summary
xi
Compliance Audit Paragraphs
Violation of provision of financial rules pertaining to handling of Government money and poor maintenance of Cash Book by the Executive Engineer, Agriculture Department Agartala led to suspected misappropriation of ` 12,23,061.
(Paragraph 2.5)
Faulty planning and arbitrary decision of the Government to abandon the work after completing upto plinth level for “Construction of Recreation Hall cum Library for Cultural Activities” at the Central Prison, Bishalgarh resulted in infructuous expenditure of ` 1.01 crore.
(Paragraph 2.6)
In violation of the contractual provisions under turnkey contract for construction of the Central Prison at Bishalgarh, payment was made by the Public Works Department (Roads and Buildings) towards land/site development as an additional item, which fell well within the scope of work of turnkey contract. This rendered the expenditure of ` 1.56 crore extra, of which ` 84.40 lakh had already been paid to M/s Engineering Projects India Ltd.
(Paragraph 2.7)
Award of works for construction of bridges in violation of the decision of the Council of Ministers to the inexperienced and unqualified agencies at higher than the approved rates, coupled with inaction on the part of the Public Works Department (Roads and Buildings), not only resulted in unauthorised and irregular expenditure of ` 3.57 crore, but also rendered the expenditure of ` 7.93 crore incurred on six suspended works idle for 12 to 36 months which, in turn, resulted in failure in achieving the objective of speedy and smooth implementation of infrastructural development projects in the State.
(Paragraph 2.8)
Lack of adequate planning and timely decision on agreement-related issues by the Public Works Department (Water Resources) coupled with non-initiating timely action for rescinding the agreement and getting the remaining work executed by another contractor at the risk and cost of erring contractor resulted in unfruitful expenditure of ` 2.17 crore. The partially constructed canal also meant that the farmers were deprived of the intended benefits of the irrigation project.
(Paragraph 2.9)

Audit Report for the year ended 31 March 2013
xii
ECONOMIC SECTOR (STATE PUBLIC SECTOR UNDERTAKINGS)
PERFORMANCE AUDIT
Working of Tripura Handloom and Handicrafts Development Corporation Limited
The Company had no vision or planned orientation in achieving its stated objectives. The system of forming MOUs between the Company and the Government was not effective as the annual targets fixed there under were not based on any scientific study. As per the unit-wise profitability worked out by Audit for 2012-13, excepting one emporium, all 43 emporia of the Company had incurred losses. Contrary to its laid down objectives, the Company had been operating two power loom units at the behest of the State Government, which had caused negative impact on its financial interests. All three major projects taken up by the Company during five years period had suffered time and cost overruns. Despite capital infusion of ` 27.93 crore by the State Government during 2008-09 to 2012-13, Company had been facing working capital crunch due to continuous operational losses. The merger of Tripura Apex Weaver’s Co-operative Society (TAWCS) with the Company had also adversely affected its financial position. Internal control and monitoring system was almost non-existent in the Company. The Company did not make any effort to assess the impact of its activities in uplifting socio economic conditions of the weavers/artisans in the State.
The Company failed to achieve its stated objectives of serving the weavers and artisans of the State.
(Paragraph 3.2)
Compliance Audit Paragraphs
Failure of Tripura Industrial Development Corporation Limited to incorporate an appropriate clause in lease agreements for recovery of lease premium and rent at revised rates had resulted in loss of revenue of ` 62.20 lakh.
(Paragraph 3.3)
Due to improper investment of funds in absence of a scientific method for investment planning, the Tripura Industrial Development Corporation Limited suffered an avoidable interest loss of ` 22.98 lakh.
(Paragraph 3.4)
Failure of the State Government in providing the project land to Tripura Tourism Development Corporation Limited for the Government of India sponsored tourism project “Destination Development of Agartala” deprived the State of the intended benefits of the project.
(Paragraph 3.5

Executive Summary
xiii
REVENUE SECTOR
Compliance Audit Paragraph
Concealment of turnover by the dealers, incorrect application of rates and non submission of audited balance sheet which escaped notice of the assessing authorities resulted in short levy of Sales Tax/VAT of ` 60.30 lakh, leviable interest of ` 51.16 lakh, penalty of ` 38.12 lakh and Additional Sales Tax of ` 1.80 lakh.
(Paragraph 4.2)
GENERAL SECTOR
PERFORMANCE AUDIT
A performance audit of the Home (Police) Department revealed several deficiencies in their functioning. The Department did not have its own Police Manual. It had also not formulated any long-term or short term plan for prioritising the goals of the Department with reference to the objectives of policing. Budget estimates were not realistic. The incidence of IPC crime especially crime against women in the State increased during 2008-2012 while the conviction rate was low which is a matter of concern. Further, use of forensic science in crime investigation was not fully functional due to lack of skilled manpower. Average reaction and response time was unsatisfactory. Housing facilities for police personnel were not adequate. The Department also failed to benefit from the modernisation schemes due to their tardy implementation. The striking ability of the police force was compromised due to shortage of modern weapons, mobility deficiency, inadequate and ineffective communication equipment. It was also noticed that internal control, supervision and monitoring was inadequate.
(Paragraph 5.3)

Audit Report for the year 2012-13, Government of Tripura 1
CHAPTER I: SOCIAL SECTOR
1.1 Introduction This Chapter of the Audit Report for the year ended 31 March 2013 deals with the findings on audit of the State Government units under Social Sector.
The names of the State Government departments and the total budget allocation and expenditure of the State Government under Social Sector during the year 2012-13 are given in the table below:
Table: 1.1.1 (` in crore)
Name of the Departments Total Budget Allocation Expenditure
Education (Higher) Department 152.83 113.11Education (School) Department 992.92 871.93Education (Social) Department 281.04 214.28Education (Sports and Youth Programme) Department 43.96 42.98Food, Civil Supplies and Consumer Affairs Department 55.61 50.62Family Welfare and Preventive Medicine 211.36 94.03Health Department 192.28 154.06Labour Organisation 6.30 8.74Panchayati Raj Department 181.36 172.12Public Works (Drinking Water and Sanitation) Department
93.24 85.93
Relief and Rehabilitation Department 27.49 27.37Rural Development Department 169.08 105.42Tribal Welfare (Research) Department 2.40 1.58Tribal Welfare Department 1,512.10 980.06TRP and PGP Department 16.88 16.98Urban Development Department 214.69 157.17Welfare for SC and OBC Department 805.31 436.64Welfare of Minorities Department 11.70 8.89Total number of Departments = 18 4,970.55 3,541.91
Source: Appropriation Accounts – 2012-13.
Besides the above, the Central Government had transferred a sizeable amount of funds directly to the Implementing agencies under the Social Sector to different agencies in the State during the year 2012-13. The major transfers (` 5 crore and above) to the State Implementing Agencies for implementation of flagship programmes of the Central Government are detailed below:

Chapter I: Social Sector
Audit Report for the year 2012-13, Government of Tripura
2
Table: 1.1.2 Funds transferred to State Implementing Agencies during 2012-13
(` 5 crore and above) (` in crore)
Name of the Department
Name of the Scheme/ Programme Implementing Agency
Amount of funds transferred during
the year Education (School)
Sarva Shiksha Abhiyan (SSA)
SSA Rajya Mission, Tripura
120.10
Rashtriya Madhyamik Shiksha Abhiyan (RMSA)
RMSA, Rajya Mission 70.18
Health National Rural Health Mission (NRHM) Centrally Sponsored
State Health and Family Welfare Society, Tripura
42.05
Public Works (Drinking Water and Sanitation)
National Rural Drinking Water Programme
SWSM, Tripura 100.59
Rural Development
Mahatma Gandhi National Rural Employment Guarantee Scheme
State Employment Guarantee Fund, Tripura
768.90
Rural Housing – IAY DRDAs 61.86 Pradhan Mantri Gram Sadak Yojana (PMGSY)
Tripura Rural Roads Development Agency, Tripura
338.59
Total: 1,502.27
Source: ‘Central Plan Scheme Monitoring System’ portal in Controller General of Accounts’ website
1.2 Planning and conduct of Audit Audit process starts with the assessment of risks faced by various departments of Government based on expenditure incurred, criticality/complexity of activities, level of delegated financial powers, assessment of overall internal controls, etc.
The audits were conducted during 2012-13 involving test-check of an expenditure of ` 1,763.40 crore (including expenditure pertaining to previous years audited during the year) of the State Government under Social Sector. This Sector contains one paragraph on ‘Implementation of Information and Communication Technology (ICT) in Schools’ of the Education (School) Department and two Compliance Audit Paragraphs.
After completion of audit of each unit, Inspection Reports containing audit findings are issued to the heads of the departments. The departments are requested to furnish replies to the audit findings within one month of receipt of the Inspection Reports. Whenever replies are received, audit findings are either settled or further action for compliance is advised. The important audit observations arising out of those Inspection Reports are processed for inclusion in the Audit Reports, which are submitted to the Governor of the State under Article 151 of the Constitution of India for being laid in the State Legislature.
The major observations detected in audit during the year 2012-13 are as detailed in the succeeding paragraphs:

Chapter I: Social Sector
Audit Report for the year 2012-13, Government of Tripura 3
EDUCATION (SCHOOL) DEPARTMENT
1.3 Implementation of Information and Communication Technology in Schools
1.3.1 Introduction
In December 2004 the Government of India (GOI), Ministry of Human Resource Development (MHRD) launched a scheme “Information and Communication Technology (ICT) in Schools” to provide opportunities to secondary stage students to build their capacity on ICT skills and make them learn through computer aided learning process.
The objectives of the scheme, inter alia, included:
Establishment of an enabling environment to promote the usage of ICT especially in higher secondary and secondary Government schools in rural areas. Critical factors of such an enabling environment include widespread availability of access devices, connectivity to the Internet and promotion of ICT literacy.
Ensuring the availability of quality content on-line and through access devices both in the private sector and by State Institutes of Education Technology.
Enrichment of existing curriculum and pedagogy by employing ICT tools for teaching and learning.
Enabling the students to acquire skills needed for the digital world for higher studies and gainful employment.
Promoting the use of ICT tools in distance education including the employment of audio-visual medium and satellite-based devices.
Based on the computer education plan sent (November 2006) by the State Government, MHRD approved (March 2007) 200 schools under the scheme during 2006-07 which was revised (November 2007) to 400 schools to be covered during 2007-12. MHRD further approved coverage of another 282 schools in November 2010.
The State Government implemented the scheme in 400 high and higher secondary schools for providing computer aided learning1 (CAL) to the students of classes VI to VIII and computer education to the students of classes IX to XII under Build, Own, Operate and Transfer (BOOT) model by engaging private agencies through open tender who would also be responsible for supply, installation, commissioning and maintenance of the computer hardware 2 , software 3 and connected accessories including furniture in computer rooms. The State Council of Educational Research and Training (SCERT) under Education (School) Department was the nodal agency to implement and monitor the scheme. 1 Imparting education with the help of multimedia based education software covering the hard spots of four subjects (English, Science, Mathematics and Social Science) identified by the SCERT. 2 Ten computers, ten UPS, one printer, etc. 3 Operating and application software, multimedia based educational software for CAL, etc.

Chapter I: Social Sector
Audit Report for the year 2012-13, Government of Tripura
4
A study on the implementation of the scheme was conducted (July/August 2012 and June/August 2013) by examining the records in the office of the Director, SCERT and physical verification/survey in fifty schools in two districts 4 selected by simple random method for the period 2007-08 to 2012-13 and the findings of audit are discussed in the succeeding paragraphs.
1.3.1.1 Deficiencies in planning leading to delay in implementation
MHRD had approved (November 2007) the implementation of the scheme in 400 schools under BOOT model for the period 2007-12 whereas the Department spread out the implementation in different phases by engaging private agencies through open tender from December 2007 to August 2012, thereby extending the period up to March 2018 as tabulated below:
Table 1.3.1: Engagement of private agencies and coverage of schools in different phases
Phase Month/year No. of
schools covered
Phase-wise total
no. of schools
No. of agencies/rate
per school (` in lakh)
Validity of agreement
1st phase December 2007 150 150 Four/ 8.50 March 2013
2nd phase September 2009 160
200 Three/8.04 March 2015 November 2009 13 December 2009 27
3rd phase May 2012 25 50 One/ 8.04 March 2018 August 2012 25
Thus, there had been inordinate delay in implementation of the scheme, i.e., two years delay in respect of 200 schools and five years delay in respect of 50 schools, leading to non- achievement of the target set for the scheme period of 2007-12.
It was further noticed that the Department had not started (August 2013) implementation of the scheme in 282 schools approved in November 2010 for the period 2010-15 though the GOI released the 1st instalment of central share of ` 4.96 crore to the State Government as early as March 2011.
The Department also did not take adequate steps to provide required facilities like internet, scanner, web camera, modem to the students as envisaged in the scheme guidelines indicating planning failure as detailed in paragraph 1.3.1.3.
The Department stated (August 2013) that the delay in implementation of scheme period 2007-12 was due to the selection of agencies by open tender in two phases but did not spell out the actual reasons for delay and implementation in phased manner spreading over five years.
1.3.1.2 Financial Management
As per the financing pattern under the scheme, the project cost (` 6.70 lakh per school) and the recurring cost (` 1.34 lakh per school per annum) was to be shared on 90:10 basis between the GOI and the State Government. The project cost of 4 West Tripura and Dhalai

Chapter I: Social Sector
Audit Report for the year 2012-13, Government of Tripura 5
` 24.12 crore was to be released by the GOI in instalments - ` 8.12 crore @ ` 2.03 lakh per school during 2007-08 and ` 4 crore every year for four years during 2008-12 @ ` 1 lakh per school. GOI released ` 22.23 crore as project cost and ` 5.01 crore as recurring cost till March 2013.
Audit observed the following deficiencies in the financial management of the scheme:
The Department failed to implement the schemes in time (150 schools in December 2007, 200 school in September –December 2009 and 50 schools in May-August 2012 against the target of 400 schools by March 2012). Therefore, the GOI did not release its share of project cost during the years 2008-09 and 2009-10 (` 8 crore) which was partly (` 4.50 crore) released in 2010-11 and balance (` 3.50 crore) in 2011-12.
As per the scheme guidelines, the GOI fund commitment was up to the year 2011-12 only, whereas due to delay on the part of the Department, the funding had got delayed beyond the commitment period and ` 1.89 crore was still due from the GOI on account of project cost.
The Department claimed recurring grant of ` 7.84 crore from GoI for the period 2008-09 to2010-11 only in August 2011 of which ` 3.63 crore was accepted by GOI. No reasons for short acceptance of the claim by the GOI were found on records. The Department also did not pursue the matter with the GOI thereby depriving the State of a substantial amount of ` 4.21 crore under the scheme.
On this being pointed out by audit, the Department admitted (August 2013) the delay in submitting claims for recurring grant stating that initially the SCERT was not aware about recurring grant. They further agreed that communication would be made with the MHRD for the balance amount of ` 4.21 crore.
GOI had provided/committed financial assistance of ` 53.60 crore under the scheme for 400 schools at the rate of ` 13.40 lakh per school on account of capital and recurring expenditure for five years whereas the Department placed the work orders with private agencies at ` 8.50 lakh per school for 150 schools and ` 8.04 lakh for 250 schools resulting into likely savings of ` 20.75 crore5. This aspect was neither intimated to the MHRD nor was its impact/utilisation assessed by the Department.
The Department stated (August 2013) that the State Government had decided to enhance the monthly remuneration of the computer faculties engaged by the agencies by ` 2000 per faculty per month with effect from 1 April 2012 and this would consequently exhaust the savings before the end of the scheme in 2018. But the fact
5 GOI assistance =` 53.60 crore Less actual/committed expenditurei) 150×` 8.50 lakh =` 12.75 crore ii) 250×` 8.04 lakh =` 20.10 crore =` 32.85 crore Savings =` 20.75 crore

Chapter I: Social Sector
Audit Report for the year 2012-13, Government of Tripura
6
remained that the huge savings would be exhausted only to the extent of ` 4.80 crore6 by enhancement of remuneration of the faculties. Moreover, the Department did not spell out the reasons for not providing the facilities like scanner, web camera, modem in 1st phase as envisaged in the scheme guidelines.
The Director, SCERT further stated (October 2013) that the Department would take initiative to assess impact of likely savings and after assessment this aspect would be intimated to the MHRD.
The 1st instalment of GOI share of ` 4.96 crore against 282 schools approved in November 2010 received in March 2011 was lying idle for over two years (July 2013) as the Department had not started implementation of the scheme in those schools (July 2013). Despite request made (July 2013) by Audit, the Director, SCERT did not furnish the reasons for non-implementation of the scheme in 282 schools.
1.3.1.3 Availability of the required equipment and facilities
The Department entered into agreements with the private agencies to provide computer hardware consisting of 10 computers, 10 UPSs, one printer and necessary furniture & fixtures for each school. As per the scheme guidelines, the computer system was required to be inclusive of facilities like scanner, web camera, modem, etc. It was, however, observed that these facilities were not included in the scope of private agencies except the inclusion of modems for 250 schools of the second and the third phase.
Further, though the agreements with the private agencies provided for the topics on internet basics, browsing on the internet, creating e-mail account etc, the Department did not take the required action to provide internet connections as discussed below:
The Project Management and Evaluation Group of the MHRD repeatedly informed (November 2007, November 2008 and November 2010) the State Government that the Ministry of Telecommunication had assured to provide broadband connections on priority to all high schools and also instructed the State to take up the matter with the Department of Telecom (DoT) and BSNL units located in the State. The State Government did not take up the issue of providing broadband connectivity with the DoT and the local BSNL authority. The Director, SCERT informed (January 2013) the MHRD that the internet connection was not provided in the 400 schools and asked the private agencies to provide internet connection through BSNL.
The terms and conditions of bid documents in 2nd phase of implementation in 200 schools, inter alia, provided that the bidder must arrange a telephone
6 150 schools from April 2012 to March 2013=150 x2x12x` 2000=` 0.72 crore 200 schools from April 2012 to March 2015=200 x2x36x` 2000=` 2.88 crore 50 schools from April 2013 to March 2018=50 x2x60x` 2000=` 1.20 crore
Total=` 4.80 crore

Chapter I: Social Sector
Audit Report for the year 2012-13, Government of Tripura 7
connection with internet connection on all the machines by using suitable software and 100 hours internet connection per annum for five years must be obtained for exclusive use of the students. They were also required to maintain a log book regarding the time of usage by the students. But, the above terms and conditions of bid documents were not incorporated in the agreements (September-December 2009) meant for 200 schools. However, on this being pointed out in audit (July 2012) the said provision had been incorporated in the agreements of 25 schools (August 2012) out of 50 schools where the scheme was being implemented in the 3rd phase.
Thus, the Department did not take up the issue of internet connectivity in all seriousness and vested the responsibility solely with the implementing agencies in disregard to the instructions of the MHRD. Besides, the Department also extended undue benefits to the agencies by not incorporating all the provision contained in the bid documents into the agreements. As the component-wise (both in respect of cost of equipment to be supplied and services to be rendered by the agencies) break-up of rate was not mentioned in the agreements, the SCERT had no scope to recover any proportionate amount from the agencies for not providing the internet connectivity to the schools.
The Department stated (August 2013) that the issue of providing internet connectivity would be taken up with the DoT and BSNL authorities. The fact, however, remained that implementation of the scheme in 150 schools had already been completed without providing internet facilities to the students.
Audit further observed following deficiencies in the procurement/utilisation of equipment/facilities:
Testing of the equipment supplied by the agencies not done
As per provision of the agreements, all the items of equipment were to be tested by the Electronic Testing and Development Centre (ETDC) under the Ministry of Communication and Information Technology, Government of India.
Audit observed that the Director, SCERT requested ETDC to test the equipment only in August 2012 i.e. at the end of the agreement period for 150 schools which was also not carried out till August 2013. The agreement did not provide any restriction on payments pending required testing of the equipment.
The Department stated (August 2013) that the ETDC would be again requested to start the testing work.
Maintenance of the hardware during the agreement period
As per the agreements, the agencies were required to maintain the hardware in working condition and for this purpose the downtime of the computers and other accessories were to be recorded in the log book. The logbooks were to be submitted to the Heads of the institution at the end of every week for countersignature.

Chapter I: Social Sector
Audit Report for the year 2012-13, Government of Tripura
8
Audit observed that log books were not properly maintained and countersigned by the Heads of the institution. During physical verification by Audit, 90 computer systems of 17 schools were found non-functional. On this being pointed out, the Headmasters (HMs) informed that the systems were non-functional for different spells between April 2011 and March 2013 (Appendix 1.1).
The Department stated (August 2013) that the HMs would be instructed to maintain and countersign the logbooks and to keep records properly.
Inadmissible payments on false certificates and non-levy of liquidated damage
As per provision of the agreements, 10 per cent of the contract value was to be paid to the agencies within 30 days after the signing of the agreement and another 15 per cent on completion of installation and commissioning of equipment in the schools. The balance amount was to be paid in ten instalments @ 7.5 per cent of contract value for each school on receipt of six- monthly certificate of satisfactory performance from the school Headmasters.
As stated in the preceding paragraph, operational data regarding downtime of the computer accessories were not properly recorded by the agencies as prescribed in the agreement. But the HMs kept on issuing satisfactory performance reports without any mention of downtime of computers and payment was released on the basis of those certificates despite non-functioning of the computers. This resulted in inadmissible payment of ` 19.85 lakh to the agencies (Appendix 1.1).
On the other hand, the HMs of six test-checked schools intimated the SCERT about non-functioning of 21 computers in different spells but the SCERT did not levy the liquidated damages which was to be levied @ ` 400 per computer per week on the defaulting agencies.
The Department stated (August 2013) that the HMs would be instructed to take necessary measures about the observations raised by Audit and necessary deductions would be made at the time of release of final payments to the agencies.
1.3.1.4 Utilisation of ICT for school students
As per the agreement, the faculties appointed by the agencies were responsible for providing computer education to the school students from Class IX to XII as per the prescribed syllabus.
Audit survey however, revealed (July-August 2013) that the computer faculties did not cover the prescribed syllabus and confined only to computer basics viz. MS-Word and Excel thereby depriving the students from necessary computer education as envisaged in the scheme.
Further as stated in paragraph 1.3.1.3, no provision was made for internet connections in the schools and as such, lack of internet facility resulted in non-achievement of the main objective of providing online content, widespread availability of access devices and internet connectivity to the students as envisaged in the scheme guidelines.

Chapter I: Social Sector
Audit Report for the year 2012-13, Government of Tripura 9
The Department stated (August 2013) that the school authorities would be instructed to cover the entire computer syllabus as provided in the agreements.
1.3.1.5 Assessment of the students
The scope of the rate contract given in the bid documents, inter alia, provided for testing and certification in computer education for the students at the end of every academic year from an independent agency approved by the State Government.
But, it was noticed that the above terms and conditions of the bid documents were not incorporated in the agreements executed with the agencies.
In the absence of such clause in the agreements, the impact of computer education and the level of learning/skills acquired by the students which was one of the stated objectives of the scheme remained un-assessed.
On this being pointed out by Audit in July 2012, the Director, SCERT stated (August 2012) that the above conditions would be included by suitable modifications of the existing agreements. But no step was taken by the SCERT in this regard till July 2013.
The Department stated (August 2013) that the agencies would be requested to assess the students.
1.3.1.6 Utilisation of ICT for school teachers
As per the agreement the agencies were to provide five days’ training to five subject teachers including HMs in each school for use of Multimedia Based Educational Software and basic computer education.
It was noticed in audit that the Director, SCERT neither arranged any training to the teachers nor had any information/ records relating to teachers’ training provided by the agencies.
During physical verification by Audit, HMs of 11 out of 50 test-checked schools informed (July-August 2012 and July-August 2013) that teachers of those schools were given training by the agencies but no records showing details of nomination, curriculum of the training, training module etc. could be provided to Audit.
Thus, teachers in the schools were untrained in the usage of ICT tools in teaching the students and the schools remained solely dependent on the computer faculties of the agencies having serious implication as discussed in paragraph 1.3.1.7 below.
Further, the agreement also provided that the computer faculties would assist the subject teachers in imparting computer aided learning (CAL) to the students of classes VI to VIII with the help of multimedia based education software.
A survey conducted (July-August 2013) by Audit among the students in the presence of HMs revealed that the CAL was provided only by the computer faculties without

Chapter I: Social Sector
Audit Report for the year 2012-13, Government of Tripura
10
any involvement of subject teachers (except in five schools7, where neither the subject teachers nor the computer faculties provided CAL to the students).
The fact of non-involvement of subject teachers was confirmed by the students and the headmasters. Thus, the subject teachers could not be equipped with the required knowledge for taking up computer teaching in the future.
1.3.1.7 Discontinuance of ICT education after agreement period
As per the scheme guidelines, the computer education in the selected schools was to be taken over by the trained teachers at the end of the project. The Department also reported (January 2013) to MHRD that the trained teachers could take over the computer lab at the end of the project period.
It was however, noticed in audit (July 2013) that the computer education in 150 schools covered in the first phase had been discontinued after expiry of the validity of the agreement with the agencies on 31 March 2013. The Department had not taken any steps to continue the computer education in the schools and thus, the capital investment on computer hardware and infrastructure remained un-utilised besides deprivation of envisaged benefits to the targeted students. Moreover, the GOI was wrongly informed about the continuation of ICT education at the end of the project.
The Director, SCERT also admitted (July 2013) the fact stating that the Department had acute shortage of computer trained teachers and the computer education had also not been included in the curriculum of the schools. As such, the Department was not in a position to continue the scheme or any other computer education programme. This was the most serious lapse in the entire process of implementation of the scheme which in effect had nullified whatever little achievements were made under the scheme and the very purpose of the scheme had been defeated.
The Department stated (August 2013) that it would take necessary steps so that the trained teachers would take over the charge of computer lab for imparting computer education but did not specify the time frame and any concrete plan in this regard. The Director, SCERT further confirmed (October 2013) that the Department had not formulated any policy/programme/syllabus to restart computer education programme. Thus, due to non-inclusion of computer education in the curriculum and absence of syllabus of the computer education the issue of imparting computer education to the students of secondary and higher secondary stages by trained teachers had remained uncertain in the schools. Consequently, the commitment made to the GOI regarding taking over of computer lab at the end of project period remained un-fulfilled and also the main objective of the scheme i.e. the promotion of ICT literacy among the students of secondary and higher secondary Government schools remained unachieved.
7 Arabinda Vidyamandir High School, Jampuijala Girls’ High School, Kulai Colony High School, North Kamrangatali H.S. School, Poangbari High School.

Chapter I: Social Sector
Audit Report for the year 2012-13, Government of Tripura 11
1.3.1.8 Monitoring and supervision
As per instructions of the Principal Secretary (School Education), the Director, SCERT constituted (March 2012) a State Level Monitoring Committee (SLMC) for effective monitoring and supervision of the implementation of the scheme.
It was noticed in audit that the SLMC was constituted as late as March 2012, i.e., when the 5-year scheme period of 2007-12 almost came to an end. Even after that, the Committee was non-functional and had held no meeting/visit to monitor the implementation of the scheme in the schools till July 2013.
The Department stated (August 2013) that the SLMC would be made functional.
Audit observed other irregularities/deficiencies in monitoring as under:
Quarterly Progress Reports not sent to MHRD
Guidelines of the scheme provided for submission of quarterly progress reports (QPRs) by the State Government to the MHRD. It was noticed in audit that the progress reports were sent to the MHRD only on five occasions since 2007-08 in November 2009, February 2010, September 2010, October 2011 and January 2013. The Department stated (August 2013) that the QPRs would henceforth be sent to the MHRD on regular basis.
Non-compliance of Departmental instructions
The Principal Secretary (School Education) to the Government of Tripura instructed (November 2011) the officers posted in the Directorate of School Education to inspect the schools while they were on official tour in the field and also to get the schools inspected by the four inspection teams constituted with the senior officers of the Department. He further directed the DSE to evaluate the performance on the basis of reports submitted by the officers of the Directorate and the visiting inspection teams constituted in this regard. The copies of the inspection reports should also be forwarded to the Director, SCERT.
The DSE did not furnish the inspection reports though called for (June 2013) and the Director, SCERT informed (July 2013) that no inspection report had been received from the DSE.
1.3.1.9 Evaluation of the scheme
The guidelines of the scheme provided that the Department would explore the possibility of getting the scheme evaluated through an independent agency. While sanctioning computer education plan for 400 schools, the MHRD directed that the programme was required to be consolidated and monitored through independent agencies like Indian Institutes of Information Technology, Indian Institutes of Technology, Indian Institutes of Management and Engineering Colleges etc.
Audit observed that on the request of the SCERT (May 2010 and January 2011), the National Institute of Technology, Agartala, conducted an evaluation study and submitted (February 2012) the evaluation report for only 37 schools (11 per cent of

Chapter I: Social Sector
Audit Report for the year 2012-13, Government of Tripura
12
350 schools) wherein shortcomings like deficiency in teacher training, non-supply of modem, non-working of computers and other accessories were reported.
It was noticed in audit that the Department did not take any follow up action on the above issues till July 2013.
The Department stated (August 2013) that the evaluation reports submitted by the NIT would be examined and effective corrective action would be taken thereon.
1.3.1.10 Conclusion
The ICT scheme implemented at the cost of ` 21.90 crore (till March 2013) was plagued by inordinate delay leading to non-achievement of targets, non-fulfilment of objectives, inadequate utilisation of ICT for school teachers, lack of monitoring, non-follow up action on the report of NIT and above all failure to ensure capacity building by arranging all-important training for the school teachers and as a result, the Department had failed to continue the computer education programme after the agreement period. Thus, the achievement of objectives of computer education to students and training to teachers using information and computer technology did not yield the results as envisaged in the scheme.
1.3.1.11 Recommendations
The Government may consider implementation of the following recommendations:
formulate a clearly defined action plan for computer training to teachers and inclusion of computer education in the syllabus to ensure continuation of the computer education in all the schools in the future;
An effective system may be devised for evaluation of the computer skills acquired by the students; and
strengthen the monitoring mechanism through the State Level Committee as well as field inspections by the departmental officers.

Chapter I: Social Sector
Audit Report for the year 2012-13, Government of Tripura 13
RURAL DEVELOPMENT DEPARTMENT
1.4 Wasteful expenditure
Failure in planning by the Department led to non-completion of nine staff quarters in Mungiakami RD Block even after five years from the scheduled date of completion and the expenditure of ` 61.69 lakh incurred on them had become wasteful. Moreover, further deterioration of the materials due to prolonged suspension of work would require additional cost for completing the work.
Under the State Plan for major works in 2008-09, the Rural Development Department placed (July 2008) ` 30 lakh with the District Magistrate & Collector, West Tripura for construction of nine8 staff quarters during 2008-09 under Mungiakami RD Block against the tentative requirement (May 2008) of funds of ` 79 lakh. The District Magistrate & Collector in turn placed (August 2008) the amount with the Block Development Officer (BDO), Mungiakami RD Block. Subsequently, the Department placed ` 35 lakh9 under State Plan for maintenance and minor works during 2009-10.
Scrutiny (March 2013) of records of the BDO revealed that the works were taken up departmentally through three implementing officers (IOs)10. As per the work order issued (September 2008) to the IOs the revised estimated cost of nine staff quarters was ` 93.22 lakh 11 and the works were to be completed within 90 days i.e. by December 2008. No Measurement Book (MB) relating to the works was maintained and as such the actual date(s) of commencement of the works and their chronological progress were not available. However, it was seen that out of advance of ` 63.01 lakh given to the IOs during August 2008 to March 2010, ` 61.69 lakh12 was spent on the works upto March 2010. But none of the works was completed even after a lapse of more than five years from the scheduled date of completion and all the works remained suspended midway13 for want of funds.
Scrutiny further revealed that due to slow progress of the works, the estimated cost of the quarters was being revised from time to time from ` 93.22 lakh in August 2008 to ` 1.10 crore in August 2011 as detailed below:
8 Four Type-II (one double storied); four Type III (one double storied) and one Type IV (one single storied) 9 ` 30 lakh in February 2010 and ` 5 lakh in March 2010. 10 Two Junior Engineers (JEs) and one Village Secretary (VS) 11 Type-II: ` 26.27 lakh; Type III: ` 56.01 lakh and Type IV: ` 10.94 lakh 12 Type II: ` 13.74 lakh; Type III: ` 37.43 lakh and Type IV: ` 10.52 lakh 13 Type II: after casting of first floor and raising brick wall upto window level; Type III: after completion of roof casting of 2nd floor; and Type IV: leaving the finishing works, such as fitting & fixing of doors and windows, electrification, water connection, toilet, etc.

Chapter I: Social Sector
Audit Report for the year 2012-13, Government of Tripura
14
Table 1.4.1 (` in lakh)
Estimated cost Type II Type III Type IV TotalEstimated cost (August 2008) 26.27 56.01 10.94 93.22Revised Estimated cost in February 2009 26.27 60.06 10.94 97.27Revised Estimated cost in June 2009 27.04 60.06 10.94 98.04Revised Estimated cost in January 2011 27.04 60.06 16.11 103.21Revised Estimated cost in August 2011 27.04 66.40 16.11 109.55
The BDO requested (November 2011) the DM & Collector, West Tripura for placing funds of ` 44.56 lakh to complete the works but no funds were placed till September 2013.
During a joint inspection (September 2013) of the construction site, it was noticed that miscreants had cut down and taken off the iron rods from Type II and Type III quarters and some portions of the buildings were in dilapidated condition and bushes had grown up inside the buildings.
Thus, failure in planning by the Department led to non-completion of nine staff quarters even after five years from the scheduled date of completion and the expenditure of ` 61.69 lakh incurred on them had become wasteful. Moreover, further deterioration of the materials due to prolonged suspension of work would require additional cost for completing the work.
The matter was reported to the Government in October 2013; reply had not been received (January 2014).
1.5 Doubtful execution of works
The actual procurement and plantations of saplings at a cost of ` 45.91 lakh under MGNREGA scheme in seven ADC villages in Jampui Hill RD Block was doubtful as there were no pre-plantation works, post-plantation works and supporting documentation. Para (iv) of Schedule 1 of MGNREGA guidelines permits work on individual land for providing irrigation facility to land owned by households belonging to the Scheduled Castes and Scheduled Tribes or to land of beneficiaries of land reforms or that of the beneficiaries under the Indira Awaas Yojana of the Government of India. This was amended (March 2007) to include horticulture plantation, irrigation and land development. MGNREGA thus, provides an opportunity for the above households to take up inter alia horticulture plantation on their land to enhance agricultural productivity and generate steady income.
After approval of the works of individual households and inclusion in the Annual Action Plan, the concerned Junior Engineer/Technical Assistant with the help of concerned department would carry out the required survey and would prepare project with design and estimates. Before planting, certain preliminary works like collection of soil sample and testing, earth work for excavation of pits, ditch-cum-bund and compost pits, pit filling with mixture of soil, manure, fertilizer were to be undertaken. Besides, administrative/financial/technical sanction would be issued by the competent

Chapter I: Social Sector
Audit Report for the year 2012-13, Government of Tripura 15
authority as prescribed by the State Government and procurement of materials would be done by Project Implementing Agency (PIA) following the financial norms and utmost care should be taken for ensuring transparency in procurement of materials. As per MGNREGA scheme guidelines, the planting materials shall be procured from the Government nurseries and nurseries raised under MGNREGA in the month of June-July. In such cases where these are not available with them, the line department can procure as per their financial rules.
Test-check of records (January 2013) of the Block Development Officer (BDO), Jampui Hill RD Block revealed that work orders were issued (August 2009) to seven Rural Programme Secretaries (RPSs) for execution of plantation14 works during 2009-10 at seven villages under the Autonomous District Council. The planting materials (except rubber stump) were procured at a cost of ` 45.91 lakh from different private agencies and individuals during 2009-10.
Scrutiny revealed that the decision for execution of the works and procurement of planting materials was taken by the Chairman of the Block Advisory Committee and the Block Development Officer on 22 August 2009 whereas the supply orders were issued15 to different private agencies before the date of the decision. The planting materials were shown as procured from different private agencies/individuals which was in contravention of the guidelines. Moreover, no tenders/quotations were invited for procurement of the saplings from the agencies/individuals. The materials procured from individuals (without any supply orders) were received by the Chairman, Vice-chairman and Members etc. of the Village Committees. No stock and issue register was found to be maintained and hence actual quantity of materials received and issued to the beneficiaries could not be ascertained. No expenditure was incurred on labour wages and on earth works for excavation of pits, pit filling with mixture of soil, manure, fertilizer, etc. No action was also found to have been taken by the Block authorities after distribution of the planting materials for inter culture operations viz. hoeing & weeding, watering and application of fertilizer & pesticides and no expenditure was incurred for the purpose.
Thus, the actual procurement and plantations at a cost of ` 45.91 lakh remained doubtful as there were no pre-plantation works, post-plantation works and supporting documentation.
The BDO stated (July 2013) that the planting materials (saplings) were distributed to the beneficiaries but remained silent on other issues. The reply was not tenable as the date(s) of distribution and details of land of the beneficiaries (Dag No., Khatian No., Plot No. etc.) were not indicated. Moreover, mere distribution of saplings was in contravention with the MGNREGA guidelines.
The matter was reported to the Government in September 2013; reply had not been received (January 2014).
14 Plantation of Areca nut, Orange, Sweta Chandan, Musambi, Elachi-lemon, Coffee, and Rubber stump 15 On 27 July 2009, 28 July 2009, 30 July 2009, 7 August 2009 and 10 August 2009
Audit Report for the year 2012-13, Government of Tripura
17
CHAPTER II: ECONOMIC SECTOR
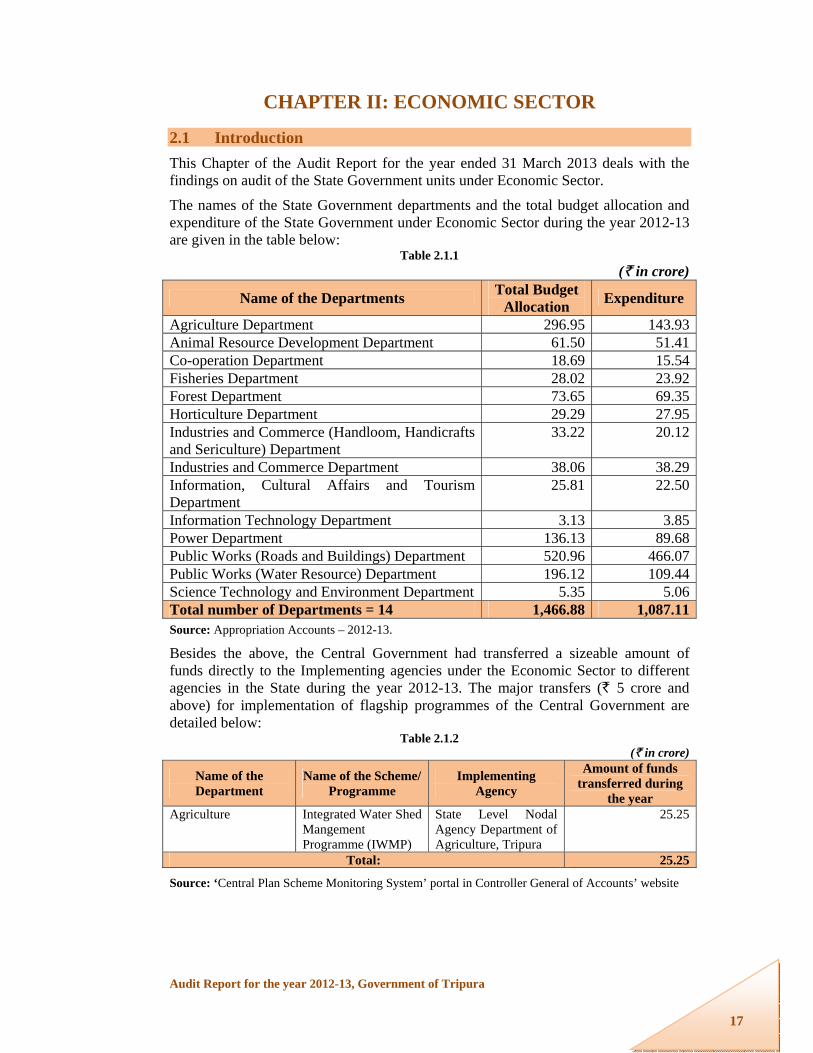
2.1 Introduction This Chapter of the Audit Report for the year ended 31 March 2013 deals with the findings on audit of the State Government units under Economic Sector.
The names of the State Government departments and the total budget allocation and expenditure of the State Government under Economic Sector during the year 2012-13 are given in the table below:
Table 2.1.1 (` in crore)
Name of the Departments Total Budget Allocation Expenditure
Agriculture Department 296.95 143.93Animal Resource Development Department 61.50 51.41Co-operation Department 18.69 15.54Fisheries Department 28.02 23.92Forest Department 73.65 69.35Horticulture Department 29.29 27.95Industries and Commerce (Handloom, Handicrafts and Sericulture) Department
33.22 20.12
Industries and Commerce Department 38.06 38.29Information, Cultural Affairs and Tourism Department
25.81 22.50
Information Technology Department 3.13 3.85Power Department 136.13 89.68Public Works (Roads and Buildings) Department 520.96 466.07Public Works (Water Resource) Department 196.12 109.44Science Technology and Environment Department 5.35 5.06Total number of Departments = 14 1,466.88 1,087.11Source: Appropriation Accounts – 2012-13.
Besides the above, the Central Government had transferred a sizeable amount of funds directly to the Implementing agencies under the Economic Sector to different agencies in the State during the year 2012-13. The major transfers (` 5 crore and above) for implementation of flagship programmes of the Central Government are detailed below:
Table 2.1.2 (` in crore)
Name of the Department
Name of the Scheme/ Programme
Implementing Agency
Amount of funds transferred during
the year Agriculture Integrated Water Shed
Mangement Programme (IWMP)
State Level Nodal Agency Department of Agriculture, Tripura
25.25
Total: 25.25
Source: ‘Central Plan Scheme Monitoring System’ portal in Controller General of Accounts’ website

Chapter II: Economic Sector
Audit Report for the year 2012-13, Government of Tripura
1818
2.2 Planning and conduct of Audit Audit process starts with the assessment of risks faced by various departments of Government based on expenditure incurred, criticality/complexity of activities, level of delegated financial powers, assessment of overall internal controls, etc.
The audits were conducted during 2012-13 involving test-check of an expenditure of ` 444.93 crore (including expenditure pertaining to the previous years audited during the year) of the State Government under Economic Sector. This Sector contains two Performance Audits on “Rashtriya Krishi Vikash Yojana (RKVY)” and “Roads and Bridges Projects funded by NLCPR and NEC” and five Compliance Audit paragraphs.
After completion of audit of each unit, Inspection Reports containing audit findings are issued to the heads of the departments. The departments are requested to furnish replies to the audit findings within one month of receipt of the Inspection Reports. Whenever replies are received, audit findings are either settled or further action for compliance is advised. The important audit observations arising out of those Inspection Reports are processed for inclusion in the Audit Reports, which are submitted to the Governor of the State under Article 151 of the Constitution of India for being laid in the State Legislature.
The major observations detected in audit during the year 2012-13 are as detailed in the succeeding paragraphs:

Chapter II: Economic Sector
Audit Report for the year 2012-13, Government of Tripura
19
AGRICULTURE DEPARTMENT
2.3 Performance Audit Report on “Rashtriya Krishi Vikas Yojana (RKVY)”
The Rashtriya Krishi Vikas Yojana (RKVY) was launched by Government of India (GOI) as a State Plan Scheme during the year 2007-08 with the objective, inter alia, of stimulating agriculture and allied sectors so that the State could achieve four per cent growth during the XIth plan period. The scheme is fully funded by the GOI and being implemented in the State by Agriculture Department (nodal department) and other departments like Horticulture and Soil Conservation, Animal Resources Development Department, etc. The Performance Audit of the scheme for the period from 2007-08 to 2012-13 was conducted in the nodal department as well as the implementing departments. The audit focus was on assessing the achievements of intended objectives of the projects taken up under the scheme. The Performance Audit of RKVY brought out the following main points
Highlights: The Department did not prepare Comprehensive State Agricultural Plan in time. The District Agricultural Plans were prepared during 2008-09. However, the bottom-up approach was not followed as Panchayat level Agricultural Planning Units were not involved in planning.
(Paragraph 2.3.9.1)
There was short release of 18.85 crore by the GOI against total allocation of funds approved by it. There was delay in release of funds at all levels from the State Government to the nodal department and the implementing agencies.
{Paragraphs 2.3.9.2(i) and 2.3.9.2(ii)}
There were deficiencies in the implementation of the projects like delayed execution, non-utilisation of completed projects, diversion of assets for other purposes, etc. Six out of 28 projects were completed with delays ranging from 22 to 51 months. Effective steps were not taken to ensure the timely completion and utilisation of the projects.
(Paragraph 2.3.10)
No criteria were prescribed or adopted while selecting the beneficiaries for the projects. In the absence of any laid down criteria, audit could not ascertain whether the selection of beneficiaries were transparent. There was no mechanism to assess the benefit in terms of economic development of the targeted beneficiaries and no impact assessment was done.
(Paragraphs 2.3.10.1 to 2.3.10.7)

Chapter II: Economic Sector
Audit Report for the year 2012-13, Government of Tripura
2020
Monitoring and Internal control mechanism was weak. Neither the nodal department nor the State Level Sanctioning Committee (SLSC) constituted for project sanctioning, monitoring and evaluation ever reviewed or monitored the progress and implementation of the projects. The SLSC did not meet regularly and whenever it met, that was only for approval of the project proposals.
(Paragraphs 2.3.12.1 and 2.3.12.2)
2.3.1 Introduction The Planning Commission in its approach paper to the XIth Five Year Plan expressed concern for the Agriculture sector which had witnessed a sharp decline in growth after the mid-1990s despite the fact that the potential for the growth of agriculture was high. A major cause behind the slow growth in agriculture was the consistent decrease in investments in the sector by the State Governments. Concerned by the slow growth in the Agriculture and allied sectors, the National Development Council (NDC), in its meeting (May 2007) resolved that a Special Additional Central Assistance Scheme, namely, Rashtriya Krishi Vikas Yojana (RKVY) be launched with the aim of achieving 4 per cent annual growth in the agricultural sector during the XIth Plan period, by ensuring holistic development of Agriculture and allied sectors. Accordingly, the RKVY was launched as a State Plan Scheme during 2007-08.
2.3.2 Objectives of the Scheme The main objectives of the scheme are:
To incentivise States so as to increase public investment in agriculture and allied sectors;
To provide flexibility and autonomy to States in the process of planning and executing Agriculture and allied sector schemes;
To ensure preparation of Agriculture Plans for districts and States based on agro-climatic conditions, availability of technology and natural resources;
To achieve the goal of reducing yield gaps in important crops through focussed interventions;
To maximise returns to farmers in Agriculture and allied sectors; To ensure that local needs/crops/priorities are better reflected in agricultural
plans of States; and To bring about quantifiable changes in production and productivity of various
components of Agriculture and allied sectors by addressing them in a holistic manner.
2.3.3 Organisational set up The State Agriculture Department was the nodal department for the implementation of the scheme. Further, a State Level Sanctioning Committee (SLSC) was constituted (November 2007) for sanctioning of the projects at the State level and for reviewing and monitoring the implementation of the scheme and to ensure that the projects were implemented in accordance with the guidelines laid down by the Central Government. After the projects were approved by the SLSC, the implementing departments

Chapter II: Economic Sector
Audit Report for the year 2012-13, Government of Tripura
21
(Agriculture, Horticulture, Fisheries and Animal Resources Development Department), Tripura Tribal Areas Autonomous District Council (TTAADC) and Krishi Vikas Kendra (KVK) implemented them through their district level and sub-divisional level officers.
2.3.4 Financing Pattern As per RKVY guidelines, each State will become eligible to receive RKVY funds, if the base line1 share of Agriculture and allied sectors in its total State Plan (excluding RKVY funds) expenditure is maintained and District Agriculture Plans and State Agriculture Plans have been formulated.
Funds under the Scheme are provided to States as 100 per cent grant by Central Government. RKVY funds are available to the States in two distinct streams2. Under RKVY, 75 per cent funds are released under Stream-I for 17 specific components (Appendix 2.1) highlighted by the Department of Agriculture and Cooperation (DAC) and the balance 25 per cent funds under Stream-II for existing schemes of the State Governments. Depending upon the State’s needs, a State may choose to use its entire allocated RKVY funds under the Stream-I only. However, the reverse is not permissible if a State cannot choose to lower its Stream-I allocation below 75 per cent.
2.3.5 Audit Objectives The main objectives of this performance audit were to assess whether:
Planning process of the implementation of scheme was effective and according to the RKVY guidelines;
Financial management ensured adequate and timely availability of funds and their effective and economic utilisation;
Projects were implemented according to the regulatory structure in place and the intended objectives of the projects were achieved and nodal department effectively coordinated with various departments and implementing agencies for implementing various projects;
Internal control mechanisms were put in place to ensure efficient and effective monitoring and control over implementation; monitoring mechanism at each level was adequate; and
The objectives of maximising returns to the farmers in Agriculture and allied sectors were achieved and the State could achieve four per cent growth in the Agricultural sector during the XIth Plan period.
2.3.6 Audit Criteria The following sources of audit criteria were adopted for the Performance Audit:
1 Base line would be a moving average and the average of the previous three years expenditure would be taken into account for determining the eligibility under the RKVY after excluding the funds already received. 2 Stream-I and Stream-II

Chapter II: Economic Sector
Audit Report for the year 2012-13, Government of Tripura
2222
Guidelines for Rashtriya Krishi Vikas Yojana (RKVY) of Department of Agriculture & Cooperation, Ministry of Agriculture.
Comprehensive State Agricultural Plan. Guidelines for projects under implementation. Instructions/guidelines issued at State/District level for implementation of
RKVY. State general financial and accounts rules.
2.3.7 Scope of Audit The performance audit was carried out between May and September 2013 covering the period from 2007-08 to 2012-13 and involved scrutiny of records and other evidence in the offices of the State Agriculture (Nodal) Department including directorates of Animal Resources Development Department (ARDD), Fisheries Department, Horticulture & Soil Conservation Department, Executive Engineer (Mechanical), Agriculture Department and Chief Executive Officer (CEO), Tripura Tribal Areas Autonomous District Council (TTAADC) at State level, 16 offices3 at district level, 26 offices4 at sub divisional level. Eight sectors detailed below were selected by using Simple Random Sampling. The SLSC approved 148 projects covering 17 sectors (Appendix 2.1), of which 12 projects were dropped and 136 projects were taken-up for implementation under Stream-I during 2007-13. Out of 136 projects, 28 projects covering eight sectors as detailed in Table No. 2.3.1 below were selected for test-check by using Probability Proportional to Size With Replacement (PPSWR) method and 4 randomly selected projects of Stream-II were covered in the Performance Audit.
Table No. 2.3.1 (` in crore)
Name of Sector Total Projects Projects selected Nos. Project cost Nos. Project cost
Stream-I Animal Husbandry 32 29.30 6 11.38Horticulture 28 21.13 6 7.54Micro Irrigation 6 14.40 2 9.07Marketing 6 12.47 2 8.06Fisheries 23 8.67 5 3.38Agriculture Mechanisations
6 7.48 2 5.12
Crop Development 17 87.43 4 69.31Non-Farming Activity 1 0.16 1 0.16Sub Total 119 181.04 28 114.02Stream-II 36 37.05 4 17.13
3 Dy. Director of Agriculture of Dhalai, North, South and West districts, Dy. Director of ARDD of Dhalai, North, South, and West districts, Dy. Director of Horticulture, West, Executive Engineer (Agirulcure) of North, South and West districts and ZDO, Dhalai, North, South and West., KVK, BC Manu. 4 Agriculture Department: Supdt. of Agriculture, Bishalgarh, Melaghar, Matabari, Rajnagar, Amarpur, Salema, Kadamtala, Panisagar and Kumarghat; H&SC Department: Supdt. of H&SC, Bishalgarh, Sonamura, Udaipur, Manu, and Kumarghat; Fisheries Department: Supdt. of Fisheries, Sadar, Santirbazar, Amarpur, Kailashahar and Dharmanagar ARDD: AD(BL), Bishargarh, Sonamura, Belonia, Sabroom, Salema and Kumarghat

Chapter II: Economic Sector
Audit Report for the year 2012-13, Government of Tripura
23
2.3.8 Audit Methodology
The Entry conference was held with the Additional Chief Secretary, Agriculture Department in May 2013 wherein the audit objectives, audit criteria and methodology were discussed. Joint physical Verification of projects at 51 locations pertaining to 32 selected projects and joint survey including interview of 415 beneficiaries of the projects were also carried out in audit for doing an impact assessment of the Scheme. The audit findings and recommendations were discussed in the exit conference held with the Principal Secretary, Agriculture Department on 31 December 2013. The audit findings are mentioned in the succeeding paragraphs:
2.3.9 Audit findings
2.3.9.1 Planning Process
Audit Objective 1: Whether planning process of the implementation of scheme was effective and according to the RKVY guidelines
(i) District Agricultural Plans and Comprehensive State Agriculture Plan
The bottom-up approach was not followed as the draft proposals of District Agricultural Plans (DAPs) were not prepared at Panchayat level Agriculture Planning Units as envisaged in the guidelines. Rather, the DAPs were prepared by the District Planning Committee constituted in each district.
The DAC, GOI engaged (January 2008) National Institute of Rural Development (NIRD) for effective monitoring and evaluation of RKVY. As seen from the RKVY website, the NIRD scrutinised the Comprehensive State Agriculture Plan (C-SAP) of the States and pointed out deficiencies noticed in the XIth Five-Year Plan’s C-SAP and made recommendations in their evaluation study reports so that the states could improve their next State Agriculture Plan by incorporating the recommendations suggested by the NIRD. However, in respect of Tripura, the preparation of C-SAP was delayed and sent to the DAC in February 2011 as reported by the nodal department. The evaluation report of NIRD in respect of C-SAP of Tripura was not available either with the Nodal Department or in the RKVY website.
Hence, due to non-preparation of C-SAP in time and non-availability of NIRD evaluation report the State Government was deprived of any opportunity to carry out improvements in the planning process of the C-SAP for XIIth Five Year Plan.
The Government while agreeing with the audit observations assured (December 2013) to comply with the requirement during preparation of DAPs for XIIth Five Year Plan.

Chapter II: Economic Sector
Audit Report for the year 2012-13, Government of Tripura
2424
2.3.9.2 Financial management
Audit Objective 2: Whether financial management ensured adequate and timely availability of funds and their effective and economic utilisation
(i) Receipts of grants and expenditure incurred The details of funds released by DAC, GOI and expenditure incurred by the State Government during the years from 2007-08 to 2012-13 under RKVY are given in the table below:
Table No. 2.3.2 (` in crore)
Year Funds allotted
Project cost of
Stream-I
Funds released by DAC, GOI Expenditure incurred Stream- I Stream
-II Sub
scheme Total Stream-I Stream
-II Sub
scheme Total Balance
2007-08 4.69 4.40 2.84 1.32 0 4.16 0 0.20 0 0.20 3.962008-09 34.02 28.69 12.25 3.83 0 16.08 15.37 3.83 0 19.20 0.842009-10 31.28 31.64 23.46 7.82 0 31.28 14.80 0 0 14.80 17.322010-11 116.86 111.37 87.26 29.22 0 116.48 63.08 29.22 0 92.30 41.502011-12 25.63 18.51 18.51 3.62 3.50 25.63 57.96 3.62 3.50 65.08 2.052012-13 56.43 43.58 32.47 10.82 13.14 56.43 39.60 0.18 6.57 46.35 12.13
Total 268.91 238.19 176.79 56.63 16.64 250.06 190.81 37.05 10.07 237.93 12.13Note: Total expenditure incurred was as per reconciliation done by the Agriculture (Nodal) department with Accountant General
(Accounts &Entitlement), Tripura
The DAC, GOI released ` 250.06 crore during 2007-13 against allocation of ` 268.91 crore. Out of ` 250.06, ` 176.79 crore was under Stream-I against approved project cost of ` 238.19 crore, and ` 56.63 crore was under Stream-II and ` 16.64 crore was under Sub scheme. Thus, there was a difference of ` 61.40 crore between approved project cost and funds received under Stream-I. Out of ` 56.63 crore received under Stream-II, ` 19.58 crore was utilised for implementation of projects under Stream-I which was allowed under scheme guidelines and balance of ` 37.05 crore was utilised for Stream-II projects. During 2007-13, ` 237.93 crore was utilised by the State Government leaving unspent balance of ` 12.13 crore.
(ii) Delay in receipt of funds at various levels There had been significant delays in release of funds by the State Finance and nodal department. Six to nine months delay had been made by the State Finance Department on 6 occasions. In the case of Stream-II funds for the year 2008-09, the State Finance Department released in August 2010 against funds released by the DAC in June 2008. Further, on four occasions, 6 to 10 months delay had been made by the nodal department to release funds to Implementing departments. The details of funds received from GOI and subsequent releases made by the State Finance and nodal department are given in Appendix 2.2. While accepting the facts the Government (December 2013) stated that such delays would be avoided in future.

Chapter II: Economic Sector
Audit Report for the year 2012-13, Government of Tripura
25
(iii) Submission of Utilisation Certificates
Year wise funds received, Utilisation Certificates submitted to DAC and amount lying with DDOs are given in the table below:
Table No. 2.3.3 (` in crore)
Year Funds
released by GOI
Funds released by State nodal
departmentto DDOs
UC submitted
to GOI
Date of submission of
UC to GOI
Unspent amount lying with DDOs
(June 2013) 2007-08 4.16 0.20 4.16 24-11-10 2008-09 16.08 19.20 16.08 24-11-10 2009-10 31.28 14.80 31.28 21-09-11 2010-11 116.48 92.30 116.48 20-01-12 2.022011-12 25.63 65.08 25.63 07-11-12 1.962012-13 56.43 48.60 20.44 15-03-13
Total 250.06 240.18 214.07 3.982013-14 33.22 18-9-13
The above table shows that:
Submission of UCs by the nodal department to the GOI had been regularly delayed.
Though the nodal department submitted UCs for the entire funds received during 2007-12, an amount of ` 3.98 crore had been lying unspent (July 2013) with 5 (five) DDOs as detailed in Appendix 2.3 against funds drawn during the years 2010-11 and 2011-12.
Thus, the Utilisation Certificates sent to the GOI for the years 2010-11 and 2011-12 were incorrect.
The Government stated (December 2013) that UCs were submitted to GoI for entire funds of previous year to get release of funds for the succeeding year.
(iv) Unadjusted amount with Implementing Officers
Scrutiny of records revealed that unadjusted amount of ` 0.61 crore was lying with 34 implementing officers since 2010-11 and 2011-12 as detailed in Appendix 2.4. But no action had been taken by the implementing departments against the IOs for non-submission of the adjustment vouchers.
The Government stated (December 2013) that immediate steps would be taken to obtain the adjustments from the implementing officers.

Chapter II: Economic Sector
Audit Report for the year 2012-13, Government of Tripura
2626
2.3.10 Implementation of Projects
Audit Objective 3: Whether projects were implemented according to the regulatory structure in place and the intended objectives of the projects were achieved and nodal department effectively coordinated with various departments and implementing agencies for implementing various projects.
2.3.10.1 Animal Husbandry For Animal Husbandry sector 36 projects under Stream-I were sanctioned by SLSC during the period from 2007-08 to 2012-13. 32 projects were taken up and 4 projects got dropped due to short release of funds by the GOI. The projects were implemented by four agencies: ARDD-20, TTAADC-7, Tripura Cooperative Milk Production Union Ltd.(TCMPUL)-3, Krishi Vigyan Kendra-2. As of June 2013, out of 32 projects (approved project cost ` 30.18 crore), 23 projects were completed at a cost of ` 19.81 crore while 9 projects were on going. Six projects were selected for detailed audit scrutiny. Audit findings in respect of four of these projects are detailed in Appendix 2.5.
It could be seen from the Appendix that in three out of the six selected projects there were delays in execution of the projects. Besides, the selection of beneficiaries under the projects was also not transparent and bias could not be ruled out.
Joint physical verification of 50 units (beneficiaries) implemented by eight offices5 of four districts revealed that in five cases the beneficiaries had no pigs, in two cases only one pig and in three cases two pigs as against distribution of five pigs to each beneficiary. About 10 per cent (out of 50) of the verified units were found closed.
Further, Joint physical verification of 40 units (beneficiaries) implemented by eight offices6 of four districts further revealed that in two cases the beneficiaries had no goat, in two cases only two goats were found against the total allocation of one male and five female goats provided to each unit. About 5 per cent (out of 40) of the verified units were found closed.
2.3.10.2 Horticulture For Horticulture sector, the SLCC sanctioned 30 projects during the period 2007-08 to 2012-13. Out of 30 projects, 28 projects had been taken up and two projects had been dropped due to short release of funds by the GOI. The projects were to be implemented by Horticulture Department (21), TTAADC (6) and KVK (1). As of June 2013, out of 28 projects (approved project cost ` 21.13 crore), 26 projects had been completed at a cost of ` 19.33 crore while two other projects were in progress. Besides, the selection of beneficiaries under the projects was also not transparent and
5 Dy. Director of ARDD ( North and Dhalai), Asstt. Director of ARDD (Bishalgarh, Sonamura, Belonia, Sabroom, Salema and Kumarghat), 6 Dy. Director of ARDD ( North and Dhalai), Asstt. Director of ARDD (Bishalgarh, Sonamura, Belonia, Sabroom, Salema and Kumarghat),

Chapter II: Economic Sector
Audit Report for the year 2012-13, Government of Tripura
27
bias could not be ruled out. Audit findings in respect of five selected projects are detailed in the Appendix 2.6.
It was noticed from the Appendix that out of total five projects, there was delay in completion of one project for over two years and in respect of four projects no study was carried out to assess the impact of the scheme, particularly the assessment of the increase in productivity/yield and income enhancement of the targeted beneficiaries was done. Therefore, the achievement of the objectives of the project remained un-assessed. However, during joint physical verification involving 145 beneficiaries, all the beneficiaries stated that they had been benefited from the projects.
2.3.10.3 Micro Irrigation Under Agriculture (Micro irrigation) sector, 7 projects had been sanctioned by SLSC during the period from 2007-08 to 2012-13. Out of 7 projects, one had been dropped due to short release of funds by the DAC, GOI. Three projects had been implemented by the Agriculture Department through their Engineering Wing and three projects were undertaken by the TTAADC. The projects were mainly for installation of Mini Deep Tube Wells (MDTWs) at the farmers’ land to provide irrigation facilities to the farmers. As of June 2013, out of 6 projects (approved project cost ` 14.40 crore), 5 projects had been completed at a cost of ` 6.93 crore while one project was in progress (utilisation ` 6.51 crore against project cost of ` 7.47 crore).
The project ‘Installation of 80 Small bore tube well with submersible pump’ had been completed in August 2011 and the funds released by the nodal department had been fully utilised. During physical verification of projects involving 10 beneficiaries, it was noticed that the MDTWs were working and the beneficiaries also reported that they were getting irrigation facilities from them.
2.3.10.4 Marketing and post harvest management
With the objective of providing better marketing facilities to the farmers, Agriculture Department, Government of Tripura had proposed seven projects at an estimated cost of ` 17.47 crore. All the projects were approved by the SLSC and DAC, GOI. However, one project (estimated cost ` 5 crore) proposed during 2008-09 had been dropped due to short receipt of funds from DAC, GOI. Two projects Infrastructure Development in Agricultural Markets and Development of village markets were selected for test-check. Under one project development of one Wholesale Assembling Market and 5 Primary Rural Markets were taken up during the period from 2007-08 to 2012-13 at an estimated cost of ` 3.39 crore. Out of six markets, five were completed while one was in progress (June 2013).
Further, development of 5 village markets proposed at an estimated cost of ` 4.67 crores were completed with delays ranging from 10 to 24 months. Except Killa and Barpathari other markets were either not used or partially used.

Chapter II: Economic Sector
Audit Report for the year 2012-13, Government of Tripura
2828
The observations relating to deficiencies in implementation of marketing and post harvest management are detailed in Appendix 2.7. It can be seen from the Appendix that there were delays in construction of wholesale and rural markets and even where the construction of the markets had been completed, they had not been put to use.
During joint physical verification of Construction of Wholesale Assembling market at Bishramganj, it was noticed that none of the items like Covered Market shed, Wholesale and Retail Shop, Veterinary Dispensary etc., though completed and in usable condition had not been put to use. As a result, the targeted beneficiaries were deprived of getting those facilities.
The construction works of five primary rural markets had been completed at a cost of ` 1.09 crore. Though all the markets were completed only three (Moharchhara, Bairagi bazaar and Debdaru) had been put to use. Out of the remaining two markets, one market at Durga Chowmuhani had been completed recently (August 2013), but another one at Anandabazar was lying unutilised since September 2012. No action had been taken by the implementing department to put the markets to use. As a result, the targeted beneficiaries were deprived of getting the facilities.
Scrutiny of records and physical visit revealed that the rural market at Killa was completed in time and was put to use. Four other markets were completed with delays ranging from 10 to 21 months. The market at Ambassa completed in June 2013 and Barpathari completed in March 2013 was put to use, K.K.Nagar completed in March 2012 had been partially used mainly due to absence of power supply connection and Noagaon completed in December 2012 was not used till the date of Audit (June 2013).
In the exit conference, the Principal Secretary assured that steps would be taken to put the markets to use at the earliest.
2.3.10.5 Agriculture Mechanisation sector With the objective of providing better marketing facilities to the farmers, Agriculture Department, Government of Tripura had proposed six projects under Agriculture Mechanisation sector at an estimated cost of ` 7.48 crore for providing subsidy on procurement of power tiller, power sprayer, paddy transplanter, etc. All the projects were approved by the SLSC and DAC, GOI and their implementation had been completed.
It was noticed that there were two projects namely ‘Increasing Cropping Intensity by mechanisation through Power Tiller’ and ‘Productivity increase through subsidy on Power Sprayers’. The subsidy on Power Sprayers had been diverted for grant of subsidy on Power Tillers due to non-availability of demand for Power Sprayers. Besides, the possibility of arbitrariness and bias in recommending the beneficiaries by the PRI bodies for granting Power Tiller Subsidy could not be ruled out. Further, due to the implementation of the project without prescribing any targeted beneficiaries, impact of the implementation of project particularly in socio-economic development of beneficiaries could not be evaluated.

Chapter II: Economic Sector
Audit Report for the year 2012-13, Government of Tripura
29
2.3.10.6 Crop Development Under Crop Development sector, 18 projects had been sanctioned by SLSC during the period from 2007-08 to 2012-13. Out of 18 projects, 17 projects had been taken up and one project had been dropped due to short release of funds by the GOI. Out of 17 projects (approved project cost of ` 87.43 crore), 15 projects had been completed at a cost of ` 81.01 crore while two projects were in progress.
It was noticed that in respect of two projects viz., ‘Popularising cultivation of Paddy through System of Rice Intensification (SRI)’ and ‘Providing support for improved method of Jhum cultivation’, the impact of implementation of the projects had not been evaluated and documented. Hence, the same could not be ascertained and verified in audit.
During physical verification of projects involving 40 beneficiaries (farmers), the beneficiaries stated that they were benefited from the projects but no data regarding increase in production/productivity was available.
In the exit conference, the Principal Secretary stated that the production of rice had generally increased in the State. However, the impact of implementation would henceforth be evaluated and documented systematically.
2.3.10.7 Fisheries Under Fisheries sector 23 projects had been sanctioned by SLSC during the period from 2007-08 to 2012-13. Out of 23 projects, 17 projects had been taken up by the Fisheries Department, 5 by TTAADC and 1 by KVK. As of June 2013, out of 23 projects (approved project cost ` 8.67 crore), 19 projects had been completed at a cost of ` 7.71 crore while 4 were in progress. The details of five projects are shown in Appendix 2.8.
It could be seen from the Appendix that there were delays in implementation of the projects due to which the intended beneficiaries were deprived of the benefits of the projects. Besides, due to implementation of the projects without prescribing any targeted beneficiaries/measurable parameters, the impact of the implementation of the projects could not be evaluated.
Further, though the project ‘Hi-tech Fish culture through use of Aerator’ was to be implemented during 2012-13, no Aerator had been supplied by the firm till June 2013 and therefore, the intended beneficiaries were deprived of getting Aerator at subsidised rate.
2.3.11 Stream-II
The DAC, GOI released ` 56.63 core under Stream-II during the period 2007-13 but due to short release of funds under Stream-I, ` 19.58 crore had been diverted to Stream-I to mitigate the short release of funds under Stream-I.
It was noticed in audit that construction of cold storage at Ambassa which was scheduled to be completed in June 2011 had not been completed till September 2013

Chapter II: Economic Sector
Audit Report for the year 2012-13, Government of Tripura
3030
due to delay in approval of drawing and design and further due to slow progress of works. Moreover, no action had been taken by the implementing department against the contractor for non-completion of the project till September 2013.
2.3.12 Monitoring and supervision
Audit Objective 4: Whether internal control mechanisms were put in place to ensure efficient and effective monitoring and control over implementation; monitoring mechanism at each level was adequate.
2.3.12.1 Monitoring and evaluation by Nodal Department Scrutiny of the records of the Agriculture Department revealed that while allocating the funds to Implementing Agencies, project specific allotment were not being made by the nodal department. The project wise compilation of physical and financial progress reports received from time to time from the district/sub-divisional level offices had not been done either by the nodal department or the implementing department. Further, scrutiny revealed that the monthly progress reports of physical and financial status were also not being submitted regularly by the implementing department/agencies to nodal department. The nodal department had neither undertaken any evaluation studies nor engaged any third party for evaluation of the implementation of the projects.
Audit noticed following further shortcomings in monitoring/control:
(i). The nodal department was to ensure that project wise accounts were maintained by the implementing department/organisation but the same were not maintained by the Animal Resources Development, Horticulture and Fisheries Departments and even by the Agriculture Department itself for its own projects. However on being called for in audit, a statement of physical and financial status of the projects had been furnished by them.
(ii). The details of assets created at District/State level under RKVY as required to be maintained by the nodal/implementing departments were not being done by Agriculture, Horticulture, Fisheries and Animal Resources Development departments.
(iii). As per the amended RKVY guidelines (July 2008), a Committee was to be constituted under the chairmanship of the Agriculture Production Commissioner to review the implementation of RKVY on a monthly basis and submit reports to the SLSC. In Tripura, there was no Agriculture Production Commissioner. However, a Committee was constituted after a lapse of over three years in August 2011 under the Chairmanship of Joint Director (Planning), Directorate of Agriculture. The Committee had to meet at least once a month to look after the implementation of projects and report to the Principal Secretary (Agriculture). But the Committee did not hold any meeting to review the RKVY projects and consequently did not report to the Principal Secretary (Agriculture).

Chapter II: Economic Sector
Audit Report for the year 2012-13, Government of Tripura
31
2.3.12.2 Monitoring and evaluation by SLSC As per RKVY guidelines, the SLSC was to meet at least once in a quarter. In Tripura, the SLSC was constituted in November 2007 and only 9 meetings were held by the SLSC against 21 meetings during the period from 2007-08 to 2012-13. Further, review of the minutes of meetings made available to Audit revealed that the meetings took place mainly for approval of the projects proposed by the nodal department and no monitoring/reviewing of the implementation of the project/scheme’s objectives was done. The physical and financial achievements of the projects were not monitored by the SLSC and no evaluation study had been initiated by the SLSC.
2.3.12.3 Submission of quarterly physical and financial reports to Ministry
The quarterly physical and financial progress reports as required to be submitted to the DAC, GOI had not been done by the nodal department except sending of UCs. Only project wise physical and financial progress was being uploaded by the nodal department in GOI’s RKVY website.
2.3.12.4. Implementation of Web-based management information system
As per the guidelines, the State Government had to establish effective IT based Management system. But the Government of Tripura did not establish any IT based MIS for RKVY. However, the State’s data had been regularly uploaded by the RKVY Cell created by the nodal department in RKVY website of DAC, GOI.
Though regular data entry was done in RKVY, GOI’s website, the actual expenditure and completion of projects shown in the website did not match with the documents furnished to audit. Projects on ‘Infrastructure Development in Agricultural Markets’ (Project code: TR/RKVY-MRKT/2009/076) was shown as completed and expenditure incurred for ` 3.39 crore in RKVY website though the project was not completed and unspent amount of ` 0.20 crore was lying with the implementing officer till June 2013. Similarly, in the case of project on ‘Development of Demonstration Unit on Piggery’ (Project code: TR/RKVY-ANHB/2010/049) ` 5.21 crore was shown as expenditure incurred in RKVY website but only ` 5.15 crore was spent by the implementing department for implementation of the project and ` 0.06 crore was lying with implementing officers. Further, during verification of RKVY website data with the actual records (June 2013), it was seen that there were discrepancies between the number and value of projects uploaded in the website and the projects actually sanctioned/implemented. However, on being pointed out by Audit, all the discrepancies had been rectified by the nodal department as re-verified by Audit in November 2013.
2.3.12.5 Internal Audit Internal Audit of implementation of RKVY had been conducted by the Directorate of Audit, Finance Department, Government of Tripura during August-December 2011 for the period from 2007-08 to 2010-11 only in respect of West Tripura District. The

Chapter II: Economic Sector
Audit Report for the year 2012-13, Government of Tripura
3232
Internal Audit Reports submitted (April 2012) to the nodal department had been circulated (June 2013) after a lapse of 15 months to the concerned officers for taking corrective action which had not been done (September 2013) by 23 out of 30 offices covered in audit. But no effective steps had been taken by the nodal department to get the deficiencies rectified as pointed out in the Internal Audit Report.
Thus, the internal audit was rendered ineffective first, due to non-covering of all the implementing offices and later not taking corrective action on internal audit reports.
2.3.13 Impact
Audit Objective 5: Whether the objectives of maximising returns to the farmers in Agriculture and allied sectors were achieved and the State could achieve four per cent growth in the agricultural sector during the XIth Plan period.
2.3.13.1 Impact evaluation of RKVY
No evaluation was carried out by the nodal department either itself or by engaging any third party as done in many other States to assess the impact of RKVY and to find out as to what extent the objectives of the scheme had been achieved in the State. As per the agreement with DAC, NIRD was required to design and plan to carry out external concurrent monitoring for verification of physical and financial progress as well as concurrent evaluation in the middle of XIth Plan period and at the end of XIth Plan period (two evaluations in 5 years). No records of any such concurrent monitoring and evaluation by NIRD were found in the nodal department.
The Government stated (December 2013) that the Institute for Social and Economic Change (ISEC), Bangalore had been engaged for evaluation studies of RKVY projects implemented during XIth Five Year Plan.
2.3.14 Conclusion The implementation of RKVY in Tripura produced mixed results with both the achievements and failures in equal measures. The Department did not prepare the overall State comprehensive agricultural plan in time. The District level agricultural plans were prepared without preparing the plan at Panchayat level planning units. Therefore, involvement of the Panchayats in planning process could not be ensured by the Department. There were considerable delays in release of funds at every level and the completion of the projects was delayed in many cases. No criteria for selection of beneficiaries under the scheme were prescribed. Though the beneficiaries interviewed in audit accepted availing benefits of the projects, no mechanism was in place to assess the benefits actually accruing to the beneficiaries in terms of their economic well being. The nodal department as well as SLSC did not monitor and review the progress and implementation/ achievement of the projects. The internal control mechanism was weak and the required records were not maintained. Data reliability

Chapter II: Economic Sector
Audit Report for the year 2012-13, Government of Tripura
33
was not ensured. No evaluation or impact assessment of RKVY was done by the State Government.
2.3.15 Recommendations The Department/State Government may consider implementing the following recommendations:
DAPs as well as SAP should be prepared following bottom-up approach with the active involvement of Panchayats and taking required professional assistance/support/consultation from the Standing consultant, i.e. NIRD;
The Implementing Departments/Officers should be made accountable for undue delays in completion of the projects;
Criteria should be prescribed for selection of beneficiaries and effective system should be developed to assess the outcome of projects;
Nodal department and SLSC should closely monitor the implementation of schemes through periodical progress reports and field inspections as well;
Evaluation should be carried out on priority to assess the achievements of RKVY during 2007-13 and use the inputs for future planning.

Chapter II: Economic Sector
Audit Report for the year 2012-13, Government of Tripura
3434
PUBLIC WORKS DEPARTMENT (ROADS AND BUILDINGS)
2.4 Performance Audit of Roads & Bridges Projects funded through Non-Lapsable Central Pool of Resources (NLCPR) and North Eastern Council (NEC)
Government of India (GOI) created the Non-lapsable Central Pool of Resources (NLCPR) and North Eastern Council (NEC) with the aim of speeding up the execution of infrastructure projects in the North Eastern States by increasing the flow of budgetary financing for specific viable infrastructure projects in various sectors and to reduce the critical gaps in basic minimum services. A Performance Audit of Roads and Bridges projects funded through NLCPR and NEC during 2008-13 in the State revealed that projects were taken up without adequate planning and prioritisation. Consequently, out of 24 projects approved by the GOI during 2008-09 to 2012-13 and which were scheduled to be completed by March 2013, only nine projects (38 per cent) were completed in Roads and Bridges sector as of March 2013. The State had neither carried out gap analysis nor evaluated the extent of achievement of the objective of reducing the gap between the required and available infrastructure facilities in the State and its impact on the economy and social fabric of the State.
Highlights:
Project proposals were formulated without carrying out gap analysis of infrastructure requirements and also without adopting District Infrastructure Index method.
(Paragraphs 2.4.7.1 and 2.4.7.3) Tendering process was not transparent and competitive. The works were awarded to ineligible and inexperienced contractors at unduly high rates, As a result, the Department incurred an extra expenditure of ` 23.13 crore besides commitment of extra expenditure of ` 42.53 crore.
{Paragraphs 2.4 8.5(A)(ii), 2.4.8.5(A)(iii) and 2.4.8.5(B)(i)} There were delays in release and utilisation of funds at all levels ranging upto 30 months. Further, there was short release of State share as well as diversion of funds.
(Paragraphs 2.4.9.1, 2.4.9.2 and 2.4.9.3) Execution of projects suffered due to frequent revisions in DPRs/Technical specifications, slow progress of execution, contractor’s lackadaisical approach and lack of monitoring by the divisions.
{Paragraphs 2.4.8.2, 2.4.8.3, 2.4.10.4(v) and 2.4.10.4(ix)} As of September 2013 there were 15 incomplete projects which had not been completed within the scheduled date. Only 9 out of 24 projects due for completion were actually completed with a time overrun ranging from 15 to 23 months.
(Paragraph 2.4.10.2)

Chapter II: Economic Sector
Audit Report for the year 2012-13, Government of Tripura
35
Contractors were given undue benefits in the form of payment of mobilisation advance, non-recovery of interest, non-provision for deposit of security deposit/earnest money, payment against wrong claims, irregular issue of materials and doubtful execution, etc. causing financial loss of `14.10 crore.
{Paragraphs 2.4.10.4(i), 2.4.10.4(ii), 2.4.10.4(iii) and 2.4.10.4(viii)}
Prescribed monitoring mechanism was not adequately followed. No evaluation or impact study was conducted to assess the impact of the projects in the State.
(Paragraphs 2.4.11.2 and 2.4.11.3)
2.4.1 Introduction The North Eastern part of India has essentially depended on central funding for development works. All the States in the North Eastern Region (NER) are Special Category States whose Development Plans are substantially financed by the centre. The North Eastern Council (NEC) constituted in 1971 by an Act of Parliament is the nodal agency for the economic and social development of NER which consists of eight States of Arunachal Pradesh, Assam, Manipur, Meghalaya, Mizoram, Nagaland, Sikkim and Tripura. The Government of India further created a Non Lapsable Central Pool of Resources (NLCPR) in the Union Budget from the year 1998-99 in the Public Account titled “Central Resource Pool for development of NER” for funding specific programmes for economic and social upliftment of North Eastern States. The funds were meant mainly for ensuring speedy development of Roads and Bridges in NER and also to support development of the physical and social infrastructures.
The NLCPR and NEC schemes are funded and monitored by the Ministry of Development of North Eastern Region at the Centre.
For the State of Tripura, the Government of India sanctioned 26 projects under NLCPR (estimated cost ` 122.69 crore) and 1 project (estimated cost ` 195 crore) under NEC during 2008-13. Out of 26 projects, the project proposals of 23 projects were sent during 2004-05 by the Government of Tripura. The approved NLCPR projects mainly consisted of replacement of existing Semi-permanent type bridges with Reinforced Cement Concrete bridges (23) and improvement/widening of roads (3). 2.4.2 Organisational Set-up The organisational set-up for implementation of Roads and Bridges projects in Tripura under NLCPR and NEC scheme of Government of India (GOI) is given below:

C
TDDwC
2T
2
T
Chapter II: Eco
The PlanningDepartment. Department (works were eChief Engine
.4.3 AudiThe objective
There wthat the
The mestrictly post app
Adequapurpose
Projectsobjectiv
There wprojects
.4.4 Audi
The audit find
Guideli Detailed Conditi
onomic Sector
g and Co-ordThe ProjecPWD). The
executed by er (Roads &
t Objectivees of the Perf
was a criticae individual pechanism in adhered to
proval and inate funds we; s were execves; and was a mechas.
t Criteria
dings have b
ines of the Gd Project Reions and norm
r
dination Depct implemenPWD has itthose Divisi
&Buildings).
es formance Au
l assessmentprojects werplace for apand approp
n the tenderiwere released
cuted efficie
anism for ade
been benchm
GOI for NLCeports ms for relea
partment of Gntation was ts Divisions ions under t
udit were to
t of needs ine planned appproval and
priate checksing process;d in a time
ently and ec
equate and e
marked again
CPR funded s
se of funds
Government done throu
throughout tthe overall su
assess whet
n each of theppropriately;d commences applied at
ely manner
conomically
effective mon
nst the follow
schemes
of Tripura wugh State Pthe State andupervision a
ther:
e infrastructu; ment of theeach stage,
and utilised
to achieve
nitoring and
wing sources
was the NodPublic Workd the differenand control o
ural areas an
e projects wa, prior to an
d for specif
the intende
evaluation o
s of criteria:
dal ks nt of
nd
as nd
fic
ed
of

Chapter II: Economic Sector
Audit Report for the year 2012-13, Government of Tripura
37
CPWD/Tripura Public Works Manual Prescribed monitoring mechanism
2.4.5 Scope of Audit
The Performance Audit was conducted between May and September 2013 and covered the implementation of ‘Roads and Bridges’ projects under NLCPR and NEC during 2008-09 to 20012-13. Out of total 26 projects sanctioned under NLCPR, 15 projects were selected for detailed examination by Audit based on Probability Proportional to Size without Replacement (PPSWOR) method. The approved cost of 15 projects was ` 47.09 crore (Bridge: ` 36.41crore, Road: ` 10.68 crore) against which ` 37.53 crore was released (GOI: ` 35.18 crore and Government of Tripura ` 2.35 crore) during the period covered by audit. For NEC projects, one project sanctioned by GOI during 2010 and three other projects sanctioned prior to 2008-09 but executed during 2008-2013 were selected by Audit.
2.4.6 Audit methodology The Performance Audit commenced with an entry conference with the Secretary, Planning and Coordination and State PWD officials on 23 May 2013 wherein the audit objectives, criteria, scope and methodology were discussed. Audit was conducted through examination of records of Planning and Coordination Department, Chief Engineer PWD (R&B) and nine executing Divisions7 and through issue of questionnaires and audit memos, joint field verification taking photographs of project sites. An exit conference was held with the Additional Chief Secretary, Public Works Department, Government of Tripura on 24 January 2014 to discuss the audit findings and recommendations. The replies furnished by the Government on 22 January 2014 have also been suitably incorporated in the Report. Audit findings
2.4.7 Planning Process
Audit Objective 1: Whether there was a critical assessment of needs in each of the infrastructural areas and that the individual projects were planned appropriately.
2.4.7.1 Preparation and Submission of Annual Priority List and Concept Paper
In terms of the NLCPR guidelines, the State Government was to prepare a Perspective Plan after a thorough analysis of gaps in infrastructure under various sectors. The projects submitted to the GOI for consideration under NLCPR were to be picked up strictly from the perspective plan and according to the priority assigned therein. This was to be in consonance with the overall planning process within the State covering annual plans and five year plans. Along with Priority list, the ‘concept paper’ for each project providing detailed analysis of the existing facilities in the sector and full
7Bishalgarh, Sonamura, Amarpur, Kamalpur, Khowai, Manu, Kanchanpur, Mohanpur and Jirania

Chapter II: Economic Sector
Audit Report for the year 2012-13, Government of Tripura
3838
justification for retention of the particular project and cost benefit analysis of the project as per generic structures was also to be prepared and submitted to GOI. Each project proposal or concept paper was to be accompanied by a socio-economic feasibility report and a Detailed Project Report (DPR).
Scrutiny of records revealed that the State Government had neither prepared any Perspective Plan nor carried out gap analysis for infrastructural development of the State. Annual Priority list was submitted by the nodal department during 2008-09 to 2012-13 to the GOI on the basis of project proposals received from the State Public Works Department and was in accordance with the policy decision of the State Government. No criteria or considerations were made available to Audit for assigning the priority ranking of the projects.
It was also noticed that the concept papers submitted with priority list by the State Government were not as per generic structure and did not provide detailed justification for favourable consideration of the projects under NLCPR. Thus, planning process as prescribed by the GOI was not adhered to by the State Government.
In reply, the Government while stating that the priority of projects was finalised on the basis of infrastructural gap, necessity, importance, target beneficiaries etc., did not comment on the audit observation regarding not adhering to GOI guidelines. 2.4.7.2 Delay in submission of annual priority list The State Government through its Nodal Department was required to submit annual priority list for the next financial year to the GOI by 30 November (earlier 31 December) starting from 2009. From the annual priority list so submitted by the State Government, the GOI retains/approves the projects. Further, the State Government was required to prepare Detailed Project Reports (DPRs) within two months for the projects retained by the GOI. The year-wise details of the project proposals submitted by the Nodal Department, projects retained by GOI and the DPRs submitted by the Department were as below:
Table: 2.4.1
Annual Priority list submitted Projects Proposed
Projects retained by GOI
Date of retention
of the project
Date of submission of DPR
Delay in submission
of DPR
Date of approval
of projects by GOI
Scheduled Date
Actual Date Delays
Dec’ 2007 27.5.2008 5 months 04 03 08.08.08 08.08.08 20.02.09
24.11.09, 24.2. 09 04.06. 09
13 months 4 months 1 ½ months
25.9.2012 25.9.2012 Not yet approved
Dec’ 2008 9.3.2010 16 months 01 Nil Nil Nil -- Nov’ 2009 9.3.2010 4 months 03 02 01.11.10
11.1.11 20.04.2011 01.06.2011
3 ½ months 2 ½ months
Not yet approved
Nov’ 2010 NIL ---- ---- ---- ---- ---- ---- ---- Nov’ 2011 NIL ---- ---- ---- ---- ---- ---- ----
Total: 8 5 2

Chapter II: Economic Sector
Audit Report for the year 2012-13, Government of Tripura
39
The Department could not submit its annual priority list within the prescribed time frame. The delay in submission ranged between 4 and 16 months. Further, no project proposals of roads and bridges were submitted by the Department for the last two years i.e. 2011-12 and 2012-13 but the reasons for the same were not available on record. The submission of DPRs of the retained projects was also delayed by 1.5 to 13 months resulting in further delay in approval of the projects. During 2008-09 to 2012-13, GOI approved only two projects out of the eight submitted by the Department.
In reply, the Government stated that two-month time was not sufficient for preparation of DPR. The reply is not tenable as the time frame was fixed by the GOI. 2.4.7.3 Non- adoption of District Infrastructure Index The NEC prescribed the method for identification of the districts/projects based on seven indicators viz., transport facility, energy and irrigation facility, banking facility, communication infrastructure, educational institutions and health facilities named as District Infrastructure Index (DII). However, no such analysis based on the prescribed indicators was conducted by the State Government while submitting the project proposals to the NEC. Thus, priority and ranking of the project proposals by the State Government was not based on those indicators.
In reply, the Government agreed to consider DII parameters in future. 2.4.8 Approval and award of works
Audit Objective 2: Whether the mechanism in place for approval and commencement of the projects was strictly adhered to and appropriate checks applied at each stage, prior to and post approval and in the tendering process.
2.4.8.1 Deficient Detailed Project Reports After retention of project under NLCPR by the GOI, the State Government was required to submit detailed project report (DPR) within two months which were delayed as mentioned above in Paragraph 2.4.7.2. As prescribed by GOI, the DPRs were to include socio-economic feasibility report and technical and economic viability clearly laying down year-wise phasing of input, project monitoring indicators, quarterly and year-wise physical output to be achieved, CPM and PERT chart, project implementation schedule and all regulatory and statutory clearances.
Scrutiny revealed that none of the DPRs of 15 projects examined by Audit had included the prescribed generic details like, CPM and PERT chart, year-wise phasing of input, project monitoring indicators, quarterly and year-wise physical output to be achieved, project implementation schedule and all regulatory and statutory clearance etc.
Though the NEC did not prescribe any specific guidelines for preparation of DPRs, the planning and monitoring mechanism as prescribed by NLCPR was equally vital for NEC projects also. Audit observed that none of the DPRs of four selected projects of NEC contained those details.

Chapter II: Economic Sector
Audit Report for the year 2012-13, Government of Tripura
4040
Thus, non-adoption of prescribed generic structure of DPR and frequent change of technical specification by the State Government resulted in revision of DPRs and delayed implementation of the projects which showed poor project monitoring mechanism as discussed in subsequent paragraphs.
In reply, the Government while agreeing with the audit observation stated that the progress of individual project had been monitored on the basis of the detailed work programme submitted by the contractor(s). The fact, however, remained that the monitoring mechanism was not effective as almost all projects had been badly delayed. 2.4.8.2 Revision of Detailed Project Reports Audit scrutiny revealed that DPRs of 8 out of 15 projects of NLCPR were revised technically leading to increase in the estimated cost by ` 6.43 crore (Appendix 2.9). The main reasons which caused the revision of DPRs were non-updating of Tripura Schedule of Rate (TSR) by State PWD and change in drawing & designs, non-providing safe bearing capacity, not incorporating detailed specification for construction of approach roads, etc. The DPRs were prepared based on TSR 2002 with indexation percentage by the Department, which were not accepted by the GOI. Subsequently, the TSR 2002 was updated to TSR 2008 which resulted in revision of estimated cost.
2.4.8.3 Deviations from the approved Detailed Project Reports The Ministry stipulated the utilisation of funds sanctioned for the purpose indicated in the administrative and financial approval and also directed the State not to divert the funds from the approved projects.
Audit however, observed that the Department changed the technical specifications of approved DPRs -reducing the span of four bridges and changing the type of one bridge from RCC T shape to Box culvert without obtaining approval of GOI. This change resulted in total savings in approved DPR cost by ` 3.76 crore (Appendix 2.10).
The State Government however, received the funds of ` 3.76 crore from the GoI but diverted the funds for other purposes without seeking/obtaining the approval of GoI.
2.4.8.4 Additional liability due to deviations from the Detailed Project Reports
Scrutiny of four NEC projects selected for audit revealed that the Department while executing the work had revised the DPR specification approved by the GOI for three projects which resulted in upward cost revision. The revised DPRs submitted were subsequently approved by GOI as follows:

Chapter II: Economic Sector
Audit Report for the year 2012-13, Government of Tripura
41
Table: 2.4.2 (` in crore)
Sl. No. Name of the work Approved
cost
Revised DPR cost
Revised Cost
approved by GOI
State liability
Approved carriage
width (metres)
Carriage width
(metres) executed
1 Improvement of Agartala Mohanpur-Chebri Road (including 12 bridges)
56.23 120 99.10 Not mentione
d by NEC
5.50 7.00 (upto 25 Km)
2 Dharmanagar- Tilthai- Damcherra Road (including 13 RCC bridges)
66.25 97.70 81.67 15.47 5.50 7.00 (upto 19 Km)
3 Balance work of Manu-Chawmanu Gobindobari road (15.3 km)
9.56 14.88 11.59 3.29
Total: 122.48 180.77
The project-wise details of deviation in specifications and revision of cost were as under:
(a). Improvement of Agartala- Mohanpur- Chebri Road (including 12 bridges): The original approved DPR was for ` 56.23 crore having carriage width of 5.50 metres for widening of 54 Km road. The work was awarded at 94 per cent over the estimated cost. During execution, the Department revised the scope of work of widening of the road from 5.50 metres to 7 metres for almost 28 Km. However, neither detailed justification for change of specification was found on record nor mentioned in the revised DPR. All of these factors resulted in extra cost and revision of DPR to ` 120 crore. The Revised DPR was again submitted to GOI for approval. The GOI approved ` 99.10 crore only. Thus, additional financial burden was to be borne by the State. The work had been completed but the actual total extra cost borne by the State would be known after the final bill is settled.
(b). Dharmanagar- Tilthai- Damcherra Road (including 13 RCC bridges): The original approved DPR was for ` 66.25 crore having carriage width of 5.50 metres for widening of 60 Km. While executing the work, the Department decided to increase the carriage width to 7 metres which resulted in increase in the DPR cost to ` 97.70 crore. The carriage width was increased by the Department on the ground of anticipated increase in volume of the traffic. However, audit observed that detailed justification was not mentioned in the revised DPR in this regard. The revised DPR was submitted to GOI for its approval. The GOI approved ` 81.67 crore with the direction that balance ` 15.47 crore were to be borne by the State. Thus, by changing the specifications at the later stage, the State was burdened with extra cost.
(c). Balance work of Manu-Chawmanu-Gobindobari road (15.3 Km): The Department, while executing the project carried out the special repair work for a stretch of 0-22 Km at an estimated cost of ` 1.70 crore. The revised DPR cost of ` 14.88 crore was submitted to NEC in April 2009. Initially, DPR was prepared

Chapter II: Economic Sector
Audit Report for the year 2012-13, Government of Tripura
4242
without conducting any detailed survey resulting in huge deviation of work. Out of revised DPR cost of ` 14.88 crore, NEC approved ` 11.59 crore only leaving the balance of ` 3.29 crore to be borne by the State Government due to lapses on their part. 2.4.8.5 Irregularities in tendering process Scrutiny of tender documents of 19 selected projects revealed that the award of works to contractors was made in different manner as given below:
Table: 2.4.3
Name of the scheme Type of tender invited No of works awarded to the contractor
NLCPR(15 projects) Open tender 05 Cost Plus contract 108
Total: 15 NEC(4 projects) Open tender 01 Cost Plus contract 01 Restricted tender 02
Total: 4
Audit scrutiny of tendering process and award of works revealed wide range of deficiencies and irregularities, viz., deviation from approved process, violations of codal provisions, disobeying the instructions and prescribed procedures which are discussed in the succeeding paragraphs. (A) Cost Plus Contract The Department put up a proposal (May 2008) before the State Council of Ministers stating that local contractors were overloaded and not capable to take up any more projects for implementation and were also not equipped with modern machinery and technology which were very much essential for speedy implementation of the projects with improved quality. Therefore, the Department may be allowed to award works to the PSUs/Private Sector Agencies at ‘Cost plus basis’ (limited upto 10 per cent of the estimated cost) after invitation of Expression of Interest (EOI) and evaluation of experience, technical and financial capabilities. The proposal of the Department was approved by the Council of Ministers in June 2008.
The irregularities/deficiencies noticed under cost plus contract are given below: (i) Non-compliance of two-bid system The CPWD manual provided that the works for which technical specification is finalised and defined clearly in NIT the tenderers should be required to submit the bids in two envelopes i.e. Envelope 1: documents related to eligibility criteria and Envelope 2: financial bid.
The GOI while approving the DPRs had also prescribed that the State Government was to ensure that tenders were called on competitive basis by giving wide publicity
82 works withdrawn under Cost Plus and subsequently awarded through open tender

Chapter II: Economic Sector
Audit Report for the year 2012-13, Government of Tripura
43
in print media. Since the Department had already conducted all the activities of survey and finalised the technical specifications before getting the DPR approved from the GOI the Department was to invite open tender for seeking competitive rates for award of the work for execution. However, contrary to these provisions and instructions the Department obtained the approval of Council of Minister for seeking Expression of Interest instead of following two-bid envelope system. Moreover, while inviting Expression of Interest from the private agencies, activities like Preliminary Survey, Preparation of preliminary drawing, detailed survey, soil investigation, preparation of DPR etc. were also included in the scope of work. Since these activities had already been done by the Department, their inclusion in scope of work resulted in duplication of above activities. Thus, invitation of the EOI for the activities already performed by the Department was irregular and resulted in duplication of work. (ii) Award of work to ineligible and inexperienced contractors The Department invited Expression of Interest in July 2008 from private sector agencies for execution of the approved projects on Cost plus Basis method. In response, 10 agencies submitted the EOI. Audit scrutiny revealed that none of the bidders except one had fulfilled the eligibility criteria and also did not possess required working experience. Thus, only one bidder was technically qualified to be considered for further processing. However, by diluting the requirement of prescribed work experience, the Department selected six bidders for inviting the financial bid. All the shortlisted bidders submitted their financial bid.
Scrutiny revealed that the contractors to whom the works were awarded were not qualified and competent in the respective field of work as per terms and conditions of EOI since they did not have past experience of construction of similar bridge and road works that ultimately resulted in either cancellation of contract, suspension of work or delayed execution. It was evident from the fact that two works were withdrawn from the contractors for non-execution, one work was suspended by the contractor and eight works were delayed substantially. Out of total nine selected works awarded under Cost Plus basis, only two were completed till September 2013. Thus, the State had suffered due to award of works to ineligible and inexperienced contractors as discussed in succeeding paragraphs. (iii) Award of work at exorbitant rates The Council of Ministers had approved (June 2008) the award of work at the maximum of 10 per cent above the estimated cost.
Scrutiny of records revealed that based on the financial bids submitted by the six short-listed bidders as discussed above in sub-paragraph (ii), the Department awarded (between January 2009 and June 2010) nine works at 42 to 51.50 per cent above for bridges and 29 per cent above for roads over the estimated cost at current SOR 2008 which was much higher than the limit of 10 per cent above the estimated cost set by the Council of ministers as detailed below:
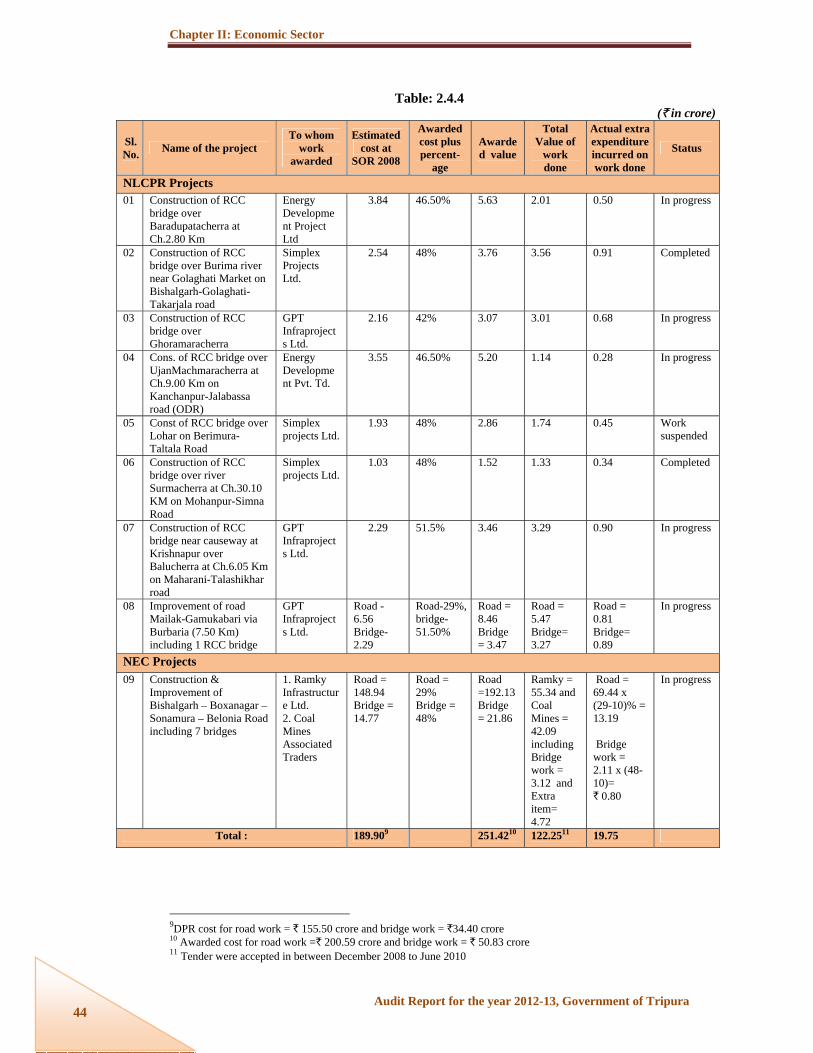
Chapter II: Economic Sector
Audit Report for the year 2012-13, Government of Tripura
4444
Table: 2.4.4 (` in crore)
Sl. No. Name of the project
To whom work
awarded
Estimated cost at
SOR 2008
Awarded cost plus percent-
age
Awarded value
Total Value of
work done
Actual extra expenditure incurred on work done
Status
NLCPR Projects
01 Construction of RCC bridge over Baradupatacherra at Ch.2.80 Km
Energy Development Project Ltd
3.84 46.50% 5.63 2.01 0.50 In progress
02 Construction of RCC bridge over Burima river near Golaghati Market on Bishalgarh-Golaghati-Takarjala road
Simplex Projects Ltd.
2.54 48%
3.76 3.56 0.91 Completed
03 Construction of RCC bridge over Ghoramaracherra
GPT Infraprojects Ltd.
2.16 42%
3.07 3.01 0.68 In progress
04 Cons. of RCC bridge over UjanMachmaracherra at Ch.9.00 Km on Kanchanpur-Jalabassa road (ODR)
Energy Development Pvt. Td.
3.55 46.50% 5.20 1.14 0.28 In progress
05 Const of RCC bridge over Lohar on Berimura-Taltala Road
Simplex projects Ltd.
1.93 48%
2.86 1.74 0.45 Work suspended
06 Construction of RCC bridge over river Surmacherra at Ch.30.10 KM on Mohanpur-Simna Road
Simplex projects Ltd.
1.03 48%
1.52 1.33 0.34 Completed
07 Construction of RCC bridge near causeway at Krishnapur over Balucherra at Ch.6.05 Km on Maharani-Talashikhar road
GPT Infraprojects Ltd.
2.29 51.5% 3.46 3.29 0.90 In progress
08 Improvement of road Mailak-Gamukabari via Burbaria (7.50 Km) including 1 RCC bridge
GPT Infraprojects Ltd.
Road - 6.56 Bridge-2.29
Road-29%, bridge-51.50%
Road = 8.46 Bridge = 3.47
Road = 5.47 Bridge= 3.27
Road = 0.81 Bridge= 0.89
In progress
NEC Projects 09 Construction &
Improvement of Bishalgarh – Boxanagar – Sonamura – Belonia Road including 7 bridges
1. Ramky Infrastructure Ltd. 2. Coal Mines Associated Traders
Road = 148.94 Bridge = 14.77
Road = 29% Bridge = 48%
Road =192.13 Bridge = 21.86
Ramky = 55.34 and Coal Mines = 42.09 including Bridge work = 3.12 and Extra item= 4.72
Road = 69.44 x (29-10)% = 13.19 Bridge work = 2.11 x (48-10)= ` 0.80
In progress
Total : 189.909 251.4210 122.2511 19.75
9DPR cost for road work = ` 155.50 crore and bridge work = `34.40 crore 10 Awarded cost for road work =` 200.59 crore and bridge work = ` 50.83 crore 11 Tender were accepted in between December 2008 to June 2010

Chapter II: Economic Sector
Audit Report for the year 2012-13, Government of Tripura
45
Further, it was also noticed in audit that the Executive Engineer, Planning Division-I had also recorded that the rates quoted by the lowest bidders were abnormally high in comparison with prevalent market rates.
Thus, by accepting the tenders at higher rates in violation of the approval of Council of Ministers, the Department committed extra expenditure of ` 42.53 crore (` 251.42 crore- ` 208.8912 crore) and had already incurred extra expenditure of ` 19.75 crore on the works executed till September 2013. In fact, the Department subsequently awarded road/bridge works at much lower rates as discussed in sub- paragraph (vi) below.
In reply, the Government stated that the tenders were approved by the Works Advisory Board (WAB) headed by the Chief Secretary.
The reply was not tenable as the Council of Ministers had prescribed the upper limit of 10 per cent above the estimated cost.
In the Exit Conference, the Additional Chief Secretary also agreed that the Council of Ministers should have been kept informed. (iv) Sub-contracting of work The Department had obtained the approval of Council of Ministers for not following the open tender system on the ground of overloading and incapability of the local contractors. However, audit scrutiny revealed that the Contractors to whom the works were awarded under this pretext had sub-contracted their work to the local contractors with the full knowledge of the Department. It was noticed that 62 per cent of the work “Improvement/Upgradation of Bishalgarh–Boxanagar–Sonamura–Belonia Road” awarded (December 2008) under Cost plus basis to M/s Ramky Infrastructure Ltd. from Sonamura to Belonia (45.50 Km) under NEC scheme was sub-contracted (28.50 Km) to four local contractors as documented in the minutes of the meeting held on 10 March 2011 between Principal Secretary (PWD) and the Contractor.
In reply, the Government stated that there was no sub-contracting. The fact however, remained that the matter of sub-contracting was clearly mentioned in the minutes of the meeting held on 10 March 2011 between Principal Secretary (PWD) and the Contractor. (v) Non-achievement of the objectives of speedy development The Department had avoided open tender system on the ground of speedy implementation of infrastructure projects which did not materialise. The work “Improvement/Upgradation of Bishalgarh–Boxanagar–Sonamura–Belonia Road” awarded to M/s. Ramky Infrastructure Ltd. was scheduled to be completed by December 2012. However, as of May 2013; only 11.5 Km. road had got completed (25 per cent) out of total 45.50 Km (43-87.50 Km). Further, another contractor “Coal Mines Associated Traders Ltd.” which was awarded construction of 42 Km road (0 to 12 Awarded cost as per Council of Minister = Estimated cost of ` 189.90 crore + 10 per cent (` 18.99 crore) = ` 208.89 crore.

Chapter II: Economic Sector
Audit Report for the year 2012-13, Government of Tripura
4646
42 Km) had completed only one Km as of May 2013 against the scheduled date of completion of the whole work in December 2012.The work was delayed due to slow progress of work by the contractors. Similarly, the NLCPR projects for construction of bridges were also delayed and only two bridges out of eight awarded on cost plus basis had been completed. The reason for slow progress was mainly due to award of work to the inexperienced agencies as mentioned in sub-paragraph (ii). Besides, there was improper work plan and monitoring lapses on the part of the Department.
As of September 2013 the overall status of completion of 15 NLCPR projects selected for detailed audit was as under:
Table: 2.4.5
Completed and put to
use
Completed before GOI
approval
Cancelled/suspended In-progress Delay
3 2 1 9 7 to 23 months
In reply, the Government stated that delay was due to prolonged monsoon in the State. The reply was not tenable as all constraints were to be taken into consideration while finalising the work schedule in the DPR.
(vi) Cancelled works awarded to local contractors at much lower rates Two works, namely “Construction of RCC bridge over river Dhanai at Ch. 6.60 Km on Champaknagar- Mandai Road and construction of RCC bridge over river Surmacherra at Ch. 34.53 Km on Mohanpur–Simna road” awarded to M/s Simplex Infrastructure Pvt. Ltd. (March 2009) under Cost plus basis @ 48 per cent above the SOR 2008 were cancelled due to non-commencement of work even after lapse of two years from the date of work order. The same work was re-tendered under ‘open tender’ system and awarded (July 2012) to the lowest bidder (local) at 32.78 per cent and 34.15 per cent over SOR 2008 that too after a lapse of three years of original award of work. Further, a similar work of construction of bridge was awarded through open tender in October 2010 (after one and a-half year of award of work @ 48 per cent above rates) at 18.63 per cent above the estimated cost based on the same SOR 2008. Thus, the much lower rates than 48 per cent even after a period of three years of award of work received through open tender confirmed some serious lapse in acceptance of 48 per cent higher rates under Cost plus basis method by the Department.
(B) Restricted Tender CPWD Manual provided that the restricted tender of any value may be called for in certain circumstances. The manual further provides that variation up to 10 per cent above the justified rate might be allowed while accepting the tender after placing the reasons on record. Tenders above this limit should not be accepted.
The details of irregularities noticed under ‘restricted tender’ are given below:-

Chapter II: Economic Sector
Audit Report for the year 2012-13, Government of Tripura
47
(i) Award of work under ‘Restricted tender’ Scrutiny of records of NEC works revealed that two works were awarded on the basis of ‘Restricted tender.’ For the work- “Construction of 12 RCC bridges on Mohanpur– Chebri Road” with estimated cost of ` 17.26 crore based on TSR 2002- the NIT was issued (11 July 2007) to seven agencies (4 companies and 3 individuals) for the financial bid. The basis of selection of those seven agencies could not be made available to Audit. In response, only two agencies submitted the financial bid and the work was awarded to lower of the two at ` 33.54 crore which was as high as 94.35 per cent over the estimated cost. Total upto date value of work done was ` 33.34 crore including extra item of ` 7.61 crore and escalation of ` 0.82 crore. Therefore, total value of work done against agreement items was ` 24.91 crore.
It was noticed that justified rates worked out in September 2007 by the Executive Engineer, Planning Division-I was 58 per cent above the estimated cost based on TSR 2002. Therefore, if 10 per cent variation was applied as per Manualised provision, the accepted tender value would not be beyond 67.82 per cent (57.82 per cent + 10 per cent variation) i.e. 68 per cent above the estimated cost. However, the Department awarded on 18 December 2007 the above works at 94.35 per cent above the estimated cost. Records also disclosed that rates accepted by the Department for other RCC bridge works between May 2006 and April 2007 varied from 44.99 per cent to 63.60 per cent above the estimated cost based on TSR 2002 which also indicated that the higher rates accepted for the above work was not justified.
Thus, due to acceptance of tender at much higher rate in violation of the manualised provision the Department incurred extra expenditure of ` 3.3813 crore.
2.4.9 Fund management
Audit Objective 3: Whether adequate funds were released in timely manner and utilised for specific purpose.
The funding pattern for NLCPR/NEC projects in Tripura was 90:10 by GOI and Government of Tripura (GOT) respectively. The total funds released by the GOI as well as the State Finance Department during the period 2008-09 to 2012-13 were as under:
Table: 2.4.6 (` in crore)
Year Amounts released by GOI to
State Government Release of funds by State
Government NLCPR NEC NLCPR NEC
2008-09 Nil 32 Nil 36.37 2009-10 19.42 44.20 4.73 21.00 2010-11 14.08 30.12 22.37 61.71 2011-12 6.47 39.00 15.59 46.912012-13 29.22 30.00 19.58 30.00
Total 69.19 175.32 62.27 195.99
13 Total value of work done against Agreement item = ` 24.91 crore Value of work done without contractor’s profit as per estimated cost = `12.81 crore Extra expenditure = ` 12.81 x (94.35 – 68)% =` 3.38 crore

Chapter II: Economic Sector
Audit Report for the year 2012-13, Government of Tripura
4848
2.4.9.1 Delay in release and utilisation of funds As per GOI guidelines prescribed for NLCPR projects, the State was to release the funds to executing agencies within 15 days from the date of receipt of funds from GOI. Scrutiny of records of test-checked projects revealed that there were delays in release of funds by the State Finance Department14to the Chief Engineer and further delay ranging from 25 days to 895 days from Chief Engineer to executing Divisions in 24 cases out of 27 as detailed in Appendix 2.11.
Further, in terms of the guidelines funds released by the Government of India were to be utilised within 12 months. Audit found that there were delays in utilisation of funds by the State and the delay ranged upto 31 months (Appendix 2.12) from the permissible period. Moreover, the funds were not utilised in time and utilisation certificates were pending. The position of pending Utilisation Certificates (UCs) under NLCPR as of March 2013 was as under:
Table: 2.4.7 (` in crore)
In reply, the Government stated that delay in release of funds was necessitated by the delayed commencement/slow progress of the works.
2.4.9.2 Short release of State share As per financing pattern prescribed by the GOI, the State was to bear 10 per cent of the approved project cost. For the 19 projects (NLCPR: 15 and NEC: 4) selected for detailed audit, the GOI released ` 210.50 crore for the period 2008-09 to 2012-13. The State contributed only ` 18.04 crore as against its share of ` 21.05 crore. Hence, there was a short release of ` 3.01 crore by the State as detailed below:-
Table: 2.4.8 (` in crore)
Year Release of Central
share Contribution due from State (10%)
Actual amount contributed by the
State
Short release of State share
NLCPR NEC NLCPR NEC NLCPR NEC NLCPR NEC 2008-09 Nil 32.00 Nil 3.20 Nil Nil Nil -3.2 2009-10 13.66 44.20 1.37 4.42 Nil 6.72 -1.36 +2.3 2010-11 10.97 30.12 1.09 3.00 Nil Nil -1.09 -3.00 2011-12 2.67 39.00 0.27 3.90 2.16 5.06 +1.89 +1.16 2012-13 7.88 30.00 0.79 3.00 0.19 3.91 -0.6 +0.91 Total: 35.18 175.32 3.52 17.52 2.35 15.69 (-) 1.16 (-) 1.85
14Time taken in release of funds by State Finance Department : min 10 days to max 518 days Time taken in release of funds by Chief Engineer : min 2 days to 850 days 152 new projects sanctioned in Sept 2012 at cost of ` 53 crore of which ` 19.08 crore was released in 2012-13 16Total fund released during 2008-09 to 2012-13 = ` 69.19 crore Fund released ` 19.08 crore in respect of two new projects for which utilisation date not yet over ` 69.72 – ` 19.08 = ` 50.64 crore
Total NLCPR projects
Total Approved cost
Amount released
Amount spent & UC submitted
Amount of UC pending
2615 122.68 50.6416 42.81 7.83

Chapter II: Economic Sector
Audit Report for the year 2012-13, Government of Tripura
49
In reply, the Government assured to make up the short-fall in the release of State share.
2.4.9.3 Expenditure incurred on inadmissible items In terms of scheme guidelines, the NLCPR and NEC funds were not to be used for land acquisition. Audit however, observed that ` 37.25 lakh and ` 9.26 lakh were incurred towards land acquisition by the Mohanpur Division and Kanchanpur Division in May 2007 and October 2012 respectively in violation of the prescribed guidelines. Further, Kanchanpur Division diverted an amount of ` 99 lakh from the NEC funds for Maintenance and Improvement of a Road not related to any NEC project.
Thus, the diversion of funds provided for NEC project without approval from GOI was not only unauthorised but also reduced the availability of funds for implementation of NEC projects.
In reply, the Government assured (January 2014) to take corrective action by adjusting the amount from the State Plan. 2.4.10 Project execution
Audit Objective 4: Whether projects were executed efficiently and economically to achieve intended objectives.
2.4.10.1 Status of pre-2008-09 projects
The status of completion of projects sanctioned prior to April 2008 under NLCPR and NEC was as under:
Status of Projects sanctioned prior to April 2008
Table: 2.4.9
Scheme Total No.
of projects sanctioned
Total approved
cost (` in
crore)
Projects due for
completion as of March
2008
Projects completed
as of March 2008
Projects completed
after March 2008
Projects in
progress
NLCPR 03 36.40 03 01 2 --- NEC 08 196.09 06 01 4 1
Total: 11 232.49 09 02 6 1
The above table shows that only two out of a total of nine projects due for completion were completed by March 2008 reflecting poor progress of work. One project was still in progress even after a lapse of 6 years from the scheduled date of completion.
In reply, the Government stated that the remaining project was likely to be completed by March 2014. 2.4.10.2 Status of projects sanctioned during 2008-13 The status of projects (August 2013) approved during 2008-09 to 2012-13 was as under:

Chapter II: Economic Sector
Audit Report for the year 2012-13, Government of Tripura
5050
Table: 2.4.10
As of September 2013 there were 15 incomplete projects which had not been completed within the scheduled date. Only 9 out of 24 projects due for completion were actually completed with a time overrun ranging from 15 to 23 months. The State Government failed to complete the projects timely which ultimately deprived the State from obtaining further funding from the GoI. The reasons for failure to complete the projects in time were not monitored and analysed by the Department. However, it was seen in audit that the delays occurred due to preparation of DPRs without proper survey, frequent change in designs, award of work to ineligible and inexperienced contractors causing suspension or surrender of works as well as re-tendering, poor control and monitoring.
2.4.10.3 Projects completed with time overrun The status of 15 selected projects (August 2013) were as under:
Table: 2.4.11
Name of the scheme
No of projects completed
Projects completed on time
Projects completed with time overrun
NLCPR 05* 01 02 (14 months ) NEC Nil Nil Nil * 2 projects were completed before submission/ approval of the DPRs by GOI.
From the above table, it could be seen that only one project was completed on time and two were completed with time overrun of 14 months and remaining projects were in progress with substantial time overrun as compared to the scheduled date of completion.
In reply, Government agreed that most of the projects were delayed but mentioned the reasons like non-responsive tenders, prolonged rainy season, non-availability of materials, labour problems etc. The fact, however, remained that projects were required to be completed as per the schedule fixed after considering all relevant factors. 2.4.10.4 Project wise Observations Out of 19 selected projects, joint physical verification of nine projects (3 NEC projects sanctioned prior to 2008 but implemented during 2008-13, 1 NEC and 5 NLCPR projects sanctioned and implemented during the period 2008-13) was conducted by Audit. The shortcomings and irregularities noticed in the implementation of the nine reviewed projects are discussed in succeeding paragraphs:
17 Out of 26 projects, proposals for 24 projects were sent by the State Government in 2004-05 and proposals for the remaining two projects were sent in 2008-09
Scheme No. of projects approved
No. of projects due for completion as of
March 2013
No. of projects completed till August
2013
Achievement (In per cent)
NLCPR 2617 24 09 38 NEC 1 -- In progress ----

Chapter II: Economic Sector
Audit Report for the year 2012-13, Government of Tripura
51
(i) Project– 1 Improvement/Upgradation of Dharmanagar-Tilthai-Damcherra-Khedacherra Road (60 Km)
The NEC approved the project for ` 66.25 crore in September 2006 for widening of 60 Km Road and construction of 13 bridges. The Department awarded the contract through restricted tender method to M/s. Coalmines Associated Traders in December, 2007 at ` 89.65 crore with stipulation to complete in three years from the date of signing of the agreement. However, the Department rescinded the contract in April 2013 after completion of 60 per cent (value of work ` 53.24 crore) work by the contractor due to slow progress of work by the contractor on account of inadequate deployment of labour and also suspension of work for long time without assigning any reason.
(a) Status of construction of 13 bridges
The contractor did not commence the work at all for 10 bridges till the rescission of contract in April 2013 i.e. for about six years. Technical specification for one bridge was changed from RCC T-shape to Box-culvert which was completed. Work for two bridges had commenced (28 December 2007) and remained incomplete till September 2013. The Department had paid ` 5.41 crore against the value of work done. However, the expenditure incurred had been unfruitful without achieving the objective of the project due to non-completion of work. The status of the two bridges is shown in the photographs (taken on 8 August 2013) below:
A. RCC Bridge at Rowa B. RCC Bridge at Deocherra
(b) Non -completion of work resulting in damage of partially executed items
Scrutiny of records revealed that out of 60 Km length of roads, only 16.40 Km road was completed in all respects and for the remaining road, partial work was done for which 90 per cent payment was also made to the contractor.
During joint physical verification of the incomplete road, it was found that the partial work done upto top layer (WBM level without BM and pre-mix carpeting) was damaged and the loss assessed by Audit was ` 1.67 crore as detailed in

Chapter II: Economic Sector
Audit Report for the year 2012-13, Government of Tripura
5252
Appendix 2.13. The status of the damaged roads on different chainages is shown in the photographs (taken on 20 August 2013) below:
Ch at 12.32 Km Ch at 23.65 Km
Ch at 36.2 Km Ch at 21.15 Km
(c). Undue benefit of ` 1.02 crore to the contractor
As per the agreement, the items of Granular Sub Base (GSB) work were to be executed with the bricks aggregates chargeable @ ` 1650 per cum. The contractor requested the Department that because of heavy shortage of bricks, he might be permitted to continue his work with stone aggregates till the shortage of bricks is over at no extra cost to the Department which was agreed by the Department.
The contractor executed a total quantity of 14365.610 cum with stone aggregates and charged at the rate of ` 2359.50 per cum in breach of the approval given by the Department. In contravention of terms, the Department also paid the higher rate and incurred unwarranted and unjustified extra expenditure of ` 1.02 crore {(` 2359.50- ` 1650) x 14365.610}. (d). Excess payment of ` 84.69 lakh on extra consumption of material
As per items of work in the agreement, 1.43 cum bricks was required for execution of one cum GSB and Water Bound Macadam (WBM) work. Audit scrutiny revealed that the contractor consumed 11446.058 cum and 10676.078 cum for GSB and WBM respectively against the specified requirement of 9283.65 cum and 7952.97 cum

Chapter II: Economic Sector
Audit Report for the year 2012-13, Government of Tripura
53
resulting in excess consumption of 4885.5118 cum valued at ` 84.69 lakh which was paid incorrectly by the Department (Appendix 2.14). (e). Payment against wrong claims for felling of trees- ` 50.22 lakh
Scrutiny of records revealed that the contractor was paid ` 50.22 lakh for felling of 1953 trees of various girths during execution of the above work. The details are as under:
Table : 2.4.12
Girth Bill of Quantity (in Nos.)
Actual Quantity charged (in Nos.)
Rate (in `) Amount paid (`)
0-60 cm 122 1099 1000 1099000
60-120 cm 65 196 3000 588000
Upto 240 cm 14 649 5000 3245000
Beyond 240 cm 2 9 10000 90000
Total: 203 1953 50,22,000
The above table shows that against the bill of quantity of 203, the contractor claimed and the Department paid for the felling of 1953 trees. The reasons for such heavy deviations in the quantity were found not on record. The records of handing over of felled trees by the contractor to the Forest Department were also not made available to Audit. Further, cross check by Audit with the DFO, Kanchanpur revealed that no trees were felled by the contractor. Rather felling of trees was done by the Forest Department for which the EE, Kanchanpur paid them ` 12.20 lakh. Therefore, the payment of ` 50.22 lakh to the contractor against felling of trees was not correct.
(f). Non-recovery of material cost–` 32.62 lakh
As per agreement, the contractor was to arrange for Tor Steel and other materials required for the work. Scrutiny of records of the EE, Kanchanpur Division revealed that in June 2009, the Division sent a proposal to the CE for issue of Tor Steel to the contractor which was rejected by the CE. It was however seen that the Division had already issued Tor Steel (60.857 MT) valuing ` 32.62 lakh to the contractor in May 2009. The Division had not recovered the amount from the contractor as of August 2013. Since the contract was rescinded, the chances of recovery of the amount were remote and thus, the Division by violating the contractual terms caused loss of ` 32.62 lakh to the State.
(g). Non imposition of penalty for slow progress of work
Para 12.1 and 12.2 of General Terms and conditions of contract provide that if a contractor fails to maintain the required progress in terms of agreed time and progress chart or to complete the work, he shall be liable to be penalised by liquidated damages
18 For GSB : (volume consumed) 11446.058 cum – (estimated volume) 9283.65 cum = 2162.408 cum For WBM : (volume consumed) 10676.078 cum – (estimated volume) 7952.97 cum = 2723.108 cum Total excess volume consumed for GSB and WBM: 2162.408 cum + 2723.108 cum= 4885.516 cum

Chapter II: Economic Sector
Audit Report for the year 2012-13, Government of Tripura
5454
@ one half per cent of the contract price per week of delay. The aggregate of such damages shall not exceed 10 per cent of the total contract price. The agreement was signed in January 2008 with stipulation to complete the work by January 2011.
Scrutiny of records revealed that work commenced in December 2008 (delay of 11 months) and the value of work done upto April 2013 was only ` 53.24 crore (60 per cent) as against the total contract value of ` 89.65 crore. Therefore, the contractor was liable to be charged the liquidated damages of maximum amount (10 per cent of contract value) of ` 8.97 crore. However, the Department had not levied any such damages and the contract was rescinded. Thus, the Department failed to penalise and recover the penalty of ` 8.97 crore from the contractor. (h) Interest-free Mobilisation advance and failure of its recovery and interest
Para 32.5 of CPWD Works Manual 2007 provides that in case of tender value of ` 2.00 crore and above, mobilisation advance may be given limited to 10 per cent of tendered amount at 10 per cent simple interest on specific request from the contractor. The mobilisation advance shall be released only after obtaining a bank Guarantee bond from a schedule bank for the amount of advance to be released and valid for the contract period.
Scrutiny of Records revealed that the Department had paid interest-free mobilisation advance of ` 8.90 crore (10 per cent of contract value) to the contractor in April 2008. The Department could recover only ` 6.41 crore from the RA bills paid to the contractor. Since the contract was rescinded, balance amount of ` 2.49 crore remained unrecovered. The Department also suffered loss of interest of ` 2.79 crore on the mobilisation advance paid in contravention of the Manualised Provisions. The bank guarantee of ` 4.48 crore submitted by the contractor had also expired in December 2012. Details of payment, recovery and interest calculations are given in Appendix 2.15.
In reply, the Government agreed to investigate the issues of overpayments/undue benefit to the contractor and take corrective action. As regards, non-imposition of penalty for slow progress of work, the Government considered the rescission of contract as a major penalty which was not tenable as per the terms and conditions of the contract. No reply was furnished for payment of interest-free advance to the contractor. (ii) Project- 2
Improvement/Upgradation of Agartala – Mohanpur – Chebri Road including 12 RCC bridges
GOI approved (November 2005) the project of Improvement/Upgradation of Agartala –Mohanpur- Chebri Road (54 Km) including 12 RCC Bridges under NEC at an estimated cost of ` 56.23 crore. The work was divided into two parts viz. road work and bridges construction work and awarded to the same contractor. The work awarded for construction of road was 45 per cent higher and bridge 94 per cent above the estimated cost.

Chapter II: Economic Sector
Audit Report for the year 2012-13, Government of Tripura
55
(a) Undue benefit to the contractor led to loss of ` 40.29 lakh
The bridge construction work had one item under Super structure and Sub structure namely “Steel reinforcement for RCC work including bending, cranking, and binding with 20 gm lying wire and position, etc. completed as directed (deformed bars)”.The total agreed bill of quantity for those items was 17121 quintal @ ` 45,000/- per MT. The rate was inclusive of material and labour charges. The actual quantity executed by the contractor was 12,449 quintal and ` 5.60 crore was paid to the contractor at the agreed rate.
Scrutiny of records revealed that the Agreement provided that only 20 mm dia and above tor steel would be supplied by the Department and ` 32,819 per MT was to be recovered from the contractor for the steel supplied. However due to price hike of the steel, the Department issued 496.792 MT below 20 mm dia tor steel (8 mm dia to 16 mm dia) to the contractor as per Government order for which recovery @ ` 33,951/- per MT was fixed. The contractor consumed 469.08 MT of below 20 mm dia tor steel and the Department was required to pay only the labour charges as the material was supplied by the Department. The labour charges arrived at by Audit was ` 2370 per MT. Therefore, it resulted in over-payment to the contractor of ` 40.6619 lakh and thereby unwarranted loss was incurred by the State.
In reply, the Government agreed that material was issued to the contractor but no specific reason for non-recovery of the cost was stated. (b) Extra expenditure of ` 1.11 crore
Both the work of road and bridge construction of the same project was awarded to one contractor at different rates as mentioned above. Audit scrutiny revealed that the items charged as extra items under the bridge construction work by the contractor and paid by the Department were actually to be classified under the road construction work. Therefore, the contractor got over paid by ` 1.11 crore as the agreed rates were different for bridge and road construction work as mentioned above and detailed in Appendix 2.16.
19
Agreement Item no.6 s& 15 Rate as per TSR 2002 ` 2535 per quintal -do- Contractor offered rate ` 4500 per quintal
Overall % of the TSR 2002 78% above Labour charges at the time dropping of tender ` 133 per quintal Add: Contractor’s profit @ 78% above the TSR 2002 in respect of labour charge for the item No. 6 and 15
` 104 per quintal
Total labour charge per quintal ` 237 per quintal Cost of steel = ` (4500 – 237) per quintal= ` 4262/- per quintal = ` 42620 per MT Material supplied till 14th RA = 496.793 MT Material consumed till 14th RA =469.08 MT Recovery fixed for supply of below 20 mm dia = ` 33,951/- including VAT Difference in recovery for cost of departmental materials supplied= ` (42620 – 33,951) MT = ` 8,669/- per MT Undue benefit given to the contractor = 469.08 MT x ` 8,669/- = ` 40,66,455

Chapter II: Economic Sector
Audit Report for the year 2012-13, Government of Tripura
5656
In reply, the Government agreed that the items shown in the Appendix 2.16 were related to the road works but had to be executed under RCC bridge since the approach road and the bridge proper were reciprocal from technical point of view.
The reply was not tenable as the road and bridge work were awarded to the same contractor and the necessary work was to be executed under the ‘Road’ work only. (c) Doubtful execution of work of ` 0.95 crore
(i) In the bill of quantity of the revised DPR, the area of Water Bound Macadam (WBM) for the work was 3,56,294 sqm and correspondingly, the Dense Bituminous Macadam (DBM) area was also to be same. The DBM was to be laid upon the WBM only. However, audit scrutiny revealed that as per the final bill of the contractor, the quantity executed for WBM was 3,73,758 sqm. but the quantity claimed and paid for the DBM area was 3,85,758 sqm which was practically inexplicable. Therefore, the payment made for extra area of 12,012 sqm for DBM amounting to ` 0.44 crore was doubtful.
(ii) Further, the pre-mix carpeting is laid over the DBM and therefore, the quantity for pre-mix work would also be same. However for pre-mix work, the actual quantity paid for was 4,10,733 sqm. Therefore, it resulted in doubtful expenditure of ` 0.51 crore.
The details of quantity as per DPR, executed quantity and calculation of over-payment of ` 0.95 crore are given in Appendix 2.17.
In reply, the Government agreed to adjust the amount of overpayment at the time of final settlement. (iii) Project - 3
Improvement/Upgradation of Bishalgarh- Boxanagar- Sonamura – Belonia Road
The project for improvement/widening of road for 87.50 Km including 7 RCC bridges on the road for ` 195 crore was approved by the GOI in June 2010 under NEC. Audit scrutiny revealed that the Department had already completed the tendering process between May and December 2008 and made agreements with two contractors (January 2009)- M/s Ramky Infrastructure Ltd and M/s Coal mines (I) Ltd - with stipulation to complete the work within 2 years (December 2012) from the date of approval of DPR (December 2010) by the Department. Thus, the Department had finalised and entered into agreement much before the approval of the GOI to the project. The work commenced in December 2010 and was in progress (September 2013). (a) Interest free mobilisation advance- Loss of Interest ` 1.82 crore
Scrutiny of records revealed that interest free mobilisation advances amounting to ` 10.73 crore (Ramky Infrastructure Pvt. Ltd.:` 5.78 crore and Coal Mines Associated Traders: ` 4.95 crore) was paid to the two contractors during January - March 2011 of which ` 5.30 crore was only recovered till March 2013 as shown in Appendix 2.18.

Chapter II: Economic Sector
Audit Report for the year 2012-13, Government of Tripura
57
Thus, the Department allowed interest free mobilisation advance to the contractors in violation of Manualised provision and caused a loss of interest of ` 1.82 crore till March 2013.
In reply, the Government stated that there was no provision in the contract for charging interest. The reply is not tenable as the contract itself was entered in violation of the Codal Provisions. (b) Short-deduction of Security Deposit in violation of manualised provision
As per provisions of CPWD Works Manual, security deposit for the defect liability period was to be deducted @ 5 per cent from the RA Bills paid to the Contractor. The Department agreed in the contract to deduct the security deposit @ 5 per cent but mentioned it as “subject to maximum of ` 25 lakh only”.
Scrutiny of records revealed that the Department while making payment to the contractors for the work executed till May 2013 had deducted security deposit as under:
Table: 2.4.13 (` in crore)
Name of Contractor
Total Payment made till date
Security Deposit to be deducted (5%)
Security deposit deducted till date
Short Deduction
Coal Mines Associated Traders 41.96 2.09 0.25 1.84
Ramky Infrastructure Ltd. 55.34 2.76 0.37 2.39
Total: 97.30 4.85 0.62 4.23
Thus, due to short deduction of security deposit of ` 4.23 crore from the contractors, the Department had allowed undue advantage to the contractors as well as caused insecurity to the Government in case of detection of defects, if any, or breach of terms and conditions of the agreement by the contractor.
In reply, the Government stated that there was no provision in the contract for charging five per cent security deposit. The reply is not tenable as the contract itself was entered in violation of the Codal Provisions. (c) Deviation from approved specification
The DPR submitted by the Department to the GOI had projected the road thickness of 375 mm (GSB: 150 mm, WBM Grade III: 100 mm, WBM Grade II: 75 mm and DBM: 50 mm). While conveying approval, NEC prescribed that DBM should not be laid directly on WBM. Instead, it should be laid on Wet Mix Macadam (WMM) in view of commercial and international importance of the road.
Scrutiny of records revealed that contrary to the directions of the GOI, the contractors constructed the road of 350 mm thickness (GSB: 125 mm, WBM: 75 mm, WMM: 100 mm and DBM: 50 mm) and the Department had allowed the use of WBM instead of WMM with reduced thickness indicating compromise with quality.

Chapter II: Economic Sector
Audit Report for the year 2012-13, Government of Tripura
5858
In reply, the Government stated that work was being executed as per the DPR maintaining thickness of 350 mm with WBM. The reply was not tenable since the technical specifications approved by GOI had provided for 375 mm with WMM. (d) Time overrun
The work was scheduled to be completed by December 2012. As of May 2013, only 15 per cent road was completed in all respects and none of the bridges were completed. Though the contractors failed to adhere to the time schedule, the Department did not penalise the contractors and take any concrete action to get the work done in time. (iv) Project-4 Construction of RCC bridge over Dhuraicherra at Ch. 0.90 km on Kamalpur – Bilascherra Road (ODR)
The Department submitted the DPR to the GOI in August 2006 for construction of the bridge. Scrutiny of records of the EE, Kamalpur Division revealed that the bridge was already constructed and completed in April 2006. The GOI approved the project in February 2010 and released the funds of ` 2.62 crore. Since the bridge was already constructed, the Department without any information to the GOI diverted all the funds to different purposes and submitted the bridge completion and utilisation certificate to the GOI in April 2013. Thus, the Department not only submitted the DPR to the GOI for the work already existed but also misreported utilisation and completion of the project to the GOI.
(v) Project- 5
Construction of RCC bridge over Lohar on Berimura – Taltala Road
The GOI sanctioned construction of RCC bridge under NLCPR funds for ` 2.29 crore in March 2010 over Lohar on Berimura – Taltala Road. The Department had already awarded the work to M/s Simplex Project Ltd. in July 2009 under cost plus contract method. The Department allowed 24 months for completion of work (February 2012) to be reckoned from the date of approval of DPR (March 2010) by the GOI. The contractor commenced the work in August 2010 i.e. after a lapse of one year from the date of issue of work order (July 2009) and suspended it in March 2012 after execution of work of ` 1.73 crore (60 per cent) against the contract value of ` 2.85 crore.

Chapter II: Economic Sector
Audit Report for the year 2012-13, Government of Tripura
59
The minutes of meeting held in June 2012 revealed that the Government had directed the Department to cancel the contract at the risk and cost of the contractor. However, the Department had not finalised the process till July 2013. Thus, the work had remained suspended for more than one and a half year and the expenditure incurred remained unfruitful.
(vi) Project -6
Construction of RCC bridge over local stream at Ch. 4.40 Km on Jogendranagar to Jamapaijala Road
Government of India approved (September 2009) RCC bridge over local stream at Ch. 4.40 Km on Jogendranagar to Jamapaijala Road at a cost of ` 1.84 crore. The agreement was entered into with the contractor in October 2010 The work commenced in October 2010 and was completed in November 2012 at a total cost of ` 3.01 crore.
The contract included supply and erection of Bailey bridge of 90 feet for ` 80.66 lakh. Audit scrutiny revealed that the Department had procured one Bailey bridge of 120 feet span from M/s Bridge & Roof (I) Pvt. Ltd., Howrah in April 2010. The Bailey bridge could have been utilised while constructing the above RCC bridge. Therefore, the provision of one more Bailey bridge at the cost of ` 80.66 lakh in the contract was unwarranted and it resulted in avoidable expenditure as the Bailey bridge procured in 2010 was lying unutilised as of June 2013.
(vii) Project - 7 Construction of Manu- Chamanu- Gobindabari Road/Portion Ch. 43.46Km to Ch. 58.78 Km (15.30 Km)
With the approval obtained from NEC, the above work was awarded (June 2005) to a contractor at a tendered value of ` 3.47 crore with stipulation to complete the work within 6 months. The work commenced in February 2006 and was suspended by the contractor in April 2009. The Department did not take any action and it was closed only in July 2013 after four years of abandonment of work by the contractor. Total value of work done by the contractor till June 2009 was ` 5.12 crore including deviations of ` 1.90 crore. The contractor was paid ` 4.83 crore. The contractor performed the formation of road which had not been carpeted till August 2013. Since formation was lying uncarpeted for last 4-5 years, the work done by the contractor had become unfruitful and subject to deterioration in the work done and paid for by the Department. Thus, it did not achieve the objective of the connectivity of the remote tribal area and also resulted in financial loss to the State.
In reply, the Government stated that work re-awarded to another contractor was in progress.

Chapter II: Economic Sector
Audit Report for the year 2012-13, Government of Tripura
6060
(viii) Project - 8 Construction of RCC bridge over Barduptacherra at Ch. 2.8 Km and Ujan Machmaracherra at Chainage 9.00 Km Undue benefit given to the contractor-` 10.50 lakh
The scope of work under cost plus contract included DPR preparation and related activities such as the preliminary survey, preparation of preliminary drawings(s), detailed survey and sub-soil investigation, preparation of detailed drawing along with structural drawings etc.
The above work was awarded on 30 June 2010 to M/s Energy Development Company Ltd., Kolkata at 46.50 per cent above the SOR 2008. The preparation of DPR and related activities were to be carried out by the Energy Development Company Ltd. However, it was got done from STUP Consultants and for the purpose, the Department was to deduct ` 10.50 lakh from the amount to be paid to M/s. Energy Development Company Ltd. which was not done causing undue benefit to the contractor. The Department in a similar other case had deducted the amount for performing such activities from Coal Mines Associated Traders.
In reply, the Government agreed with the audit observation and assured to recover the excess payment. (ix) Project - 9 Construction of RCC bridge over Dhanai at Ch. 6.60 Km Champaknagar – Mandai Road
The GOI approved (February 2010) the project of RCC T-shape bridge over river Dhanai at Ch. 6.60 Km on Champaknagar – Mandai Road (ODR) for ` 3.21 crore with stipulation to complete the work within 36 months from the date of sanction of the project.
Scrutiny of records revealed that above work was initially awarded (July2009) on cost plus basis to M/s. Simplex Ltd. The contractor did not start work till June 2011. Thus, after lapse of more than two years, the Department withdrew the work from the contractor (June 2011). Since the earnest money had not been obtained for the cost plus basis contract, the Department could not take any penal action against the contractor.
After that, the Government decided (July 2011) that instead of T-shaped RCC bridge, two RCC box cell culverts (3x7 metres) would be constructed on the same road against the existing work and the administrative and technical sanction of detailed
Box Cell Culvert at Dhumticherra

Chapter II: Economic Sector
Audit Report for the year 2012-13, Government of Tripura
61
estimate of ` 1.54 crore was accorded. Such change in the scope of work was not reported to GOI. The work was awarded (June 2012) at ` 2.03 crore (32 per cent higher than estimated cost) with stipulated completion time of nine months (March 2013). Though, the work commenced in July 2012, it was incomplete (September 2013) and the value of work done was ` 0.65 crore (32 per cent). The payment made to contractor was ` 0.60 crore. However, the EE, Jirania Division submitted utilisation certificate for ` 1.16 core to the CE, PWD (R&B) in January 2013.
Thus, by changing the type of bridge, the Department had either compromised with the quality/strength of bridge or it had made an incorrect assessment of the type of bridge required on the road while sending the proposal to GOI. Further, the completion of work was also not monitored as it was incomplete despite lapse of six months from the scheduled date of completion.
In reply, though the Government stated that the quality/strength of bridge was not compromised due to change, no reason was furnished for changing the specifications approved by the GOI. 2.4.11 Monitoring and evaluation
Audit Objective 5: Whether there was a mechanism for adequate and effective monitoring and evaluation of projects.
2.4.11.1 Quality control mechanism As per NEC guidelines for maintaining quality and specifications, a third level quality control was to be done by the State by engaging consultants. For this purpose, one per cent of the estimated cost of each work was to be earmarked to meet the expenditure for conducting various tests under NEC Projects.
Scrutiny of records revealed that neither any earmarked funds were created for quality monitoring nor was any consultant appointed by the State Government to ensure the quality control of the works. The checks for quality control were conducted by the respective implementing Divisions in respect of the NEC projects without involving any independent agency.
In reply, the Government stated that an MOU had since been signed with CSIR-NEIST Laboratory, Jorhat for upgradation of State Quality Testing Laboratory of PWD. 2.4.11.2 Monitoring by the State Government NLCPR guidelines prescribed the following measures for monitoring and evaluation of various projects sanctioned under NLCPR scheme:
submission of Quarterly Progress Report (QPR) by the States by the third week from the end of the quarter; and
holding of quarterly meetings by the Chief Secretary to review the progress of implementation of the ongoing projects.
Chapter II: Economic Sector
Audit Report for the year 2012-13, Government of Tripura
6262
Audit examination revealed that those measures were not adequately followed by the State Government:
The submission of QPRs in case of selected projects was not properly documented. As such audit could not assess the irregularity in submission of QPRs.
The quarterly meetings to review the progress of implementation of the ongoing projects under NLCPR by the Chief Secretary were not held regularly. Against the required 20 meetings, only 10 were held during 2008-09 to 2012-13.
2.4.11.3 Impact evaluation NLCPR projects mainly consisted of replacement of SPT bridges. Nine out of 24 sanctioned and due to be completed during 2008-13 were completed till September 2013. Under NEC scheme, one road of 54 Km including 13 RCC bridges were completed. The importance of those projects was due to the fact that they had been undertaken with the objective of improving inter/intra State connectivity and increased volume of traffic signifying socio-economic development of the State and the region. However, the Government had not designed any system/undertaken any study to evaluate the impact of those projects. The Government had also not created any separate maintenance funds for those projects.
In reply, the Government agreed to consider engaging an agency for evaluation/ impact study of those projects. 2.4.12 Conclusion Government of India had created NLCPR and NEC for the speedy infrastructure development of NER. The success of the projects funded through the NLCPR and NEC essentially depended on efficient planning, effective implementation of project activities and regular monitoring. There were inadequacies in all these key aspects as has been brought out in this report.
The nodal department did not assess the infrastructure gap and prepare the overall perspective plan with the required concept papers. The PWD prepared the projects on an ad-hoc manner which were endorsed by the nodal department to the GOI. The priority ranking was also assigned arbitrarily. The State did not submit any project proposal for the last three years.
The process for awarding works as adopted by the Department was not transparent and it was largely based on assumptions with regard to technical and financial capability of local contractors and in violation of codal provisions as well as the principles of financial propriety. The works were awarded to ineligible and inexperienced contractors at unduly high rates, at times without ensuring competitive rates which caused extra cost to the State exchequer. The DPRs were revised frequently, technical specifications changed and diversions made in the approved projects.

Chapter II: Economic Sector
Audit Report for the year 2012-13, Government of Tripura
63
Execution of projects under NLCPR and NEC was also not satisfactory given that only 9 out of a total 24 projects sanctioned during 2008-13 and due for completion by March 2013 had actually been completed by August 2013. There was delay due to slow progress of works by the contractors and the contractors’ lackadaisical approach. The monitoring of the execution of work was very poor and the Department did not take required measures to ensure the timely execution of works by the contractors. The Department did not collect earnest money or adequate security deposit in violation of codal provisions, rather it extended interest-free mobilisation advance to the full extent permissible and in the cases of abandonment of work by the contractors, even the recovery of mobilisation advance was doubtful.
Thus, the Department had not been able to avail full benefits of the NLCPR and NEC funds depriving the State of the improved infrastructure. 2.4.13 Recommendations
State Government should conduct gap analysis of Basic Minimum Service and infrastructure gap required for socio-economic development of the State and prioritise the work in accordance with importance.
Tendering process should be made transparent, competitive and fully compliant with the codal provisions.
Revised timelines may be drawn up for completion of projects which are overdue and holding the contractors as well as implementing Divisions accountable for any slippage.
The State Government should strengthen controls as well as the inspection and monitoring mechanism at all levels for effective implementation of the projects and ensure quality in work execution.
Impact studies/evaluation should be undertaken especially with reference to achievement of outcomes.
Chapter II: Economic Sector
Audit Report for the year 2012-13, Government of Tripura
6464
AGRICULTURE DEPARTMENT 2.5 Suspected misappropriation
Violation of provision of financial rules pertaining to handling of Government money and poor maintenance of Cash Book led to suspected misappropriation of ` 12,23,061.
Rule 77-A of the Central Treasury Rule (CTR) (Volume-I) states that all Government Officers who receive Government dues and handle cash and perform the functions of Drawing and Disbursing Officer (DDO) should observe that all monetary transactions are entered in the Cash Book as soon as they occur and attested as a token of check; the Cash Book is closed regularly after verifying the total at the end of each month; cash balance in the Cash Book is verified and a certificate recorded to satisfy that money paid into treasury/bank are actually credited through checking of treasury/bank receipts. Rule 3 and GOI decision below Rule 6 of General Financial Rules also requires strict enforcement of financial rules/orders while managing public money.
Further, cheques issued by the DDO which are encashable in his capacity as DDO (self-cheque) alone need to be entered in the Cash Book. The DDO who signs the endorsement on the reverse of the self-cheque is responsible to ensure that the item is entered promptly on the receipt side of the Cash Book. He should insist that the self-cheque is submitted to him for signature along with the Cash Book with the relevant entry. If this is not possible, he should ensure recording in a separate register and watch the entry in the Cash Book when it is put up for signature.
Scrutiny of records (March-April 2013) of the Executive Engineer, Agriculture Department, Agartala for the period from December 2010 to February 2013 revealed that the above financial rules/orders regarding handling of Government moneys were not followed by the DDO (Executive Engineer). Transactions were not recorded in the Cash Book regularly and the Cash Book was not closed on daily basis. Entries in the Cash Book were made intermittently combining transactions of a number of days together. Self-cheques issued and drawn by the DDO were also not entered in the Cash Book which led to suspected misappropriation of Government money as detailed below:
The DDO (Executive Engineer) withdrew ` 12,23,061 by issuing self-cheques (60 nos.) between 27 December 2010 and 23 February 2013 from Bank accounts. But none of the aforesaid drawals had either been reflected in the receipt side of the Cash Book or in the payment side as a mark of disbursement till date of audit (April 2013). As a result, the entire amount of ` 12,23,061 so withdrawn from bank remained outside the Government account.
In response to an audit query, the DDO furnished (9 April 2013) a bunch of cash memos (pertaining to the period November 2011 to March 2013) amounting to ` 6,68,648, mostly obtained from local petrol pumps against purchase of oil and lubricants. However, he failed to justify the genuineness of those cash memos as

Chapter II: Economic Sector
Audit Report for the year 2012-13, Government of Tripura
65
the relevant sanction orders, bills against such purchases, evidence of payments and their stock and disposal records could not be made available to audit. Besides, whereabouts of the balance amount of ` 5,54,41320 could neither be produced nor be explained. Hence, the entire amount of ` 12,23,061 is suspected to have been misappropriated.
Thus, violation of provision of financial rules pertaining to handling of Government money and improper maintenance of Cash Book led to suspected misappropriation of ` 12,23,061.
The matter was reported to the Government in September 2013; reply had not been received (January 2014).
PUBLIC WORKS DEPARTMENT
(ROADS AND BUILDINGS)
2.6 Infructous expenditure
Faulty planning and arbitrary decision of the Government to abandon the work after completing up to plinth level for “Construction of Recreation Hall cum Library for Cultural Activities” at the Central Prison, Bishalgarh resulted in infructuos expenditure of ` 1.01 crore. The Home (Jail) Department accorded (December 2007) administrative approval for ` 62.55 crore and expenditure sanction of ` 15.00 crore for construction of 1000 intake capacity Model Central Prison at Bishalgarh. The work was awarded (October 2007) on turnkey basis to the lowest tenderer, M/s Engineering Projects India Ltd (EPIL), Kolkata21, with the approval (October 2007) of the Work Advisory Board at the negotiated value of ` 62.55 crore with the stipulation to complete the work within two years.
One of the components of the Central Prison was construction of “Recreation Hall cum Library for Cultural Activities”, covering 600 square metre (sqm) areas22. The work of the component commenced in May 2009 and was completed up to the plinth level (including raising RCC columns up to a reasonable height). Against the value of work done, EPIL was paid (March 2010) ` 1.01 crore (from 8th to 24th RA bills) and thereafter the work remained suspended.
Scrutiny (March - April 2013) of records of the Executive Engineer, PWD, Bishalgarh Division (R&B) revealed that in a review meeting23 held in September 2010 at the Prison Complex it was decided not to take up the construction of the Recreation Hall and to convert one prisoner complex into recreation hall. 20 ` 12,23,061 - ` 6,68,648 21 A Government of India Enterprise 22 At the rate of ` 21,000 per sqm, valuing ` 1.26 crore 23 Chaired by Hon’ble Minister, Public Works Department in presence of Hon’ble Minister, Home (Jail) Department; Commissioner & Secretary, Home (Jail) Department; CE, PWD (R&B), IG Prisons and others

Chapter II: Economic Sector
Audit Report for the year 2012-13, Government of Tripura
6666
It was further seen that the CE, PWD (R&B) during his visit to the work site in October 2011 opined that discarding the work at that stage was not justified and decided to execute the work up to ground floor since it was relevant and essential. But no further work after the plinth level was taken up and subsequently in January 2012, the CE, PWD (R&B) had dropped the idea for construction of the building up to the ground floor.
Thus, due to indecisiveness on the part of the Department and arbitrary decision to abandon the work of Recreation Hall cum Library for Cultural Activities after completing up to plinth level and subsequently eliminating the work from the scope of the project resulted in infructuous expenditure of ` 1.01 crore.
The Government stated (December 2013) that the work of the Recreation Hall cum Library for Cultural Activities had been temporarily suspended due to funds constraints of the Home (Jail) Department and would be taken up at any time as soon as all other components are completed and funds position of the said Department is slightly improved.
The reply was not acceptable as funds for construction of the Central Prison was provided from Modernisation Scheme and TFC grants. Further, there was no decision to take up the abandoned work, revisiting the decision of the review meeting held in September 2010.
2.7 Extra expenditure
In violation of the contractual provisions under turnkey contract for construction of the Central Prison at Bishalgarh, payment by the Department towards land/site development as an additional item, which fell well within the scope of work of turnkey contract. This rendered the expenditure of ` 1.56 crore extra, of which ` 84.40 lakh had already been paid to M/s Engineering Projects India Ltd.
With the approval (October 2007) of the Works Advisory Board (WAB), the work “Planning, designing, detailed engineering and execution of Central Prison at Bishalgarh24” was awarded on turnkey basis to the lowest tenderer25, M/s Engineering Projects India Ltd (EPIL), Kolkata26 at the negotiated value of ` 62.55 crore with the stipulation to complete the work within 24 months. The work commenced in November 2008 and was in progress (June 2013). Against the value of work done (` 55.92 crore) EPIL was paid (July 2013) ` 53.83 crore (upto 61st RA bill). The said amount included additional item of work of ` 84.40 lakh27 towards land/site development.
24 Administrative approval for ` 62.55 crore and expenditure sanction of ` 15.00 crore was accorded
by Home (Jail) Department for construction of 1000 intake capacity Model Central Prison at Bishalgarh in December 2007
25 Out of two received (from six short listed firms) 26 A Government of India Enterprise 27 Against the value of work done for ` 1.56 crore

Chapter II: Economic Sector
Audit Report for the year 2012-13, Government of Tripura
67
Scrutiny (March-April 2013) of records of the Executive Engineer (EE), Bishalgarh Division PWD (R&B) revealed the following:
Section 7 of the Draft NIT of the said work provided inter alia that (i) the bidders were to study the data supplied to them for site selection, visit the site, study the physical parameters, etc. and if required get clarification on any issue regarding the same before submitting their offers; and (ii) upon submission of their offers all the bidders would be considered to have gone through the above mentioned process of drawing study, site visit and allied formalities. Even if they had not done the same physically no excuse whatsoever in this regard was to be entertained at any stage of processing the offers, evaluation of bids or contract implementation.
Further, while submitting the technical bid, which formed part of agreement, EPIL had declared that any modification, if required according to Jail Code/site condition would be done by it without any extra cost to the client.
Despite the above, in December 2009 (i.e. after almost one year of commencement of the work) EPIL informed the EE that in order to bring the entire site to required formation for construction of various buildings, structures, perimeter walls, roads etc. it had executed heavy quantities of clearance of jungles, clearance of top organic soil, earth cutting/filling, compaction and carriage, retaining slopes with sand bags etc., which were mandatory for the project. EPIL added that the huge amount involved in the above activities were not covered under the contractual provision and hence it requested to consider for amendment of those items (as additional work of land/site development) for reimbursement of the same.
The EE had rejected the issue of re-imbursement towards the cost of land/site development twice (January and February 2010), informing EPIL inter alia that any activity already found/to be found further as mandatory for land development for construction of any structure within the scope of the work also fall well within the scope of contract according to its terms and conditions.
It was however, seen that against land/site development works (as additional item) the EE had paid EPIL (at provisional rates subject to approval of higher authority) ` 62.58 lakh in February 2012 (44th RA bill) and ` 3.54 lakh in June 2012 (45th RA bill), which was beyond the terms of the turnkey contract. It was further observed that as per decision of the Chief Engineer, PWD (R&B), the EE asked EPIL (July 2012) to take up all the additional works for which payment would be made on the basis of TSR 2008 adding 40 per cent cost enhancement charge.
Thereafter EPIL was paid ` 11.01 lakh in August 2012 (50th RA bill) and ` 7.27 lakh in July 2013 (61st RA bill). Against total value of work done for ` 1.56 crore (upto 9th RA bill) as additional item towards area development by cutting/ transportation/filling of earth EPIL was paid ` 84.40 lakh28 (upto 61st RA bill) for which no justification was available. As per the terms and conditions, the required quantity of excavated
28 ` 62.58 lakh + ` 3.54 lakh + ` 11.01 lakh + ` 7.27 lakh

Chapter II: Economic Sector
Audit Report for the year 2012-13, Government of Tripura
6868
earth would be stacked in the nearby area for back filling the same after casting of the structure was completed and the surplus excavated earth would be loaded manually/mechanically into tippers and disposed in the designated places.
Thus, in violation of the contractual provisions under turnkey contract for construction of various buildings, structures, perimeter walls, etc. of the Central Prison at Bishalgarh, payment by the Department towards land/site development as additional item, which fell well within the scope of work of turnkey contract rendered the expenditure of ` 1.56 crore extra of which ` 84.40 lakh had already been paid to M/s Engineering Projects India Ltd.
The EE stated (July 2013) that the bidders provided sealed rates and amount for different items of work and their respective quantities along with item specification under various work groups (1 to 429). But site development and landscaping were not included in the price bid and the accepted rates were plinth area rates. He further stated that the work of site development was mandatory but was not included in the scope of the agency and the work was therefore carried out as extra item and payment had been made on provisional rates approved by the competent authority.
The reply was not acceptable since land/site development for construction of any structure is mandatory which fell well within the scope of work of the turnkey contract. Execution of such a basic work as “extra item” was not only unrealistic but also unreasonable.
The Government stated (December 2013) that the landscape selected for the project was a undulated/uneven one where all the different units were set in different elevation. But the unoccupied/uncovered area of the entire complex was required to be placed at a comfortable level with respect to the plinth height of the different buildings which was beyond the provision of the agreement of turnkey project.
The reply was also not acceptable since the aspect of the undulated/uneven landscape was a known fact and in the Draft NIT the bidders were specifically asked to study the data supplied to them for site selection, visit the site, study the physical parameters, etc. before submitting their offers which indicated that area development was an integral part of the turnkey project. Thereby rendering an expenditure of ` 1.56 crore extra.
29 (1) Work Group-1: Survey, Soil testing and Design & Engineering; (2) Work Group-2: Civil Works; (3) Work Group-3: Public Health Works; and (4) Work Group-4: Electrical Works

Chapter II: Economic Sector
Audit Report for the year 2012-13, Government of Tripura
69
2.8 Idle and extra expenditure
Award of works for construction of bridges in violation of the decision of the Council of Ministers to the inexperienced and unqualified agencies at higher than the approved rates, coupled with inaction on the part of the Department, not only resulted in unauthorised and irregular expenditure of ` 3.57 crore, but also rendered the expenditure of ` 7.93 crore incurred on six suspended works idle for 12 to 36 months which, in turn, resulted in failure in achieving the objective of speedy and smooth implementation of infrastructural development projects in the State.
Based on the decision of the Cabinet (June 2008) on a proposal of the Public Works Department to award infrastructure development projects to Central and State Public Sector Undertakings (PSUs)/Private sector Construction agencies (Agencies) at cost plus basis (limited upto 10 per cent of the estimated cost based on the current State Schedule of Rates), the Department invited (July 2008) Expression of Interest (EOI) from PSUs and agencies with a view to short-listing on the basis, inter alia, of evaluation of their technical and financial capabilities, and then asking the short-listed bidders for offering financial bids for a few specific packages of works and awarding the works/packages to the lowest bidder on cost plus percentage basis.
Scrutiny of records (March-April 2013) of the Executive Engineer, PWD (R&B), Bishalgarh Division and information/documents collected from the Chief Engineer, PWD (R&B) revealed that though the Department invited EOI separately from the PSUs and the agencies on the same date (30 July 2008) with the same opening date (21 August 2008), the financial bids from PSUs and agencies were invited and opened on different dates (11 and 22 September 2008; 24 September and 17 October 2008). Thus, the rates of PSUs were already known to all much before the bids of agencies were opened and hence, the risk of influencing their financial bids could not be ruled out. This was also reflected from the fact that the lowest offer of the PSU for Bridge projects was 49 per cent above cost, whereas the same stood at cost plus 48 per cent for the agencies. It was seen that two Kolkata based agencies-Ramky Infrastructure Ltd. and Coal Mines Associated Traders (‘A’ and ‘B’) were awarded (January 2009) with the work for Bridge Project Package No.-1(comprising 12 bridges) - six bridge projects each at 48 per cent above the estimated cost. The action of the Department was clearly in violation of the Cabinet approval that allowed the Department to award the works at cost plus percentage to be limited upto 10 per cent of the estimated cost.
While according approval to the rates of 48 per cent above the estimated cost, the Chief Secretary had also observed (December 2008) that Council of Ministers be briefed accordingly by the Principal Secretary (PWD). However, when the Principal Secretary, PWD was asked (August 2012) as to how the works were awarded at the rates much higher than the rates approved by the Cabinet and whether the approval of

Chapter II: Economic Sector
Audit Report for the year 2012-13, Government of Tripura
7070
the Cabinet was taken before issuing work orders, the Chief Engineer not only stated (October 2012) that the works were in no way to be treated as ‘cost plus’, but also rejected the very basis of 10 per cent over TSR 2008 stating that the same was unreasonable. The reply of the Chief Engineer was contradictory to the proposal submitted by the Department and approved by the Cabinet, and further confirmed that the decision of the Cabinet was purposely given a go away in the entire process. This not only resulted in extra expenditure of ` 3.57 crore (Appendix 2.19), but also in the expenditure being unauthorised and irregular.
Further, as per the approval of the Cabinet the works were to be awarded to the well reputed agencies to be short listed after evaluation of their technical and financial capabilities, experience in the respective fields, etc. The proposal submitted by the Department also emphasised that the new system was required for smooth and speedy implementation of the projects with improved quality and finishing which the local contractors were not capable of. Audit scrutiny, however, revealed that of the nine agencies that had responded to the EOI, only one had previous experience in similar nature of works and met the criteria fixed for short listing in the EOI. The Department, despite noting that most of the agencies were not eligible as per their requirement, short listed six (including five unqualified) of them for inviting financial bids diluting their EOI requirements. Four agencies (who were to be disqualified) submitted their financial bids and two of them were awarded with the works. Thus, evidently, here again the decision of the Cabinet was violated and the works were awarded to those who were inexperienced, ineligible and technically unqualified.
It was, however, observed in audit that the same Division had awarded three similar RCC bridges to a local contractor in October 2010 (2 Nos.) and September 2011 (1 No), i.e. even 1-2 years later at much lower rates varying from below 7.13 per cent to over 18.63 per cent on the estimated cost based on same Schedule of Rates as were used for the above mentioned works (Appendix 2.20).
Audit scrutiny of the execution of the 12 bridge projects revealed that the work orders were issued to the two selected agencies for six bridges each in February 2009 with the direction to start the works ‘at once’ to be completed by February 2011. As against this stipulation, the agencies could neither commence the work in time (Appendix 2.21) (only nine works were commenced between March 2009 and March 2010 while three works were withdrawn from the scope of ‘B’ in July 2010) nor maintained the required progress of the works to complete them within the stipulated period. None of the nine works had been completed even after the time overrun of 28 months till July 2013. Not only this, seven of those nine works were actually found to have been suspended by the agencies midway between July 2010 and July 2012 against which payment of ` 9.07 crore (Appendix 2.21) had already been made to them and only two works – one under each agency- were in progress with 56 per cent and 64 per cent completion.
The Department did not take any action to get those works completed except withdrawing one of the seven suspended works from ‘A’ and awarding the balance

Chapter II: Economic Sector
Audit Report for the year 2012-13, Government of Tripura
71
portion to a local contractor in November 2012 which was in progress. In March 2013, ‘A’ requested the EE, Bishalgarh Division to withdraw the four suspended works from them on ‘as is where is’ basis without levying any liquidated damages. The matter was intimated by the EE to the SE, PWD (R&B) in April 2013 for further decision which was still awaited (July 2013). Thus, work on six bridges remained suspended for the last 12 to 36 months and expenditure of ` 7.93 crore (Appendix 2.21) incurred on them remained idle.
Thus, awarding the works of construction of bridges in violation of the approval of the Council of Ministers to the inexperienced and unqualified agencies at higher than the approved rates coupled with inaction on the part of the Department not only resulted in unauthorised and irregular expenditure of ` 3.57 crore but also rendered the expenditure of ` 7.93 crore incurred on six suspended works idle for 12 to 36 months which in turn resulted in failure in achieving the objective of speedy and smooth implementation of infrastructural development projects in the State.
The Government stated (December 2013) that the agencies were selected through EOI with a set of pre-requisite stringent criteria. The reply was not acceptable since records indicated that the Department shortlisted the agencies diluting their EOI requirements.
As regards not adhering to the Council of Ministers’ approval of cost plus percentage limited to 10, it was stated that Works Advisory Board (the highest body in the State to decide the tender) approved the negotiated rates. The reply was not acceptable as the decision of the Council of Ministers cannot be overruled by the WAB.
PUBLIC WORKS DEPARTMENT (WATER RESOURCES)
2.9 Unfruitful expenditure
Lack of adequate planning and timely decision on agreement related issues by the Public Works Department (Water Resources) coupled with non-initiating timely action for rescinding the agreement and getting the remaining work executed by another contractor at the risk and cost of erring contractor resulted in unfruitful expenditure of ` 2.17 crore. The partially constructed canal also meant that the farmers were deprived of the intended benefits of the irrigation project.
The Executive Engineer (EE), Water Resource Division No. VI, Kailashahar executed (October 2005) an agreement for ` 8.32 crore against the estimated cost of ` 6.82 crore for construction of Left bank Manu Canal (Main Canal) from ch 20,030 m to ch 21,700 m under Manu Irrigation Project with a stipulation that the work was to be completed by November 2006. Subsequently (November 2007), the completion time was extended to March 2010 by a supplementary agreement.
Chapter II: Economic Sector
Audit Report for the year 2012-13, Government of Tripura
7272
Scrutiny (February-March 2010 and August 2013) of records of the Division revealed that the contractor suspended the work on this project in April 2008 citing dispute over/non-settlement of various long pending issues like release of security deposit, approval/payment of extra item for dewatering from tunnel and cut and cover, excess excavation due to modification of approved drawing, mechanical transportation of huge quantity of earth for disposal and back filling, price escalation etc. It was observed that these issues, some of which could have been taken care of at the planning/DPR stage were left pending for long (May 2006/August 2007/November 2007) by the Division/Department without taking timely decision to resolve them. Even after the contractor indicated his intention to suspend the work in April 2008, the EE did not take any concrete action except occasionally making correspondence with the contractor either refuting his statements or requesting him to resume the work. The EE requested the contractor to recommence the work as late as November 2010 i.e, even after the expiry of revised completion period (March 2010).
Though the work was stopped by the contractor in April 2008, the Department did not initiate any action for three years (April 2011) against the contractor by imposing penalty as per the provisions of the agreement or rescinding the work invoking clause 3(i) (ii) (iii) and clause 3 (a) (b) and (c) of the agreement and getting the remaining work executed at the risk and cost of the contractor by any other agency. Meanwhile, the contractor was paid (November 2009) ` 2.17 crore (upto 4th RA bill prepared in July 2008) against the total value of work done for ` 2.20 crore. It was only after the contractor sought for arbitration in January 2011 (which was in hearing stage as of August 2013), that the EE exercising the powers of Engineer-in-Charge rescinded (May 2011) the contract on the ground of contractor’s failure to complete the work by the extended date of completion. The EE rescinded (May 2011) the agreement but no action was taken to get the remaining work executed at the risk and cost of the erring contractor even though more than 28 months have since elapsed (August 2013).
Thus, lack of adequate planning and timely decision on agreement-related issues by the Department coupled with non-initiating timely action for rescinding the agreement and getting the remaining work executed by another contractor at the risk and cost of erring contractor resulted in unfruitful expenditure of ` 2.17 crore. The partially constructed canal also meant that the farmers were deprived of the intended benefits of the irrigation project.
The matter was reported to the Government in September 2013; reply had not been received (January 2014).

Audit Report for the year 2012-13, Government of Tripura 73
CHAPTER III: ECONOMIC SECTOR (STATE PUBLIC SECTOR UNDERTAKINGs)
3.1 Overview of State Public Sector Undertakings
Introduction
The State Public Sector Undertakings (SPSUs) consist of State Government Companies and Statutory Corporations. The SPSUs are established to carry out activities of commercial nature while keeping in view the welfare of people. The working SPSUs registered a turnover of ` 466.52 crore as per their latest finalised accounts as of September 2013. This turnover was equal to 1.96 per cent of State Gross Domestic Product (GDP) of ` 23,854.70 crore1 for 2012-13. Thus, the SPSUs occupy an insignificant place in the State economy. Major activities of Tripura SPSUs are concentrated in Power and Manufacturing sectors. The SPSUs incurred a loss of ` 98.74 crore in aggregate as per their latest finalised accounts as of September 2013. They had employed 71122 employees as of 31 March 2013. The SPSUs do not include Departmental Undertakings (DUs), which carry out commercial operations but are a part of Government departments.
3.1.2 As on 31 March 2013, there were 14 SPSUs as per the details given below. None of the companies were listed on the stock exchange.
Table No. 3.1.1
Type of SPSUs Working SPSUs Non-working SPSUs3
Total
Government Companies4 12 1 13 Statutory Corporations 1 - 1
Total: 13 1 14
Audit Mandate
3.1.3 Audit of Government companies is governed by Section 619 of the Companies Act, 1956. According to Section 617, a Government company is one in which not less than 51 per cent of the paid up capital is held by Government(s). A Government company includes a subsidiary of a Government company. Further, a company in which not less than 51 per cent of the paid up capital is held in any combination by Government(s), Government companies and Corporations controlled by Government(s) is treated as if it were a Government company (deemed Government company) as per Section 619-B of the Companies Act.
1 Advanced estimates of State GDP for 2012-13 as furnished by Directorate of Economic and Statistics, Government of Tripura. 2 As per the details provided by SPSUs, except one non-working SPSU and one newly incorporated company. 3 Non-working SPSUs are those which have ceased to carry on their operations. 4 Includes one 619-B company namely Tripura Natural Gas Company Limited.

Chapter III: Economic Sector (State Public Sector Undertakings)
Audit Report for the year 2012-13, Government of Tripura
74
3.1.4 The accounts of State Government companies (as defined in Section 617 of the Companies Act, 1956) are audited by Statutory Auditors, who are appointed by CAG as per the provisions of Section 619(2) of the Companies Act, 1956. These accounts are also subject to supplementary audit conducted by CAG as per the provisions of Section 619 of the Companies Act, 1956.
3.1.5 Audit of Statutory corporations is governed by their respective legislations. CAG is the sole auditor of the only Statutory Corporation in the State viz. Tripura Road Transport Corporation.
Investment in SPSUs
3.1.6 As on 31 March 2013, the investment (capital and long-term loans) in 14 SPSUs (including one 619 B company) was ` 902.93 crore as per details given below.
Table No. 3.1.2 (` in crore)
Type of SPSUs Government Companies Statutory Corporations Grand
Total Capital Long Term Loans Total Capital Long Term
Loans Total
Working SPSUs 469.19 275.95 745.14 157.50 0.25 157.75 902.89 Non-working SPSUs 0.04 - 0.04 - - - 0.04
Total: 469.23 275.95 745.18 157.50 0.25 157.75 902.93
A summarised position of Government investment in SPSUs is detailed in Appendix 3.1.
3.1.7 As on 31 March 2013, of the total investment in SPSUs, 99.99 per cent was in working SPSUs and the remaining 0.01 per cent in one non-working SPSU. This total investment consisted of 69.41 per cent towards capital and 30.59 per cent in long-term loans. The investment had grown by 51.66 per cent from ` 595.36 crore in 2008-09 to ` 902.93 crore in 2012-13 as shown in the graph below.
595.36633.61
705.69796.71
902.93
0100200300400500600700800900
1000
2008-09 2009-10 2010-11 2011-12 2012-13
(`in
cro
re)
Chart No. 3.1Investment (Capital and long-term loans)
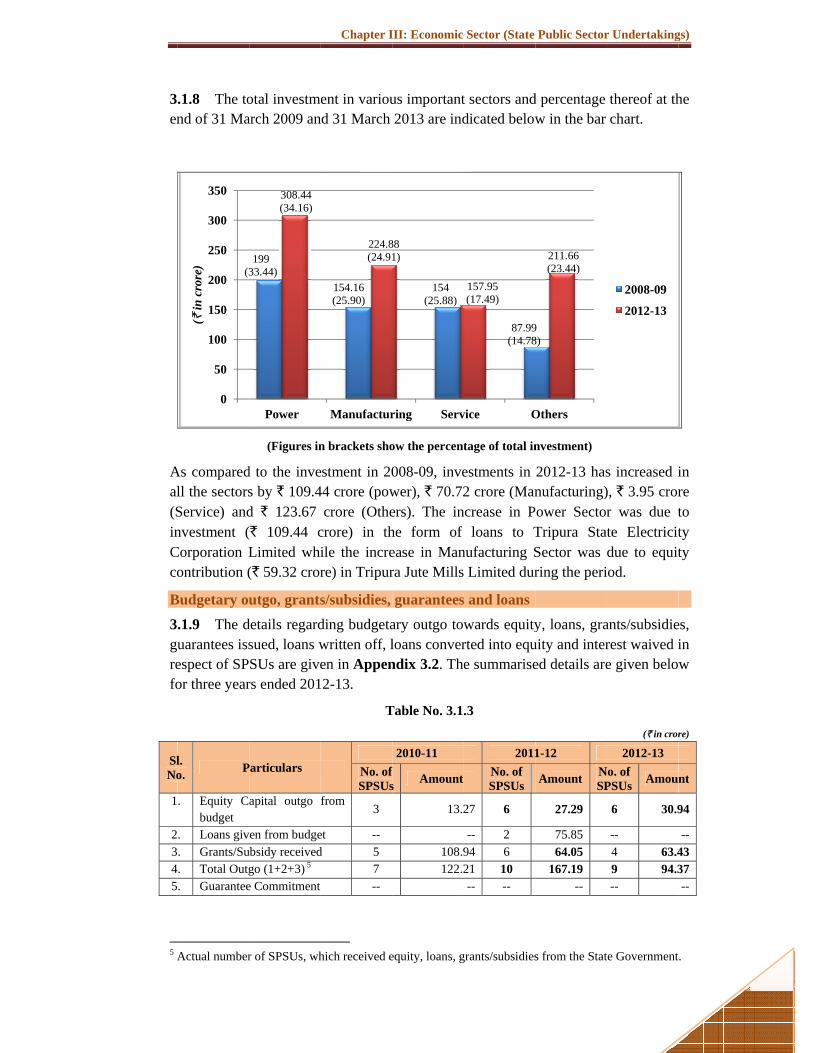
3en
Aal(SinCco
B
3gurefo
SlNo
1
2345
5 A
.1.8 The tond of 31 Ma
As comparedll the sectorsService) andnvestment (
Corporation Lontribution (
Budgetary ou
.1.9 The duarantees issespect of SPor three year
l. o. P
. Equity Cbudget
. Loans giv
. Grants/Su
. Total Outg
. Guarantee
Actual number
(3
0
50
100
150
200
250
300
350(`
in c
rore
)
otal investmarch 2009 an
(Figures in
d to the inves by ` 109.4d ` 123.67 (` 109.44 cLimited whi(` 59.32 cror
utgo, grants
details regardsued, loans wSUs are givers ended 201
Particulars
apital outgo
en from budgeubsidy receivedgo (1+2+3) 5 e Commitment
r of SPSUs, wh
19933.44)
308.44(34.16)
Power
Chapter I
ent in variound 31 March
n brackets sho
estment in 2044 crore (pow
crore (Othecrore) in thile the increre) in Tripur
s/subsidies,
ding budgetawritten off, len in Appen2-13.
T
No. of SPSUs
from 3
et -- d 5
7 --
hich received e
154.16(25.90)
224.8(24.91
Manufactur
Ch
III: Economic
us important2013 are ind
ow the percent
008-09, invewer), ` 70.72ers). The inhe form of ease in Manra Jute Mills
guarantees
ary outgo towloans converndix 3.2. The
Table No. 3.1
2010-11 fs Amount
13.2
108.9122.2
equity, loans, g
154(25.88)
881)
ring Serv
hart No.3.2
Sector (State
t sectors anddicated below
tage of total in
estments in 2 crore (Man
ncrease in Ploans to T
nufacturing S Limited dur
s and loans
wards equityrted into eque summarise
.3
2011No. of SPSUs
27 6
-- 2 94 6 21 10 -- --
grants/subsidies
87.99(14.78
157.95(17.49)
vice O
Public Sector
d percentage w in the bar
nvestment)
2012-13 hasnufacturing)ower SectorTripura StatSector was ring the peri
y, loans, grauity and intered details are
1-12
Amount NSP
27.29
75.85 64.05
167.19 --
s from the Stat
98)
211.66(23.44)
Others
r Undertaking
thereof at thchart.
s increased i), ` 3.95 crorr was due tte Electricitdue to equitiod.
ants/subsidierest waived ie given belo
(` in cror
2012-13 No. of PSUs Amou
6 30.9
-- 4 63.49 94.3--
te Government
2008-09
2012-13
gs)
he
in re to ty ty
es, in w
re)
nt
94
-- 43 37 --
.

Chapter III: Economic Sector (State Public Sector Undertakings)
Audit Report for the year 2012-13, Government of Tripura
76
3.1.10 The details regarding budgetary outgo towards equity, loans and grants/ subsidies for the past five years are given in a graph below:
It may be observed that the budgeting outgo to the SPSUs in the form of equity, loans, grants/subsidies, etc. had shown a mixed trend during 2008-09 to 2012-13. The budgetary outgo to SPSUs was lowest in five years during 2008-09 (` 89.69 crore) and was at the peak at ` 181.85 crore during 2009-10. The budgetary outgo to SPSUs during 2012-13 was, however, at ` 94.37 crore. The major beneficiaries of budgetary outgo during 2012-13 were Tripura State Electricity Corporation Limited (subsidy of ` 40.00 crore), Tripura Jute Mills Limited (equity of ` 18.67 crore) and Tripura Road Transport Corporation (grant and subsidy of ` 14.80 crore).
Reconciliation with Finance Accounts
3.1.11 The figures in respect of equity and loans outstanding as per records of SPSUs should agree with that of the figures appearing in the Finance Accounts of the State. In case the figures do not agree, the concerned SPSUs and the Finance Department should carry out reconciliation of differences. The position in this regard as on 31 March 2013 is stated below.
Table No. 3.1.4 (` in crore)
Outstanding in respect of
Amount as per Finance Accounts
Amount as per records of SPSUs Difference
(2012-13) Equity 981.95 616.41 365.54 Loans 43.506 203.77 160.27
6 Represents State Government loans to Tripura State Electricity Corporation Limited for Power Projects. Separate details for loans to other SPSUs were not available in the Finance Accounts of the State
89.69
181.85
122.21
167.19
94.37
020406080
100120140160180200
2008-09 2009-10 2010-11 2011-12 2012-13
(`in
cro
re)
Chart No. 3.3Budgetary outgo towards Equity, Loans and Grants/Subsidies
Chapter III: Economic Sector (State Public Sector Undertakings)
Audit Report for the year 2012-13, Government of Tripura 77
Audit observed that the differences in equity figures existed in respect of 11 SPSUs. It was further observed that during 2011-12, the differences in the figures of Equity and Loans were to the tune of ` 286.36 crore and ` 160.27 crore respectively. Thus, the unreconciled differences in case of State Government investment in the Equity of SPSUs had increased by ` 79.18 crore during 2012-13. The issue was also taken up (April 2013) with the Additional Chief Secretary, Finance Department, Government of Tripura and the heads of the concerned SPSUs for early reconciliation of long pending differences. No significant progress was, however, noticed in this direction. The Government and the SPSUs should take concrete steps to reconcile the differences in a time-bound manner.
Performance of SPSUs
3.1.12 The financial results of SPSUs, financial position and working results of the only working Statutory Corporation are detailed in Appendices 3.3, 3.4 and 3.5 respectively. A ratio of SPSU turnover to State GDP shows the extent of SPSU activities in the State economy. The following table provides the details of working SPSU turnover and State GDP for the period 2008-09 to 2012-13.
Table No. 3.1.5 (` in crore)
Particulars 2008-09 2009-10 2010-11 2011-12 2012-13 Turnover7 260.69 288.48 331.33 419.52 466.52 State GDP8 13,572.64 15,402.70 17,867.73 20,981.74 (P) 23,854.70 (A) Percentage of Turnover to State GDP
1.92 1.87 1.85 2.00 1.96
It may be noticed from the table that the turnover of the working SPSUs and the State GDP had shown consistent growth during the years from 2008-09 to 2012-13. The percentage of turnover to the State GDP during 2012-13 had marginally declined compared to 2011-12 as the increase in the turnover during the year was not commensurate with the growth in the State GDP.
3.1.13 Overall losses9 incurred by working SPSUs during 2008-09 to 2012-13 based on their latest finalised accounts as of September of the respective year are given below in a bar chart:
7 Turnover as per the latest finalised accounts of SPSUs as of September of respective year. 8 GSDP figures furnished by Directorate of Economic & Statistic, Government of Tripura; (P) Provisional, (A) Advance Estimate. 9 Arrived at before making the below the line adjustments like income tax penalty, refund of income tax, etc.

C
Fyanse2eiTcoLCLT
3immHCsepob
(`i
)
Chapter III: Ec
rom the aboears during nd 2012-13 ector SPSU 012-13, out ight SPSUs
Transport Coontributor t
Limited (` 24Corporation LLimited (` 16Transport Co
.1.14 The lmplementati
monitoring. DHandicrafts Corporation Lelected for der their latesbjections inc
19
0
20
40
60
80
100
120
2
(`in
cro
re)
(Figur
conomic Secto
ove it can be2008-09 to (` 98.74 cronamely, Triof 13 workincurred losmpany Limio profit wa4.53 crore).Limited (` 96.22 crore), Trporation (`
losses of SPon of projeDuring the yDevelopmenLimited anddetailed audist finalised acluded in thi
9.84 (12)
008‐09
res in brackets
or (State Publi
Aud
e seen that th2012-13. Siore) were mipura State Eking SPSUs,ss of ` 139.3ited), howevas Tripura F. Heavy los95.79 crore),Tripura Jute 10.00 crore
PSUs are mect, runningyear 2012-1nt Corporatd Tripura Toit. The detaiaccounts as ois Report are
1.97 (13)
2009‐10
C
s show the nu
ic Sector Und
dit Report for
he working ignificant los
mainly due toElectricity C, four SPSU30 crore. Onver, had not Forest Deve
sses were in, Tripura Ha Mills Limit
e).
mainly attribg their ope13, three SPtion Limiteourism Devils of revenuof Septembee summarised
4.36 (13)
2010‐11
Chart No. 3.
mber of work
ertakings)
r the year 2012
SPSUs incusses during
o heavy lossCorporation Us earned prne working Sfinalised its elopment &ncurred by andloom andted (` 14.78
butable to derations, finPSUs namelyd, Tripura
velopment Cue, cost, net er 2013 and d below.
104.98 (1
2011‐1
.4
king SPSUs in
2-13, Governm
urred losses 2011-12 (`
ses incurred Limited. Du
rofit of ` 40SPSU (viz. Tfirst accoun
& PlantationTripura Sta
d Handicraft8 crore) and
deficiencies nancial many Tripura H
Industrial Corporation L
profit of thethe money v
13)98.74
12 2012
respective yea
ment of Tripur
in all the fiv104.98 croreby the powe
uring the yea.56 crore an
Tripura Urbants. The majon Corporatioate Electricits CorporatioTripura Roa
in planninnagement anHandloom an
DevelopmenLimited werese SPSUs avalue of aud
4 (13)
2‐13
ars)
ra
ve e) er ar nd an or on ty on ad
g, nd nd nt re as dit
Chapter III: Economic Sector (State Public Sector Undertakings)
Audit Report for the year 2012-13, Government of Tripura 79
Table No. 3.1.6 (` in crore)
Name of the Company Revenue Cost Net Profit/ Net Loss (-)
Money value of audit objections
Excess cost incurred
Revenue forgone
Tripura Handloom and Handicrafts Development Corporation Limited (latest finalised accounts- 2012-13)
3.24 19.46 -16.22 2.49 --
Tripura Industrial Development Corporation Limited (latest finalised accounts- 2011-12)
4.81 1.64 3.17 -- 0.85
Total: 8.05 21.10 -13.05 2.49 0.85
3.1.15 The above losses pointed out are based on test-check of records of SPSUs. The actual losses would be much more. The above table shows that with better management, the losses can be eliminated. The SPSUs can discharge their role efficiently only if they are financially self-reliant. The above situation points towards a need for improving professionalism and accountability in the functioning of SPSUs.
3.1.16 Some other key parameters pertaining to SPSUs based on their latest finalised accounts are given below.
Table No. 3.1.7 (` in crore)
Particulars 2008-09 2009-10 2010-11 2011-12 2012-13 Return on total Capital Employed (per cent)
Negative 0.59 0.50 Negative Negative
Debt 98.29 108.37 128.28 203.77 276.20 Turnover10 260.69 288.48 331.33 419.52 466.52 Debt/ Turnover Ratio 0.38:1 0.38:1 0.39:1 0.49:1 0.59:1 Interest Payments10 5.89 7.27 9.37 9.37 10.33 Accumulated losses 10 243.74 303.21 320.31 348.01 348.03
3.1.17 From the table above, it may be noticed that there had been significant increase in the overall debts of the SPSUs during past five years from ` 98.29 crore (2008-09) to ` 276.20 crore (2012-13) mainly on account of overall increase of ` 185.19 crore in the borrowings of Tripura State Electricity Corporation Limited (` 109.44 crore) and Tripura Industrial Development Corporation Limited (` 75.75 crore). As a result, the Debt-Turnover ratio as well as the interest payments had shown increasing trend after 2008-09. During the last five years, except during 2009-10 and 2010-11, the return on total capital employed had been negative due to high losses incurred by the SPSUs.
3.1.18 The State Government had not formulated any dividend policy regarding payment of minimum dividend by the SPSUs. As per their latest finalised accounts as on 30 September 2013, four SPSUs earned an aggregate profit of ` 40.56 crore. None of these SPSUs had, however, paid any dividend during the year 2012-13.
10 Turnover of working SPSUs and interest as well as accumulated losses as per the latest finalised accounts as of September 2013.

Chapter III: Economic Sector (State Public Sector Undertakings)
Audit Report for the year 2012-13, Government of Tripura
80
Arrears in finalisation of accounts
3.1.19 The accounts of the companies for every financial year are required to be finalised within six months from the end of the relevant financial year under Sections 166, 210, 230, 619 and 619-B of the Companies Act, 1956. Similarly, in case of Statutory corporations, their accounts are finalised, audited and presented to the Legislature as per the provisions of their respective Acts.
The table below provides the details of progress made by working SPSUs in finalisation of accounts as of September 2013:
Table No. 3.1.8
Sl. No. Particulars 2008-09 2009-10 2010-11 2011-12 2012-13
1. Number of working SPSUs 12 13 13 13 13 2. Number of accounts finalised during
the year 24 38 27 22 1911
3. Number of accounts in arrears 74 49 35 26 20 4. Average arrears per SPSU (3/1) 6.17 3.77 2.69 2.00 1.54 5. Number of Working SPSUs with
arrears in accounts 12 13 13 13 10
6. Extent of arrears 2 to 15 years
1 to 9 years
1 to 10 years
1 to 6 years
1 to 3 years
3.1.20 From the table, it may be seen that there had been a significant improvement in the position of arrears of accounts of the SPSUs after 2008-09. The average number of arrears per SPSU had reduced from 6.17 accounts (2008-09) to 1.54 accounts (2012-13). It may, however, be observed that only 3 out of 13 working SPSUs had up to date accounts and the accounts of remaining 10 working SPSUs still had arrears of accounts for periods ranging from one to three years as on 30 September 2013. Thus, concrete steps should be taken by the SPSUs for preparation of accounts as per the statutory requirements with special focus on clearance of arrears in a time bound manner.
3.1.21 The State Government had invested ` 236.08 crore (equity: ` 26.63 crore and grants: ` 209.45 crore) in eight SPSUs during the years for which accounts have not been finalised as detailed in Appendix 3.6. Delay in finalisation of accounts by these SPSUs may result in risk of fraud and leakage of public money apart from violation of the provisions of the Companies Act, 1956.
3.1.22 The administrative departments have the responsibility to oversee the activities of these entities and to ensure that the accounts are finalised and adopted by these SPSUs within the prescribed period. Though the concerned administrative departments and officials of the Government were informed of the arrears in finalisation of accounts by Audit, including taking up the matter demi-officially by the Accountant General with the Additional Chief Secretary, Finance Department,
11 Including one year account (2012-13) of one SPSU (Tripura Handloom and Handicrafts Development Corporation Limited) finalised in December 2013.

Chapter III: Economic Sector (State Public Sector Undertakings)
Audit Report for the year 2012-13, Government of Tripura 81
Government of Tripura (September 2013), remedial measures were taken belatedly. As a result the net worth of these SPSUs could not be assessed in audit.
3.1.23 In view of above state of affairs, it is recommended that the Government should monitor and ensure timely finalisation of accounts in conformity with the provisions of the Companies Act, 1956.
Winding up of non-working SPSUs
3.1.24 There was one non-working SPSU (viz. Tripura State Bank Limited) as on 31 March 2013, which had been non-functional since 1971. The said SPSU was in the process of liquidation under Section 560 of the Companies Act, 1956. The non-working SPSU is required to be wound up expeditiously since its existence is not going to serve any purpose. The Company, however, continues to await liquidation for more than four decades. The Government may expedite the process of winding up of the non-working SPSU.
Accounts Comments and Internal Audit
3.1.25 Ten working companies had forwarded 16 audited accounts to AG during the year 2012-13 (up to September 2013). Out of these 16 accounts, 8 accounts of 7 companies were selected for supplementary audit. The audit reports of statutory auditors appointed by CAG and the supplementary audit of CAG indicate that the quality of maintenance of accounts needs to be improved substantially. The details of aggregate money value of comments of statutory auditors and CAG based on the accounts audited during the period from 2009-10 to 2012-13 (till September 2013) are given below:
Table No. 3.1.9 (` in crore)
Sl. No. Particulars
2009-10 2010-11 2011-12 2012-13 No. of
accounts Amount No. of accounts Amount No. of
accounts Amount No. of accounts Amount
1. Decrease in profit
9 11.94 5 2.64 1 3.00 3 12.80
2. Increase in loss 9 8.79 12 14.99 9 23.32 6 14.10 3. Non-disclosure
of material facts 4 3.91 0 0 6 36.83 3 0.61
4. Errors of classification
11 34.41 0 0 4 13.31 0 0
3.1.26 During the year, the statutory auditors had given qualified certificates on all the audited accounts received up to September 2013. The audit comments were based mainly on the non-compliance by the companies with the Accounting Standards namely AS-1 (Disclosure of Accounting Policies), AS-2 (Valuation of Inventories), AS-4 (Contingencies & events occurring after the Balance Sheet date), AS-15 (Employee Benefits) and AS-22 (Accounting for Taxes on Income).
3.1.27 Some of the important comments in respect of accounts of Companies audited during the year 2012-13 (up to September 2013) are stated below:

Chapter III: Economic Sector (State Public Sector Undertakings)
Audit Report for the year 2012-13, Government of Tripura
82
Tripura Industrial Development Corporation Limited (2011-12)
1) The one-time non-refundable lease premium of ` 2.96 crore received by the company during the year 2011-12 against the properties leased out for a period of 30 to 35 years should have been treated in the nature of ‘operating lease’ and recognised on a straight line basis over the lease term as per para 40 of AS-19. This has resulted in overstatement of ‘profit for the year’ by ` 2.92 crore with corresponding understatement of ‘Reserve & Surplus-Capital Reserve’ to the same extent.
2) Incorrect accounting of interest earned against project funds pertaining to Government of Tripura as the Company’s own income, has resulted in overstatement of ‘profit for the year’ by ` 1.19 crore and understatement of ‘Other Long-Term Liabilities’ to the same extent.
Tripura Forest Development and Plantation Corporation Limited (2011-12)
1) Non-provisioning towards actuarial valuation of liability as assessed by LIC of India in respect of Group Gratuity Scheme and Group Leave Encashment Schemes for the employees as on 31 March, 2012 has resulted in overstatement of profit for the year by ` 5.11 crore with corresponding understatement of Other Current Liabilities to the same extent.
2) Incorrect capitalisation of cost of construction of Head Office building (` 4.16 crore) prior to its actual completion led to excess charging of depreciation amounting to ` 28.36 lakh resulting in understatement of accumulated Profit to the same extent.
3.1.28 Similarly, the only working Statutory Corporation in the State (viz. Tripura Road Transport Corporation) for which CAG is the sole auditor, had forwarded its one year accounts (2009-10) to AG during the year 2012-13. The audit of the accounts forwarded by the corporation was completed. The results of the sole audit indicate that the quality of maintenance of accounts needs to be improved substantially.
3.1.29 Some of the important comments in respect of accounts of the Statutory Corporation are stated below.
Tripura Road Transport Corporation (2009-10)
1) The ‘Current Liabilities’ and the ‘Net Deficit’ of the Corporation for the year 2009-10 were understated by ` 1.98 crore due to non-provision for the liability against pay revision arrears of the employees for the period from January 2009 to March 2010.
2) The ‘Current Assets (Third Party Advance)’ of the Corporation included ` 49.90 lakh, being the advances pertaining to various suppliers and contractors up to the year 2002-03 without having complete party wise details. Since the chances of recovery/adjustment of the advance were remote, necessary provision should have been made in the accounts. This had resulted in overstatement of

Chapter III: Economic Sector (State Public Sector Undertakings)
Audit Report for the year 2012-13, Government of Tripura 83
Current Assets by ` 49.90 lakh with corresponding understatement of ‘accumulated deficit’ to the same extent.
3.1.30 The Statutory Auditors (Chartered Accountants) are required to furnish a detailed report upon various aspects including internal control/internal audit systems in the companies audited in accordance with the directions issued by the CAG to them under Section 619(3)(a) of the Companies Act, 1956 and to identify areas which needed improvement. An illustrative resume of major comments made by the Statutory Auditors on possible improvement in the internal audit/internal control system in respect of seven companies12 for the year 2012-13 are given below.
Table No. 3.1.11
Sl. No.
Nature of comments made by Statutory Auditors
Number of companies where
recommendations were made
Reference to serial number of the companies as per
Appendix 3.2
1. Non maintenance of proper fixed asset register
7 A2, A3, A4, A7, A8, A11, A12.
2. No/inadequate internal audit system 6 A2, A4, A7, A8, A11, A12. 3. Non maintenance of cost record 3 A2, A7, A11.
Status of placement of Separate Audit Reports
3.1.31 Separate Audit Reports (SARs) issued by the CAG on the accounts of Tripura Road Transport Corporation were placed in the Legislature by the Government up to 2008-09. The SAR for the year 2009-10 was issued in September 2013 which was yet to be placed in the State Assembly. The Government should ensure prompt placement of SARs in the Legislature.
Disinvestment, Privatisation and Restructuring of SPSUs
3.1.32 No disinvestment, privatisation or restructuring of SPSU occurred during 2012-13.
12 Serial number A-2, 3, 4, 7, 8, 11, 12 in Appendix – 3.2
Chapter III: Economic Sector (State Public Sector Undertakings)
Audit Report for the year 2012-13, Government of Tripura
84
INDUSTRIES AND COMMERCE DEPARTMENT (Tripura Handloom and Handicrafts Development Corporation Limited)
3.2 Performance audit of the working of Tripura Handloom and Handicrafts Development Corporation Limited
Handloom industry in the State of Tripura plays a dominant role in the economic development of the rural people by providing gainful employment. The State is also known for the rich diversity of its handicraft products. As per the latest Economic Review of Tripura (2011-12), there are about 1.19 lakh weavers in the State out of which 17,637 are organised under clusters. Tripura Handloom and Handicrafts Development Corporation Limited (Company) was incorporated (September 1974) primarily for promotion and strengthening of this sector on a commercial footing by supplying raw materials, marketing the finished products and running of production centres. At present, however, the activities of the Company are confined mainly to marketing of finished products procured from weavers and artisans. The performance of the Company in achieving its laid down objectives was evaluated during the present audit that mainly focused on the financial and operational management covering the period of five years from 2008-09 to 2012-13. A review of the functioning of the Company brought out the following main points:
Highlights: The Company did not have any long term or short term plan for achievement of its objectives. The sales targets set in the Memorandums of Understanding by the Government for the years 2008-09 to 2012-13 were neither achieved nor monitored.
(Paragraphs 3.2.6.1 and 3.2.6.2) As per the profitability statement prepared by Audit for the year 2012-13, 42 out of 43 emporia operated by the Company incurred losses.
{Paragraph 3.2.7.1(ii)} Accumulation of inventory and debtors due to their poor management resulted in severe strain on working capital.
(Paragraphs 3.2.7.6 and 3.2.9.4)
Contrary to its laid down objectives, the Company had been operating two power loom units at the behest of the State Government, which had caused negative impact on its financial interests
(Paragraphs 3.2.7.8) Undue delay in execution of Urban Haat Project resulted in cost escalation of ` 2.49 crore along with non-attainment of its objectives.
(Paragraph 3.2.8.2)

Chapter III: Economic Sector (State Public Sector Undertakings)
Audit Report for the year 2012-13, Government of Tripura 85
The Company had incurred operational losses during all the five years from 2008-09 to 2012-13 aggregating ` 33.77 crore. Despite capital infusion of ` 27.93 crore by the State Government during 2008-13, the entire paid up capital of the Company was wiped off by the losses and the net worth of the Company had become negative.
(Paragraphs 3.2.9.1 and 3.2.9.3) Monitoring activities and the internal control system of the Company were found to be deficient.
(Paragraphs 3.2.10.1 and 3.2.10.2)
3.2.1 Introduction
Handloom industry in the State of Tripura plays a dominant role in the economic development of the rural people by providing gainful employment. The State is also known for the rich diversity of its handicraft products. As per the latest Economic Review of Tripura (2011-12), there are about 1.19 lakh weavers in the State out of which 17,637 are organised under clusters. Tripura Handloom and Handicrafts Development Corporation Limited (Company) was incorporated (September 1974) with a view to organise the Handloom and Handicraft Industries of the State on a commercial footing, expand their market and create employment as well as improve the standards of living of the handloom and handicrafts artisans of the State. The Company operates under the administrative control of Department of Handloom, Handicrafts and Sericulture, Government of Tripura. During the year 2011-12, the Company could serve total 19321 weavers (viz. 16 per cent of total weavers in the State) in terms of procurement of finished products from them for selling in the market. The main objectives of the Company are to:
procure and supply raw materials or any other item required for handloom and handicrafts industry;
purchase or receive the finished handloom and handicrafts products of the weavers/artisans for selling the same in the market;
establish and run production units for handloom and handicrafts items by employing weavers and artisans;
set up/assist in setting up common facilities for the weavers/artisans and also arrange training for skill and design development for improving products quality; and
establish and operate depots within and outside the State, for exhibition and sale of handloom and handicrafts products of the weavers/artisans.
At present, the Company has been trading mainly in the Handloom/Handicraft items being procured from clusters of weavers/artisans within the State. The Company had 43 sales outlets named as emporia under the brand name “Purbasha” spread across four States viz., Tripura (33), Assam (3), West Bengal (6), and New Delhi (1) for selling its products. Besides, the Company had two Power loom Units (at Indranagar

Chapter III: Economic Sector (State Public Sector Undertakings)
Audit Report for the year 2012-13, Government of Tripura
86
and Badharghat), one Common Facility Centre and two Central Procurement Stores. As on 31 March 2013, the Company employed 384 employees.
The Company is wholly owned by Government of Tripura. Management of the Company vests with the Board of Directors (Board) comprising eleven members appointed by the State Government. The Board is headed by the Chairman and the day-to-day operations are carried out by the Managing Director, who is the Chief Executive of the Company.
3.2.2 Scope of Audit
The working of the Company was last reviewed and included in the Report of the Comptroller and Auditor General of India, Government of Tripura for the year ended 31 March 1998. The Report was considered by the Committee on Public Undertakings (COPU) in January 2001. The recommendations of COPU on the Report were included in the 37th Report of the COPU, which was placed before the Legislature on 10 September 2007. Action Taken Notes (ATNs) on the Report of the COPU were submitted to the Legislature on 8 March 2010. The status of compliance by the Company on the recommendations of COPU has been appropriately included in the present audit report13 .
The present audit reviews the performance of the Company covering the period 2008-09 to 2012-13. This audit involved scrutiny of Company’s records pertaining to planning, operational efficiency, implementation of schemes, financial management and inventory control etc. For this purpose Audit examined records at the Head Office as well as the records maintained by both the Central Procurement Stores and Power loom units14 of the Company. Besides, out of 33 emporia of the Company located in Tripura, 8 emporia15 were selected for audit using the method of Simple Random Sampling without Replacement.
3.2.3 Audit Objectives
The objectives of the performance audit were to ascertain whether: planning was adequate and effective for achieving Company’s objectives of
promoting the handloom and handicraft activities in the state; operational activities including procurement of handloom and handicrafts,
running of emporia, marketing and manpower management were done in an economic and effective manner;
the Schemes/Projects funded by the State/Central Government had been implemented in economic, effective and efficient manner;
financial management was efficient and effective; an effective monitoring and internal control system was in place ; and system existed for assessing the impact of Company’s activities in uplifting
socio–economic conditions of weavers/artisans in the State. 13 Paragraph 3.2.7.2 14 Located at Indranagar and Badarghat 15 H.O. complex, Sakuntala Road, Udaipur, Ranir Bazar, Jirania, Kaman Chowmuhani, Bishramganj and Melagarh (Last five were previously TAWCS emporia)

Chapter III: Economic Sector (State Public Sector Undertakings)
Audit Report for the year 2012-13, Government of Tripura 87
3.2.4 Audit Criteria
The audit criteria for assessing the achievement of the audit objectives were derived from the following sources:
Records relating to the targets set by State Government for Memorandums of Understanding (MOU) entered with the Company;
Directives/instructions/guidelines etc. issued by the State Government/Board from time to time;
Policies/Rules and Regulations of the Company with regard to manpower, discount, purchases, unit-wise targets. etc; and
Terms/conditions as well as the prescribed guidelines for various Central/State Government Schemes.
3.2.5 Audit Methodology
The Audit held (July 2013) entry conference with the Company Management wherein the scope, objectives, criteria of audit and audit sample-size were discussed. Audit examined relevant records based on which preliminary observations were issued to the Management and their replies, wherever received, were considered while drawing the audit conclusions. After receipt of Management’s reply on the draft report which was endorsed by the Government, an exit conference was held (December 2013) with the Secretary, Industries and Commerce Department, Government of Tripura (Secretary) and their responses were considered appropriately while finalising this Report.
The audit findings are discussed in the subsequent paragraphs.
Audit findings
Audit objective 1: Whether planning was adequate and effective for achieving Company’s objectives of promoting the handloom and handicraft activities in the state
3.2.6 Planning
3.2.6.1 Non preparation of perspective and annual plan
For achieving the objectives and ensuring the viability of State PSUs, the State Government desired (November 2009) to have a perspective plan of the Company. Audit observed that the Company did not prepare any such perspective plan. Further, the Company did not have even annual plans resulting in directionless operations of the Company. In the exit conference, the Secretary assured that the Company would prepare a perspective plan.
3.2.6.2 Memorandum of Understanding with State Government
The Company entered into Memorandums of Understanding (MOU) with the State Government on annual basis fixing annual targets of the Company with regard to

Chapter III: Economic Sector (State Public Sector Undertakings)
Audit Report for the year 2012-13, Government of Tripura
88
Turnover, Salaries, Wages and Other expenses. The status of sales targets and its achievement was as under:
Table No.3.2.1
It may be seen from above that MOU sales targets were not achieved in any of the five years. As per the MOU entered into during 2008-09, the sales targets for next four years from 2009-10 to 2012-13 were fixed at ` 4.65 crore, ` 5.30 crore, ` 6.10 crore, ` 7.00 crore respectively based on the sales projections made for the respective years. It was, however, observed that the annual sales targets for the respective years were fixed at significantly lower side than the projections made during 2008-09 based on previous years’ sales performance. The fixation of sales targets at lower values than the projections made in 2008-09 was indicative of the inadequacy of Company’s efforts towards marketing and sales promotion. It further reflected that the annual targets were merely based on the previous years’ sales without any study or evaluation of the potentials of the Company and its product.
Though the MOU provided for monitoring of Company’s performance on quarterly basis, in practice, however, there was no such monitoring done by the Government. The sales targets provided under MOU were not bifurcated for Government and private sales as the Government sales was merely a captive sales16. Therefore, the Company’s actual performance with reference to private sales in the competitive environment could not be judged or monitored by the Government.
In reply, the Government, while accepting the audit findings stated that main reason for non achievement of MOU targets was the inability of the Company to procure demandable items due to shortage of working capital. It was, however, observed that working capital position could have been improved by better management of inventory and sundry debtors as discussed under paragraph 3.2.7.6 and 3.2.9.4 infra.
3.2.6.3 Promotion of handloom and handicraft activities
The Company was formed (September 1974) with the prime objectives of promoting of handloom and handicrafts activities in the State by organising the Handloom and Handicrafts Industries on commercial footing, expanding their market as well as improving the standards of living of the handloom and handicrafts artisans of the State. A review of the Company’s records for five years revealed that the Company
16 Represents sales to various Government Departments/Undertakings based on the mandatory directions issued by the State Government to such Departments/undertakings
Year MOU sales target (` in crore)
Actual sales (` in crore)
Achievement (in percentage)
Shortfall (` in crore)
Shortfall (in percentage)
2008-09 4.30 2.96 68.84 1.34 31.16 2009-10 3.50 3.23 92.29 0.27 7.71 2010-11 4.00 3.75 93.75 0.25 6.25 2011-12 4.50 2.68 59.56 1.82 40.44 2012-13 3.40 2.61 76.76 0.79 23.24

Chapter III: Economic Sector (State Public Sector Undertakings)
Audit Report for the year 2012-13, Government of Tripura 89
did not plan specifically anything with reference to its primary objective of promoting the handloom and handicraft activities in the State.
Audit objective 2: Whether operational activities including procurement of handloom and handicrafts, running of emporia, marketing and manpower management were done in an economic and effective manner
3.2.7 Operational Performance
3.2.7.1 Performance of emporia
(i) Sales Performance
The emporia-wise and year-wise sales performance of the Company in Handloom and Handicraft products vis-a-vis the MOU targets for five years from 2008-09 to 2012-13 have been given in the Appendix-3.7.
Scrutiny of records revealed that although the Company had fixed the annual sales targets for the emporia over the years, no proper criteria, analysis or basis of such fixation of targets was seen on records by Audit. Analysis of the data compiled in the Appendix further shows that the achievement by the emporia against the annual sales targets was very poor. It was observed that 64 per cent of the total turnover of the emporia sales during 2008-09 to 2012-13 belonged to only three units i.e., H.O. Complex (37 per cent), New Delhi (18 per cent), Dhakuria (9 per cent). Further, 70 per cent of the handicraft sales during the said period was contributed by only two units i.e. H.O. Complex, Agartala, and New Delhi Emporium. It showed that excepting these two emporia, all the remaining emporia did not make any significant contribution in achieving the sales targets. The Company, however, failed to take any concrete remedial steps to improve the sales performance of these emporia.
(ii) Profitability
The Company did not analyse unit-wise profitability of various emporia. Consequently, meaningful review of performance of emporia did not exist. Unit wise profitability statement for the year 2012-13 as prepared by Audit and summarised under Appendix-3.8 revealed the following:
Out of total 43 emporia of the Company, only one emporium (viz. New Delhi emporium) earned profits and all the remaining 42 emporia (98 per cent) had incurred losses during the year. These losses have been arrived at without apportioning the Head Office overheads;
Only two17 of these forty three units were able to generate adequate contribution to meet their salary expenditure.
17 1. H.O. Complex, Agartala and 2. New Delhi

Chapter III: Economic Sector (State Public Sector Undertakings)
Audit Report for the year 2012-13, Government of Tripura
90
Margin on sales generated by six18 out of forty three units was not adequate to meet even their operational expenditure like electricity charges.
In view of the poor operational performance of the emporia, the Company needed to take concrete steps for making these emporia viable. To address the situation, the Company may require to take appropriate action to reduce its operational expenditure and also to improve the sales performance of the emporia through better marketing and improvement in quality of products.
In reply, the Government stated that efforts like closing down of emporia, withdrawal of excess staff, etc had been taken to minimise the losses. In the exit conference, the Secretary also agreed on the need to review the feasibility and viability of continuing the operations of these emporia.
3.2.7.2 Procurement of handloom and handicraft items
The Company mainly procures the items from the Clusters (Weavers’ Societies) and individual artisans. The Company’s annual procurement plans were based on the assessment of the capacity and readiness of various clusters, review of previous years’ sales performance and availability of working capital. Scrutiny of records, however, revealed that the Company prepared the annual procurement plans only up to 2010-11 and no such plan was prepared in subsequent years. The details of the procurement targets fixed by the Company under the annual procurement plans for three years ended 2010-11 vis-a-vis the actual procurements made there against are as under:
Table No.3.2.2 (` in crore)
Year Handloom Handicraft Target Achievement Target Achievement
2008-09 1.70 1.60 1.03 0.57 2009-10 2.00 1.23 1.21 0.85 2010-11 1.50 0.86 1.05 0.82
It may be seen from above that there was no consistency in procurement targets fixed over the years. The Company, however, could not achieve the procurement targets during any of the three years. It may also be observed that despite significant shortfall in the procurement targets during 2008-09, the procurement targets relating to Handloom and Handicrafts material for 2009-10 were enhanced. The above position is indicative of the fact that the procurement targets were fixed on ad hoc basis without any scientific study.
In reply, the Government stated that the major reason for the shortfall was the acute working capital crisis faced by the Company.
In this context, it may be stated that the shortfall against procurement targets was also discussed by COPU in its 37th Report on the Performance Audit conducted on the working of the Company for the period 1993-97. In the Action Taken Notes, the
18 1. Bishramganj, 2. Melagarh, 3. Ranirbazar, 4. Super Market, Dharmanagar, 5. Maniktala (Annex) and 6. New Delhi

Chapter III: Economic Sector (State Public Sector Undertakings)
Audit Report for the year 2012-13, Government of Tripura 91
Company had submitted that shortage of working capital was a major hindrance in achieving the purchase targets. It was, however, observed that no effective course of action was planned by the Government/Management so far so as to improve the liquidity position of the Company and overcome the working capital constraints.
3.2.7.3 Payment to weavers and artisans
The activities of the Company at present are confined mainly to marketing of finished products procured from weavers and artisans. The Company procured the finished products from the Clusters (weavers’ societies) and individual artisans only on credit basis. Scrutiny of records revealed that there were inordinate delays in making payments to the suppliers of the products against the supplies made by them. The details of dues outstanding for payment to suppliers (artisans and weavers) during the five years from 2008-09 to 2012-13 have been summarised as under:
Table No.3.2.3 (` in lakh)
Year Handicrafts Handloom 2008-09 25.95 32.422009-10 27.90 32.002010-11 46.12 27.342011-12 0.63 05.102012-13 7.34 03.49
It was observed that the dues payable to suppliers in respect of Handicrafts increased continuously up to 2010-11. The dues payable against supplies of Handloom items were also significant upto 2010-11. The substantial decline in dues, thereafter, was because of clearance of previous dues of artisans by the Company out of the one-time assistance of ` 1.20 crore provided (September 2011) by the Government for the purpose. Scrutiny of records revealed that while providing the said assistance, the Government had specifically directed (September 2011) that all future purchases should be made by the Company only on cash basis. Contrary to the said directions, however, the Company continued to make procurements on credit basis. As a result, the outstanding dues of the suppliers kept on accumulating again during 2011-12 and 2012-13.
While accepting the audit observations, the Government stated that all procurements are now being made as per the availability of funds and the outstanding bills of the weavers were being cleared.
3.2.7.4 Pricing
The Company did not have a documented policy for pricing of its products. As a matter of practice, the product prices were fixed on mark up basis by adding the overhead margin varying from 40 per cent to 50 per cent on the purchase cost. Prices were revised only on the basis of increase in wages and cost of materials. The system of conducting market survey, making comparative analysis of competitors’ prices, etc.

Chapter III: Economic Sector (State Public Sector Undertakings)
Audit Report for the year 2012-13, Government of Tripura
92
for fixation of selling price on scientific basis did not exist and hence, competitiveness of product prices could not be analysed.
Since the Company had a liberal discount system of allowing the discount at flat rate of 20 per cent on marked-up price (as discussed under paragraph 3.2.7.5 infra), the effective mark-up was reduced to 20 per cent 19 on cost price only. However, considering the fact that average overhead to sales ratio of the Company during 2008-09 to 2012-13 stood at 216 per cent20, the effective mark-up price of 20 per cent on cost price was highly inadequate to generate any meaningful contribution.
The Government in its reply stated that pricing of products was done in such a manner that the sale price should be competitive as per existing market prices. Necessary documents in support of the reply regarding evaluation of competitive prices were, however, not furnished to Audit.
3.2.7.5 Discount policy
As part of its promotional efforts, the Company had been offering discount sales throughout the year for different spells varying from 7 days (June) to 30 days (February-March) in a month. A review of discount sales period in last three years showed that actual average discount period was 160 days as against total 265 working days (60 per cent) in a year. Scrutiny of records further revealed that the discount rate was fixed at flat rate of 20 per cent on marked-up price and the annual calendar for discount was conveyed in advance to all the sales counters during the first month of the financial year. Announcement of discount rate and schedule of discount period in advance at the beginning of each year had detrimental effects on the normal sales of the Company during regular working days when discount was not available.
An analysis of sales at Head Office complex emporium, which contributed 58 per cent of total emporia turnover of the Company within the State revealed the following trends:
Table No.3.2.4 (` in lakh)
Year (1)
Net Discount
Sales (2)
Normal Sales (3)
Total discount Offered
(4)
Total Sales21
(2)+(3)=(5)
Percentage of Normal Sales to
Total Sales (3)/(5)x100=(6)
Average percentage of Normal Sales to Total
Sales (7)
2010-11 33.06 14.90 8.26 47.96 31.07 30.62 2011-12 34.30 15.28 8.57 49.58 30.82
2012-13 36.83 15.77 9.21 52.60 29.98
A significant observation could be made from above that the average ratio of normal sales to total sales during 2010-11 to 2012-13 was only 30.62 per cent and the balance 69.38 per cent of the average total sales was discount sales only. It reflected that the
19 Assuming per product cost at ` 100 and selling price at ` 150(with markup of 50 per cent on purchase cost), the net selling price per product (after allowing flat discount of 20 per cent) would be ` 120 only. 20 Sales comprise of sales to Government and sales (others); Overheads comprise of general and selling and distribution expenditure (Appendix-3.11). 21 Excluding sale of ‘Fabric Plus’ on commission basis
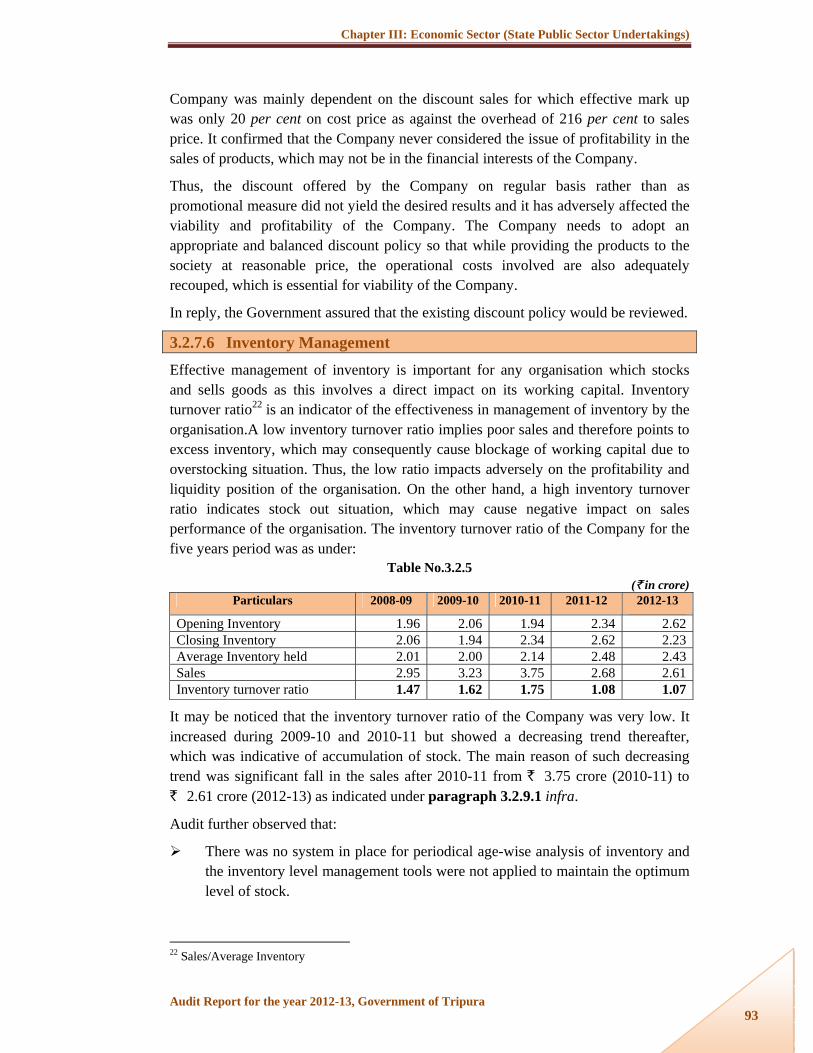
Chapter III: Economic Sector (State Public Sector Undertakings)
Audit Report for the year 2012-13, Government of Tripura 93
Company was mainly dependent on the discount sales for which effective mark up was only 20 per cent on cost price as against the overhead of 216 per cent to sales price. It confirmed that the Company never considered the issue of profitability in the sales of products, which may not be in the financial interests of the Company.
Thus, the discount offered by the Company on regular basis rather than as promotional measure did not yield the desired results and it has adversely affected the viability and profitability of the Company. The Company needs to adopt an appropriate and balanced discount policy so that while providing the products to the society at reasonable price, the operational costs involved are also adequately recouped, which is essential for viability of the Company.
In reply, the Government assured that the existing discount policy would be reviewed.
3.2.7.6 Inventory Management
Effective management of inventory is important for any organisation which stocks and sells goods as this involves a direct impact on its working capital. Inventory turnover ratio22 is an indicator of the effectiveness in management of inventory by the organisation.A low inventory turnover ratio implies poor sales and therefore points to excess inventory, which may consequently cause blockage of working capital due to overstocking situation. Thus, the low ratio impacts adversely on the profitability and liquidity position of the organisation. On the other hand, a high inventory turnover ratio indicates stock out situation, which may cause negative impact on sales performance of the organisation. The inventory turnover ratio of the Company for the five years period was as under:
Table No.3.2.5 (` in crore)
Particulars 2008-09 2009-10 2010-11 2011-12 2012-13
Opening Inventory 1.96 2.06 1.94 2.34 2.62Closing Inventory 2.06 1.94 2.34 2.62 2.23Average Inventory held 2.01 2.00 2.14 2.48 2.43Sales 2.95 3.23 3.75 2.68 2.61Inventory turnover ratio 1.47 1.62 1.75 1.08 1.07
It may be noticed that the inventory turnover ratio of the Company was very low. It increased during 2009-10 and 2010-11 but showed a decreasing trend thereafter, which was indicative of accumulation of stock. The main reason of such decreasing trend was significant fall in the sales after 2010-11 from ` 3.75 crore (2010-11) to ` 2.61 crore (2012-13) as indicated under paragraph 3.2.9.1 infra.
Audit further observed that:
There was no system in place for periodical age-wise analysis of inventory and the inventory level management tools were not applied to maintain the optimum level of stock.
22 Sales/Average Inventory

Chapter III: Economic Sector (State Public Sector Undertakings)
Audit Report for the year 2012-13, Government of Tripura
94
There was no independent annual physical verification of stock at the emporia as it was being carried out by the respective emporia staff only.
The determination of damaged stock was not done on regular basis. The damaged stock was not marked with indelible ink so as to avoid the possibility of getting it mixed with the good stock and selling the good stock as damaged stock.
In the exit conference, the Secretary agreed with the observation and emphasised on the need for improved inventory management.
3.2.7.7 Manpower management
As on 31 March 2013, the Company had total manpower strength of 384 employees. Manpower strength and the percentage of salary expenditure as a part of total administrative expenditure were as under:
Table No.3.2.6
As mentioned earlier, the massive increase in manpower strength during 2010-11 was due to merger of Tripura Apex Weavers’ Cooperative Society Limited with the Company.
Despite surplus staff in the Company, 138 No. of Daily Rated Workers/Casual Labourers/Contingent Workers included in the above total number of employees were regularised from December 2012 resulting in increased salary commitment of ` 72 lakh per annum23.
Business generated per employee by three emporia was ` 5000 or less per annum24 in 2012-13 (Appendix-3.9);
Major portion (51 per cent) of the staff belonged to unskilled (Group D) category. Hence, the productivity of surplus labour was low;
Key Department like Accounts Wing was not manned by specialist officers causing adverse impact on the quality of maintenance of accounts and other records; and
Human Resource Development practices like training was absent though the staff relating to Sales and Marketing Department was regularly dealing with general public. This could adversely affect the repute and reliability of the Company in the general public and stakeholders.
Since the Company was not able to generate any surplus as explained above, the Government had been providing financial assistance in the form of Share Capital contribution for meeting the salary expenditure of the Company resulting in an avoidable burden on the public exchequer. 23 Based on projections made by the Company 24 Ambassa - ` 5000, Ranirbazar - ` 3000 and Bishramganj - ` 1000
Year 2008-09 2009-10 2010-11 2011-12 2012-13 No. of employees 298 285 406 388 384Percentage of salary to total Administrative Expenditure
87.43 83.30 89.35 95.71 92.97

Chapter III: Economic Sector (State Public Sector Undertakings)
Audit Report for the year 2012-13, Government of Tripura 95
In reply, the Government stated that several steps were initiated for withdrawal of surplus staff from the Company so as to minimise its salary burden. However, necessary documents in support of the reply and the results thereof was not furnished.
3.2.7.8 Operation of Power loom Units
The activities relating to the production and marketing of Power loom products did not form part of the Company’s objectives as per its Memorandum of Association. The State Government had also categorically instructed (April 2008) that the Company should not in any way be involved in marketing of Power loom fabrics since it was against its founding objectives of promoting and strengthening the handloom and handicraft sector in the State. It was, however, observed that contrary to the above directions, the Government transferred (July 2009/June 2012) two power loom units to the Company, which were previously run by the Industries Department, for production of grey silk sarees and silk fabrics with the following directions:
• Printing on the grey silk sarees would be done at the Company’s silk printing unit at Indranagar;
• Marketing of the finished products was to be done partly by the Company and partly by a weavers’ society, namely Muhuripur Tant Silpa Samavaya Samithi Ltd (MTSSS);
During the four year period from 2009-10 to 2012-13, these units produced 4347 Grey silk sarees at a total cost of production of ` 55.37 lakh. It was, however, observed that the downward linkage in the production chain could not be achieved due to non- commissioning of Silk Printing Unit as discussed under paragraph 3.2.8.3. As the Grey silk sarees without printing were not marketable,the Company decided to get these sarees printed at MTSSS and also outside the state. The details of production and dispatch of these sarees for printing under these two arrangements in each of the five years is given in Appendix-3.10. In this connection, following observations are made:
During the period from August 2009 to September 2012, total 1867 grey silk sarees involving cost of production of ` 19.53 lakh (average cost of production ` 1046/- per saree) were issued to MTSSS for printing. It was, however, observed that the above arrangement with MTSSS was not formalised with definite terms and conditions on all important issues.
Out of the above stock dispatched to MTSSS, the Company purchased back 714 sarees after printing at the price charged by MTSSS ranging between ` 4000 to ` 1250 per saree valued at total amount of ` 14.45 lakh. The remaining stock of 1153 sarees (cost of production ` 12.26 lakh) dispatched during the period 2011-12 to 2012-13 had not been returned by the MTSSS so far. The reasons of non-return of 1153 sarees were neither found on the record nor furnished to Audit though called for. Since there were no clear terms and conditions, the possibility of complete loss of the said stock could not be ruled out.
In April 2012, 560 sarees (cost of production ` 6.90 lakh) were dispatched to the Company’s Branch Office at Kolkata for printing through private parties. It

Chapter III: Economic Sector (State Public Sector Undertakings)
Audit Report for the year 2012-13, Government of Tripura
96
was, however, observed that out of the said stock, only 75 sarees valued ` 0.92 lakh were received (January 2013) back by the Company after printing and balance stock of 485 sarees (cost of production ` 5.16 lakh) was pending to be received by the Company even after one and a half years of its despatch.
Thus, the operations of the power loom units at the behest of the State Government were contrary to its own directions as well as to the laid down objectives of the Company. The Company is also likely to sustain losses in the operationsof these units in absence of an effective system for monitoring and follow up of the saree stock issued to private parties for printing.
While confirming the facts, the Government did not offer any specific reply with regard to entrustment of the power loom operations to the Company contrary to its own directions. Reply of the Government was also silent on supplying the silk saree stock to MTSSS for printing without any terms and conditions as well as non-recovery of the saree stock lying with MTSSS. As regards non-receipt of Sarees from Kolkata after printing, the Government stated that the matter was under reconciliation.
Audit objective 3: Whether the Schemes/Projects funded by the State/Central Government had been implemented in economic, effective and efficient manner
3.2.8 Implementation of Projects
Development of Head Office Complex, Urban Haat and Silk Printing Unit were the three major projects undertaken by the Company during the period of five years covered in the Audit. During 2008-09 to 2012-13, the Company received an amount of ` 10.31 crore from the Government of India/State Government towards implementation of these projects in addition to ` 0.75 crore received prior to 2008-09. As against the available funds aggregating ` 11.07 crore, the Company utilised an amount of ` 3.68 crore (33.24 per cent), the details of which are given below:
Table No.3.2.7 (` in crore)
Sl. No.
Name of the Project/Scheme
Opening balance as on
1/4/2008
Total receipt
Total fund available
Total expenditure
incurred
Closing balance of funds as on 31/03/2013
1. Development of Purbasha Head Office Complex
Nil 8.71 8.71 1.92 6.79
2. Urban Haat 0.49 1.37 1.86 1.46 0.403. Silk Printing
Unit 0.26 0.24 0.50 0.30 0.20
The Audit observations on implementation of the above schemes by the Company are discussed in succeeding paragraphs:

Chapter III: Economic Sector (State Public Sector Undertakings)
Audit Report for the year 2012-13, Government of Tripura 97
3.2.8.1 Development of Head Office Complex
The Draft Project Report (DPR) for development of 1st phase of Head Office Complex of the Company with facilities for showrooms and godowns was approved by the Government of Tripura in June 2009. Subsequently, an estimate amounting to ` 14.28 crore for the work was also approved (April 2010).
Scrutiny of records revealed that the DPR for the project was prepared by a Delhi based consultancy firm ‘Shristhi’ (Consultants), which was appointed by the Company without inviting open tenders. The work scope of the Consultants also include preparation of cost estimates, tender documents, etc. for the project as well as rendering necessary assistance in awarding and monitoring of the work to a contractor for execution of project work. The Consultants were entitled for a consultancy fee of ` 55.25 lakh at the rate of 6.5 per cent of estimate cost of work (` 8.50 crore).
Tenders were invited by the Company for execution of the project stipulating certain prequalification criteria. It was observed that the invitation of the tenders was restricted to the local newspapers only. As a result, the Company received only two offers against the tender and the work was awarded (September 2010) to the lowest bidder (Contractor) ignoring the fact that the bidder did not meet the pre-qualification criteria of having successfully executed the prescribed quantum of work. The work was scheduled for completion by June 2012. Scrutiny of records revealed that execution of the work was delayed on many occasions due to deviation from design, poor quality of execution and use of unspecified materials. As admitted by the Contractor, the work of the project was complicated and was of exotic nature. The state of affairs as stated above was indicative of the fact that while selecting the Contractor, the Company/Consultant failed to properly evaluate the technical competence and capability of the bidders taking congnizance of the prequalification criteria. As a result, execution of the project suffered due to unforeseen delays and the project was still pending for completion (December 2013).
In reply, the Government stated that the Contractor was selected by considering both technical and financial bids. The reply is not tenable as the conditions of technical bid regarding successful completion of prescribed value of work by the bidder were not strictly followed at the time of selection of the work contractor. In fact, in view of nature and volume of work involved, the Company should have given wider publicity to the work Tender rather than restricting it to the local newspapers only.
3.2.8.2 Urban Haat
With a view to provide direct marketing facilities to crafts persons/weavers in various States throughout the country, the Government of India formulated the Urban Haat Scheme as part of the Ninth Five Year Plan (1998-2002). Urban Haat was to include Craft shops, Food courts, Exhibition Hall, Children’s play area, Lily Pond and an Amphitheatre. As per the scheme, the Haats were to be self sustainable based on the potential of the income from stall/exhibition hall rentals from artisans, entry ticket sale and food courts.

Chapter III: Economic Sector (State Public Sector Undertakings)
Audit Report for the year 2012-13, Government of Tripura
98
The Urban Haat Project in Tripura was approved (January 2002) by GOI at an estimated cost of ` 1.35 crore (to be funded in the ratio of 70:30 by Central and State Governments). Due to delays in taking up the project, the cost estimates for the project escalated to ` 2.85 crore. Taking a note of significant increase in the cost estimates, the State Government decided (January 2005) to keep the project in abeyance.
In March 2006, a revised project proposal and estimates were placed before the Government. This revised project estimates were confined only to the essential elements of project so as to keep the cost within the original project cost (` 1.35 crore) sanctioned by the Government. Tenders were invited (April 2007) and work was awarded to the lowest bidder at an estimated cost of ` 1.13 crore with stipulation to complete the work by July 2008. It was, however, observed that the contractor could complete the first phase of the Urban Haat project after a delay of two and half years from the scheduled date in January 2011.
As per the CPWD Manual, the Company was required to maintain the Hindrance Register detailing the stage-wise reasons for delays in execution of the project. No such Register or other records were, however, maintained by the Company. As a result, the Audit could not analyse the stage-wise reasons responsible for delay in execution of the project. It was, however, observed that the following reasons directly contributed to the delay in execution:
Pre-project formalities like soil testing, clearing of site, etc. were not completed in advance before handing over the site to the contractor, resulting in delay of almost five months in commencement of project work.
Based on the proposal of the Company to complete the left out components of the project under first phase, the State Government approved the second phase of the project at estimated cost of ` 2.49 crore. Even though it was evident that the available funds were not sufficient to complete the entire project, the proposal for the second phase was placed before the State Government only in May 2008 and techno feasibility report submitted only in June 2010. Even after release of first installment of funds by GOI in September 2011, actual work at site for the second phase of the project was commenced only after 13 months in October 2012.
Audit observed that many of the Urban Haat projects which commenced simultaneously elsewhere in the country had been successfully completed25 while the project relating to the Tripura State was still pending for completion as shown in the following photographs.
25Eg. Urban Haats at Bhubneswar, Ahmedabad, Uchana (Haryana), Jammu, Tirupati, Gohar Mahal (M.P), Jodhpur, Agra, Srinagar, Raipur, Bhuj, Mysore, Dimapur, Konark and Pitampura (Delhi).

Chapter III: Economic Sector (State Public Sector Undertakings)
Audit Report for the year 2012-13, Government of Tripura 99
Thus, undue delay in execution of Urban Haat Project due to above-mentioned reasons resulted in escalation of ` 2.49 crore in the project cost besides unproductive investment of funds along with the related social costs.
The Government in its reply stated that escalation in project cost was due to revised project proposal. Reply is not tenable since revised project proposal itself was necessitated due to non completion of all the elements of the Urban Haat Project in entirety.
Thus, both the prestigious and important projects for the State being executed by the Company were delayed due to various reasons even though adequate funds had been made available by Central and State Governments.
3.2.8.3 Silk Printing Unit
The Company received (February 2005) a fund of ` 21.61 lakh from the Government under Additional Central Assistance for installation of a Silk printing unit for printing and dyeing of silk fabrics. It was, however, observed that significant portion of the funds amounting to ` 20 lakh was diverted (March-April 2005) by the Company towards payment of dues to weavers and artisans without any intimation/approval of the Government. When the Government insisted (April 2007) for submission of utilisation certificate of the fund, the Company intimated (June 2007) about the diversion with request for additional fund of ` 20.00 lakh for execution of the work. Government sanctioned (December 2007) an additional fund of ` 26.50 lakh based on a revised project proposal for installation of the Unit.
Audit scrutiny revealed that for execution of the project a committee headed by the Managing Director was constituted (July 2007) with the responsibility for purchase of machineries and equipment to be installed in the Silk Printing Unit. During the period up to January 2009, the Company spent ` 28.52 lakh for procurement of machineries, building construction, effluent treatment plant, fee payment to consultant etc. The Company faced technical difficulties in installation and commissioning of the machines and other equipment so procured. As a result, the unit was still pending for commissioning (October 2013).
Urban Haat Navi Mumbai taken up in 2003 was commissioned in 2008
Present state of Urban Haat, Agartala

C
Teimw
Inex
A
3
3
A0o
Finco`ad`inpr(Tadsu
Chapter III: Ec
Thus, the Coight years d
machineries awork at addit
n reply, the xpected to b
Audit object
.2.9 Finan
.2.9.1 W
An overview 9 to 2012-13f the Compa
rom the chancreased froonsiderable 6.81 crore dministrativ 7.20 crore ncreased by rimarily dueTAWCS) wdministrativucceeding pa
-20
-15
-10
-5
0
5
(` in
cro
re)
conomic Secto
ompany failedespite spendand equipmional costs.
Governmene completed
ive 4: Whet
nce Manag
Working Re
of the opera3 are given iany for the p
art above, it om ` 2.96
increase i(2010-11) m
e expenditu(2010-11).
more than 1e to mergerwith the Ce expendituraragraphs.
2.96
-2.972008-09
or (State Publi
Aud
ed to install ding ` 28.5ent, besides
nt stated thad within a mo
ther financi
gement
esults
ational resulin Appendixeriod of five
may be notcrore in 20
in operationmainly becaure of the
After 201138 per centr of TripuraCompany dre without co
3.23
-1.632009-10
CTurnover
Tur
ic Sector Und
dit Report for
and commi2 lakh, whi forcing the
at the commonth or two.
ial managem
lts of the Cox-3.11. The te years are d
ticed that alt008-09 to `nal losses ause of subst
Company 0-11, the ot (` 9.41 croa Apex Weduring 2010orresponding
3.75
-6
2010-
Chart No. 3and Worki
rnover N
ertakings)
r the year 2012
ission the Sich may leae Company
missioning o
ment was eff
ompany duriturnover vis
depicted in th
though the t` 3.75 crore
from ` 2.tantial increfrom ` 3
operational ore) to ` 16eavers’ Coop0-11 and g increase in
2.6
6.81
-11 20
.5 ing Results
Net Loss
2-13, Governm
Silk Printing d to obsolesto outsource
of Silk Print
ficient and e
ng the perio-a-vis the w
he following
turnover of e in 2010-1.97 crore
ease (` 3.35.85 crore losses of t.22 crore duperative Socconsequent n turnover as
68
-6.14
011-12
ment of Tripur
Unit for lascence of the the printin
ting Unit wa
effective
od from 2008orking resul chart:
the Compan11, there wa(2008-09) t crore) in th(2008-09) tthe Companuring 2012-1ciety Limite
increase is discussed i
2.61
-16.22
2012-13
ra
ast he ng
as
8-lts
ny as to he to ny 13 ed in in

Chapter III: Economic Sector (State Public Sector Undertakings)
Audit Report for the year 2012-13, Government of Tripura 101
3.2.9.2 Merger of Tripura Apex Weavers’ Cooperative Society
The TAWCS was engaged in sale of handloom products through own showrooms. In view of the decision taken by the Government, the Board of Directors of the Company approved (7 July 2007) the proposal for merger of both the organisations in anticipation that the merger would create synergy and hasten the development of the sector. The merger which was effective from 20 May 2010 had, however, caused an additional salary commitment for the Company to the tune of ` 2.01 crore per year in respect of 131 employees of TAWCS added on the pay roll of the Company. At the time of merger, TAWCS had a paid up Share Capital of ` 15.66 crore and an insignificant net worth of ` 0.38 crore after taking into account the accumulated losses of ` 15.28 crore.
Audit analysis of the financial implications of the merger on the performance of the Company revealed that during the next three years after the merger (from May 2010 to March 2013), the Company had to bear additional salary expenditure of ` 6.06 crore 26 against the employees of erstwhile TAWCS. As against this, the additional net margin generated against the turnover of 24 TAWCS emporia was only ` 0.13 crore (2.15 per cent). The significant disproportion in the benefits accrued vis-à-vis the expenditure committed in post merger scenario indicated that the merger was carried out without conducting a proper business study and without preparing an action plan so as to make the merger mutually advantageous. As a result, the merger of TAWCS with the Company proved to be a burden for the Company adding to its operational losses and worsening its financial position.
In reply, the Government stated that the intended goals of the merger could not be achieved due to shortage of working capital.
The reply is indicative of the fact that while taking decision for merger of TAWCS with the Company, all relevant factors having direct bearing on the financial interests of the Company were not taken into account. Further, the analysis carried out by Audit indicated that the major reason for shortage of working capital was poor management of inventory and debtors as mentioned under paragraphs 3.2.7.6 and 3.2.9.4. Thus, failure on part of the Company in improving the inventory and debtors management system was also responsible for deterioration in the working capital position of the Company to some extent.
3.2.9.3 Financial Position
The details of the financial position of the Company as per its certified accounts for the years from 2008-09 to 2012-13 are given below:
26 Represents actual salary expenditure incurred by the Company during the period against the employees of TAWCS added on Company’s rolls.

Chapter III: Economic Sector (State Public Sector Undertakings)
Audit Report for the year 2012-13, Government of Tripura
102
Table No.3.2.8 (` in crore)
Scrutiny of records revealed that during five years’ period from 2008-09 to 2012-13, the State Government had made total equity contribution of ` 27.93 crore30 in the Company. It may, however, be observed that despite said capital infusion by the State Government, the entire paid up capital of the Company was wiped off by the losses and the net worth of the Company had become negative. It was further observed that there was no capital expenditure of the Company against the equity contribution made by the State Government and the entire capital addition was being utilised for meeting day to day revenue expenditure only. As a result, the Company continued to be sick over the years.
3.2.9.4 Debtors management The Company sells goods on credit only to Government Departments and related agencies. The status of the debtors over the years has been as under:
Table No.3.2.9 (` in crore)
Year Opening Balance Credit Sales Collection Closing Balance 2008-09 4.08 1.59 1.42 4.25 2009-10 4.25 1.78 0.78 5.25 2010-11 5.25 2.13 1.26 6.12 2011-12 6.12 1.05 0.62 6.55 2012-13 6.55 1.45 1.24 6.76 Total 8.00 5.32
27 Share suspense represents the amount received from the State Government towards share capital pending allotment. 28 As per the revised format of Schedule-VI of the Companies Act, 1956 (effective from 2011-12) accumulated loss had to be disclosed under Reserves & Surplus 29 Capital employed represents “Share-holders' funds plus Long-term Borrowings” 30 Paid-up capital as on 31March 2013 (` 67.34 crore) minus Paid-up capital as on 1 April 2008 (` 23.75 crore) minus Paid-up capital of TAWCS (` 15.66 crore) = Capital infusion during 2008-13 (` 27.93 crore)
Particulars 2008-09 2009-10 2010-11 2011-12 2012-13 A. Liabilities a) Paid-up capital (including Share suspense27)
26.80 30.67 53.14 59.88 67.34
(b) Reserves and surplus (27.50) (26.21) (52.78) (61.28)28 (77.50) (c ) Long-term borrowings 5.87 4.34 4.38 4.27 4.27 (d) Other long-term liabilities Nil Nil Nil 9.16 9.23 (e) Trade dues, current liabilities and provisions
7.41 7.65 10.41 9.14 17.16
Total A 12.58 16.45 15.15 21.17 20.50 B. Assets (a) Gross lock 2.56 2.56 2.85 2.89 2.91 (b) Depreciation 1.87 1.93 1.99 2.05 2.11 (c) Net fixed assets 0.69 0.63 0.86 0.84 0.80 (d) Capital work-in-progress Nil Nil Nil 1.16 1.16(e) Current Assets, loans and advances
11.89 15.82 14.29 19.17 18.54
Total B 12.58 16.45 15.15 21.17 20.50 C. Capital employed29 5.17 8.80 4.74 2.87 (5.89) Net Worth (0.70) 4.46 0.36 (1.40) (10.16)

Chapter III: Economic Sector (State Public Sector Undertakings)
Audit Report for the year 2012-13, Government of Tripura 103
It may be seen that the closing balance of sundry debtors had been increasing year after year and the recoveries from debtors were not even sufficient to match the credit sales of that year itself.
Scrutiny of records revealed that as per the certified accounts of the Company as on 31 March 2012-13, 33 per cent of the total receivables were due only from the Directorate of Panchayat. As on 31 March 2013, the Company had total receivables of ` 6.76 crore against 285 parties. It was observed that the accounts of 159 out of these 285 parties involving receivables of ` 1.05 crore were dormant during all the five years under reference. It was further observed that there was no system of obtaining the confirmation of outstanding balances from the debtors on year to year basis. The Company also did not conduct age-wise analysis of receivables and review of their realisability so as to make appropriate provisions against doubtful debts. Thus, the efforts made by the Company for monitoring and follow up of receivables outstanding against sundry debtors were inadequate and had adversely affected the liquidity position of the Company. As a result, the Company faced shortage of working capital in meeting the requirements of its day-to-day operations.
In the exit conference, the Secretary appreciated the audit observation and agreed for taking necessary corrective steps.
Audit objective 5: Whether an effective monitoring and internal control system was in place
3.2.10 Monitoring
3.2.10.1 Corporate Governance
A good and effective corporate governance provides the framework for attaining the objectives of an organisation. It encompasses every sphere of management from action plans and internal controls to performance measurement of the organisation.
The Board of Directors of the Company comprised of eleven members including a full time Managing Director who was the Chief Executive of the Company. Official members of Industries and Finance Departments were the representatives of these Departments in the Board. In this connection, following deficiencies were observed in the functioning of the Board which had adverse impact on the monitoring activities of the Company through better corporate governance:
i) The Company did not have a full time MD during the period of five years covered by Audit. In absence of a full time MD, the Director, Handloom, Handicrafts and Sericulture performed the duties of Chief Executive of the Company.
ii) As against total number of 22 meetings of the Board held during 2008-13, Secretary, Industries & Commerce (HHS) attended only one meeting while representative of Finance Department attended the meetings only on five occasions.

Chapter III: Economic Sector (State Public Sector Undertakings)
Audit Report for the year 2012-13, Government of Tripura
104
iii) The Board, in its 121st Meeting (November 2007) decided that development activities taken up by the Company for weavers and artisans should be stated in detail in future meetings. This issue, however, never appeared again in the Board meeting.
iv) The Board never discussed and reviewed the Company’s poor performance and reasons thereof. It also never considered the steps to be taken to improve the financial status of the Company.
3.2.10.2 Internal Control
Internal control systems of an organisation ensure achievement of organisational objectives, effective utilisation of resources, safeguarding of assets and availability of reliable information to the management and other stakeholders. Audit noticed the following deficiencies in internal control:
There was no system of internal audit; Budgetary control system was absent; There were no operational or financial manuals; Bank reconciliations were not carried out periodically; Emporia staff was not rotated periodically; Surprise verification of cash in the emporia was not conducted and the monthly
statements sent by the emporia were not being reconciled with Head Office records;
Management Information System was absent; There was no system of cross verification of data generated by various
Departments; and Accounts wing of the Company was weak and was entirely dependent on
external agencies for compilation of transactions. The Government agreed with the audit observations and assured to take the necessary corrective action.
Audit objective 6: Whether system existed for assessing the impact of Company’s activities in uplifting socio–economic conditions of weavers/artisans in the State
3.2.11 Impact assessment
The Company was established to improve the socio-economic conditions of the artisans and weavers by undertaking a variety of activities having direct and indirect impact in their sphere of activity. For this purpose, the Company implemented various projects and undertook commercial activities using Government assistance. The Company was, however, not prompt in making payment of dues of the artisans and weavers against the cost of finished products procured from them for selling in the market mainly on account of working capital crisis as discussed under paragraph 3.2.7.3 supra. Inordinate delays by the Company in clearing the dues of the weavers/artisans had adversely affected the economic conditions of these weavers/artisans, which was not in lines with its laid down objectives. It was the duty

Chapter III: Economic Sector (State Public Sector Undertakings)
Audit Report for the year 2012-13, Government of Tripura 105
of the Company to analyse the impact of its operations on its beneficiaries. It was, however, observed that the Company did not even have basic data regarding its beneficiary community, not to mention the impact it had on their operations. Consequently, it remained in the dark regarding the role it was performing in the Handloom and Handicraft sector of the State.
3.2.12 Conclusion
The Company was formed with the prime objective of promoting and strengthening the Handloom and Handicraft sectors in the State by supplying raw materials to weavers and artisans, marketing the finished products and running of production centres. The present activities of the Company are, however, confined mainly to marketing of finished products procured from weavers and artisans.
The Company had no vision or planned orientation in achieving the stated objectives. The system of forming MOUs between the Company and the Government was not effective as the annual targets of turnover and operational expenses of the Company fixed there under were not based on any scientific study.
The Company did not have a documented pricing policy. The liberal discount system followed by the Company on regular basis had adverse impact on its viability and profitability. As per the unit-wise profitability worked out by Audit for 2012-13, excepting one emporium, all 43 emporia of the Company had incurred losses. Contrary to its laid down objectives, the Company had been operating two power loom units at the behest of the State Government, which had caused negative impact on its financial interests.
All three major projects taken up by the Company during five years period had suffered time and cost overruns mainly due to reasons like, improper selection of work contractor, non-completion of pre-project formalities in time, technical difficulties in installation of machines, etc. As a result, intended objectives of the projects could not be achieved.
Despite capital infusion of ` 27.93 crore by the State Government during 2008-09 to 2012-13, Company had been facing working capital crunch due to continuous operational losses. The merger of Tripura Apex Weaver’s Co-operative Society (TAWCS) with the Company had also adversely affected its financial position as there was significant disproportion between the benefits accrued vis-à-vis addition in the committed expenditure towards manpower cost of the Company in post merger scenario.
Internal control and monitoring system was almost non-existent in the Company.
The Company did not make any effort to assess the impact of its activities in uplifting socio economic conditions of the weavers/artisans in the State.

Chapter III: Economic Sector (State Public Sector Undertakings)
Audit Report for the year 2012-13, Government of Tripura
106
3.2.13 Recommendations
The Government/Company may consider the following recommendations:
The Government should ensure that the Company develops a long term Perspective Plan fixing feasible annual targets/goals on scientific basis in lines with its laid down objectives. ;
To make the operations of the emporia viable, the Company needs to review its discount policy so that the discount is offered as a promotional measure rather than allowing the same on routine basis. The Government needs to take decision on continuing with the operations of Company’s power loom units duly considering it’s laid down objectives.
The commissioning of on-going projects be expedited so as to achieve the intended objectives.
The working capital position of the Company needs to be improved through close monitoring and effective management of its major components like debtors and inventory using modern managerial tools.
The Company needs to improve Corporate Governance and overhaul its internal control/management information system in order to ensure effective monitoring and control of its operations.
In the Exit Conference, the Secretary accepted the audit recommendations and assured necessary corrective actions

Chapter III: Economic Sector (State Public Sector Undertakings)
Audit Report for the year 2012-13, Government of Tripura 107
INDUSTRIES AND COMMERCE DEPARTMENT (Tripura Industrial Development Corporation Limited)
3.3 Loss of revenue
Failure of the Company to incorporate an appropriate clause in lease agreements for recovery of lease premium and rent at revised rates had resulted in loss of revenue of ` 62.20 lakh
The Tripura Industrial Development Corporation Limited (Company) allotted land/sheds to the industrial units located at Bodhjungnagar Growth Centre on lease basis for 30 years. The Company had been charging one-time non-refundable lease premium of ` 1 lakh per acre of land/per shed and monthly lease of ` 4,000 per acre (of land) and ` 5,000 per shed in respect of land and sheds respectively as per the rates fixed in 1998.
Considering the present market value of the locality, it was proposed in the meeting (15 September 2006) of the Board of Directors (BOD) to enhance the one-time non-refundable lease premium to ` 5 lakh for per acre of land and ` 2 lakh per shed with monthly lease rent of ` 5000 per acre of land and ` 6000 per shed respectively. BOD deferred (September 2006) the decision on the proposed increase till the next meeting and directed that provisional allotment of land and shed be continued after adding a new clause in the lease agreement that new allottees shall pay premium and rent at the rate enhanced by the Board. Based on the decision taken in a subsequent meeting (September 2008) of BOD, the rates were finally enhanced with effect from October 2008. As per the revised rates, the land premium per acre was fixed at ` 2.50 lakh and premium per shed fixed at ` 5 lakh while monthly rent for land and shed were revised to ` 6000 per acre and ` 7000 per shed respectively.
Scrutiny of records (January 2013) revealed that during September 2006 to October 2008, the Company had allotted 24.05 acres of land to six industrial units. It was, however, observed that as per the directions (September 2006) of the BOD, the Company had incorporated a clause in these lease agreements to charge lease premium and lease rent as per the revised rates after final decision of the Company in this regard. But the Company could not realise the enhanced one-time lease premium as well as the revised monthly lease rent from these allottees (effective from October 2008) as these lease agreements contained contradictory provisions for increase in lease rent only after expiry of 5/10 years31 of the lease period. This had resulted in avoidable loss of revenue of ` 62.20 lakh towards lease premium and rent upto December 2013 (Appendix 3.12).
In reply, the Company accepted (April 2013) the fact that enhanced rates could not be implemented due to the insertion of a refraining clause in the agreements.
31 5 years in respect of 3 units (M/s Agartala Rubber Industry, M/s Brite Rubber Processor (P) Ltd and M/s Rotomec) and 10 years in respect of 3 units (M/s Agartala Food Processing (P) Ltd, M/s Dharampal Premchand Ltd and M/s Bengal Breweries (P) Ltd)

Chapter III: Economic Sector (State Public Sector Undertakings)
Audit Report for the year 2012-13, Government of Tripura
108
Thus, failure of the Company to incorporate an appropriate clause in lease agreements for recovery of premium and rent at revised rates as per the directions of the Board of Directors had resulted in loss of revenue of ` 62.20 lakh.
The Director, Industries and Commerce Department, while endorsing the reply of the Company, stated (August 2013) that the number of new lessees during 2008-09 to 2012-13 (60) vis-a vis the number of units closed during the same period (24) gives the dismal picture of demands for land and sheds for industrial purpose, and in a situation where there was no demand for land and sheds the Management could not implement the Board’s decision in order to attract more investors in industrial sector.
The reply regarding low demand during 2008-12 is not relevant and appears to be an afterthought as the audit observation pertained to the allotments made during September 2006 to October 2008. Further, Management’s decision to incorporate the contradictory clause in the lease agreements without the approval of the BOD was irregular.
The matter was reported (July 2013) to the Government; their replies had not been received (January 2014).
3.4 Loss due to injudicious investments
Due to improper investment of funds in absence of a scientific method for investment planning, the Company suffered an avoidable interest loss of ` 22.98 lakh.
The Tripura Industrial Development Corporation Limited (Company) acts as an implementing agency for execution of various industrial infrastructure development projects in Tripura. The Company receives funds from the Government of India/ Government of Tripura from time to time against the sanctioned projects. The project funds as well as the Company’s own funds generated out of lease premium/rent are invested by the Company in various Fixed Deposits (FDs) with banks. Thus, the Company needs to invest the surplus funds in FDs in such a manner so that the returns on these investments are maximised. For the purpose, the Company should analyse the interest rates of FDs offered by various banks duly taking into account other relevant factors (viz. safety of invested funds, liquidity options, etc.) before arriving at final decision.
During the review (January 2013) of funds invested by the Company in FDs during 2006-07 to 2012-13, it was revealed that in 46 cases, FDs were made with different banks on the same/nearer date(s) at varying rates of interest, without cross-verifying the available higher rates of interest. The Company could have earned an additional income of ` 22.98 lakh (Appendix 3.13) in these cases by investing in FDs with the banks offering higher rates of interest on the particular date.
In reply to the observation raised at initial stage, the Company stated (April 2013) that it had maintained separate savings bank accounts for various projects and had preferred to place the funds in term deposits with the same bank based on experience

Chapter III: Economic Sector (State Public Sector Undertakings)
Audit Report for the year 2012-13, Government of Tripura 109
that there occurs delay in transfer of funds from one bank to another if the deposits were made with another bank. It was further stated that it would take initiative to avail best interest rates for optimising the interest earning on the basis of the observation made by the Audit.
The plea of operational convenience cited in the reply was not convincing in the present scenario of internet banking and also considering the fact that operations of all the savings accounts were within Agartala city only. The Company, therefore should have invested the funds in the FDs only with the banks offering the highest rate of return.
Thus, due to improper investment of funds in absence of a scientific method for investment planning, the Company had suffered an avoidable loss of revenue of ` 22.98 lakh.
The matter was reported (July 2013) to the Government; their replies had not been received (January 2014).
INFORMATION, CULTURAL AFFAIRS AND TOURISM DEPARTMENT
(Tripura Tourism Development Corporation Limited)
3.5 Non-implementation of tourism project
Failure of the State Government in providing the project land for the Government of India sponsored tourism project “Destination Development of Agartala” deprived the State of the intended benefits of the project.
Government of India (GOI) sanctioned (March 2007) ` 3.19 crore and released (April 2008) ` 2.55 crore (80 per cent of the sanctioned amount) to the Information, Cultural Affairs and Tourism (ICAT) Department for the project “Destination Development of Agartala” with the stipulation to commission the project within a maximum period of 30 months (upto September 2010) from the date of issue of sanction. The project was intended mainly to promote the destination to local and intra-regional tourists by providing improved accommodation facilities, way side amenities, recreational activities and up-gradation and enhancement of existing facilities. The project consisted of two components viz. (i) Tourist Facilitation Centre at Kunjaban and (ii) Memorial Park at Kunjaban. As per the Detailed Project Report (DPR) prepared in October 2007, the proposed site for the Tourist Facilitation Centre was in the proximity of Circuit House at Kunjaban. The site for the Memorial Park was to be a lush green area of 6 acres proposed on a hillock overlooking the central area of Agartala Town at Kunjaban.
Scrutiny (May 2013) of records revealed that while forwarding the DPR to GOI, the State Government/Department had given an undertaking that the required land for the project was readily available with it. It was, however, observed that while the proposed site for Tourist Facilitation Centre was in the possession of the Department, the land required for the Memorial Park was pending for acquisition by the State

Chapter III: Economic Sector (State Public Sector Undertakings)
Audit Report for the year 2012-13, Government of Tripura
110
Government. Accordingly, the Department requested (October 2008) the DM & Collector, West Tripura District to allot six acres of land at the southern side of State Guest House and State Tourism Lodge to implement the project but no land could be found for allotment in that area. In June 2009, the Department transferred the project funds amounting to ` 2.55 crore as released by GOI to the Tripura Tourism Development Corporation Limited (Company) for implementation of the project. Subsequently, the Company also requested (April 2010) the DM & Collector to allot at least one acre of land in the vicinity of Kunjaban for setting up of the Memorial park. But no land could be acquired for the purpose.
Ultimately, GOI asked (September 2012) the Department to refund the money immediately, following which the funds of ` 2.55 crore had to be refunded by the Company to GOI due to non-implementation of the project. This indicated that the proposals for the project were made to GOI for sanction of funds without due regard to availability of land. Consequently, the objective of the project remained un-achieved due to lack of timely action on the part of the State Government.
It was observed that the Company earned an interest of ` 32.35 lakh on the project funds, which remained un-utilised for 38 months in its Saving Bank Account. Out of the interest income so earned, ` 7.50 lakh was irregularly utilised by the Company for another project and balance of ` 24.85 lakh was still lying in the Saving Bank Account of the Company.
Thus, failure on part of the State Government in providing a suitable site for the Government of India sponsored tourism project deprived the State of the intended benefits of the project.
In reply, the Government stated (December 2013) that as it had been very late to start the work, it was directed (February 2011) by the GOI to drop the project.
The reply confirms the fact of surrendering the project funds to GOI due to the failure of the Department in providing suitable site for the project.

Audit Report for the year 2012-13, Government of Tripura 111
CHAPTER IV: REVENUE SECTOR
4.1 GENERAL
4.1.1 Trend of revenue receipts
The tax and non-tax revenue raised by the Government of Tripura during the year 2012-13, the State’s share of net proceeds of divisible Union taxes and duties assigned to the State and grants-in-aid received from the Government of India during the year and the corresponding figures for the preceding four years are mentioned below:
Table No. 4.1.1 (` in crore)
2008-09 2009-10 2010-11 2011-12 2012-13 I. Revenue raised by the State Government
• Tax revenue 442.50 527.01 622.34 858.02 1004.65 • Non-tax revenue 149.04 125.40 131.79 214.22 178.75
Total: 591.54 652.41 754.13 1072.24 1183.40 Percentage of increase over previous year 21.69 10.29 15.59 42.18 10.37
II. Receipts from the Government of India • State’s share of net proceeds of divisible
Union taxes 686.52 706.34 1122.36 1307.56 1493.18
• Grants-in-aid 2798.72 3042.60 3292.11 4097.10 4373.72 Total: 3485.24 3748.94 4414.47 5404.66 5866.90
III. Total receipts of State Government (I+II) 4076.78 4401.35 5168.60 6476.90 7050.30
IV. Percentage of I to III 15 15 15 17 17
Thus, growth of revenue during 2012-13 over previous year was at 10.37 per cent against 42.18 per cent in the year 2011-12. Further, during the year 2012-13, the revenue raised by the State Government (` 1,183.40 crore) was 17 per cent of the total revenue receipts (` 7,050.30 crore). The percentage of own receipts to total receipts during the current year was same (17 per cent) as compared to the previous year. The balance 83 per cent of receipts during 2012-13 was from the Government of India.
4.1.1 (a) Tax Revenue: The following table presents the details of tax revenue raised during the period 2008-09 to 2012-13:
Table No. 4.1.2 (` in crore)
Sl. No. Head of revenue 2008-09 2009-10 2010-11 2011-12 2012-13
Percentage of increase (+) or decrease (-) in 2012-13 over
2011-12 1. Sales Tax/VAT 314.79 374.93 444.93 666.32 763.07 (+) 152. State Excise 48.28 61.09 85.85 94.68 114.00 (+) 20
3. Other Taxes on Income and Expenditure
25.97 29.16 29.22 30.27 32.16 (+) 6
4. Stamps and Registration Fees 17.03 18.15 24.23 30.73 36.71 (+) 19

Chapter IV: Revenue Sector
Audit Report for the year 2012-13, Government of Tripura
112
(` in crore)
Sl. No. Head of revenue 2008-09 2009-10 2010-11 2011-12 2012-13
Percentage of increase (+) or decrease (-) in 2012-13 over
2011-12 5. Taxes on Vehicles 29.82 37.14 21.92 25.18 30.73 (+) 22
6. Other Taxes and Duties on Commodities and Services
0.84 0.95 0.91 1.42 1.36 (-) 4
7. Land Revenue 5.55 5.55 15.25 9.33 26.44 (+) 183 8. Taxes on Agricultural Income 0.18 0.01 0.01 0.04 0.10 (+) 150 9. Taxes and Duties on Electricity 0.02 0.02 0.02 0.05 0.05 Nil 10. Others 0.02 0.01 Nil Nil 0.03 Nil
Total 442.50 527.01 622.34 858.02 1004.65 (+) 17
The Finance (Excise & Taxation) Department furnished the following reasons for increase in revenue in 2012-13 as compared to 2011-12:
Sales Tax:- The increase in collection of Sales Tax/VAT (15 per cent) was due to minimisation of evasion of tax, efficient tax collection and intensive checking, regular monitoring at Churaibari Checkpost and revision of VAT rates.
State Excise:- The increase in collection of State Excise (20 per cent) was due to higher consumption of ‘Liquor’ as compared to the previous year and hike in licence fees.
4.1.1 (b) Non-Tax Revenue: The following table presents the details of the non-tax revenue raised during the period 2008-09 to 2012-13.
Table No. 4.1.3 (` in crore)
Sl. No. Head of revenue 2008-09 2009-10 2010-11 2011-12 2012-13
Percentage of increase (+)/
decrease (-) in 2012-13 over
2011-12 1. Forestry and Wildlife 5.57 6.29 7.64 6.98 6.56 (-) 6 2. Education, Sports, Art and Culture 1.55 1.50 1.27 2.06 0.68 (-) 67 3. Crop Husbandry 1.70 1.52 1.85 1.93 1.97 (+) 2 4. Other Administrative Services 2.33 11.76 3.91 5.45 5.36 (-) 2 5. Miscellaneous General Services 22.28 22.29 11.29 11.60 0.80 (-) 93 6. Water Supply and Sanitation 1.23 1.13 1.21 1.26 1.68 (+) 33 7. Police 19.86 16.88 24.73 37.33 28.48 (-) 24 8. Interest Receipts 62.93 27.88 23.24 50.66 67.88 (+) 34 9. Stationery and Printing 1.75 1.26 1.51 1.40 1.28 (-) 9 10. Animal Husbandry 1.56 1.45 1.57 1.32 1.49 (+) 13 11. Industries 9.38 11.87 30.63 39.80 41.20 (+) 4 12. Public Works 6.17 7.71 7.83 7.84 5.56 (-) 29 13. Village and Small Industries 0.02 1.46 0.04 0.01 0.03 (+) 200 14. Fisheries 1.89 0.68 0.55 0.67 0.60 (-) 10 15. Other Rural Development Programmes 0.03 0.03 0.08 0.04 0.03 (-) 25 16. Housing 1.13 1.34 1.35 1.73 1.71 (-) 1 17. Minor Irrigation 0.71 0.06 0.08 0.08 0.16 (+) 100 18. Medical and Public Health 4.52 4.87 4.06 5.14 6.95 (+) 35 19. Co-operation 0.05 0.07 0.05 3.69 0.07 (-) 98 20. Others 4.38 5.35 8.90 35.23 6.26 (-) 82
Total 149.04 125.40 131.79 214.22 178.75 (-) 17

Chapter IV: Revenue Sector
Audit Report for the year 2012-13, Government of Tripura 113
The General Administration (Stationery and Printing) Department stated that the decrease in collection of Stationery and Printing (nine per cent) was due to lesser collection than previous year.
The reasons for variations in respect of other Heads are awaited from the concerned departments (January 2014).
4.1.2 Variation between the budget estimates and actuals
The variations between the budget estimates and actuals of revenue receipts under the principal heads of Tax and Non-Tax revenue for the year 2012-13 are mentioned in the following table:
Table No. 4.1.4 (` in crore)
Sl. No. Head of Revenue Receipt Budget
estimates Actuals Variation
increase (+) decrease (-)
Percentage of variation over Budget Estimate
Tax Revenue 1. Sales Tax/VAT 670.00 763.07 (+) 93.07 (+) 13.89 2. State Excise 100.00 114.00 (+) 14.00 (+) 14.00 3. Other Taxes on Income and
Expenditure1 32.00 32.16 (+) 0.16 (+) 0.50
4. Stamps and Registration Fees 30.00 36.71 (+) 6.71 (+) 22.37 5. Taxes on Vehicles 40.00 30.73 (-) 9.27 (-) 23.18 6. Other Taxes and Duties on
Commodities and Services 1.37 1.36 (-) 0.01 (-) 0.73
7. Land Revenue 20.00 26.44 (+) 6.44 (+) 32.20 8. Taxes on Agricultural Income 0.01 0.10 (+) 0.09 (+) 900.00 9. Taxes and Duties on Electricity 0.03 0.05 (+) 0.02 (+) 66.67
Non-Tax Revenue 10. Forestry and Wildlife 1.20 6.56 (+) 5.36 (+) 446.67 11. Education, Sports, Art and
Culture 2.00 0.68 (-) 1.32 (-) 66.00
12. Crop Husbandry 2.70 1.97 (-) 0.73 (-) 27.04 13. Other Administrative Services 22.35 5.36 (-) 16.99 (-) 76.02 14. Miscellaneous General Services 11.93 0.80 (-) 11.13 (-) 93.29
15. Water Supply and Sanitation 2.15 1.68 (-) 0.47 (-) 21.86 16. Police 20.00 28.48 (+) 8.48 (+) 42.40 17. Interest Receipts 30.00 67.88 (+) 37.88 (+) 126.27 18. Stationery and Printing 1.75 1.28 (-) 0.47 (-) 26.86 19. Animal Husbandry 2.15 1.49 (-) 0.66 (-) 30.70 20. Industries 35.00 41.20 (+) 6.20 (+) 17.71 21. Public Works 15.00 5.56 (-) 9.44 (-) 62.94 22. Village and Small Industries 0.10 0.03 (-) 0.07 (-) 70.00 23. Fisheries 2.86 0.60 (-) 2.26 (-) 79.02 24. Other Rural Development
Programmes 0.11 0.03 (-) 0.08 (-) 72.73
25. Housing 2.15 1.71 (-) 0.44 (-) 20.47 26. Minor Irrigation 2.15 0.16 (-) 1.99 (-) 92.56 27. Medical and Public Health 8.00 6.95 (-) 1.05 (-) 13.13 28. Co-operation 0.21 0.07 (-) 0.14 (-) 66.67 29. Others 16.53 6.26 (-) 10.27 (-) 62.13
Source: Annual Financial Statement and Finance Account for the year 2012-13.
1 Includes Taxes on Profession, Trades, Calling and Employment.

Chapter IV: Revenue Sector
Audit Report for the year 2012-13, Government of Tripura
114
The Finance (Excise & Taxation) Department furnished the following reasons for increase in actuals over the Budget Estimates:
Sales Tax:- The increase in collection of Sales Tax/VAT (13.89 per cent) was due to increase of rate of VAT, minimisation of evasion of tax, efficient tax collection due to intensive checking, regular monitoring at Churaibari Checkpost and introduction of e-Services also.
State Excise:- The increase in collection of State Excise (14 per cent) was on account of increased consumption of liquor than the projections made in the budget and hike in licence fees.
4.1.3 Cost of collection
The gross collection of major revenue receipts, expenditure incurred on collection and the percentage of such expenditure to gross collection during the period 2010-11 to 2012-13 along with the relevant all India average percentage of expenditure on collection to gross collections for 2011-12 are mentioned in the following table:
Table No. 4.1.5 (` in crore)
Sl. No. Head of revenue Year Gross
Collection Expenditure on collection
Percentage of expenditure on
collection to gross collection
All India average
percentage for the year
2011-12 1. Sales Tax/ VAT 2010-11 444.93 5.74 1.29
0.83 2011-12 666.32 7.84 1.18 2012-13 763.07 8.94 1.17
2. State Excise 2010-11 85.85 1.44 1.68 2.98 2011-12 94.68 1.41 1.49
2012-13 114.00 1.35 1.18 3. Taxes on Vehicles 2010-11 21.92 1.55 7.07
2.96 2011-12 25.18 1.37 5.44 2012-13 30.73 1.43 4.65
4. Stamp Duty and Registration Fees
2010-11 24.23 1.32 5.45 1.89 2011-12 30.73 1.91 6.22
2012-13 36.71 2.08 5.67 Source: Finance Accounts 2012-13.
The cost of collection in respect of Sales Tax/VAT, Taxes on Vehicles and Stamp Duty & Registration Fees were higher than the All India average during the year 2012-13 which needs to be looked into by the concerned Departments. The cost of collection in respect of State Excise during the year 2012-13 showed an encouraging trend as it was lower than the All India average.
4.1.4 Analysis of arrears of revenue
The arrears of revenue as on 31 March 2013 in respect of the principal Heads of Revenue as reported by the Departments was ` 34.31 crore of which ` 5.22 crore (15 per cent) was outstanding for more than five years as per details mentioned in the following table.

Chapter IV: Revenue Sector
Audit Report for the year 2012-13, Government of Tripura 115
Table No. 4.1.6 (` in crore)
Sl. No. Head of revenue Amount outstanding
as on 31 March 2013 Amount outstanding for more
than five years 1. Taxes/VAT on Sales,
Trades etc. 33.53 4.59
2. Taxes on Vehicles 0.78 0.63 Total: 34.31 5.22
Source: State Departments.
4.1.5 Arrears in assessment
The details of Taxes on Agricultural income assessment cases pending at the beginning of the year 2012-13, cases which became due for assessment during the year, cases disposed during the year and number of cases pending at the end of the year 2012-13 as furnished by the Additional Commissioner of Taxes are mentioned below:
Table No. 4.1.7
Head of revenue
Opening balance as
on 31 March 2012
New cases due for
assessment during 2012-13
Total assessment
due
Cases disposed of
during 2012-13
Balance at the end of the year 2012-13
Percentage of disposals to the total assessments
5 to 4 1 2 3 4 5 6 7
Taxes on Agricultural Income
504 10 514 Nil 514 Nil
The arrear in assessment increased from 504 to 514 cases with the addition of another 10 cases which became due for assessment during the year 2012-13 and no cases have been disposed of during the year. Steps may be taken for timely and periodical assessment of cases.
4.1.6 Evasion of Tax
The details of cases of evasion of tax detected, cases finalised and demands for additional tax raised in 2012-13, as reported by the Departments concerned are mentioned in the following table:
Table No. 4.1.8
Name of tax/duty
Cases pending as on 31 March 2012
Cases detected during 2012-13
Total
Number of cases in which assessments/investigation completed
and additional demand including penalty etc., raised during the year
2012-13
Number of pending
cases as on 31 March
2013 No. of cases (` in lakh)
Sales Tax/VAT 727 1273 2000 1139 210.22 861
Source: State Department.
727 cases of evasion of tax were outstanding as on 31 March 2012. 1,273 cases of evasion of tax had been detected and reported during 2012-13 taking the total of pending cases to 2,000. Of these pending cases, in 1,139 number (56.95 per cent) of

Chapter IV: Revenue Sector
Audit Report for the year 2012-13, Government of Tripura
116
cases assessments/investigation were completed and additional demand including penalty etc., amounting to ` 2.10 crore was raised during the year 2012-13. Consequently, 861 cases were pending as on 31 March 2013.
4.1.7 Refunds
The information on refunds in case of Sales Tax/VAT during 2012-13 is mentioned in the following table:
Table No. 4.1.9 (` in lakh)
Sl. No. Particulars Sales Tax/VAT
No. of cases Amount 1. Claims outstanding at the beginning of the year 04 1.24 2. Claims received during the year Nil Nil 3. Refunds made during the year Nil Nil 4. Balance outstanding at the end of the year 04 1.24
No claim for refund of Sales Tax/VAT was received during the year. The outstanding balance at the end of the year was four cases involving ` 1.24 lakh.
4.1.8 Response of the Departments/Government towards audit
Transactions and maintenance of important accounts and other records of the departments are test-checked and Inspection Report containing audit findings is issued to the Head of the Office so audited for comments and/or compliance. Audit findings of serious nature are processed into draft paragraphs and forwarded to the Administrative Head of the concerned Department through demi-official letter drawing their attention to the audit findings with a request to furnish their response within six weeks. The response of the departments/Government towards audit is discussed in succeeding paragraphs.
4.1.8 (a) Failure of senior officials to enforce accountability and protect the interest of the State Government
The Accountant General (Audit), Tripura (AG) conducts periodical inspection of the Government departments to test-check the transactions and verify the maintenance of important accounts and other records as prescribed in the rules and procedures. These inspections are followed up with the Inspection Reports (IRs) incorporating irregularities detected during the inspection and not settled on the spot, which are issued to the Heads of the Offices inspected with copies to the next higher authorities for taking prompt corrective action. The Heads of the Offices/Government are required to promptly comply with the observations contained in the IRs, rectify the defects and omissions and report compliance through initial reply to the AG within one month from the date of issue of the IRs. Serious financial irregularities are reported to the Heads of the Departments and the Government.
Inspection Reports issued upto June 2013 disclosed that 582 paragraphs involving ` 135.37 crore relating to 212 IRs remained outstanding as mentioned in the following table along with the corresponding figures for the preceding two years.

Chapter IV: Revenue Sector
Audit Report for the year 2012-13, Government of Tripura 117
Table No. 4.1.10 June 2011 June 2012 June 2013
Number of outstanding IRs 208 215 212 Number of outstanding audit observations 539 559 582 Amount involved (` in crore) 100.12 115.96 135.37
The Department-wise details of the IRs and audit observations outstanding as on 30 June 2013 and the amounts involved are mentioned in the following table:
Table No. 4.1.11
Sl. No.
Name of Department Nature of Receipts
No. of Outstanding
IRs
No. of Outstanding
Audit Observations
Money Value
involved (` in crore)
1. Finance Taxes/VAT on Sales, Trade, etc 77 242 15.64 Professional Tax 07 08 0.13 Agricultural Income Tax Nil Nil Nil Amusement Tax 03 09 0.23 Luxury Tax Nil Nil Nil
2. Forest Forest Receipts 25 80 6.02 3. Industries and
Commerce Mines and Minerals Nil Nil Nil
4. Revenue Land Revenue 36 52 1.01 Stamp Duty and Registration Fees
20 34 1.06
5. Excise State Excise 17 58 9.64 6. Transport Taxes on Vehicles/Taxes on
Goods and Passengers 27 99 101.64
Total: 212 582 135.37
Even the first replies required to be received from the Heads of Offices within one month from the date of issue of the IRs were not received for 147 IRs issued upto June 2013. This large pendency of the IRs due to non-receipt of the replies is indicative of the fact that the Heads of Offices and Heads of the Departments failed to initiate action to rectify the defects, omissions and irregularities pointed out by us in the IRs.
It is recommended that the Government takes suitable steps to install an effective procedure for prompt and appropriate response to audit observations as well as takes action against officials/officers who fail to send replies to the IRs/paragraphs as per the prescribed time schedules and also fail to take action to recover loss/outstanding demand in a time bound manner.
4.1.8 (b) Departmental Audit Committee Meeting
In order to expedite settlement of the outstanding audit observations contained in the IRs, Departmental Audit Committees are constituted by the Government. These committees are chaired by the Secretaries of the concerned administrative Department and attended by the concerned officers of the State Government and officers of the Accountant General (AG). The audit committees need to meet regularly in order to expedite clearance of the outstanding audit observations.

Chapter IV: Revenue Sector
Audit Report for the year 2012-13, Government of Tripura
118
Seven Audit Committee Meetings (ACMs) were held during the year 2012-13. In these ACMs, 105 paras of 43 IRs were discussed out of which 51 paras of 13 IRs were settled.
The Government may ensure holding of frequent meetings of these Committees for ensuing effective action on the audit observations leading to their settlement.
4.1.8 (c) Response of the Departments to the draft audit paragraphs
One draft paragraph proposed for inclusion in the Audit Report of the Comptroller and Auditor General of India for the year ended March 2013 was forwarded (September 2013) to the Secretary of the Department through demi-official letter.
The administrative Secretary did not furnish replies in respect of the draft paragraph till date (January 2014).
4.1.8 (d) Follow up on Audit Reports – summarised position
As per recommendations made by the High Powered Committee (HPC) which were also accepted by the State Government in October 1993, suo moto explanatory notes on corrective/remedial measures taken on all paragraphs included in Audit Reports are required to be submitted by the Departments duly vetted by the Accountant General to PAC within three months from the date of placing of Audit Reports in the Legislature.
However, as of September 2013, suo moto explanatory notes pertaining to 8 paragraphs/reviews for the Audit reports for the years 2001-02 to 2010-11 were not received within the stipulated period of three months either from the Departments or through the Tripura Legislative Assembly Secretariat.
4.1.8 (e) Compliance with the earlier Audit Reports
In the Audit Reports 2007-08 to 2011-12 cases of under-assessments, evasion, non/short levy of taxes/penalty, loss of revenue, failure to raise demands etc. involving ` 101.26 crore were reported. Audit Report wise details of cases accepted and recovered are given in the following table:
Table No. 4.1.12 (` in crore)
As of March 2013, the Departments concerned have accepted audit observations of ` 38.03 crore and recovered ` 1.60 crore which was 4.21 per cent of the accepted money value. Steps may be taken to improve the rate of recovery of under- assessments, evasion, non/short levy of taxes/penalty, loss of revenue, failure to raise demands etc., as pointed out in the Audit Reports.
Year of Audit Report Total money value Accepted money value Recovery made 2007-08 17.74 17.74 0.14 2008-09 68.43 7.95 0.66 2009-10 1.78 1.16 0.42 2010-11 5.43 3.35 0.36 2011-12 7.88 7.83 0.02
Total 101.26 38.03 1.60

Chapter IV: Revenue Sector
Audit Report for the year 2012-13, Government of Tripura 119
4.1.9 Analysis of the mechanism for dealing with the issues raised by Audit
In order to analyse the system of addressing the issues highlighted in the Inspection Reports/Audit Reports by the departments/Government, the action taken on the paragraphs and Performance Audits included in the Audit Reports of the last five years in respect of one Department is evaluated and included in each Audit Report.
The succeeding Paragraphs 4.1.9 (a) to 4.1.9 (b) discuss the performance of Taxation Department in dealing with the cases detected in the course of local audit conducted during the last five years and also the cases included in the Audit Reports for the years 2008-09 to 2012-13.
4.1.9 (a) Position of Inspection Reports
The summarised position of Inspection Reports issued during the last five years, paragraphs included in these Reports and their status as on 30 June 2013 in respect of Sales Tax, State Excise are given in the following table:
Table No. 4.1.13 (` in crore)
Year
Opening balance
Addition during the year
Clearance during the year
Closing balance during the year
IRs Paras Money Value IRs Paras Money
Value IRs Paras Money Value IRs Paras Money
Value 2008-09 33 101 4.42 06 18 1.73 Nil 04 0.18 39 115 5.97 2009-10 39 115 5.97 04 12 0.36 03 11 0.16 40 116 6.17 2010-11 40 116 6.17 19 78 7.85 Nil 22 1.63 59 172 12.39 2011-12 59 172 12.39 12 48 5.36 Nil 03 0.06 71 217 17.69 2012-13 71 217 17.69 12 51 4.17 Nil 01 0.07 83 267 21.79
We reminded the Department periodically to furnish replies to the outstanding audit observations.
4.1.9 (b) Assurances given by the Department/Government on the issues highlighted in the Audit Reports
4.1.9 (b) (i) Recovery of accepted cases The position of paragraphs included in the Audit Reports of the last five years and those accepted by the Department and the amount recovered are mentioned in the following table:
Table No. 4.1.14
Year of Audit
Report
No. of paragraphs
included
Money value of the
paragraphs (` in crore)
No. of paragraphs
accepted
Money value of accepted paragraphs (` in crore)
Amount recovered during the
year (` in crore)
Status of recovery of
accepted cases (` in crore)
2007-08 1 0.34 1 0.34 Nil 0.14 2008-09 32 6.76 3 6.76 0.00* 0.11 2009-10 3 1.74 2 1.16 Nil 0.42 2010-11 33 3.12 3 3.12 0.05 0.36 2011-12 1 0.87 1 0.87 0.02 0.02
Total 11 12.83 10 12.25 0.07 1.05 *Negligible figure amounting to ` 3,280
2 Including one Review 3 Including one Review

Chapter IV: Revenue Sector
Audit Report for the year 2012-13, Government of Tripura
120
From the above table it is seen that for the period from 2007-08 to 2011-12, 11 paragraphs involving ` 12.83 crore featured in the Audit Reports, of which 10 paragraphs involving ` 12.25 crore had been accepted by the State Government. Of the accepted amount, ` 1.05 crore had been recovered till date.
The Departments need to evolve a strong mechanism to monitor and ensure recovery of accepted cases.
4.1.9 (b) (ii) Action taken on the recommendations accepted by the departments/ Government
The draft Performance Audits (PAs) conducted by the AG are forwarded to the concerned departments/Government for their information with a request to furnish their replies. These PAs are also discussed in an Exit Conference and the Department’s/Government’s views are included while finalising the PAs for the Audit Reports.
During the period from 2002-03 to 2011-12, two Performance Audits in respect of Finance (Excise and Taxation) Department were featured in the Audit Report– 2008-09 and 2010-11. Details of the Performance Audits are given below:
Table No. 4.1.15
Year of Audit Report Name of the review No. of
recommendations
Details of the recommendations
accepted 2008-09 Review on ‘Transition from
Sales Tax to Value Added Tax’Nine Yet to be discussed in
PAC. 2010-11 Review on ‘Cross Verification
of declaration forms used in Inter-State Trade’
Five -do-
4.1.10 Results of audit 4.1.10 (a) Position of local audit conducted during the year
Test-check of the records of 20 units of Sales Tax, Excise, Registration, Agricultural Tax, Pofessional Tax, Land Revenue, Forest, Motor Vehicles and other Departments conducted during the year 2012-13 revealed underassessment/short levy/loss of revenue/non-realisation of outstanding revenue aggregating ` 3.92 crore in 51 cases. Of these the Departments recovered ` 0.07 crore in one case.
4.1.10 (b) This Report
This Report contains one paragraph having financial effect of ` 1.51 crore. The replies of the paragraph have not been received (January 2014). The Audit findings are discussed in succeeding paragraphs.

Chapter IV: Revenue Sector
Audit Report for the year 2012-13, Government of Tripura 121
FINANCE (EXCISE & TAXATION) DEPARTMENT (SALES TAX / VALUE ADDED TAX)
4.2 Short-levy of tax
Concealment of turnover by the dealers, incorrect application of rates and non submission of audited balance sheet which escaped notice of the assessing authorities resulted in short levy of Sales Tax/VAT of ` 60.30 lakh, leviable interest of ` 51.16 lakh, penalty of ` 38.12 lakh and Additional Sales Tax of ` 1.80 lakh. (A) According to Section 25(3) of the Tripura Value Added Tax Act, 2004 read with Section 13 of the Tripura Sales Tax Act, 1976, if the Commissioner in the course of any proceedings is satisfied that any dealer has concealed particulars of his turnover, he may direct that such dealer shall pay by way of penalty, in addition to the tax and interest as prescribed, a sum not exceeding one and a half times of the tax due but not less than 10 per cent of that amount. Moreover, the Tripura Additional Sales Tax Act, 1990 provides that the tax payable under the Tripura Sales Tax (TST) Act, 1976 shall be increased in the case of dealers whose taxable turnover for a year exceeds ` 10 lakh by an additional rate of tax of 0.50 per cent of the taxable turnover.
On test-check (May 2012 to April 2013) of permit registers, form-XXVI, C-form utilisation statements, assessment records, trading accounts, etc. of five Superintendent of Taxes4 it was noticed that during the period from 2004-05 to 2011-12 in 47 cases relating to 21 dealers, there was concealment of taxable turnover of ` 5.29 crore. The Assessing Officers, while completing the assessments between 2005-06 to 2012-13 accepted the turnover disclosed by the dealers and completed the assessment accordingly. Though the documents based on which cross verification was carried out by Audit were also accessible to the concerned Assessing Officers, yet the same were not co-related by them while completing the assessments. This resulted in non-detection of concealment of the turnover leading to short levy of tax/additional tax of ` 61.46 lakh on which interest of ` 50.46 lakh and minimum penalty of ` 36.45 lakh was leviable as shown in Appendix 4.1(A).
(B) Section 31 of Tripura Value Added Tax Act, 2004, provides that where the Commissioner is not satisfied with the correctness of any return filed under section 24, or bonafides of any claim of exemption, deduction, concession, input tax credit or genuineness of any declaration, evidence furnished by a registered dealer in support thereof, the Commissioner may serve on such dealer a notice to produce the books of account and all evidences on which the dealer relies in support of his returns including tax invoice. The Commissioner shall, after giving reasonable opportunity of being heard, direct the dealer to pay, in addition to the tax and interest payable by him, a 4 (1) Superintendent of Taxes, Charge-I, Agartala; (2) Superintendent of Taxes, Charge-IV, Agartala; (3) Superintendent of Taxes, Charge-VI, Agartala; (4) Superintendent of Taxes, Charge-VII, Agartala and (5) Superintendent of Taxes, Udaipur.

Chapter IV: Revenue Sector
Audit Report for the year 2012-13, Government of Tripura
122
penalty not exceeding one and a half times the tax due (but it shall not be less than 10 per cent of that amount).
During test-check of records (May 2012 to April 2013) of two Superintendents of Taxes5 it was noticed that two dealers M/s Ramthakur Enterprise and M/s Bengal Sanitary Stores in their returns for 2005-06 paid tax at four per cent on turnover of ` 7.55 lakh. However, scrutiny of the returns revealed that the dealers dealt in cosmetics, plastic goods, bags, electronic toys, jewelery, yarn, sanitary goods, pipes, pipe fittings, etc. which were taxable at 12.5 per cent. The Assessing Officers failed to detect the wrong application of tax resulting in short levy of tax of ` 0.64 lakh, on which interest of ` 0.70 lakh and penalty of ` 0.05 lakh was additionally leviable as shown in Appendix 4.1(B).
(C) Section 53 of Tripura Value Added Tax Act, 2004 provides that where in any particular year, the gross turnover of a dealer exceeds ` 40 lakh or such other amount as the Commissioner, may by notification in the official Gazette specify, then such dealer shall get his accounts audited by an accountant within six month from the end of that year. In case of non-compliance of the above the Commissioner shall, after giving the dealer a reasonable opportunity of being heard impose on him in addition to any tax payable, a sum by way of penalty equal to 0.1 per cent of the turnover as he may determine to the best of his judgement in his case in respect of the said period.
During test-check of records (May 2012 to April 2013) of two Superintendents of Taxes6 it was noticed that in 11 cases relating to two dealers7, the dealers did not submit the audited accounts along with the returns for the periods between 2005-06 and 2011-12. However, the Assessing Officers failed to detect non-submission of the returns and consequently did not levy applicable penalty. This resulted in irregular acceptance of returns without statutory documents coupled with non-levy of penalty of ` 1.62 lakh as shown in Appendix 4.1(C).
Thus due to concealment of turnover by the dealers, incorrect application of rates and non submission of audited balance sheet which escaped notice of the assessing authorities resulted in short levy of Sales Tax/VAT of ` 60.30 lakh, leviable interest of ` 51.16 lakh, penalty of ` 38.12 lakh and Additional Sales Tax of ` 1.80 lakh.
The matters were reported to the Government in September 2013; reply had not been received (January 2014).
5 Superintendent of Taxes, Charge-I & IV, Agartala 6 Superintendent of Taxes, Charge-IV, Agartala and Udaipur 7 M/s Victor & Company and M/s Dutta Brothers

Audit Report for the year 2012-13, Government of Tripura 123
CHAPTER V: GENERAL SECTOR
5.1 Introduction This Chapter of the Audit Report for the year ended 31 March 2013 deals with the findings on audit of the State Government units under General Sector.
The names of the State Government departments and the total budget allocation and expenditure of the State Government under General Sector during the year 2012-13 are given in the table below:
Table 5.1.1 (` in crore)
Name of the Departments Total Budget Allocation Expenditure
Chief Minister Secretariat 0.62 0.62Civil Defence Department 0.65 0.41Department of Parliamentary Affairs 11.77 10.20Election Department 19.79 17.17Employment 3.22 2.75Factories and Boilers Organisation 1.38 1.26Finance Department 2220.02 1557.09Fire Service Organisation 52.25 39.46General Administration (P & T) TPSC Department 3.62 2.73General Administration (Political) Department 2.13 1.87General Administration (AR) Department 2.21 1.90General Administration, Printing and Stationery 10.02 8.75General Administration (SA) Department 44.63 37.39Governors Secretariat 2.64 2.46High Court 7.45 6.88Home (FSL, PAC and Prosecution Cell) 8.14 7.47Home (Jail) Department 26.97 19.89Home (Police) Department 719.70 646.68Institutional Finance Department 1.94 1.81Law Department 58.08 34.27Planning and Coordination Department 163.24 7.09Statistical Department 5.99 4.21Treasuries 5.82 4.47Total number of Departments = 23 3,372.28 2,416.83Source: Appropriation Accounts – 2012-13.
Besides the above, the Central Government had transferred a sizeable amount of funds directly to the Implementing agencies under the General Sector to different agencies in the State during the year 2012-13. There was no major transfer (` 5 crore and above) under this Sector during 2012-13.
5.2 Planning and conduct of Audit Audit process starts with the assessment of risks faced by various departments of Government based on expenditure incurred, criticality/complexity of activities, level of delegated financial powers, assessment of overall internal controls, etc.

Chapter V: General Sector
Audit Report for the year 2012-13, Government of Tripura
124
The audits were conducted during 2012-13 involving test-check of an expenditure of ` 506.09 crore (including expenditure pertaining to the previous years audited during the year) of the State Government under General Sector. This Sector contains one Performance Audit on Home (Police) Department.
After completion of audit of each unit, Inspection Reports containing audit findings are issued to the heads of the departments. The departments are requested to furnish replies to the audit findings within one month of receipt of the Inspection Reports. Whenever replies are received, audit findings are either settled or further action for compliance is advised. The important audit observations arising out of those Inspection Reports are processed for inclusion in the Audit Reports, which are submitted to the Governor of the State under Article 151 of the Constitution of India for being laid in the State Legislature.
The major observations detected in audit during the year 2012-13 are as detailed in the succeeding paragraph:

Chapter V: General Sector
Audit Report for the year 2012-13, Government of Tripura 125
HOME (POLICE) DEPARTMENT
5.3 Audit of Home (Police) Department
The audit of Home (Police) Department was carried out to examine efficiency and effectiveness in its functioning, identifying systematic issues that need to be addressed at various levels. The audit focuses on the crime management in the State, besides other aspects of the functioning of the Department, viz. financial management, human resource management, internal control and monitoring, etc. A Performance Audit on the functioning of the Department brought out the following main points:
Highlights:
The Department neither prepared any five-year Strategic Plan nor Annual Plans for prioritising the goals of the Department with reference to the objectives of policing.
(Paragraph 5.3.6) The incidence of IPC crime in the State including crime against women showed increasing trend whereas investigation and conviction rate was low which is a matter of concern. Deployment of police personnel in the police stations was skewed and not commensurate with the incidence of crimes in the areas falling under them. Use of forensic science in crime investigation was not satisfactory.
{Paragraphs 5.3.8.1, 5.3.8.2, 5.3.8.5, 5.3.8.7(i) and 5.3.8.8} There were large scale vacancies in the police force ranging between 13 and 52 per cent in different cadres. The representation of women police was only 7 per cent. Training facilities were inadequate and underutilised.
{Paragraphs 5.3.9.1, 5.3.9.3 and 5.3.9.5(i)} Priority was not given to construction of quarters and police stations buildings. The satisfaction level in respect of accommodation was merely 32 and 26 per cent in the case of upper and lower subordinates respectively.
(Paragraph 5.3.10.2) The striking ability of the police force was compromised due to shortage of 26 to 74 per cent main strike weapons and 55 per cent vehicles.
(Paragraphs 5.3.10.3 and 5.3.10.4) The Department failed to benefit from modernisation schemes like POLNET, CIPA and CCTNS despite incurring ` 3.36 crore due to their tardy implementation. The Department did not even ensure timely procurement and installation/utilisation of modern communication and surveillance equipment and accessories which led to unfruitful expenditure of ` 4.29 crore.
(Paragraphs 5.3.10.5 and 5.3.10.7) Weak Internal controls led to serious shortcomings in the proper functioning and achievement of objectives of the Department.
(Paragraph 5.3.11)

Chapter V: General Sector
Audit Report for the year 2012-13, Government of Tripura
126
5.3.1 Introduction Tripura Police is responsible for maintaining public peace, protecting life and property of the citizens and preventing and detecting crimes all over the State of Tripura, presently divided into eight districts1.
As on 1 January 2013, Tripura Police had 23757 police personnel (10501 civil police and 13256 armed police) including 776 women police, supported by 1183 Home Guards and Auxiliary force to serve approximately 36.72 lakh people residing in the State spread over an area of 10,491 square kilometers. There were on an average 286 civil police personnel per lakh population. There were 34 IPS officers in the State of which 18 were on deputation to the Central Government.
Tripura Police had adopted Police Regulations of Bengal, 1943 mutatis mutandis and Tripura Police Act came into force in 2007.
“Police” and “law and order” are State subject. It is primarily the responsibility of the State Governments to modernise and adequately equip their police forces for meeting the challenges of law and order and internal security. Ministry of Home Affairs (MHA) has been supplementing their efforts and resources from time to time by way of funding under the plan Modernisation of State Police Forces (MOPF). The continuance of the MOPF Scheme was approved up to 2016-17.
A Performance Audit on ‘Modernisation of State Police Force’ was featured in the Audit Report– 2007-08 which was discussed (21 March 2012) by the Public Accounts Committee in its 110th Report wherein it was recommended that Department should take necessary steps to achieve the target in time. However, audit findings are discussed in the succeeding paragraphs.
5.3.2 Organisational set up
The Secretary to the Government of Tripura, Home Department is the administrative head and the Director General of Police (DGP) is the overall in-charge. Different wings are headed by the Inspectors General of Police (IGP). The State is divided into eight Police Districts comprising 27 Police sub-divisions, 66 Police Stations (PSs) and 37 Police Outposts (OPs).
The Department had one Director General of Police, eight Inspectors General of Police, eight Deputy Inspectors General and Superintendents/Commandants of various units. There were 12 Battalions of Tripura State Rifles of which nine were India Reserve Battalions. The organisational set up of the Department is given below:
1 West Tripura, Sepahijala, Khowai, Dhalai, North Tripura, Unokoti, Gumti and South Tripura.

Chapter V: General Sector
Audit Report for the year 2012-13, Government of Tripura 127
5.3.3 Audit Objectives The main objectives of the audit were to assess whether:
planning was adequate and effective to ensure the achievement of the Department’s objective of prevention and detection of crime and maintenance of law and order;
utilisation of funds was efficient, economic and effective;
the Department was adequately prepared for operation management and the cases of crime were disposed off timely and effectively with efficient, economic and effective utilisation of its resources;
manpower was adequate, trained and deployed optimally; procurement, installation and utilisation of equipment under Modernisation/
State plan was done economically, efficiently and effectively to achieve the objectives; and
internal control mechanism was in place and effective.
5.3.4 Audit Criteria The following sources of audit criteria were used to evaluate the performance of the Department for the audit:
Tripura Police Act, 2007; Police Manual and Police Men Charter of duties; Norms prescribed by Bureau of Police Research & Development (BPR&D);
Director General of Police
IGP AP
IGP (L/O) IGP (INT) IGP(ADMN)
IGP(COMN)
JCG HG IGP (TRG)
DIGP AP ADMN &Trg
DIGP AP &OPS
SAF
12 TSR Bn
SP (Police Control
DIG NR
DIG SR
SP (North)
SP (Dhalai)
SP (GRP)
SP (traffic)
SP (West)
SP (South)
CO (HG)
AIG (HQR)
SP (Proc)
SP (Pers)
SP (Security)
SP (MTF)
SP (EB)
SP (CID)
SP (SB)
DIG (CID)
CO CTI
DIG (TRG)
PrincipalKTDC PTC
SP (Comn)
AIG (OPS)
DIG (HQr) DIG (HG)
CO BWBN
IGP (Manual)

Chapter V: General Sector
Audit Report for the year 2012-13, Government of Tripura
128
Recommendations of the National Police Commission, Administrative Reforms Commission and Padmanabiah Committee;
Supreme Court judgments; Guidelines of MOPF; Budget Manual, 1998, Central Treasury Rules (CTR), General Financial Rules
(GFR), 2005, Delegation of Financial Power Rules, Tripura, 2011, and Government notifications/instructions.
5.3.5 Scope and Methodology of Audit The performance audit of the Department covering the period 2008-09 to 2012-13 was conducted (April-September 2013) by test-check of the records maintained in the State Police Headquarters, two out of four district Headquarters, Superintendent of Police (Procurement), Superintendent of Police (Communication), Superintendent of Police (CID), Superintendent of Police (Traffic), three police training institutes2 and Director (FSL). Besides, the records of five out of 12 TSR Battalion Headquarters, eight out of 38 PSs of the selected districts and four out of six outposts (OPs) of the selected PSs were also test-checked after selection through the Simple Random Sampling Without Replacement method (Appendix 5.1).
An entry conference was held (23 May 2013) with the Secretary to the Government of Tripura, Home (Police) Department during which the audit objectives, criteria, scope of audit and methodology were discussed. Audit conclusions in the report were drawn after scrutiny of original records, analysis of the available data and Department’s responses to questionnaires and audit memoranda. The audit findings, conclusions and recommendations were discussed with the Chief Secretary to the Government of Tripura who is heading Home Department and Director General of Police in an exit conference held on 8 January 2014 and the Department’s views have been taken into consideration while finalising the audit report. Audit findings
Audit Objective 1: Whether planning was adequate and effective to ensure the achievement of the Department’s objective of prevention and detection of crime and maintenance of law and order
5.3.6 Planning Model Police Manual, prepared by the BPR&D provided for drawing up a five year Strategic Plan, in consultation with the State Police Board, duly identifying the objectives of policing as well as an Annual Policing Plan prioritising the goals for the year. Tripura Police Act, 2007 stipulated setting up of State Police Board (SPB) to formulate broad policy guidelines for promoting efficient, effective, responsive and accountable policing; to identity performance indicators; and review and evaluate the
2 (1) KTD Singh Police Training Academy, Narsinghgarh (2) A. Ch. Ramarao TSR Training Centre at TSR 2nd Battalion, RK Nagar and (3) CIAT School at Kachucharra at TSR 3rd Battalion

Chapter V: General Sector
Audit Report for the year 2012-13, Government of Tripura 129
performance of the Police service against the Annual Plan and performance indicators.
5.3.6.1 Non-preparation of Strategic and Annual Plan Audit scrutiny revealed that the Department had neither prepared any five year Strategic Plan nor an Annual Plan for prioritising the goals of the Department with reference to the objectives of policing. As such there was no scope for evaluation of the performance of police force by the Department.
In the exit conference, the Chief Secretary assured that the Department would prepare five year strategic plan.
Audit Objective 2: Whether utilisation of funds was efficient, economic and effective
5.3.7 Financial Management
5.3.7.1 Budgetary allocation and expenditure The year-wise budgetary allocation of funds and expenditure incurred by the Department during 2008-09 to 2012-13, were as under:
Table 5.3.1: Year wise allocation of funds and expenditure incurred during 2008-09 to 2012-13 (` in crore)
Year
Budget provision Funds received Expenditure Excess (+) Savings(-)
(Plan)
Excess (+) Savings(-) Non-Plan) Plan Non Plan
(Non salary) Plan Non Plan (Non salary) Plan Non Plan
(Non salary) 2008-09 4.00 93.40 4.00 91.98 3.39 81.90 (-) 0.61 (15) (-) 10.08 (11) 2009-10 5.00 87.26 5.00 86.10 5.00 85.80 0.00 (0) (-) 0.30 (0) 2010-11 0.00 54.23 0.00 53.24 0 53.78 0.00 (0) (+) 0.54 (1) 2011-12 28.49 75.74 28.53 75.94 28.53 70.53 0.00 (0) (-) 5.41(7) 2012-13 35.42 88.64 17.53 87.19 16.09 71.45 (-) 1.44 (8) (-) 15.74 (18)
Total 72.91 399.27 55.06 394.45 53.01 363.46 (-) 2.05 (4) (-) 30.99 (8) Sources: Information furnished by the department
It was noticed that during 2008-09 to 2012-13, Department short received ` 22.67 crore (` 17.85 crore under Plan and ` 4.82 crore under Non-Plan). Reason for short receipt was not found on record. Further, during the period under review there was savings of ` 33.04 crore. It was also evident that Plan savings declined from 15 per cent to zero in 2009-10 and continued to be so upto 2011-12 but thereafter again increased to eight per cent in 2012-13, Savings under Non-Plan decreased from 11 per cent to zero in 2009-10 and again increased in 2011-12 and 2012-13 by seven per cent and 18 per cent respectively which reflected upon the quality of budgeting.
Thus, short receipt of funds of ` 22.67 crore coupled with failure of the Department to spend ` 33.04 crore adversely affected the fulfillment/achievement of objectives especially in respect of procurement, communication equipment and construction works as discussed under Paragraph 5.3.10.

Chapter V: General Sector
Audit Report for the year 2012-13, Government of Tripura
130
(i) Non-surrender of savings Rule 56 of GFR, 2005 stipulates that the departments incurring expenditure are required to surrender the appropriations or portion thereof to the Finance Department as and when the savings are anticipated.
Audit observed that savings of ` 26.90 crore which occurred in four to 10 items during 2008-13 were not surrendered by the Department, as detailed below.
Table 5.3.2: Savings occurred against object heads during 2008-09 to 2012-13 (` in crore)
Year Proposed by the Deptt for
RE
Approved revised budget
allocation Expenditure Savings No of items
having savings Range of savings
(per cent)
2008-09 45.91 54.35 43.61 10.74 10 2 to 56 2009-10 39.81 45.07 35.56 9.51 5 1 to 542010-11 35.09 35.20 33.22 1.98 4 2 to 38 2011-12 43.80 45.71 44.80 0.91 5 1 to 7 2012-13 19.27 27.48 23.72 3.76 4 2 to 42
Total 183.88 207.81 180.91 26.90 Source: Budget books, information collected from AG (A&E) and departmental records
It was noticed that Department could not spend even the proposed amount against rent, rates and taxes, minor works, hiring charge of vehicles. Thus, the demand raised for those items during 2008-13 proved to be inflated during the years (Appendix 5.2).
In the exit conference, the Chief Secretary stated that short utilisation of funds was due to poor response from the tenderers. He further added that the matter was taken up with the GOI also and unspent funds of a year under MOPF had been revalidated in the subsequent year. No supporting records were, however, produced to audit.
(ii) Rush of expenditure According to Rule 56 of the GFR, 2005, rush of expenditure in the closing month of the financial year should be avoided. Audit observed that during 2008-09 to 2012-13, selected DDOs spent 28 per cent to 89 per cent of the total annual non salary expenditure in the month of March every year (Appendix 5.3).
(iii) Retention of funds Scrutiny of 16 test-checked units revealed that contrary to the provisions of CTR, 15 units kept ` 15.95 crore in the bank at the end of the March 2013 (Appendix 5.4).
(iv) Non-reconciliation with Bank Scrutiny of Cash Books and Bank Statements for the month of March each year during 2008-13 of 16 DDOs revealed that there were huge differences in balances between Cash Book and Bank Statement in case of 13 DDOs but the DDOs did not prepare Bank Reconciliation Statement during those years. There was a total difference of ` 8.93 crore between Cash Book balance and Bank Statement at the end of March 2013. Unit wise details are shown in Appendix 5.4.
In view of non-reconciliation with the bank for a long period possibility of misappropriation of funds could not be ruled out.

Chapter V: General Sector
Audit Report for the year 2012-13, Government of Tripura 131
The Government stated (December 2013) that instructions would be issued to the DDOs to conduct reconciliation with Banks at regular intervals.
(v) Non-submission of DCC Bills Sub-rules 11 (ii) and 14 of Rule 27 of the Delegation of Financial power Rules, Tripura, 2011 provides that drawal of the amount in AC bills should be adjusted by submission of DCC bills to the Controlling Officer within 60 days from the date of drawal of the amount.
Scrutiny revealed that there were 32 AC bills involving ` 15.82 crore, drawn during 2009-10 to 2012-13, which were over due for submission of DCC bills. The year wise position was as under:
Table 5.3.3: Year wise status of pending AC Bills (` in crore)
Year Total no. of AC bills during the
year
Amount drawn
No. of AC Bills pending as of June
2013
Amount of pending AC bills
2009-10 29 13.20 4 0.47 2010-11 11 6.61 3 1.00 2011-12 16 11.06 9 9.88 2012-13 20 4.51 16 4.47
Total 76 35.38 32 15.82 Source: Information furnished by PHQ
Non-adjustment of AC Bills for long periods was indicative of lack of financial discipline and fraught with the risk of fraud/misappropriation.
The Government stated (December 2013) that efforts would be made to settle the pending AC bills by the end of 2013-14.
(vi) Non-recovery of deployment charges Under the provisions of Police Regulation of Bengal, 1943 as adopted by the Government of Tripura, police personnel are deployed in different Government and Non-Government institutions on chargeable basis. Rule 9 of the GFR, 2005 further provides that receipts and dues of the Government should be correctly and promptly assessed, collected and duly credited to the Government account.
Test-check of the records of the DGP, Agartala and returns submitted by the subordinate offices revealed that the police deployment charges amounting to ` 31.07 crore were unrecovered from various Government Departments, PSUs, Banks and Central Public sector Undertakings (Appendix 5.5).
It was also noticed that the field offices submitted claims to the organisations every month for the current charges but reminders for collection of the arrears were not regular. Further, Police Headquarter convened one meeting with the defaulter organisations in May 2010 and thereafter no initiative was taken by the Department at the highest level for collection of the charges overdue for recovery even for almost 10 years. Thus, due to lack of follow up action and lack of seriousness at the level of higher management, deployment charges of ` 31.07 crore remained unrealised till September 2013.

Chapter V: General Sector
Audit Report for the year 2012-13, Government of Tripura
132
The above deficiencies indicated weak monitoring and financial management in the Department.
The Government stated (December 2013) that efforts were underway for recovery of outstanding deployment charges.
5.3.7.2 Modernisation of Police Force The main objective of the scheme was to meet the identified deficiencies in various aspects of police administration, worked out in 2000 by the BPR&D. The scheme, fully funded by the GOI during 2008-12 and on 90:10 basis from 2012-13, aimed at construction of safe PSs, outposts, improving housing, providing modern weaponry, improving mobility, communication, security, forensic science equipment and training facilities, etc.
(i) Short receipt of funds from GOI The approval and release of funds by the GOI during 2008-09 to 2012-13 are as under:
Table 5.3.4: Approval and release of funds by the GOI under MOPF (` in crore)
Year Plan approved by GOI Share of GOI Released by
GOI Short release
of funds
2008-09 24.00 24.00 19.24 4.76
2009-10 27.76 27.76 22.92 4.84
2010-11 21.85 21.85 21.85 Nil
2011-12 21.85 21.85 16.22 5.63
2012-13 23.99 21.59 3.55 18.04
Total 119.45 117.05 83.78 33.27 Source: Departmental records
Scrutiny revealed that GOI short released ` 33.27 crore out of which ` 18.04 crore pertained to 2012-13. In 2012-13, GOI released ` 3.55 crore against which State Government released its matching contribution of ` 44.00 lakh. Out of ` 33.27 crore, ` 5.63 crore was due to non-utilisation of funds by the Department upto 2009-10. Records relating to short release of ` 27.64 crore was not made available to audit. Thus, due to short receipt of funds particularly during 2012-13 Department could not modernise communication equipment, equipment for district police/TSR/HG, security wing etc to that extent.
The Government stated (December 2013) that the MHA though approved the plan, did not release the entire approved funds.
(ii) Incorrect reporting of expenditure During test-check of records it was noticed that seven items with a total cost of ` 2.20 crore, approved under MOPF during 2009-13 (Appendix 5.6) were reported as procured and amount spent by the Department, though no such expenditure was made. Thus, expenditure of ` 2.20 crore was incorrectly reported to MHA.

Chapter V: General Sector
Audit Report for the year 2012-13, Government of Tripura 133
The Government stated (December 2013) that efforts were on to procure the above mentioned items.
(iii) Diversion of funds The scheme guidelines stipulate that funds released for a particular item should not be diverted by the State Government for any other item without obtaining specific sanction to that effect from MHA.
Scrutiny of records and information made available to audit revealed that the Department had diverted ` 4.42 crore (Table 5.3.5 below) of which MHA approved (13 December 2011) diversion of ` 2.55 crore only. Thus, diversion of ` 1.87 crore was irregular.
Table 5.3.5: Diversion of funds from one head to another head (` in crore)
2008-09 to 2012-13 Communication equipment
Traffic and Police Control Unit
Equipment for SB
FSL Equipment
Approved as per Annual Plan 10.85 0.25 4.03 1.39 Fund released by MHA 7.12 0.25 4.00 0.70 Actual expenditure incurred 5.57 0.18 1.29 0.62 Diverted to other Head 1.56 0.07 2.71 0.08 Diversion (in per cent) 22 28 68 11 Source: Departmental records
Example of few items of irregular diversions were:
` 40.90 lakh out of ` 45.00 lakh approved for procurement of 6 Mega Ray Search Light (December 2011) was diverted (February 2013) for installation of Video Conferencing facilities which was also not started till August 2013 due to non-availability of any response from the BSNL regarding ‘Leased Line Circuits including 2 MB lease line modems’.
` 50.00 lakh approved for procurement of one Remote Controlled Improvised Explosive Device Jammer for VVIP security was diverted for procurement of other items.
In the exit conference, the Chief Secretary assured to get the matter examined by the Department.
Audit Objective 3: Whether the Department was adequately prepared for operation management and the cases of crime were disposed off timely and effectively with efficient, economic and effective utilisation of its resources.
5.3.8 Operations management
The main function of the Police Department is prevention and detection of crime and maintenance of law and order. A well managed police force will be able to contain crime, detect the crimes in time, respond quickly to any situation and prosecute criminals expeditiously. The Department had not framed any Manual of its own for

Chapter V: General Sector
Audit Report for the year 2012-13, Government of Tripura
134
regulating its activities. It had adopted Police Regulations of Bengal, 1943 without any modification.
5.3.8.1 Crime rate Various crimes that were being registered and investigated by the Home (Police) Department were broadly grouped under the ‘Indian Penal Code (IPC)’ or under the ‘Special and Local Laws (SLL)’. The incidences of IPC crimes in the State during 2008 to 2012 were as under.
Table 5.3.6: Incidences of IPC crimes in the State during 2008 to 2012
Year West Tripura Dhalai North
Tripura South
Tripura GRP Total Percentage of increase
Rate of incidence3
of crime 2008 2420 417 993 1506 0 5336 - 158 2009 2561 420 1016 1489 0 5486 2 160 2010 2600 541 970 1688 6 5805 5 166 2011 2709 437 871 1775 11 5803 (-) 1 162 2012 2804 443 1086 1921 10 6264 9 176
Source: Information furnished by the Department It was observed that the rate of incidence of crime gradually increased from 158 in 2008 to 176 in 2012 with South Tripura District showing the highest increase (28 per cent) against 17 per cent increase in the State as a whole. In 2012, rate of incidence of total IPC crimes in South Tripura District (219) was much higher than the State average (171). Increase in the crime rate was more serious when viewed in the background of the fact that the availability of average number of police personnel in terms of per one lakh population per 100 square km and per PS was almost double than the National average.
The Government accepted (December 2013) the audit observation.
5.3.8.2 Crime against Women and its prevention
(i) Crime rate Rate of incidences of crimes against women in the State and contribution to the total incidences of crimes in the State during 2008 to 2012 were as under.
Table 5.3.7: Incidences of crimes against women
Year Total IPC crime
Incidence of crime against women in the State
Total incidence against women
Rate of incidence in the State
Share to the total IPC Crimes
(In per cent) 2008 5336 1416 40 27 2009 5486 1517 43 28 2010 5805 1678 46 29 2011 5803 1358 37 23 2012 6264 1559 42 25
Source: Information furnished by the Department and NCRB statistic
3 Incidence of crime per one lakh population

Chapter V: General Sector
Audit Report for the year 2012-13, Government of Tripura 135
Analysis of rate of incidence of major IPC crimes against women in the sampled districts are depicted below.
Table 5.3.8: Nature of rate of incidence of major IPC crime against women occurred in 2012.
Particulars 2012 State West Tripura Dhalai South Tripura North Tripura
Rape 6 5 9 6 8 Abduction 4 4 3 4 4 Dowery Death 1 1 1 1 1 Molestation 9 8 8 9 11 Cruelty by Husband 23 21 15 28.24 28 Source: Information furnished by the Department and NCRB statistics
Audit analysis revealed that overall rate of incidence of crime against women vis-à-vis share of crimes against women to the total IPC crimes was higher in South and North Tripura districts as compared to the State as a whole.
The Government accepted (December 2013) the audit observation.
(ii) Prevention of crime against women
The Government of India has been issuing advisories regularly to the State Governments about the measures for protection of women and prevention and reduction of incidence of crimes against women. The second Administrative Reforms Commission in its 5th report in 2012, inter alia, recommended that-
1. All training programme should include a module on gender and human rights,
2. Representation of women in police at all levels should be increased to 33 per cent.
In compliance, Department stated (September 2012) that help desk was set up in all PSs, help line had been set up in all district SP offices. Besides, Police control room phone number and PS phone numbers were functioning as help line numbers. Briefing of staff from constable to Inspector was done regularly by the superior officers and a topic on gender sensitisation had been included in the training curriculum of Constable and Sub-Inspectors.
During scrutiny, it was noticed that neither short term/long term strategy had been formulated by the Department nor any funds earmarked for prevention of crime against women. During 2008-13, only 264 personnel were trained on prevention of crime against women. Representation of women police personnel in the civil police force was only 7 per cent as of January 2013. No lady police officers were posted in 42 of 66 PSs (64 per cent), though women constables were posted in all PSs. Although help lines were stated to be set up in district headquarters, number of complaints lodged over telephone and addressed by police were not found on record.
Further, test-check of eight PSs and four OPs revealed as follows:
No lady police personnel were posted in any OPs.
No help line was created in any of the test-checked PSs and OPs.

Chapter V: General Sector
Audit Report for the year 2012-13, Government of Tripura
136
Help desk was created only in four out of eight test-checked PSs. No help desk was created in the OPs.
The Government stated (December 2013) that outposts were extension of police stations and hence no women were posted and they did not register any cases. All the police stations had working telephones and the numbers were displayed outside the PS.
But the fact remained that no lady police officers were posted in 42 of 66 PSs (64 per cent), though one or two women constables were posted in 37 PSs and in the rest 29 PSs average number of women constable was five. Moreover, number of complaints lodged over telephone and addressed by police were not found on record.
In the exit conference, the Chief Secretary stated that the Department had been working on the augmentation of the strength of women police as well as mobilisation of the community support. The Director General of Police further added that posting of women constables would be rationalised to ensure at least three women personnel at each Police Station. The status of women posting would further improve after the process of recruitment of Women Constables and Sub-Inspectors was completed.
(iii) Eve-teasing Hon’ble Supreme Court directed4 to depute plain clothed female police officers in busy places like bus stands, markets, cinema halls, parks, etc., installation of CCTV in strategic positions, establishment of women-help line for controlling menace of eve-teasing etc.
In compliance, the Department stated (June 2013) that all the PSs were asked to depute their available women staff in busy places, help desks were set up and installation of CCTV was in progress.
But the fact remained that total women constables were only 668 and out of 66 PSs, 37 PSs were having (August 2013) one or two women constables only and in the rest 29 PSs average number of women constable was five, being maximum 23 constables in the Agartala Women PS. So, with that available manpower it was difficult for the PSs to run Help Desk and cover all the busy places. Further, MHA approved (December 2010) ` 50 lakh for procurement of CCTV in 2010-11 but Department had not procured CCTV till date although utilisation certificate was furnished to MHA.
As a result, due to non-availability of sufficient manpower and non-installation of CCTV in the strategic positions, prevention of crime against women was compromised.
The Government stated (December 2013) that process of procurement of CCTV was under progress.
4 Judgement (30 Nov 2012) in Civil Appeal No. 8513 of 2012, arising out of SLP(C) No. 31592 of 2008 in the case of the Deputy Inspector General of Police & Anr. – versus S. Samuthiram.

Chapter V: General Sector
Audit Report for the year 2012-13, Government of Tripura 137
5.3.8.3 Violent Crimes5 Violent crimes affect the life and safety of the people. Such crimes induce a sense of insecurity and fear in the community. The frequency and the magnitude of such crimes also affect the public peace. Incidences of Violent crimes in the State during 2008 to 2012 were as under:
Table 5.3.9: Incidence of violent crimes in the State
Year Total incidence
Rate of incidence (per 1 lakh population)
As percentage of total IPC crimes
2008 931 26 17 2009 858 24 16 2010 895 25 15 2011 921 25 16 2012 864 24 14
Source: Information furnished by the Department and NCRB Statistics
It was observed that during 2008 to 2012 violent crimes to the total IPC crimes decreased over the years. Further, analysis of incidence of crimes in 2012 revealed that rate of incidence of murder (3), attempt to commit murder (2), kidnapping and abduction (4), robbery (2), hurt (41) and theft (15) were alarming although the rate of incidence of few serious crimes like dacoity (0), preparation and assembly for dacoity (0), rioting (3), cheating (3), counterfeiting (0) etc. were low.
The Government accepted (December 2013) the audit findings.
5.3.8.4 Registration of complaints and response thereof Test-check of records of eight PSs6 revealed that overall registration of complaints showed decreasing trend upto 2011 and thereafter increased by 27 per cent in 2012 compared to 2011.
(i) Registration of FIR Police Men Charter of duties towards public stipulates registration of FIR on any information revealing commission of a cognizable offence without any delay.
Audit scrutinised 120 cases - 15 cases each from selected eight PSs- on this yardstick. During scrutiny only Khatian register and FIR book were produced. Police docket and case diaries were stated to be submitted along with the charge sheet to the Court. On the basis of information noted in the Khatian register and FIR register, it was noticed that out of 120 cases, 27 cases were registered within six hours of the crime, 82 cases within a month whereas registration of 11 cases took 34 to 562 days. Thus, there was undue delay in registering of FIRs by the selected PSs.
5 The components of crimes such as murder, attempt to commit murder, culpable homicide not amounting to murder, rape, kidnapping & abduction, dacoity, preparation & assembly of dacoity, robbery, riots, arson and dowry death have been grouped as violent crimes. 6 East Agartala PS, East Agartala Women PS, Champahour PS, Melagarh PS, Bishramganj PS, Kachucharra PS, Dhumacharra PS and Gandacharra PS

Chapter V: General Sector
Audit Report for the year 2012-13, Government of Tripura
138
(ii) Response time Police Men Charter of duties also stipulates that PSs should attend to any complaint, etc. immediately with the available resources.
It was however, found that average reaction time7 and response time8 in 87 of 120 test-checked cases (73 per cent) was as high as 164 minutes and 201 minutes while police reached the crime site before lodging of complaints in 17 cases. In 16 cases, timings were not recorded. This indicates the lack of readiness of the police to combat the crimes.
The Government accepted (December 2013) the audit findings.
5.3.8.5 Investigation of Crime Cases The status of investigation of IPC cases and disposal thereof by police during 2008-12 was as under:
Table 5.3.10: Disposal of crime cases (Year wise performance)
Year
Total No. of cases for investigation including carry
over cases
No of cases in which investigation completed Charge
sheeting rate {5*100/(4+5)}
Disposal rate
Charge found false
Final report true submitted9
Charge sheet
submitted
Total no. of cases
disposed of (1) (2) (3) (4) (5) (6) (7) (8)
2008 6448 22 939 4515 5476 83 85 2009 6666 0 860 4648 5508 84 83 2010 7141 42 995 4558 5595 82 78 2011 7497 0 1172 5307 6479 82 86 2012 7489 23 1149 5159 6331 82 85 Total 35241 87 5115 24187 29389 Source: Departmental records
It was observed that there were 35,241 cases for investigation during 2008- 2012 including the pending cases from previous years of which investigation was completed in 29,389 cases accounting for 83 per cent against national average of 94 per cent.
(i) Time taken in investigation Regulation 261 of the Police Regulation of Bengal, 1943, adopted by the Tripura Police stipulated that the investigation of even the most difficult cases should rarely be necessary to prolong beyond 15 days.
Test-check of 120 cases in sampled 8 PSs revealed that time taken for investigation was ranging from 1 to 1154 days, though no reason for delay was recorded.
The Government stated (December 2013) that the stipulations for crime investigation as contained in the CrPC 1973 were being adhered to and the same was monitored. The investigations were regularly monitored by senior police officers.
7 Duration between time of reporting of crime and time of movement of police. 8 Duration between time of reporting of crime and time of reaching the place of occurance of crime by police. 9 Cases in which after completion of investigation charge sheet is not required to submit.

Chapter V: General Sector
Audit Report for the year 2012-13, Government of Tripura 139
But the fact remained that even after monitoring by the senior police officers, in 23 per cent cases time taken for investigation was ranging from 184 days to 1154 days. This reflected adversely on the quality of monitoring also.
In the exit conference, the Director General of Police stated that generally investigations are completed within three months, However, in case of heinous crimes or where the criminals are absconding, it might have taken more time. Further, he assured to review all the cases as pointed out by audit.
(ii) Separation of Investigation from Law and Order Tripura Police Act, 2007 provides for separation of the investigation of crimes from law and order and other police functions. Padmanabhiah Committee on Police Reforms and Supreme Court10 reiterated the necessity of separation of investigation from maintenance of law and order to ensure superior investigation, better expertise and improved rapport with the people.
State Government identified (August 2007) nine PSs where law and order was separated from investigation. During scrutiny of records in the sampled eight PSs including East Agartala PS where law and order was separated from investigation, it was noticed that all Inspectors, Sub-Inspectors, Assistant Sub-Inspectors posted in the PSs were investigating cases along with the maintenance of law and order. One investigating officer (IO) investigated on an average 15 cases, maximum being 53 cases in a year. In Melagarh PS, out of 223 cases in 2012, six IOs investigated 201 cases (90 per cent) and rest five IOs investigated only 22 cases (10 per cent). Reason for unequal distribution of cases was not found on record.
Further test-check of 120 cases in sampled 8 PSs revealed that in 91 cases investigation was completed within 180 days, in 28 cases (23 per cent) police took 181 to 1154 days and one case was under investigation for 270 days as of September 2013.
Thus, due to non-separation of investigation from law and order coupled with uneven distribution of cases, timely investigation was not ensured.
The Government stated (December 2013) that further separation was not considered due to less number of cases and manpower constraints.
(iii) Arrest A total of 40,337 persons were arrested by the police under various IPC and SLL crimes during 2008-2012. Details of incidence of crimes, arrests made and number of persons charge sheeted during 2008-2012 are shown below:
10 Judgment dated 22 September 2006 in the case of Prakash Singh and others vs. Union of India.

Chapter V: General Sector
Audit Report for the year 2012-13, Government of Tripura
140
Table 5.3.11: Comparison of crime rate and arrest rate
Year No. of crimes
Arrested during the
year
No of persons released before trial
No of persons charge sheeted
Persons under investigation at the
end of the year 2008 5581 6227 1705 4999 648 2009 5694 9277 2087 6032 1806 2010 5983 7031 1218 5808 1811 2011 5951 10481 1760 7641 2888 2012 6471 7591 984 7768 1727 Total 29680 40607 7754 26440
Source: Information furnished by the Department and NCRB statistics
It was observed that out of 40,607 persons arrested during 2008-12, 7,754 persons (19 per cent) were released before trial. Further, details/status of 1727 persons kept under custody for non-completion of investigation was not made available to audit.
5.3.8.6 Conviction rate During 2008-2012, a total of 28,694 IPC crimes were recorded in the State of which conviction took place in 2118 cases (7 per cent) which was much lower than the national average (77 per cent) as shown below:
Table 5.3.12 : Conviction rate in the State during 2008 to 2012
Year Total IPC cases Actual conviction 2008 5336 253 (5) 2009 5486 266 (5) 2010 5805 274 (5) 2011 5803 401 (7) 2012 6264 923 (15) Total 28694 2117 (7)
Source: Departmental information
In order to corroborate the figures reported by the Department, a detailed analysis of conviction rate in 8 PSs was undertaken. During scrutiny only Champahour PS provided information about conviction wherein it was noticed that out of 163 cases recorded during 2008 to 2012, conviction took place only in 8 cases representing 5 per cent conviction.
The Government accepted (December 2013) the audit findings.
5.3.8.7 Prevention of Crime A well-planned crime prevention strategy not only prevents crime and victimisation but also promotes confidence of safety in the community and contributes to the sustainable development of the country. Effective and responsible crime prevention enhances the quality of life of all citizens.
The activities of the Police Department are discussed below:

Chapter V: General Sector
Audit Report for the year 2012-13, Government of Tripura 141
(i) Presence of Police The presence of police has a deterrent effect on the criminals and instils the confidence among the people. The status of the presence of police (1 January 2013) in the selected districts of the State was as under:
Table 5.3.13: Deployment of police personnel in the selected districts
Particulars West Tripura Dhalai State National Population (In lakh) 17.70 3.78 36.72 12133.70Area (In Sq. Km) 3099 2533 10491 3172167No. of PSs 25 13 66 15015No. of PS per 1 lakh population 1.41 3.44 1.80 1.24No. of PS per Sq. Km 0.008 0.005 0.006 0.005Deployment of police personnel 2844 971 10501 1674755Average no. of police personnel per PS 113 74 159 112No. of policemen per 1 lakh population 161 257 286 138No. of policemen per 100 sq. Km area 92 38 100 53Source: Departmental records
Audit observed that presence of police in the State in terms of population, area and PSs was almost 200 per cent of the National average. However, cognizable crimes particularly crimes against women was increasing over the years. This indicated that police forces were not used efficiently and intelligently.
The Government stated (December 2013) that the police effectiveness was to be judged by charge sheet percentage and not by the means of registration.
Reply was not tenable to audit as crimes against women were sharply increasing despite the fact that number of PSs and the constable present therein were substantively higher than the national average. Further number of police men per one lakh population in the State was almost double of national average.
(ii) Identification of Hot Spots The areas with high unemployment rate, low average income or high poverty rate, greater proportion of migrant population, spaces that are lonely, poorly lit or isolated are hot spots for criminals and police has to intensify its efforts in those areas to check the criminal activities.
It was noticed that no hotspot was identified in Dhalai district. West Tripura district identified ten hotspots11. However, steps taken for deployment of additional resources including patrolling in such spots were not found on record.
The Government agreed (December 2013) with the audit observation.
(iii) Review of history-sheeters A register of history-sheeters was to be maintained in each PS and required to be reviewed by the Higher Officers quarterly. In addition, the outposts were required to check their presence in their homes, which was recorded in the fly sheets. 11 Karepara, Subarampara, Twikarma, Baskarcharra and Jumbari under Mungiakami PS of Khowai. Kamalasagar, N C Sagar, Durgapur, Kalamchoura and Dhanpur under Sepahijala.

Chapter V: General Sector
Audit Report for the year 2012-13, Government of Tripura
142
During scrutiny of records maintained by the selected Districts it was noticed that there were 50 history sheeters of whom eight were reported to be missing. Initiatives taken by the police to find out the missing history sheeters were not made available to audit.
The Government stated (December 2013) that the Crime and Criminal Tracking Network and System (CCTNS) would provide one time solution for review and updation of history sheeters.
(iv) Recovery of unlicensed arms Scrutiny revealed that no assessment was made regarding use of unlicensed arms in the State despite the fact that 82 unlicensed arms were seized and recovered in the selected districts during 2008-13, recovery being the highest in Dhalai district. Further, 27 cases of killings by fire arms were reported during 2008-13 which constituted four per cent of the murders in the State. Eighty per cent of the firearms used in those murders were unlicensed. This indicated that use of unlicensed firearms was a matter of concern in the State.
The Government agreed (December 2013) with the audit findings and stated that country-made arms were normally used in the tribal areas and unlicensed arms were used by the extremists.
(v) Community Policing ‘Prayaas’, a community policing programme of Tripura Police was launched throughout the State in January 2010. It was quite heartening to note that beat committees were formed in all the PSs and 4769 meetings were convened to spread awareness about crimes including gender equality and crime against women etc. In addition, 934 awareness campaigns were also organised in Schools and Colleges. However, this programme would serve better if impact study/evaluation was also made.
The Government stated (December 2013) that the initiative under ‘Prayas’ would be strengthened.
5.3.8.8 Use of Science and technology in investigations Forensic science12 is a branch of science that deals with crime, criminals and law. Use of forensic science in crime investigation not only facilitates just and speedy results but also reinforces the faith in the police Department that the right person was brought to book.
Following deficiencies were observed in this area:
State Forensic Science Laboratory (SFSL) at Agartala was suffering from acute shortage of staff, with the overall shortage of 56 per cent across all cadres.
12 Forensic science (often known as forensics) is the application of a broad spectrum of sciences and technologies to investigate situations after the fact, and to establish what occurred based on collected evidence.

Chapter V: General Sector
Audit Report for the year 2012-13, Government of Tripura 143
Udaipur District mobile FSL set up at an expenditure of ` 45.04 lakh in July 2010 was not made functional till December 2013 even after a lapse of three years.
Kailasahar District FSL started functioning from September 2009 but could not examine (till July 2013) any case although 46 samples had been collected by it, because the equipment valued ` 13.28 lakh was provided only in March 2013.
Only 2168 forensic samples of 28694 IPC crimes (8 per cent) were received by the SFSL.
45 per cent PSs in the test-checked districts did not have Forensic Kits. Basic equipment required to collect bare forensic evidence i.e., fingerprints and
photographs etc. was unavailable in two out of selected eight PSs. In 120 test-checked cases, none of the PS ever collected any sample from the
scene of crime for forensic examination. Time taken for examination of sample in the SFSL ranged between 37 and 51
days. In a few cases, the time taken was even one year. Delay in examination of samples contributed to the delay in investigation and was fraught with the risk of deterioration, which could affect the test results.
Investigating authority took unreasonably high time ranging from 21 days to 49 days in collection of the report from FSL, maximum time taken in one case was 462 days in 2010.
The Government stated (December 2013) that due to shortage of manpower two divisions and District mobile FSL could not be made functional and delayed the examination/disposal of crime case exhibits. In few cases there were delay in collection of reports due to non-availability of standards and procedural defects.
Against 28694 IPC crimes during 2008-12, fingerprints were taken only in 18 cases. An automated finger print identification system was procured (August 2010) at the cost of ` 22.61 lakh. However, examination of only 18 cases reflected underutilisation of the system. In 120 test-checked cases at eight PSs, no finger prints were taken from the scene of crime.
The Government stated (December 2013) that two fingerprint experts had been working since August 2010 in the finger print cell, Crime Investigation Department (CID) and they visit the scene of crime on the strength of requisition of District Police in which finger prints are available at the scene of crime. .
But the fact remained that in 120 test-checked cases at eight PSs, no finger prints were taken from the scene of crime.
Despite having a strength of 14 dogs in the Police Dog Squad under SP (CID), dogs were utilised only in 235 cases (less than one per cent of total crime cases) for investigation which reflected gross underutilisation of the dog squad.
Contribution of low use of forensic science in the low conviction rate (seven per cent) in the State could not be ruled out.

Chapter V: General Sector
Audit Report for the year 2012-13, Government of Tripura
144
In the exit conference, the Chief Secretary and the Director General of Police agreed with the need for optimal utilisation of Forensic Science to improve the conviction rate.
Audit Objective 4: Whether manpower was adequate, trained and deployed optimally.
5.3.9 Human Resource Management
5.3.9.1 Large scale vacancies Status of manpower vis-à-vis sanctioned strength as on 01 January 2013 is depicted below:
(i) Civil Police Table 5.3.14: Sanctioned strength vis-à-vis men-in-position in civil police
as on 01 January 2013 Category Sanctioned Strength Men in position Shortage (In percent)
Dy SP to DG 213 103 110 (52)ASI to Inspector 1588 1387 201 (13)Head constable and Constable
11024 9011 2013 (18)
Total 12825 10501 2324 (18)
As is evident, the vacancy was 18 per cent in lower subordinate level and 13 per cent in upper subordinate level. But, 52 per cent vacancy in supervisory level was very alarming as the quality of supervision of the subordinate staff level was adversely affected.
(ii) Armed Police Table 5.3.15: Sanctioned strength vis-à-vis men-in-position in Armed police
as on 01 January 2013
Category Sanctioned Strength Men in Position Shortage (In Percent) Dy. SP to DG 126 47 79 (63) ASI to Inspector 552 497 55 (10) Head constable and Constable 13836 12712 1124 (9) Total 14514 13256 1258 (9)
The vacancy was nine per cent in lower subordinate level and 10 per cent in upper subordinate level. But, 63 per cent vacancy in supervisory level was very alarming as the quality of supervision of the subordinate staff level was adversely affected.
The Government stated (December 2013) that steps had been taken to fill up the vacant posts.
5.3.9.2 Teeth to tail ratio The Padmanabhaiah Committee recommended that the staff structure should be rationalised so that the teeth-to-tail ratio – upper subordinates to lower subordinates-should be 1:7 and finally brought down to 1:4.
The average of teeth-to-tail ratio in Tripura was 1:6 in civil police and 1:26 in armed police. It was also noticed that in case of armed police at the planning level itself the

Chapter V: General Sector
Audit Report for the year 2012-13, Government of Tripura 145
teeth to tail ratio with reference to sanctioned strength was 1:25 i.e., 552/13836. Therefore, the Department needs to review its staffing structure to comply with Padmanabhaiah Committee recommendations so that the quality of supervision of the subordinate staff level was not adversely affected.
5.3.9.3 Representation of women in the police force There were only 776 (7 per cent) women police in the total police force of 10,501 which was significantly low having adverse impact on prevention of crime against women as already discussed in paragraphs 5.3.8.2 above.
The Government stated (December 2013) that the efforts had been taken for recruitment of 300 women constables and 30 women Sub-Inspectors.
5.3.9.4 Distribution of manpower to Police Stations In order to find the extent of skewness in distribution of constables, deployment of manpower in eight PSs was reviewed. The details are as under:
Table 5.3.16: Distribution of constables in Police Stations
Police Stations
Average no of crimes in a year during
2008-12
Sanctioned Strength of constables
Men in Position
Sanctioned strength
per crime
Men in position
per crime
Deployment of manpower as %age
of sanctioned strength
Kachucharra PS 23 24 19 1.04 0.83 79 Dhumacharra PS 7 40 18 5.71 2.57 45 Gandacharra PS 34 55 32 1.62 0.94 58 Champahour PS 33 50 16 1.52 0.48 32
Melagarh PS 178 24 26 0.13 0.15 108 Bishramganj PS 70 38 22 0.54 0.31 58 East Agartala PS 256 N. A. 47 - 0.18 -
Agartala women PS 143 40 19 0.28 0.13 48 Source: Information furnished by PS
Analysis of above data revealed as follows:
The notified sanctioned strength was not based on the crime rate. Sanctioned strength per crime was highest (5.71) in Dhumacharra PS and lowest (0.13) in Melagarh PS.
Deployment of manpower in the PSs was not equitable as the deployment of manpower to sanctioned strength varied from 32 per cent to 108 per cent. Further, the deployment of manpower was also not proportionate to the average crime rate per annum.
During 2008-12, average number of crimes in Melagarh PS was 178, where there were only 26 constables. Similarly, while the average crime at Dhumacharra and Gandacharra were seven and 34, there were 18 and 32 constables. The inconsistency in deployment of constables indicates that deployment was not based on the occurrence of crime or actual requirement.
The Government stated (December 2013) that the sanctioned strength was made on the basis of the crime scenario and on the extremist activities in the State.

Chapter V: General Sector
Audit Report for the year 2012-13, Government of Tripura
146
Reply was not tenable to audit as the deployment of manpower was not proportionate to the sanctioned strength and average crime rate per annum. In the exit conference, the Director General of Police stated that recruitment and deployment of police personnel was a continuous process and it would be further reviewed and rationalised.
5.3.9.5 Training The three training schools provided training to 15,567 police personnel during 2009-13. Audit scrutiny of records revealed the following shortcomings:
(i) Inadequate training infrastructure The institutes were suffering from shortage of Instructors (ranging from 33 to 69 per cent), class room furniture and training aids. The Government stated (December 2013) that proposals for improving infrastructure was being taken through various Central Schemes like MOPF and Finance Commission.
(ii) Non-working Small Arms Training Simulators None of the three Small Arms Training Simulators-vital for practice on a variety of small arms including 9mm pistols, revolvers, 303 rifles, INSAS 5.56 mm, 7.62mm rifles, AK-47s, carbines and Light Machine Guns- installed at the cost of ` 87.30 lakh13 , was found (August-September 2013) in working condition as summarised below:
Table 5.3.17 : Status of three Simulators (` in lakh)
Name of the Institute
Date of installation Cost Status
TSR 2nd Bn 27-08-2002 43.61 Non- functional after 15-3-2012 TSR 3rd Bn 17-11-2006 20.99 Non functional from early 2008 PTA, Narsingarh 22-09-2009 22.70 Non-functional since 15-06-2010 Total 87.30 Source: Departmental records
The machines were non-functional due to not entering into AMCs with the supplier and lack of any concrete action for their repair and maintenance.
The Government stated (December 2013) that AMCs with the suppliers would be undertaken shortly to make the training simulators functional.
(iii) Inadequate firing range The training institutes had outdoor firing range of 22 mtr, 91 mtr and 273 mtr. only against the required firing range14 of 300 to 1000 mtr for 303 Rifle, AK-47 Rifle, SLR 13 PTA: ` 22.70 lakh; Ch. Ramarao Training Centre at TSR 2nd Bn:` 43.61 lakh; CIAT school at Kachucharra at TSR 3rd Bn:
` 20.99 lakh 14 Table showing Effective firing range of various weapons Weapons Effective range 7.62 LMG, & 303 LMG 1000 mtr 5.56 INSAS LMG 700 mtr 51 mm Mortar 500 mtr 303 Rifle, AK-47 Rifle, SLR and 7.62 mm BA rifle 300 mtr
Source: Information furnished by the training institutes

Chapter V: General Sector
Audit Report for the year 2012-13, Government of Tripura 147
and 7.62 mm BA rifle, 7.62 LMG, 303 LMG & 5.56 INSAS LMG, thereby limiting the training capability and accuracy of shooting of the aforesaid modern weapons below maximum range.
The Government stated (December 2013) that efforts would be made for allotment of sufficient land for construction of firing range.
Audit Objective 5: Whether procurement, installation and utilisation of equipment under Modernisation/State plan was done economically, efficiently and effectively to achieve the objectives.
5.3.10 Adequacy and allocation of resources
The operational efficiency and effectiveness of police force largely depends on the availability and proper allocation/utilisation of its resources, viz, buildings, vehicles, weapons, surveillance and communication equipment and security equipment. The deficiencies noticed in these areas are discussed in the succeeding paragraphs:
5.3.10.1 Office Buildings
Police Station Buildings It was noticed that construction of 15 PS Buildings were in progress and there
had been huge delays for instance Birganj PS and Kanchanpur PS already delayed by 33 months and 44 months respectively from the scheduled date of completion. Delays in execution of works were attributed to delay in finalisation of work site, Administrative approval & approval of design and drawing by the Police Department and fund constraints etc.
The Department had placed ` 143.96 lakh with PWD (R&B) on 04-02-2009 for construction of PS buildings at Belonia, Sonamura and Kadamtala. However, site was not finalised in Belonia till date and in Sonamura and Kadamtala site was finalised after four years and the works were re-assigned to Rural Development Department and funds (` 80.00 lakh) placed in December 2012. Construction of PS building at Mungiakami was commenced by PWD (R&B) on 05 January 2010 and completed on 22 May 2012 at a total expenditure of ` 79.58 lakh. After completion of the building, Executive Engineer, Police Engineering Cell visited (7 June 2012) the PS building and noticed that the building was not constructed as per design and drawing. There was no indication about the monitoring of the Police Department during execution of the PS building. As a result, even after completion of the building for more than a year, Police Department did not take it over from the PWD (R&B) and make it operational till August 2013.
Construction of well-secured police station (PS) buildings was one of the thrust areas of the MOPF. Thus, due to delay in execution of works the Department could not provide better working environment for the police personnel.

Chapter V: General Sector
Audit Report for the year 2012-13, Government of Tripura
148
The Government accepted (December 2013) the audit observation and stated that Department depend upon PWD (R&B), RD Department and Tripura Housing and Construction Board for major construction works. But the fact remained that the Department had inadequate monitoring over the construction works, as cited above.
In the exit conference, the Chief Secretary and Director General of Police appreciated the audit finding and assured to take necessary corrective action.
Out Posts Construction of two outpost buildings at Debdaru and Champaknagar could not be started due to non-availability of site although ` 1.00 crore (@ ` 50.00 lakh) were approved in 2008-09 under MOPF.
The Government stated (December 2013) that Champaknagar OP had now been shifted to its own accommodation by constructing five pre-fabricated huts and Debdaru OP had been included under MOPF scheme 2012-13.
Women Help Desks Construction of two women help desks at Kakraban and Raishyabari PS were not started even after eight months from the date of placement of funds (@ ` 10.80 lakh each) with the executing agencies. Reason for non-commencement of works was not found on record.
SDPO Office Building Department placed ` 1.20 crore with THCB in July 2012 for construction of Office-cum-residence building of SDPO in Sonamura, Bishalgarh, Jirania and Longtarai Valley. But works could not be commenced till date as the design and drawing of the buildings were approved by the Department only in August 2013 and THCB was requested to prepare estimates for the works.
The Government stated (December 2013) that the size of the buildings had been reduced by the agency due to price escalation which was being sorted out.
5.3.10.2 Residential Buildings BPR&D was of the view (March 2000) that the performance of the police was better in States where accommodation was available in large numbers. The National Police Commission (NPC) also recommended 100 per cent accommodation for all police personnel. As per the recommendation of the review committee on Police Reforms and Response of State Governments, circulated by MHA in May 2006, the State was asked to achieve 80 per cent satisfaction level as early as possible. Scrutiny revealed as follows:
Department had not assessed the housing requirement for police personnel and as such no requirement regarding housing was incorporated in the MOPF plans during 2008-09 to 2012-13.
As on 1 January 2013 Tripura Police had 4121 family quarters for constable to Group Officers. Percentage of satisfaction of family accommodation was 32

Chapter V: General Sector
Audit Report for the year 2012-13, Government of Tripura 149
per cent for the upper subordinates (Inspector, SI and ASI) and 26 per cent for lower subordinates (Head constables, constables).
The Government stated (December 2013) that a proposal had been made to the 14th Finance Commission for sanction of funds for construction of 1194 quarters to achieve satisfaction level upto 40 per cent.
Out of 4121 family quarters, 484 quarters (12 per cent) were damaged. However due to scarcity of quarters, 34 damaged Type-I qtr and 38 damaged Type-II qtrs were allotted to the TSR 1st Bn. and TSR 2nd Bn jawans. Hence, possibility of accidents causing injury/death could not be ruled out.
Administrative lapse of the Home Department in taking timely and proper follow up action resulted in suspension of construction works of 49 family quarters ( Type-I: 9 ;Type-II: 34 ;Type-III:6) in three TSR Bn headquarters15 for a long period. The exact dates since when the work was suspended were not available on record.
Construction of 9 Type-I quarters in TSR 2nd Bns remained suspended since long.
Police Department placed ` 3.41 crore in three installments between March 2008 and March 2009 to the RD Department for construction of 48 Type-III quarters at AD Nagar. The work of four three-storied blocks (6 quarters each) consisting 24 quarters was commenced in November 2008 and completed in July 2010. However, those quarters were taken over by the Police Department on 28 September 2012, after a lapse of 26 months from completion. Reasons for delay in taking over was not found on record.
15 TSR 1st Bn (Type-II:6; Type-III:2), TSR 2nd Bn (Type-I:9), TSR 6th Bn(Type-II:28; Type-III:4)

Chapter V: General Sector
Audit Report for the year 2012-13, Government of Tripura
150
During execution of works, Chief Secretary and Director General of Police, Tripura visited the site and finalised construction of three four-storied blocks (8 quarters each) in place of three storied blocks. Accordingly, design was modified for four-storied blocks and estimate was prepared (10 November 2009) for 8 quarters of a block of four storied building for an amount of ` 69.33 lakh. The work commenced on 26 October 2010 but was suspended (May 2011) after completion of civil work leaving pipeline &sanitation, painting and internal electrical work incomplete due to shortage of funds (` 14.04 lakh).
Type-III four storied building constructed at AD Nagar, Agartala
Department had placed ` 3.41 crore to the RD Department through the DM & Collector (West) for the said work but RD Department’s records showed only ` 2.90 crore. As a result, whereabouts of ` 51 lakh was not known to the Department and the work was suspended which reflects upon poor monitoring by the Department.
Scrutiny of records of SP (Procurement) revealed that out of 84 Type-III quarters (including 24 new quarters) available in AD Nagar, only 69 quarters were allotted and 13 quarters remained vacant till August 2013 due to non-availability of eligible applicants. Thus, it was evident that before construction of Type-III quarters in AD Nagar, Police Department did not assess the requirement. As a result, at least two blocks of three storied buildings constructed at an expenditure of ` 1.12 crore had been lying idle for the last three years.
The Government stated (December 2013) that SP (procurement) had taken necessary steps for allotment as per norms. But the fact remained that there were no eligible applicants for allotment of the quarters.
5.3.10.3 Vehicles Mobility is vital for efficient and effective performance of a police force. Increased mobility reduces response time and enhances operational efficiency. Requirement of vehicle to bring down the ‘mobility deficiency’ to ‘Nil’ was not assessed by the Department. However, BPR&D assessed (March 2000) the requirement of one heavy, one medium, five light vehicles and five motor cycles for smooth movement of a fleet of 100 police personnel. The position of vehicles in Tripura vis-à-vis BPR&D norms as of August 2013 was as under:

Chapter V: General Sector
Audit Report for the year 2012-13, Government of Tripura 151
Table 5.3.18 : Availability of vehicles
Type of vehicle
Requirement as per
BPR&D norms
AvailabilityOff road due to condemnation
and ageing
Actually on road
Allocated to CMT pool
Actually used for police duty
Shortageas of
Aug 2013
Heavy 238 228 32 196 08 188 50 Medium 238 217 28 189 10 179 59
Light 1190 827 79 748 181 567 623 Motor Cycle 1190 400 18 382 34 348 842
Total 2856 1672 157 1515 233 1282 1574 Note: Out of 175 Heavy vehicles there were 14 cranes and out of 547 light vehicles there were 46 water tankers, 43 Ambulance,1 riot control vehicle & 1 water canonSource: Departmental records
It was noticed (August 2013) that:
There was a shortage of 1574 (55 per cent) vehicles as compared to BPR&D norms.
Out of 157 vehicles kept off road, 22 vehicles were off road for six months due to non-availability of tyres. For example, ambulance available in TSR 3rd Battalion was out of road due to non-availability of tyre w.e.f. January 2013 to August 2013. Ambulance available with the TSR 3rd Bn was off
road from January 2013 due to non-availability of tyres
As per BPR&D norms, to meet the requirement of police force at the cutting edge level, 2 light vehicles and 3 motor cycles were to be provided to each PS and 2 motor cycles to each police OPs. In the test-checked districts, all but two PSs were equipped with at least two light/medium vehicles. However, out of 23 vehicles allotted to eight test-checked PSs, 10 vehicles were more than 10 years old (43 per cent) and often remained out of order. Further, seven OPs16 were not provided with any Motorcycles; rather they were provided with one light vehicle.
During preparation of Annual Plan for MOPF, Department justified that two vehicles per camp was required for ensuring quick movement of force in militancy infested areas. Scrutiny of records in sampled five TSR Battalions revealed that out of 80 camps, 46 camps (58 per cent) did not have any vehicle and 33 camps were having one vehicle each. As a result, due to restriction on movement of forces high response time could not be ruled out.
447 vehicles and 378 motor cycles were included in the MOPF (2008-13) of which only 344 vehicles and 236 motor cycles were procured till June 2013.
16 Patni, Bamutia, SNT OP, Old Agartala, Jumpuijalla, Taibandal and BJB OP

Chapter V: General Sector
Audit Report for the year 2012-13, Government of Tripura
152
However, no basis showing assessment of requirement of vehicles was available with the Department. Though there were shortage of vehicles in the field, 85 (30 per cent) of 286 light vehicles procured during 2008-13 under MOPF scheme were kept in the central pool and attached with the dignitaries.
Thus, due to shortage of vehicles coupled with diversion of 85 vehicles, the objective of providing vehicles to all PSs and TSR camps was not achieved which naturally restricted movement of the police forces and also led to high response time and reaction time. Besides, 17 PSs regularly hired light vehicles for their operational duties and ` 26.96 lakh were paid as hiring charges of vehicles during 2012-13 which was avoidable.
The Government stated (December 2013) that no case of delay due to non availability of vehicle in PSs had been reported.
5.3.10.4 Weaponry The Department has weapons in the form of INSAAS Rifle, Self Loading Rifle (SLR), AK 47, 9 mm Carbine, LMG, SMG, Rifle 303, Glock Pistol and allied ammunition. Test-check of records revealed as follows:
Department was holding 23,069 main strike weapons against authorisation of 40,334 weapons. Thus, there was shortage of 17,265 nos ranging from six per cent to 83 per cent in different categories. Thus, shortage of strike weapons could lead to under-performance and causalities in anti insurgency operations, especially in remote hilly areas.
Department was having more than 70 years old 7535 “303 Rifles” of which 6040 were in use. But, there was no plan to phase out those old weapons.
Department procured (15 May 2008) 12 nos Gun M/C 7.62 mm MAG from Small Arms Factory, Kanpur at a total cost of ` 54.52 lakh. But, no ammunitions were procured, resulting in the guns lying idle.
The Government stated (December 2013) that the Tripura Police was a better equipped force in terms of arms and ammunition. Further, there was sufficient ammunition of 7.62 mm caliber in the stock for utilisation of 7.62 mm MAG. But the fact remained that test-checked TSR Battalions could not utilise the 7.62 mm MAGs due to non-availability of link belt (Amn belt) & ammunition
5.3.10.5 Surveillance and Communication System
(i) Wireless sets Tripura police had 2303 functional handheld sets and 2394 functional Mobilophone sets against requirement of 3723 and 3435 respectively.
BPR&D norms provide that two secondary batteries were required for each mobilophone set and two dry fit batteries for each handheld set. Further, life of a secondary battery and rechargeable dry fit battery were 18 months and one year

Chapter V: General Sector
Audit Report for the year 2012-13, Government of Tripura 153
respectively, can be extended upto five years with decreasing output in normal conditions17. Scrutiny revealed as follows:
Mobilophone Sets Mobilophone sets are used in all police Communication Stations, PSs, Police vehicles, TSR camps etc. for the purpose of transmission and reception of registered radiogram and verbal conversation among the senior police officers.
For operation of those mobilophone sets Tripura police had (August 2013) 822 batteries of which only 379 batteries were procured during 2008 to 2013. As a result, with the available 379 batteries, Department could utilise only 189 sets against available 2394 such sets.
Handheld Sets Handheld Sets are used by the police patrol party, police operational party, traffic police for the purpose of transmission and reception of verbal instructions relating to law and order and traffic control.
Department procured only 2620 batteries during March 2008 to November 2010 for opearation of HH sets with which only 1310 sets could be utilised.
During 2008-09 to 2012-13, 170 digital Mobilophone sets (` 0.67 crore), 270 digital HH sets (` 0.98 crore) were procured out of which, 133 sets (Mobilophone: 42: HH: 91) were lying in the central store.
Thus, non-availability of efficient batteries with full output adversely affected the operation of VHF-HF sets and wireless sets purchased at a cost of ` 1.65 crore during 2008-13 and failed to augment the communication network of Police Force. Further, shortage of communication equipment coupled with acute shortage of batteries might result in lack of coordination between different units of Police Department and could lead to poor response at the time of requirement.
The Government stated (December 2013) that efforts were on for procuring spare batteries.
(ii) Idle Self Supporting Tower It was noticed that one 150 feet self supporting tower was installed at the TSR 8th Battalion Hqr, Lalcharra in October 2005. The tower was installed about 200 mtr away from the signal centre and for this reason the tower could not be made operational till August 2013.
Thus, due to lack of assessment and inefficient planning, the tower could not be utilised even after 8 years from the time of construction and thus the entire expenditure of ` 17.80 lakh became wasteful and failed to achieve the desired objectives.
17 "Normal" in this case means the battery goes through full charge cycles, isn't subjected to extreme temperatures, is attached to a reliable and consistent charging system and isn't providing power for a ton of accessories.

Chapter V: General Sector
Audit Report for the year 2012-13, Government of Tripura
154
The Government stated (December 2013) that efforts would be taken for operationalisation of the communication tower.
(iii) Global Positioning System The Global Positioning System (GPS), a satellite navigation system helps to accurately track the vehicle's movements/whereabouts.
With a view to equip the Tripura Police with it, the Department procured 68 GPS at a cost of ` 18.77 lakh during 2008-13 under MOPF scheme. Scrutiny of records in the sampled units18 revealed that 28 GPS were issued out of which 16 were lying in their store. Thus, the intended purpose of effective policing was defeated.
The Government stated (December 2013) that efforts would be made for utilisation of all GPS sets.
(iv) Geo Spatial System Geo Application System (3-Dimensional Terrain Module) helps in identification and movement of extremists and also generation of maps to assist and guide the Counter Insurgency Operations Party.
As per instruction of the MHA, Police Department procured the System from the Mission for Geo Spatial Application under Department of Science and Technology, Government of India at a total cost of ` 47.67 lakh and installed in five district police headquarters19 during March to August 2012.
During scrutiny it was noticed that at the time of installation, Mission provided MPT images of 2004-05 although it assured to supply latest images. Due to installation of old images, the system did not generate the desired output and the Department could not derive any functional benefits which led to infructuous expenditure of ` 47.67 lakh.
(v) Police Communication Network POLNET, a satellite based police communication network intended to connect all the PS in the country through Multi Access Radio Telephone was installed in all the four district headquarters and 34 PSs during September 2004 to August 2006 at a cost of ` 77.38 lakh.
Scrutiny of records revealed that the whole project became non-functional from April 2008 as the warranty period of the network expired in March 2008. Thereafter, no AMC was made with the supplier as the State Government was not ready to bear the expenditure of the AMC, despite instructions (18 September 2008) issued by MHA and recommendations (August 2009) made by the technical committee of the Department. As a result, the objective of improved communication among the State police force had remained frustrated for last five years and the expenditure of ` 77.38 lakh became unfruitful.
18 SP (Dhalai), PTA, TSR 2nd Bn, TSR 3rd Bn, TSR 5th Bn, TSR 7th Bn and TSR 8th Bn 19 Agartala, Ambassa, Dharmanagar, Udaipur and Kailasahar

Chapter V: General Sector
Audit Report for the year 2012-13, Government of Tripura 155
The Government stated (December 2013) that as all the sets were not functional and effective, AMC was not made.
(vi) Common Integrated Police Application project The CIPA software was designed and developed to maintain the details pertaining to all the activities of the PSs relating to crime and criminals. The system provides information to the higher levels as and when required and also generates various statutory reports for the smooth functioning of the PS.
CIPA project was implemented by the National Informatics Centre, New Delhi in two stages in 21 PSs at a total expenditure of ` 33.27 lakh. Scrutiny of records revealed that 69 per cent client system, 52 per cent duplex printer, 52 per cent MFP and 95 per cent UPS were not functioning. Status of equipment as of July 2013 is summarised below:
Table 5.3.19 : Status of hardware of CIPA project
Equipment Functioning Non-functioning Total Client System 28 62 (69%) 90 Duplex Printer 10 11 (52%) 21 MFP 10 11 (52%) 21 Ups 01 20 (95%) 21 Source: Departmental records
Further, no initiative was taken by the Department to make this system functional. Thus, due to non-functioning of the 62 client system (out of 90) benefit of the project could not be obtained despite incurring an amount of ` 33.27 lakh.
The Government stated (December 2013) that CIPA had been amalgamated with CCTNS project. But the fact remained that without making the system functional, amalgamation with the CCTNS could not be done. (vii) Crime and Criminal Tracking Network and Systems CCTNS Scheme had been approved by the Cabinet Committee on economic affairs on 19 June 2009 as a 100 per cent Centrally Sponsored Scheme to modernise the police force giving top priority on enhancing outcomes in the areas of Crime Investigation and Criminals Detection, in information gathering, its dissemination among various police organisations and units across the country and enhancing Citizen Services.
As per information made available by the Department, MoU was made on 25 January 2010 between Government of Tripura and MHA for implementation of the scheme. Of ` 3.57 crore released by MHA, ` 2.27 crore was spent by the Department as of December 2012. The Department also selected System Integrator and other Implementing agencies for implementation of the scheme.
During audit, progress of implementation of the scheme against the target date fixed for completion of the project could not be checked as SP (CID), nodal officer did not produce any records in connection with implementation of the project.

Chapter V: General Sector
Audit Report for the year 2012-13, Government of Tripura
156
In the exit conference, the Chief Secretary intimated that CCTNS had been launched on 3 January 2014. He further assured that relevant records would be provided to audit. Consequent to the Chief Secretary’s direction, though the Department furnished information/records relating to appointment of System Integrator and other implementing agencies, other records relating to tender, implementation-data digitisation, deployment of hardware, network commissioning, CAS customisation and payments, etc. were not made available to audit.
5.3.10.6 Security equipment Security equipment like bullet-proof (BP) jackets, helmets, patkas 20 etc. were essential for the safety of the police force involved in anti-insurgency operations. Each person was to have one set of the above mentioned security gadgets. Scrutiny of five test-checked TSR Battalions revealed that against the posted strength of 5461 jawans and officers, there were only 1540 BP jackets (28 per cent), 69 BP helmets (1 per cent) and 2641 BP patkas (41 per cent). Shortage of the security gadgets left the combat forces vulnerable to injury/death.
5.3.10.7 Procurement of Equipment
(i) Digital Communication equipment For procurement of Digital Communication Equipment under MOPF -100 Digital radio VHF Handheld Sets, 100 Digital Radio Mobilophones and 3 Digital VHF repeaters with accessories- tender was invited in July 2010. In response, three tenders were received in which M/s Vertel Infotel Pvt. Limited, New Delhi stood lowest at the quoted price of ` 63.43 lakh. The Department however, could not finalise the tender and validity of the rate offered by the bidders expired on 21 August 2011. Second call invited in December 2011 resulted in two tenders which were declared (February 2012) informal by the technical committee due to non-compliance with technical specifications.
In March 2012 without inviting any tender, the Department collected rate from Broadcast Engineering Consultants India Limited, a Government of India enterprise and issued two supply orders in July 2012 for procurement of 270 Digital radio VHF Handheld Sets, 170 Digital Radio Mobilophone and 9 Digital VHF repeaters at the cost of ` 1.71 crore.
During scrutiny it was noticed that those equipment were not proprietary items and the supplier imported the equipment from Japan and supplied to Tripura police. Thus, procurement was not only in contravention of GFR but also resulted in extra expenditure of ` 48.03 lakh21 due to non finalisation of the initial tender in July 2010. Further, the Department also increased the ordered quantity by 2 to 3 times as compared to the planned quantity without assigning any justification.
20 A security gadget to protect head. 21 Based on the lowest quoted rate of M/S Vertel Infotel Pvt. Limited cost of 270 Digital radio VHF Handheld Sets, 170 Digital Radio Mobilophones and nine Digital VHF repeaters would be ` 1.23 crore. Therefore there was extra expenditure of ` 48 lakh

Chapter V: General Sector
Audit Report for the year 2012-13, Government of Tripura 157
The Government stated (December 2013) that procurement of the items had been made as per approval of the Supply Advisory Board without mentioning the reason for non-finalisation of tenders in July 2010.
(ii) Fiber Optical Surveillance Set In view of bomb explosion in the Agartala town in 2008, it was proposed (October 2008) to strengthen the bomb disposal squad of security wing in terms of manpower, vehicle and quality equipment. At that time in addition to Agartala, Bomb Squads were functioning in Kailasahar, Ambassa and Udaipur. It was also decided to place Bomb Detection and Disposal Solution (BDDS) units at Santirbazar and Teliamura. In consultation with the Expert of Bomb Disposal Unit of NSG, New Delhi, requirement of seven Fiber Optical Surveillance Set (FOSS)-two for Hqr (Agartala) and one each for five units22- was assessed.
During scrutiny of records it was noticed that the Department procured (September 2010) nine sets at a total cost of ` 1.82 crore and allotted to SP (Security) on 22 September 2010. Reason for procurement of two excess sets was not found on record. Moreover out of nine sets, three were issued to BDDS units of Kailasahar, Ambassa and Udaipur and remaining six were lying in the store of the BDDS Hqr. at Agartala.
Thus, due to procurement of nine sets against requirement of seven sets and non-commissioning of BDDS unit at Santirbazar and Teliamura, four sets were lying idle and unutilised resulting in blockade of funds and unfruitful expenditure amounting to ` 80.92 lakh.
Further scrutiny revealed that in three BDDS units at Kailasahar, Ambassa and Udaipur, three FOSS (` 60.62 lakh) and other bomb disposal equipment (` 2.18 crore) were stored at different places viz., SP (DIB) offices, district stores, police hospitals etc. The police hospital building at Kailasahar was very old and damaged. As a result, the electronic equipment could be damaged due to such storage. Reasons for storage of equipment at different places without proper care instead of storage in BD units were not found on record. Moreover, at the time of need it might be difficult to gather all the equipment from different places and use immediately to diffuse any explosive. Thus, very objective of procurement of such equipment might be defeated.
The Government stated (December 2013) that efforts were being made for utilisation of all the BDDS equipment.
(iii) Bullet proof Jacket covers For procurement of Jacket covers, Department invited (September 2011) quotation from two firms only. In response the lowest rate quoted (November 2011) by MB Rubber Pvt. Ltd. was ` 795.00 per BP Jacket cover. Subsequently, Department decided (February 2012) to procure BP Jackets with same specifications procured earlier for TSR Bns. in 2004 from PEC Limited, New Delhi. Accordingly, SP
22 Kailashahar, Ambassa, Udaipur, Santirbazar and Teliamura.

Chapter V: General Sector
Audit Report for the year 2012-13, Government of Tripura
158
(Procurement) procured (July 2012) 399 BP Jackets from PEC Ltd, New Delhi @ ` 2251.19 per Jacket.
Scrutiny revealed that specifications offered by both the firms were same. However, rate offered by MB Rubber Ltd was much lower- almost one-third- than the rates of PEC Ltd. No recorded reason/justification was found for non-procurement of Jackets from MB rubber Ltd. Thus, the unjustified procurement giving undue preference to PEC Limited resulted in extra expenditure of ` 5.81 lakh.
The Government stated (December 2013) that the rates were approved by the Higher Purchase Committee without replying as to why lower rate offered by M/s MB Rubber Limited was not accepted.
Audit Objective 6: Whether internal control mechanism was in place and effective.
5.3.11 Internal Control and Monitoring
5.3.11.1 Non-preparation of Manual Tripura Police do not have a manual of its own. It followed Police Regulation of Bengal (PRB), 1943 mutatis mutandis. In the Organogram, there is a post of IGP (Manual) but initiatives if any, taken by the Department for preparation of Manual was not found on record. Moreover, compilation of departmental orders and instructions, issued from time to time was also not found on record.
In the exit conference, the Chief Secretary and the Director General of Police assured to start preparation of own Manual of Tripura Police.
5.3.11.2 Lack of documentation and non-production of records The maintenance and upkeep of records by the Department was unsatisfactory. Important documents like records relating to details of complaints lodged and addressed over helpline, records relating to details of persons kept under custody for non-completion of investigation, status of IO wise investigation made by the East Agartala PS, and other office records i.e. Asset register, Work progress register, Agency wise details of placement of funds and utilisation there against etc. in respect of construction works were not maintained. Further, records relating to setting up and functioning of State Police Board, physical progress of CCTNS, etc were not furnished to audit though called for.
In the exit conference, the Director General of Police assured to look into the matter and take necessary action.
5.3.11.3 Lack of monitoring over construction works During 2008-13, the Department placed ` 24.38 crore with the Police Engineering cell, Rural development Department, PWD (R&B) and Housing Board for execution of 86 works. But after placement of funds the Department never asked for submission of utilisation certificates and periodical returns showing physical and financial

Chapter V: General Sector
Audit Report for the year 2012-13, Government of Tripura 159
achievements. Thus, due to lack of monitoring, works remained incomplete due to shortage of funds in some cases while in some cases funds were lying idle for number of years with the executing agencies without commencement of works.
Moreover, the Department did not maintain inventory register or any record of major and minor works indicating the name of the executing agencies, funds placed from time to time, name of works, expenditure incurred and present status of works. This indicated lack of adequate monitoring by the Department over the construction works.
The Government stated (December 2013) that records were being maintained. But the fact remained that records were not produced to audit though requisitioned by Audit.
In the exit conference, the Chief Secretary and the Director General of Police assured to take action for better monitoring.
5.3.11.4 Response to Audit The State Finance Department issued instructions in July 1993 to watch over the receipt and disposal of Audit Notes/Inspection Reports issued by the Accountant General (Audit) which inter alia provides that (i) a register of audit para disposal should be maintained by each office and (ii) reply to Audit Notes is to be furnished within one month from the date of their receipt. No such register was maintained by the Department. The position of outstanding Inspection reports and paragraphs issued by the Accountant General (Audit), Tripura to the Department for the last five years is detailed in the table below:
Table 5.3.20: Status of outstanding Inspection Reports
Year Issued Settled Outstanding 1st reply not received IR Paras IR Paras IR Paras
2008-09 8 22 3 14 5 8 Nil 2009-10 15 37 7 11 8 26 01 2010-11 11 44 3 28 8 16 02 2011-12 14 63 3 13 11 50 05 2012-13 6 36 0 0 6 36 06
Total 54 202 16 66 38 136 14
The Government stated (December 2013) that efforts would be taken for early settlement of paras.
5.3.12 Conclusion The performance audit of the Home (Police) Department revealed several deficiencies in their functioning. The Department did not have its own Police Manual. It had also not formulated any long-term or short term plan for prioritising the goals of the Department with reference to the objectives of policing. Budget estimates were not realistic. The incidence of IPC crime especially crime against women in the State increased during 2008-2012 while the conviction rate was low which is a matter of concern. Further, use of forensic science in crime investigation was not fully functional due to lack of skilled manpower. Average reaction and response time was unsatisfactory. Housing facilities for police personnel were not adequate. The Department also failed to benefit from the modernisation schemes due to their tardy

Chapter V: General Sector
Audit Report for the year 2012-13, Government of Tripura
160
implementation. The striking ability of the police force was compromised due to shortage of modern weapons, mobility deficiency, inadequate and ineffective communication equipment. It was also noticed that internal control, supervision and monitoring was inadequate.
5.3.13 Recommendations The Department may consider implementing the following recommendations:
prepare its own Manual and formulate a long term strategic plan identifying the annual goals to be achieved in crime management with special emphasis to curb crime against women;
rationalise the deployment of its police force; initiate steps to increase the representation of women police personnel,
especially lady police officers; prioritise the construction of residential and office buildings and ensure their
completion within specific timeliness; ensure efficient and effective utilisation of its resources including
communication and surveillance equipment so as to achieve a lower crime rate and a higher conviction rate;
strengthen the internal control and monitoring mechanism.

6
6
SanATexR
(a
A3ydich
1 P
.1 Fo
.1.1 No
erious irregund Auditor G
According toTripura in Jxplanatory
Reports withi
a) Publi
As of Nove1 paragraphears 2001-0iscussion. Thart below:
Placed in the Sta
8
5
0
2
4
6
8
10
12
14
16
18
2006
Ch
Total Pen
FOLLO
llow up act
on-submissio
ularities notGeneral of Io the instrucJuly 1993 tnotes on thin three mon
c Accounts
ember 2013s and 11 Pe2 to 2010-1
The position
ate Assembly on
9
5
3
6-07
hart No. 6.1
nding Paras/R
CHA
W UP OF
tion on ear
on of explan
ticed in audiIndia (Auditctions issuethe Adminihe paragrapnths of their p
Committee
, 13 Deparerformance 1. The Audof suo motu
n 27 September 2
9
0
9
2007-08
1: Position o
Reviews Suo
APTER –
F AUDIT O
rlier Audit
natory notes
it are includt Reports) aned by the Fstrative dep
phs/Performapresentation
e (PAC):
rtments didAudits inclu
dit Report fou replies duri
2013.
10
2
8
2008-09
of pending sReports
motu reply re
– VI
OBSERVA
Reports
s
ded in the Rnd presented
Finance Deppartments wance Auditsn to the Legis
d not submiuded in the
or the year 2ing the last f
4
2
2009
suo motu re
eceived Suo
ATIONS
Report of thed to the Statpartment, Gowere requires included slature.
it explanatoAudit Rep
2011-12 wasfive years is
16
2
-10 2
eplies to Aud
motu reply no
e Comptrollee Legislaturovernment oed to furnisin the Aud
ory notes oorts from ths not due1 fo shown in th
6
6
10
2010-11
dit
ot received
er re. of sh dit
on he for he

Chapter VI: Follow up of Audit Observations
Audit Report for the year 2012-13, Government of Tripura
162
Chart 6.1 represents the position of suo motu replies received/not received pertaining to pending paras/Performance Audits of Audit Reports for the period from 2006-07 to 2010-11. The Department largely responsible for non-submission of explanatory notes was Public Works (Roads & Buildings)2, Revenue and Transport Departments.
(b) Committee on Public Undertakings (COPU):
As of November 2013, two Departments did not submit explanatory notes on two paragraphs (Forest Department) and one Performance Audit (Power Department) included in the Audit Reports for the year 2010-11.
6.1.2 Response of the departments to the recommendations of the Public Accounts Committee (PAC)/Committee on Public Undertakings (COPU)
Finance Department, Government of Tripura issued (July 1993) instructions to all departments to submit Action Taken Notes (ATN) on various suggestions, observations and recommendations made by PAC/COPU for their consideration within six months of presentation of the PAC/COPU Reports to the Legislature. The PAC/COPU Reports/Recommendations are the principal medium by which the Legislature enforces financial accountability of the Executive to the Legislature and it is appropriate that they elicit timely response from the departments in the form of Action Taken Notes (ATNs).
(a) Public Accounts Committee (PAC)
As of November 2013, out of 51 recommendations of the PAC made between 2000-01 and 2009-10, 38 ATNs were submitted of which 33 ATNs had been discussed by the PAC. The concerned administrative departments had not submitted ATNs for 13 recommendations, five of which were due from the Health and Family Welfare Department and three from Public Works (Drinking Water and Sanitation) Department.
(b) Committee on Public Undertakings (COPU)
As of November 2013, ATNs on six recommendations of the COPU made between 2007-08 and 2009-10 were awaited from the concerned administrative departments of which five pertained to Power Department.
6.2 Monitoring
The following Committees had been formed at the Government level to monitor the follow up action on Audit Reports and PAC/COPU recommendations.
2 12 Paragraphs and 1 Performance Audit.

Chapter VI: Follow up of Audit Observations
Audit Report for the year 2012-13, Government of Tripura 163
Departmental Monitoring Committee
Departmental Monitoring Committees (DMCs) had been formed (April 2002) by all departments of the Government under the Chairmanship of the Departmental Secretaries to monitor the follow up action on Audit Reports and PAC/COPU recommendations. The DMCs were to hold monthly meetings and send Progress Reports on the issue every month to the Finance Department.
The details of DMC meetings held during 2012-13 were awaited (January 2014) from the Finance Department, though called for (November 2013).
Apex Committee
An Apex Committee had been formed (April 2002) at the State level under the Chairmanship of the Chief Secretary to monitor the follow up action on Audit Reports and PAC/COPU recommendations.
The details of Apex Committee meetings held during 2012-13 were awaited (January 2014) from the Finance Department though called for (November 2013).
6.3 Outstanding Inspection Reports First reply for 288 out of 980 Inspection Reports issued upto 2012-13 were not furnished within the stipulated period by the concerned Departments.
Audit observations on financial irregularities and deficiencies in maintenance of initial accounts noticed during local audit and not settled on the spot are communicated to the audited entities and to the higher authorities through Inspection Reports (IRs). The more serious irregularities are reported to the Government. The Government had prescribed that the first reply to the IRs should be furnished within one month from the date of receipt.
Analysis of the position of outstanding Inspection Reports showed that 4,062 paragraphs included in 980 IRs issued upto 2012-13 were pending settlement as of November 2013. Of these, even the first reply had not been received in respect of 288 IRs in spite of repeated reminders. The year-wise break-up of the outstanding IRs and the position of response thereto is given in the chart below:

C
An
E
W
B
Nov
U
O
Chapter VI: Fo
As a result, tot been addr
Natu
Excess/Irregu
Wasteful/Una
Blocking of f
Non-recoveryverpayments
Under Assess
Others
239
0
50
100
150
200
250
300
2007
No. of
ollow up of Au
the followingressed as of N
ure of irreg
ular/Avoidab
authorised/Id
funds
y of excess ps
sment
Total:
97
58
7-08 200
Chart
f outsatnding I
udit Observati
Aud
g important November 2
T
gularities
ble/Unfruitfu
dle expenditu
payments/
71
24
08-09 20
No. 6.2: Po
IRs No. of
ions
dit Report for
irregularitie2013.
Table No. 6.3
Nu
ul/
ure
13
22
009-10
osition of tot
IRs for which
r the year 2012
es commente
.1
umber of cases
326
276
276
20
1,706
2,604
154
35
2010-11
tal outstand
h even 1st repl
2-13, Governm
ed upon in t
Amount(` in
199
62
2011-12
ding IRs
ly had not bee
ment of Tripur
those IRs ha
t involved crore)
176.9
319.5
77.1
1.9
1,270.9
1,846.4
178
87
2012-13
en received
ra
ad
97
56
14
91
91
49

Chapter VI: Follow up of Audit Observations
Audit Report for the year 2012-13, Government of Tripura 165
6.3.1 Departmental Audit Committee Meetings
Eight Audit Committee Meetings were held during 2012-13 wherein 80 IRs and 272 paragraphs were discussed out of which 22 IRs and 139 paragraphs were settled.
Agartala The
(R. K. AGRAWAL) Accountant General (Audit),
Tripura, Agartala
Countersigned New Delhi The
(SHASHI KANT SHARMA)
Comptroller and Auditor General of India

Appendices
Audit Report for the year 2012-13, Government of Tripura 167
Appendix 1.1
Statement showing the calculation of inadmissible payment made/due to the agencies
(Reference: Paragraph No. 1.3.1.3)
Sl. No. Name of the School
Number of non-functioning
computers
Period of non- functioning Phase No/Agency
No. of defaulting Half yearly
periods and rate
Inadmissible payment
(in `) (1) (2) (3) (4) (5) (6) (7)
1. Baralutma Class XII School, Dhalai
04 March 2012 to
March 2013
2nd/ Educomp Solutions Ltd.
3 @ ` 60,3001 1,80,900
2. Choudhurybari Girls HS School, West Tripura
04 March 2012 2nd / Aces Infotech Pvt. Ltd.
1@ ` 60,300 60,300
3. Dr. B .R. Ambedkar High School, West Tripura
10 March 2012 1st / Educomp Solutions Ltd.
1 @ ` 63,7502 63,750
4. Durlav Narayan HS School, West Tripura
04 August 2011 to
March 2013
1st / Educomp Solutions Ltd.
4 @ ` 63,750 2,55,000
5. Harerkhola High School, Dhalai 05 August 2011 to
March 2012
2nd / Educomp Solutions Ltd.
2 @ ` 60,300 1,20,600
6. Jampuijala High School, West Tripura
10 December 2012 to March 2013
2nd / Aces Infotech Pvt. Ltd.
1 @ ` 60,300 60,300
7. Jagatpur High School, West Tripura
06 October 2012 to
March 2013
1st / NIIT Ltd. 1 @ ` 63,750 63,750
8. Kamalpur English MedIum School, Dhalai
04 March 2012 1st / NIIT Ltd. 1 @ ` 63,750 63,750
9. Kulubari High School, West Tripura
07 July 2011 to
March 2012
2nd/ Everonn Education Ltd.
2 @ ` 60,300 1,20,600
1 7.5 per cent of ` 8.04 lakh 2 7.5 per cent of ` 8.50 lakh

Appendices
Audit Report for the year 2012-13, Government of Tripura
168
Appendix 1.1 (Concld.)
Statement showing the calculation of inadmissible payment made/due to the agencies
(Reference: Paragraph No. 1.3.1.3)
Sl. No. Name of the School
Number of non-functioning
computers
Period of non- functioning Phase No/Agency
No. of defaulting Half yearly
periods and rate
Inadmissible payment
(in `) (1) (2) (3) (4) (5) (6) (7)
10. Kulai Colony High School, Dhalai
08 January 2013 to
March 2013
1st / NIIT Ltd. 1 @ ` 63,750 63,750
11. Mohanpur Girls’ High School, West Tripura
06 June 2011 to
March 2013
1st / NIIT Ltd. 4 @ ` 63,750 2,55,000
12. Nalchar High School, West Tripura
07 April 2011 to
March 2012
2nd / Aces Infotech Pvt. Ltd.
2 @ ` 60,300 1,20,600
13. Narsinghar H.S. School, West Tripura
07 January 2012 to
March 2013
1st/ NIIT Ltd. 3 @ ` 63,750 1,91,250
14. North Kamrangatali HS School, West Tripura
02 October 2012 to
March 2013
1st/ NIIT Ltd. 1 @ ` 63,750 63,750
15. Rangamatia H.S. School, West Tripura
01 September 2012 to March 2013
2nd/Everonn 2 @ ` 60,300 1,20,600
16. Taibandal HS School, West Tripura
04 June 2011 to
March 2012
2nd / Aces Infotech Pvt. Ltd.
2 @ ` 60,300 1,20,600
17. West Noabadi High School, West Tripura
01 January 2012 to
March 2012
2nd / Aces Infotech Pvt. Ltd.
1 @ ` 60,300 60,300
Total: 90 19,84,800

Appendices
Audit Report for the year 2012-13, Government of Tripura
169
Appendix 2.1
Statement showing the sector-wise number of projects sanctioned, taken up for implementation and dropped.
(Reference: Paragraph No. 2.3.4 & 2.3.7)
Name of Sector Total No. of projects
Present status of projects taken up Dropped
Completed On going Animal Husbandry 36 23 9 4 Horticulture 30 26 2 2 Fisheries 23 19 4 0 Crop Development 18 15 2 1 Marketing 7 4 2 1 Micro Irrigation 7 5 1 1 Non Farming 2 1 0 1 Agricultural Mechanisation 6 6 0 0 Extension 2 1 0 1 Organic farming/Bio fertilizer 5 5 0 0 Fertilizer and inn 3 3 0 0 Innovative Programme/ Training 3 3 0 0 Natural resources management 2 1 0 1 Agricultural research 1 1 0 0 Integrated pest management 1 1 0 0 Dairy farming 1 1 0 0 Seed 1 1 0 0
Total: 148 116 20 12

Appendices
Audit Report for the year 2012-13, Government of Tripura
170
Appendix 2.2
Statement showing the delay release of funds by the Finance Department and Nodal Department
{Reference: Paragraph No. 2.3.9.2(ii)} (` in crore)
Year/ Stream GOI to State State Finance to Nodal
Department Nodal Department to
IOs
Delay (Finance Depart-ment to Nodal
Delay (Nodal to IOs)
2007-08 Date Amount Date Amount Date Amount (in Months) Stream-I 12/02/2008 2.84 21/08/2008 2.84 16/02/2009 2.84 6.37 5.97 Stream-II 10/01/2008 1.12 21/08/2008 1.12 16/02/2009 1.12 7.47 5.97
11/01/2008 0.20 21/08/2008 0.20 16/02/2009 0.20 7.43 5.97 2008-09 Stream-I 12/09/2008 12.25 07/01/2009 12.25 07/02/2009 12.25 3.90 1.03 Stream-II 26/06/2008 3.83 15/05/2010 3.83 02/08/2010 3.83 22.93 2.63 2009-10 Stream-I 01/12/2009 11.56 03/02/2010 11.56 24/02/2010 11.56 2.13 0.70
15/01/2010 11.90 01/04/2010 11.90 13/04/2010 6.92 2.53 0.40 01/04/2010 24/05/2010 4.98 1.77
Stream-II 15/06/2009 3.08 27/10/2009 3.08 29/12/2009 3.08 4.47 2.10 09/09/2009 4.74 01/04/2010 4.74 13/04/2010 4.74 6.80 0.40
2010-11 Stream-I 26/05/2010 43.82 07/08/2010 21.91 01/10/2010 21.91 2.43 1.83
26/05/2010 01/01/2011 13.50 31/01/2011 13.50 7.33 1.00 26/05/2010 14/02/2011 8.41 15/03/2011 8.41 8.80 0.97 01/03/2011 43.44 13/04/2011 43.44 21/06/2011 43.44 1.43 2.30
Stream-II 30/04/2010 29.22 04/02/2011 29.22 15/03/2011 10.50 9.33 1.30 04/02/2011 13/06/2011 0.10 4.30 04/02/2011 18/07/2011 9.61 5.47 04/02/2011 19/12/2011 9.01 10.60
2011-12 Stream-I 20/06/2011 5.44 05/08/2011 5.44 13/09/2011 5.44 1.53 1.30
10/02/2012 5.43 09/03/2012 5.43 14/03/2012 5.43 0.93 0.17 28/03/2012 7.64 12/06/2012 7.64 06/07/2012 7.56 2.53 0.80
Stream-II 28/04/2011 1.81 25/07/2011 1.81 02/09/2011 1.13 2.93 1.30 25/07/2011 10/02/2012 0.03 6.67 25/07/2011 14/03/2012 0.09 7.77 25/07/2011 18/06/2012 0.56 10.97
10/02/2012 1.81 05/06/2012 1.81 18/06/2012 1.81 3.87 0.43 Sub-schemes 20/06/2011 1.75 20/08/2011 1.75 16/09/2011 1.75 2.03 0.90
10/02/2012 1.75 09/03/2012 1.75 14/03/2012 1.75 0.93 0.172012-13 Stream-I 23/07/2012 6.79 11/10/2012 6.79 20/11/2012 6.79 2.67 1.33
27/09/2012 9.45 07/11/2012 9.45 04/01/2013 9.45 1.37 1.93 31/12/2012 16.23 16/02/2013 12.92 02/03/2013 12.92 1.57 0.47
Stream-II 18/06/2012 5.41 01/09/2012 10.82 24/09/2012 10.64 2.90 0.7706/07/2012 5.41 01/09/2012 14/03/2013 0.18 1.90 6.47
Sub-schemes 21/12/2012 6.57 19/01/2013 6.57 02/02/2013 6.57 0.97 0.47 21/03/2012 6.57

Appendices
Audit Report for the year 2012-13, Government of Tripura
171
Appendix 2.3
Statement showing the details of unspent amount lying with the DDOs {Reference: Paragraph No. 2.3.9.2(iii)}
(` in crore) Sl. No.
Name of DDOs
Amount drawn
Date of drawal
Purpose Amount lying
unspent
Present Status of work
1 EE (Agri.), North
1.90 2010-11 For Construction of Cold storage at Ambassa (Additional fund under Stream-II
1.82 Ongoing
2 EE (Mech.) West Tripura,
0.15 2010-11 Installation of plant and machinery in Cool chamber at Wholesale assembling market, Bishramganj under Stream-I
0.15 Ongoing
3 -Do- 0.05 2010-11 Installation of plant and machinery at Fruit processing centre, Bishramganj under Stream-I
0.05 Ongoing
4 -Do- 0.68 March 2012
Setting up of Modern Rice Mill under Stream-II
0.68 Not yet started
5 EE (Agri.), West Tripura,
0.42 March 2012
-Do- 0.42 Not yet started
6 -Do- 0.06 March 2012
Development works of Sonamura Market under Stream-II
0.06 Ongoing
7 Dy. Director of Agriculture (West)
March 2012
Procurement of Hybrid Paddy seeds, Maize seeds and Zink sulphate under Stream-I
0.22 Ongoing
8 Supdt. of Veterinary Hospital, Ambassa
0.58 March 2012
Production of day old layer chicks (satellite hatchery) under Stream-I
0.58 Ongoing
Total: 3.98

Appendices
Audit Report for the year 2012-13, Government of Tripura
172
Appendix 2.4
Statement showing the unadjusted amount lying with the Implementing Officers {Reference: Paragraph No. 2.3.9.2(iv)}
(` in crore)
Sl. No. Name of office
Advanced during the
year
No. of IOs advanced
Amount advanced
Amount adjusted
Amount lying un-adjusted
1 Deputy Director of ARDD, Dhalai 2011-12 10 0.69 0.46 0.23
2 Deputy Director of ARDD, North 2011-12 6 0.10 0 0.10
3 Deputy Director of ARDD, West
2010-11 1 0.05 0 0.05 2011-12 17 0.23 0 0.23

Appendices
Audit Report for the year 2012-13, Government of Tripura
173
Appendix 2.5
Statement showing the observations relating to the selected projects pertaining to Animal Husbandry under RKVY
(Reference: Paragraph No. 2.3.10.1)
Sl. No.
Name of the Project Objective of the project Project
period Amount
(` in crore)
Number of beneficiaries
targeted Observations relating to the Project
1 Establishment of poultry Breeding Farm at Khumlung
Supply of chicks at a minimum profit to the small scale farmers and to increase profitability of the farmers
2009-10 1.50 Not specified Due to delay in release of funds by the nodal department and further delay in inviting and finalisation of tender as well as due to delay in execution of works by the contractors the project for the period 2009-10 as sanctioned by SLSC got commissioned only in May 2012 after a delay of 24 months by depriving the targeted beneficiaries of getting the benefits of the project.
2 Development of Demonstration Unit on Piggery’
Educating the pig farmers on better scientific method and increasing the productivity,
2009-10 to
2011-12
6.21 679 All the units were established as projected and sanctioned by the SLSC.
Scrutiny revealed that no criteria had been prescribed by the Department/ Government for selection of beneficiaries. The beneficiaries had been selected by the PRI bodies from the list of BPL/SC/ST. However, the basis of the selection of beneficiaries was not on record. Thus, the selection of beneficiaries under the scheme was not transparent and bias could not be ruled out.
Further, joint physical verification of 50 units (beneficiaries) implemented by eight offices1 of four districts revealed that in five cases the beneficiaries had no pigs, in two cases only one pig and in three cases two pigs as against distribution of five pigs to each beneficiary. About 10 per cent (out of 50) of the verified units were found closed.
1 Dy. Director of ARDD ( North and Dhalai), Asstt. Director of ARDD (Bishalgarh, Sonamura, Belonia, Sabroom, Salema and Kumarghat),

Appendices
Audit Report for the year 2012-13, Government of Tripura
174
Appendix 2.5 (Contd..)
Statement showing the observations relating to the selected projects pertaining to Animal Husbandry under RKVY
(Reference: Paragraph No. 2.3.10.1)
Sl. No.
Name of the Project Objective of the project Project
period Amount
(` in crore)
Number of beneficiaries
targeted Observations relating to the Project
3 Development of Demonstration Unit on Goatery
Providing education on better scientific method of functioning of goat husbandry and increasing the productivity and income level of the farmers
2008-09 1.50 500 Due to delay in release of funds by the nodal department and further delay in revalidation of lapsed funds, the project was completed in September 2013 after a delay of 53 months. The nodal department never pursued or monitored the progress of work with the implementing department and thereby, the project was not executed in timely manner and the funds allocated remained idle for about 3-4 years.
Scrutiny of the records of eight offices of four districts revealed that no criteria had been prescribed by the Department/Government for selection of beneficiaries. The beneficiaries had been selected by the PRI bodies from the list of BPL/SC/ST. However, the basis of the selection of beneficiaries was not on record. Thus, the selection of beneficiaries under the scheme was not transparent and bias could not be ruled out.
Joint physical verification of 40 units (beneficiaries) implemented by eight offices2 of four districts further revealed that in two cases the beneficiaries had no goat, in two cases only two goats were found against the total allocation of one male and five female goats provided to each unit. About 5 per cent (out of 40) of the verified units were found closed.
2 Dy. Director of ARDD ( North and Dhalai), Asstt. Director of ARDD (Bishalgarh, Sonamura, Belonia, Sabroom, Salema and Kumarghat),

Appendices
Audit Report for the year 2012-13, Government of Tripura
175
Appendix 2.5 (Concld.)
Statement showing the observations relating to the selected projects pertaining to Animal Husbandry under RKVY
(Reference: Paragraph No. 2.3.10.1)
Sl. No.
Name of the Project Objective of the project Project
period Amount
(` in crore)
Number of beneficiaries
targeted Observations relating to the Project
4 Establishment of “Satellite Hatchery” for Production of Day Old layer Chicks at Amabassa
Increasing of egg and meat production in the State.
2011-12 0.77 Not specified The ARDD spent ` 0.13 crore for procurement of a 10 KV Diesel generator set, Hatchers, Setters etc. and deposited ` 0.06 crore for renovation of old building (site for placing the hatchery) with the Rural Development (RD) Department. Due to delay in execution of renovation works of the building by the RD Department, the project had not been implemented till June 2013. However, it was noticed that though the renovation of building was not completed, the balance amount of ` 0.58 crore was placed (September 2012) as working capital with the Superintendent of Veterinary Hospitals, Ambassa for implementation of the project.

Appendices
Audit Report for the year 2012-13, Government of Tripura
176
Appendix 2.6 Statement showing the observations relating to the selected projects pertaining to Horticulture under RKVY
(Reference: Paragraph No. 2.3.10.2)
Sl. No.
Name of the Projects
Object of the project
Project period
Amount (` in crore)
Number of beneficiaries
targeted Observations relating to the Project
1 ‘Development of Government Orchards’
To rejuvenate the existing four Government orchards under West Tripura District and also ensuring production of healthy planting material for different perennial fruit crops.
2009-10 0.56 Not specified Under this project, the construction of shed for putting seedlings, labour shed and irrigation facility had been taken up at different Government Orchards under West Tripura District and construction of Farmer Training Centre at Badharghat Government Orchards. Due to site problem and further slow progress of works by the contractor, the Training Centre which was scheduled to be completed by April 2011 had not been completed as of June 2013.
Thus, the project which was to be implemented during 2010-11 had remained incomplete for last three years and the stated objectives of rejuvenating the orchards and training to farmers etc. could not be achieved.
2 Enhancing Production of Off season and Other Root and Tuber Vegetables
To increase the additional area under Root and Tuber vegetables under Off season vegetables and also to increase yield through improved method of cultivation practices and high economic returns to the growers
2010-11 1.25 Increase production of 15500 MT vegetables from additional areas of 1180 hectares
Scrutiny of the records of the Director of Horticulture & Soil Conservation and nine offices3 of four districts revealed that the funds were released by the nodal department during 2010-11 directly to the Superintendent of Agriculture/Horticulture & Soil Conservation for implementation of the project. The implementation of the project was started in May 2010 and completed in February 2011 and the implementation of 609 hectares had been achieved by providing assistance to 2955 beneficiaries. Out of 2955 beneficiaries, the percentage of SC and ST beneficiaries was 22 and 32 respectively and in terms of gender male 83 per cent and female 17 per cent.
During physical verification of projects involving 40 beneficiaries, all the beneficiaries stated that they were benefited from the project. But no study had been conducted to assess the production of vegetables actually increased by implementation of the project.
3 Supdt. of H&SC, Bishalgahr, Sonamura, Udaipur, Manu and Kumarghat, Suptd. of Agriculture, Amarpur, Salema, Panisagar and Kadamtala

Appendices
Audit Report for the year 2012-13, Government of Tripura
177
Appendix 2.6 (Concld.) Statement showing the observations relating to the selected projects pertaining to Horticulture under RKVY
(Reference: Paragraph No. 2.3.10.2)
Sl. No.
Name of the Projects
Object of the project
Project period
Amount (` in crore)
Number of beneficiaries
targeted Observations relating to the Project
3 Block plantation of pineapple through staggered planting & chemical induction
To increase the productivity and production period of pineapple by induction of chemical in a staggered manner
2009-10 and 2011-12
5.02 1000 hectares with expected outcome of productivity of 25 MT per hectare.
During 2009-10 the project had been implemented in 500 hectares involving 1280 beneficiaries through staggered planting and during 2011-12 the chemical induction of flowering had been implemented in 1000 hectares involving 1503 beneficiaries. No study on the outcome of implementation of the project was done. During joint physical verification of projects implemented by eight offices of four districts involving 40 beneficiaries, all the beneficiaries stated that they had been benefited from the projects.
4 Demonstration on Improved Method of Cultivation of less fiber Ginger
Increase productivity of ginger from 5.06 MT per hectare to 10 MT per hectare by introduction of fibreless high yield varieties of ginger, bringing more areas and introduction of new techniques and practices
2010-11 0.45 100 ha The implementation of project had been started in Feb 2011 and completed in March 2011 by providing assistance to 474 beneficiaries which was 20 per cent of SC and 47 per cent of ST and in terms of gender, the female beneficiaries were 9 per cent. But no impact study had been conducted to assess whether the production of ginger actually increased leading to economic upliftment of the targeted beneficiaries by implementation of the project. During joint physical verification of projects implemented by eight offices of four districts involving 40 beneficiaries, all the beneficiaries stated that they had been benefited from the projects.
5 Introduction of Colocasia in Forest Areas as Intercrop
Increase additional production of Colacasia and annual income of the farmers by providing financial assistance and training.
2012-13 0.26 100 hectares through 1000 beneficiaries
The implementation of the project had been started in January 2013 and completed in August 2013 by providing assistance to 955 beneficiaries, 24 per cent of which was SC and 74 per cent ST and in terms of gender, the female beneficiaries were 15 per cent. But, no study to assess the impact of the scheme, particularly the assessment of the increase in productivity/yield per hectare and income enhancement of the targeted beneficiaries was done. Therefore, the achievement of the objectives of the project remained un-assessed. During joint physical verification of projects implemented by eight offices of four districts involving 25 beneficiaries, all the beneficiaries stated that they had been benefited from the projects.

Appendices
Audit Report for the year 2012-13, Government of Tripura
178
Appendix 2.7
Statement showing the observations relating to the selected projects pertaining to Development of Agricultural Market under RKVY
(Reference: Paragraph 2.3.10.4)
Name of the Project Name of the market
Project amount
(` in crore)
Status of completion Observations relating to the Project
Infrastructure Development in Agricultural Markets
Wholesale Assembling market at Bisramganj
2.30 Ongoing Due to delay in execution of works the Wholesale Assembling market at Bishramgani had not been completed and ` 2.10 crore was spent till June 2013. It was noticed that though most of the work had been completed, the work order for the sub-head ‘construction of multi-purpose cool chamber’, was initially issued in March 2011 to execute the works departmentally by a Junior Engineer but subsequently the work was awarded to a contractor in July 2011 with stipulation to complete the work within three months (November 2011). The work had not been completed till June 2013 despite lapse of 24 months against the stipulated three months. But reasons for delay in execution of work was not found on record. No hindrance register had been maintained for recording the reasons. Moreover, no action had also been taken against the contractor for not completing the work within the stipulated period. Rather the Department issued letters (23-3-2012 and 22-6-2012) to the contractor from time to time allowing of time extension, simply stating that the progress of work was not up to the mark or suspension of the work till date etc. During joint physical verification of Construction of Wholesale Assembling market at Bishramganj, it was noticed that none of the items like Covered Market shed, Wholesale and Retail Shop, Veterinary Dispensary etc., which had been completed and were in usable condition had been put to use. Further, it was observed that assets created for Market office and Fruit processing centre (` 16.00 lakh) had been diverted for creation of State PWD office. As a result, the targeted beneficiaries were deprived of getting these facilities.
5 Primary Rural Market at Bairagi Bazar and Moharchara (West Tripura), Debdaru (South Tripura) Anandabazar (North Tripura) and Durga Chowmuhani (Dhalai district)
1.09 completed The construction works of all five primary rural markets had been completed at a cost of ` 1.09 crore. Though all the markets were completed only three (Moharchhara, Bairagi bazaar and Debdaru) had been put to use. Out of the remaining two markets, one market at Durga Chowmuhani had been completed recently (August 2013), but another one at Anandabazar was lying unutilised since September 2012. No action had been taken by the implementing department to put the markets to use. As a result, the targeted beneficiaries were deprived of getting the facilities.

Appendices
Audit Report for the year 2012-13, Government of Tripura
179
Appendix 2.7 (Concld.)
Statement showing the observations relating to the selected projects pertaining to Development of Agricultural Market under RKVY
(Reference: Paragraph 2.3.10.4)
Name of the Project Name of the market
Project amount
(` in crore)
Status of completion Observations relating to the Project
Development of Village markets
5 Rural Markets at K.K.Nagar (West Tripura); Killa and Barpathari (South Tripura); Noagoan (North Tripura); and Ambassa (Dhalai)
4.67 Completed Scrutiny of records and physical visit revealed that the rural market at Killa was completed in time and was put to use. Due to delay in handing over of site, rainy season as well as due to delay in execution of works, all other four markets were completed with delays ranging from 10 to 21 months. The market at Ambassa was completed in June 2013. Barpathari completed in March 2013 was put to use, K.K.Nagar completed in March 2012 had been partially used mainly due to absence of power supply connection and Noagaon completed in December 2012 was not used till the date of audit (June 2013).

Appendices
Audit Report for the year 2012-13, Government of Tripura
180
Appendix 2.8
Statement showing the observations relating to the selected projects pertaining to Fisheries under RKVY (Reference: Paragraph No. 2.3.10.7)
Sl. No.
Name of the Project
Object of the project
Project period
Amount (` in
crore)
Number of beneficiaries
targeted Observations relating to the Project
1 Construction of Fish Farmers’ Training Centre at Lembucherra
To improve productivity by providing advanced training to the fish farmers
2008-09 0.38 Revised to
0.62
Not specific The work was started in November 2010 and completed in October 2012 at a cost of ` 0.62 crore (including cost of ` 0.07 crore for additional items) as against the original estimated cost of ` 0.38 crore. Due to delay in execution of works by the Rural Development Department, an extra expenditure of ` 0.17 crore had been incurred by the implementing department besides delay of about three years in execution of the project by the RD Department.
2 Development of Research Lab at Kumarghat
To assist the fish farmers in improving the productivity by providing scientific inputs.
2008-09 0.40 Not specific The works had been executed through a contractor by inviting open tender. The tender was invited in October 2009 and the work was awarded to the lowest tenderer in December 2009 for ` 0.24 crore with a stipulation to complete the work by June 2010. However, the works had been completed in April 2012 at a cost of ` 0.24 crore. It was observed that there was a delay of 21 months in execution of the project. No action had been taken against the contractor for non-completion of works within the stipulated period.
3 Establishment of eco-hatchery
For quality singhi and kaoi fish seed production in South Tripura
2012-13 0.23 Not specific The funds were placed with Krishi Vigyan Kendra (KVK) Birchandra Manu in October 2012. But the implementation had not been started till June 2013. The Coordinator of KVK replied (December 2013) that training had been provided to the selected beneficiaries and tender had been finalised for execution of civil construction works for implementation of the project and expected to be completed by March 2014.

Appendices
Audit Report for the year 2012-13, Government of Tripura
181
Appendix 2.8 (Concld.)
Statement showing the observations relating to the selected projects pertaining to Fisheries under RKVY (Reference: Paragraph No. 2.3.10.7)
Sl. No.
Name of the Project
Object of the project
Project period
Amount (` in
crore)
Number of beneficiaries
targeted Observations relating to the Project
4 Development of special aqua village
To popularise semi-intensive fish culture technology for sustainable production and livelihood security of rural farmers
2012-13 1.00 80 hectares Neither any criteria had been prescribed by the Department for selection of beneficiaries nor any measurable parameters for ensuring the upliftment of the livelihood of rural fishermen was prescribed. The project had been completed in August 2013. The number of beneficiaries (fisherman) facilitated by the implementation of the project was 748 fishermen which included 25 per cent SC, 38 per cent ST and in terms of gender, 6 per cent female beneficiaries. During joint physical verification of projects involving 25 beneficiaries, the beneficiaries stated that they had been benefited from the project. But due to the implementation of project without prescribing any targeted beneficiaries/measurable parameters, the impact of the implementation of the project could not be evaluated.
5 Hi-tech Fish culture through use of Aerator
Encourage Hi-tech Fish culture through use of Aerator among the 2nd & 3rd category farmers
2012-13 0.21 To provide 60 Aerators to the beneficiaries at a subsidised rate of ` 5000 each
The funds were placed by the nodal department in September 2012. The tender was invited in November 2012 and work order was issued to the 1st lowest tenderer in January 2013 at a tendered value of ` 0.21 crore for supply of 60 Nos. of Aerator with a stipulation to complete the supply within six months (i.e. by July 2013). Though the project was to be implemented during 2012-13 due to delay in inviting and finalisation of tender and further allowing of six months time (up to July 2013) to the suppliers, no Areator had been supplied by the firm till June 2013. The result was that the project had not been completed till date and intended beneficiaries were deprived of getting Areator at subsidised rate.

Appendices
Audit Report for the year 2012-13, Government of Tripura
182
Appendix 2.9
Statement showing details of cost escalation due to revision of DPR (Reference: Paragraph No 2.4.8.2)
(in `) Name of the Project Item Initial DPR
cost Revised DPR
cost Difference
RCC Bridge over Lohar on Berimura- Taltala Road
Super Structure 4611899 5543033 931134 Sub-structure 8579241 12218327 3639086 Approach Road 1735709 4722802 2987093
Total 14926849 22484162 7557313
RCC Bridge over local stream on Bishalgarh-Takerjala Road near Golaghati Market
Super Structure 6267451 7946835 1679384 Sub-structure 12995119 18939773 5944654 Approach Road 2877826 7740327 4862501
Total 22140396 34626935 12486539 RCC Bridge over Ujanmachmarracherra at Ch. 9.00 Km on Kanchanpur to Jalebassa Road
Sub-structure 11961202 20289005 8327803 Super Structure 4695933 4846711 150778Approach Road 1884642 4963333 3078691
Total 18541777 30099049 11557272 RCC Bridge over Laxmicherra at Ch.12.01 Km on Khowai to Udna Road
Sub-structure 8098540 12319039 4220499Super Structure 3092722 4149355 1056633 Approach Road 2226626 4678186 2451560
Total 13417888 21146580 7728692 RCC bridge over local stream at Ch. 4.4 Km on Jampaijala to Jogendranagar Road
Sub-structure 2772338 3550035 777697 Super Structure 7680921 9919457 2238536 Approach Road 2342978 4577960 2234982
Total 10023899 18047452 5251215 RCC bridge over Balucherra on Maharani - Tulashikahr road
Sub-structure 6450071 9477787 3027716 Super Structure 2772338 3550035 777697 Approach Road 2126498 4437232 2310734
Total 4898836 17465054 6116147
RCC Bridge over SURMACHERRA at Ch 30.10 KM on Mohanpur- Simna Road
Sub-structure 5897595 9021441 3123846 Super Structure 2276202 3503161 1226959 Approach Road 1822239 3850261 2028022
Total 4098441 16374863 6378827
RCC Bridge over SURMACHERRA at Ch 34.53 KM on Mohanpur- Simna Road
Sub-structure 8591330 12222819 3631489 Super Structure 4611899 5543033 931134 Approach Road 1538733 4169086 2630353
Total 6150632 21934938 7192976 6,42,68,981
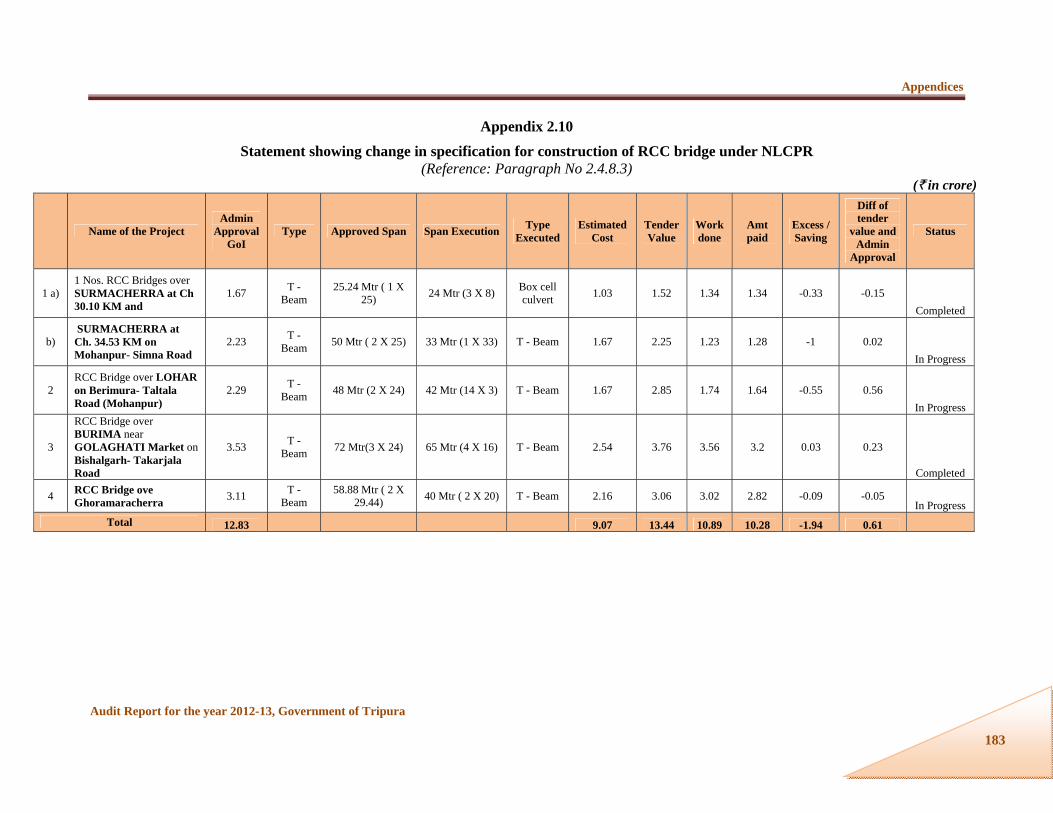
Appendices
Audit Report for the year 2012-13, Government of Tripura
183
Appendix 2.10
Statement showing change in specification for construction of RCC bridge under NLCPR (Reference: Paragraph No 2.4.8.3)
(` in crore)
Name of the Project Admin
Approval GoI
Type Approved Span Span Execution Type Executed
Estimated Cost
Tender Value
Work done
Amt paid
Excess / Saving
Diff of tender
value and Admin
Approval
Status
1 a) 1 Nos. RCC Bridges over SURMACHERRA at Ch 30.10 KM and
1.67 T - Beam
25.24 Mtr ( 1 X 25) 24 Mtr (3 X 8) Box cell
culvert 1.03 1.52 1.34 1.34 -0.33 -0.15 Completed
b) SURMACHERRA at Ch. 34.53 KM on Mohanpur- Simna Road
2.23 T - Beam 50 Mtr ( 2 X 25) 33 Mtr (1 X 33) T - Beam 1.67 2.25 1.23 1.28 -1 0.02
In Progress
2 RCC Bridge over LOHAR on Berimura- Taltala Road (Mohanpur)
2.29 T - Beam 48 Mtr (2 X 24) 42 Mtr (14 X 3) T - Beam 1.67 2.85 1.74 1.64 -0.55 0.56
In Progress
3
RCC Bridge over BURIMA near GOLAGHATI Market on Bishalgarh- Takarjala Road
3.53 T - Beam 72 Mtr(3 X 24) 65 Mtr (4 X 16) T - Beam 2.54 3.76 3.56 3.2 0.03 0.23
Completed
4 RCC Bridge ove Ghoramaracherra 3.11 T -
Beam 58.88 Mtr ( 2 X
29.44) 40 Mtr ( 2 X 20) T - Beam 2.16 3.06 3.02 2.82 -0.09 -0.05 In Progress
Total 12.83 9.07 13.44 10.89 10.28 -1.94 0.61

Appendices
Audit Report for the year 2012-13, Government of Tripura
184
Appendix 2.11
Statement showing details of fund released by GOI, State Finance Department as well as CE (Reference: Paragraph No 2.4.9.1)
Sl. No.
Name of the bridge Release by GOI to Finance Department
Release by Finance Department(FD) to Chief Engineer(CE)
Total time
taken by FD
Release of fund by CE to Executing Agency
Time taken by
CE
Total time taken from the date of
release of GOI (in days) including
permissible 15 days 1 2 3 4 5 6 7 8 (5+7) Amount Date Amount Date Amount Date Amount 1 2 Nos. RCC Bridges over
SURMACHERRA at Ch 30.10 KM and Ch. 34.53 KM on Mohanpur- Simna Road
123.08 17.08.2009 123.08 28.04.2010 240 123.08 04.10.10 150 390
159.05 18.03.2013 159.05 Nil 159.05 Nil 2. RCC Bridge over river DHANAI
at Ch.6.60 KM on Champaknagar-Mandai Road
115.68 23.02.2010 115.68 28.04.2010 60 115.68 03.09.2012 850 910
3 RCC Bridge over DHURAICHERRA at Ch. 0.90 KM on Kamalpur- Bilascherra Road
107.02 23.02.2010 107.02 28.04.2010 60 107.02 24.10.2011 540 600
155.3 22.03.2011 155.3 18.04.2011 25 155.3 27.05.2011 40 65
4 RCC Bridge at KRISHNAPUR Ch. 6.05 on Maharani-Tulashikhar Road (Amarpur)
64.13 09.03.2010 64.13 28.04.2010 50 64.13 29.12.2010 240 290 64.13 29.09.2011 32.065 15.11.2011 45 32.065 25.11.2011 9 54
32.065 09.03.2012 159 32.065 12.03.2012 3 162 28.92 27.12.2012 28.92 19.02.2013 54 28.92 27.02.2013 373 427
5 RCC Bridge over LOHAR on Berimura- Taltala Road (Mohanpur)
82.56 11.03.2010 82.56 28.04.2010 47 82.56 04.10.2010 155 202
82.56 15.03.2011 82.56 18.04.2011 34 82.56 05.05.2011 17 51 6 RCC Bridge over
Baraduptacherra at Ch. 2.80 KM
139.54 10.06.2010 139.54 20.02.2011 250 139.54 24.10.2011 242 492
133.07 11.03.2013 133.07 Nil 133.07 Nil 7 RCC Bridge over BURIMA near
GOLAGHATI Market on Bishalgarh- Takarjala Road
127.14 08.02.2010 127.14 20.02.2011 372 127.14 09.03.2011 17 389
127.14 24.05.2011 127.14 02.08.2011 69 127.14 12.08.2011 11 80

Appendices
Audit Report for the year 2012-13, Government of Tripura
185
Appendix 2.11 (Concld.)
Statement showing details of fund released by GoI, State Finance department as well as CE (Reference: Paragraph No 2.4.9.1)
Sl. No.
Name of the bridge Release by GOI to Finance Department
Release by Finance Department(FD) to Chief Engineer(CE)
Total time
taken by FD
( in days)
Release of fund by CE to Executing Agency
Time taken by CE
(in days)
Total time taken from the date of release of
GOI (in days)
1 2 3 4 5 6 7 8 (5+7) Amount Date Amount Date Amount Date Amount 8 RCC Bridge over Ujan
MACHMARACHERRA at Ch. 9.00 KM (Kanchanpur)
110.52 10.06.2010 110.52 20.02.2011 250 110.52 24.10.2011 242 492
9 RCC Bridge over GHORAMARACHERRA at JIRANIA on NH-44 (Bishalgarh)
111.89 10.06.2010 111.89 20.02.2011 250 111.89 24.10.2011 242 492
107.52 5.12.2012 107.52 28.01.2013 53 107.52 01.02.2013 03 56 10 RCC Bridge at
LAXMICHERRA at Ch. 12.01 KM (Khowai)
77.65 29.03.2010 77.65 20.02.2011 322 77.65 09.03.2011 17 339
112.66 18.03.2011 112.66 18.04.2011 30 112.66 06.05.2011 17 47 11 Improvement of MAILAK-
GOMUKABARI via Burbaria 7.50 KM
384.5 24.12.2010 384.5 20.02.2011 57 384.5 04.03.2012 11 68 384.5 19.05.2011 384.5 02.08.2011 73 384.5 12.08.2011 09 82 173.4 29.06.2012 173.4 08.08.2012 38 173.4 22.08.2012 13 51
12 RCC Bridge over KAKRICHERRA at Ch. 4.50 KM on THALAIBARI- MICROSA (Sonamura)
75.52 29.09.2009 75.52 09.12.2009 70 75.52 26.03.2011 168 238 75.52 29.09.2011 37.76 15.11.2011 45 37.76 25.11.2011 09 54
37.76 09.03.2012 160 37.76 12.03.2012 02 162 34.06 17.01.2013 34.06 Nil 34.06 Nil
13 RCC Bridge over local stream at Ch. 4.40 KM and Ch. 7.50 KM on JOGENDRANAGAR- JAMPUIJALA Road (Bishalgarh)
158.37 30.09.2009 158.37 24.03.2011 533 158.37 26.03.2011 02 535
152.15 11.02.2013 63.86 20.03.2013 36 63.86 25.03.2013 04 40

Appendices
Audit Report for the year 2012-13, Government of Tripura
186
Appendix 2.12
Statement showing the details of delay in submission of Utilisation Certificates (Reference: Paragraph No 2.4.9.1)
Name of Project
Approved Cost & date of approval (` in lakh)
Amount of Installment Due date for submission of
UC
Date of Submission of
UC by Implementing
Agency
Date of submission of UC by CE to
Planning Deptt.
Delay in submission
of UC Amount (` in lakh)
Date
Construction of RCC bridge over Baradupatacherra at Ch.2.80 Km on Kanchanpur-Jalabassa Road(ODR)
387.62 139.54
133.07
10.06.2010
11.03.2013
09.06.2011
10.03.2014
12.07.2012 -
28.09.2012 -
13 months
Construction of RCC bridge over Burima river near Golaghati Market on Bishalgarh-Golaghati-Takarjala Road
353.19 127.14
127.14
08.02.2010
24.05.2011
07.02.2011
23.05.2012
02.03.2013
9 months
Construction of RCC bridge over river Dhanai at Ch.6.60 Km on Champaknagar-Mandai Road
321.34 115.68 23.02.2010 22.02.2011 16.02.2013 23 months
Construction of RCC bridge over Ghoramaracherra on NH-44 at Jirania Tripura Engineering College-Chalkbasta Road
310.82 111.89
107.52
10.06.2010
05.12.2012
09.06.2011
04.12.2013
05.04.2012
24.05.2013
02.03.2013 10 months
Construction of RCC bridge over Ujan Machmaracherra at Ch.9.00 Km on Kanchanpur-Jalabassa Road (ODR)
307.01 110.52 10.06.2010 09.06.2011 09.04.2013 02.03.2013 22 months
Construction of RCC bridge over Dhuraicherra at Ch.0.90 KM on Kamalpur-Bilascherra Road
297.30 107.02
155.30
23.02.2010
22.03.2011
22.02.2011
21.03.2012
05.04.2012
17.10.2011
16.08.2011
13 months
NilConstruction of RCC bridge over local steam at Ch. 4.40 km & Ch.7.50 km on Jogendranagar to Jampaijala Road
439.92 158.37
152.15
30.09.2009
11.02.2013
29.09.2010
10.02.2014
-
19.06.2012 -
15 months -
Construction of RCC bridge over Lohar on Berimura-Taltala Road
229.33 82.56 82.56
11.03.2010 15.03.2011
10.03.2011 14.03.2012
16.04.2013 16.04.2013
02.04.2013
25 months 13 months
Improvement of Mailak-Gamokhabari Road via Burburia (7.50 KM)
1068.05 384.50 384.50 173.40
24.12.2010 19.05.2011 29.06.2012
23.12.2011 18.05.2011 28.06.2013
08.03.2011 03.04.2012 04.04.2013
13.03.2012
Nil 10 months
Nil Construction of RCC bridge over river Surmacherra at Ch. 30.10 KM & Ch.34.53 KM on Mohanpur-Simna Road
390.75 123.08
159.05
24.08.2009
18.03.2013
23.08.2010
17.03.2014
16.04.2013 -
24.01.2013 -
31 months -

Appendices
Audit Report for the year 2012-13, Government of Tripura
187
Appendix 2.12 (Concld.)
Statement showing the details of delay in submission of Utilisation Certificates (Reference: Paragraph No 2.4.9.1)
Name of Project
Approved Cost & date of approval (` in lakh)
Amount of Installment ( in Lakh) Due date for
submission of UC
Date of Submission of UC by Implementing
Agency
Date of submission of UC by CE to Planning Deptt.
Delay in submission
of UC Amount (` in lakh)
Date
Construction of RCC bridge over Kakricherra on Thalibari-Microsa Road
209.77 75.52
75.52
34.06
30.09.2009
29.09.2011
17.01.2013
29.09.2010
28.09.2012
16.01.2014
20.06.2011
-
29.11.2012
-
6 months
2 months
- Construction of RCC bridge at Krishnapur Ch. 6.05 KM on Maharani – Tulasikhar Road (Amarpur)
178.14 64.13
64.13
28.92
11.03.2010
29.09.2011
27.12.2012
10.03.2011
28.09.2012
26.12.2013
08.04.2011
03.04.2012
04.04.2013
13.03.2012
1 month
Nil
Nil Construction of RCC bridge over Laxmicherra at Ch. 12.01 KM on Khowai to Udna Road
215.69 77.65
112.66
29.03.2010
18.03.2011
28.03.2011
17.03.2012
07.04.2011
05.03.2012
02.09.2011
Nil
Nil

Appendices
Audit Report for the year 2012-13, Government of Tripura
188
Appendix 2.13
Statement showing details of calculation of damaged quantity of outer layer of road of Dharmanagar-Tilthai-Damcherra-Khedacherra road
{Reference: Paragraph No 2.4.10.4(i)(b), Project – 1}
New Alignment ExtensionGSB + WBM(I) GSB + WBM(I) WBM II
Chainage from
Chainage to Difference
Length in mtr
Chainage from
Chainage to Difference
Length in mtr
Chainage from
Chainage to Difference
Length in mtr
22.2 22.3 0.1 100 19.435 19.5 0.065 65 25.55 25.68 0.13 130 22.45 22.58 0.13 130 21.3 22.2 0.9 900 32.82 33 0.18 18024.6 24.72 0.12 120 22.3 22.45 0.15 150 33.24 33.36 0.12 120
50.43 50.66 0.23 230 22.58 24.6 2.02 2020 34.65 34.72 0.07 70 52.37 52.62 0.25 250 24.72 25.55 0.83 830 35.28 35.42 0.14 140 52.9 53.01 0.11 110 25.68 27.58 1.9 1900 37.63 37.94 0.31 310
Total 940 27.6 29.25 1.65 1650 48.61 48.76 0.15 150 29.31 30.2 0.89 890 Total 1100 30.29 30.4 0.11 110
32 32.82 0.82 820 33 33.24 0.24 240
33.36 34.65 1.29 1290 34.72 35.28 0.56 560 35.42 37.63 2.21 2210 37.94 38.4 0.46 460 50.94 51.86 0.92 920
Total 15015

Appendices
Audit Report for the year 2012-13, Government of Tripura
189
Appendix 2.13 (Concld.)
Statement showing details of calculation of damaged quantity of outer layer of road of Dharmanagar-Tilthai-Damcherra-Khedacherra road
{Reference: Paragraph No 2.4.10.4(i)(b), Project–1}
Volume of WBM-I damaged in New Alignment = 940 mtr (length) X 7.5mtr (width) X 0.10mtr (thickness) = 705 cum WBM I
Agreement item Collection Ratio4 as per estimate
Total laying done (cum)
Total collection/laying
(cum)
Rate (in `) Cost (in `)
Total cost (in `)
Collection of bricks 1.43 705 1008.15 1800 1814670 Laying 705 300 211500 2026170
Volume of WBM-I damaged in Extension = 15015 mtr (length) X 3 mtr (width) X 0.10 mtr (thickness) = 4504.5 cum say 4505 cum
Collection of bricks 1.43 4505 6442.15 1800 11595870 Laying 4505 300 1351500 12947370
Volume of WBM-II damaged in Extension = 1100mtr (length) X 5.5 mtr (width) X 0.10mtr (thickness) = 605 cum
Collection of bricks 1.43 605 865.15 1800 1557270 Laying 605 300 181500 1738770
Total cost of damaged quantity 16712310
4 Volume of brick required for execution of 1 cum GSB/WBM work

Appendices
Audit Report for the year 2012-13, Government of Tripura
190
Appendix 2.14
Statement showing excess collection of material in violation of estimated quantity {Reference: Paragraph No 2.4.10.4(i)(d), Project-1}
For GSB
As per estimate
For 23098.65 cum GSB required = 33031.070 cum 63 mm Jhama bricks
1 cum GSB required = 33031.070/23098.65 = 1.43 cum 63 mm Jhama bricks
Total GSB done with Jhama bricks aggregate =6492.062 cum Total collection required = 6492.062 x 1.43 = 9283.65 cum Excess collection of Jhama bricks for GSB preparation = (11446.058 – 9283.65) cum
=2162.408 cum Excess expenditure incurred = 2162.408 x ` 1650 = ` 3567973.2 For WBM
As per estimate
For 41596.500 cum WBM required 59358.206 of 50 mm Jhama bricks
For 1 cum WBM required = 59358.206/41596.500
= 1.43 cum Total WBM done with Jhama bricks aggregate = 5561.523 cum Total collection required = 5561.523 x 1.43= 7952.97789 Excess collection of Jhama bricks for WBM preparation = (10676.078 – 7952.97789) cum
=2723.10011 cum Extra expenditure incurred = 2723.10011 x ` 1800 = ` 4901580.2 Total extra expenditure incurred = ` 3567973.20+ `4901580.20 = ` 8469553.40

Appendices
Audit Report for the year 2012-13, Government of Tripura
191
Appendix 2.15 Statement showing loss of interest against mobilisation advance
{Reference: Paragraph No. 2.4.10.4 (i) (h), Project-1} (in `)
Date of advance
given
Period Amount of advance
Date of recovery
Amount recovered
Balance amount
available
Period in days
Rate of interest
(per cent)
Amount in interest
1 2 3 4 5 6 7 8 9
18-04-08 18-04-2008 to 11-05-2008
60000000 0 0 60000000 24 10 394521
12-05-08 12-05-2008 to 20-10-2009
29000000 0 0 89000000 527 10 12850137
21-10-2009 to 04-04-2010
89000000 21-10-09 8600000 80400000 185 10 4075068
05-04-2010 to 09-05-2010
80400000 05-04-10 28000000 52400000 35 10 502466
10-05-2010 to 29-07-2010
52400000 07-05-10 10000000 42400000 81 10 940932
30-07-2010 to 27-12-2010
42400000 30-07-10 2767500 39632500 151 10 1639591
28-12-2010 to 24-03-2011
39632500 28-12-10 5700000 33932500 87 10 808802
25-03-2010 to 12-09-2011
33932500 25-03-11 2163000 31769500 172 10 1497083
13-09-1011 to 20-03-2012
31769500 13-09-11 1205000 30564500 190 10 1591029
21-03-2012 to 31-03-2013
30564500 21-03-12 5631900 24932600 376 10 2568399
01-04-2013 to 31-08-2013
24932600 0 0 24932600 153 10 1045120
27913148

Appendices
Audit Report for the year 2012-13, Government of Tripura
192
Appendix 2.16
Extra expenditure of ` 1.11 crore due to execution of agreement item through another agreement as an extra item {Reference: Paragraph No 2.4.10.4 (ii) (b), Project-2}
Item No. with reference to Extra item
Description of Item Unit Agreement Rate (in `)
Rate for extra item
Difference (`)
Total quantity executed
Total extra amount
(`) AI-7 Ex- 2
Preparation of sub-grade excavating earth to an average of 22.5 cm depth, dressing to camber& consolidating with road roller including making good the un-dulation etc. and disposal of all kinds of soil (excluding rock)
Sqm 18 1000 982 38275.81 3,75,868
AI-9 Ex- 3
Collection & stacking of jhama brick aggregate of 63mm nominal size at site of work
Cum 1308 1650 342 16201.557 55,40,932
AI-10 Ex- 4
Laying granular sub-base in uniform layer with brick aggregate including screening, sorting, spreading to template and consolidation with power road roller min. 8 Tonne to 10 Tonne complete as per direction of the Engineer-in-charge
Cum 145 170 25 9256.8816 2,31,422
AI-12 Ex- 5
Laying wearing course with brick aggregate including screening, sorting, spreading to template and consolidation with power road roller min. 8 Tonne complete including spreading and consolidation of blinding materials (payment to be made for quantity of brick aggregate excluding binding matrerials)
Cum 175 190 15 6921.8914 1,03,828
AI-13 Ex- 6
Collection & stacking of stone aggregate of 20mm nominal size at site of work
Cum 2625 3000 375 3934.52 14,75,445
AI-14 Ex- 7
Laying dense bituminous mecadam of any thickness with picked jhama/ stone aggregate and 64 Kg of hot cut back bitumen including tack coat of approved quality per cum of brick/ stone aggregate including the cost of preparation of base for laying the bitumenous concrete and tack coat but excluding the cost of brick/stone aggregate (payment to be made only for finished thickness)
Cum 2550 3394 (1250 +
Bitumen 2144)
3952.768 844 33,36136
Total: 1,10,63,631

Appendices
Audit Report for the year 2012-13, Government of Tripura
193
Appendix 2.17
Statement showing details of Doubtful execution of work {Reference: Paragraph No 2.4.10.4 (ii) (c), Project-2}
(1) Doubtful execution of DBM work valued ` 0.44 crore As per Bill quantity (i) GSB (63mm) done against Agreement Item -10 273173.003 sqm(ii) GSB (63mm) done against Extra Item-(EI) 4 52004.98 sqm
Total GSB Area (i) + (ii) 3,25,178 sqmWBM (63mm) done against AI-12 (49450.317- 2924.805) cum= 46525.512 cum(iii) Since thickness of WBM is 0.143 m hence area covered: 46525.512 cum/ 0.143 325353.2308 Sqm
(iv) WBM (63mm) done against EI-5 48404.77 SqmTotal WBM (63mm) Area (iii) + (iv) 3,73758.008 sqm
(v) DBM done against AI-14 330331.3 sqm(vi) DBM done against EI-7 55438.89 sqm
Total DBM Area (v) + (vi) 3,85,770.2 sqmHence, DBM area shown excess than WBM (385770.165- 373758.0008) sqm= 12012.164 sqmThus, DBM quantity shown excess than WBM (12012.1642 X 0.0713) cum= 856.46731 cum (a) Cost of DBM shown in excess (856.46731 X ` 2550 per cum) = ` 2183991.60
(b) Cost of Collection & stacking of stone aggregate of 20mm for DBM work shown in excess
(856.46731 X ` 2625 per cum)= ` 2248226.70
Hence, total excess cost shown in DBM work= (a+b) ` 4432218.3 (2) Excess cost shown in Premix surfacing and Sand seal coating Premix surfacing against AI-15 351987.902 Sqm @` 170 per sqm Premix surfacing against EI-8 58745.155 Sqm @` 127 + ` 4.11 (for bitumen) = `
131 per sqm Total Premix surfacing done 410733.057 Sqm
Sand seal coating against AI-16 351987.897 Sqm @` 21 Per sqm Sand seal coating against EI-9 57920.155 Sqm @` 7 + ` 1.46(for bitumen)= ` 8.46
per sqm Total Sand seal coating done 409908.052 Sqm
Total WBM (63mm) area covered 373758.0008 SqmDBM to be laid on WBM; Premix surfacing and Sand seal coating to be done on DBM. Hence,
(a) Premix surfacing excess shown 410733.057 - 373758.0008) sqm= 36975.0562 sqm @ ` 131= ` 4843732
(b) Sand seal coating excess shown (409908.052 - 373758.0008) sqm= 36150.0512 sqm @ ` 8.46= ` 305829
Total excess cost shown in Premix surfacing and Sand seal coating = (a+b)
` (4843732 + 305829)= ` 5149561
Grand Total (1) + (2) ` 4432218.3+` 5149561 = ` 9581779.3 (say ` 0.95 crore)

Appendices
Audit Report for the year 2012-13, Government of Tripura
194
Appendix 2.18
Statement showing loss of interest against mobilisation advance {Reference: Paragraph No 2.4.10.4(iii)(a), Project-3}
(in `) (I) M/s Ramky Infrastructure Ltd.
Date of advance
given
Period Amount of advance
Date of recovery
Amount recovered
Balance amount
available
Period in days
Rate of interest
(per cent)
Amount of interest
1 2 3 4 5 6 7 8 9 31-01-2011 31-01-2011 to 15-03-2011 28892500 0 0 28892500 44 10 348293 16-03-2011 16-03-2011 to 05-05-2011 28892500 0 0 57785000 51 10 807407
06-05-2011 to 07-08-2011 57785000 06-05-2011 1453125 56331875 94 10 1450739 08-08-2011 to 14-10-2011 56331875 08-08-2011 421875 55910000 68 10 1041611 15-10-2011 to 19-12-2011 55910000 15-10-2011 281250 55628750 66 10 1005890 20-12-2011 to 16-01-2012 55628750 20-12-2011 4062500 51566250 27 10 381449 17-01-2012 to 29-01-2012 51566250 0 0 51566250 13 10 183661 30-01-2012 to 06-08-2012 51566250 30-01-2012 187500 51378750 190 10 2674510 07-08-2012 to 15-10-2012 51378750 07-08-2012 9342823 42035927 70 10 806168 16-10-2012 to 23-12-2012 42035927 16-10-2012 3470302 38565625 69 10 729049 24-12-2012 to 23-01-2013 38565625 24-01-2013 5794121 24932600 31 10 211756 24-01-2013 to 24-03-2013 24932600 25-03-2013 3200720 21731880 60 10 357236 25-03-2013 to 31-03-2013 21731880 21731880 7 41678
Total 10039447 (II) M/s Coal Mines Ltd.
11-02-2011 11-02-2011 to 03-03-2011 24765000 0 0 24765000 21 10 142484 06-03-2011 04-03-2011 to 25-07-2011 24765000 0 0 49530000 144 10 1954060 26-07-2011 to 03-11-2011 49530000 26-07-2011 2881250 46648750 101 10 1290828 04-11-2011 to 24-11-2011 46648750 04-11-2011 3250000 43398750 21 10 249691 25-11-2011 to 30-12-2011 43398750 25-11-2011 219177 43179573 36 10 425881 31-12-2011 to 11-03-2012 43179573 20-12-2011 1560456 41619117 72 10 820980 12-03-2012 to 11-07-2012 41619117 12-03-2012 3447163 38171954 122 10 1275884 12-07-2012 to 10-09-2012 38171954 12-07-2012 3159600 35012354 61 10 585138 11-09-2012 to 11-10-2012 35012354 11-09-2012 2354674 32657680 31 10 277367 12-10-2012 to 08-11-2012 32657680 12-10-2012 915042 31742638 28 10 243505 09-11-2012 to 18-11-2012 31742638 09-11-2012 2185825 24932600 10 10 68308 19-11-2012 to 28-02-2013 24932600 10-11-2012 710585 24222015 102 10 676889 01-03-2013 to 21-03-2013 24222015 21-03-2013 2415044 21806971 21 10 125465 22-03-2013 to 30-03-2013 21806871 30-03-2013 1700000 20106971 9 10 49579 31-03-2013 20106971 20106971 1 10 5509 Total 8191569
(I+II) = ` 10039447 + ` 8191569 = ` 1,82,31,016

Appendices
Audit Report for the year 2012-13, Government of Tripura
195
Appendix 2.19 Statement showing the extra expenditure incurred by the Department in awarding works to
the private sector construction agencies (Reference: Paragraph No 2.8)
Sl. No. Name of the bridge
Tender Value as per DPR
(` in lakh)
Expenditure incurred on the basis of work order Expenditure on the basis of cost plus Difference (6-19)
i.e. extra expenditure
incurred (`)
Execution as per estimate based
on SOR 2008 (`)
48% above on the DPR
(`)
Total (4 + 5)
(`)
Execution as per estimate
based on SOR 2008 (`)
10% above on the DPR
(`)
Total (8+ 9)
(`)
1 2 3 4 5 6 7 8 9 10
M/s Ramky Infrastructure Ltd. 1. Const. of RCC bridge on the road from
South Anandanagar to Takarjala at Ch.16.00 KM to 17 KM
226.16
1,13,44,702
54,45,457
1,67,90,159
1,13,44,702
11,34,470
1,24,79,172
43,10,987
2. Const. of RCC bridge on the road from Bishalgarh Golaghati road (Near Gandhi Home) to Nabasantiganj
330.86
97,36,330
46,73,438
1,44,09,768
97,36,330
9,73,633
1,07,09,963
36,99,805
3. Const. of RCC bridge on the road from South Anandanagar to Jarulbachai via Kanterjala at Ch.2.80 KM
393.72
85,30,043
40,94,421
1,26,24,464
85,30,043
8,53,004
93,83,047
32,41,417
4. Const. of RCC bridge on the road from Rabindrasadan to Anandanagar at Ch.0.45 KM
180.35
1,10,06,910
52,83,317
1,46,98,794
1,10,06,910
11,00,691
1,21,07,601
25,91,193
5. Const. of RCC bridge on the road from Jarulbachai to Gabordi at Ch.2.00 KM
219.01
83,28,823
39,97,835
1,23,26,658
83,28,823
8,32,882
91,61,705
31,64,953
6. Const. of RCC bridge on the road from Rabindranagar to Shyamaprasad at Ch.0.15 KM
167.51
81,15,122
38,95,259
1,20,10,381
81,15,122
8,11,512
89,26,634
30,83,747
M/s Coal Mines Associated Traders Ltd. 7. Const. of RCC bridge over Bangeswar
river on the road from Dukli to Medda Chowmuhani at Ch.0.75 KM
293.11
1,88,11,368
90,29,457
2,78,40,825
1,88,11,368
18,81,137
2,06,92,505
71,48,320
8. Const. of RCC of RCC bridge over river Sinai on the road from Kanchanmala market to Purba Champamura at Ch.0.20 KM
514.15
1,14,60,546
55,01,062
1,69,61,608
1,14,60,546
11,46,055
1,26,06,601
43,55,007
9. Const. of RCC bridge over river Sinai on the road from Sekerkote Mandir to Pandavpur at Ch.1.20 KM”
376.03
65,79,489
31,58,155
97,37,644
65,79,489
6,57,949
72,37,438
25,00,206
Total: 2700.90 9,39,13,333 4,50,78,401 13,89,91,734 9,39,13,333 93,91,333 10,33,04,666 3,56,87,068

Appendices
Audit Report for the year 2012-13, Government of Tripura
196
Appendix 2.20
Statement showing the details of works awarded to local contractor
(Reference: Paragraph No 2.8)
(` in crore) Sl. No. Name of the work Estimated
cost Tendered
Value Tender
percentage Time for
completion Date of award
of work Present Status (Total value of
work done) 1. Construction of RCC bridge over Nagicherra
at Moloynagar to Anandanagar road at Ch.2 KM under Bishalgarh Division
2.69 3.20 18.632% above the estimated cost
18 months 13/10/2010 Completed on 29/11/2012 (` 3.01 crore)
2. Construction of RCC bridge over river Sinai on the road from Ishanchandranagar to Fultali (L-3.50 KM) at Ch.0.40 KM under Bishalgarh Division
5.52 5.12 7.13% below the estimated cost
36 months 13/10/2010 Total value of work done (` 3.77 crore upto March 2013) Financial achievement: 74%
3. Construction of RCC bridge over Bangeshwar on the road Moloynagar to South Anandanagar at Ch.7.00KM under Bishalgarh Division
3.01 3.48 15.71% above the estimated cost
24 months 13/09/2011 Total value of work done (Rs.2.33 crore upto March 2013) Financial achievement: 67%

Appendices
Audit Report for the year 2012-13, Government of Tripura
197
Appendix 2.21 Statement showing the detailed position of nine bridges awarded to private sector construction agencies
(Reference: Paragraph No 2.8)
Sl. No. Name of the bridge
Date of commen-cement
Date of last
measure-ment
Tender Value as per DPR
(` in lakh)
Expenditure incurred and paid to the agencies Present Status
(Period of remaining idle upto July 2013)
Execution as per estimate based on SOR 2008
(`)
48% above on the DPR
(`)
Total (6 + 7)
\(`)
Total amount paid to the agency
(` in lakh) 1 2 3 4 5 6 7 8 9 10
M/s Ramky Infrastructure Ltd. 1. Const. of RCC bridge on the road from
South Anandanagar to Takarjala at Ch.16.00 KM to 17 KM
25-08-09
July 2012
226.16
1,13,44,702
54,45,457
1,67,90,159
161.42
Work suspended by the agency from July 2012 (12 months)
2. Const. of RCC bridge on the road from Bishalgarh Golaghati road (Near Gandhi Home) to Nabasantiganj
25-03-10
July 2012
330.86
97,36,330
46,73,438
1,44,09,768
140.21
Work suspended by the agency from July 2012 (12 months)
3. Const. of RCC bridge on the road from South Anandanagar to Jarulbachai via Kanterjala at Ch.2.80 KM
07-12-09
18-7-10
393.72
85,30,043
40,94,421
1,26,24,464
117.38
Work suspended by the agency from July 2010 (36 months)
4. Const. of RCC bridge on the road from Rabindrasadan to Anandanagar at Ch.0.45 KM
04-03-09
27-02-12
180.35
1,10,06,910
52,83,317
1,46,98,794
110.21
Work suspended by the agency from February 2012 (17 months)
5. Const. of RCC bridge on the road from Jarulbachai to Gabordi at Ch.2.00 KM
12-02-10
23-02-12
219.01
83,28,823
39,97,835
1,23,26,658
123.27
Work is in progress
6. Const. of RCC bridge on the road from Rabindranagar to Shyamaprasad at Ch.0.15 KM
04-03-09
06-03-12
167.51
81,15,122
38,95,259
1,20,10,381
113.11
Withdrawn and balance work awarded to local contractor in November 2012
Coal Mines Associated Traders Ltd. 7. Const. of RCC bridge over Bangeswar
river on the road from Dukli to Medda Chowmuhani at Ch.0.75 KM
30-12-09
10-03-13
293.11
1,88,11,368
90,29,457
2,78,40,825
238.67
Work is in progress
8. Const. of RCC of RCC bridge over river Sinai on the road from Kanchanmala market to Purba Champamura at Ch.0.20 KM
30-12-09
04-10-10
514.15
1,14,60,546
55,01,062
1,69,61,608
166.79
Work suspended by the agency from October 2010 (34 months)
9. Const. of RCC bridge over river Sinai on the road from Sekerkote Mandir to Pandavpur at Ch.1.20 KM”
30-12-09
24-11-11
376.03
65,79,489
31,58,155
97,37,644
97.38
Work suspended by the agency from November 2011 (20 months)
Total expenditure incurred on seven suspended works (Sl. No. 1, 2, 3, 4, 6, 8 and 9) 906.50 Total expenditure incurred on six suspended works (Sl. No. 1, 2, 3, 4, 8 and 9) 793.39

Appendices
Audit Report for the year 2012-13, Government of Tripura
198
Appendix 3.1 Statement showing particulars of up-to-date capital, loans outstanding and manpower as on 31 March 2013 in respect of Government
Companies and Statutory Corporation (Reference: Paragraph No 3.1.6)
(Figures in Column 5(a) to 6(d) are ` in crore)
Sl. No.
Sector and Name of the Company $
Name of the Department
Month and Year of
incorporation
Paid-up capital Loans outstanding at the close of 2012-13 Debt-equity
ratio for 2012-13 (Previous
year)
Man Power (No. of
employees) (as on 31-03-
13)
State Govt.
Central Govt. Others Total State
Govt. Central Govt. Others Total
1 2 3 4 5(a) 5(b) 5(c) 5(d) 6(a) 6(b) 6(c) 6(d) 7 8 AGRICULTURE AND ALLIED
1 Tripura Forest Development & Plantation Corporation Limited
Forest 26.03.76 8.90 0.30 0.00 9.20 0.00 0.00 0.00 0.00 0.00 216
2 Tripura Horticulture Corporation Limited
Agriculture 07.04.87 2.84 0.00 0.00 2.84 0.00 0.00 0.00 0.00 0.00 90
3 Tripura Tea Development Corporation Limited
Industries and Commerce
11.08.80 30.19 0.00 0.00 30.19 0.00 0.00 0.00 0.00 0.00 719
Sector wise total 41.93 0.30 0.00 42.23 0.00 0.00 0.00 0.00 0.00 1025 FINANCE
4 Tripura Handloom and Handicrafts Development Corporation Limited
Industries and Commerce
05.09.74 66.52 0.78 0.04 67.34 0.00 0.00 0.00 0.00 0.00 384
5 Tripura Industrial Development Corporation
Industries and Commerce
28.03.74 16.16 0.00 1.64 17.80 75.75 0.00 0.00 75.75 4.26:1 (4.26:1)
41

Appendices
Audit Report for the year 2012-13, Government of Tripura
199
Appendix 3.1 (contd..) Statement showing particulars of up-to-date capital, loans outstanding and manpower as on 31 March 2013 in respect of Government
Companies and Statutory Corporation (Reference: Paragraph No 3.1.6)
(Figures in Column 5(a) to 6(d) are ` in crore)
Sl. No.
Sector and Name of the Company $
Name of the Department
Month and Year of
incorporation
Paid-up capital Loans outstanding at the close of 2012-13
Debt-equity ratio for 2012-13
(Previous year)
Man Power (No. of
employees) (as on 31-03-13)
State Govt.
Central Govt. Others Total State
Govt. Central Govt. Others Total
1 2 3 4 5(a) 5(b) 5(c) 5(d) 6(a) 6(b) 6(c) 6(d) 7 8 6 Tripura
Rehabilitation Plantation Corporation Limited
Tribal Welfare (TRP & PTG)
03.02.83 4.58 0.00 0.00 4.58 0.00 0.00 0.00 0.00 0.00 212
Sector wise total 87.26 0.78 1.68 89.72 75.75 0.00 0.00 75.75 0.84:1 (0.92:1)
637
MANUFACTURING 7 Tripura Jute Mills
Limited Industries and Commerce
10.10.74 180.39 0.00 0.00 180.39 1.05 0.00 0.00 1.05 0.01:1 (0.01:1)
1073
8 Tripura Small Industries Corporation Limited
Industries and Commerce
30.04.65 43.44 0.00 0.00 43.44 0.00 0.00 0.00 0.00 0.00 209
Sector wise total
223.83 0.00 0.00 223.83 1.05 0.00 0.00 1.05 0.01:1 (0.01:1)
1282
POWER 9 Tripura State
Electricity Corporation Limited
Power 09.06.04 109.29 0.00 0.00 109.29 126.72 0.00 72.43 199.15 1.82:1 (1.16:1)
3579
Sector wise total 109.29 0.00 0.00 109.29 126.72 0.00 72.43 199.15 1.82:1 (1.16:1)
3579

Appendices
Audit Report for the year 2012-13, Government of Tripura
200
Appendix 3.1 (contd..) Statement showing particulars of up-to-date capital, loans outstanding and manpower as on 31 March 2013 in respect of Government
Companies and Statutory Corporation (Reference: Paragraph No 3.1.6)
(Figures in Column 5(a) to 6(d) are ` in crore)
Sl. No.
Sector and Name of the Company $
Name of the Department
Month and Year of
incorporation
Paid-up capital Loans outstanding at the close of 2012-13
Debt-equity ratio for 2012-13
(Previous year)
Man Power (No. of
employees) (as on 31-03-13)
State Govt.
Central Govt. Others Total State
Govt. Central Govt. Others Total
1 2 3 4 5(a) 5(b) 5(c) 5(d) 6(a) 6(b) 6(c) 6(d) 7 8 SERVICES
10 Tripura Urban Transport Company Limited
Transport 03.01.10
Newly incorporated company. First accounts yet to be finalised.
11 Tripura Tourism Development Corporation Limited
Information, Cultural Affairs & Tourism
03.06.09 0.20 0.00 0.00 0.20 0.00 0.00 0.00 0.00 0.00 95
Sector wise total 0.20 0.00 0.00 0.20 0.00 0.00 0.00 0.00 0.00 95 MISCELLANEOUS
12 Tripura Natural Gas Company Limited
Industries and Commerce
10.07.90 0.00 0.00 3.92 3.92 0.00 0.00 0.00 0.00 0.00 17
Sector wise total 0.00 0.00 3.92 3.92 0.00 0.00 0.00 0.00 0.00 17 Total A (All sector wise working Government
companies)
462.51 1.08 5.60 469.19 203.52 0.00 72.43 275.95 0.59:1 (0.47:1)
6635
B. Working Statutory Corporations SERVICES
1 Tripura Road Transport Corporation
Transport 23.10.69 153.86 3.64 0.00 157.50 0.25 0.00 0.00 0.25 Negligible 477
Sector wise total 153.86 3.64 0.00 157.50 0.25 0.00 0.00 0.25 Negligible 477

Appendices
Audit Report for the year 2012-13, Government of Tripura
201
Appendix 3.1 (concld.) Statement showing particulars of up-to-date capital, loans outstanding and manpower as on 31 March 2013 in respect of Government
Companies and Statutory Corporation (Reference: Paragraph No 3.1.6)
(Figures in Column 5(a) to 6(d) are ` in crore)
Sl. No.
Sector and Name of the Company $
Name of the Department
Month and Year of
incorporation
Paid-up capital Loans outstanding at the close of 2012-13
Debt-equity ratio for 2012-13
(Previous year)
Man Power (No. of
employees) (as on 31-03-13)
State Govt.
Central Govt. Others Total State
Govt. Central Govt. Others Total
1 2 3 4 5(a) 5(b) 5(c) 5(d) 6(a) 6(b) 6(c) 6(d) 7 8 Total B (All sector wise
working Statutory corporations)
153.86 3.64 0.00 157.50 0.25 0.00 0.00 0.25 Negligible 477
Grand Total (A+B) 616.37 4.72 5.60 626.69 203.77 0.00 72.43 276.20 0.44:1 (0.34:1)
7112
C. Non-working Government companies FINANCE 1 Tripura State
Bank Limited Finance Not available 0.04 0.00 0.00 0.04 0.00 0.00 0.00 0.00 0 0
Sector wise total 0.04 0.00 0.00 0.04 0.00 0.00 0.00 0.00 0.00 0.00 Total C (All sector wise
non-working Government companies)
0.04 0.00 0.00 0.04 0.00 0.00 0.00 0.00 0.00 0.00
Grand Total (A+B+C) 616.41 4.72 5.60 626.73 203.77 0.00 72.43 276.20 0.44:1 (0.34:1)
7112
Notes: 1. All figures are provisional and as given by the companies and corporations except in respect of SPSUs at Sl No.A-4, A-11 and A-12, which have finalised their accounts for 2012-13 2. Sl.No.12 of Part-A is 619-B Company. 3. Loans outstanding at the close of 2012-13 represent long term loans only. 4. Paid-up-capital includes share application money.
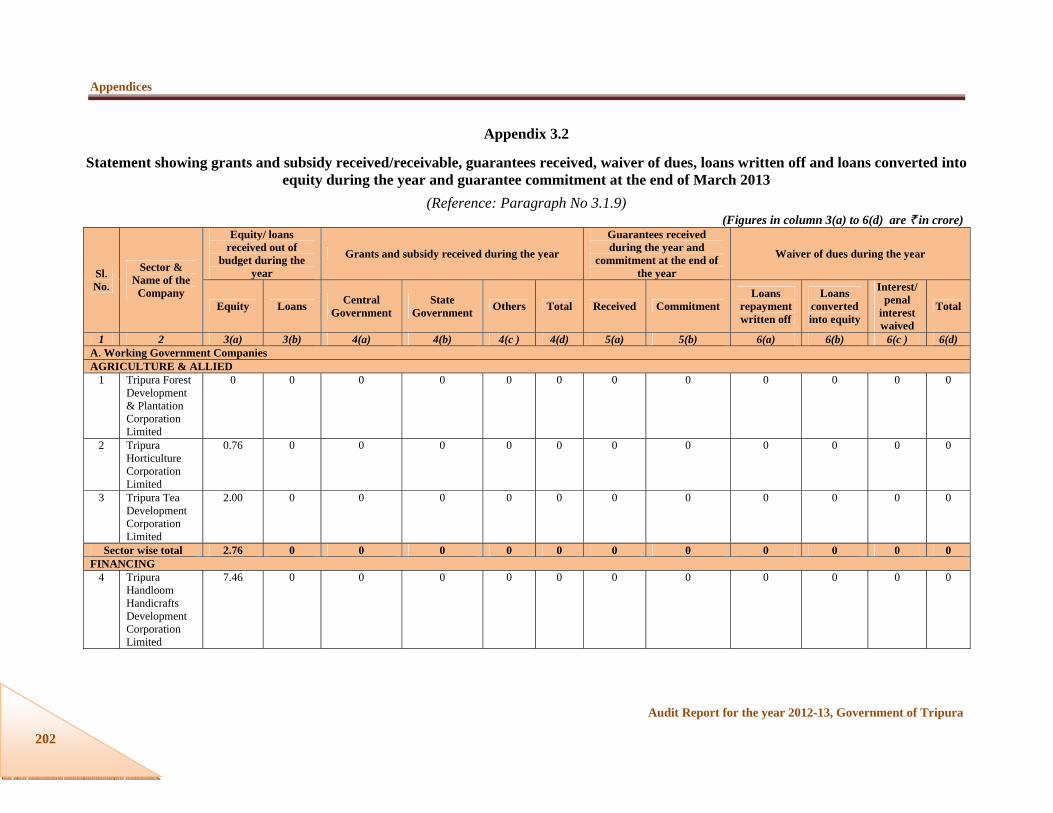
Appendices
Audit Report for the year 2012-13, Government of Tripura
202
Appendix 3.2
Statement showing grants and subsidy received/receivable, guarantees received, waiver of dues, loans written off and loans converted into equity during the year and guarantee commitment at the end of March 2013
(Reference: Paragraph No 3.1.9)
(Figures in column 3(a) to 6(d) are ` in crore)
Sl. No.
Sector & Name of the
Company
Equity/ loans received out of
budget during the year
Grants and subsidy received during the year
Guarantees received during the year and
commitment at the end of the year
Waiver of dues during the year
Equity Loans Central Government
State Government Others Total Received Commitment
Loans repayment written off
Loans converted into equity
Interest/ penal
interest waived
Total
1 2 3(a) 3(b) 4(a) 4(b) 4(c ) 4(d) 5(a) 5(b) 6(a) 6(b) 6(c ) 6(d) A. Working Government Companies AGRICULTURE & ALLIED
1 Tripura Forest Development & Plantation Corporation Limited
0 0 0 0 0 0 0 0 0 0 0 0
2 Tripura Horticulture Corporation Limited
0.76 0 0 0 0 0 0 0 0 0 0 0
3 Tripura Tea Development Corporation Limited
2.00 0 0 0 0 0 0 0 0 0 0 0
Sector wise total 2.76 0 0 0 0 0 0 0 0 0 0 0 FINANCING
4 Tripura Handloom Handicrafts Development Corporation Limited
7.46 0 0 0 0 0 0 0 0 0 0 0

Appendices
Audit Report for the year 2012-13, Government of Tripura
203
Appendix 3.2 (contd..)
Statement showing grants and subsidy received/receivable, guarantees received, waiver of dues, loans written off and loans converted into equity during the year and guarantee commitment at the end of March 2013
(Reference: Paragraph No 3.1.9)
(Figures in column 3(a) to 6(d) are ` in crore)
Sl. No.
Sector & Name of the
Company
Equity/ loans received out of
budget during the year
Grants and subsidy received during the year
Guarantees received during the year and
commitment at the end of the year
Waiver of dues during the year
Equity Loans Central Government
State Government Others Total Received Commitment
Loans repayment written off
Loans converted into equity
Interest/ penal
interest waived
Total
1 2 3(a) 3(b) 4(a) 4(b) 4(c ) 4(d) 5(a) 5(b) 6(a) 6(b) 6(c ) 6(d) 5 Tripura
Industrial Development Corporation Limited
0 0 0 0 0 0 0 0 0 0 0 0
6 Tripura Rehabilitation Plantation Corporation Limited
0 0 0.96 6.82 0 7.78 0 0 0 0 0 0
Sector wise total 7.46 0 0.96 6.82 0 7.78 0 0 0 0 0 0 MANUFACTURING
7 Tripura Jute Mills Limited
18.67 0 0 0 0 0 0 0 0 0 0 0
8 Tripura Small Industries Corporation Limited
2.00 0 0 0 0 0 0 0 0 0 0 0
Sector wise total 20.67 0 0 0 0 0 0 0 0 0 0 0

Appendices
Audit Report for the year 2012-13, Government of Tripura
204
Appendix 3.2 (contd..)
Statement showing grants and subsidy received/receivable, guarantees received, waiver of dues, loans written off and loans converted into equity during the year and guarantee commitment at the end of March 2013
(Reference: Paragraph No 3.1.9)
(Figures in column 3(a) to 6(d) are ` in crore)
Sl. No.
Sector & Name of the Company
Equity/ loans received out of
budget during the year
Grants and subsidy received during the year
Guarantees received during the year and
commitment at the end of the year
Waiver of dues during the year
Equity Loans Central Government
State Government Others Total Received Commitment
Loans repayment written off
Loans converted into equity
Interest/ penal
interest waived
Total
1 2 3(a) 3(b) 4(a) 4(b) 4(c ) 4(d) 5(a) 5(b) 6(a) 6(b) 6(c ) 6(d) POWER
9 Tripura State Electricity Corporation Limited
0 0 55.43 40 0 95.43 0 0 0 0 0 0
Sector wise total 0 0 55.43 40 0 95.43 0 0 0 0 0 0 SERVICES 10 Tripura Urban
Transport Company Limited
Newly incorporated Company
11 Tripura Tourism Development Corporation Limited
0 0 12.83 1.81 0 14.64 0 0 0 0 0 0
Sector wise total 0 0 12.83 1.81 0 14.64 0 0 0 0 0 0 MISCELLANEOUS
12
Tripura Natural Gas Corporation Limited 0 0 0 0 0 0 0 0 0 0 0 0
Sector wise total 0 0 0 0 0 0 0 0 0 0 0 0

Appendices
Audit Report for the year 2012-13, Government of Tripura
205
Appendix 3.2 (concld.)
Statement showing grants and subsidy received/receivable, guarantees received, waiver of dues, loans written off and loans converted into equity during the year and guarantee commitment at the end of March 2013
(Reference: Paragraph No 3.1.9) (Figures in column 3(a) to 6(d) are ` in crore)
Sl. No.
Sector & Name of the
Company
Equity/ loans received out of
budget during the year
Grants and subsidy received during the year
Guarantees received during the year and
commitment at the end of the year
Waiver of dues during the year
Equity Loans Central Government
State Government Others Total Received Commitment
Loans repayment written off
Loans converted into equity
Interest/ penal
interest waived
Total
1 2 3(a) 3(b) 4(a) 4(b) 4(c ) 4(d) 5(a) 5(b) 6(a) 6(b) 6(c ) 6(d) Total A (All sector
wise working Government companies)
30.89 0 69.22 48.63 0 117.85 0 0 0 0 0 0
B. Working Statutory corporation SERVICES
1 Tripura Road Transport Corporation
0.05 0 0 14.80 0 14.80 0 0 0 0 0 0
Sector wise total 0.05 0 0 14.80 0 14.80 0 0 0 0 0 0 Total B (All sector
wise working Statutory
Corporation)
0.05 0 0 14.8 0 14.80 0 0 0 0 0 0
Grand Total (A+B) 30.94 0 69.22 63.43 0 132.65 0 0 0 0 0 0 C. Non working Government companies FINANCING
1 Tripura State Bank Limited
Non functional for about 42 years. In the process of liquidation under Section 560 of Companies Act 1956.
Sector wise total 0 0 0 0 0 0 0 0 0 0 0 0 Total C (All sector wise non working
Government company)
0 0 0 0 0 0 0 0 0 0 0 0
Grand Total (A+B+C) 30.94 0 69.22 63.43 0 132.65 0 0 0 0 0 0 NOTE: Figures are as given by the SPSUs.

Appendices
Audit Report for the year 2012-13, Government of Tripura
206
Appendix 3.3
Summarised financial results of Government Companies and Statutory Corporation for the latest year for which accounts were finalised
(Reference: Paragraph No 3.1.12) (Figures in column 5(a) to 11 are ` in crore)
Sl. No.
Sector & Name of the Company
Period of Accounts
Year in which
finalised
Net Profit (+)/ Loss (-)
Turnover Impact of Accounts
Comments *
Paid up Capital
@
Accumulated Profit (+)/
Loss (-)
Capital Employed #
Return on capital
employed $
Percent-age return on capital employed
Net Profit/ Loss before Interest & Depreciation
Interest Depreciation Net
Profit/ Loss
1 2 3 4 5(a) 5(b) 5(c ) 5(d) 6 7 8 9 10 11 12 A. Working Government Companies AGRICULTURE & ALLIED
1 Tripura Forest Development & Plantation Corporation Limited
2011-12 2013-14 25.53 0.00 1.00 24.53 41.31 -3.79 9.20 118.98 128.27 24.53 19.12
2 Tripura Horticulture Corporation Limited
2009-10 2013-14 -0.07 0.00 0.01 -0.08 7.35 0.00 1.68 -1.48 0.20 -0.08 --
3 Tripura Tea Development Corporation Limited
2011-12 2013-14 -0.54 0.00 0.22 -0.76 4.55 -0.37 28.19 -13.34 14.85 -0.76 --
Sector-wise total 24.92 0.00 1.23 23.69 53.21 -4.16 39.07 104.16 143.32 23.69 16.53 FINANCING
4 Tripura Handloom Handicrafts Development Corporation Limited
2012-13 2013-14 -16.16 0.00 0.06 -16.22 2.61 -3.82 67.34 -77.50 -5.89 -16.22 --
5 Tripura Industrial Development Corporation Limited
2011-12 2013-14 7.32 0.38 3.77 3.17 11.18 -4.40 17.80 3.57 97.27 3.55 3.65
6 Tripura Rehabilitation Plantation Corporation Limited
2010-11 2013-14 8.18 0.00 0.04 8.14 29.89 -1.80 4.58 16.82 21.47 8.14 37.91
Sector-wise total -0.66 0.38 3.87 -4.91 43.68 -10.02 89.72 -57.11 112.85 -4.53 --

Appendices
Audit Report for the year 2012-13, Government of Tripura
207
Appendix 3.3 (contd..) Summarised financial results of Government Companies and Statutory Corporation for the latest year for which accounts were finalised
(Reference: Paragraph No 3.1.12) (Figures in column 5(a) to 11 are ` in crore)
Sl. No.
Sector & Name of the Company
Period of Accounts
Year in which
finalised
Net Profit (+)/ Loss (-)
Turnover
Impact of Accounts
Comments *
Paid up Capital
@
Accumulated Profit (+)/
Loss (-)
Capital Employed
#
Return on capital
employed $
Percent-age
return on capital
employed
Net Profit/ Loss before Interest &
Depreciation
Interest Depreciation Net
Profit/ Loss
1 2 3 4 5(a) 5(b) 5(c ) 5(d) 6 7 8 9 10 11 12 MANUFACTURING
7 Tripura Jute Mills Limited
2011-12 2012-13 -12.94 0.00 1.84 -14.78 6.78 0.00 161.72 -162.31 0.45 -14.78 --
8 Tripura Small Industries Corporation Limited
2010-11 2013-14 -1.19 0.00 0.33 -1.52 22.38 -2.15 38.95 -22.99 16.17 -1.52 --
Sector-wise total -14.13 0.00 2.17 -16.30 29.16 -2.15 200.67 -185.30 16.62 -16.30 -- POWER
9 Tripura State Electricity Corporation Limited
2010-11 2012-13 -53.54 0.00 42.25 -95.79 305.94 -0.61 109.29 16.34 284.29 -95.79 --
Sector-wise total -53.54 0.00 42.25 -95.79 305.94 -0.61 109.29 16.34 284.29 -95.79 -- SERVICES 10 Tripura Urban
Transport Company Limited
First accounts yet to be received.
11 Tripura Tourism Development Corporation Limited
2012-13 2013-14 0.93 0.00 1.08 -0.15 1.83 0.00 0.20 -0.83 1.03 -0.15 --
Sector-wise total 0.93 0.00 1.08 -0.15 1.83 0.00 0.20 -0.83 1.03 -0.15 -- MISCELLANEOUS 12 Tripura Natural
Gas Company Limited
2012-13 2013-14 7.72 0.00 3.00 4.72 28.60 0.00 3.92 19.06 37.02 4.72 12.75
Sector-wise total 7.72 0.00 3.00 4.72 28.60 0.00 3.92 19.06 37.02 4.72 12.75 Total A (All sector-wise working Government
Companies) -34.76 0.38 53.60 -88.74 462.42 -16.94 442.87 -103.68 595.13 -88.36 --
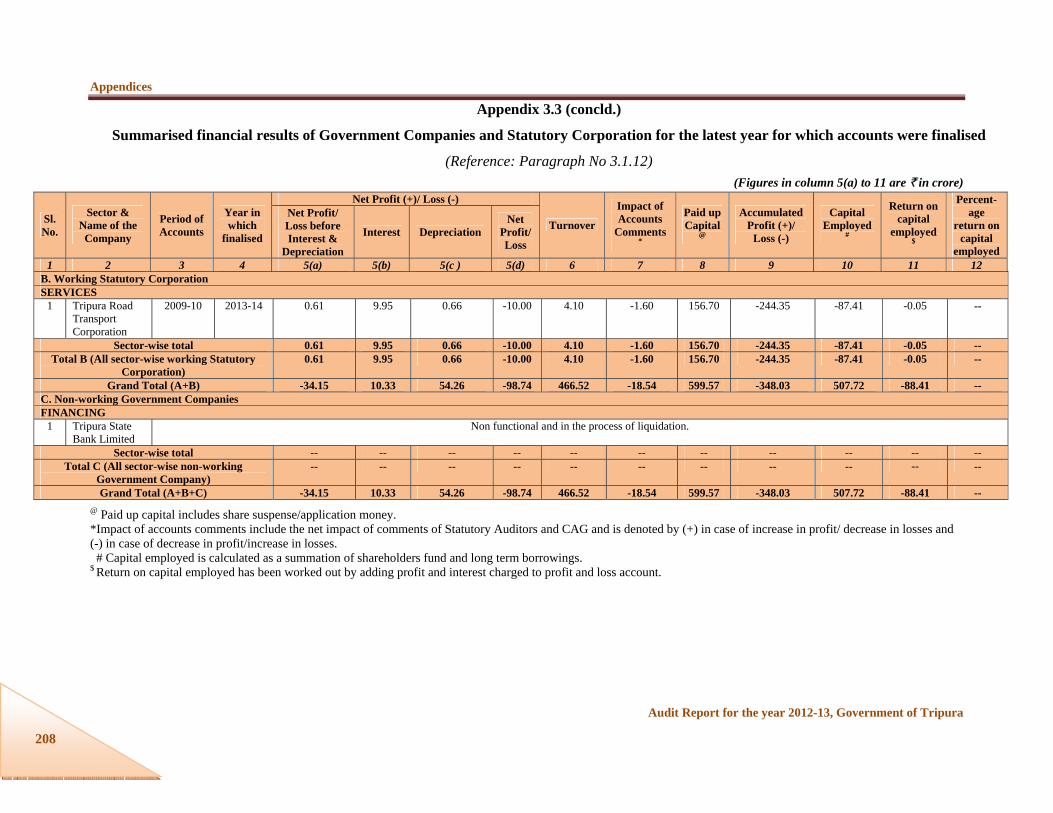
Appendices
Audit Report for the year 2012-13, Government of Tripura
208
Appendix 3.3 (concld.)
Summarised financial results of Government Companies and Statutory Corporation for the latest year for which accounts were finalised
(Reference: Paragraph No 3.1.12)
(Figures in column 5(a) to 11 are ` in crore)
Sl. No.
Sector & Name of the Company
Period of Accounts
Year in which
finalised
Net Profit (+)/ Loss (-)
Turnover
Impact of Accounts
Comments *
Paid up Capital
@
Accumulated Profit (+)/
Loss (-)
Capital Employed
#
Return on capital
employed $
Percent-age
return on capital
employed
Net Profit/ Loss before Interest &
Depreciation
Interest Depreciation Net
Profit/ Loss
1 2 3 4 5(a) 5(b) 5(c ) 5(d) 6 7 8 9 10 11 12 B. Working Statutory Corporation SERVICES
1 Tripura Road Transport Corporation
2009-10 2013-14 0.61 9.95 0.66 -10.00 4.10 -1.60 156.70 -244.35 -87.41 -0.05 --
Sector-wise total 0.61 9.95 0.66 -10.00 4.10 -1.60 156.70 -244.35 -87.41 -0.05 -- Total B (All sector-wise working Statutory
Corporation) 0.61 9.95 0.66 -10.00 4.10 -1.60 156.70 -244.35 -87.41 -0.05 --
Grand Total (A+B) -34.15 10.33 54.26 -98.74 466.52 -18.54 599.57 -348.03 507.72 -88.41 -- C. Non-working Government Companies FINANCING
1 Tripura State Bank Limited
Non functional and in the process of liquidation.
Sector-wise total -- -- -- -- -- -- -- -- -- -- -- Total C (All sector-wise non-working
Government Company) -- -- -- -- -- -- -- -- -- -- --
Grand Total (A+B+C) -34.15 10.33 54.26 -98.74 466.52 -18.54 599.57 -348.03 507.72 -88.41 -- @ Paid up capital includes share suspense/application money. *Impact of accounts comments include the net impact of comments of Statutory Auditors and CAG and is denoted by (+) in case of increase in profit/ decrease in losses and (-) in case of decrease in profit/increase in losses. # Capital employed is calculated as a summation of shareholders fund and long term borrowings. $ Return on capital employed has been worked out by adding profit and interest charged to profit and loss account.
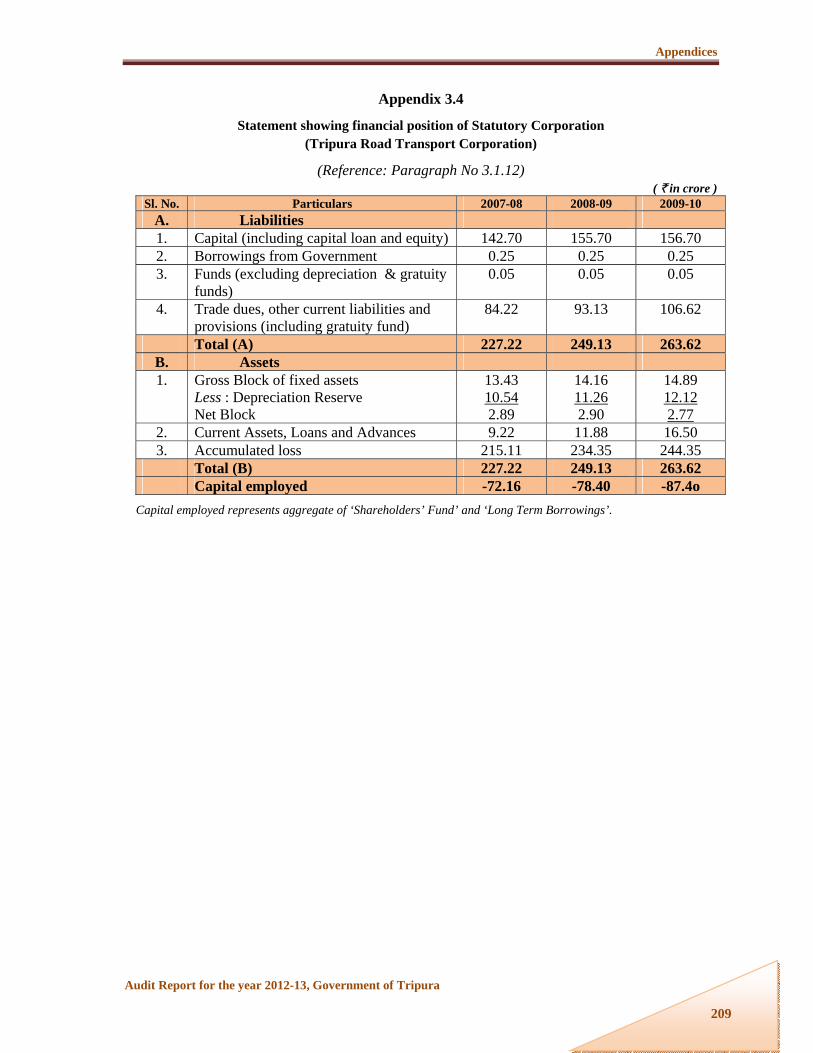
Appendices
Audit Report for the year 2012-13, Government of Tripura
209
Appendix 3.4
Statement showing financial position of Statutory Corporation (Tripura Road Transport Corporation)
(Reference: Paragraph No 3.1.12) ( ` in crore )
Sl. No. Particulars 2007-08 2008-09 2009-10 A. Liabilities 1. Capital (including capital loan and equity) 142.70 155.70 156.70 2. Borrowings from Government 0.25 0.25 0.25 3. Funds (excluding depreciation & gratuity
funds) 0.05 0.05 0.05
4. Trade dues, other current liabilities and provisions (including gratuity fund)
84.22 93.13 106.62
Total (A) 227.22 249.13 263.62 B. Assets 1. Gross Block of fixed assets
Less : Depreciation Reserve Net Block
13.43 10.54 2.89
14.16 11.26 2.90
14.89 12.12 2.77
2. Current Assets, Loans and Advances 9.22 11.88 16.50 3. Accumulated loss 215.11 234.35 244.35 Total (B) 227.22 249.13 263.62 Capital employed -72.16 -78.40 -87.4o
Capital employed represents aggregate of ‘Shareholders’ Fund’ and ‘Long Term Borrowings’.

Appendices
Audit Report for the year 2012-13, Government of Tripura
210
Appendix 3.5
Statement showing working results of Statutory Corporation (Tripura Road Transport Corporation)
(Reference: Paragraph No 3.1.12)
( ` in crore ) Sl. No. Particulars 2007-08 2008-09 2009-10
1.
Operating: (a) Revenue 3.68 4.22 4.10 (b) Expenditure 21.96 23.28 24.87 (c) Surplus/(-)Deficit (-) 18.28 (-) 19.06 (-) 20.77
2.
Non-operating: (a) Revenue 0.69 0.18 11.20 (b) Expenditure 0.33 0.36 0.43(c) Surplus/(-)Deficit 0.36 (-) 0.18 10.77
3.
Total: (a) Revenue 4.37 4.40 15.30 (b) Expenditure 22.29 23.64 25.30 (c) Net Profit/(-)Loss (-) 17.92 (-) 19.24 (-)10.00
4. Interest on Capital and Loans 8.61 9.37 9.95 5. Total return on capital employed (-) 9.31 (-) 9.87 (-)0.05

Appendices
Audit Report for the year 2012-13, Government of Tripura
211
Appendix 3.6
Statement showing investment made by State Government in SPSUs whose accounts are in arrears
(Reference: Paragraph No 3.1.21) (` in crore)
Sl. No.
Name of SPSU
Year upto which
accounts finalised*
Paid capital as per latest
finalised accounts
Investment made by State Government during the years for which accounts are in arrears No. of
accounts in
arrear* Year Equity Loans Grants Others
1 2 3 4 5(a) 5(b) 5(c) 5(d) 5(e) A. Working Government Companies
1 Tripura Forest Development & Plantation Corporation Limited
2011-12 9.20 2012-13
0.00 0.00 0.00 0.00 1
2 Tripura Horticulture Corporation Limited
2009-10 1.68 2010-11
0.05 0.00 0.00 0.00 3
2011-12
0.35 0.00 0.00 0.00
2012-13
0.76 0.00 0.00 0.00
3 Tripura Tea Development Corporation Limited
2011-12 28.19 2012-13
2.00 0.00 0.00 0.00 1
4 Tripura Rehabilitation Plantation Corporation Limited
2010-11 4.58 2011-12
0.00 0.00 0.50 0.00 2
2012-13
0.00 0.00 6.82 0.00
5 Tripura Jute Mills Limited
2011-12 161.72 2012-13
18.67 0.00 0.00 0.00 1
6 Tripura Small Industries Corporation Limited
2010-11 38.95 2011-12
2.00 0.00 0.00 0.00 2
2012-13
2.00 0.00 0.00 0.00
7 Tripura State Electricity Corporation Limited
2010-11 109.29 2011-12
0.00 0.00 64.15 0.00 2
2012-13
0.00 0.00 95.43 0.00
TOTAL (A): Government Companies 33.29 0 166.9 0 12 B. Working Statutory Corporation
1 Tripura Road Transport Corporation
2009-10 156.70 2010-11
0.60 0.00 14.50 0.00 3
2011-12
0.15 0.00 13.25 0.00
2012-13
0.05 0.00 14.80 0.00
TOTAL (B): Statutory Corporation 0.80 0.00 42.55 0.00 3 Grand total (A + B) 26.63 0.00 209.45 0.00 15
* As on 30 September 2013.

Appendices
Audit Report for the year 2012-13, Government of Tripura
212
Appendix 3.7 Emporium-wise sales performance against target
{Reference: Paragraph No 3.2.7.1(i)} (` in lakh)
Sl. No. Name of Purbasha
2008-09 2009-10 Handloom Handicraft Handloom Handicraft
Target Achieve-ment
Percentage of
achievementTarget Achieve-
ment
Percentage of achieve-
ment
Tar-get
Achieve-ment
Percentage of
achievementTarget Achieve-
ment
Percentage of
achievement 1 H.O. Complex 20.00 20.82 104.10 33.00 28.76 87.15 26.00 20.69 79.58 36.00 33.63 93.42 2 2nd Counter 0.58 0.58 3 G.B. Bazar 4.00 1.92 48.00 1.00 0.34 34.00 4.00 1.74 43.50 1.00 0.17 17.00 4 Sukantala road 2.00 2.38 119.00 2.00 2.02 1.01 2.5. 2.90 116.00 2.00 1.95 97.50 5 Udaipur 3.00 2.39 79.67 0.09 3.50 2.61 74.57 0.05 6 Matabari 1.25 0.45 36.00 1.00 0.65 65.00 7 Santirbazar 3.50 1.82 52.00 3.50 2.13 60.86 8 Belonia 3.00 2.05 68.33 0.50 0.38 76.00 3.50 5.02 143.43 0.50 0.72 144.00 9 Kamalpur 2.50 2.03 81.20 3.00 2.10 70.00 10 Halahali 1.00 1.02 102.00 1.00 1.04 104.00 11 Salema 1.00 0.44 44.00 1.00 0.86 86.00 12 Kanchanpur 2.50 2.32 92.80 3.00 2.39 79.67 13 Panisagar 3.00 2.34 78.00 3.50 3.31 94.57 14 Super market,Dmn. 1.25 0.56 44.80 1.00 0.57 57.00 15 Kalibari Rd. Dmn. 2.50 2.67 106.80 0.50 0.40 80.00 3.00 2.02 67.33 0.50 0.28 56.00 16 Badarpur 3.50 2.82 80.57 4.00 2.93 73.25 17 Silchar 4.50 4.56 101.33 2.00 - 5.00 3.67 73.40 2.00 1.45 72.50 18 Dhakuria 1.50 0.33 22.00 20.00 11.85 59.25 1.00 0.55 55.00 20.00 17.26 86.30 19 Maniktala 1.00 0.67 67.00 2.50 2.52 100.8 1.00 0.26 26.00 3.00 1.27 42.33 20 Chowringee 0.50 0.15 30.00 2.00 2.01 100.5 0.50 0.16 32.00 3.00 3.07 102.33 21 Behala 1.00 0.65 65.00 1.00 0.62 62.00 1.00 0.49 49.00 2.00 1.12 56.00 22 Salt lake City 1.50 0.32 21.33 3.00 0.94 31.33 1.50 0.41 27.33 3.00 0.81 27.00 23 New Market - 0.0724 New Delhi 5.00 3.90 78.00 30.00 24.55 81.83 5.00 2.67 53.40 30.00 30.81 102.70 25 Shilpagram 0.50 0.36 72.00 2.50 3.54 141.60 0.50 0.40 80.00 3.00 1.77 59.00 26 Durgachowmuhani 0.50 0.77 154.00 0 1.00 0.50 50.00 0.20 0.03 15.00
Total 70.00 58.32 83.31 100.00 78.02 78.02 80.00 60.72 78.35 106.20 94.39 88.88

Appendices
Audit Report for the year 2012-13, Government of Tripura
213
Appendix 3.7 (Contd…) Emporium-wise sales performance against target
{Reference: Paragraph No 3.2.7.1(i)} (` in lakh)
Sl. No. Name of Purbasha
2010-11 2011-12 Handloom Handicraft Handloom Handicraft
Target Achieve-ment
Percentage of achieve-
ment Target Achiev-
ement
Percentage of achieve-
ment Target Achieve-
ment
Percentage of achieve-
ment Target Achieve-
ment
Percentage of achieve-
ment 1 H.O. Complex 26.00 23.67 91.04 36.00 33.13 92.03 26.00 27.79 106.88 36.00 32.06 89.06 2 G.B. Bazar 2.50 1.76 70.4 0.50 0.12 24.00 2.50 1.35 54.00 0.50 0.09 18.00 3 Sukantala road 3.00 3.87 129.00 2.00 2.57 128.50 4.00 1.52 38.00 2.50 1.33 53.20 4 Udaipur 3.50 1.88 53.71 ** 0.03 2.50 1.52 60.80 ** 0.05 5 Matabari 1.00 0.45 45.00 1.00 0.39 39.00 6 Santirbazar 3.00 1.67 55.67 2.50 0.28 11.20 7 Belonia 4.00 2.16 54.00 0.50 0.87 174.00 3.50 1.51 43.14 0.50 0.85 170.00 8 Kamalpur 3.00 1.44 48.00 2.50 0.76 30.4 9 Halahali 1.00 0.78 78.00 1.00 -
10 Salema 1.00 0.58 58.00 1.00 0.75 75.00 11 Kanchanpur 3.00 2.04 68.00 3.00 1.57 52.33 12 Panisagar 3.50 2.46 70.29 3.50 1.69 48.29 13 Super market, Dmn. 1.00 0.82 82.00 ** 0.19 1.00 0.04 4.00 14 Kalibari Rd. Dmn. 3.00 1.66 55.33 0.50 0.28 56.00 2.50 1.08 43.20 0.50 0.22 44.00 15 Badarpur 4.00 2.84 71.00 3.50 2.43 69.43 16 Silchar 5.00 3.32 66.40 1.50 2.40 160.00 4.50 2.70 60.00 3.00 1.56 52.00 17 Dhakuria 1.00 0.45 45.00 20.00 11.75 58.75 1.00 0.09 9.00 18.00 13.27 73.72 18 Maniktala 1.00 0.32 32.00 2.00 1.15 57.50 1.00 0.08 8.00 2.00 1.32 66.00 19 Chowringee 0.50 0.32 64.00 3.50 2.11 60.29 0.50 0.13 26.00 3.50 1.75 50.00 20 Behala 0.75 0.41 54.67 2.00 0.55 27.50 0.50 0.33 66.00 2.00 0.46 23.00 21 Salt lake City 0.75 0.07 9.33 2.00 0.18 9.00 22 New Market - - - - - 2.00 - - 23 New Delhi 3.00 1.65 55.00 32.00 30.26 94.56 3.00 1.56 52.00 32.00 22.49 70.28 24 Shilpagram,Guwahati 0.50 0.50 100.00 2.50 2.59 103.60 0.50 0.42 84.00 3.50 2.17 62.00 25 Durgachowmuhani 1.00 0.62 62.00 0 1.00 0.36 36.00 ** 0.38 26 Ambassa 0.22

Appendices
Audit Report for the year 2012-13, Government of Tripura
214
Appendix 3.7 (Contd…) Emporium-wise sales performance against target
{Reference: Paragraph No 3.2.7.1(i)} (` in lakh)
Sl. No.
Name of Purbasha
2010-11 2011-12 Handloom Handicraft Handloom Handicraft
Target Achieve-ment
Percentage of achieve-
ment Target Achieve-
ment
Percentage of achieve-
ment Target Achieve-
ment
Percentage of achieve-
ment Target Achievement Percentage of
achievement
27 Indranagar Annex 0.19 0.50 0.52 104.00 28 Kaman Chowmuhani 3.82 6.00 3.11 51.83 29 Lenin Sarani 2.78 4.50 2.50 55.56 ** 0.02 30 Durga Chowmuhani
Annex 1.00 1.50 0.72 48.00
31 Mohanpur 0.77 1.00 0.44 44.00 32 H/L Marketing
complex 2.74 3.50 0.76 21.71
33 Sonamura(Melagarh) 0.74 1.00 0.53 53.00 34 Bishramganj 0.10 0.50 0.15 30.00 35 Sabroom 1.69 2.00 0.45 22.50 36 Manu Bazar 1.57 2.00 1.22 61.00 37 Nutan Bazar 0.23 1.00 0.27 27.00 38 Udaipur annex 0.78 1.50 - 39 Kumarghat 0.35 1.00 0.10 10.00 40 Manughat 0.84 1.50 0.99 66.00 41 Kailashahar 1.45 2.50 1.25 50.00 42 Teliamura 1.13 2.00 1.83 91.50 43 Khowai 1.60 2.50 0.84 33.60 44 Mandai 0.45 1.50 0.84 56.00 45 Jirania 2.42 3.00 1.11 37.00 46 Ranirbazar 0.41 1.00 0.75 75.00 47 Gariahat 0.45 ** 0.02 0.50 0.44 88.00 ** 0.03 48 Maniktala Annex 0.89 ** 0.19 1.09 0.41 37.61 ** 0.69 49 Amarpur 0.69 50 Kalyanpur 0.31 0.50 -
Total * 83.14 105.00 88.39 84.18 114.09 67.80 59.43 106 78.74 74.28 *No targets for sale of handloom products were fixed for emporia at Sl. No. 26 to 50 for the year 2010-11, ** No targets for sale of handicraft products were fixed for emporia for the years 2010-11 and 2011-12

Appendices
Audit Report for the year 2012-13, Government of Tripura
215
Appendix 3.7 (Concld.) Emporium-wise sales performance against target
{Reference: Paragraph No 3.2.7.1(i)} (` in lakh)
Sl. No. Name of Purbasha
2012-13 Handloom Handicraft
Target Achievement Percentage of achievement Target Achievement Percentage of
achievement1 H.O. Complex 26.00 28.21 108.50 36.00 34.18 94.94 2 Sukantala road 4.00 1.76 44.00 2.00 0.57 28.50 3 Udaipur 2.50 1.71 68.40 4 Matabari 1.00 0.72 72.00 5 Santirbazar 1.00 0.78 78.00 6 Belonia 3.50 3.00 85.71 0.50 0.78 156.00 7 Kamalpur 2.50 1.03 41.20 8 Salema 1.00 0.59 59.00 9 Kanchanpur 2.50 1.61 64.40
10 Panisagar 3.50 2.39 68.29 11 Super market, Dmn. 1.00 0.22 22.00 12 Kalibari Rd. Dmn. 2.50 1.39 55.60 0.50 0.39 78.00 13 Badarpur 3.50 2.57 73.43 14 Silchar 4.50 2.72 60.44 2.00 1.36 68.00 15 Dhakuria 1.00 0.24 24.00 18.00 10.33 57.39 16 Maniktala 1.00 0.16 16.00 2.00 0.85 42.50 17 Chowringee 0.50 0.15 30.00 2.50 0.85 34.00 18 Behala 0.50 0.41 82.00 1.00 1.33 133.00 19 New Delhi 3.00 2.92 97.33 32.00 21.36 66.75 20 Shilpagram, Guwahati 0.50 0.32 64.00 3.00 1.66 55.33 21 Durgachowmuhani 1.00 0.41 41.00 22 Ambassa 1.00 0.20 20.00 23 Indranagar Annex 0.75 2.35 313.33 24 Kaman Chowmuhani 4.50 5.38 119.56 25 Lenin Sarani 3.50 4.43 126.57
26 Durga Chowmuhani Annex
1.25 2.29 183.20
27 Mohanpur 1.00 0.81 81.00
28 H/L Marketing complex
29 Melagarh 1.00 0.30 30.00 30 Bishramganj 0.50 0.04 8.00 31 Sabroom 1.00 1.63 163.00 32 Manu Bazar 1.75 1.03 58.86 33 Nutan Bazar 0.50 0.32 64.00 34 Kumarghat 0.50 0.22 44.00 35 Manughat 1.50 0.87 58.00 36 Kailashahar 2.00 2.40 120.00 37 Teliamura 2.50 2.21 88.40 38 Khowai 1.50 1.57 104.67 39 Mandai 1.25 0.72 57.60 40 Jirania 2.00 1.68 84.00 41 Ranirbazar 1.50 0.10 6.67 42 Gariahat 1.00 0.57 57.00 43 Maniktala Annex 1.50 0.75 50.00
Total 98.50 83.18 84.45 99.50 73.66 74.03

Appendices
Audit Report for the year 2012-13, Government of Tripura
216
Appendix 3.8
Emporium-wise profitability statement for the year 2012-13 {Reference: Paragraph No 3.2.7.1(ii)}
(` in crore)
Sl. No. Name of Emporium
Open-ing
stock
Stock received
during the year
Operating expenses
Salary expenditu
re of emporia
Total Expendit
ure Sales
Serv-ice
Char-ges
Bank Intere
st
Closing stock
Total Income
Net profit / (-) loss
Margin on sales (Approx)
Excess/(-) Shortage of margin over
operating expenses
Excess/(-) Shortage of margin over
salary expenditure
(1) (2) (3) (4) (5) (6) Sum of (3) to
(6)=(7) (8) (9) (10) (11)
Sum of (8) to
(11)=(12)
(12) - (7) = (13)
33 per cent of (8)
= (14)
(14) - (5) = (15)
(14) - (6) = (16)
1 Bishramganj 0.61 0.05 5.05 5.71 0.04 - - 0.53 0.57 -5.14 0.01 -0.04 -5.04 2 Melagarh 1.15 0.32 0.17 4.75 6.39 0.30 - - 0.98 1.28 -5.11 0.10 -0.07 -4.65 3 Manu Bazar 2.78 0.79 0.09 4.93 8.59 1.03 - 0.01 2.54 3.58 -5.01 0.34 0.25 -4.59 4 Sabroom 2.46 1.68 0.30 2.12 6.56 1.63 - 0.02 1.76 3.41 -3.15 0.54 0.24 -1.58 5 Ranir Bazar 0.76 0.03 0.41 4.72 5.92 0.10 - 0.01 0.85 0.96 -4.96 0.03 -0.38 -4.69 6 Jirania 1.97 1.09 0.30 7.86 11.22 1.68 - 0.05 1.08 2.81 -8.41 0.56 0.26 -7.30 7 Khowai 2.41 1.17 0.35 5.54 9.47 1.57 - 0.03 2.01 3.61 -5.86 0.52 0.17 -5.02 8 Manughat 2.47 0.50 0.09 3.86 6.92 0.87 - - 2.09 2.96 -3.96 0.29 0.20 -3.57 9 Kailashahar 0.99 2.09 0.29 4.50 7.87 2.40 - 0.01 0.38 2.79 -5.08 0.80 0.51 -3.70
10 Lenin Sarani,Agt. 2.23 6.07 0.05 10.07 18.42 4.43 - - 2.40 6.83 -11.59 1.48 1.43 -8.59 11 Kaman Chowmuhani 2.97 7.81 0.11 7.09 17.98 5.38 - - 3.16 8.54 -9.44 1.79 1.68 -5.30 12 Shilpgram 4.66 1.60 0.12 9.55 15.93 1.98 - - 4.27 6.25 -9.68 0.66 0.54 -8.89 13 Club Rd.,Silchar 9.89 3.30 0.94 15.57 29.70 4.08 - - 9.03 13.11 -16.59 1.36 0.42 -14.21 14 Super Market,
Dharmanagar 0.53 0.23 0.19 5.32 6.27 0.22 - - 0.54 0.76 -5.51 0.07 -0.12 -5.25
15 Kalibari Road, Dharmanagar
2.37 1.16 0.03 5.41 8.97 1.78 - - 1.74 3.52 -5.45 0.59 0.56 - 4.82
16 Kanchanpur 1.55 2.27 0.37 6.51 10.70 1.61 - - 2.15 3.76 -6.94 0.54 0.17 -5.97 17 Kamalpur,Dhalai 3.79 1.14 0.31 4.80 10.04 1.03 - - 2.42 3.45 -6.59 0.34 0.03 -4.46

Appendices
Audit Report for the year 2012-13, Government of Tripura
217
Appendix 3.8 (Contd...)
Emporium-wise profitability statement for the year 2012-13 {Reference: Paragraph No 3.2.7.1(ii)}
(` in crore)
Sl. No. Name of Emporium
Open-ing
stock
Stock received
during the year
Operating expenses
Salary expendi-ture of
emporia
Total Expendi-
ture Sales Service
Charges
Bank Inte-rest
Closing stock
Total Income
Net profit / (-) loss
Margin on sales (Approx)
Excess/(-) Shortage of margin over
operating expenses
Excess/(-) Shortage of margin over
salary expenditure
(1) (2) (3) (4) (5) (6) Sum of (3) to
(6)=(7) (8) (9) (10) (11)
Sum of (8) to
(11)=(12)
(12) - (7) = (13)
33 per cent of (8)
= (14)
(14) - (5) = (15)
(14) - (6) = (16)
18 Ambassa, Dhalai 1.65 - 0.05 7.35 9.05 0.20 - - 1.40 1.60 -7.45 0.07 0.02 -7.28 19 Belonia 3.75 5.86 0.77 8.90 19.28 3.78 0.02 - 4.94 8.74 -10.54 1.26 0.49 -7.64 20 Matabari,Gumati 0.79 2.37 0.10 8.80 12.06 0.72 - - 1.65 2.37 -9.69 0.24 0.14 -8.56 21 Udaipur 1.38 2.34 0.31 6.74 10.77 1.71 - - 1.98 3.69 -7.08 0.57 0.26 -6.17 22 Durga Chowmuhani 1.08 0.80 0.12 4.64 6.64 0.41 - - 1.44 1.85 -4.79 0.14 0.02 -4.50 23 Sukantala Road 3.44 2.97 0.10 6.97 13.48 2.33 - - 3.66 5.99 -7.49 0.78 0.68 -6.19 24 Natun Bazar 1.29 - 0.02 3.90 5.21 0.32 - - 0.71 1.03 -4.18 0.11 0.09 -3.79 25 H.O. Complex. Agt. 15.69 69.63 0.46 17.62 103.40 62.39 - 1.01 19.40 82.80 -20.60 20.79 20.33 3.17 26 Mohanpur 1.22 0.25 0.14 4.49 6.10 0.81 - - 0.65 1.46 -4.64 0.27 0.13 -4.22 27 Mandai 1.73 0.12 0.07 3.08 5.00 0.72 - 0.03 1.13 1.88 -3.12 0.24 0.17 -2.84 28 Teliamura 2.14 2.35 0.36 4.95 9.80 2.21 - - 2.27 4.48 -5.32 0.74 0.38 -4.21 29 Kumarghat 0.77 0.22 0.05 4.55 5.59 0.22 - - 0.43 0.65 -4.94 0.07 0.02 -4.48 30 Indranagar Annex 1.15 3.17 0.01 3.68 8.01 2.35 - - 1.97 4.32 -3.69 0.78 0.77 -2.90 31 Durga Chowmohani
(Annex) 0.91 4.58 0.05 7.71 13.25 2.29 - - 3.13 5.42 -7.83 0.76 0.71 -6.95
32 Badarpur 4.89 2.05 0.57 9.89 17.40 2.57 - - 4.28 6.85 -10.55 0.86 0.29 -9.03 33 Panisagar 2.21 1.68 0.31 4.46 8.66 2.39 - - 1.48 3.87 -4.79 0.80 0.49 -3.66

Appendices
Audit Report for the year 2012-13, Government of Tripura
218
Appendix 3.8 (Concld.)
Emporium-wise profitability statement for the year 2012-13 {Reference: Paragraph No 3.2.7.1(ii)}
(` in crore)
Sl. No. Name of Emporium
Open-ing
stock
Stock received
during the year
Operat ing
expenses
Salary expendi-ture of
emporia
Total Expend-
iture Sales
Service Charges
Bank Inte-rest
Closing stock
Total Income
Net profit / (-) loss
Margin on
sales (Approx)
Excess/(-) Shortage of margin over
operating expenses
Excess/(-) Shortage of margin over
salary expenditure
(1) (2) (3) (4) (5) (6) Sum of (3) to
(6)=(7) (8) (9) (10) (11)
Sum of (8) to
(11)=(12)
(12) - (7) = (13)
33 per cent of (8)
= (14)
(14) - (5) = (15)
(14) - (6) = (16)
34 Salema 0.76 0.36 0.17 5.24 6.53 0.59 - - 0.52 1.11 -5.42 0.20 0.03 -5.04 35 Santirbazar 0.79 1.50 0.05 4.06 6.40 0.78 - - 1.31 2.09 -4.31 0.26 0.21 -3.80 36 New Market Kol 0.18 - - 0.18 - - 0.18 0.18 - - - - 37 Dhakuria Kol 12.23 10.28 0.77 5.43 28.71 10.57 - - 9.79 20.36 -8.35 3.52 2.75 -1.91 38 Chowringhee Kol 1.72 1.45 0.20 5.47 8.84 1.00 - - 2.16 3.16 -5.68 0.33 0.13 -5.14 39 Behala -Kol 1.92 1.65 0.30 4.78 8.65 1.74 - - 1.84 3.58 -5.07 0.58 0.28 -4.20 40 Gariahat(Annex)-Kol 1.67 0.28 0.18 2.69 4.82 0.57 - - 1.28 1.85 -2.97 0.19 0.01 -2.50 41 Manik Tala -Kol 1.49 1.15 0.17 4.41 7.22 1.01 - - 1.52 2.53 -4.69 0.34 0.17 -4.07 42 Maniktala , Annex 1.62 1.04 0.27 5.98 8.91 0.75 - - 2.02 2.77 -6.14 0.25 -0.02 -5.73 43 New Delhi 39.16 29.67 17.27 4.70 90.80 24.28 28.38 - 44.13 96.79 5.99 8.09 -9.18 3.39
Grand total 149.22 177.02 27.04 258.14 611.42 156.84 28.40 1.17 153.20 339.61 -271.81 52.27 25.23 -205.87

Appendices
Audit Report for the year 2012-13, Government of Tripura
219
Appendix 3.9 Details of emporium-wise turnover per employee during the period 2008-09 to 2012-13
(Reference: Paragraph No 3.2.7.7) (` in lakh)
Sl. No.
Name of Emporia/
Office
2008-09 2009-10 2010-11 2011-12 2012-13
Salary expenditure
No. of employees (No.)
Turnover1
Turnover per
employee
Salary expenditure
No. of employees (No.)
Turnover
Turnover per
employee
Salary expenditure
No. of employees (No.)
Turnover
Turnover per
employee
Salary expenditure
No. of employees (No.)
Turnover
Turnover per employee
Salary
expenditure
No. of employees (No.)
Turnover
Turnover per
employee
1 Purbasha Head Office Complex
10.11 10 49.58 4.96 13.74 10 54.32 5.43 15.79 10.00 56.80 5.68 16.22 11 59.85 5.44 17.62 10 62.39 6.24
2 2nd Counter 5.87 6 0.58 0.10 5.76 4 0.58 0.15 3.08 4.00
3 GB Agartala 4.34 5 2.26 0.45 6.91 6 1.91 0.32 7.03 5.00 1.88 0.38 5.49 4 1.44 0.36
4 Sakuntala Road
3.72 6 4.40 0.73 5.07 6 4.85 0.81 6.39 5.00 6.44 1.29 6.13 5 2.85 0.57 6.97 4 2.33 0.58
5 Udaipur 3.13 7 2.48 0.35 4.11 7 2.66 0.38 5.19 7.00 1.91 0.27 8.60 9 1.57 0.17 6.74 7 1.71 0.24 6 Matabari 3.28 5 0.45 0.09 3.93 5 0.65 0.13 4.60 5.00 0.45 0.09 4.85 5 0.39 0.08 8.80 6 0.72 0.12 7 Santirbazar 2.06 2 1.82 0.91 2.89 2 2.13 1.07 3.68 3.00 1.67 0.56 3.88 2 0.28 0.14 4.06 2 0.78 0.39 8 Belonia 4.76 8 2.43 0.30 6.31 8 5.74 0.72 8.08 8.00 3.03 0.38 7.76 7 2.36 0.34 8.90 8 3.78 0.47 9 Kamalpur 2.23 3 2.03 0.68 2.66 3 2.10 0.70 4.19 3.00 1.44 0.48 4.17 3 0.76 0.25 4.80 3 1.03 0.34
10 Halahali 3.40 3 1.02 0.34 4.98 3 1.04 0.35 3.77 3.00 0.78 0.26 11 Salema 2.33 3 0.44 0.15 3.21 3 0.86 0.29 4.10 3.00 0.58 0.19 4.13 3 0.75 0.25 5.24 4 0.59 0.15 12 Kanchanpur 4.76 5 2.32 0.46 6.18 4 2.39 0.60 6.32 4.00 2.04 0.51 6.26 4 1.57 0.39 6.51 3 1.61 0.54 13 Panisagar 3.61 4 2.34 0.14 4.21 3 3.31 1.10 3.95 3.00 2.46 0.82 4.24 3 1.69 0.56 4.46 3 2.39 0.80 14 Office
tilla/Super Market, DMN
2.56 3 0.56 0.19 4.11 3 0.57 0.19 6.11 3.00 1.01 0.34 6.09 3 0.04 0.01 5.32 2 0.22 0.11
1 Turnover of all the emporia for the years 2008-09 to 2012-13 has been taken at the gross sales value.

Appendices
Audit Report for the year 2012-13, Government of Tripura
220
Appendix 3.9 (Contd...) Details of emporium-wise turnover per employee during the period 2008-09 to 2012-13
(Reference: Paragraph No 3.2.7.7) (` in lakh)
Sl. No.
Name of Emporia/
Office
2008-09 2009-10 2010-11 2011-12 2012-13
Salary expenditure
No. of employees (No.)
Turnover
Turnover per
employee
Salary expenditure
No. of employees (No.)
Turnover
Turno ver per employ
ee
Salary
expenditure
No. of
employees (No.)
Turnover
Turnover per
employee
Salary expendi
ture
No. of
employees (No.)
Turnover
Turnover per
employee
Salary
expenditu
re
No. of
employees (No.)
Turnover
Turnover per
employee
15 Kalibari road, DMN
3.23 4 3.07 0.77 4.45 4 2.30 0.58 4.48 3.00 1.94 0.65 4.10 3 1.30 0.43 5.41 4 1.78 0.45
16 Badarpur 4.82 4 2.82 0.71 7.00 5 2.93 0.59 8.57 4.00 2.84 0.71 8.51 4 2.43 0.61 9.89 4 2.57 0.64 17 Silchar 8.03 7 4.56 0.65 11.83 7 5.12 0.73 14.19 7.00 5.72 0.82 14.42 7 4.26 0.61 15.57 7 4.08 0.58 18 Dhakuria 3.61 3 12.18 4.06 3.89 2 17.81 8.91 2.88 2.00 12.20 6.10 4.80 3 13.36 4.45 5.43 3 10.57 2.11 19 Maniktala 1.20 1 3.19 3.19 1.98 2 1.53 0.77 3.87 2.00 1.47 0.74 3.95 2 1.40 0.70 4.41 2 1.01 0.51 20 Chowringee 1.64 2 2.16 1.08 2.70 2 3.23 1.62 4.13 2.00 2.43 1.22 6.31 2 1.88 0.94 5.47 2 1.00 0.50 21 Behala 1.80 2 1.27 0.64 2.54 2 1.61 0.81 3.27 2.00 0.96 0.48 3.39 2 0.79 0.40 4.78 2 1.74 0.87 22 Salt Lake City 2.50 2 1.26 0.63 3.52 2 1.22 0.61 3.72 2.00 0.25 0.13 23 New Market,
Kolkata 0.04 1 - - 0.59 1 0.07 0.07 0.71 1.00 0.56 1 - -
24 New Delhi 6.61 4 28.45 7.11 5.08 2 33.48 16.74 4.32 2.00 31.91 15.96 4.21 2 24.05 8.02 4.70 2 24.28 8.09 25 Shilpgram,
Guwahati 2.25 2 3.90 1.95 3.33 2 2.17 1.09 8.14 4.00 3.09 0.77 8.60 4 2.59 0.65 9.55 4 1.98 0.50
26 Durgachowmuhani
3.55 7 0.77 0.11 4.76 6 0.53 0.09 5.11 5.00 0.62 0.12 4.40 4 0.74 0.19 4.64 3 0.41 0.14
27 Ambassa 2.41 3.00 6.04 3 0.22 0.07 7.35 4 0.20 0.05 28 Indranagar 3.08 2.00 0.19 0.10 3.30 2 0.52 0.26 3.68 2 2.35 1.18 29
Kaman Chowmuhani
8.68 6.00 3.82 0.64 9.26 6 3.11 0.52 7.09 3 5.38 1.79
30 Lenin Sarani 8.04 7.00 2.78 0.40 8.54 7 2.52 0.36 10.07 7 4.43 0.63

Appendices
Audit Report for the year 2012-13, Government of Tripura
221
Appendix 3.9 (Concld.) Details of emporium-wise turnover per employee during the period 2008-09 to 2012-13
(Reference: Paragraph No 3.2.7.7) (` in lakh)
Sl. No.
Name of Emporia/ Office
2008-09 2009-10 2010-11 2011-12 2012-13 Sal-ary expenditu
re
No. of employees (No.)
Turnover
Turnover per
employee
Sal-ary expenditu
re
No. of employees (No.)
Turnover
Turnover per emplo
yee
Salary expenditure
No. of
employees (No.)
Turnover
Turnover per
employee
Salary expend
iture
No. of
employees (No.)
Turn-over
Turn-over per
employ-yee
Salary expenditure
No. of
employees (No.)
Turnover
Turnover per
employee
31 Durgachowmuhani Annex
6.65 4.00 1.00 0.25 6.97 4 0.72 0.18 7.71 3 2.29 0.76
32 Mohanpur Sidai 4.10 2.00 0.77 0.39 4.42 2 0.44 0.22 4.49 2 0.81 0.41 33 H/L Marketing 6.22 4.00 2.74 0.69 6.61 4 0.76 0.19 34 Melagarh 3.31 2.00 0.74 0.37 3.58 2 0.53 0.27 4.75 2 0.3 0.15 35 Bishramganj 4.97 3.00 0.10 0.03 5.24 3 0.15 0.05 5.05 3 0.04 0.01 36 Sabroom 2.05 3.00 1.69 0.56 2.08 3 0.45 0.15 2.12 3 1.63 0.82 37 Manubazar 4.09 2.00 1.57 0.79 4.42 2 1.22 0.61 4.93 2 1.03 0.52 38 Nutan Bazar 3.20 2.00 0.23 0.12 3.50 2 0.27 0.14 3.90 2 0.32 0.16 39 Udaipur Annex 3.03 2.00 0.78 0.39 40 Kumarghat 3.69 2.00 0.35 0.18 4.05 2 0.10 0.05 4.55 2 0.22 0.11 41 Manughat 3.25 2.00 0.84 0.42 3.37 2 0.99 0.50 3.86 2 0.87 0.29 42 Kailashahar 3.32 4.00 1.45 0.36 3.60 4 1.25 0.31 4.50 4 2.4 0.60 43 Teliamura 3.57 3.00 1.13 0.38 3.91 3 1.83 0.61 4.95 4 2.21 0.55 44 Khowai 3.69 4.00 1.60 0.40 4.05 4 0.84 0.21 5.54 4 1.57 0.52 45 Mandai 2.50 2.00 0.45 0.23 2.66 2 0.84 0.42 3.08 3 0.72 0.24 46 Jirania 3.48 2.00 2.42 1.21 3.63 2 1.11 0.56 7.86 5 1.68 0.34 47 Ranirbazar 1.49 2.00 0.41 0.21 4.14 2 0.75 0.38 4.72 3 0.1 0.03 48 Gariahat 2.19 2.00 0.47 0.24 2.30 2 0.47 0.24 2.69 2 0.57 0.29 49 Maniktala annex 4.76 4.00 1.08 0.27 5.00 4 1.10 0.28 5.98 4 0.75 0.19 50 Amarpur 0.84 1.00 0.69 0.69 51 Kalyanpur 0.82 0.31 0.31
Total: 95.44 109 136.34 1.25 125.74 104 155.11 1.49 239.10 173.00171.54 0.99 241.74 160 146.54 0.92 258.14 151 156.84 1.04

Appendices
Audit Report for the year 2012-13, Government of Tripura
222
Appendix 3.10 Statement on production and distribution of silk sarees
(Reference: Paragraph No 3.2.7.8)
Year Name of Unit Year
Opening balance Production Distribution Closing Balance Shortage
No. of sarees Value No. of
sarees
Cost of production
(`)
No. of sarees Value (`) Details of
dispatch No. of sarees Value
2009-10 Indranagar 0 0 76 61,274 75 60,446 Muhuripur TSSS Ltd.(MTSSS)
1 828
2010-11 -Do- 1 828 924 8,44,791 795 7,22,573 MTSSS 117 1,19,466 9 nos. valued ` 8,937 4 3,580 Printing unit
2011-12 -Do- 117 1,19,466 1,046 13,66,733 497 5,52,531 MTSSS 563 8,12,081 56 64,577 Printing unit 27 32,610 Central store 20 24400 Individual
2012-13 -Do- 563 8,12,081 873 11,79,673 250 2,99,476 MTSSS 530 8,09,081 553 6,84,615 Central store 148 1,92,482 Individual
5 6,100 Printing unit 2012-13 Badharghat 530 8,09,081 1,428 20,84,500 250 3,17,500 MTSSS 1,189 17,97,581
519 7,78,500 Central store Total: 4,347 55,36,971 3,199 37,39,390

Appendices
Audit Report for the year 2012-13, Government of Tripura
223
Appendix 3.11
Operational performance of the Company during the period from 2008-09 to 2012-13
(Reference: Paragraph No 3.2.9.1)
(` in crore ) Particulars 2008-09 2009-10 2010-11 2011-12 2012-13
A. Income (a) Sales to Government 1.60 1.78 2.13 1.05 1.45(b) Sales (Others) 1.36 1.45 1.62 1.63 1.16
(c) Other income 0.23 2.11 0.36 1.42 0.63Total income (A) 3.19 5.34 4.11 4.10 3.24B. Expenditure (a) Material consumption 1.94 2.10 3.31 2.51 3.21(b) Administrative expenses
3.85. 4.30 7.20 7.22 8.41
(c) Selling and distribution expenses
0.31 0.52 0.35 0.45 0.06
(d) Depreciation 0.06 0.05 0.06 0.06 0.06(e) Prior period adjustments
7.72
Total expenditure (B) 6.16 6.97 10.92 10.24 19.46C. Net Loss (A)- (B) 2.97 1.63 6.81 6.14 16.22

Appendices
Audit Report for the year 2012-13, Government of Tripura
224
Appendix 3.12 Statement showing details of avoidable loss of revenue towards lease rent and premium from October 2008 to December 2013
(Reference: Paragraph No 3.3)
Sl. No.
Name of lessee
Date of allotment
No. of acres
Existing monthly rate of lease rent paid
per acre (`)
Revised monthly
lease rent
payable per acre
(`)
Old monthly
rent paid (`)
Revised monthly
rent payable
(`)
Loss of revenue
per month
(`)
Period up to which rate
cannot be
revised (in
years)
Effective month
of revised rates
Period up to which old rates
will continue as
per lease agreements
No. of months revised
rate could not be
enforced from
October 2008 to
December 2013
Avoidable Loss of revenue towards
lease rent (`)
Lease Premium
paid at old rate @ Rs.1
lakh per acre (`)
Lease premium at revised
rate of Rs.2.5
lakh per acre not
recovered (`)
Loss of revenue towards
lease premium
(`)
(1) (2) (3) (4) (5) (6) (7)= (4) X (5)
(8)= (4) X (6)
(9)= (8)- (7) (10) (11) (12) (13)=
(12)-(11) (14)=
(9) X (13)
(15)= (4) X 1 lakh
(16)= (4) X 2.5
lakh
(17)= (16)- (15)
1 M/s Agartala Rubber Industry 30/6/2007 2 4000 6000 8000 12000 4000 5 Oct-08 Jun-12 44 176000 200000 500000 300000
2 M/s Brite Rubber Processor (P) Ltd 13/7/2007 4 4000 6000 16000 24000 8000 5 Oct-08 Jul-12 45 360000 400000 1000000 600000
3 M/s Agartala Food Processing (P) Ltd 24/9/2007 3.5 4000 6000 14000 21000 7000 10 Oct-08 Sep-17 63 441000 350000 875000 525000
4 M/s Dharampal Premchand Ltd 10/1/2007 8.55 4000 6000 34200 51300 17100 10 Oct-08 Jan-17 63 1077300 855000 2137500 1282500
5 M/s Bengal Breweries (P) Ltd
24/7/2008 (cancelled in Sept 2010) 5 4000 6000 20000 30000 10000 10 Oct-08 Sep-10 23 230000 500000 1250000 750000 9/2/2012 (Rellotted) 5 4000 6000 20000 30000 10000 10 Feb-12 Jul-18 23 230000
6 M/s Rotomec 1/11/2007 1 4000 6000 4000 6000 2000 5 Oct-08 Nov-12 49 98000 100000 250000 150000
Total: 24.05 2612300 3607500 Total Loss of revenue (Rent +Premium)= ` 62,19,800 rounded off to ` 62.20 lakh
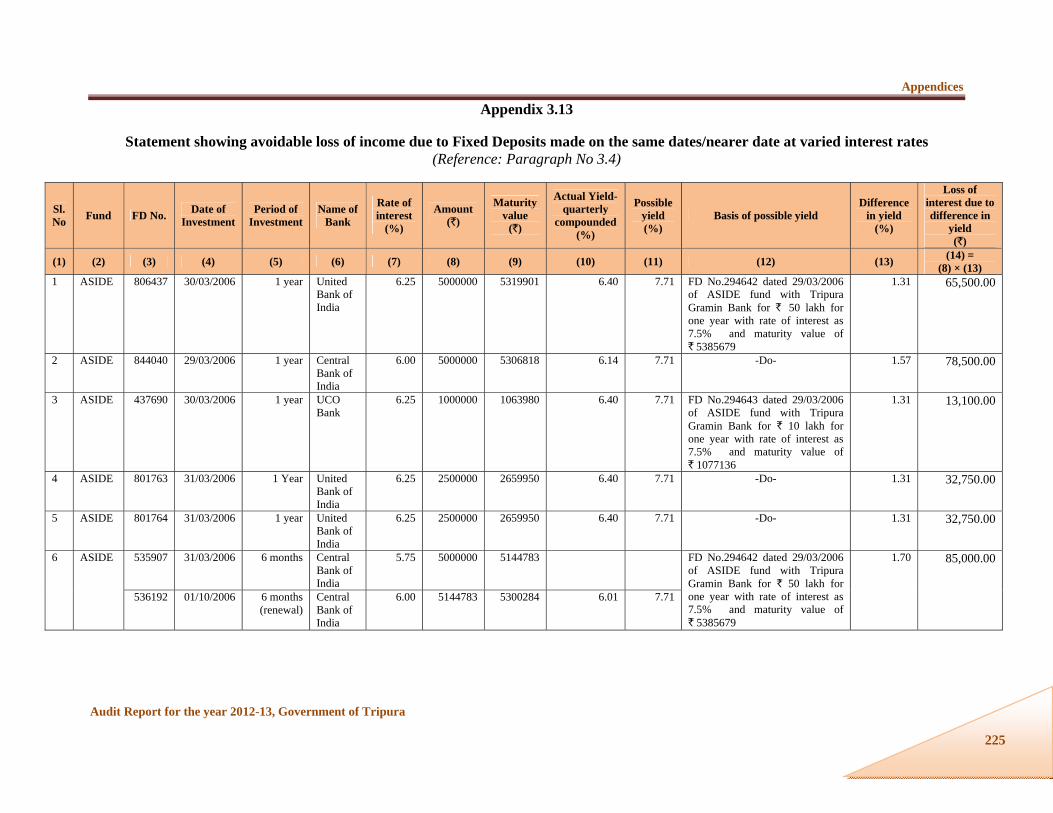
Appendices
Audit Report for the year 2012-13, Government of Tripura
225
Appendix 3.13
Statement showing avoidable loss of income due to Fixed Deposits made on the same dates/nearer date at varied interest rates (Reference: Paragraph No 3.4)
Sl. No Fund FD No. Date of
Investment Period of
Investment Name of
Bank
Rate of interest
(%)
Amount (`)
Maturity value
(`)
Actual Yield- quarterly
compounded (%)
Possible yield (%)
Basis of possible yield Difference
in yield (%)
Loss of interest due to difference in
yield (`)
(1) (2) (3) (4) (5) (6) (7) (8) (9) (10) (11) (12) (13) (14) = (8) × (13)
1 ASIDE 806437 30/03/2006 1 year United Bank of India
6.25 5000000 5319901 6.40 7.71 FD No.294642 dated 29/03/2006 of ASIDE fund with Tripura Gramin Bank for ` 50 lakh for one year with rate of interest as 7.5% and maturity value of ` 5385679
1.31 65,500.00
2 ASIDE 844040 29/03/2006 1 year Central Bank of India
6.00 5000000 5306818 6.14 7.71 -Do- 1.57 78,500.00
3 ASIDE 437690 30/03/2006 1 year UCO Bank
6.25 1000000 1063980 6.40 7.71 FD No.294643 dated 29/03/2006 of ASIDE fund with Tripura Gramin Bank for ` 10 lakh for one year with rate of interest as 7.5% and maturity value of ` 1077136
1.31 13,100.00
4 ASIDE 801763 31/03/2006 1 Year United Bank of India
6.25 2500000 2659950 6.40 7.71 -Do- 1.31 32,750.00
5 ASIDE 801764 31/03/2006 1 year United Bank of India
6.25 2500000 2659950 6.40 7.71 -Do- 1.31 32,750.00
6 ASIDE 535907 31/03/2006 6 months Central Bank of India
5.75 5000000 5144783 FD No.294642 dated 29/03/2006 of ASIDE fund with Tripura Gramin Bank for ` 50 lakh for one year with rate of interest as 7.5% and maturity value of ` 5385679
1.70 85,000.00
536192 01/10/2006 6 months (renewal)
Central Bank of India
6.00 5144783 5300284 6.01 7.71

Appendices
Audit Report for the year 2012-13, Government of Tripura
226
Appendix 3.13 (contd...)
Statement showing avoidable loss of income due to Fixed Deposits made on the same dates/nearer date at varied interest rates (Reference: Paragraph No 3.4)
Sl. No Fund FD No. Date of
Investment Period of
Investment Name of
Bank
Rate of interest
(%)
Amount (`)
Maturity value
(`)
Actual Yield- quarterly
compounded (%)
Possible yield (%)
Basis of possible yield Difference
in yield (%)
Loss of interest due to difference
in yield (`)
(1) (2) (3) (4) (5) (6) (7) (8) (9) (10) (11) (12) (13) (14) = (8) × (13)
7 ASIDE 535906 31/03/2006 6 months Central Bank of India
5.75 5000000 5144783 FD No.294642 dated 29/03/2006 of ASIDE fund with Tripura Gramin Bank for ` 50 lakh for one year with rate of interest as 7.5% and maturity value of ` 5385679
1.70 85,000.00
536193 01/10/2006 6 months (renewal)
Central Bank of India
6.00 5144783 5300284 6.01 7.71
8 ASIDE 630862 29/03/2006 1 year UCO Bank
6.50 5000000 5333008 6.66 7.71 -Do- 1.05 52,500.00
9 ASIDE 630889 31/03/2006 6 months UCO Bank
7.15 5000000 5178750 -Do- 0.84 42,000.00
48861 30/09/2006 6 months (renewal)
UCO Bank
6.50 5178750 5343634 6.87 7.71
10 ASIDE 154308 30/03/2006 1 year SBI 7.00 10000000 10718590 7.19 7.71 -Do- 0.52 52,000.00 11 ASIDE 50407 12/01/2007 1 year UCO
Bank 8.00 5010000 5422985 8.24 8.51 FD no.154870 dated 12/01/2007
of ASISE fund with SBI for `50 lakh for one year @ 8.25% with maturity value of `5425483
0.27 13,527.00

Appendices
Audit Report for the year 2012-13, Government of Tripura
227
Appendix 3.13 (contd...)
Statement showing avoidable loss of income due to Fixed Deposits made on the same dates/ nearer date at varied interest rates (Reference: Paragraph No 3.4)
Sl. No Fund FD No. Date of
Investment Period of
Investment Name of
Bank
Rate of interest
(%)
Amount (`)
Maturity value
(`)
Actual Yield- quarterly
compounded (%)
Possible yield (%)
Basis of possible yield Difference
in yield (%)
Loss of interest due to difference
in yield (`)
(1) (2) (3) (4) (5) (6) (7) (8) (9) (10) (11) (12) (13) (14) = (8) × (13)
12 ASIDE 365733 16/05/2007 400 days Union Bank
9.00 10000000 11022473 10.22 10.38 FD No.157106000002172 dated 26/05/2007 (start date 19/05/2007) with IDBI for `1,00,10,000 @ 10% for one year with maturity value as `1,10,49,167
0.16 16,000.00
13 ASIDE 598025 15/05/2007 1 year Canara Bank
8.50 10000000 10877480 8.77 10.38 -Do- 1.61 1,61,000.00
14 ASIDE 598026 15/05/2007 1 year Canara Bank
8.50 10000000 10877480 8.77 10.38 -Do- 1.61 1,61,000.00
15 ASIDE 154870 12/01/2008 1 year SBI 8.30 5449544 5915970 8.56 9.31 FD No.050407 dated 12/01/2008 of ASIDE fund with UCO Bank for `54,22,985 @ 9% for one year with maturity value as `59,27,774
0.75 40,871.58
16 ASIDE 642097 29/07/2008 1 year UCO Bank
9.60 10000000 10995116 9.95 10.38 FD No.3942504 dated 28/07/2008 of ASIDE fund with IDBI for `1,01,00,000 @ 10% for one year with maturity value as `1,11,48,510
0.43 43,000.00
17 ASIDE 643088 19/01/2009 1 year Canara Bank
7.50 23932468 25778520 7.71 8.77 FD No.144950 dated 19/01/2009 of ASIDE fund with SBI for `59,15,970 @ 8.5% for one year with maturity value as `64,35,084
1.06 2,53,684.16
18 ASIDE 616643 22/09/2009 1 year United Bank of India
6.75 6000000 6415367 6.92 7.19 FD No.643560 dated 22/09/2009 of ASIDE fund with Canara Bank for `70 lakh @ 7% for one year with maturity value as `75,03,013
0.27 16,200.00

Appendices
Audit Report for the year 2012-13, Government of Tripura
228
Appendix 3.13 (contd...)
Statement showing avoidable loss of income due to Fixed Deposits made on the same dates/ nearer date at varied interest rates (Reference: Paragraph No 3.4)
Sl. No Fund FD No. Date of
Investment Period of
Investment Name of
Bank
Rate of interest
(%)
Amount (`)
Maturity value
(`)
Actual Yield- quarterly
compounded (%)
Possible yield (%)
Basis of possible yield Difference
in yield (%)
Loss of interest due to difference
in yield (`)
(1) (2) (3) (4) (5) (6) (7) (8) (9) (10) (11) (12) (13) (14) = (8) × (13)
19 ASIDE 616631 23/09/2009 1 year United Bank of India
6.75 8000000 8553823 6.92 7.19 -Do- 0.27 21,600.00
20 Rubber Park
643205 20/03/2009 1 year Canara Bank
8.25 5000000 5425438 8.51 8.77 FD No.297527 dated 20/03/2009 of Rubber Park fund with United Bank of India @ 8.50% for one year with maturity value as `54,38,739.81
0.26 13,000.00
21 Rubber Park
145202 19/03/2009 1 year SBI 8.10 10000000 10834938 8.35 8.77 -Do- 0.42 42,000.00
22 TIDC 806878 16/01/2007 1 year United Bank of India
8.25 5000000 5425438 8.51 9.04 FD No.344753 dated 16/01/2007 of TIDC fund for ` 25 lakh with UCO Bank @ 8.75% for one year with maturity value as ` 2726033
0.53 26,500.00
23 TIDC 711785 16/01/2007 1 year Allahabad Bank
8 2500000 2706080 8.24 9.04 -Do- 0.80 20,000.00
24 TIDC 152869 22/04/2008 1 year Bank of Baroda
8.50 1170479 1273186 8.77 9.31 FD No.750583 dated 22/04/2008 of TIDC fund for ` 1234174 with UCO Bank @ 9% for one year with maturity value as `1349055
0.54 6,320.59
25 TIDC 38120 25/08/2010 1 year Union Bank
6.75 7572651 8096890 6.92 7.45 FD No.RTCMC 3102324 dated 25/08/2010 of TIDC fund for `5274066 lakh with IDBI Bank @ 7.25% for one year with maturity value as ` 5666958
0.53 40,135.05
26 TIDC 8425785
25/08/2010 1 year Union Bank
6.75 1570081 1678774 6.92 7.45 -Do- 0.53 8,321.43

Appendices
Audit Report for the year 2012-13, Government of Tripura
229
Appendix 3.13 (contd...)
Statement showing avoidable loss of income due to Fixed Deposits made on the same dates/ nearer date at varied interest rates (Reference: Paragraph No 3.4)
Sl. No Fund FD No. Date of
Investment Period of
Investment Name of
Bank
Rate of interest
(%)
Amount (`)
Maturity value
(`)
Actual Yield- quarterly
compounded (%)
Possible yield (%)
Basis of possible yield Difference
in yield (%)
Loss of interest due to difference
in yield (`)
(1) (2) (3) (4) (5) (6) (7) (8) (9) (10) (11) (12) (13) (14) = (8) × (13)
27 TIDC 646300 22/04/2011 1 year UCO Bank
8.50 1537471 1672381 8.77 9.31 FD No.152869 dated 22/04/2011 of TIDC fund for ` 1410871 with Bank of Baroda @ 9% for one year with maturity value as `1542200
0.54 8,302.34
28 TIDC 152869 22/04/2012 1 year Bank of Baroda
9.25 1528990 1675404 9.58 9.84 FD No.646300 dated 22/04/2012 of TIDC fund for ` 1672381 with UCO Bank @ 9.50% for one year with maturity value as ` 1837007
0.26 3,975.37
29 Dukli Grant
366641 19/10/2010 1 year Tripura Gramin Bank
7.75 7503013 8101615 7.98 8.24 FD No.59777 dated 19/10/2010 of Dukli fund for ` 7532000 with Tripura State Co-operative Bank @ 8% for one year with maturity value as ` 8152879
0.26 19,507.83
30 Dukli Grant
366640 19/10/2010 1 year Tripura Gramin Bank
7.75 9646731 10416362 7.98 8.24 -Do- 0.26 25,081.50
31 Dukli Grant
366639 19/10/2010 1 year Tripura Gramin Bank
7.75 9646731 10416362 7.98 8.24 -Do- 0.26 25,081.50
32 Dukli Grant
366641 19/10/2011 1 year Tripura Gramin Bank
9.25 8101615 8877412 9.58 9.84 FD No.59777 dated 19/10/2011 of Dukli fund for ` 8152879 with Tripura State Co-operative Bank @ 9.50% for one year with maturity value as ` 8955434
0.26 21,064.20
33 Dukli Grant
366640 19/10/2011 1 year Tripura Gramin Bank
9.25 10416362 11413816 9.58 9.84 -Do- 0.26 27,082.54

Appendices
Audit Report for the year 2012-13, Government of Tripura
230
Appendix 3.13 (contd...)
Statement showing avoidable loss of income due to Fixed Deposits made on the same dates/ nearer date at varied interest rates (Reference: Paragraph No 3.4)
Sl. No Fund FD No. Date of
Investment Period of
Investment Name of
Bank
Rate of interest
(%)
Amount (`)
Maturity value
(`)
Actual Yield- quarterly
compounded (%)
Possible yield (%)
Basis of possible yield Difference
in yield (%)
Loss of interest due to difference
in yield (`)
(1) (2) (3) (4) (5) (6) (7) (8) (9) (10) (11) (12) (13) (14) = (8) × (13)
34 Dukli Grant
902604 19/10/2011 1 year IOB 9.25 14431550 15813492 9.58 9.84 -Do- 0.26 37,522.03
35 Dukli Grant
902605 19/10/2011 1 year IOB 9.25 14431550 15813492 9.58 9.84 -Do- 0.26 37,522.03
36 Dukli Grant
31997501615
20/10/2011 1 year SBI 9.25 8553275 9372322 9.58 9.84 -Do- 0.26 22,238.52
37 Dukli Grant
271984 19/10/2012 1 year IOB 9.25 15813492 17327766 9.58 10.11 FD No.366641 dated 19/10/2012 of Dukli fund for ` 8818773 with Tripura Gramin Bank @ 9.75% for one year with maturity value as ` 9710556
0.53 83,811.51
38 Dukli Grant
271985 19/10/2012 1 year IOB 9.25 15813492 17327766 9.58 10.11 -Do- 0.53 83,811.51
39 Dukli Grant
30926958561
19/10/2012 1 year SBI 8.50 5996792 6522998 8.77 10.11 -Do- 1.34 80,357.01
40 Dukli Grant
30926958979
19/10/2012 1 year SBI 8.50 5996792 6522998 8.77 10.11 -Do- 1.34 80,357.01
41 Dukli Grant
59779 19/10/2012 1 year Tripura State Co-operative Bank
9.30 11410944 12509749 9.63 10.11 -Do- 0.48 54,772.53
42 Dukli Grant
59780 19/10/2012 1 year Do- 9.30 11410944 12509749 9.63 10.11 -Do- 0.48 54,772.53
43 Dukli Grant
59781 19/10/2012 1 year Do- 9.30 11410944 12509749 9.63 10.11 -Do- 0.48 54,772.53

Appendices
Audit Report for the year 2012-13, Government of Tripura
231
Appendix 3.13 (concld.)
Statement showing avoidable loss of income due to Fixed Deposits made on the same dates/ nearer date at varied interest rates (Reference: Paragraph No 3.4)
Sl. No Fund FD No. Date of
Investment Period of
Investment Name of
Bank
Rate of interest
(%)
Amount (`)
Maturity value
(`)
Actual Yield- quarterly
compounded (%)
Possible yield (%)
Basis of possible yield Difference
in yield (%)
Loss of interest due to difference
in yield (`)
(1) (2) (3) (4) (5) (6) (7) (8) (9) (10) (11) (12) (13) (14) = (8) × (13)
44 Dukli Grant
59783 19/10/2012 1 year Do- 9.30 11410944 12509749 9.63 10.11 -Do- 0.48 54,772.53
45 Dukli Grant
59785 19/10/2012 1 year Do- 9.30 11410944 12509749 9.63 10.11 -Do- 0.48 54,772.53
46 Dukli Grant
874210 19/04/2011 1 year Union Bank
8 5786621 6263625 8.24 9.04 FD No.876552 dated 19/04/2011of Rubber Park fund for ` 5713462 with Canara Bank @ 8.75% for one year with maturity value as ` 6230035
0.80 46,292.97
TOTAL: 22,98,130.33

Appendices
Audit Report for the year 2012-13, Government of Tripura
232
Appendix-4.1(A)
Statement showing short levy of Sales Tax/VAT, interest, penalty and Additional Sales Tax due to concealment of turnover by the dealers
(Reference: Paragraph No. 4.2) (` in lakh)
1 Taxable @ 12.5 per cent in VAT regime
Sl. No.
Name of the dealer
No. of assess- ment cases
Period of
assess- ment
Date of assess- ment
Amount of Concealment of turnover 1
Short levy
Total Remarks Sales Tax/ VAT
Interest Penalty Addl. Sales Tax
1. Superintendent of Taxes, Charge-I, Agartala 1. Tripura
Industrial Corporation
1 2009-10 30.08.12 8.71 (1.75 @4% &
6.96 @12.5%)
0.94 0.41 -- 1.35 AA stated that the case will be reviewed as per provision of the TVAT Act and action will be taken accordingly
2. Sova Glass Aluminum Centre
2 2006-07 28.06.12 8.84 (4%) 0.35 0.14 0.03 -- 0.52 -do- 3 2007-08 4 2010-11
3. Joy & Co. 5 2005-06 30.03.12 9.54 (4%) 0.38 0.41 -- -- 0.79 -do- 4. Matri
Homeo Drugs
6 2006-07 20.07.12 11.00 (4%) 0.44 0.25 -- -- 0.69 -do- 7 2007-08 8 2008-09 9 2009-10 10 2010-11
5. Brahamaputra Valley Fertilizer Corporation
11 2005-06 May 2012 4.06 (4%) 0.16 0.15 -- -- 0.31 -do-
6. Pawan Auto Spare
12 2006-07 29.03.12 2.52 0.31 0.24 -- -- 0.55 -do- 13 2008-09
2. Superintendent of Taxes, Charge-IV, Agartala7. Berjer Paints
India Ltd 14 2005-06 20.03.12 192.25 24.03 21.70 11.14 -- 56.87 AA stated that the case would be
reviewed as per provision of the TVAT Act and action would be taken accordingly
15 2007-08 16 2008-09 17 2009-10

Appendices
Audit Report for the year 2012-13, Government of Tripura 233
Appendix-4.1(A) (Contd.)
Statement showing short levy of Sales Tax/VAT, interest, penalty and Additional Sales Tax due to concealment of turnover by the dealers
(Reference: Paragraph No. 4.2) (` in lakh)
2 Taxable @ 12.5 per cent in VAT regime 3 Taxable @8 per cent in Sales Tax régime 4 Additional Sales Tax of ` 1.80 lakh (0.5 per cent on TOR) levied in Sales Tax regime 5 Taxable @12 per cent in Sales Tax regime
Sl. No.
Name of the dealer
No. of assess- ment cases
Period of
assess- ment
Date of assess- ment
Amount of Concealment of turnover 2
Short levy
Total Remarks Sales Tax/ VAT
Interest Penalty Addl. Sales Tax
8. Laxmi Enterprise
18 2004-05 30.06.07 50.783 4.06 7.11 2.44 1.804 15.41 -do-
9. Sree Maa Laxmi Agency
19 2006-07 15.11.12 54.42 6.80 6.40 0.68 -- 13.88 -do- 20 2007-08 21 2008-09
10. Kamakhya Enterprise
22 2004-05 26.02.12 0.355 0.04 -- 0.01 -- 0.05 -do- 23 2005-06 3.27 (0.03
@4% & 3.24 @12.5%)
0.41 0.43 0.04 -- 0.88 -do-
3. Superintendent of Taxes, Charge-VI, Agartala11 Samin
Chowdhury 24 2008-09 11.02.13 12.99 1.62 2.09 5.96 -- 9.67 AA stated that the case would be
reviewed as per provision of the TVAT Act and action would be
taken accordingly.
25 2009-10 26 2010-11
12 Anwar Hossain
27 2007-08 14.01.11 22.97 2.87 1.46 0.29 -- 4.62 -do- 28 2008-09 29 2009-10 30 2010-11
13 Milan Miah 31 2009-10 29.01.13 36.50 4.56 1.51 6.84 -- 12.91 -do- 32 2010-11
14 Narayan Das 33 2009-10 23.12.12 27.03(24.36 @12.5% &
2.67 @13.5%)
3.41 1.50 5.11 -- 10.02 -do- 34 2011-12

Appendices
Audit Report for the year 2012-13, Government of Tripura
234
Appendix-4.1(A) (Concld.)
Statement showing short levy of Sales Tax/VAT, interest, penalty and Additional Sales Tax due to concealment of turnover by the dealers
(Reference: Paragraph No. 4.2) (` in lakh)
6 Taxable @ 12.5 per cent in VAT regime
Sl. No.
Name of the dealer
No. of assess- ment cases
Period of
assess- ment
Date of assess- ment
Amount of Concealment of turnover 6
Short levy
Total Remarks Sales Tax/ VAT
Interest Penalty Addl. Sales Tax
15 Firoj Khan 35 2008-09 29.01.13 16.58(15.90 @12.5% &
0.68 @13.5%)
2.08 1.39 3.12 -- 6.59 - 36 2009-10 37 2010-11 38 2011-12
16 Joy Ram Udyog
39 2005-06 31.03.11 33.10(5.78 @4% & 27.32
@12.5%)
3.65 3.23 0.36 -- 7.24 -
4. Superintendent of Taxes, Charge-VII, Agartala17 Priya
Motors Pvt. Ltd.
40 2006-07 17.01.11 13.66 1.71 0.65 -- -- 2.36 Since AA has no power for making re-assessment of the dealer, the case is being taken up for review by the Revisional authority.
18 S.P. Agency 41 2005-06 30.05.11 3.35 0.42 0.39 -- -- 0.81 -do- 19 K.D.
Industries 42 2005-06 29.01.11 7.30 0.90 0.53 0.06 -- 1.49 -do- 43 2007-08 44 2008-09 24.09.11 45 2009-10
5. Superintendent of Taxes, Udaipur 20 Dutta
Brothers 46 2005-06 NA 8.19 (4%) 0.33 0.35 0.28 0.96 AA stated that the case would be
reviewed as per provision of the TVAT Act and action would be taken accordingly
21 Chandra Tara Stores
47 2008-09 28.11.12 2.06(0.84 @4% & 1.22
@12.5%)
0.19 0.12 0.09 -- 0.40 -do-
Total: 529.47 59.66 50.46 36.45 1.80 148.37

Appendices
Audit Report for the year 2012-13, Government of Tripura 235
Appendix-4.1(B)
Statement showing short levy of Sales Tax/VAT, interest and penalty due to incorrect application of taxable rates (Reference: Paragraph No. 4.2)
(` in lakh)
7 Tax deposited @4 per cent instead of 12.5 per cent i.e. 8.5 per cent short deposited by the dealer
Sl. No.
Name of the
dealer
No. of assess- ment cases
Period of
assess- ment
Date of assess- ment
Amount on which incorrect
application of taxable rates
was made7
Short levy Total Remarks
Sales Tax/ VAT
Interest Penalty
1. Superintendent of Taxes, Charge-I, Agartala
1
Ramthakur Enterprise
1 2005-06 31.01.12 2.10 0.18 0.19 -- 0.37 AA stated that the case will be reviewed as per provision of the TVAT Act and action will be taken accordingly
2. Superintendent of Taxes, Charge-IV, Agartala
2 Bengal Sanitary Stores
2 2005-06 25.04.12 5.45 0.46 0.51 0.05 1.02 -do-
Total 7.55 0.64 0.70 0.05 1.39

Appendices
Audit Report for the year 2012-13, Government of Tripura
236
Appendix 4.1(C)
Statement showing non levy of penalty due to non submission of audited balance sheet (Reference: Paragraph No.4.2)
(` in lakh)
Sl. No.
Name of the dealer
No. of assess- ment cases
Period of
assess- ment
Date of assess- ment
Penalty Total Remarks
1. Superintendent of Taxes, Charge-IV, Agartala
1
Victor & Company
1 2007-08 31.01.13 0.97 0.97 AA stated that the case would be reviewed as per provision of the TVAT Act and action would be taken accordingly
2 2008-09 3 2009-10 4 2010-11
2 Superintendent of Taxes, Udaipur
2
Dutta Brothers
5 2005-06 NA 0.65 0.65 -do- 6 2006-07 23.03.13 7 2007-08 8 2008-09 9 2009-10
10 2010-11 11 2011-12
Total 1.62 1.62

Appendices
Audit Report for the year 2012-13, Government of Tripura 237
Appendix 5.1
Units Selected by Using Random Table (Page No. 23)
(Reference: Paragraph No. 5.3.5)
Automatic Selections Being Single Unit/Controlling Unit:
Sl. No. Name of the Selected Units
1. Office of the DGP (PHQ) 2. Office of the SP, Procurement 3. Office of the SP, Communication 4. Office of the SP, CID 5. Office of the SP, Traffic 6. Office of the Principal, KTD Singh Police Training Academy,
Narsingarh 7. Office of the Director, FSL, Narsingarh 8. Commanding Officer, TSR 2nd BN (Training), Gakulnagar 9. Centre for Insurgency and Jungle Warfare(CIJW), under TSR 3rd Bn,
Kachucherra, Dhalai
Selection of Districts:
Sl. No. Name of the District 1. Dhalai 2. West Tripura
Selection of District Units:
Sl. No. Name of the Selected Units
1. Office of the SP, West Tripura District {Bifurcated into three offices viz., SP (West), SP (Sepahijala) and SP (Khowai) w.e.f. January 2012}
2. Office of the SP, Dhalai District
Selection of Police Station under West Tripura District:
Sl. No. Name of the Police Stations 1st STRATA: Women Station
1. Women Agartala Police Station 2nd STRATA: Capital Police Station
1. East Agartala PS 3rd STRATA: Police Station outside Capital
1. Bishramganj PS 2. Melaghar PS 3. Champahour PS

Appendices
Audit Report for the year 2012-13, Government of Tripura
238
Appendix 5.1 (concld.)
Units Selected by Using Random Table (Page No. 23)
(Reference: Paragraph No. 5.3.5)
Selection of Out Post under selected Police Stations of West Tripura District
Sl. No.
Name of the Police Station Name of the Out Post
1. East Agartala PS 1 Khayerpur OP 2 Abhoynagar OP
2. Bishramganj PS Amarendranagar OP 3. Melaghar PS Taibandal OP 4. Champahour PS No Out Post
Selection of Police Station under Dhalai District:
Sl. No. Name of the Police Stations
1. Dhumacherra PS 2. Gandacherra PS 3. Kachucherra PS
** No Out Post under Dhalai District
Selection of TSR Bn:
Sl. No. Name of the selected TSR BN
1. Commandant 5th BN TSR, Daluma, Amarpur 2. Commandant 7th BN TSR, Jumpuijala 3. Commandant 8th BN TSR, Lalcherra, Dhalai

Appendices
Audit Report for the year 2012-13, Government of Tripura 239
Appendix 5.2
Details of savings against revised budget estimates during 2008-09 to 2012-13
{Reference: Paragraph No. 5.3.7.1(i)}
(` in lakh)
Sl. No.
Item of Expenditure
Proposal sent for Budget
Estimate
Budget Allotted
Proposal sent for Revised Estimate
Revised Budget Allotted
Expenditure Incurred Savings Percentage
of savings
Year 2008-09 1. Office expenses 140 157.2 174.12 194.32 181.45 12.87 7 2. Rent Rates and
Taxes 4.4 4.4 5 5 3.29 1.71 34
3. Piublication 1 1.25 1.27 2.75 1.84 0.91 33 4. Purchase of new
vehicles 490 490 1198.22 1198.22 1135.12 63.10 5
5. Cost of fuel etc and maintanance cost of vehicles
180 185 150 157.37 149.65 7.72 5
6. Hiring charges of vehicles
500 503 263 751.72 329.79 421.93 56
7. Other Administrative expenses
15 9.7 20.49 20.34 14.35 5.99 29
8. Supplies and materials
300 313 179.97 203.52 198.88 4.64 2
9. P.O.L. 1400 1402 1416.69 1420.64 1369.31 51.33 4 10. Clothing and
tentage 300 300 479.4 479.4 479.27 0.13 0
11. Minor works 693.6 1141.15 703.37 1002.14 498.31 503.83 50 Total: 4024 4506.7 4591.5 5435.42 4361.26 1074.16 20
Year 2009-10 1. TA 1030.35 1030.35 1027.35 1035.85 1024.41 11.44 1 2. Purchase of new
vehicles 937 667 709.4 709.4 558.41 150.99 21
3. Hiring charges of vehicles
355 355 235.12 240.12 234.85 5.27 2
4. Supplies and materials
200.57 200.57 466.17 470.67 462.09 8.58 2
5. Clothing and tentage
500 500 613.8 613.8 613.76 0.04 0
6. Minor works 1285.08 1285.08 929.64 1436.89 662.09 774.80 54 Total: 4308 4038 3981.48 4506.73 3555.61 951.12 21
Year 2010-11 1. Wages 707.88 709.58 714.95 714.95 699.56 15.39 2 2. Cost of fuel etc
and maintanance cost of vehicles
179.2 186 93.11 96.63 93.08 3.55 4
3. Hiring charges of vehicles
140 145 186.47 140.03 136.50 3.53 3
4. Supplies and materials
300 204.5 324.21 214.29 306.41 -92.12 -43

Appendices
Audit Report for the year 2012-13, Government of Tripura
240
Appendix 5.2 (concld.)
Details of savings against revised budget estimates during 2008-09 to 2012-13
{Reference: Paragraph No. 5.3.7.1(i)}
(` in lakh)
Sl. No.
Item of Expenditure
Proposal sent for Budget
Estimate
Budget Allotted
Proposal sent for Revised Estimate
Revised Budget Allotted
Expenditure Incurred Savings
Percentage of
savings
5. P.O.L. 1262 1267 1490.54 1385.54 1385.53 0.01 0 6. Clothing and
tentage 200 348 130 270 269.79 0.21 0
7. Minor works 475 715.6 570 698.81 431.60 267.21 38 Total: 3264.08 3575.68 3509.28 3520.25 3322.47 197.78 6
Year 2011-12 1. Wages 796 750.7 750 750.7 698.49 52.21 7 2. TA 1865.5 240 973.2 973.2 945.99 27.21 3 3. Cost of fuel etc
and maintanance cost of vehicles
142 100 143.14 143.14 138.50 4.64 3
4. Hiring charges of vehicles
100 100 135 105 108.03 -3.03 -3
5. Supplies and materials
450 247 156.7 244.5 245.59 -1.09 0
6. Cost of Ration, Medicine, Bedding etc
40 22.25 24.93 27.04 25.27 1.77 7
7. P.O.L. 262 1300 1670 1670 1666.18 3.82 0 8. Minor works 400 3456 527.27 657.4 651.84 5.56 1
Total: 4055.5 6215.95 4380.24 4570.98 4479.89 91.09 2 Year 2012-13
1. Wages 750 750 797.53 770 715.89 54.11 7 2. Hiring charges of
vehicles 80 80 215 519.5 470.57 48.93 9
3. Supplies and materials
206.54 206.54 485.45 513.32 504.57 8.75 2
4. Clothing and tentage
100 124 199.47 319.47 319.05 0.42 0
5. Minor works 228.56 278.56 229.19 625.71 361.52 264.19 42
Total: 1365.1 1439.1 1926.64 2748 2371.60 376.40 14

Appendices
Audit Report for the year 2012-13, Government of Tripura 241
Appendix 5.3
Statement showing expenditure incurred in March vis-a-vis total expenditure under Non-salary during 2008-13
{Reference: Paragraph No. 5.3.7.1(ii)} (` in lakh)
Name of the unit
2008-09 2009-10 2010-11 2011-12 2012-13
Exp
endi
ture
in
Mar
ch
Tot
al e
xpen
ditu
re
Perc
enta
ge o
f M
arch
exp
endi
ture
to
tota
l exp
endi
ture
Exp
endi
ture
in
Mar
ch
Tot
al e
xpen
ditu
re
Perc
enta
ge o
f M
arch
exp
endi
ture
to
tota
l exp
endi
ture
Exp
endi
ture
in
Mar
ch
Tot
al e
xpen
ditu
re
Perc
enta
ge o
f M
arch
exp
endi
ture
to
tota
l exp
endi
ture
Exp
endi
ture
in
Mar
ch
Tot
al e
xpen
ditu
re
Perc
enta
ge o
f M
arch
exp
endi
ture
to
tota
l exp
endi
ture
Exp
endi
ture
in
Mar
ch
Exp
endi
ture
in
Mar
ch
Perc
enta
ge o
f M
arch
exp
endi
ture
to
tota
l exp
endi
ture
PHQ 0.62 4.56 13.60 2.5 7.21 34.67 2.04 8.26 24.70 5.98 7.3 81.92 3.6 13.18 27.31
SP WEST 1.42 4.51 31.49 1.45 5.7 25.44 0.46 2.7 17.04 1.45 3.14 46.18 1.47 3.22 45.65
SP (Khowai) - - - - - - - - - - - - 0.30 0.80 37.50
SP (Sepahijala) - - - - - - - - - - - - 0.28 0.37 75.68
SP (Dhalai) 0.37 1.28 28.91 0.48 2.07 23.19 0.56 1.40 40.00 0.71 1.58 44.94 0.80 2.00 40.00
SP COMM 0.77 2.36 32.63 1.05 2.73 38.46 0.16 1.82 8.79 0.78 1.29 60.47 0.13 1.93 6.74
SP CID 0.05 0.22 22.73 3.9 4.37 89.24 0.78 1.16 67.24 0.41 0.84 48.81 0.02 0.35 5.71
SP (Procurement ) 0.09 4.91 1.83 0.1 5.9 1.69 0.2 1.18 16.95 0.63 2.22 28.38 1.37 4.95 27.68
TSR 2nd Bn 0.40 1.06 38.00 0.19 1.19 16.00 0.02 0.46 4.00 0.07 0.37 18.00 0.17 0.79 21.00
TSR 3rd Bn 2.82 7.81 36.11 21.17 141.8 14.93 6.64 61.56 10.79 26.83 84.14 31.89 47.22 124.81 37.83
TSR 5TH Bn 42.71 111.8 38.22 16.63 123.4 13.48 2.29 69.68 3.29 62.83 145.77 43.10 52.13 139 37.50
TSR 7th Bn 0.36 0.9 40.00 0.33 1.2 27.50 0.18 0.62 29.03 0.18 0.73 24.66 0.33 1.46 22.60
TSR 8th Bn 0.38 1.02 37.25 0.57 1.29 44.19 0.19 0.67 28.36 0.27 1.42 19.01 1.43 2.72 52.57 Source: Departmental records.

Appendices
Audit Report for the year 2012-13, Government of Tripura
242
Appendix 5.4
Statement showing differences of closing balances as per Cash Book and Bank statement
{Reference: Paragraph No. 5.3.7.1(iii) & (iv)}
(In `)
Sl. No. Name of Unit Closing Balance
as per cash book Closing Balance as per bank statement Difference
1. Director General of Police 29937840 30012690 74850
2. S.P. Sepahijala 864964 4652413 3787449
3. S. P. West 10942232 13585275 2643043
4. S.P. Dhalai 9858355 11283552 1425197
5. S.P. Khowai 95430 4058253 3962823
6. S.P. CID 890004 1379746 489742
7. S.P. Procurement 751504 52662857 51911353
8. S.P. Traffic 23987 831262 807275
9. S.P. Communication 0 5900 5900
10. Comndt. 2nd BN TSR 6412960 6412960 0
11. Comndt. 3rd BN TSR 168622 2578834 2410212
12. Comndt. 5th BN TSR 4458338 4458338 0
13. Comndt. 7th BN TSR 0 0 0
14. Comndt. 8th BN TSR 11860 12243280 12231420
15. Director. Forensic Science Laboratory 5762937 5767576 4639
16. Principal, Police Training Academy 16477 9609504 9593027
Total: 7,01,95,510 15,95,42,440 8,93,46,930

Appendices
Audit Report for the year 2012-13, Government of Tripura 243
Appendix 5.5
Statement showing the organisation-wise position of outstanding deployment cost of Police Personnel upto May 2013
{Reference: Paragraph No. 5.3.7.1(vi)}
Sl. No.
Name of the Police establishment to
whom due
Name of the Organisation from whom due Period of claim Amount outstanding
(in `)
1 S P West
BSNL, Agartala April 02 to April 11 1348496 SIB, Agartala January 13 to February 13 252532 AG, Tripura, Agartala January 13 to May 13 418340 DDK, Agartala March 13 to May 13 396672 AIR, Agartala September 12 to May 13 2708967 ONGC, Agartala May 11 to March, 12 &
January 13 to April 13 10407943
Transport Department December 11 to May 13 3216116 BSNL, Mohanbari October 05 to April 12 9458995 SBI, Melarmath Branch February 10 to May 13 1579594 Central Bank of India, Khosh Bagan, Agartala
September 03 to September 12 & March 13 to May 13
3722470
UBI, Khowai Branch September 03 to April 12 7940633 UBI, Sonamura Branch September 03 to April 12 8320874
Sub-Total 49771632
2 SP Dhalai
Airports Authority of India,(AAI),Kamalpur
November 06 to March 13 288720
AIR, Longtharai January 10 to March 13 4875308 S K Bari Microwave Station &Telephone Babhwan, Ambassa
April 95 to November 11 25485267
Sub-Total 30649295
3 SP South All India Radio January 12 to February 13 420444 Sub-Total 420444
4 SP Unakoti
AIR, Kailashahar September 11 & January 13 to June 13
1348427
AAI, Kailashahar March 08 to June 13 1219788 Microwave Sub-station, Sermuntilla
May 05 to October 11 13475383
Sub-Total 16043598
5 Commandant, SAF BSNL, Badharghat. April 99 to December 10 7317219 BSNL, North Gate April 99 to December 10 7618618
Sub-Total 14935837
6
Commandant, Home Guard, Tripura
AlR, Agartala December 12 to May 13 272825 BSNL October 12 to May 13 169400 DMN T/tore November 12 to January 13 48300 Air India January 13 to May 13 135135 Air India October 11 9175
AIR, Kailashahar March 11 to March 12 72650 AAI, Khowai April 11 to May 13 508825

Appendices
Audit Report for the year 2012-13, Government of Tripura
244
Appendix 5.5 (Contd..)
Statement showing the organisation-wise position of outstanding deployment cost of Police Personnel upto May 2013
{Reference: Paragraph No. 5.3.7.1(vi)}
Sl. No.
Name of the Police establishment to
whom due
Name of the Organisation from whom due Period of claim Amount outstanding
(in `)
AlR, Natun Bazar September 11 to May 13 164100 AlR, Udaipur August 12 to May 13 156025 DDK Agartala 124950
Sub-Total 1661385
7
Commandant, 1st Bn. TSR
ONGC, Tripura March 09 to June 09 & May 13 3037968
GAIL India Pvt. Ltd. February 13 to May 13 902951 Jubilant Oil & Gas Pvt. Ltd. September, October &
December 12 & March 13 68549 HLS Asia Ltd. Tripura May 12 to February 13 49077 Sub-Total 4058545
8
Commandant, 2nd Bn. TSR
ONGC, Tripura June 12 135738
GAIL India Pvt. Ltd. December 03 to April 05 1232469 Total 1368207
9 Commandant, 6th Bn. TSR
Jubilant Oil & Gas Pvt. Ltd. November 12 to February 13 1516022
Sub-Total 1516022
10 Commandant, 7th Bn. TSR
Jubilant Oil & Gas Pvt. Ltd. December 12 & January 13 789399
Sub-Total 789399
11 Commandant, 9th Bn. TSR
Jubilant Oil & Gas Pvt. Ltd. January 2012 to February 2013 2328552
Sub-Total 2328552
12 Commandant, 10th Bn. TSR
ONGC Ltd. Agartala January, April & May 2013 66842827
Sub-Total 66842827
13 Commandant, 11th Bn. TSR
OTPC, Palatana October 11 to January 13 5485579
Sub-Total 5485579
14 SP, Unakoti UBI, Kailashahar September 03 to March 10 &
January 11 to June 13 10838295
Sub-Total 10838295
15
Commandant, SAF SBI, Melarmath Branch, Agartala
January 03 to June 13 12327187
State Bank of India, TLA Branch, Agartala
January 03 to June 13 7681072
UBI, HGB Road Agartala January 03 to June 13 6688185 UCO Bank of India, HGB
Road, Agartala January 03 to June 13 5050480
Tripura Gramin Bank(TGB), Bordowali, Agartala
October 10 to June 13 3364974
Sub-Total 35111898

Appendices
Audit Report for the year 2012-13, Government of Tripura 245
Appendix 5.5 (Concld.)
Statement showing the organisation-wise position of outstanding deployment cost of Police Personnel upto May 2013
{Reference: Paragraph No. 5.3.7.1 (vi)}
Sl. No.
Name of the Police establishment to
whom due
Name of the Organisation from whom due Period of claim Amount outstanding
(in `)
16
SP ( Dhalai ) UBI, Kamalpur Branch September 03 to December 12 & April 13 to July 13
8059539
UBI, Ambassa Branch September 03 to December 12 & April 13 to July 13
7381083
UBI, Manu Branch September 03 to December 12 & April 13 to July 13
7392727
Sub-Total 22833349
17
SP ( South ) UBI, Sabroom Branch September 03 to June 13 8853670
UBI, Belonia Branch September 03 to June 13 8853670
Sub-Total 17707340
18
SP ( Gomati) SBI, Udaipur. September 03 to June 13 5556908 UBI, Udaipur Branch September 03 to June 13 7661578 UBI, Amarpur Branch September 03 to June 13 7661578 Sub-Total 20880064
19 SP (North ) SBI, Dharmanagar Branch September 03 to September 12 7494847 Sub-Total 7494847 Grand Total 310737115
Source: Departmental records.

Appendices
Audit Report for the year 2012-13, Government of Tripura
246
Appendix 5.6
Statement showing items reported as procured under MoPF but in reality not procured till September 2013
{Reference: Paragraph No. 5.3.7.2(ii)}
(` in lakh) Item Year Quantity Cost
CC TV 2010-11 02 50.000 15 KVA Generator (against Jammer) 2010-11 08 24.960 Poly Carbonate Anti Riot Shield (against Jammer) 2010-11 400 15.342 Poly Carbonate Antiriot Helmet (against Jammer) 2010-11 510 Body protector (against Jammer) 2010-11 102 31.698 Mega Ray 2009-10 06 45.000 Tyre Retreading Machine 2009-10 07 52.500
Total: 219.500 Source: Departmental records.