
MReadings: MR in RT
40
Not for distribution in the US Page 4 Editorial Comment Caroline Chung Page 6 MRI for Target Delineation in RT – an Overview of Treatment Indications Florian Putz, et al. Page 14 MRI in Radiosurgery for Trigeminal Neuralgia Krzysztof Ślosarek, et al. Page 18 Clinical Implementation and Evaluation of MR-only RT Planning for Brain Tumors David Roberge and Jean-Charles Côté Page 24 Clinical Implementation of MR-guided RT for Prostate Cancer in the Halcyon-System Mandy Zimmermann, et al. Page 33 A Fully Automated, End-to-End Prostate MRI Workflow Solution Incorporating Dot, Ultrashort Biparametric Imaging and Deep-Learning-based Detection, Classification, and Reporting David J. Winkel, et al. MReadings: MR in RT 6 th Edition ESTRO 2020 siemens.com/magnetom-world-rt CT T1w MPRAGE T2w CISS
-
Upload
khangminh22 -
Category
Documents
-
view
1 -
download
0
Transcript of MReadings: MR in RT

Not f
or d
istrib
utio
n in
the
US
Page 4Editorial CommentCaroline Chung
Page 6MRI for Target Delineation in RT – an Overview of Treatment IndicationsFlorian Putz, et al.
Page 14MRI in Radiosurgery for Trigeminal NeuralgiaKrzysztof Ślosarek, et al.
Page 18Clinical Implementation and Evaluation of MR-only RT Planning for Brain TumorsDavid Roberge and Jean-Charles Côté
Page 24Clinical Implementation of MR-guided RT for Prostate Cancer in the Halcyon-SystemMandy Zimmermann, et al.
Page 33A Fully Automated, End-to-End Prostate MRI Workflow Solution Incorporating Dot, Ultrashort Biparametric Imaging and Deep-Learning-based Detection, Classification, and ReportingDavid J. Winkel, et al.
MReadings: MR in RT6th Edition ESTRO 2020 siemens.com/magnetom-world-rt
CT
T1w MPRAGE
T2w CISS

Note in accordance with § 33 Para.1 of the German Federal Data Protection Law: Despatch is made using an address file which is maintained with the aid of an automated data processing system.
MAGNETOM Flash is sent free of charge to Siemens Healthineers MR customers, qualified physicians, technologists, physicists and radiology departments throughout the world. It includes reports in the English language on magnetic resonance: diagnostic and therapeutic methods and their application as well as results and experience gained with corresponding systems and solutions. It introduces from case to case new principles and procedures and discusses their clinical potential. The statements and views of the authors in the individual contributions do not necessarily reflect the opinion of the publisher.
The information presented in these articles and case reports is for illustration only and is not intended to be relied upon by the reader for instruction as to the practice of medicine. Any health care practitioner reading this information is reminded that they must use their own learning, training and expertise in dealing with their individual patients. This material does not substitute for that duty and is not intended by Siemens Healthcare to be used for any purpose in that regard. The drugs and doses mentioned herein are consistent with the approval labeling for uses and/or indications of the drug. The treating physician bears the sole responsibility for the diagnosis and treatment of patients, including drugs and doses prescribed in connection with such use. The Operating Instructions must always be strictly followed when operating the MR system. The sources for the technical data are the corresponding data sheets. Results may vary.
Partial reproduction in printed form of individual contributions is permitted, provided the customary bibliographical data such as author’s name and title of the contribution as well as year, issue number and pages of MAGNETOM Flash are named, but the editors request that two copies be sent to them. The written consent of the authors and publisher is required for the complete reprinting of an article.
We welcome your questions and comments about the editorial content of MAGNETOM Flash. Please contact us at [email protected]
Manuscripts as well as suggestions, proposals and information are always welcome; they are carefully examined and submitted to the editorial board for attention. MAGNETOM Flash is not responsible for loss, damage, or any other injury to unsolicited manuscripts or other materials. We reserve the right to edit for clarity, accuracy, and space. Include your name, address, and phone number and send to the editors, address above.
The entire editorial staff at MD Anderson Cancer Center and at Siemens Healthineers extends their appreciation to all the radiation oncologists, radiologists, technologists, physicists, experts, and scholars who donate their time and energy – without payment – in order to share their expertise with the readers of MAGNETOM Flash and the MReadings.
MAGNETOM Flash – Imprint
© 2020 by Siemens Healthcare GmbH, All Rights Reserved
Publisher: Siemens Healthcare GmbH Magnetic Resonance, Karl-Schall-Str. 6, D-91052 Erlangen, Germany
Editor-in-chief: Antje Hellwich ([email protected])
Guest Editor: Caroline Chung, MD MSc FRCPCAssociate Professor, Radiation Oncology & Diagnostic ImagingDirector of Imaging Technology & Innovation, Radiation OncologyThe University of Texas MD Anderson Cancer Center, Houston, Texas, USA
Editorial Board: Rebecca Ramb, Ph.D.; Sunil Kumar S. L., Ph.D.; Wellesley Were; Nadine Leclair, M.D.; Jane Kilkenny
Review Board: Nuria Escobar Corral, Ph.D.; Elena Nioutsikou, Ph.D.; Matthias Drobnitzky, Ph.D.; Daniel Fischer; Glen Roberts
Copy Editing: Sheila Regan, Jen Metcalf, UNIWORKS, www.uni-works.org (with special thanks to Kylie Martin)
Layout: Agentur Baumgärtner, Friedrichstr. 4, D-90762 Fürth, Germany
Production: Norbert Moser, Siemens Healthcare GmbH
Printer: G. Peschke Druckerei GmbH, Taxetstr. 4, D-85599 Parsdorf b. Munich, Germany
MReadings: MR in RT is also available online:
www.siemens.com/magnetom-world-rt2 siemens.com/magnetom-world-rt
MReadings: MR in RTImprint

sCT CT
Editorial Comment
4 Advancing MR to Fulfil its Role in Oncology: Time to Finish the Pivot from Adjunctive to Essential
Caroline Chung The University of Texas MD Anderson Cancer Center, Houston, TX, USA
Radiation Therapy
6 MRI for Target Delineation in Radiotherapy – an Overview of Treatment Indications
Florian Putz, et al.Friedrich-Alexander-University Erlangen-Nuremberg, Erlangen, Germany
14 MR Imaging in Radiosurgery for Trigeminal Neuralgia
Krzysztof Ślosarek, et al.Maria Sklodowska-Curie National Research Institute of Oncology, Gliwice, Poland
18 Clinical Implementation and Evaluation of MR-only Radiotherapy Planning for Brain Tumors
David Roberge and Jean-Charles CôtéCentre Hospitalier de l’Université de Montréal, Montreal, Canada
24 Clinical Implementation of MR-guided Radiotherapy for Prostate Cancer in Halcyon-System
Mandy Zimmermann, et al.Radiologische Allianz, Strahlentherapie, Hamburg, Germany
AI in MR
33 A Fully Automated, End-to-End Prostate MRI Workflow Solution Incorporating Dot, Ultrashort Biparametric Imaging and Deep- Learning-based Detection, Classification, and Reporting1
David J. Winkel, et al.Department of Radiology, University Hospital Basel, Switzerland
Meet Siemens Healthineers
39 Introducing Nuria Escobar CorralClinical and scientific specialist in imaging for radiotherapy Siemens Healthineers, Forchheim, Germany
MR-only radiotherapy planning for brain tumorsAdvantages of acquiring the planning MRI in treatment position
186
1 Work in progress: the application is currently under development and is not for sale in the U.S. and in other countries. Its future availability cannot be ensured.
3siemens.com/magnetom-world-rt
MReadings: MR in RT Contents

Dr. Caroline Chung completed her undergraduate studies in biochemistry – molecular biology and genetics at the University of British Columbia (UBC) in Vancouver, Canada, in 1999 and continued at UBC to complete her medical degree and Radiation Oncology residency in 2008. She then completed a two year Research Fellowship in Radiation Oncology at the Princess Margaret Cancer Centre in Toronto, Canada, concurrently with a thesis M.Sc. at the University of Toronto’s Institute of Medical Sciences and Royal College of Physicians and Surgeons of Canada Clinician Investigator Program at the University of British Columbia in 2011. Dr. Chung was then recruited to practice as a Clinician-Scientist in the Radiation Medicine Program of the Princess Margaret where she held the rank of Assistant Professor in the Department of Radiation Oncology at the University of Toronto and she was co-lead of the Brain Metastasis Clinic and Program at Princess Margaret Cancer Centre. In 2016, she was recruited to the MD Anderson Cancer Center in Houston, Texas, USA, to be the Director of the Advanced Imaging Strategic Initiative within the Division of Radiation Oncology with cross- appointment to Division of Diagnostic Imaging. She is currently an Associate Professor and the Director of Imaging Technology and Innovation within the Division of Radiation Oncology. In addition to running her own computational laboratory in oncological imaging research, as Director of Magnetic Resonance (MR) Research she leads collaborative research studies of MR-guided radiotherapy including the use of MR for target delineation, real-time MR image guidance
Advancing MR to Fulfil its Role in Oncology: Time to Finish the Pivot from Adjunctive to EssentialDear readers and colleagues,Cancer care has been transformed by the development of three-dimensional imaging techniques since their emergence into clinical care in the 1970s and 80s. Early computed tomography (CT) and magnetic resonance (MR) imaging systems provided soft-tissue visualization of both tumor and normal anatomy to provide oncologists with insights of the distribution and overall burden of disease that have advanced our ability to stage and prognosticate cancer since the first American Joint Committee Manual for Staging of Cancer in 1977 [1]. In those early days, imaging studies provided insights that were largely treated as quali-tative, adjunctive information, which when combined with the clinical exam, would enhance clinical decision-making.
The role of imaging data in oncological clinical care has evolved dramatically in recent years where imaging has transitioned from its adjunctive role to become a clini-cian-directed measurement tool for prognostication and response assessment, as well as a tool for directly guiding intervention. MR imaging, in particular, has advanced at an astounding pace with improvements in image quality and new capabilities to interrogate tissue microstructure, physiology and metabolism, generating more mechanism- oriented measures that could be integrated into clinical decision-making for precision medicine approaches. However, while the imaging systems have advanced, the persistent qualitative nature in the use and interpretation of medical imaging has to-date prohibited utilizing the full potential of the rich multiparametric and multimodal imaging data in the guidance of cancer care.
Complementary to the advances in imaging technology itself, the rapidly growing computing power and prevalence of artificial intelligence (AI) in the world around us has certainly introduced new opportunities and challenges in medicine and particularly in the field of radiology. There are promising strides in utilizing AI to improve image quality, accelerate image acquisition and image reconstruction, as well as assist with image interpretation. One question that has arisen amidst the enthusiasm for AI applications in medical imaging is whether the requirements of imaging data are different in the adjunctive paradigm used by humans than numerical algorithms and whether the quali-tative approach to imaging information in current practice will suffice in the era of human-machine hybrid medical care.
In order to fully address these evolving requirements and applications of imaging data, the community needs to make a conscious pivot from treating MR imaging data as a qualitative assessment tool when in actuality clinicians and the evolving technology around us are pushing its use as a quantitative measurement tool. This pivot requires critical steps that address the consistency and quality of imaging data at the time of imaging acquisition, post-processing and analysis, as well as changes in human behavior.
A dedicated effort is being led by groups including the Radiological Society of North America Quantitative Imaging Biomarker Alliance, which has broadly engaged institutions globally and partnered with industry to facilitate this transi-tion of imaging from pictures to quantitative measurement. Through growing knowledge dissemination, clinical trial investigators have come to appreciate the impact of variable image acquisition on robust response assessment.
Work in progress: the application is currently under development and is not for sale in the U.S. and in other countries. Its future availability cannot be ensured.
4 siemens.com/magnetom-world-rt
MReadings: MR in RTEditorial

Recently, members of collaborative clinical trial groups with the endorsement of the U.S. Food and Drug Adminis-tration (FDA) and National Cancer Institution (NCI) have established standardized MR acquisition protocols for pri-mary and secondary brain tumors [2–4]. While establishing consensus for standardized image acquisition protocols are a first step, clinical adoption of these standardized pro-tocols remains a challenge and along with this, the quality assessment metrics of MR imaging data need to be estab-lished for truly impactful implementation of quantitative MR imaging. Beyond the image acquisition, quantitative image interpretation also relies on standardized and trans-parent post-processing and analysis of imaging data with a quantitative approach, as fostered by groups such as the Quantitative Imaging Network [5–7]. Ideally, these aca-demic collaborative efforts will include close industry engagement that will lead to the development of tools that enable broad deployment of quantitative MR implemen- tation across varying clinical environments from large aca-demic centers to community-based settings.
As highlighted in this edition of MReadings, the clinical research community is working aggressively to make the pivot and learn how to utilize the full and immense power of MR to quantitatively characterize and target tumors and tissues to improve radiotherapy delivery, as well as assess and adapt to early response to treatment. This transition will not only maximize the benefit of the ever-improving MR information to clinical decision-making, it will release the full power of multiparametric MR to characterize tissues for its use in biological targeting of tumor and biologically relevant radiation dosing of tumor subregions while limiting radiation-associated toxicity to the surrounding normal tissues – realizing personalized MR-guided radiotherapy.
References
1 Carr DT. The manual for the staging of cancer. Ann Intern Med. 1977;87(4):491-2. Epub 1977/10/01. doi: 10.7326/0003-4819-87-4-491. PubMed PMID: 907249.
2 Ellingson BM, Bendszus M, Boxerman J, Barboriak D, Erickson BJ, Smits M, Nelson SJ, Gerstner E, Alexander B, Goldmacher G, Wick W, Vogelbaum M, Weller M, Galanis E, Kalpathy-Cramer J, Shankar L, Jacobs P, Pope WB, Yang D, Chung C, Knopp MV, Cha S, van den Bent MJ, Chang S, Yung WK, Cloughesy TF, Wen PY, Gilbert MR, Jumpstarting Brain Tumor Drug Development Coalition Imaging Standardization Steering C. Consensus recommendations for a standardized Brain Tumor Imaging Protocol in clinical trials. Neuro Oncol. 2015;17(9):1188-98. Epub 2015/08/08. doi: 10.1093/neuonc/nov095. PubMed PMID: 26250565; PMCID: PMC4588759.
3 Goldmacher GV, Ellingson BM, Boxerman J, Barboriak D, Pope WB, Gilbert M. Standardized Brain Tumor Imaging Protocol for Clinical Trials. AJNR Am J Neuroradiol. 2015;36(10):E65-6. Epub 2015/09/12. doi: 10.3174/ajnr.A4544. PubMed PMID: 26359146.
4 Kaufmann TJ, Smits M, Boxerman J, Huang R, Barboriak DP, Weller M, Chung C, Tsien C, Brown PD, Shankar L, Galanis E, Gerstner E, van den Bent MJ, Burns TC, Parney IF, Dunn G, Brastianos PK, Lin NU, Wen PY, Ellingson BM. Consensus recommendations for a standard- ized brain tumor imaging protocol for clinical trials in brain metastases (BTIP-BM). Neuro Oncol. 2020. Epub 2020/02/13. doi: 10.1093/neuonc/noaa030. PubMed PMID: 32048719.
5 Press RH, Shu HG, Shim H, Mountz JM, Kurland BF, Wahl RL, Jones EF, Hylton NM, Gerstner ER, Nordstrom RJ, Henderson L, Kurdziel KA, Vikram B, Jacobs MA, Holdhoff M, Taylor E, Jaffray DA, Schwartz LH, Mankoff DA, Kinahan PE, Linden HM, Lambin P, Dilling TJ, Rubin DL, Hadjiiski L, Buatti JM. The Use of Quantitative Imaging in Radiation Oncology: A Quantitative Imaging Network (QIN) Perspective. Int J Radiat Oncol Biol Phys. 2018;102(4):1219-35. Epub 2018/07/04. doi: 10.1016/j.ijrobp.2018.06.023. PubMed PMID: 29966725; PMCID: PMC6348006.
6 Nordstrom RJ. The Quantitative Imaging Network in Precision Medicine. Tomography. 2016;2(4):239-41. Epub 2017/01/14. doi: 10.18383/j.tom.2016.00190. PubMed PMID: 28083563; PMCID: PMC5224526.
7 Clarke LP, Nordstrom RJ, Zhang H, Tandon P, Zhang Y, Redmond G, Farahani K, Kelloff G, Henderson L, Shankar L, Deye J, Capala J, Jacobs P. The Quantitative Imaging Network: NCI's Historical Perspective and Planned Goals. Transl Oncol. 2014;7(1):1-4. Epub 2014/04/29. doi: 10.1593/tlo.13832. PubMed PMID: 24772201; PMCID: PMC3998696.
of radiation delivery and imaging biomarkers of response. Her major research focus is in the utilization of advanced imaging to measure and predict response and toxicity to treatment. In her career, she has published over 90 articles in peer-reviewed journals and has been highly successful in securing peer-reviewed funding for both clinical trials and translational research. Her efforts extend from preclinical investigations of imaging response biomarkers utilizing multi-parametric MR imaging for conformal radiotherapy and anti-angiogenic therapy thru to translational research of imaging biomarkers in clinical trials for patients treated with SRS with and without anti-angiogenic therapy for brain metastases. She is a principal investigator in an NCI-supported randomized trial of bevacizumab vs. corticosteroids for brain radionecrosis that incorporated advanced MR for both trial eligibility and early response assessment. More recently, she has established collaborative projects with NASA to investigate imaging and fluid-based biomarkers of radiation injury to the heart and brain. Dr. Chung has also made significant contributions to the field through her work on standardization in medical imaging. She is co-chair of the Dynamic Contrast Enhanced-MRI Committee for the Radiological Society of North America Quantitative Imaging Biomarker Alliance, a member of the Jumpstarting Brain Tumor Drug Development Coalition’s Imaging Standardization Steering Committee, Co-Chair of the Neuro-imaging Subcommittee in the Neuro-Oncology Committee of the Alliance for Clinical Trials in Oncology and has taken leadership in the development of quantitative imaging initiatives both in Toronto and Houston. She is active in the Radiation Oncology and Diagnostic Radiology communities in her dedicated efforts to advance the role of quantitative imaging and technology in cancer care, to develop gender diversity in leadership, and for her passion in supporting and supervising young talent.
Caroline Chung, MD MSc FRCPCAssociate Professor, Radiation Oncology & Diagnostic ImagingDirector of Imaging Technology & Innovation, Radiation OncologyThe University of Texas MD Anderson Cancer Center
5siemens.com/magnetom-world-rt
MReadings: MR in RT Editorial

MRI for Target Delineation in Radiotherapy – an Overview of Treatment IndicationsFlorian Putz, M.D.1; Thomas Weissmann, M.D.1; Veit Mengling, M.Sc.1; Rosalind Perrin, Ph.D.1; Siti Masitho, M.Sc.1; Johannes Rösch, M.D.1; Manuel Alexander Schmidt, M.D.3; Michael Uder, M.D.2; Rainer Fietkau, M.D.1; Christoph Bert, Ph.D.1
1Department of Radiation Oncology, Friedrich-Alexander-University Erlangen-Nuremberg, Erlangen, Germany 2Institute of Radiology, Friedrich-Alexander-University Erlangen-Nuremberg, Erlangen, Germany 3 Department of Neuroradiology, Friedrich-Alexander-University Erlangen-Nuremberg, Erlangen, Germany
AbstractImaging used for target delineation and treatment planning plays a critical role for treatment success in radiotherapy. Due to its superior soft tissue contrast, MRI is essential for many radiotherapy treatment cases. In the present article, we summarize and discuss the role of MRI for the most relevant radiotherapy treatment indications.
IntroductionRadiotherapy has different demands on MR imaging than diagnostic radiology. In routine radiologic imaging, de-pending on the site and patient history, imaging primarily needs to be able to detect previously unknown pathologies and provide information on differential diagnosis while the accurate depiction of the true three-dimensional extension of tumors is of less importance. In contrast, MRI for radio-therapy planning primarily needs to accurately and clearly depict the tumor perimeter in three-dimensional space for precise gross tumor volume (GTV) delineation.
Different radiotherapy treatment indications and sites also may have specific demands on MR sequences and tissue contrasts. Frequently target delineation for treatment planning is based on contrast-enhanced T1 sequences. However, usually multiple tissue contrasts and sequences are integrated when creating target volumes for radiotherapy.
Magnetic resonance imaging is routinely required for treatment planning in many indications in radio-oncology [1]. In the present article we summarize the role of MRI for the most relevant radiotherapy treatment indications and discuss the varying specific requirements each treatment site puts on MR imaging.
Intracranial radiotherapyOne of the most important areas for MR imaging in radio-therapy are intracranial treatment indications. Intracranial targets, especially when small in size or low-enhancing, usually are not visualized on CT at all, rendering MR imaging critical for treatment planning. At the same time intracranial diseases are one of the most important indications for radiotherapy. Irradiation can be delivered very accurately to intracranial targets, as the skull can be positioned with submillimeter accuracy using thermoplastic mask immobilization and X-ray-based imaging during treatment delivery [2]. The high overall accuracy of intracranial radiotherapy enables precise target volumes and high radiotherapy doses with minimal impair-ment of normal tissues. This leads to high treatment efficacy and low or minimal side effects in a variety of malignant intracranial tumors like brain metastases, benign tumors like vestibular schwannoma and functional disorders like trigeminal neuralgia. In these diseases the requirements for geometric accuracy in MR imaging are particularly demanding, as commonly used margins of ≤ 1 mm do not account for additional MR imaging- related uncertainties [2, 3].
Another group of frequent intracranial treatment indications are gliomas, which are more difficult to treat as they are usually larger in size and show diffuse infiltration in the surrounding brain tissue, thus rendering precise delivery of high irradiation doses to all tumor cells is impossible without impairing normal brain tissue. In these tumors improved MR imaging could help with precise tumor delineation or potentially identifying candidate regions for dose-escalation and -sparing.
The concepts and information presented in this paper are based on research and are not commercially available.
6
Radiation Therapy
siemens.com/magnetom-world-rt
MReadings: MR in RT

Brain metastasesWhen being referred to treatment today, brain metastases are usually small (mostly < 1 cm diameter) solitary or multiple spherical lesions, which are best visualized in post-contrast T1 sequences. They show no or minimal infiltration into the surrounding brain tissue [4] and thus are usually irradiated with an isotropic uncertainty margin of less than 2 mm [2]. Due to the small size high-resolution isotropic 3D sequences are usually best-suited as they enable accurate multiplanar reconstruction and minimize partial volume effects [5, 6].
Inversion-recovery gradient echo sequences (IR-GRE) like the T1-MPRAGE [7], have been the most commonly used 3D MR imaging technique for brain tumors and have been included in the standardized Brain Tumor Imaging Protocol (BTIP) [8, 9]. However, multiple sources suggest that a 3D-turbo-spin-echo (TSE) T1-SPACE could be superior to the frequently used T1-MPRAGE gradient-echo sequence for intracranial radiotherapy target volume delineation [8, 10-12]. While T1-SPACE provides less contrast between grey and white matter [8], this is negligible in most cases for radiotherapy treatment planning and may in fact even help with the delineation of intracranial metastases, as does the suppression of vessels in the T1-SPACE [12]. Conversely, T1-MPRAGE suffers from a known reduced enhancement if low contrast agent uptake is present, which could lead to underestima-tion of lesion boundaries [8, 13] (Fig. 1).
Additional important requirements for radiotherapy in brain metastases are the minimization of distortions from gradient-non-linearities and susceptibility effect-induced distortions [14, 15].
Due to the malignant nature of brain metastases, they have a high growth rate [16, 17] and are usually surrounded by perifocal edema [18], which may change in configuration spontaneously or when corticosteroid dosage is modified (Fig. 2) [19]. Salkeld et al. found profound changes with imaging intervals ≤ 7 days before radiosurgery. Change in management was required for 41% of patients with interval ≤ 7 days and even for 78% if the delay exceeded 7 days. The most frequent reason for replanning was an increase in tumor or resection cavity size [17, 20]. Therefore, the interval between imaging and treatment delivery should be as short as possible. While same-day imaging would be optimal, in our university medical center in Erlangen we currently have established the requirement that the interval between imaging and treatment delivery must not exceed 5 days.
In addition to pretreatment changes, brain metastases may also undergo profound changes during radiotherapy due to transient swelling, changes in perifocal edema and treatment response (Fig. 2). Hessen et al. in a recent study evaluated the significance of a repeated MRI scan in the fractionated stereotactic radiotherapy of 18 brain metastases and 20 resection cavities. For cases with in-situ brain metastases, reductions in coverage of up
1 Examples of sequences used for target delineation. (1A) T2 SPACE FLAIR (1 mm slice thickness – bottom) vs. conventional T2 FLAIR (5 mm slice thickness – top) in a patient with glioma. (1B) T1 SPACE 3D TSE sequence (right) vs. T1 MPRAGE IR GE sequence (left). Some metastases are only very faintly visible in the T1 MPRAGE (arrows). Note also: Suppression of vessels and less contrast between gray and white matter in the T1-SPACE. (1C) Isotropic T2 SPACE sequence in prostate cancer (left) with high- resolution sagittal reconstruction (right). Left inset: ADC map from diffusion-weighted imaging with reduced volume excitation (ZOOMit) showing focal diffusion restriction in the top lobe of the prostate (arrow). Right inset: Synthetic CT of the pelvis showing proper detection of air inside rectal balloon.
1B1A
1C
7
Radiation Therapy
siemens.com/magnetom-world-rt
MReadings: MR in RT

to 34.8% were found due to changes during fractionated radiotherapy [21].
This accumulating evidence for rapid tumor growth and accompanying anatomic changes in brain metastases might mean that optimal MR imaging for treatment planning needs to be performed daily. Considering the trend that more and more brain metastases are treated with stereotactic radiotherapy alone and life expectancies increase due to advances in immunotherapy and targeted agents [22], alternatives to contrast-enhanced T1 sequences might become necessary to reduce exposure to gadolinium-based contrast agents. Promising results recently have been achieved with deep learning-based prediction of synthetic contrast-enhanced T1 sequences from non-enhanced MR sequences, which could reduce cumulative gadolinium doses patients need to receive for radiotherapy [23].
There is a real potential for improving clinical out-comes with optimized MR imaging in brain metastases: In prospective clinical trials, local control rates of around 70% at 1 year post-radiotherapy have been consistently shown
for stereotactic radiotherapy alone, while control rates for stereotactic radiotherapy with adjuvant whole brain radio-therapy measured at around 90% [24]. As increasing radio-therapy dose due to additional whole-brain radiotherapy is a less likely explanation, marginal miss in stereotactic radiotherapy because of suboptimal imaging could account for a substantial part of the observed difference in local efficacy.
GliomasWhile MRI was introduced many decades ago for target volume delineation in gliomas [25–28], these tumors are more difficult to treat and improvement in outcomes for the most part has stalled in recent years. Target delineation is more challenging in gliomas than in brain metastases. High-grade gliomas usually show strong contrast- enhancement, which is the main target for radiotherapy. However, while the surrounding T2 hyperintensity in brain metastases merely represents vasogenic edema and microscopic infiltration is minimal in brain metastases [4],
13 Days
0
20
40
100
80
60
Met
asta
ses
enco
mpa
ssed
by
PTV
(%)
14 28 42 56 70Days since MRI
3 mm PTV margin2 mm PTV margin1 mm PTV margin
2B
Planning MRI Repeated MRI during treatment
2C
2 Importance of the time interval between MR imaging and treatment delivery in brain metastases. (2A) Brain metastasis increasing to 281% in volume in an interval of only 13 days. Orange: planning target volume (PTV) definition based on initial MRI would have missed 31.5% of GTV volume. (2B) Kaplan-Meier plot showing the diminishing fraction of metastases encompassed by the initial PTV volume over time for margin definitions of 1–3 mm (preliminary analysis of 85 metastases). (2C) Repeated planning MRI during fractionated stereotactic radiotherapy in a patient with brainstem metastasis. Note: Substantial reduction in tumor volume and in accompanying edema results in profound shifting of the brainstem. The radiotherapy plan was adapted based on the repeated planning MRI.
2A
8
Radiation Therapy
siemens.com/magnetom-world-rt
MReadings: MR in RT

T2 abnormalities may constitute an important or the only visible tumor portion in low-grade gliomas or IDH-mutant glioblastomas [29–31].
Additionally, aside from imaging changes, extensive microscopic tumor cell infiltration into the adjacent brain is present in gliomas with microscopic infiltration even expected to extent into the contralateral brain hemisphere [32].
To make matters worse, contrast-enhancing tumor needs to be differentiated from treatment effects due to prior surgery and radiation as well as pseudo-progression.
For visualization of contrast-enhancing tumor, 3D contrast-enhanced T1-sequences like the T1-MPRAGE and T1-SPACE are usually used. In stark contrast to the millime-ter margins employed in stereotactic radiotherapy for brain metastases, current guidelines recommend giving an isotropic margin of 2 cm around any contrast-enhancing tumor [29, 33]. Geometric accuracy therefore usually is less critical in radiotherapy for gliomas than in other intra-cranial treatment indications. The non-contrast enhancing tumor usually is delineated in 2D T2-FLAIR sequences with 3–5 mm slice thickness [34]. While current guidelines also recommend a margin of around 2 cm for T2-FLAIR hyperintensities in lower-grade gliomas, recommendations are conflicting in primary, IDH-wildtype, glioblastoma with the ESTRO recommending not considering the T2-FLAIR hyperintensity at all [29, 33].
As discussed above, thick slice 2D FLAIR sequences could lead to unnecessarily high treatment volumes in cases of small tumor volumes. Coarse depiction of non-enhancing tumor parts in conventional T2-FLAIR sequences should be of particular relevance in cases of stereotactic reirradiation, where much smaller margins are used.
We currently evaluate high-resolution 3D T2-SPACE FLAIR sequences in patients with malignant low-grade gliomas in comparison to conventional T2-FLAIR imaging. In our preliminary experience a 3D T2-SPACE FLAIR sequence allows for more precise delineation of non-en-hancing tumor volumes with high-resolution multiplanar reconstruction being particularly beneficial to target delineation in radiotherapy (Fig. 1).
Moreover, RT-optimized perfusion and diffusion sequences could help with differentiating true tumor from other reasons for contrast-enhancement and T2-FLAIR hyperintensity. We are currently evaluating an EPI with reduced volume excitation (ZOOMit) to help with target volume delineation in gliomas.
Benign tumors and functional disordersVestibular schwannomas are an important benign tumor, frequently treated with stereotactic radiotherapy. In these cerebellopontine neoplasms excellent long-term
control and functional outcome is achieved with local radiotherapy [35]. As vestibular schwannomas show strong contrast enhancement, 3D T1-sequences like the T1-MPRAGE are frequently used for delineation in radio-therapy treatment planning. In addition, high-resolution 3D-CISS sequences depict tumors and surrounding cerebrospinal fluid with high contrast and are important for delineation of adjacent cranial nerves. They also allow high-resolution segmentation of inner ear structures which may reduce cochlea doses and help with preservation of hearing. Post-radiotherapy these tumors frequently show transient enlargement before regressing in size, which sometimes is challenging to differentiate from treatment failure [35, 36].
Another benign brain tumor frequently treated with radiotherapy is meningioma, in which contouring mainly relies on contrast-enhanced T1 3D sequences like the T1-MPRAGE. In delineation of meningiomas for stereotactic radiotherapy the accurate estimation of the amount of dural extent (“Dural tail”) is frequently challenging to determine and contouring of meningioma cases is frequently very time-consuming because of complex geo-metric tumor configurations and imaging changes due to previous surgery.
Trigeminal neuralgia is a functional disorder that may be treated with stereotactic radiosurgery in patients refrac-tory to analgesics and surgical decompression. A very large radiosurgery dose (70–90 Gy) is given to the trigeminal root entry zone or cisternal portion of the nerve making accurate high-resolution MRI for treatment planning cru-cial. We usually employ a high-resolution 3D CISS, which enables clear distinction of the trigeminal and surrounding cranial nerves [37].
Head and neck cancer Radiotherapy of the head and neck region is a highly effective curative treatment for wide variety of tumors ranging from malignant entities like squamous cell cancers of the oral cavity and throat, malignant paranasal sinus tumors and lymphomas to benign indications like paragan-glioma.
Substantial improvements in treatment side effects have been achieved with intensity-modulated radiotherapy (IMRT) by sparing of salivary glands, mucosal surfaces and skin [38]. By improving precision in tumor and lymph node level delineation, MR imaging for radiotherapy treatment planning has the potential to further reduce uncertainty margins and treatment side effects.
Important structures for radiotherapy planning in head and neck cancer show superior depiction in MRI compared to CT. These include salivary glands and cervical lymph nodes [39], but also malignant tissues. Rasch et al. observed that tumor volumes in advanced head and neck
9
Radiation Therapy
siemens.com/magnetom-world-rt
MReadings: MR in RT

cancer delineated in MRI are smaller and show less interobserver variability than using CT alone [40] and in nasopharyngeal cancer, Chung et al. showed in a study of 258 patients that MRI was far superior than CT for the detection of intracranial and pterygopalatine fossa invasion [41].
MRI for radiotherapy treatment planning in the head and neck region benefits greatly from image acquisition in treatment position as anatomic changes may become extensive, if the configuration of the cervical spine, mandible or scapula is different [1]. The anatomic changes usually are too large to be solved by non-rigid registration techniques with clinically desired accuracy [42]. Multiple groups therefore have developed solutions to acquire the MRI in treatment position with mask immobilization. A common challenge for acquiring MR studies in treatment position is that thermoplastic mask systems do not fit into routine head and neck coils. The most common solution therefore is to use flexible surface coils instead [1, 43, 44], with high-channel coils enabling decently good image quality.
Fat-saturated 3D post-contrast T1w-sequences are generally considered to be the backbone for radiotherapy target delineation [1, 43]. With 3D T2-FLAIR sequences and diffusion-weighted sequences providing additional information for delineation [43, 45].
Liver and abdominal tumorsPatients suffering from hepatic tumors can undergo a broad range of treatment options including surgery, radiofrequency ablation (RFA) and stereotactic body radio-therapy (SBRT). Large lesion size or close proximity to bigger vessels generally favor SBRT in comparison to RFA. A 2016 study published by Wahl et al. in the Journal of Clinical Oncology showed significantly improved tumor control for hepatocellular carcinoma treated with SBRT compared to RFA, if tumor diameter was ≥ 2 cm [46].
MR imaging is crucial for radiotherapy planning of hepatic tumors as the boundary of most lesions cannot be adequately discerned on CT and many tumors are not visible on CT at all.
Hepatic tumors usually show complex motion patterns during respiration as the liver not only undergoes move-ment but also deformation during the respiratory cycle and is additionally influenced by abdominal peristalsis [47, 48]. At the same time, uncertainty margins need to be minimized to spare surrounding liver and bowel while escalating radiotherapy dose to the target. Tumor motion and integration with the remaining SBRT workflow there-fore are the main challenges in liver MRI for radiotherapy treatment planning.
Strategies for respiratory motion management in liver SBRT include internal target volume (ITV) concepts, expiration breath-hold, gating and tracking of tumor motion. As X-ray-based image guidance available at conventional linear accelerators does not visualize hepatic lesions, additional fiducials need to be invasively placed to allow for real-time image guidance. If radiotherapy is delivered exclusively in one respiratory phase, e.g. expira-tion, breath-hold or navigator-triggered MR sequences can be acquired to best reflect the respiratory position during treatment. As usual, MR imaging in radiotherapy treatment position using a flat table-top and similar immo-bilization equipment minimizes anatomic differences due to positioning. We currently use a navigator-triggered fat-saturated T2 TSE and EPI diffusion sequence as well as multiple breath-hold T1 VIBE Dixon sequences in different contrast phases for treatment planning.
4D MRI techniques are very promising for radiotherapy target volume delineation as they provide multiple 3D datasets during the respiratory cycle. 4D respiratory- correlated MRI acquires respiratory motion across multiple breathing cycles, which are subsequently sorted according to respiratory phase [49]. In contrast to 4D CT, 4D respira-tory-correlated MRI thus provides data on an average breathing cycle that might be more representative of the actual respiration during treatment. 4D MRI datasets can be used to create an internal target volume, that encompasses all possible tumor positions and is treated in free-breathing, but it can also be exploited for expiration breath-hold, gating and tracking strategies that limit dose to surrounding structures. One limitation for tumor tracking on conventional linear accelerators is that only the position of the fiducial itself is tracked and changes in tumor shape and position in relation to the fiducials are not captured. An interesting method was published in 2018 by Harris et al. to use a pre-treatment 4D MRI together with LINAC on-board kV projections to generate a synthetic on-board 4D MRI on conventional linear accelerators [50]. Real-time image guidance of abdominal tumors is of course also a prime use case for new MR-LINAC systems and a technique for generating synthet-ic volumetric cine-MRI using the MR-LINAC on-board 2D-cine imaging as well as a pretreatment 4D MRI was developed by the same group before [51]. We currently acquire a transversal 4D T1 StarVIBE-based respiratory self-gating series with and without contrast in MRI simula-tion for liver SBRT reconstructing 5 to 7 respiratory bins. In our preliminary experience subtraction of pre- and postcontrast acquired 4D series further improves contrast ratio of target lesions.
10
Radiation Therapy
siemens.com/magnetom-world-rt
MReadings: MR in RT

Prostate cancerProstate radiotherapy shows large benefits from MR imag-ing. Accurate delineation of the prostate is impossible in CT alone and it has been shown that prostate segmentations in CT are significantly larger than MRI, which leads to unnecessary high doses to penile and surrounding nerve and vascular structures and increases the risk for long-term urologic side effects [52, 53]. Precise radiotherapy delivery also reduces acute and late rectal side effects like proctitis. We therefore currently employ a rectal balloon and bladder filling protocol to enable a reliable anatomic configuration at each treatment session [53]. To assure accurate registration, we perform a dedicated MRI for radiotherapy treatment planning using the same positioning with rectal balloon and bladder filling as at daily treatment session. (Fig. 3) While a range of different non-rigid registration solutions are available, these algorithms may be associated with problematic uncertainties. For example, Brock et al. have observed errors of up to 8.7 mm for the prostate itself in intramodality non-rigid registration of repeated prostate MRIs [54]. As errors with non-rigid registration largely depend on the amount of deformation [7], performing MR measurements in treatment position also increases the accuracy of any subsequent registration steps.
We currently employ an isotropic, axial T2 SPACE with compressed sensing acceleration as the main sequence for delineation of the prostate, seminal vesicles and pelvic lymph nodes in patients with prostate cancer (Fig. 1). In our experience, this sequence provides high tissue contrasts, large field of view and allows for high-resolution sagittal reconstruction for differentiation of the caudal prostate margin and structures of the pelvic floor. As detailed sagittal imaging of the prostate and pelvic floor structures is of high importance in our experience, we currently still employ an additional sagittal T2 BLADE, which suppresses motion artifacts and provides high signal-to-noise in the prostate region. We use an EPI diffu-sion sequence with reduced volume excitation (ZOOMit) of the prostate region to get additional information on the location of malignant tumor inside the prostate (Fig. 1).
SummaryOptimal MR imaging for radiotherapy target delineation has distinct requirements that may be different from routine diagnostic indications. Demands on MR imaging in radiotherapy frequently are indication and site-specific, which needs to be addressed with specialized protocols. MRI for radiotherapy planning primarily needs to accurately and clearly depict the tumor perimeter in three-dimension-al space for precise gross tumor volume delineation. In addition, 4D MRI techniques are capable of integrating tumor motion and have large potential to improve preci-sion in radiotherapy of moving targets.
References
1 Paulson ES, Crijns SP, Keller BM, Wang J, Schmidt MA, Coutts G and van der Heide UA (2016) Consensus opinion on MRI simulation for external beam radiation treatment planning. Radiother Oncol 121 (2):187-192. doi:10.1016/j.radonc.2016.09.018
2 Kocher M, Wittig A, Piroth MD, Treuer H, Seegenschmiedt H, Ruge M, Grosu AL and Guckenberger M (2014) Stereotactic radiosurgery for treatment of brain metastases. A report of the DEGRO Working Group on Stereotactic Radiotherapy. Strahlentherapie und Onkologie: Organ der Deutschen Röntgengesellschaft [et al] 190 (6):521-532. doi:10.1007/s00066-014-0648-7
3 Shaw E, Scott C, Souhami L, Dinapoli R, Kline R, Loeffler J and Farnan N (2000) Single dose radiosurgical treatment of recurrent previously irradiated primary brain tumors and brain metastases: final report of RTOG protocol 90-05. Int J Radiat Oncol Biol Phys 47 (2):291-298.
4 Baumert BG, Rutten I, Dehing-Oberije C, Twijnstra A, Dirx MJ, Debougnoux-Huppertz RM, Lambin P and Kubat B (2006) A pathology-based substrate for target definition in radiosurgery of brain metastases. Int J Radiat Oncol Biol Phys 66 (1):187-194. doi:10.1016/j.ijrobp.2006.03.050
5 Anzalone N, Essig M, Lee SK, Dorfler A, Ganslandt O, Combs SE and Picozzi P (2013) Optimizing contrast-enhanced magnetic resonance imaging characterization of brain metastases: relevance to stereotactic radiosurgery. Neurosurgery 72 (5):691-701. doi:10.1227/NEU.0b013e3182889ddf
6 Snell JW, Sheehan J, Stroila M and Steiner L (2006) Assessment of imaging studies used with radiosurgery: a volumetric algorithm and an estimation of its error. Technical note. J Neurosurg 104 (1):157-162. doi:10.3171/jns.2006.104.1.157
7 Mugler JP, 3rd and Brookeman JR (1990) Three-dimensional magnetization-prepared rapid gradient-echo imaging (3D MP RAGE). Magnetic resonance in medicine 15 (1):152-157. doi:10.1002/mrm.1910150117
3 Advantages of acquiring the planning MRI in treatment position. Planning MRI in prostate cancer showing good correspondence of bladder and rectum with endorectal balloon in the planning CT and dedicated planning MRI.
11
Radiation Therapy
siemens.com/magnetom-world-rt
MReadings: MR in RT

8 Danieli L, Riccitelli GC, Distefano D, Prodi E, Ventura E, Cianfoni A, Kaelin-Lang A, Reinert M and Pravata E (2019) Brain Tumor- Enhancement Visualization and Morphometric Assessment: A Comparison of MPRAGE, SPACE, and VIBE MRI Techniques. AJNR American journal of neuroradiology 40 (7):1140-1148. doi:10.3174/ajnr.A6096
9 Ellingson BM, Bendszus M, Boxerman J, Barboriak D, Erickson BJ, Smits M, Nelson SJ, Gerstner E, Alexander B, Goldmacher G, Wick W, Vogelbaum M, Weller M, Galanis E, Kalpathy-Cramer J, Shankar L, Jacobs P, Pope WB, Yang D, Chung C, Knopp MV, Cha S, van den Bent MJ, Chang S, Yung WK, Cloughesy TF, Wen PY and Gilbert MR (2015) Consensus recommendations for a standardized Brain Tumor Imaging Protocol in clinical trials. Neuro-oncology 17 (9):1188-1198. doi:10.1093/neuonc/nov095
10 Chappell PM, Pelc NJ, Foo TK, Glover GH, Haros SP and Enzmann DR (1994) Comparison of lesion enhancement on spin-echo and gradient-echo images. AJNR American journal of neuroradiology 15 (1):37-44.
11 Reichert M, Morelli JN, Runge VM, Tao A, von Ritschl R, von Ritschl A, Padua A, Dix JE, Marra MJ, Schoenberg SO and Attenberger UI (2013) Contrast-enhanced 3-dimensional SPACE versus MP-RAGE for the detection of brain metastases: consider-ations with a 32-channel head coil. Invest Radiol 48 (1):55-60. doi:10.1097/RLI.0b013e318277b1aa
12 Komada T, Naganawa S, Ogawa H, Matsushima M, Kubota S, Kawai H, Fukatsu H, Ikeda M, Kawamura M, Sakurai Y and Maruyama K (2008) Contrast-enhanced MR imaging of metastatic brain tumor at 3 tesla: utility of T(1)-weighted SPACE compared with 2D spin echo and 3D gradient echo sequence. Magnetic resonance in medical sciences: MRMS: an official journal of Japan Society of Magnetic Resonance in Medicine 7 (1):13-21. doi:10.2463/mrms.7.13
13 Mugler JP, 3rd and Brookeman JR (1993) Theoretical analysis of gadopentetate dimeglumine enhancement in T1-weighted imaging of the brain: comparison of two-dimensional spin-echo and three-dimensional gradient-echo sequences. Journal of magnetic resonance imaging: JMRI 3 (5):761-769. doi:10.1002/jmri.1880030512
14 Wang H, Balter J and Cao Y (2013) Patient-induced susceptibility effect on geometric distortion of clinical brain MRI for radiation treatment planning on a 3T scanner. Phys Med Biol 58 (3):465-477. doi:10.1088/0031-9155/58/3/465
15 Seibert TM, White NS, Kim GY, Moiseenko V, McDonald CR, Farid N, Bartsch H, Kuperman J, Karunamuni R, Marshall D, Holland D, Sanghvi P, Simpson DR, Mundt AJ, Dale AM and Hattangadi-Gluth JA (2016) Distortion inherent to magnetic resonance imaging can lead to geometric miss in radiosurgery planning. Practical radiation oncology 6 (6):e319-e328. doi:10.1016/j.prro.2016.05.008
16 Garcia MA, Anwar M, Yu Y, Duriseti S, Merritt B, Nakamura J, Hess C, Theodosopoulos PV, McDermott M, Sneed PK and Braunstein SE (2018) Brain metastasis growth on preradiosurgical magnetic resonance imaging. Practical radiation oncology 8 (6):e369-e376. doi:10.1016/j.prro.2018.06.004
17 Salkeld AL, Hau EKC, Nahar N, Sykes JR, Wang W and Thwaites DI (2018) Changes in Brain Metastasis During Radiosurgical Planning. Int J Radiat Oncol Biol Phys 102 (4):727-733. doi:10.1016/j.ijrobp.2018.06.021
18 Nardone V, Nanni S, Pastina P, Vinciguerra C, Cerase A, Correale P, Guida C, Giordano A, Tini P, Reginelli A, Cappabianca S and Pirtoli L (2019) Role of perilesional edema and tumor volume in the prognosis of non-small cell lung cancer (NSCLC) undergoing radiosurgery (SRS) for brain metastases. Strahlentherapie und Onkologie: Organ der Deutschen Röntgengesellschaft [et al] 195 (8):734-744. doi:10.1007/s00066-019-01475-0
19 Andersen C, Astrup J and Gyldensted C (1994) Quantitative MR analysis of glucocorticoid effects on peritumoral edema associated with intracranial meningiomas and metastases. Journal of computer assisted tomography 18 (4):509-518. doi:10.1097/00004728-199407000-00001
20 Scharl S, Kirstein A, Kessel KA, Duma MN, Oechsner M, Straube C and Combs SE (2019) Cavity volume changes after surgery of a brain metastasis-consequences for stereotactic radiation therapy. Strahlentherapie und Onkologie: Organ der Deutschen Röntgengesellschaft [et al] 195 (3):207-217. doi:10.1007/s00066-018-1387-y
21 Hessen E, Nijkamp J, Damen P, Hauptmann M, Jasperse B, Dewit L, Lutkenhaus L, Lamers E, van der Heide U, Damen E, Hanssens P and Borst G (2019) Predicting and implications of target volume changes of brain metastases during fractionated stereotactic radiosurgery. Radiother Oncol. doi:10.1016/j.radonc.2019.07.011
22 Badiyan SN, Regine WF and Mehta M (2016) Stereotactic Radiosur-gery for Treatment of Brain Metastases. J Oncol Pract 12 (8):703-712. doi:10.1200/JOP.2016.012922
23 Kleesiek J, Morshuis JN, Isensee F, Deike-Hofmann K, Paech D, Kickingereder P, Kothe U, Rother C, Forsting M, Wick W, Bendszus M, Schlemmer HP and Radbruch A (2019) Can Virtual Contrast Enhancement in Brain MRI Replace Gadolinium?: A Feasibility Study. Invest Radiol 54 (10):653-660. doi:10.1097/rli.0000000000000583
24 Tsao M, Xu W and Sahgal A (2012) A meta-analysis evaluating stereotactic radiosurgery, whole-brain radiotherapy, or both for patients presenting with a limited number of brain metastases. Cancer 118 (9):2486-2493. doi:10.1002/cncr.26515
25 Potter R, Heil B, Schneider L, Lenzen H, al-Dandashi C and Schnepper E (1992) Sagittal and coronal planes from MRI for treatment planning in tumors of brain, head and neck: MRI assisted simulation. Radiother Oncol 23 (2):127-130. doi:10.1016/0167-8140(92)90344-t
26 Sumanaweera TS, Adler JR, Jr., Napel S and Glover GH (1994) Characterization of spatial distortion in magnetic resonance imaging and its implications for stereotactic surgery. Neurosurgery 35 (4):696-703; discussion 703-694. doi:10.1227/00006123-199410000-00016
27 Khoo VS, Dearnaley DP, Finnigan DJ, Padhani A, Tanner SF and Leach MO (1997) Magnetic resonance imaging (MRI): consider-ations and applications in radiotherapy treatment planning. Radiother Oncol 42 (1):1-15. doi:10.1016/s0167-8140(96)01866-x
28 Kondziolka D, Dempsey PK, Lunsford LD, Kestle JR, Dolan EJ, Kanal E and Tasker RR (1992) A comparison between magnetic resonance imaging and computed tomography for stereotactic coordinate determination. Neurosurgery 30 (3):402-406; discussion 406-407. doi:10.1227/00006123-199203000-00015
29 Niyazi M, Brada M, Chalmers AJ, Combs SE, Erridge SC, Fiorentino A, Grosu AL, Lagerwaard FJ, Minniti G, Mirimanoff RO, Ricardi U, Short SC, Weber DC and Belka C (2016) ESTRO-ACROP guideline "target delineation of glioblastomas". Radiother Oncol 118 (1):35-42. doi:10.1016/j.radonc.2015.12.003
30 Bynevelt M, Britton J, Seymour H, MacSweeney E, Thomas N and Sandhu K (2001) FLAIR imaging in the follow-up of low-grade gliomas: time to dispense with the dual-echo? Neuroradiology 43 (2):129-133. doi:10.1007/s002340000389
31 Buckner JC, Shaw EG, Pugh SL, Chakravarti A, Gilbert MR, Barger GR, Coons S, Ricci P, Bullard D, Brown PD, Stelzer K, Brachman D, Suh JH, Schultz CJ, Bahary JP, Fisher BJ, Kim H, Murtha AD, Bell EH, Won M, Mehta MP and Curran WJ, Jr. (2016) Radiation plus Procarbazine, CCNU, and Vincristine in Low-Grade Glioma. N Engl J Med 374 (14):1344-1355. doi:10.1056/NEJMoa1500925
32 Wang Y and Jiang T (2013) Understanding high grade glioma: molecular mechanism, therapy and comprehensive management.
12
Radiation Therapy
siemens.com/magnetom-world-rt
MReadings: MR in RT

Cancer letters 331 (2):139-146. doi:10.1016/j.canlet.2012.12.02433 Gilbert MR, Wang M, Aldape KD, Stupp R, Hegi ME, Jaeckle KA,
Armstrong TS, Wefel JS, Won M, Blumenthal DT, Mahajan A, Schultz CJ, Erridge S, Baumert B, Hopkins KI, Tzuk-Shina T, Brown PD, Chakravarti A, Curran WJ, Jr. and Mehta MP (2013) Dose-dense temozolomide for newly diagnosed glioblastoma: a randomized phase III clinical trial. Journal of clinical oncology: official journal of the American Society of Clinical Oncology 31 (32):4085-4091. doi:10.1200/jco.2013.49.6968
34 Menze BH, Jakab A, Bauer S, Kalpathy-Cramer J, Farahani K, Kirby J, Burren Y, Porz N, Slotboom J, Wiest R, Lanczi L, Gerstner E, Weber MA, Arbel T, Avants BB, Ayache N, Buendia P, Collins DL, Cordier N, Corso JJ, Criminisi A, Das T, Delingette H, Demiralp C, Durst CR, Dojat M, Doyle S, Festa J, Forbes F, Geremia E, Glocker B, Golland P, Guo X, Hamamci A, Iftekharuddin KM, Jena R, John NM, Konukoglu E, Lashkari D, Mariz JA, Meier R, Pereira S, Precup D, Price SJ, Raviv TR, Reza SM, Ryan M, Sarikaya D, Schwartz L, Shin HC, Shotton J, Silva CA, Sousa N, Subbanna NK, Szekely G, Taylor TJ, Thomas OM, Tustison NJ, Unal G, Vasseur F, Wintermark M, Ye DH, Zhao L, Zhao B, Zikic D, Prastawa M, Reyes M and Van Leemput K (2015) The Multimodal Brain Tumor Image Segmentation Benchmark (BRATS). IEEE transactions on medical imaging 34 (10):1993-2024. doi:10.1109/tmi.2014.2377694
35 Putz F, Muller J, Wimmer C, Goerig N, Knippen S, Iro H, Grundtner P, Eyupoglu I, Rossler K, Semrau S, Fietkau R and Lettmaier S (2017) Stereotactic radiotherapy of vestibular schwannoma: Hearing preservation, vestibular function, and local control following primary and salvage radiotherapy. Strahlentherapie und Onkologie: Organ der Deutschen Röntgengesellschaft [et al] 193 (3):200-212. doi:10.1007/s00066-016-1086-5
36 Mindermann T and Schlegel I (2014) How to distinguish tumor growth from transient expansion of vestibular schwannomas following Gamma Knife radiosurgery. Acta Neurochir (Wien) 156 (6):1121-1123. doi:10.1007/s00701-014-2063-3
37 Koca S, Distel L, Lubgan D, Lambrecht U, Bischoff B, Buchfelder M, Semrau S, Lettmaier S, Fietkau R and Putz F (2018) Time-course of pain response and toxicity after whole nerve encompassing LINAC-based radiosurgery for trigeminal neuralgia - a prospective observational study. Strahlentherapie und Onkologie: Organ der Deutschen Röntgengesellschaft [et al] In press
38 Saarilahti K, Kouri M, Collan J, Hamalainen T, Atula T, Joensuu H and Tenhunen M (2005) Intensity modulated radiotherapy for head and neck cancer: evidence for preserved salivary gland function. Radiother Oncol 74 (3):251-258. doi:10.1016/j.radonc.2004.11.004
39 Tien RD and Robbins KT (1992) Correlation of clinical, surgical, pathologic, and MR fat suppression results for head and neck cancer. Head & neck 14 (4):278-284. doi:10.1002/hed.2880140404
40 Rasch C, Keus R, Pameijer FA, Koops W, de Ru V, Muller S, Touw A, Bartelink H, van Herk M and Lebesque JV (1997) The potential impact of CT-MRI matching on tumor volume delineation in advanced head and neck cancer. Int J Radiat Oncol Biol Phys 39 (4):841-848. doi:10.1016/s0360-3016(97)00465-3
41 Chung NN, Ting LL, Hsu WC, Lui LT and Wang PM (2004) Impact of magnetic resonance imaging versus CT on nasopharyngeal carcinoma: primary tumor target delineation for radiotherapy. Head & neck 26 (3):241-246. doi:10.1002/hed.10378
42 Varadhan R, Karangelis G, Krishnan K and Hui S (2013) A frame-work for deformable image registration validation in radiotherapy clinical applications. Journal of applied clinical medical physics 14 (1):4066. doi:10.1120/jacmp.v14i1.4066
43 Mandija S, D'Agata F, Navest RJM, Sbrizzi A, Tijssen RHN, Philippens MEP, Raaijmakers CPJ, Seravalli E, Verhoeff JJC, Lagendijk JJW and van den Berg CAT (2019) Brain and Head-and-Neck MRI in
Immobilization Mask: A Practical Solution for MR-Only Radiothera-py. Front Oncol 9:647. doi:10.3389/fonc.2019.00647
44 Wong OL, Yuan J, Yu SK and Cheung KY (2017) Image quality assessment of a 1.5T dedicated magnetic resonance-simulator for radiotherapy with a flexible radio frequency coil setting using the standard American College of Radiology magnetic resonance imaging phantom test. Quantitative imaging in medicine and surgery 7 (2):205-214. doi:10.21037/qims.2017.02.08
45 Cardoso M, Min M, Jameson M, Tang S, Rumley C, Fowler A, Estall V, Pogson E, Holloway L and Forstner D (2019) Evaluating diffusion-weighted magnetic resonance imaging for target volume delineation in head and neck radiotherapy. J Med Imaging Radiat Oncol 63 (3):399-407. doi:10.1111/1754-9485.12866
46 Wahl DR, Stenmark MH, Tao Y, Pollom EL, Caoili EM, Lawrence TS, Schipper MJ and Feng M (2016) Outcomes After Stereotactic Body Radiotherapy or Radiofrequency Ablation for Hepatocellular Carcinoma. Journal of clinical oncology: official journal of the American Society of Clinical Oncology 34 (5):452-459. doi:10.1200/jco.2015.61.4925
47 Akino Y, Oh RJ, Masai N, Shiomi H and Inoue T (2014) Evaluation of potential internal target volume of liver tumors using cine-MRI. Med Phys 41 (11):111704. doi:10.1118/1.4896821
48 Mostafaei F, Tai A, Omari E, Song Y, Christian J, Paulson E, Hall W, Erickson B and Li XA (2018) Variations of MRI-assessed peristaltic motions during radiation therapy. PloS one 13 (10):e0205917. doi:10.1371/journal.pone.0205917
49 Stemkens B, Paulson ES and Tijssen RHN (2018) Nuts and bolts of 4D-MRI for radiotherapy. Phys Med Biol 63 (21):21tr01. doi:10.1088/1361-6560/aae56d
50 Harris W, Wang C, Yin FF, Cai J and Ren L (2018) A Novel method to generate on-board 4D MRI using prior 4D MRI and on-board kV projections from a conventional LINAC for target localization in liver SBRT. Med Phys 45 (7):3238-3245. doi:10.1002/mp.12998
51 Harris W, Ren L, Cai J, Zhang Y, Chang Z and Yin FF (2016) A Technique for Generating Volumetric Cine-Magnetic Resonance Imaging. Int J Radiat Oncol Biol Phys 95 (2):844-853. doi:10.1016/j.ijrobp.2016.02.011
52 Rasch C, Barillot I, Remeijer P, Touw A, van Herk M and Lebesque JV (1999) Definition of the prostate in CT and MRI: a multi-observer study. Int J Radiat Oncol Biol Phys 43 (1):57-66. doi:10.1016/s0360-3016(98)00351-4
53 Bockelmann F, Hammon M, Lettmaier S, Fietkau R, Bert C and Putz F (2019) Penile bulb sparing in prostate cancer radiotherapy: Dose analysis of an in-house MRI system to improve contouring. Strahlentherapie und Onkologie: Organ der Deutschen Röntgengesellschaft [et al] 195 (2):153-163. doi:10.1007/s00066-018-1377-0
54 Brock KK (2010) Results of a multi-institution deformable registration accuracy study (MIDRAS). Int J Radiat Oncol Biol Phys 76 (2):583-596. doi:10.1016/j.ijrobp.2009.06.031
Contact Dr. Florian Putz Department of Radiation Oncology Friedrich-Alexander-University Erlangen- Nuremberg Universitaetsstraße 27 91054 Erlangen Germany Tel.: +49 9131 8534080 Fax: +49 9131 8534185 [email protected]
13
Radiation Therapy
siemens.com/magnetom-world-rt
MReadings: MR in RT

The Treatment Planning Department in the Maria Sklodowska-Curie National Research Institute of Oncology, Gliwice Branch, has been equipped with a 1.5T MAGNETOM Aera (Siemens Healthcare, Erlangen, Germany) since 2012. An on-site scanner is needed because MRI is used as a standard in both conventional radiotherapy and radiosurgical techniques. According to target volume type and location, various imaging sequences are routinely used.
Ionizing radiation has been successfully used for years in the treatment of trigeminal neuralgia. This method enables noninvasive treatment of severe facial pain using a high dose of radiation. With the Leksell Gamma Knife (Elekta AB, Stockholm, Sweden), high dose means 80–90 Gy in a single fraction specified at dose maximum. With the CyberKnife (Accuray, Sunnyvale, CA, USA), it means 60 Gy in a single fraction specified at the isodose encompassing the target volume [1–4]. High radiation doses, very small target volumes and close proximity to critical organs require definition of all the anatomical structures with the highest precision. With the CyberKnife system, the treatment planning calculation is performed with computed tomography (CT) data on electron density. However, CT imaging alone does not allow for differentia-tion of specific anatomical volumes, whereas these discrete structures are clearly visible on various MR sequences.
The accurate registration (also called fusion) of the planning CT and given MR sequence is vital. Registration in radiotherapy is a process of visualization and alignment of multimodal images [5, 6].
In our Institute, rigid registration is the standard method of handling diagnostic images used for radiotherapy planning. In case of trigeminal neuralgia, two different fusions are commonly used.
MR Imaging in Radiosurgery for Trigeminal NeuralgiaAleksandra Grządziel1; Sławomir Blamek2; Barbara Bekman1; Sylwia Garbaciok1; Jacek Wendykier1; Krzysztof Ślosarek1
1 Radiotherapy Planning Department, Maria Sklodowska-Curie National Research Institute of Oncology, Gliwice Branch, Gliwice, Poland
2 Radiotherapy Department, Maria Sklodowska-Curie National Research Institute of Oncology, Gliwice Branch, Gliwice, Poland
1 Patient examination position with head in Head/Neck 20 coil.
AbstractThe hallmarks of radiosurgery for trigeminal neural-gia are high radiation doses, very small target vol-ume, and close proximity to critical organs. This kind of treatment requires maximum precision in defini-tion of all the anatomical structures. Although dose distribution is calculated with computed tomography, this modality alone cannot show specific anatomical volumes with sufficient precision. These discrete structures are clearly visible on various magnetic resonance imaging sequences. The highest possible accuracy of registration of CT images and specific MR sequences is vital. Our institutional protocol for all patients with intracranial lesions includes T1-weighted 3D MPRAGE without and with contrast enhancement. For trigeminal neuralgia cases, a CISS sequence is also routinely used. Thanks to its high-resolution imaging, the CISS sequence allows for accurate delineation of the target volume – the fifth cranial nerve – and organs at risk surrounding the target, including cranial nerves and the structures of the inner ear.
The concepts and information presented in this paper are based on research and are not commercially available.
14
Radiation Therapy
siemens.com/magnetom-world-rt
MReadings: MR in RT

Technical aspects of CT and MR scanningOur routine practice is CT imaging in immobilization system with head mask. The CT scans are acquired from the top of the mask to the subclavian area. The CT image matrix resolution is 512 x 512 pixels with 1.0 mm gap between slices and 50 cm FOV acquired with 120 kV and 500 mAs. A flat scanner couch overlay is used for CT imaging to maintain the same position of the body as on the treatment couch.
The protocol for all patients with intracranial lesions includes T1-weighted 3D Magnetization Prepared Rapid Acquisition Gradient Echo (3D MPRAGE) without and with contrast enhancement. Moreover, for trigeminal neuralgia cases, a Constructive Interference in Steady State (CISS) sequence is routinely used [7–9]. This is a heavily T2-weighted fast gradient echo sequence of 0.35 mm spatial resolution. It allows for precise visualization of minute neural structures, especially the trigeminal nerve root where the target volume is located. Usually, one of two possible target volume locations is used. One is the root entry zone, close to the brainstem, allowing for excellent pain control [10], but irradiating this region is believed to be associated with higher rates of adverse ef-fect, including facial hypoesthesia and anesthesia dolorosa. The second is the retrogasserian region (zona triangularis), which is more distant from the brainstem, and therefore thought to be safer to irradiate. The CISS sequence allows for accurate delineation of the target volume thanks to imaging with high resolution and great detail of the fifth cranial nerve against the background of bright cerebrospinal fluid. Moreover, it allows for accurate differentiation between nerve fibers and neighboring vessels, which are often the cause of trigeminal neuralgia due to neurovascular conflict.
Finally, it precisely reveals organs at risk surrounding the region of interest, including cranial nerves and the struc-tures of the inner ear (cochlea and semicircular canals) [7]. To better identify vascular structures, especially if the cerebellopontine region has atypical anatomy, vascular sequences such as TOF (Time Of Flight) can be used.
MR scans are acquired with the patient positioned as in CT scanning, head first supine on a flat couch overlay (Fig. 1). The 3D MPRAGE sequence covers the entire head and a fragment of the cervical spine with 1 mm slices, with TR = 1390 ms and TE = 3.01 ms. The CISS sequence covers a slab of up to 10 cm of the head with the trigeminal nerve root located in the center. The CISS slice distance is 0.7 mm, with TR = 6.85 ms and TE = 3.43 ms.
The patient’s position during MR scanning should be as close as possible to the position during the CT scan. This approach facilitates image registration and contouring, especially for the brainstem and medulla which can move significantly during flexion and extension of the neck.
Treatment planning aspectsThe fusion of CT and MR images, regardless of the contour-ing and planning system, must be performed with care. Modern systems offer both automatic and manual rigid image registration. The planner must not rely solely on the automatic registration. Taking into account as many factors as possible during the image fusion is crucial in order to obtain the correct results. For CT/3D MPRAGE MR fusion, the anatomy of contrasted vessels, and the shapes of the brainstem and the medulla oblongata are analyzed. CT/CISS MR registration is performed taking into account the shapes of the brainstem, medulla, auditory nerve, and inner ear structures (Fig. 2).
2A 2C2B
2 Transversal scans at the level of the target volume: (2A) CT with barely visible trigeminal nerve and brainstem; (2B) T1-weighted MPRAGE with barely visible trigeminal nerve, but well visible brainstem, (2C) T2-weighted CISS with clearly visible trigeminal nerve, brainstem and surrounding structures.
15
Radiation Therapy
siemens.com/magnetom-world-rt
MReadings: MR in RT

3A
3B
3 T2-weighted CISS in treatment planning system (3A) transversal image with contour of right inner ear structures (yellow), (3B) coronal image with contour of right cochlea (yellow) and trigeminal nerve (red).
4C
4E4D
4 CyberKnife treatment plan for trigeminal neuralgia. (4A) 3D body surface reconstruction and beam arrangement, (4B) isocurve scale; structure delineation and dose distribution on the (4C) transversal, (4D) sagittal and (4E) coronal plane.
4A 4B
16
Radiation Therapy
siemens.com/magnetom-world-rt
MReadings: MR in RT

Delineation of the target and critical organs is done on CT images taking into account two fusions: the 3D MPRAGE and CISS sequences. The CISS sequence is the primary one for target and inner ear contouring (Fig. 3).
The goal of trigeminal neuralgia radiosurgery planning is to obtain a very high point dose in the target and a steep dose gradient outside the target where the nearest critical structures are located.
An acceptable plan must meet certain criteria for these critical structures, especially the brainstem but also the inner ear. In our center, for example, the dose delivered to the brainstem must not exceed 15 Gy and a dose of 10 Gy cannot be delivered in a volume larger than 0.5 cm3. The doses in other critical structures farther from the target, such as the optic pathway, eyeballs, and lenses, are always monitored. Sparing organs at risk is a higher priority than target dose coverage.
Treatment plan evaluation requires careful reviewing of dose-volume histograms and CT scans one by one. It allows for controlling the dose distribution in the target area and capturing possible hotspots distant from the region of interest (Fig. 4).
SummaryEvery year, more than a dozen trigeminal neuralgia treat-ments are performed at our Institute. CT imaging alone cannot show specific anatomical volumes with sufficient precision, but these small structures are more evident on different MR sequences. Therefore, it is essential to achieve the highest possible accuracy in registering of CT and specific MR sequences. Our institutional protocol for all patients with trigeminal neuralgia includes the registration
of CT and 3D MPRAGE without and with contrast enhance-ment as well as a CISS sequence. Thanks to high resolution imaging, the CISS sequence allows for accurate delineation of the target volume i.e. the fifth cranial nerve, and organs at risk surrounding the target, including cranial nerves and the structures of inner ear. MR imaging is absolutely necessary as the base of exact target and critical structures delineation, allowing a high dose gradient in stereotactic plans to be achieved.
References
1 Niedzi L.A., The Implementation of Ablative Hypofractionated Radiotherapy for Stereotactic Treatments in the Brain and Body: Observations on Efficacy and Toxicity in Clinical Practice, Seminars in Radiation Oncology 18, 265-272 (2008).
2 Gorgulho A., Radiation mechanisms of pain control in classical trigeminal neuralgia, Surg Neurol Int. 3 Suppl 1, 17-25 (2012).
3 Obermann M., Treatment options in trigeminal neuralgia, Ther Adv Neurol Disord. 3 2, 107-115 (2010).
4 Mehrotra S.; Keane J.F.; Goldstain L., Trigeminal Neuralgia: Current Diagnosis and Treatment Options How to assess this debilitating chronic condition, which often mimics other disorders., Practical Pain Management 16 4, 46-47
5 Dogra A.; Goyal B.; Agrawal S., Medical Image Fusion: A Brief Introduction, Biomedical & Pharmacology Journal 11 3, 1209-1214 (2018).
6 James A.P.; Dasarthy B.V., Medical image fusion: A survey of the state of the art, Information Fusion 19, 4-19 (2014).
7 Chavhan G.B. et al., Steady-State MR Imaging Sequences: Physics, Classification, and Clinical Applications, RadioGraphics 28 4 (2008).
8 Elster A.D., Gradient-Echo MR Imaging: Techniques and Acronyms, Radiology 186, 1-8 (1993).
9 Hargreaves B.A., Rapid Gradient-Echo Imaging, Journal of Magnetic Resonance Imaging. 36, 1300-1313 (2012).
10 Somaza S.; Montilla E.M.; Mora M.C., Gamma knife radiosurgery on the trigeminal ganglion for idiopathic trigeminal neuralgia: Results and review of the literature, Surg Neurol Int. 10:89 (2019).
Contact Professor Krzysztof Ślosarek Radiotherapy Planning Department Maria Sklodowska-Curie National Research Institute of Oncology Gliwice Branch 15 Wybrzeże Armii Krajowej Street 44-101 Gliwice Poland Tel.: +32 278 88 86 [email protected]
17
Radiation Therapy
siemens.com/magnetom-world-rt
MReadings: MR in RT

Clinical Implementation and Evaluation of MR-only Radiotherapy Planning for Brain TumorsDavid Roberge, MD and Jean-Charles Côté, PhD
Department of Radiation Oncology, Centre Hospitalier de l’Université de Montréal (CHUM), Montreal, Canada
1 Example of patient positioning for MR Brain acquisition for radiation therapy planning on 1.5T MAGNETOM Aera.
IntroductionOver the past decades, magnetic resonance (MR) imaging has been increasingly used to improve delineation of targets to be irradiated and organs at risk (OAR) to be avoided. In 2020, the list of clinical scenarios where MR is not considered useful is shorter than the list of sites where it is felt to provide benefit. This being said, for most uses of MR in radiotherapy planning, the level of evidence for clini-cal benefit is weak. Although it can often be demonstrated that physician segmentations will be altered by the use of MR, it is not often proven that these changes result in more cures or better quality of life. As adoption of MR planning increases, the quality of the evidence will likely improve.
An impediment to a more widespread use of MR in radiotherapy is the need to obtain both MR and CT images for treatment planning. In such a workflow the MR is used for tissue segmentation and the CT for treatment planning. In the combined workflow, image registration is required to align the images from both modalities. Target volumes and OARs defined in the MR image can then be transferred to the CT dataset, with which plan optimization and dose calculation are performed. The electron density informa-tion required for accurate dose calculation and reference images used for patient positioning are obtained from CT.
The challenges from a combined MR and CT workflow include:• Accurate image registration between MR and CT.
Small inaccuracies in registration will translate into systematic error throughout the treatment course.
• Patient scheduling. Scheduling patients on two different devices (CT and MR) can be burdensome on the patient and the healthcare institution. As time elapses between the images, anatomy can change (bladder filling as an example) and image registration may suffer.
• Financial issues. In bundled reimbursement schemes both imaging procedures may not be reimbursed presenting a burden to the institution. In schemes where both procedures are reimbursed, the additional imaging procedures and imaging devices represent a potentially unnecessary financial burden on the healthcare system as a whole.
An analogous situation existed after the introduction of CT simulation. Many patients underwent CT simulation followed by conventional fluoroscopic simulation. Today, most fluoroscopic simulators have been sold for scrap metal and, when necessary, digitally reconstructed radio-graphs are produced using CT images. A future can be imagined where CT scanners also disappear from radiation oncology departments.
In contrast to other disease sites, the use of MR for delineation in the management of brain tumors is not controversial. Many brain targets and organs at risk are
18
Radiation Therapy
siemens.com/magnetom-world-rt
MReadings: MR in RT

simply not visible on CT – this is the case, for example, of small brain metastases and the hippocampal regions of the temporal lobes. In narrow indications, such as Gamma Knife radiosurgery, MR-only planning has been used in rou-tine clinical practice for decades. This adoption of MR-only planning for frame-based radiosurgery has been facilitated by the absence of image-guidance, dose calculations which ignore tissue inhomogeneities and external MR fiducials which provide some measure of geometric quality assur-ance. In the more widespread implementation of MR-only planning, one must account for:• Reference images for image guidance (CT or digitally
reconstructed radiographs)• Dose calculations which take into account electron
density• Quality assurance of the geometric integrity of varied
MR images
Synthetic CT (sCT) provides images generated from MR scans that emulate CT images regarding electron density information and geometric representation. The images contain different Hounsfield units (HU) for different mate-rials and these HU can be converted to electron density in the treatment planning system (TPS) using a calibration curve. The purpose of sCT images is to provide the same dose calculation accuracy as with CT images, enabling MR-only radiotherapy planning without needing additional CT images. Synthetic CT is now commercially available for both the brain and pelvis. After evaluating the pre-clinical version of this software, we have begun the clinical imple-mentation of the commercial version and describe our ex-perience herein.
Clinical workflowThe first step in the MR-only workflow is patient immobili-zation. In our workflow, the curved MR table is rendered flat using a custom insert. A commercial overlay is placed on the insert. In order to identify the treatment table in the treatment planning system, we lay a small slab of gel on the MR couch top. The patient lies on the table and is positioned straight using the sagittal in-room laser. The thermoplastic mask is heated outside the MR room and the warm mask impressionned on the patient. Although it is possible to use external fiducials or the laser bridge to mark an isocenter on the patient, we chose to use the tip of the nose as our reference. We feel that this is simple and accurate for our practice where every treatment fraction is preceded by a cone beam CT. Using an in-house plastic
bridge, 2 flex small 4 coils are placed on each side of the head and a body 18 long above the patient. In addition, 2 rows of the spine 32 posterior coil are typically used for a total of 34 coil elements (Fig. 1).
For each clinical scenario, an MR protocol needs to be assembled around the sequences required for sCT. We chose to start our clinical implementation with whole-brain radiotherapy using hippocampal avoidance. This clinical scenario was chosen based on its incidence (not too common, not too rare), the low total dose and delivery via conventional linear accelerators. The MR protocol for this indication includes, in addition to localizer and quality assurance sequences, five sequences. The following sequences are required to generate sCT images of the brain: T1 VIBE Dixon, T2 SPACE, PETRA, FLASH Gradient Echo with “Time of Flight generated contrast” [2] (Fig. 2). For hippocampal avoidance an MPRAGE sequence is added.
The acquisition of the four sequences takes approxi-mately 14 minutes on our MAGNETOM Aera1 (1.5T) and is reported to last a similar time on a MAGNETOM Sola (1.5T) – 9 minutes with the MAGNETOM Vida (3T). We send the images to the hospital PACS and syngo.via. In syngo.via, the sCT image set is generated. Prior to being sent to our contouring server with the MPRAGE dataset, the sCT is inspected for aberrations or artefacts. The target and organs at risk are segmented by the physician before the case moves to dosimetry. The structure sets and imag-es are sent to planning (in our case, this is the same plat-form as contouring) and the radiation plan is optimized.
Quality assurance Once the images are acquired, the quality assurance
sequences are reviewed for geometric accuracy quality control. For geometric quality assurance control, two sets of axial images are acquired in opposed frequency axis pushing the distortions each to one side. The bandwidth is reduced to amplify the distortion. The two sets of images are compared. The goal is to find distortion coming from the patient: surgical clip, dental implant, air, etc. Basic B0 and gradients quality control are performed weekly on phantom and annually for exhaustive QC.
A first dosimetric quality assurance is performed by comparing plans with and without heterogeneity corrections before sending the plan to the linear accelera-tor. At the first treatment session, the sCT is visually compared to the cone-beam CT (CBCT). After the first treatment session, the dose is recalculated on the CBCT as a final quality control step.
1 MR protocols for Synthetic CT generation are works in progress for MAGNETOM Aera, they are currently under development and not for sale in the U.S. and in other countries. Their future availability cannot be ensured.
MR protocols for Synthetic CT generation for 1.5T MAGNETOM Sola and 3T MAGNETOM Vida are clinically released.
19
Radiation Therapy
siemens.com/magnetom-world-rt
MReadings: MR in RT
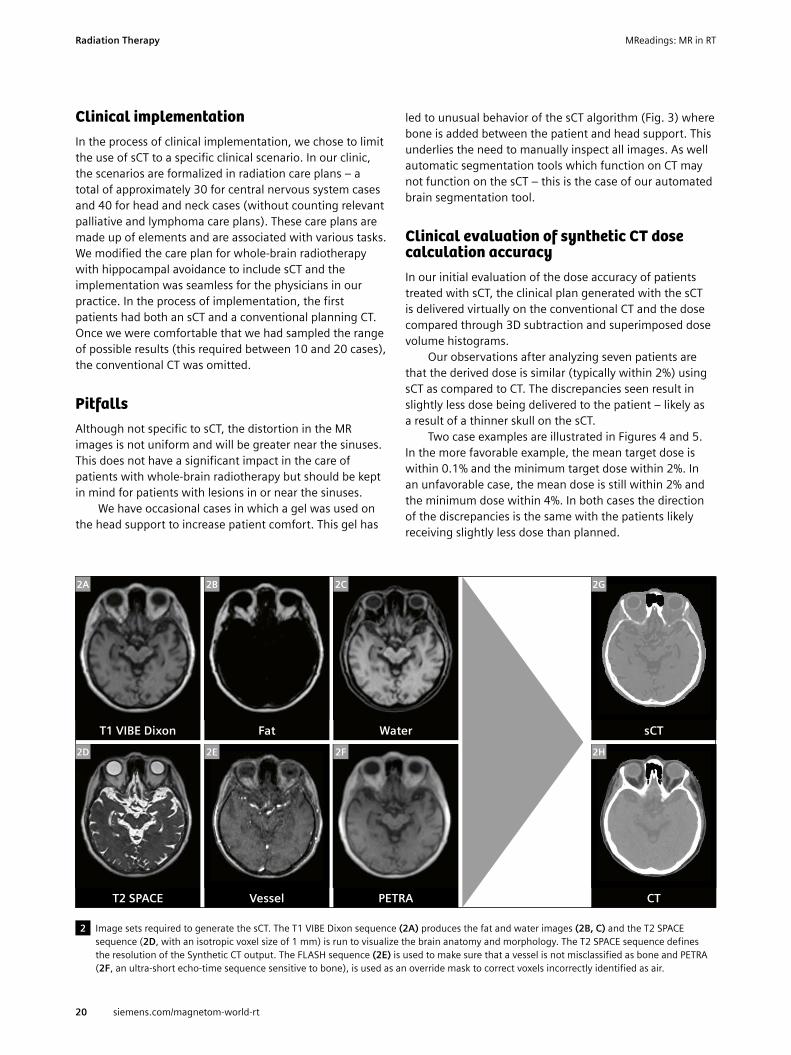
Clinical implementationIn the process of clinical implementation, we chose to limit the use of sCT to a specific clinical scenario. In our clinic, the scenarios are formalized in radiation care plans – a total of approximately 30 for central nervous system cases and 40 for head and neck cases (without counting relevant palliative and lymphoma care plans). These care plans are made up of elements and are associated with various tasks. We modified the care plan for whole-brain radiotherapy with hippocampal avoidance to include sCT and the implementation was seamless for the physicians in our practice. In the process of implementation, the first patients had both an sCT and a conventional planning CT. Once we were comfortable that we had sampled the range of possible results (this required between 10 and 20 cases), the conventional CT was omitted.
PitfallsAlthough not specific to sCT, the distortion in the MR images is not uniform and will be greater near the sinuses. This does not have a significant impact in the care of patients with whole-brain radiotherapy but should be kept in mind for patients with lesions in or near the sinuses.
We have occasional cases in which a gel was used on the head support to increase patient comfort. This gel has
led to unusual behavior of the sCT algorithm (Fig. 3) where bone is added between the patient and head support. This underlies the need to manually inspect all images. As well automatic segmentation tools which function on CT may not function on the sCT – this is the case of our automated brain segmentation tool.
Clinical evaluation of synthetic CT dose calculation accuracyIn our initial evaluation of the dose accuracy of patients treated with sCT, the clinical plan generated with the sCT is delivered virtually on the conventional CT and the dose compared through 3D subtraction and superimposed dose volume histograms.
Our observations after analyzing seven patients are that the derived dose is similar (typically within 2%) using sCT as compared to CT. The discrepancies seen result in slightly less dose being delivered to the patient – likely as a result of a thinner skull on the sCT.
Two case examples are illustrated in Figures 4 and 5. In the more favorable example, the mean target dose is within 0.1% and the minimum target dose within 2%. In an unfavorable case, the mean dose is still within 2% and the minimum dose within 4%. In both cases the direction of the discrepancies is the same with the patients likely receiving slightly less dose than planned.
2 Image sets required to generate the sCT. The T1 VIBE Dixon sequence (2A) produces the fat and water images (2B, C) and the T2 SPACE sequence (2D, with an isotropic voxel size of 1 mm) is run to visualize the brain anatomy and morphology. The T2 SPACE sequence defines the resolution of the Synthetic CT output. The FLASH sequence (2E) is used to make sure that a vessel is not misclassified as bone and PETRA (2F, an ultra-short echo-time sequence sensitive to bone), is used as an override mask to correct voxels incorrectly identified as air.
T1 VIBE Dixon Water
T2 SPACE Vessel
Fat
PETRA
sCT
CT
2E 2F
2G
2H
2A 2B 2C
2D
20
Radiation Therapy
siemens.com/magnetom-world-rt
MReadings: MR in RT

3A 3B 3 sCT artefact resulting from an immobilization device (3A: sCT and 3B: CT).
100
80
60
40
20
01000500 1500 2000 2500 3000 3500
Volu
me
%
Dose [cGy]
PTV sCTPTV CT Hippocampus left sCT
Hippocampus right sCTHippocampus left CTHippocampus right CT
4A 4B
4 Dose subtraction and dose volume histograms from a clinical case.
100
80
60
40
20
01000500 1500 2000 2500 3000 3500
Volu
me
%
Dose [cGy]
PTV sCTPTV CT Hippocampus left sCT
Hippocampus right sCTHippocampus left CTHippocampus right CT
5 Dose subtraction and dose volume histograms from a clinical case.
5A 5B
21
Radiation Therapy
siemens.com/magnetom-world-rt
MReadings: MR in RT

DiscussionWe have begun the clinical implementation of MR-only planning with the Siemens sCT protocol. Our preliminary evaluation is that this process allows a feasible and dosim-etrically satisfactory workflow for whole-brain treatments. Our next step is to expand the use of this technology to other higher-dose brain treatments (high-grade gliomas are expected to be next). The MR-only workflow does add additional quality control steps which will hopefully be streamlines in the future. In the medium term, we plan to investigate the use of generative adversarial network (machine learning) generated images in an attempt to accelerate our workflow and improve accuracy.
References
1 Lorna Young et al., IMV Radiation Therapy Market Summary Report, Oct 2018.
2 SH Hsu et al., Investigation of a method for generating synthetic CT models from MRI scans of the head and neck for radiation therapy, Phys Med Biol. 2013 Dec 7;58(23):8419-35.
3 E Paradis et al., Assessing the dosimetric accuracy of MR-generated synthetic CT images for focal brain VMAT radiotherapy, Int J Radiat Oncol Biol Phys. 2015 Dec 1;93(5):1154-61.
4 SH Hsu et al., Quantitative Characterization of Ultrashort Echo (UTE) Images for supporting Air-Bone Separation in the Head, Phys Med Biol. 2015 Apr 7;60(7):2869-80.
5 Dr. Stéphane Muraro, Dr. Kinda Anna Saddi, White Paper: Simula-tion and data analysis in RT with syngo.via RT Image Suite, 2018.
6 Thian et al. Academic Radiology, 2014:21(4).7 https://www.siemens-healthineers.com/de/magnetic-
resonance-imaging/magnetom-world.8 D Thorwarth et al., Synthetic CT Generation for the Pelvic Region
Based on Dixon-MR Sequences: Workflow, dosimetric Quality and Daily Patient Positioning, 2018, MReadings: MR in RT, 5th Edition, ESTRO 2019:23-27.
9 DA Low et al, A technique for the quantitative evaluation of the dose distributions., Med Phys, 1998 May; 25(5):656-61.
Contact Dr. David Roberge Radiation Oncology Centre Hospitalier de l’Université de Montréal (CHUM) 1000, rue Saint-Denis Radio-oncologie, Pavillon C, C.S3.5002 Montreal QC H2X 0C1 Canada Tel.: +1 514 890-8254 [email protected] Jean-Charles Côté, PhD David Roberge, MD
22
Radiation Therapy
siemens.com/magnetom-world-rt
MReadings: MR in RT

Siemens Healthineers’ global MRI community offers peer-to-peer support and information. Radiation Oncologists, Radiologists, Medical Physicists, Technologists and Cardiologists have all contributed with publications, presentations, training documents, videos, case studies and more – all freely available to you via this unique network.
Put the advantages of the MAGNETOM World to work for you!
www.siemens.com/magnetom-world-rt
Don’t miss the MRI protocols and practical tips and tricks for several body regions from experts for both experts and novice users. The information can help in supporting your entire clinical team and grow your practice.
The centerpiece of the MAGNETOM World Internet platform consists of MAGNETOM users’ results. Here you will find articles, case reports and application tips allowing you to optimize your daily work.
Advertisement

Clinical Implementation of MR-guided Radiotherapy for Prostate Cancer in Halcyon-SystemZimmermann M.1; Lange A.2; Sabatino M.1; Giro C.1; Lorenzen J.3; Struck J.3; Dahle J.1; Würschmidt F.1; Kretschmer M.1
1Radiologische Allianz, Strahlentherapie, Hamburg, Germany2Beuth Hochschule für Technik, Berlin, Germany 3Radiologische Allianz, Diagnostische Radiologie, Hamburg, Germany
IntroductionIn Germany, prostate cancer is the most common cancer among men. Approximately 58,000 men are diagnosed with prostate cancer each year, and more than 14,000 men die from it [1]. Almost half of all patients receive external beam radiotherapy (EBRT). Before treatment, a three- dimensional radiation therapy plan is created. Many clinics use thin-slice CT images to define the clinical target volume (CTV). Because of the limited soft tissue contrast of CT images, and the uncertainties in the treatment planning process, a large margin is needed to create the planning
target volume (PTV). Early studies have shown that co-registered CT/MRI images improve target volume definition for radiotherapy planning of prostate cancer [2]. However, the image registration introduces an additional error in delineating targets and organs at risk (OARs) due to the modified geometry by two different examinations at two different time points.
A workflow based only on MR images (MR-only work-flow)1 offers considerably improved soft tissue contrast for CTV definition and improved OAR delineation without
Case Age [years] Weight [kg] Gleason score iPSA [ng/ml] TNM
1 76 92 3 + 3 = 6 10.25 cT2a cN0 M0
2 78 85 5 + 4 = 9 6.50 cT2a cN0 cM0
3 78 84 3 + 3 = 6 32.80 pT3b pN0 (0/18) R1 Pn1 cM0
4 82 95 4 + 5 = 9 88.61 cT2b-c cN0 cM0
5 58 – 4 + 4 = 8 5.70 cT2c cN0 cM0
6 79 82 4 + 5 = 9 12.70 cT2c cN0 cM0
7 75 87 4 + 3 = 7 9.53 cT2c cN0 cM0
8 77 86 3 + 3 = 6 7.80 cT2b cN0 cM0
9 80 72 4 + 3 = 7 42.00 cT2c cN0 M1
10 68 83 3 + 4 = 7 9.45 pT1b pN0 cM0
11 72 84 5 + 4 = 9 11.00 cT2c cN0 cM0 Pn1
12 67 80 3 + 4 = 7 – cT1c
13 71 72 3 + 4 = 7 101.00 pT3a pN0 (0/6) cM0 L0 V0 pM1 R1
14 74 85 4 + 5 = 9 6.58 cT2 cN0 cM0 pn1, G3
15 67 115 4 + 3 = 7 8.00 pT3b pN0 (0/5) L0 V0 Pn1 R1
Table 1: Clinical profile and tumor stages of the patients included in the implementation phase. Patients 6, 11, and 14 received radiation therapy to their lymph nodes.
24
Radiation Therapy
siemens.com/magnetom-world-rt
MReadings: MR in RT

registration errors. The acquisition and maintenance price is higher than that of CT imaging, but it can be considerably reduced by shared-use models including diagnostic radiology departments, so diagnostic images and MR-only sequences can be acquired in one session.
Optimizing the dose distribution requires electron density (or mass density), which is not provided by MR images. Moreover, modern image-guided radiotherapy (IGRT) linear accelerators need CT images as a reference to compare cone beam CT (CBCT) images with planning CT images for patient position correction before each treatment session. For these reasons synthetic CTs (sCT) have been introduced into clinical routine. Tissue classifica-tion methods as well as atlas-based and machine learning algorithms are used to generate sCT datasets from MR sequences. These algorithms have moved in recent years from research to the clinical world (so far for brain and pelvis cases). Commercially available solutions use some-what different methods to generate the sCT images, and come with different business models. Spectronic offers a cloud-based pay-per-use approach, whereas Siemens Healthineers offers a classic software license model.
The main objective of our analysis was clinical imple-mentation of the MR-only workflow in a novel ring-gantry linear accelerator system (Halcyon; Varian, Palo Alto, CA, USA) with daily CBCT based IGRT. We discuss in particular how daily CBCT guided IGRT based on sCT images com-pares with the traditional approach using a planning CT (pCT) image as reference. Detailed dose calculations are part of the comparison and complete the discussion.
Materials and methodsThe implementation phase of MR-only radiotherapy took place from May to August 2019. It included all prostate patients without contraindications (such as pacemakers, extensive endoprosthesis, claustrophobia). During the consent discussion, patients were required to follow an empty rectum protocol before each imaging and treatment session. For radiotherapy planning, patients received first a planning CT scan with virtual simulation, and immediately afterwards (within a maximum of 30 minutes) an MRI scan in identical position.
1. Patient collective
In total 15 patients with different tumor stages were included in this study: 11 patients with localized tumors (T1–2, N0, M0), three patients with locally advanced tu-mors (T3a–T3b, N0, M0) and one patient with metastasis to the sacrum. Twelve of the patients included in this study
received radiotherapy as primary therapy, and the other three received postoperative radiotherapy. Because of their PSA values and Gleason scores, three of the patients also had radiation therapy to their lymph nodes (Table 1).
2. CT/MRT virtual simulation
For pCT imaging, the SOMATOM Definition AS (Siemens Healthcare, Forchheim, Germany) with a slice thickness of 2 mm, 120 kV and iterative image reconstruction was used.
As MRI simulator, the 1.5T MAGNETOM Aera (Siemens Healthcare, Erlangen, Germany) installed in our clinic. Images are reconstructed with 2.5 mm slice thickness was used. Table 2 shows the acquired sequences.
For simulation purposes, patients must be scanned in the same position as on the treatment couch of the linear accelerator. So in the MRI scanner patients were positioned on a flat tabletop overlay using a knee immo bilization device, reproducing the positioning setup during pCT imaging and during the treatment with the Halcyon system.
Figure 1 shows the body coil (Body 18 long MR coil 1.5T) fixed in place with a coil positioning aid (INSIGHT Body Coil Holder; Qfix, Avondale, PA, USA).
In addition to the diagnostic images (sequences listed in Table 2), the T1- and T2-sequences, together with the generated sCT are imported into the oncology information system (OIS) ARIA (Varian, Palo Alto, CA, USA). Contouring of the target volumes is performed on the images obtained from these sequences, using the diagnostic findings recorded in ARIA as support. The workflow is integrated into the ARIA CarePath.
Step Sequence Time in min
Orientationlocalizer bh 00:17
localizer @center 00:17
Overviewt2 tse sag 3.5 mm 04:30
t2 haste cor mbh 00:49
Diffusion ep2d diff b50 800 1400 tra 3 mm 04:36
sCT Spectronic t2 tse tra p2 2.5 mm 13:35
sCT Siemens t1 sCTp1-Dixon 02:32
Perfusion with KMt1 vibe tra dyn 4 mm 02:05
t1 fl2d fs tra mbh 01:20
Total 30:17
Table 2: Description of sequences used.
1 MR protocols for Synthetic CT generation are works in progress for MAGNETOM Aera, they are currently under development and not for sale in the U.S. and in other countries. Their future availability cannot be ensured. MR protocols for Synthetic CT generation for 1.5T MAGNETOM Sola and 3T MAGNETOM Vida are clinically released.
25
Radiation Therapy
siemens.com/magnetom-world-rt
MReadings: MR in RT

3. Generation of sCT
3.1 Pay-per-use model (Spectronic)Spectronic (Helsingborg, Sweden) uses an atlas-based algorithm for sCT image generation, offered as a cloud-based service2. Anonymized MRI datasets are transferred from PACS or directly from the MRI scanner to the cloud using a DICOM-receiver installed at the clinic network. After being de-anonymized in the DICOM-receiver the generated sCTs are transferred to PACS. Customers are informed by E-mail that new data are available. The sCT images are generated using a statistical decomposition algorithm (SDA) [3]. The atlas-based method is combined with machine learning. The algorithm calculates the most probable CT representation for an MRI image set, according to previously acquired datasets. So it is important always to follow the same protocol and use the same scan param-eters when scanning patients, to obtain the same contrast as in the training datasets.
3.2 License-based model (Siemens Healthineers)Siemens Healthineers combines a tissue classification and an atlas-based method to generate the sCT image. From the required T1 VIBE Dixon sequence, four MR
datasets with different weighting in water, fat, in-phase and opposed-phase were obtained. The four sets or image sets are used by the syngo.via RT Image Suite to generate an sCT dataset in a few minutes (Fig. 2). Bones are rendered in the sCT image set using a multi atlas-based algorithm, so the three lowest lumbar vertebrae must be scanned during the sequence acquisition.
4. Treatment planning
A VMAT treatment plan was optimized using a Halcyon system (V2.0) with 6 MV flattening filter-free beam and Eclipse V15.6. Later, the sCT image and pCT image are reg-istered rigidly and the structures and beam configurations are transferred to the sCT image. On the sCT image, the treatment plan is re-calculated, without new optimization.
5. Treatment and image guided radiotherapy
5.1 Halcyon with iCBCT (online matching)For IGRT, the Halcyon linear accelerator uses daily CBCT with iterative image reconstruction (iCBCT) and slice thick-ness of 2 mm. A treatment session without imaging before dose application is not possible with this system.
2The information shown herein refers to products of a 3rd party, which are their regulatory responsibility. Please contact the 3rd party for further information.
1 Patient positioning in an MRI device using MRI compatible positioning aids: flat table top with knee immobilization device to reproduce the patient positioning from the simulation to the treatment, in this case using the Halcyon.
26
Radiation Therapy
siemens.com/magnetom-world-rt
MReadings: MR in RT

2 The synthetic CT algorithm for the pelvis, from image acquisition to synthetic CT image generation.
MR clinical image Assignment of voxel belonging to tissue class CT-like image
T1 VIBE Dixon
Water
Fat
Opposed Phase
In Phase
Classifier / Soft Tissue
Atlas / Bone
Synthetic CT image
3 Patient positioning on the Halcyon.
27
Radiation Therapy
siemens.com/magnetom-world-rt
MReadings: MR in RT

5.2 Offline matchingIn the implementation phase, each CBCT image is regis-tered offline with the pCT and sCT images (Siemens and Spectronic). Registration is based on intensity differences and a pixel-based similarity optimization. For this auto- registration, a region including the PTV and a margin of 2 cm was selected (Fig. 4). To calculate translations in x-, y- and z-directions, the following equation was used:
In order to perform this analysis analog to the clinical work, image registration was limited to translations, so rotation, pitch, and roll were not considered. 6. Quality assurance
Currently there is no official guideline for quality assurance (QA) for MRI systems used for radiotherapy planning. To measure geometric distortions in MRI, the GRADE Phantom (Spectronic) was used. As result of the analysis, a PDF is generated with a 3D overview of the distortion in a clinically relevant scan volume (Fig. 5).
4A 4B 4C
4 Example of image registration between CBCT images and CT images using soft tissue. The contoured PTV is in blue and the soft tissue used for the auto-registration algorithm is in red. The red line defines the volume of interest (VOI) used for the registration.
5 GRADE phantom from Spectronic, used to measure geometrical distortion. (5A) Image of the phantom. (5B) Phantom on the scanner allowing the measurement of geometric distortion in the entire scan field.
5A 5B
∆V = ∆VCBCT/pCT - (∆VCBCT/sCT + ∆VpCT/sCT)
transversal sagittal coronal
where the term ∆VpCT/sCT expresses the intrinsic offset between pCT and sCT images.
28
Radiation Therapy
siemens.com/magnetom-world-rt
MReadings: MR in RT

ResultsFigure 6 shows an example of the results from the different sCT generation methods. The solution from Spectronic with its continuous Hounsfield units (HU) distribution is similar to a planning CT image whereas the Siemens solution uses a discrete HU distribution: Air (-1000 HU), fat (-75 HU), water (0 HU), spongy bone (204 HU) and cortical bone (1170 HU) (Fig. 6). The soft tissue of bladder, rectum and prostate is assigned 0 HU, like water. The sCT images from Spectronic use different HU values for differ-ent soft tissues, in analogy to pCT images.
Dose distributionsDifferent therapy concepts regarding the total dose were used during this study. For comparison reasons, the calculated plans were all normalized to the mean PTV dose and only relative dose deviations were considered.
In Figure 7, mean dose differences of the 15 patients are represented using a boxplot diagram, showing the results for the following OARs: rectum, bladder, and right- and left femoral head. The plot gives the difference between the calculated dose based on the sCT (Spectronic) and pCT (left box); and between the calculated dose based on the sCT (Siemens) and pCT (right box). The total mean difference is below 2%.
6 Examples of pCT (6A), sCT (Spectronic: 6C) and sCT (Siemens: 6E) representation including HU surface histogram (pCT: 6B; Spectronic: 6D; Siemens: 6F) of the shown cross-sectional images. The HU histograms of the pCT and the sCT (Spectronic) have a continuous spectrum from -1000 to 1210 HU and -1000 to 1071 HU, respectively. The HU histogram of the sCT (Siemens) has discrete values.
pCT Histogram pCT
Pixe
l cou
nt
HU105
100
-1000 5000-500 1000
101
102
103
104
Pixe
l cou
nt
HU
105
100
-1000 5000-500 1000
101
102
103
104
Pixe
l cou
nt
HU
-1000 5000-500 1000102
103
104
sCT (Spectronic) Histogram (Spectronic)
sCT (Siemens Healthineers) Histogram (Siemens Healthineers)
6A 6B
6C 6D
6E 6F
29
Radiation Therapy
siemens.com/magnetom-world-rt
MReadings: MR in RT
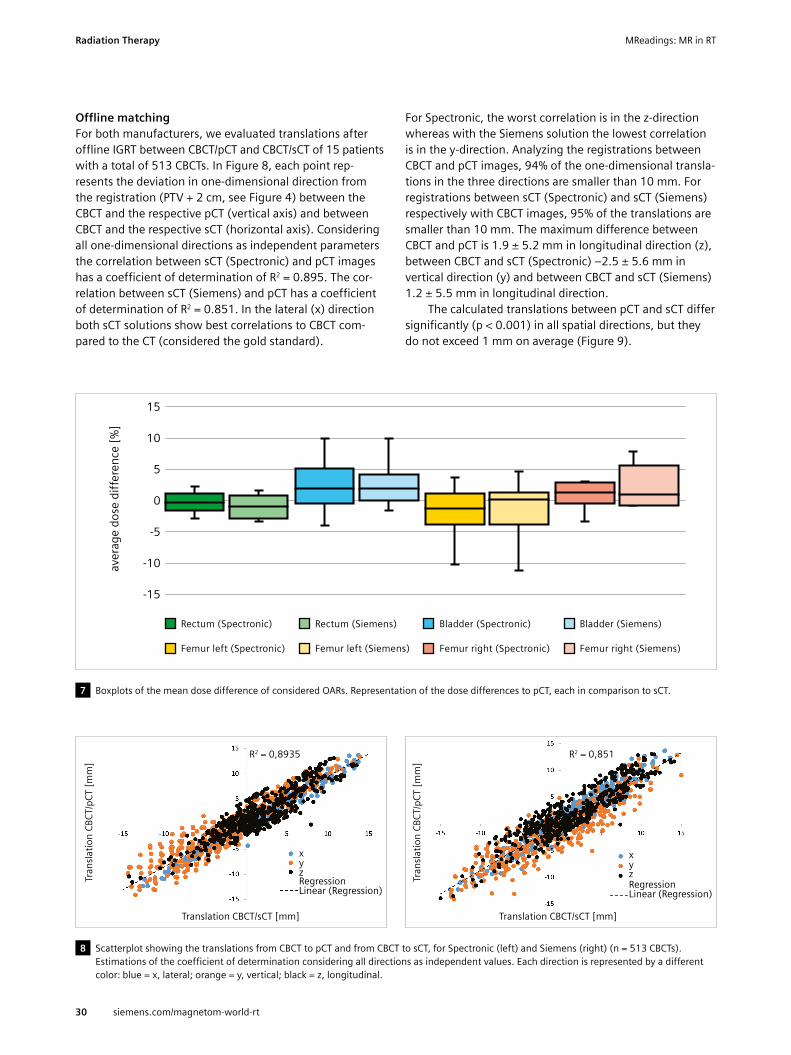
Offline matchingFor both manufacturers, we evaluated translations after offline IGRT between CBCT/pCT and CBCT/sCT of 15 patients with a total of 513 CBCTs. In Figure 8, each point rep-resents the deviation in one-dimensional direction from the registration (PTV + 2 cm, see Figure 4) between the CBCT and the respective pCT (vertical axis) and between CBCT and the respective sCT (horizontal axis). Considering all one-dimensional directions as independent parameters the correlation between sCT (Spectronic) and pCT images has a coefficient of determination of R2 = 0.895. The cor-relation between sCT (Siemens) and pCT has a coefficient of determination of R2 = 0.851. In the lateral (x) direction both sCT solutions show best correlations to CBCT com-pared to the CT (considered the gold standard).
For Spectronic, the worst correlation is in the z-direction whereas with the Siemens solution the lowest correlation is in the y-direction. Analyzing the registrations between CBCT and pCT images, 94% of the one-dimensional transla-tions in the three directions are smaller than 10 mm. For registrations between sCT (Spectronic) and sCT (Siemens) respectively with CBCT images, 95% of the translations are smaller than 10 mm. The maximum difference between CBCT and pCT is 1.9 ± 5.2 mm in longitudinal direction (z), between CBCT and sCT (Spectronic) –2.5 ± 5.6 mm in vertical direction (y) and between CBCT and sCT (Siemens) 1.2 ± 5.5 mm in longitudinal direction.
The calculated translations between pCT and sCT differ significantly (p < 0.001) in all spatial directions, but they do not exceed 1 mm on average (Figure 9).
8 Scatterplot showing the translations from CBCT to pCT and from CBCT to sCT, for Spectronic (left) and Siemens (right) (n = 513 CBCTs). Estimations of the coefficient of determination considering all directions as independent values. Each direction is represented by a different color: blue = x, lateral; orange = y, vertical; black = z, longitudinal.
7 Boxplots of the mean dose difference of considered OARs. Representation of the dose differences to pCT, each in comparison to sCT.
15
-15
-10
-5
0
5
10
aver
age
dose
diff
eren
ce [%
]
Rectum (Spectronic) Rectum (Siemens) Bladder (Spectronic) Bladder (Siemens)
Femur left (Spectronic) Femur left (Siemens) Femur right (Spectronic) Femur right (Siemens)
Tran
slatio
n CB
CT/p
CT [m
m]
Tran
slatio
n CB
CT/p
CT [m
m]
Translation CBCT/sCT [mm] Translation CBCT/sCT [mm]
xx
R2 = 0,8935 R2 = 0,851
RegressionRegressionLinear (Regression)Linear (Regression)zzyy
30
Radiation Therapy
siemens.com/magnetom-world-rt
MReadings: MR in RT

DiscussionIn order to integrate the MR-only workflow into our clinical routine we had to develop a new CarePath (ARIA, Varian). For this, the existing workflow has been extended by adding the MRI simulation, including the sCT generation, as new task. This modified workflow comprises the pCT scan acquisition, followed by MRI acquisition when the MRI scanner was available. Afterwards, the standard clinical workflow was carried out. During the validation phase of this study, pCT images were used as basis for
9 Boxplots of the translations of the CBCT registration to pCT, sCT (Spectronic) and sCT (Siemens). blue = x-direction, orange = y-direction, grey = z-direction.
contouring, dose calculation, and IGRT. In the analysis, the results from sCT are compared with pCT as a reference.
The MR-only workflow eliminates the error introduced in the standard MR/CT workflow when doing image regis-tration. Patient positioning during CT and MRI acquisition may be different. Moreover, scans are taken at different times, which can produce different internal geometry (for example bladder filling).
The standard simulation timeslot required for MR only is 45 minutes, independent of the chosen solution for sCT generation. The sequences required for sCT generation and
Tran
slatio
n [m
m]
15
20
-15
-20
-10
-5
0
5
10
Spectronic
Tran
slatio
n [m
m]
15
20
-15
-20
-10
-5
0
5
10
Siemens
p < 0,001 p < 0,001 p < 0,001
p < 0,001 p < 0,001 p < 0,001
X (CBCT/pCT) X (CBCT/sCT) Y (CBCT/pCT) Y (CBCT/sCT) Z (CBCT/pCT) Z (CBCT/sCT)
X (CBCT/pCT) X (CBCT/sCT) Y (CBCT/pCT) Y (CBCT/sCT) Z (CBCT/pCT) Z (CBCT/sCT)
31
Radiation Therapy
siemens.com/magnetom-world-rt
MReadings: MR in RT

Contact Mandy Zimmermann M.Sc. Medical Physics Radiologische Allianz Hamburg Mörkenstraße 47 22767 Hamburg Germany Tel.: +49 (40) 325552-598 [email protected]
also the diagnostic images for staging are taken at this time. If diagnostic images are already available, the timeslot is shortened to 20 minutes to acquire T2- and T1-Dixon sequences for contouring, and generate sCT images. The advantage of the quick T1-Dixon sequence from the Siemens solution is reduced when considering that a T2 sequence is normally needed for contouring. However, an important advantage of the quick acquisition is that motion artifacts are less prominent compared with those from a long sequence acquisition for sCT generation.
All 15 patients included in the implementation phase received a daily image-guided radiotherapy treatment in the prostate region at the Halcyon linear accelerator. A total of 513 CBCT images were compared with pCT and sCT images to calculate the translation. The values were significantly different when comparing the results from pCT (reference) images to the results from sCT images. The correlations (R² = 0.85–0.89) from CBCT/pCT and CBCT/sCT images demonstrate the difficulty when comparing the translation values from pCT and sCT images because of changes in geometry between pCT and MRI (sCT) scans taken at different times. The mean differences are smaller than 1.1 mm, and therefore not clinically relevant for daily IGRT on the Halcyon. They are, moreover, in accordance with already published studies [4].
IGRT based on sCT can therefore be performed on the Halcyon-System and allows the replacement of the conventional workflow using pCT as reference imaging for online matching. For the considered OARs the dose calculations based on sCT image sets from Siemens and
Spectronic show small mean differences and dose distributions.
The GRADE Phantom, adapted to MRI, allows to scan a large field of view, comparable to the field of view used for a pelvis patient. The mean distortion value measured in a clinically relevant field of view (150–200 mm from magnet isocenter) is 0.76 mm.
ConclusionThe MR-only workflow with the 1.5T MAGNETOM Aera has been successfully implemented. High contrast images for prostate contouring, and the immediate availability of the radiological report integrated in the ARIA OIS are helpful features that will lighten the daily workload in a busy clinical environment. The daily IGRT using the sCT image generated with the solution either from Siemens or Spectronic as reference CT can be performed on the Halcyon-system and allows the replacement of the conven-tional workflow using a pCT. The “pay-per-use”-model of-fered by Spectronic allows costs to be assigned to patients. The advantage of a license-based model as offered by Siemens is the unlimited and real-time availability of sCT.
References
1 Robert Koch Institute, Society of Epidemiological Cancer Registries in Germany, editors. Cancer in Germany for 2015/2016, 12th edition. Berlin, 2019.
2 Nyholm T, Nyberg M, Karlsson MG, Karlsson M. Systematisation of spatial uncertainties for comparison between a MR and a CT-based radiotherapy workflow for prostate treatments. Radiat Oncol. 2009; 4(1): 54. doi:10.1186/1748-717X-4-54.
3 Siversson C, Nordström F, Nilsson T, Nyholm T, Jonsson J, Gunnlaugsson A, Olsson LE. MRI only prostate radiotherapy planning using the statistical decomposition algorithm. Med. Phys. 2015; 42(10): 6090-6097. doi:10.1118/1.4931417.
4 Chen S, Quan H, Qin A, Yee S, Yan D. MR image-based synthetic CT for IMRT prostate treatment planning and CBCT image-guided localization. J Appl Clin Med Phys. 2016; 17(3): 236–245.doi:10.1120/jacmp. v17i3.6065.
Left to right: M.Sc. Marcello Sabatino, Dr. Matthias Kretschmer, M.Sc. Mandy Zimmermann, Dr. Christian Giro
32
Radiation Therapy
siemens.com/magnetom-world-rt
MReadings: MR in RT

A Fully Automated, End-to-End Prostate MRI Workflow Solution Incorporating Dot, Ultrashort Biparametric Imaging and Deep- Learning-based Detection, Classification, and ReportingDavid J. Winkel, M.D.1; Robert Grimm, Ph.D.2; Thomas Benkert, Ph.D.2; Berthold Kiefer, Ph.D.2; Daniel T. Boll, M.D.1
1Department of Radiology, University Hospital Basel, Switzerland2MR Applications Predevelopment, Siemens Healthineers, Erlangen, Germany
IntroductionFor more than a decade, magnetic resonance imaging (MRI) has been established as a powerful tool for prostate cancer diagnosis. The PROMIS study has demonstrated that prostate MRI is a suitable triage tool for biopsy-naïve men, reducing the number of unnecessary biopsies by a quarter while improving the detection of clinically signifi-cant cancer [1]. The PRECISION study randomized patients to either systematic biopsies or MRI; with no biopsy if MRI was negative, and targeted biopsy if MRI was positive. Targeted biopsies guided by MRI detected significantly more clinically significant cancers while reducing the number of clinically insignificant cancers [2]. Because of these findings, MRI for prostate cancer diagnosis has been integrated into established guidelines [3].
Increasing demand for prostate MRI examinations can be expected, as the incidence of prostate cancer increases with age and life-expectancy in developed countries is rising. Furthermore, prostate MRI has been discussed in the literature as a screening tool, similar to breast cancer screening [4]. However, several limitations need to be addressed in order to prepare for this increasing prostate MRI workload. Variation in MRI data acquisitions could be reduced [5]. Another limitation is the relatively long acqui-sition time of multiparametric MRI examinations (mpMRI) employing T2-weighted (T2w), diffusion-weighted imaging (DWI) and dynamic-contrast enhanced (DCE) MRI. Several studies have shown that an approach without DCE MRI, called biparametric MRI (bpMRI), yields comparable results to mpMRI of the prostate [6]. Potentially even more important topic is the varying interpretation performance based on the expertise level. However, even among expert
radiologists, agreement on prostate cancer classification based on established guidelines is imperfect [7, 8].
This all points to a clear need for 1. Efficient, reproducible, and robust data
acquisition workflow 2. Optimized and fast sequence design 3. Automated detection, classification, and reporting
workflows in prostate MRI examinations
1 Image acquisition using the Prostate Dot Engine1 including automated prostate contour detection, prostate centering, field of view adaption and three-dimensional correction of spatial axes.
1 Work in progress: the application is currently under development and is not for sale in the U.S. and in other countries. Its future availability cannot be ensured.
33siemens.com/magnetom-world-rt
MReadings: MR in RT AI in MR

This is a chain of independent, yet highly interlinked stages. Well-registered and reformatted images with reproducible high image quality are a key prerequisite for optimal and reproducible artificial intelligence- based analyses.
In this article, we outline an end-to-end solution that addresses all the limitations above, incorporating day optimizing throughput (Dot), ultrashort bpMRI and deep-learning-based lesion detection, classification and reporting. We present two example cases using the proposed workflow in order to illustrate its feasibility.
Material and methodsProstate Dot EngineThe Prostate Dot Engine1 is a prototype software tool designed to provide a fast, robust, and standardized image acquisition workflow. After acquiring the Turbo-Spin Echo (TSE) scout, the Prostate Dot automatically centers the prostate in the field of view, adapts the size of the field of view and performs a three-dimensional correction of spatial axes. Slices can be aligned either strictly orthogonal or automatically defined by the orientation of the urethra, i.e., perpendicular to the urethra for the axial planes. Furthermore, the prostate is segmented for standardized volume assessment. After coil placement, the Dot work-flow does not require further adaptations by technicians, and it allows interruptions and corrections of the scan process at any time. A screenshot of the Prostate Dot Engine can be found in Figure 1.
Sequence specificationsThe biparametric protocol consists of a T2-weighted turbo spin-echo (TSE) pulse sequence in axial, sagittal and coronal orientations and an improved single shot DWI EPI sequence (ZOOMitPRO, Siemens Healthcare, Erlangen, Germany) with consecutive computation of the apparent diffusion coefficient. Unlike other DWI techniques, ZOOMitPRO magnifies the prostate (in the phase-encoding direction) and is free of infolding artifacts. Either a smaller quadratic FOV or only a reduced FOV in the phase-encod-ing direction (‘stripe’) is excited (see Figure 2A). As there is no signal from the non-excited regions, only the small stripe needs to be encoded (see Figures 2B, C). That means the encoding time can be decreased while main-taining spatial resolution, or the spatial resolution can be increased, or a combination of the two. Furthermore, decreased encoding time reduces spatial distortion.
Prostate AIThe output of the Prostate Dot Engine goes into the AI prototype (Prostate AI1, Siemens Healthcare, Erlangen, Germany) for fully automatic prostate lesion detection, classification and reporting.
As illustrated in Figure 3, Prostate AI contains two parts:1. A preprocessing pipeline 2. A component for lesion detection and classification,
based on deep learningThe preprocessing pipeline takes the acquired bpMRI sequences and generates the required well-formatted and transformed data volumes. From the DWI series, a logarithmic extrapolation method is adopted to compute a new DWI volume with b-value of 2000 s/mm2. This step
2 Single-shot DWI EPI sequence (ZOOMitPRO) with image examples from one study object: (2A) reduced FOV in phase-encoding direction (blue stripe); (2B) resulting image in comparison to (2C) the conventional RESOLVE technique.
2C2B2A
34 siemens.com/magnetom-world-rt
MReadings: MR in RTAI in MR

3 Image acquisition workflow using the automated Prostate Dot Engine and biparametric imaging (orange); deep learning architecture with preprocessing pipeline (gray); deep learning-based lesion detection and classification component (blue).
Dot = day optimizing throughput, FOV = field of view, 3D = three-dimensional, TA = time of acquisition, DICOM = Digital Imaging and Communications in Medicine, ADC = apparent diffusion coefficient, FP = false positive, PI-RADS = Prostate Imaging Reporting- and Data System
Automated Dot Engine
Axial Scout Images
FOV Sizing
Prostate Centering
3D Correction of Spatial Axes
Biparametric Imaging
T2-weighted Turbo-Spin Echo in axial, sagittal
and coronal orientations
Diffusion-Weighted Imaging using
ZOOMit
TA = 2:43 min
TA = 3:37 min
DWI-2000 & ADC Computation
ADC Computation
T2WI Segmentation
RegistrationVolume Centering,
Cropping & Transformation
Volume Parsing & Loading
Raw DICOM Sequences
Crop Localization Net
FP Reduction Net
PI-RADS Scoring Net
PI-RADS 3PI-RADS 4PI-RADS 5
bpMRI SubvolumesPI-RADS 1&2 vs.PI-RADS ≥ 3
PI-RADS 1&2 vs.PI-RADS ≥ 3
Data Visualization
Review, Edit & Finalize Report
Report Generation
35siemens.com/magnetom-world-rt
MReadings: MR in RT AI in MR

can eliminate the b-value variances among the datasets and also improve lesion detection performance [10]. Also, apparent diffusion coefficient (ADC) maps are computed.Next, whole-organ gland segmentation is performed on the T2w volume using a learning-based method as presented in Yang et al. [11]. After segmentation, a rigid registration is conducted to align T2w and DWI images. The preprocessing pipeline can eliminate both geometric and intensity variances across sequences and patient studies.
Prostate AI then automatically detects clinically rele-vant lesions and classifies each detected lesion according to PI-RADS categories. This is achieved by a sequence of coupled deep neural networks that are trained separately. First, a fully convolutional localization net is able to gener-ate a semantic lesion candidate heatmap (see Figures 5 and 6); then a subvolume-based false positive reduction net further improves detection accuracy by removing the false positives; finally another sub-volume-based PI-RADS scoring net stages the level of malignancy for each detec-tion according to PI-RADS categories.
In a last step, Prostate AI displays the detection and classification results on a dedicated platform. As the ability of the interpreting radiologist to accept or reject AI-based findings has been identified as a prerequisite for adoption of these techniques [12], these capabilities have been implemented. The user is then able to create a machine- readable report with all relevant information for the referring physician (see Figure 4). This report can be sent to the local RIS/PACS system.
CasesCase 1Figures 5A-D demonstrate a lesion in the right midgland PZpl/PZa of a 62-year-old man, with a maximum diameter of 30.2 mm and a mean ADC-value of 758 µm²/s. Prostate AI detected the lesion and assigned a PI-RADS 5 category. Biopsy results revealed a Gleason 4+3 = 7 pattern.
4 Data visualization platform with the T2w images, ADC map, and high b-value image as well as the T2w image overlaid with the AI-generated heatmap (in red and yellow). Prostate AI automatically detected the suspect lesion in the transition zone (TZ, yellow dot) and pre-populated all relevant information according to current PI-RADS guidelines. Next, a machine-readable report based on this information is generated.
5A 5B
5C 5D
36 siemens.com/magnetom-world-rt
MReadings: MR in RTAI in MR

Case 2Figures 6A-D demonstrate a lesion in the left apical PZpl of a 51-year-old man, with a maximum diameter of 10.2 mm and a mean ADC-value of 961 µm²/s. Prostate AI detected the lesion and assigned a PI-RADS 4 category. Biopsy results revealed a Gleason 3+3 = 6 pattern.
ConclusionIn this article, we outlined an end-to-end concept to allow a standardized workflow with a reproducible and fast data acquisition with optimized imaging sequences and an AI-empowered data analysis including automated detec-tion, classification and reporting of suspicious lesions in biparametric prostate MRI examinations.
Reproducible and fast data acquisition concepts are not only contributing to a standardized reporting per-formed by human readers but would also help artificial intelligence-based solutions to reliably process input data. Preliminary results from a study conducted at the Universi-ty of Innsbruck in Austria including 50 patients referred for a prostate MRI examination, compared the tilting angle of the auto-alignment of the Prostate Dot Engine against axes determined manually by an experienced radiologist, serving as the reference-standard. The investigators were able to show a mean ± SD deviation of the tilting angle of 5.5 ± 4.4 degrees (Ch. Kremser, W. Judmaier, Med. Uni Innsbruck, unpublished results). However, to date,
there is no study investigating workflow differences, such as time-saving metrics, between Dot-guided and conven-tional, technician-guided workflows. Those studies are currently planned, and their results will contribute to reveal the value of Dot engines in clinical routine.
Concerning the use of abbreviated protocols consisting of T2-weighted and DWI only – so-called biparametric prostate MRI – several studies [6, 13, 14] have shown comparable results as obtained with conventional, mpMRI protocols including DCE-MRI. We added another compo-nent to our suggested workflow, that is performing DWI with the ZOOMitPRO. As shown in Figure 2, ZOOMitPRO uses a reduced FOV in the phase-encoding direction compared with either standard single shot DWI EPI or RESOLVE (REadout Segmentation Of Long Variable Echo trains). The resulting decreased acquisition time can be invested in a superior spatial resolution. Future studies are needed to systematically investigate differences between different types of DWI acquisition schemes compared to the ZOOMitPRO technique.
The last component in our workflow is the use of AI-based lesion detection and classification. Schelb et al. [15] used the input from T2w sequences and DWI to train a deep learning algorithm (Unet) on the histopathological outcome, serving as ground truth. They were able to show that this algorithm achieved a similar performance to human readers using the PI-RADS assessment score. Cao et al. [16] used the input of mpMRI images to build a convolutional neural network trained on histopathological data and used this algorithm to detect suspicious lesions and to predict the Gleason score. The results were promis-ing, with a high sensitivity for lesion detection – compara-ble to expert human readers – and a high classification performance with regards to clinically significant cancer. However, the usefulness of these algorithms needs to be proven in larger multi-reader, multi-case (MRMC) studies, systematically examining their influence on interpretation performance and speed, with and without those solutions.
We have identified a need to re-structure existing prostate MRI workflows, as patient or – in case of screen-ing approaches – participant throughput is expected to increase. In our vision, current workflows need more reliable, reproducible and fast data acquisition steps. Furthermore, recent research has shown that deep learn-ing algorithms can compete with human intelligence in prostate MRI reporting. We outlined a possible end-to-end solution and demonstrated its feasibility with two case examples. Future research will investigate what impact the individual components or the combination of those components will have on the future of prostate MRI.
6A 6B
6C 6D
37siemens.com/magnetom-world-rt
MReadings: MR in RT AI in MR

Contact David J. Winkel, M.D. Department of Radiology University Hospital Basel Spitalstrasse 21 4031 Basel Switzerland Tel.: +41 61 328 65 22 [email protected]
References
1 Ahmed HU, El-Shater Bosaily A, Brown LC, et al. Diagnostic accuracy of multi-parametric MRI and TRUS biopsy in prostate cancer (PROMIS): a paired validating confirmatory study. Lancet. 2017;389:815–822. https://doi.org/10.1016/S0140-6736(16)32401-1
2 Kasivisvanathan V, Rannikko AS, Borghi M, et al. MRI-Targeted or Standard Biopsy for Prostate-Cancer Diagnosis. N Engl J Med. 2018;378:1767–1777. https://doi.org/10.1056/NEJMoa1801993
3 EAU Guidelines. Presented at the EAU Annual Congress Barcelona 2019. ISBN 978-94-92671-04-2.
4 Kim SJ, Vickers AJ, Hu JC. Challenges in Adopting Level 1 Evidence for Multiparametric Magnetic Resonance Imaging as a Biomarker for Prostate Cancer Screening. JAMA Oncol. 2018;4:1663–1664. https://doi.org/10.1001/jamaoncol.2018.4160
5 Padhani AR, Barentsz J, Villeirs G, et al. PI-RADS Steering Commit-tee: The PI-RADS Multiparametric MRI and MRI-directed Biopsy Pathway. Radiology. 2019;292:464–474. https://doi.org/10.1148/radiol.2019182946
6 Weiss J, Martirosian P, Notohamiprodjo M, et al. Implementation of a 5-Minute Magnetic Resonance Imaging Screening Protocol for Prostate Cancer in Men with Elevated Prostate-Specific Antigen before Biopsy. Invest Radiol. 2018;53:186–190. https://doi.org/10.1097/RLI.0000000000000427
7 Weinreb JC, Barentsz JO, Choyke PL, et al. PI-RADS Prostate Imaging - Reporting and Data System: 2015, Version 2. Eur Urol. 2016;69:16–40. https://doi.org/10.1016/j.eururo.2015.08.052
8 Rosenkrantz AB, Ginocchio LA, Cornfeld D, et al. Interobserver Reproducibility of the PI-RADS Version 2 Lexicon: A Multicenter Study of Six Experienced Prostate Radiologists. Radiology. 2016;280:793–804. https://doi.org/10.1148/radiol.2016152542
9 Maas MC, Fütterer JJ, Scheenen TW. Quantitative evaluation of computed high b value diffusion-weighted magnetic resonance imaging of the prostate. Invest Radiol. 2013;48:779.
10 Rosenkrantz AB, Parikh N, Kierans AS, et al. Prostate Cancer Detection Using Computed Very High b-value Diffusion-weighted Imaging: How High Should We Go? Acad Radiol. 2016;23:704–711. https://doi.org/10.1016/J.ACRA.2016.02.003
11 Yang D, Xu D, Zhou SK, et al. Automatic Liver Segmentation Using an Adversarial Image-to-Image Network. In: Descoteaux M, Maier-Hein L, Franz A, et al (eds) Medical Image Computing and Computer Assisted Intervention − MICCAI 2017. Springer International Publishing, Cham. 2017; pp 507–515.
12 Padhani AR, Turkbey B. Detecting Prostate Cancer with Deep Learning for MRI: A Small Step Forward. Radiology. 2019;192012. https://doi.org/10.1148/radiol.2019192012
13 Kuhl CK, Bruhn R, Krämer N, et al. Abbreviated Biparametric Prostate MR Imaging in Men with Elevated Prostate-specific Antigen. Radiology. 2017;282:493–505. https://doi.org/10.1148/radiol.2017170129
14 Woo S, Suh CH, Kim SY, et al. Head-to-head comparison between biparametric and multiparametric MRI for the diagnosis of prostate cancer: A systematic review and meta-analysis. Am J Roentgenol. 2018;211:W226–W241. https://doi.org/10.2214/AJR.18.19880
15 Schelb P, Kohl S, Radtke JP, et al. Classification of Cancer at Prostate MRI: Deep Learning versus Clinical PI-RADS Assessment. Radiology. 2019;190938. https://doi.org/10.1148/radiol.2019190938
16 Cao R, Bajgiran AM, Mirak SA, et al. Joint Prostate Cancer Detection and Gleason Score Prediction in mp-MRI via FocalNet. IEEE Trans Med Imaging. 2019;38:2496–2506. https://doi.org/10.1109/TMI.2019.2901928
38 siemens.com/magnetom-world-rt
MReadings: MR in RTAI in MR

Siemens Healthineers: Our brand name embodies the pioneering spirit and engineering expertise that is unique in the healthcare industry. The people working for Siemens Healthineers are totally committed to the company they work for, and are passionate about their technology. In this section we introduce you to colleagues from all over the world – people who put their hearts into what they do.
Meet Siemens Healthineers
How did you first come into contact with MRI?As a medical physicist in radiotherapy departments, I was in contact with MR images, but not with MR systems. Images were produced elsewhere, and we used them to support therapy planning. I was very impressed by the soft-tissue contrast MRI could achieve, which is especially useful for head and pelvis cases in radiotherapy. My first real contact with an MR system was when I joined Siemens Healthineers. I’m amazed at everything I’ve learned this past year, and at everything that MRI can offer to radiotherapy.
What do you find most fascinating about MRI?That’s a difficult question: The technology is so fascinating that it’s hard to choose one thing. Compared to the classic CT radiotherapy world, for example, it’s fascinating that you can measure different physical processes and obtain different images and therefore different clinical informa-tion, all in one measurement session. I’m also astonished at the contrast provided by MRI images. It enables clinicians to establish the boundaries between organs and tumors much more confidently. I would say that MRI reveals ana-tomical and physiological details that we could previously only guess from CT images. I’m also very interested in the possibilities presented by functional imaging for assessing treatments or even predicting treatment outcomes. It might also play an important role in dose painting in the future. Overall, MRI and radiotherapy are a recently mar-
ried pair that are opening up a new world of possibilities for cancer treatment.
What do you find motivating about your job?I see my role as a mediator between the MRI and radio- therapy worlds. They have different ways of working, and even a different language. And now that the use of MRI in radiotherapy is increasing so quickly, they are forced to understand each other. As a mediator, I must understand both MR and radiotherapy, and build the bridges that enable communication. I find this task very interesting, and the challenges associated with it are very motivating.
If you could do anything you wanted for a month, what would it be?I’d probably spend some time performing measurements with our MR systems, learning all the information we can acquire from different sequences, and building my expertise for our software solutions.
Outside of work, you can usually find me with my two sons, reading a book, playing a board game, or riding a bike. I am very family oriented and I love travelling. So when we have free time, we visit my parents in Spain, or my parents-in-law in Brazil. I also love discovering new places with my husband and my kids. For example, we’re traveling to Norway by car this summer and we’re already excited about it.
Nuria Escobar Corral, Ph.D. I was born and raised in Spain. I moved to Germany when I was 21, as part of the ERASMUS exchange program between European universities. It was supposed to just be for a year, but I ended up staying. After earning a degree in physics from Universidad de Valencia, Spain, I went on to work as a medical physicist in the Department of Radiotherapy at Uniklinik RWTH Aachen, Germany, from 2009 to 2017. During this time, I also earned my Ph.D. in a collaboration with the Department of Physics at RWTH Aachen University. In 2017, my family and I moved to Bamberg, where I spent 18 months working in the Department of Radiation Oncology at University Hospital Erlangen, before joining Siemens Healthineers in April 2019. In my role as a clinical and scientific specialist in imaging for radiotherapy, I work on topics involving the use of multimodality imaging in radiotherapy.
Forchheim, Germany
39
Meet Siemens Healthineers
siemens.com/magnetom-world-rt
MReadings: MR in RT

MRe
adin
gs: M
R in
RT
Not for distribution in the US
On account of certain regional limitations of sales rights and service availability, we cannot guarantee that all products included in this brochure are available through the Siemens sales organization worldwide. Availability and packaging may vary by country and is subject to change without prior notice. Some/All of the features and products described herein may not be available in the United States.
The information in this document contains general technical descriptions of specifications and options as well as standard and optional features which do not always have to be present in individual cases, and which may not be commercially available in all countries.
Due to regulatory reasons their future availability cannot be guaranteed. Please contact your local Siemens organization for further details.
Siemens reserves the right to modify the design, packaging, specifications, and options described herein without prior notice. Please contact your local Siemens sales representative for the most current information.
Note: Any technical data contained in this document may vary within defined tolerances. Original images always lose a certain amount of detail when reproduced.
Siemens Healthineers HeadquartersSiemens Healthcare GmbH Henkestr. 127 91052 Erlangen, Germany Phone: +49 9131 84-0 siemens-healthineers.com
Published by Siemens Healthcare GmbH · Order No. A91MR-1100-110C-7600 · Printed in Germany · 8782 0420 · © Siemens Healthcare GmbH, 2020
siemens.com/magnetom-world-rt