Running Reports using SAS Web Report Studio
10
Running Reports using SAS Web Report Studio Introduction This document explains the key features of the SAS Web Report Studio (Web Report Studio) reporting tool. It is not specific to any one report. There is a separate, supplemental document for each Web Report Studio report that explains that report's purpose and filters. A complete list of reports can be found on the Finance Reporting Reference Guide and the HR/Payroll Reference Guide. The links to these documents are below: l http://ccinfo.unc.edu/resource-docs/finance-reporting-reference-guide/ l http://ccinfo.unc.edu/tools/hr-reporting/ Sections in this Document This document contains the following sections: l Accessing Web Report Studio Reports in InfoPorte l Running Web Report Studio Reports l Working with the Report Output l Common Web Report Studio Commands Accessing Web Report Studio Reports Web Report Studio reports are located in different places in InfoPorte, depending on the report's content. Always refer to the reporting guides for the navigation paths for each report. The navigation paths to some commonly used Web Report Studio reports are below. Example 1: OSR Campus Reports Several Web Report Studio reports related to grants are located at this navigation path: Finance > Dept Accounting > Grants > OSR Campus Reports Click the link to open the report. 1
-
Upload
khangminh22 -
Category
Documents
-
view
3 -
download
0
Transcript of Running Reports using SAS Web Report Studio
Running Reports using SAS Web Report StudioIntroduction
This document explains the key features of the SAS Web Report Studio (Web Report Studio)reporting tool. It is not specific to any one report. There is a separate, supplementaldocument for each Web Report Studio report that explains that report's purpose and filters.
A complete list of reports can be found on the Finance Reporting Reference Guide andthe HR/Payroll Reference Guide. The links to these documents are below:
l http://ccinfo.unc.edu/resource-docs/finance-reporting-reference-guide/
l http://ccinfo.unc.edu/tools/hr-reporting/
Sections in this Document
This document contains the following sections:
l Accessing Web Report Studio Reports in InfoPorte
l Running Web Report Studio Reports
l Working with the Report Output
l Common Web Report Studio Commands
Accessing Web Report Studio Reports
Web Report Studio reports are located in different places in InfoPorte, depending on thereport's content. Always refer to the reporting guides for the navigation paths for eachreport. The navigation paths to some commonly used Web Report Studio reports are below.
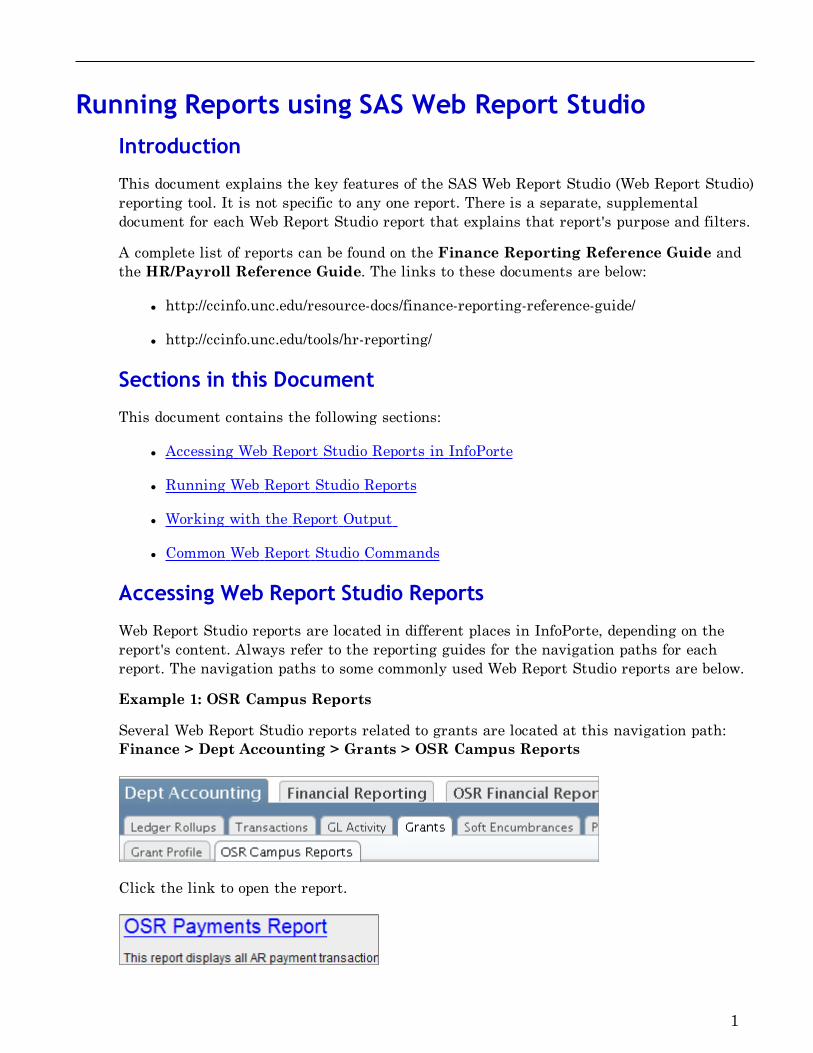
Example 1: OSR Campus Reports
Several Web Report Studio reports related to grants are located at this navigation path:Finance > Dept Accounting > Grants > OSR Campus Reports
Click the link to open the report.
1
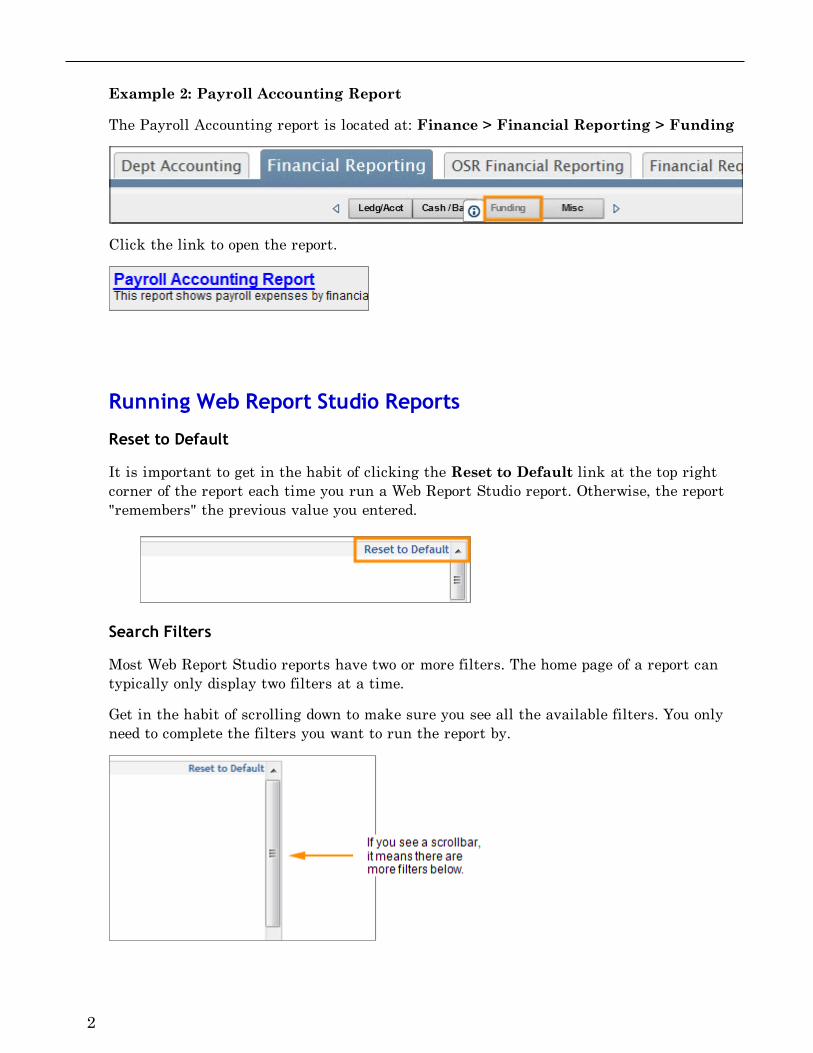
Example 2: Payroll Accounting Report
The Payroll Accounting report is located at: Finance > Financial Reporting > Funding
Click the link to open the report.
Running Web Report Studio Reports
Reset to Default
It is important to get in the habit of clicking the Reset to Default link at the top rightcorner of the report each time you run a Web Report Studio report. Otherwise, the report"remembers" the previous value you entered.
Search Filters
Most Web Report Studio reports have two or more filters. The home page of a report cantypically only display two filters at a time.
Get in the habit of scrolling down to make sure you see all the available filters. You onlyneed to complete the filters you want to run the report by.
2
Search or Enter Values
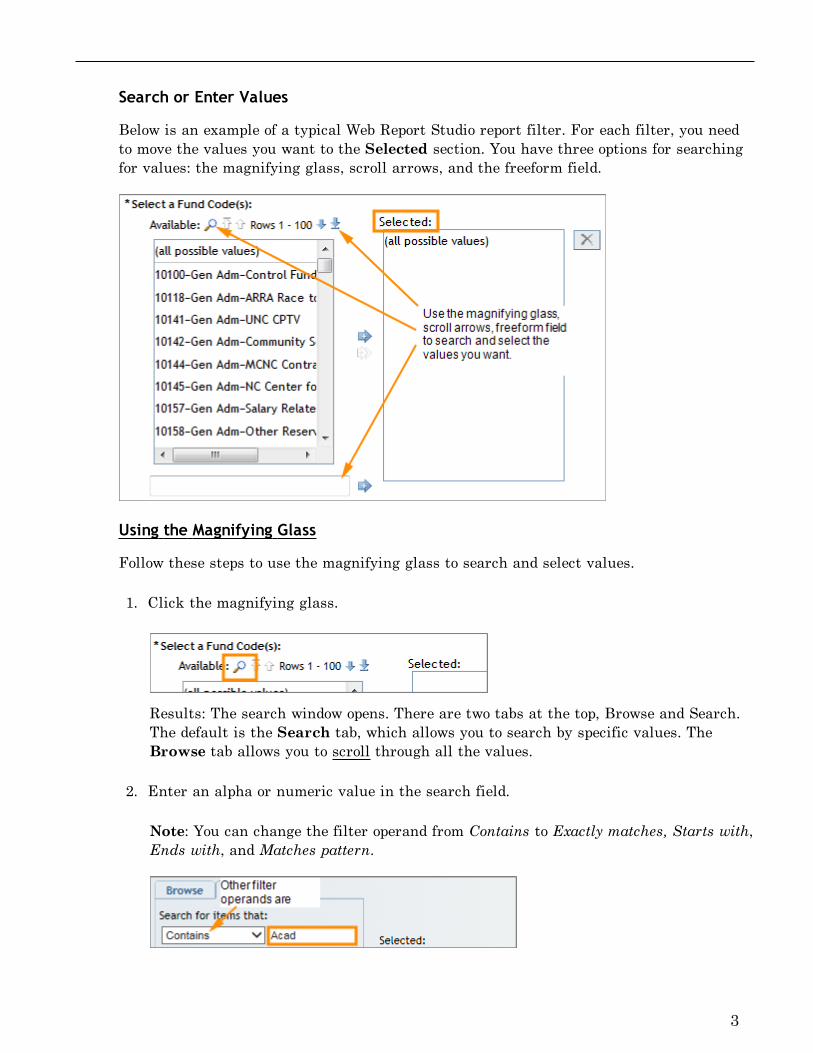
Below is an example of a typical Web Report Studio report filter. For each filter, you needto move the values you want to the Selected section. You have three options for searchingfor values: the magnifying glass, scroll arrows, and the freeform field.
Using the Magnifying Glass
Follow these steps to use the magnifying glass to search and select values.
1. Click the magnifying glass.
Results: The search window opens. There are two tabs at the top, Browse and Search.The default is the Search tab, which allows you to search by specific values. TheBrowse tab allows you to scroll through all the values.
2. Enter an alpha or numeric value in the search field.
Note: You can change the filter operand from Contains to Exactly matches, Starts with,Ends with, and Matches pattern.
3
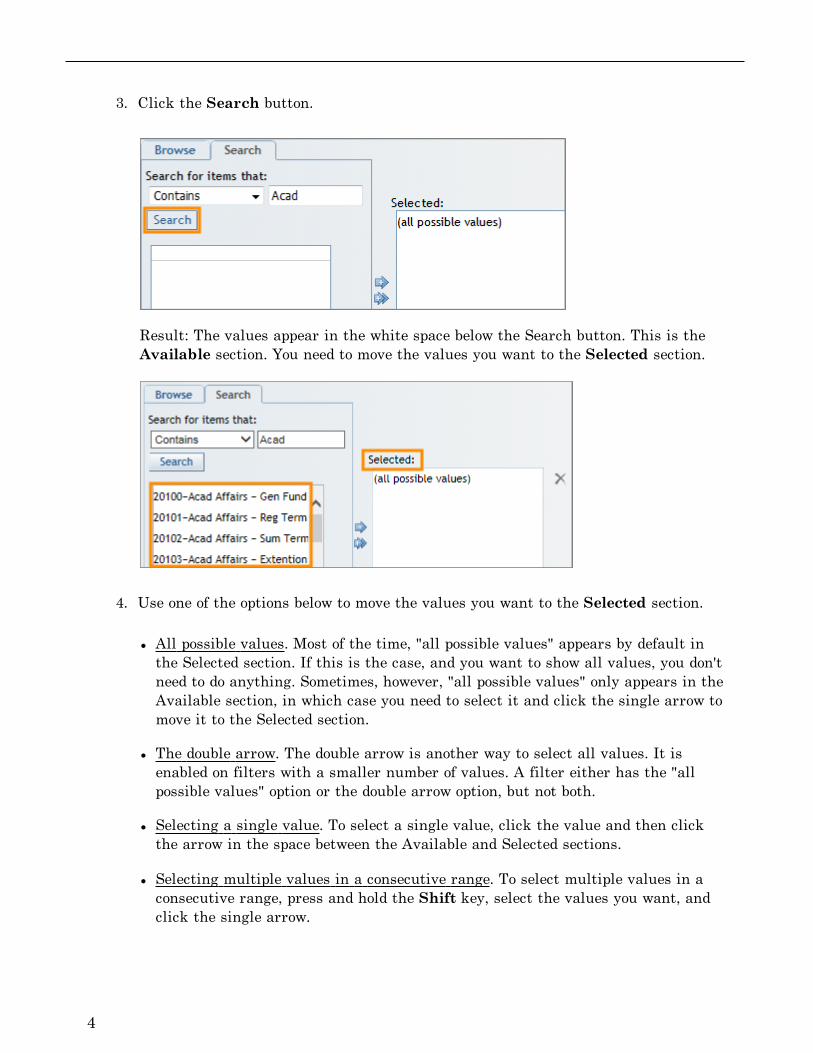
3. Click the Search button.
Result: The values appear in the white space below the Search button. This is theAvailable section. You need to move the values you want to the Selected section.
4. Use one of the options below to move the values you want to the Selected section.
l All possible values. Most of the time, "all possible values" appears by default inthe Selected section. If this is the case, and you want to show all values, you don'tneed to do anything. Sometimes, however, "all possible values" only appears in theAvailable section, in which case you need to select it and click the single arrow tomove it to the Selected section.
l The double arrow. The double arrow is another way to select all values. It isenabled on filters with a smaller number of values. A filter either has the "allpossible values" option or the double arrow option, but not both.
l Selecting a single value. To select a single value, click the value and then clickthe arrow in the space between the Available and Selected sections.
l Selecting multiple values in a consecutive range. To select multiple values in aconsecutive range, press and hold the Shift key, select the values you want, andclick the single arrow.
4
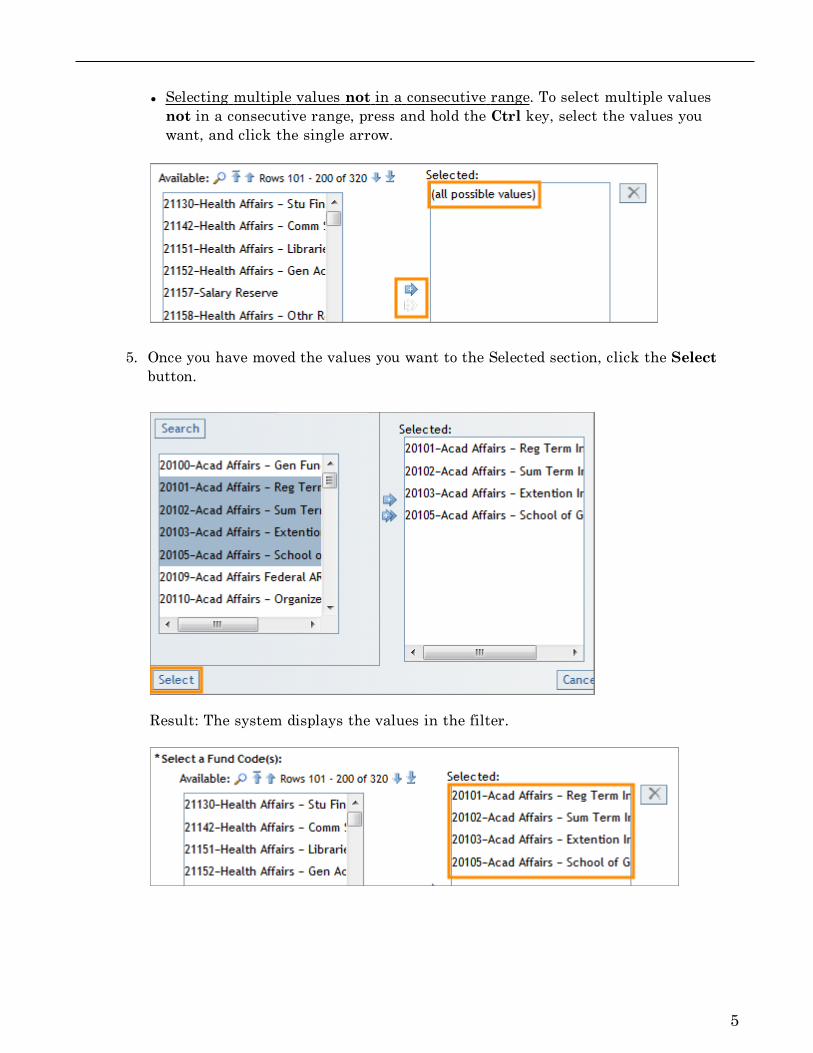
l Selecting multiple values not in a consecutive range. To select multiple valuesnot in a consecutive range, press and hold the Ctrl key, select the values youwant, and click the single arrow.
5. Once you have moved the values you want to the Selected section, click the Selectbutton.
Result: The system displays the values in the filter.
5
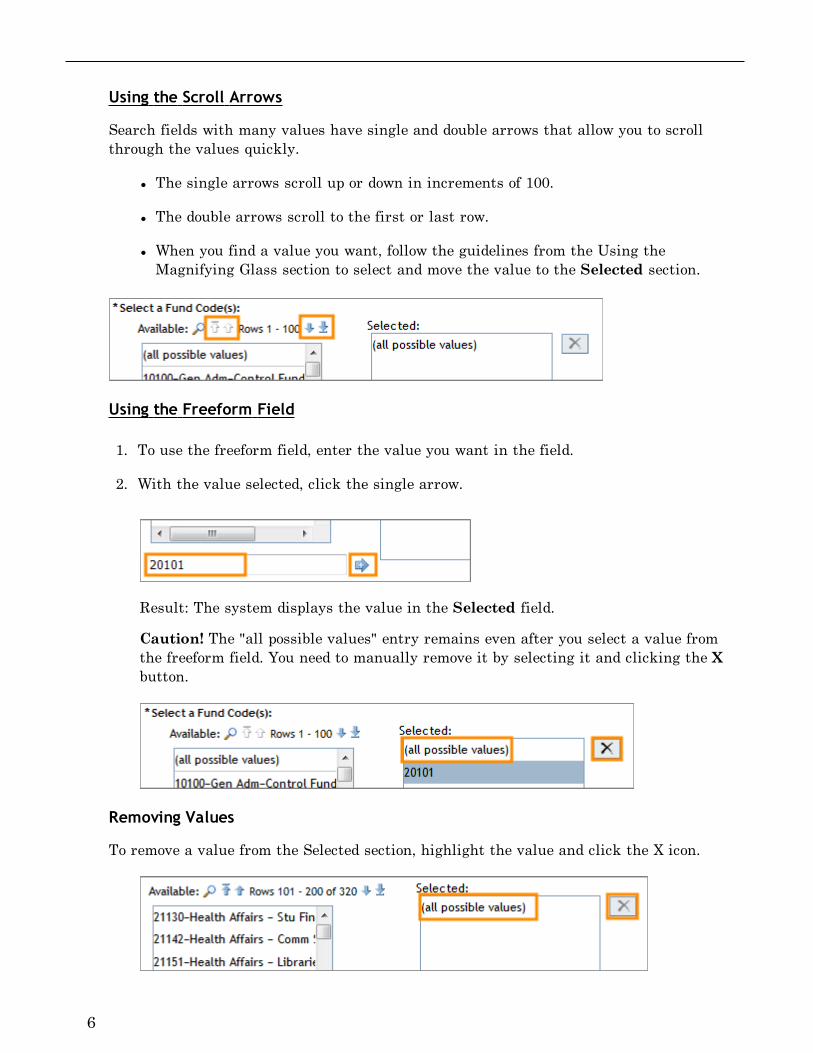
Using the Scroll Arrows
Search fields with many values have single and double arrows that allow you to scrollthrough the values quickly.
l The single arrows scroll up or down in increments of 100.
l The double arrows scroll to the first or last row.
l When you find a value you want, follow the guidelines from the Using theMagnifying Glass section to select and move the value to the Selected section.
Using the Freeform Field
1. To use the freeform field, enter the value you want in the field.
2. With the value selected, click the single arrow.
Result: The system displays the value in the Selected field.
Caution! The "all possible values" entry remains even after you select a value fromthe freeform field. You need to manually remove it by selecting it and clicking the Xbutton.
Removing Values
To remove a value from the Selected section, highlight the value and click the X icon.
6
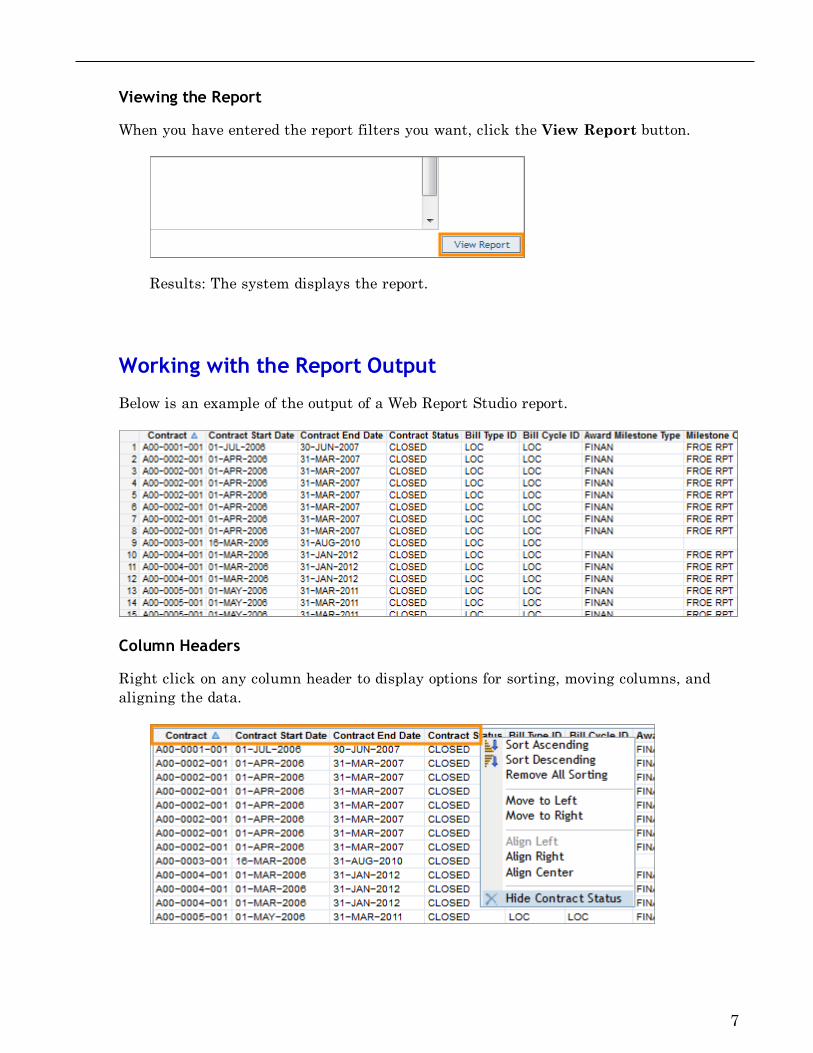
Viewing the Report
When you have entered the report filters you want, click the View Report button.
Results: The system displays the report.
Working with the Report Output
Below is an example of the output of a Web Report Studio report.
Column Headers
Right click on any column header to display options for sorting, moving columns, andaligning the data.
7
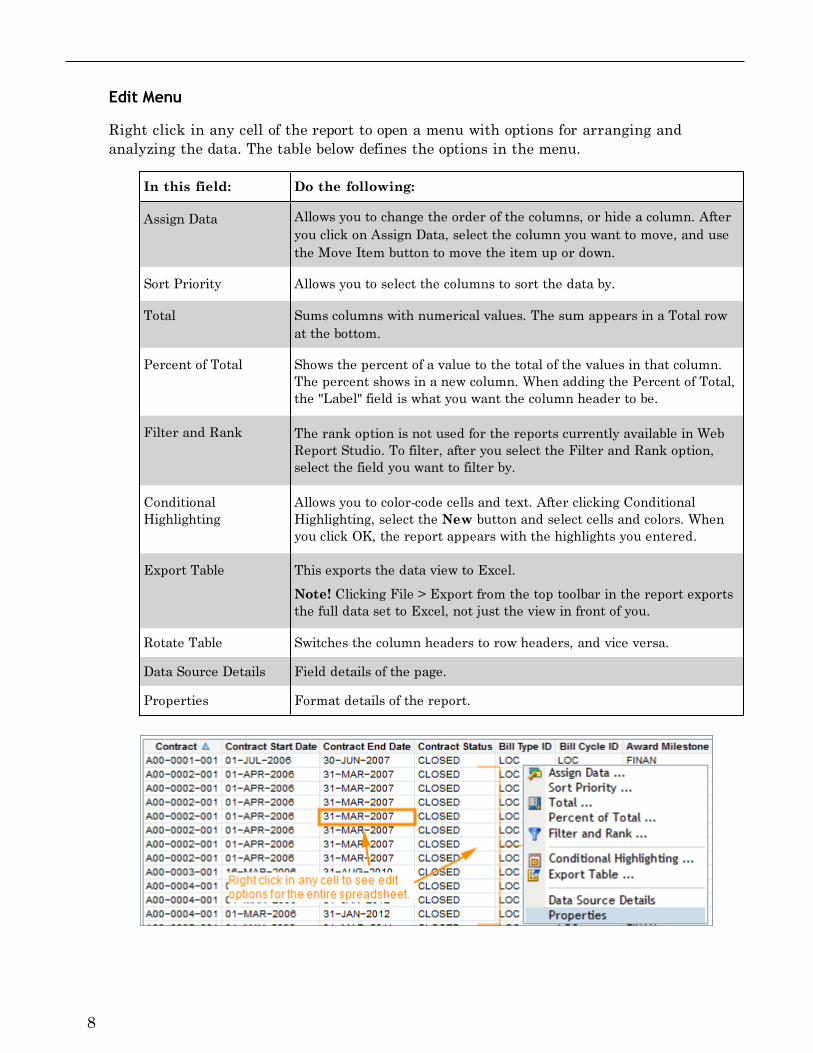
Edit Menu
Right click in any cell of the report to open a menu with options for arranging andanalyzing the data. The table below defines the options in the menu.
In this field: Do the following:
Assign Data Allows you to change the order of the columns, or hide a column. Afteryou click on Assign Data, select the column you want to move, and usethe Move Item button to move the item up or down.
Sort Priority Allows you to select the columns to sort the data by.
Total Sums columns with numerical values. The sum appears in a Total rowat the bottom.
Percent of Total Shows the percent of a value to the total of the values in that column.The percent shows in a new column. When adding the Percent of Total,the "Label" field is what you want the column header to be.
Filter and Rank The rank option is not used for the reports currently available in WebReport Studio. To filter, after you select the Filter and Rank option,select the field you want to filter by.
ConditionalHighlighting
Allows you to color-code cells and text. After clicking ConditionalHighlighting, select the New button and select cells and colors. Whenyou click OK, the report appears with the highlights you entered.
Export Table This exports the data view to Excel.
Note! Clicking File > Export from the top toolbar in the report exportsthe full data set to Excel, not just the view in front of you.
Rotate Table Switches the column headers to row headers, and vice versa.
Data Source Details Field details of the page.
Properties Format details of the report.
8
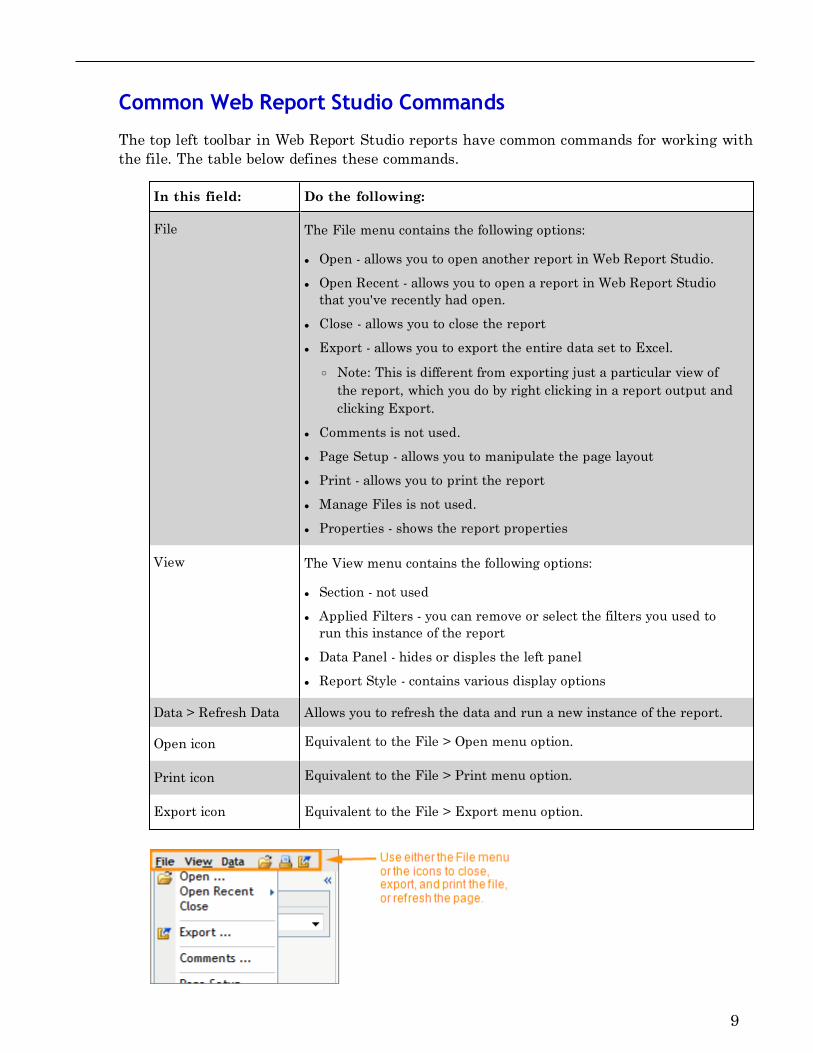
Common Web Report Studio Commands
The top left toolbar in Web Report Studio reports have common commands for working withthe file. The table below defines these commands.
In this field: Do the following:
File The File menu contains the following options:
l Open - allows you to open another report in Web Report Studio.
l Open Recent - allows you to open a report in Web Report Studiothat you've recently had open.
l Close - allows you to close the report
l Export - allows you to export the entire data set to Excel.o Note: This is different from exporting just a particular view ofthe report, which you do by right clicking in a report output andclicking Export.
l Comments is not used.
l Page Setup - allows you to manipulate the page layout
l Print - allows you to print the report
l Manage Files is not used.
l Properties - shows the report properties
View The View menu contains the following options:
l Section - not used
l Applied Filters - you can remove or select the filters you used torun this instance of the report
l Data Panel - hides or disples the left panel
l Report Style - contains various display options
Data > Refresh Data Allows you to refresh the data and run a new instance of the report.
Open icon Equivalent to the File > Open menu option.
Print icon Equivalent to the File > Print menu option.
Export icon Equivalent to the File > Export menu option.
9
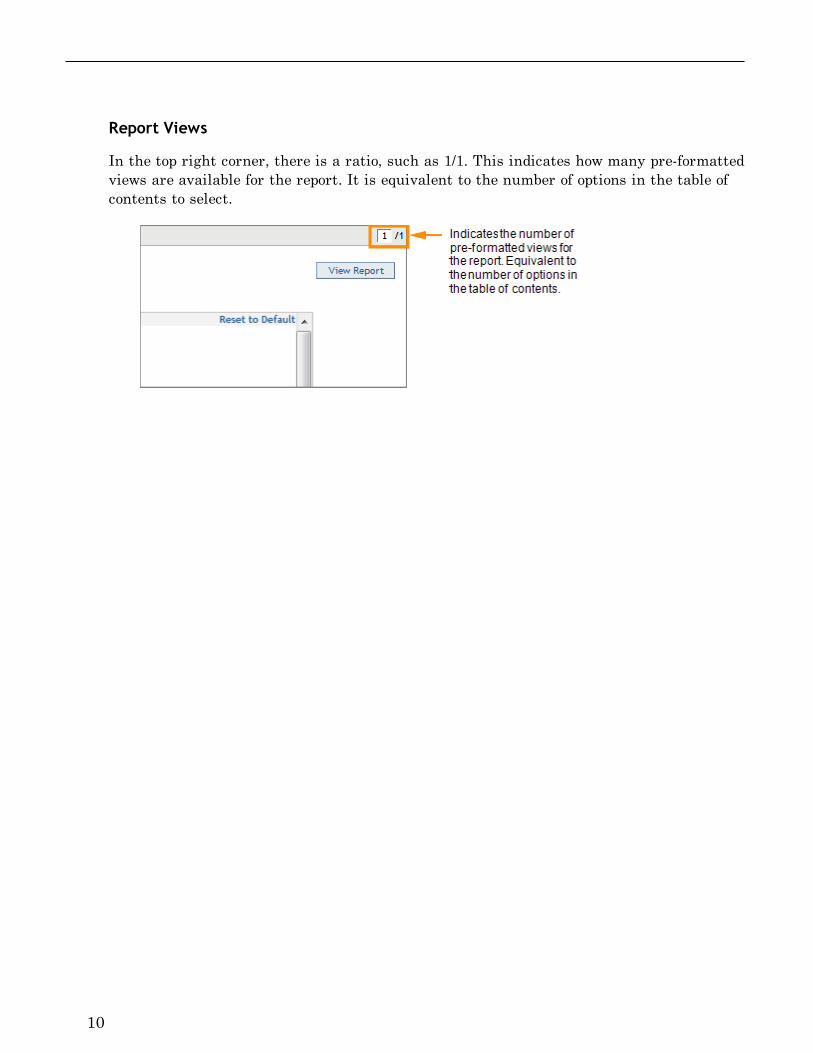
Report Views
In the top right corner, there is a ratio, such as 1/1. This indicates how many pre-formattedviews are available for the report. It is equivalent to the number of options in the table ofcontents to select.
10