Running faster or measuring better? How is the R&D sector in Central and Eastern Europe catching up...
23
Working Paper Series This paper was funded under the FP7 project “Growth– Innovation – Competitiveness: Fostering Cohesion in Central and Eastern Europe (GRINCOH)” under the Programme SSH.2011.2.2-1: Addressing cohesion challenges in Central and Eastern Europe; Area 8.2.2 Regional, territorial and social cohesion. Project Nr. 290657 Serie 3 Knowledge, Innovation, Technology * Centre for European Regional and Local Studies (EUROREG), University of Warsaw Paper No. 3.06 2015 www.grincoh.eu Adam Płoszaj*, Agnieszka Olechnicka* Running faster or measuring better? How is the R&D sector in Central and Eastern Europe catching up with Western Europe?
Transcript of Running faster or measuring better? How is the R&D sector in Central and Eastern Europe catching up...

Working Paper Series
This paper was funded under the FP7 project “Growth– Innovation – Competitiveness: Fostering Cohesion
in Central and Eastern Europe (GRINCOH)” under the Programme SSH.2011.2.2-1: Addressing
cohesion challenges in Central and Eastern Europe; Area 8.2.2 Regional, territorial and social cohesion.
Project Nr. 290657
Serie 3
Knowledge, Innovation, Technology
* Centre for European Regional and Local Studies (EUROREG), University of Warsaw
Paper No. 3.06
2015
www.grincoh.eu
Adam Płoszaj*, Agnieszka Olechnicka*
Running faster or measuring better? How is the
R&D sector in Central and Eastern Europe
catching up with Western Europe?

1
Adam Płoszaj [email protected] Agnieszka Olechnicka [email protected] Centre for European Regional and Local Studies (EUROREG), University of Warsaw www.euroreg.uw.edu.pl Please cite as: Płoszaj A., Olechnicka A, (2015), ‘Running faster or measuring better? How is the R&D sector in Central and Eastern Europe catching up with Western Europe?’, GRINCOH Working Paper Series, Paper No. 3.06
Running faster or measuring better? How is the R&D sector in Central and Eastern Europe catching up with Western Europe?
Abstract
This paper explores the development of the science sector in Central and Eastern European (CEE) countries and convergence with ‘old’ European Union countries. The aim is to better understand the observed development processes in the science sector in CEE by the use of data concerning research outcomes in the form of articles indexed in the Web of Science (WoS) database. The Authors put forward the hypothesis that changes in the list of journals, particularly in the number of periodicals published in specific CEE countries, have a significant impact on bibliometric indicators and, consequently, on the convergence levels they are used to measure.
The analyses presented in the article support the argument that countries from Central and Eastern Europe, despite showing fairly consistent convergence trends, achieve noticeably weaker results than Western Europe in terms of research and development and scientific activity. The evident impact made by inclusion of numerous CEE journals in WoS on the values of the indicator analysed, directly supports the hypothesis put forward in this article. The results of the study are important because data on the number of publications and citations in the Web of Science are increasingly used as development indicators of national R&D sectors. By showing how modifications in these databases influence the results obtained, we can better understand and thus make better use of data from these sources. The article concludes with listing the possibilities for furthering and deepening selected themes pointed out in the paper.
Content
Introduction ............................................................................................................................................. 2 Grounds for analysis, aim and hypothesis .............................................................................................. 2 Data ......................................................................................................................................................... 3 Results ..................................................................................................................................................... 4
Expenditure on R&D and employment in R&D ................................................................................... 4 Journals published in CEE .................................................................................................................... 6 Citations ............................................................................................................................................... 9 International Collaboration ............................................................................................................... 11 Productivity and Effectiveness .......................................................................................................... 13
Discussion .............................................................................................................................................. 17 Conclusion ............................................................................................................................................. 19 Acknowledgments ................................................................................................................................. 20 References ............................................................................................................................................. 21

2
Introduction
Central-Eastern Europe (CEE) is often portrayed in contrast to Western Europe. Due to a wide variety
of economic, social, institutional and historical factors, this region exhibits a lower level of socio-
economic development, lower levels of innovation as well as a less advanced information society
(etc.). The successive entry of CEE countries to the European Union (EU) and their adoption of
cohesion policy instruments brought positive economic consequences. As stated in the Sixth Report
on economic, social and territorial cohesion: "Between 2000 and 2011, all the regions in the central
and eastern Member States recorded an increase in GDP per head in PPS relative to the EU average"
(EC 2014b, p. 5).Thus, in the case of CEE countries, we can talk about economic convergence on a
European level. Statistics given in the report show that the crisis caused a slow-down in these
processes from 2009, yet this is taken to be of a transitional nature, and the convergence process is
expected to continue. This optimistic picture of convergence on the European scale is undermined by
the internal divergence that can be observed within countries – that is, the increasing difference
among regions of CEE countries (Smetkowski, Wojcik 2012). A deepening internal divergence could
lead to a slow-down in convergence processes on the European scale, although so far the increased
development gap among countries has been attributed to the economic crisis of recent years (Kozak
2014).
One of the elements allowing CEE countries to catch up with Western Europe in socio-economic
terms is the development of science and innovation. In this area CEE countries stand out visibly from
their western neighbours, although even here we can observe a (slow) process of convergence
(Vinkler 2008; Must 2006; EC 2014a; Abbott, Schiermeier 2014; Radosevic, Yoruk 2014; Kozak,
Bornmanz, Leydesdorff 2015). On one hand, this is the consequence of economic growth, and on the
other it is the result of EU policy and closely related national policies. We would expect that
incorporating CEE countries into EU structures and thereby allowing them to make use of EU
instruments to support science sector development, including Framework Programme grants, should
help reduce the distance dividing CEE from Western Europe in terms of both expenditure as well as
research outcomes, including the number of articles and citations.
Grounds for analysis, aim and hypothesis
The development of the science sector in CEE countries and, in consequence, convergence with ‘old’
EU countries is unquestionable (although the rate of this convergence, particularly in terms of
development policy, is still unsatisfactory) and is easy to elaborate (open borders, ease of
cooperation, substantial EU funds available for supporting research work and innovation in new
member states). Why, then, it is worth paying further attention to this issue? Firstly, because the
decisive majority of analyses in this area are based on widely available statistical data, while in this
article, we draw on seldom used data concerning research outcomes in the form of research articles
indexed in the Web of Science (WoS) database. WoS is a bibliographic database containing
bibliographic descriptions and indexes of citations from scientific publications. This database is one of
the products created and made available by the Institute of Scientific Information, a commercial
research institute that is part of the Thomson Reuters Corporation. WoS, from among many
databases of this kind, boasts extensive coverage, with a total file count of 90 million records, which
includes over a billion cited references1. For the purposes of this study, data on research articles
1 http://wokinfo.com/citationconnection/realfacts/#regional, access: 14.01.15.

3
derived from WoS has been elaborated to show not only the number of publications in specific years,
but also their citations, language, country of publication of the journal in which they appear as well
as declared international collaboration with authors from various countries. The presentation of data
from different perspectives allows for a better understanding of the dynamics of emerging processes
in the science sector in CEE and to differentiate among countries in the region.
Secondly – and most more importantly – our analysis serves to show a phenomenon that has up till
now been largely overlooked: the way in which modifications to the coverage of bibliometric
databases influence observable trends, in our case the process of scientific convergence of CEE
countries with Western Europe. In order to conduct such an analysis, we make use of detailed data
from the Web of Science database. The usual analyses conducted are based on the overall number of
articles attributed to a given country. From this angle, the growth and convergence of CEE countries
are as clear as day. However, this approach ignores the fact that the list of journals in the WoS
database is not permanent but, quite the contrary, changes significantly in some periods. We put
forward the hypothesis that changes in the list of journals, particularly in the number of periodicals
published in specific CEE countries, have a significant impact on bibliometric indicators and,
consequently, on the convergence levels they are used to measure. In a broader sense, our analysis
aims to show that observed trends in scientific output sometimes result not only from intensified
research activity, but may also be the effect of elements being accounted for which were not
previously included, in short, they derive from more precise (or simply different) measures. This
viewpoint is also important because data on the number of publications and citations in the Web of
Science are increasingly used as development indicators of national R&D sectors (EC 2014a). By
showing how modifications in these databases influence the results obtained, we can better
understand and thus make better use of data from these sources.
Data
The spatial scope of the study was defined as the ten countries of Central and Eastern Europe (EU10)
which acceded to the EU as part of expansion in 2004 and 2007. These are: the Czech Republic,
Estonia, Lithuania, Latvia, Poland, Slovakia, Slovenia, Hungary, Bulgaria and Romania. In the article
their situation is outlined against the background of the so-called ‘old’ member states, also referred
to as ‘the fifteen’ (EU15) as well as in reference to the situation of the whole European Union (EU27,
i.e. without Croatia that entered the EU on 1 July 2013).
In the study, alongside widely available data concerning expenditure and employment in research
and development, bibliometric data was used that was generated from the Web of Science database.
Detailed data, on the level of individual articles, was retrieved from the database in June 2014. The
sample created from this source contains in total 547,050 articles affiliated to Central and Eastern
Europe (EU10) published in the years 2000-2013. These constitute 10.9% of articles affiliated to EU27
countries (5,034,893).
The EU10 group of countries is very diverse in terms of the size and structure of publication output
due to the disparate sizes of individual economies as well as the specificity of their scientific sectors.
Almost 40% of all the publications in the region published in the years 2000-2013 are affiliated to
Poland (217,288), 18% in the Czech Republic (97,012) 13% in Hungary (68,713) and 11% in Romania
(59,175). It is interesting that the share of the Czech Republic and Hungary in the EU15 citation pool
is higher than in the publication pool, which is the reverse in the case of Romania. This means that

4
the publications affiliated to this country are cited much less often. For our analysis it is important
that the dominant role of Polish publications in the publication output and citations of the EU10
means that processes affecting Poland determine the results obtained for the whole group of CEE
countries.
Figure 1. Countries' share in articles and citations of EU10
Source: own study based on data from the Web of Science.
The share of individual countries in the joint publication output of CEE countries hardly changed
during the analysed period; the greatest change took place in Hungary, whose share fell from 16% in
2000 to 11% in 2013, as well as Romania, where there was a four-fold increase in the number of
articles, and whose share rose from 8% to 14% in the study period. Meanwhile, Romania came in
third place among the EU10 in terms of its share in the general publication pool. Only Lithuania noted
a higher uninterrupted growth in the number of articles affiliated there, although due to the small
scale this did not translate into a spectacular rise in its share in EU10 output (by 2 pp.) (Figure 1).
Results
Expenditure on R&D and employment in R&D
Convergence of the scientific systems of the EU10 and EU15 is visible in terms of expenditure as well
as outcomes of R&D activity. The basic indicators which can be traced in this respect are the level of
expenditure on R&D with reference to GDP as well as the indicator of employment in R&D relative to
population size.
Data on R&D expenditure and employment lead us to several conclusions. Firstly, in the years 2000-
2013 both groups of countries display an increase in expenditure on R&D measured in relation to
GDP as well as a growth in the indicator of employment in science in relation to population size.
Interestingly, during the crisis period (starting in 2009), there was no fall in the level of investment in
research and development in relation to GDP; quite the contrary, a growth in the value of this
indicator was noted (Figure 2, Figure 3).
0%
5%
10%
15%
20%
25%
30%
35%
40%
45%
20
00
20
01
20
02
20
03
20
04
20
05
20
06
20
07
20
08
20
09
20
10
20
11
20
12
20
13
articles
0%
5%
10%
15%
20%
25%
30%
35%
40%
45%
20
00
20
01
20
02
20
03
20
04
20
05
20
06
20
07
20
08
20
09
20
10
20
11
20
12
20
13
citations BG
CZ
EE
HU
LT
LV
PL
RO
SI
SK

5
Figure 2. GERD as % of GDP
Source: own study based on data from the Web of Science.
Figure 3. Employment in R&D as % of population
Source: own study based on data from the Web of Science.
Figure 4. GERD in % of GDP and Employment in R&D as % of population in EU10 in relation to EU15 (EU15=100)
Source: own study based on data from the Web of Science.
Secondly, there are important differences among the EU10 countries. In recent years, Slovenia and
Estonia achieved a level of expenditure exceeding the EU15 average. In the former country this was a
0,0
0,5
1,0
1,5
2,0
2,5
20
00
20
01
20
02
20
03
20
04
20
05
20
06
20
07
20
08
20
09
20
10
20
11
20
12
20
13
EU15
EU10
0,0
0,5
1,0
1,5
2,0
2,5
3,0
20
00
20
01
20
02
20
03
20
04
20
05
20
06
20
07
20
08
20
09
20
10
20
11
20
12
20
13
BG
CZ
EE
HU
LT
LV
PL
RO
SI
SK
EU15
EU10
0,0
0,1
0,2
0,3
0,4
0,5
0,6
0,7
0,8
20
00
20
01
20
02
20
03
20
04
20
05
20
06
20
07
20
08
20
09
20
10
20
11
20
12
20
13
EU15
EU10
0,0
0,1
0,2
0,3
0,4
0,5
0,6
0,7
0,82
00
0
20
01
20
02
20
03
20
04
20
05
20
06
20
07
20
08
20
09
20
10
20
11
20
12
20
13
BG
CZ
EE
HU
LT
LV
PL
RO
SI
SK
EU15
EU10
0
10
20
30
40
50
60
70
20
00
20
01
20
02
20
03
20
04
20
05
20
06
20
07
20
08
20
09
20
10
20
11
20
12
20
13
GERD as % of GDP
Employment in R&Das % of population

6
permanent upward trend as from 2011, while in the latter nation, spectacular growth in the years
2010-2012 was followed by a dramatic drop in value of the said indicator. Besides the above
mentioned countries, only the Czech Republic and Hungary achieved a level of expenditure
exceeding the EU10 average. Slovenia confirmed its strong position equally in terms of employment
in R&D – after 2011 this indicator reached levels exceeding the EU15 average. However, the Czech
Republic, Estonia and Lithuania noted higher levels of employment in R&D than the EU10 average in
the study period. Romania and Bulgaria are in the weakest position in this respect, and Poland is
marked out by weak values for this indicator in relation to its population size (Figure 2, Figure 3).
Thirdly, as we might have anticipated, the gap in values for expenditure and employment between
CEE countries and the ‘fifteen’ is significant. In 2000, expenditure on R&D as % GDP in the EU10 came
to only 39% of that in the EU15, rising to 57% in 2013. Meanwhile, employment taken as %
inhabitants in EU10 countries was 48% in 2000, rising to 56% at the end of the study period. All
things considered, despite the significant disproportion between the EU10 and EU15, a visible
convergence of results can be seen to take place on the European scale (Figure 4). More and more
resources in the science sector can contribute to subsequent growth in the scientific output of CEE
countries (Vinkler 2008; Lin, Chen, Yang 2014).
Journals published in CEE
The Web of Science does not include all scientific articles published worldwide. It contains only
articles from selected journals. In principle, the choice of journals is meant to be content-based – the
intention is to include the most prominent (the best) periodicals. However, other factors also play a
role. One of these is the desire to achieve a spatially balanced database, by including journals that
are not only important on the world scale, but also those whose scope is more regional (i.e. a group
of countries) or even national (Testa 2011). This approach is particularly important in the case of
periodicals in the field of social science and humanities, as the research problems they deal with are
often of a national, linguistic or even local nature. However, journals relating to the exact sciences
which are clearly of a national character (supported by the fact that they are published in non-
congress languages) can also be included in WoS, such as the journal “Przemysł Chemiczny”
(Chemical Industry) which is published in Poland and mostly in the Polish language (there is a fraction
of articles in English).
Inclusion in the database is not indefinite. If a journal does not fulfil the criteria determined by WoS,
it is simply removed. The criteria include formal requirements (e.g. regular issue) as well as content
requirements (a suitably high Impact Factor)2. When a given journal is removed from the index, the
‘space’ becomes available to new titles. The scope for considering new titles depends both on the
engagement of publishers who apply for entry, as well as of the database administrators who, apart
from respecting the overriding principle of listing the most important journals, must to some extent
be guided by business sense. We should also remember, that WoS is a commercial product, and its
creators (owners) are guided by economic outcomes. It follows that, in aiming to include journals
from different countries (markets), we can perceive that WoS does not only strive to provide an
adequate representation of the diversity of worldwide research, but also seeks to reach new
potential clients. Moreover, an important question remains unanswered as to whether the Thomson
2 http://wokinfo.com/essays/journal-selection-process/, access: 14.01.15.

7
Reuters’ selection criteria are consistent and rigorous or whether some countries are favoured and
overrepresented in WoS (Kosanovic and Sipka 2013).
In recent years we have witnessed a fairly important expansion in the spatial range of the WoS
database. This growth has been markedly more intense than in previous decades. In the years 1980-
1990, the number of journals in the database rose from 6130 by 654 titles (10.7%) In the decade
1990-2000, a further 1444 journals were added (21.3%). In the years 2000-2010 the increase was
visibly steeper: in 2000 there were 8228 titles, and as many as 11793 in 2010. The increase of 3511
journals meant that the list of titles grew by 42.7%. This radical expansion of the database is
described by Thomson Reuters as “The Globalization of the Web of Science” (Testa 2011). Apart from
the routine analysis of journals for inclusion in the database – in recent years around 2.5 thousand
applications annually, of which around 10% are accepted – in the years 2007-2009 action was
undertaken to increase the database’s representation of journals outside the ‘centre’ of world
research:
[…] from 2007 to 2009 the Editorial Development Department at Thomson Reuters
focused on a collection of more than 10,000 regional journals (these are journals
published outside the US or UK that contain the scholarship of authors from a particular
region or country, and cover topics of regional interest or topics studied from a regional
perspective). Sixteen hundred (1,600) of these 10,000 journals met Thomson Reuters
standards and were selected for coverage (Testa 2011, p. 2)
In consequence the number of journals published in some countries and listed in WoS grew
significantly between 2005 and 2010. The steepest growth in absolute numbers was recorded in:
Spain (112 new titles; growth of 207%), Brazil (105; 389%), Australia (97; 105%), Poland (85; 149%),
Turkey (68; 971%), Italy (68; 56%), France (62; 28%), China (62; 75%), South Korea (62; 168%), Japan
(61; 35%), India (60; 113%), Romania (52; 650%), Croatia (47; 336%), South Africa (41; 152%) (Testa
2011, p. 4).The increase in the number of journals naturally leads to an increased number of indexed
articles in WoS. This should be remembered when performing time analyses. The growth in the
number of articles are, after all, not only the result of increased research activity, but also the effect
of more extensive monitoring of scientific production - in this case, the greater number of journals
included in WoS.
The greater openness of WoS to journals outside the global research centre is clearly visible in
Central and Eastern Europe. In the years 2000-2006 published titles in CEE constituted barely more
than 3% of all journals published in the entire EU27. As a consequence of the database’s expansion,
in the years 2007-2009 this percentage rose by around 3.5% and in subsequent years (2010-2013)
maintained a level of around 7.5% (see Figure 5, left).This growth in the number of journals affected
all the CEE countries analysed (see Figure 5, right), although the scale varied due partly to the size of
country as well as to the number of journals from a given country that were listed in WoS before the
‘global expansion’ of 2007-2009. When we compare figures for 2000 and 2013, the greatest growth
in journal numbers in WoS was noted in Romania and Estonia – where the number of titles increased
10-fold. To a large extent this results from the low starting point (i.e. a low number of journals from
these countries in 2000). A spectacular 5-fold increase was recorded in Slovenia. In the case of
Poland and Bulgaria, growth was just over 3-fold. Meanwhile Poland is the clear leader in the group
of countries analysed in terms of absolute numbers of titles – one in three journals from the EU10 in

8
the database is a journal published in Poland. Hungary, Lithuania and the Czech Republic doubled the
number of journals in WoS and Slovakia increased its share by 40%. Meanwhile, Latvia is a very
unusual case, as in 2013 only two journals from this country were present in WoS, and its entire
growth is attributed to the addition of just one title in 2007. Another specific case is Lithuania: in the
years 2000-2001 not a single journal published in this country appeared in WoS while, as a result of
the expansion, as many as 29 titles had been included by the end of the decade.
Analysis of the number of articles appearing in journals published in EU10 countries and included in
WoS results in a similar picture to that given by analysis of the number of journal titles. Equally in this
case, there is a clear leap in the years 2007-2008 (Figure 6).
Figure 5. Journals published in EU10 countries and indexed in WoS
Source: own study based on data from the Web of Science.
Figure 6. Articles in journals published in EU10 countries indexed in WoS
Source: own study based on data from the Web of Science.
One of the effects of including such a large number of national journals in WoS is the noticeable
increase in the percentage of articles affiliated to EU10 countries and appearing in journals published
by institutions in this part of Europe. In the years 2000-2006 these constituted 17-18% of all articles
affiliated to these countries and indexed in WoS. However, in the years 2008-2009 this percentage
increased to 31%. Subsequent years saw a fall in numbers and in the years 2012 and 2013 only
around one in four articles from the EU10 in WoS came from journals published in this region.
Despite this drop, the figure is still higher than a decade earlier. The significance of national journals
0%
1%
2%
3%
4%
5%
6%
7%
8%
9%
10%
20
00
20
01
20
02
20
03
20
04
20
05
20
06
20
07
20
08
20
09
20
10
20
11
20
12
20
13
As a percentage of journals published in EU27
EU10
0
20
40
60
80
100
120
140
160
20
00
20
01
20
02
20
03
20
04
20
05
20
06
20
07
20
08
20
09
20
10
20
11
20
12
20
13
Number of titles BG
CZ
EE
HU
LT
LV
PL
RO
SI
SK
0%
1%
2%
3%
4%
5%
6%
7%
8%
9%
10%
20
00
20
01
20
02
20
03
20
04
20
05
20
06
20
07
20
08
20
09
20
10
20
11
20
12
20
13
As a percentage of articles published in EU27
EU10
0
1 000
2 000
3 000
4 000
5 000
6 000
7 000
8 000
9 000
20
00
20
01
20
02
20
03
20
04
20
05
20
06
20
07
20
08
20
09
20
10
20
11
20
12
20
13
Number of articles BG
CZ
EE
HU
LT
LV
PL
RO
SI
SK

9
in the number of articles is very diverse in CEE. In the case of Lithuania and Romania, in the years
directly following the expansion of WoS to include a large number of titles from these countries,
more than half the articles in WoS came from journals published in the EU10 (which is almost equal
to the number of journals from these countries – it is very rare that articles affiliated to the EU10
appear in journals published in other countries). However, the Czech Republic presents a completely
different scenario. In this country, despite the number of journals in WoS doubling, the percentage of
articles appearing in journals published in the EU in the years 2000-2013 (this also differs from
national journals) remained at a level of 20% (see Figure 7).
Figure 7. Percentage of articles affiliated to EU10 appearing in journals published in EU10
Source: own study based on data from the Web of Science.
The difference in the share of articles appearing in journals published in countries in the region could
testify to the differing levels of internationalization of publishing activity. A high percentage of
publications in journals of a particular country (region) can be interpreted as indicating a lower level
of internationalization in the science sector of this country. Meanwhile, a dominance of articles
published in journals outside the country (region) in question indicates a greater presence in
international research circles.
Citations
Information on citations from scientific journals are often used to gauge the quality of these
publications and/or their impact factor (see Hoekman et al. 2008, van Raan 2004). However, citations
are not a perfect measure, as they do not allow for context, that is, they assign weight to a given
publication, even if the citation is negative – for example to show misconceptions or incorrect
methods. Moreover, the most recent studies are often cited in preference to earlier ones which
relate to a given issue (citation amnesia) or overlook studies included in the canon of research
because their influence is regarded as obvious (oversight due to incorporation). This measure also
fails because studies are produced by large teams of researchers recruited to study new, popular
issues (see de Bells N. 2009; Moed 2005; Andrès 2009; Kamińska-Włodarczyk, Siwiec-Kurczab 2003).
The weakness of citations is the fact that they are derived from (imperfect) bibliometric databases
which do not encompass all citations appearing in all publications worldwide, but only those indexed
in a given database. Moreover, in researching citations, we should allow for the time lapse in relation
to publication (Schneider 2009; Moed 2005).
0%
10%
20%
30%
40%
50%
60%
20
00
20
01
20
02
20
03
20
04
20
05
20
06
20
07
20
08
20
09
20
10
20
11
20
12
20
13
EU10
0%
10%
20%
30%
40%
50%
60%
20
00
20
01
20
02
20
03
20
04
20
05
20
06
20
07
20
08
20
09
20
10
20
11
20
12
20
13
BG
CZ
EE
HU
LT
LV
PL
RO
SI
SK
EU10

10
This analysis of ‘citability’ is based on the normalised citations, that is, the number of citations from
articles affiliated to a given country and published in a given year is compared with the average
number of citations from articles in the EU15 in that year. This allows us to compare citability over
time. This is essential, as information on article citations is obtained at the moment of retrieving data
from the WoS database, i.e. mid-2014. Therefore more recent articles have decidedly fewer citations
than older articles, not because they are of inferior quality, but above all because the more time
passes, the greater likelihood of a larger number of citations. This is also the reason why the data
presented here relates to the period 2000-2011 (as opposed to the remaining analyses in this article
which relate to the period 2000-2013). Information on article citations where only a short time has
lapsed since publication is less reliable than articles published some distance in the past (Research
Evaluation and Policy Project 2005). This stems from the fact that usually, from the moment of
publication to the moment of citations appearing, at least a few or several months pass, or often
even many years3.
Analyses relativized to the EU15 values for average article citation shows that publications affiliated
to EU10 countries are much less frequently cited than those affiliated to the EU15, although this
difference can be seen to be lessening over time. The average number of citations per publication
affiliated to the EU10 constituted 56.3% of the EU15 average in 2000, while in 2011, 63.3% - a growth
of 6.9 pp. (Figure 8, left). However, as with the number of articles, convergence can be seen to be
much stronger when we exclude from the publication sample those titles which were published in
CEE countries. The relative increase in normalised citations in the EU10 for this newly defined sample
of articles is 16 pp. (from 64.9 in 2000 to 80.9 in 2013) (Figure 8, left). This means that publications
which appeared in CEE journals are generally less often cited and the normalised citations of these
articles increases on average at a slower rate. This leads us to the practical conclusion that, if
researchers from CEE wish to be more frequently cited, they should try to have their work published
in journals outside their country and region.
The EU10 group is diverse in terms of the indicators discussed above. In both respects (all articles and
only those published outside CEE) values above the EU average are achieved by the Czech Republic,
Hungary and Estonia. In 2010 and 2011 this last country exceeded even the EU15 average in the case
of articles published in journals outside CEE. Poland and Slovenia noted values close to the EU10
average or slightly below it (although the trend observed in Poland reflects the EU10 average –
Poland, as the country with the largest number of articles in the region, has the greatest influence on
this average). On the other hand, Romania and Lithuania are countries which fall farthest below the
EU10 average (with considerable fluctuation from year to year). The values for Latvia are the most
unstable – this is due to the relatively small number of articles affiliated to this country: the fewer
articles, the more sensitive the average number of citations to the influence of one or two frequently
cited articles (see Figure 8, right; Figure 9, right).
33 In order for an article to be cited it must first be read, then the citation must be included in an article submitted for publication; this is then followed by a review process that may last several months or even years leading to amendment or further review, etc.

11
Figure 8. Citations per article in EU10 and EU15 in relation to EU15 (UE15=100) – all journals
Source: own study based on data from the Web of Science.
Figure 9. Citations per article in EU10 and EU15 in relation to EU15 (UE15=100) - journals published outside EU10
Source: own study based on data from the Web of Science.
International Collaboration
Modern day science is increasingly globalized. This is evidenced by the growing intensity of
international collaboration among researchers from different countries and continents. In terms of
scientific publications this has led to a growing number of articles with multiple authors from various
institutions and countries (Glänzel, Schubert, Czerwon 1999; Glänzel, Schubert 2004; Wagner,
Leydesdorff 2005, Tijssen 2008). A synthetic indicator of the internationalization of publications can
be the percentage of articles affiliated to a given country which have at least one foreign author, in
the overall number of publications from that country. In 2013 over half the publications from the
EU15 were produced in cooperation with co-authors from abroad. Moreover, the value of the
discussed indicator has grown in recent years. In 2000, international articles constituted 37.6% of
those published in the EU15, while as many as 54.8%in 2013. In this context, Central and Eastern
European countries give a different picture. In the years 2000-2006, the share of international
articles in the overall publication output of the EU15 maintained a fairly stable level of between 44.5
and 46.7%. In the years 2007-2008 there was a noticeable drop to a level of 40%. In subsequent years
the value of this indicator gradually rose, but did not exceed the level of 2000-2006. Thus, despite
the fact that in the first half of the analysed period the share of international publications in the EU10
0
10
20
30
40
50
60
70
80
90
100
110
20
00
20
01
20
02
20
03
20
04
20
05
20
06
20
07
20
08
20
09
20
10
20
11
20
12
20
13
UE15
UE10
0
10
20
30
40
50
60
70
80
90
100
110
20
00
20
01
20
02
20
03
20
04
20
05
20
06
20
07
20
08
20
09
20
10
20
11
20
12
20
13
BG
CZ
EE
HU
LT
LV
PL
RO
SI
SK
UE15
UE10
0
10
20
30
40
50
60
70
80
90
100
110
20
00
20
01
20
02
20
03
20
04
20
05
20
06
20
07
20
08
20
09
20
10
20
11
20
12
20
13
UE15
UE10
0
10
20
30
40
50
60
70
80
90
100
1102
00
0
20
01
20
02
20
03
20
04
20
05
20
06
20
07
20
08
20
09
20
10
20
11
20
12
20
13
BG
CZ
EE
HU
LT
LV
PL
RO
SI
SK
UE15
UE10

12
was greater than in the EU15, in subsequent years Western European countries began to noticeably
overtake CEE countries in this respect (Figure 10, left).
As with other aspects discussed in this article, the group of CEE countries is diversified in terms of the
share of articles with foreign co-authors. In many cases we can also see major changes in the values
of this indicator. Generally speaking, we can distinguish three groups of countries. The first group is
formed of countries in which the share of international articles in the period 2000-2013 noticeably
fell. The steepest drop was noted in Lithuania (-16.9%), while it was slightly less steep in Romania
(-9.6%) and in Poland (-6.3%). Finally, at the end of the analysed period, only these three countries
had a share of international articles below the EU10 average. The second group constitutes countries
with a clear growth in the share of international articles. The most spectacular growth was witnessed
in Slovenia (13.7 pp) and Slovakia (11.8 pp).Significant growth could also be observed in Bulgaria
(9.5 pp), Estonia (8.2 pp), Hungary (6.7 pp), as well as in the Czech Republic (5.6 pp). A distinct case is
represented by Latvia, in which the indicator began to rise dramatically, from 53.9% in 2000 to
68.3%, and then subsequently fell dramatically. Thus at the end of the discussed period, Latvia noted
only insignificant growth in the share of international articles (2.5%). This dramatic fluctuation in
Latvia’s case is the result of the relatively small number of articles affiliated to this country (Figure 10,
right).
Figure 10. Percentage of articles with at least one foreign affiliation – all journals
Source: own study based on data from the Web of Science.
We can presume that changes in the share of international articles in the EU10 were influenced by
the expansion of the WoS database to include journals published in these countries. This is shown by
the fall in the number of international publications produced in the years 2007-2008, exactly when
WoS started to index a large number of journals published in CEE countries (see above). This
presumption is further supported by analysis of the share of international articles appearing only in
journals published outside Central and Eastern Europe. From this angle we do not see a fall in the
value of the indicator, but quite the contrary, we can observe constant – although slight – growth
(see Figure 11, left).
0%
10%
20%
30%
40%
50%
60%
70%
20
00
20
01
20
02
20
03
20
04
20
05
20
06
20
07
20
08
20
09
20
10
20
11
20
12
20
13
EU15
EU10
0%
10%
20%
30%
40%
50%
60%
70%
20
00
20
01
20
02
20
03
20
04
20
05
20
06
20
07
20
08
20
09
20
10
20
11
20
12
20
13
BG
CZ
EE
HU
LT
LV
PL
RO
SI
SK
EU15
EU10
13
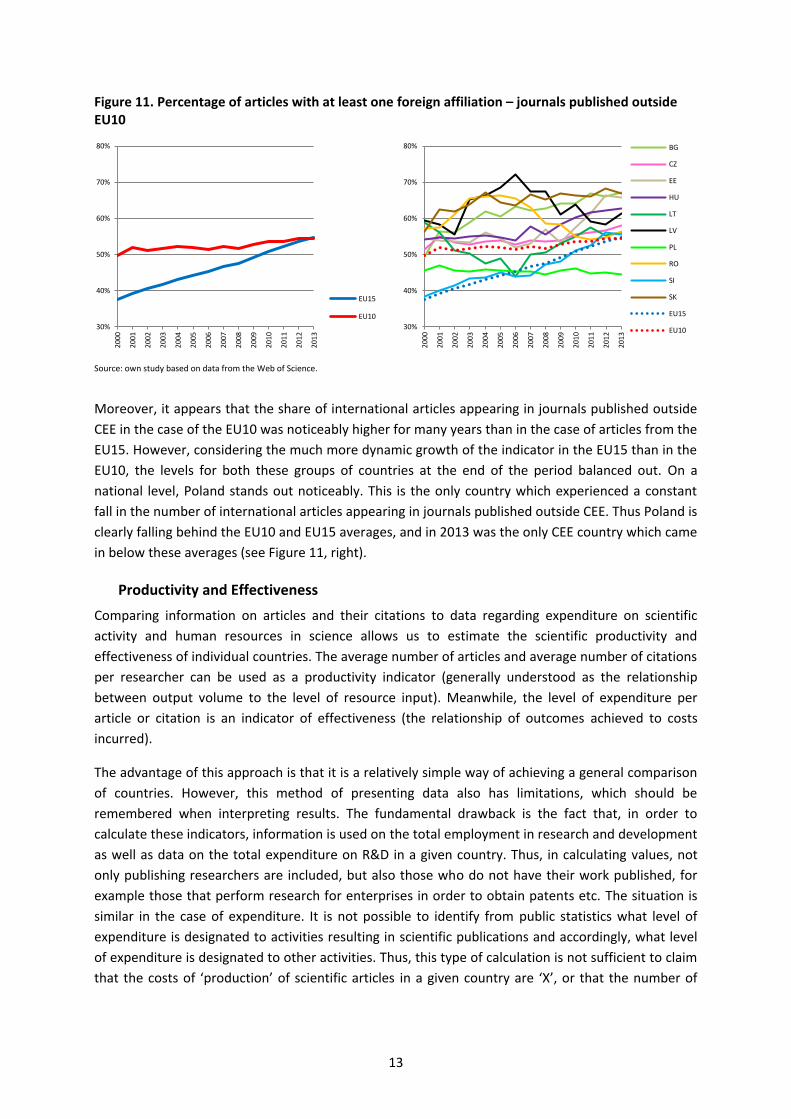
Figure 11. Percentage of articles with at least one foreign affiliation – journals published outside EU10
Source: own study based on data from the Web of Science.
Moreover, it appears that the share of international articles appearing in journals published outside
CEE in the case of the EU10 was noticeably higher for many years than in the case of articles from the
EU15. However, considering the much more dynamic growth of the indicator in the EU15 than in the
EU10, the levels for both these groups of countries at the end of the period balanced out. On a
national level, Poland stands out noticeably. This is the only country which experienced a constant
fall in the number of international articles appearing in journals published outside CEE. Thus Poland is
clearly falling behind the EU10 and EU15 averages, and in 2013 was the only CEE country which came
in below these averages (see Figure 11, right).
Productivity and Effectiveness
Comparing information on articles and their citations to data regarding expenditure on scientific
activity and human resources in science allows us to estimate the scientific productivity and
effectiveness of individual countries. The average number of articles and average number of citations
per researcher can be used as a productivity indicator (generally understood as the relationship
between output volume to the level of resource input). Meanwhile, the level of expenditure per
article or citation is an indicator of effectiveness (the relationship of outcomes achieved to costs
incurred).
The advantage of this approach is that it is a relatively simple way of achieving a general comparison
of countries. However, this method of presenting data also has limitations, which should be
remembered when interpreting results. The fundamental drawback is the fact that, in order to
calculate these indicators, information is used on the total employment in research and development
as well as data on the total expenditure on R&D in a given country. Thus, in calculating values, not
only publishing researchers are included, but also those who do not have their work published, for
example those that perform research for enterprises in order to obtain patents etc. The situation is
similar in the case of expenditure. It is not possible to identify from public statistics what level of
expenditure is designated to activities resulting in scientific publications and accordingly, what level
of expenditure is designated to other activities. Thus, this type of calculation is not sufficient to claim
that the costs of ‘production’ of scientific articles in a given country are ‘X’, or that the number of
30%
40%
50%
60%
70%
80%
20
00
20
01
20
02
20
03
20
04
20
05
20
06
20
07
20
08
20
09
20
10
20
11
20
12
20
13
EU15
EU10
30%
40%
50%
60%
70%
80%
20
00
20
01
20
02
20
03
20
04
20
05
20
06
20
07
20
08
20
09
20
10
20
11
20
12
20
13
BG
CZ
EE
HU
LT
LV
PL
RO
SI
SK
EU15
EU10

14
articles per researcher is ‘Y’. Nevertheless, the proposed approach allows us to spot some interesting
differences among countries and between groups of countries.
Firstly, the convergence of EU10 countries is stronger in terms of productivity indicators than
effectiveness measures. While the indicator for the number of articles per researcher at the end of
the analysed period came close to the EU15 average (in the years 2008-2009 it even exceeded it
slightly) and the citation indicator per R&D worker reached 60% of the EU average, at the same time
expenditure on R&D per article or citation oscillated between 53% and 34% of the EU15 average. This
phenomenon is linked to the above-mentioned greater convergence of CEE in employment in R&D
than in expenditure on research and development activity (see Figure 12).
Among the indicators of effectiveness, the disparity between the scale of convergence calculated for
the whole publication pool and for the sample of publications appearing in Western European
journals is three times greater in the case of the cost of articles compared to the cost of citations
(60% versus 20%). This means that the rate of growth in the cost absorption of articles published in
foreign journals is greater than for those published in CEE. A similar conclusion can be drawn from
the indicator of citations, with the exception that here, differences relating to the place of
publication are less significant. Meanwhile, in the case of citations per researcher, the disparity is
also visible, but decidedly less pronounced. This may indicate that the inclusion of journals from the
EU10 in WoS had an impact on the number of publications from this region indexed in WoS, but did
not influence (at least for the time being) growth in the normalised citations of researchers from
Central and Eastern Europe (see Figure 12, left).
Figure 12. Productivity and effectiveness measures in EU10 in relation to EU15 (EU15=100)
Source: own study based on data from the Web of Science.
Diversity among CEE countries regarding output, measured as the number of articles per researcher,
is very great. We only need to notice that while many countries with the highest level of
convergence, such as Estonia, Slovenia, Poland and Romania, achieved values that exceed the EU15,
countries such as Bulgaria and Latvia achieved levels of no more than 50-60% of the EU15 average.
This disparity is visible in both the levels and rates of convergence. The clear leader is Romania,
where the index of articles per researcher in relation to the EU15 grew in the study period from a
level of one third to a level exceeding the EU15 average. This fast rate of convergence also
distinguishes Estonia, Lithuania and Poland. However, the Czech Republic and Hungary show a fall in
productivity measures in terms of articles. As a result, while starting at a high level – close to the
0
20
40
60
80
100
120
20
00
20
01
20
02
20
03
20
04
20
05
20
06
20
07
20
08
20
09
20
10
20
11
Productivity
articles perresearcher - all
articles perresearcher -outside EU10
citations perresearcher - all
citations perresearcher -outside EU10
0
20
40
60
80
100
120
20
00
20
01
20
02
20
03
20
04
20
05
20
06
20
07
20
08
20
09
20
10
20
11
Effectiveness
expendituresper article - all
expendituresper article -outside EU10
expendituresper citation - all
expendituresper citation -outside EU10

15
EU15 average – at the beginning of the study period, they have clearly lost ground in recent years,
distancing themselves both from the EU15 and even the EU10 average (Figure 13, left). However, by
limiting the pool of articles and citations to journals published outside CEE, we arrive at significantly
revised values for the discussed indicators. The observed convergence is decidedly less pronounced
(e.g. Estonia, Lithuania, Romania) or non-existent, and we can even notice a departure from the
EU15 (Bulgaria). In the case of the Czech Republic and Hungary, this divergence is plainly visible
(Figure 13, right).
Figure 13. Number of articles per researcher in EU10 in relation to EU15 (UE15=100)
Source: own study based on data from the Web of Science.
Figure 14. Number of citations per researcher in EU10 in relation to EU15 (UE15=100)
Source: own study based on data from the Web of Science.
While in the case of articles per researcher some CEE countries achieved the EU15 average, or even
significantly exceeded it, in the case of citations per researcher the distance dividing EU10 countries
from the EU15 average is still enormous. Apart from a few exceptions (Slovenia in 2003 and Estonia
in 2010 and 2011) none of the analysed countries came close to the EU15 average. However, we
should point out that certain countries noted constant improvement (e.g. Poland, Romania, Slovakia
and Lithuania). Meanwhile, the Czech Republic and Hungary, which also began in a relatively high
position in this respect, did not achieve significant convergence (Figure 14, left). It is interesting to
note that in the case of citations, the inclusion of articles appearing in journals published outside CEE
in the citation sample analysed has little influence on the shape of these trends (Figure 14, right).
0
20
40
60
80
100
120
140
160
20
00
20
01
20
02
20
03
20
04
20
05
20
06
20
07
20
08
20
09
20
10
20
11
All BG
CZ
EE
HU
LT
LV
PL
RO
SI
SK
EU15
EU100
20
40
60
80
100
120
140
160
20
00
20
01
20
02
20
03
20
04
20
05
20
06
20
07
20
08
20
09
20
10
20
11
Published outside EU10 BG
CZ
EE
HU
LT
LV
PL
RO
SI
SK
EU15
EU10
0
20
40
60
80
100
120
20
00
20
01
20
02
20
03
20
04
20
05
20
06
20
07
20
08
20
09
20
10
20
11
All BG
CZ
EE
HU
LT
LV
PL
RO
SI
SK
EU15
EU100
20
40
60
80
100
120
20
00
20
01
20
02
20
03
20
04
20
05
20
06
20
07
20
08
20
09
20
10
20
11
Published outside EU10 BG
CZ
EE
HU
LT
LV
PL
RO
SI
SK
EU15
EU10

16
This may stem from the fact that articles published in journals outside CEE are cited more often than
those from CEE.
The situation looks completely different regarding effectiveness within the region (Figure 15, Figure
16). Firstly, none of the CEE countries in the entire study period noted output levels that exceeded
the EU15 average. In the case of Latvia, the EU15 average was exceeded incidentally in 2007 in terms
of the average expenditure on citations. Secondly, the scale of diversity among CEE countries is
decidedly less than in the case of productivity (around 30 pp versus 100 pp). Moreover, the group of
countries which stand out in terms of convergence levels is also somewhat distinct. Countries with a
cost absorption indicator exceeding the EU10 average are the Czech Republic, Slovenia, Hungary and
Latvia. However, the countries with the lowest cost absorption of articles in relation to the EU15
average are Romania and Bulgaria, thus the economies which have the lowest level of GERD in %
GDP. Thirdly, the rate of convergence is weaker than that for output levels. The cost of articles is
growing fastest in Estonia, Latvia, the Czech Republic and Hungary, while the slowest in Lithuania,
Poland and Romania. Similar tendencies affect expenditure relative to citation numbers (Figure 16,
left).
Figure 15. R&D expenditures per article in EU10 in relation to EU15 (UE15=100)
Source: own study based on data from the Web of Science.
Figure 16. R&D expenditures per citation in EU10 in relation to EU15 (UE15=100)
Source: own study based on data from the Web of Science.
0
10
20
30
40
50
60
70
80
90
20
00
20
01
20
02
20
03
20
04
20
05
20
06
20
07
20
08
20
09
20
10
20
11
All BG
CZ
EE
HU
LT
LV
PL
RO
SI
SK
EU15
EU100
10
20
30
40
50
60
70
80
90
20
00
20
01
20
02
20
03
20
04
20
05
20
06
20
07
20
08
20
09
20
10
20
11
Published outside EU10 BG
CZ
EE
HU
LT
LV
PL
RO
SI
SK
EU15
EU10
0
10
20
30
40
50
60
70
80
90
100
110
120
130
140
20
00
20
01
20
02
20
03
20
04
20
05
20
06
20
07
20
08
20
09
20
10
20
11
All BG
CZ
EE
HU
LT
LV
PL
RO
SI
SK
EU15
EU100
10
20
30
40
50
60
70
80
90
100
110
120
130
140
20
00
20
01
20
02
20
03
20
04
20
05
20
06
20
07
20
08
20
09
20
10
20
11
Published outside EU10 BG
CZ
EE
HU
LT
LV
PL
RO
SI
SK
EU15
EU10

17
Comparison of trends calculated for all journals, as well as for a sample excluding journals published
in the EU10, generally gives similar results. Of course, the average cost of an article in all the
countries appears greater than when we include all articles, which is a natural consequence of
excluding a group of articles (e.g. those appearing in journals published CEE). The differences in the
case of expenditure on citations are less pronounced, due to the above-mentioned fact that articles
from journals published in CEE are much less often cited (i.e. citations from these articles constitute a
sufficiently small proportion of total citations that their exclusion from the analysis does not
significantly influence results, since they combine the same level of expenditure with a slightly lower
number of citations).
Discussion
The analyses presented in this article support the argument that countries from Central and Eastern
Europe, despite showing fairly consistent convergence trends, achieve noticeably weaker results than
Western Europe in terms of research and development and scientific activity. The distance
separating CEE countries from the Western European average is lesser or greater depending on
which indicators are analysed. Moreover, EU10 countries also differ considerably from each other.
However, none of them exceeds the EU15 average in all analysed contexts. Generally speaking, the
best runners up behind Western Europe are Estonia, Slovenia, the Czech Republic and Hungary. The
first two of these countries are relatively small economies which in recent years took up a
comprehensive, knowledge-based approach to economic growth. Meanwhile, the Czech Republic
and Hungary possess a strong scientific tradition, which in recent years they have been able to
maintain and even develop. The middle of the Central European league table for science and R&D is
taken by Lithuania, Latvia, Poland and Slovakia. The weakest results are shown by Romania and
Bulgaria (see Figure 17). We can see here quite a clear relationship between the level of economic
growth of a country (measured e.g. by GDP per capita), or the wider level of socio-economic
development (assessed using e.g. the Human Development Index created by UNDP), and indicators
of R&D development. However, this relationship is two-way. It is true to say that development of the
science sector influences socio-economic development, but the fact is that wealthier countries invest
more in the R&D sector.
Traditional measures of research and development activity – expenditure on R&D relative to GDP as
well as employment in R&D as a percentage of the population – show that, in 2013, the EU10
average reached over half the EU15 average (57% and 56% of the average, respectively). In terms of
the number of articles listed in WoS per inhabitant, this distance is somewhat greater: the EU10
attained a level of 48% of the EU15 average. However, if we set the number of publications against
the number of researchers, it turns out that the EU10 comes up equal with the EU15 average. Thus
we can assume that further growth in the number of publications in the EU10 is unlikely without an
increase in human resources in science. Scientists from Central and Eastern Europe have similar
levels of output to their Western European colleagues, but there are proportionately less of them
(relative to population potential). They have decidedly less funds at their disposal with which to
finance research. This is also the reason why the relationship between expenditure on R&D and the
number of articles and citations differs to such an extent between the EU10 and EU15.In the EU10
this amounts to 34% (expenditure per article) and 53% (expenditure per citation) of the EU15
average. In very simplified terms, we can say that Central European articles are relatively ‘cheaper’
than those from Western Europe, which can certainly be attributed to the fact that less costly
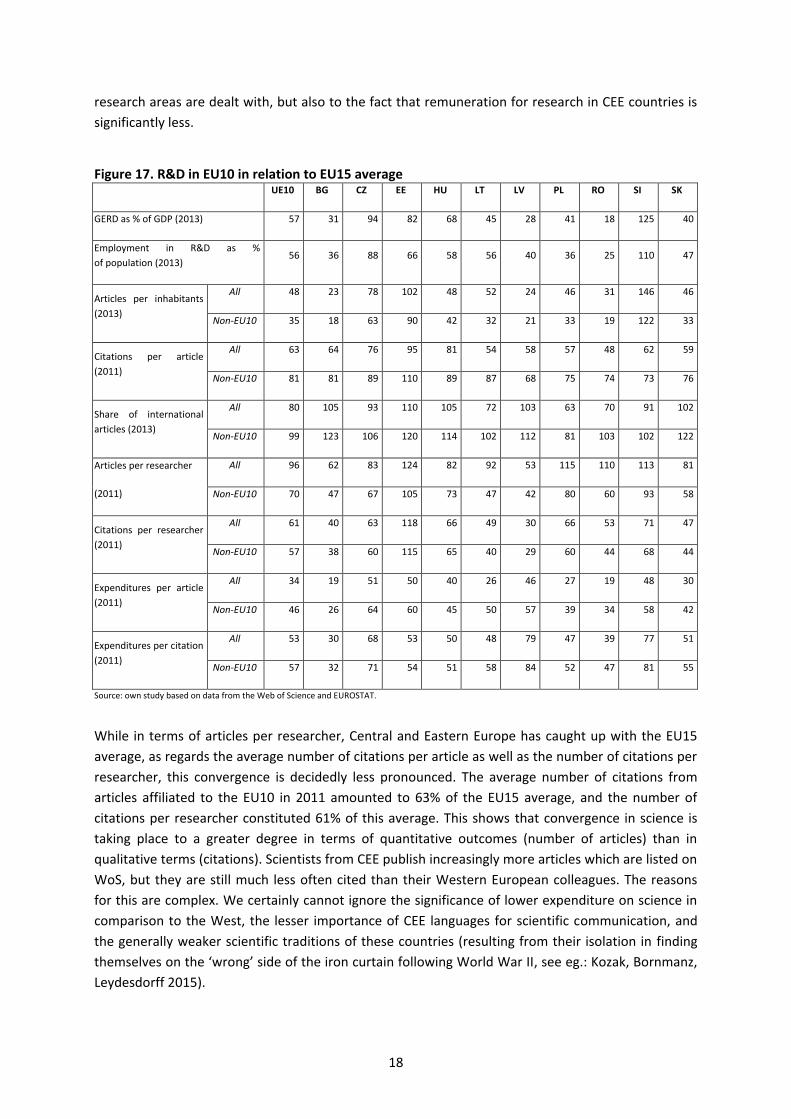
18
research areas are dealt with, but also to the fact that remuneration for research in CEE countries is
significantly less.
Figure 17. R&D in EU10 in relation to EU15 average UE10 BG CZ EE HU LT LV PL RO SI SK
GERD as % of GDP (2013) 57 31 94 82 68 45 28 41 18 125 40
Employment in R&D as %
of population (2013) 56 36 88 66 58 56 40 36 25 110 47
Articles per inhabitants
(2013)
All 48 23 78 102 48 52 24 46 31 146 46
Non-EU10 35 18 63 90 42 32 21 33 19 122 33
Citations per article
(2011)
All 63 64 76 95 81 54 58 57 48 62 59
Non-EU10 81 81 89 110 89 87 68 75 74 73 76
Share of international
articles (2013)
All 80 105 93 110 105 72 103 63 70 91 102
Non-EU10 99 123 106 120 114 102 112 81 103 102 122
Articles per researcher
(2011)
All 96 62 83 124 82 92 53 115 110 113 81
Non-EU10 70 47 67 105 73 47 42 80 60 93 58
Citations per researcher
(2011)
All 61 40 63 118 66 49 30 66 53 71 47
Non-EU10 57 38 60 115 65 40 29 60 44 68 44
Expenditures per article
(2011)
All 34 19 51 50 40 26 46 27 19 48 30
Non-EU10 46 26 64 60 45 50 57 39 34 58 42
Expenditures per citation
(2011)
All 53 30 68 53 50 48 79 47 39 77 51
Non-EU10 57 32 71 54 51 58 84 52 47 81 55
Source: own study based on data from the Web of Science and EUROSTAT.
While in terms of articles per researcher, Central and Eastern Europe has caught up with the EU15
average, as regards the average number of citations per article as well as the number of citations per
researcher, this convergence is decidedly less pronounced. The average number of citations from
articles affiliated to the EU10 in 2011 amounted to 63% of the EU15 average, and the number of
citations per researcher constituted 61% of this average. This shows that convergence in science is
taking place to a greater degree in terms of quantitative outcomes (number of articles) than in
qualitative terms (citations). Scientists from CEE publish increasingly more articles which are listed on
WoS, but they are still much less often cited than their Western European colleagues. The reasons
for this are complex. We certainly cannot ignore the significance of lower expenditure on science in
comparison to the West, the lesser importance of CEE languages for scientific communication, and
the generally weaker scientific traditions of these countries (resulting from their isolation in finding
themselves on the ‘wrong’ side of the iron curtain following World War II, see eg.: Kozak, Bornmanz,
Leydesdorff 2015).

19
Nonetheless, in this article we would like to pay particular attention to one factor alone: the place in
which journals are published. It happens that if we exclude from our analysis those journals
published in CEE, then the average number of citations from articles written by authors from EU10
countries comes much closer to the EU15 average, attaining a level of 81% - that is 18 pp more than
if we include journals published in CEE. This suggests that reasons for the weaker citability of CEE
scientists should also be sought in the characteristics of journals published in these countries (this
finding is in line with that of Pajic (2015), who analysed the impact of national journals on citations
inhumanities and social sciences). For some reason the articles they publish are less likely to be cited.
This partly stems from the national language they are published in. However, this factor does not
have great impact since only 6% of articles in the years 2000-2013 affiliated in the EU10 were
published in a language other than English. Therefore, we can assume that a major role is played by
factors which are hard to capture, such as the prestige of a journal, its international recognition, its
availability on the internet in full-length form and finally – even harder to assess – the quality of the
articles published. For authors affiliated to EU10 countries it may be easier to publish articles in
national journals (even English-language ones), than in international titles. A whole range of factors
contribute to this situation including, among others, poorer knowledge of publication standards and
publication strategies as well as inadequate levels of proficiency in English, but also perhaps poorer
standards of research resulting, inter alia, from weaker international collaboration. We can suppose
that publishing in CEE journals, even for authors of the region, is a second choice, particularly if the
article has valuable content. This aspect requires further detailed analysis based on the experiences
and opinions of scientists in this part of Europe.
Conclusion
The development of scientific and R&D activity in Central and Eastern European countries, and
consequently their progressing convergence towards the old EU member states, is easily observable.
Even basic data from EUROSTAT testifies to this phenomenon and it is also quite easy to explain. On
one hand, convergence has been caused by the opening of borders, the incorporation into EU
structures, the growing wealth of society, the implementation of scientific policies, and also to the
substantial EU funding designated to support the research and development sector and innovation in
general in these countries. On the other hand, the purely statistical aspect is also important, that is,
the so-called low-base effect. It is easier to achieve a high rate of development if you start from a low
ceiling.
The aim of this article is to show that there is also a third factor, which influences the observable (but
real?) convergence in term of research and development outcomes, in the form of publications in
scientific journals. This factor is the wider inclusion of research articles from journals published in
Central and Eastern European countries in worldwide bibliometric databases. To illustrate this we
used the Web of Science, which has for decades been the main reference source for international
bibliometric comparisons. The evident impact made by inclusion, in 2007-2008, of numerous CEE
journals in WoS on the values of the indicator analysed, directly supports the argument put forward
in this article. The growth in the number of articles from individual countries in WoS thus not only
testifies to the organic growth of the science sector in these countries, but also results from decisions
made by the managing bodies of these commercial databases. Changes in the database are doubtless
content-driven, and are prompted, for example, by the desire to better reflect the state of world
research. But we cannot reject other, non-content related motives, such as the wish to make the

20
database more attractive to potential clients in countries with ‘developing’ science sectors and who
have a great need to evaluate their research achievements (which in many countries goes hand in
hand with reforms in higher education and science). However, irrespective of the reasons for
expanding the database, it has led to better visibility in the European arena (Vanecek2014) and
easier access to the research outcomes of CEE countries. And in the context of scientometric studies
and international comparisons, we can say that the state of research in CEE countries is also being
better measured.
Without a doubt, this article has many limitations and – thanks to these limitations – possibilities for
furthering and deepening selected themes. Firstly, the analyses conducted are based on a single
bibliometric source. Conducting similar analyses on other source materials would help verify our
theories. An obvious line of research would be to investigate data from the SCOPUS database, as the
main rival database for bibliometric analyses. The unquestionable advantage of SCOPUS over WoS is
its wider inclusion of publications from the social sciences and the arts. Secondly, this article is based
only on descriptive and comparative statistical analyses. More detailed analyses using more
advanced statistical instruments could help give a more precise understanding of the nature and
scale of differences as well as the incidence of co-variance and causal relationships. Thirdly, we can
point to several content-related areas for pursuing the given approach: (a) An important area would
be to analysed more precisely the influence of the language of publication on the normalised
citations of articles; (b) A very important factor – completely overlooked in this article –is the
differentiation of research fields. This is important because in certain countries the range of research
fields in the publication pool varies, and each field has a very different approach to publishing,
internationalization, the number of co-authors, the average number of citations and the speed at
which (citations of) articles are included into intellectual circulation in a given field (see van Raan
2004). Initial analysis shows that the field structure of articles in the EU10 countries differs
significantly to that in the EU15. In particular, there is a much higher percentage of publications from
natural science fields, while the share of articles from medical sciences is much less. This is largely a
result of their historical legacy (Kozlowski, Radosevic, Ircha 1999). Fourthly, a potentially interesting
aspect for further analysis would be to analysed in detail international collaboration, taking into
consideration not only the share of articles from foreign authors, but also the directions of this
collaboration (from national and regional perspectives), as well as national collaboration. Fifth, it
would be worth carefully analysing indicators of productivity and effectiveness, e.g. paying attention
to division of expenditure on public and private R&D, as well as employment in R&D in government
and enterprise sectors.
Acknowledgments
This work was supported by the Polish National Science Center under grant “Polish scientific centres
in the European cooperation network - characteristics, determinants, mechanisms” and European
Union's 7th Framework Programme under project “GRINCOH—Growth-Innovation-Competitiveness:
Fostering Cohesion in Central and Eastern Europe”.

21
References
Abbott, A., & Schiermeier, Q. (2014). After the Berlin Wall: Central Europe up close. Nature, 05 November.
Andrès, A. (2009). Measuring Academic Research. How to undertake a Bibliometric Study. Oxford: Chandos Publishing.
Barre, R., Henriques, L., Pontikakis, D., & Weber, M. (2012). Measuring the integration and coordination dynamics of the European Research Area. Science and Public Policy, 40, 187–205.
de Bells, N. (2009), Bibliometrics and citation analysis. From the Science Citation Index to Cybermetrics. Plymouth: The Scarecrow Press, Inc.
EC (European Commission) (2014a). Innovation Union Scoreboard 2014.
EC (European Commission) (2014b). Investment of jobs and growth. Promoting investment and good governance in EU regions and cities. Sixth report on economic, social and territorial cohesion, Luxembourg.
Frenken, K., Hardeman, S., & Hoekman, J. (2009). Spatial scientometrics: Towards a cumulative research program. Journal of Informetrics, 3(3), 222-232.
Glänzel, W., & Schubert, A. (2004). Analysing Scientific Networks through Co-Authorship. In F.H. Moed, W. Glänzel, U. Schmoch (Eds.), Handbook of Quantitative Science and Technology Research. The use of Publications and Patent Statistics in Studies of S&T Systems (pp. 257-276). Dordrecht: Kluwer Academic Publishers.
Glänzel, W., Schubert, A., & Czerwon, H. J. (1999). A bibliometric analysis of international scientific cooperation of the European Union (1985–1995). Scientometrics, 45, 185–202.
Hoekman, J., Frenken, K., & van Oort, F. (2008). Collaboration networks as carriers of knowledge spillovers: Evidence from EU27 regions. KITeS Working Papers No 222, Milano: Centre for Knowledge, Internationalization and Technology Studies, Universita' Bocconi.
Kamińska-Włodarczyk, R., & Siwiec-Kurczab, B. (2003). Problemy oceny dorobku naukowego w Polsce. cz 2. Biuletyn Informacyjny Biblioteki Głównej Akademii Wychowania Fizycznego w Krakowie, 2, 7-19.
Kosanovic, B., & Sipka, P. (2013). Output in WoS vs. representation in JCR of SEE Nations: does mother Thomson cherish all her children equally. In P. Šipka (ed.) Journal Publishing in Developing, Transition and Emerging Countries: Proceedings of the 5th Belgrade International Open Access Conference 2012 (pp. 125-137). Belgrade: Centre for Evaluation in Education and Science.
Kozak, M. (2014). 10 lat polityki spójności w Polsce. Studia Regionalne i Lokalne, 4(58), 25-50.
Kozak, M., Bornmann, L., & Leydesdorff, L. (2015). How have the Eastern European countries of the former Warsaw Pact developed since 1990? A bibliometric study. Scientometrics, 102(2), 1101-1117.
Kozlowski, J., Radosevic, S., & Ircha, D. (1999). History matters: the inherited disciplinary structure of the post-communist science in countries of Central and Eastern Europe and its restructuring. Scientometrics, 45(1), 137-166.
Lin, P. H., Chen, J. R., & Yang, C. H. (2014). Academic research resources and academic quality: a cross-country analysis. Scientometrics, 101(1), 109-123.
Moed, H. F. (2005). Citation Analysis in Research Evaluation. Dordrecht: Springer.
Must, Ü. (2006). “New” countries in Europe-Research, development and innovation strategies vs bibliometric data. Scientometrics, 66(2), 241-248.
Pajić, D. (2014). Globalization of the social sciences in Eastern Europe: genuine breakthrough or a slippery slope of the research evaluation practice? Scientometrics, doi: 10.1007/s11192-014-1510-5
Radosevic, S., & Yoruk, E. (2014). Are there global shifts in the world science base? Analysing the catching up and falling behind of world regions. Scientometrics, 101(3), 1897-1924.
Research Evaluation and Policy Project. (2005). Quantitative indicators for research assessment—A literature review (REPP discussion paper 05/1). Canberra: Research Evaluation and Policy Project, Research School of Social Sciences, The Australian National University.

22
Schneider, J. W. (2009). An Outline of the Bibliometric Indicator Used for Performance-Based Funding of Research Institutions in Norway. European Political Science, 8, 364-378.
Smętkowski, M., & Wójcik, P. (2012). Regional Convergence in Central and Eastern European Countries: A Multidimensional Approach. European Planning Studies, 20(6), 923-939.
Testa, J. (2011). The Globalisation of Web of Science: 2005-2010. Thomson Reuters.
Tijssen, R. J. W. (2008). Are we moving towards an integrated European Research Area? Collnet Journal of Scientometrics and Information Management, 2(1), 19-25.
van Raan, A. F. J. (2004). Measuring science. In F. H. Moed, W. Glänzel, & U. Schmoch (Eds.) Handbook of Quantitative Science and Technology Research. The use of Publications and Patent Statistics in Studies of S&T Systems (pp. 19-50). Dordrecht: Kluwer Academic Publishers.
Vanecek, J. (2014). The effect of performance-based research funding on output of R&D results in the Czech Republic. Scientometrics, 98(1), 657–681.
Vinkler, P. (2008). Correlation between the structure of scientific research, scientometric indicators and GDP in EU and non-EU countries. Scientometrics, 74(2), 237-254.
Wagner, C. S., & Leydesdorff, L. (2005). Network structure, self-organization and the growth of international collaboration in science. Research Policy, 34(10), 1608–1618.