RSPAT 2016 Report B (Fatigue, Young Drivers, School ...
108
1 Department of Transport and Main Roads RSPAT SURVEY 2016 REPORT B Fatigue, Young Drivers, School Transport Safety, Occupant Restraint, Safer Roads, Cycling PREPARED FOR Department of Transport and Main Roads PREPARED BY MCR DATE July 2016 JOB # 161519
-
Upload
khangminh22 -
Category
Documents
-
view
1 -
download
0
Transcript of RSPAT 2016 Report B (Fatigue, Young Drivers, School ...
1
Department of Transport and Main RoadsRSPAT SURVEY 2016 REPORT B Fatigue, Young Drivers, School Transport Safety, Occupant Restraint, Safer Roads, Cycling PREPARED FOR Department of Transport and Main Roads PREPARED BY MCR DATE July 2016 JOB # 161519

2

3
TABLE OF CONTENTS INTRODUCTION ............................................................................................................................................................................................................................................ 7
SUMMARY ................................................................................................................................................................................................................................................... 9
Fatigue ......................................................................................................................................................................................................................................................... 10 Young Drivers ................................................................................................................................................................................................................................................ 11 School Transport Safety ................................................................................................................................................................................................................................. 11 Occupant Restraint ........................................................................................................................................................................................................................................ 12 Safer Roads .................................................................................................................................................................................................................................................... 12 Cycling ......................................................................................................................................................................................................................................................... 13 Key trends – Fatigue ...................................................................................................................................................................................................................................... 14 Key trends – Young Drivers ............................................................................................................................................................................................................................ 14 Key trends – School Transport Safety ............................................................................................................................................................................................................ 15 Key trends – Occupant Restraint ................................................................................................................................................................................................................... 15 Key trends – Safer Roads ............................................................................................................................................................................................................................... 16 Key trends – Cycling ....................................................................................................................................................................................................................................... 17
METHOD .................................................................................................................................................................................................................................................... 19
Research Method .......................................................................................................................................................................................................................................... 20 Fieldwork ....................................................................................................................................................................................................................................................... 20 Sample Selection and Size ............................................................................................................................................................................................................................. 20 Publication of Information ............................................................................................................................................................................................................................ 22
FINDINGS ................................................................................................................................................................................................................................................... 23
FATIGUE ..................................................................................................................................................................................................................................................... 25
1.0 WARNING SIGNS FOR DRIVER/RIDER FATIGUE ............................................................................................................................................................................................ 26 1.1.1 To the best of your knowledge, what are some of the warning signs for driver/rider fatigue? (F16) (new measure) ............................................................................................... 26 1.1.2 To the best of your knowledge, what are some ways to avoid driver/rider fatigue? (F17) (new measure) ............................................................................................................... 26 1.1.3 Key sub‐group differences ........................................................................................................................................................................................................................................... 26
2.0 PREVALENCE OF DRIVING/RIDING WHILE FATIGUED ..................................................................................................................................................................................... 29 2.1.1 > In the last 12 months, have you ever been fatigued while driving/riding? (F1) ...................................................................................................................................................... 29 2.1.2 Key sub‐group differences ........................................................................................................................................................................................................................................... 29
3.0 CHARACTERISTICS OF FATIGUED DRIVING .................................................................................................................................................................................................. 30 3.1.1 When you were last fatigued while driving/riding, what was the time of day? (F8) .................................................................................................................................................. 30 3.1.2 When you were last fatigued while driving/riding, what was the duration of the entire trip? (F6) ........................................................................................................................... 30 3.1.3 When you were last fatigued while driving/riding, what was the approximate location? (F7) .................................................................................................................................. 30
4.0 CAUSES OF FATIGUED DRIVING/RIDING AND SLEEP PATTERNS ......................................................................................................................................................................... 35
4
4.1.1 What do you believe contributed to your fatigue? (F11) ........................................................................................................................................................................................... 35 4.1.2 When you were last fatigued while driving/riding, how many hours was it since you last slept? (F9) ...................................................................................................................... 35 4.1.3 When you were last fatigued while driving/riding, which of the following best describes your sleep patterns leading up to that event? (F10)...................................................... 35 4.1.4 Key sub‐group differences ........................................................................................................................................................................................................................................... 36
5.0 MOTORISTS’ BEHAVIOUR WHEN DRIVING/RIDING FATIGUED .......................................................................................................................................................................... 39 5.1.1 When you first noticed that you were fatigued, what did you do? (F13) ................................................................................................................................................................... 39 5.1.2 Why did you choose to keep driving? (F14) ............................................................................................................................................................................................................... 39 5.1.3 Key sub‐group differences ........................................................................................................................................................................................................................................... 39
YOUNG DRIVERS ........................................................................................................................................................................................................................................ 41
1.0 SUPPORT FOR INITIATIVES AFFECTING PROVISIONAL LICENCE HOLDERS ONLY ...................................................................................................................................................... 42 1.1 PEER PASSENGER RESTRICTIONS FOR P1 LICENCE HOLDERS – GENERAL PUBLIC .................................................................................................................................................... 42
1.1.1 P1 licence holders have a peer passengers restriction for at least the first 12 months of driving, where no more than one passenger aged under 21 is allowed in a car with a P1 driver between 11pm and 5am. Exemptions apply for family members carried as passengers. How strongly do you support or oppose this rule? (Y8) ....................................... 42
1.1.2 Why do you oppose this? (Y9) ..................................................................................................................................................................................................................................... 42 1.1.3 How strongly would you support or oppose peer passenger restrictions for P1 licence holders applying at all times (24 hours)? (Y12) .................................................................. 43 1.1.4 Why do you oppose this? (Y18) (new measure) .......................................................................................................................................................................................................... 43
1.2 SUPPORT FOR LATE NIGHT DRIVING RESTRICTIONS FOR PROVISIONAL DRIVERS .................................................................................................................................................... 46 1.2.1 Provisional drivers who have had their licence suspended or cancelled have a late night driving restriction for at least 12 months, after they return to driving. Drivers with this
restriction cannot drive a vehicle or ride a motorbike between 11pm and 5am. Exemptions apply for work, education and family purposes. How strongly do you support or oppose this rule? (Y10) ................................................................................................................................................................................................................................................ 46
1.2.2 Why do you oppose this rule? (Y11) ............................................................................................................................................................................................................................ 46 1.2.3 How strongly would you support or oppose late night driving restrictions applying to all P1 licence holders? These restrictions would mean that P1 licence holders cannot drive
a vehicle or ride a motorbike between 11pm and 5am. Exemptions apply for work, education and family purposes. (Y14) .................................................................................. 46 1.2.4 Why do you oppose this? (Y20) (new measure) .......................................................................................................................................................................................................... 47
SCHOOL TRANSPORT SAFETY ...................................................................................................................................................................................................................... 51
1.0 SCHOOL ZONE RECOGNITION ................................................................................................................................................................................................................. 52 1.1.1 On which days does a school zone operate? (ST5) ...................................................................................................................................................................................................... 52 1.1.2 How would you recognise a school zone on a road that you may be unfamiliar with? (ST6) ..................................................................................................................................... 52
2.0 SCHOOL ZONE SAFETY .......................................................................................................................................................................................................................... 54 2.1.1 To what extent do you agree or disagree with the following statements? (ST11) ...................................................................................................................................................... 54 2.1.2 How often do you perform the following behaviours while driving? (ST12) ............................................................................................................................................................... 54
3.0 DRIVING BEHAVIOUR DURING SCHOOL ZONE TIMES ..................................................................................................................................................................................... 57 3.1.1 How often do you travel over the speed limit in a school zone with flashing school zone signs in operation during school zone times? (ST3b) ...................................................... 57 3.1.2 How often do you travel over the speed limit in a standard (non‐flashing) school zone during school zone times? (ST3a) ...................................................................................... 57 3.1.3 How often do you travel over the speed limit in a school zone with children present during school zone times? (ST3c) .......................................................................................... 57
4.0 CONSEQUENCES FOR SPEEDING IN SCHOOL ZONES ....................................................................................................................................................................................... 60 4.1.1 Do you think that FINES for speeding within a school zone should be …? (ST13) ....................................................................................................................................................... 60 4.1.2 Do you think that DEMERIT POINTS for speeding within a school zone should be…? (ST14) ...................................................................................................................................... 60
5
5.0 SPEED LIMITS IN SCHOOL ZONES ............................................................................................................................................................................................................. 62 5.1.1 What do you think is the appropriate speed limit within a school zone on a road with a default speed limit of 60 km/h? (ST15) (new measure) ................................................... 62 5.1.2 Have you seen police enforcing the reduced speed limit in a school zone? (ST16) (new measure) ............................................................................................................................ 62
OCCUPANT RESTRAINT ............................................................................................................................................................................................................................... 65
1.0 WEARING A SEAT BELT ......................................................................................................................................................................................................................... 66 1.1.1 When travelling in a car, how often do you wear a seat belt, either as a driver or a passenger? (OR1) ..................................................................................................................... 66 1.1.2 To what extent do you agree with the following statement? I think that I am likely to get caught and fined if I don’t wear a seatbelt when driving. (OR7) ................................... 66 1.1.3 Who is responsible for the seat belt wearing of passengers in vehicles in Queensland? (OR8) (new measure) ........................................................................................................ 66
2.0 METHOD OF RESTRAINING PASSENGERS UNDER SEVEN YEARS ......................................................................................................................................................................... 68 2.1.1 How do you restrain child passengers aged under seven years? (OR6a) .................................................................................................................................................................... 68
SAFER ROADS ............................................................................................................................................................................................................................................. 71
1.0 TRAVELLING ON THE BRUCE HIGHWAY ..................................................................................................................................................................................................... 72 1.1.1 How often do you travel on the Bruce Highway? (SR1) (new measure) ..................................................................................................................................................................... 72 1.1.2 What transport mode do you typically use when you travel on the Bruce Highway? (SR2) (new measure).............................................................................................................. 72 1.1.3 Which section/s of the Bruce Highway do you typically travel on? (SR3) (new measure) .......................................................................................................................................... 72 1.1.4 How safe do you think it is to travel on the Bruce Highway at the present time? (SR4) (new measure) ................................................................................................................... 73 1.1.5 Please describe which location/s of the Bruce Highway you do not believe are safe at the present time. (SR5) (new measure) ............................................................................. 73 1.1.6 Key sub‐group differences ........................................................................................................................................................................................................................................... 73
CYCLING ..................................................................................................................................................................................................................................................... 77
1.0 FACTORS TO ENCOURAGE CYCLING .......................................................................................................................................................................................................... 78 1.1.1 What would encourage you to cycle or cycle more often? (C1) .................................................................................................................................................................................. 78
2.0 CYCLING AND ROAD RULES .................................................................................................................................................................................................................... 82 2.1.1 > After a two‐year trial, a ‘minimum overtaking distance’ rule has been introduced in Queensland. What do you think of this rule? (C2) .............................................................. 82 2.1.2 Key sub‐group differences ........................................................................................................................................................................................................................................... 82 2.1.3 Which of the following road rules apply in Queensland? (C5) – Road rules that DO CURRENTLY apply ..................................................................................................................... 82 2.1.4 Key sub‐group differences ........................................................................................................................................................................................................................................... 82 2.1.5 Which of the following road rules apply in Queensland? (C5) – Road rules that DO NOT CURRENTLY apply ............................................................................................................. 83 2.1.6 Key sub‐group differences ........................................................................................................................................................................................................................................... 83
3.0 ATTITUDES TOWARDS CYCLISTS .............................................................................................................................................................................................................. 85 3.1.1 How strongly do you agree or disagree with the following statements? (C4) ............................................................................................................................................................ 85
APPENDICES ............................................................................................................................................................................................................................................... 87
APPENDIX A – QUESTIONNAIRE ...................................................................................................................................................................................................................... 88 APPENDIX B – OTHER RESPONSES ................................................................................................................................................................................................................. 102 APPENDIX C – FIELDWORK REPORT ................................................................................................................................................................................................................ 107 APPENDIX D – SAMPLING ERROR CHART ......................................................................................................................................................................................................... 108

6

7
introduction
8
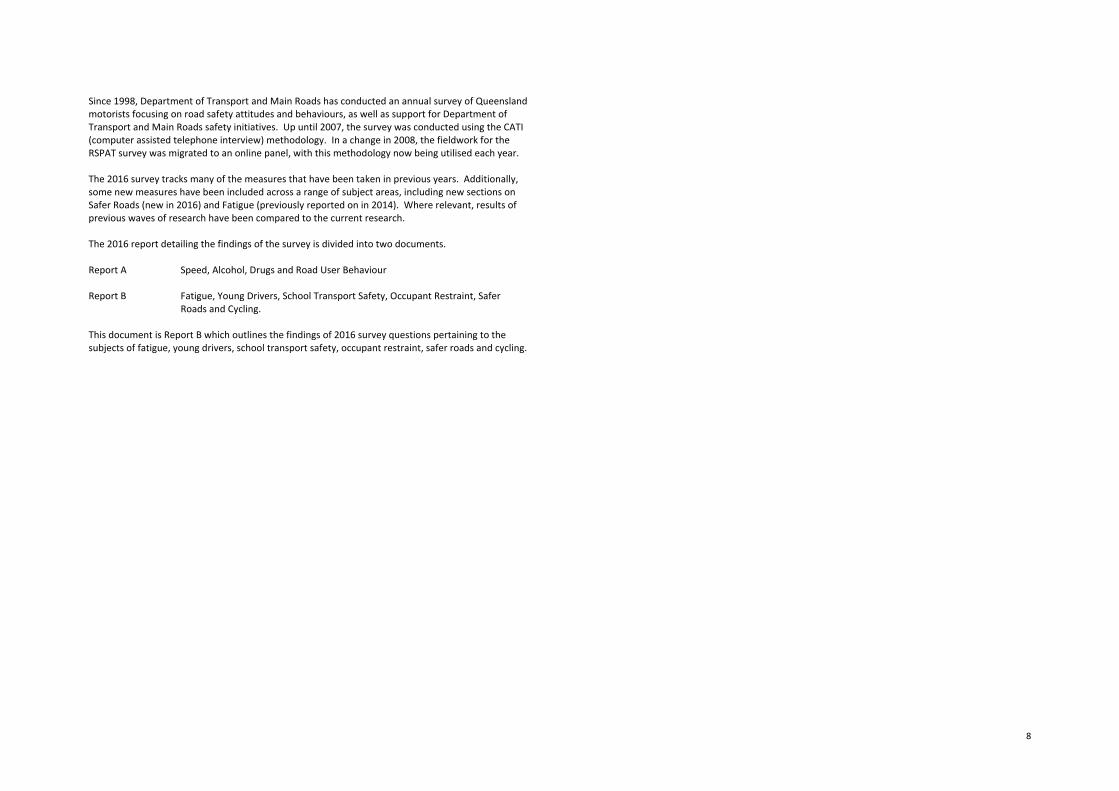
Since 1998, Department of Transport and Main Roads has conducted an annual survey of Queensland motorists focusing on road safety attitudes and behaviours, as well as support for Department of Transport and Main Roads safety initiatives. Up until 2007, the survey was conducted using the CATI (computer assisted telephone interview) methodology. In a change in 2008, the fieldwork for the RSPAT survey was migrated to an online panel, with this methodology now being utilised each year. The 2016 survey tracks many of the measures that have been taken in previous years. Additionally, some new measures have been included across a range of subject areas, including new sections on Safer Roads (new in 2016) and Fatigue (previously reported on in 2014). Where relevant, results of previous waves of research have been compared to the current research. The 2016 report detailing the findings of the survey is divided into two documents. Report A Speed, Alcohol, Drugs and Road User Behaviour
Report B Fatigue, Young Drivers, School Transport Safety, Occupant Restraint, Safer
Roads and Cycling.
This document is Report B which outlines the findings of 2016 survey questions pertaining to the subjects of fatigue, young drivers, school transport safety, occupant restraint, safer roads and cycling.

9
summary
10
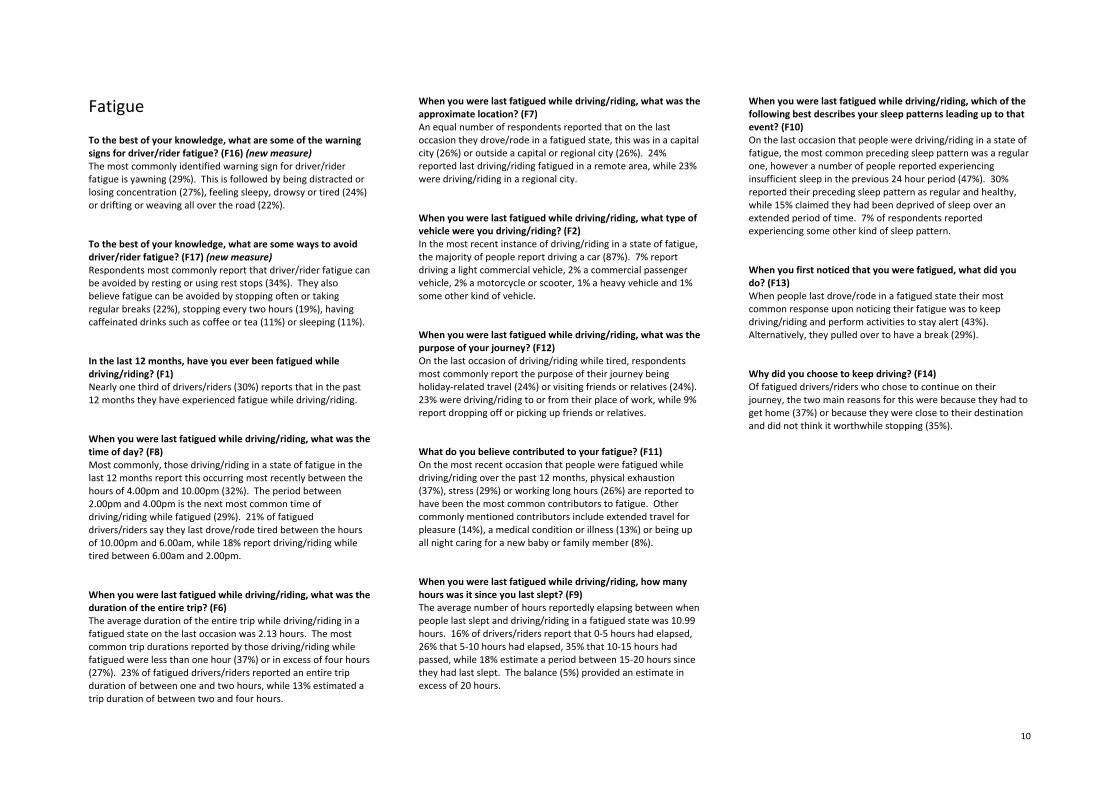
Fatigue To the best of your knowledge, what are some of the warning signs for driver/rider fatigue? (F16) (new measure) The most commonly identified warning sign for driver/rider fatigue is yawning (29%). This is followed by being distracted or losing concentration (27%), feeling sleepy, drowsy or tired (24%) or drifting or weaving all over the road (22%). To the best of your knowledge, what are some ways to avoid driver/rider fatigue? (F17) (new measure) Respondents most commonly report that driver/rider fatigue can be avoided by resting or using rest stops (34%). They also believe fatigue can be avoided by stopping often or taking regular breaks (22%), stopping every two hours (19%), having caffeinated drinks such as coffee or tea (11%) or sleeping (11%). In the last 12 months, have you ever been fatigued while driving/riding? (F1) Nearly one third of drivers/riders (30%) reports that in the past 12 months they have experienced fatigue while driving/riding. When you were last fatigued while driving/riding, what was the time of day? (F8) Most commonly, those driving/riding in a state of fatigue in the last 12 months report this occurring most recently between the hours of 4.00pm and 10.00pm (32%). The period between 2.00pm and 4.00pm is the next most common time of driving/riding while fatigued (29%). 21% of fatigued drivers/riders say they last drove/rode tired between the hours of 10.00pm and 6.00am, while 18% report driving/riding while tired between 6.00am and 2.00pm. When you were last fatigued while driving/riding, what was the duration of the entire trip? (F6) The average duration of the entire trip while driving/riding in a fatigued state on the last occasion was 2.13 hours. The most common trip durations reported by those driving/riding while fatigued were less than one hour (37%) or in excess of four hours (27%). 23% of fatigued drivers/riders reported an entire trip duration of between one and two hours, while 13% estimated a trip duration of between two and four hours.
When you were last fatigued while driving/riding, what was the approximate location? (F7) An equal number of respondents reported that on the last occasion they drove/rode in a fatigued state, this was in a capital city (26%) or outside a capital or regional city (26%). 24% reported last driving/riding fatigued in a remote area, while 23% were driving/riding in a regional city. When you were last fatigued while driving/riding, what type of vehicle were you driving/riding? (F2) In the most recent instance of driving/riding in a state of fatigue, the majority of people report driving a car (87%). 7% report driving a light commercial vehicle, 2% a commercial passenger vehicle, 2% a motorcycle or scooter, 1% a heavy vehicle and 1% some other kind of vehicle. When you were last fatigued while driving/riding, what was the purpose of your journey? (F12) On the last occasion of driving/riding while tired, respondents most commonly report the purpose of their journey being holiday‐related travel (24%) or visiting friends or relatives (24%). 23% were driving/riding to or from their place of work, while 9% report dropping off or picking up friends or relatives. What do you believe contributed to your fatigue? (F11) On the most recent occasion that people were fatigued while driving/riding over the past 12 months, physical exhaustion (37%), stress (29%) or working long hours (26%) are reported to have been the most common contributors to fatigue. Other commonly mentioned contributors include extended travel for pleasure (14%), a medical condition or illness (13%) or being up all night caring for a new baby or family member (8%). When you were last fatigued while driving/riding, how many hours was it since you last slept? (F9) The average number of hours reportedly elapsing between when people last slept and driving/riding in a fatigued state was 10.99 hours. 16% of drivers/riders report that 0‐5 hours had elapsed, 26% that 5‐10 hours had elapsed, 35% that 10‐15 hours had passed, while 18% estimate a period between 15‐20 hours since they had last slept. The balance (5%) provided an estimate in excess of 20 hours.
When you were last fatigued while driving/riding, which of the following best describes your sleep patterns leading up to that event? (F10) On the last occasion that people were driving/riding in a state of fatigue, the most common preceding sleep pattern was a regular one, however a number of people reported experiencing insufficient sleep in the previous 24 hour period (47%). 30% reported their preceding sleep pattern as regular and healthy, while 15% claimed they had been deprived of sleep over an extended period of time. 7% of respondents reported experiencing some other kind of sleep pattern. When you first noticed that you were fatigued, what did you do? (F13) When people last drove/rode in a fatigued state their most common response upon noticing their fatigue was to keep driving/riding and perform activities to stay alert (43%). Alternatively, they pulled over to have a break (29%). Why did you choose to keep driving? (F14) Of fatigued drivers/riders who chose to continue on their journey, the two main reasons for this were because they had to get home (37%) or because they were close to their destination and did not think it worthwhile stopping (35%).
11
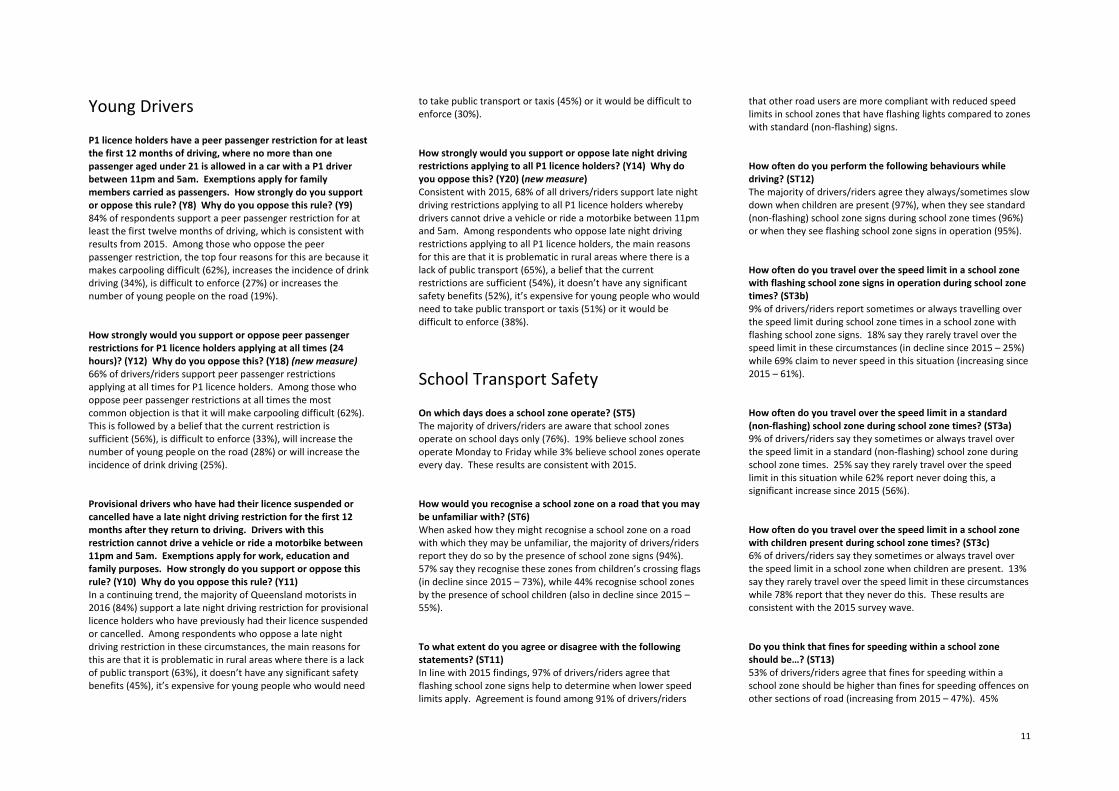
Young Drivers P1 licence holders have a peer passenger restriction for at least the first 12 months of driving, where no more than one passenger aged under 21 is allowed in a car with a P1 driver between 11pm and 5am. Exemptions apply for family members carried as passengers. How strongly do you support or oppose this rule? (Y8) Why do you oppose this rule? (Y9) 84% of respondents support a peer passenger restriction for at least the first twelve months of driving, which is consistent with results from 2015. Among those who oppose the peer passenger restriction, the top four reasons for this are because it makes carpooling difficult (62%), increases the incidence of drink driving (34%), is difficult to enforce (27%) or increases the number of young people on the road (19%). How strongly would you support or oppose peer passenger restrictions for P1 licence holders applying at all times (24 hours)? (Y12) Why do you oppose this? (Y18) (new measure) 66% of drivers/riders support peer passenger restrictions applying at all times for P1 licence holders. Among those who oppose peer passenger restrictions at all times the most common objection is that it will make carpooling difficult (62%). This is followed by a belief that the current restriction is sufficient (56%), is difficult to enforce (33%), will increase the number of young people on the road (28%) or will increase the incidence of drink driving (25%). Provisional drivers who have had their licence suspended or cancelled have a late night driving restriction for the first 12 months after they return to driving. Drivers with this restriction cannot drive a vehicle or ride a motorbike between 11pm and 5am. Exemptions apply for work, education and family purposes. How strongly do you support or oppose this rule? (Y10) Why do you oppose this rule? (Y11) In a continuing trend, the majority of Queensland motorists in 2016 (84%) support a late night driving restriction for provisional licence holders who have previously had their licence suspended or cancelled. Among respondents who oppose a late night driving restriction in these circumstances, the main reasons for this are that it is problematic in rural areas where there is a lack of public transport (63%), it doesn’t have any significant safety benefits (45%), it’s expensive for young people who would need
to take public transport or taxis (45%) or it would be difficult to enforce (30%). How strongly would you support or oppose late night driving restrictions applying to all P1 licence holders? (Y14) Why do you oppose this? (Y20) (new measure) Consistent with 2015, 68% of all drivers/riders support late night driving restrictions applying to all P1 licence holders whereby drivers cannot drive a vehicle or ride a motorbike between 11pm and 5am. Among respondents who oppose late night driving restrictions applying to all P1 licence holders, the main reasons for this are that it is problematic in rural areas where there is a lack of public transport (65%), a belief that the current restrictions are sufficient (54%), it doesn’t have any significant safety benefits (52%), it’s expensive for young people who would need to take public transport or taxis (51%) or it would be difficult to enforce (38%).
School Transport Safety On which days does a school zone operate? (ST5) The majority of drivers/riders are aware that school zones operate on school days only (76%). 19% believe school zones operate Monday to Friday while 3% believe school zones operate every day. These results are consistent with 2015. How would you recognise a school zone on a road that you may be unfamiliar with? (ST6) When asked how they might recognise a school zone on a road with which they may be unfamiliar, the majority of drivers/riders report they do so by the presence of school zone signs (94%). 57% say they recognise these zones from children’s crossing flags (in decline since 2015 – 73%), while 44% recognise school zones by the presence of school children (also in decline since 2015 –55%). To what extent do you agree or disagree with the following statements? (ST11) In line with 2015 findings, 97% of drivers/riders agree that flashing school zone signs help to determine when lower speed limits apply. Agreement is found among 91% of drivers/riders
that other road users are more compliant with reduced speed limits in school zones that have flashing lights compared to zones with standard (non‐flashing) signs. How often do you perform the following behaviours while driving? (ST12) The majority of drivers/riders agree they always/sometimes slow down when children are present (97%), when they see standard (non‐flashing) school zone signs during school zone times (96%) or when they see flashing school zone signs in operation (95%). How often do you travel over the speed limit in a school zone with flashing school zone signs in operation during school zone times? (ST3b) 9% of drivers/riders report sometimes or always travelling over the speed limit during school zone times in a school zone with flashing school zone signs. 18% say they rarely travel over the speed limit in these circumstances (in decline since 2015 – 25%) while 69% claim to never speed in this situation (increasing since 2015 – 61%). How often do you travel over the speed limit in a standard (non‐flashing) school zone during school zone times? (ST3a) 9% of drivers/riders say they sometimes or always travel over the speed limit in a standard (non‐flashing) school zone during school zone times. 25% say they rarely travel over the speed limit in this situation while 62% report never doing this, a significant increase since 2015 (56%). How often do you travel over the speed limit in a school zone with children present during school zone times? (ST3c) 6% of drivers/riders say they sometimes or always travel over the speed limit in a school zone when children are present. 13% say they rarely travel over the speed limit in these circumstances while 78% report that they never do this. These results are consistent with the 2015 survey wave. Do you think that fines for speeding within a school zone should be…? (ST13) 53% of drivers/riders agree that fines for speeding within a school zone should be higher than fines for speeding offences on other sections of road (increasing from 2015 – 47%). 45%
12
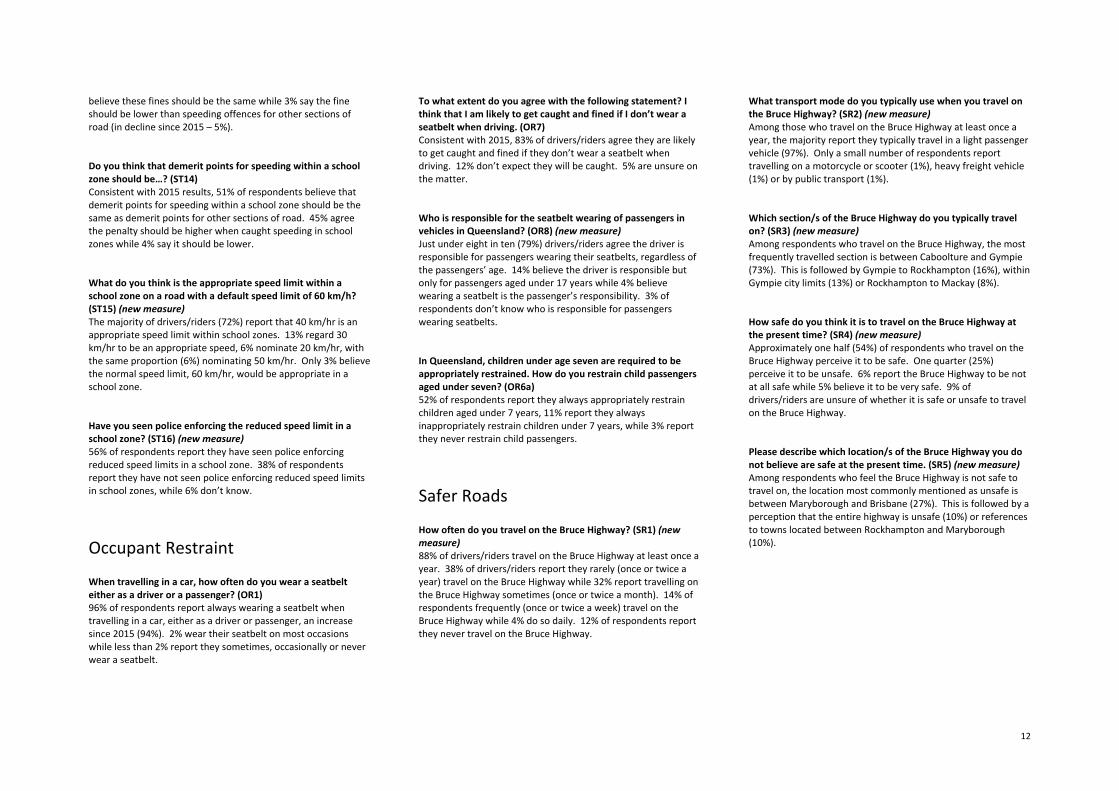
believe these fines should be the same while 3% say the fine should be lower than speeding offences for other sections of road (in decline since 2015 – 5%). Do you think that demerit points for speeding within a school zone should be…? (ST14) Consistent with 2015 results, 51% of respondents believe that demerit points for speeding within a school zone should be the same as demerit points for other sections of road. 45% agree the penalty should be higher when caught speeding in school zones while 4% say it should be lower. What do you think is the appropriate speed limit within a school zone on a road with a default speed limit of 60 km/h? (ST15) (new measure) The majority of drivers/riders (72%) report that 40 km/hr is an appropriate speed limit within school zones. 13% regard 30 km/hr to be an appropriate speed, 6% nominate 20 km/hr, with the same proportion (6%) nominating 50 km/hr. Only 3% believe the normal speed limit, 60 km/hr, would be appropriate in a school zone. Have you seen police enforcing the reduced speed limit in a school zone? (ST16) (new measure) 56% of respondents report they have seen police enforcing reduced speed limits in a school zone. 38% of respondents report they have not seen police enforcing reduced speed limits in school zones, while 6% don’t know.
Occupant Restraint When travelling in a car, how often do you wear a seatbelt either as a driver or a passenger? (OR1) 96% of respondents report always wearing a seatbelt when travelling in a car, either as a driver or passenger, an increase since 2015 (94%). 2% wear their seatbelt on most occasions while less than 2% report they sometimes, occasionally or never wear a seatbelt.
To what extent do you agree with the following statement? I think that I am likely to get caught and fined if I don’t wear a seatbelt when driving. (OR7) Consistent with 2015, 83% of drivers/riders agree they are likely to get caught and fined if they don’t wear a seatbelt when driving. 12% don’t expect they will be caught. 5% are unsure on the matter. Who is responsible for the seatbelt wearing of passengers in vehicles in Queensland? (OR8) (new measure) Just under eight in ten (79%) drivers/riders agree the driver is responsible for passengers wearing their seatbelts, regardless of the passengers’ age. 14% believe the driver is responsible but only for passengers aged under 17 years while 4% believe wearing a seatbelt is the passenger’s responsibility. 3% of respondents don’t know who is responsible for passengers wearing seatbelts. In Queensland, children under age seven are required to be appropriately restrained. How do you restrain child passengers aged under seven? (OR6a) 52% of respondents report they always appropriately restrain children aged under 7 years, 11% report they always inappropriately restrain children under 7 years, while 3% report they never restrain child passengers.
Safer Roads How often do you travel on the Bruce Highway? (SR1) (new measure) 88% of drivers/riders travel on the Bruce Highway at least once a year. 38% of drivers/riders report they rarely (once or twice a year) travel on the Bruce Highway while 32% report travelling on the Bruce Highway sometimes (once or twice a month). 14% of respondents frequently (once or twice a week) travel on the Bruce Highway while 4% do so daily. 12% of respondents report they never travel on the Bruce Highway.
What transport mode do you typically use when you travel on the Bruce Highway? (SR2) (new measure) Among those who travel on the Bruce Highway at least once a year, the majority report they typically travel in a light passenger vehicle (97%). Only a small number of respondents report travelling on a motorcycle or scooter (1%), heavy freight vehicle (1%) or by public transport (1%). Which section/s of the Bruce Highway do you typically travel on? (SR3) (new measure) Among respondents who travel on the Bruce Highway, the most frequently travelled section is between Caboolture and Gympie (73%). This is followed by Gympie to Rockhampton (16%), within Gympie city limits (13%) or Rockhampton to Mackay (8%). How safe do you think it is to travel on the Bruce Highway at the present time? (SR4) (new measure) Approximately one half (54%) of respondents who travel on the Bruce Highway perceive it to be safe. One quarter (25%) perceive it to be unsafe. 6% report the Bruce Highway to be not at all safe while 5% believe it to be very safe. 9% of drivers/riders are unsure of whether it is safe or unsafe to travel on the Bruce Highway. Please describe which location/s of the Bruce Highway you do not believe are safe at the present time. (SR5) (new measure) Among respondents who feel the Bruce Highway is not safe to travel on, the location most commonly mentioned as unsafe is between Maryborough and Brisbane (27%). This is followed by a perception that the entire highway is unsafe (10%) or references to towns located between Rockhampton and Maryborough (10%).
13
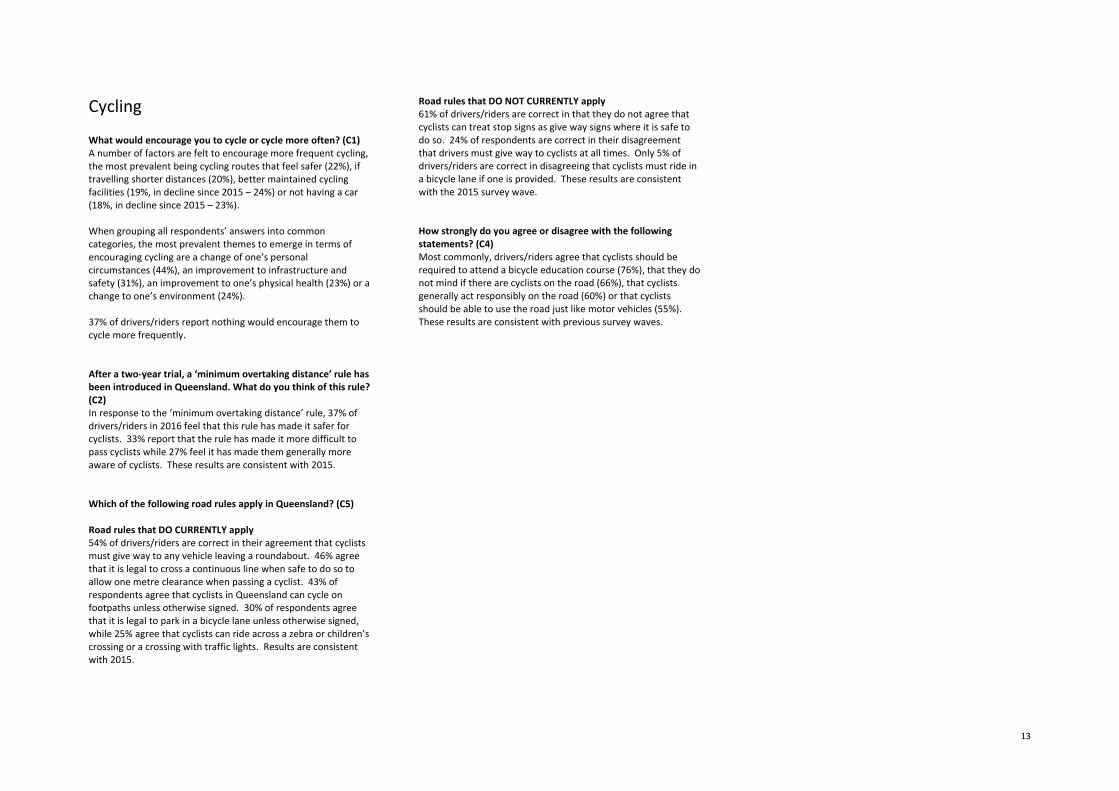
Cycling What would encourage you to cycle or cycle more often? (C1) A number of factors are felt to encourage more frequent cycling, the most prevalent being cycling routes that feel safer (22%), if travelling shorter distances (20%), better maintained cycling facilities (19%, in decline since 2015 – 24%) or not having a car (18%, in decline since 2015 – 23%). When grouping all respondents’ answers into common categories, the most prevalent themes to emerge in terms of encouraging cycling are a change of one’s personal circumstances (44%), an improvement to infrastructure and safety (31%), an improvement to one’s physical health (23%) or a change to one’s environment (24%). 37% of drivers/riders report nothing would encourage them to cycle more frequently. After a two‐year trial, a ‘minimum overtaking distance’ rule has been introduced in Queensland. What do you think of this rule? (C2) In response to the ‘minimum overtaking distance’ rule, 37% of drivers/riders in 2016 feel that this rule has made it safer for cyclists. 33% report that the rule has made it more difficult to pass cyclists while 27% feel it has made them generally more aware of cyclists. These results are consistent with 2015. Which of the following road rules apply in Queensland? (C5) Road rules that DO CURRENTLY apply 54% of drivers/riders are correct in their agreement that cyclists must give way to any vehicle leaving a roundabout. 46% agree that it is legal to cross a continuous line when safe to do so to allow one metre clearance when passing a cyclist. 43% of respondents agree that cyclists in Queensland can cycle on footpaths unless otherwise signed. 30% of respondents agree that it is legal to park in a bicycle lane unless otherwise signed, while 25% agree that cyclists can ride across a zebra or children’s crossing or a crossing with traffic lights. Results are consistent with 2015.
Road rules that DO NOT CURRENTLY apply 61% of drivers/riders are correct in that they do not agree that cyclists can treat stop signs as give way signs where it is safe to do so. 24% of respondents are correct in their disagreement that drivers must give way to cyclists at all times. Only 5% of drivers/riders are correct in disagreeing that cyclists must ride in a bicycle lane if one is provided. These results are consistent with the 2015 survey wave. How strongly do you agree or disagree with the following statements? (C4) Most commonly, drivers/riders agree that cyclists should be required to attend a bicycle education course (76%), that they do not mind if there are cyclists on the road (66%), that cyclists generally act responsibly on the road (60%) or that cyclists should be able to use the road just like motor vehicles (55%). These results are consistent with previous survey waves.
14
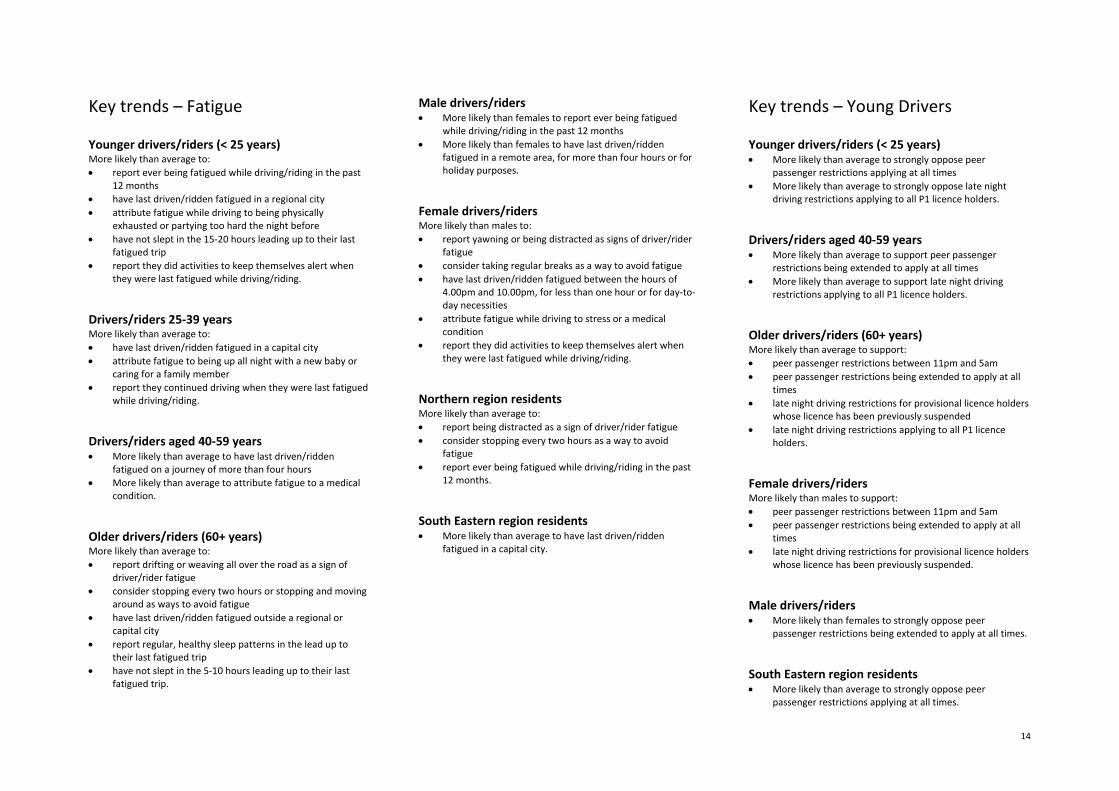
Key trends – Fatigue
Younger drivers/riders (< 25 years) More likely than average to: report ever being fatigued while driving/riding in the past
12 months have last driven/ridden fatigued in a regional city attribute fatigue while driving to being physically
exhausted or partying too hard the night before have not slept in the 15‐20 hours leading up to their last
fatigued trip report they did activities to keep themselves alert when
they were last fatigued while driving/riding. Drivers/riders 25‐39 years More likely than average to: have last driven/ridden fatigued in a capital city attribute fatigue to being up all night with a new baby or
caring for a family member report they continued driving when they were last fatigued
while driving/riding. Drivers/riders aged 40‐59 years More likely than average to have last driven/ridden
fatigued on a journey of more than four hours More likely than average to attribute fatigue to a medical
condition. Older drivers/riders (60+ years) More likely than average to: report drifting or weaving all over the road as a sign of
driver/rider fatigue consider stopping every two hours or stopping and moving
around as ways to avoid fatigue have last driven/ridden fatigued outside a regional or
capital city report regular, healthy sleep patterns in the lead up to
their last fatigued trip have not slept in the 5‐10 hours leading up to their last
fatigued trip.
Male drivers/riders More likely than females to report ever being fatigued
while driving/riding in the past 12 months More likely than females to have last driven/ridden
fatigued in a remote area, for more than four hours or for holiday purposes.
Female drivers/riders More likely than males to: report yawning or being distracted as signs of driver/rider
fatigue consider taking regular breaks as a way to avoid fatigue have last driven/ridden fatigued between the hours of
4.00pm and 10.00pm, for less than one hour or for day‐to‐day necessities
attribute fatigue while driving to stress or a medical condition
report they did activities to keep themselves alert when they were last fatigued while driving/riding.
Northern region residents More likely than average to: report being distracted as a sign of driver/rider fatigue consider stopping every two hours as a way to avoid
fatigue report ever being fatigued while driving/riding in the past
12 months. South Eastern region residents More likely than average to have last driven/ridden
fatigued in a capital city.
Key trends – Young Drivers
Younger drivers/riders (< 25 years) More likely than average to strongly oppose peer
passenger restrictions applying at all times More likely than average to strongly oppose late night
driving restrictions applying to all P1 licence holders. Drivers/riders aged 40‐59 years More likely than average to support peer passenger
restrictions being extended to apply at all times More likely than average to support late night driving
restrictions applying to all P1 licence holders. Older drivers/riders (60+ years) More likely than average to support: peer passenger restrictions between 11pm and 5am peer passenger restrictions being extended to apply at all
times late night driving restrictions for provisional licence holders
whose licence has been previously suspended late night driving restrictions applying to all P1 licence
holders. Female drivers/riders More likely than males to support: peer passenger restrictions between 11pm and 5am peer passenger restrictions being extended to apply at all
times late night driving restrictions for provisional licence holders
whose licence has been previously suspended. Male drivers/riders More likely than females to strongly oppose peer
passenger restrictions being extended to apply at all times. South Eastern region residents More likely than average to strongly oppose peer
passenger restrictions applying at all times.

15
Open licence holders More likely than average to support: peer passenger restrictions between 11pm and 5am peer passenger restrictions being extended to apply at all
times late night driving restrictions for provisional licence holders
whose licence has been previously suspended late night driving restrictions applying to all P1 licence
holders. Sub‐open licence holders More likely than average to strongly oppose peer
passenger restrictions applying at all times More likely than average to strongly oppose late night
driving restrictions applying to all P1 licence holders.
Key trends – School Transport Safety
Younger drivers/riders (< 25 years) More likely than average to: report they don’t know what days school zones operate report sometimes/always travelling over the speed limit in
school zones with non‐flashing school zone signs perceive 50 km/hr as an appropriate speed limit within
school zones. Drivers/riders aged 25‐39 years More likely than average to report sometimes/always
travelling over the speed limit in school zones. Drivers/riders aged 40‐59 years More likely than average to recognise school zones on
unfamiliar roads by children’s crossing flags, pavement markings or roadside activity
More likely than average to report having seen police enforcing reduced speed limits in school zones.
Older drivers/riders (60+ years) More likely than average to: believe school zones operate on school days only recognise school zones on unfamiliar roads by presence of
school zone signs or children’s crossing flags agree that other road users are more compliant with
reduced speed limits in school zones with flashing lights rather than standard signs
report slowing down in school zones when children are present
perceive 20 km/hr or 30 km/hr as an appropriate speed limit within school zones.
Male drivers/riders More likely than females to report sometimes/always
travelling over the speed limit in school zones with non‐flashing school zone signs or when children are present.
South Eastern region residents More likely than average to agree that demerit points
should be lower for speeding in a school zone. Northern region residents More likely than average to believe school zones operate
on school days only More likely than average to recognise school zones on
unfamiliar roads by presence of school zone signs. Open licence holders More likely than average to: recognise school zones on unfamiliar roads by presence of
school zone signs, children’s crossing flags or pavement markings
report always slowing down in each of the school zone scenarios tested
perceive 40 km/hr as an appropriate speed limit within school zones
report having seen police enforcing reduced speed limits in school zones.
Sub‐open licence holders More likely than average to: believe school zones operate every day report sometimes/always travelling over the speed limit in
school zones with non‐flashing or flashing school zone signs perceive 50 km/hr as an appropriate speed limit within
school zones. Motorcycle riders More likely than average to: believe school zones operate every day report sometimes/always travelling over the speed limit in
school zones perceive 30 km/hr as an appropriate speed limit within
school zones.
Key trends – Occupant Restraint
Younger drivers/riders (< 25 years) More likely than average to be unsure who is responsible
for passengers wearing seatbelts More likely than average to report they always, mostly or
sometimes do not restrain child passengers at all. Drivers/riders aged 25‐39 years More likely than average to report the driver is responsible
for passengers wearing seatbelts, but only for passengers under 17 years
More likely than average to report they always, mostly or sometimes appropriately restrain children under 7 years
More likely than average to report they always, mostly or sometimes do not restrain child passengers at all.

16
Older drivers/riders (60+ years) More likely than average to believe they are likely to get
caught and fined if they do not wear a seatbelt while driving/riding
More likely than average to report the driver is responsible for passengers wearing seatbelts, regardless of their age.
Male drivers/riders More likely than females to report they always, mostly or
sometimes inappropriately restrain children under 7 years. South Eastern region residents More likely than average to report they always, mostly or
sometimes inappropriately restrain children under 7 years. Open licence holders More likely than average to report the driver is responsible
for passengers wearing seatbelts, regardless of their age. Sub‐open licence holders More likely than average to report the driver is responsible
for passengers wearing seatbelts, but only for passengers under 17 years or to be unsure who is responsible for passengers wearing seatbelts
More likely than average to report they always, mostly or sometimes inappropriately restrain or do not restrain children at all.
Motorcycle riders Less likely than average to sometimes, mostly or always
wear a seatbelt in a car More likely than average to report they always, mostly or
sometimes restrain children under 7 years appropriately, inappropriately or do not restrain children at all.
Key trends – Safer Roads
Younger drivers/riders (< 25 years) More likely than average to report never travelling on the
Bruce Highway More likely than average to report travelling on the Bruce
Highway in a heavy freight vehicle. Drivers/riders aged 40‐59 years More likely than average to consider the Bruce Highway to
be unsafe to travel.
Older drivers/riders (60+ years) More likely than average to report rarely travelling on the
Bruce Highway More likely than average to travel on the Bruce Highway
between Caboolture and Gympie. Female drivers/riders More likely than males to report travelling in a light
passenger vehicle on the Bruce Highway. South Eastern region residents More likely than average to report never travelling on the
Bruce Highway.
Southern region residents More likely than average to report rarely travelling on the
Bruce Highway. Central region residents More likely than average to report travelling on the Bruce
Highway once or twice a week or daily.
Northern region residents More likely than average to report travelling on the Bruce
Highway daily. Open licence holders More likely than average to: report rarely travelling on the Bruce Highway report travelling in a light passenger vehicle on the Bruce
Highway consider the Bruce Highway to be unsafe to travel. Sub‐open licence holders More likely than average to report travelling on the Bruce
Highway on a motorcycle/scooter or in a heavy freight vehicle.
Motorcycle riders More likely than average to report travelling on the Bruce
Highway on a motorcycle/scooter or in a heavy freight vehicle
More likely than average to travel on the Bruce Highway between Gympie and Mackay, including within the city limits of Gympie and Rockhampton.
17
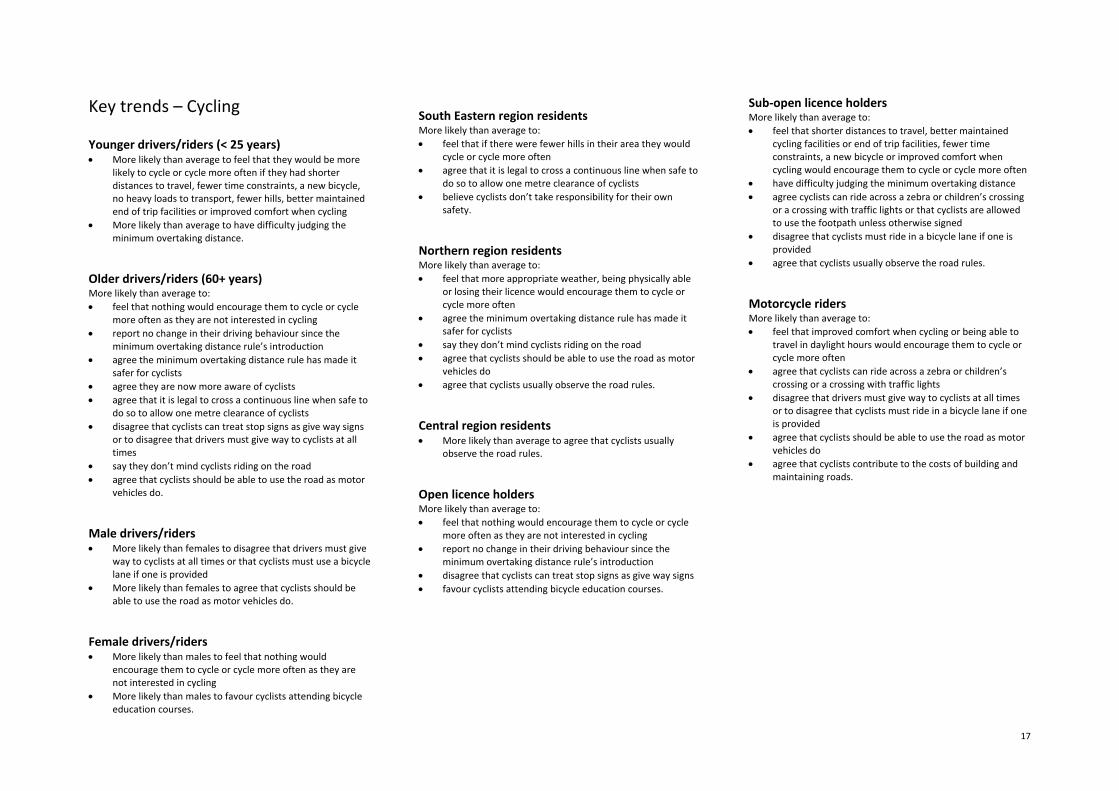
Key trends – Cycling
Younger drivers/riders (< 25 years) More likely than average to feel that they would be more
likely to cycle or cycle more often if they had shorter distances to travel, fewer time constraints, a new bicycle, no heavy loads to transport, fewer hills, better maintained end of trip facilities or improved comfort when cycling
More likely than average to have difficulty judging the minimum overtaking distance.
Older drivers/riders (60+ years) More likely than average to: feel that nothing would encourage them to cycle or cycle
more often as they are not interested in cycling report no change in their driving behaviour since the
minimum overtaking distance rule’s introduction agree the minimum overtaking distance rule has made it
safer for cyclists agree they are now more aware of cyclists agree that it is legal to cross a continuous line when safe to
do so to allow one metre clearance of cyclists disagree that cyclists can treat stop signs as give way signs
or to disagree that drivers must give way to cyclists at all times
say they don’t mind cyclists riding on the road agree that cyclists should be able to use the road as motor
vehicles do. Male drivers/riders More likely than females to disagree that drivers must give
way to cyclists at all times or that cyclists must use a bicycle lane if one is provided
More likely than females to agree that cyclists should be able to use the road as motor vehicles do.
Female drivers/riders More likely than males to feel that nothing would
encourage them to cycle or cycle more often as they are not interested in cycling
More likely than males to favour cyclists attending bicycle education courses.
South Eastern region residents More likely than average to: feel that if there were fewer hills in their area they would
cycle or cycle more often agree that it is legal to cross a continuous line when safe to
do so to allow one metre clearance of cyclists believe cyclists don’t take responsibility for their own
safety. Northern region residents More likely than average to: feel that more appropriate weather, being physically able
or losing their licence would encourage them to cycle or cycle more often
agree the minimum overtaking distance rule has made it safer for cyclists
say they don’t mind cyclists riding on the road agree that cyclists should be able to use the road as motor
vehicles do agree that cyclists usually observe the road rules. Central region residents More likely than average to agree that cyclists usually
observe the road rules. Open licence holders More likely than average to: feel that nothing would encourage them to cycle or cycle
more often as they are not interested in cycling report no change in their driving behaviour since the
minimum overtaking distance rule’s introduction disagree that cyclists can treat stop signs as give way signs favour cyclists attending bicycle education courses.
Sub‐open licence holders More likely than average to: feel that shorter distances to travel, better maintained
cycling facilities or end of trip facilities, fewer time constraints, a new bicycle or improved comfort when cycling would encourage them to cycle or cycle more often
have difficulty judging the minimum overtaking distance agree cyclists can ride across a zebra or children’s crossing
or a crossing with traffic lights or that cyclists are allowed to use the footpath unless otherwise signed
disagree that cyclists must ride in a bicycle lane if one is provided
agree that cyclists usually observe the road rules. Motorcycle riders More likely than average to: feel that improved comfort when cycling or being able to
travel in daylight hours would encourage them to cycle or cycle more often
agree that cyclists can ride across a zebra or children’s crossing or a crossing with traffic lights
disagree that drivers must give way to cyclists at all times or to disagree that cyclists must ride in a bicycle lane if one is provided
agree that cyclists should be able to use the road as motor vehicles do
agree that cyclists contribute to the costs of building and maintaining roads.

18

19
method

20
Research Method The 2016 method comprised an online self‐completion survey using the ORU research panel. Where relevant, results from the 2016 survey have been paired with data from previous waves of research for comparison. Prior to 2008, the survey was conducted using the CATI (computer assisted telephone interview) methodology, but was changed in subsequent years to an online panel format.
Fieldwork Questionnaire Design The questionnaire used for the current wave of interviewing is appended to this report as Appendix A. The questionnaire consists predominantly of closed‐ended questions where response options have been pre‐coded. A listing of responses that did not fall within the prescribed response codes within the questionnaire can be found at Appendix B. At the request of Department of Transport and Main Roads (DTMR), changes have been made to the questionnaire between each wave of interviewing. New questions have been introduced, past questions deleted and some changes to question wording have been requested. Where question wording has changed, this has been indicated throughout the report. Online panel MCR’s panel supplier, ORU, generated the sample and distributed the self‐completion survey to its Queensland panellists for this study. ORU own and manage the largest research‐only panel in Australia (with over 300,000 members) and have QSOAP (Quality Standard for Online Access Panels) ‘Best Practice’ Level 2 accreditation. They have a unique “by‐invitation‐only” strategy which ensures greater quality of respondents.
Sample Selection and Size Eligibility for selection and sampling population
The geographic sampling population for this survey was the state of Queensland. Those eligible to be surveyed were people aged 16 years and over who hold, or who have ever held a drivers/riders (motorcycle, scooter or moped) licence.
Sampling Best practice sampling was used to collect the respondent group: the sample was deployed as random in controlled batches, with reminders, activity/category filtering and over sampling conducted as necessary. Anyone who had taken part in a survey on the topic of road safety in the past six months was excluded from the invitation process. Dates of fieldwork
The fieldwork dates for the survey were from the 11th April –12th May, 2016. Appendix C contains the fieldwork report which details the results of contact with all potential respondents.
Weighting
Post enumeration the data were weighted up to statistics supplied by DTMR on the total number licences on record in Queensland as at 31st January 2016.
Definitions
Throughout the report a number of abbreviations and labels have been used, the definitions of which are provided below: Sub‐open – Learner, Provisional and Probationary licences Sth Eastern – South Eastern km/hr – kilometres per hour Jul – July Apr – April M/C – Motorcycle 60+ – people aged 60 years and older <25 – people aged 16‐24 years n – sample. Data Analysis
At the completion of fieldwork, the survey results were analysed using the statistical package: SurveyCraft. The analysis took the form of frequency counts for each question and cross analysis of responses to all questions by selected demographic and behavioural factors (cross tabulations). In addition to these analyses, the data were subjected to Z‐tests to detect significant differences between the average and sub‐group results. Statistics that are significantly different to the average have been identified throughout the report through the use of bolding. The average calculation is based on the responses of all respondents to a question. It should be noted that where a key result differs significantly from the average (and is referred to in the report’s commentary), it is not necessarily the group with the highest percentage (small cell sizes mean sometimes there is a group with a higher percentage, however this does not differ significantly from the average after taking sampling error into account).
To assess sampling error associated with survey results, the reader is referred to the sampling error chart at Appendix D.
21
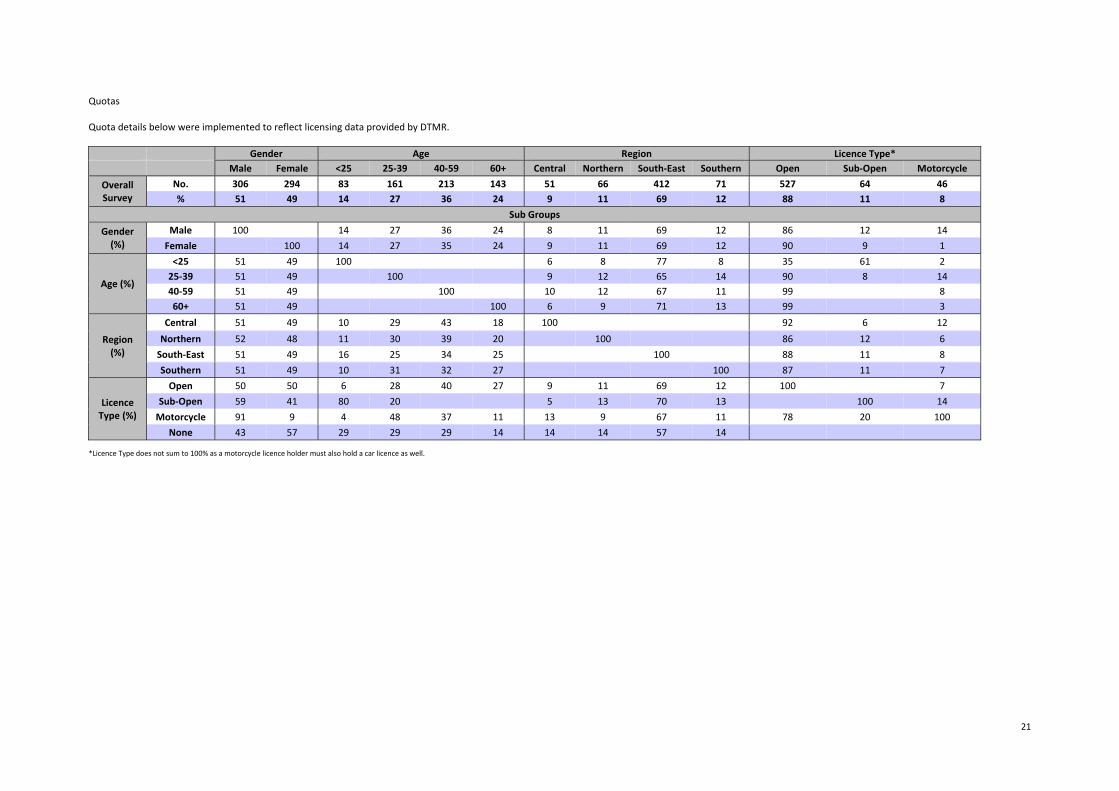
Quotas Quota details below were implemented to reflect licensing data provided by DTMR.
Gender Age Region Licence Type* Male Female <25 25‐39 40‐59 60+ Central Northern South‐East Southern Open Sub‐Open Motorcycle
Overall Survey
No. 306 294 83 161 213 143 51 66 412 71 527 64 46 % 51 49 14 27 36 24 9 11 69 12 88 11 8
Sub Groups
Gender (%)
Male 100 14 27 36 24 8 11 69 12 86 12 14 Female 100 14 27 35 24 9 11 69 12 90 9 1
Age (%)
<25 51 49 100 6 8 77 8 35 61 2 25‐39 51 49 100 9 12 65 14 90 8 14 40‐59 51 49 100 10 12 67 11 99 8 60+ 51 49 100 6 9 71 13 99 3
Region (%)
Central 51 49 10 29 43 18 100 92 6 12 Northern 52 48 11 30 39 20 100 86 12 6 South‐East 51 49 16 25 34 25 100 88 11 8 Southern 51 49 10 31 32 27 100 87 11 7
Licence Type (%)
Open 50 50 6 28 40 27 9 11 69 12 100 7 Sub‐Open 59 41 80 20 5 13 70 13 100 14 Motorcycle 91 9 4 48 37 11 13 9 67 11 78 20 100
None 43 57 29 29 29 14 14 14 57 14
*Licence Type does not sum to 100% as a motorcycle licence holder must also hold a car licence as well.
22
Publication of Information
MCR is a member of the Australian Market and Social Research Organisation (AMSRO) and abides by the Australian Market and Social Research Society’s Code of Professional Behaviour. Fieldwork is provided by an AMSRS and QA certified research panel. The Code of Professional Behaviour can be downloaded at www.amsrs.com.au. Under the Code of Professional Behaviour – information about clients’ businesses, their commissioned market research data and findings remain confidential to the clients unless both clients and researchers agree to the details of any publications.
Disclaimer As is our normal practice, we emphasise that any market size estimates in this report can be influenced by a number of unforeseen events or by management decisions. Therefore no warranty can be given that the information included will be predictive of a desired outcome.

23
findings

24

25
fatigue
26
1.0 Warning signs for driver/rider fatigue
1.1.1 To the best of your knowledge, what are some of the warning signs for driver/rider fatigue? (F16) (new measure)
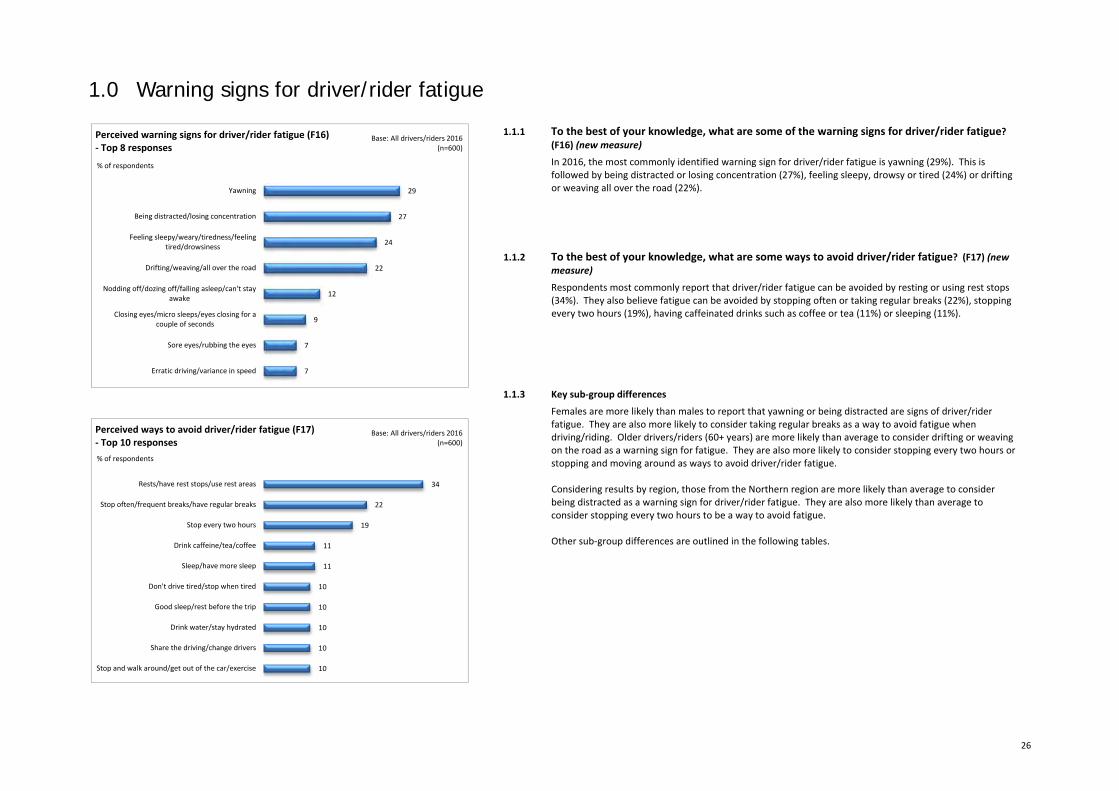
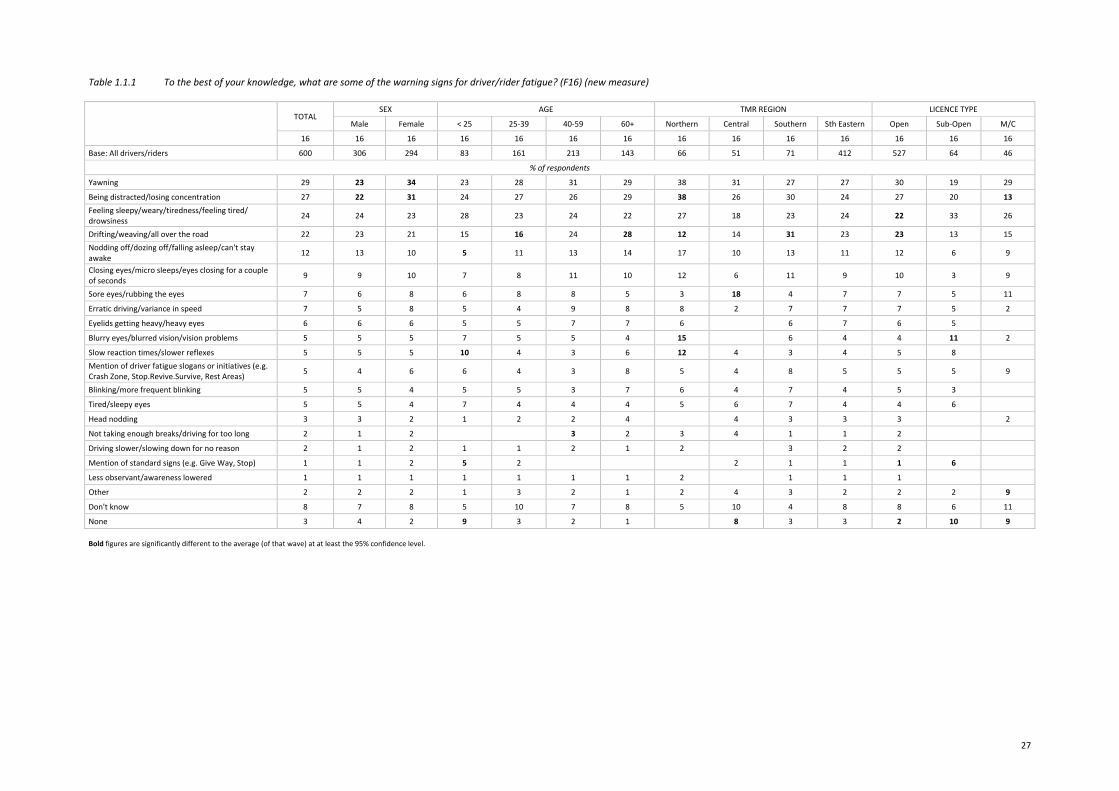
In 2016, the most commonly identified warning sign for driver/rider fatigue is yawning (29%). This is followed by being distracted or losing concentration (27%), feeling sleepy, drowsy or tired (24%) or drifting or weaving all over the road (22%).
1.1.2 To the best of your knowledge, what are some ways to avoid driver/rider fatigue? (F17) (new measure)
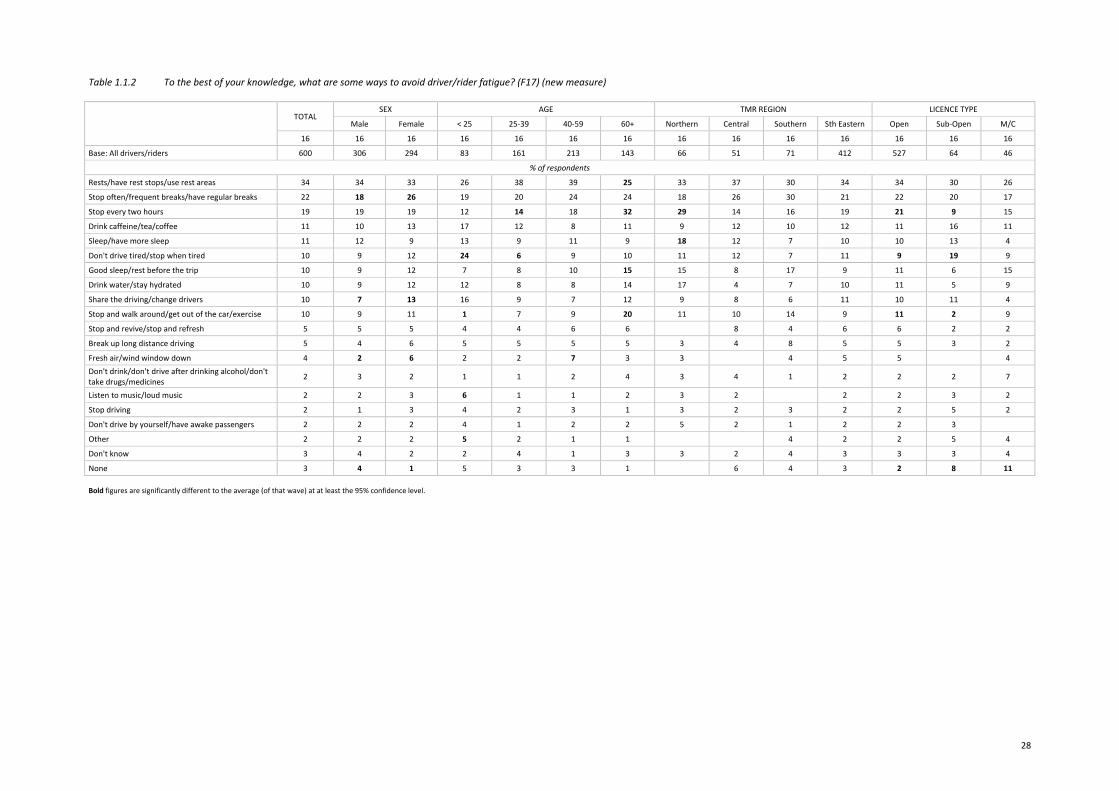
Respondents most commonly report that driver/rider fatigue can be avoided by resting or using rest stops (34%). They also believe fatigue can be avoided by stopping often or taking regular breaks (22%), stopping every two hours (19%), having caffeinated drinks such as coffee or tea (11%) or sleeping (11%).
1.1.3 Key sub‐group differences
Females are more likely than males to report that yawning or being distracted are signs of driver/rider fatigue. They are also more likely to consider taking regular breaks as a way to avoid fatigue when driving/riding. Older drivers/riders (60+ years) are more likely than average to consider drifting or weaving on the road as a warning sign for fatigue. They are also more likely to consider stopping every two hours or stopping and moving around as ways to avoid driver/rider fatigue. Considering results by region, those from the Northern region are more likely than average to consider being distracted as a warning sign for driver/rider fatigue. They are also more likely than average to consider stopping every two hours to be a way to avoid fatigue. Other sub‐group differences are outlined in the following tables.
29
27
24
22
12
9
7
7
Yawning
Being distracted/losing concentration
Feeling sleepy/weary/tiredness/feelingtired/drowsiness
Drifting/weaving/all over the road
Nodding off/dozing off/falling asleep/can't stayawake
Closing eyes/micro sleeps/eyes closing for acouple of seconds
Sore eyes/rubbing the eyes
Erratic driving/variance in speed
Perceived warning signs for driver/rider fatigue (F16) ‐ Top 8 responses
% of respondents
Base: All drivers/riders 2016(n=600)
34
22
19
11
11
10
10
10
10
10
Rests/have rest stops/use rest areas
Stop often/frequent breaks/have regular breaks
Stop every two hours
Drink caffeine/tea/coffee
Sleep/have more sleep
Don't drive tired/stop when tired
Good sleep/rest before the trip
Drink water/stay hydrated
Share the driving/change drivers
Stop and walk around/get out of the car/exercise
Perceived ways to avoid driver/rider fatigue (F17) ‐ Top 10 responses% of respondents
Base: All drivers/riders 2016(n=600)
27
Table 1.1.1 To the best of your knowledge, what are some of the warning signs for driver/rider fatigue? (F16) (new measure)
TOTAL
SEX AGE TMR REGION LICENCE TYPE
Male Female < 25 25‐39 40‐59 60+ Northern Central Southern Sth Eastern Open Sub‐Open M/C
16 16 16 16 16 16 16 16 16 16 16 16 16 16
Base: All drivers/riders 600 306 294 83 161 213 143 66 51 71 412 527 64 46
% of respondents
Yawning 29 23 34 23 28 31 29 38 31 27 27 30 19 29
Being distracted/losing concentration 27 22 31 24 27 26 29 38 26 30 24 27 20 13 Feeling sleepy/weary/tiredness/feeling tired/ drowsiness 24 24 23 28 23 24 22 27 18 23 24 22 33 26
Drifting/weaving/all over the road 22 23 21 15 16 24 28 12 14 31 23 23 13 15 Nodding off/dozing off/falling asleep/can't stay awake 12 13 10 5 11 13 14 17 10 13 11 12 6 9
Closing eyes/micro sleeps/eyes closing for a couple of seconds 9 9 10 7 8 11 10 12 6 11 9 10 3 9
Sore eyes/rubbing the eyes 7 6 8 6 8 8 5 3 18 4 7 7 5 11
Erratic driving/variance in speed 7 5 8 5 4 9 8 8 2 7 7 7 5 2
Eyelids getting heavy/heavy eyes 6 6 6 5 5 7 7 6 6 7 6 5
Blurry eyes/blurred vision/vision problems 5 5 5 7 5 5 4 15 6 4 4 11 2
Slow reaction times/slower reflexes 5 5 5 10 4 3 6 12 4 3 4 5 8 Mention of driver fatigue slogans or initiatives (e.g. Crash Zone, Stop.Revive.Survive, Rest Areas) 5 4 6 6 4 3 8 5 4 8 5 5 5 9
Blinking/more frequent blinking 5 5 4 5 5 3 7 6 4 7 4 5 3
Tired/sleepy eyes 5 5 4 7 4 4 4 5 6 7 4 4 6
Head nodding 3 3 2 1 2 2 4 4 3 3 3 2
Not taking enough breaks/driving for too long 2 1 2 3 2 3 4 1 1 2
Driving slower/slowing down for no reason 2 1 2 1 1 2 1 2 3 2 2
Mention of standard signs (e.g. Give Way, Stop) 1 1 2 5 2 2 1 1 1 6
Less observant/awareness lowered 1 1 1 1 1 1 1 2 1 1 1
Other 2 2 2 1 3 2 1 2 4 3 2 2 2 9
Don't know 8 7 8 5 10 7 8 5 10 4 8 8 6 11
None 3 4 2 9 3 2 1 8 3 3 2 10 9 Bold figures are significantly different to the average (of that wave) at at least the 95% confidence level.
28
Table 1.1.2 To the best of your knowledge, what are some ways to avoid driver/rider fatigue? (F17) (new measure)
TOTAL
SEX AGE TMR REGION LICENCE TYPE
Male Female < 25 25‐39 40‐59 60+ Northern Central Southern Sth Eastern Open Sub‐Open M/C
16 16 16 16 16 16 16 16 16 16 16 16 16 16
Base: All drivers/riders 600 306 294 83 161 213 143 66 51 71 412 527 64 46
% of respondents
Rests/have rest stops/use rest areas 34 34 33 26 38 39 25 33 37 30 34 34 30 26
Stop often/frequent breaks/have regular breaks 22 18 26 19 20 24 24 18 26 30 21 22 20 17
Stop every two hours 19 19 19 12 14 18 32 29 14 16 19 21 9 15
Drink caffeine/tea/coffee 11 10 13 17 12 8 11 9 12 10 12 11 16 11
Sleep/have more sleep 11 12 9 13 9 11 9 18 12 7 10 10 13 4
Don't drive tired/stop when tired 10 9 12 24 6 9 10 11 12 7 11 9 19 9
Good sleep/rest before the trip 10 9 12 7 8 10 15 15 8 17 9 11 6 15
Drink water/stay hydrated 10 9 12 12 8 8 14 17 4 7 10 11 5 9
Share the driving/change drivers 10 7 13 16 9 7 12 9 8 6 11 10 11 4
Stop and walk around/get out of the car/exercise 10 9 11 1 7 9 20 11 10 14 9 11 2 9
Stop and revive/stop and refresh 5 5 5 4 4 6 6 8 4 6 6 2 2
Break up long distance driving 5 4 6 5 5 5 5 3 4 8 5 5 3 2
Fresh air/wind window down 4 2 6 2 2 7 3 3 4 5 5 4 Don't drink/don't drive after drinking alcohol/don't take drugs/medicines 2 3 2 1 1 2 4 3 4 1 2 2 2 7
Listen to music/loud music 2 2 3 6 1 1 2 3 2 2 2 3 2
Stop driving 2 1 3 4 2 3 1 3 2 3 2 2 5 2
Don't drive by yourself/have awake passengers 2 2 2 4 1 2 2 5 2 1 2 2 3
Other 2 2 2 5 2 1 1 4 2 2 5 4
Don't know 3 4 2 2 4 1 3 3 2 4 3 3 3 4
None 3 4 1 5 3 3 1 6 4 3 2 8 11 Bold figures are significantly different to the average (of that wave) at at least the 95% confidence level.
29
2.0 Prevalence of driving/riding while fatigued
2.1.1 > In the last 12 months, have you ever been fatigued while driving/riding? (F1)
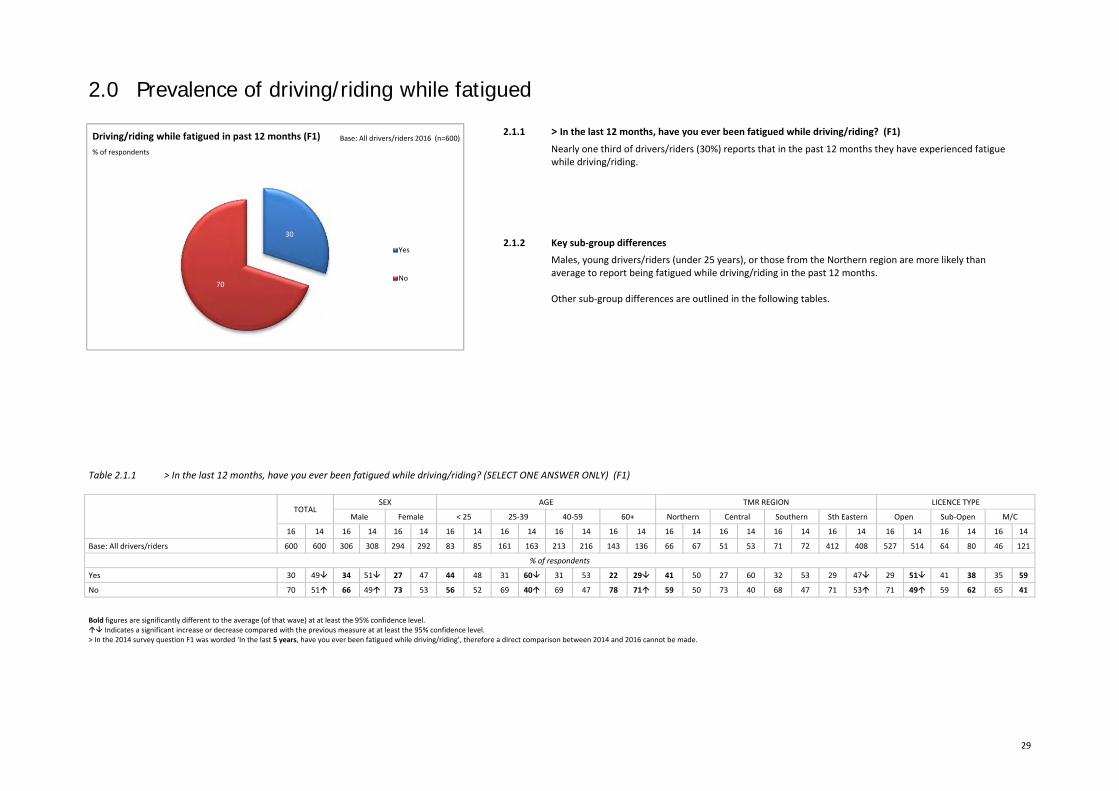
Nearly one third of drivers/riders (30%) reports that in the past 12 months they have experienced fatigue while driving/riding.
2.1.2 Key sub‐group differences
Males, young drivers/riders (under 25 years), or those from the Northern region are more likely than average to report being fatigued while driving/riding in the past 12 months. Other sub‐group differences are outlined in the following tables.
Table 2.1.1 > In the last 12 months, have you ever been fatigued while driving/riding? (SELECT ONE ANSWER ONLY) (F1)
TOTAL
SEX AGE TMR REGION LICENCE TYPE
Male Female < 25 25‐39 40‐59 60+ Northern Central Southern Sth Eastern Open Sub‐Open M/C
16 14 16 14 16 14 16 14 16 14 16 14 16 14 16 14 16 14 16 14 16 14 16 14 16 14 16 14
Base: All drivers/riders 600 600 306 308 294 292 83 85 161 163 213 216 143 136 66 67 51 53 71 72 412 408 527 514 64 80 46 121
% of respondents
Yes 30 49 34 51 27 47 44 48 31 60 31 53 22 29 41 50 27 60 32 53 29 47 29 51 41 38 35 59
No 70 51 66 49 73 53 56 52 69 40 69 47 78 71 59 50 73 40 68 47 71 53 71 49 59 62 65 41
Bold figures are significantly different to the average (of that wave) at at least the 95% confidence level. Indicates a significant increase or decrease compared with the previous measure at at least the 95% confidence level. > In the 2014 survey question F1 was worded ‘In the last 5 years, have you ever been fatigued while driving/riding’, therefore a direct comparison between 2014 and 2016 cannot be made.
30
70
Yes
No
Driving/riding while fatigued in past 12 months (F1) Base: All drivers/riders 2016 (n=600)
% of respondents
30
3.0 Characteristics of fatigued driving
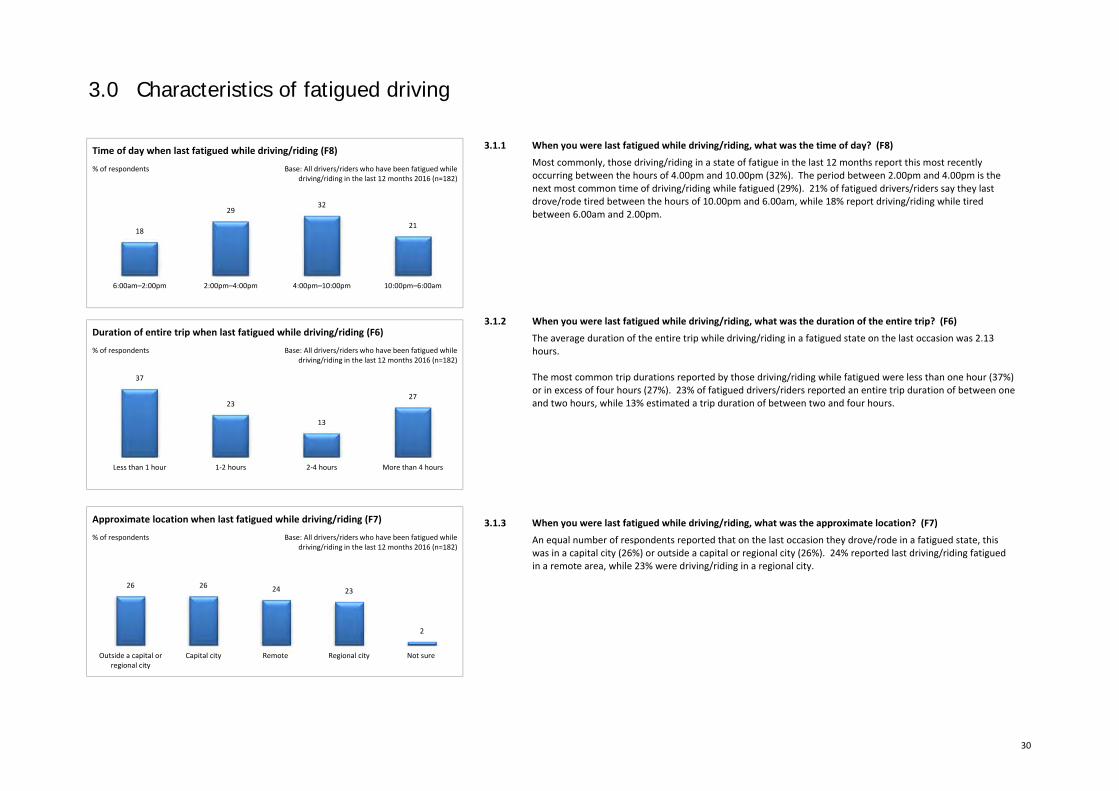
3.1.1 When you were last fatigued while driving/riding, what was the time of day? (F8)
Most commonly, those driving/riding in a state of fatigue in the last 12 months report this most recently occurring between the hours of 4.00pm and 10.00pm (32%). The period between 2.00pm and 4.00pm is the next most common time of driving/riding while fatigued (29%). 21% of fatigued drivers/riders say they last drove/rode tired between the hours of 10.00pm and 6.00am, while 18% report driving/riding while tired between 6.00am and 2.00pm.
3.1.2 When you were last fatigued while driving/riding, what was the duration of the entire trip? (F6)
The average duration of the entire trip while driving/riding in a fatigued state on the last occasion was 2.13 hours. The most common trip durations reported by those driving/riding while fatigued were less than one hour (37%) or in excess of four hours (27%). 23% of fatigued drivers/riders reported an entire trip duration of between one and two hours, while 13% estimated a trip duration of between two and four hours.
3.1.3 When you were last fatigued while driving/riding, what was the approximate location? (F7)
An equal number of respondents reported that on the last occasion they drove/rode in a fatigued state, this was in a capital city (26%) or outside a capital or regional city (26%). 24% reported last driving/riding fatigued in a remote area, while 23% were driving/riding in a regional city.
18
2932
21
6:00am–2:00pm 2:00pm–4:00pm 4:00pm–10:00pm 10:00pm–6:00am
% of respondents Base: All drivers/riders who have been fatigued while driving/riding in the last 12 months 2016 (n=182)
Time of day when last fatigued while driving/riding (F8)
37
23
13
27
Less than 1 hour 1‐2 hours 2‐4 hours More than 4 hours
% of respondents Base: All drivers/riders who have been fatigued while driving/riding in the last 12 months 2016 (n=182)
Duration of entire trip when last fatigued while driving/riding (F6)
26 26 24 23
2
Outside a capital orregional city
Capital city Remote Regional city Not sure
% of respondents Base: All drivers/riders who have been fatigued while driving/riding in the last 12 months 2016 (n=182)
Approximate location when last fatigued while driving/riding (F7)
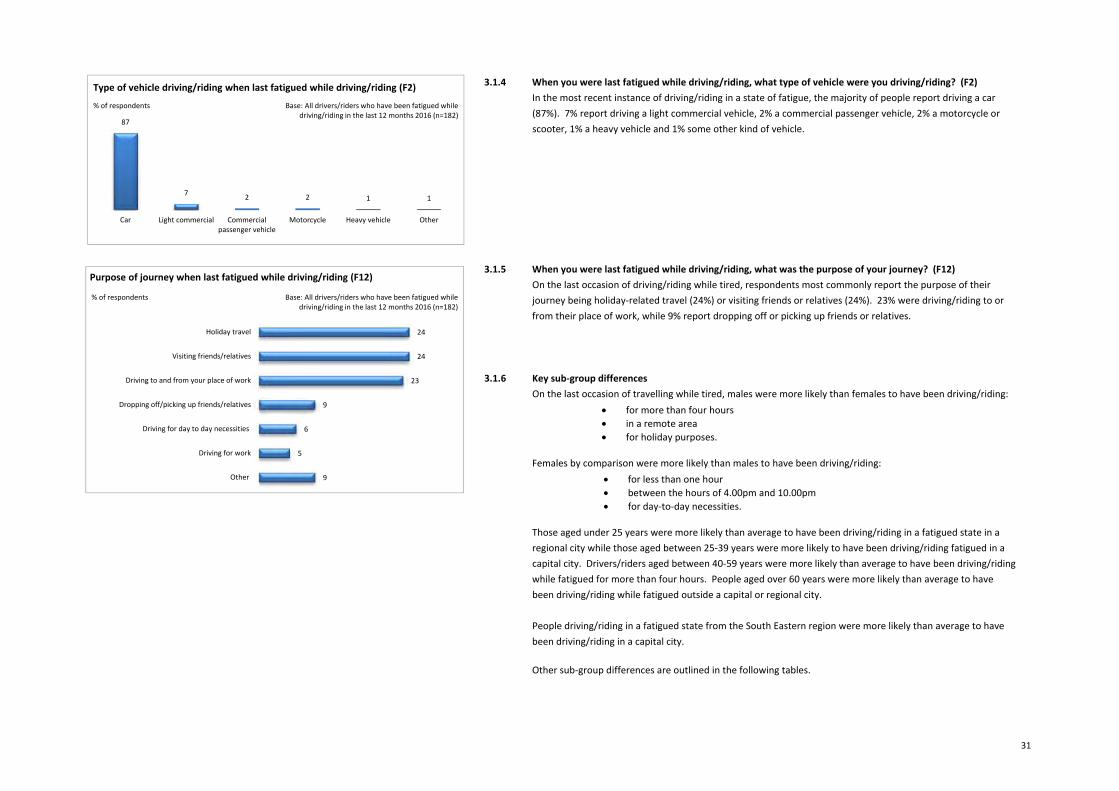
31
3.1.4 When you were last fatigued while driving/riding, what type of vehicle were you driving/riding? (F2)In the most recent instance of driving/riding in a state of fatigue, the majority of people report driving a car (87%). 7% report driving a light commercial vehicle, 2% a commercial passenger vehicle, 2% a motorcycle or scooter, 1% a heavy vehicle and 1% some other kind of vehicle.
3.1.5 When you were last fatigued while driving/riding, what was the purpose of your journey? (F12) On the last occasion of driving/riding while tired, respondents most commonly report the purpose of their journey being holiday‐related travel (24%) or visiting friends or relatives (24%). 23% were driving/riding to or from their place of work, while 9% report dropping off or picking up friends or relatives.
3.1.6 Key sub‐group differences
On the last occasion of travelling while tired, males were more likely than females to have been driving/riding: for more than four hours in a remote area for holiday purposes.
Females by comparison were more likely than males to have been driving/riding:
for less than one hour between the hours of 4.00pm and 10.00pm for day‐to‐day necessities.
Those aged under 25 years were more likely than average to have been driving/riding in a fatigued state in a regional city while those aged between 25‐39 years were more likely to have been driving/riding fatigued in a capital city. Drivers/riders aged between 40‐59 years were more likely than average to have been driving/riding while fatigued for more than four hours. People aged over 60 years were more likely than average to have been driving/riding while fatigued outside a capital or regional city. People driving/riding in a fatigued state from the South Eastern region were more likely than average to have been driving/riding in a capital city.
Other sub‐group differences are outlined in the following tables.
24
24
23
9
6
5
9
Holiday travel
Visiting friends/relatives
Driving to and from your place of work
Dropping off/picking up friends/relatives
Driving for day to day necessities
Driving for work
Other
Purpose of journey when last fatigued while driving/riding (F12)
% of respondents Base: All drivers/riders who have been fatigued while driving/riding in the last 12 months 2016 (n=182)
87
7 2 2 1 1
Car Light commercial Commercialpassenger vehicle
Motorcycle Heavy vehicle Other
% of respondents Base: All drivers/riders who have been fatigued while driving/riding in the last 12 months 2016 (n=182)
Type of vehicle driving/riding when last fatigued while driving/riding (F2)
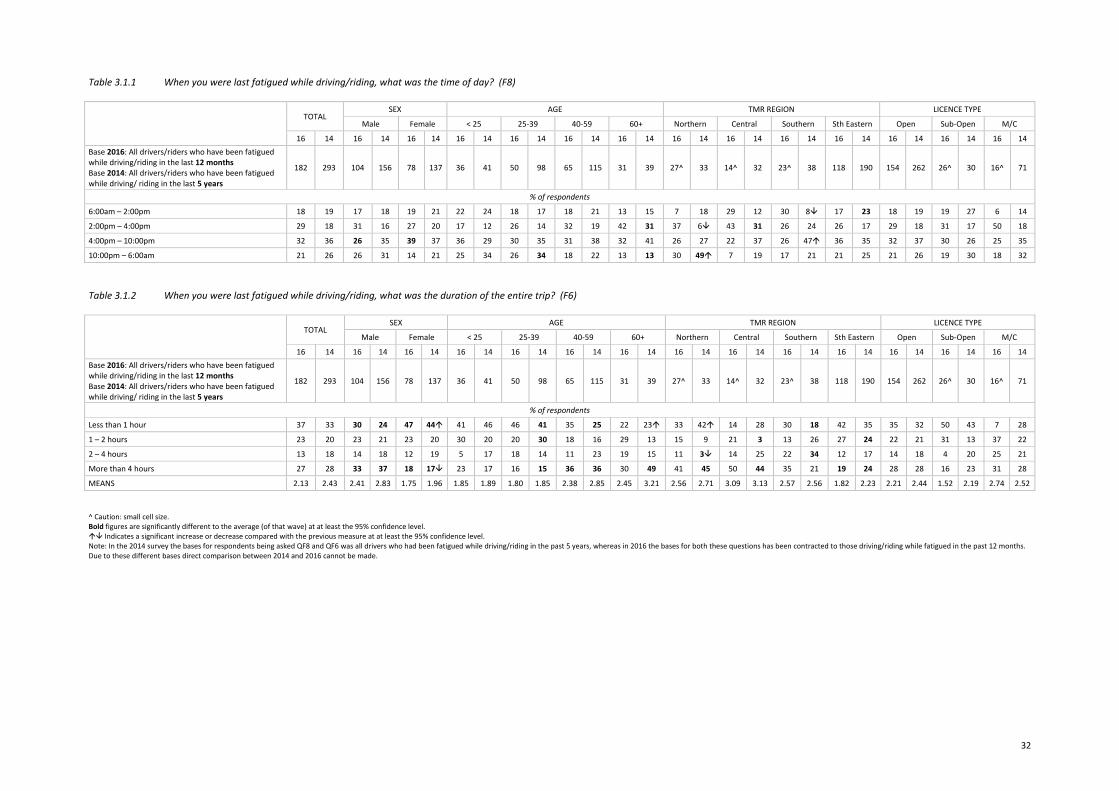
32
Table 3.1.1 When you were last fatigued while driving/riding, what was the time of day? (F8)
TOTAL
SEX AGE TMR REGION LICENCE TYPE
Male Female < 25 25‐39 40‐59 60+ Northern Central Southern Sth Eastern Open Sub‐Open M/C
16 14 16 14 16 14 16 14 16 14 16 14 16 14 16 14 16 14 16 14 16 14 16 14 16 14 16 14 Base 2016: All drivers/riders who have been fatigued while driving/riding in the last 12 months Base 2014: All drivers/riders who have been fatigued while driving/ riding in the last 5 years
182 293 104 156 78 137 36 41 50 98 65 115 31 39 27^ 33 14^ 32 23^ 38 118 190 154 262 26^ 30 16^ 71
% of respondents
6:00am – 2:00pm 18 19 17 18 19 21 22 24 18 17 18 21 13 15 7 18 29 12 30 8 17 23 18 19 19 27 6 14
2:00pm – 4:00pm 29 18 31 16 27 20 17 12 26 14 32 19 42 31 37 6 43 31 26 24 26 17 29 18 31 17 50 18
4:00pm – 10:00pm 32 36 26 35 39 37 36 29 30 35 31 38 32 41 26 27 22 37 26 47 36 35 32 37 30 26 25 35
10:00pm – 6:00am 21 26 26 31 14 21 25 34 26 34 18 22 13 13 30 49 7 19 17 21 21 25 21 26 19 30 18 32
Table 3.1.2 When you were last fatigued while driving/riding, what was the duration of the entire trip? (F6)
TOTAL
SEX AGE TMR REGION LICENCE TYPE
Male Female < 25 25‐39 40‐59 60+ Northern Central Southern Sth Eastern Open Sub‐Open M/C
16 14 16 14 16 14 16 14 16 14 16 14 16 14 16 14 16 14 16 14 16 14 16 14 16 14 16 14 Base 2016: All drivers/riders who have been fatigued while driving/riding in the last 12 months Base 2014: All drivers/riders who have been fatigued while driving/ riding in the last 5 years
182 293 104 156 78 137 36 41 50 98 65 115 31 39 27^ 33 14^ 32 23^ 38 118 190 154 262 26^ 30 16^ 71
% of respondents
Less than 1 hour 37 33 30 24 47 44 41 46 46 41 35 25 22 23 33 42 14 28 30 18 42 35 35 32 50 43 7 28
1 – 2 hours 23 20 23 21 23 20 30 20 20 30 18 16 29 13 15 9 21 3 13 26 27 24 22 21 31 13 37 22
2 – 4 hours 13 18 14 18 12 19 5 17 18 14 11 23 19 15 11 3 14 25 22 34 12 17 14 18 4 20 25 21
More than 4 hours 27 28 33 37 18 17 23 17 16 15 36 36 30 49 41 45 50 44 35 21 19 24 28 28 16 23 31 28
MEANS 2.13 2.43 2.41 2.83 1.75 1.96 1.85 1.89 1.80 1.85 2.38 2.85 2.45 3.21 2.56 2.71 3.09 3.13 2.57 2.56 1.82 2.23 2.21 2.44 1.52 2.19 2.74 2.52
^ Caution: small cell size. Bold figures are significantly different to the average (of that wave) at at least the 95% confidence level. Indicates a significant increase or decrease compared with the previous measure at at least the 95% confidence level. Note: In the 2014 survey the bases for respondents being asked QF8 and QF6 was all drivers who had been fatigued while driving/riding in the past 5 years, whereas in 2016 the bases for both these questions has been contracted to those driving/riding while fatigued in the past 12 months. Due to these different bases direct comparison between 2014 and 2016 cannot be made.
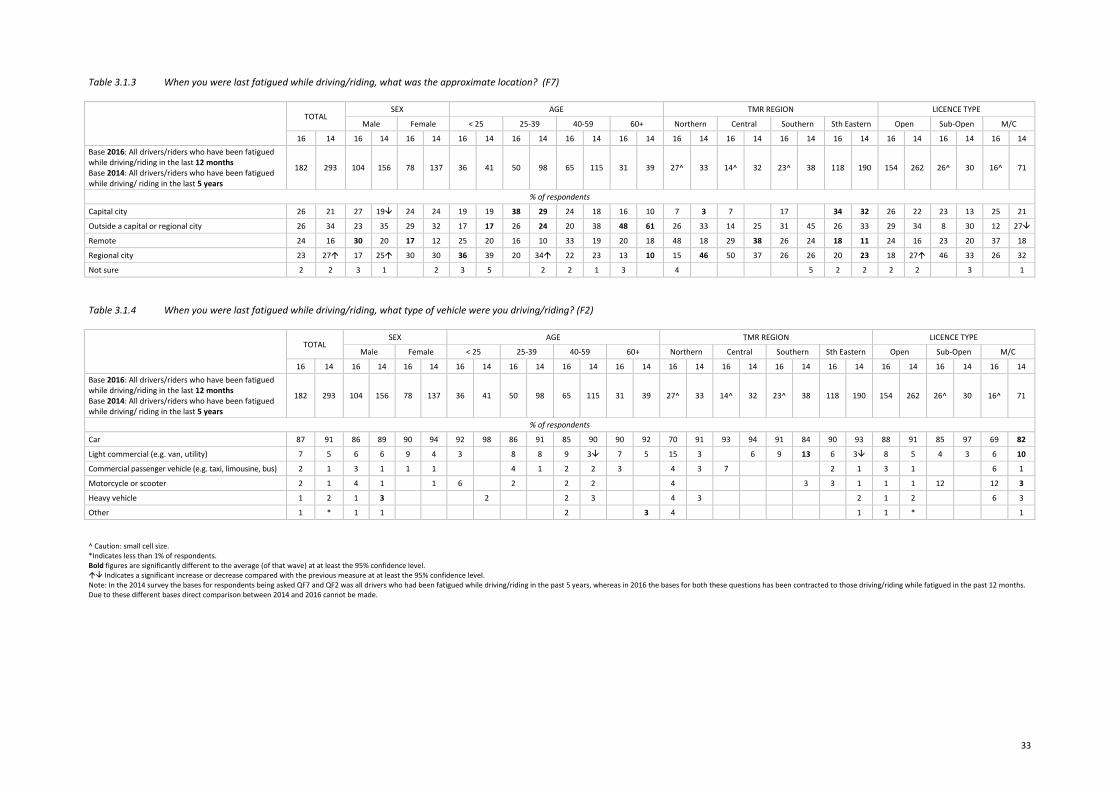
33
Table 3.1.3 When you were last fatigued while driving/riding, what was the approximate location? (F7)
TOTAL
SEX AGE TMR REGION LICENCE TYPE
Male Female < 25 25‐39 40‐59 60+ Northern Central Southern Sth Eastern Open Sub‐Open M/C
16 14 16 14 16 14 16 14 16 14 16 14 16 14 16 14 16 14 16 14 16 14 16 14 16 14 16 14 Base 2016: All drivers/riders who have been fatigued while driving/riding in the last 12 months Base 2014: All drivers/riders who have been fatigued while driving/ riding in the last 5 years
182 293 104 156 78 137 36 41 50 98 65 115 31 39 27^ 33 14^ 32 23^ 38 118 190 154 262 26^ 30 16^ 71
% of respondents
Capital city 26 21 27 19 24 24 19 19 38 29 24 18 16 10 7 3 7 17 34 32 26 22 23 13 25 21
Outside a capital or regional city 26 34 23 35 29 32 17 17 26 24 20 38 48 61 26 33 14 25 31 45 26 33 29 34 8 30 12 27
Remote 24 16 30 20 17 12 25 20 16 10 33 19 20 18 48 18 29 38 26 24 18 11 24 16 23 20 37 18
Regional city 23 27 17 25 30 30 36 39 20 34 22 23 13 10 15 46 50 37 26 26 20 23 18 27 46 33 26 32
Not sure 2 2 3 1 2 3 5 2 2 1 3 4 5 2 2 2 2 3 1
Table 3.1.4 When you were last fatigued while driving/riding, what type of vehicle were you driving/riding? (F2)
TOTAL
SEX AGE TMR REGION LICENCE TYPE
Male Female < 25 25‐39 40‐59 60+ Northern Central Southern Sth Eastern Open Sub‐Open M/C
16 14 16 14 16 14 16 14 16 14 16 14 16 14 16 14 16 14 16 14 16 14 16 14 16 14 16 14 Base 2016: All drivers/riders who have been fatigued while driving/riding in the last 12 months Base 2014: All drivers/riders who have been fatigued while driving/ riding in the last 5 years
182 293 104 156 78 137 36 41 50 98 65 115 31 39 27^ 33 14^ 32 23^ 38 118 190 154 262 26^ 30 16^ 71
% of respondents
Car 87 91 86 89 90 94 92 98 86 91 85 90 90 92 70 91 93 94 91 84 90 93 88 91 85 97 69 82
Light commercial (e.g. van, utility) 7 5 6 6 9 4 3 8 8 9 3 7 5 15 3 6 9 13 6 3 8 5 4 3 6 10
Commercial passenger vehicle (e.g. taxi, limousine, bus) 2 1 3 1 1 1 4 1 2 2 3 4 3 7 2 1 3 1 6 1
Motorcycle or scooter 2 1 4 1 1 6 2 2 2 4 3 3 1 1 1 12 12 3
Heavy vehicle 1 2 1 3 2 2 3 4 3 2 1 2 6 3
Other 1 * 1 1 2 3 4 1 1 * 1
^ Caution: small cell size. *Indicates less than 1% of respondents. Bold figures are significantly different to the average (of that wave) at at least the 95% confidence level. Indicates a significant increase or decrease compared with the previous measure at at least the 95% confidence level. Note: In the 2014 survey the bases for respondents being asked QF7 and QF2 was all drivers who had been fatigued while driving/riding in the past 5 years, whereas in 2016 the bases for both these questions has been contracted to those driving/riding while fatigued in the past 12 months. Due to these different bases direct comparison between 2014 and 2016 cannot be made.
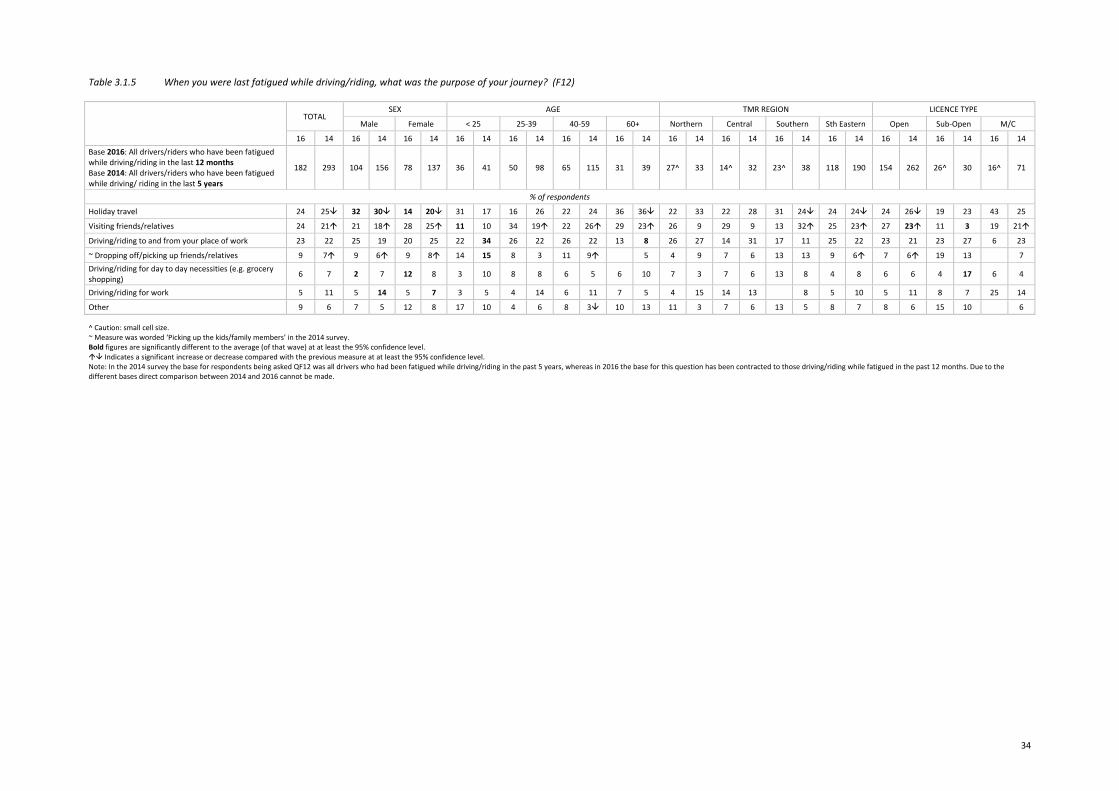
34
Table 3.1.5 When you were last fatigued while driving/riding, what was the purpose of your journey? (F12)
TOTAL
SEX AGE TMR REGION LICENCE TYPE
Male Female < 25 25‐39 40‐59 60+ Northern Central Southern Sth Eastern Open Sub‐Open M/C
16 14 16 14 16 14 16 14 16 14 16 14 16 14 16 14 16 14 16 14 16 14 16 14 16 14 16 14 Base 2016: All drivers/riders who have been fatigued while driving/riding in the last 12 months Base 2014: All drivers/riders who have been fatigued while driving/ riding in the last 5 years
182 293 104 156 78 137 36 41 50 98 65 115 31 39 27^ 33 14^ 32 23^ 38 118 190 154 262 26^ 30 16^ 71
% of respondents
Holiday travel 24 25 32 30 14 20 31 17 16 26 22 24 36 36 22 33 22 28 31 24 24 24 24 26 19 23 43 25
Visiting friends/relatives 24 21 21 18 28 25 11 10 34 19 22 26 29 23 26 9 29 9 13 32 25 23 27 23 11 3 19 21
Driving/riding to and from your place of work 23 22 25 19 20 25 22 34 26 22 26 22 13 8 26 27 14 31 17 11 25 22 23 21 23 27 6 23
~ Dropping off/picking up friends/relatives 9 7 9 6 9 8 14 15 8 3 11 9 5 4 9 7 6 13 13 9 6 7 6 19 13 7 Driving/riding for day to day necessities (e.g. grocery shopping) 6 7 2 7 12 8 3 10 8 8 6 5 6 10 7 3 7 6 13 8 4 8 6 6 4 17 6 4
Driving/riding for work 5 11 5 14 5 7 3 5 4 14 6 11 7 5 4 15 14 13 8 5 10 5 11 8 7 25 14
Other 9 6 7 5 12 8 17 10 4 6 8 3 10 13 11 3 7 6 13 5 8 7 8 6 15 10 6
^ Caution: small cell size. ~ Measure was worded ‘Picking up the kids/family members’ in the 2014 survey. Bold figures are significantly different to the average (of that wave) at at least the 95% confidence level. Indicates a significant increase or decrease compared with the previous measure at at least the 95% confidence level. Note: In the 2014 survey the base for respondents being asked QF12 was all drivers who had been fatigued while driving/riding in the past 5 years, whereas in 2016 the base for this question has been contracted to those driving/riding while fatigued in the past 12 months. Due to the different bases direct comparison between 2014 and 2016 cannot be made.
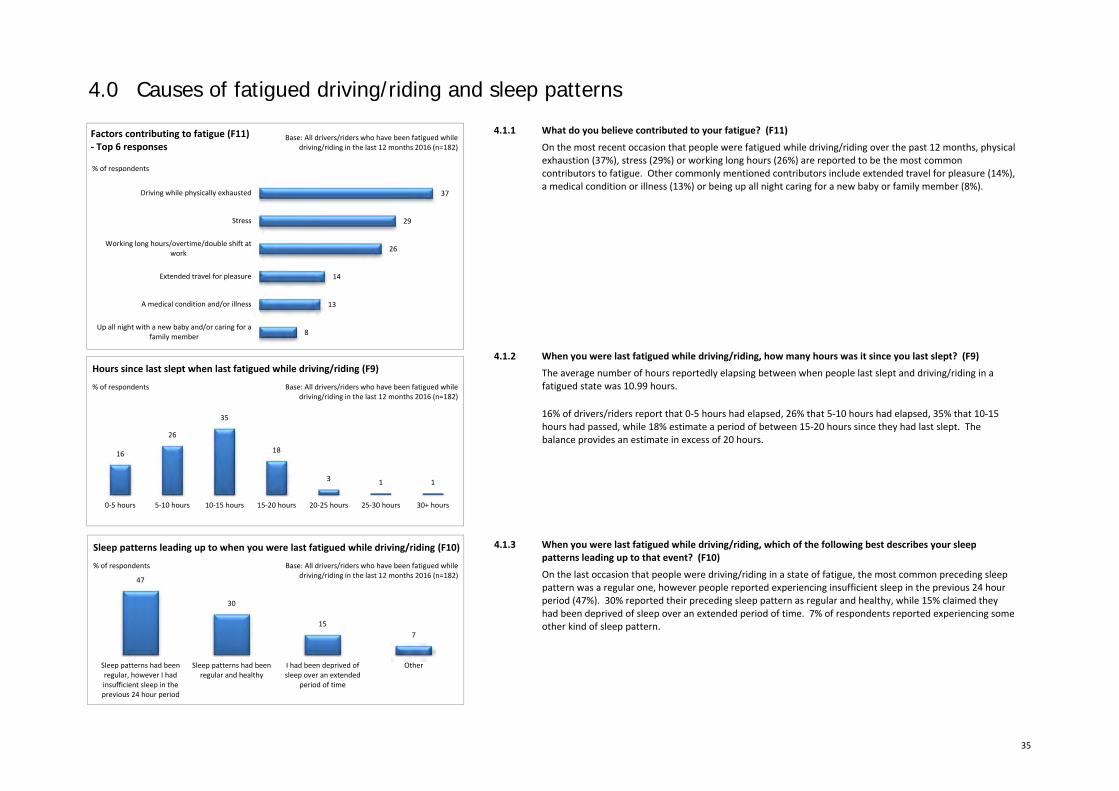
35
4.0 Causes of fatigued driving/riding and sleep patterns
4.1.1 What do you believe contributed to your fatigue? (F11)
On the most recent occasion that people were fatigued while driving/riding over the past 12 months, physical exhaustion (37%), stress (29%) or working long hours (26%) are reported to be the most common contributors to fatigue. Other commonly mentioned contributors include extended travel for pleasure (14%), a medical condition or illness (13%) or being up all night caring for a new baby or family member (8%).
4.1.2 When you were last fatigued while driving/riding, how many hours was it since you last slept? (F9)
The average number of hours reportedly elapsing between when people last slept and driving/riding in a fatigued state was 10.99 hours. 16% of drivers/riders report that 0‐5 hours had elapsed, 26% that 5‐10 hours had elapsed, 35% that 10‐15 hours had passed, while 18% estimate a period of between 15‐20 hours since they had last slept. The balance provides an estimate in excess of 20 hours.
4.1.3 When you were last fatigued while driving/riding, which of the following best describes your sleep patterns leading up to that event? (F10)
On the last occasion that people were driving/riding in a state of fatigue, the most common preceding sleep pattern was a regular one, however people reported experiencing insufficient sleep in the previous 24 hour period (47%). 30% reported their preceding sleep pattern as regular and healthy, while 15% claimed they had been deprived of sleep over an extended period of time. 7% of respondents reported experiencing some other kind of sleep pattern.
37
29
26
14
13
8
Driving while physically exhausted
Stress
Working long hours/overtime/double shift atwork
Extended travel for pleasure
A medical condition and/or illness
Up all night with a new baby and/or caring for afamily member
Factors contributing to fatigue (F11)‐ Top 6 responses
% of respondents
Base: All drivers/riders who have been fatigued while driving/riding in the last 12 months 2016 (n=182)
16
26
35
18
3 1 1
0‐5 hours 5‐10 hours 10‐15 hours 15‐20 hours 20‐25 hours 25‐30 hours 30+ hours
% of respondents Base: All drivers/riders who have been fatigued while driving/riding in the last 12 months 2016 (n=182)
Hours since last slept when last fatigued while driving/riding (F9)
47
30
157
Sleep patterns had beenregular, however I hadinsufficient sleep in theprevious 24 hour period
Sleep patterns had beenregular and healthy
I had been deprived ofsleep over an extended
period of time
Other
% of respondents Base: All drivers/riders who have been fatigued while driving/riding in the last 12 months 2016 (n=182)
Sleep patterns leading up to when you were last fatigued while driving/riding (F10)
36
4.1.4 Key sub‐group differences
On the last occasion of travelling while tired, females were more likely than males to have attributed their fatigue to stress or a medical condition. Those aged under 25 years are more likely than average to have attributed their fatigue to being physically exhausted or to partying too hard the night before. They are also more likely than average to have reported not sleeping in the 15‐20 hours leading up to their trip. Those aged between 25‐39 years are more likely than average to have attributed their fatigue to being up all night with a new baby and/or caring for a family member. Those aged between 40‐59 years are more likely than average to have attributed their fatigue to a medical condition. Older drivers/riders aged over 60 years are more likely than average to report their sleep patterns as being regular and healthy in the lead up to their trip. This group most commonly reported that 5‐10 hours had elapsed since they had last slept prior to driving/riding in a fatigued state. Other sub‐group differences, including regional differences are outlined in the following tables.
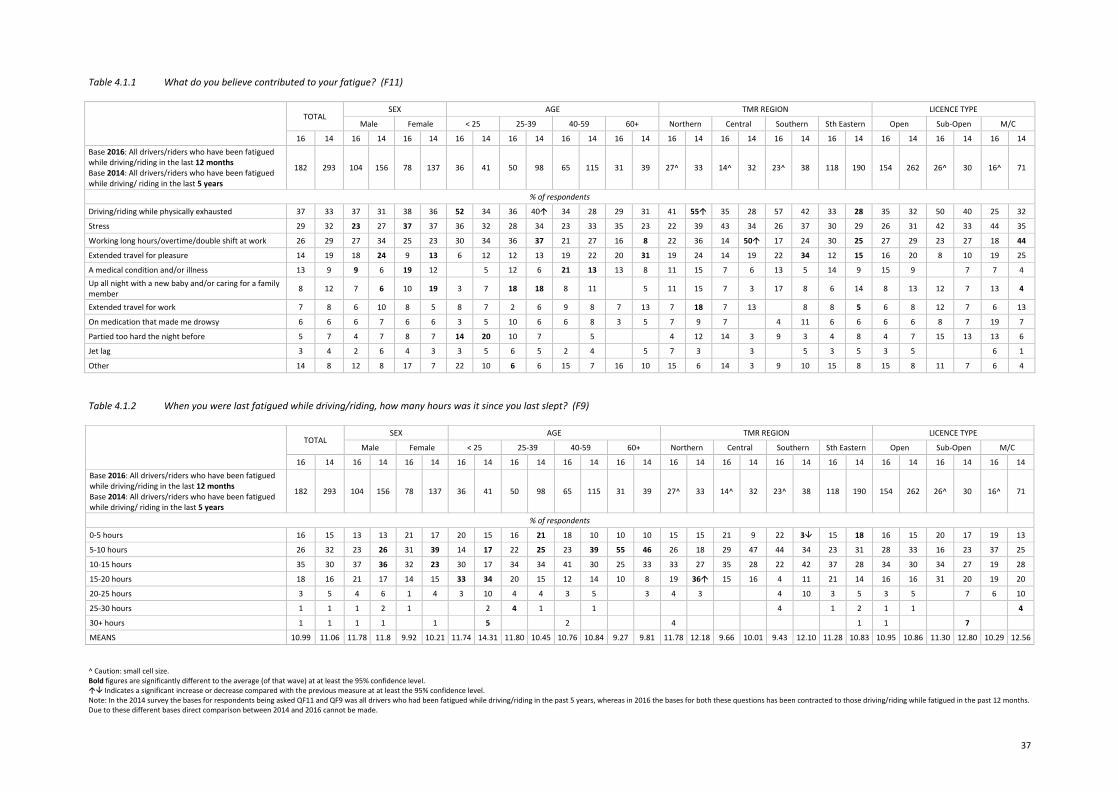
37
Table 4.1.1 What do you believe contributed to your fatigue? (F11)
TOTAL
SEX AGE TMR REGION LICENCE TYPE
Male Female < 25 25‐39 40‐59 60+ Northern Central Southern Sth Eastern Open Sub‐Open M/C
16 14 16 14 16 14 16 14 16 14 16 14 16 14 16 14 16 14 16 14 16 14 16 14 16 14 16 14 Base 2016: All drivers/riders who have been fatigued while driving/riding in the last 12 months Base 2014: All drivers/riders who have been fatigued while driving/ riding in the last 5 years
182 293 104 156 78 137 36 41 50 98 65 115 31 39 27^ 33 14^ 32 23^ 38 118 190 154 262 26^ 30 16^ 71
% of respondents
Driving/riding while physically exhausted 37 33 37 31 38 36 52 34 36 40 34 28 29 31 41 55 35 28 57 42 33 28 35 32 50 40 25 32
Stress 29 32 23 27 37 37 36 32 28 34 23 33 35 23 22 39 43 34 26 37 30 29 26 31 42 33 44 35
Working long hours/overtime/double shift at work 26 29 27 34 25 23 30 34 36 37 21 27 16 8 22 36 14 50 17 24 30 25 27 29 23 27 18 44
Extended travel for pleasure 14 19 18 24 9 13 6 12 12 13 19 22 20 31 19 24 14 19 22 34 12 15 16 20 8 10 19 25
A medical condition and/or illness 13 9 9 6 19 12 5 12 6 21 13 13 8 11 15 7 6 13 5 14 9 15 9 7 7 4 Up all night with a new baby and/or caring for a family member 8 12 7 6 10 19 3 7 18 18 8 11 5 11 15 7 3 17 8 6 14 8 13 12 7 13 4
Extended travel for work 7 8 6 10 8 5 8 7 2 6 9 8 7 13 7 18 7 13 8 8 5 6 8 12 7 6 13
On medication that made me drowsy 6 6 6 7 6 6 3 5 10 6 6 8 3 5 7 9 7 4 11 6 6 6 6 8 7 19 7
Partied too hard the night before 5 7 4 7 8 7 14 20 10 7 5 4 12 14 3 9 3 4 8 4 7 15 13 13 6
Jet lag 3 4 2 6 4 3 3 5 6 5 2 4 5 7 3 3 5 3 5 3 5 6 1
Other 14 8 12 8 17 7 22 10 6 6 15 7 16 10 15 6 14 3 9 10 15 8 15 8 11 7 6 4
Table 4.1.2 When you were last fatigued while driving/riding, how many hours was it since you last slept? (F9)
TOTAL
SEX AGE TMR REGION LICENCE TYPE
Male Female < 25 25‐39 40‐59 60+ Northern Central Southern Sth Eastern Open Sub‐Open M/C
16 14 16 14 16 14 16 14 16 14 16 14 16 14 16 14 16 14 16 14 16 14 16 14 16 14 16 14 Base 2016: All drivers/riders who have been fatigued while driving/riding in the last 12 months Base 2014: All drivers/riders who have been fatigued while driving/ riding in the last 5 years
182 293 104 156 78 137 36 41 50 98 65 115 31 39 27^ 33 14^ 32 23^ 38 118 190 154 262 26^ 30 16^ 71
% of respondents
0‐5 hours 16 15 13 13 21 17 20 15 16 21 18 10 10 10 15 15 21 9 22 3 15 18 16 15 20 17 19 13
5‐10 hours 26 32 23 26 31 39 14 17 22 25 23 39 55 46 26 18 29 47 44 34 23 31 28 33 16 23 37 25
10‐15 hours 35 30 37 36 32 23 30 17 34 34 41 30 25 33 33 27 35 28 22 42 37 28 34 30 34 27 19 28
15‐20 hours 18 16 21 17 14 15 33 34 20 15 12 14 10 8 19 36 15 16 4 11 21 14 16 16 31 20 19 20
20‐25 hours 3 5 4 6 1 4 3 10 4 4 3 5 3 4 3 4 10 3 5 3 5 7 6 10
25‐30 hours 1 1 1 2 1 2 4 1 1 4 1 2 1 1 4
30+ hours 1 1 1 1 1 5 2 4 1 1 7
MEANS 10.99 11.06 11.78 11.8 9.92 10.21 11.74 14.31 11.80 10.45 10.76 10.84 9.27 9.81 11.78 12.18 9.66 10.01 9.43 12.10 11.28 10.83 10.95 10.86 11.30 12.80 10.29 12.56
^ Caution: small cell size. Bold figures are significantly different to the average (of that wave) at at least the 95% confidence level. Indicates a significant increase or decrease compared with the previous measure at at least the 95% confidence level. Note: In the 2014 survey the bases for respondents being asked QF11 and QF9 was all drivers who had been fatigued while driving/riding in the past 5 years, whereas in 2016 the bases for both these questions has been contracted to those driving/riding while fatigued in the past 12 months. Due to these different bases direct comparison between 2014 and 2016 cannot be made.
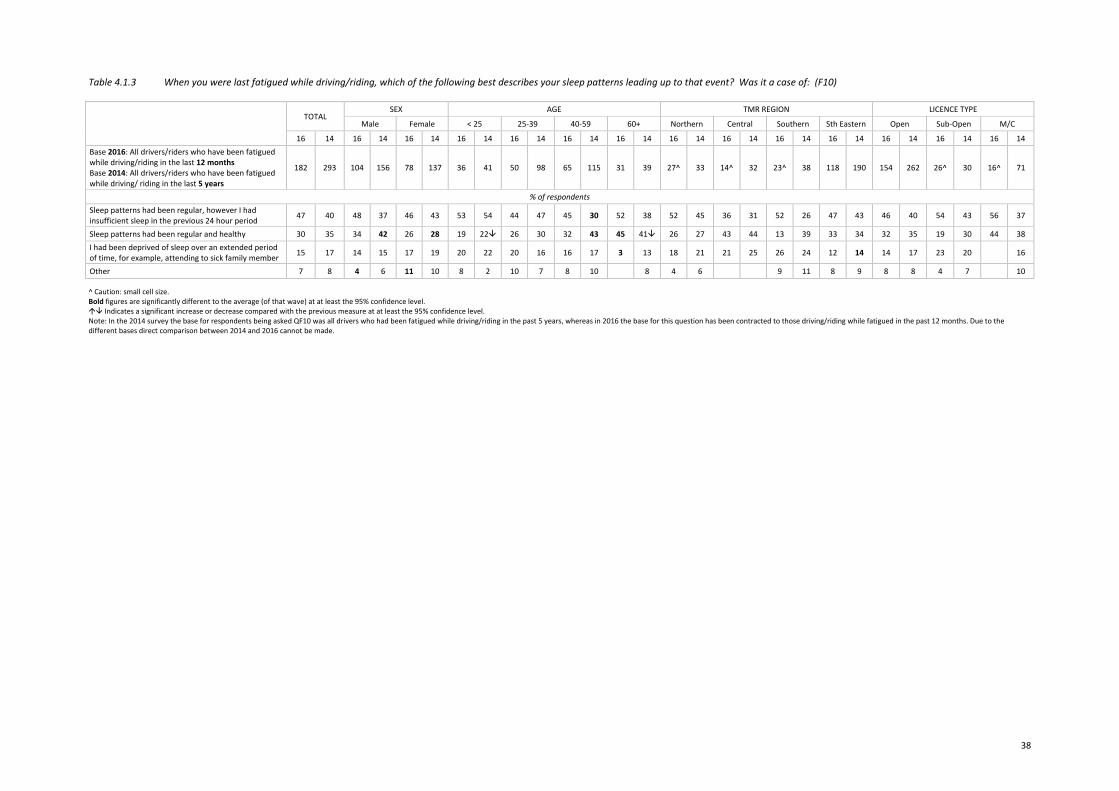
38
Table 4.1.3 When you were last fatigued while driving/riding, which of the following best describes your sleep patterns leading up to that event? Was it a case of: (F10)
TOTAL
SEX AGE TMR REGION LICENCE TYPE
Male Female < 25 25‐39 40‐59 60+ Northern Central Southern Sth Eastern Open Sub‐Open M/C
16 14 16 14 16 14 16 14 16 14 16 14 16 14 16 14 16 14 16 14 16 14 16 14 16 14 16 14 Base 2016: All drivers/riders who have been fatigued while driving/riding in the last 12 months Base 2014: All drivers/riders who have been fatigued while driving/ riding in the last 5 years
182 293 104 156 78 137 36 41 50 98 65 115 31 39 27^ 33 14^ 32 23^ 38 118 190 154 262 26^ 30 16^ 71
% of respondents Sleep patterns had been regular, however I had insufficient sleep in the previous 24 hour period 47 40 48 37 46 43 53 54 44 47 45 30 52 38 52 45 36 31 52 26 47 43 46 40 54 43 56 37
Sleep patterns had been regular and healthy 30 35 34 42 26 28 19 22 26 30 32 43 45 41 26 27 43 44 13 39 33 34 32 35 19 30 44 38 I had been deprived of sleep over an extended period of time, for example, attending to sick family member 15 17 14 15 17 19 20 22 20 16 16 17 3 13 18 21 21 25 26 24 12 14 14 17 23 20 16
Other 7 8 4 6 11 10 8 2 10 7 8 10 8 4 6 9 11 8 9 8 8 4 7 10
^ Caution: small cell size. Bold figures are significantly different to the average (of that wave) at at least the 95% confidence level. Indicates a significant increase or decrease compared with the previous measure at at least the 95% confidence level. Note: In the 2014 survey the base for respondents being asked QF10 was all drivers who had been fatigued while driving/riding in the past 5 years, whereas in 2016 the base for this question has been contracted to those driving/riding while fatigued in the past 12 months. Due to the different bases direct comparison between 2014 and 2016 cannot be made.
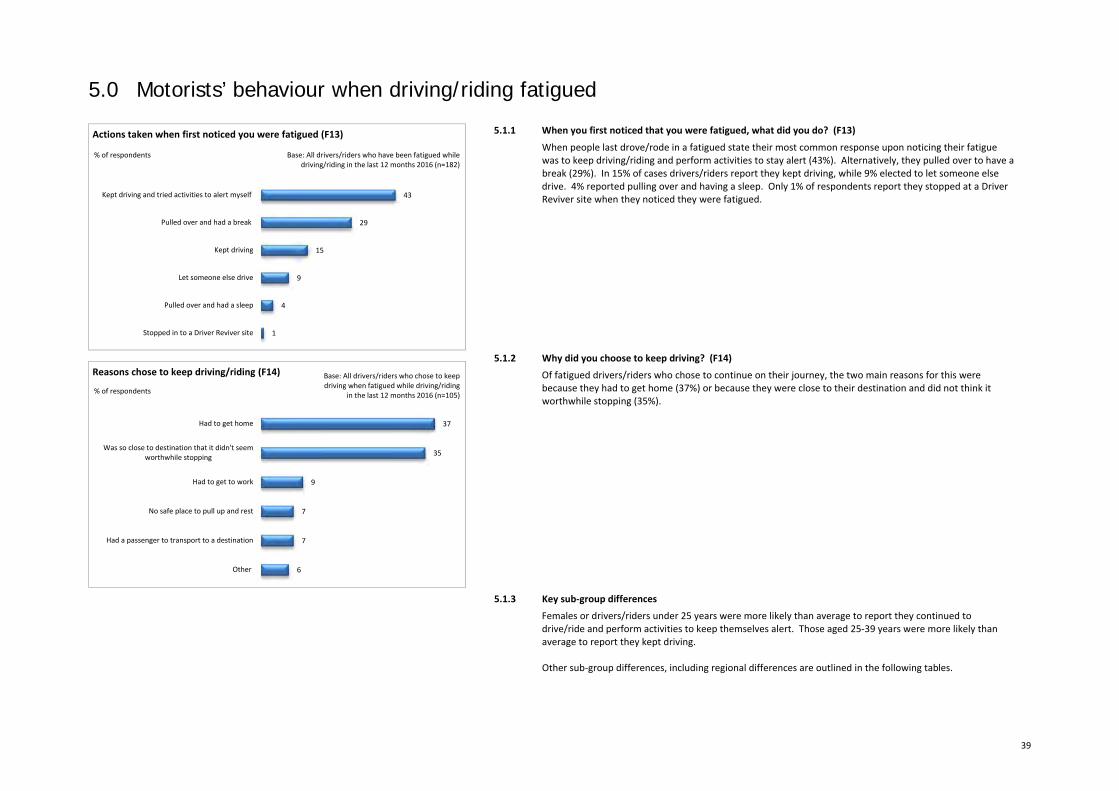
39
5.0 Motorists’ behaviour when driving/riding fatigued
5.1.1 When you first noticed that you were fatigued, what did you do? (F13)
When people last drove/rode in a fatigued state their most common response upon noticing their fatigue was to keep driving/riding and perform activities to stay alert (43%). Alternatively, they pulled over to have a break (29%). In 15% of cases drivers/riders report they kept driving, while 9% elected to let someone else drive. 4% reported pulling over and having a sleep. Only 1% of respondents report they stopped at a Driver Reviver site when they noticed they were fatigued.
5.1.2 Why did you choose to keep driving? (F14)
Of fatigued drivers/riders who chose to continue on their journey, the two main reasons for this were because they had to get home (37%) or because they were close to their destination and did not think it worthwhile stopping (35%).
5.1.3 Key sub‐group differences
Females or drivers/riders under 25 years were more likely than average to report they continued to drive/ride and perform activities to keep themselves alert. Those aged 25‐39 years were more likely than average to report they kept driving. Other sub‐group differences, including regional differences are outlined in the following tables.
43
29
15
9
4
1
Kept driving and tried activities to alert myself
Pulled over and had a break
Kept driving
Let someone else drive
Pulled over and had a sleep
Stopped in to a Driver Reviver site
Actions taken when first noticed you were fatigued (F13)
% of respondents Base: All drivers/riders who have been fatigued while driving/riding in the last 12 months 2016 (n=182)
37
35
9
7
7
6
Had to get home
Was so close to destination that it didn't seemworthwhile stopping
Had to get to work
No safe place to pull up and rest
Had a passenger to transport to a destination
Other
Reasons chose to keep driving/riding (F14)
% of respondents
Base: All drivers/riders who chose to keep driving when fatigued while driving/riding
in the last 12 months 2016 (n=105)
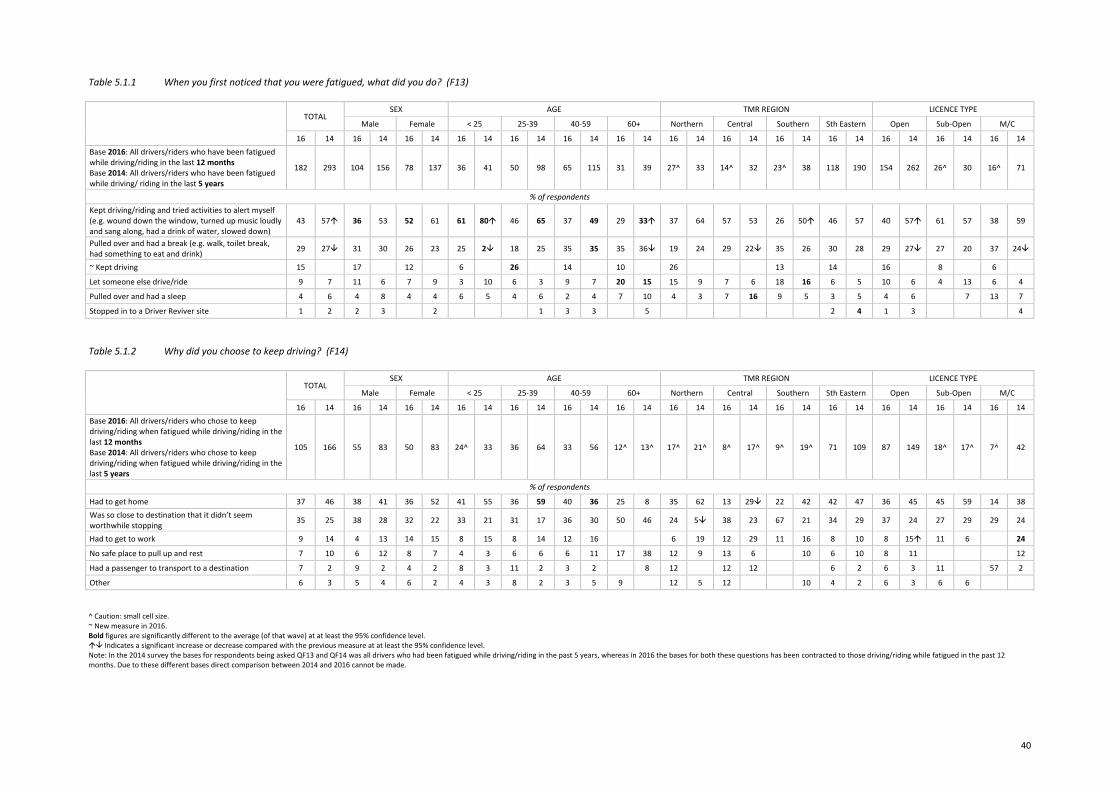
40
Table 5.1.1 When you first noticed that you were fatigued, what did you do? (F13)
TOTAL
SEX AGE TMR REGION LICENCE TYPE
Male Female < 25 25‐39 40‐59 60+ Northern Central Southern Sth Eastern Open Sub‐Open M/C
16 14 16 14 16 14 16 14 16 14 16 14 16 14 16 14 16 14 16 14 16 14 16 14 16 14 16 14 Base 2016: All drivers/riders who have been fatigued while driving/riding in the last 12 months Base 2014: All drivers/riders who have been fatigued while driving/ riding in the last 5 years
182 293 104 156 78 137 36 41 50 98 65 115 31 39 27^ 33 14^ 32 23^ 38 118 190 154 262 26^ 30 16^ 71
% of respondents Kept driving/riding and tried activities to alert myself (e.g. wound down the window, turned up music loudly and sang along, had a drink of water, slowed down)
43 57 36 53 52 61 61 80 46 65 37 49 29 33 37 64 57 53 26 50 46 57 40 57 61 57 38 59
Pulled over and had a break (e.g. walk, toilet break, had something to eat and drink) 29 27 31 30 26 23 25 2 18 25 35 35 35 36 19 24 29 22 35 26 30 28 29 27 27 20 37 24
~ Kept driving 15 17 12 6 26 14 10 26 13 14 16 8 6
Let someone else drive/ride 9 7 11 6 7 9 3 10 6 3 9 7 20 15 15 9 7 6 18 16 6 5 10 6 4 13 6 4
Pulled over and had a sleep 4 6 4 8 4 4 6 5 4 6 2 4 7 10 4 3 7 16 9 5 3 5 4 6 7 13 7
Stopped in to a Driver Reviver site 1 2 2 3 2 1 3 3 5 2 4 1 3 4
Table 5.1.2 Why did you choose to keep driving? (F14)
TOTAL
SEX AGE TMR REGION LICENCE TYPE
Male Female < 25 25‐39 40‐59 60+ Northern Central Southern Sth Eastern Open Sub‐Open M/C
16 14 16 14 16 14 16 14 16 14 16 14 16 14 16 14 16 14 16 14 16 14 16 14 16 14 16 14 Base 2016: All drivers/riders who chose to keep driving/riding when fatigued while driving/riding in the last 12 months Base 2014: All drivers/riders who chose to keep driving/riding when fatigued while driving/riding in the last 5 years
105 166 55 83 50 83 24^ 33 36 64 33 56 12^ 13^ 17^ 21^ 8^ 17^ 9^ 19^ 71 109 87 149 18^ 17^ 7^ 42
% of respondents
Had to get home 37 46 38 41 36 52 41 55 36 59 40 36 25 8 35 62 13 29 22 42 42 47 36 45 45 59 14 38 Was so close to destination that it didn’t seem worthwhile stopping 35 25 38 28 32 22 33 21 31 17 36 30 50 46 24 5 38 23 67 21 34 29 37 24 27 29 29 24
Had to get to work 9 14 4 13 14 15 8 15 8 14 12 16 6 19 12 29 11 16 8 10 8 15 11 6 24
No safe place to pull up and rest 7 10 6 12 8 7 4 3 6 6 6 11 17 38 12 9 13 6 10 6 10 8 11 12
Had a passenger to transport to a destination 7 2 9 2 4 2 8 3 11 2 3 2 8 12 12 12 6 2 6 3 11 57 2
Other 6 3 5 4 6 2 4 3 8 2 3 5 9 12 5 12 10 4 2 6 3 6 6
^ Caution: small cell size. ~ New measure in 2016. Bold figures are significantly different to the average (of that wave) at at least the 95% confidence level. Indicates a significant increase or decrease compared with the previous measure at at least the 95% confidence level. Note: In the 2014 survey the bases for respondents being asked QF13 and QF14 was all drivers who had been fatigued while driving/riding in the past 5 years, whereas in 2016 the bases for both these questions has been contracted to those driving/riding while fatigued in the past 12 months. Due to these different bases direct comparison between 2014 and 2016 cannot be made.
41
young drivers
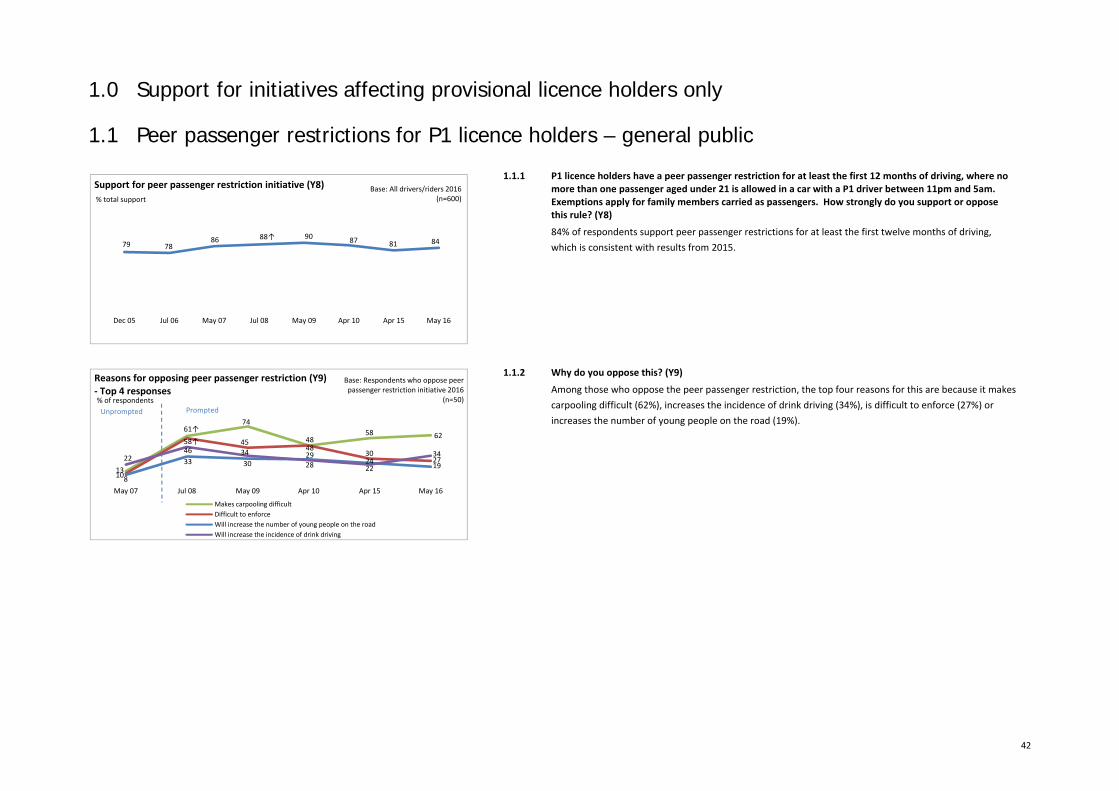
42
1.0 Support for initiatives affecting provisional licence holders only
1.1 Peer passenger restrictions for P1 licence holders – general public
1.1.1 P1 licence holders have a peer passenger restriction for at least the first 12 months of driving, where no more than one passenger aged under 21 is allowed in a car with a P1 driver between 11pm and 5am. Exemptions apply for family members carried as passengers. How strongly do you support or oppose this rule? (Y8)
84% of respondents support peer passenger restrictions for at least the first twelve months of driving, which is consistent with results from 2015.
1.1.2 Why do you oppose this? (Y9)
Among those who oppose the peer passenger restriction, the top four reasons for this are because it makes carpooling difficult (62%), increases the incidence of drink driving (34%), is difficult to enforce (27%) or increases the number of young people on the road (19%).
79 7886 88↑ 90 87 81 84
Dec 05 Jul 06 May 07 Jul 08 May 09 Apr 10 Apr 15 May 16
Support for peer passenger restriction initiative (Y8)% total support
Base: All drivers/riders 2016(n=600)
625848
7461↑
1327
3048
4558↑
101924
293033
8
34
2228
344622
May 16Apr 15Apr 10May 09Jul 08May 07
Reasons for opposing peer passenger restriction (Y9)‐ Top 4 responses
Makes carpooling difficultDifficult to enforceWill increase the number of young people on the roadWill increase the incidence of drink driving
% of respondents
Base: Respondents who oppose peer passenger restriction initiative 2016
(n=50)Unprompted Prompted
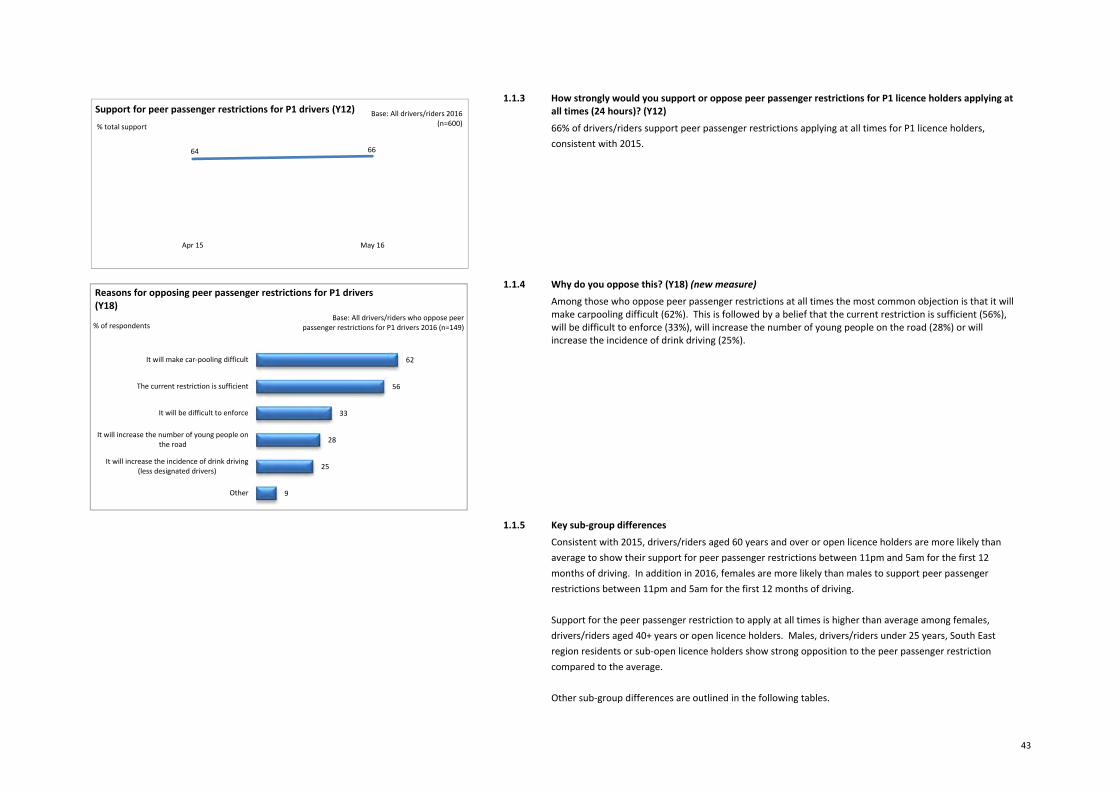
43
1.1.3 How strongly would you support or oppose peer passenger restrictions for P1 licence holders applying at all times (24 hours)? (Y12)
66% of drivers/riders support peer passenger restrictions applying at all times for P1 licence holders, consistent with 2015.
1.1.4 Why do you oppose this? (Y18) (new measure)
Among those who oppose peer passenger restrictions at all times the most common objection is that it will make carpooling difficult (62%). This is followed by a belief that the current restriction is sufficient (56%), will be difficult to enforce (33%), will increase the number of young people on the road (28%) or will increase the incidence of drink driving (25%).
1.1.5 Key sub‐group differences
Consistent with 2015, drivers/riders aged 60 years and over or open licence holders are more likely than average to show their support for peer passenger restrictions between 11pm and 5am for the first 12 months of driving. In addition in 2016, females are more likely than males to support peer passenger restrictions between 11pm and 5am for the first 12 months of driving. Support for the peer passenger restriction to apply at all times is higher than average among females, drivers/riders aged 40+ years or open licence holders. Males, drivers/riders under 25 years, South East region residents or sub‐open licence holders show strong opposition to the peer passenger restriction compared to the average. Other sub‐group differences are outlined in the following tables.
64 66
Apr 15 May 16
Support for peer passenger restrictions for P1 drivers (Y12)
% total support
Base: All drivers/riders 2016(n=600)
62
56
33
28
25
9
It will make car‐pooling difficult
The current restriction is sufficient
It will be difficult to enforce
It will increase the number of young people onthe road
It will increase the incidence of drink driving(less designated drivers)
Other
Reasons for opposing peer passenger restrictions for P1 drivers (Y18)
Base: All drivers/riders who oppose peer passenger restrictions for P1 drivers 2016 (n=149)% of respondents
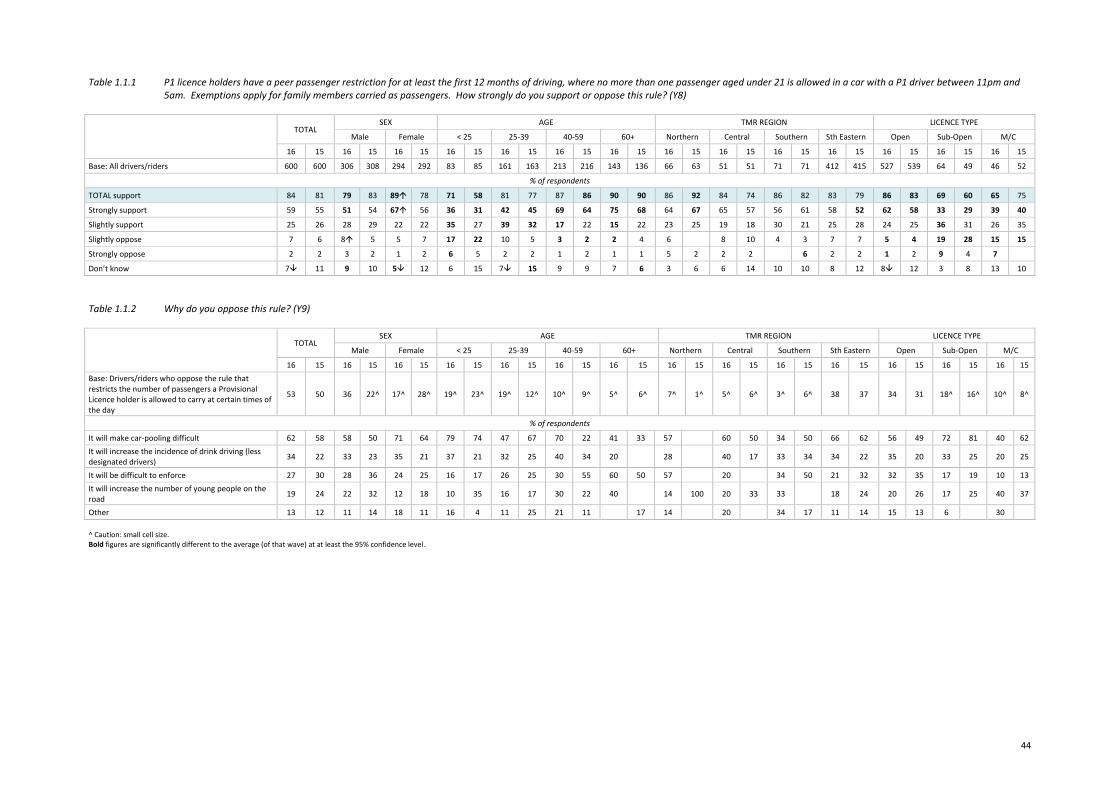
44
Table 1.1.1 P1 licence holders have a peer passenger restriction for at least the first 12 months of driving, where no more than one passenger aged under 21 is allowed in a car with a P1 driver between 11pm and 5am. Exemptions apply for family members carried as passengers. How strongly do you support or oppose this rule? (Y8)
TOTAL SEX AGE TMR REGION LICENCE TYPE
Male Female < 25 25‐39 40‐59 60+ Northern Central Southern Sth Eastern Open Sub‐Open M/C
16 15 16 15 16 15 16 15 16 15 16 15 16 15 16 15 16 15 16 15 16 15 16 15 16 15 16 15
Base: All drivers/riders 600 600 306 308 294 292 83 85 161 163 213 216 143 136 66 63 51 51 71 71 412 415 527 539 64 49 46 52
% of respondents
TOTAL support 84 81 79 83 89 78 71 58 81 77 87 86 90 90 86 92 84 74 86 82 83 79 86 83 69 60 65 75
Strongly support 59 55 51 54 67 56 36 31 42 45 69 64 75 68 64 67 65 57 56 61 58 52 62 58 33 29 39 40
Slightly support 25 26 28 29 22 22 35 27 39 32 17 22 15 22 23 25 19 18 30 21 25 28 24 25 36 31 26 35
Slightly oppose 7 6 8 5 5 7 17 22 10 5 3 2 2 4 6 8 10 4 3 7 7 5 4 19 28 15 15
Strongly oppose 2 2 3 2 1 2 6 5 2 2 1 2 1 1 5 2 2 2 6 2 2 1 2 9 4 7
Don’t know 7 11 9 10 5 12 6 15 7 15 9 9 7 6 3 6 6 14 10 10 8 12 8 12 3 8 13 10
Table 1.1.2 Why do you oppose this rule? (Y9)
TOTAL
SEX AGE TMR REGION LICENCE TYPE
Male Female < 25 25‐39 40‐59 60+ Northern Central Southern Sth Eastern Open Sub‐Open M/C
16 15 16 15 16 15 16 15 16 15 16 15 16 15 16 15 16 15 16 15 16 15 16 15 16 15 16 15 Base: Drivers/riders who oppose the rule that restricts the number of passengers a Provisional Licence holder is allowed to carry at certain times of the day
53 50 36 22^ 17^ 28^ 19^ 23^ 19^ 12^ 10^ 9^ 5^ 6^ 7^ 1^ 5^ 6^ 3^ 6^ 38 37 34 31 18^ 16^ 10^ 8^
% of respondents
It will make car‐pooling difficult 62 58 58 50 71 64 79 74 47 67 70 22 41 33 57 60 50 34 50 66 62 56 49 72 81 40 62 It will increase the incidence of drink driving (less designated drivers) 34 22 33 23 35 21 37 21 32 25 40 34 20 28 40 17 33 34 34 22 35 20 33 25 20 25
It will be difficult to enforce 27 30 28 36 24 25 16 17 26 25 30 55 60 50 57 20 34 50 21 32 32 35 17 19 10 13 It will increase the number of young people on the road 19 24 22 32 12 18 10 35 16 17 30 22 40 14 100 20 33 33 18 24 20 26 17 25 40 37
Other 13 12 11 14 18 11 16 4 11 25 21 11 17 14 20 34 17 11 14 15 13 6 30 ^ Caution: small cell size. Bold figures are significantly different to the average (of that wave) at at least the 95% confidence level.
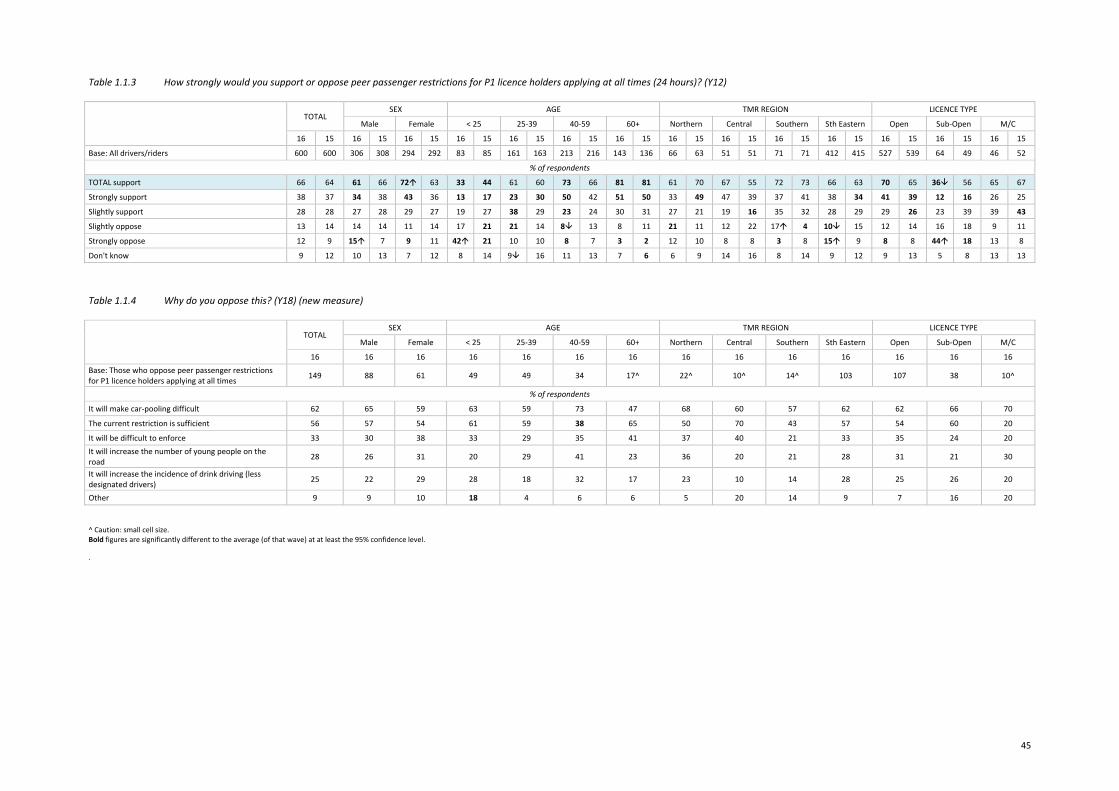
45
Table 1.1.3 How strongly would you support or oppose peer passenger restrictions for P1 licence holders applying at all times (24 hours)? (Y12)
TOTAL
SEX AGE TMR REGION LICENCE TYPE
Male Female < 25 25‐39 40‐59 60+ Northern Central Southern Sth Eastern Open Sub‐Open M/C
16 15 16 15 16 15 16 15 16 15 16 15 16 15 16 15 16 15 16 15 16 15 16 15 16 15 16 15
Base: All drivers/riders 600 600 306 308 294 292 83 85 161 163 213 216 143 136 66 63 51 51 71 71 412 415 527 539 64 49 46 52
% of respondents
TOTAL support 66 64 61 66 72 63 33 44 61 60 73 66 81 81 61 70 67 55 72 73 66 63 70 65 36 56 65 67
Strongly support 38 37 34 38 43 36 13 17 23 30 50 42 51 50 33 49 47 39 37 41 38 34 41 39 12 16 26 25
Slightly support 28 28 27 28 29 27 19 27 38 29 23 24 30 31 27 21 19 16 35 32 28 29 29 26 23 39 39 43
Slightly oppose 13 14 14 14 11 14 17 21 21 14 8 13 8 11 21 11 12 22 17 4 10 15 12 14 16 18 9 11
Strongly oppose 12 9 15 7 9 11 42 21 10 10 8 7 3 2 12 10 8 8 3 8 15 9 8 8 44 18 13 8
Don't know 9 12 10 13 7 12 8 14 9 16 11 13 7 6 6 9 14 16 8 14 9 12 9 13 5 8 13 13 Table 1.1.4 Why do you oppose this? (Y18) (new measure)
TOTAL
SEX AGE TMR REGION LICENCE TYPE
Male Female < 25 25‐39 40‐59 60+ Northern Central Southern Sth Eastern Open Sub‐Open M/C
16 16 16 16 16 16 16 16 16 16 16 16 16 16 Base: Those who oppose peer passenger restrictions for P1 licence holders applying at all times 149 88 61 49 49 34 17^ 22^ 10^ 14^ 103 107 38 10^
% of respondents
It will make car‐pooling difficult 62 65 59 63 59 73 47 68 60 57 62 62 66 70
The current restriction is sufficient 56 57 54 61 59 38 65 50 70 43 57 54 60 20
It will be difficult to enforce 33 30 38 33 29 35 41 37 40 21 33 35 24 20 It will increase the number of young people on the road 28 26 31 20 29 41 23 36 20 21 28 31 21 30
It will increase the incidence of drink driving (less designated drivers) 25 22 29 28 18 32 17 23 10 14 28 25 26 20
Other 9 9 10 18 4 6 6 5 20 14 9 7 16 20 ^ Caution: small cell size. Bold figures are significantly different to the average (of that wave) at at least the 95% confidence level.
.
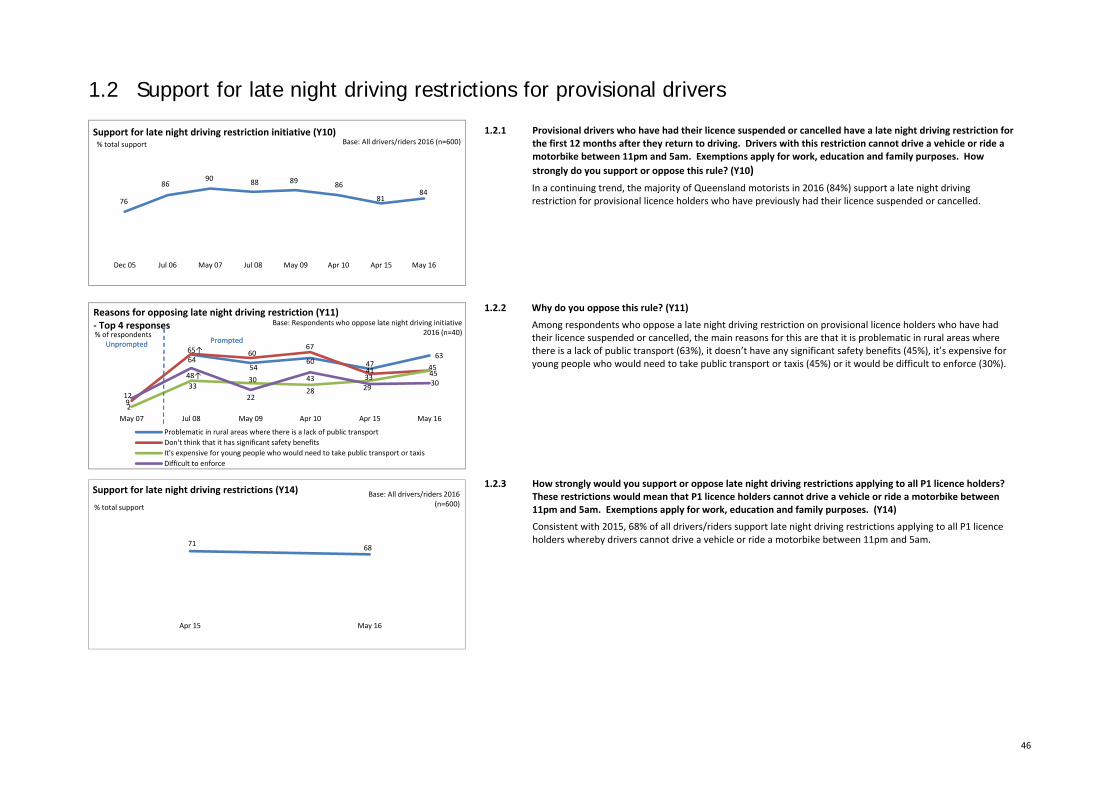
46
1.2 Support for late night driving restrictions for provisional drivers
1.2.1 Provisional drivers who have had their licence suspended or cancelled have a late night driving restriction for the first 12 months after they return to driving. Drivers with this restriction cannot drive a vehicle or ride a motorbike between 11pm and 5am. Exemptions apply for work, education and family purposes. How strongly do you support or oppose this rule? (Y10) In a continuing trend, the majority of Queensland motorists in 2016 (84%) support a late night driving restriction for provisional licence holders who have previously had their licence suspended or cancelled.
1.2.2 Why do you oppose this rule? (Y11)
Among respondents who oppose a late night driving restriction on provisional licence holders who have had their licence suspended or cancelled, the main reasons for this are that it is problematic in rural areas where there is a lack of public transport (63%), it doesn’t have any significant safety benefits (45%), it’s expensive for young people who would need to take public transport or taxis (45%) or it would be difficult to enforce (30%).
1.2.3 How strongly would you support or oppose late night driving restrictions applying to all P1 licence holders? These restrictions would mean that P1 licence holders cannot drive a vehicle or ride a motorbike between 11pm and 5am. Exemptions apply for work, education and family purposes. (Y14)
Consistent with 2015, 68% of all drivers/riders support late night driving restrictions applying to all P1 licence holders whereby drivers cannot drive a vehicle or ride a motorbike between 11pm and 5am.
76
8690 88 89 86
8184
Dec 05 Jul 06 May 07 Jul 08 May 09 Apr 10 Apr 15 May 16
Support for late night driving restriction initiative (Y10)Base: All drivers/riders 2016 (n=600)% total support
634760
5464
4541
676065↑
9
4533
2830
33
2
302943
22
48↑
12
May 16Apr 15Apr 10May 09Jul 08May 07
Reasons for opposing late night driving restriction (Y11)‐ Top 4 responses
Problematic in rural areas where there is a lack of public transportDon't think that it has significant safety benefitsIt's expensive for young people who would need to take public transport or taxisDifficult to enforce
Base: Respondents who oppose late night driving initiative 2016 (n=40)
PromptedUnprompted% of respondents
PromptedUnprompted
71 68
Apr 15 May 16
Support for late night driving restrictions (Y14)
% total support
Base: All drivers/riders 2016(n=600)
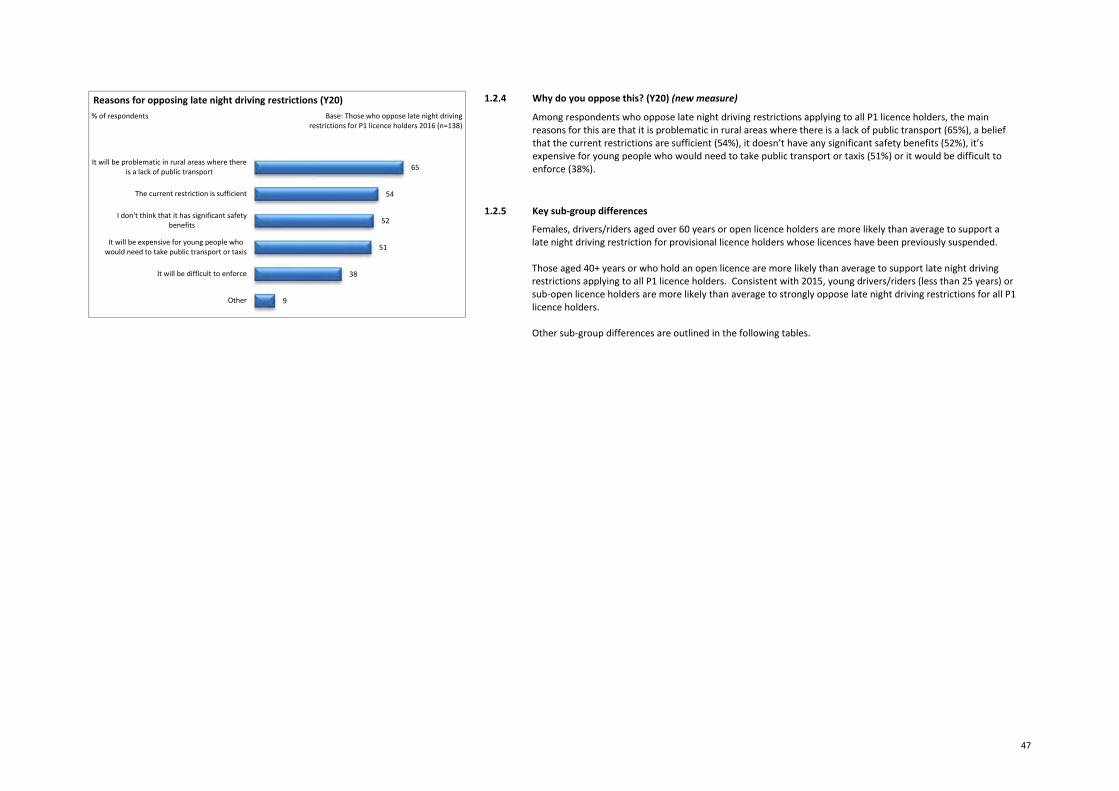
47
1.2.4 Why do you oppose this? (Y20) (new measure)
Among respondents who oppose late night driving restrictions applying to all P1 licence holders, the main reasons for this are that it is problematic in rural areas where there is a lack of public transport (65%), a belief that the current restrictions are sufficient (54%), it doesn’t have any significant safety benefits (52%), it’s expensive for young people who would need to take public transport or taxis (51%) or it would be difficult to enforce (38%).
1.2.5 Key sub‐group differences
Females, drivers/riders aged over 60 years or open licence holders are more likely than average to support a late night driving restriction for provisional licence holders whose licences have been previously suspended. Those aged 40+ years or who hold an open licence are more likely than average to support late night driving restrictions applying to all P1 licence holders. Consistent with 2015, young drivers/riders (less than 25 years) or sub‐open licence holders are more likely than average to strongly oppose late night driving restrictions for all P1 licence holders. Other sub‐group differences are outlined in the following tables.
65
54
52
51
38
9
It will be problematic in rural areas where thereis a lack of public transport
The current restriction is sufficient
I don't think that it has significant safetybenefits
It will be expensive for young people whowould need to take public transport or taxis
It will be difficult to enforce
Other
Reasons for opposing late night driving restrictions (Y20)Base: Those who oppose late night driving
restrictions for P1 licence holders 2016 (n=138)% of respondents
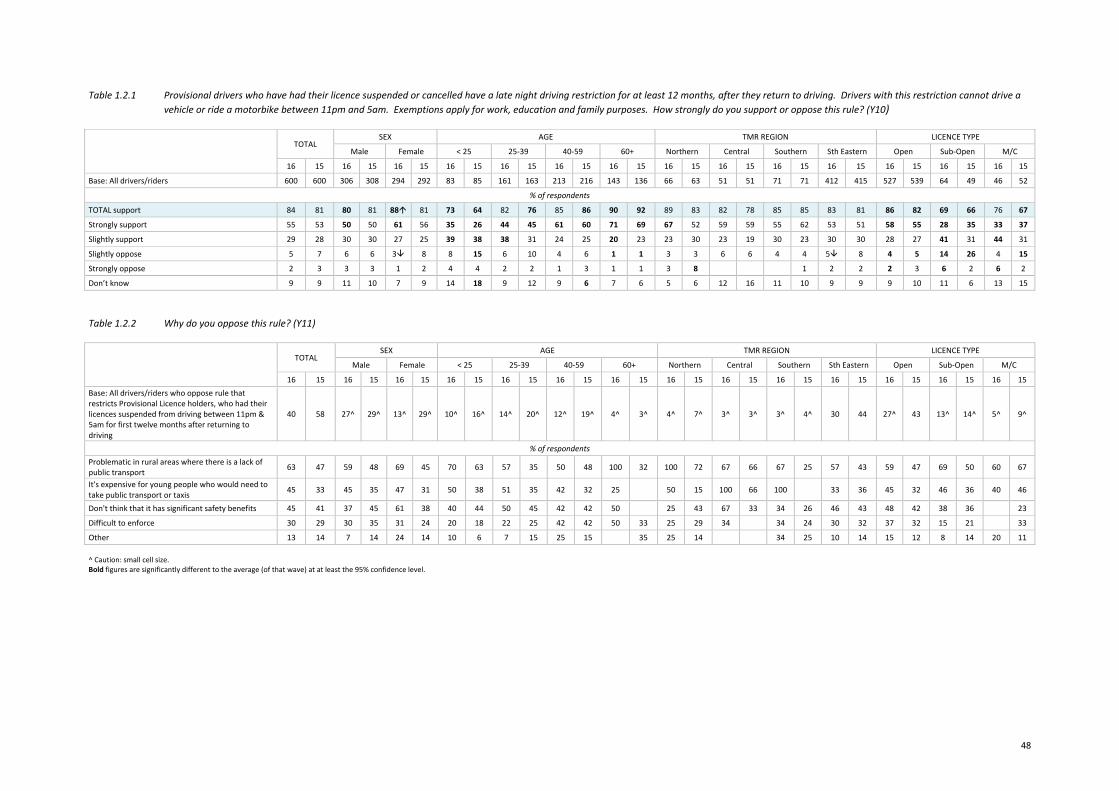
48
Table 1.2.1 Provisional drivers who have had their licence suspended or cancelled have a late night driving restriction for at least 12 months, after they return to driving. Drivers with this restriction cannot drive a
vehicle or ride a motorbike between 11pm and 5am. Exemptions apply for work, education and family purposes. How strongly do you support or oppose this rule? (Y10)
TOTAL
SEX AGE TMR REGION LICENCE TYPE
Male Female < 25 25‐39 40‐59 60+ Northern Central Southern Sth Eastern Open Sub‐Open M/C
16 15 16 15 16 15 16 15 16 15 16 15 16 15 16 15 16 15 16 15 16 15 16 15 16 15 16 15
Base: All drivers/riders 600 600 306 308 294 292 83 85 161 163 213 216 143 136 66 63 51 51 71 71 412 415 527 539 64 49 46 52
% of respondents
TOTAL support 84 81 80 81 88 81 73 64 82 76 85 86 90 92 89 83 82 78 85 85 83 81 86 82 69 66 76 67
Strongly support 55 53 50 50 61 56 35 26 44 45 61 60 71 69 67 52 59 59 55 62 53 51 58 55 28 35 33 37
Slightly support 29 28 30 30 27 25 39 38 38 31 24 25 20 23 23 30 23 19 30 23 30 30 28 27 41 31 44 31
Slightly oppose 5 7 6 6 3 8 8 15 6 10 4 6 1 1 3 3 6 6 4 4 5 8 4 5 14 26 4 15
Strongly oppose 2 3 3 3 1 2 4 4 2 2 1 3 1 1 3 8 1 2 2 2 3 6 2 6 2
Don’t know 9 9 11 10 7 9 14 18 9 12 9 6 7 6 5 6 12 16 11 10 9 9 9 10 11 6 13 15
Table 1.2.2 Why do you oppose this rule? (Y11)
TOTAL
SEX AGE TMR REGION LICENCE TYPE
Male Female < 25 25‐39 40‐59 60+ Northern Central Southern Sth Eastern Open Sub‐Open M/C
16 15 16 15 16 15 16 15 16 15 16 15 16 15 16 15 16 15 16 15 16 15 16 15 16 15 16 15 Base: All drivers/riders who oppose rule that restricts Provisional Licence holders, who had their licences suspended from driving between 11pm & 5am for first twelve months after returning to driving
40 58 27^ 29^ 13^ 29^ 10^ 16^ 14^ 20^ 12^ 19^ 4^ 3^ 4^ 7^ 3^ 3^ 3^ 4^ 30 44 27^ 43 13^ 14^ 5^ 9^
% of respondents Problematic in rural areas where there is a lack of public transport 63 47 59 48 69 45 70 63 57 35 50 48 100 32 100 72 67 66 67 25 57 43 59 47 69 50 60 67
It's expensive for young people who would need to take public transport or taxis 45 33 45 35 47 31 50 38 51 35 42 32 25 50 15 100 66 100 33 36 45 32 46 36 40 46
Don't think that it has significant safety benefits 45 41 37 45 61 38 40 44 50 45 42 42 50 25 43 67 33 34 26 46 43 48 42 38 36 23
Difficult to enforce 30 29 30 35 31 24 20 18 22 25 42 42 50 33 25 29 34 34 24 30 32 37 32 15 21 33
Other 13 14 7 14 24 14 10 6 7 15 25 15 35 25 14 34 25 10 14 15 12 8 14 20 11 ^ Caution: small cell size. Bold figures are significantly different to the average (of that wave) at at least the 95% confidence level.
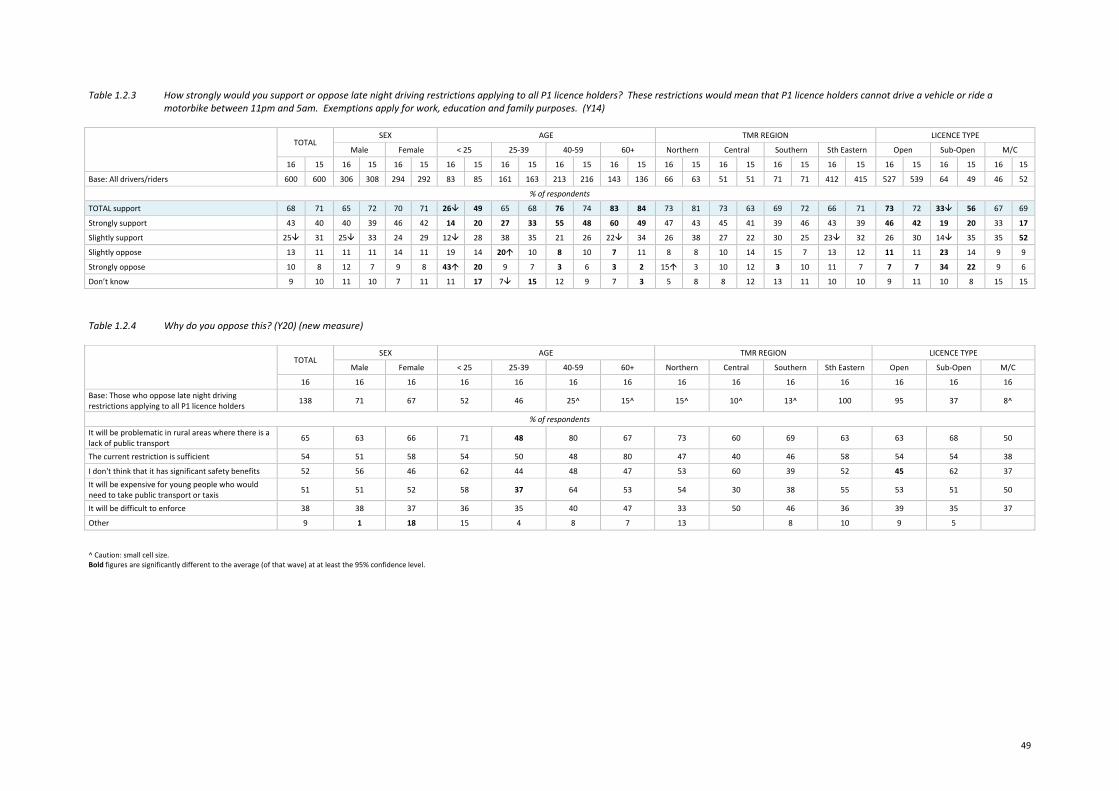
49
Table 1.2.3 How strongly would you support or oppose late night driving restrictions applying to all P1 licence holders? These restrictions would mean that P1 licence holders cannot drive a vehicle or ride a
motorbike between 11pm and 5am. Exemptions apply for work, education and family purposes. (Y14)
TOTAL
SEX AGE TMR REGION LICENCE TYPE
Male Female < 25 25‐39 40‐59 60+ Northern Central Southern Sth Eastern Open Sub‐Open M/C
16 15 16 15 16 15 16 15 16 15 16 15 16 15 16 15 16 15 16 15 16 15 16 15 16 15 16 15
Base: All drivers/riders 600 600 306 308 294 292 83 85 161 163 213 216 143 136 66 63 51 51 71 71 412 415 527 539 64 49 46 52
% of respondents
TOTAL support 68 71 65 72 70 71 26 49 65 68 76 74 83 84 73 81 73 63 69 72 66 71 73 72 33 56 67 69
Strongly support 43 40 40 39 46 42 14 20 27 33 55 48 60 49 47 43 45 41 39 46 43 39 46 42 19 20 33 17
Slightly support 25 31 25 33 24 29 12 28 38 35 21 26 22 34 26 38 27 22 30 25 23 32 26 30 14 35 35 52
Slightly oppose 13 11 11 11 14 11 19 14 20 10 8 10 7 11 8 8 10 14 15 7 13 12 11 11 23 14 9 9
Strongly oppose 10 8 12 7 9 8 43 20 9 7 3 6 3 2 15 3 10 12 3 10 11 7 7 7 34 22 9 6
Don’t know 9 10 11 10 7 11 11 17 7 15 12 9 7 3 5 8 8 12 13 11 10 10 9 11 10 8 15 15 Table 1.2.4 Why do you oppose this? (Y20) (new measure)
TOTAL
SEX AGE TMR REGION LICENCE TYPE
Male Female < 25 25‐39 40‐59 60+ Northern Central Southern Sth Eastern Open Sub‐Open M/C
16 16 16 16 16 16 16 16 16 16 16 16 16 16 Base: Those who oppose late night driving restrictions applying to all P1 licence holders 138 71 67 52 46 25^ 15^ 15^ 10^ 13^ 100 95 37 8^
% of respondents It will be problematic in rural areas where there is a lack of public transport 65 63 66 71 48 80 67 73 60 69 63 63 68 50
The current restriction is sufficient 54 51 58 54 50 48 80 47 40 46 58 54 54 38
I don't think that it has significant safety benefits 52 56 46 62 44 48 47 53 60 39 52 45 62 37 It will be expensive for young people who would need to take public transport or taxis 51 51 52 58 37 64 53 54 30 38 55 53 51 50
It will be difficult to enforce 38 38 37 36 35 40 47 33 50 46 36 39 35 37
Other 9 1 18 15 4 8 7 13 8 10 9 5 ^ Caution: small cell size. Bold figures are significantly different to the average (of that wave) at at least the 95% confidence level.

50
51
school transport safety
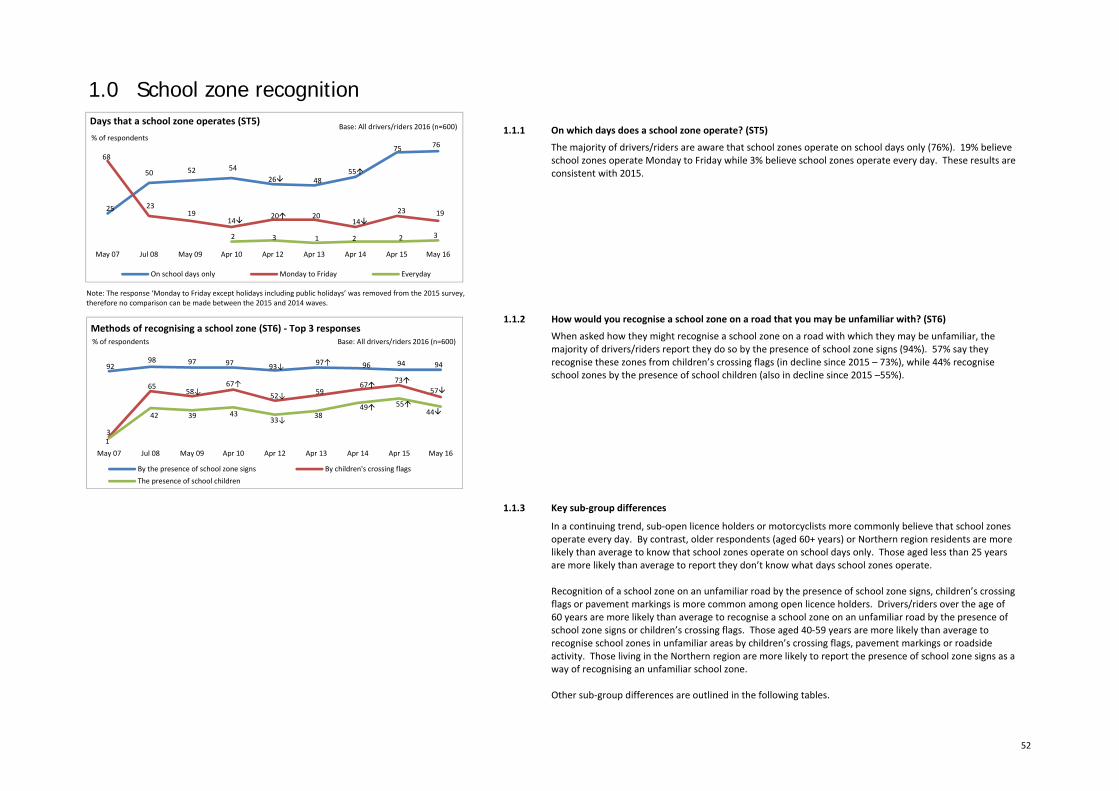
52
1.0 School zone recognition
1.1.1 On which days does a school zone operate? (ST5)
The majority of drivers/riders are aware that school zones operate on school days only (76%). 19% believe school zones operate Monday to Friday while 3% believe school zones operate every day. These results are consistent with 2015.
1.1.2 How would you recognise a school zone on a road that you may be unfamiliar with? (ST6)
When asked how they might recognise a school zone on a road with which they may be unfamiliar, the majority of drivers/riders report they do so by the presence of school zone signs (94%). 57% say they recognise these zones from children’s crossing flags (in decline since 2015 – 73%), while 44% recognise school zones by the presence of school children (also in decline since 2015 –55%).
1.1.3 Key sub‐group differences
In a continuing trend, sub‐open licence holders or motorcyclists more commonly believe that school zones operate every day. By contrast, older respondents (aged 60+ years) or Northern region residents are more likely than average to know that school zones operate on school days only. Those aged less than 25 years are more likely than average to report they don’t know what days school zones operate. Recognition of a school zone on an unfamiliar road by the presence of school zone signs, children’s crossing flags or pavement markings is more common among open licence holders. Drivers/riders over the age of 60 years are more likely than average to recognise a school zone on an unfamiliar road by the presence of school zone signs or children’s crossing flags. Those aged 40‐59 years are more likely than average to recognise school zones in unfamiliar areas by children’s crossing flags, pavement markings or roadside activity. Those living in the Northern region are more likely to report the presence of school zone signs as a way of recognising an unfamiliar school zone. Other sub‐group differences are outlined in the following tables.
Note: The response ‘Monday to Friday except holidays including public holidays’ was removed from the 2015 survey, therefore no comparison can be made between the 2015 and 2014 waves.
25
50 52 5426 48
55
75 7668
2319
14 20 2014
23 19
2 3 1 2 2 3
May 07 Jul 08 May 09 Apr 10 Apr 12 Apr 13 Apr 14 Apr 15 May 16
Days that a school zone operates (ST5)
On school days only Monday to Friday Everyday
Base: All drivers/riders 2016 (n=600)% of respondents
9298 97 97 93↓ 97↑ 96 94 94
3
6558↓
67↑52↓ 59
67 7357
1
42 39 4333↓ 38
49 5544
May 07 Jul 08 May 09 Apr 10 Apr 12 Apr 13 Apr 14 Apr 15 May 16
Methods of recognising a school zone (ST6) ‐ Top 3 responses
By the presence of school zone signs By children's crossing flagsThe presence of school children
Base: All drivers/riders 2016 (n=600)% of respondents
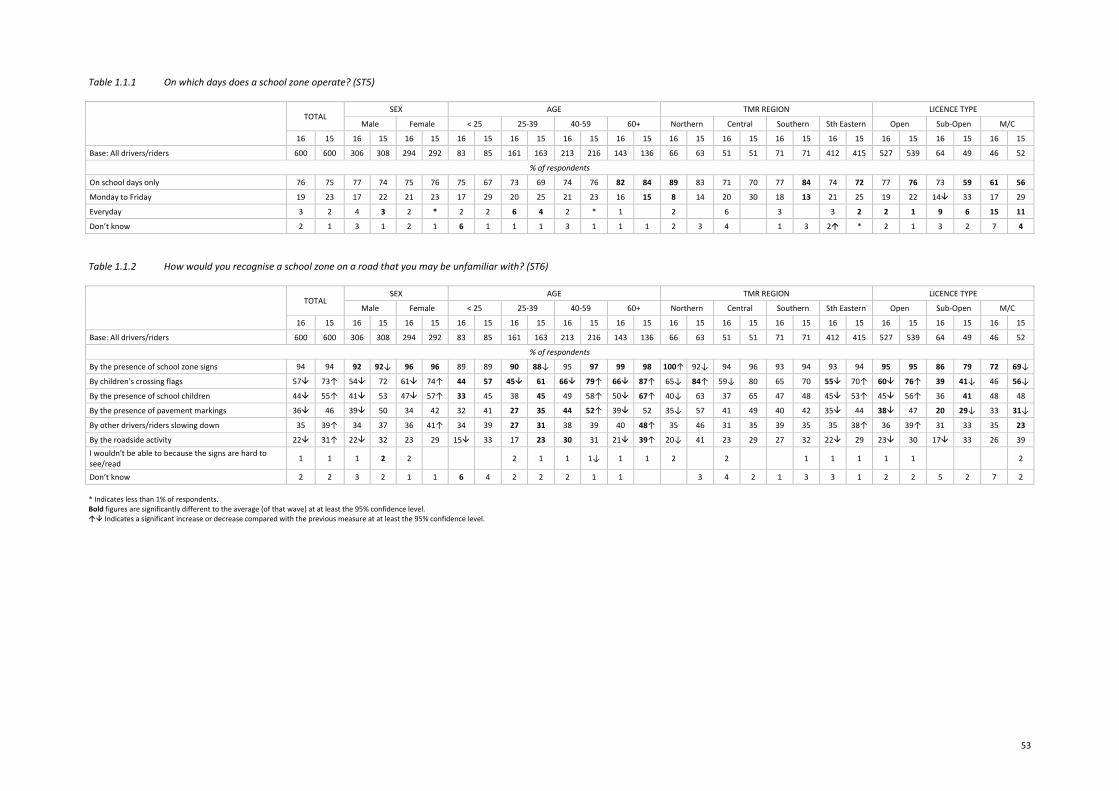
53
Table 1.1.1 On which days does a school zone operate? (ST5)
TOTAL
SEX AGE TMR REGION LICENCE TYPE
Male Female < 25 25‐39 40‐59 60+ Northern Central Southern Sth Eastern Open Sub‐Open M/C
16 15 16 15 16 15 16 15 16 15 16 15 16 15 16 15 16 15 16 15 16 15 16 15 16 15 16 15
Base: All drivers/riders 600 600 306 308 294 292 83 85 161 163 213 216 143 136 66 63 51 51 71 71 412 415 527 539 64 49 46 52
% of respondents
On school days only 76 75 77 74 75 76 75 67 73 69 74 76 82 84 89 83 71 70 77 84 74 72 77 76 73 59 61 56
Monday to Friday 19 23 17 22 21 23 17 29 20 25 21 23 16 15 8 14 20 30 18 13 21 25 19 22 14 33 17 29
Everyday 3 2 4 3 2 * 2 2 6 4 2 * 1 2 6 3 3 2 2 1 9 6 15 11
Don’t know 2 1 3 1 2 1 6 1 1 1 3 1 1 1 2 3 4 1 3 2 * 2 1 3 2 7 4
Table 1.1.2 How would you recognise a school zone on a road that you may be unfamiliar with? (ST6)
TOTAL
SEX AGE TMR REGION LICENCE TYPE
Male Female < 25 25‐39 40‐59 60+ Northern Central Southern Sth Eastern Open Sub‐Open M/C
16 15 16 15 16 15 16 15 16 15 16 15 16 15 16 15 16 15 16 15 16 15 16 15 16 15 16 15
Base: All drivers/riders 600 600 306 308 294 292 83 85 161 163 213 216 143 136 66 63 51 51 71 71 412 415 527 539 64 49 46 52
% of respondents
By the presence of school zone signs 94 94 92 92↓ 96 96 89 89 90 88↓ 95 97 99 98 100↑ 92↓ 94 96 93 94 93 94 95 95 86 79 72 69↓
By children's crossing flags 57 73↑ 54 72 61 74↑ 44 57 45 61 66 79↑ 66 87↑ 65↓ 84↑ 59↓ 80 65 70 55 70↑ 60 76↑ 39 41↓ 46 56↓
By the presence of school children 44 55↑ 41 53 47 57↑ 33 45 38 45 49 58↑ 50 67↑ 40↓ 63 37 65 47 48 45 53↑ 45 56↑ 36 41 48 48
By the presence of pavement markings 36 46 39 50 34 42 32 41 27 35 44 52↑ 39 52 35↓ 57 41 49 40 42 35 44 38 47 20 29↓ 33 31↓
By other drivers/riders slowing down 35 39↑ 34 37 36 41↑ 34 39 27 31 38 39 40 48↑ 35 46 31 35 39 35 35 38↑ 36 39↑ 31 33 35 23
By the roadside activity 22 31↑ 22 32 23 29 15 33 17 23 30 31 21 39↑ 20↓ 41 23 29 27 32 22 29 23 30 17 33 26 39 I wouldn't be able to because the signs are hard to see/read 1 1 1 2 2 2 1 1 1↓ 1 1 2 2 1 1 1 1 1 2
Don’t know 2 2 3 2 1 1 6 4 2 2 2 1 1 3 4 2 1 3 3 1 2 2 5 2 7 2 * Indicates less than 1% of respondents. Bold figures are significantly different to the average (of that wave) at at least the 95% confidence level. Indicates a significant increase or decrease compared with the previous measure at at least the 95% confidence level.
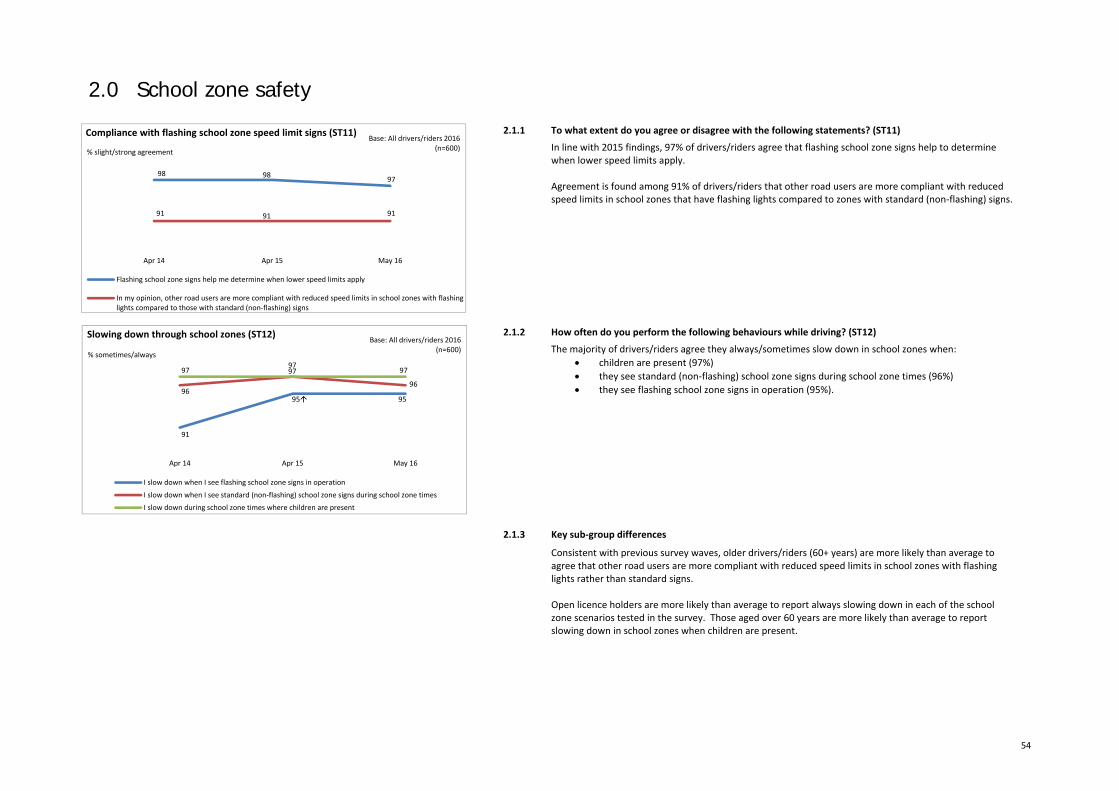
54
2.0 School zone safety
2.1.1 To what extent do you agree or disagree with the following statements? (ST11)
In line with 2015 findings, 97% of drivers/riders agree that flashing school zone signs help to determine when lower speed limits apply. Agreement is found among 91% of drivers/riders that other road users are more compliant with reduced speed limits in school zones that have flashing lights compared to zones with standard (non‐flashing) signs.
2.1.2 How often do you perform the following behaviours while driving? (ST12)
The majority of drivers/riders agree they always/sometimes slow down in school zones when: children are present (97%) they see standard (non‐flashing) school zone signs during school zone times (96%) they see flashing school zone signs in operation (95%).
2.1.3 Key sub‐group differences
Consistent with previous survey waves, older drivers/riders (60+ years) are more likely than average to agree that other road users are more compliant with reduced speed limits in school zones with flashing lights rather than standard signs. Open licence holders are more likely than average to report always slowing down in each of the school zone scenarios tested in the survey. Those aged over 60 years are more likely than average to report slowing down in school zones when children are present.
98 98 97
91 91 91
Apr 14 Apr 15 May 16
Compliance with flashing school zone speed limit signs (ST11)
Flashing school zone signs help me determine when lower speed limits apply
In my opinion, other road users are more compliant with reduced speed limits in school zones with flashinglights compared to those with standard (non‐flashing) signs
% slight/strong agreement
Base: All drivers/riders 2016 (n=600)
91
95 9596
97
96
97 97 97
Apr 14 Apr 15 May 16
Slowing down through school zones (ST12)
I slow down when I see flashing school zone signs in operation
I slow down when I see standard (non‐flashing) school zone signs during school zone times
I slow down during school zone times where children are present
% sometimes/always
Base: All drivers/riders 2016 (n=600)
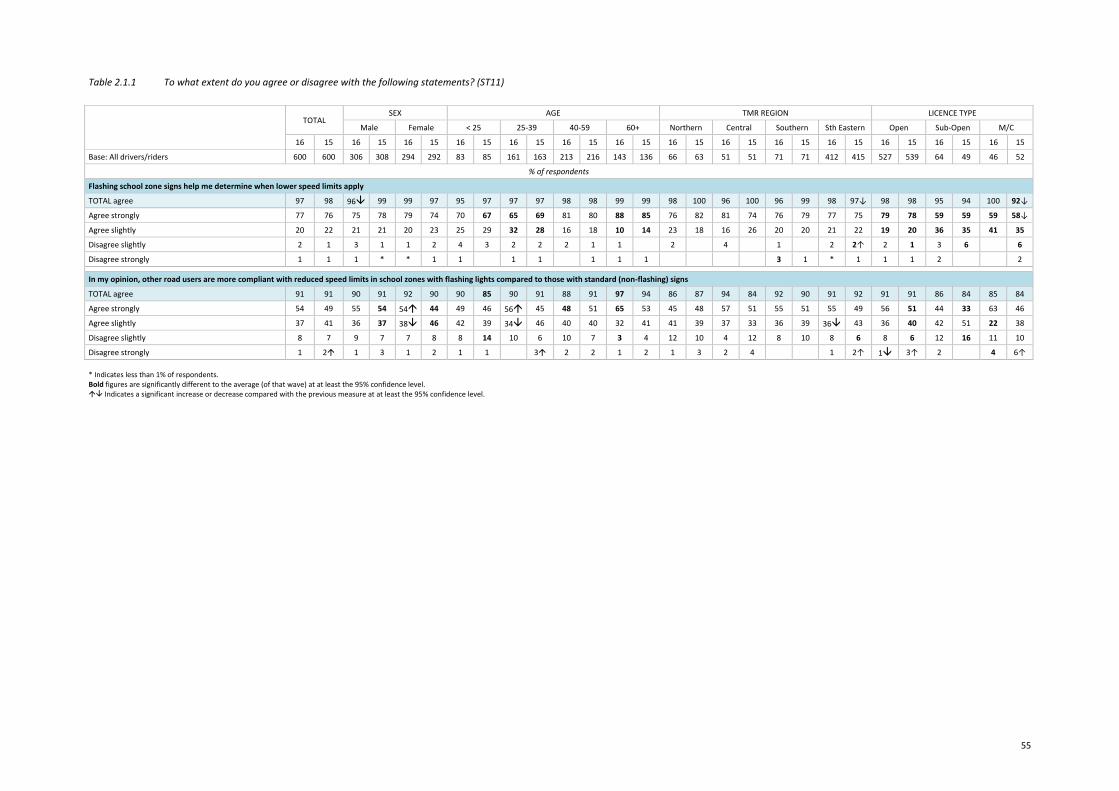
55
Table 2.1.1 To what extent do you agree or disagree with the following statements? (ST11)
* Indicates less than 1% of respondents. Bold figures are significantly different to the average (of that wave) at at least the 95% confidence level. Indicates a significant increase or decrease compared with the previous measure at at least the 95% confidence level.
TOTAL
SEX AGE TMR REGION LICENCE TYPE
Male Female < 25 25‐39 40‐59 60+ Northern Central Southern Sth Eastern Open Sub‐Open M/C
16 15 16 15 16 15 16 15 16 15 16 15 16 15 16 15 16 15 16 15 16 15 16 15 16 15 16 15
Base: All drivers/riders 600 600 306 308 294 292 83 85 161 163 213 216 143 136 66 63 51 51 71 71 412 415 527 539 64 49 46 52
% of respondents
Flashing school zone signs help me determine when lower speed limits apply
TOTAL agree 97 98 96 99 99 97 95 97 97 97 98 98 99 99 98 100 96 100 96 99 98 97↓ 98 98 95 94 100 92↓
Agree strongly 77 76 75 78 79 74 70 67 65 69 81 80 88 85 76 82 81 74 76 79 77 75 79 78 59 59 59 58↓
Agree slightly 20 22 21 21 20 23 25 29 32 28 16 18 10 14 23 18 16 26 20 20 21 22 19 20 36 35 41 35
Disagree slightly 2 1 3 1 1 2 4 3 2 2 2 1 1 2 4 1 2 2↑ 2 1 3 6 6
Disagree strongly 1 1 1 * * 1 1 1 1 1 1 1 3 1 * 1 1 1 2 2
In my opinion, other road users are more compliant with reduced speed limits in school zones with flashing lights compared to those with standard (non‐flashing) signs
TOTAL agree 91 91 90 91 92 90 90 85 90 91 88 91 97 94 86 87 94 84 92 90 91 92 91 91 86 84 85 84
Agree strongly 54 49 55 54 54 44 49 46 56 45 48 51 65 53 45 48 57 51 55 51 55 49 56 51 44 33 63 46
Agree slightly 37 41 36 37 38 46 42 39 34 46 40 40 32 41 41 39 37 33 36 39 36 43 36 40 42 51 22 38
Disagree slightly 8 7 9 7 7 8 8 14 10 6 10 7 3 4 12 10 4 12 8 10 8 6 8 6 12 16 11 10
Disagree strongly 1 2 1 3 1 2 1 1 3 2 2 1 2 1 3 2 4 1 2↑ 1 3↑ 2 4 6↑
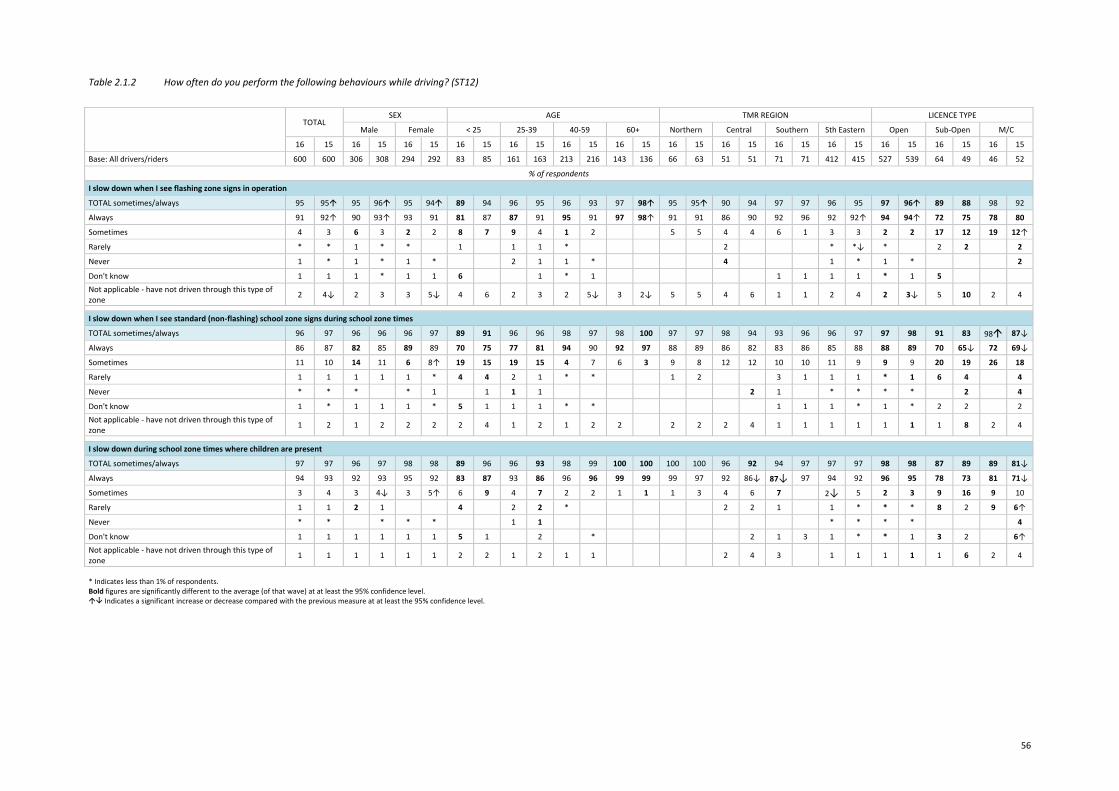
56
Table 2.1.2 How often do you perform the following behaviours while driving? (ST12)
* Indicates less than 1% of respondents. Bold figures are significantly different to the average (of that wave) at at least the 95% confidence level. Indicates a significant increase or decrease compared with the previous measure at at least the 95% confidence level.
TOTAL
SEX AGE TMR REGION LICENCE TYPE
Male Female < 25 25‐39 40‐59 60+ Northern Central Southern Sth Eastern Open Sub‐Open M/C
16 15 16 15 16 15 16 15 16 15 16 15 16 15 16 15 16 15 16 15 16 15 16 15 16 15 16 15
Base: All drivers/riders 600 600 306 308 294 292 83 85 161 163 213 216 143 136 66 63 51 51 71 71 412 415 527 539 64 49 46 52
% of respondents
I slow down when I see flashing zone signs in operation
TOTAL sometimes/always 95 95 95 96 95 94 89 94 96 95 96 93 97 98 95 95 90 94 97 97 96 95 97 96 89 88 98 92
Always 91 92↑ 90 93↑ 93 91 81 87 87 91 95 91 97 98↑ 91 91 86 90 92 96 92 92↑ 94 94↑ 72 75 78 80
Sometimes 4 3 6 3 2 2 8 7 9 4 1 2 5 5 4 4 6 1 3 3 2 2 17 12 19 12↑
Rarely * * 1 * * 1 1 1 * 2 * *↓ * 2 2 2
Never 1 * 1 * 1 * 2 1 1 * 4 1 * 1 * 2
Don't know 1 1 1 * 1 1 6 1 * 1 1 1 1 1 * 1 5 Not applicable ‐ have not driven through this type of zone 2 4↓ 2 3 3 5↓ 4 6 2 3 2 5↓ 3 2↓ 5 5 4 6 1 1 2 4 2 3↓ 5 10 2 4
I slow down when I see standard (non‐flashing) school zone signs during school zone times
TOTAL sometimes/always 96 97 96 96 96 97 89 91 96 96 98 97 98 100 97 97 98 94 93 96 96 97 97 98 91 83 98 87↓
Always 86 87 82 85 89 89 70 75 77 81 94 90 92 97 88 89 86 82 83 86 85 88 88 89 70 65↓ 72 69↓
Sometimes 11 10 14 11 6 8↑ 19 15 19 15 4 7 6 3 9 8 12 12 10 10 11 9 9 9 20 19 26 18
Rarely 1 1 1 1 1 * 4 4 2 1 * * 1 2 3 1 1 1 * 1 6 4 4
Never * * * * 1 1 1 1 2 1 * * * * 2 4
Don't know 1 * 1 1 1 * 5 1 1 1 * * 1 1 1 * 1 * 2 2 2 Not applicable ‐ have not driven through this type of zone 1 2 1 2 2 2 2 4 1 2 1 2 2 2 2 2 4 1 1 1 1 1 1 1 8 2 4
I slow down during school zone times where children are present
TOTAL sometimes/always 97 97 96 97 98 98 89 96 96 93 98 99 100 100 100 100 96 92 94 97 97 97 98 98 87 89 89 81↓
Always 94 93 92 93 95 92 83 87 93 86 96 96 99 99 99 97 92 86↓ 87↓ 97 94 92 96 95 78 73 81 71↓
Sometimes 3 4 3 4↓ 3 5↑ 6 9 4 7 2 2 1 1 1 3 4 6 7 2↓ 5 2 3 9 16 9 10
Rarely 1 1 2 1 4 2 2 * 2 2 1 1 * * * 8 2 9 6↑
Never * * * * * 1 1 * * * * 4
Don't know 1 1 1 1 1 1 5 1 2 * 2 1 3 1 * * 1 3 2 6↑ Not applicable ‐ have not driven through this type of zone 1 1 1 1 1 1 2 2 1 2 1 1 2 4 3 1 1 1 1 1 6 2 4
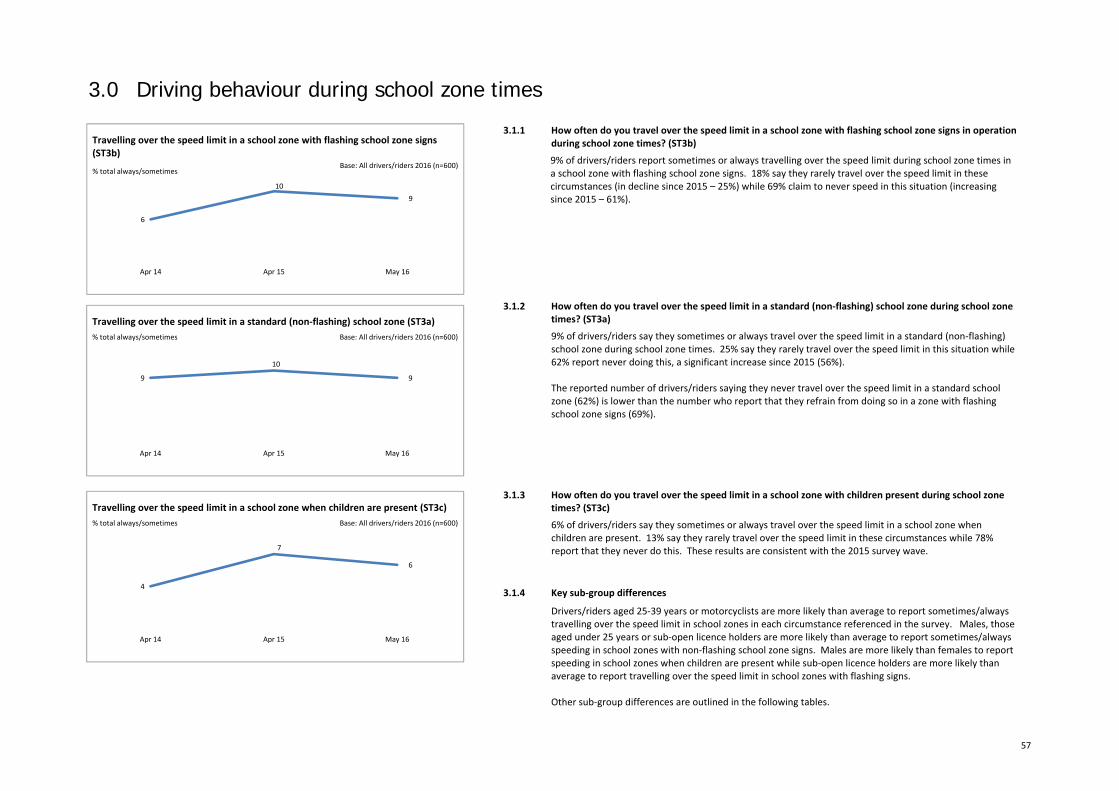
57
3.0 Driving behaviour during school zone times
3.1.1 How often do you travel over the speed limit in a school zone with flashing school zone signs in operation during school zone times? (ST3b)
9% of drivers/riders report sometimes or always travelling over the speed limit during school zone times in a school zone with flashing school zone signs. 18% say they rarely travel over the speed limit in these circumstances (in decline since 2015 – 25%) while 69% claim to never speed in this situation (increasing since 2015 – 61%).
3.1.2 How often do you travel over the speed limit in a standard (non‐flashing) school zone during school zone times? (ST3a)
9% of drivers/riders say they sometimes or always travel over the speed limit in a standard (non‐flashing) school zone during school zone times. 25% say they rarely travel over the speed limit in this situation while 62% report never doing this, a significant increase since 2015 (56%). The reported number of drivers/riders saying they never travel over the speed limit in a standard school zone (62%) is lower than the number who report that they refrain from doing so in a zone with flashing school zone signs (69%).
3.1.3 How often do you travel over the speed limit in a school zone with children present during school zone times? (ST3c)
6% of drivers/riders say they sometimes or always travel over the speed limit in a school zone when children are present. 13% say they rarely travel over the speed limit in these circumstances while 78% report that they never do this. These results are consistent with the 2015 survey wave.
3.1.4 Key sub‐group differences
Drivers/riders aged 25‐39 years or motorcyclists are more likely than average to report sometimes/always travelling over the speed limit in school zones in each circumstance referenced in the survey. Males, those aged under 25 years or sub‐open licence holders are more likely than average to report sometimes/always speeding in school zones with non‐flashing school zone signs. Males are more likely than females to report speeding in school zones when children are present while sub‐open licence holders are more likely than average to report travelling over the speed limit in school zones with flashing signs. Other sub‐group differences are outlined in the following tables.
6
109
Apr 14 Apr 15 May 16
% total always/sometimes Base: All drivers/riders 2016 (n=600)
Travelling over the speed limit in a school zone with flashing school zone signs (ST3b)
9
10
9
Apr 14 Apr 15 May 16
% total always/sometimes Base: All drivers/riders 2016 (n=600)
Travelling over the speed limit in a standard (non‐flashing) school zone (ST3a)
4
7
6
Apr 14 Apr 15 May 16
% total always/sometimes Base: All drivers/riders 2016 (n=600)
Travelling over the speed limit in a school zone when children are present (ST3c)
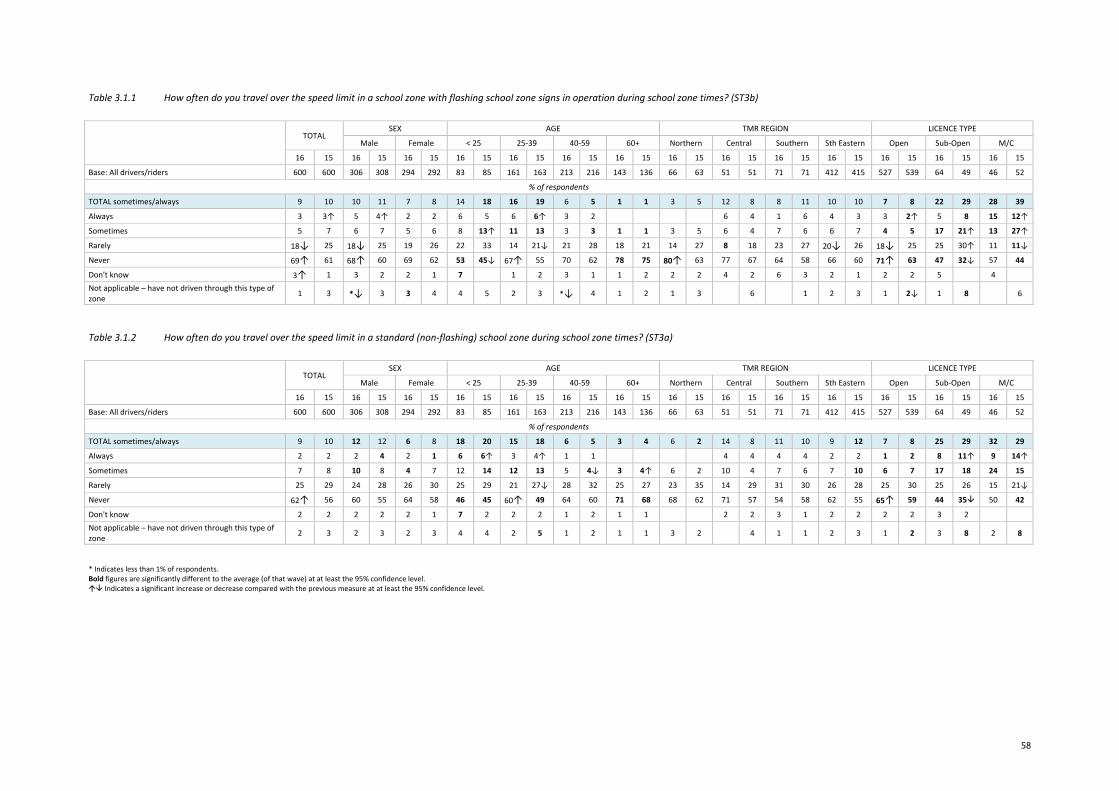
58
Table 3.1.1 How often do you travel over the speed limit in a school zone with flashing school zone signs in operation during school zone times? (ST3b)
Table 3.1.2 How often do you travel over the speed limit in a standard (non‐flashing) school zone during school zone times? (ST3a)
* Indicates less than 1% of respondents. Bold figures are significantly different to the average (of that wave) at at least the 95% confidence level. Indicates a significant increase or decrease compared with the previous measure at at least the 95% confidence level.
TOTAL
SEX AGE TMR REGION LICENCE TYPE
Male Female < 25 25‐39 40‐59 60+ Northern Central Southern Sth Eastern Open Sub‐Open M/C
16 15 16 15 16 15 16 15 16 15 16 15 16 15 16 15 16 15 16 15 16 15 16 15 16 15 16 15
Base: All drivers/riders 600 600 306 308 294 292 83 85 161 163 213 216 143 136 66 63 51 51 71 71 412 415 527 539 64 49 46 52
% of respondents
TOTAL sometimes/always 9 10 10 11 7 8 14 18 16 19 6 5 1 1 3 5 12 8 8 11 10 10 7 8 22 29 28 39
Always 3 3↑ 5 4↑ 2 2 6 5 6 6↑ 3 2 6 4 1 6 4 3 3 2↑ 5 8 15 12↑
Sometimes 5 7 6 7 5 6 8 13↑ 11 13 3 3 1 1 3 5 6 4 7 6 6 7 4 5 17 21↑ 13 27↑
Rarely 18↓ 25 18↓ 25 19 26 22 33 14 21↓ 21 28 18 21 14 27 8 18 23 27 20↓ 26 18↓ 25 25 30↑ 11 11↓
Never 69↑ 61 68↑ 60 69 62 53 45↓ 67↑ 55 70 62 78 75 80↑ 63 77 67 64 58 66 60 71↑ 63 47 32↓ 57 44
Don't know 3↑ 1 3 2 2 1 7 1 2 3 1 1 2 2 2 4 2 6 3 2 1 2 2 5 4 Not applicable – have not driven through this type of zone 1 3 *↓ 3 3 4 4 5 2 3 *↓ 4 1 2 1 3 6 1 2 3 1 2↓ 1 8 6
TOTAL
SEX AGE TMR REGION LICENCE TYPE
Male Female < 25 25‐39 40‐59 60+ Northern Central Southern Sth Eastern Open Sub‐Open M/C
16 15 16 15 16 15 16 15 16 15 16 15 16 15 16 15 16 15 16 15 16 15 16 15 16 15 16 15
Base: All drivers/riders 600 600 306 308 294 292 83 85 161 163 213 216 143 136 66 63 51 51 71 71 412 415 527 539 64 49 46 52
% of respondents
TOTAL sometimes/always 9 10 12 12 6 8 18 20 15 18 6 5 3 4 6 2 14 8 11 10 9 12 7 8 25 29 32 29
Always 2 2 2 4 2 1 6 6↑ 3 4↑ 1 1 4 4 4 4 2 2 1 2 8 11↑ 9 14↑
Sometimes 7 8 10 8 4 7 12 14 12 13 5 4↓ 3 4↑ 6 2 10 4 7 6 7 10 6 7 17 18 24 15
Rarely 25 29 24 28 26 30 25 29 21 27↓ 28 32 25 27 23 35 14 29 31 30 26 28 25 30 25 26 15 21↓
Never 62↑ 56 60 55 64 58 46 45 60↑ 49 64 60 71 68 68 62 71 57 54 58 62 55 65↑ 59 44 35 50 42
Don't know 2 2 2 2 2 1 7 2 2 2 1 2 1 1 2 2 3 1 2 2 2 2 3 2 Not applicable – have not driven through this type of zone 2 3 2 3 2 3 4 4 2 5 1 2 1 1 3 2 4 1 1 2 3 1 2 3 8 2 8
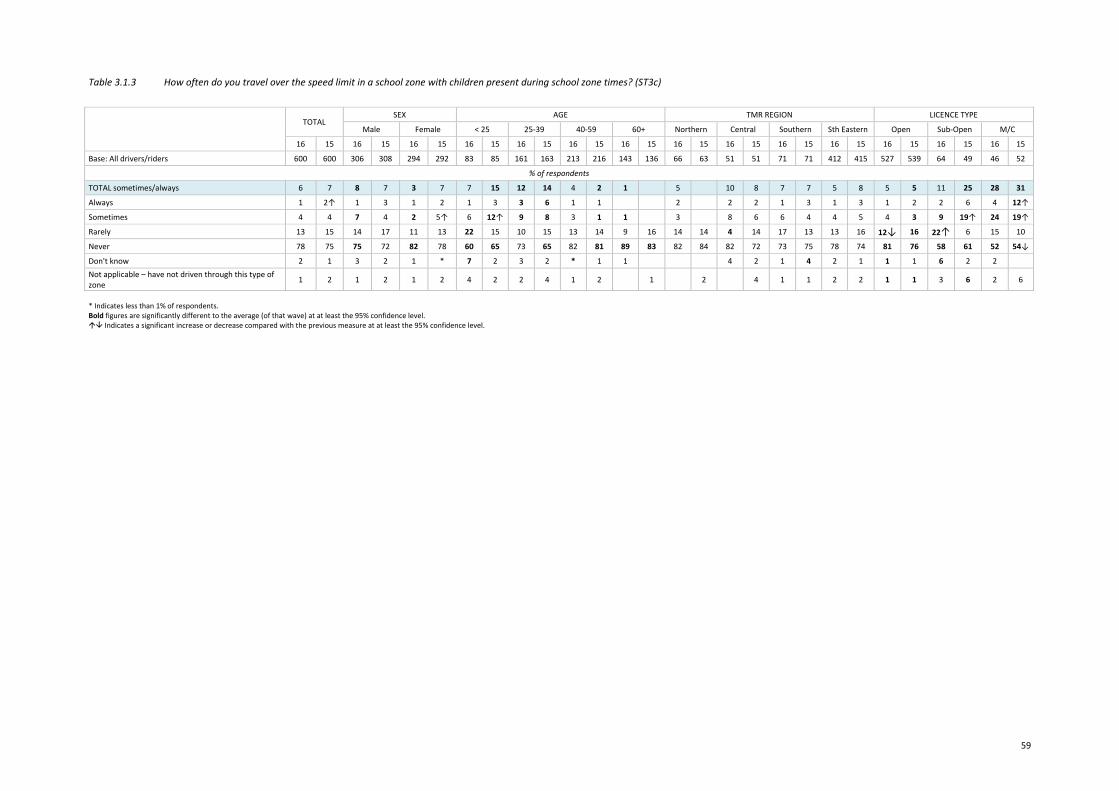
59
Table 3.1.3 How often do you travel over the speed limit in a school zone with children present during school zone times? (ST3c)
* Indicates less than 1% of respondents. Bold figures are significantly different to the average (of that wave) at at least the 95% confidence level. Indicates a significant increase or decrease compared with the previous measure at at least the 95% confidence level.
TOTAL
SEX AGE TMR REGION LICENCE TYPE
Male Female < 25 25‐39 40‐59 60+ Northern Central Southern Sth Eastern Open Sub‐Open M/C
16 15 16 15 16 15 16 15 16 15 16 15 16 15 16 15 16 15 16 15 16 15 16 15 16 15 16 15
Base: All drivers/riders 600 600 306 308 294 292 83 85 161 163 213 216 143 136 66 63 51 51 71 71 412 415 527 539 64 49 46 52
% of respondents
TOTAL sometimes/always 6 7 8 7 3 7 7 15 12 14 4 2 1 5 10 8 7 7 5 8 5 5 11 25 28 31
Always 1 2↑ 1 3 1 2 1 3 3 6 1 1 2 2 2 1 3 1 3 1 2 2 6 4 12↑
Sometimes 4 4 7 4 2 5↑ 6 12↑ 9 8 3 1 1 3 8 6 6 4 4 5 4 3 9 19↑ 24 19↑
Rarely 13 15 14 17 11 13 22 15 10 15 13 14 9 16 14 14 4 14 17 13 13 16 12↓ 16 22↑ 6 15 10
Never 78 75 75 72 82 78 60 65 73 65 82 81 89 83 82 84 82 72 73 75 78 74 81 76 58 61 52 54↓
Don't know 2 1 3 2 1 * 7 2 3 2 * 1 1 4 2 1 4 2 1 1 1 6 2 2 Not applicable – have not driven through this type of zone 1 2 1 2 1 2 4 2 2 4 1 2 1 2 4 1 1 2 2 1 1 3 6 2 6
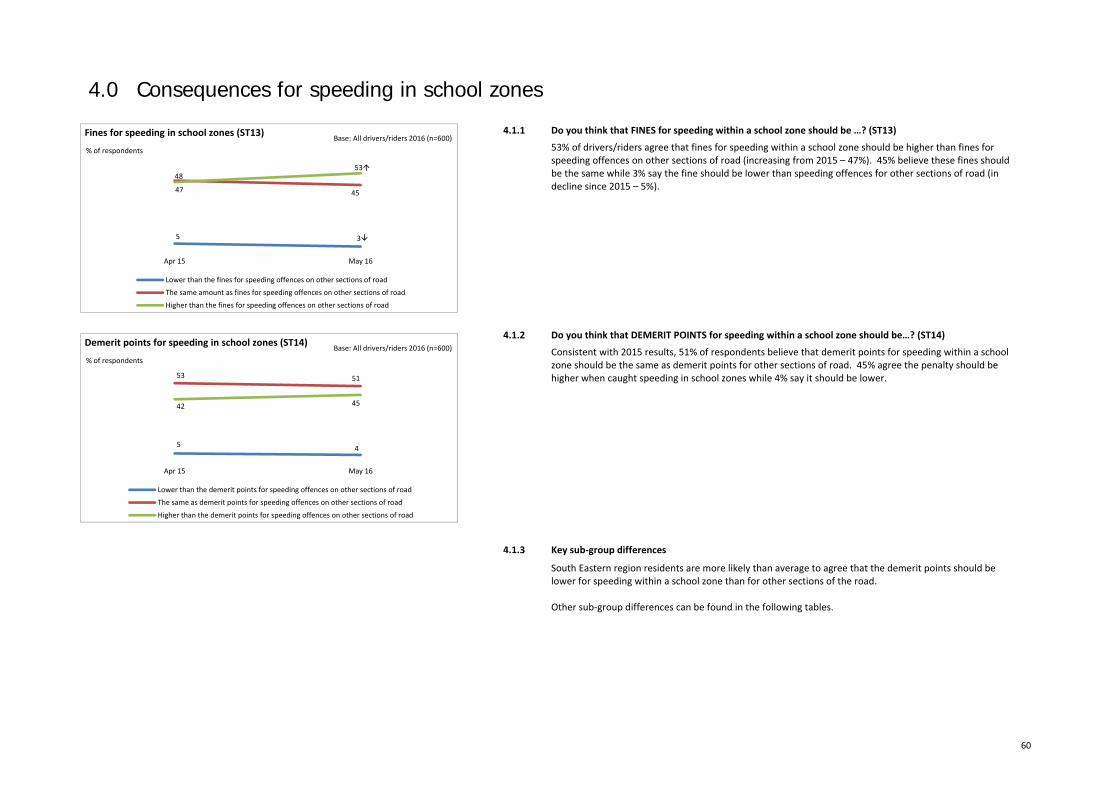
60
4.0 Consequences for speeding in school zones
4.1.1 Do you think that FINES for speeding within a school zone should be …? (ST13)
53% of drivers/riders agree that fines for speeding within a school zone should be higher than fines for speeding offences on other sections of road (increasing from 2015 – 47%). 45% believe these fines should be the same while 3% say the fine should be lower than speeding offences for other sections of road (in decline since 2015 – 5%).
4.1.2 Do you think that DEMERIT POINTS for speeding within a school zone should be…? (ST14)
Consistent with 2015 results, 51% of respondents believe that demerit points for speeding within a school zone should be the same as demerit points for other sections of road. 45% agree the penalty should be higher when caught speeding in school zones while 4% say it should be lower.
4.1.3 Key sub‐group differences
South Eastern region residents are more likely than average to agree that the demerit points should be lower for speeding within a school zone than for other sections of the road. Other sub‐group differences can be found in the following tables.
5 3
48
4547
53
Apr 15 May 16
Fines for speeding in school zones (ST13)
Lower than the fines for speeding offences on other sections of road
The same amount as fines for speeding offences on other sections of road
Higher than the fines for speeding offences on other sections of road
Base: All drivers/riders 2016 (n=600)% of respondents
5 4
53 51
42 45
Apr 15 May 16
Demerit points for speeding in school zones (ST14)
Lower than the demerit points for speeding offences on other sections of road
The same as demerit points for speeding offences on other sections of road
Higher than the demerit points for speeding offences on other sections of road
Base: All drivers/riders 2016 (n=600)% of respondents
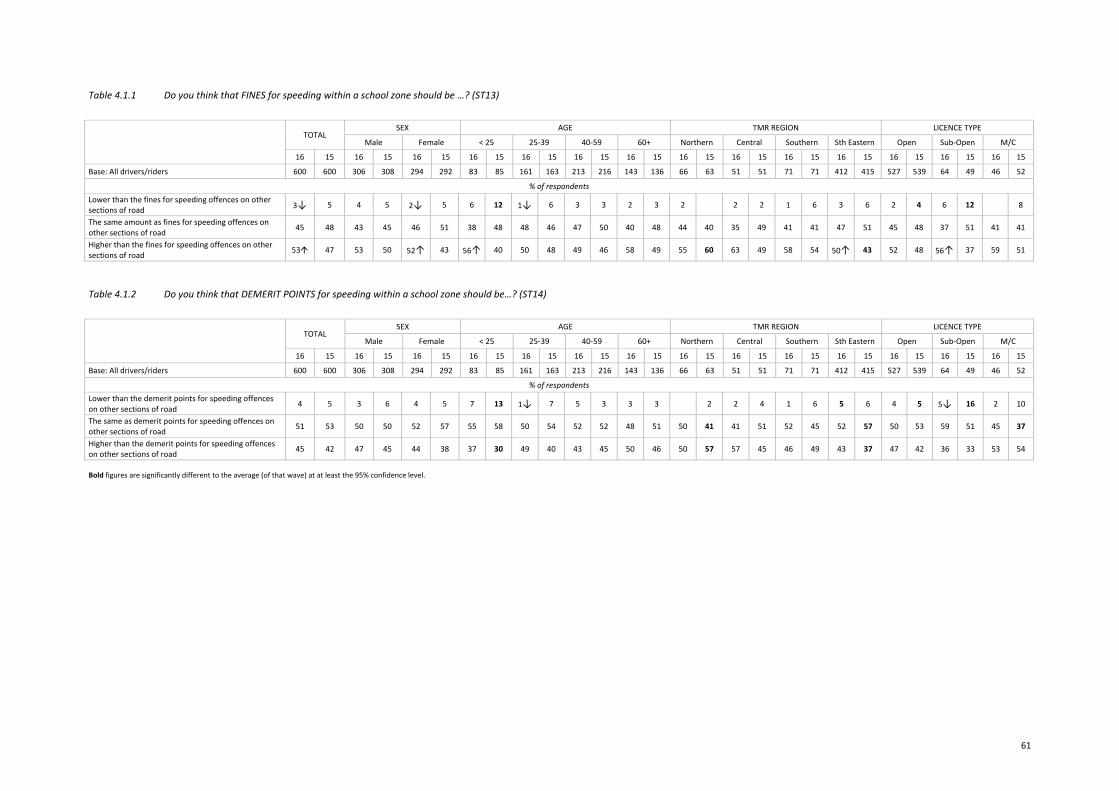
61
Table 4.1.1 Do you think that FINES for speeding within a school zone should be …? (ST13)
Table 4.1.2 Do you think that DEMERIT POINTS for speeding within a school zone should be…? (ST14)
Bold figures are significantly different to the average (of that wave) at at least the 95% confidence level.
TOTAL
SEX AGE TMR REGION LICENCE TYPE
Male Female < 25 25‐39 40‐59 60+ Northern Central Southern Sth Eastern Open Sub‐Open M/C
16 15 16 15 16 15 16 15 16 15 16 15 16 15 16 15 16 15 16 15 16 15 16 15 16 15 16 15
Base: All drivers/riders 600 600 306 308 294 292 83 85 161 163 213 216 143 136 66 63 51 51 71 71 412 415 527 539 64 49 46 52
% of respondents Lower than the fines for speeding offences on other sections of road 3↓ 5 4 5 2↓ 5 6 12 1↓ 6 3 3 2 3 2 2 2 1 6 3 6 2 4 6 12 8
The same amount as fines for speeding offences on other sections of road 45 48 43 45 46 51 38 48 48 46 47 50 40 48 44 40 35 49 41 41 47 51 45 48 37 51 41 41
Higher than the fines for speeding offences on other sections of road 53 47 53 50 52↑ 43 56↑ 40 50 48 49 46 58 49 55 60 63 49 58 54 50↑ 43 52 48 56↑ 37 59 51
TOTAL
SEX AGE TMR REGION LICENCE TYPE
Male Female < 25 25‐39 40‐59 60+ Northern Central Southern Sth Eastern Open Sub‐Open M/C
16 15 16 15 16 15 16 15 16 15 16 15 16 15 16 15 16 15 16 15 16 15 16 15 16 15 16 15
Base: All drivers/riders 600 600 306 308 294 292 83 85 161 163 213 216 143 136 66 63 51 51 71 71 412 415 527 539 64 49 46 52
% of respondents Lower than the demerit points for speeding offences on other sections of road 4 5 3 6 4 5 7 13 1↓ 7 5 3 3 3 2 2 4 1 6 5 6 4 5 5↓ 16 2 10
The same as demerit points for speeding offences on other sections of road 51 53 50 50 52 57 55 58 50 54 52 52 48 51 50 41 41 51 52 45 52 57 50 53 59 51 45 37
Higher than the demerit points for speeding offences on other sections of road 45 42 47 45 44 38 37 30 49 40 43 45 50 46 50 57 57 45 46 49 43 37 47 42 36 33 53 54
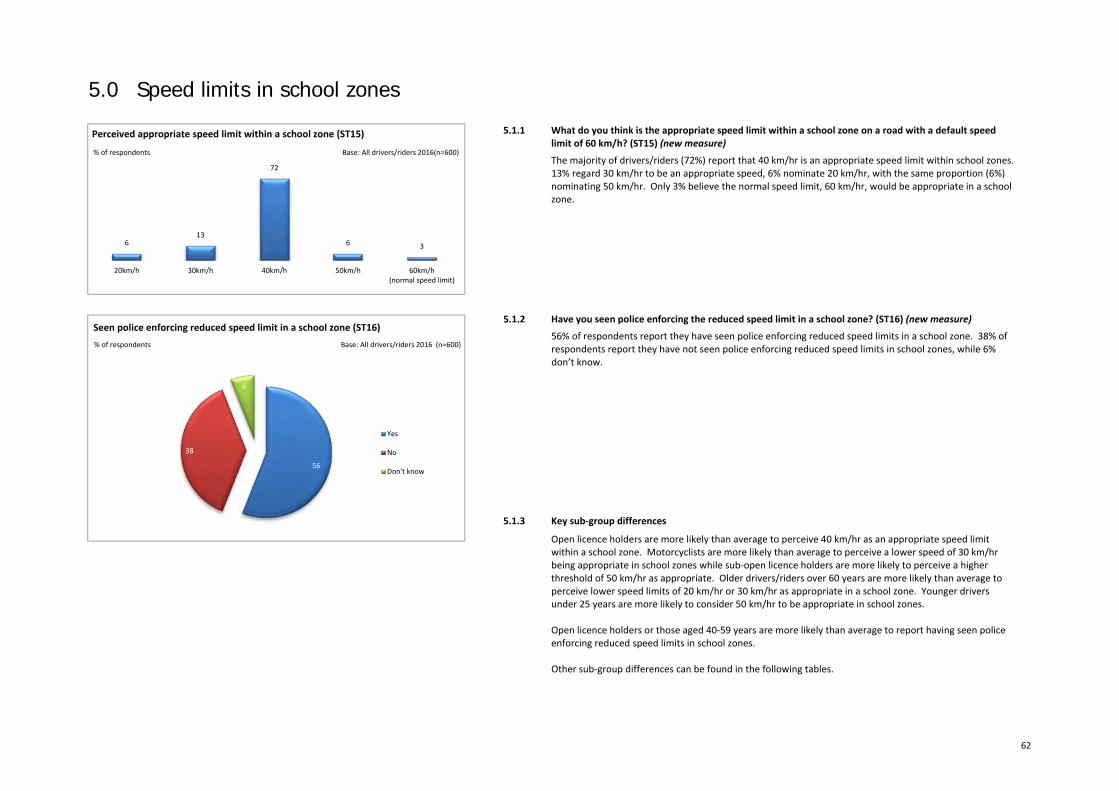
62
5.0 Speed limits in school zones
5.1.1 What do you think is the appropriate speed limit within a school zone on a road with a default speed limit of 60 km/h? (ST15) (new measure)
The majority of drivers/riders (72%) report that 40 km/hr is an appropriate speed limit within school zones. 13% regard 30 km/hr to be an appropriate speed, 6% nominate 20 km/hr, with the same proportion (6%) nominating 50 km/hr. Only 3% believe the normal speed limit, 60 km/hr, would be appropriate in a school zone.
5.1.2 Have you seen police enforcing the reduced speed limit in a school zone? (ST16) (new measure)
56% of respondents report they have seen police enforcing reduced speed limits in a school zone. 38% of respondents report they have not seen police enforcing reduced speed limits in school zones, while 6% don’t know.
5.1.3 Key sub‐group differences
Open licence holders are more likely than average to perceive 40 km/hr as an appropriate speed limit within a school zone. Motorcyclists are more likely than average to perceive a lower speed of 30 km/hr being appropriate in school zones while sub‐open licence holders are more likely to perceive a higher threshold of 50 km/hr as appropriate. Older drivers/riders over 60 years are more likely than average to perceive lower speed limits of 20 km/hr or 30 km/hr as appropriate in a school zone. Younger drivers under 25 years are more likely to consider 50 km/hr to be appropriate in school zones. Open licence holders or those aged 40‐59 years are more likely than average to report having seen police enforcing reduced speed limits in school zones. Other sub‐group differences can be found in the following tables.
56
38
6
Yes
No
Don't know
Seen police enforcing reduced speed limit in a school zone (ST16)Base: All drivers/riders 2016 (n=600)% of respondents
613
72
6 3
20km/h 30km/h 40km/h 50km/h 60km/h(normal speed limit)
Perceived appropriate speed limit within a school zone (ST15)
% of respondents Base: All drivers/riders 2016(n=600)
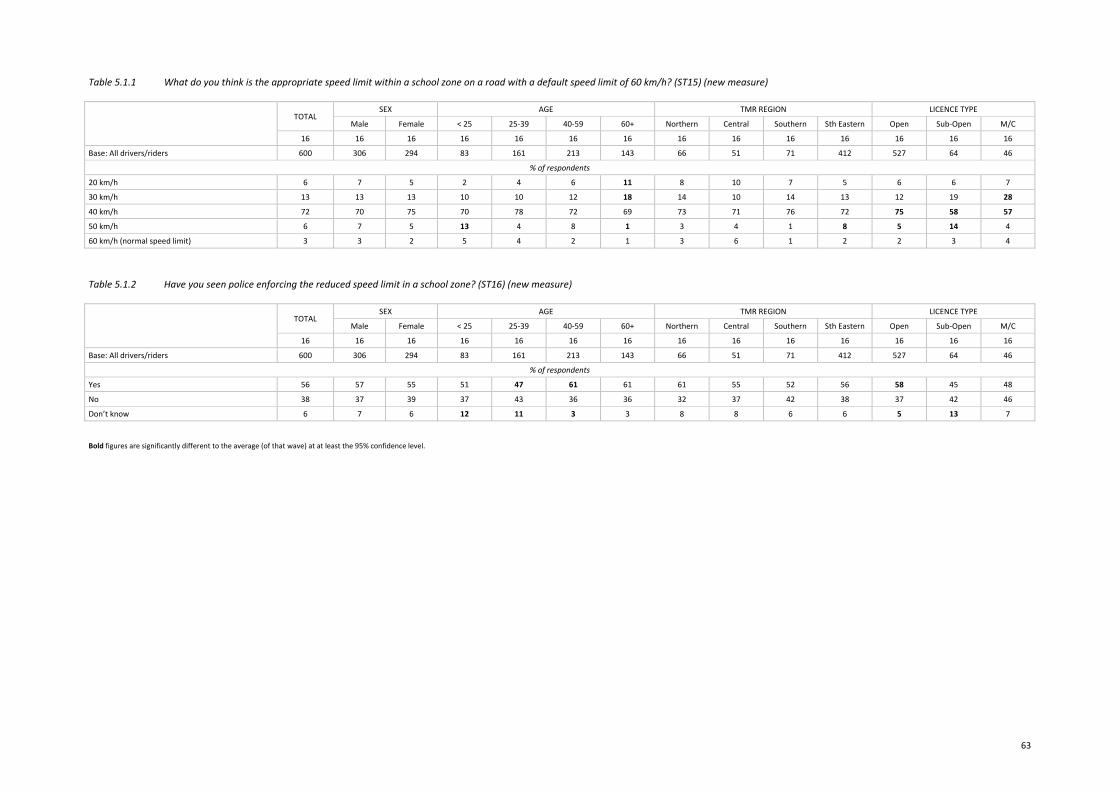
63
Table 5.1.1 What do you think is the appropriate speed limit within a school zone on a road with a default speed limit of 60 km/h? (ST15) (new measure)
TOTAL
SEX AGE TMR REGION LICENCE TYPE
Male Female < 25 25‐39 40‐59 60+ Northern Central Southern Sth Eastern Open Sub‐Open M/C
16 16 16 16 16 16 16 16 16 16 16 16 16 16
Base: All drivers/riders 600 306 294 83 161 213 143 66 51 71 412 527 64 46
% of respondents
20 km/h 6 7 5 2 4 6 11 8 10 7 5 6 6 7
30 km/h 13 13 13 10 10 12 18 14 10 14 13 12 19 28
40 km/h 72 70 75 70 78 72 69 73 71 76 72 75 58 57
50 km/h 6 7 5 13 4 8 1 3 4 1 8 5 14 4
60 km/h (normal speed limit) 3 3 2 5 4 2 1 3 6 1 2 2 3 4 Table 5.1.2 Have you seen police enforcing the reduced speed limit in a school zone? (ST16) (new measure)
TOTAL
SEX AGE TMR REGION LICENCE TYPE
Male Female < 25 25‐39 40‐59 60+ Northern Central Southern Sth Eastern Open Sub‐Open M/C
16 16 16 16 16 16 16 16 16 16 16 16 16 16
Base: All drivers/riders 600 306 294 83 161 213 143 66 51 71 412 527 64 46
% of respondents
Yes 56 57 55 51 47 61 61 61 55 52 56 58 45 48
No 38 37 39 37 43 36 36 32 37 42 38 37 42 46
Don’t know 6 7 6 12 11 3 3 8 8 6 6 5 13 7 Bold figures are significantly different to the average (of that wave) at at least the 95% confidence level.

64
65
occupant restraint
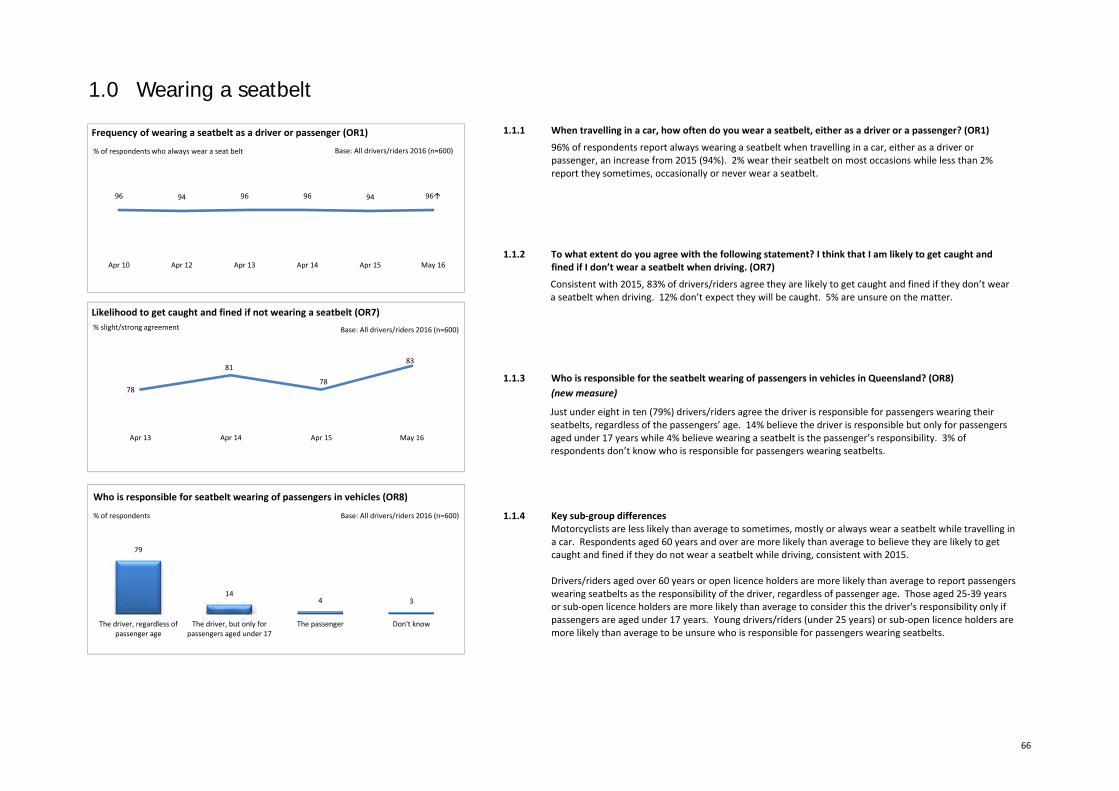
66
1.0 Wearing a seatbelt
1.1.1 When travelling in a car, how often do you wear a seatbelt, either as a driver or a passenger? (OR1)
96% of respondents report always wearing a seatbelt when travelling in a car, either as a driver or passenger, an increase from 2015 (94%). 2% wear their seatbelt on most occasions while less than 2% report they sometimes, occasionally or never wear a seatbelt.
1.1.2 To what extent do you agree with the following statement? I think that I am likely to get caught and fined if I don’t wear a seatbelt when driving. (OR7)
Consistent with 2015, 83% of drivers/riders agree they are likely to get caught and fined if they don’t wear a seatbelt when driving. 12% don’t expect they will be caught. 5% are unsure on the matter.
1.1.3 Who is responsible for the seatbelt wearing of passengers in vehicles in Queensland? (OR8) (new measure)
Just under eight in ten (79%) drivers/riders agree the driver is responsible for passengers wearing their seatbelts, regardless of the passengers’ age. 14% believe the driver is responsible but only for passengers aged under 17 years while 4% believe wearing a seatbelt is the passenger’s responsibility. 3% of respondents don’t know who is responsible for passengers wearing seatbelts.
1.1.4 Key sub‐group differences Motorcyclists are less likely than average to sometimes, mostly or always wear a seatbelt while travelling in a car. Respondents aged 60 years and over are more likely than average to believe they are likely to get caught and fined if they do not wear a seatbelt while driving, consistent with 2015. Drivers/riders aged over 60 years or open licence holders are more likely than average to report passengers wearing seatbelts as the responsibility of the driver, regardless of passenger age. Those aged 25‐39 years or sub‐open licence holders are more likely than average to consider this the driver's responsibility only if passengers are aged under 17 years. Young drivers/riders (under 25 years) or sub‐open licence holders are more likely than average to be unsure who is responsible for passengers wearing seatbelts.
96 94 96 96 94 96
Apr 10 Apr 12 Apr 13 Apr 14 Apr 15 May 16
Frequency of wearing a seatbelt as a driver or passenger (OR1)
% of respondents who always wear a seat belt Base: All drivers/riders 2016 (n=600)
78
81
78
83
Apr 13 Apr 14 Apr 15 May 16
Likelihood to get caught and fined if not wearing a seatbelt (OR7)
Base: All drivers/riders 2016 (n=600)% slight/strong agreement
79
144 3
The driver, regardless ofpassenger age
The driver, but only forpassengers aged under 17
The passenger Don't know
Base: All drivers/riders 2016 (n=600)% of respondents
Who is responsible for seatbelt wearing of passengers in vehicles (OR8)
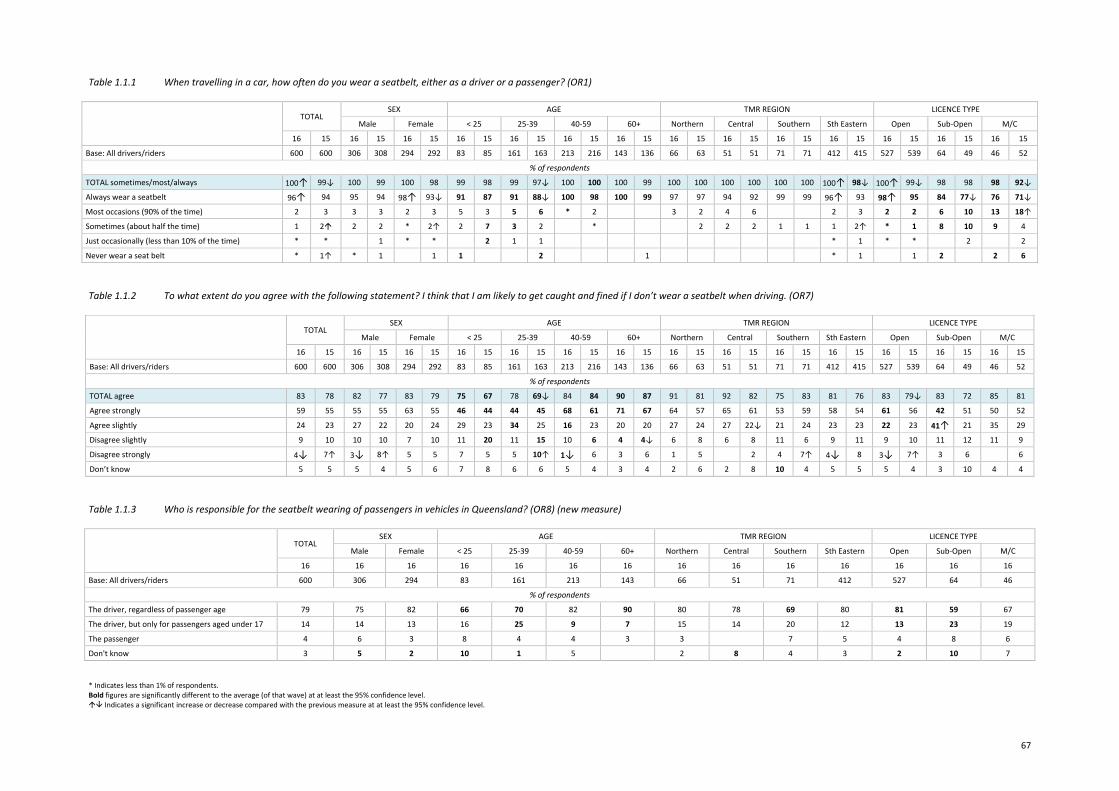
67
Table 1.1.1 When travelling in a car, how often do you wear a seatbelt, either as a driver or a passenger? (OR1)
TOTAL SEX AGE TMR REGION LICENCE TYPE
Male Female < 25 25‐39 40‐59 60+ Northern Central Southern Sth Eastern Open Sub‐Open M/C
16 15 16 15 16 15 16 15 16 15 16 15 16 15 16 15 16 15 16 15 16 15 16 15 16 15 16 15
Base: All drivers/riders 600 600 306 308 294 292 83 85 161 163 213 216 143 136 66 63 51 51 71 71 412 415 527 539 64 49 46 52
% of respondents
TOTAL sometimes/most/always 100↑ 99↓ 100 99 100 98 99 98 99 97↓ 100 100 100 99 100 100 100 100 100 100 100↑ 98↓ 100↑ 99↓ 98 98 98 92↓
Always wear a seatbelt 96↑ 94 95 94 98↑ 93↓ 91 87 91 88↓ 100 98 100 99 97 97 94 92 99 99 96↑ 93 98↑ 95 84 77↓ 76 71↓
Most occasions (90% of the time) 2 3 3 3 2 3 5 3 5 6 * 2 3 2 4 6 2 3 2 2 6 10 13 18↑
Sometimes (about half the time) 1 2 2 2 * 2↑ 2 7 3 2 * 2 2 2 1 1 1 2↑ * 1 8 10 9 4
Just occasionally (less than 10% of the time) * * 1 * * 2 1 1 * 1 * * 2 2
Never wear a seat belt * 1↑ * 1 1 1 2 1 * 1 1 2 2 6
Table 1.1.2 To what extent do you agree with the following statement? I think that I am likely to get caught and fined if I don’t wear a seatbelt when driving. (OR7)
TOTAL
SEX AGE TMR REGION LICENCE TYPE
Male Female < 25 25‐39 40‐59 60+ Northern Central Southern Sth Eastern Open Sub‐Open M/C
16 15 16 15 16 15 16 15 16 15 16 15 16 15 16 15 16 15 16 15 16 15 16 15 16 15 16 15
Base: All drivers/riders 600 600 306 308 294 292 83 85 161 163 213 216 143 136 66 63 51 51 71 71 412 415 527 539 64 49 46 52
% of respondents
TOTAL agree 83 78 82 77 83 79 75 67 78 69↓ 84 84 90 87 91 81 92 82 75 83 81 76 83 79↓ 83 72 85 81
Agree strongly 59 55 55 55 63 55 46 44 44 45 68 61 71 67 64 57 65 61 53 59 58 54 61 56 42 51 50 52
Agree slightly 24 23 27 22 20 24 29 23 34 25 16 23 20 20 27 24 27 22↓ 21 24 23 23 22 23 41↑ 21 35 29
Disagree slightly 9 10 10 10 7 10 11 20 11 15 10 6 4 4↓ 6 8 6 8 11 6 9 11 9 10 11 12 11 9
Disagree strongly 4↓ 7↑ 3↓ 8↑ 5 5 7 5 5 10↑ 1↓ 6 3 6 1 5 2 4 7↑ 4↓ 8 3↓ 7↑ 3 6 6
Don’t know 5 5 5 4 5 6 7 8 6 6 5 4 3 4 2 6 2 8 10 4 5 5 5 4 3 10 4 4
Table 1.1.3 Who is responsible for the seatbelt wearing of passengers in vehicles in Queensland? (OR8) (new measure)
TOTAL
SEX AGE TMR REGION LICENCE TYPE
Male Female < 25 25‐39 40‐59 60+ Northern Central Southern Sth Eastern Open Sub‐Open M/C
16 16 16 16 16 16 16 16 16 16 16 16 16 16
Base: All drivers/riders 600 306 294 83 161 213 143 66 51 71 412 527 64 46
% of respondents
The driver, regardless of passenger age 79 75 82 66 70 82 90 80 78 69 80 81 59 67
The driver, but only for passengers aged under 17 14 14 13 16 25 9 7 15 14 20 12 13 23 19
The passenger 4 6 3 8 4 4 3 3 7 5 4 8 6
Don't know 3 5 2 10 1 5 2 8 4 3 2 10 7 * Indicates less than 1% of respondents. Bold figures are significantly different to the average (of that wave) at at least the 95% confidence level. Indicates a significant increase or decrease compared with the previous measure at at least the 95% confidence level.
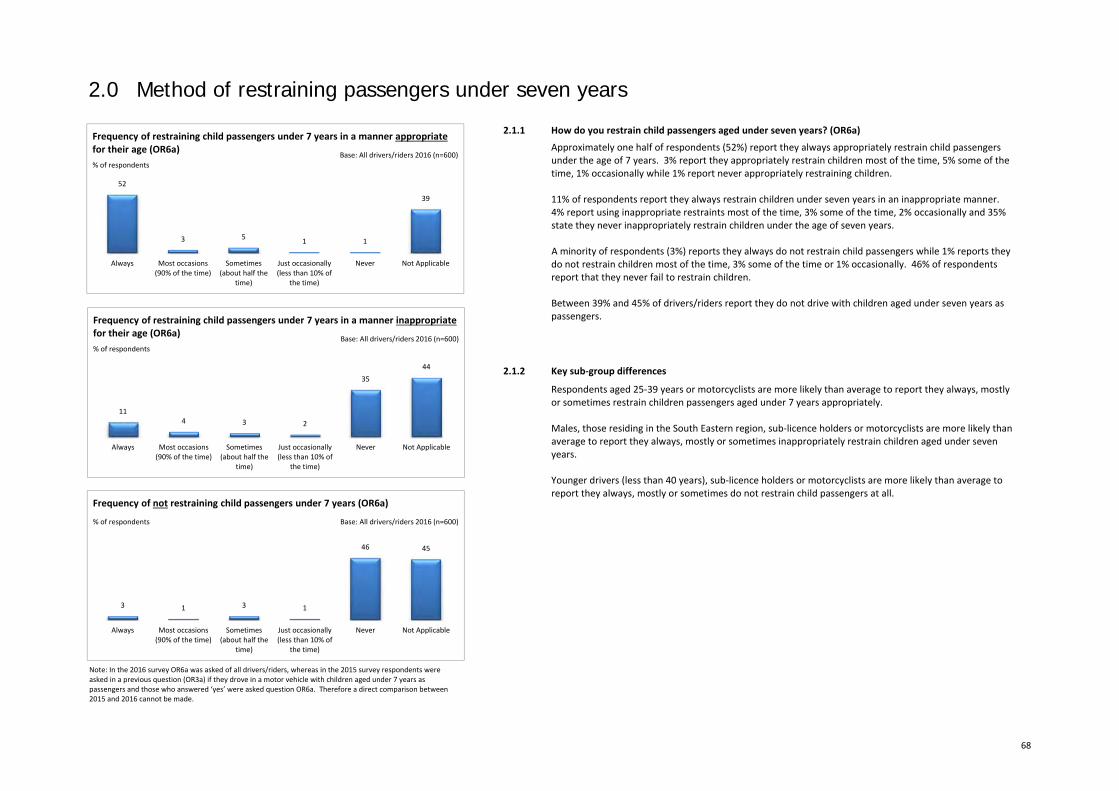
68
2.0 Method of restraining passengers under seven years
2.1.1 How do you restrain child passengers aged under seven years? (OR6a)
Approximately one half of respondents (52%) report they always appropriately restrain child passengers under the age of 7 years. 3% report they appropriately restrain children most of the time, 5% some of the time, 1% occasionally while 1% report never appropriately restraining children. 11% of respondents report they always restrain children under seven years in an inappropriate manner. 4% report using inappropriate restraints most of the time, 3% some of the time, 2% occasionally and 35% state they never inappropriately restrain children under the age of seven years. A minority of respondents (3%) reports they always do not restrain child passengers while 1% reports they do not restrain children most of the time, 3% some of the time or 1% occasionally. 46% of respondents report that they never fail to restrain children. Between 39% and 45% of drivers/riders report they do not drive with children aged under seven years as passengers.
2.1.2 Key sub‐group differences
Respondents aged 25‐39 years or motorcyclists are more likely than average to report they always, mostly or sometimes restrain children passengers aged under 7 years appropriately. Males, those residing in the South Eastern region, sub‐licence holders or motorcyclists are more likely than average to report they always, mostly or sometimes inappropriately restrain children aged under seven years. Younger drivers (less than 40 years), sub‐licence holders or motorcyclists are more likely than average to report they always, mostly or sometimes do not restrain child passengers at all.
Note: In the 2016 survey OR6a was asked of all drivers/riders, whereas in the 2015 survey respondents were asked in a previous question (OR3a) if they drove in a motor vehicle with children aged under 7 years as passengers and those who answered ‘yes’ were asked question OR6a. Therefore a direct comparison between 2015 and 2016 cannot be made.
52
3 5 1 1
39
Always Most occasions(90% of the time)
Sometimes(about half the
time)
Just occasionally(less than 10% of
the time)
Never Not Applicable
Base: All drivers/riders 2016 (n=600)% of respondents
Frequency of restraining child passengers under 7 years in a manner appropriatefor their age (OR6a)
114 3 2
3544
Always Most occasions(90% of the time)
Sometimes(about half the
time)
Just occasionally(less than 10% of
the time)
Never Not Applicable
Base: All drivers/riders 2016 (n=600)% of respondents
Frequency of restraining child passengers under 7 years in a manner inappropriatefor their age (OR6a)
3 1 3 1
46 45
Always Most occasions(90% of the time)
Sometimes(about half the
time)
Just occasionally(less than 10% of
the time)
Never Not Applicable
Base: All drivers/riders 2016 (n=600)% of respondents
Frequency of not restraining child passengers under 7 years (OR6a)
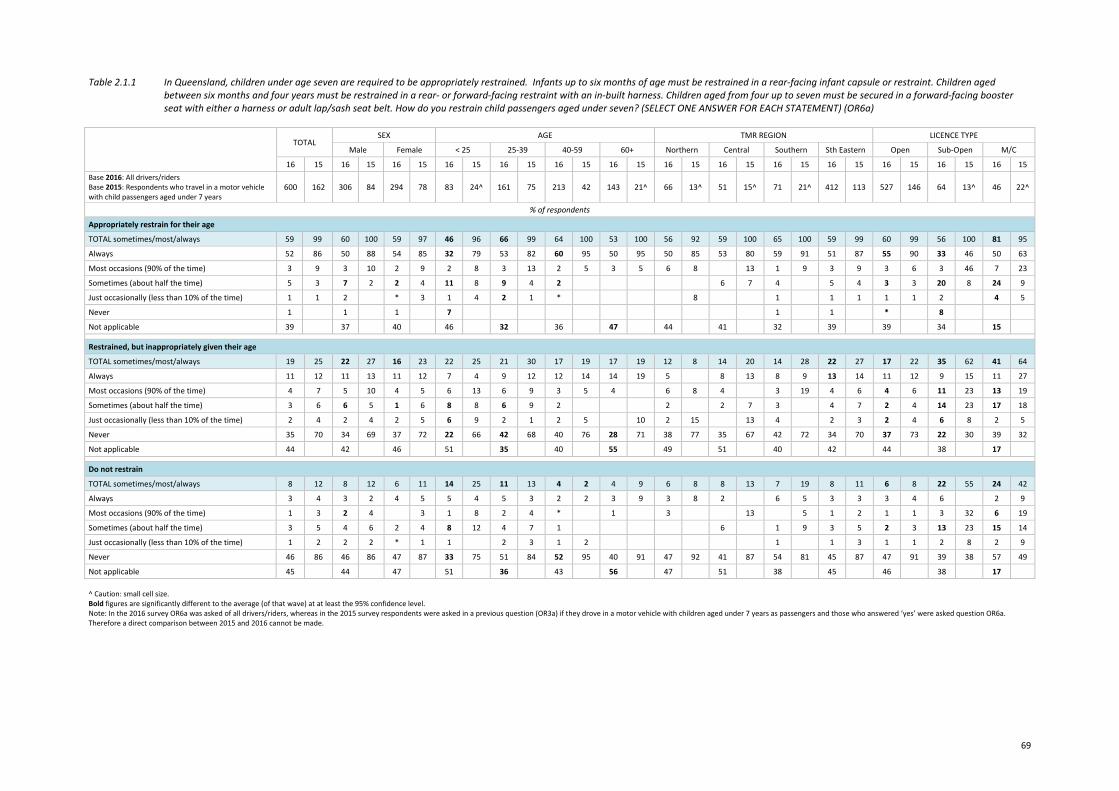
69
Table 2.1.1 In Queensland, children under age seven are required to be appropriately restrained. Infants up to six months of age must be restrained in a rear‐facing infant capsule or restraint. Children aged between six months and four years must be restrained in a rear‐ or forward‐facing restraint with an in‐built harness. Children aged from four up to seven must be secured in a forward‐facing booster seat with either a harness or adult lap/sash seat belt. How do you restrain child passengers aged under seven? (SELECT ONE ANSWER FOR EACH STATEMENT) (OR6a)
TOTAL
SEX AGE TMR REGION LICENCE TYPE
Male Female < 25 25‐39 40‐59 60+ Northern Central Southern Sth Eastern Open Sub‐Open M/C
16 15 16 15 16 15 16 15 16 15 16 15 16 15 16 15 16 15 16 15 16 15 16 15 16 15 16 15 Base 2016: All drivers/riders Base 2015: Respondents who travel in a motor vehicle with child passengers aged under 7 years
600 162 306 84 294 78 83 24^ 161 75 213 42 143 21^ 66 13^ 51 15^ 71 21^ 412 113 527 146 64 13^ 46 22^
% of respondents
Appropriately restrain for their age
TOTAL sometimes/most/always 59 99 60 100 59 97 46 96 66 99 64 100 53 100 56 92 59 100 65 100 59 99 60 99 56 100 81 95
Always 52 86 50 88 54 85 32 79 53 82 60 95 50 95 50 85 53 80 59 91 51 87 55 90 33 46 50 63
Most occasions (90% of the time) 3 9 3 10 2 9 2 8 3 13 2 5 3 5 6 8 13 1 9 3 9 3 6 3 46 7 23
Sometimes (about half the time) 5 3 7 2 2 4 11 8 9 4 2 6 7 4 5 4 3 3 20 8 24 9
Just occasionally (less than 10% of the time) 1 1 2 * 3 1 4 2 1 * 8 1 1 1 1 1 2 4 5
Never 1 1 1 7 1 1 * 8
Not applicable 39 37 40 46 32 36 47 44 41 32 39 39 34 15
Restrained, but inappropriately given their age
TOTAL sometimes/most/always 19 25 22 27 16 23 22 25 21 30 17 19 17 19 12 8 14 20 14 28 22 27 17 22 35 62 41 64
Always 11 12 11 13 11 12 7 4 9 12 12 14 14 19 5 8 13 8 9 13 14 11 12 9 15 11 27
Most occasions (90% of the time) 4 7 5 10 4 5 6 13 6 9 3 5 4 6 8 4 3 19 4 6 4 6 11 23 13 19
Sometimes (about half the time) 3 6 6 5 1 6 8 8 6 9 2 2 2 7 3 4 7 2 4 14 23 17 18
Just occasionally (less than 10% of the time) 2 4 2 4 2 5 6 9 2 1 2 5 10 2 15 13 4 2 3 2 4 6 8 2 5
Never 35 70 34 69 37 72 22 66 42 68 40 76 28 71 38 77 35 67 42 72 34 70 37 73 22 30 39 32
Not applicable 44 42 46 51 35 40 55 49 51 40 42 44 38 17
Do not restrain
TOTAL sometimes/most/always 8 12 8 12 6 11 14 25 11 13 4 2 4 9 6 8 8 13 7 19 8 11 6 8 22 55 24 42
Always 3 4 3 2 4 5 5 4 5 3 2 2 3 9 3 8 2 6 5 3 3 3 4 6 2 9
Most occasions (90% of the time) 1 3 2 4 3 1 8 2 4 * 1 3 13 5 1 2 1 1 3 32 6 19
Sometimes (about half the time) 3 5 4 6 2 4 8 12 4 7 1 6 1 9 3 5 2 3 13 23 15 14
Just occasionally (less than 10% of the time) 1 2 2 2 * 1 1 2 3 1 2 1 1 3 1 1 2 8 2 9
Never 46 86 46 86 47 87 33 75 51 84 52 95 40 91 47 92 41 87 54 81 45 87 47 91 39 38 57 49
Not applicable 45 44 47 51 36 43 56 47 51 38 45 46 38 17 ^ Caution: small cell size. Bold figures are significantly different to the average (of that wave) at at least the 95% confidence level. Note: In the 2016 survey OR6a was asked of all drivers/riders, whereas in the 2015 survey respondents were asked in a previous question (OR3a) if they drove in a motor vehicle with children aged under 7 years as passengers and those who answered ‘yes’ were asked question OR6a. Therefore a direct comparison between 2015 and 2016 cannot be made.

70
71
safer roads
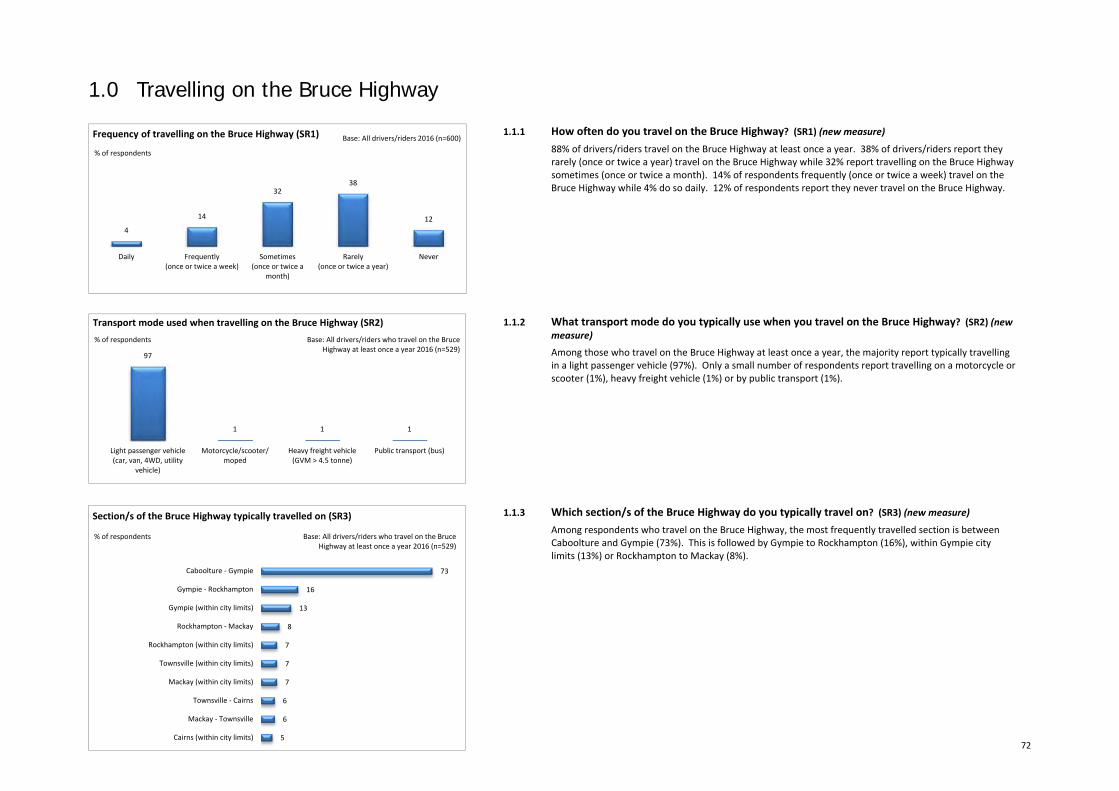
72
1.0 Travelling on the Bruce Highway
1.1.1 How often do you travel on the Bruce Highway? (SR1) (new measure)
88% of drivers/riders travel on the Bruce Highway at least once a year. 38% of drivers/riders report they rarely (once or twice a year) travel on the Bruce Highway while 32% report travelling on the Bruce Highway sometimes (once or twice a month). 14% of respondents frequently (once or twice a week) travel on the Bruce Highway while 4% do so daily. 12% of respondents report they never travel on the Bruce Highway.
1.1.2 What transport mode do you typically use when you travel on the Bruce Highway? (SR2) (new measure)
Among those who travel on the Bruce Highway at least once a year, the majority report typically travelling in a light passenger vehicle (97%). Only a small number of respondents report travelling on a motorcycle or scooter (1%), heavy freight vehicle (1%) or by public transport (1%).
1.1.3 Which section/s of the Bruce Highway do you typically travel on? (SR3) (new measure)
Among respondents who travel on the Bruce Highway, the most frequently travelled section is between Caboolture and Gympie (73%). This is followed by Gympie to Rockhampton (16%), within Gympie city limits (13%) or Rockhampton to Mackay (8%).
73
16
13
8
7
7
7
6
6
5
Caboolture ‐ Gympie
Gympie ‐ Rockhampton
Gympie (within city limits)
Rockhampton ‐ Mackay
Rockhampton (within city limits)
Townsville (within city limits)
Mackay (within city limits)
Townsville ‐ Cairns
Mackay ‐ Townsville
Cairns (within city limits)
Section/s of the Bruce Highway typically travelled on (SR3)
% of respondents Base: All drivers/riders who travel on the Bruce Highway at least once a year 2016 (n=529)
4
14
3238
12
Daily Frequently(once or twice a week)
Sometimes(once or twice a
month)
Rarely(once or twice a year)
Never
Frequency of travelling on the Bruce Highway (SR1)
% of respondents
Base: All drivers/riders 2016 (n=600)
97
1 1 1
Light passenger vehicle(car, van, 4WD, utility
vehicle)
Motorcycle/scooter/moped
Heavy freight vehicle(GVM > 4.5 tonne)
Public transport (bus)
Transport mode used when travelling on the Bruce Highway (SR2)% of respondents Base: All drivers/riders who travel on the Bruce
Highway at least once a year 2016 (n=529)
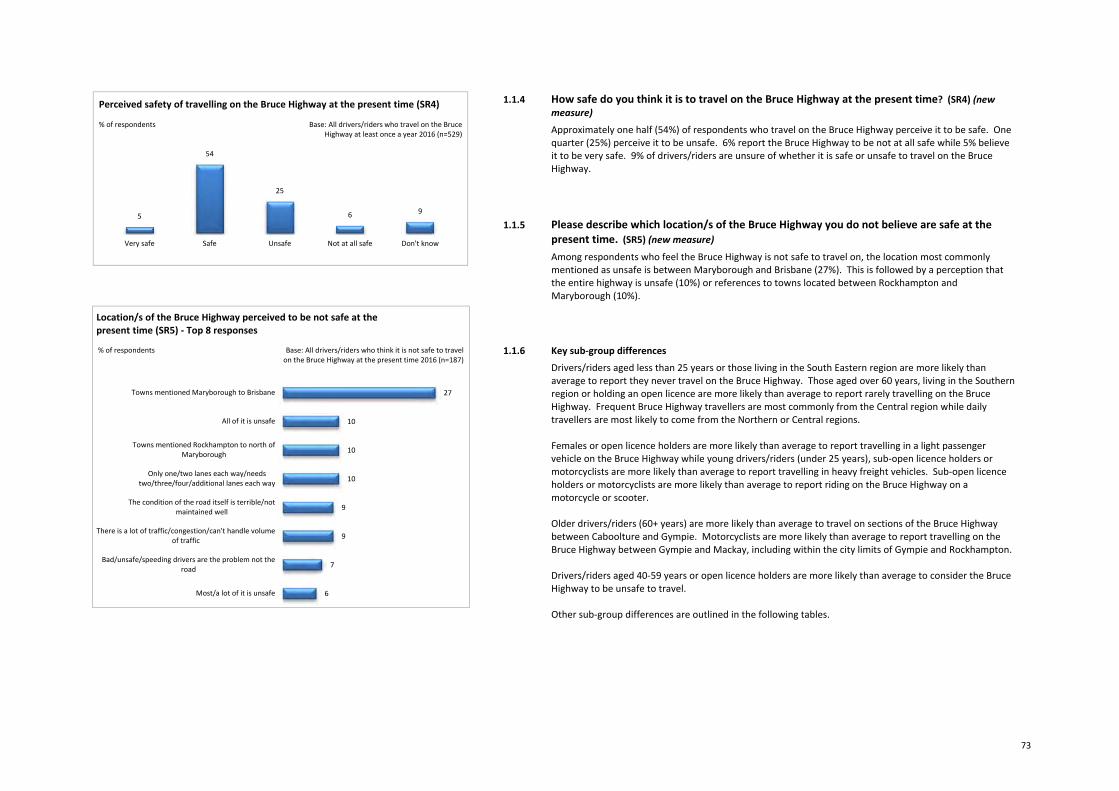
73
1.1.4 How safe do you think it is to travel on the Bruce Highway at the present time? (SR4) (new measure)
Approximately one half (54%) of respondents who travel on the Bruce Highway perceive it to be safe. One quarter (25%) perceive it to be unsafe. 6% report the Bruce Highway to be not at all safe while 5% believe it to be very safe. 9% of drivers/riders are unsure of whether it is safe or unsafe to travel on the Bruce Highway.
1.1.5 Please describe which location/s of the Bruce Highway you do not believe are safe at the present time. (SR5) (new measure)
Among respondents who feel the Bruce Highway is not safe to travel on, the location most commonly mentioned as unsafe is between Maryborough and Brisbane (27%). This is followed by a perception that the entire highway is unsafe (10%) or references to towns located between Rockhampton and Maryborough (10%).
1.1.6 Key sub‐group differences
Drivers/riders aged less than 25 years or those living in the South Eastern region are more likely than average to report they never travel on the Bruce Highway. Those aged over 60 years, living in the Southern region or holding an open licence are more likely than average to report rarely travelling on the Bruce Highway. Frequent Bruce Highway travellers are most commonly from the Central region while daily travellers are most likely to come from the Northern or Central regions. Females or open licence holders are more likely than average to report travelling in a light passenger vehicle on the Bruce Highway while young drivers/riders (under 25 years), sub‐open licence holders or motorcyclists are more likely than average to report travelling in heavy freight vehicles. Sub‐open licence holders or motorcyclists are more likely than average to report riding on the Bruce Highway on a motorcycle or scooter. Older drivers/riders (60+ years) are more likely than average to travel on sections of the Bruce Highway between Caboolture and Gympie. Motorcyclists are more likely than average to report travelling on the Bruce Highway between Gympie and Mackay, including within the city limits of Gympie and Rockhampton. Drivers/riders aged 40‐59 years or open licence holders are more likely than average to consider the Bruce Highway to be unsafe to travel. Other sub‐group differences are outlined in the following tables.
27
10
10
10
9
9
7
6
Towns mentioned Maryborough to Brisbane
All of it is unsafe
Towns mentioned Rockhampton to north ofMaryborough
Only one/two lanes each way/needstwo/three/four/additional lanes each way
The condition of the road itself is terrible/notmaintained well
There is a lot of traffic/congestion/can't handle volumeof traffic
Bad/unsafe/speeding drivers are the problem not theroad
Most/a lot of it is unsafe
Location/s of the Bruce Highway perceived to be not safe at the present time (SR5) ‐ Top 8 responses
% of respondents Base: All drivers/riders who think it is not safe to travel on the Bruce Highway at the present time 2016 (n=187)
5
54
25
6 9
Very safe Safe Unsafe Not at all safe Don't know
% of respondents Base: All drivers/riders who travel on the Bruce Highway at least once a year 2016 (n=529)
Perceived safety of travelling on the Bruce Highway at the present time (SR4)
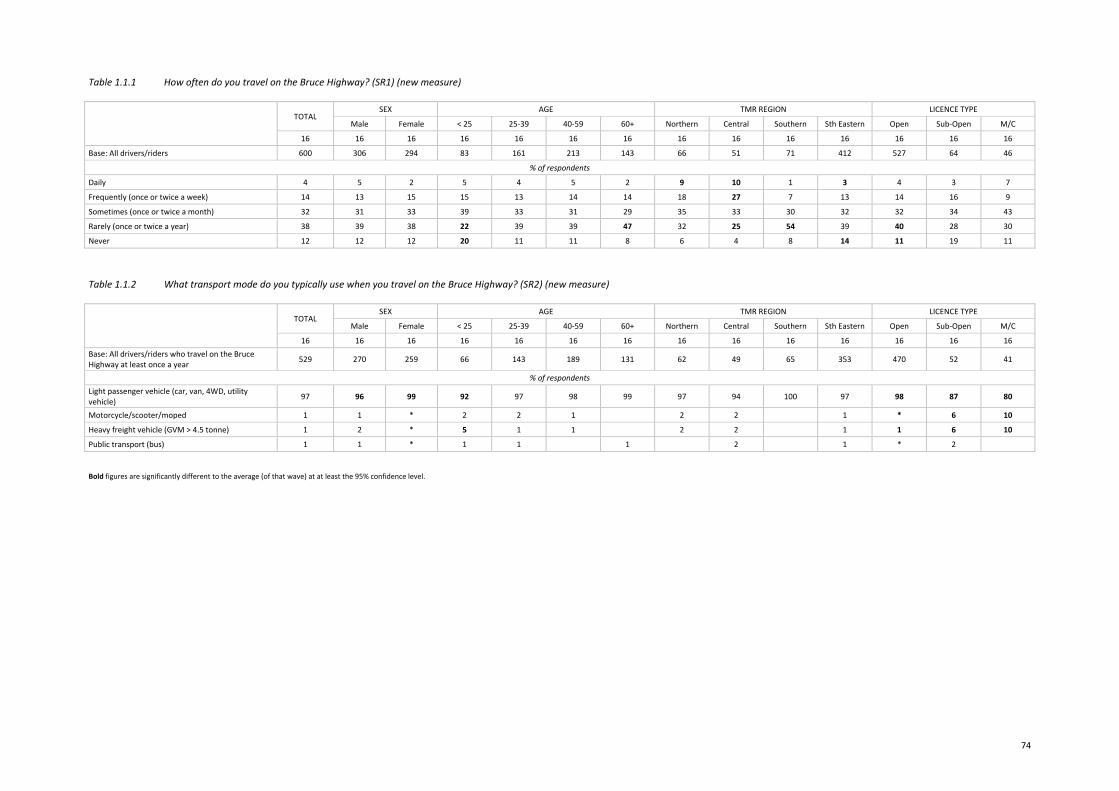
74
Table 1.1.1 How often do you travel on the Bruce Highway? (SR1) (new measure)
TOTAL
SEX AGE TMR REGION LICENCE TYPE
Male Female < 25 25‐39 40‐59 60+ Northern Central Southern Sth Eastern Open Sub‐Open M/C
16 16 16 16 16 16 16 16 16 16 16 16 16 16
Base: All drivers/riders 600 306 294 83 161 213 143 66 51 71 412 527 64 46
% of respondents
Daily 4 5 2 5 4 5 2 9 10 1 3 4 3 7
Frequently (once or twice a week) 14 13 15 15 13 14 14 18 27 7 13 14 16 9
Sometimes (once or twice a month) 32 31 33 39 33 31 29 35 33 30 32 32 34 43
Rarely (once or twice a year) 38 39 38 22 39 39 47 32 25 54 39 40 28 30
Never 12 12 12 20 11 11 8 6 4 8 14 11 19 11 Table 1.1.2 What transport mode do you typically use when you travel on the Bruce Highway? (SR2) (new measure)
TOTAL
SEX AGE TMR REGION LICENCE TYPE
Male Female < 25 25‐39 40‐59 60+ Northern Central Southern Sth Eastern Open Sub‐Open M/C
16 16 16 16 16 16 16 16 16 16 16 16 16 16 Base: All drivers/riders who travel on the Bruce Highway at least once a year 529 270 259 66 143 189 131 62 49 65 353 470 52 41
% of respondents Light passenger vehicle (car, van, 4WD, utility vehicle) 97 96 99 92 97 98 99 97 94 100 97 98 87 80
Motorcycle/scooter/moped 1 1 * 2 2 1 2 2 1 * 6 10
Heavy freight vehicle (GVM > 4.5 tonne) 1 2 * 5 1 1 2 2 1 1 6 10
Public transport (bus) 1 1 * 1 1 1 2 1 * 2 Bold figures are significantly different to the average (of that wave) at at least the 95% confidence level.
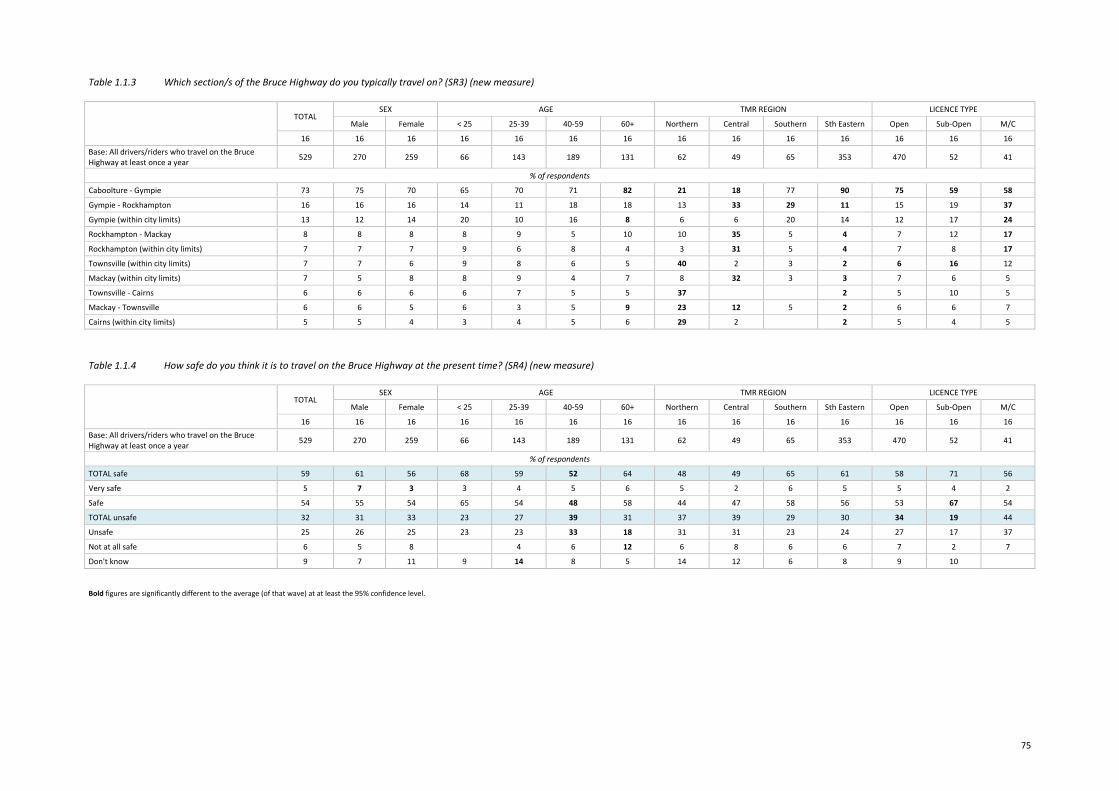
75
Table 1.1.3 Which section/s of the Bruce Highway do you typically travel on? (SR3) (new measure)
TOTAL
SEX AGE TMR REGION LICENCE TYPE
Male Female < 25 25‐39 40‐59 60+ Northern Central Southern Sth Eastern Open Sub‐Open M/C
16 16 16 16 16 16 16 16 16 16 16 16 16 16 Base: All drivers/riders who travel on the Bruce Highway at least once a year 529 270 259 66 143 189 131 62 49 65 353 470 52 41
% of respondents
Caboolture ‐ Gympie 73 75 70 65 70 71 82 21 18 77 90 75 59 58
Gympie ‐ Rockhampton 16 16 16 14 11 18 18 13 33 29 11 15 19 37
Gympie (within city limits) 13 12 14 20 10 16 8 6 6 20 14 12 17 24
Rockhampton ‐ Mackay 8 8 8 8 9 5 10 10 35 5 4 7 12 17
Rockhampton (within city limits) 7 7 7 9 6 8 4 3 31 5 4 7 8 17
Townsville (within city limits) 7 7 6 9 8 6 5 40 2 3 2 6 16 12
Mackay (within city limits) 7 5 8 8 9 4 7 8 32 3 3 7 6 5
Townsville ‐ Cairns 6 6 6 6 7 5 5 37 2 5 10 5
Mackay ‐ Townsville 6 6 5 6 3 5 9 23 12 5 2 6 6 7
Cairns (within city limits) 5 5 4 3 4 5 6 29 2 2 5 4 5 Table 1.1.4 How safe do you think it is to travel on the Bruce Highway at the present time? (SR4) (new measure)
TOTAL
SEX AGE TMR REGION LICENCE TYPE
Male Female < 25 25‐39 40‐59 60+ Northern Central Southern Sth Eastern Open Sub‐Open M/C
16 16 16 16 16 16 16 16 16 16 16 16 16 16 Base: All drivers/riders who travel on the Bruce Highway at least once a year 529 270 259 66 143 189 131 62 49 65 353 470 52 41
% of respondents
TOTAL safe 59 61 56 68 59 52 64 48 49 65 61 58 71 56
Very safe 5 7 3 3 4 5 6 5 2 6 5 5 4 2
Safe 54 55 54 65 54 48 58 44 47 58 56 53 67 54
TOTAL unsafe 32 31 33 23 27 39 31 37 39 29 30 34 19 44
Unsafe 25 26 25 23 23 33 18 31 31 23 24 27 17 37
Not at all safe 6 5 8 4 6 12 6 8 6 6 7 2 7
Don't know 9 7 11 9 14 8 5 14 12 6 8 9 10 Bold figures are significantly different to the average (of that wave) at at least the 95% confidence level.
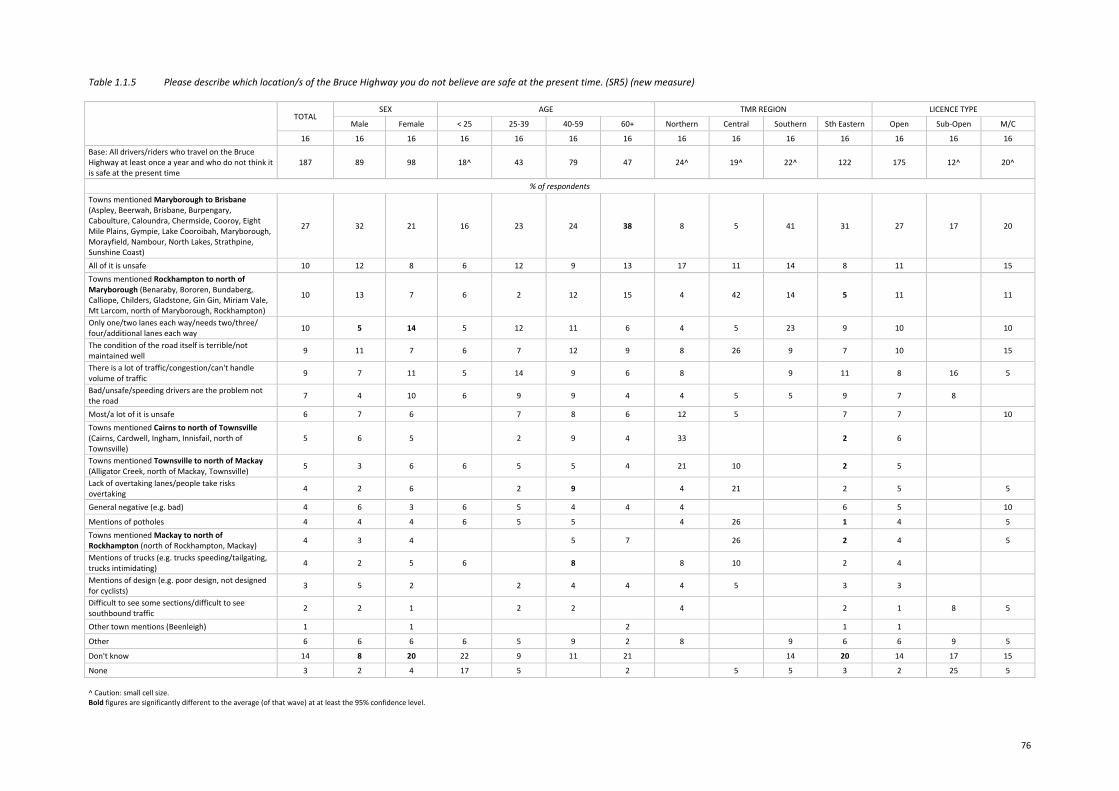
76
Table 1.1.5 Please describe which location/s of the Bruce Highway you do not believe are safe at the present time. (SR5) (new measure)
TOTAL
SEX AGE TMR REGION LICENCE TYPE
Male Female < 25 25‐39 40‐59 60+ Northern Central Southern Sth Eastern Open Sub‐Open M/C
16 16 16 16 16 16 16 16 16 16 16 16 16 16 Base: All drivers/riders who travel on the Bruce Highway at least once a year and who do not think it is safe at the present time
187 89 98 18^ 43 79 47 24^ 19^ 22^ 122 175 12^ 20^
% of respondents Towns mentioned Maryborough to Brisbane (Aspley, Beerwah, Brisbane, Burpengary, Caboulture, Caloundra, Chermside, Cooroy, Eight Mile Plains, Gympie, Lake Cooroibah, Maryborough, Morayfield, Nambour, North Lakes, Strathpine, Sunshine Coast)
27 32 21 16 23 24 38 8 5 41 31 27 17 20
All of it is unsafe 10 12 8 6 12 9 13 17 11 14 8 11 15 Towns mentioned Rockhampton to north of Maryborough (Benaraby, Bororen, Bundaberg, Calliope, Childers, Gladstone, Gin Gin, Miriam Vale, Mt Larcom, north of Maryborough, Rockhampton)
10 13 7 6 2 12 15 4 42 14 5 11 11
Only one/two lanes each way/needs two/three/ four/additional lanes each way 10 5 14 5 12 11 6 4 5 23 9 10 10
The condition of the road itself is terrible/not maintained well 9 11 7 6 7 12 9 8 26 9 7 10 15
There is a lot of traffic/congestion/can't handle volume of traffic 9 7 11 5 14 9 6 8 9 11 8 16 5
Bad/unsafe/speeding drivers are the problem not the road 7 4 10 6 9 9 4 4 5 5 9 7 8
Most/a lot of it is unsafe 6 7 6 7 8 6 12 5 7 7 10 Towns mentioned Cairns to north of Townsville (Cairns, Cardwell, Ingham, Innisfail, north of Townsville)
5 6 5 2 9 4 33 2 6
Towns mentioned Townsville to north of Mackay (Alligator Creek, north of Mackay, Townsville) 5 3 6 6 5 5 4 21 10 2 5
Lack of overtaking lanes/people take risks overtaking 4 2 6 2 9 4 21 2 5 5
General negative (e.g. bad) 4 6 3 6 5 4 4 4 6 5 10
Mentions of potholes 4 4 4 6 5 5 4 26 1 4 5 Towns mentioned Mackay to north of Rockhampton (north of Rockhampton, Mackay) 4 3 4 5 7 26 2 4 5
Mentions of trucks (e.g. trucks speeding/tailgating, trucks intimidating) 4 2 5 6 8 8 10 2 4
Mentions of design (e.g. poor design, not designed for cyclists) 3 5 2 2 4 4 4 5 3 3
Difficult to see some sections/difficult to see southbound traffic 2 2 1 2 2 4 2 1 8 5
Other town mentions (Beenleigh) 1 1 2 1 1
Other 6 6 6 6 5 9 2 8 9 6 6 9 5
Don't know 14 8 20 22 9 11 21 14 20 14 17 15
None 3 2 4 17 5 2 5 5 3 2 25 5 ^ Caution: small cell size. Bold figures are significantly different to the average (of that wave) at at least the 95% confidence level.

77
cycling
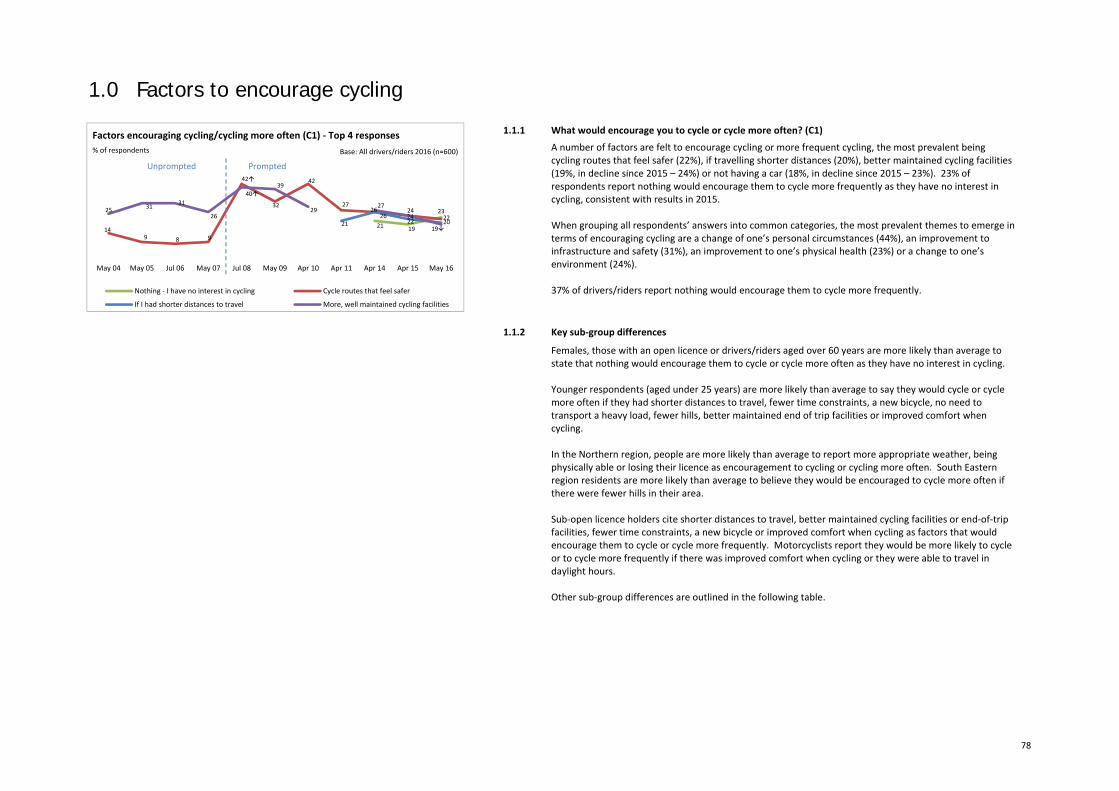
78
1.0 Factors to encourage cycling
1.1.1 What would encourage you to cycle or cycle more often? (C1)
A number of factors are felt to encourage cycling or more frequent cycling, the most prevalent being cycling routes that feel safer (22%), if travelling shorter distances (20%), better maintained cycling facilities (19%, in decline since 2015 – 24%) or not having a car (18%, in decline since 2015 – 23%). 23% of respondents report nothing would encourage them to cycle more frequently as they have no interest in cycling, consistent with results in 2015. When grouping all respondents’ answers into common categories, the most prevalent themes to emerge in terms of encouraging cycling are a change of one’s personal circumstances (44%), an improvement to infrastructure and safety (31%), an improvement to one’s physical health (23%) or a change to one’s environment (24%). 37% of drivers/riders report nothing would encourage them to cycle more frequently.
1.1.2 Key sub‐group differences
Females, those with an open licence or drivers/riders aged over 60 years are more likely than average to state that nothing would encourage them to cycle or cycle more often as they have no interest in cycling. Younger respondents (aged under 25 years) are more likely than average to say they would cycle or cycle more often if they had shorter distances to travel, fewer time constraints, a new bicycle, no need to transport a heavy load, fewer hills, better maintained end of trip facilities or improved comfort when cycling. In the Northern region, people are more likely than average to report more appropriate weather, being physically able or losing their licence as encouragement to cycling or cycling more often. South Eastern region residents are more likely than average to believe they would be encouraged to cycle more often if there were fewer hills in their area. Sub‐open licence holders cite shorter distances to travel, better maintained cycling facilities or end‐of‐trip facilities, fewer time constraints, a new bicycle or improved comfort when cycling as factors that would encourage them to cycle or cycle more frequently. Motorcyclists report they would be more likely to cycle or to cycle more frequently if there was improved comfort when cycling or they were able to travel in daylight hours. Other sub‐group differences are outlined in the following table.
23
192122
2426
27
42
32
42
98914
2022
26
2119
24
2729
3940
26
313125
May 16Apr 15Apr 14Apr 11Apr 10May 09Jul 08May 07Jul 06May 05May 04
Nothing ‐ I have no interest in cycling Cycle routes that feel safer
If I had shorter distances to travel More, well maintained cycling facilities
% of respondents
Unprompted Prompted
Factors encouraging cycling/cycling more often (C1) ‐ Top 4 responsesBase: All drivers/riders 2016 (n=600)
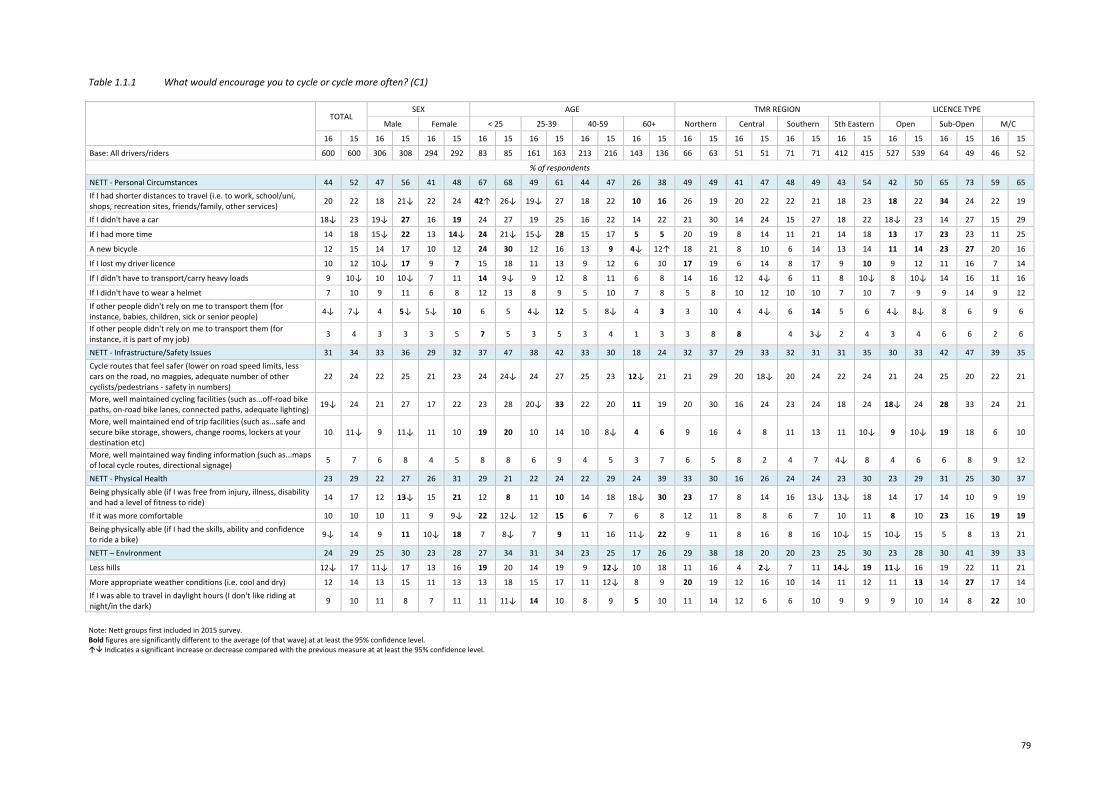
79
Table 1.1.1 What would encourage you to cycle or cycle more often? (C1)
TOTAL
SEX AGE TMR REGION LICENCE TYPE
Male Female < 25 25‐39 40‐59 60+ Northern Central Southern Sth Eastern Open Sub‐Open M/C
16 15 16 15 16 15 16 15 16 15 16 15 16 15 16 15 16 15 16 15 16 15 16 15 16 15 16 15
Base: All drivers/riders 600 600 306 308 294 292 83 85 161 163 213 216 143 136 66 63 51 51 71 71 412 415 527 539 64 49 46 52
% of respondents
NETT ‐ Personal Circumstances 44 52 47 56 41 48 67 68 49 61 44 47 26 38 49 49 41 47 48 49 43 54 42 50 65 73 59 65 If I had shorter distances to travel (i.e. to work, school/uni, shops, recreation sites, friends/family, other services) 20 22 18 21↓ 22 24 42↑ 26↓ 19↓ 27 18 22 10 16 26 19 20 22 22 21 18 23 18 22 34 24 22 19
If I didn't have a car 18↓ 23 19↓ 27 16 19 24 27 19 25 16 22 14 22 21 30 14 24 15 27 18 22 18↓ 23 14 27 15 29
If I had more time 14 18 15↓ 22 13 14↓ 24 21↓ 15↓ 28 15 17 5 5 20 19 8 14 11 21 14 18 13 17 23 23 11 25
A new bicycle 12 15 14 17 10 12 24 30 12 16 13 9 4↓ 12↑ 18 21 8 10 6 14 13 14 11 14 23 27 20 16
If I lost my driver licence 10 12 10↓ 17 9 7 15 18 11 13 9 12 6 10 17 19 6 14 8 17 9 10 9 12 11 16 7 14
If I didn't have to transport/carry heavy loads 9 10↓ 10 10↓ 7 11 14 9↓ 9 12 8 11 6 8 14 16 12 4↓ 6 11 8 10↓ 8 10↓ 14 16 11 16
If I didn't have to wear a helmet 7 10 9 11 6 8 12 13 8 9 5 10 7 8 5 8 10 12 10 10 7 10 7 9 9 14 9 12 If other people didn't rely on me to transport them (for instance, babies, children, sick or senior people) 4↓ 7↓ 4 5↓ 5↓ 10 6 5 4↓ 12 5 8↓ 4 3 3 10 4 4↓ 6 14 5 6 4↓ 8↓ 8 6 9 6
If other people didn't rely on me to transport them (for instance, it is part of my job) 3 4 3 3 3 5 7 5 3 5 3 4 1 3 3 8 8 4 3↓ 2 4 3 4 6 6 2 6
NETT ‐ Infrastructure/Safety Issues 31 34 33 36 29 32 37 47 38 42 33 30 18 24 32 37 29 33 32 31 31 35 30 33 42 47 39 35 Cycle routes that feel safer (lower on road speed limits, less cars on the road, no magpies, adequate number of other cyclists/pedestrians ‐ safety in numbers)
22 24 22 25 21 23 24 24↓ 24 27 25 23 12↓ 21 21 29 20 18↓ 20 24 22 24 21 24 25 20 22 21
More, well maintained cycling facilities (such as...off‐road bike paths, on‐road bike lanes, connected paths, adequate lighting) 19↓ 24 21 27 17 22 23 28 20↓ 33 22 20 11 19 20 30 16 24 23 24 18 24 18↓ 24 28 33 24 21
More, well maintained end of trip facilities (such as...safe and secure bike storage, showers, change rooms, lockers at your destination etc)
10 11↓ 9 11↓ 11 10 19 20 10 14 10 8↓ 4 6 9 16 4 8 11 13 11 10↓ 9 10↓ 19 18 6 10
More, well maintained way finding information (such as...maps of local cycle routes, directional signage) 5 7 6 8 4 5 8 8 6 9 4 5 3 7 6 5 8 2 4 7 4↓ 8 4 6 6 8 9 12
NETT ‐ Physical Health 23 29 22 27 26 31 29 21 22 24 22 29 24 39 33 30 16 26 24 24 23 30 23 29 31 25 30 37 Being physically able (if I was free from injury, illness, disability and had a level of fitness to ride) 14 17 12 13↓ 15 21 12 8 11 10 14 18 18↓ 30 23 17 8 14 16 13↓ 13↓ 18 14 17 14 10 9 19
If it was more comfortable 10 10 10 11 9 9↓ 22 12↓ 12 15 6 7 6 8 12 11 8 8 6 7 10 11 8 10 23 16 19 19 Being physically able (if I had the skills, ability and confidence to ride a bike) 9↓ 14 9 11 10↓ 18 7 8↓ 7 9 11 16 11↓ 22 9 11 8 16 8 16 10↓ 15 10↓ 15 5 8 13 21
NETT – Environment 24 29 25 30 23 28 27 34 31 34 23 25 17 26 29 38 18 20 20 23 25 30 23 28 30 41 39 33
Less hills 12↓ 17 11↓ 17 13 16 19 20 14 19 9 12↓ 10 18 11 16 4 2↓ 7 11 14↓ 19 11↓ 16 19 22 11 21
More appropriate weather conditions (i.e. cool and dry) 12 14 13 15 11 13 13 18 15 17 11 12↓ 8 9 20 19 12 16 10 14 11 12 11 13 14 27 17 14 If I was able to travel in daylight hours (I don't like riding at night/in the dark) 9 10 11 8 7 11 11 11↓ 14 10 8 9 5 10 11 14 12 6 6 10 9 9 9 10 14 8 22 10
Note: Nett groups first included in 2015 survey. Bold figures are significantly different to the average (of that wave) at at least the 95% confidence level. Indicates a significant increase or decrease compared with the previous measure at at least the 95% confidence level.
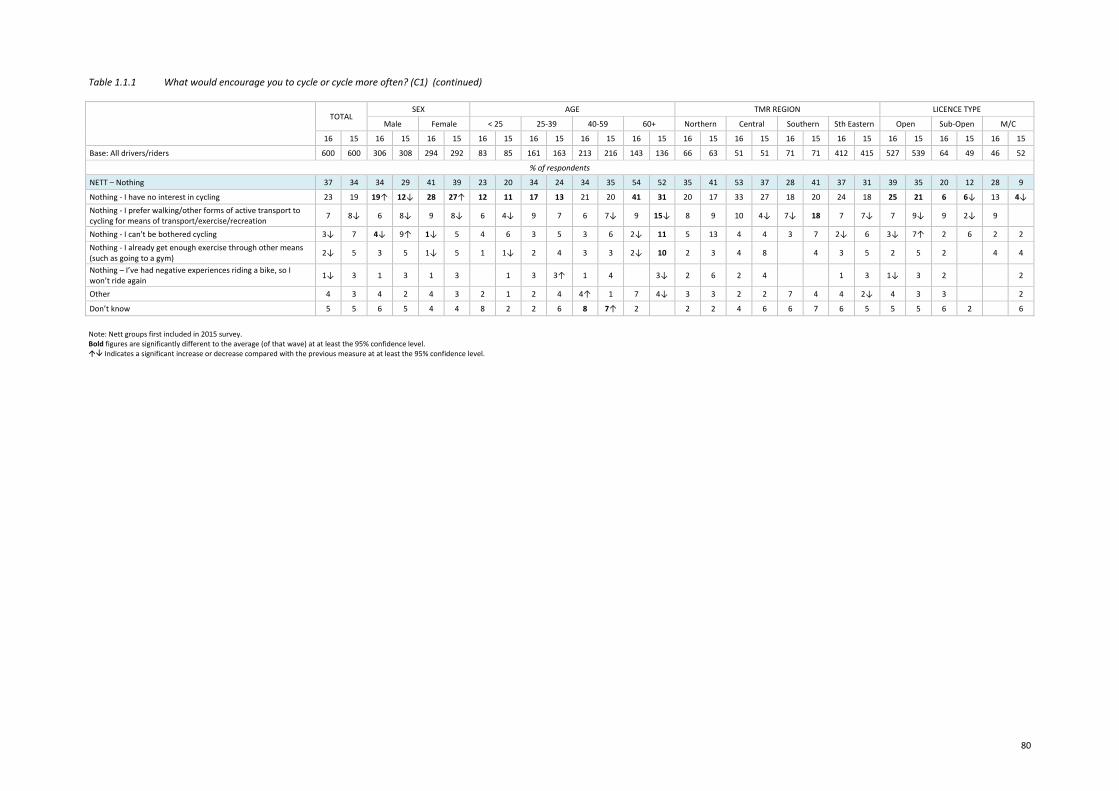
80
Table 1.1.1 What would encourage you to cycle or cycle more often? (C1) (continued)
TOTAL
SEX AGE TMR REGION LICENCE TYPE
Male Female < 25 25‐39 40‐59 60+ Northern Central Southern Sth Eastern Open Sub‐Open M/C
16 15 16 15 16 15 16 15 16 15 16 15 16 15 16 15 16 15 16 15 16 15 16 15 16 15 16 15
Base: All drivers/riders 600 600 306 308 294 292 83 85 161 163 213 216 143 136 66 63 51 51 71 71 412 415 527 539 64 49 46 52
% of respondents
NETT – Nothing 37 34 34 29 41 39 23 20 34 24 34 35 54 52 35 41 53 37 28 41 37 31 39 35 20 12 28 9
Nothing ‐ I have no interest in cycling 23 19 19↑ 12↓ 28 27↑ 12 11 17 13 21 20 41 31 20 17 33 27 18 20 24 18 25 21 6 6↓ 13 4↓ Nothing ‐ I prefer walking/other forms of active transport to cycling for means of transport/exercise/recreation 7 8↓ 6 8↓ 9 8↓ 6 4↓ 9 7 6 7↓ 9 15↓ 8 9 10 4↓ 7↓ 18 7 7↓ 7 9↓ 9 2↓ 9
Nothing ‐ I can't be bothered cycling 3↓ 7 4↓ 9↑ 1↓ 5 4 6 3 5 3 6 2↓ 11 5 13 4 4 3 7 2↓ 6 3↓ 7↑ 2 6 2 2 Nothing ‐ I already get enough exercise through other means (such as going to a gym) 2↓ 5 3 5 1↓ 5 1 1↓ 2 4 3 3 2↓ 10 2 3 4 8 4 3 5 2 5 2 4 4
Nothing – I’ve had negative experiences riding a bike, so I won’t ride again 1↓ 3 1 3 1 3 1 3 3↑ 1 4 3↓ 2 6 2 4 1 3 1↓ 3 2 2
Other 4 3 4 2 4 3 2 1 2 4 4↑ 1 7 4↓ 3 3 2 2 7 4 4 2↓ 4 3 3 2
Don’t know 5 5 6 5 4 4 8 2 2 6 8 7↑ 2 2 2 4 6 6 7 6 5 5 5 6 2 6
Note: Nett groups first included in 2015 survey. Bold figures are significantly different to the average (of that wave) at at least the 95% confidence level. Indicates a significant increase or decrease compared with the previous measure at at least the 95% confidence level.
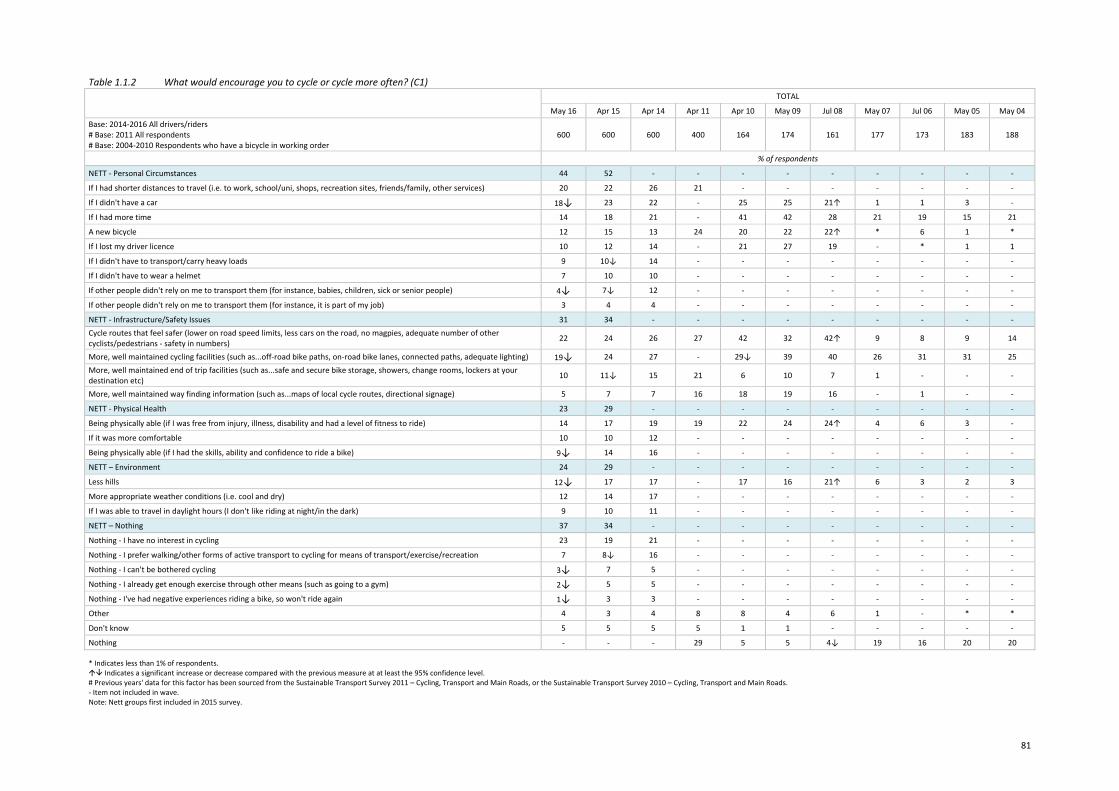
81
Table 1.1.2 What would encourage you to cycle or cycle more often? (C1)
TOTAL
May 16 Apr 15 Apr 14 Apr 11 Apr 10 May 09 Jul 08 May 07 Jul 06 May 05 May 04 Base: 2014‐2016 All drivers/riders # Base: 2011 All respondents # Base: 2004‐2010 Respondents who have a bicycle in working order
600 600 600 400 164 174 161 177 173 183 188
% of respondents
NETT ‐ Personal Circumstances 44 52 ‐ ‐ ‐ ‐ ‐ ‐ ‐ ‐ ‐
If I had shorter distances to travel (i.e. to work, school/uni, shops, recreation sites, friends/family, other services) 20 22 26 21 ‐ ‐ ‐ ‐ ‐ ‐ ‐
If I didn't have a car 18↓ 23 22 ‐ 25 25 21↑ 1 1 3 ‐
If I had more time 14 18 21 ‐ 41 42 28 21 19 15 21
A new bicycle 12 15 13 24 20 22 22↑ * 6 1 *
If I lost my driver licence 10 12 14 ‐ 21 27 19 ‐ * 1 1
If I didn't have to transport/carry heavy loads 9 10↓ 14 ‐ ‐ ‐ ‐ ‐ ‐ ‐ ‐
If I didn't have to wear a helmet 7 10 10 ‐ ‐ ‐ ‐ ‐ ‐ ‐ ‐
If other people didn't rely on me to transport them (for instance, babies, children, sick or senior people) 4↓ 7↓ 12 ‐ ‐ ‐ ‐ ‐ ‐ ‐ ‐
If other people didn't rely on me to transport them (for instance, it is part of my job) 3 4 4 ‐ ‐ ‐ ‐ ‐ ‐ ‐ ‐
NETT ‐ Infrastructure/Safety Issues 31 34 ‐ ‐ ‐ ‐ ‐ ‐ ‐ ‐ ‐ Cycle routes that feel safer (lower on road speed limits, less cars on the road, no magpies, adequate number of other cyclists/pedestrians ‐ safety in numbers) 22 24 26 27 42 32 42↑ 9 8 9 14
More, well maintained cycling facilities (such as...off‐road bike paths, on‐road bike lanes, connected paths, adequate lighting) 19↓ 24 27 ‐ 29↓ 39 40 26 31 31 25 More, well maintained end of trip facilities (such as...safe and secure bike storage, showers, change rooms, lockers at your destination etc) 10 11↓ 15 21 6 10 7 1 ‐ ‐ ‐
More, well maintained way finding information (such as...maps of local cycle routes, directional signage) 5 7 7 16 18 19 16 ‐ 1 ‐ ‐
NETT ‐ Physical Health 23 29 ‐ ‐ ‐ ‐ ‐ ‐ ‐ ‐ ‐
Being physically able (if I was free from injury, illness, disability and had a level of fitness to ride) 14 17 19 19 22 24 24↑ 4 6 3 ‐
If it was more comfortable 10 10 12 ‐ ‐ ‐ ‐ ‐ ‐ ‐ ‐
Being physically able (if I had the skills, ability and confidence to ride a bike) 9↓ 14 16 ‐ ‐ ‐ ‐ ‐ ‐ ‐ ‐
NETT – Environment 24 29 ‐ ‐ ‐ ‐ ‐ ‐ ‐ ‐ ‐
Less hills 12↓ 17 17 ‐ 17 16 21↑ 6 3 2 3
More appropriate weather conditions (i.e. cool and dry) 12 14 17 ‐ ‐ ‐ ‐ ‐ ‐ ‐ ‐
If I was able to travel in daylight hours (I don't like riding at night/in the dark) 9 10 11 ‐ ‐ ‐ ‐ ‐ ‐ ‐ ‐
NETT – Nothing 37 34 ‐ ‐ ‐ ‐ ‐ ‐ ‐ ‐ ‐
Nothing ‐ I have no interest in cycling 23 19 21 ‐ ‐ ‐ ‐ ‐ ‐ ‐ ‐
Nothing ‐ I prefer walking/other forms of active transport to cycling for means of transport/exercise/recreation 7 8↓ 16 ‐ ‐ ‐ ‐ ‐ ‐ ‐ ‐
Nothing ‐ I can't be bothered cycling 3↓ 7 5 ‐ ‐ ‐ ‐ ‐ ‐ ‐ ‐
Nothing ‐ I already get enough exercise through other means (such as going to a gym) 2↓ 5 5 ‐ ‐ ‐ ‐ ‐ ‐ ‐ ‐
Nothing ‐ I've had negative experiences riding a bike, so won't ride again 1↓ 3 3 ‐ ‐ ‐ ‐ ‐ ‐ ‐ ‐
Other 4 3 4 8 8 4 6 1 ‐ * *
Don't know 5 5 5 5 1 1 ‐ ‐ ‐ ‐ ‐
Nothing ‐ ‐ ‐ 29 5 5 4↓ 19 16 20 20
* Indicates less than 1% of respondents. Indicates a significant increase or decrease compared with the previous measure at at least the 95% confidence level. # Previous years' data for this factor has been sourced from the Sustainable Transport Survey 2011 – Cycling, Transport and Main Roads, or the Sustainable Transport Survey 2010 – Cycling, Transport and Main Roads. ‐ Item not included in wave. Note: Nett groups first included in 2015 survey.
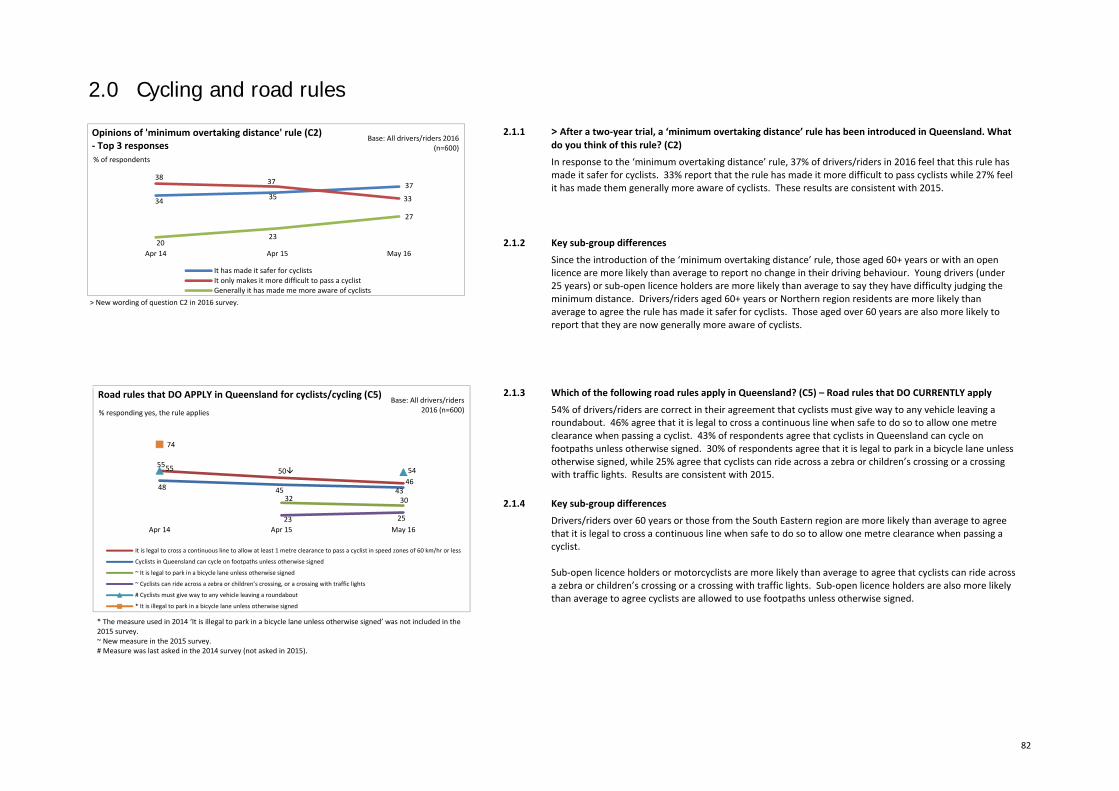
82
2.0 Cycling and road rules
2.1.1 > After a two‐year trial, a ‘minimum overtaking distance’ rule has been introduced in Queensland. What do you think of this rule? (C2)
In response to the ‘minimum overtaking distance’ rule, 37% of drivers/riders in 2016 feel that this rule has made it safer for cyclists. 33% report that the rule has made it more difficult to pass cyclists while 27% feel it has made them generally more aware of cyclists. These results are consistent with 2015.
2.1.2 Key sub‐group differences
Since the introduction of the ‘minimum overtaking distance’ rule, those aged 60+ years or with an open licence are more likely than average to report no change in their driving behaviour. Young drivers (under 25 years) or sub‐open licence holders are more likely than average to say they have difficulty judging the minimum distance. Drivers/riders aged 60+ years or Northern region residents are more likely than average to agree the rule has made it safer for cyclists. Those aged over 60 years are also more likely to report that they are now generally more aware of cyclists.
2.1.3 Which of the following road rules apply in Queensland? (C5) – Road rules that DO CURRENTLY apply
54% of drivers/riders are correct in their agreement that cyclists must give way to any vehicle leaving a roundabout. 46% agree that it is legal to cross a continuous line when safe to do so to allow one metre clearance when passing a cyclist. 43% of respondents agree that cyclists in Queensland can cycle on footpaths unless otherwise signed. 30% of respondents agree that it is legal to park in a bicycle lane unless otherwise signed, while 25% agree that cyclists can ride across a zebra or children’s crossing or a crossing with traffic lights. Results are consistent with 2015.
2.1.4 Key sub‐group differences
Drivers/riders over 60 years or those from the South Eastern region are more likely than average to agree that it is legal to cross a continuous line when safe to do so to allow one metre clearance when passing a cyclist. Sub‐open licence holders or motorcyclists are more likely than average to agree that cyclists can ride across a zebra or children’s crossing or a crossing with traffic lights. Sub‐open licence holders are also more likely than average to agree cyclists are allowed to use footpaths unless otherwise signed.
* The measure used in 2014 ‘It is illegal to park in a bicycle lane unless otherwise signed’ was not included in the 2015 survey. ~ New measure in the 2015 survey. # Measure was last asked in the 2014 survey (not asked in 2015).
34 3537
38 37
33
2023
27
Apr 14 Apr 15 May 16
Opinions of 'minimum overtaking distance' rule (C2)‐ Top 3 responses
It has made it safer for cyclistsIt only makes it more difficult to pass a cyclistGenerally it has made me more aware of cyclists
% of respondents
Base: All drivers/riders 2016 (n=600)
465055
434548
3032
2523
5455
74
May 16Apr 15Apr 14
Road rules that DO APPLY in Queensland for cyclists/cycling (C5)
It is legal to cross a continuous line to allow at least 1 metre clearance to pass a cyclist in speed zones of 60 km/hr or less
Cyclists in Queensland can cycle on footpaths unless otherwise signed
~ It is legal to park in a bicycle lane unless otherwise signed
~ Cyclists can ride across a zebra or children’s crossing, or a crossing with traffic lights
# Cyclists must give way to any vehicle leaving a roundabout
* It is illegal to park in a bicycle lane unless otherwise signed
Base: All drivers/riders2016 (n=600)% responding yes, the rule applies
> New wording of question C2 in 2016 survey.
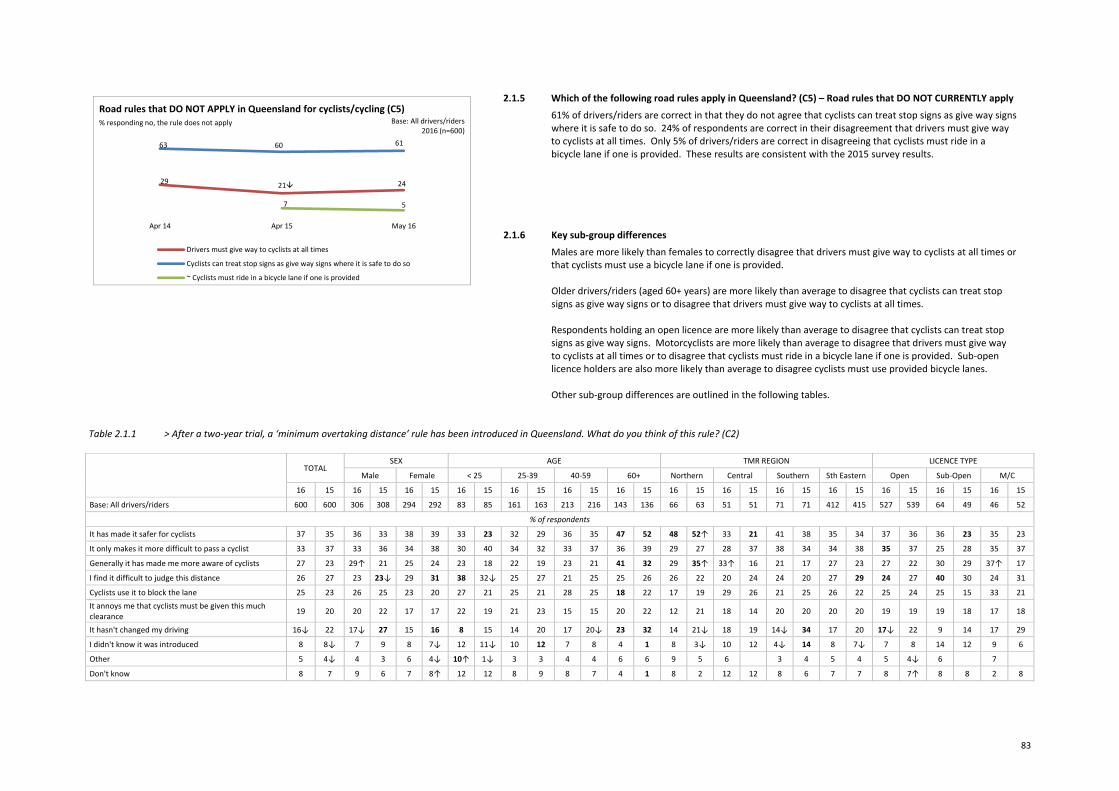
83
2.1.5 Which of the following road rules apply in Queensland? (C5) – Road rules that DO NOT CURRENTLY apply
61% of drivers/riders are correct in that they do not agree that cyclists can treat stop signs as give way signs where it is safe to do so. 24% of respondents are correct in their disagreement that drivers must give way to cyclists at all times. Only 5% of drivers/riders are correct in disagreeing that cyclists must ride in a bicycle lane if one is provided. These results are consistent with the 2015 survey results.
2.1.6 Key sub‐group differences
Males are more likely than females to correctly disagree that drivers must give way to cyclists at all times or that cyclists must use a bicycle lane if one is provided. Older drivers/riders (aged 60+ years) are more likely than average to disagree that cyclists can treat stop signs as give way signs or to disagree that drivers must give way to cyclists at all times. Respondents holding an open licence are more likely than average to disagree that cyclists can treat stop signs as give way signs. Motorcyclists are more likely than average to disagree that drivers must give way to cyclists at all times or to disagree that cyclists must ride in a bicycle lane if one is provided. Sub‐open licence holders are also more likely than average to disagree cyclists must use provided bicycle lanes. Other sub‐group differences are outlined in the following tables.
Table 2.1.1 > After a two‐year trial, a ‘minimum overtaking distance’ rule has been introduced in Queensland. What do you think of this rule? (C2)
TOTAL
SEX AGE TMR REGION LICENCE TYPE
Male Female < 25 25‐39 40‐59 60+ Northern Central Southern Sth Eastern Open Sub‐Open M/C
16 15 16 15 16 15 16 15 16 15 16 15 16 15 16 15 16 15 16 15 16 15 16 15 16 15 16 15
Base: All drivers/riders 600 600 306 308 294 292 83 85 161 163 213 216 143 136 66 63 51 51 71 71 412 415 527 539 64 49 46 52
% of respondents
It has made it safer for cyclists 37 35 36 33 38 39 33 23 32 29 36 35 47 52 48 52↑ 33 21 41 38 35 34 37 36 36 23 35 23
It only makes it more difficult to pass a cyclist 33 37 33 36 34 38 30 40 34 32 33 37 36 39 29 27 28 37 38 34 34 38 35 37 25 28 35 37
Generally it has made me more aware of cyclists 27 23 29↑ 21 25 24 23 18 22 19 23 21 41 32 29 35↑ 33↑ 16 21 17 27 23 27 22 30 29 37↑ 17
I find it difficult to judge this distance 26 27 23 23↓ 29 31 38 32↓ 25 27 21 25 25 26 26 22 20 24 24 20 27 29 24 27 40 30 24 31
Cyclists use it to block the lane 25 23 26 25 23 20 27 21 25 21 28 25 18 22 17 19 29 26 21 25 26 22 25 24 25 15 33 21 It annoys me that cyclists must be given this much clearance 19 20 20 22 17 17 22 19 21 23 15 15 20 22 12 21 18 14 20 20 20 20 19 19 19 18 17 18
It hasn't changed my driving 16↓ 22 17↓ 27 15 16 8 15 14 20 17 20↓ 23 32 14 21↓ 18 19 14↓ 34 17 20 17↓ 22 9 14 17 29
I didn't know it was introduced 8 8↓ 7 9 8 7↓ 12 11↓ 10 12 7 8 4 1 8 3↓ 10 12 4↓ 14 8 7↓ 7 8 14 12 9 6
Other 5 4↓ 4 3 6 4↓ 10↑ 1↓ 3 3 4 4 6 6 9 5 6 3 4 5 4 5 4↓ 6 7
Don't know 8 7 9 6 7 8↑ 12 12 8 9 8 7 4 1 8 2 12 12 8 6 7 7 8 7↑ 8 8 2 8
242129
616063
57
May 16Apr 15Apr 14
Drivers must give way to cyclists at all times
Cyclists can treat stop signs as give way signs where it is safe to do so
~ Cyclists must ride in a bicycle lane if one is provided
Base: All drivers/riders2016 (n=600)
% responding no, the rule does not apply
Road rules that DO NOT APPLY in Queensland for cyclists/cycling (C5)
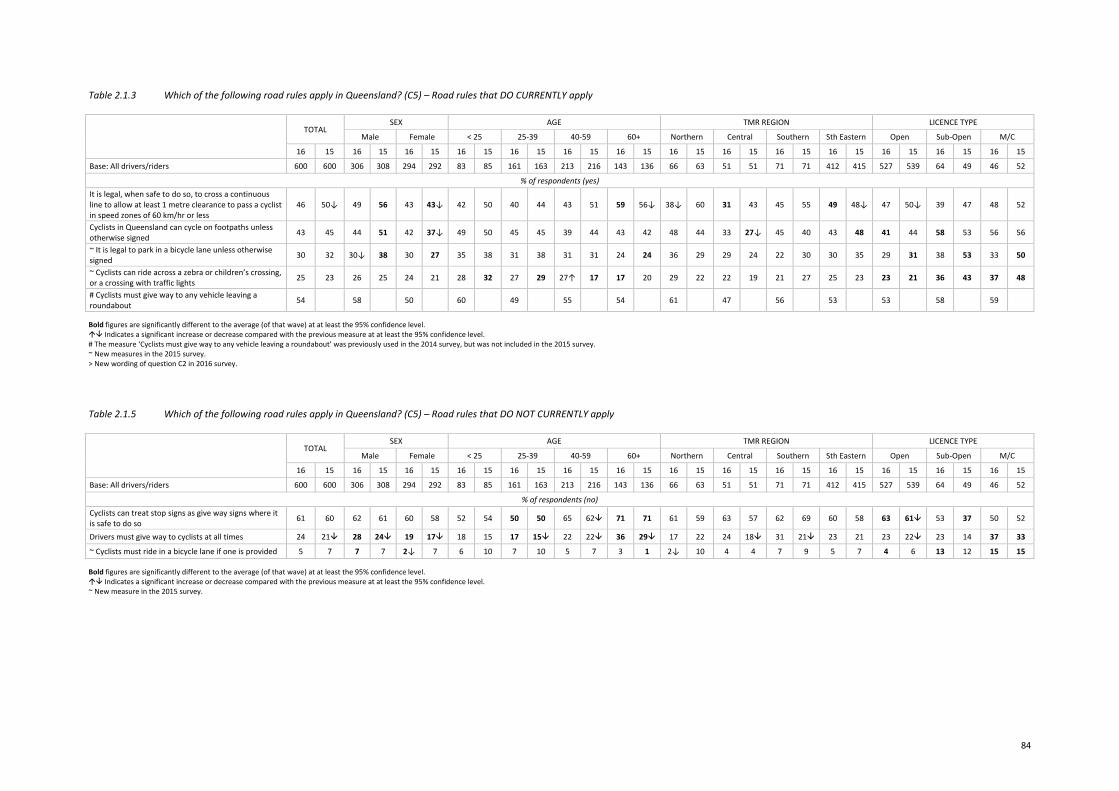
84
Table 2.1.3 Which of the following road rules apply in Queensland? (C5) – Road rules that DO CURRENTLY apply
TOTAL
SEX AGE TMR REGION LICENCE TYPE
Male Female < 25 25‐39 40‐59 60+ Northern Central Southern Sth Eastern Open Sub‐Open M/C
16 15 16 15 16 15 16 15 16 15 16 15 16 15 16 15 16 15 16 15 16 15 16 15 16 15 16 15
Base: All drivers/riders 600 600 306 308 294 292 83 85 161 163 213 216 143 136 66 63 51 51 71 71 412 415 527 539 64 49 46 52
% of respondents (yes) It is legal, when safe to do so, to cross a continuous line to allow at least 1 metre clearance to pass a cyclist in speed zones of 60 km/hr or less
46 50↓ 49 56 43 43↓ 42 50 40 44 43 51 59 56↓ 38↓ 60 31 43 45 55 49 48↓ 47 50↓ 39 47 48 52
Cyclists in Queensland can cycle on footpaths unless otherwise signed 43 45 44 51 42 37↓ 49 50 45 45 39 44 43 42 48 44 33 27↓ 45 40 43 48 41 44 58 53 56 56
~ It is legal to park in a bicycle lane unless otherwise signed 30 32 30↓ 38 30 27 35 38 31 38 31 31 24 24 36 29 29 24 22 30 30 35 29 31 38 53 33 50
~ Cyclists can ride across a zebra or children’s crossing, or a crossing with traffic lights 25 23 26 25 24 21 28 32 27 29 27↑ 17 17 20 29 22 22 19 21 27 25 23 23 21 36 43 37 48
# Cyclists must give way to any vehicle leaving a roundabout 54 58 50 60 49 55 54 61 47 56 53 53 58 59
Bold figures are significantly different to the average (of that wave) at at least the 95% confidence level. Indicates a significant increase or decrease compared with the previous measure at at least the 95% confidence level. # The measure ‘Cyclists must give way to any vehicle leaving a roundabout’ was previously used in the 2014 survey, but was not included in the 2015 survey. ~ New measures in the 2015 survey. > New wording of question C2 in 2016 survey. Table 2.1.5 Which of the following road rules apply in Queensland? (C5) – Road rules that DO NOT CURRENTLY apply
TOTAL
SEX AGE TMR REGION LICENCE TYPE
Male Female < 25 25‐39 40‐59 60+ Northern Central Southern Sth Eastern Open Sub‐Open M/C
16 15 16 15 16 15 16 15 16 15 16 15 16 15 16 15 16 15 16 15 16 15 16 15 16 15 16 15
Base: All drivers/riders 600 600 306 308 294 292 83 85 161 163 213 216 143 136 66 63 51 51 71 71 412 415 527 539 64 49 46 52
% of respondents (no) Cyclists can treat stop signs as give way signs where it is safe to do so 61 60 62 61 60 58 52 54 50 50 65 62 71 71 61 59 63 57 62 69 60 58 63 61 53 37 50 52
Drivers must give way to cyclists at all times 24 21 28 24 19 17 18 15 17 15 22 22 36 29 17 22 24 18 31 21 23 21 23 22 23 14 37 33
~ Cyclists must ride in a bicycle lane if one is provided 5 7 7 7 2↓ 7 6 10 7 10 5 7 3 1 2↓ 10 4 4 7 9 5 7 4 6 13 12 15 15
Bold figures are significantly different to the average (of that wave) at at least the 95% confidence level. Indicates a significant increase or decrease compared with the previous measure at at least the 95% confidence level. ~ New measure in the 2015 survey.
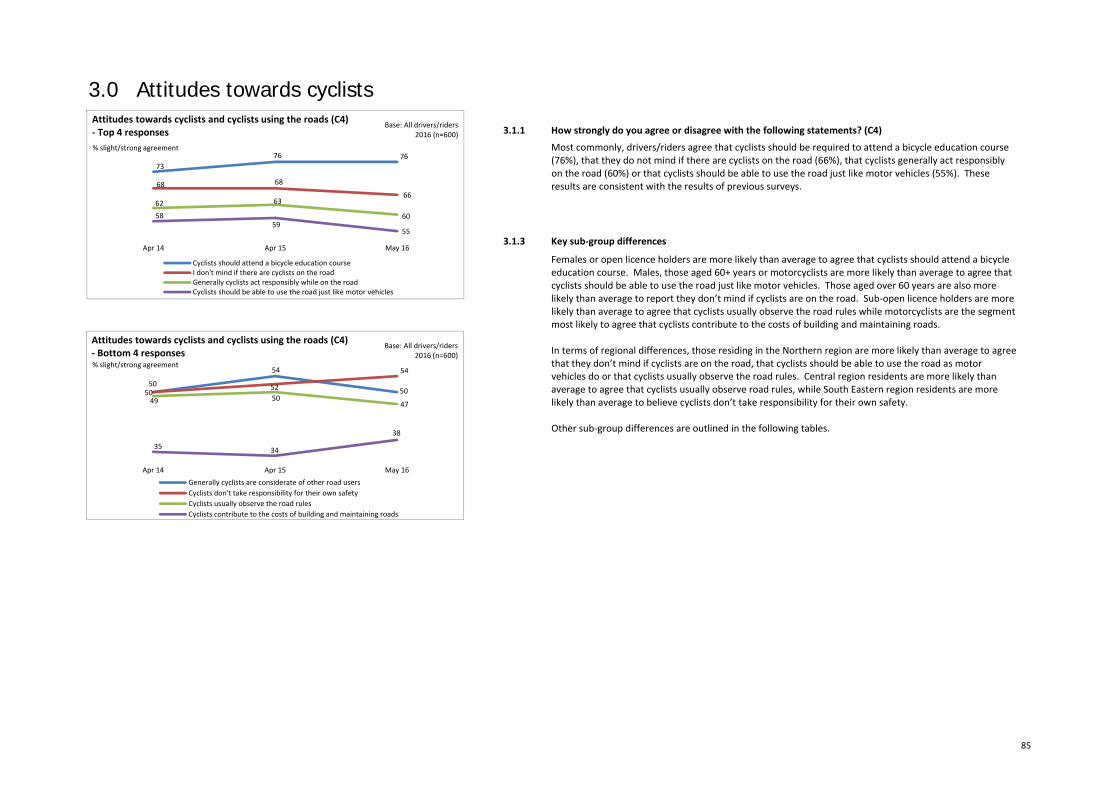
85
3.0 Attitudes towards cyclists
3.1.1 How strongly do you agree or disagree with the following statements? (C4)
Most commonly, drivers/riders agree that cyclists should be required to attend a bicycle education course (76%), that they do not mind if there are cyclists on the road (66%), that cyclists generally act responsibly on the road (60%) or that cyclists should be able to use the road just like motor vehicles (55%). These results are consistent with the results of previous surveys.
3.1.3 Key sub‐group differences
Females or open licence holders are more likely than average to agree that cyclists should attend a bicycle education course. Males, those aged 60+ years or motorcyclists are more likely than average to agree that cyclists should be able to use the road just like motor vehicles. Those aged over 60 years are also more likely than average to report they don’t mind if cyclists are on the road. Sub‐open licence holders are more likely than average to agree that cyclists usually observe the road rules while motorcyclists are the segment most likely to agree that cyclists contribute to the costs of building and maintaining roads. In terms of regional differences, those residing in the Northern region are more likely than average to agree that they don’t mind if cyclists are on the road, that cyclists should be able to use the road as motor vehicles do or that cyclists usually observe the road rules. Central region residents are more likely than average to agree that cyclists usually observe road rules, while South Eastern region residents are more likely than average to believe cyclists don’t take responsibility for their own safety. Other sub‐group differences are outlined in the following tables.
7376 76
68 68
6662 63
605859
55
Apr 14 Apr 15 May 16
Attitudes towards cyclists and cyclists using the roads (C4)‐ Top 4 responses
Cyclists should attend a bicycle education courseI don't mind if there are cyclists on the roadGenerally cyclists act responsibly while on the roadCyclists should be able to use the road just like motor vehicles
Base: All drivers/riders2016 (n=600)
% slight/strong agreement
50
54
5050 52
54
49 5047
35 34
38
Apr 14 Apr 15 May 16
Attitudes towards cyclists and cyclists using the roads (C4)‐ Bottom 4 responses
Generally cyclists are considerate of other road usersCyclists don't take responsibility for their own safetyCyclists usually observe the road rulesCyclists contribute to the costs of building and maintaining roads
Base: All drivers/riders2016 (n=600)
% slight/strong agreement
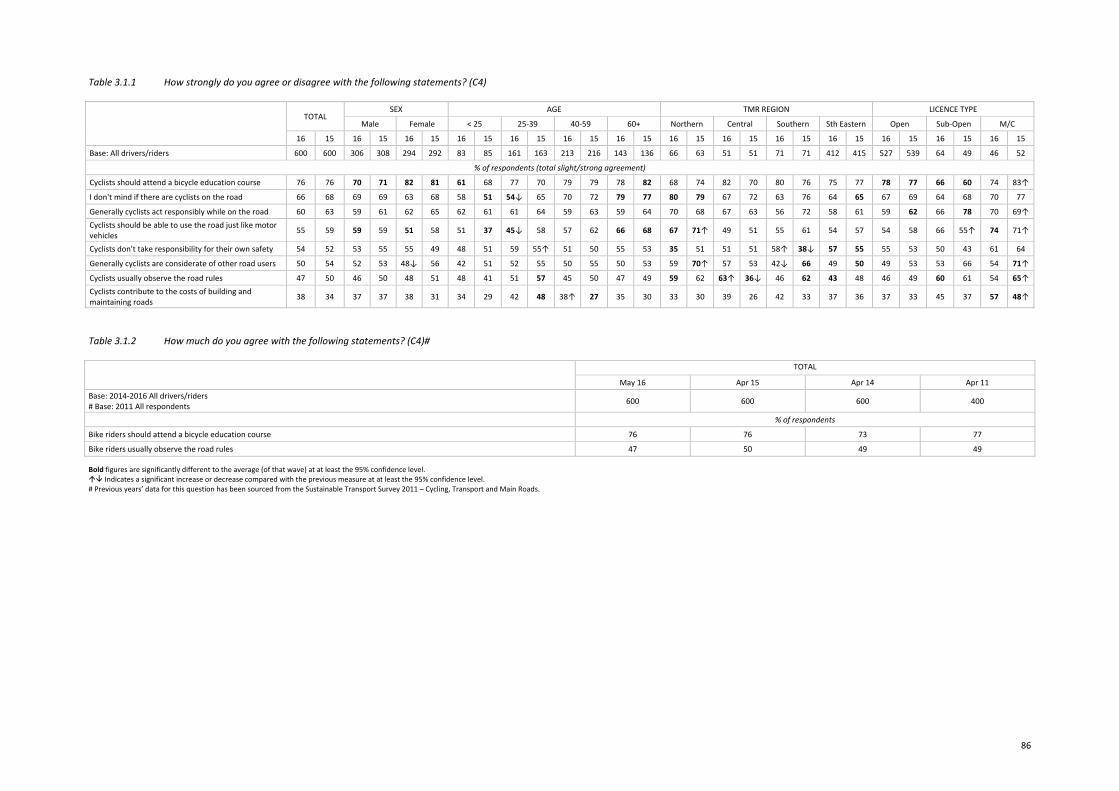
86
Table 3.1.1 How strongly do you agree or disagree with the following statements? (C4)
TOTAL
SEX AGE TMR REGION LICENCE TYPE
Male Female < 25 25‐39 40‐59 60+ Northern Central Southern Sth Eastern Open Sub‐Open M/C
16 15 16 15 16 15 16 15 16 15 16 15 16 15 16 15 16 15 16 15 16 15 16 15 16 15 16 15
Base: All drivers/riders 600 600 306 308 294 292 83 85 161 163 213 216 143 136 66 63 51 51 71 71 412 415 527 539 64 49 46 52
% of respondents (total slight/strong agreement)
Cyclists should attend a bicycle education course 76 76 70 71 82 81 61 68 77 70 79 79 78 82 68 74 82 70 80 76 75 77 78 77 66 60 74 83↑
I don't mind if there are cyclists on the road 66 68 69 69 63 68 58 51 54↓ 65 70 72 79 77 80 79 67 72 63 76 64 65 67 69 64 68 70 77
Generally cyclists act responsibly while on the road 60 63 59 61 62 65 62 61 61 64 59 63 59 64 70 68 67 63 56 72 58 61 59 62 66 78 70 69↑ Cyclists should be able to use the road just like motor vehicles 55 59 59 59 51 58 51 37 45↓ 58 57 62 66 68 67 71↑ 49 51 55 61 54 57 54 58 66 55↑ 74 71↑
Cyclists don't take responsibility for their own safety 54 52 53 55 55 49 48 51 59 55↑ 51 50 55 53 35 51 51 51 58↑ 38↓ 57 55 55 53 50 43 61 64
Generally cyclists are considerate of other road users 50 54 52 53 48↓ 56 42 51 52 55 50 55 50 53 59 70↑ 57 53 42↓ 66 49 50 49 53 53 66 54 71↑
Cyclists usually observe the road rules 47 50 46 50 48 51 48 41 51 57 45 50 47 49 59 62 63↑ 36↓ 46 62 43 48 46 49 60 61 54 65↑ Cyclists contribute to the costs of building and maintaining roads 38 34 37 37 38 31 34 29 42 48 38↑ 27 35 30 33 30 39 26 42 33 37 36 37 33 45 37 57 48↑
Table 3.1.2 How much do you agree with the following statements? (C4)#
TOTAL
May 16 Apr 15 Apr 14 Apr 11 Base: 2014‐2016 All drivers/riders # Base: 2011 All respondents 600 600 600 400
% of respondents
Bike riders should attend a bicycle education course 76 76 73 77
Bike riders usually observe the road rules 47 50 49 49
Bold figures are significantly different to the average (of that wave) at at least the 95% confidence level. Indicates a significant increase or decrease compared with the previous measure at at least the 95% confidence level. # Previous years’ data for this question has been sourced from the Sustainable Transport Survey 2011 – Cycling, Transport and Main Roads.

87
appendices
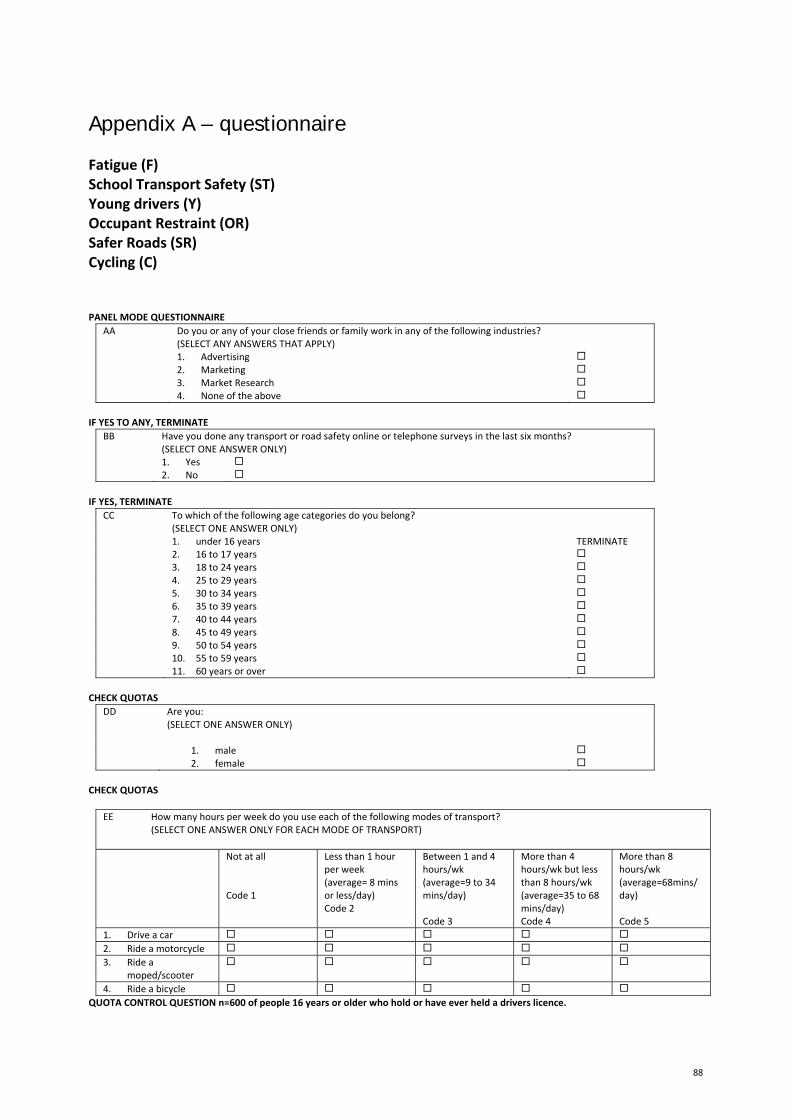
88
Appendix A – questionnaire
Fatigue (F) School Transport Safety (ST) Young drivers (Y) Occupant Restraint (OR) Safer Roads (SR) Cycling (C) PANEL MODE QUESTIONNAIRE
AA Do you or any of your close friends or family work in any of the following industries? (SELECT ANY ANSWERS THAT APPLY)
1. Advertising 2. Marketing 3. Market Research 4. None of the above
IF YES TO ANY, TERMINATE
BB Have you done any transport or road safety online or telephone surveys in the last six months? (SELECT ONE ANSWER ONLY)
1. Yes 2. No
IF YES, TERMINATE
CC To which of the following age categories do you belong?(SELECT ONE ANSWER ONLY)
1. under 16 years TERMINATE 2. 16 to 17 years 3. 18 to 24 years 4. 25 to 29 years 5. 30 to 34 years 6. 35 to 39 years 7. 40 to 44 years 8. 45 to 49 years 9. 50 to 54 years 10. 55 to 59 years 11. 60 years or over
CHECK QUOTAS
DD Are you: (SELECT ONE ANSWER ONLY)
1. male 2. female
CHECK QUOTAS
EE How many hours per week do you use each of the following modes of transport? (SELECT ONE ANSWER ONLY FOR EACH MODE OF TRANSPORT) Not at all
Code 1
Less than 1 hour per week (average= 8 mins or less/day) Code 2
Between 1 and 4 hours/wk (average=9 to 34 mins/day) Code 3
More than 4 hours/wk but less than 8 hours/wk (average=35 to 68 mins/day) Code 4
More than 8 hours/wk (average=68mins/ day) Code 5
1. Drive a car 2. Ride a motorcycle 3. Ride a
moped/scooter
4. Ride a bicycle QUOTA CONTROL QUESTION n=600 of people 16 years or older who hold or have ever held a drivers licence.
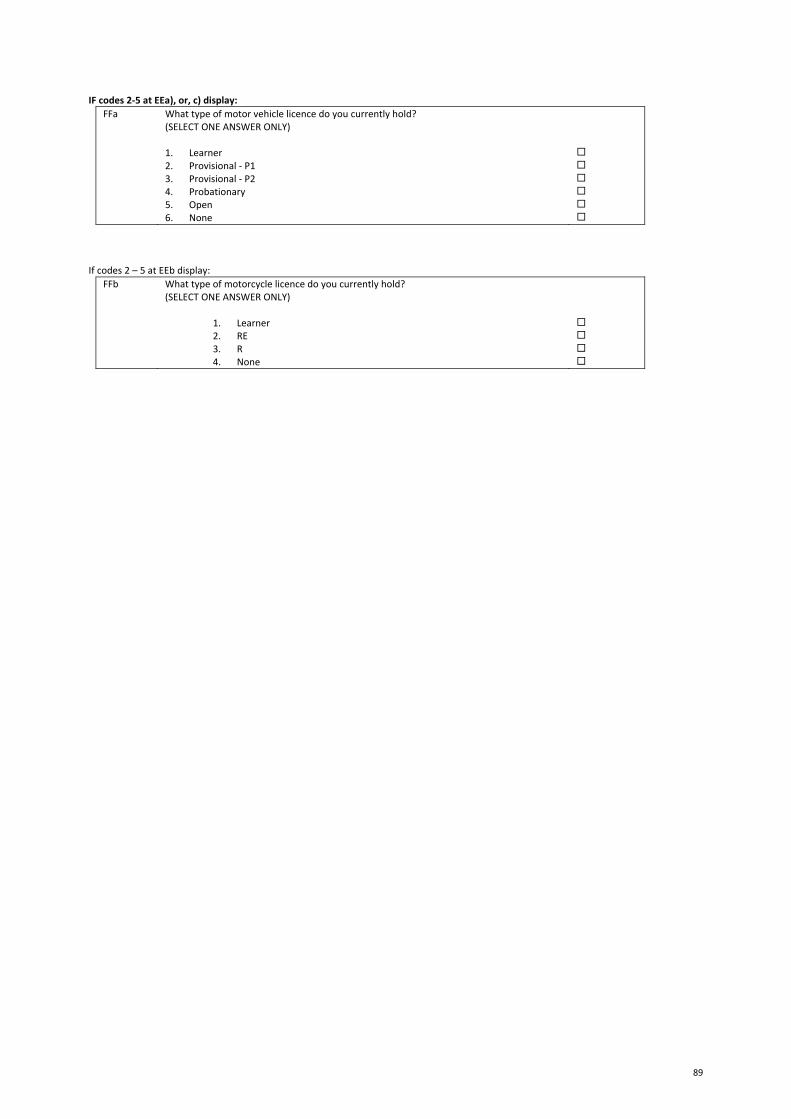
89
IF codes 2‐5 at EEa), or, c) display: FFa What type of motor vehicle licence do you currently hold?
(SELECT ONE ANSWER ONLY)
1. Learner 2. Provisional ‐ P1 3. Provisional ‐ P2 4. Probationary 5. Open 6. None
If codes 2 – 5 at EEb display:
FFb What type of motorcycle licence do you currently hold? (SELECT ONE ANSWER ONLY)
1. Learner 2. RE 3. R 4. None
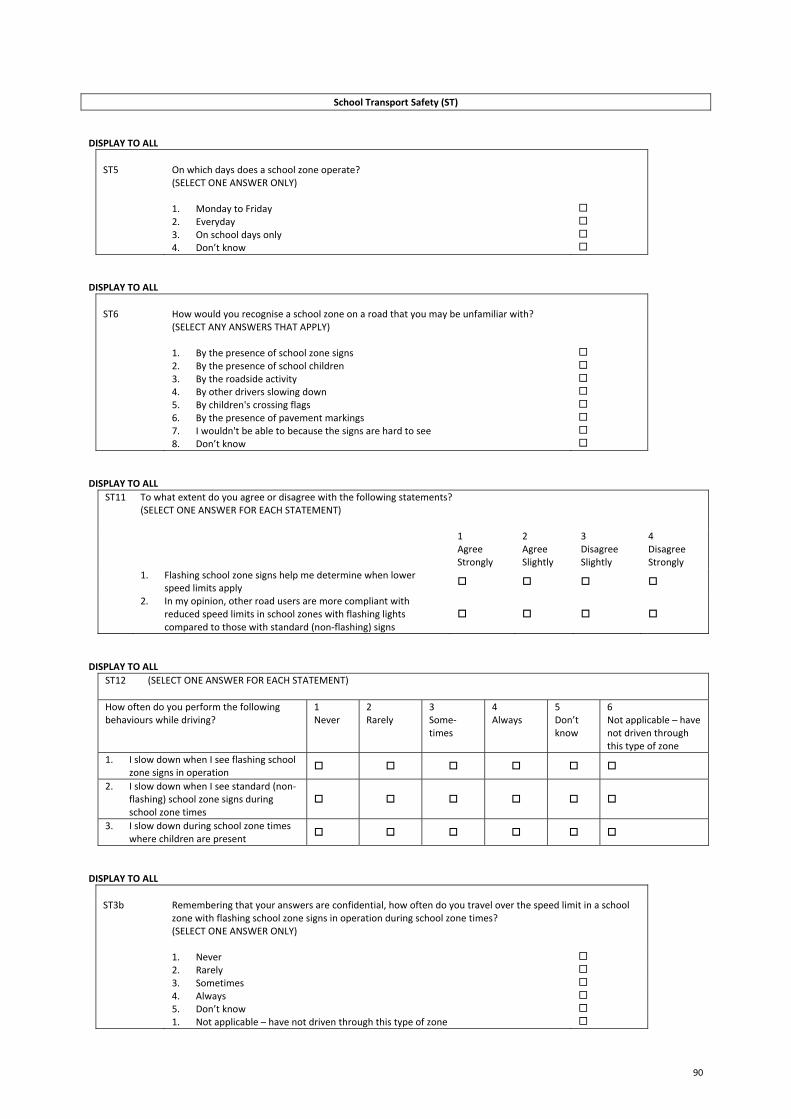
90
School Transport Safety (ST) DISPLAY TO ALL
ST5 On which days does a school zone operate?
(SELECT ONE ANSWER ONLY)
1. Monday to Friday 2. Everyday 3. On school days only 4. Don’t know
DISPLAY TO ALL
ST6 How would you recognise a school zone on a road that you may be unfamiliar with?
(SELECT ANY ANSWERS THAT APPLY)
1. By the presence of school zone signs 2. By the presence of school children 3. By the roadside activity 4. By other drivers slowing down 5. By children's crossing flags 6. By the presence of pavement markings 7. I wouldn't be able to because the signs are hard to see 8. Don’t know
DISPLAY TO ALL
ST11 To what extent do you agree or disagree with the following statements? (SELECT ONE ANSWER FOR EACH STATEMENT)
1Agree Strongly
2Agree Slightly
3 Disagree Slightly
4 Disagree Strongly
1. Flashing school zone signs help me determine when lower speed limits apply
2. In my opinion, other road users are more compliant with reduced speed limits in school zones with flashing lights compared to those with standard (non‐flashing) signs
DISPLAY TO ALL
ST12 (SELECT ONE ANSWER FOR EACH STATEMENT)
How often do you perform the following behaviours while driving?
1 Never
2Rarely
3Some‐times
4Always
5 Don’t know
6 Not applicable – have not driven through this type of zone
1. I slow down when I see flashing school zone signs in operation
2. I slow down when I see standard (non‐flashing) school zone signs during school zone times
3. I slow down during school zone times where children are present
DISPLAY TO ALL
ST3b Remembering that your answers are confidential, how often do you travel over the speed limit in a school
zone with flashing school zone signs in operation during school zone times? (SELECT ONE ANSWER ONLY)
1. Never 2. Rarely 3. Sometimes 4. Always 5. Don’t know 1. Not applicable – have not driven through this type of zone
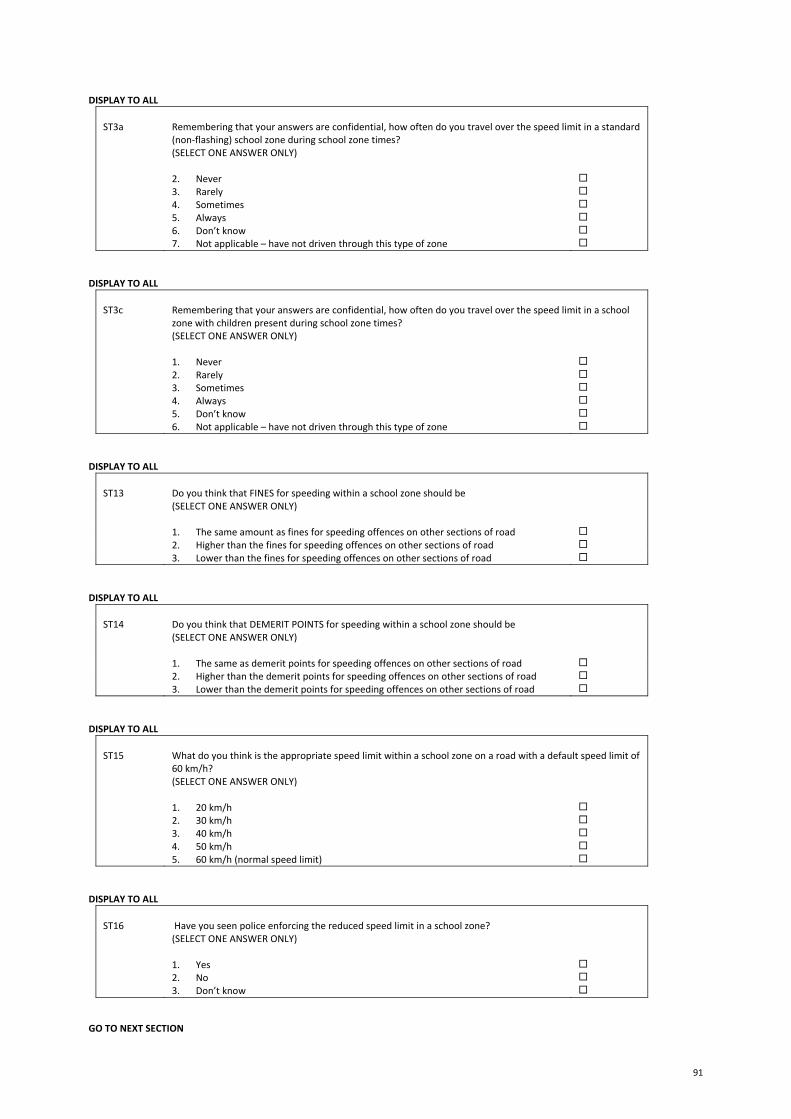
91
DISPLAY TO ALL ST3a Remembering that your answers are confidential, how often do you travel over the speed limit in a standard
(non‐flashing) school zone during school zone times? (SELECT ONE ANSWER ONLY)
2. Never 3. Rarely 4. Sometimes 5. Always 6. Don’t know 7. Not applicable – have not driven through this type of zone
DISPLAY TO ALL
ST3c Remembering that your answers are confidential, how often do you travel over the speed limit in a school
zone with children present during school zone times? (SELECT ONE ANSWER ONLY)
1. Never 2. Rarely 3. Sometimes 4. Always 5. Don’t know 6. Not applicable – have not driven through this type of zone
DISPLAY TO ALL
ST13 Do you think that FINES for speeding within a school zone should be
(SELECT ONE ANSWER ONLY)
1. The same amount as fines for speeding offences on other sections of road 2. Higher than the fines for speeding offences on other sections of road 3. Lower than the fines for speeding offences on other sections of road
DISPLAY TO ALL
ST14 Do you think that DEMERIT POINTS for speeding within a school zone should be
(SELECT ONE ANSWER ONLY)
1. The same as demerit points for speeding offences on other sections of road 2. Higher than the demerit points for speeding offences on other sections of road 3. Lower than the demerit points for speeding offences on other sections of road
DISPLAY TO ALL
ST15 What do you think is the appropriate speed limit within a school zone on a road with a default speed limit of
60 km/h? (SELECT ONE ANSWER ONLY)
1. 20 km/h 2. 30 km/h 3. 40 km/h 4. 50 km/h 5. 60 km/h (normal speed limit)
DISPLAY TO ALL
ST16 Have you seen police enforcing the reduced speed limit in a school zone?
(SELECT ONE ANSWER ONLY)
1. Yes 2. No 3. Don’t know
GO TO NEXT SECTION
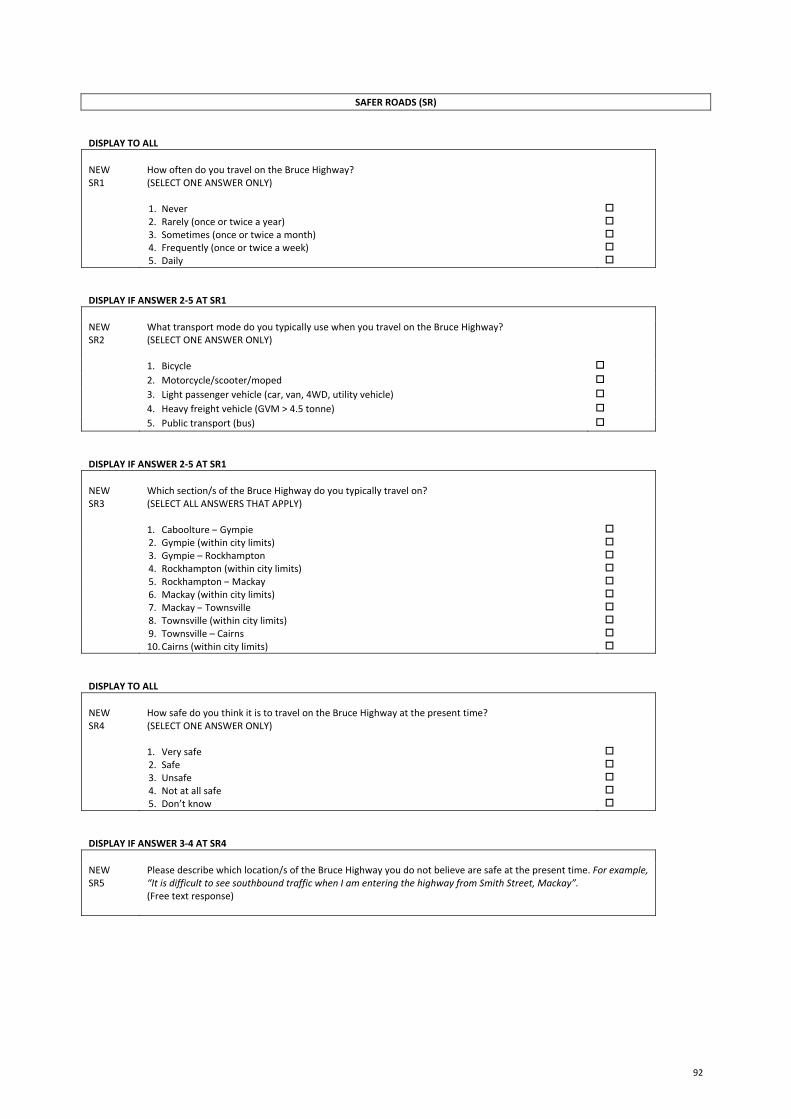
92
SAFER ROADS (SR) DISPLAY TO ALL NEW SR1
How often do you travel on the Bruce Highway? (SELECT ONE ANSWER ONLY)
1. Never 2. Rarely (once or twice a year) 3. Sometimes (once or twice a month) 4. Frequently (once or twice a week) 5. Daily
DISPLAY IF ANSWER 2‐5 AT SR1 NEW SR2
What transport mode do you typically use when you travel on the Bruce Highway?(SELECT ONE ANSWER ONLY)
1. Bicycle 2. Motorcycle/scooter/moped 3. Light passenger vehicle (car, van, 4WD, utility vehicle) 4. Heavy freight vehicle (GVM > 4.5 tonne) 5. Public transport (bus)
DISPLAY IF ANSWER 2‐5 AT SR1 NEW SR3
Which section/s of the Bruce Highway do you typically travel on? (SELECT ALL ANSWERS THAT APPLY)
1. Caboolture – Gympie 2. Gympie (within city limits) 3. Gympie – Rockhampton 4. Rockhampton (within city limits) 5. Rockhampton – Mackay 6. Mackay (within city limits) 7. Mackay – Townsville 8. Townsville (within city limits) 9. Townsville – Cairns 10. Cairns (within city limits)
DISPLAY TO ALL NEW SR4
How safe do you think it is to travel on the Bruce Highway at the present time? (SELECT ONE ANSWER ONLY)
1. Very safe 2. Safe 3. Unsafe 4. Not at all safe 5. Don’t know
DISPLAY IF ANSWER 3‐4 AT SR4 NEW SR5
Please describe which location/s of the Bruce Highway you do not believe are safe at the present time. For example, “It is difficult to see southbound traffic when I am entering the highway from Smith Street, Mackay”. (Free text response)
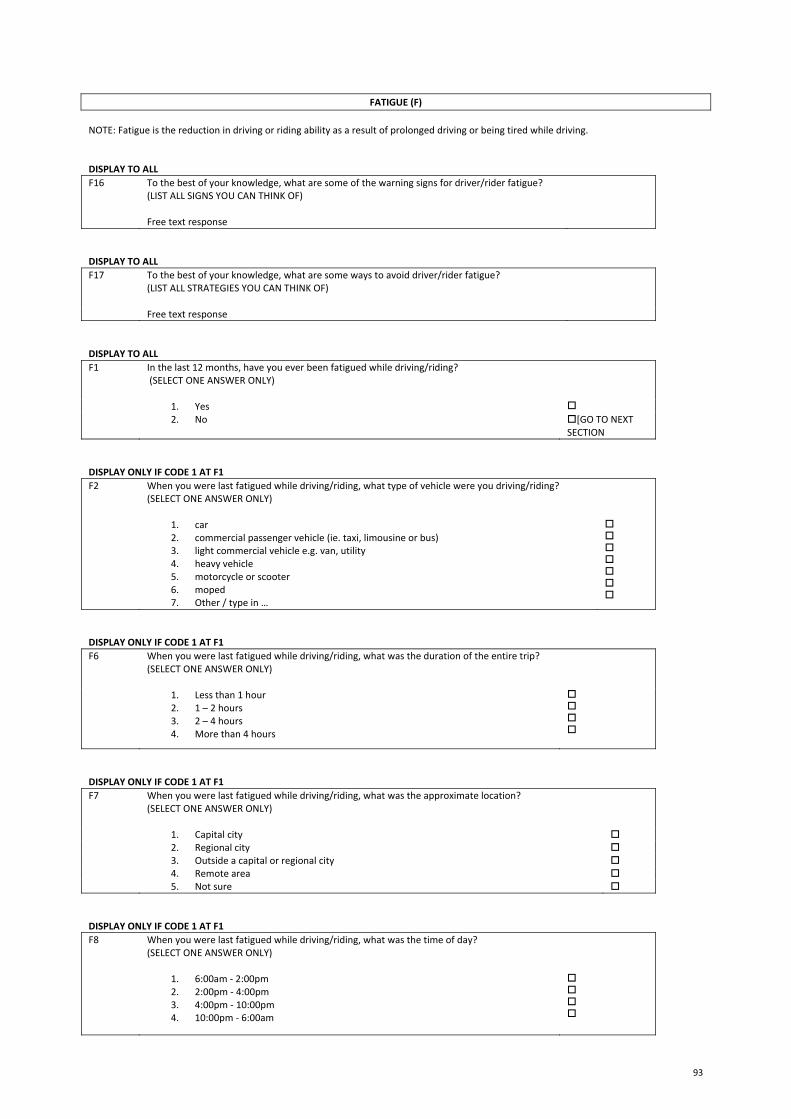
93
FATIGUE (F) NOTE: Fatigue is the reduction in driving or riding ability as a result of prolonged driving or being tired while driving. DISPLAY TO ALL F16 To the best of your knowledge, what are some of the warning signs for driver/rider fatigue?
(LIST ALL SIGNS YOU CAN THINK OF)
Free text response DISPLAY TO ALL F17 To the best of your knowledge, what are some ways to avoid driver/rider fatigue?
(LIST ALL STRATEGIES YOU CAN THINK OF)
Free text response DISPLAY TO ALL F1 In the last 12 months, have you ever been fatigued while driving/riding?
(SELECT ONE ANSWER ONLY)
1. Yes 2. No [GO TO NEXT
SECTION DISPLAY ONLY IF CODE 1 AT F1 F2 When you were last fatigued while driving/riding, what type of vehicle were you driving/riding?
(SELECT ONE ANSWER ONLY)
1. car 2. commercial passenger vehicle (ie. taxi, limousine or bus) 3. light commercial vehicle e.g. van, utility 4. heavy vehicle 5. motorcycle or scooter 6. moped 7. Other / type in …
DISPLAY ONLY IF CODE 1 AT F1 F6 When you were last fatigued while driving/riding, what was the duration of the entire trip?
(SELECT ONE ANSWER ONLY)
1. Less than 1 hour 2. 1 – 2 hours 3. 2 – 4 hours 4. More than 4 hours
DISPLAY ONLY IF CODE 1 AT F1 F7 When you were last fatigued while driving/riding, what was the approximate location?
(SELECT ONE ANSWER ONLY)
1. Capital city 2. Regional city 3. Outside a capital or regional city 4. Remote area 5. Not sure
DISPLAY ONLY IF CODE 1 AT F1 F8 When you were last fatigued while driving/riding, what was the time of day?
(SELECT ONE ANSWER ONLY)
1. 6:00am ‐ 2:00pm 2. 2:00pm ‐ 4:00pm 3. 4:00pm ‐ 10:00pm 4. 10:00pm ‐ 6:00am
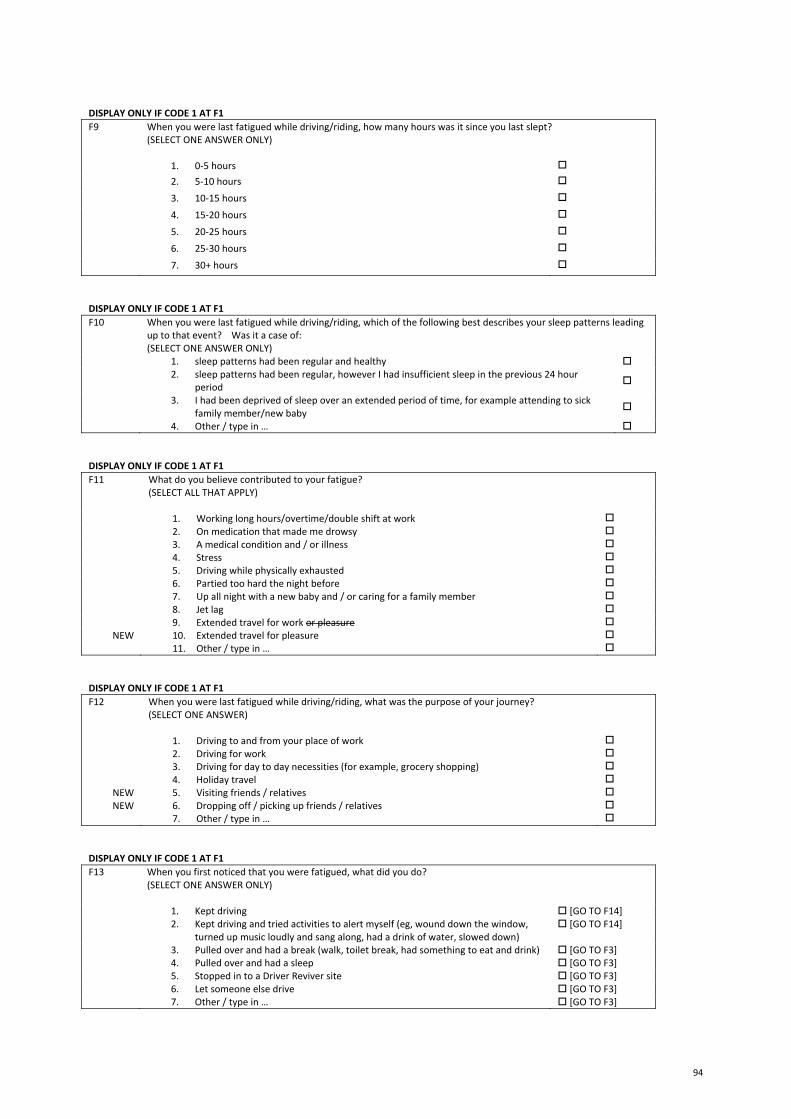
94
DISPLAY ONLY IF CODE 1 AT F1 F9 When you were last fatigued while driving/riding, how many hours was it since you last slept?
(SELECT ONE ANSWER ONLY)
1. 0‐5 hours 2. 5‐10 hours
3. 10‐15 hours
4. 15‐20 hours
5. 20‐25 hours
6. 25‐30 hours
7. 30+ hours
DISPLAY ONLY IF CODE 1 AT F1 F10 When you were last fatigued while driving/riding, which of the following best describes your sleep patterns leading
up to that event? Was it a case of: (SELECT ONE ANSWER ONLY)
1. sleep patterns had been regular and healthy 2. sleep patterns had been regular, however I had insufficient sleep in the previous 24 hour
period
3. I had been deprived of sleep over an extended period of time, for example attending to sick family member/new baby
4. Other / type in … DISPLAY ONLY IF CODE 1 AT F1 F11 What do you believe contributed to your fatigue?
(SELECT ALL THAT APPLY)
1. Working long hours/overtime/double shift at work 2. On medication that made me drowsy 3. A medical condition and / or illness 4. Stress 5. Driving while physically exhausted 6. Partied too hard the night before 7. Up all night with a new baby and / or caring for a family member 8. Jet lag 9. Extended travel for work or pleasure
NEW 10. Extended travel for pleasure 11. Other / type in …
DISPLAY ONLY IF CODE 1 AT F1 F12 When you were last fatigued while driving/riding, what was the purpose of your journey?
(SELECT ONE ANSWER)
1. Driving to and from your place of work 2. Driving for work 3. Driving for day to day necessities (for example, grocery shopping) 4. Holiday travel
NEW 5. Visiting friends / relatives NEW 6. Dropping off / picking up friends / relatives
7. Other / type in … DISPLAY ONLY IF CODE 1 AT F1 F13 When you first noticed that you were fatigued, what did you do?
(SELECT ONE ANSWER ONLY)
1. Kept driving [GO TO F14] 2. Kept driving and tried activities to alert myself (eg, wound down the window,
turned up music loudly and sang along, had a drink of water, slowed down) [GO TO F14]
3. Pulled over and had a break (walk, toilet break, had something to eat and drink) [GO TO F3] 4. Pulled over and had a sleep [GO TO F3] 5. Stopped in to a Driver Reviver site [GO TO F3] 6. Let someone else drive [GO TO F3] 7. Other / type in … [GO TO F3]

95
DISPLAY ONLY IF CODE 1 AT F13 F14 Why did you choose to keep driving?
(SELECT ONE ANSWER ONLY)
1. Had to get home 2. Had a passenger to transport to a destination 3. Had to get to work 4. Was so close to destination that it didn’t seem worthwhile stopping 5. No safe place to pull up and rest 6. Other / type in …
GO TO NEXT SECTION
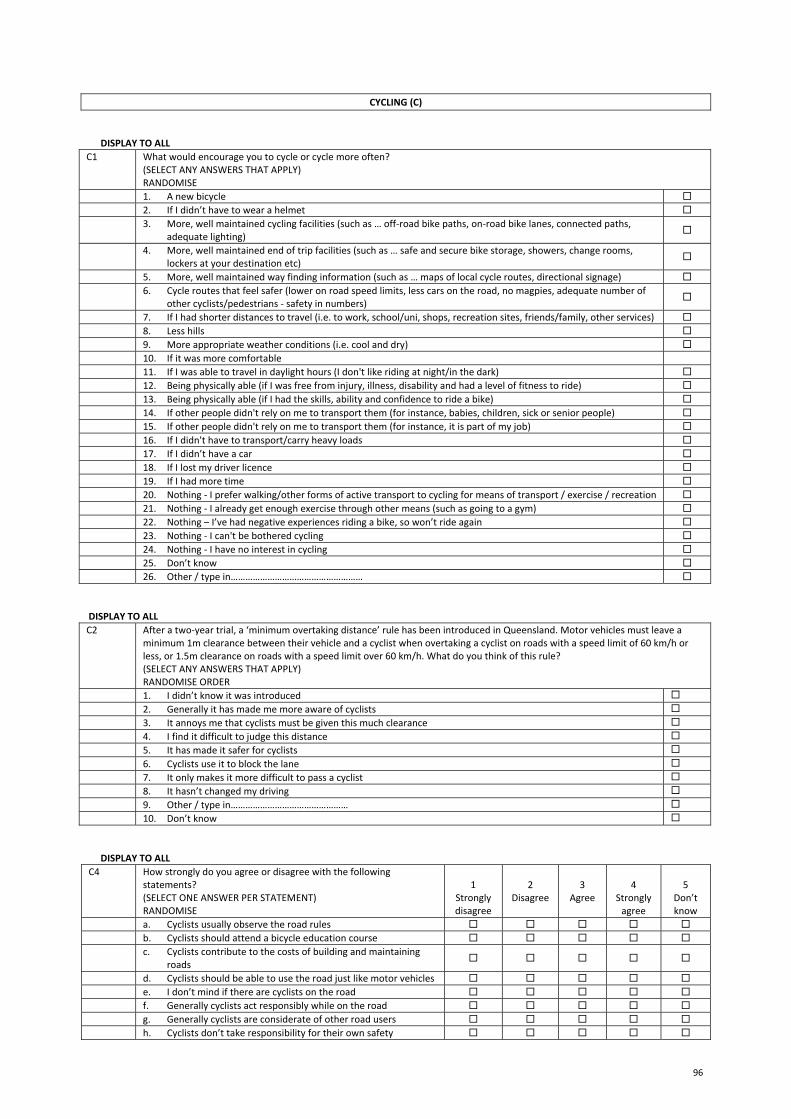
96
CYCLING (C) DISPLAY TO ALL
C1
What would encourage you to cycle or cycle more often?(SELECT ANY ANSWERS THAT APPLY) RANDOMISE
1. A new bicycle 2. If I didn’t have to wear a helmet 3. More, well maintained cycling facilities (such as … off‐road bike paths, on‐road bike lanes, connected paths,
adequate lighting)
4. More, well maintained end of trip facilities (such as … safe and secure bike storage, showers, change rooms, lockers at your destination etc)
5. More, well maintained way finding information (such as … maps of local cycle routes, directional signage) 6. Cycle routes that feel safer (lower on road speed limits, less cars on the road, no magpies, adequate number of
other cyclists/pedestrians ‐ safety in numbers)
7. If I had shorter distances to travel (i.e. to work, school/uni, shops, recreation sites, friends/family, other services) 8. Less hills 9. More appropriate weather conditions (i.e. cool and dry) 10. If it was more comfortable 11. If I was able to travel in daylight hours (I don't like riding at night/in the dark) 12. Being physically able (if I was free from injury, illness, disability and had a level of fitness to ride) 13. Being physically able (if I had the skills, ability and confidence to ride a bike) 14. If other people didn't rely on me to transport them (for instance, babies, children, sick or senior people) 15. If other people didn't rely on me to transport them (for instance, it is part of my job) 16. If I didn't have to transport/carry heavy loads 17. If I didn’t have a car 18. If I lost my driver licence 19. If I had more time 20. Nothing ‐ I prefer walking/other forms of active transport to cycling for means of transport / exercise / recreation 21. Nothing ‐ I already get enough exercise through other means (such as going to a gym) 22. Nothing – I’ve had negative experiences riding a bike, so won’t ride again 23. Nothing ‐ I can't be bothered cycling 24. Nothing ‐ I have no interest in cycling 25. Don’t know 26. Other / type in……………………………………………… DISPLAY TO ALL C2 After a two‐year trial, a ‘minimum overtaking distance’ rule has been introduced in Queensland. Motor vehicles must leave a
minimum 1m clearance between their vehicle and a cyclist when overtaking a cyclist on roads with a speed limit of 60 km/h or less, or 1.5m clearance on roads with a speed limit over 60 km/h. What do you think of this rule? (SELECT ANY ANSWERS THAT APPLY) RANDOMISE ORDER
1. I didn’t know it was introduced 2. Generally it has made me more aware of cyclists 3. It annoys me that cyclists must be given this much clearance 4. I find it difficult to judge this distance 5. It has made it safer for cyclists 6. Cyclists use it to block the lane 7. It only makes it more difficult to pass a cyclist 8. It hasn’t changed my driving 9. Other / type in………………………………………… 10. Don’t know
DISPLAY TO ALL C4 How strongly do you agree or disagree with the following
statements? (SELECT ONE ANSWER PER STATEMENT) RANDOMISE
1 Strongly disagree
2 Disagree
3 Agree
4 Strongly agree
5 Don’t know
a. Cyclists usually observe the road rules b. Cyclists should attend a bicycle education course c. Cyclists contribute to the costs of building and maintaining
roads
d. Cyclists should be able to use the road just like motor vehicles e. I don’t mind if there are cyclists on the road f. Generally cyclists act responsibly while on the road g. Generally cyclists are considerate of other road users h. Cyclists don’t take responsibility for their own safety

97
DISPLAY TO ALL C5 Which of the following road rules apply in Queensland?
(SELECT ONE ANSWER PER STATEMENT) RANDOMISE
1 Yes
2 No
3Don’t know
a. It is legal to park in a bicycle lane unless otherwise signed b. It is legal, when safe to do so, to cross a continuous line (including double centre lines) to allow at
least 1 metre clearance to pass a cyclist in speed zones of 60 km/h or less
c. Cyclists in Queensland can cycle on footpaths unless otherwise signed d. Cyclists can treat stop signs as give way signs where it is safe to do so e. Drivers must give way to cyclists f. Cyclists must give way to any vehicle leaving a roundabout g. Cyclists can ride across a zebra or children’s crossing, or a crossing with traffic lights h. Cyclists must ride in a bicycle lane if one is provided
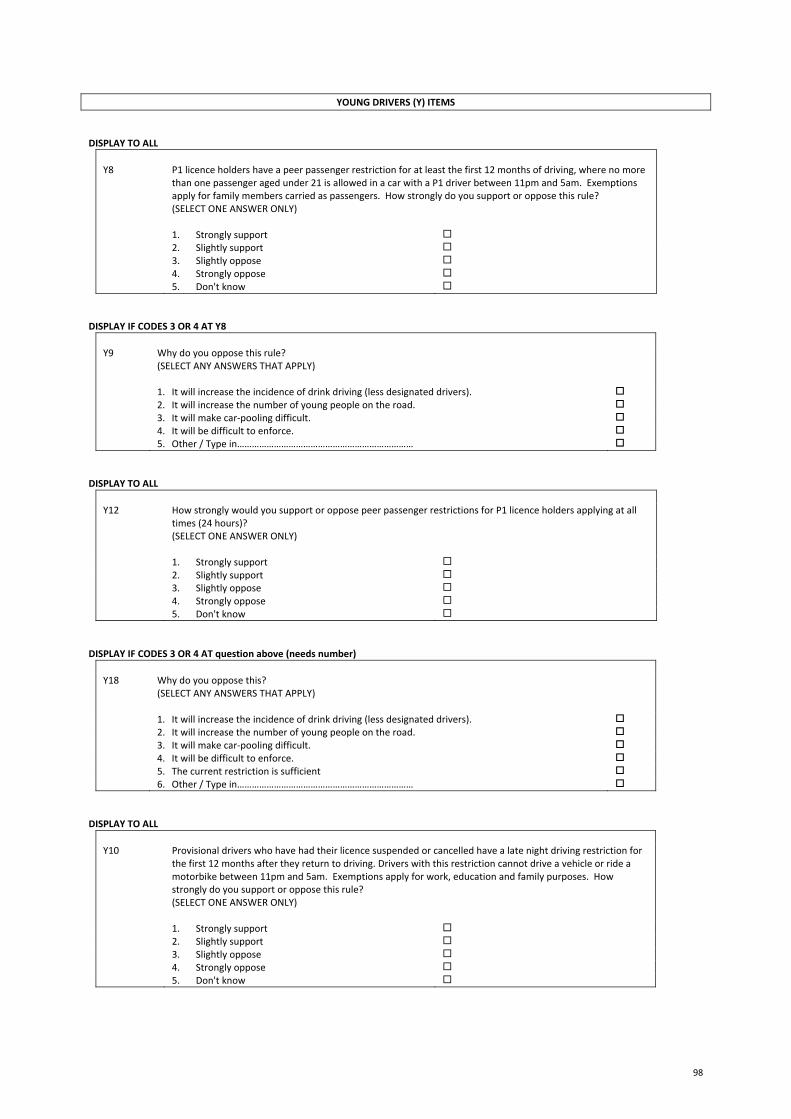
98
YOUNG DRIVERS (Y) ITEMS DISPLAY TO ALL
Y8 P1 licence holders have a peer passenger restriction for at least the first 12 months of driving, where no more
than one passenger aged under 21 is allowed in a car with a P1 driver between 11pm and 5am. Exemptions apply for family members carried as passengers. How strongly do you support or oppose this rule? (SELECT ONE ANSWER ONLY)
1. Strongly support 2. Slightly support 3. Slightly oppose 4. Strongly oppose
5. Don't know
DISPLAY IF CODES 3 OR 4 AT Y8 Y9 Why do you oppose this rule?
(SELECT ANY ANSWERS THAT APPLY)
1. It will increase the incidence of drink driving (less designated drivers). 2. It will increase the number of young people on the road. 3. It will make car‐pooling difficult. 4. It will be difficult to enforce. 5. Other / Type in………………………………………………………………
DISPLAY TO ALL
Y12 How strongly would you support or oppose peer passenger restrictions for P1 licence holders applying at all
times (24 hours)? (SELECT ONE ANSWER ONLY)
1. Strongly support 2. Slightly support 3. Slightly oppose 4. Strongly oppose
5. Don't know DISPLAY IF CODES 3 OR 4 AT question above (needs number)
Y18 Why do you oppose this?
(SELECT ANY ANSWERS THAT APPLY)
1. It will increase the incidence of drink driving (less designated drivers). 2. It will increase the number of young people on the road. 3. It will make car‐pooling difficult. 4. It will be difficult to enforce. 5. The current restriction is sufficient 6. Other / Type in………………………………………………………………
DISPLAY TO ALL
Y10 Provisional drivers who have had their licence suspended or cancelled have a late night driving restriction for
the first 12 months after they return to driving. Drivers with this restriction cannot drive a vehicle or ride a motorbike between 11pm and 5am. Exemptions apply for work, education and family purposes. How strongly do you support or oppose this rule? (SELECT ONE ANSWER ONLY)
1. Strongly support 2. Slightly support 3. Slightly oppose 4. Strongly oppose
5. Don't know
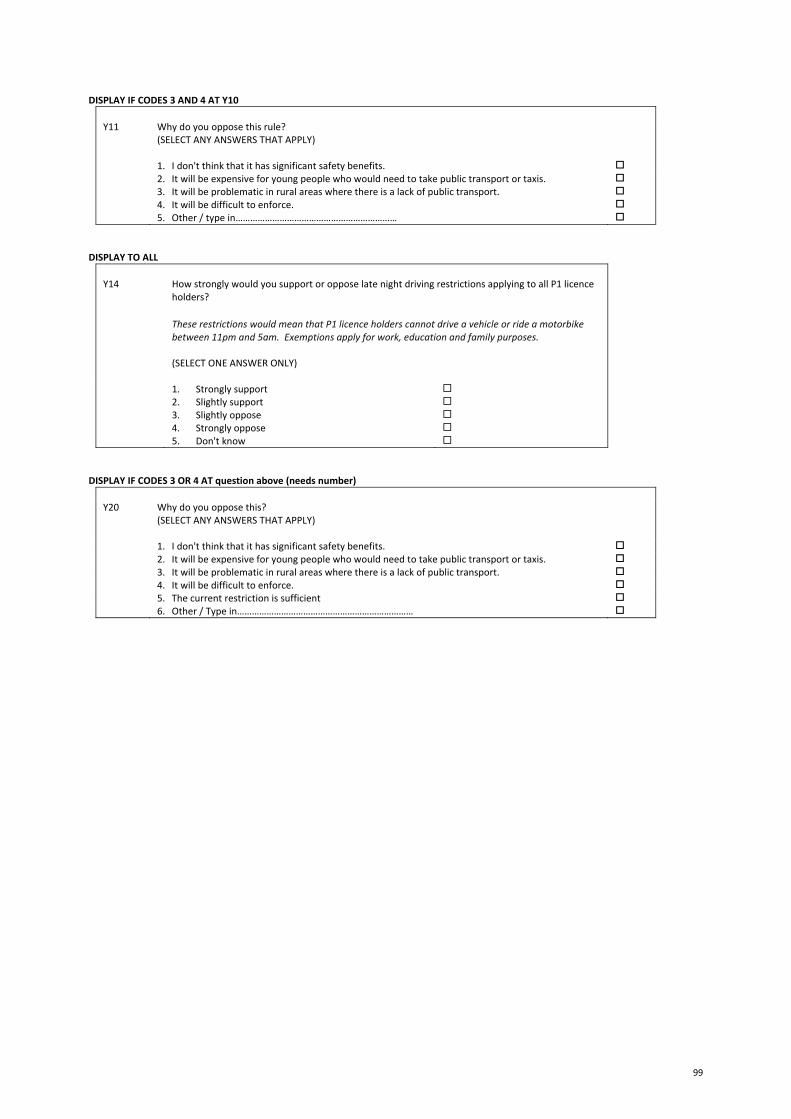
99
DISPLAY IF CODES 3 AND 4 AT Y10 Y11 Why do you oppose this rule?
(SELECT ANY ANSWERS THAT APPLY)
1. I don't think that it has significant safety benefits. 2. It will be expensive for young people who would need to take public transport or taxis. 3. It will be problematic in rural areas where there is a lack of public transport. 4. It will be difficult to enforce. 5. Other / type in…………………………………………………………
DISPLAY TO ALL
Y14 How strongly would you support or oppose late night driving restrictions applying to all P1 licence
holders? These restrictions would mean that P1 licence holders cannot drive a vehicle or ride a motorbike between 11pm and 5am. Exemptions apply for work, education and family purposes. (SELECT ONE ANSWER ONLY)
1. Strongly support 2. Slightly support 3. Slightly oppose 4. Strongly oppose
5. Don't know DISPLAY IF CODES 3 OR 4 AT question above (needs number)
Y20 Why do you oppose this?
(SELECT ANY ANSWERS THAT APPLY)
1. I don't think that it has significant safety benefits. 2. It will be expensive for young people who would need to take public transport or taxis. 3. It will be problematic in rural areas where there is a lack of public transport. 4. It will be difficult to enforce. 5. The current restriction is sufficient 6. Other / Type in………………………………………………………………
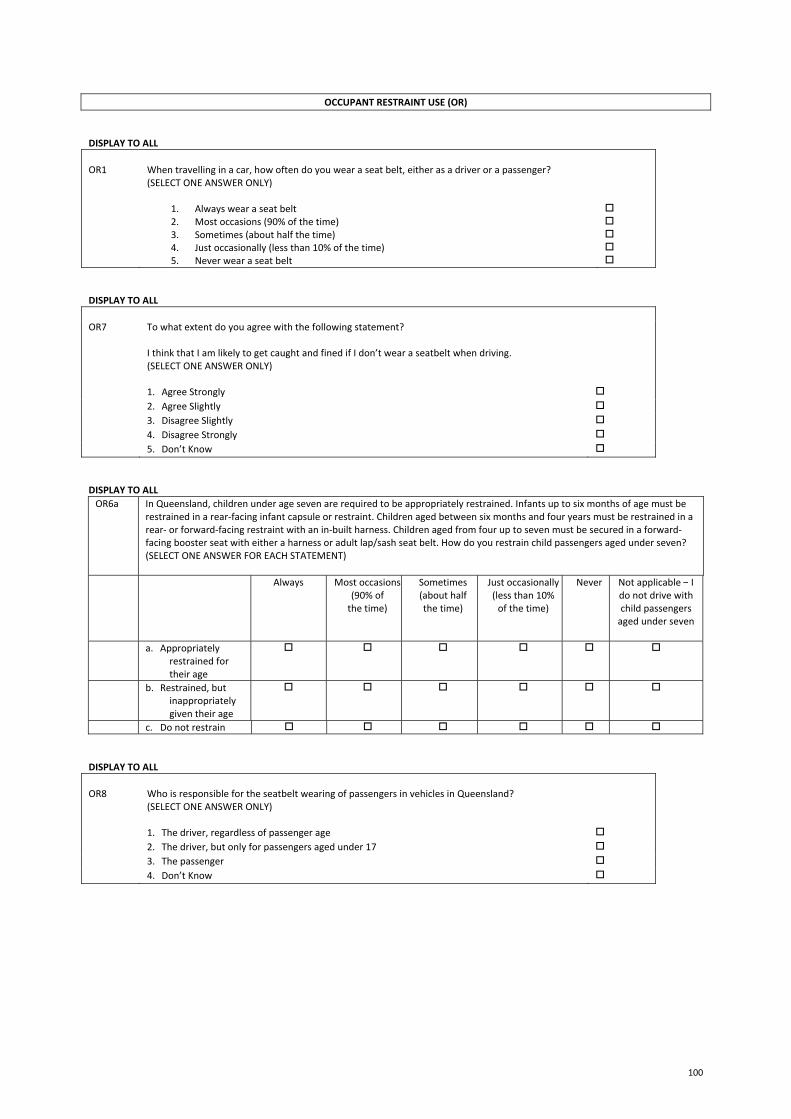
100
OCCUPANT RESTRAINT USE (OR) DISPLAY TO ALL OR1 When travelling in a car, how often do you wear a seat belt, either as a driver or a passenger?
(SELECT ONE ANSWER ONLY)
1. Always wear a seat belt 2. Most occasions (90% of the time) 3. Sometimes (about half the time) 4. Just occasionally (less than 10% of the time) 5. Never wear a seat belt
DISPLAY TO ALL OR7 To what extent do you agree with the following statement?
I think that I am likely to get caught and fined if I don’t wear a seatbelt when driving. (SELECT ONE ANSWER ONLY)
1. Agree Strongly 2. Agree Slightly 3. Disagree Slightly 4. Disagree Strongly 5. Don’t Know DISPLAY TO ALL OR6a In Queensland, children under age seven are required to be appropriately restrained. Infants up to six months of age must be
restrained in a rear‐facing infant capsule or restraint. Children aged between six months and four years must be restrained in a rear‐ or forward‐facing restraint with an in‐built harness. Children aged from four up to seven must be secured in a forward‐facing booster seat with either a harness or adult lap/sash seat belt. How do you restrain child passengers aged under seven? (SELECT ONE ANSWER FOR EACH STATEMENT)
Always Most occasions (90% of the time)
Sometimes (about half the time)
Just occasionally (less than 10% of the time)
Never Not applicable – I do not drive with child passengers aged under seven
a. Appropriately restrained for their age
b. Restrained, but inappropriately given their age
c. Do not restrain DISPLAY TO ALL OR8 Who is responsible for the seatbelt wearing of passengers in vehicles in Queensland?
(SELECT ONE ANSWER ONLY)
1. The driver, regardless of passenger age 2. The driver, but only for passengers aged under 17 3. The passenger 4. Don’t Know
101
DEMOGRAPHICS ‐ DISPLAY TO ALL And finally just a couple of questions about you which are for statistical purposes only. Demo 1 What is your occupation?
TYPE IN YOUR ANSWER BELOW
…………………………………………………………………………………………
Demo 2 What is the highest level of education that you have completed?(SELECT ONE ANSWER ONLY)
1. Below Year 10 2. Year 10 3. Year 11 4. Year 12 5. Certificate or Diploma 6. Undergraduate University degree 7. Postgraduate University degree
Demo 3 Area of Residence
(SELECT ONE ANSWER)
1. Capital City 2. Regional City 3. Outside a capital or regional city 4. Remote
Demo 4 What is the name of your suburb or town?
TYPE IN YOUR ANSWER BELOW
…………………………………………………………………………………………
As this is market research, it is carried out in compliance with the Privacy Act and the information you provided will be used only for research purposes. Your answers will be combined with those of other participants to provide feedback to the Department of Transport and Main Roads on the servicing needs of the Queensland public. Once information processing has been completed, please be assured that your name and contact details will be removed from your responses to this survey. After that time we will no longer be able to identify the responses provided by you. However for the period that your name and contact details remain with your survey responses, which will be approximately one month, you will be able to contact us to request that we delete some or all of your information.
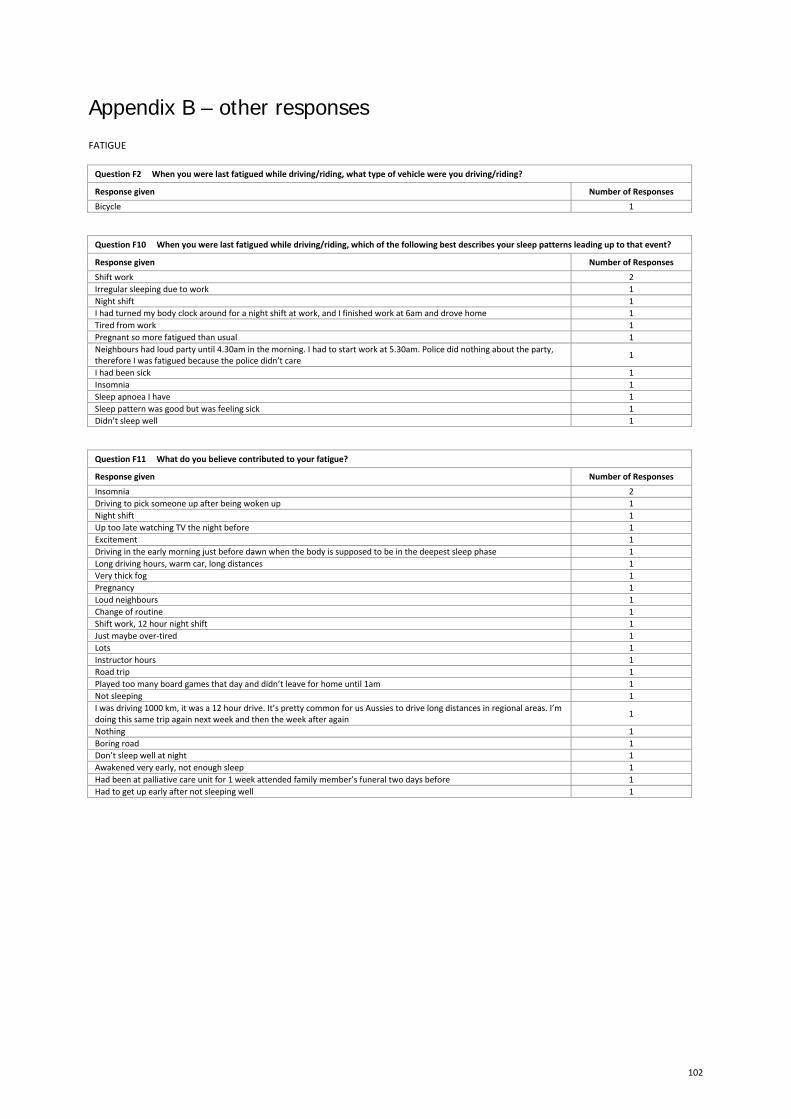
102
Appendix B – other responses FATIGUE Question F2 When you were last fatigued while driving/riding, what type of vehicle were you driving/riding?
Response given Number of Responses
Bicycle 1
Question F10 When you were last fatigued while driving/riding, which of the following best describes your sleep patterns leading up to that event?
Response given Number of Responses
Shift work 2 Irregular sleeping due to work 1 Night shift 1 I had turned my body clock around for a night shift at work, and I finished work at 6am and drove home 1 Tired from work 1 Pregnant so more fatigued than usual 1 Neighbours had loud party until 4.30am in the morning. I had to start work at 5.30am. Police did nothing about the party, therefore I was fatigued because the police didn’t care 1
I had been sick 1 Insomnia 1 Sleep apnoea I have 1 Sleep pattern was good but was feeling sick 1 Didn’t sleep well 1
Question F11 What do you believe contributed to your fatigue?
Response given Number of Responses
Insomnia 2 Driving to pick someone up after being woken up 1 Night shift 1 Up too late watching TV the night before 1 Excitement 1 Driving in the early morning just before dawn when the body is supposed to be in the deepest sleep phase 1 Long driving hours, warm car, long distances 1 Very thick fog 1 Pregnancy 1 Loud neighbours 1 Change of routine 1 Shift work, 12 hour night shift 1 Just maybe over‐tired 1 Lots 1 Instructor hours 1 Road trip 1 Played too many board games that day and didn’t leave for home until 1am 1 Not sleeping 1 I was driving 1000 km, it was a 12 hour drive. It’s pretty common for us Aussies to drive long distances in regional areas. I’m doing this same trip again next week and then the week after again 1
Nothing 1 Boring road 1 Don’t sleep well at night 1 Awakened very early, not enough sleep 1 Had been at palliative care unit for 1 week attended family member’s funeral two days before 1 Had to get up early after not sleeping well 1
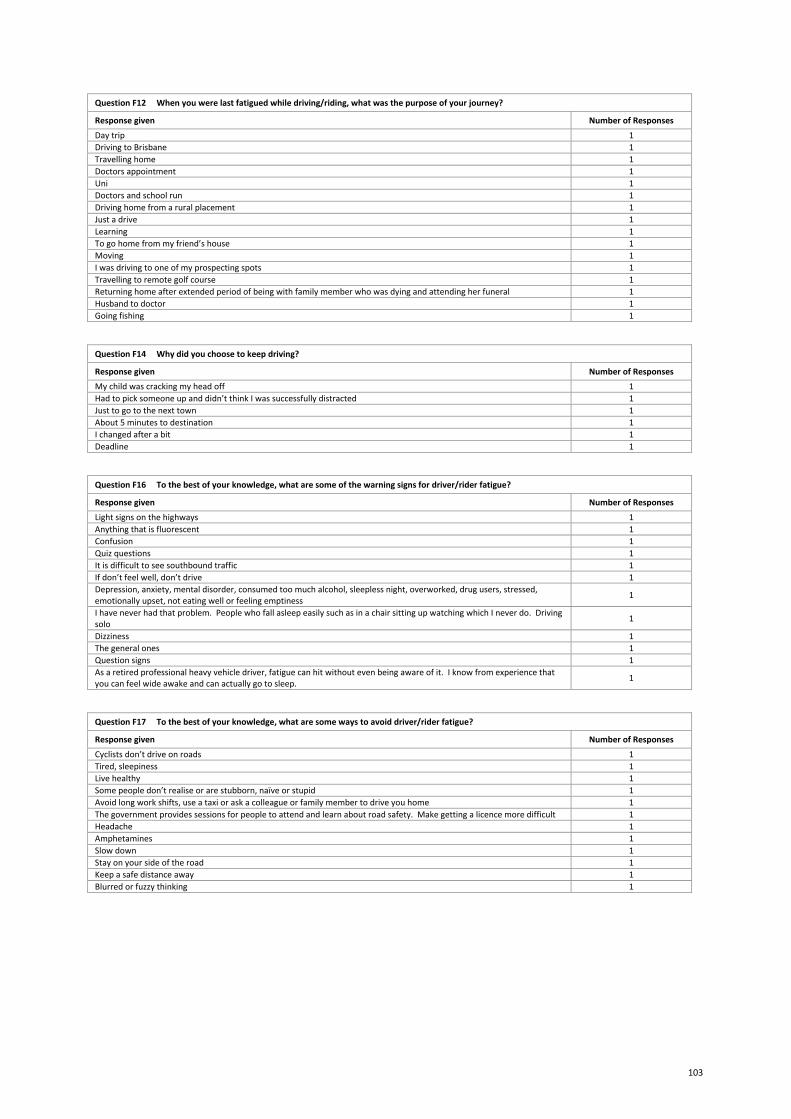
103
Question F12 When you were last fatigued while driving/riding, what was the purpose of your journey?
Response given Number of Responses
Day trip 1 Driving to Brisbane 1 Travelling home 1 Doctors appointment 1 Uni 1 Doctors and school run 1 Driving home from a rural placement 1 Just a drive 1 Learning 1 To go home from my friend’s house 1 Moving 1 I was driving to one of my prospecting spots 1 Travelling to remote golf course 1 Returning home after extended period of being with family member who was dying and attending her funeral 1 Husband to doctor 1 Going fishing 1
Question F14 Why did you choose to keep driving?
Response given Number of Responses
My child was cracking my head off 1 Had to pick someone up and didn’t think I was successfully distracted 1 Just to go to the next town 1 About 5 minutes to destination 1 I changed after a bit 1 Deadline 1
Question F16 To the best of your knowledge, what are some of the warning signs for driver/rider fatigue?
Response given Number of Responses
Light signs on the highways 1 Anything that is fluorescent 1 Confusion 1 Quiz questions 1 It is difficult to see southbound traffic 1 If don’t feel well, don’t drive 1 Depression, anxiety, mental disorder, consumed too much alcohol, sleepless night, overworked, drug users, stressed, emotionally upset, not eating well or feeling emptiness 1
I have never had that problem. People who fall asleep easily such as in a chair sitting up watching which I never do. Driving solo 1
Dizziness 1 The general ones 1 Question signs 1 As a retired professional heavy vehicle driver, fatigue can hit without even being aware of it. I know from experience that you can feel wide awake and can actually go to sleep. 1
Question F17 To the best of your knowledge, what are some ways to avoid driver/rider fatigue?
Response given Number of Responses
Cyclists don’t drive on roads 1 Tired, sleepiness 1 Live healthy 1 Some people don’t realise or are stubborn, naïve or stupid 1 Avoid long work shifts, use a taxi or ask a colleague or family member to drive you home 1 The government provides sessions for people to attend and learn about road safety. Make getting a licence more difficult 1 Headache 1 Amphetamines 1 Slow down 1 Stay on your side of the road 1 Keep a safe distance away 1 Blurred or fuzzy thinking 1
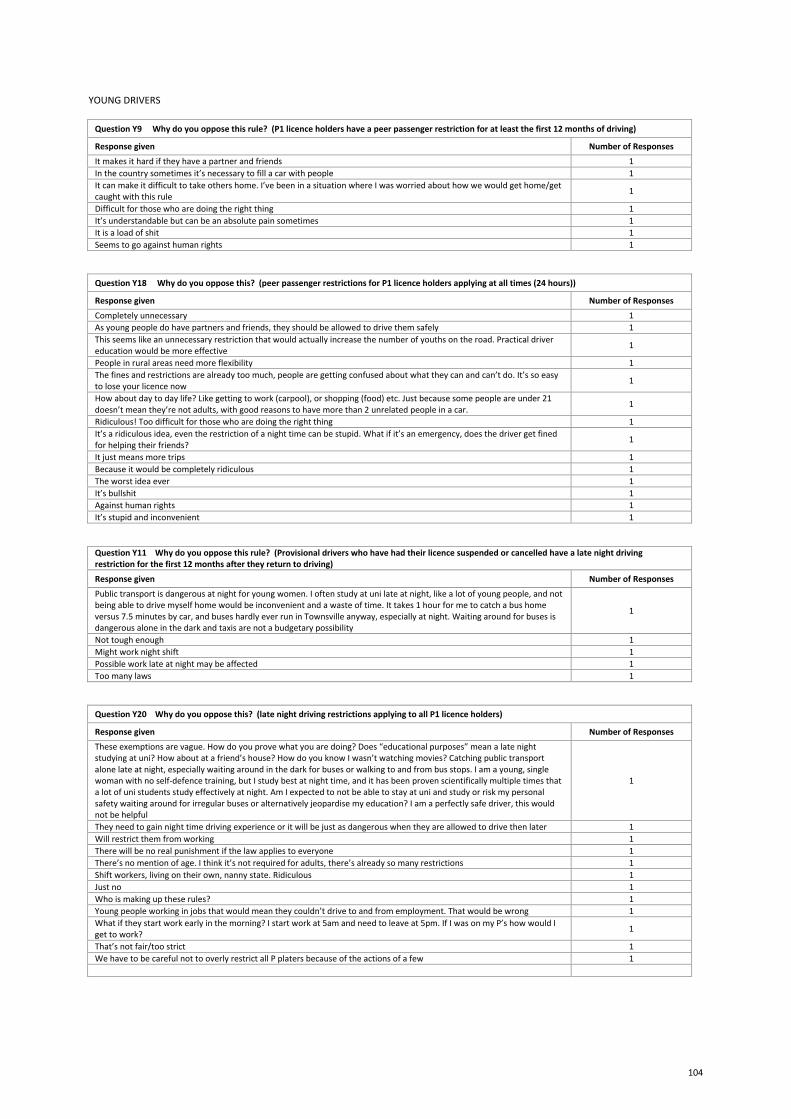
104
YOUNG DRIVERS Question Y9 Why do you oppose this rule? (P1 licence holders have a peer passenger restriction for at least the first 12 months of driving)
Response given Number of Responses
It makes it hard if they have a partner and friends 1 In the country sometimes it’s necessary to fill a car with people 1 It can make it difficult to take others home. I’ve been in a situation where I was worried about how we would get home/get caught with this rule 1
Difficult for those who are doing the right thing 1 It’s understandable but can be an absolute pain sometimes 1 It is a load of shit 1 Seems to go against human rights 1
Question Y18 Why do you oppose this? (peer passenger restrictions for P1 licence holders applying at all times (24 hours))
Response given Number of Responses
Completely unnecessary 1 As young people do have partners and friends, they should be allowed to drive them safely 1 This seems like an unnecessary restriction that would actually increase the number of youths on the road. Practical driver education would be more effective 1
People in rural areas need more flexibility 1 The fines and restrictions are already too much, people are getting confused about what they can and can’t do. It’s so easy to lose your licence now 1
How about day to day life? Like getting to work (carpool), or shopping (food) etc. Just because some people are under 21 doesn’t mean they’re not adults, with good reasons to have more than 2 unrelated people in a car. 1
Ridiculous! Too difficult for those who are doing the right thing 1 It’s a ridiculous idea, even the restriction of a night time can be stupid. What if it’s an emergency, does the driver get fined for helping their friends? 1
It just means more trips 1 Because it would be completely ridiculous 1 The worst idea ever 1 It’s bullshit 1 Against human rights 1 It’s stupid and inconvenient 1
Question Y11 Why do you oppose this rule? (Provisional drivers who have had their licence suspended or cancelled have a late night driving restriction for the first 12 months after they return to driving)
Response given Number of Responses
Public transport is dangerous at night for young women. I often study at uni late at night, like a lot of young people, and not being able to drive myself home would be inconvenient and a waste of time. It takes 1 hour for me to catch a bus home versus 7.5 minutes by car, and buses hardly ever run in Townsville anyway, especially at night. Waiting around for buses is dangerous alone in the dark and taxis are not a budgetary possibility
1
Not tough enough 1 Might work night shift 1 Possible work late at night may be affected 1 Too many laws 1
Question Y20 Why do you oppose this? (late night driving restrictions applying to all P1 licence holders)
Response given Number of Responses
These exemptions are vague. How do you prove what you are doing? Does “educational purposes” mean a late night studying at uni? How about at a friend’s house? How do you know I wasn’t watching movies? Catching public transport alone late at night, especially waiting around in the dark for buses or walking to and from bus stops. I am a young, single woman with no self‐defence training, but I study best at night time, and it has been proven scientifically multiple times that a lot of uni students study effectively at night. Am I expected to not be able to stay at uni and study or risk my personal safety waiting around for irregular buses or alternatively jeopardise my education? I am a perfectly safe driver, this would not be helpful
1
They need to gain night time driving experience or it will be just as dangerous when they are allowed to drive then later 1 Will restrict them from working 1 There will be no real punishment if the law applies to everyone 1 There’s no mention of age. I think it’s not required for adults, there’s already so many restrictions 1 Shift workers, living on their own, nanny state. Ridiculous 1 Just no 1 Who is making up these rules? 1 Young people working in jobs that would mean they couldn’t drive to and from employment. That would be wrong 1 What if they start work early in the morning? I start work at 5am and need to leave at 5pm. If I was on my P’s how would I get to work? 1
That’s not fair/too strict 1 We have to be careful not to overly restrict all P platers because of the actions of a few 1
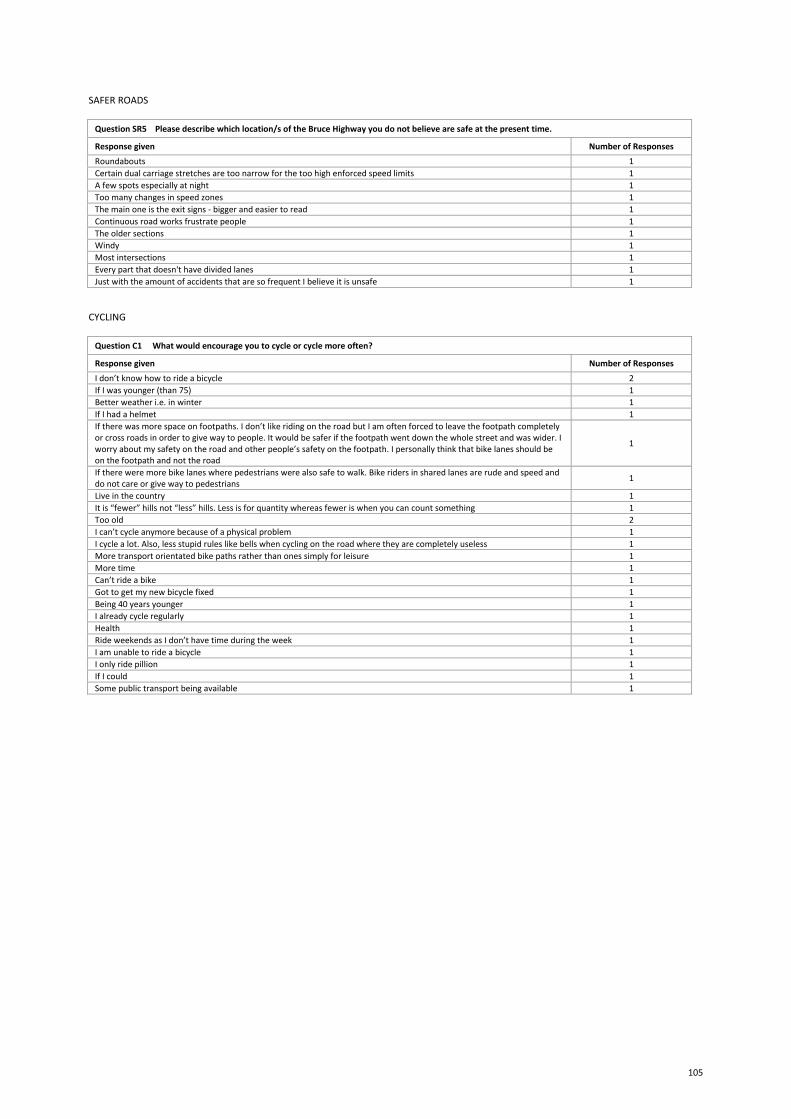
105
SAFER ROADS Question SR5 Please describe which location/s of the Bruce Highway you do not believe are safe at the present time.
Response given Number of Responses
Roundabouts 1 Certain dual carriage stretches are too narrow for the too high enforced speed limits 1 A few spots especially at night 1 Too many changes in speed zones 1 The main one is the exit signs ‐ bigger and easier to read 1 Continuous road works frustrate people 1 The older sections 1 Windy 1 Most intersections 1 Every part that doesn't have divided lanes 1 Just with the amount of accidents that are so frequent I believe it is unsafe 1
CYCLING Question C1 What would encourage you to cycle or cycle more often?
Response given Number of Responses
I don’t know how to ride a bicycle 2 If I was younger (than 75) 1 Better weather i.e. in winter 1 If I had a helmet 1 If there was more space on footpaths. I don’t like riding on the road but I am often forced to leave the footpath completely or cross roads in order to give way to people. It would be safer if the footpath went down the whole street and was wider. I worry about my safety on the road and other people’s safety on the footpath. I personally think that bike lanes should be on the footpath and not the road
1
If there were more bike lanes where pedestrians were also safe to walk. Bike riders in shared lanes are rude and speed and do not care or give way to pedestrians 1
Live in the country 1 It is “fewer” hills not “less” hills. Less is for quantity whereas fewer is when you can count something 1 Too old 2 I can’t cycle anymore because of a physical problem 1 I cycle a lot. Also, less stupid rules like bells when cycling on the road where they are completely useless 1 More transport orientated bike paths rather than ones simply for leisure 1 More time 1 Can’t ride a bike 1 Got to get my new bicycle fixed 1 Being 40 years younger 1 I already cycle regularly 1 Health 1 Ride weekends as I don’t have time during the week 1 I am unable to ride a bicycle 1 I only ride pillion 1 If I could 1 Some public transport being available 1
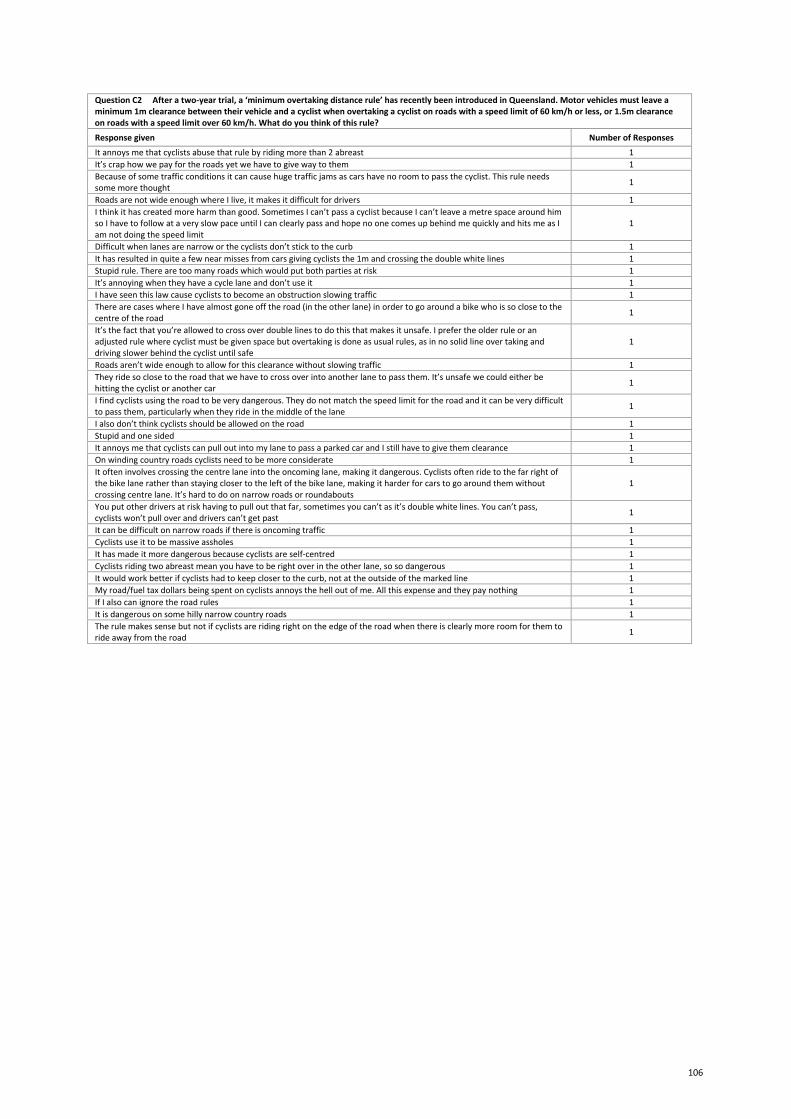
106
Question C2 After a two‐year trial, a ‘minimum overtaking distance rule’ has recently been introduced in Queensland. Motor vehicles must leave a minimum 1m clearance between their vehicle and a cyclist when overtaking a cyclist on roads with a speed limit of 60 km/h or less, or 1.5m clearance on roads with a speed limit over 60 km/h. What do you think of this rule?
Response given Number of Responses
It annoys me that cyclists abuse that rule by riding more than 2 abreast 1 It’s crap how we pay for the roads yet we have to give way to them 1 Because of some traffic conditions it can cause huge traffic jams as cars have no room to pass the cyclist. This rule needs some more thought 1
Roads are not wide enough where I live, it makes it difficult for drivers 1 I think it has created more harm than good. Sometimes I can’t pass a cyclist because I can’t leave a metre space around him so I have to follow at a very slow pace until I can clearly pass and hope no one comes up behind me quickly and hits me as I am not doing the speed limit
1
Difficult when lanes are narrow or the cyclists don’t stick to the curb 1 It has resulted in quite a few near misses from cars giving cyclists the 1m and crossing the double white lines 1 Stupid rule. There are too many roads which would put both parties at risk 1 It’s annoying when they have a cycle lane and don’t use it 1 I have seen this law cause cyclists to become an obstruction slowing traffic 1 There are cases where I have almost gone off the road (in the other lane) in order to go around a bike who is so close to the centre of the road 1
It’s the fact that you’re allowed to cross over double lines to do this that makes it unsafe. I prefer the older rule or an adjusted rule where cyclist must be given space but overtaking is done as usual rules, as in no solid line over taking and driving slower behind the cyclist until safe
1
Roads aren’t wide enough to allow for this clearance without slowing traffic 1 They ride so close to the road that we have to cross over into another lane to pass them. It’s unsafe we could either be hitting the cyclist or another car 1
I find cyclists using the road to be very dangerous. They do not match the speed limit for the road and it can be very difficult to pass them, particularly when they ride in the middle of the lane 1
I also don’t think cyclists should be allowed on the road 1 Stupid and one sided 1 It annoys me that cyclists can pull out into my lane to pass a parked car and I still have to give them clearance 1 On winding country roads cyclists need to be more considerate 1 It often involves crossing the centre lane into the oncoming lane, making it dangerous. Cyclists often ride to the far right of the bike lane rather than staying closer to the left of the bike lane, making it harder for cars to go around them without crossing centre lane. It’s hard to do on narrow roads or roundabouts
1
You put other drivers at risk having to pull out that far, sometimes you can’t as it’s double white lines. You can’t pass, cyclists won’t pull over and drivers can’t get past 1
It can be difficult on narrow roads if there is oncoming traffic 1 Cyclists use it to be massive assholes 1 It has made it more dangerous because cyclists are self‐centred 1 Cyclists riding two abreast mean you have to be right over in the other lane, so so dangerous 1 It would work better if cyclists had to keep closer to the curb, not at the outside of the marked line 1 My road/fuel tax dollars being spent on cyclists annoys the hell out of me. All this expense and they pay nothing 1 If I also can ignore the road rules 1 It is dangerous on some hilly narrow country roads 1 The rule makes sense but not if cyclists are riding right on the edge of the road when there is clearly more room for them to ride away from the road 1

107
Appendix C – fieldwork report Dates of fieldwork: Monday 11th April to Thursday 12th May, 2016 No. of invitations issued: Approx. 14,000 invitations for 1372 responses (600 completes, 155 incompletes, 324 screeners and 293 quota full) Average survey length: 32 mins
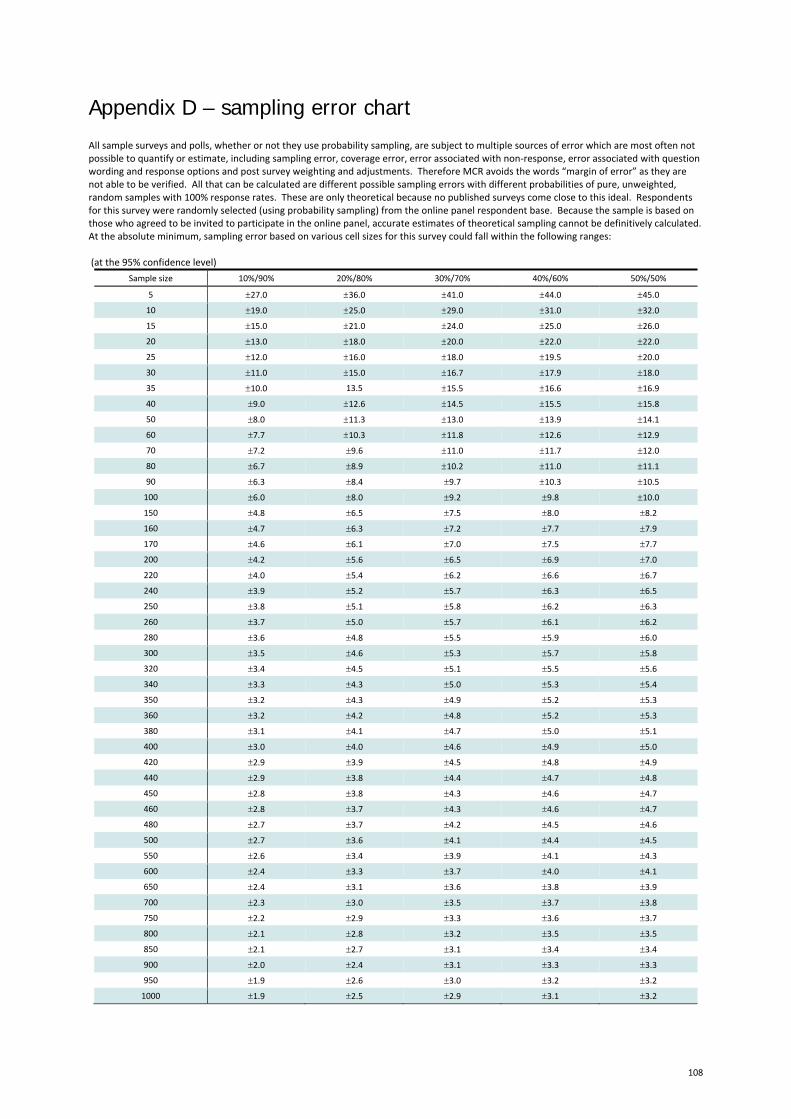
108
Appendix D – sampling error chart All sample surveys and polls, whether or not they use probability sampling, are subject to multiple sources of error which are most often not possible to quantify or estimate, including sampling error, coverage error, error associated with non‐response, error associated with question wording and response options and post survey weighting and adjustments. Therefore MCR avoids the words “margin of error” as they are not able to be verified. All that can be calculated are different possible sampling errors with different probabilities of pure, unweighted, random samples with 100% response rates. These are only theoretical because no published surveys come close to this ideal. Respondents for this survey were randomly selected (using probability sampling) from the online panel respondent base. Because the sample is based on those who agreed to be invited to participate in the online panel, accurate estimates of theoretical sampling cannot be definitively calculated. At the absolute minimum, sampling error based on various cell sizes for this survey could fall within the following ranges: (at the 95% confidence level)
Sample size 10%/90% 20%/80% 30%/70% 40%/60% 50%/50%
5 27.0 36.0 41.0 44.0 45.0
10 19.0 25.0 29.0 31.0 32.0
15 15.0 21.0 24.0 25.0 26.0
20 13.0 18.0 20.0 22.0 22.0
25 12.0 16.0 18.0 19.5 20.0
30 11.0 15.0 16.7 17.9 18.0
35 10.0 13.5 15.5 16.6 16.9
40 9.0 12.6 14.5 15.5 15.8
50 8.0 11.3 13.0 13.9 14.1
60 7.7 10.3 11.8 12.6 12.9
70 7.2 9.6 11.0 11.7 12.0
80 6.7 8.9 10.2 11.0 11.1
90 6.3 8.4 9.7 10.3 10.5
100 6.0 8.0 9.2 9.8 10.0
150 4.8 6.5 7.5 8.0 8.2
160 4.7 6.3 7.2 7.7 7.9
170 4.6 6.1 7.0 7.5 7.7
200 4.2 5.6 6.5 6.9 7.0
220 4.0 5.4 6.2 6.6 6.7
240 3.9 5.2 5.7 6.3 6.5
250 3.8 5.1 5.8 6.2 6.3
260 3.7 5.0 5.7 6.1 6.2
280 3.6 4.8 5.5 5.9 6.0
300 3.5 4.6 5.3 5.7 5.8
320 3.4 4.5 5.1 5.5 5.6
340 3.3 4.3 5.0 5.3 5.4
350 3.2 4.3 4.9 5.2 5.3
360 3.2 4.2 4.8 5.2 5.3
380 3.1 4.1 4.7 5.0 5.1
400 3.0 4.0 4.6 4.9 5.0
420 2.9 3.9 4.5 4.8 4.9
440 2.9 3.8 4.4 4.7 4.8
450 2.8 3.8 4.3 4.6 4.7
460 2.8 3.7 4.3 4.6 4.7
480 2.7 3.7 4.2 4.5 4.6
500 2.7 3.6 4.1 4.4 4.5
550 2.6 3.4 3.9 4.1 4.3
600 2.4 3.3 3.7 4.0 4.1
650 2.4 3.1 3.6 3.8 3.9
700 2.3 3.0 3.5 3.7 3.8
750 2.2 2.9 3.3 3.6 3.7
800 2.1 2.8 3.2 3.5 3.5
850 2.1 2.7 3.1 3.4 3.4
900 2.0 2.4 3.1 3.3 3.3
950 1.9 2.6 3.0 3.2 3.2
1000 1.9 2.5 2.9 3.1 3.2