RP-Thin Layer Chromatographic Method for the Quantification of Three Gingerol Homologs of...
22
For Review Only RP-thin layer chromatographic method for the quantification of three gingerol homologous and finger printing of ultrasonic-assisted fresh rhizome extracts of Zingiber officinale Collected from North Western Himalayas Journal: Journal of Separation Science Manuscript ID: jssc.200900629 Wiley - Manuscript type: Original Paper Date Submitted by the Author: 30-Sep-2009 Complete List of Authors: GUPTA, AJAI; IIIM-CSIR, Patent Cell Division GUPTA, SUPHLA; IIIM-CSIR, Plant biotechnology Division Keywords: Gingerols homologous , RP-TLC, Ultrasound extraction, Z. officinale Wiley-VCH Journal of Separation Science
-
Upload
independent -
Category
Documents
-
view
3 -
download
0
Transcript of RP-Thin Layer Chromatographic Method for the Quantification of Three Gingerol Homologs of...
For Review O
nly
RP-thin layer chromatographic method for the quantification of three gingerol homologous and finger printing of ultrasonic-assisted fresh rhizome extracts of
Zingiber officinale Collected from North Western Himalayas
Journal: Journal of Separation Science
Manuscript ID: jssc.200900629
Wiley - Manuscript type: Original Paper
Date Submitted by the Author:
30-Sep-2009
Complete List of Authors: GUPTA, AJAI; IIIM-CSIR, Patent Cell Division GUPTA, SUPHLA; IIIM-CSIR, Plant biotechnology Division
Keywords: Gingerols homologous , RP-TLC, Ultrasound extraction, Z. officinale
Wiley-VCH
Journal of Separation Science
For Review O
nly
RP-thin layer chromatographic method for the quantification of three gingerol homologous
and finger printing of ultrasonic-assisted fresh rhizome extracts of Zingiber officinale Collected
from North Western Himalayas
Imran Khan1, Pankaj Pandotra2, Ajai prakash Gupta3*, Rajni Sharma4, Bishan das Gupta4, Jagdish
kumar Dhar1, Y S Bedi2, Suphla Gupta*2,
1Quanlity Control & Assurance, Indian Institute of Integrative Medicine, Jammu-180001, Jammu &
Kashmir, India
2Plant
Biotechnology Department, Indian Institute of Integrative Medicine, Jammu-180001, Jammu
& Kashmir, India
3Patent Cell Division
, Indian Institute of Integrative Medicine, Jammu-180001, Jammu & Kashmir,
India
4Natural Product Chemistry, Indian Institute of Integrative Medicine, Jammu-180001, Jammu &
Kashmir, India
Key wards: Gingerols homologous; RP-TLC; Ultrasound extraction; Z. officinale
__________________________________________________________
*Corresponding author: Dr. Ajai Prakash Gupta; Patent Cell Division;
Indian Institute of Integrative Medicine, Canal Road; Jammu-180001, Jammu & Kashmir, India
Tel.: +91 1912569000; Ext: 341; Fax: +91-191-2569333
E-mail address: [email protected] (A. P. Gupta)
Page 1 of 21
Wiley-VCH
Journal of Separation Science
123456789101112131415161718192021222324252627282930313233343536373839404142434445464748495051525354555657585960
For Review O
nly
Abstract
A rapid and sensitive reversed phase high-performance thin-layer chromatographic (RP-HPTLC)
methodology was developed and validated for the quantitative estimation of gingerols in methanolic
extract of fresh ginger rhizome. The samples were chromatographed on RP-TLC glass plates pre-
coated with RP-18 60F254 as the stationary phase. Linear ascending development was carried out in
twin trough glass chamber saturated with ternary-solvent system consisting of acetonitrile-water-
formic acid (7:2:1, v/v/v) at room temperature (25±20C) and plates were scanned at 500nm. The
system was found to give compact spots for gingerols (Rf values of 6-gingerol 0.73±0.04, 8-gingerol
0.59±0.08 and 10-gingerol 0.36±0.05). Linearity were found to be in the range of 6-gingerol 140–
840 ng/spot , 8-gingerol 168-1008 ng/spot and 10-gingerol 136-816 ng/spot with significantly high
value of correlation coefficient. The linear regression analysis data for the calibration plots showed
linear relationship (r2) 0.9992 6-gingerol, 0.9957 8-gingerol and 0.9937 for 10-gingerol. Software
was used to quantify individual The method was used for routine analyses and to obtain relative
amount of the gingerols in the fresh rhizomes of the ginger cultivated in different locations of
Uttaranchal and Himachal Pradesh of North Western Himalayas (India).
Page 2 of 21
Wiley-VCH
Journal of Separation Science
123456789101112131415161718192021222324252627282930313233343536373839404142434445464748495051525354555657585960
For Review O
nly
1. Introduction
Ginger (Zingiber officinale Rosc.), a member of Zingiberaceae family, is grown in tropical
and subtropical regions for spice and medicinal purposes since thousands of years. It is used in
traditional systems of Indian, Tibbetian and Chinese medicines for the treatment of catarrh,
rheumatism, nervous diseases, gingivitis, toothache, asthma, stroke, constipation and diabetes. Z.
officinale, which is the main source of ginger, is cultivated on a large scale in India, China
Bangladesh, Taiwan, Jamaica and Nigeria from where it is exported to other countries of the world
[1]. Ginger, one of the best-known spices, is highly esteemed for its pleasant and aromatic odour and
warm and pungent taste. It is used in dried, preserved and green forms. Dried-ginger derived
products (oil and oleoresins) are used in neutraceuticals and pharmaceuticals and are valued more in
international trade than either of the other two forms. It is widely used for flavouring a great variety
of foods, for the preparation of extracts and oleoresin, and for the distillation of volatile oil. It is
categorized by the U.S. Food and Drug Administration as a Generally Regarded As Safe (GRAS)
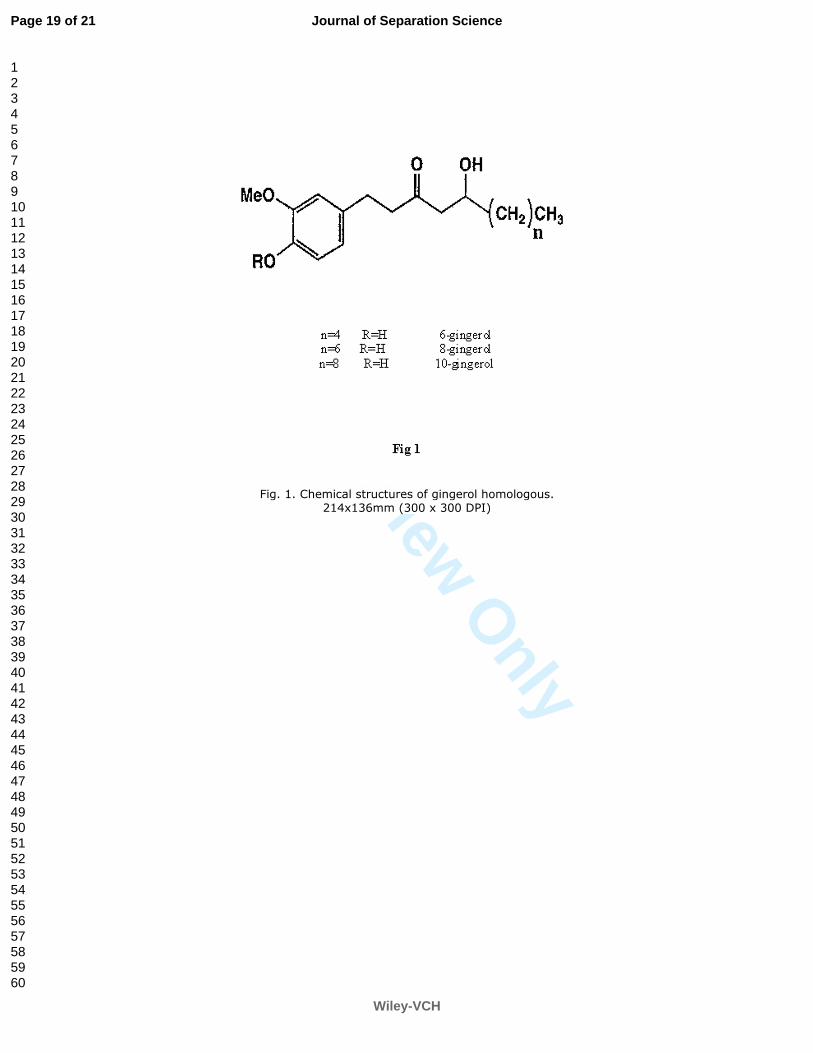
food additive. The major pungent compounds found in ginger are the gingerols [2,3]. 6-Gingerol (5-
hydroxy-1- (49-hydroxy-39-methoxyphenyl)-3-decanone) (Fig. 1) is one of the major bioactive
principles of ginger and has been shown to have a number of pharmacological activities such as
antipyretic, antitussive, hypotensive [4], cardiotonic [5], antiplatelet [6], antiangiogenic [7], anti-
inflammatory, analgesic [8], cytotoxic, apoptotic [9], antitumor [10], anticancer [11], antioxidant
[12], antihepatotoxic [13], antifungal [14], vanilloid receptor agonistic [1], cholagogic [15], and
antiemetic activity[16]. Ginger is among the 20 top-selling herbal supplements in the USA, and its
retail sales in mainstream US market (including only food stores, drug stores, and mass market retail
sales) in 2001 amounted to US $1.2 million. In Germany, ginger products are marketed for the
treatment of dyspepsia and prophylaxis of motion sickness. Today, pharmacopoeias of a number of
different countries list ginger extract for various diseases [17]. Because of the widespread use of
Page 3 of 21
Wiley-VCH
Journal of Separation Science
123456789101112131415161718192021222324252627282930313233343536373839404142434445464748495051525354555657585960
For Review O
nly
ginger as a spice, household remedy, and an ingredient of various natural health products,
standardization of ginger extracts becomes very important.
GC–MS has earlier been used to analyze gingerols in ginger extract [18,19]. Because the
main pungent principles 6, 8 and 10-gingerol, are thermally unstable and decompose under high
temperature during GC analysis, there were some artefacts detected. HPLC has also been used for
ginger analysis [20-26]. The combination of HPLC with UV photodiode array detection and mass
spectrometry offers on-line UV and mass spectra for each peak. It therefore supplies more data for
precise assignment of known compounds in a chromatogram. There are many different LC–MS
interfaces each with certain selectivity and their own restrictions [27]. LC/ESI MS/MS (LC/ESI-
MS/MS) coupled with diode array detection has also been utilized in identifying 6-gingerol and
related compounds from crude extracts of ginger rhizome [28]. Besides these, UV spectrophotometer
has also been used for the determination of 6-gingerol content in ginger rhizomes [29]. High-
performance TLC (HPTLC) method for the quantification of ginger extracts and geographical
variation without validation [30], determination of 6-gingerol as the marker compound in
rhizome[31], quantification of 6-gingerol in Ayurvedic formulation [32] and simultaneous
densitometric determination of 6-gingerol, 8-gingerol, 10-gingerol and 6-shogol in commercial
Indonesian ginger using carcinogenic toluene as one of the mobile phase [33] but till date no report is
available for the quantification 6,8 and 10-gingerol in fresh ginger rhizome collected from
Uttaranchal and Himachal Pradesh , the major ginger cultivating areas in North-western part of
Himalayas in India using RP-TLC.
Nowadays, HPTLC has become a routine analytical technique having advantages of being
reliable, cost effective and sensitive in quantitation of analytes at micro and nanogram levels. The
major advantage of HPTLC is several samples can be analyzed simultaneously using small quantity
of mobile phase unlike HPLC. This reduces the time and cost of analysis thereby being eco-friendly.
Page 4 of 21
Wiley-VCH
Journal of Separation Science
123456789101112131415161718192021222324252627282930313233343536373839404142434445464748495051525354555657585960
For Review O
nly
HPTLC also facilitates repeated detection (scanning) of the chromatogram with same or different
parameters. Simultaneous assay of several components in a multi-component formulation is possible.
The aim of the present work is to develop and validate fast, accurate, specific and
reproducible Reverse phase HPTLC method for quantification of 6,8,10 gingerols in fresh ginger
rhizomes. The progress in instrumentation has led HPTLC–densitometry to an improvement of the
reliability making this technique competitive with respect to HPLC–UV detection, so that a HPTLC–
densitometric approach should be taken as an alternative to HPLC. A simple Reverse phase TLC–
densitometric method is developed with successfully quantification of three gingerol homologues in
fresh ginger rhizome collected from different locations of Uttaranchal and Himachal Pradesh (India)
and grown in our experimental farm.
2. Experimental
2.1. Plant materials and chemicals
The plant materials were collected from various locations of Uttaranchal and Himachal
Pradesh of western Himalayas, India, in 2007 and grown in our experimental farm. The plants were
identified and the voucher specimens were deposited in the herbarium of the Institute (IIIM) at
Jammu for the reference. The ginger rhizome was cut into pieces and ground in mixer at room
temperature. Standards of 6, 8, and 10-gingerol were isolated and identified in our laboratory with
standard gingerols and also with LC- mass. All the reference standards were more than 98% pure.
The TLC plates RP-18 F254S (20 cm×10 cm) (E. Merck, Darmastadt, Germany) were used without
any pre-treatment. All chemicals and solvents used were of analytical grade (E. Merck, India).
2.2 Extraction of Plant Material
Extraction was carried out using ultrasonic bath (Elma, Germany). Fresh rhizomes (25g) were
extracted with 50 mL of methanol in ultrasonicator bath. Extraction was performed at 80%
(ultrasonic power) for 30–100 min. The temperature of the water bath was maintained at 40±2 0C by
Page 5 of 21
Wiley-VCH
Journal of Separation Science
123456789101112131415161718192021222324252627282930313233343536373839404142434445464748495051525354555657585960
For Review O
nly
changing the water of ultrasonicator bath at regular intervals. The optimum yield was obtained with
extraction time of 60 min in methanol.
2.3. Standard stock solutions
Stock solutions of standard 6, 8 and 10-gingerol were prepared by dissolving each of the standards in
methanol to obtain a desired concentration for quantification. Stock solutions were stored at −4◦C.
The concentration of reference standards used for calibration were 140-840 ng/spot 6-gingerol, 168-
1008 ng/spot 8-gingerol and 136-816 ng/spot in methanol. Different volumes of each samples were
spotted on to the RP-TLC plate to prepare a seven point calibration curves.
2.4. Chromatographic conditions
Standard solutions of 6, 8 and 10-gingerol, sample extracts of ginger rhizome and spiked
samples of ginger were applied on pre-coated RP-TLC plates, with the help of applicator Linomat IV
with a rate of 70 nl/s in the form of a 6mm band and 10 mm space from the bottom and left side. The
plates were developed in a filter-lined twin-trough chamber saturated for 30 min with 10 ml solvent
system of acetonitrile-water-formic acid (7:2:1 v/v/v). The plates were developed up to a distance of
about 75 mm and oven-dried at 600C for 5 minutes. After drying plates were dipped in cerium
ammonium sulphate reagent followed by heating at1200C for 10 minutes for post chromatographic
derivatization.
A Camag Video Documentation system in conjunction with the Reprostar 3 was used for
imaging and archiving the thin layer chromatograms. The object was captured after derivatization at
254 nm, 366 nm and white light by means of a high sensitive digital camera with 4.0M pixel CCD
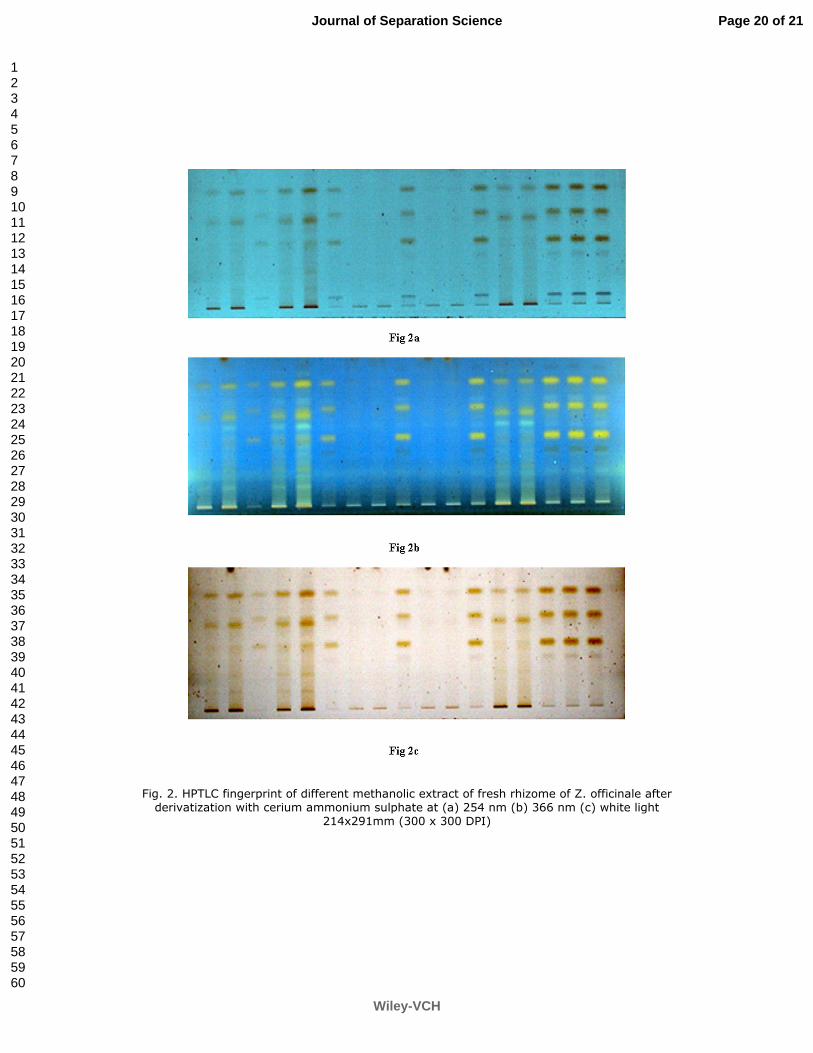
sensor and 3x optical zoom, model Power shot G2 (Canon, Singapore), Fig. 2(a-c). A special
digitizing board (frame grabber) assisted in rapid processing via the personal computer system.
Image acquisition processing and archiving were controlled via win CATS software.
2.5. Scanning
Page 6 of 21
Wiley-VCH
Journal of Separation Science
123456789101112131415161718192021222324252627282930313233343536373839404142434445464748495051525354555657585960
For Review O
nly
The plates were scanned by the Camag scanner III at a wavelength of 500 nm keeping the slit width
5.0X0.45 mm Micro and scanning speed 20 mm/s, data resolution 100um/step using Tungsten (W)
lamp in remission-absorption mode. The densitograms were further scanned for their in- situ UV
spectra from 300 to 800 nm.
2.6. Chromatography
Standard mix and sample solutions were applied band-wise (band length 6 mm, 70 nl/s delivery
speed, track distance 10.6 mm, distance from left edge 10 mm) to the RP-TLC plates. Plates were
developed at room temperature in a Camag twin trough developing chamber with acetonitrile–water–
formic acid (7:2:1 v/v/v) as mobile phase. The analytes were stable on the sorbent surface during
development. The plates were scanned within 1 hour after post chromatographic derivatization with
cerium sulphate solution followed by heating for 10 minutes.
3. Results and discussion
3.1 Optimization of chromatographic conditions
Various combinations of developing solvents with varying polarity were tested for achieving good
separation and compact band. After optimization of developing solvent with the given combination,
the plate showed good separation of all the three gingerol with Rf values of 0.73, 0.59 and 0.36,
respectively in acetonitrile–water–formic acid (7:2:1, v/v/v). All the compounds showed clear
separation and were used as references for the identification and quantification of 6, 8 and 10-
gingerol present in the methanolic extract (Fig.2) of rhizomes of Z. officinale collected from different
locations of Uttaranchal and Himachal Pradesh, India. Lower limits of detection obtained for 6, 8 and
10-gingerol were 23,32 and 21 ng/spot, respectively with good linearity ranging from 0.9992 to
0.9937 while the limit of quantification obtained were 140, 168 and 136 ng, respectively (Table 1).
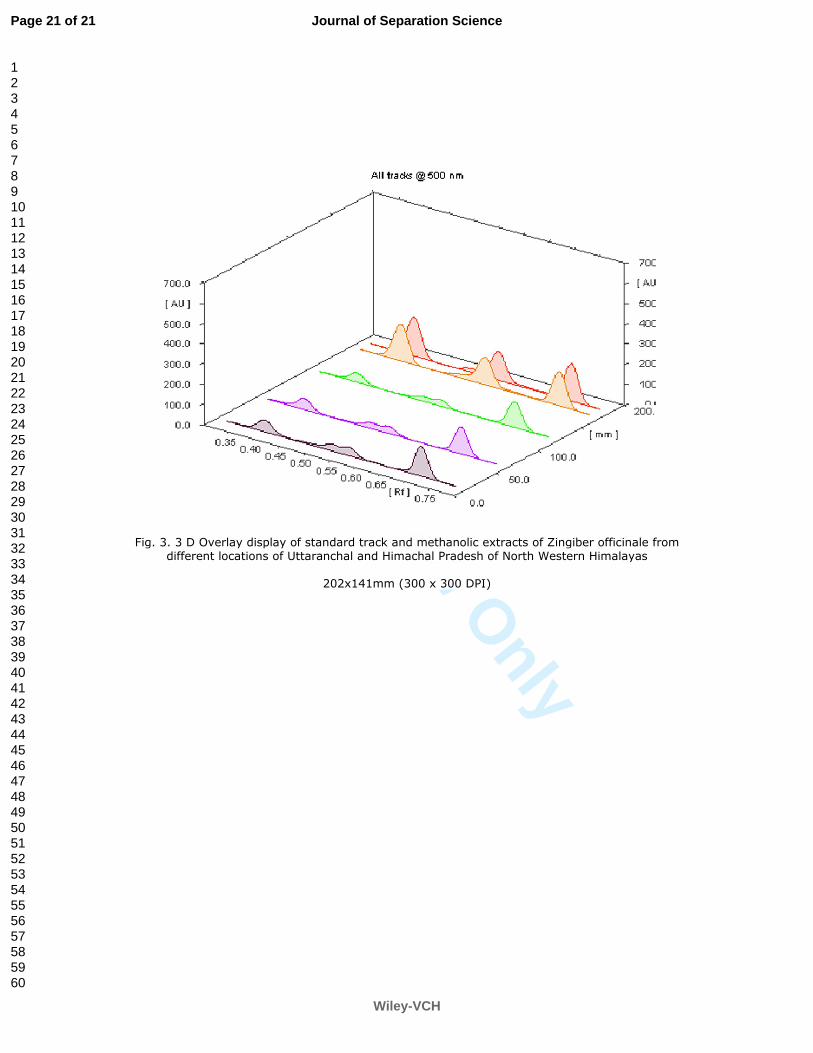
The mean Rf of 6, 8 and 10-gingerol were 0.73, 0.59 and 0.36. The densitograms of sample is
shown in Fig. 3. The identification of 6, 8, and 10-gingerol were done by matching the Rf of
gingerols in sample with that of standard gingerols and further it was confirmed by in situ UV
Page 7 of 21
Wiley-VCH
Journal of Separation Science
123456789101112131415161718192021222324252627282930313233343536373839404142434445464748495051525354555657585960
For Review O
nly
spectra of the above bands of the densitograms. The experimental conditions, such as mobile phase
composition, scan mode, scan speed and wavelength of detection were optimised to provide accurate
and precise results. Development with the mobile phase described above on the RP-TLC plate
produced compact, flat and dark bands of 6, 8 and 10-gingerol (Rf 0.73, 0.59 and 0.36) when viewed
under 254, 366 nm UV and white light. The gingerols band from the samples was confirmed by
comparing the UV absorption spectrum of the standard with the corresponding band at three different
points; start, mid and end in the sample. The relationship between the peak areas and the amount of
gingerols applied showed good linearity. The regression equation, correlation coefficient (r2) and
other statistical parameters are listed in Table 1. For routine analysis 5 point calibration curve was
used.
3.2 Quantification of 6, 8 and 10-gingerol
The quantitative determination was performed by winCATS software program using the external
calibration method. The experimental method standardized was employed to determine the 6, 8 and
10-gingerols of Z. officinale collected from different locations of Uttaranchal and Himachal Pradesh
of North Western Himalayas. The results showed interesting differences in the quantities of all the
three major gingerols. This variation was evident in the samples were collected from different ginger
growing farms of same district also (Table 2). In general, the lowest percentage of 6, 8, 10-gingerol
was 0.04, 0.03 and 0.02, respectively. The highest percentage of 6, 8, 10-gingerols was 1.31(6
gingerol), 2.30 (10 gingerol) and 0.65 (10 gingerol), respectively in their methanolic extracts. One of
the samples collected from Tehri district shows all the three gingerol homologs in higher percentage
6, 8 and 10-gingerol (1.31%, 2.15% and 0.45%) in comparison to the other samples. It is worth
mentioning that we, for the first time, are reporting quantification of 6, 8 and 10-gingerol in fresh
rhizome of Z. officinale and elucidating their variation in samples collected from different locations
by RP-TLC and finger printing. This fast and reliable method is more useful in quantifying ginger
samples in large samples on fresh weight basis. As with delay in analysis, due to variation in
Page 8 of 21
Wiley-VCH
Journal of Separation Science
123456789101112131415161718192021222324252627282930313233343536373839404142434445464748495051525354555657585960
For Review O
nly
moisture content quantification might give erroneous result in terms of gingerols present in fresh
weight basis.
3.3 Method validation
According to ICH guidelines [34], the specificity of an analytical method is an ability to assess the
analytes clearly in the presence of other analytes that may be expected to present in analyzing
samples. The specificity of the method is ascertained by analyzing reference compounds and
samples. The bands for compounds 6, 8 and 10-gingerols were confirmed by comparing the Rf and
the spectra of the bands with that of standards. Absence of any interfering peak indicated that the
method is specific. The peak purity of the analytes was assessed by comparing the spectra at three
levels, i.e., peak start, peak apex and peak end.
The present method was validated for linearity, precision, repeatability and accuracy. For
proving linearity seven calibration points were analyzed over the range of 140-840 ng/spot for 6-
gingerol, 168-1008 ng/spot for 8-gingerl and 136-816 ng/spot for 10-gingerol. For each point, three
measurements were made to improve repeatability. The mean peak areas from six different plates
were taken for the construction of calibration curve. The data were analyzed by linear regression
least square model and showed a good linear relationship over the tested range (r2 = 0.9992 for 6-
gingerol, r2 =0.9957 for 8-gingerol and r2 = 0.9937 for 10-gingerol). The linear regression equations
for 6-gingerol, 8-gingerol and 10-gingerol were y =866.6+6.226*X, y=198.6+6.892*X and y
=621.5+6.652*X, respectively.
3.4 Limit of detection and low limit of quantitation
In order to estimate the limit of detection (LOD) and lower limit of quantitation (LLOQ),
blank methanol was spotted six times following the same method as explained earlier. The signal to
noise ratio was determined. LOD was considered as 3:1 and LLOQ as 10:1. LOD was determined
based on the lowest concentration detected by the instrument from the standard while the LOQ was
determined based on the lowest concentration quantified in the sample.
Page 9 of 21
Wiley-VCH
Journal of Separation Science
123456789101112131415161718192021222324252627282930313233343536373839404142434445464748495051525354555657585960
For Review O
nly
3.5 Accuracy and Precision
Accuracy was assessed by comparing the results with the analysis of the standard reference
material over the range of 80–120% of the amount corresponding to the midpoint of the curve.
Accuracy assessed with the method of standard additions at three concentration levels (nine
replicates) gave good recoveries in the range were obtained by fortification of the samples at three
concentration levels for 6, 8 and 10-gingerols. The percent recoveries for all the three gingerol
homologous were in the range of 95.65 -101.45%. The instrumental precision was also determined
at all levels (6 replicates and 6 scanning runs) giving RSD values within 0.89% (third level) and
1.65% (lowest level). The inter- and intra-day precision (%RSD) were calculated by measurement of
peak area for the 6-gingerol 1.18 - 2.93%, 8-gingerol 1.28-2.11% and for 10-gingerol 1.68-2.43%
RSD for inter-day precision and Intra-day precision for 6-gingerol 0.74-1.47%, 8-gingerol 0.86-
1.32% and 10-gingerol 1.24-1.51% RSD were observed, which demonstrated that good precision of
proposed method(Table-3).
3.6 Robustness of the method
By introducing small changes in the mobile phase composition, the effects on the results were
examined. Mobile phases having different composition like acetonitrile–water–formic acid (7.5:1.5:1
v/v/v), acetonitrile–water–formic acid (6.5:2.5:1 v/v/v) acetonitrile–water–formic acid (7.5:2:0.5
v/v/v) acetonitrile–water–formic acid (7:1.5:1.5 v/v/v) acetonitrile–water–formic acid (7:2.5:0.5
v/v/v) were tried and chromatograms were run. The amount of mobile phase, time from spotting to
chromatography and from chromatography to scanning was varied from 20, 40 and 60 minutes.
Conclusion
The simplicity of sample preparation and the possibility to analyse several samples simultaneously in
less time make HPTLC the method of choice for quantification and fingerprint analyses.
Chromatography of 12 samples takes only 10 min. All in all, including application and evaluation,
the analysis of 14 samples requires about 45 min, i.e. 3 min per sample compared with 30–45 min
Page 10 of 21
Wiley-VCH
Journal of Separation Science
123456789101112131415161718192021222324252627282930313233343536373839404142434445464748495051525354555657585960
For Review O
nly
using HPLC method. In conclusion, rapidness, high-throughput and cost effectiveness of planar
chromatography should be preferred in this case, especially for routine applications, to the
comparatively more time-consuming and cost intensive HPLC. The results demonstrated that the
HPTLC method is feasible for the comprehensive quality evaluation of herbal products.
Acknowledgments
The authors are greatly acknowledge to Dr. Ram Vishwakarma (Director) and Dr. K. A. Suri for
their support.
Page 11 of 21
Wiley-VCH
Journal of Separation Science
123456789101112131415161718192021222324252627282930313233343536373839404142434445464748495051525354555657585960
For Review O
nly
References
[ 1] Dedov, V. N., Tran, V. H., Duke, C. C., Connor, M., et al., Br. J. Pharmacol. 2002, 137, 793–
798.
[2] Govindarajan, V. S., CRC Crit. Rev. Sci. Nutr. 1982, 17, 1–96.
[3] Govindarajan, V. S., CRC Crit. Rev. Sci. Nutr. 1982, 17, 189–258.
[4] Suekawa, M., Ishige, A., Yusas, K., Sudo, K., et al., J. Pharmacobiol. Dyn. 1984, 7, 836–848.
[5]Kobayashi, M., Shoji, N., Ohizumi, Y., Biochim. Biophys.Acta 1987, 903, 96–102.
[6] Guh, J. H., Ko, F. N., Jong, T. T., Teng, C. M., J. Pharm. Pharmacol. 1995, 47, 329–332.
[7] Kim, E. C., Min, J. K., Kim, T. Y., Lee, S. J., et al., Biochem. Biophys. Res. Commun. 2005, 335,
300–308.
[8] Young, H. Y., Luo, Y. L., Cheng, H. Y., Hsieh, W. C., et al., J. Ethnopharmacol. 2005, 96, 207–
210.
[9] Wei, Q. Y., Ma, J. P., Cai, Y. J., Yang, L., Liu, Z. L., J. Ethnopharmacol. 2005, 102, 177–184.
[10] Surh, Y. J., Park, K. K., Chun, K. S., Lee, L. J., et al., J. Environ. Pathol. Toxicol. Oncol. 1999,
18, 131–139.
[11] Dorai, T., Aggarwal, B. B., Cancer Lett. 2004, 215, 129–140.
[12] Masuda, Y., Kikuzaki, H., Hisamoto, M., Nakatani, N., Biofactors 2004, 21, 293–296.
[13] Hikino, H., Kiso, Y., Kato, N., Hamada, Y., et al., J. Ethnopharmacol. 1985, 14, 31–39.
[14] Ficker, C., Smith, M. L., Akpagana, K., Gbeassor, M., et al., Phytother. Res. 2003, 17, 897–902.
[15] Yamahara, J., Miki, K., Chisaka, T., Sawada, T., et al., J. Ethnopharmacol. 1985, 13, 217–225.
Page 12 of 21
Wiley-VCH
Journal of Separation Science
123456789101112131415161718192021222324252627282930313233343536373839404142434445464748495051525354555657585960
For Review O
nly
[16] Kawai, T., Kinoshita, K., Koyama, K., Takahashi, K., Planta Med. 1994, 60, 17–20.
[17] Capasso, F., Gaginella, T. S., Grandolini, G., Izzo, A. A., Phytotherapy: A Quick Reference to
Herbal Medicine, Springer- Verlag, Heidelberg, Germany 2003.
[18] Mukherjee, P. K., Drug Info. J. 2002, 63, 635–644.
[19] D.J. Harvey, J. Chromatogr., 1981, 212, 75-79.
[20] C.C. Chen, R.T. Rosen, C.T. Ho, J. Chromatogr. 1986, 360, 163-173.
[21] R.M. Smith, Chromatographia 1982, 16, 155-157.
[22] J.D. Baranowski, J. Chromatogr. 1985, 319, 471-474.
[23] C.C. Chen, M.C. Kuo, C.T. Ho, J. Food Sci. 1986, 51, 1364-1365.
[24] A.B. Wood, J Flavour and Fragrance. 1987, 2, 1-12.
[25] H. Wohlmuth, N. D. Leach, K. M. Smith, P. S. Myers, J Agri. Food Chemistry, 2005, 53, 5772-
5778.
[26] S. Lee, C. Khoo, W. C. Halstead, T. Huynh, A. Bensoussan, J. of AOAC International. 2007,
90, 1219-1226.
[27] X. Zhang, W.T. Iwaoka, A.S. Huang, S.T. Nakamoto, R.Wong, J. Food Sci. 1994, 59, 1338-
1343.
[28] Jiang, H., Solyom, B. N. A. M., Timmermann, B. N., Gang, D. R., Mass Spectrum 2005, 19,
2957–2964.
[29] Meng, Q., Feng, Y. F., Guo, X. L., Chen, G. F., Cai, J. C., Zhongguo Zhong Yao Za Zhi 2005,
30, 750–752.
Page 13 of 21
Wiley-VCH
Journal of Separation Science
123456789101112131415161718192021222324252627282930313233343536373839404142434445464748495051525354555657585960
For Review O
nly
[30] Sane, R. T., Phadke, M., Hijli, P. S., Shah, M., Patel, P. H., Indian Drugs 1998, 35, 37-44.
[31] Rai. S., Mukherjee K., Mal, M., Wahile, A., Saha, B. P., Mukherjee, P. K., J. Sep. Sci. 2006, 29,
2292 – 2295.
[32] Kumar, R. K., Mishra, S. K., J of Planar Chromatography-Modern TLC 2009, 22, 127-131.
[33] Melianita, F., Witha, J., Arifin, S., Wiwin, F., Indrayanto, G., J of Liquid Chromatography &
Related Technologies 2009, 32, 567-577.
[34] Q2A, ICH, Q2A (R1), Validation of Analytical Procedures: Text and Methodology,
International Conference on Harmonization, Geneva, (November 2005).
Page 14 of 21
Wiley-VCH
Journal of Separation Science
123456789101112131415161718192021222324252627282930313233343536373839404142434445464748495051525354555657585960
For Review O
nly
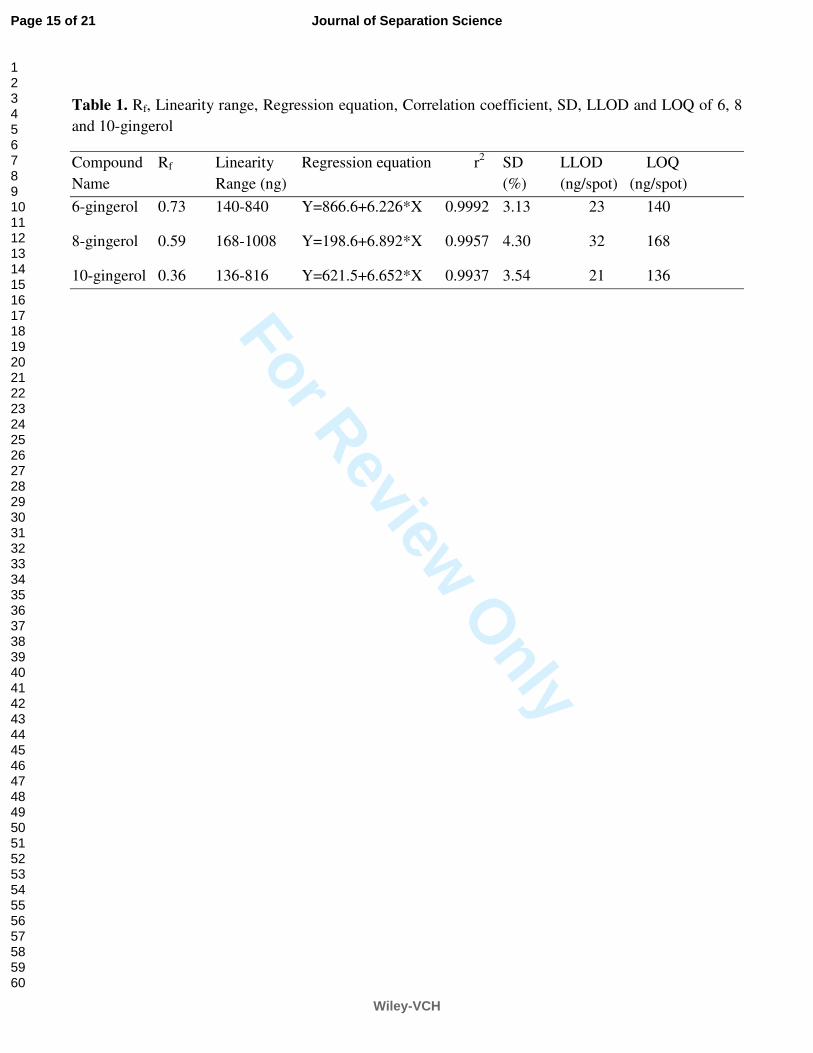
Table 1. Rf, Linearity range, Regression equation, Correlation coefficient, SD, LLOD and LOQ of 6, 8
and 10-gingerol
Compound Rf Linearity Regression equation r2
SD LLOD LOQ
Name Range (ng) (%) (ng/spot) (ng/spot)
6-gingerol 0.73 140-840 Y=866.6+6.226*X 0.9992 3.13 23 140
8-gingerol 0.59 168-1008 Y=198.6+6.892*X 0.9957 4.30 32 168
10-gingerol 0.36 136-816 Y=621.5+6.652*X 0.9937 3.54 21 136
Page 15 of 21
Wiley-VCH
Journal of Separation Science
123456789101112131415161718192021222324252627282930313233343536373839404142434445464748495051525354555657585960

For Review O
nly
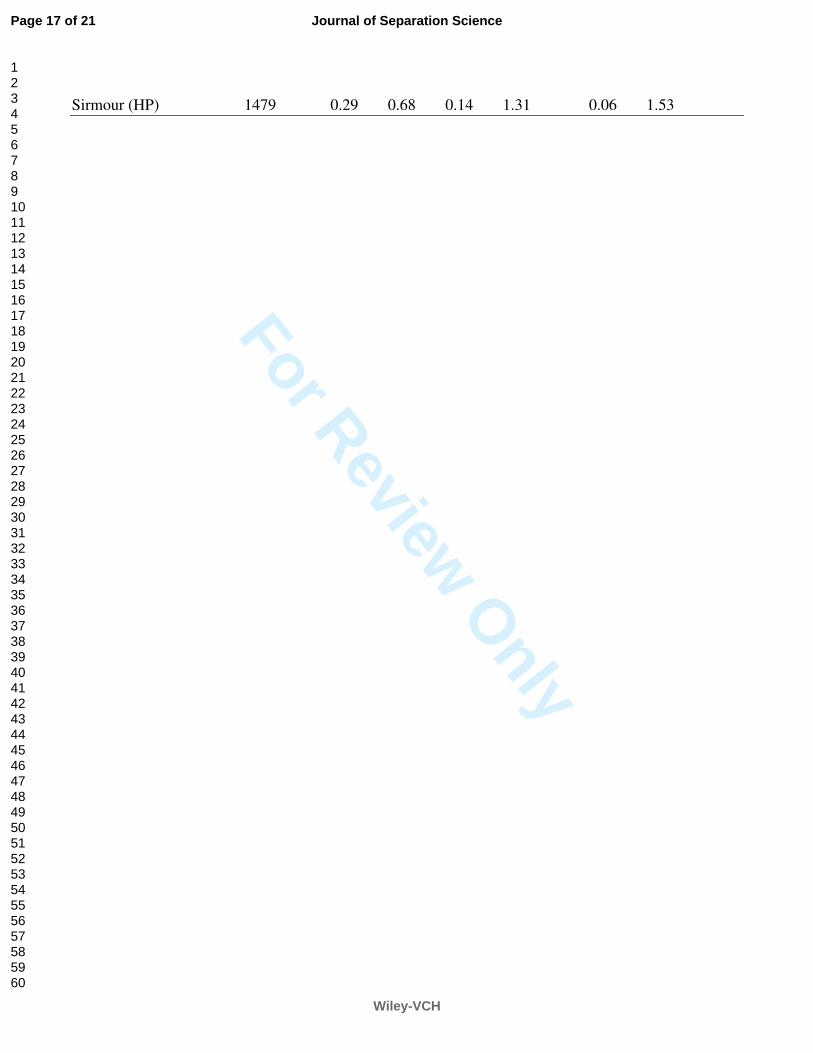
Table 2. %Amount of 6, 8 and 10-gingerol present in methanolic extract of fresh rhizome of Z.
officinale collected from different locations of Uttaranchal and Himachal Pradesh of North Western
Himalayas
Compound→ 6-gingerol 8-gingerol 10-gingerol
Locations↓ Height (mt) Av. (n=3)%RSD Av.(n=3)%RSD Av.(n=3) %RSD
Bhageshwar (UT) 960 0.17 0.84 0.20 0.54 0.08 1.21
Bhageshwar (UT) 960 0.36 0.45 0.40 0.76 0.09 1.55
Bhageshwar (UT) 960 0.04 1.21 0.03 1.65 tr -
Bhageshwar (UT) 960 0.06 1.32 0.06 0.87 tr -
Bhageshwar (UT) 960 0.08 0.88 0.16 0.46 0.03 1.43
Bhageshwar (UT) 960 0.26 0.79 0.24 0.98 0.12 1.31
Chamoli (UT) 960 0.24 0.36 0.41 0.65 0.13 0.76
Paurigarhwal (UT) 1650 0.14 0.76 0.22 1.12 0.10 1.54
Paurigarhwal (UT) 1650 0.08 1.89 0.15 0.79 tr -
Paurigarhwal (UT) 1650 0.08 0.56 2.03 0.32 0.43 0.28
Tehri (UT) 1600 0.20 0.43 2.30 0.65 0.65 1.15
Tehri (UT) 1600 0.05 0.89 0.19 0.56 0.03 0.52
Tehri (UT) 1600 1.31 0.76 2.15 0.82 0.45 0.54
Tehri (UT) 1600 0.25 0.48 0.18 0.78 0.09 1.42
Tehri (UT) 1600 0.12 1.45 0.14 1.43 0.02 1.89
Tehri (UT) 1600 0.11 0.92 tr - 0.03 1.22
Tehri (UT) 1600 0.12 0.48 tr - 0.05 1.11
Tehri (UT) 1600 0.12 0.69 tr - tr -
Tehri (UT) 1600 0.28 0.55 0.07 0.85 0.03 0.63
Tehri (UT) 1600 0.30 0.79 0.08 1.41 0.04 0.51
Tehri (UT) 1600 0.14 0.83 0.09 0.36 tr -
Nainital (UT) 2611 0.62 1.31 0.15 0.39 0.12 0.95
Nainital (UT) 2611 0.56 0.75 0.17 0.47 0.14 0.66
Page 16 of 21
Wiley-VCH
Journal of Separation Science
123456789101112131415161718192021222324252627282930313233343536373839404142434445464748495051525354555657585960
For Review O
nly
Sirmour (HP) 1479 0.29 0.68 0.14 1.31 0.06 1.53
Page 17 of 21
Wiley-VCH
Journal of Separation Science
123456789101112131415161718192021222324252627282930313233343536373839404142434445464748495051525354555657585960
For Review O
nly
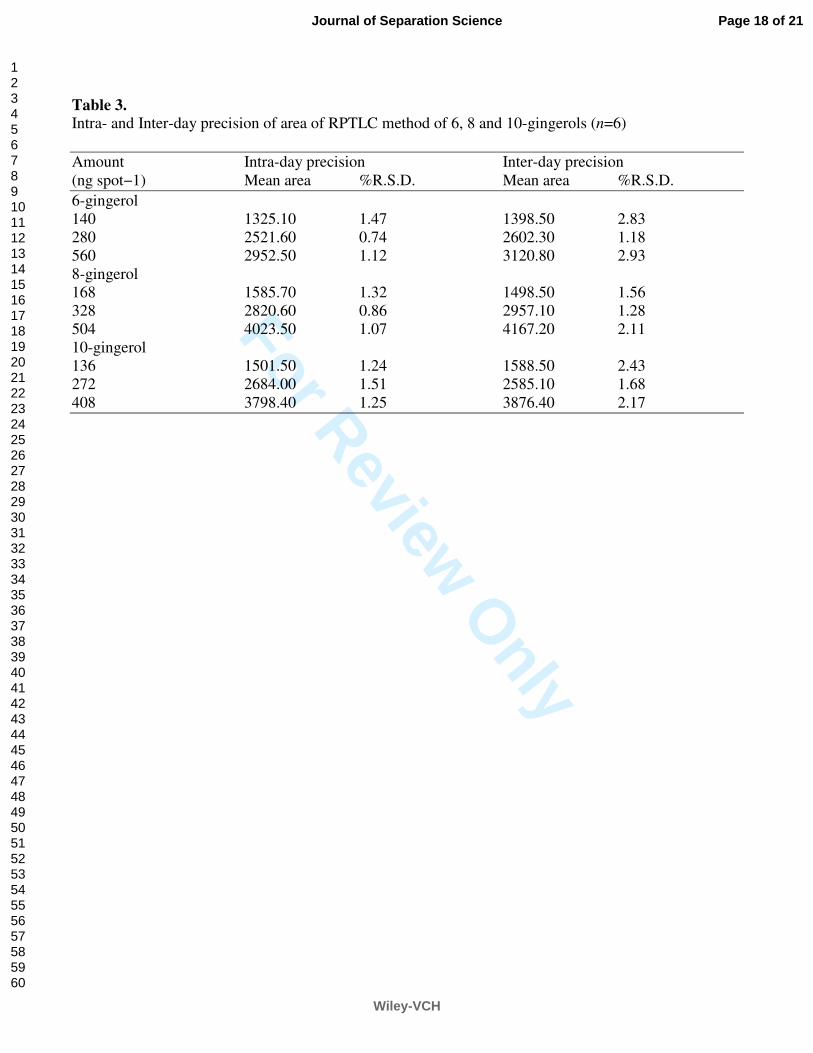
Table 3.
Intra- and Inter-day precision of area of RPTLC method of 6, 8 and 10-gingerols (n=6)
Amount Intra-day precision Inter-day precision
(ng spot−1) Mean area %R.S.D. Mean area %R.S.D.
6-gingerol
140 1325.10 1.47 1398.50 2.83
280 2521.60 0.74 2602.30 1.18
560 2952.50 1.12 3120.80 2.93
8-gingerol
168 1585.70 1.32 1498.50 1.56
328 2820.60 0.86 2957.10 1.28
504 4023.50 1.07 4167.20 2.11
10-gingerol
136 1501.50 1.24 1588.50 2.43
272 2684.00 1.51 2585.10 1.68
408 3798.40 1.25 3876.40 2.17
Page 18 of 21
Wiley-VCH
Journal of Separation Science
123456789101112131415161718192021222324252627282930313233343536373839404142434445464748495051525354555657585960
For Review O
nly
Fig. 1. Chemical structures of gingerol homologous. 214x136mm (300 x 300 DPI)
Page 19 of 21
Wiley-VCH
Journal of Separation Science
123456789101112131415161718192021222324252627282930313233343536373839404142434445464748495051525354555657585960
For Review O
nly
Fig. 2. HPTLC fingerprint of different methanolic extract of fresh rhizome of Z. officinale after derivatization with cerium ammonium sulphate at (a) 254 nm (b) 366 nm (c) white light
214x291mm (300 x 300 DPI)
Page 20 of 21
Wiley-VCH
Journal of Separation Science
123456789101112131415161718192021222324252627282930313233343536373839404142434445464748495051525354555657585960
For Review O
nly
Fig. 3. 3 D Overlay display of standard track and methanolic extracts of Zingiber officinale from different locations of Uttaranchal and Himachal Pradesh of North Western Himalayas
202x141mm (300 x 300 DPI)
Page 21 of 21
Wiley-VCH
Journal of Separation Science
123456789101112131415161718192021222324252627282930313233343536373839404142434445464748495051525354555657585960