ROTATIONALLY WARM MOLECULAR HYDROGEN IN THE ORION BAR
34
Rotationally Warm Molecular Hydrogen in the Orion Bar Gargi Shaw 1 , G. J. Ferland 2 , W. J. Henney 3 , P. C. Stancil 4 , N. P. Abel 5 , E.W. Pellegrini 6 , J.A. Baldwin 7 , & P. A. M. van Hoof 2 , 8 Abstract The Orion Bar is one of the nearest and best-studied photodissociation or photon-dominated regions (PDRs). Observations reveal the presence of H 2 lines from vibrationally or rotationally excited upper levels that suggest warm gas temperatures (400 to 700 K). However, standard models of PDRs are unable to reproduce such warm rotational temperatures. In this paper we attempt to explain these observations with new comprehensive models which extend from the H + region through the Bar and include the magnetic field in the equation of state. We adopt the model parameters from our previous paper which successfully reproduced a wide variety of spectral observations across the Bar. In this model the local cosmic-ray density is enhanced above the galactic background, as is the magnetic field, and which increases the cosmic-ray heating elevating the temperature in the molecular region. The pressure is further enhanced above the gas pressure in the H + region by the momentum transferred from the absorbed starlight. Here we investigate whether the observed H 2 lines can be reproduced with standard assumptions concerning the grain photoelectric emission. We also explore the effects due to the inclusion of recently computed H 2 + H 2 , H 2 + H and H 2 + He collisional rate coefficients. Subject headings: ISM : molecules — ISM: individual (Orion Bar) 1 Department of Astronomy and Astrophysics, Tata Institute of Fundamental Research, Mumbai-400-005, India; [email protected] 2 Department of Physics and Astronomy, University of Kentucky , Lexington, KY 40506; [email protected] 3 Centro de Radioastronomía y Astrofísica, UNAM Campus Morelia, Apartado Postal 3-72, 58090 Morelia, Michoacán, Mexico; [email protected] 4 Department of Physics and Astronomy and Center for Simulational Physics, University of Georgia, Athens, GA 30602; [email protected] 5 College of Applied Science, Department of Mathematics & Physics, University of Cincinnati, Cincinnati, OH, 452061; [email protected] 6 Physics and Astronomy Department, Michigan State University, 3270 Biomedical Physical Sciences Building, East Lansing, MI; [email protected] 7 Physics and Astronomy Department, Michigan State University, 3270 Biomedical Physical Sciences Building, East Lansing, MI; [email protected] 8 Royal Observatory of Belgium, Ringlaan 3, 1180 Brussels, Belgium; [email protected] 1
-
Upload
independent -
Category
Documents
-
view
5 -
download
0
Transcript of ROTATIONALLY WARM MOLECULAR HYDROGEN IN THE ORION BAR
Rotationally Warm Molecular Hydrogen in the Orion Bar
Gargi Shaw1, G. J. Ferland2, W. J. Henney3, P. C. Stancil4, N. P. Abel5, E.W.
Pellegrini6, J.A. Baldwin7, & P. A. M. van Hoof2,8
Abstract
The Orion Bar is one of the nearest and best-studied photodissociation or photon-dominated
regions (PDRs). Observations reveal the presence of H2 lines from vibrationally or rotationally
excited upper levels that suggest warm gas temperatures (400 to 700 K). However, standard models
of PDRs are unable to reproduce such warm rotational temperatures. In this paper we attempt to
explain these observations with new comprehensive models which extend from the H+ region
through the Bar and include the magnetic field in the equation of state. We adopt the model
parameters from our previous paper which successfully reproduced a wide variety of spectral
observations across the Bar. In this model the local cosmic-ray density is enhanced above the
galactic background, as is the magnetic field, and which increases the cosmic-ray heating elevating
the temperature in the molecular region. The pressure is further enhanced above the gas pressure in
the H+ region by the momentum transferred from the absorbed starlight. Here we investigate
whether the observed H2 lines can be reproduced with standard assumptions concerning the grain
photoelectric emission. We also explore the effects due to the inclusion of recently computed H2 +
H2, H2 + H and H2 + He collisional rate coefficients.
Subject headings: ISM : molecules — ISM: individual (Orion Bar)
1 Department of Astronomy and Astrophysics, Tata Institute of Fundamental Research, Mumbai-400-005, India; [email protected] Department of Physics and Astronomy, University of Kentucky , Lexington, KY 40506; [email protected] Centro de Radioastronomía y Astrofísica, UNAM Campus Morelia, Apartado Postal 3-72, 58090 Morelia, Michoacán, Mexico; [email protected] Department of Physics and Astronomy and Center for Simulational Physics, University of Georgia, Athens, GA 30602; [email protected] College of Applied Science, Department of Mathematics & Physics, University of Cincinnati, Cincinnati, OH, 452061; [email protected] 6 Physics and Astronomy Department, Michigan State University, 3270 Biomedical Physical Sciences Building, East Lansing, MI; [email protected] Physics and Astronomy Department, Michigan State University, 3270 Biomedical Physical Sciences Building, East Lansing, MI; [email protected] Royal Observatory of Belgium, Ringlaan 3, 1180 Brussels, Belgium; [email protected]
1
1. Introduction Molecular hydrogen (H2) is the most abundant molecule in the universe and it accounts for
much of the gas in Galactic and extragalactic interstellar clouds. Much of the of H2 emission
originates in photodisssociation regions (PDRs), which define a transition zone between an ionized
H+ region and cool molecular gas. Electronic fluorescence or photon-pumping causes the
temperature derived from line ratios involving high H2 levels to be higher than the kinetic
temperature, whereas the temperature derived from line ratios involving only low H2 levels traces
the kinetic temperature (van Dishoeck & Black 1986). However, in many PDRs, the temperature
derived from the low-level H2 line ratios is also higher than that derived from atomic fine structure
line ratios or the kinetic temperature (Wolfire et al. 2003, Timmermann et al. 1996, Fuente et al.
1999, Habart et al. 2003; 2004). Allers et al. (2005; hereafter A05) argue that the high H2
temperature in the Orion Bar measures the kinetic temperature and note that it is difficult to account
for the high derived temperature.
Recently Pellegrini et al. (2008, hereafter P08) extensively studied the Orion-Bar using multi-
wavelength (X-ray, optical, and IR) data. Their final model reproduced a wide variety of spectral
observations across the Orion-Bar and argued that the Bar has significant magnetic pressure
together with an enhanced cosmic-ray ionization rate.
The presence of a strong magnetic field is very common in star-forming regions. Earlier Houde
et al. (2004) have reported the presence of a magnetic field in Orion A and Rao et al. (1998) studied
the magnetic field structure of Orion using linearly polarized dust emission and reported a magnetic
field ≤ 35 µG in the H+ region. In addition to this, Abel et al. (2006) also discussed the B field in
the Veil, two layers of atomic gas in front of the nebula. So the inclusion of a magnetic field in the
P08 model is well justified.
This paper is a sequel to the paper by P08. Here we calculate the rotational temperature of H2
for the Bar, within the context of the P08 model. The challenge is to explain the rotationally warm
H2 observed in PDRs.
Several investigators have had difficulty in accounting for the observed temperatures, and have
suggested different sources of extra heating. Parmar et al. (1991) reported an excitation temperature
of 400-1000 K from emission of 0-0 S(1) and 0-0 S(2) lines in the Orion-Bar. A05 recently derived
various H2 excitation temperatures across the Orion-Bar (see their Table 4) and, assuming these to
be in local thermodynamical equilibrium with the surrounding gas, showed that standard grain
2
photoelectric emission physics could not produce enough heating to account for the temperature.
They used the I[0-0 S(1)]/I[0-0 S(2)] and I[0-0 S(4)]/I[0-0 S(2)] line ratios to calculate excitation
temperatures of 400-700 K. The lines are due to optically thin spontaneous radiative transitions and
so the line intensities are proportional to the column density of the upper level. Hence, the line ratio
I[0-0 S(1)]/I[0-0 S(2)] is proportional to N(0,3) and N(0,4) where N(v,J) corresponds to the column
density of the v, J rovibrational state. The excitation temperature tul is defined from the ratios of
column densities N(v,J) as
/( , ) /ln( , ) /
ulul
u u u
l l l
E ktN v J gN v J g
∆= −
⎡ ⎤⎢ ⎥⎣ ⎦
[K]. (1)
where u and l are the upper and lower states, respectively. So the excitation temperature t43 is
derived from the ratios of the column densities of N(0,4) and N(0,3). Similarly, the t64 excitation
temperature derived from I[0-0 S(4)]/I[0-0 S(2)] is proportional to the column density ratios of
N(0,6) and N(0,4). If photon pumping is important then the level populations will be super-thermal
as discussed below. If these levels are thermalized then tul is equal to the gas kinetic temperature
and we find the conundrum posed by A05.
Recently Henney et al. (2007) have studied the merged ionization / dissociation front in the
Helix nebula and reproduced the high observed luminosity in H2 lines together with the high
excitation temperature with the help of steady state dynamics. We do not consider dynamics in the
current models, which is justified because the direct effects of dynamics on the global emission
properties are likely to be much smaller in the Orion Bar than in the Helix knots, due to the much
higher ionization parameter (Henney et al 2005a).
In this paper we show the spatial variation of several H2 level populations across the Orion-Bar
and predict t43 and t64 together with the intensities of 1-0 S(1), 0-0 S(2) and 0-0 S(4) lines. We
perform numerical simulations with the recently developed model of H2 that is part of the spectral
simulation code Cloudy (Shaw et al. 2005) and explicitly include the H + region as part of the
calculation. This allows us to include the starlight momentum in the gas equation of state.
2. Calculations All numerical calculations are performed using the version 08.00 of the numerical spectral
simulation code Cloudy, last described by Ferland et al. (1998). This code is based on a self-
consistent calculation of the thermal, ionization, and chemical balance of gas and dust exposed to a
3
source of radiation. Our chemical network consists of ~103 reactions with 71 species containing
hydrogen, helium, carbon, nitrogen, oxygen, silicon, sulfur, and chlorine (Abel et al. 2005). Further,
we include silicate and graphite size-resolved grains and determine the grain charges and
photoelectric heating self-consistently (van Hoof et al. 2004).
2.1. The hydrogen molecule Our treatment of H2 is described in Shaw et al. (2005, hereafter S05; 2008) and is briefly
discussed here. We use a detailed H2 chemistry network, consisting of various state-specific
formation and destruction processes. We include all 301 bound levels within the ground electronic
state, and all levels within the lowest six electronic excited states which are coupled to the ground
electronic state by permitted electronic transitions. H2 is predominantly formed on dust grains in the
ISM. Theoretical (Cazaux &Tielens 2002) and observational (Habart et al. 2004) studies of H2
formation on grain surfaces are available. As these results are consistent, we adopted the H2
formation model of Cazaux & Tielens (2002). We also consider H2 formation via associative
detachment (H- + H0 → H2 + e-).These exothermic formation processes produce H2 in excited
vibrational and rotational levels, often referred to as formation pumping. H2 is destroyed mainly via
the Solomon process (electronic fluorescence) when the gas is optically thin to the H2 electronic
lines. Most electronic excitations of H2 result in decays to highly excited vibrational and rotational
levels of the ground electronic state (Solomon pumping), which further decay via quadrupole
transitions (Tielens & Hollenbach 1985, Black & van Dishoeck 1987, Abgrall et al. 1992). H2 can
also be collisionally dissociated from high vibrotational levels. We also consider excitation to the
triplet and singlet (B, C, B΄, and D) states via secondary electrons produced by cosmic rays
following Dalgarno et al. (1999) and Liu & Dalgarno (1994); this effect eventually populates the
vibrational and rotational levels of the ground electronic state. For further details see section 2.1 and
eqn. 2 of Shaw et al. (2008). Radiative decays between ortho- and para- H2 states are not possible
because of their different nuclear spin. However, exchange collisions with H, H+, and H3+ can
convert ortho-H2 into para-H2. As a result of these processes (for which we have included all
available data), H2 will not be in local thermodynamic equilibrium (LTE) with the surrounding gas
in the Solomon-dominated region where its electronic lines are optically thin. Therefore, the ortho-
para ratio (and the purely rotational H2 line emission) may not trace the kinetic temperature in many
astrophysical environments.
4
Collisions play an important role in determining the level populations and so it is always vital to
use accurate collisional rate coefficients. We have incorporated new data for several collisional
processes since the publication of S05. In this paper we use the updated non-reactive H2 + H
collisional rates from Wrathmall et al. (2007) which are orders of magnitude larger than the
previously used data from Le Bourlot et al. (1999) for vibrational transitions. Though the
calculations of Wrathmall et al. (2007) are quantum mechanical and adopted the most recent H3
potential energy surface, uncertainty still remains due to their neglect of reactive scattering
processes. In addition, we also use updated H2 + He collisional data from Lee et al. (2005, 2008b).
Recently Lee et al. (2006, 2008a) have performed an extensive quantum mechanical calculation for
H2 + H2 collisions using a reliable potential energy surface (Diep & Johnson 2000). Their rate-
coefficients show significant differences with those adopted in Le Bourlot et al. (1999), particularly
below 200 K. In Cloudy, an option has been added to allow for the selection of the new Lee et al.
(2008a) rate coefficients.
2.2. Cloud geometry Classically, a PDR is defined as a region where hydrogen is in atomic or molecular form and is
illuminated by far ultraviolet (FUV) (6 eV < hν < 13.6 eV) photons. However, these regions are not
isolated; they are adjacent to an H II or H+ region if the central star is hot enough. Therefore, the
ionized region, PDR, and molecular cloud are coupled to each other via proximity and dynamics. So,
instead of the classical-isolated PDR model, we simulate the full environment as it occurs in nature
– the incident continuum propagates from the H+ region into the molecular cloud through the PDR.
The radiative transport of the full continuum, from radio through x-rays, is followed including line
overlap for the hundreds of thousands of electronic transitions that determine the excitations and
destruction of H2. Further details are given in Abel et al. (2005), while Kaufmann et al. (2006) have
performed a similar type of calculation.
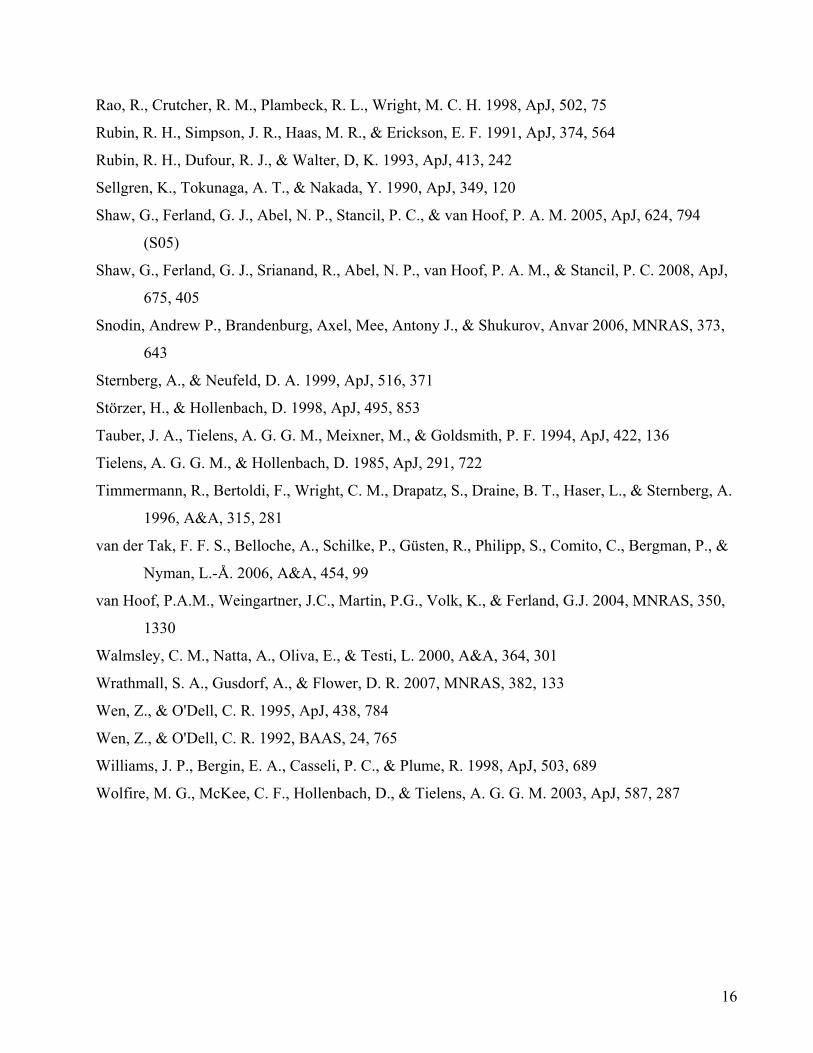
The Orion-Bar PDR is located in the Orion molecular cloud ~2′ southeast of the Trapezium
cluster. Figure 1a shows a cross-section through the Orion-Bar perpendicular to the plane of the sky.
The Bar is seen nearly edge on and so has been an important test of PDR physics (Osterbrock &
Ferland 2006; section 8.5).
We calculate one-dimensional, static models in a plane-parallel slab geometry. We assume that
the FUV radiation emitted by the Trapezium Cluster is dominated by θ1 Ori C. These models are an
5
approximation to the physical structure of the Bar along an extension of the dotted line in Figure 1a
marked “0.114 pc”.
To model the geometry shown in Figure 1a we calculate the physical properties along the
direction of the radiation field and then integrate this along the line of sight through the cloud. This
1D approximation is an obvious oversimplification but one that is common in simulations of
irradiated molecular gas. As shown in Figure 1a, the simplest model of the Bar is a slab viewed
from a particular angle (Wen & O'Dell 1992; Henney et al. 2005b, Walmsley et al. 2000). Figure 3
of P08 shows the idealized geometry used in our calculation. Once the model is calculated the
predicted surface brightnesses of the emission lines can be calculated by integrating over the
geometry. We take the geometry to be a tilted slab with line of sight length h, angle θ, and a radial
distance r from the ionizing source θ1 Ori C. Then, using the volume emissivity of each line
predicted by Cloudy as a function of r from θ1 Ori C, we step along the x axis in intervals of dx and
integrated the emissivity ε(r(x,y)) along the line of sight depth y in steps of dy. The contribution of
the emissivity to the observed surface is corrected for internal reddening through the cloud along y
during the integration using a dust reddening law consistent with the Orion Nebula.
2.3. Model parameters
The geometry within the inner regions of the Orion Nebula is well constrained by observations.
The equation of state, the relationship between the gas density, temperature, and depth into the Bar,
is critical since the calculations will extend from hot (T ≈ 104 K) ionized regions, into the warm
predominantly atomic PDR, and eventually into cold molecular gas. Our adopted model parameters
are taken from P08 and are listed in Table 1. We take the number of ionizing photons emitted by the
star to be Q(H) =1048.99 s-1 as described in P08. The stellar continuum is based on a Kurucz model
with Teff = 39,700 K modified to reproduce the [Ne III] and near IR lines observed in the Orion
nebula (Rubin 1991). We include the effects of X-rays by considering bremsstrahlung at 106 K with
an integrated luminosity Lx = 1032.6 erg s-1 over the 0.5–8 keV passband (Feigelson et al. 2005). The
electron density within the illuminated H+ layer of the Bar is measured to be ne ≈ 103.2 cm-3 (Pogge
et al. 1992). Our grain type is the same as given in Baldwin et al. (1991) with Rv = 5.5. We use a
modified MRN (Mathis et al. 1977) size distribution of grains, i.e, 3.5dn ada−∝ where a is the
radius of the grain and n is the number of grains with a radius between a and a+da. In our model we
6
consider 10 size bins with amin = 0.03 µm and amax = 0.25 µm. The mean size of these grains is
larger than the standard MRN grains with Rv = 3.1 due to the lack of small particles. We also
include PAHs (nPAH/nH0 = 3×10⁻⁷) with a power-law distribution of PAH sizes with 10 size bins,
according to Abel et al. (2008).
The magnetic field strength in Orion’s Veil is known to be large (Abel et al. 2004) and this can
affect the physical conditions. Based on that we include a magnetic field / 2
00
nB Bn
γ⎛ ⎞
= ×⎜ ⎟⎝ ⎠
where B
and n are the magnetic field and the gas density at the illuminated face of the cloud and γ depends
on the geometry of the system. We use γ =2 in our model which corresponds to plane parallel
compression perpendicular to the field lines. Our model includes enhanced cosmic ray effects
assuming that cosmic rays are trapped in the magnetic field and their density is enhanced along with
the magnetic field strength. The cosmic-ray density is given by
0
0
00
( )( , ) ( , )( )
U Bn cr B n cr BU B⎛ ⎞
= ⎜⎝ ⎠
⎟ cm-3,
where U(B) and U(B ) are the energy densities of the local magnetic field relative to the galactic
background magnetic field. The heating and ionization effects of the cosmic-rays are included
accounting for this energy density and the local ionization fraction of the gas. We also include the
cosmic microwave background (CMB).
0
We use the gas-phase abundances listed in Table 2, which are primarily derived from
observations of the Orion Nebula by Baldwin et al. (1991), Rubin et al. (1991, 1993) and
Osterbrock et al. (1992). The Ne abundance found by Baldwin et al. (1991) was affected by the
stellar atmosphere used in that paper, so we have adopted the Osterbrock et al.(1992) value.
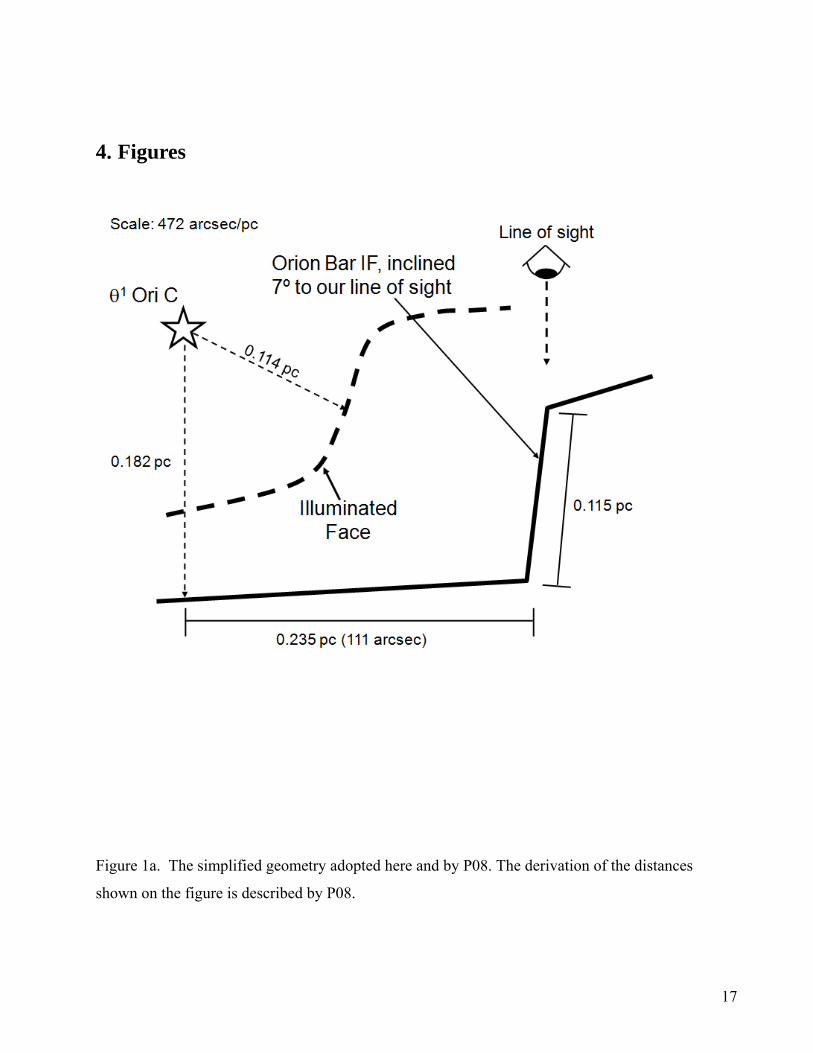
2.4. A ray into the Bar Figures 1b and 1c show the hydrogen-ionization structure without and with an enhanced
cosmic-ray ionization rate, respectively. The effect of the enhancement is most prominent at the
shielded face of the cloud and as a natural consequence of increased ionization of H2 , the density
of H+ and H0 are larger at the shielded face. Figures 1d and 1e show the temperature profile, and
various heating mechanisms without and with an enhanced cosmic-ray ionization rate, respectively.
At the shielded face of the enhanced cosmic-ray ionization model, heating is dominated by cosmic
ray ionization and the temperature is also higher. Similarly, figures 2a and 2b show the variation of
7
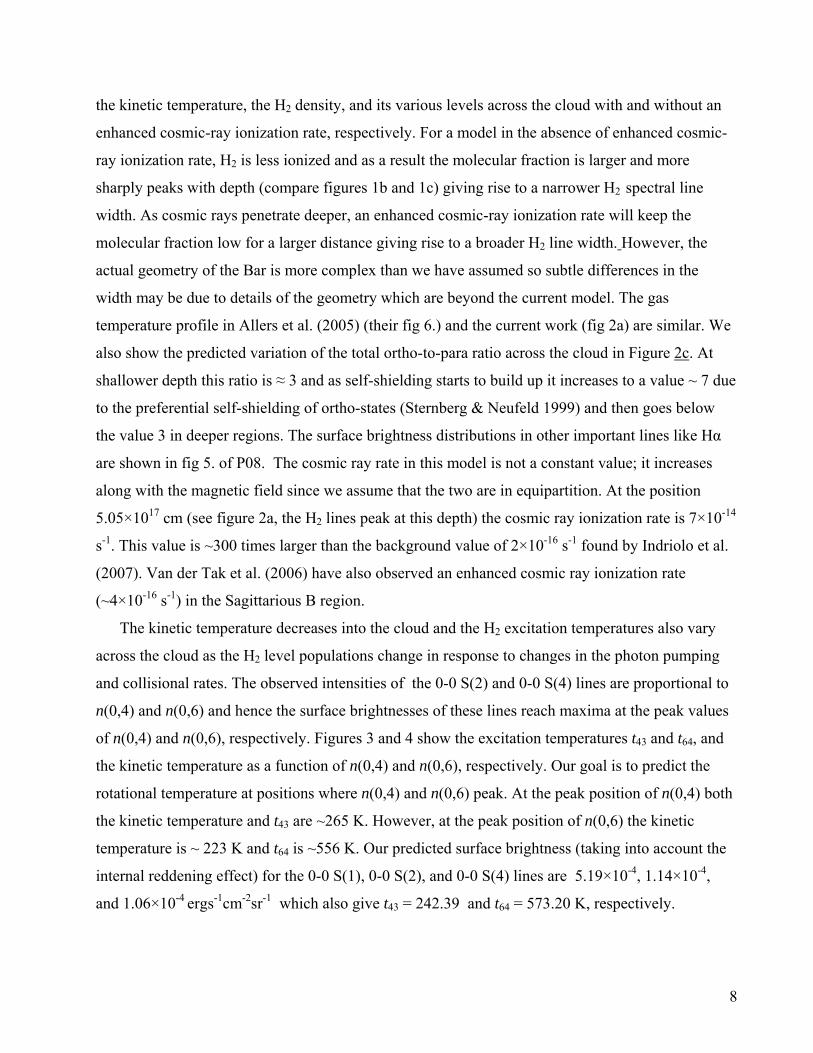
the kinetic temperature, the H2 density, and its various levels across the cloud with and without an
enhanced cosmic-ray ionization rate, respectively. For a model in the absence of enhanced cosmic-
ray ionization rate, H2 is less ionized and as a result the molecular fraction is larger and more
sharply peaks with depth (compare figures 1b and 1c) giving rise to a narrower H2 spectral line
width. As cosmic rays penetrate deeper, an enhanced cosmic-ray ionization rate will keep the
molecular fraction low for a larger distance giving rise to a broader H2 line width. However, the
actual geometry of the Bar is more complex than we have assumed so subtle differences in the
width may be due to details of the geometry which are beyond the current model. The gas
temperature profile in Allers et al. (2005) (their fig 6.) and the current work (fig 2a) are similar. We
also show the predicted variation of the total ortho-to-para ratio across the cloud in Figure 2c. At
shallower depth this ratio is ≈ 3 and as self-shielding starts to build up it increases to a value ~ 7 due
to the preferential self-shielding of ortho-states (Sternberg & Neufeld 1999) and then goes below
the value 3 in deeper regions. The surface brightness distributions in other important lines like Hα
are shown in fig 5. of P08. The cosmic ray rate in this model is not a constant value; it increases
along with the magnetic field since we assume that the two are in equipartition. At the position
5.05×1017 cm (see figure 2a, the H2 lines peak at this depth) the cosmic ray ionization rate is 7×10-14
s-1. This value is ~300 times larger than the background value of 2×10-16 s-1 found by Indriolo et al.
(2007). Van der Tak et al. (2006) have also observed an enhanced cosmic ray ionization rate
(~4×10-16 s-1) in the Sagittarious B region.
The kinetic temperature decreases into the cloud and the H2 excitation temperatures also vary
across the cloud as the H2 level populations change in response to changes in the photon pumping
and collisional rates. The observed intensities of the 0-0 S(2) and 0-0 S(4) lines are proportional to
n(0,4) and n(0,6) and hence the surface brightnesses of these lines reach maxima at the peak values
of n(0,4) and n(0,6), respectively. Figures 3 and 4 show the excitation temperatures t43 and t64, and
the kinetic temperature as a function of n(0,4) and n(0,6), respectively. Our goal is to predict the
rotational temperature at positions where n(0,4) and n(0,6) peak. At the peak position of n(0,4) both
the kinetic temperature and t43 are ~265 K. However, at the peak position of n(0,6) the kinetic
temperature is ~ 223 K and t64 is ~556 K. Our predicted surface brightness (taking into account the
internal reddening effect) for the 0-0 S(1), 0-0 S(2), and 0-0 S(4) lines are 5.19×10⁻⁴, 1.14×10⁻⁴,
and 1.06×10⁻⁴ ergs-1cm-2sr-1 which also give t43 = 242.39 and t64 = 573.20 K, respectively.
8
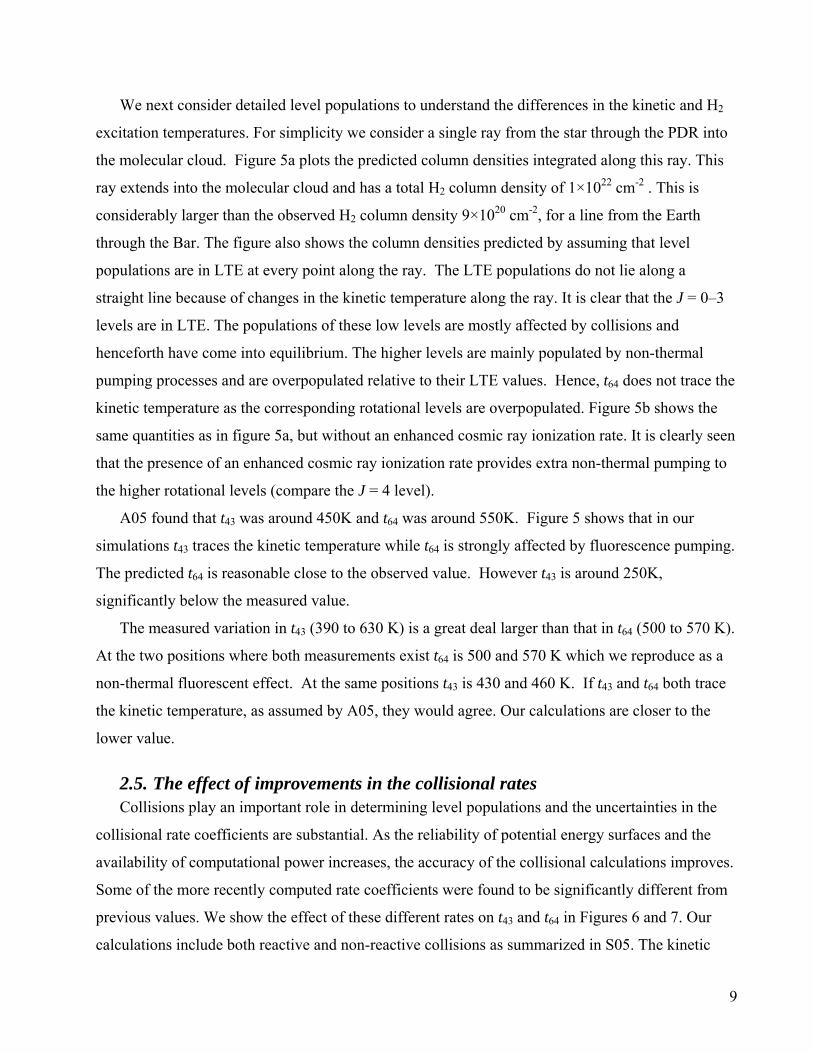
We next consider detailed level populations to understand the differences in the kinetic and H2
excitation temperatures. For simplicity we consider a single ray from the star through the PDR into
the molecular cloud. Figure 5a plots the predicted column densities integrated along this ray. This
ray extends into the molecular cloud and has a total H2 column density of 1×1022 cm-2 . This is
considerably larger than the observed H2 column density 9×1020 cm-2, for a line from the Earth
through the Bar. The figure also shows the column densities predicted by assuming that level
populations are in LTE at every point along the ray. The LTE populations do not lie along a
straight line because of changes in the kinetic temperature along the ray. It is clear that the J = 0–3
levels are in LTE. The populations of these low levels are mostly affected by collisions and
henceforth have come into equilibrium. The higher levels are mainly populated by non-thermal
pumping processes and are overpopulated relative to their LTE values. Hence, t64 does not trace the
kinetic temperature as the corresponding rotational levels are overpopulated. Figure 5b shows the
same quantities as in figure 5a, but without an enhanced cosmic ray ionization rate. It is clearly seen
that the presence of an enhanced cosmic ray ionization rate provides extra non-thermal pumping to
the higher rotational levels (compare the J = 4 level).
A05 found that t43 was around 450K and t64 was around 550K. Figure 5 shows that in our
simulations t43 traces the kinetic temperature while t64 is strongly affected by fluorescence pumping.
The predicted t64 is reasonable close to the observed value. However t43 is around 250K,
significantly below the measured value.
The measured variation in t43 (390 to 630 K) is a great deal larger than that in t64 (500 to 570 K).
At the two positions where both measurements exist t64 is 500 and 570 K which we reproduce as a
non-thermal fluorescent effect. At the same positions t43 is 430 and 460 K. If t43 and t64 both trace
the kinetic temperature, as assumed by A05, they would agree. Our calculations are closer to the
lower value.
2.5. The effect of improvements in the collisional rates Collisions play an important role in determining level populations and the uncertainties in the
collisional rate coefficients are substantial. As the reliability of potential energy surfaces and the
availability of computational power increases, the accuracy of the collisional calculations improves.
Some of the more recently computed rate coefficients were found to be significantly different from
previous values. We show the effect of these different rates on t43 and t64 in Figures 6 and 7. Our
calculations include both reactive and non-reactive collisions as summarized in S05. The kinetic
9
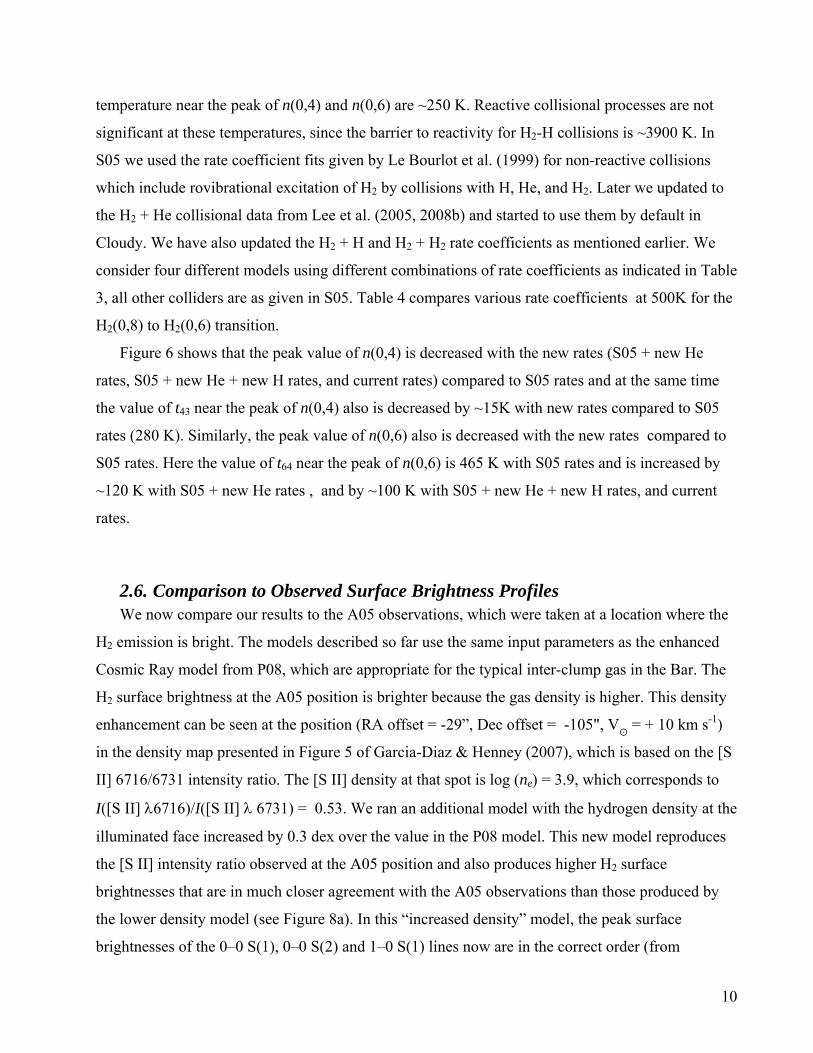
temperature near the peak of n(0,4) and n(0,6) are ~250 K. Reactive collisional processes are not
significant at these temperatures, since the barrier to reactivity for H2-H collisions is ~3900 K. In
S05 we used the rate coefficient fits given by Le Bourlot et al. (1999) for non-reactive collisions
which include rovibrational excitation of H2 by collisions with H, He, and H2. Later we updated to
the H2 + He collisional data from Lee et al. (2005, 2008b) and started to use them by default in
Cloudy. We have also updated the H2 + H and H2 + H2 rate coefficients as mentioned earlier. We
consider four different models using different combinations of rate coefficients as indicated in Table
3, all other colliders are as given in S05. Table 4 compares various rate coefficients at 500K for the
H2(0,8) to H2(0,6) transition.
Figure 6 shows that the peak value of n(0,4) is decreased with the new rates (S05 + new He
rates, S05 + new He + new H rates, and current rates) compared to S05 rates and at the same time
the value of t43 near the peak of n(0,4) also is decreased by ~15K with new rates compared to S05
rates (280 K). Similarly, the peak value of n(0,6) also is decreased with the new rates compared to
S05 rates. Here the value of t64 near the peak of n(0,6) is 465 K with S05 rates and is increased by
~120 K with S05 + new He rates , and by ~100 K with S05 + new He + new H rates, and current
rates.
2.6. Comparison to Observed Surface Brightness Profiles We now compare our results to the A05 observations, which were taken at a location where the
H2 emission is bright. The models described so far use the same input parameters as the enhanced
Cosmic Ray model from P08, which are appropriate for the typical inter-clump gas in the Bar. The
H2 surface brightness at the A05 position is brighter because the gas density is higher. This density
enhancement can be seen at the position (RA offset = -29”, Dec offset = -105", V☼
= + 10 km s-1)
in the density map presented in Figure 5 of Garcia-Diaz & Henney (2007), which is based on the [S
II] 6716/6731 intensity ratio. The [S II] density at that spot is log (ne) = 3.9, which corresponds to
I([S II] λ6716)/I([S II] λ 6731) = 0.53. We ran an additional model with the hydrogen density at the
illuminated face increased by 0.3 dex over the value in the P08 model. This new model reproduces
the [S II] intensity ratio observed at the A05 position and also produces higher H2 surface
brightnesses that are in much closer agreement with the A05 observations than those produced by
the lower density model (see Figure 8a). In this “increased density” model, the peak surface
brightnesses of the 0–0 S(1), 0–0 S(2) and 1–0 S(1) lines now are in the correct order (from
10
brightest to faintest) i.e., the 0-0 S(2) line is brighter than the 1-0 S(1) line which is consistent with
the observations, and straddle the observed peak surface brightnesses, which we consider to be a
satisfactory match. The predicted t64 and t43 for this model is 424 and 280 K. The width of the
observed spectral lines are wider than our predictions; suggesting that the cosmic ray rate might be
higher than what we have assumed. However, due to the uncertain details of the geometry, it is hard
to constrain the cosmic ray rates by comparing the observed and predicted line widths. Figure 8b
shows the computed H2 surface brightness of 0–0 S(1), 0–0 S(2), and 1–0 S(1) lines without an
enhanced cosmic ray ionization rate. The lines are much sharper as is discussed already in section
2.4. The non-thermal pumping produced by the cosmic rays populates the higher vib-rotational
levels more effectively than the lower levels. Hence the increased cosmic-ray ionization rate is more
important for the 1-0 S(1) than the 0-0 S(1) and 0-0 S(2) line data fit.
2.7. Heating sources The challenge in explaining the kinetic temperature of the H2-emitting gas is discussed by Allers
et al. (2005). They found, as we do, that conventional photon interactions with dusty
atomic/molecular gas cannot produce enough heating to explain the observations. They suggested
that the theory of gas heating by electron photoejection from grains may need to be revised. We
encountered similar problems in reproducing the observed high gas kinetic temperatures. We have
examined the effects of a higher-than-Galactic cosmic ray density and find that this can account for
many of the observations.
The Galactic background cosmic-ray ionization rate is undergoing revisions with the
development of new molecular diagnostics. Indriolo et al. (2007) argue that the Galactic
background in diffuse clouds is ~1 dex more intense than previously thought and has a significant
variance over different sight lines, which is consistent with recent theoretical modeling
(Padoan, Paolo & Scalo, John 2005; Snodin, Andrew P. et al. 2006). An increased cosmic-ray
density in dense molecular gas is harder to justify theoretically and our final value for the Bar is
higher than those measured by Indriolo et al. However, in our previous study of M17 (Pellegrini et
al 2007) we found a similarly high cosmic ray flux. This was justified in that case since a
supernova remnant, thought to be the source of galactic cosmic rays, is very near the M17 cloud.
No such supernova is close to the Orion complex.
We offer this as an alternate explanation of the observations, much in the spirit of Allers et
al (2005)’s suggestion that grain heating theory may need to be revisited. Our calculations show
11
that enhanced cosmic rays can account for many observed aspects of the Bar, but, given the
theoretical difficulties of this scenario that are outlined in the previous paragraph, it is worth
investigating alternative explanations. Cosmic rays both heat and ionize the gas, with the relative
proportion being set by the ionization fraction of the gas (Osterbrock & Ferland, 2006). Although it
is hard to distinguish between the effects of cosmic rays and X-ray photoionization from the H2
spectrum, Meijerink et al. (2006) identify other tracers, including high-J CO lines and [CI]/13CO,
HCN/CO, and HCN/HCO+ line ratios, which are sensitive to the power source. Maps of the bar in
these lines might be decisive. Observationally it is very hard to distinguish between cosmic ray and
x-ray photoionization, a point stressed in Ferland et al. (2009). Young stars in the Orion complex
are known to be significant sources of x-rays. So a third possibility is that the needed heating is
provided by a distributed population of young stars with their associated x-ray emission.
In contrast to the above is heating by grain electron photoejection, in which case the primary
electrons are not capable of ionizing the surrounding gas so the energetic electrons are quickly
thermalized. This latter process produces heating without associated ionization. A careful analysis
which combined measurements of the gas kinetic temperature with observations of the abundances
of molecular ions could discriminate between these possible processes.
3. Summary & Conclusions This paper revisits emission properties of the Orion-Bar. Our conclusions include the following.
• We include the H+, H0, and H2 regions in one self consistent calculation and include the
stellar radiation pressure, the magnetic field, and an enhanced cosmic-ray ionization rate in
the gas equation of state. The model parameters are taken from P08 who successfully
reproduced a wide variety of spectral observations across the Bar. We qualitatively
reproduce the observed H2 rotational temperature t64. There are some uncertainties regarding
the magnetic field strength, molecular data, and geometry which may lead to a lower
prediction for t43.
• Our predicted t43 is close to the kinetic temperature (~250K) but our predicted t64 is much
greater. We find that in the Orion-Bar rotational levels with J > 3 are not in
thermodynamical equilibrium with the local temperature. The excitation temperature t64 is
much higher than the kinetic temperature due to photoexcitation (FUV pumping). This
provides an explanation for why t64 is high.
12
• We predict that t43 is thermal and that it is lower than observed. This model will require an
enhanced heating rate in the atomic region of the PDR to increase both t43 and the kinetic
temperature to 450 K. A05 increased the standard photoelectric heating rate by a factor ~3 to
achieve this extra heating.
• The collisional rates for H2 with H and vibrational transitions for H2 + H2 are uncertain.
More accurate collisional rates involving J =3 and 4 might bring the predicted t43 closer to
its observational value. We note that A05 correctly predicted that the vibrationally excited
H2 –H collisional rates were, at that time, significantly too small.
• We show that a variant on the P08 model, in which the density was increased to match that
of the small higher-density clump measured by Garcia-Diaz & Henney in [S II], produces
the surface brightness and relative intensities of the H2 0–0 S(1), 0–0 S(2) and 1–0 S(1) lines.
• The starlight momentum increases the pressure in the Bar above what would be predicted
with a constant gas pressure model with the measured gas pressure in the HII region. Some
of this pressure is magnetic. That, together with a postulated enhanced cosmic ray density,
can account for most, but not all, of the observed H2 emission properties.
Acknowledgements PCS acknowledges NASA Grant NNG05GD81G and NSF Grant AST-0607733. NPA would like to
acknowledge support from the National Science Foundation under Grant No. 0094050, 0607497 to
The University of Cincinnati. PvH acknowledges support from NSF grant AST0607028. JAB
gratefully acknowledges support from NSF grant AST-0305833. EWP was supported by NASA
(07-ATFP07-0124 and STScI AR-10932) and by NSF (AST-0305833). GJF is funded by NASA
(07-ATFP07-0124) and NSF (AST0607028). We would like to thank the referee for thoughtful
suggestions.
13
References
Abel, N. P., Ferland, G. J., Shaw, G., & van Hoof, P. A. M. 2005, ApJS, 161, 65
Abel, N. P., Ferland, G. J., O'Dell, C. R., Shaw, G., & Troland, T. H. 2006, ApJ, 644, 344
Abel, N. P., van Hoof, P. A. M., Shaw, G., Ferland, G. J., & Elwert, T. 2008, ApJ, 686, 1125
Abgrall, H., Le Bourlot, J., Pineau Des Forets, G., Roueff, E, Flower, D. R., & Heck, L. 1992, A&A,
253, 52
Allers, K. N., Jaffe, D. T., Lacy, J. H., Draine, B. T., & Richter, M. J. 2005, ApJ, 630, 368 (A05)
Black, J.H., & van Dishoeck, E.F. 1987, ApJ, 322, 412
Baldwin, J. A., Ferland, G. J., Martin, P. G., Corbin, M. R., Cota, S. A., Peterson, & B. M.,
Slettebak, A. 1991, ApJ, 374, 580
Bakes, E. L. O., & Tielens, A. G. G. M. 1994, ApJ, 427, 822
Bertoldi, F., & Draine, B. T. 1996, ApJ, 458, 222
Cazaux, S., & Tielens, A. G. G. M. 2002, ApJ, 575, L29
Dalgarno, A., Yan, M., & Liu, W. 1999, ApJS, 125, 237
Diep, P. & Johnson, J. K. 2000, J. Chem. Phys., 112, 4465; 113, 3480
Feigelson, E., Getman, K., Townsley, L., Garmire, G., Preibisch, T., Grosso, N.,
Montmerle, T., Muench, A. & McCaughrean, M. 2005, ApJS, 160, 379
Ferland, G. J., Korista, K. T., Verner, D. A., Ferguson, J. W., Kingdon, J. B., & Verner, E. M. 1998,
PASP, 110, 76
Esteban, C., Peimbert, M., García-Rojas, J., Ruiz, M. T., Peimbert, A., & Rodríguez, M. 2004,
MNRAS, 355, 229
Ferland, G. J., Fabian, A. C., Hatch, N. A., Johnstone, R. M., Porter, R. L., van Hoof, P. A. M.,
Williams, R. J. R. 2009, MNRAS, 392, 1475
Fuente, A., Martín-Pintado, J., Rodríguez-Fernández, N. J., Rodríguez-Franco, A., de Vicente, P., &
Kunze, D. 1999, ApJ, 518, 45
Gagne, M., Caillault, J., & Stauffer, J. R. 1995, ApJ, 445, 280
García-Díaz, Ma. T. & Henney, W. J. 2007, AJ, 133, 952 Habart, E., Boulanger, F., Verstraete, L., Pineau des Forêts, G., Falgarone, & E., Abergel, A. 2003,
A&A, 397, 623
14
Habart, E., Boulanger,F., Verstraete, L., Walmsley, C. M., & Pineau des Forets, G., 2004, A&A,
414, 531
Heiles, C., & Crutcher, R. 2005, LNP, 664, 137
Henney, W. J., Arthur, S. J., Williams, R. J. R., & Ferland, G. J. 2005a, ApJ, 621, 328
Henney, W. J., Arthur, S. J., & García-Díaz, Ma. T. 2005b, ApJ, 627, 831
Henney, W. J., Williams, R. J. R., Ferland, G. J., Shaw, Gargi, & O'Dell, C. R. 2007, ApJ, 671, 137
Houde, M., Dowell, C. D., Hildebrand, R. H., Dotson, J. L., Vaillancourt, J. E., Phillips, T. G.,
Peng, R., & Bastien, P. 2004, ApJ, 604, 717
Indriolo, Nick, Geballe, Thomas R., Oka, Takeshi, & McCall, Benjamin J. 2007, ApJ, 671, 1736
Indriolo, N., Fields, B.D. & McCall, B.J. 2009, ApJ (in press); arXiv:0901.1143
Le Bourlot, J.Z, Pineau des Forêts, G., & Flower, D. R. 1999, MNRAS, 305, 802
Lee, T.-G., Balakrishnan, N., Forrey, R. C., Stancil, P. C., Schultz, D. R., & Ferland, G. J. 2005, J.
Chem. Phys., 122, 024307
Lee, T.-G., Balakrishnan, N., Forrey, R. C., Stancil, P. C., Shaw, G., Schultz, D. R., & Ferland, G. J.
2008a, ApJ, 689, 1105
Lee, T.-G., Clark, T. K., Forrey, R. C., Lepp, S., Shaw, G., Balakrishnan, N., Stancil, P. C., Schultz,
D. R., & Ferland, G. J. 2008b, ApJ, to be submitted
Liu, W., & Dalgarno, A. 1994, ApJ, 428, 769
Kaufmann, M. J., Wolfire, M. G., & Hollenbach, D. J. 2006, ApJ, 644, 283
Mathis, J. S., Rumpl, W., & Nordsieck, K. H. 1977, ApJ, 217, 425
Meijerink, R., Spaans, M., & Israel, F. P. 2006, ApJ, 650, 103
Osterbrock, D.E. & Ferland, G.J. 2006, Astrophysics of Gaseous Nebulae and Active Galactic
Nuclei (AGN3), 2nd Edition (University Science Books)
Osterbrock, D. E., Tran, H. D., & Veilleux, S. 1992, ApJ, 389, 305
Padoan, Paolo & Scalo, John 2005, ApJ, 624, 97
Parmar, P. S., Lacy, J. H., & Achtermann, J. M. 1991, ApJ, 372, 25
Peimbert, M., & Torres-Peimbert, S. 1977, MNRAS, 179, 217
Pellegrini, E. W., Baldwin, J. A., Ferland, G. J., & Heathcote, S. 2008, ApJ, 693, 285 (P08)
Pellegrini, E. W., Baldwin, J. A., Brogan, C. L., Hanson, M. M., Abel, N. P., Ferland, G. J.,
Nemala, H. B., Shaw, G., & Troland, T. H. 2007, ApJ, 658, 1119
Pogge, R. W., Owen, J. M., & Atwood, B. 1992, ApJ, 399, 147
15
Rao, R., Crutcher, R. M., Plambeck, R. L., Wright, M. C. H. 1998, ApJ, 502, 75
Rubin, R. H., Simpson, J. R., Haas, M. R., & Erickson, E. F. 1991, ApJ, 374, 564
Rubin, R. H., Dufour, R. J., & Walter, D, K. 1993, ApJ, 413, 242
Sellgren, K., Tokunaga, A. T., & Nakada, Y. 1990, ApJ, 349, 120
Shaw, G., Ferland, G. J., Abel, N. P., Stancil, P. C., & van Hoof, P. A. M. 2005, ApJ, 624, 794
(S05)
Shaw, G., Ferland, G. J., Srianand, R., Abel, N. P., van Hoof, P. A. M., & Stancil, P. C. 2008, ApJ,
675, 405
Snodin, Andrew P., Brandenburg, Axel, Mee, Antony J., & Shukurov, Anvar 2006, MNRAS, 373,
643
Sternberg, A., & Neufeld, D. A. 1999, ApJ, 516, 371
Störzer, H., & Hollenbach, D. 1998, ApJ, 495, 853
Tauber, J. A., Tielens, A. G. G. M., Meixner, M., & Goldsmith, P. F. 1994, ApJ, 422, 136
Tielens, A. G. G. M., & Hollenbach, D. 1985, ApJ, 291, 722
Timmermann, R., Bertoldi, F., Wright, C. M., Drapatz, S., Draine, B. T., Haser, L., & Sternberg, A.
1996, A&A, 315, 281
van der Tak, F. F. S., Belloche, A., Schilke, P., Güsten, R., Philipp, S., Comito, C., Bergman, P., &
Nyman, L.-Å. 2006, A&A, 454, 99
van Hoof, P.A.M., Weingartner, J.C., Martin, P.G., Volk, K., & Ferland, G.J. 2004, MNRAS, 350,
1330
Walmsley, C. M., Natta, A., Oliva, E., & Testi, L. 2000, A&A, 364, 301
Wrathmall, S. A., Gusdorf, A., & Flower, D. R. 2007, MNRAS, 382, 133
Wen, Z., & O'Dell, C. R. 1995, ApJ, 438, 784
Wen, Z., & O'Dell, C. R. 1992, BAAS, 24, 765
Williams, J. P., Bergin, E. A., Casseli, P. C., & Plume, R. 1998, ApJ, 503, 689
Wolfire, M. G., McKee, C. F., Hollenbach, D., & Tielens, A. G. G. M. 2003, ApJ, 587, 287
16
4. Figures
Figure 1a. The simplified geometry adopted here and by P08. The derivation of the distances
shown on the figure is described by P08.
17
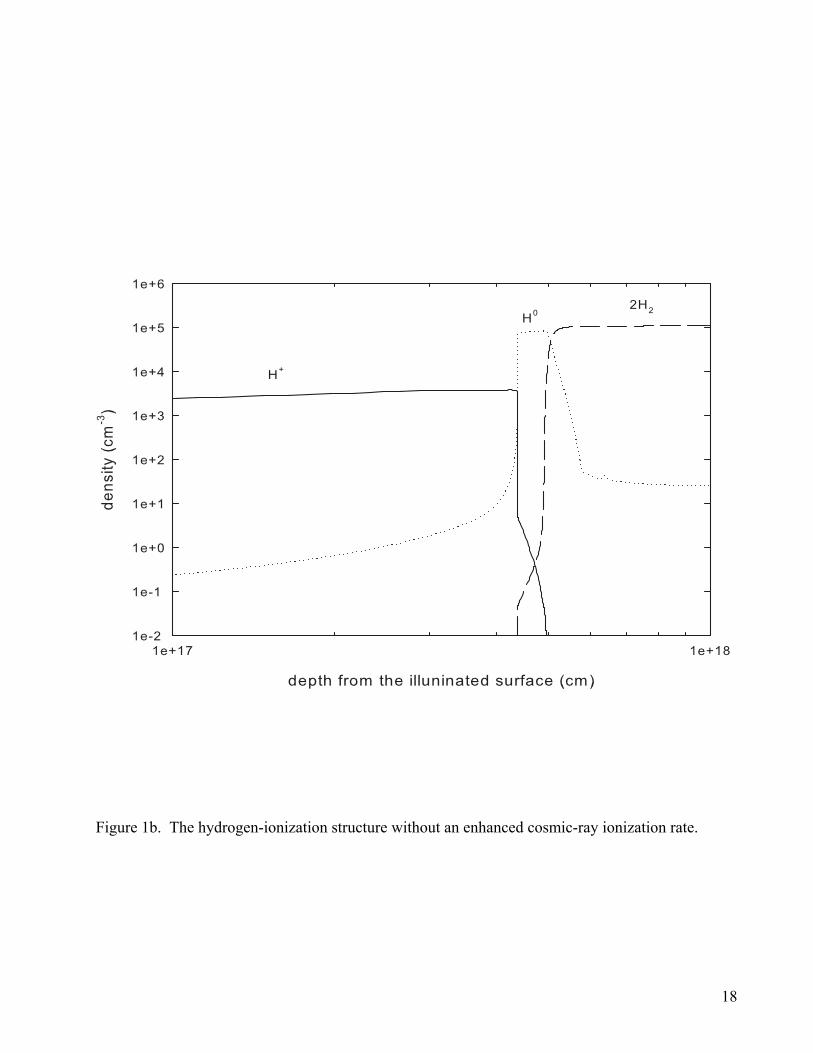
Figure 1b. The hydrogen-ionization structure without an enhanced cosmic-ray ionization rate.
18
Figure 1c. The hydrogen-ionization structure with an enhanced cosmic-ray ionization rate.
19
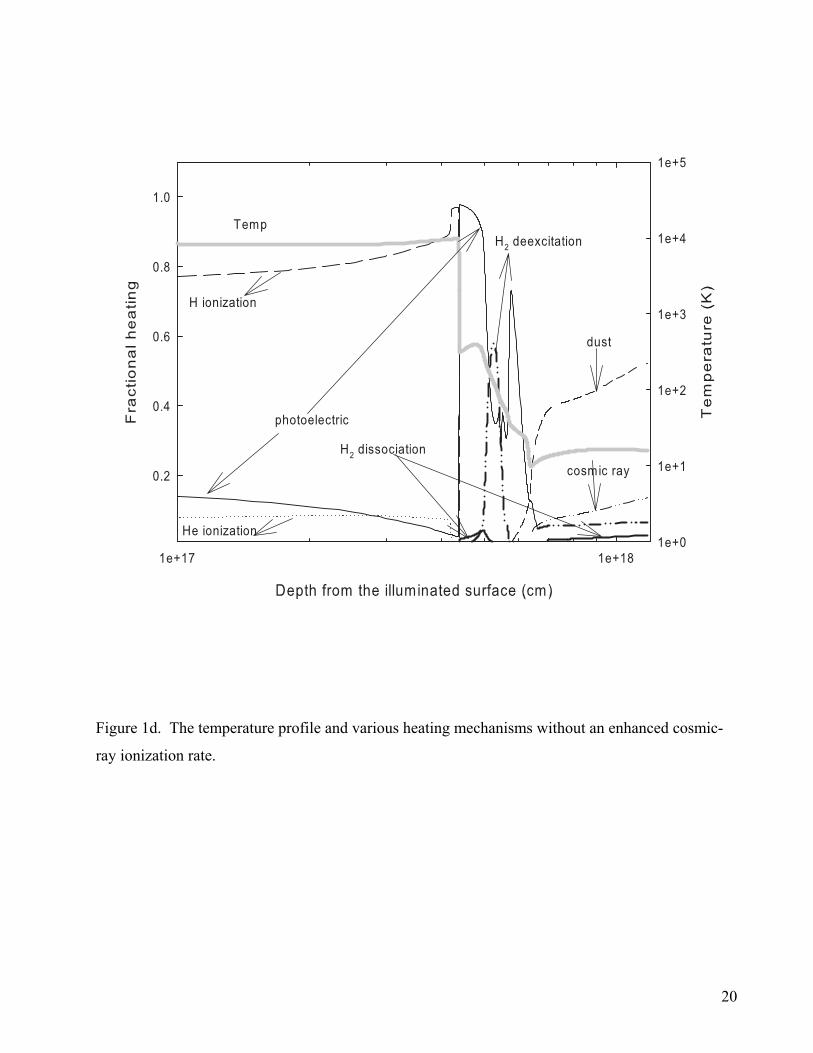
Figure 1d. The temperature profile and various heating mechanisms without an enhanced cosmic-
ray ionization rate.
20
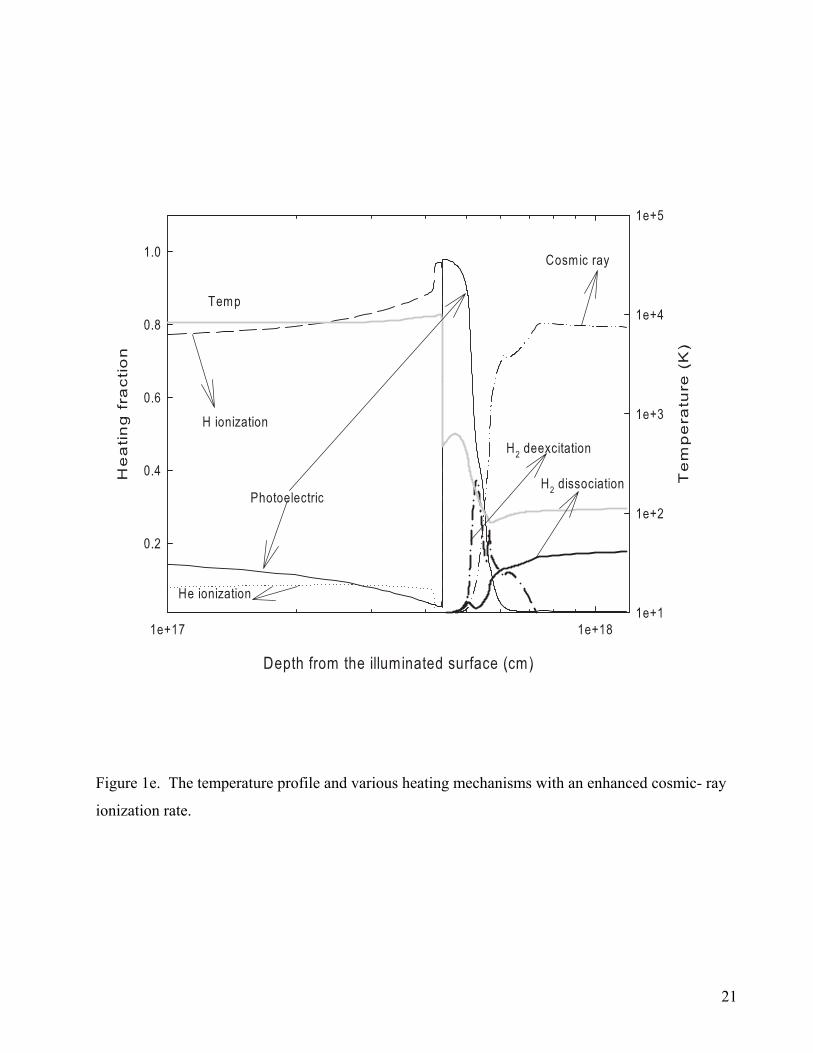
Figure 1e. The temperature profile and various heating mechanisms with an enhanced cosmic- ray
ionization rate.
21
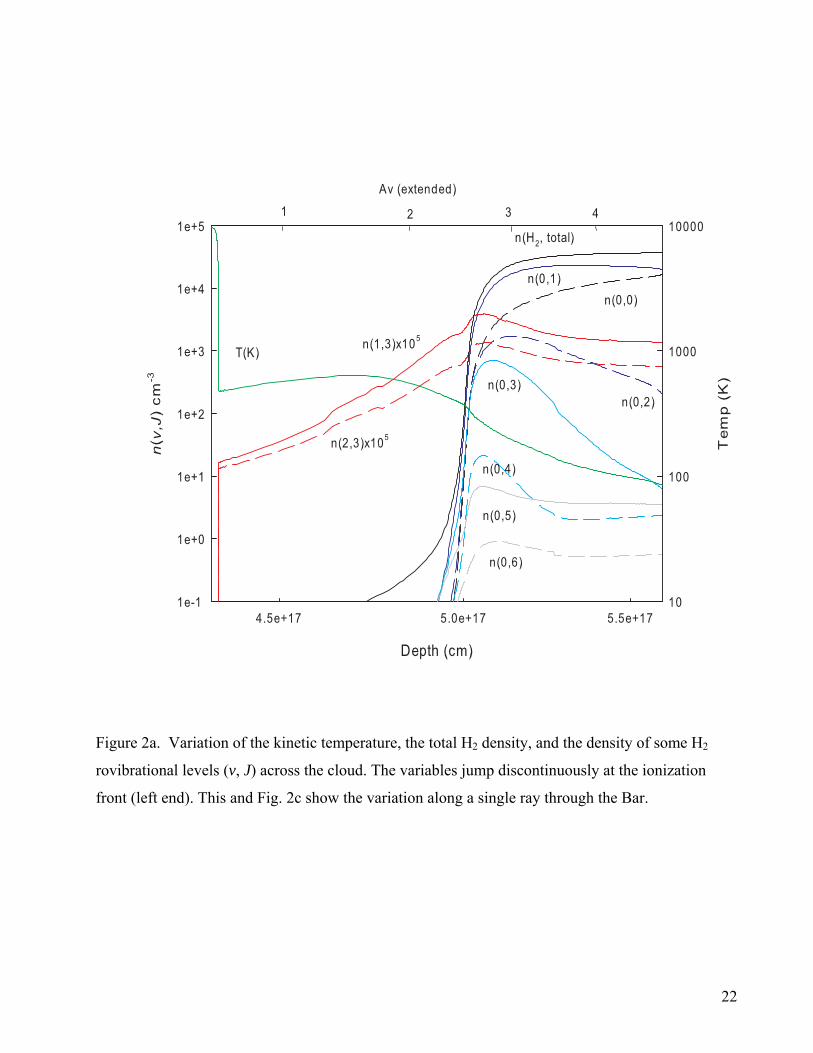
Figure 2a. Variation of the kinetic temperature, the total H2 density, and the density of some H2
rovibrational levels (v, J) across the cloud. The variables jump discontinuously at the ionization
front (left end). This and Fig. 2c show the variation along a single ray through the Bar.
22
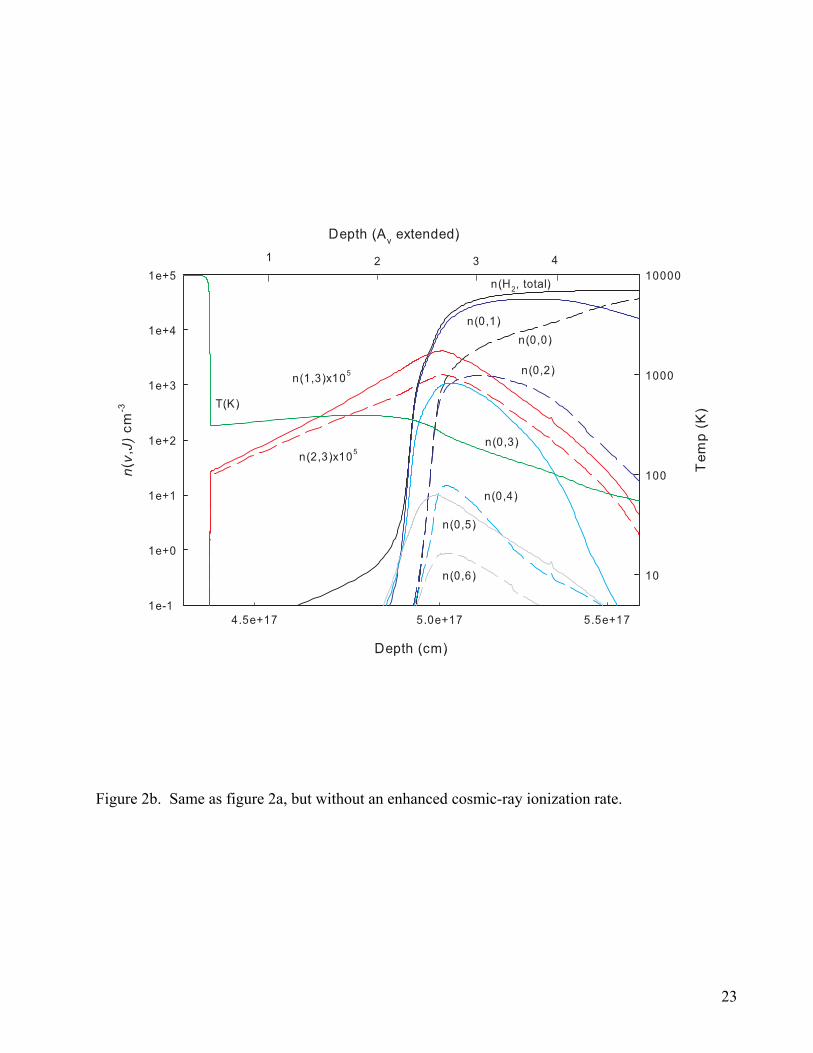
Figure 2b. Same as figure 2a, but without an enhanced cosmic-ray ionization rate.
23
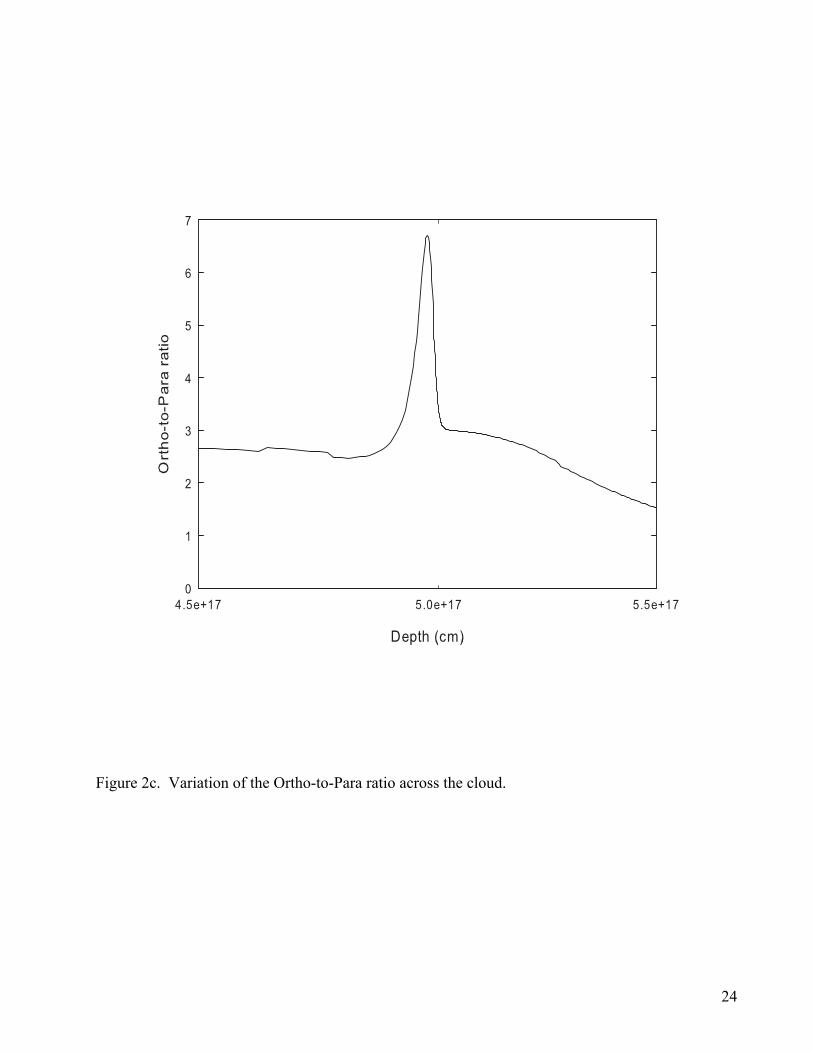
Figure 2c. Variation of the Ortho-to-Para ratio across the cloud.
24
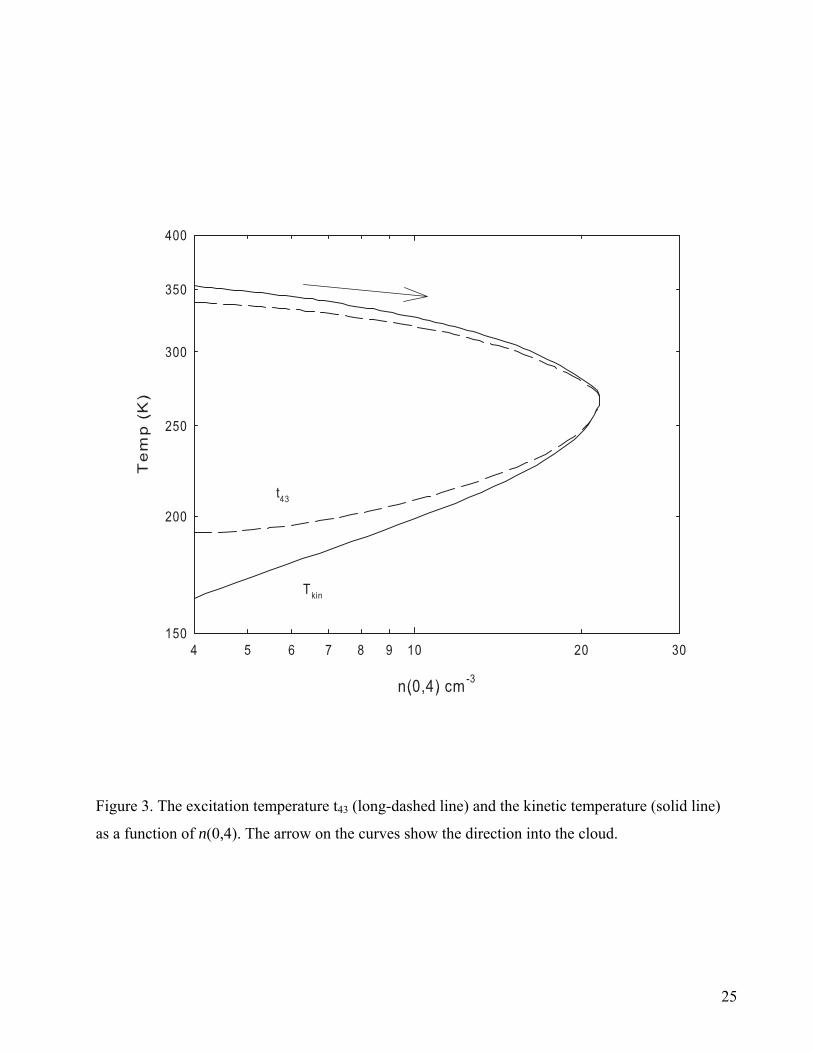
Figure 3. The excitation temperature t43 (long-dashed line) and the kinetic temperature (solid line)
as a function of n(0,4). The arrow on the curves show the direction into the cloud.
25
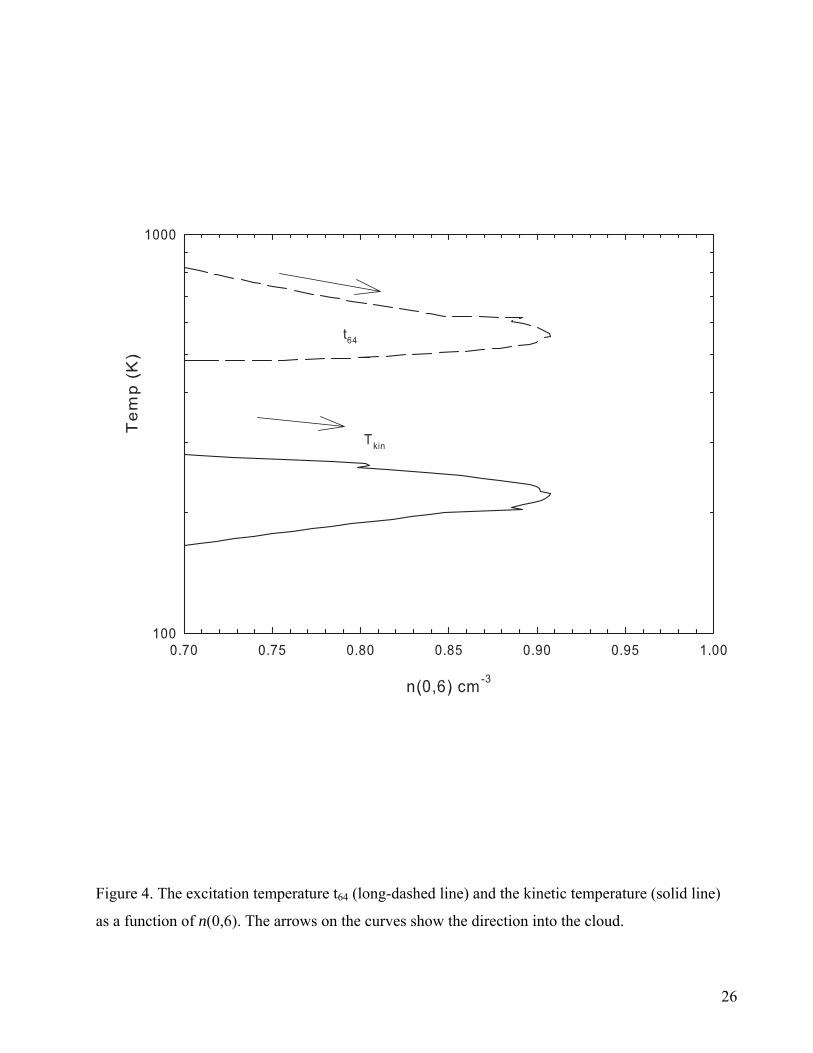
Figure 4. The excitation temperature t64 (long-dashed line) and the kinetic temperature (solid line)
as a function of n(0,6). The arrows on the curves show the direction into the cloud.
26
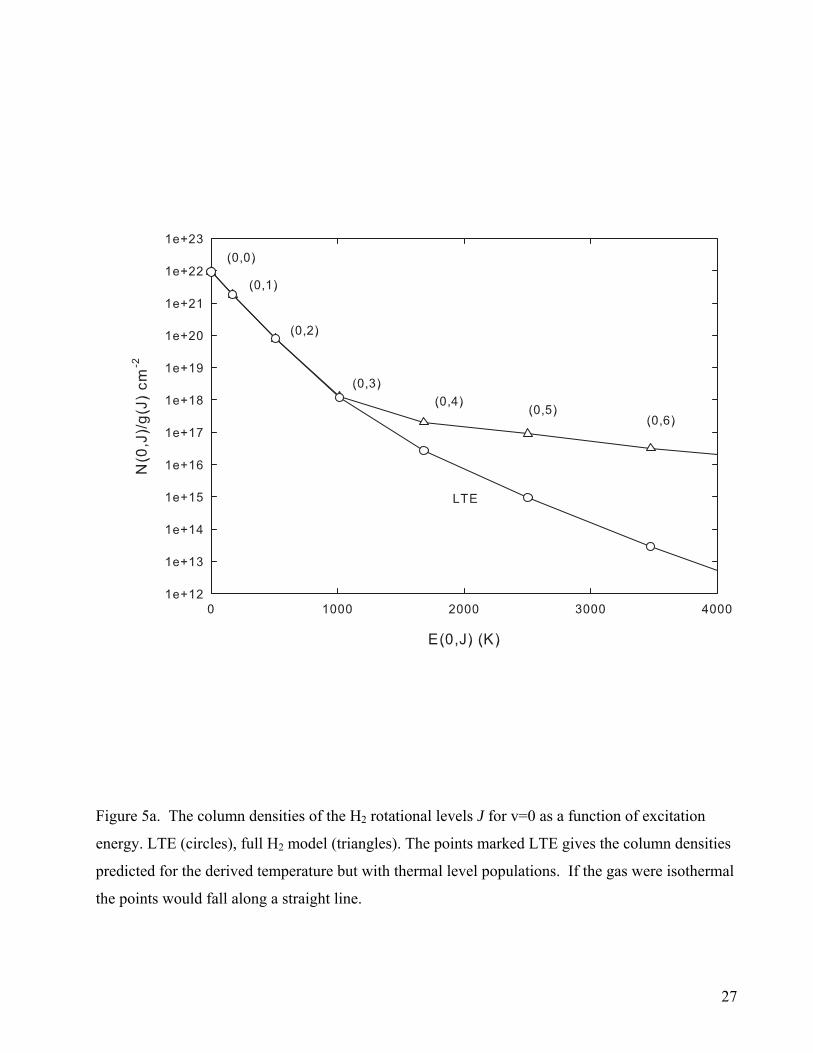
Figure 5a. The column densities of the H2 rotational levels J for v=0 as a function of excitation
energy. LTE (circles), full H2 model (triangles). The points marked LTE gives the column densities
predicted for the derived temperature but with thermal level populations. If the gas were isothermal
the points would fall along a straight line.
27
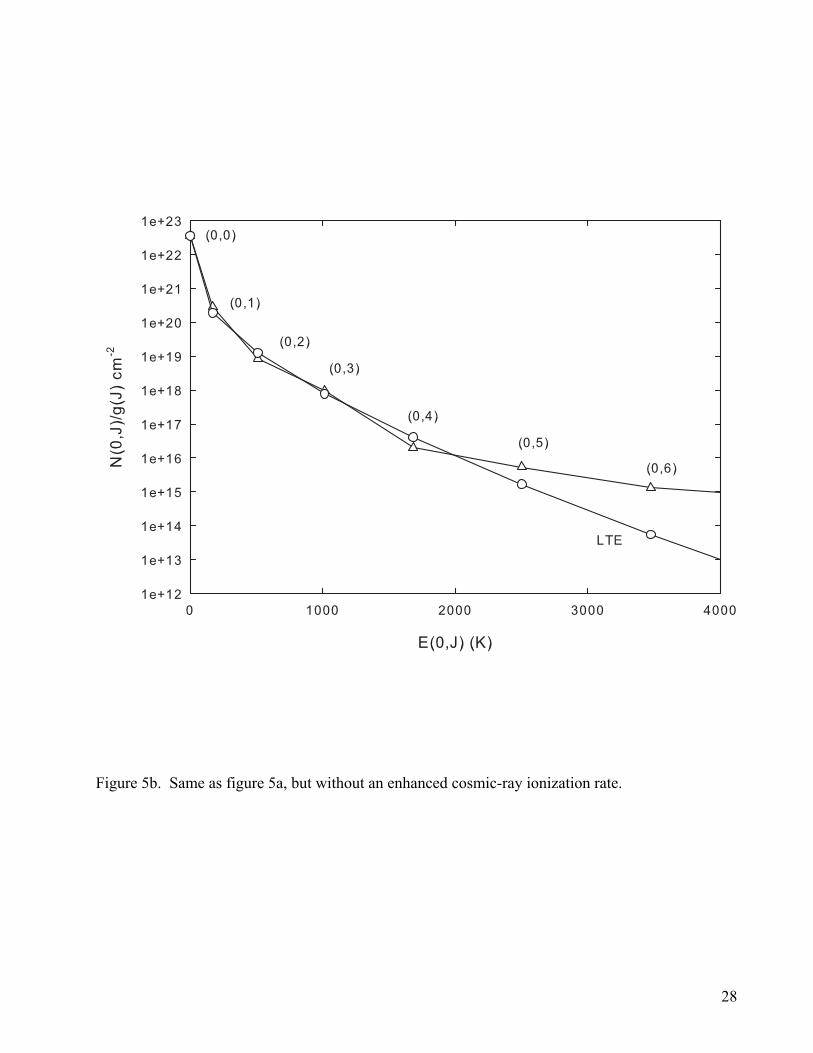
Figure 5b. Same as figure 5a, but without an enhanced cosmic-ray ionization rate.
28
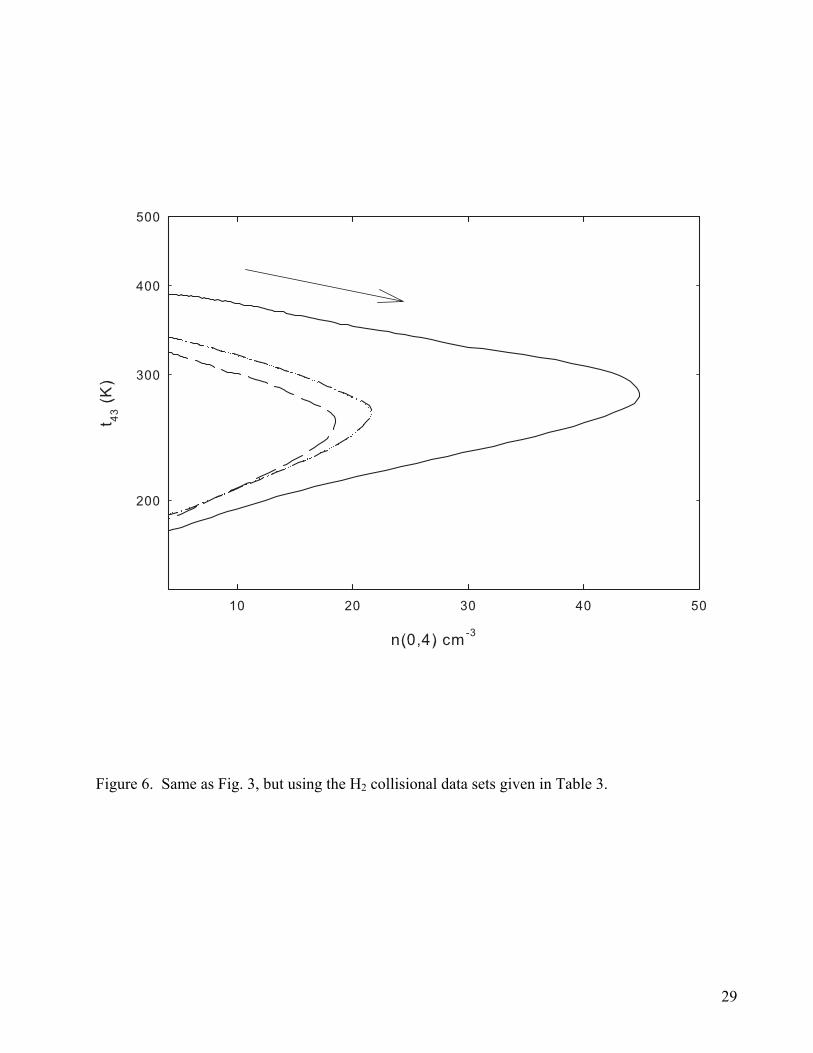
Figure 6. Same as Fig. 3, but using the H2 collisional data sets given in Table 3.
29
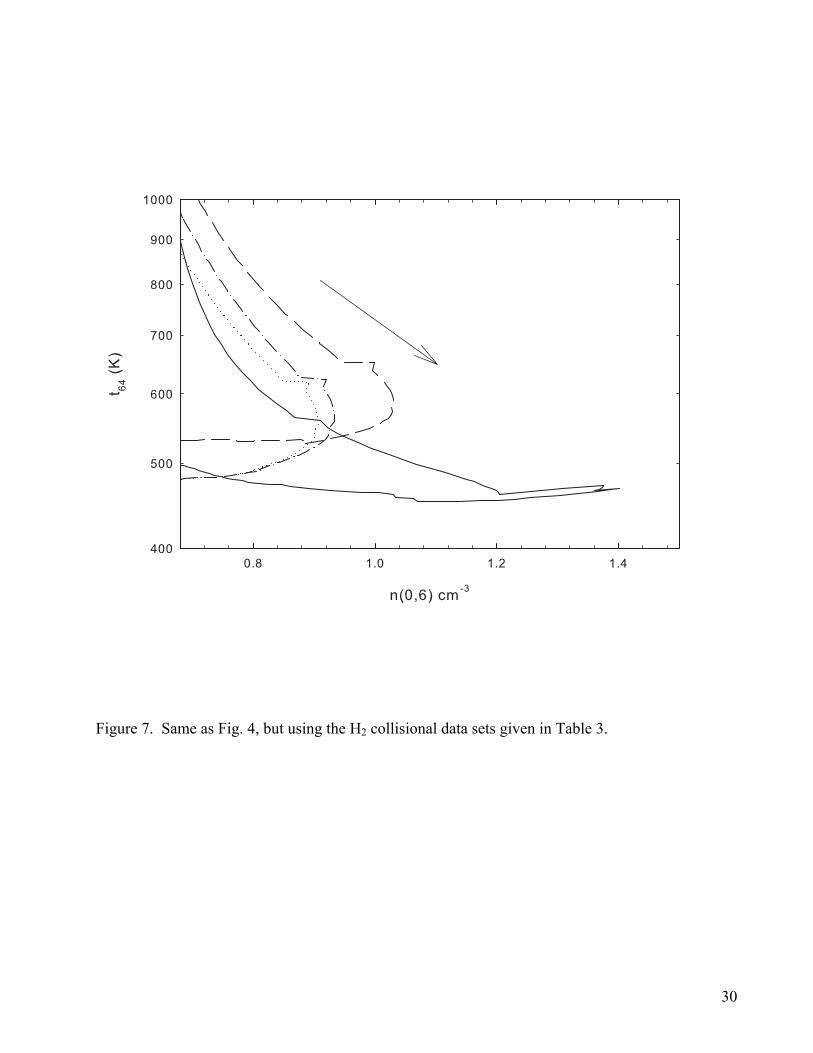
Figure 7. Same as Fig. 4, but using the H2 collisional data sets given in Table 3.
30
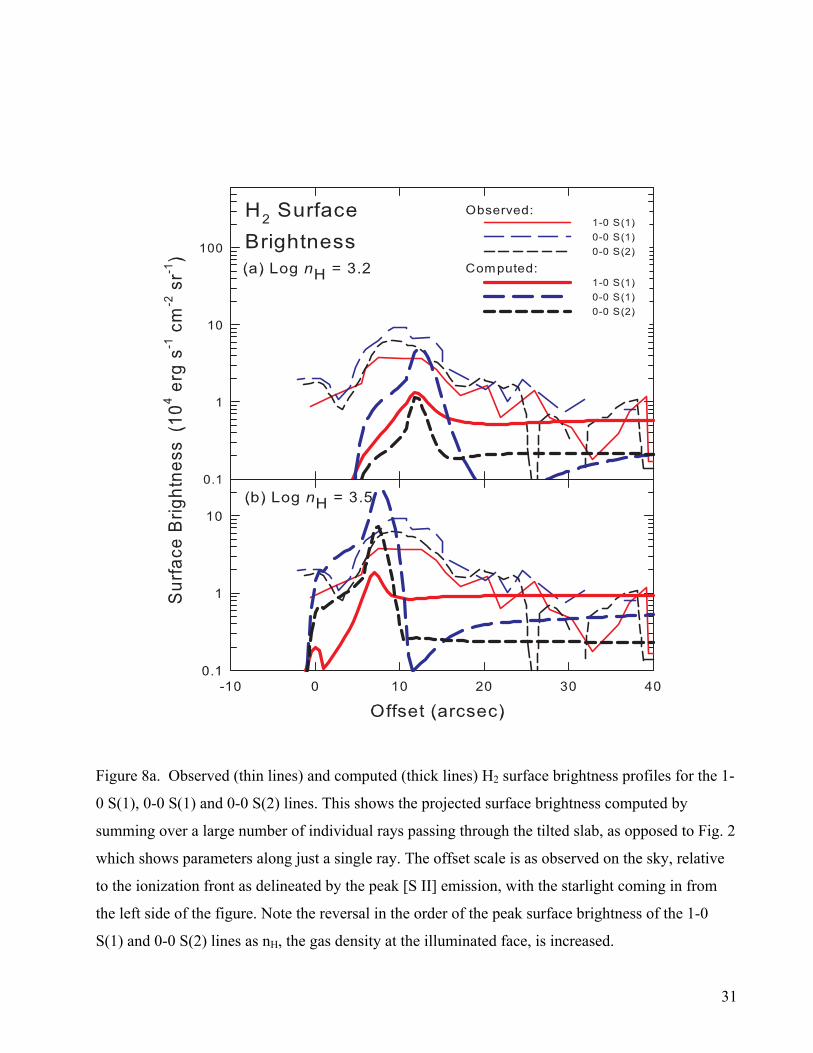
Figure 8a. Observed (thin lines) and computed (thick lines) H2 surface brightness profiles for the 1-
0 S(1), 0-0 S(1) and 0-0 S(2) lines. This shows the projected surface brightness computed by
summing over a large number of individual rays passing through the tilted slab, as opposed to Fig. 2
which shows parameters along just a single ray. The offset scale is as observed on the sky, relative
to the ionization front as delineated by the peak [S II] emission, with the starlight coming in from
the left side of the figure. Note the reversal in the order of the peak surface brightness of the 1-0
S(1) and 0-0 S(2) lines as nH, the gas density at the illuminated face, is increased.
31
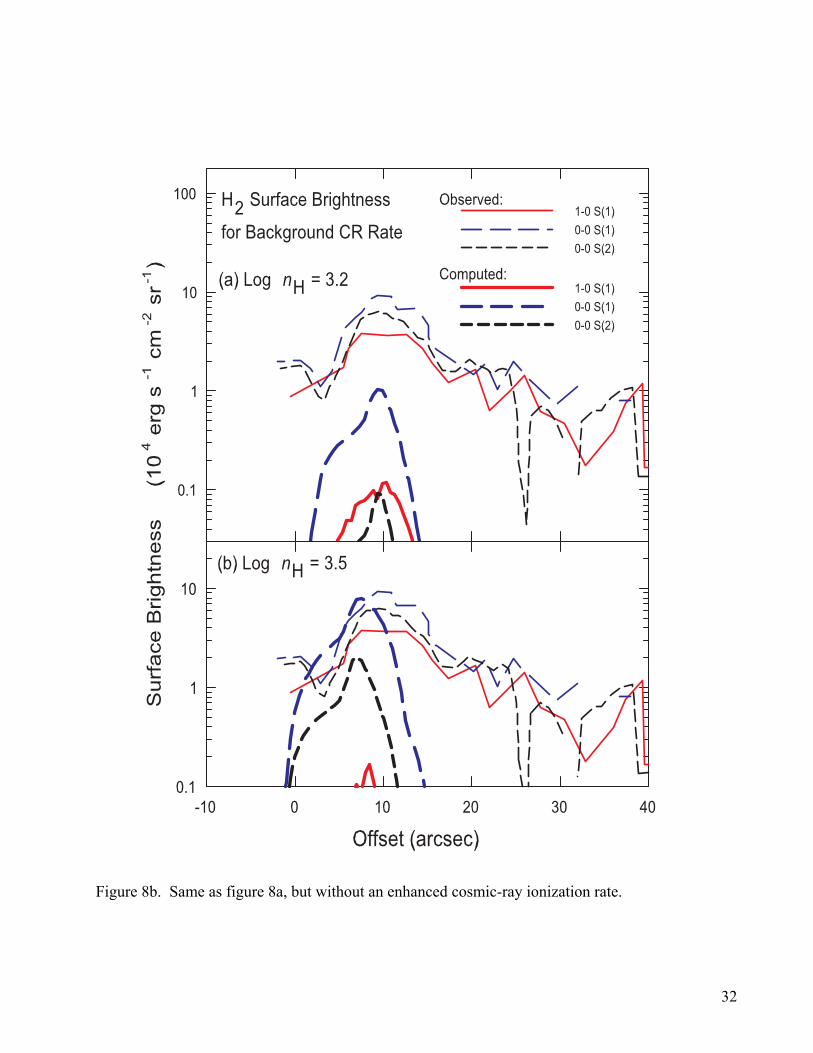
Figure 8b. Same as figure 8a, but without an enhanced cosmic-ray ionization rate.
32
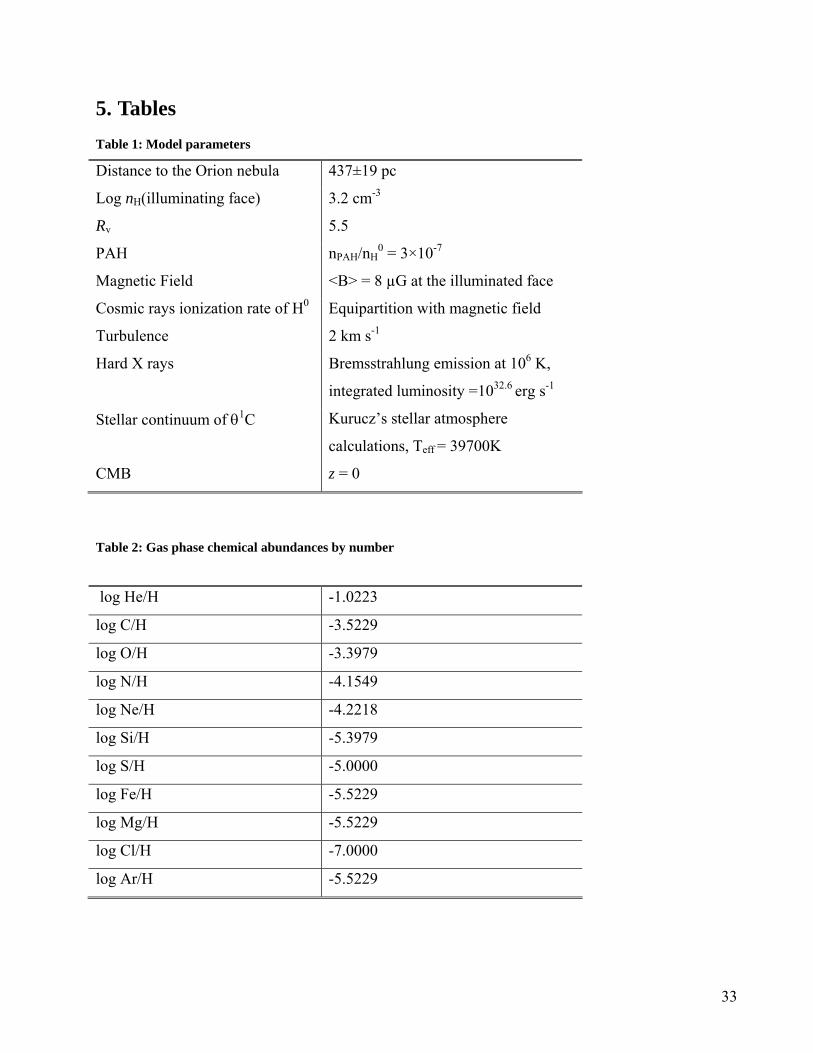
5. Tables Table 1: Model parameters
Distance to the Orion nebula 437±19 pc
Log nH(illuminating face) 3.2 cm-3
Rv 5.5
PAH nPAH/nH0 = 3×10⁻⁷
Magnetic Field <B> = 8 µG at the illuminated face
Cosmic rays ionization rate of H0 Equipartition with magnetic field
Turbulence 2 km s-1
Hard X rays Bremsstrahlung emission at 106 K,
integrated luminosity =1032.6 erg s-1
Stellar continuum of θ1C Kurucz’s stellar atmosphere
calculations, Teff = 39700K
CMB z = 0
Table 2: Gas phase chemical abundances by number
log He/H -1.0223
log C/H -3.5229
log O/H -3.3979
log N/H -4.1549
log Ne/H -4.2218
log Si/H -5.3979
log S/H -5.0000
log Fe/H -5.5229
log Mg/H -5.5229
log Cl/H -7.0000
log Ar/H -5.5229
33
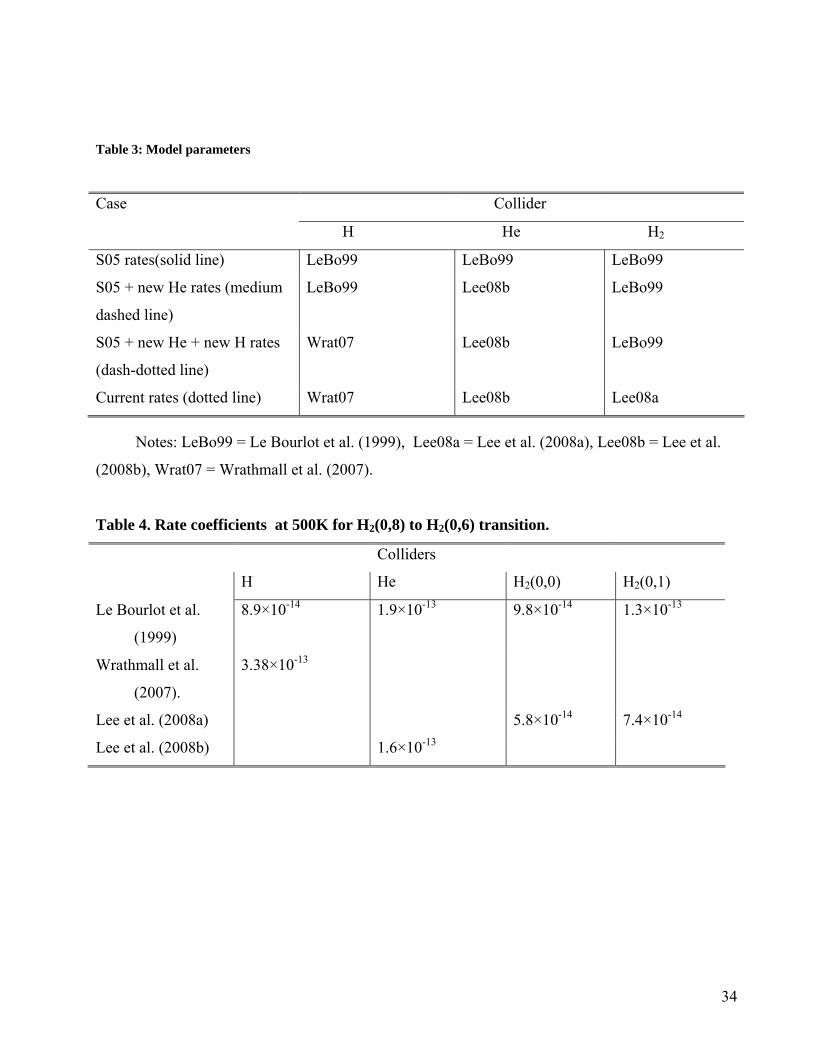
Table 3: Model parameters
Case Collider
H He H2
S05 rates(solid line) LeBo99 LeBo99 LeBo99
S05 + new He rates (medium
dashed line)
LeBo99 Lee08b LeBo99
S05 + new He + new H rates
(dash-dotted line)
Wrat07 Lee08b LeBo99
Current rates (dotted line) Wrat07 Lee08b Lee08a Notes: LeBo99 = Le Bourlot et al. (1999), Lee08a = Lee et al. (2008a), Lee08b = Lee et al.
(2008b), Wrat07 = Wrathmall et al. (2007).
Table 4. Rate coefficients at 500K for H2(0,8) to H2(0,6) transition.
Colliders
H He H2(0,0) H2(0,1)
Le Bourlot et al.
(1999)
8.9×10⁻¹⁴ 1.9×10⁻¹³ 9.8×10⁻¹⁴ 1.3×10⁻¹³
Wrathmall et al.
(2007).
3.38×10⁻¹³
Lee et al. (2008a) 5.8×10⁻¹⁴ 7.4×10⁻¹⁴
Lee et al. (2008b) 1.6×10⁻¹³
34