Rotational Spectrum and Tentative Detection of DCOOCH3Methyl Formate in Orion
13
The Astrophysical Journal, 714:1120–1132, 2010 May 10 doi:10.1088/0004-637X/714/2/1120 C 2010. The American Astronomical Society. All rights reserved. Printed in the U.S.A. ROTATIONAL SPECTRUM AND TENTATIVE DETECTION OF DCOOCH 3 –METHYL FORMATE IN ORION L. Margul` es 1 , T. R. Huet 1 , J. Demaison 1 , M. Carvajal 2 , I. Kleiner 3 , H. Møllendal 4 , B. Tercero 5 , N. Marcelino 5 , and J. Cernicharo 5 1 Laboratoire de Physique des Lasers, Atomes, et Mol´ ecules, UMR CNRS 8523, Universit´ e Lille 1, F-59655 Villeneuve d’Ascq C´ edex, France; [email protected] 2 Departamento de F´ ısica Aplicada, Facultad de Ciencias Experimentales, Universidad de Huelva, 21071 Huelva, Spain 3 Laboratoire Interuniversitaire des Syst` emes Atmosph´ eriques, UMR CNRS 7583, Universit´ e Paris 7 et Universit´ e Paris 12, 61 av. Charles de Gaulle, F-94010 Cr´ eteil C´ edex, France 4 Centre for Theoretical and Computational Chemistry (CTCC), Department of Chemistry, University of Oslo, P.O. Box 1033 Blindern, NO-0315 Oslo, Norway 5 Centro de Astrobiolog´ ıa (CSIC-INTA), Laboratory of Molecular Astrophysics, Department of Astrophysics, Ctra de Ajalvir, Km 4, 28850 Torrej´ on de Ardoz, Madrid, Spain; [email protected] Received 2009 June 19; accepted 2010 March 5; published 2010 April 16 ABSTRACT New centimeter-wave (7–80 GHz) and submillimeter-wave (580–661 GHz) spectra of a deuterated species of methyl formate (DCOOCH 3 ) have been measured. Transitions with a maximum value of J = 64 and K = 36 have been assigned and fitted together with previous measurements. The internal rotation of this compound was treated using the so-called rho axis method. A total of 1703 transitions were fitted using this method. Only 24 parameters were employed in the final fit, which has an rms deviation of 94.2 kHz. The dipole moment and the nuclear quadrupole coupling constants of the deuterated specie have also been obtained. This new study has permitted a tentative detection of DCOOCH 3 in Orion with the IRAM 30 m telescope based on the observation of more than 100 spectral features with low blending effects among the 400 lines expected in the observed frequency domain (for which over 300 are heavily blended with other species). These 100 transitions are above noise and confusion limited without heavy blending and cannot be assigned to any other species. Moreover, none of the strongest unblended transitions is missing. The derived source-averaged total column density for DCOOCH 3 is 7.8 × 10 14 cm −2 and the DCOOCH 3 /HCOOCH 3 column density ratio varies between 0.02 and 0.06 in the different cloud components of Orion. This value is consistent with the deuteration enhancement found for other species in this cloud. Key words: ISM: molecules – line: identification – methods: data analysis – methods: laboratory – methods: observational – submillimeter: ISM Online-only material: color figures, machine-readable table 1. INTRODUCTION Methyl formate (HCOOCH 3 ) has been detected in the hot cores of giant molecular clouds such as Orion KL, Sgr B2(N), and W51 e1/e2, in star-forming regions, and in comets (Blake et al. 1986; Nummelin et al. 2000; Lovas 2004; Kobayashi et al. 2007; Demyk et al. 2008). The relatively large abundance of methyl formate in hot core sources has led to the identification of an important number of interstellar lines. Approximately 900 lines of the ground torsional state were detected in various interstellar molecular clouds, Sgr B2, Orion KL, and W51 e1/e2 (Lovas 2004). Recently, torsionally excited lines of methyl formate were also observed in Orion KL by Kobayashi et al. (2007) and in W51 e2 by Demyk et al. (2008). The 13 C species of methyl formate were also subject of astrophysical searches, and about 400 lines belonging to HCOO 13 CH 3 and H 13 COOCH 3 were very recently detected (Carvajal et al. 2009). Despite the fact that methyl formate is such an abundant ubiquitous interstellar molecule and that isotopic fractiona- tion effects involving deuterium are prevalent in the interstellar medium (Herbst 1992), the singly deuterated isotopologues of methyl formate have not been detected yet. As already pointed out by Oesterling et al. (1995), the absence of detection is weird because deuterated isotopologues of methanol (CH 3 OD and CH 2 DOH) have been detected in the interstellar medium (Mauersberger et al. 1988; Jacq et al. 1993). We should em- phasize that the identification of interstellar normal methyl for- mate and its 13 C isotopologues was only made possible thanks to comprehensive laboratory work. The large spectral mate- rial, which is now available for methyl formate, is required to make full use for the new radio-astronomy facilities (Herschel, ALMA, SOFIA). The reason of this comprehensive experimen- tal and theoretical work is due to the fact that the structure of the methyl formate spectrum is complicated by the combination of a large amplitude motion, the torsion, with the large asym- metry splittings occurring in this fairly asymmetric near-prolate rotor (κ =−0.75 for DCOOCH 3 ). In particular, the internal rotation of the methyl group splits each rotational line into a doublet (characterized by the symmetry labels A and E). As the molecule is light and as the barrier to internal rotation is not so high, the internal rotation splittings are relatively large and the transition frequencies are thus difficult to calculate with ac- curacy, especially at high J values, without appropriate theory. The singly deuterated methyl formate isotopologue DCOOCH 3 was not studied as much as the normal species or even the 13 C species (Willaert et al. 2006; Carvajal et al. 2007, 2009; Maeda et al. 2008a, 2008b; Ilyushin et al. 2009), or the mono-deuterated methyl formate HCOOCH 2 D, which was also recently investi- gated (Margul` es et al. 2009a) at high resolution. Curl (1959) has studied different isotopic species of methyl formate, measuring the microwave spectrum of DCOOCH 3 up to 30 GHz, identify- ing 27 rotational transitions, and analyzing the internal rotation splittings and spectra using the principal axis method (PAM). He also determined the components of the electric dipole mo- ment along the a and b principal axes. Oesterling et al. (1995) extended the measurements of the spectra to a frequency of 1120
-
Upload
independent -
Category
Documents
-
view
1 -
download
0
Transcript of Rotational Spectrum and Tentative Detection of DCOOCH3Methyl Formate in Orion
The Astrophysical Journal, 714:1120–1132, 2010 May 10 doi:10.1088/0004-637X/714/2/1120C© 2010. The American Astronomical Society. All rights reserved. Printed in the U.S.A.
ROTATIONAL SPECTRUM AND TENTATIVE DETECTION OF DCOOCH3–METHYL FORMATE IN ORION
L. Margules1, T. R. Huet
1, J. Demaison
1, M. Carvajal
2, I. Kleiner
3, H. Møllendal
4, B. Tercero
5, N. Marcelino
5,
and J. Cernicharo5
1 Laboratoire de Physique des Lasers, Atomes, et Molecules, UMR CNRS 8523, Universite Lille 1, F-59655 Villeneuve d’Ascq Cedex, France;[email protected]
2 Departamento de Fısica Aplicada, Facultad de Ciencias Experimentales, Universidad de Huelva, 21071 Huelva, Spain3 Laboratoire Interuniversitaire des Systemes Atmospheriques, UMR CNRS 7583, Universite Paris 7 et Universite Paris 12, 61 av. Charles de Gaulle,
F-94010 Creteil Cedex, France4 Centre for Theoretical and Computational Chemistry (CTCC), Department of Chemistry, University of Oslo, P.O. Box 1033 Blindern, NO-0315 Oslo, Norway5 Centro de Astrobiologıa (CSIC-INTA), Laboratory of Molecular Astrophysics, Department of Astrophysics, Ctra de Ajalvir, Km 4, 28850 Torrejon de Ardoz,
Madrid, Spain; [email protected] 2009 June 19; accepted 2010 March 5; published 2010 April 16
ABSTRACT
New centimeter-wave (7–80 GHz) and submillimeter-wave (580–661 GHz) spectra of a deuterated species ofmethyl formate (DCOOCH3) have been measured. Transitions with a maximum value of J = 64 and K = 36 havebeen assigned and fitted together with previous measurements. The internal rotation of this compound was treatedusing the so-called rho axis method. A total of 1703 transitions were fitted using this method. Only 24 parameterswere employed in the final fit, which has an rms deviation of 94.2 kHz. The dipole moment and the nuclearquadrupole coupling constants of the deuterated specie have also been obtained. This new study has permitted atentative detection of DCOOCH3 in Orion with the IRAM 30 m telescope based on the observation of more than100 spectral features with low blending effects among the 400 lines expected in the observed frequency domain (forwhich over 300 are heavily blended with other species). These 100 transitions are above noise and confusion limitedwithout heavy blending and cannot be assigned to any other species. Moreover, none of the strongest unblendedtransitions is missing. The derived source-averaged total column density for DCOOCH3 is 7.8 × 1014 cm−2
and the DCOOCH3/HCOOCH3 column density ratio varies between 0.02 and 0.06 in the different cloud componentsof Orion. This value is consistent with the deuteration enhancement found for other species in this cloud.
Key words: ISM: molecules – line: identification – methods: data analysis – methods: laboratory – methods:observational – submillimeter: ISM
Online-only material: color figures, machine-readable table
1. INTRODUCTION
Methyl formate (HCOOCH3) has been detected in the hotcores of giant molecular clouds such as Orion KL, Sgr B2(N),and W51 e1/e2, in star-forming regions, and in comets (Blakeet al. 1986; Nummelin et al. 2000; Lovas 2004; Kobayashi et al.2007; Demyk et al. 2008). The relatively large abundance ofmethyl formate in hot core sources has led to the identificationof an important number of interstellar lines. Approximately900 lines of the ground torsional state were detected in variousinterstellar molecular clouds, Sgr B2, Orion KL, and W51 e1/e2(Lovas 2004). Recently, torsionally excited lines of methylformate were also observed in Orion KL by Kobayashi et al.(2007) and in W51 e2 by Demyk et al. (2008). The 13C species ofmethyl formate were also subject of astrophysical searches, andabout 400 lines belonging to HCOO13CH3 and H13COOCH3were very recently detected (Carvajal et al. 2009).
Despite the fact that methyl formate is such an abundantubiquitous interstellar molecule and that isotopic fractiona-tion effects involving deuterium are prevalent in the interstellarmedium (Herbst 1992), the singly deuterated isotopologues ofmethyl formate have not been detected yet. As already pointedout by Oesterling et al. (1995), the absence of detection isweird because deuterated isotopologues of methanol (CH3ODand CH2DOH) have been detected in the interstellar medium(Mauersberger et al. 1988; Jacq et al. 1993). We should em-phasize that the identification of interstellar normal methyl for-mate and its 13C isotopologues was only made possible thanks
to comprehensive laboratory work. The large spectral mate-rial, which is now available for methyl formate, is required tomake full use for the new radio-astronomy facilities (Herschel,ALMA, SOFIA). The reason of this comprehensive experimen-tal and theoretical work is due to the fact that the structure ofthe methyl formate spectrum is complicated by the combinationof a large amplitude motion, the torsion, with the large asym-metry splittings occurring in this fairly asymmetric near-prolaterotor (κ = −0.75 for DCOOCH3). In particular, the internalrotation of the methyl group splits each rotational line into adoublet (characterized by the symmetry labels A and E). As themolecule is light and as the barrier to internal rotation is notso high, the internal rotation splittings are relatively large andthe transition frequencies are thus difficult to calculate with ac-curacy, especially at high J values, without appropriate theory.The singly deuterated methyl formate isotopologue DCOOCH3was not studied as much as the normal species or even the 13Cspecies (Willaert et al. 2006; Carvajal et al. 2007, 2009; Maedaet al. 2008a, 2008b; Ilyushin et al. 2009), or the mono-deuteratedmethyl formate HCOOCH2D, which was also recently investi-gated (Margules et al. 2009a) at high resolution. Curl (1959) hasstudied different isotopic species of methyl formate, measuringthe microwave spectrum of DCOOCH3 up to 30 GHz, identify-ing 27 rotational transitions, and analyzing the internal rotationsplittings and spectra using the principal axis method (PAM).He also determined the components of the electric dipole mo-ment along the a and b principal axes. Oesterling et al. (1995)extended the measurements of the spectra to a frequency of
1120
No. 2, 2010 ROTATIONAL SPECTRUM AND TENTATIVE DETECTION OF DCOOCH3 ORION 1121
13365.0 13365.1 13365.2
1 2
1 0
1 10 1
2 1
2 2(a) 110
101
(E)
Inte
nsity
(a.
u.)
Frequency/MHz
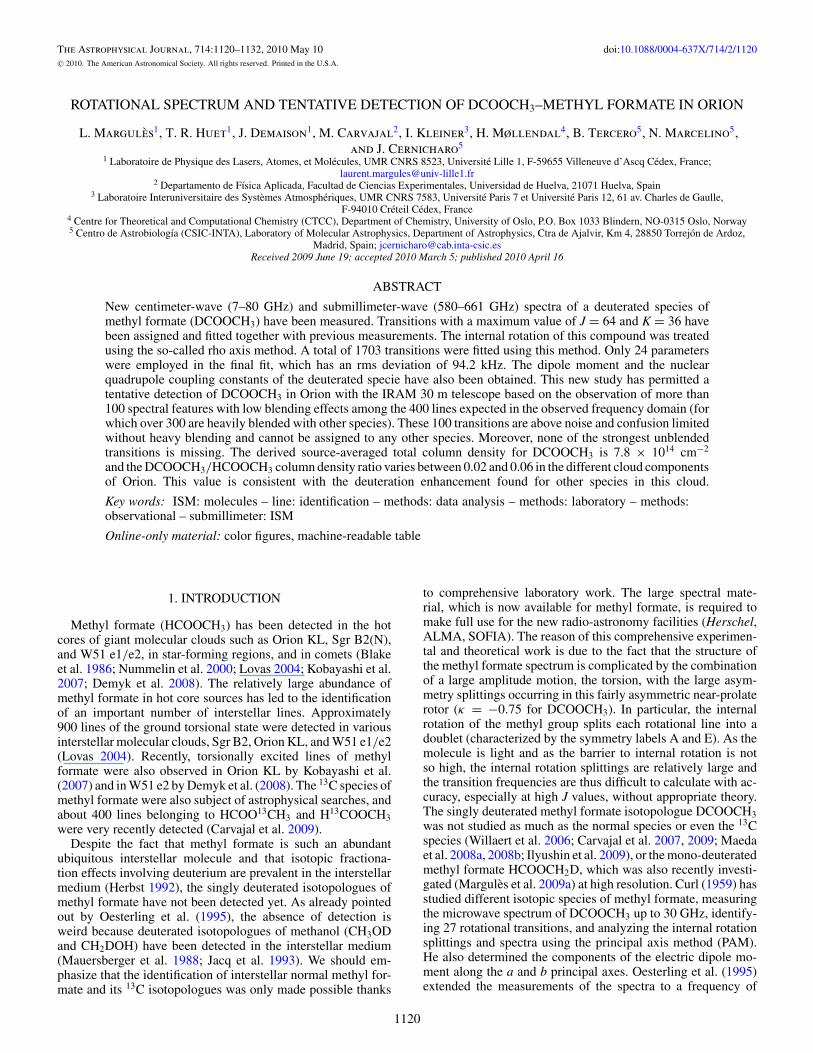
Figure 1. 110–101 (E) transition with hyperfine components due to nuclear spinof deuterium, recorded with the FTMW spectrometer.
377 GHz and assigned lines up to J = 30. These authors thencombined their 885 new lines with the 27 lines from Curl’s mea-surement using a global internal axis method, and obtained anrms deviation of 85 kHz with 31 parameters.
In the present paper, we continue our review of methyl for-mate isotopologues, trying to compile all previously publishedmicrowave and submillimeter data, and completing the mea-surements in certain spectral ranges. Using the so-called rho axismethod (RAM), we have studied the normal species (Carvajalet al. 2007), the H13COOCH3 and HCOO13CH3 (Willaert et al.2006; Carvajal et al. 2009) isotopologues. It should be noted that,using the same RAM approach, the microwave spectrum of thenormal species of methyl formate was reinvestigated by Ilyushinet al. (2009) who incorporated all previously published measure-ments, including the measurements from Maeda et al. (2008a,2008b) as well as 1550 remeasurements and 1769 new mea-surements from Kharkov in the 49–150 GHz frequency range,improving substantially the fit with a unitless weighted rms de-viation of 0.71 for 10,533 lines (6952 vt = 0 and 3581 vt = 1)and reaching the experimental uncertainty for both vt = 0 and 1torsional states. The impressive analysis performed by Ilyushinet al. (2009) using the same RAM approach shows the successof this method despite the internal rotors with intermediate bar-rier height, and high J and K values are dealt with (up to J =64, Ka = 36 in the ground vt torsional state and up to J = 35,Ka = 23 in the first excited torsional state vt = 1). Followingthe analysis we have performed for the 13C isotopologues inour previous paper (Carvajal et al. 2009), we have searched forthis species in the 30 m IRAM line survey of Orion (Terceroet al. 2010). Although the lines are weaker, and many of themblended with other species, we found evidences for a tentativedetection of deuterated methyl formate based on more than 100spectral features.
2. EXPERIMENTS
2.1. Lille: FTMW spectrometer
The hyperfine structure of DCOOCH3 was observed usingthe new molecular beam Fourier transform microwave (FTMW)spectrometer of Lille. The basic principles and technical detailsremain unchanged (Kassi et al. 2000). The main improvement
18219.6 18219.7 18219.8
3 3, 3 4, 3 2
4 4, 4 3
2 2, 2 3
312
303
(A)(b)
Inte
nsity
(a.
u.)
Frequency/MHz
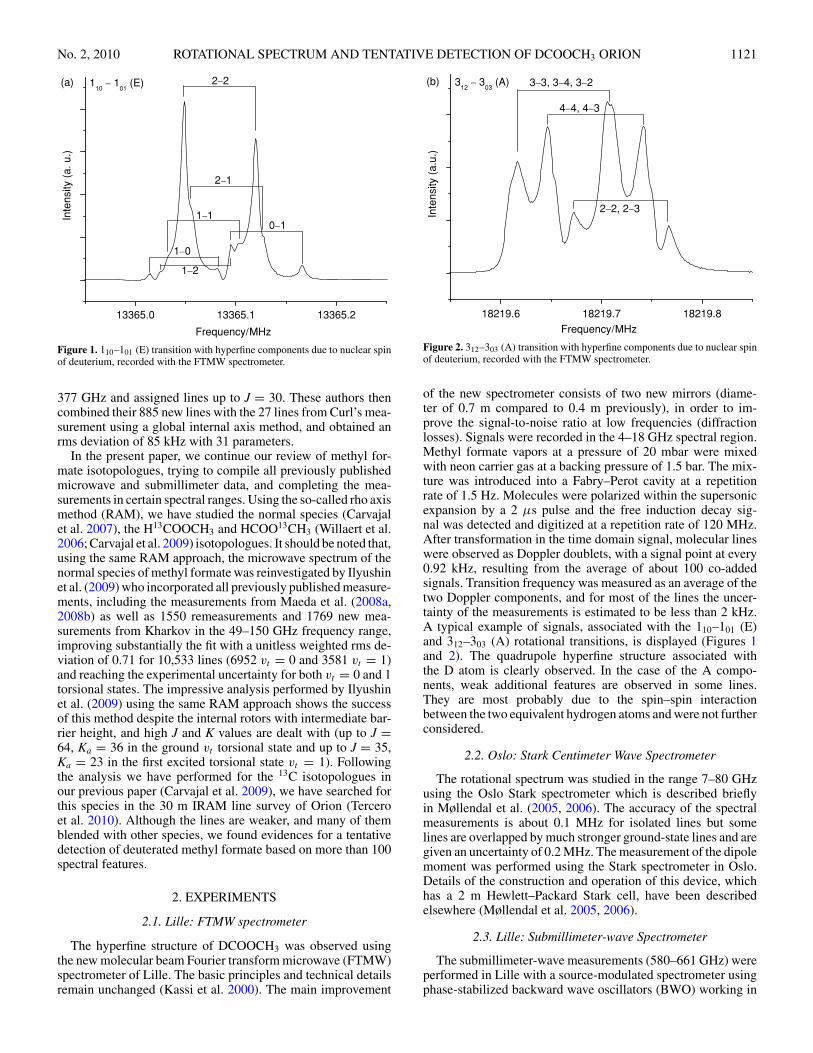
Figure 2. 312–303 (A) transition with hyperfine components due to nuclear spinof deuterium, recorded with the FTMW spectrometer.
of the new spectrometer consists of two new mirrors (diame-ter of 0.7 m compared to 0.4 m previously), in order to im-prove the signal-to-noise ratio at low frequencies (diffractionlosses). Signals were recorded in the 4–18 GHz spectral region.Methyl formate vapors at a pressure of 20 mbar were mixedwith neon carrier gas at a backing pressure of 1.5 bar. The mix-ture was introduced into a Fabry–Perot cavity at a repetitionrate of 1.5 Hz. Molecules were polarized within the supersonicexpansion by a 2 μs pulse and the free induction decay sig-nal was detected and digitized at a repetition rate of 120 MHz.After transformation in the time domain signal, molecular lineswere observed as Doppler doublets, with a signal point at every0.92 kHz, resulting from the average of about 100 co-addedsignals. Transition frequency was measured as an average of thetwo Doppler components, and for most of the lines the uncer-tainty of the measurements is estimated to be less than 2 kHz.A typical example of signals, associated with the 110–101 (E)and 312–303 (A) rotational transitions, is displayed (Figures 1and 2). The quadrupole hyperfine structure associated withthe D atom is clearly observed. In the case of the A compo-nents, weak additional features are observed in some lines.They are most probably due to the spin–spin interactionbetween the two equivalent hydrogen atoms and were not furtherconsidered.
2.2. Oslo: Stark Centimeter Wave Spectrometer
The rotational spectrum was studied in the range 7–80 GHzusing the Oslo Stark spectrometer which is described brieflyin Møllendal et al. (2005, 2006). The accuracy of the spectralmeasurements is about 0.1 MHz for isolated lines but somelines are overlapped by much stronger ground-state lines and aregiven an uncertainty of 0.2 MHz. The measurement of the dipolemoment was performed using the Stark spectrometer in Oslo.Details of the construction and operation of this device, whichhas a 2 m Hewlett–Packard Stark cell, have been describedelsewhere (Møllendal et al. 2005, 2006).
2.3. Lille: Submillimeter-wave Spectrometer
The submillimeter-wave measurements (580–661 GHz) wereperformed in Lille with a source-modulated spectrometer usingphase-stabilized backward wave oscillators (BWO) working in
1122 MARGULES ET AL. Vol. 714
the frequency range 150–670 GHz. More details could be foundin Willaert et al. (2006). The absorption was detected with aliquid helium cooled InSb bolometer (QMC Instruments Ltd).The measurements were made at room temperature and thepressure in the absorption cell was from 10 to 30 mTorr.The line width of the lines is Doppler limited. The accuracy ofthe measurements is about 30 kHz for isolated lines. However,if the lines are blended or with a poor signal-to-noise ratio, theywere given a weight of 100 or even 200 kHz.
2.4. Sample
The sample is commercial; it was purchased from Aldrichand was used without further purification.
3. THEORETICAL MODEL
The Hamiltonian used in the present work is the so-calledRAM internal rotation Hamiltonian based on the work ofKirtman (1962), Lees & Baker (1968), Herbst et al. (1984).Since rather complete descriptions of this method, which takesits name from the choice of the axis system, have been presentedin the literature (Lin & Swalen 1959; Hougen et al. 1994),we will not repeat here a detailed description. So far we haveapplied this formalism and our code to a number of internal rotormolecules (see, for example, Ilyushin et al. 2003), includingmethyl formate (Carvajal et al. 2007, 2009).
Like for the normal methyl formate species, the three-foldtorsional potential barrier of DCOOCH3 is rather high (V3 ≈389 cm−1) but the value of the reduced height s = 4V3/9F (withF ≈ 5.49 cm−1 being the internal rotation constant) is about31, so torsional splittings reach values up to a few MHz in thetorsional ground state. In addition, like in the parent species ofmethyl formate, the presence of low-frequency small-amplitudevibrations in DCOOCH3 (Shimanouchi 1972), the COC bendingmode v12 at 315 cm−1, and the out-of-plane COC bending v17mode at 290 cm−1, lying near the top of the barrier could causesome perturbations on the rotational–torsional energy levelsunder study but such perturbations were not observed duringthe course of the present work which includes only the groundtorsional state.
As in the normal species of methyl formate, we observe aclustering of the transitions with the same Kc quantum numberfor high J, low Ka values. This clustering is the consequenceof a relatively asymmetric near-prolate internal rotor molecule(κ = −0.75).
Finally, the labeling scheme for the methyl formate energylevels as well as the connection with the traditional JKa,Kc
labeling scheme is discussed in Carvajal et al. (2007) andreferences therein.
4. ASSIGNMENTS AND FIT
In the present paper, we present a combined analysis of (1) 816and 10 lines with an 80 or 200 kHz uncertainty, respectively, outof the 885 lines originally measured by Oesterling et al. (1995),5 lines from Curl (1959) weighted with 200 kHz; (2) 275 newlymeasured in Oslo with an uncertainty of 150–200 kHz, includ-ing remeasurements of 8 lines initially measured by Curl (1959);(3) 479 new unblended lines from Lille, measured using broad-band recording in various frequency intervals between 580 and661 GHz with an uncertainty of 50 kHz, and 79 blended linesfrom Lille weighted 100–200 kHz; and (4) 39 (14 of them ac-tually involve remeasurements from lines initially published by
Curl 1959) FTMW lines from Lille, with the quadrupole hyper-fine structure of the D atom being analyzed in the principal axissystem (χaa = −0.0232(15) MHz, χbb = 0.1072(18) MHz, andχaa +χbb+χcc = 0), in order to fit the frequency of the calculatedrotational transitions with uncertainties of 3 and 10 kHz for theE (unblended) and A (blended) components, respectively.
Starting from the same data set as in Oesterling et al. (1995)which includes 885 vt = 0 microwave transitions, we refit thedata using our program (Hougen et al. 1994; Ilyushin et al.2003)6 starting at low J and going up progressively. During thisprocess, and similarly to what was happening with the normalspecies, we noted that a number of previously published linesshowed observed–calculated values which were much worsethan the ones belonging to the rest of the same Ka sub-branch. Wehave thus decided to take some of them out of the fit. In addition,based on our fitting residuals, we have allocated an increasedweight of 200 kHz to 10 lines from Oesterling data, insteadof the 100 kHz originally quoted by the authors (Oesterlinget al. 1995). We note also that Maeda et al. (2008b) have madethe same conclusion regarding some of the somewhat largediscrepancies observed in their studies concerning the normalspecies which they attribute to previous FASSST measurementsperformed in 1999 since those measurements were made withoutaveraging upward and downward scans in frequency.
As in H12COO12CH3 (Ilyushin et al. 2009), we observed thesame behavior for the close series of lines assigned to A and Ecomponents of the R branch involving Ka = 0 and 1: at lowJ values, the A components of those transitions are above theE components but this situation changes after J = 39 → 40(instead of J = 38 for the normal species) and the A componentlines lie below the E components for J values above 39.
The “best” fit allowed 24 parameters (less than the 31 pa-rameters used in Oesterling et al. 1995) to be varied. Themicrowave rms deviations obtained are 94.2 kHz (for 1703vt = 0 lines), involving transitions with J � 64,Ka � 36for the ground torsional state. The overall quality of the fit isillustrated in Table 1, which gives the rms deviations for tran-sitions grouped according to their measurement uncertainties(weight in the fit was proportional to the reciprocal of squareduncertainty). The unitless standard deviation is 1.11, and eachgroup of transitions almost fits to experimental uncertainties.
Table 2 presents the values for the rotation–torsion parametersused in our model, which includes up to sixth-order parameters,i.e., those with n = l + m = 6, where n is the total order ofthe operator, l is the order of the torsional part, and m is theorder of the rotational part, respectively, following the notationof our previous papers on the RAM (Hougen et al. 1994).In comparison with the previous work, only 24 parametersare needed to achieve nearly experimental accuracy. However,because no direct information on the torsional vibrationalfrequency vt = 1–0 is included in the fit, the correlation betweenthe torsional parameters F and V3 is rather strong, and we fixedthe value of the constant F to its value for H12COO12CH3 fromCarvajal et al. (2007). This correlation between F and V3 islikely to increase the estimated uncertainty on the fitted V3parameter. Also, the value of the potential parameter V6 cannotbe determined while the potential barrier V3 is being fitted withonly experimental vt = 0 transition lines. For this reason, the
6 The source code for the fit, an example of input data file, and a readme fileare available at the Web site(http://www.ifpan.edu.pl/∼kisiel/introt/introt.htm#belgi) managed by Dr.Zbigniew Kisiel. Extended versions of code made in order to fit transitionswith higher J and K are also available from two of the authors (I.K. and M.C.).
No. 2, 2010 ROTATIONAL SPECTRUM AND TENTATIVE DETECTION OF DCOOCH3 ORION 1123
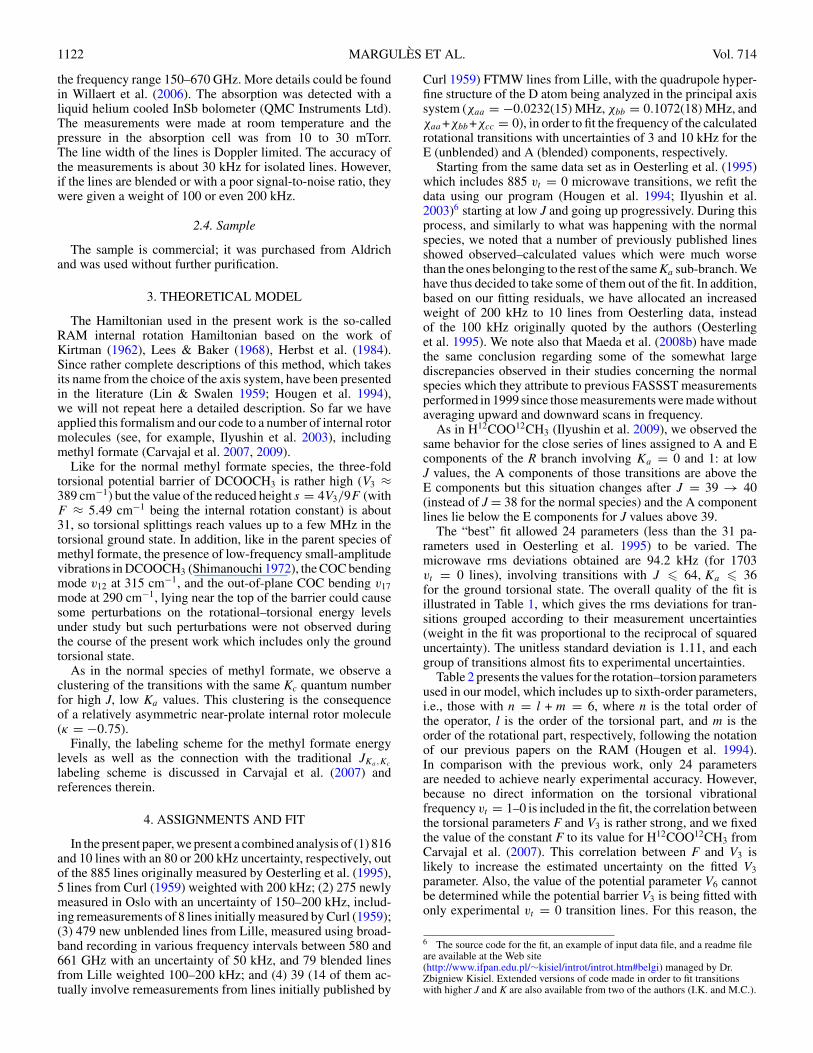
Table 1rms Deviations from the Global Fita of Transitions Involving vt = 0 Torsional Energy Levels of Deuterated Methyl Formate (DCOOCH3)
Number of parameters 24Number of lines 1703
rms of the 1703 MW vt=0–0 lines 0.0942 MHzrms of the 882 A symmetry lines 0.0971 MHzrms of the 821 E symmetry lines 0.0909 MHz
Sourceb Rangec (GHz) Jmax, Kmaxd Number of Linese Uncertaintiesf (MHz) rmsg (MHz)
FTMW–Lille 4–18 7,4 18 0.003 0.004721 0.010 0.0154
BWO–Lille 580–661 64,36 479 0.050 0.0655
OEST 91–377 30,25 816 0.080 0.0799
BWO–Lille 580–661 57,29 48 0.100 0.1190
OSLO 7–80 48,16 259 0.15016 0.200
BWO–Lille 580–661 57,35 31 0.200 0.1493CURL 227–290 5, 1 5 0.200OEST 91–377 26, 6 10 0.200
Notes.a Parameter values are given in Table 2. The complete list of observed minus calculated residuals of vt = 0 lines is given in the machine-readableform of Table 3 in the online journal.b Sources of data: OEST (Oesterling et al. 1995); BWO–Lille, FTMW–Lille, and OSLO data come from present work. The FTMW–Lille andOSLO data include remeasurements of 22 out of 27 lines from CURL (Curl 1959).c Spectral range of the measurements.d Maximum J and Ka for each group of measurements.e Number of MW lines in each uncertainty group.f Uncertainty in MHz used in the fit.g rms deviation in MHz for each group.
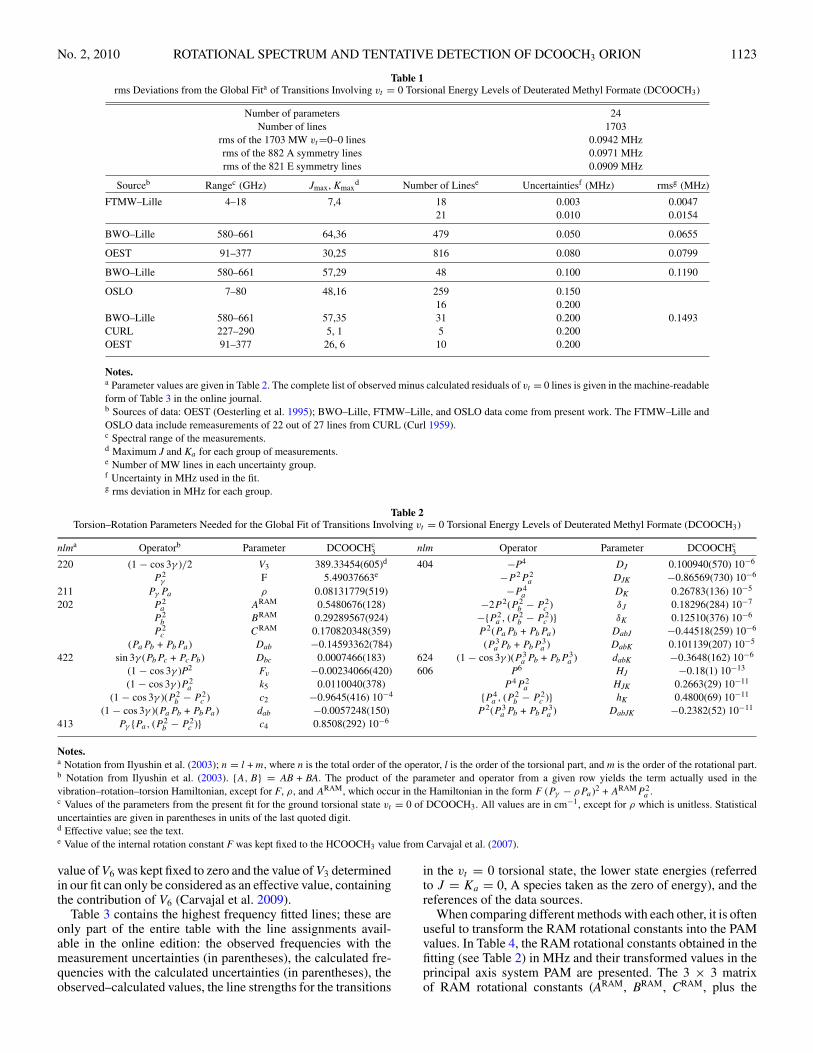
Table 2Torsion–Rotation Parameters Needed for the Global Fit of Transitions Involving vt = 0 Torsional Energy Levels of Deuterated Methyl Formate (DCOOCH3)
nlma Operatorb Parameter DCOOCHc3 nlm Operator Parameter DCOOCHc
3
220 (1 − cos 3γ )/2 V3 389.33454(605)d 404 −P4 DJ 0.100940(570) 10−6
P 2γ F 5.49037663e −P 2P 2
a DJK −0.86569(730) 10−6
211 Pγ Pa ρ 0.08131779(519) −P 4a DK 0.26783(136) 10−5
202 P 2a ARAM 0.5480676(128) −2P 2(P 2
b − P 2c ) δJ 0.18296(284) 10−7
P 2b BRAM 0.29289567(924) −{P 2
a , (P 2b − P 2
c )} δK 0.12510(376) 10−6
P 2c CRAM 0.170820348(359) P 2(PaPb + PbPa) DabJ −0.44518(259) 10−6
(PaPb + PbPa) Dab −0.14593362(784) (P 3a Pb + PbP
3a ) DabK 0.101139(207) 10−5
422 sin 3γ (PbPc + PcPb) Dbc 0.0007466(183) 624 (1 − cos 3γ )(P 3a Pb + PbP
3a ) dabK −0.3648(162) 10−6
(1 − cos 3γ )P2 Fv −0.00234066(420) 606 P6 HJ −0.18(1) 10−13
(1 − cos 3γ )P 2a k5 0.0110040(378) P 4P 2
a HJK 0.2663(29) 10−11
(1 − cos 3γ )(P 2b − P 2
c ) c2 −0.9645(416) 10−4 {P 4a , (P 2
b − P 2c )} hK 0.4800(69) 10−11
(1 − cos 3γ )(PaPb + PbPa) dab −0.0057248(150) P 2(P 3a Pb + PbP
3a ) DabJK −0.2382(52) 10−11
413 Pγ {Pa, (P 2b − P 2
c )} c4 0.8508(292) 10−6
Notes.a Notation from Ilyushin et al. (2003); n = l + m, where n is the total order of the operator, l is the order of the torsional part, and m is the order of the rotational part.b Notation from Ilyushin et al. (2003). {A, B} = AB + BA. The product of the parameter and operator from a given row yields the term actually used in thevibration–rotation–torsion Hamiltonian, except for F, ρ, and ARAM, which occur in the Hamiltonian in the form F (Pγ − ρPa)2 + ARAMP 2
a .c Values of the parameters from the present fit for the ground torsional state vt = 0 of DCOOCH3. All values are in cm−1, except for ρ which is unitless. Statisticaluncertainties are given in parentheses in units of the last quoted digit.d Effective value; see the text.e Value of the internal rotation constant F was kept fixed to the HCOOCH3 value from Carvajal et al. (2007).
value of V6 was kept fixed to zero and the value of V3 determinedin our fit can only be considered as an effective value, containingthe contribution of V6 (Carvajal et al. 2009).
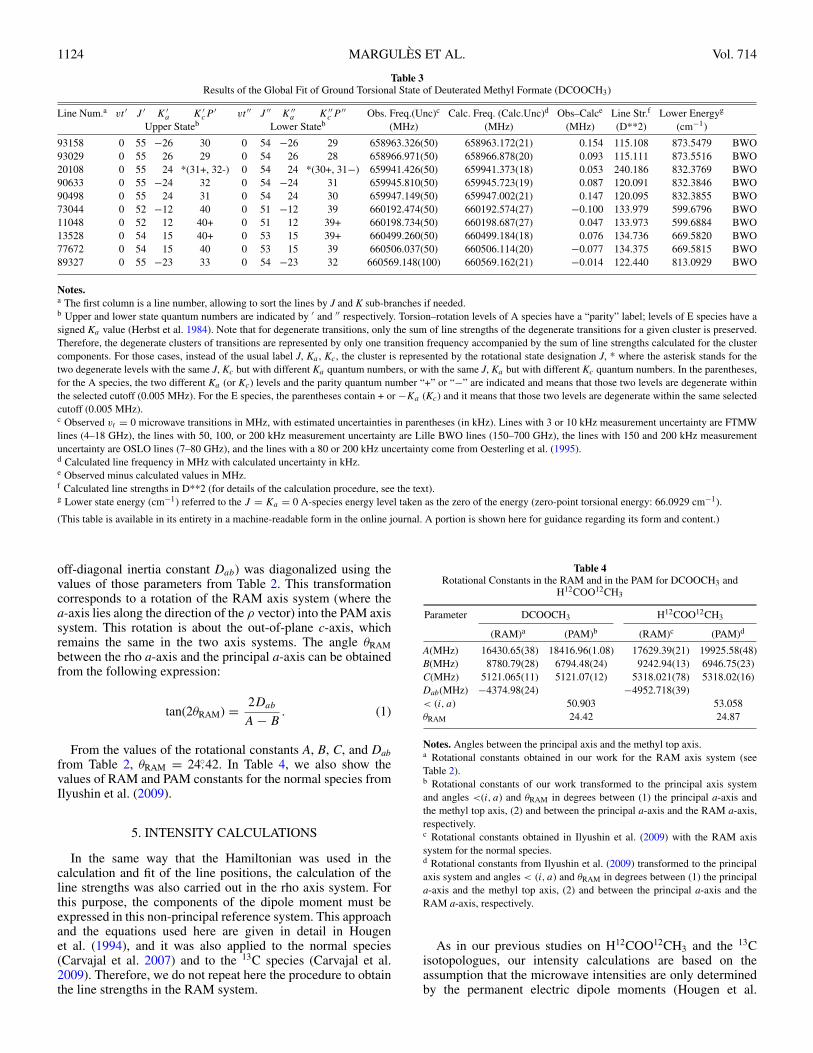
Table 3 contains the highest frequency fitted lines; these areonly part of the entire table with the line assignments avail-able in the online edition: the observed frequencies with themeasurement uncertainties (in parentheses), the calculated fre-quencies with the calculated uncertainties (in parentheses), theobserved–calculated values, the line strengths for the transitions
in the vt = 0 torsional state, the lower state energies (referredto J = Ka = 0, A species taken as the zero of energy), and thereferences of the data sources.
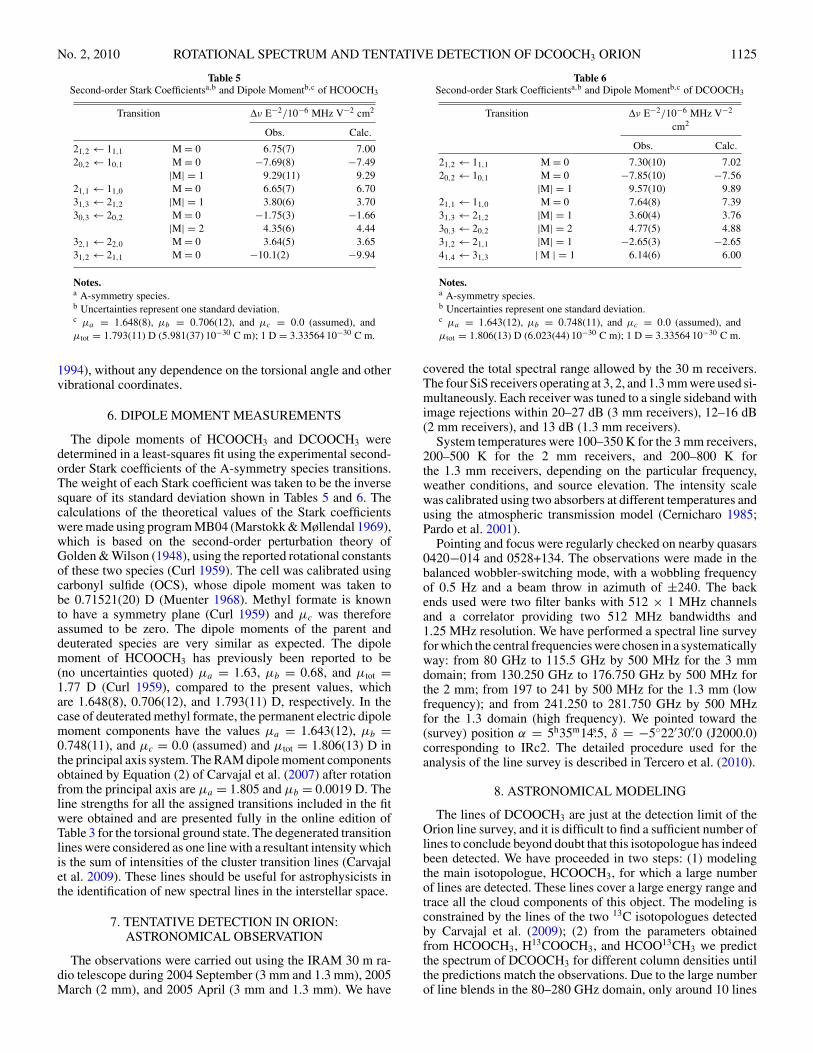
When comparing different methods with each other, it is oftenuseful to transform the RAM rotational constants into the PAMvalues. In Table 4, the RAM rotational constants obtained in thefitting (see Table 2) in MHz and their transformed values in theprincipal axis system PAM are presented. The 3 × 3 matrixof RAM rotational constants (ARAM, BRAM, CRAM, plus the
1124 MARGULES ET AL. Vol. 714
Table 3Results of the Global Fit of Ground Torsional State of Deuterated Methyl Formate (DCOOCH3)
Line Num.a vt ′ J ′ K ′a K ′
cP′ vt ′′ J ′′ K ′′
a K ′′c P ′′ Obs. Freq.(Unc)c Calc. Freq. (Calc.Unc)d Obs–Calce Line Str.f Lower Energyg
Upper Stateb Lower Stateb (MHz) (MHz) (MHz) (D**2) (cm−1)
93158 0 55 −26 30 0 54 −26 29 658963.326(50) 658963.172(21) 0.154 115.108 873.5479 BWO93029 0 55 26 29 0 54 26 28 658966.971(50) 658966.878(20) 0.093 115.111 873.5516 BWO20108 0 55 24 *(31+, 32-) 0 54 24 *(30+, 31−) 659941.426(50) 659941.373(18) 0.053 240.186 832.3769 BWO90633 0 55 −24 32 0 54 −24 31 659945.810(50) 659945.723(19) 0.087 120.091 832.3846 BWO90498 0 55 24 31 0 54 24 30 659947.149(50) 659947.002(21) 0.147 120.095 832.3855 BWO73044 0 52 −12 40 0 51 −12 39 660192.474(50) 660192.574(27) −0.100 133.979 599.6796 BWO11048 0 52 12 40+ 0 51 12 39+ 660198.734(50) 660198.687(27) 0.047 133.973 599.6884 BWO13528 0 54 15 40+ 0 53 15 39+ 660499.260(50) 660499.184(18) 0.076 134.736 669.5820 BWO77672 0 54 15 40 0 53 15 39 660506.037(50) 660506.114(20) −0.077 134.375 669.5815 BWO89327 0 55 −23 33 0 54 −23 32 660569.148(100) 660569.162(21) −0.014 122.440 813.0929 BWO
Notes.a The first column is a line number, allowing to sort the lines by J and K sub-branches if needed.b Upper and lower state quantum numbers are indicated by ′ and ′′ respectively. Torsion–rotation levels of A species have a “parity” label; levels of E species have asigned Ka value (Herbst et al. 1984). Note that for degenerate transitions, only the sum of line strengths of the degenerate transitions for a given cluster is preserved.Therefore, the degenerate clusters of transitions are represented by only one transition frequency accompanied by the sum of line strengths calculated for the clustercomponents. For those cases, instead of the usual label J, Ka , Kc , the cluster is represented by the rotational state designation J, * where the asterisk stands for thetwo degenerate levels with the same J, Kc but with different Ka quantum numbers, or with the same J, Ka but with different Kc quantum numbers. In the parentheses,for the A species, the two different Ka (or Kc) levels and the parity quantum number “+” or “−” are indicated and means that those two levels are degenerate withinthe selected cutoff (0.005 MHz). For the E species, the parentheses contain + or −Ka (Kc) and it means that those two levels are degenerate within the same selectedcutoff (0.005 MHz).c Observed vt = 0 microwave transitions in MHz, with estimated uncertainties in parentheses (in kHz). Lines with 3 or 10 kHz measurement uncertainty are FTMWlines (4–18 GHz), the lines with 50, 100, or 200 kHz measurement uncertainty are Lille BWO lines (150–700 GHz), the lines with 150 and 200 kHz measurementuncertainty are OSLO lines (7–80 GHz), and the lines with a 80 or 200 kHz uncertainty come from Oesterling et al. (1995).d Calculated line frequency in MHz with calculated uncertainty in kHz.e Observed minus calculated values in MHz.f Calculated line strengths in D**2 (for details of the calculation procedure, see the text).g Lower state energy (cm−1) referred to the J = Ka = 0 A-species energy level taken as the zero of the energy (zero-point torsional energy: 66.0929 cm−1).
(This table is available in its entirety in a machine-readable form in the online journal. A portion is shown here for guidance regarding its form and content.)
off-diagonal inertia constant Dab) was diagonalized using thevalues of those parameters from Table 2. This transformationcorresponds to a rotation of the RAM axis system (where thea-axis lies along the direction of the ρ vector) into the PAM axissystem. This rotation is about the out-of-plane c-axis, whichremains the same in the two axis systems. The angle θRAMbetween the rho a-axis and the principal a-axis can be obtainedfrom the following expression:
tan(2θRAM) = 2Dab
A − B. (1)
From the values of the rotational constants A, B, C, and Dabfrom Table 2, θRAM = 24.◦42. In Table 4, we also show thevalues of RAM and PAM constants for the normal species fromIlyushin et al. (2009).
5. INTENSITY CALCULATIONS
In the same way that the Hamiltonian was used in thecalculation and fit of the line positions, the calculation of theline strengths was also carried out in the rho axis system. Forthis purpose, the components of the dipole moment must beexpressed in this non-principal reference system. This approachand the equations used here are given in detail in Hougenet al. (1994), and it was also applied to the normal species(Carvajal et al. 2007) and to the 13C species (Carvajal et al.2009). Therefore, we do not repeat here the procedure to obtainthe line strengths in the RAM system.
Table 4Rotational Constants in the RAM and in the PAM for DCOOCH3 and
H12COO12CH3
Parameter DCOOCH3 H12COO12CH3
(RAM)a (PAM)b (RAM)c (PAM)d
A(MHz) 16430.65(38) 18416.96(1.08) 17629.39(21) 19925.58(48)B(MHz) 8780.79(28) 6794.48(24) 9242.94(13) 6946.75(23)C(MHz) 5121.065(11) 5121.07(12) 5318.021(78) 5318.02(16)Dab(MHz) −4374.98(24) −4952.718(39)< (i, a) 50.903 53.058θRAM 24.42 24.87
Notes. Angles between the principal axis and the methyl top axis.a Rotational constants obtained in our work for the RAM axis system (seeTable 2).b Rotational constants of our work transformed to the principal axis systemand angles <(i, a) and θRAM in degrees between (1) the principal a-axis andthe methyl top axis, (2) and between the principal a-axis and the RAM a-axis,respectively.c Rotational constants obtained in Ilyushin et al. (2009) with the RAM axissystem for the normal species.d Rotational constants from Ilyushin et al. (2009) transformed to the principalaxis system and angles < (i, a) and θRAM in degrees between (1) the principala-axis and the methyl top axis, (2) and between the principal a-axis and theRAM a-axis, respectively.
As in our previous studies on H12COO12CH3 and the 13Cisotopologues, our intensity calculations are based on theassumption that the microwave intensities are only determinedby the permanent electric dipole moments (Hougen et al.
No. 2, 2010 ROTATIONAL SPECTRUM AND TENTATIVE DETECTION OF DCOOCH3 ORION 1125
Table 5Second-order Stark Coefficientsa,b and Dipole Momentb,c of HCOOCH3
Transition Δν E−2/10−6 MHz V−2 cm2
Obs. Calc.
21,2 ← 11,1 M = 0 6.75(7) 7.0020,2 ← 10,1 M = 0 −7.69(8) −7.49
|M| = 1 9.29(11) 9.2921,1 ← 11,0 M = 0 6.65(7) 6.7031,3 ← 21,2 |M| = 1 3.80(6) 3.7030,3 ← 20,2 M = 0 −1.75(3) −1.66
|M| = 2 4.35(6) 4.4432,1 ← 22,0 M = 0 3.64(5) 3.6531,2 ← 21,1 M = 0 −10.1(2) −9.94
Notes.a A-symmetry species.b Uncertainties represent one standard deviation.c μa = 1.648(8), μb = 0.706(12), and μc = 0.0 (assumed), andμtot = 1.793(11) D (5.981(37) 10−30 C m); 1 D = 3.33564 10−30 C m.
1994), without any dependence on the torsional angle and othervibrational coordinates.
6. DIPOLE MOMENT MEASUREMENTS
The dipole moments of HCOOCH3 and DCOOCH3 weredetermined in a least-squares fit using the experimental second-order Stark coefficients of the A-symmetry species transitions.The weight of each Stark coefficient was taken to be the inversesquare of its standard deviation shown in Tables 5 and 6. Thecalculations of the theoretical values of the Stark coefficientswere made using program MB04 (Marstokk & Møllendal 1969),which is based on the second-order perturbation theory ofGolden & Wilson (1948), using the reported rotational constantsof these two species (Curl 1959). The cell was calibrated usingcarbonyl sulfide (OCS), whose dipole moment was taken tobe 0.71521(20) D (Muenter 1968). Methyl formate is knownto have a symmetry plane (Curl 1959) and μc was thereforeassumed to be zero. The dipole moments of the parent anddeuterated species are very similar as expected. The dipolemoment of HCOOCH3 has previously been reported to be(no uncertainties quoted) μa = 1.63, μb = 0.68, and μtot =1.77 D (Curl 1959), compared to the present values, whichare 1.648(8), 0.706(12), and 1.793(11) D, respectively. In thecase of deuterated methyl formate, the permanent electric dipolemoment components have the values μa = 1.643(12), μb =0.748(11), and μc = 0.0 (assumed) and μtot = 1.806(13) D inthe principal axis system. The RAM dipole moment componentsobtained by Equation (2) of Carvajal et al. (2007) after rotationfrom the principal axis are μa = 1.805 and μb = 0.0019 D. Theline strengths for all the assigned transitions included in the fitwere obtained and are presented fully in the online edition ofTable 3 for the torsional ground state. The degenerated transitionlines were considered as one line with a resultant intensity whichis the sum of intensities of the cluster transition lines (Carvajalet al. 2009). These lines should be useful for astrophysicists inthe identification of new spectral lines in the interstellar space.
7. TENTATIVE DETECTION IN ORION:ASTRONOMICAL OBSERVATION
The observations were carried out using the IRAM 30 m ra-dio telescope during 2004 September (3 mm and 1.3 mm), 2005March (2 mm), and 2005 April (3 mm and 1.3 mm). We have
Table 6Second-order Stark Coefficientsa,b and Dipole Momentb,c of DCOOCH3
Transition Δν E−2/10−6 MHz V−2
cm2
Obs. Calc.
21,2 ← 11,1 M = 0 7.30(10) 7.0220,2 ← 10,1 M = 0 −7.85(10) −7.56
|M| = 1 9.57(10) 9.8921,1 ← 11,0 M = 0 7.64(8) 7.3931,3 ← 21,2 |M| = 1 3.60(4) 3.7630,3 ← 20,2 |M| = 2 4.77(5) 4.8831,2 ← 21,1 |M| = 1 −2.65(3) −2.6541,4 ← 31,3 | M | = 1 6.14(6) 6.00
Notes.a A-symmetry species.b Uncertainties represent one standard deviation.c μa = 1.643(12), μb = 0.748(11), and μc = 0.0 (assumed), andμtot = 1.806(13) D (6.023(44) 10−30 C m); 1 D = 3.33564 10−30 C m.
covered the total spectral range allowed by the 30 m receivers.The four SiS receivers operating at 3, 2, and 1.3 mm were used si-multaneously. Each receiver was tuned to a single sideband withimage rejections within 20–27 dB (3 mm receivers), 12–16 dB(2 mm receivers), and 13 dB (1.3 mm receivers).
System temperatures were 100–350 K for the 3 mm receivers,200–500 K for the 2 mm receivers, and 200–800 K forthe 1.3 mm receivers, depending on the particular frequency,weather conditions, and source elevation. The intensity scalewas calibrated using two absorbers at different temperatures andusing the atmospheric transmission model (Cernicharo 1985;Pardo et al. 2001).
Pointing and focus were regularly checked on nearby quasars0420−014 and 0528+134. The observations were made in thebalanced wobbler-switching mode, with a wobbling frequencyof 0.5 Hz and a beam throw in azimuth of ±240. The backends used were two filter banks with 512 × 1 MHz channelsand a correlator providing two 512 MHz bandwidths and1.25 MHz resolution. We have performed a spectral line surveyfor which the central frequencies were chosen in a systematicallyway: from 80 GHz to 115.5 GHz by 500 MHz for the 3 mmdomain; from 130.250 GHz to 176.750 GHz by 500 MHz forthe 2 mm; from 197 to 241 by 500 MHz for the 1.3 mm (lowfrequency); and from 241.250 to 281.750 GHz by 500 MHzfor the 1.3 domain (high frequency). We pointed toward the(survey) position α = 5h35m14.s5, δ = −5◦22′30.′′0 (J2000.0)corresponding to IRc2. The detailed procedure used for theanalysis of the line survey is described in Tercero et al. (2010).
8. ASTRONOMICAL MODELING
The lines of DCOOCH3 are just at the detection limit of theOrion line survey, and it is difficult to find a sufficient number oflines to conclude beyond doubt that this isotopologue has indeedbeen detected. We have proceeded in two steps: (1) modelingthe main isotopologue, HCOOCH3, for which a large numberof lines are detected. These lines cover a large energy range andtrace all the cloud components of this object. The modeling isconstrained by the lines of the two 13C isotopologues detectedby Carvajal et al. (2009); (2) from the parameters obtainedfrom HCOOCH3, H13COOCH3, and HCOO13CH3 we predictthe spectrum of DCOOCH3 for different column densities untilthe predictions match the observations. Due to the large numberof line blends in the 80–280 GHz domain, only around 10 lines
1126 MARGULES ET AL. Vol. 714
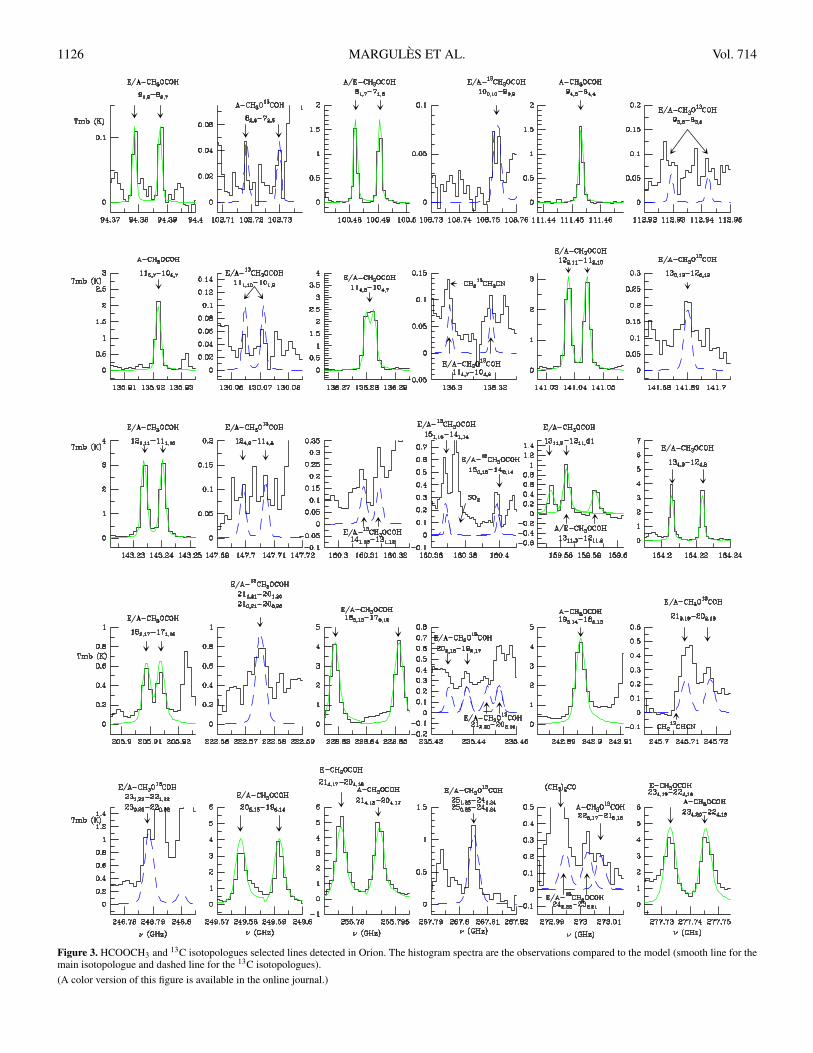
Figure 3. HCOOCH3 and 13C isotopologues selected lines detected in Orion. The histogram spectra are the observations compared to the model (smooth line for themain isotopologue and dashed line for the 13C isotopologues).
(A color version of this figure is available in the online journal.)
No. 2, 2010 ROTATIONAL SPECTRUM AND TENTATIVE DETECTION OF DCOOCH3 ORION 1127
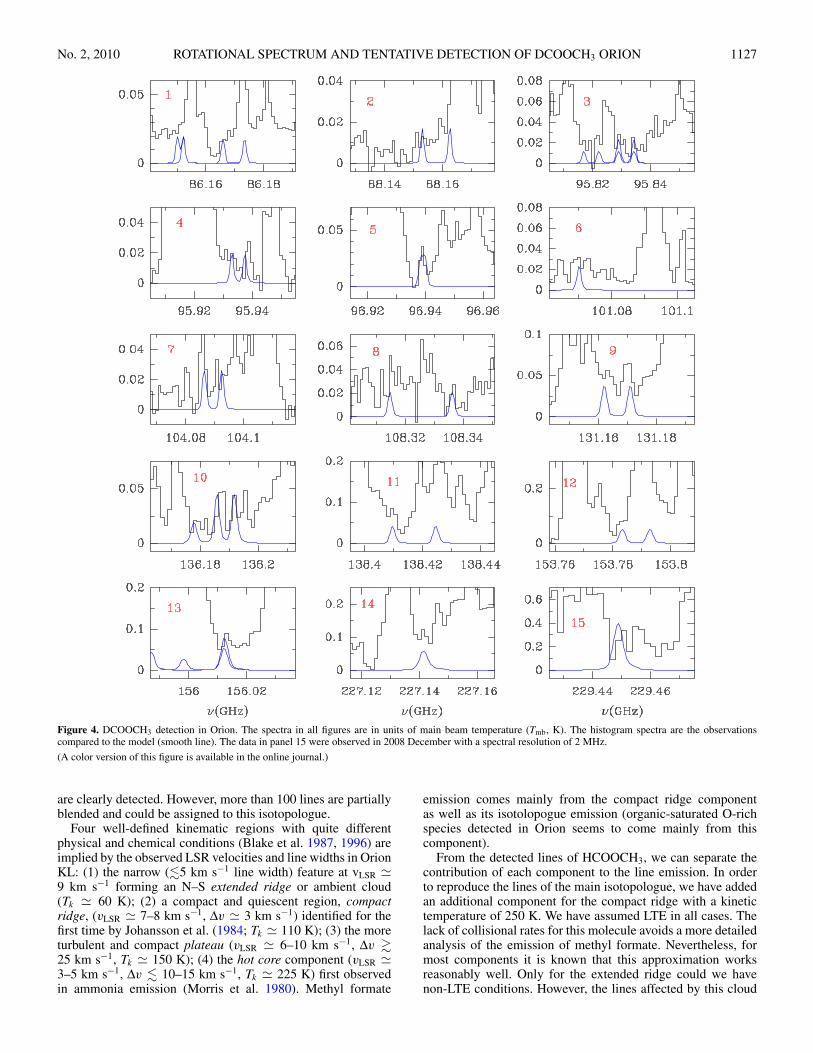
Figure 4. DCOOCH3 detection in Orion. The spectra in all figures are in units of main beam temperature (Tmb, K). The histogram spectra are the observationscompared to the model (smooth line). The data in panel 15 were observed in 2008 December with a spectral resolution of 2 MHz.
(A color version of this figure is available in the online journal.)
are clearly detected. However, more than 100 lines are partiallyblended and could be assigned to this isotopologue.
Four well-defined kinematic regions with quite differentphysical and chemical conditions (Blake et al. 1987, 1996) areimplied by the observed LSR velocities and line widths in OrionKL: (1) the narrow (�5 km s−1 line width) feature at vLSR 9 km s−1 forming an N–S extended ridge or ambient cloud(Tk 60 K); (2) a compact and quiescent region, compactridge, (vLSR 7–8 km s−1, Δv 3 km s−1) identified for thefirst time by Johansson et al. (1984; Tk 110 K); (3) the moreturbulent and compact plateau (vLSR 6–10 km s−1, Δv �25 km s−1, Tk 150 K); (4) the hot core component (vLSR 3–5 km s−1, Δv � 10–15 km s−1, Tk 225 K) first observedin ammonia emission (Morris et al. 1980). Methyl formate
emission comes mainly from the compact ridge componentas well as its isotolopogue emission (organic-saturated O-richspecies detected in Orion seems to come mainly from thiscomponent).
From the detected lines of HCOOCH3, we can separate thecontribution of each component to the line emission. In orderto reproduce the lines of the main isotopologue, we have addedan additional component for the compact ridge with a kinetictemperature of 250 K. We have assumed LTE in all cases. Thelack of collisional rates for this molecule avoids a more detailedanalysis of the emission of methyl formate. Nevertheless, formost components it is known that this approximation worksreasonably well. Only for the extended ridge could we havenon-LTE conditions. However, the lines affected by this cloud
1128 MARGULES ET AL. Vol. 714
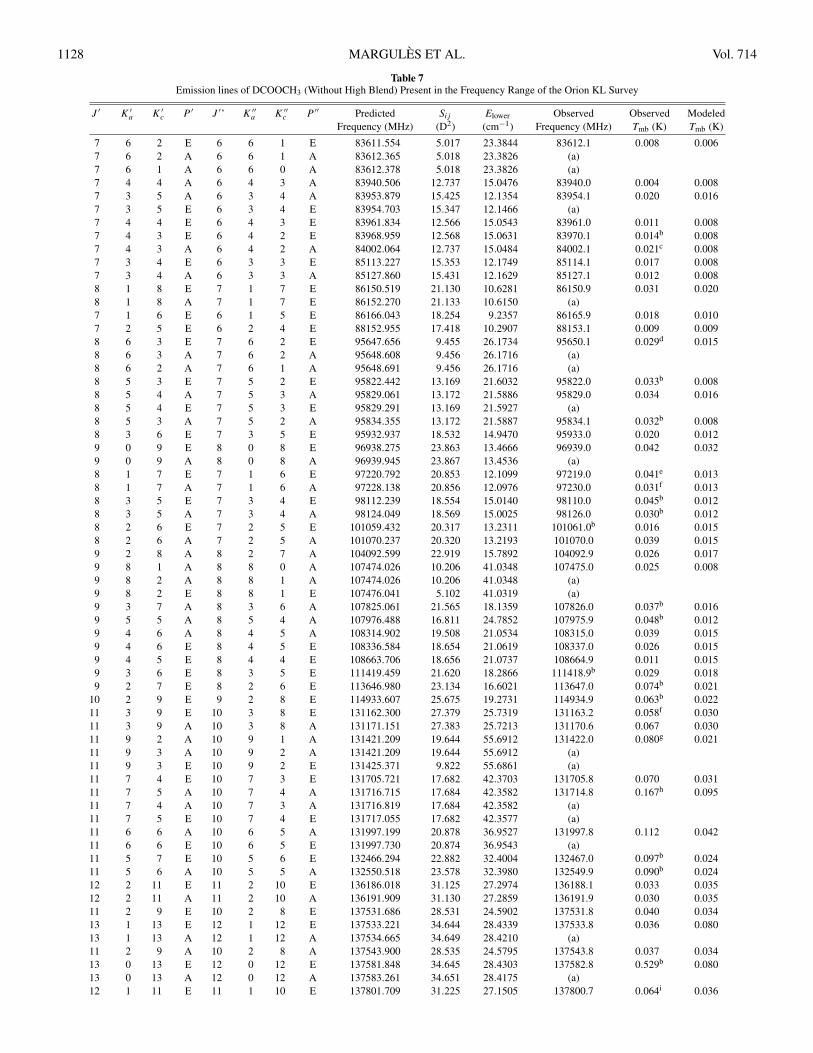
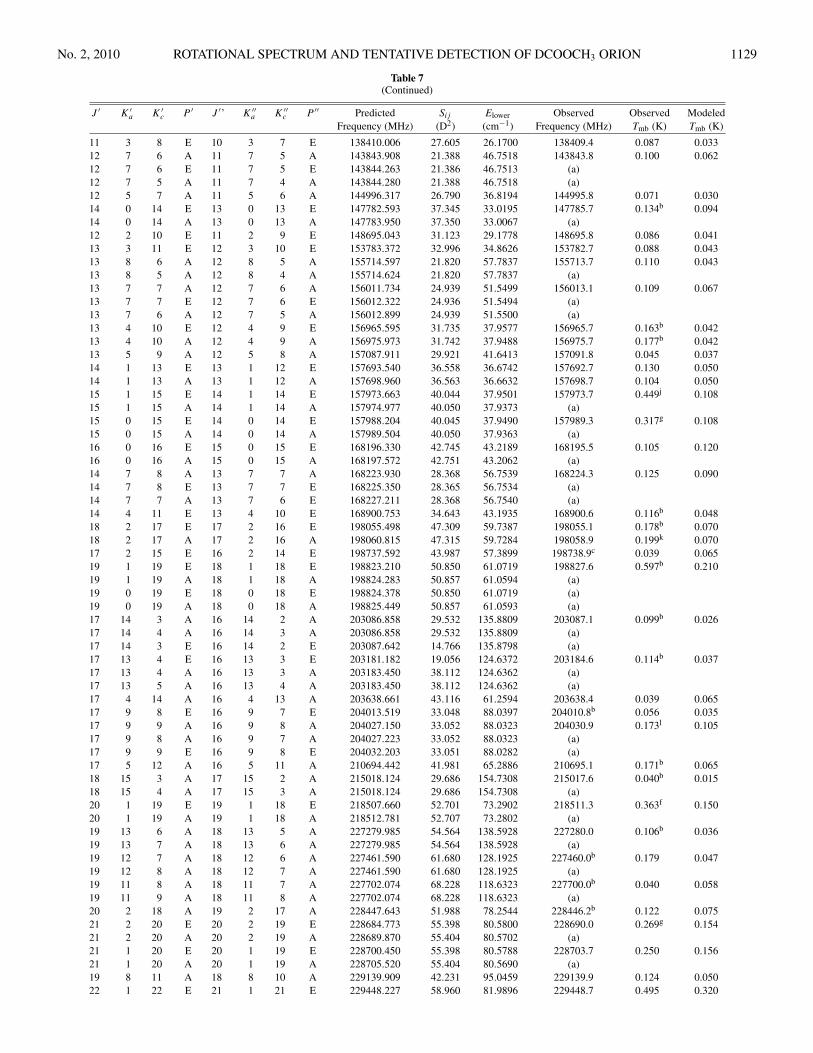
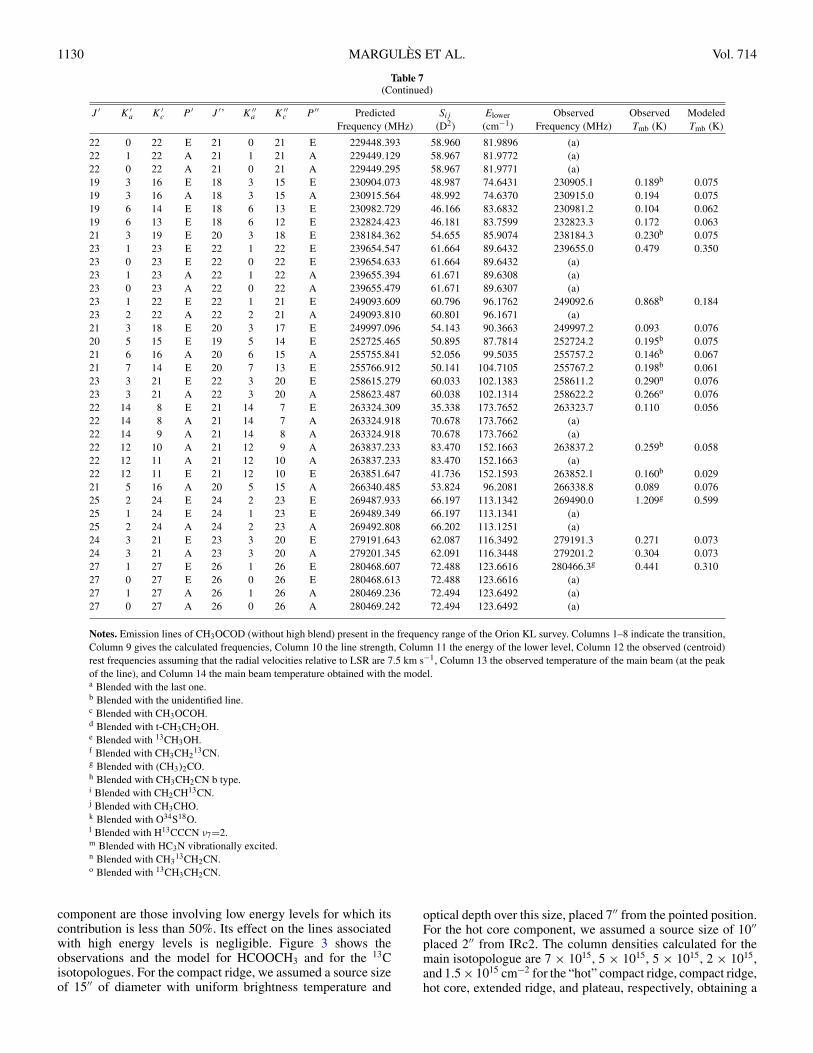
Table 7Emission lines of DCOOCH3 (Without High Blend) Present in the Frequency Range of the Orion KL Survey
J ′ K ′a K ′
c P ′ J ′’ K ′′a K ′′
c P ′′ Predicted Sij Elower Observed Observed ModeledFrequency (MHz) (D2) (cm−1) Frequency (MHz) Tmb (K) Tmb (K)
7 6 2 E 6 6 1 E 83611.554 5.017 23.3844 83612.1 0.008 0.0067 6 2 A 6 6 1 A 83612.365 5.018 23.3826 (a)7 6 1 A 6 6 0 A 83612.378 5.018 23.3826 (a)7 4 4 A 6 4 3 A 83940.506 12.737 15.0476 83940.0 0.004 0.0087 3 5 A 6 3 4 A 83953.879 15.425 12.1354 83954.1 0.020 0.0167 3 5 E 6 3 4 E 83954.703 15.347 12.1466 (a)7 4 4 E 6 4 3 E 83961.834 12.566 15.0543 83961.0 0.011 0.0087 4 3 E 6 4 2 E 83968.959 12.568 15.0631 83970.1 0.014b 0.0087 4 3 A 6 4 2 A 84002.064 12.737 15.0484 84002.1 0.021c 0.0087 3 4 E 6 3 3 E 85113.227 15.353 12.1749 85114.1 0.017 0.0087 3 4 A 6 3 3 A 85127.860 15.431 12.1629 85127.1 0.012 0.0088 1 8 E 7 1 7 E 86150.519 21.130 10.6281 86150.9 0.031 0.0208 1 8 A 7 1 7 E 86152.270 21.133 10.6150 (a)7 1 6 E 6 1 5 E 86166.043 18.254 9.2357 86165.9 0.018 0.0107 2 5 E 6 2 4 E 88152.955 17.418 10.2907 88153.1 0.009 0.0098 6 3 E 7 6 2 E 95647.656 9.455 26.1734 95650.1 0.029d 0.0158 6 3 A 7 6 2 A 95648.608 9.456 26.1716 (a)8 6 2 A 7 6 1 A 95648.691 9.456 26.1716 (a)8 5 3 E 7 5 2 E 95822.442 13.169 21.6032 95822.0 0.033b 0.0088 5 4 A 7 5 3 A 95829.061 13.172 21.5886 95829.0 0.034 0.0168 5 4 E 7 5 3 E 95829.291 13.169 21.5927 (a)8 5 3 A 7 5 2 A 95834.355 13.172 21.5887 95834.1 0.032b 0.0088 3 6 E 7 3 5 E 95932.937 18.532 14.9470 95933.0 0.020 0.0129 0 9 E 8 0 8 E 96938.275 23.863 13.4666 96939.0 0.042 0.0329 0 9 A 8 0 8 A 96939.945 23.867 13.4536 (a)8 1 7 E 7 1 6 E 97220.792 20.853 12.1099 97219.0 0.041e 0.0138 1 7 A 7 1 6 A 97228.138 20.856 12.0976 97230.0 0.031f 0.0138 3 5 E 7 3 4 E 98112.239 18.554 15.0140 98110.0 0.045b 0.0128 3 5 A 7 3 4 A 98124.049 18.569 15.0025 98126.0 0.030b 0.0128 2 6 E 7 2 5 E 101059.432 20.317 13.2311 101061.0b 0.016 0.0158 2 6 A 7 2 5 A 101070.237 20.320 13.2193 101070.0 0.039 0.0159 2 8 A 8 2 7 A 104092.599 22.919 15.7892 104092.9 0.026 0.0179 8 1 A 8 8 0 A 107474.026 10.206 41.0348 107475.0 0.025 0.0089 8 2 A 8 8 1 A 107474.026 10.206 41.0348 (a)9 8 2 E 8 8 1 E 107476.041 5.102 41.0319 (a)9 3 7 A 8 3 6 A 107825.061 21.565 18.1359 107826.0 0.037b 0.0169 5 5 A 8 5 4 A 107976.488 16.811 24.7852 107975.9 0.048b 0.0129 4 6 A 8 4 5 A 108314.902 19.508 21.0534 108315.0 0.039 0.0159 4 6 E 8 4 5 E 108336.584 18.654 21.0619 108337.0 0.026 0.0159 4 5 E 8 4 4 E 108663.706 18.656 21.0737 108664.9 0.011 0.0159 3 6 E 8 3 5 E 111419.459 21.620 18.2866 111418.9b 0.029 0.0189 2 7 E 8 2 6 E 113646.980 23.134 16.6021 113647.0 0.074b 0.021
10 2 9 E 9 2 8 E 114933.607 25.675 19.2731 114934.9 0.063b 0.02211 3 9 E 10 3 8 E 131162.300 27.379 25.7319 131163.2 0.058f 0.03011 3 9 A 10 3 8 A 131171.151 27.383 25.7213 131170.6 0.067 0.03011 9 2 A 10 9 1 A 131421.209 19.644 55.6912 131422.0 0.080g 0.02111 9 3 A 10 9 2 A 131421.209 19.644 55.6912 (a)11 9 3 E 10 9 2 E 131425.371 9.822 55.6861 (a)11 7 4 E 10 7 3 E 131705.721 17.682 42.3703 131705.8 0.070 0.03111 7 5 A 10 7 4 A 131716.715 17.684 42.3582 131714.8 0.167h 0.09511 7 4 A 10 7 3 A 131716.819 17.684 42.3582 (a)11 7 5 E 10 7 4 E 131717.055 17.682 42.3577 (a)11 6 6 A 10 6 5 A 131997.199 20.878 36.9527 131997.8 0.112 0.04211 6 6 E 10 6 5 E 131997.730 20.874 36.9543 (a)11 5 7 E 10 5 6 E 132466.294 22.882 32.4004 132467.0 0.097b 0.02411 5 6 A 10 5 5 A 132550.518 23.578 32.3980 132549.9 0.090b 0.02412 2 11 E 11 2 10 E 136186.018 31.125 27.2974 136188.1 0.033 0.03512 2 11 A 11 2 10 A 136191.909 31.130 27.2859 136191.9 0.030 0.03511 2 9 E 10 2 8 E 137531.686 28.531 24.5902 137531.8 0.040 0.03413 1 13 E 12 1 12 E 137533.221 34.644 28.4339 137533.8 0.036 0.08013 1 13 A 12 1 12 A 137534.665 34.649 28.4210 (a)11 2 9 A 10 2 8 A 137543.900 28.535 24.5795 137543.8 0.037 0.03413 0 13 E 12 0 12 E 137581.848 34.645 28.4303 137582.8 0.529b 0.08013 0 13 A 12 0 12 A 137583.261 34.651 28.4175 (a)12 1 11 E 11 1 10 E 137801.709 31.225 27.1505 137800.7 0.064i 0.036
No. 2, 2010 ROTATIONAL SPECTRUM AND TENTATIVE DETECTION OF DCOOCH3 ORION 1129
Table 7(Continued)
J ′ K ′a K ′
c P ′ J ′’ K ′′a K ′′
c P ′′ Predicted Sij Elower Observed Observed ModeledFrequency (MHz) (D2) (cm−1) Frequency (MHz) Tmb (K) Tmb (K)
11 3 8 E 10 3 7 E 138410.006 27.605 26.1700 138409.4 0.087 0.03312 7 6 A 11 7 5 A 143843.908 21.388 46.7518 143843.8 0.100 0.06212 7 6 E 11 7 5 E 143844.263 21.386 46.7513 (a)12 7 5 A 11 7 4 A 143844.280 21.388 46.7518 (a)12 5 7 A 11 5 6 A 144996.317 26.790 36.8194 144995.8 0.071 0.03014 0 14 E 13 0 13 E 147782.593 37.345 33.0195 147785.7 0.134b 0.09414 0 14 A 13 0 13 A 147783.950 37.350 33.0067 (a)12 2 10 E 11 2 9 E 148695.043 31.123 29.1778 148695.8 0.086 0.04113 3 11 E 12 3 10 E 153783.372 32.996 34.8626 153782.7 0.088 0.04313 8 6 A 12 8 5 A 155714.597 21.820 57.7837 155713.7 0.110 0.04313 8 5 A 12 8 4 A 155714.624 21.820 57.7837 (a)13 7 7 A 12 7 6 A 156011.734 24.939 51.5499 156013.1 0.109 0.06713 7 7 E 12 7 6 E 156012.322 24.936 51.5494 (a)13 7 6 A 12 7 5 A 156012.899 24.939 51.5500 (a)13 4 10 E 12 4 9 E 156965.595 31.735 37.9577 156965.7 0.163b 0.04213 4 10 A 12 4 9 A 156975.973 31.742 37.9488 156975.7 0.177b 0.04213 5 9 A 12 5 8 A 157087.911 29.921 41.6413 157091.8 0.045 0.03714 1 13 E 13 1 12 E 157693.540 36.558 36.6742 157692.7 0.130 0.05014 1 13 A 13 1 12 A 157698.960 36.563 36.6632 157698.7 0.104 0.05015 1 15 E 14 1 14 E 157973.663 40.044 37.9501 157973.7 0.449j 0.10815 1 15 A 14 1 14 A 157974.977 40.050 37.9373 (a)15 0 15 E 14 0 14 E 157988.204 40.045 37.9490 157989.3 0.317g 0.10815 0 15 A 14 0 14 A 157989.504 40.050 37.9363 (a)16 0 16 E 15 0 15 E 168196.330 42.745 43.2189 168195.5 0.105 0.12016 0 16 A 15 0 15 A 168197.572 42.751 43.2062 (a)14 7 8 A 13 7 7 A 168223.930 28.368 56.7539 168224.3 0.125 0.09014 7 8 E 13 7 7 E 168225.350 28.365 56.7534 (a)14 7 7 A 13 7 6 E 168227.211 28.368 56.7540 (a)14 4 11 E 13 4 10 E 168900.753 34.643 43.1935 168900.6 0.116b 0.04818 2 17 E 17 2 16 E 198055.498 47.309 59.7387 198055.1 0.178b 0.07018 2 17 A 17 2 16 A 198060.815 47.315 59.7284 198058.9 0.199k 0.07017 2 15 E 16 2 14 E 198737.592 43.987 57.3899 198738.9c 0.039 0.06519 1 19 E 18 1 18 E 198823.210 50.850 61.0719 198827.6 0.597b 0.21019 1 19 A 18 1 18 A 198824.283 50.857 61.0594 (a)19 0 19 E 18 0 18 E 198824.378 50.850 61.0719 (a)19 0 19 A 18 0 18 A 198825.449 50.857 61.0593 (a)17 14 3 A 16 14 2 A 203086.858 29.532 135.8809 203087.1 0.099b 0.02617 14 4 A 16 14 3 A 203086.858 29.532 135.8809 (a)17 14 3 E 16 14 2 E 203087.642 14.766 135.8798 (a)17 13 4 E 16 13 3 E 203181.182 19.056 124.6372 203184.6 0.114b 0.03717 13 4 A 16 13 3 A 203183.450 38.112 124.6362 (a)17 13 5 A 16 13 4 A 203183.450 38.112 124.6362 (a)17 4 14 A 16 4 13 A 203638.661 43.116 61.2594 203638.4 0.039 0.06517 9 8 E 16 9 7 E 204013.519 33.048 88.0397 204010.8b 0.056 0.03517 9 9 A 16 9 8 A 204027.150 33.052 88.0323 204030.9 0.173l 0.10517 9 8 A 16 9 7 A 204027.223 33.052 88.0323 (a)17 9 9 E 16 9 8 E 204032.203 33.051 88.0282 (a)17 5 12 A 16 5 11 A 210694.442 41.981 65.2886 210695.1 0.171b 0.06518 15 3 A 17 15 2 A 215018.124 29.686 154.7308 215017.6 0.040b 0.01518 15 4 A 17 15 3 A 215018.124 29.686 154.7308 (a)20 1 19 E 19 1 18 E 218507.660 52.701 73.2902 218511.3 0.363f 0.15020 1 19 A 19 1 18 A 218512.781 52.707 73.2802 (a)19 13 6 A 18 13 5 A 227279.985 54.564 138.5928 227280.0 0.106b 0.03619 13 7 A 18 13 6 A 227279.985 54.564 138.5928 (a)19 12 7 A 18 12 6 A 227461.590 61.680 128.1925 227460.0b 0.179 0.04719 12 8 A 18 12 7 A 227461.590 61.680 128.1925 (a)19 11 8 A 18 11 7 A 227702.074 68.228 118.6323 227700.0b 0.040 0.05819 11 9 A 18 11 8 A 227702.074 68.228 118.6323 (a)20 2 18 A 19 2 17 A 228447.643 51.988 78.2544 228446.2b 0.122 0.07521 2 20 E 20 2 19 E 228684.773 55.398 80.5800 228690.0 0.269g 0.15421 2 20 A 20 2 19 A 228689.870 55.404 80.5702 (a)21 1 20 E 20 1 19 E 228700.450 55.398 80.5788 228703.7 0.250 0.15621 1 20 A 20 1 19 A 228705.520 55.404 80.5690 (a)19 8 11 A 18 8 10 A 229139.909 42.231 95.0459 229139.9 0.124 0.05022 1 22 E 21 1 21 E 229448.227 58.960 81.9896 229448.7 0.495 0.320
1130 MARGULES ET AL. Vol. 714
Table 7(Continued)
J ′ K ′a K ′
c P ′ J ′’ K ′′a K ′′
c P ′′ Predicted Sij Elower Observed Observed ModeledFrequency (MHz) (D2) (cm−1) Frequency (MHz) Tmb (K) Tmb (K)
22 0 22 E 21 0 21 E 229448.393 58.960 81.9896 (a)22 1 22 A 21 1 21 A 229449.129 58.967 81.9772 (a)22 0 22 A 21 0 21 A 229449.295 58.967 81.9771 (a)19 3 16 E 18 3 15 E 230904.073 48.987 74.6431 230905.1 0.189b 0.07519 3 16 A 18 3 15 A 230915.564 48.992 74.6370 230915.0 0.194 0.07519 6 14 E 18 6 13 E 230982.729 46.166 83.6832 230981.2 0.104 0.06219 6 13 E 18 6 12 E 232824.423 46.181 83.7599 232823.3 0.172 0.06321 3 19 E 20 3 18 E 238184.362 54.655 85.9074 238184.3 0.230b 0.07523 1 23 E 22 1 22 E 239654.547 61.664 89.6432 239655.0 0.479 0.35023 0 23 E 22 0 22 E 239654.633 61.664 89.6432 (a)23 1 23 A 22 1 22 A 239655.394 61.671 89.6308 (a)23 0 23 A 22 0 22 A 239655.479 61.671 89.6307 (a)23 1 22 E 22 1 21 E 249093.609 60.796 96.1762 249092.6 0.868b 0.18423 2 22 A 22 2 21 A 249093.810 60.801 96.1671 (a)21 3 18 E 20 3 17 E 249997.096 54.143 90.3663 249997.2 0.093 0.07620 5 15 E 19 5 14 E 252725.465 50.895 87.7814 252724.2 0.195b 0.07521 6 16 A 20 6 15 A 255755.841 52.056 99.5035 255757.2 0.146b 0.06721 7 14 E 20 7 13 E 255766.912 50.141 104.7105 255767.2 0.198b 0.06123 3 21 E 22 3 20 E 258615.279 60.033 102.1383 258611.2 0.290n 0.07623 3 21 A 22 3 20 A 258623.487 60.038 102.1314 258622.2 0.266o 0.07622 14 8 E 21 14 7 E 263324.309 35.338 173.7652 263323.7 0.110 0.05622 14 8 A 21 14 7 A 263324.918 70.678 173.7662 (a)22 14 9 A 21 14 8 A 263324.918 70.678 173.7662 (a)22 12 10 A 21 12 9 A 263837.233 83.470 152.1663 263837.2 0.259b 0.05822 12 11 A 21 12 10 A 263837.233 83.470 152.1663 (a)22 12 11 E 21 12 10 E 263851.647 41.736 152.1593 263852.1 0.160b 0.02921 5 16 A 20 5 15 A 266340.485 53.824 96.2081 266338.8 0.089 0.07625 2 24 E 24 2 23 E 269487.933 66.197 113.1342 269490.0 1.209g 0.59925 1 24 E 24 1 23 E 269489.349 66.197 113.1341 (a)25 2 24 A 24 2 23 A 269492.808 66.202 113.1251 (a)24 3 21 E 23 3 20 E 279191.643 62.087 116.3492 279191.3 0.271 0.07324 3 21 A 23 3 20 A 279201.345 62.091 116.3448 279201.2 0.304 0.07327 1 27 E 26 1 26 E 280468.607 72.488 123.6616 280466.3g 0.441 0.31027 0 27 E 26 0 26 E 280468.613 72.488 123.6616 (a)27 1 27 A 26 1 26 A 280469.236 72.494 123.6492 (a)27 0 27 A 26 0 26 A 280469.242 72.494 123.6492 (a)
Notes. Emission lines of CH3OCOD (without high blend) present in the frequency range of the Orion KL survey. Columns 1–8 indicate the transition,Column 9 gives the calculated frequencies, Column 10 the line strength, Column 11 the energy of the lower level, Column 12 the observed (centroid)rest frequencies assuming that the radial velocities relative to LSR are 7.5 km s−1, Column 13 the observed temperature of the main beam (at the peakof the line), and Column 14 the main beam temperature obtained with the model.a Blended with the last one.b Blended with the unidentified line.c Blended with CH3OCOH.d Blended with t-CH3CH2OH.e Blended with 13CH3OH.f Blended with CH3CH2
13CN.g Blended with (CH3)2CO.h Blended with CH3CH2CN b type.i Blended with CH2CH13CN.j Blended with CH3CHO.k Blended with O34S18O.l Blended with H13CCCN ν7=2.m Blended with HC3N vibrationally excited.n Blended with CH3
13CH2CN.o Blended with 13CH3CH2CN.
component are those involving low energy levels for which itscontribution is less than 50%. Its effect on the lines associatedwith high energy levels is negligible. Figure 3 shows theobservations and the model for HCOOCH3 and for the 13Cisotopologues. For the compact ridge, we assumed a source sizeof 15′′ of diameter with uniform brightness temperature and
optical depth over this size, placed 7′′ from the pointed position.For the hot core component, we assumed a source size of 10′′placed 2′′ from IRc2. The column densities calculated for themain isotopologue are 7 × 10¹⁵, 5 × 10¹⁵, 5 × 10¹⁵, 2 × 10¹⁵,and 1.5 × 1015 cm−2 for the “hot” compact ridge, compact ridge,hot core, extended ridge, and plateau, respectively, obtaining a
No. 2, 2010 ROTATIONAL SPECTRUM AND TENTATIVE DETECTION OF DCOOCH3 ORION 1131
total column density of 2 × 1016 cm−2 (in agreement with thediscussion in our previous paper, Carvajal et al. 2009).
From these models, i.e., fixing the temperatures and sourcestructure, we have computed the DCOOCH3 (A, E) lines fordifferent column densities. The column densities obtained forreproducing the bulk of the DCOOCH3 emission are 4 × 1014,1 × 1014, 2 × 10¹⁴, 5 × 10¹³, and 3 × 1013 cm−2 for the “hot”compact ridge, compact ridge, hot core, extended ridge, andplateau, respectively. The model parameters were fixed to thosederived from the analysis of the main isotope and other species(see Tercero et al., 2010). The fit has been made by a closeinspection of the data and the model but not by minimizingthrough least-squares methods. Only the column density andthe temperature of the gas were allowed to vary for the mainisotope. When we considered that the fit was all right within30%, then we fixed the parameters and allowed them to vary thecolumn density for the deuterated species. A complete analysiswill require to fit all lines (16,000 thousand lines of the survey)in order to have a correct minimization of the data. Hence, weproceeded by minimizing the intensity residuals until agreementwas reached within 30% again. The uncertainty in the results iswithin a factor of 1.3–1.5.
Our results indicate a DCOOCH3/HCOOCH3 abundanceratio of 0.04 in the hot core, 0.06 in the “hot” compact ridge, 0.02in the compact ridge, 0.025 in the extended ridge, and 0.02 in theplateau (similar ratios have been found by different authors inthe compact ridge component; see Persson et al. 2007; Schilkeet al. 1992; Tercero et al. 2010).
Table 7 gives the model predictions, observed peak intensitiesand frequencies, and predicted frequencies from the rotationalconstants obtained in this paper, for all lines of this isotopologuethat are not strongly blended with other lines. DCOOCH3observed lines appear with a different degree of overlappingdepending on the frequency domain: at 1.3 mm these lines areheavily blended, at 2 mm DCOOCH3 lines are clearly detected,but blending is still important, while at 3 mm the lines aredetected but they are very weak. The differences between theintensity of the model and the peak intensity of the observed linesare mostly due to the contribution from many other molecularspecies (the frequent overlap with other lines makes difficultto provide a good baseline for the weak lines of DCOOCH3,especially at 1.3 mm). Figure 4 shows selected observed linesof DCOOCH3 together with the model results (in units of Tmb).In spite of the amount of lines blended with other molecules,some panels of Figure 4 show a quite good agreement betweenthe model and observations (see panels 2, 3, 5, 10,13, 15).Nevertheless, in all panels we assess the presence of DCOOCH3in the Orion KL spectra. It is worth noting that in DCOOCH3, thetwo 13C isotopologues of methyl formate and four isotopologuesof ethyl cyanide (13C and 15N isotopologues; see Demyk et al.2007; Margules et al. 2009b; and Carvajal et al. 2009) contributewith more than 1600 lines in the 80–280 GHz domain coveredby the Orion line survey of Tercero et al. (2010).
9. CONCLUSION
In this work, using the RAM, 24 rotation–torsion parametersof deuterated methyl formate, DCOOCH3, have been obtainedfrom a fit of 1703 lines (including some previously published861 microwave lines and 842 new measurements) of the groundstate vt = 0 of this compound with a standard deviation of94.2 kHz. The permanent dipole moment was measured forboth the normal methyl formate and for DCOOCH3 in order to
improve the intensity calculation. In addition, the quadrupolehyperfine structure of the D atom was analyzed. A predictionof the line positions and intensities was produced to search forall the lines expected in the line survey of Orion and found 102lines without heavy blending. In spite that these lines are at thedetection limit of our survey (line confusion), most of these lineshave a clear counterpart that can be related to deuterated methylformate. None of the searched lines was missing (althougharound 300 are completely blended with other features) andmany of them cannot be assigned to any other species. Hence, weclaim a more than reasonable tentative detection of this specieswith a total column density of 8 1014 cm−2. Deuterationenhancement varies from 0.02 to 0.06 for the different cloudcomponents of Orion.
It is now important to pursue the studies on the methyl formateisotopologues (13C and deuterated species) by completing themeasurements, analysis, and predictions for the first and secondexcited torsional states, as was recently done by Ilyushin et al.(2009) for the normal species. Indeed, without the excitedtorsional data, structural parameters such as the torsional barrierheight and the internal rotation constant (as well as higher orderterms in the potential Fourier series describing the potentialinternal rotation barrier) show high correlation, and their valuescan only be considered as effective values. Moreover, theknowledge of excited torsional states is also important for afuture possible detection in the interstellar medium as shownby the detection of numerous lines for the first excited torsionalvt = 1 state of the H12COO12CH3 species (Kobayashi et al.2007; Demyk et al. 2008). In the case of the normal species,some of the second torsional excited state vt = 2 transitions haveturned out to be most likely perturbed by one of the other low-frequency small amplitude modes lying around, and the nextstep is thus to take into account those vibration–rotation–torsioninteractions.
M.C. acknowledges the financial support providedby the Andalusian Government (Spain) project numberP07-FQM-03014. He also thanks Universite Paris 12 for invit-ing him. J.C., B.T., and N.M. thank the Spanish MICINN forsupport under grants AYA2006-14786, AYA2009-07304, andthe CONSOLIDER program “ASTROMOL” CSD2009-00038.This work was supported by the program “National Physique etChimie du Milieu Interstellaire.” This work was also done un-der the ANR-08-BLAN-0054 and ANR-08-BLAN-0225. Theauthors also thank Dr. J. T. Hougen for numerous discussionsduring the work, Dr. V. V. Ilyushin for providing us various codesdealing with adding intensities of degenerate components, andproviding information about the assignments and constants fromhis work on the normal species prior to publication. I.K. and J.D.thank the PEPCO-NEI cooperation project (MENESR, France)
REFERENCES
Blake, G. A., Mundy, L. G., Carlstrom, J. E., Padin, S., Scott, S. L., Scoville,N. Z., & Woody, D. P. 1996, ApJ., 472, L49
Blake, G. A., Sutton, E. C., Masson, G. R., & Philips, T. G. 1986, ApJS, 60,357
Blake, G. A., Sutton, E. C., Masson, C. R., & Philips, T. H. 1987, ApJ., 315,621
Carvajal, M., Willaert, F., Demaison, J., & Kleiner, I. 2007, J. Mol. Spectrosc.,246, 158
Carvajal, M., et al. 2009, A&A, 500, 1109Cernicharo, J. 1985, Internal IRAM Report (Granada: IRAM)Curl, R. F. 1959, J. Chem. Phys., 30, 1529Demyk, K., Wlodarczak, G., & Carvajal, M. 2008, A&A, 489, 589
1132 MARGULES ET AL. Vol. 714
Demyk, K., et al. 2007, A&A, 466, 255Golden, S., & Wilson, E. B., Jr. 1948, J. Chem. Phys., 16, 669Herbst, E. 1992, in Isotope Effects in gas Phase Chemistry, ed. J. A. Kaye
(Washington, DC: Am. Chem. Soc.)Herbst, E., Messer, J. K., De Lucia, F. C., & Helminger, P. 1984, J. Mol.
Spectrosc., 108, 42Hougen, J. T., Kleiner, I., & Godefroid, M. 1994, J. Mol. Spectrosc., 163, 559Ilyushin, V., Alekseev, E. A., Dyubko, S. F., & Kleiner, I. 2003, J. Mol.
Spectrosc., 220, 170Ilyushin, V. V., Kryvda, A., & Alekseev, E. 2009, J. Mol. Spectrosc., 255, 32Jacq, T., Walmsley, C. M., Mauersberger, R., Anderson, T., Herbst, E., & De
Lucia, F. C. 1993, A&A, 272, 276Johansson, L. E. B., et al. 1984, A&A, 130, 227Kassi, S., Petitprez, D., & Wlodarczak, G. 2000, J. Mol. Struct., 517, 375Kirtman, B. 1962, J. Chem. Phys., 37, 2516Kobayashi, K., Ogata, K., Tsunekawa, S., & Takano, S. 2007, ApJ., 657, L17Lees, R. M., & Baker, J. G. 1968, J. Chem. Phys., 48, 5299Lin, C. C., & Swalen, J. D. 1959, Rev. Mod. Phys., 31, 841Lovas, F. J. 2004, NIST Recommended Rest Frequencies for Observed In-
terstellar Molecular Microwave Transitions (Gaithersburg, MD: NIST),http://physics.nist.gov/cgi-bin/micro/table5/start.pl
Maeda, A., De Lucia, F. C., & Herbst, E. 2008a, J. Mol. Spectrosc., 251,293
Maeda, A., Medvedev, I. R., De Lucia, F. C., & Herbst, E. 2008b, ApJS, 175,138
Margules, L., Coudert, L. H., Møllendal, H., Janekova, R., Huet, T. R., &Guillemin, J. C. 2009a, J. Mol. Spectrosc., 254, 55
Margules, L., et al. 2009b, A&A, 493, 565Marstokk, K. M., & Møllendal, H. 1969, J. Mol. Struct., 4, 470Mauersberger, R., Henkel, C., Jacq, T., & Walmsley, C. M. 1998, A&A, 194,
L1Møllendal, H., Cole, G. C., & Guillemin, J.-C. 2006, J. Phys. Chem. A, 110,
921Møllendal, H., Leonov, A., & de Meijere, A. 2005, J. Phys. Chem. A, 109, 6344Morris, M., Palmer, P., & Zuckerman, B. 1980, ApJ, 237, 1Muenter, J. S. 1968, J. Chem. Phys., 48, 4544Nummelin, A., Bergman, P., Hjalmarson, A., Friberg, P., Irwine, W. M., Millar,
T. J., & Saito, S. 2000, ApJS., 128, 213Oesterling, L. C., Ferguson, D. W., Herbst, E., & De Lucia, F. C. 1995, J. Mol.
Spectrosc., 172, 469Pardo, J. R., Cernicharo, J., & Serabyn, E. 2001, IEEE Trans. Antennas Propag.,
49, 1683Persson, C. M., et al. 2007, A&A, 476, 807Schilke, P., Walmsley, C. M., Pineau Des Forets, G., Roueff, E., Flower, D. R.,
& Guilloteau, S. 1992, A&A, 256, 595Shimanouchi, T. 1972, Tables of Molecular Vibrational Frequencies Consoli-
dated Vol. 1 (Gaithersburg, MD: National Bureau of Standards), 1Tercero, B., et al. 2010, A&A, in pressWillaert, F., Møllendal, H., Alekseev, E., Carvajal, M., Kleiner, I., & Demaison,
J. 2006, J. Mol. Struct., 795, 4


![[ CONFERENCE TENTATIVE ]](https://static.fdokumen.com/doc/165x107/6332727f3108fad7760ea090/-conference-tentative-.jpg)