ROLES FOR PRIMARY CILIA AND ADRENAL VENOUS ...
348
1 THE MOLECULAR PATHOGENESIS AND DIAGNOSIS OF PHAEOCHROMOCYTOMA: ROLES FOR PRIMARY CILIA AND ADRENAL VENOUS SAMPLING? Samuel Matthew O’Toole A thesis submitted in partial fulfilment of the requirements of the degree of Doctor of Philosophy April 2019 Queen Mary University of London Mile End Road E1 4NS London UK
-
Upload
khangminh22 -
Category
Documents
-
view
0 -
download
0
Transcript of ROLES FOR PRIMARY CILIA AND ADRENAL VENOUS ...

1
THE MOLECULAR PATHOGENESIS AND DIAGNOSIS OF
PHAEOCHROMOCYTOMA: ROLES FOR PRIMARY CILIA AND
ADRENAL VENOUS SAMPLING?
Samuel Matthew O’Toole
A thesis submitted in partial fulfilment of the requirements of the degree of
Doctor of Philosophy
April 2019
Queen Mary University of London
Mile End Road
E1 4NS
London
UK
2
Statement of originality
I, Samuel Matthew O’Toole, confirm that the research included within this thesis is my own work or
that where it has been carried out in collaboration with, or supported by others, that this is duly
acknowledged below and my contribution indicated. Previously published material is also
acknowledged below.
I attest that I have exercised reasonable care to ensure that the work is original, and does not to the
best of my knowledge break any UK law, infringe any third party’s copyright or other Intellectual
Property Right, or contain any confidential material.
I accept that the College has the right to use plagiarism detection software to check the electronic
version of the thesis.
I confirm that this thesis has not been previously submitted for the award of a degree by this or any
other university.
The copyright of this thesis rests with the author and no quotation from it or information derived
from it may be published without the prior written consent of the author.
Date: 28th April 2019
Details of collaboration and publications:
RNA sequencing was performed at The Barts and The London Genome Centre and its analysis was
conducted in collaboration with David Watson.
Oncometabolite induced primary cilia loss in pheochromocytoma. O’Toole SM, Watson DS,
Novoselova TV, Romano LEL, King PJ, Bradshaw TY, Thompson CL, Knight MM, Sharp TV, Barnes MR,
Srirangalingam U, Drake WM, Chapple JP. Endocrine Related Cancer 2019; 26(1): 165-180.
Adrenal Vein Catecholamine Levels and Ratios: Reference Intervals Derived from Patients with
Primary Aldosteronism. Sze CWC*, O’Toole SM*, Tirador RK, Akker SA, Matson M, Perry L, Druce MR,
Dekkers T, Deinum J, Lenders JWM, Eisenhofer G, Drake WM. Hormone and Metabolic Research
2017; 49(6): 418-423.

3
Abstract
Primary cilia are microtubule-based cellular organelles that project into the extracellular space. They
subserve a wide range of sensory stimuli, co-ordinate and modulate a number of signalling pathways
and are intrinsically linked to the cell cycle and its progression. Cilia loss is frequently observed in
tumours; yet, the responsible mechanisms and consequences for tumourigenesis remain unclear.
The aim of this thesis is to examine the role of primary cilia in the pathogenesis of
phaeochromocytomas (life-threatening catecholamine-producing neuroendocrine tumours of the
adrenal medulla).
We demonstrate that primary cilia are lost in phaeochromocytomas compared to adjacent non-
cancerous tissue. These structural changes are associated with transcriptional alterations within
cilia-mediated signaling pathways that are associated with tumorigenesis generally and
phaeochromocytomas specifically. Importantly, cilia loss is most dramatic in patients with germline
mutations in the pseudohypoxia-linked genes SDHx and VHL.
Using a phaeochromocytoma-derived cell line, we show that hypoxia and oncometabolite-induced
pseudohypoxia are key drivers of cilia loss and identify that this is dependent on activation of the
Aurora-A/HDAC6 cilia resorption pathway. We also show that cilia loss drives transcriptional changes
associated with proliferation and tumourigenesis.
Our data provide evidence for primary cilia dysfunction contributing to phaeochromocytoma
pathogenesis through a hypoxic/pseudohypoxic mechanism and implicate oncometabolites as ciliary
regulators. These findings have relevance beyond phaeochromocytomas as hypoxia is a general
feature of the tumour microenvironment and the resultant ciliary resorption can be
pharmacologically inhibited, suggesting a potential therapeutic target.
Further studies demonstrate that additional features of the phaeochromocytoma
microenvironment, namely catecholamines, also impact on primary cilia expanding our
understanding of the role of this organelle.
Finally, we provide normative reference intervals for adrenal venous catecholamines facilitating
accurate diagnosis of phaeochromocytomas for use in situations where localisation cannot be
reliably achieved by standard imaging approaches alone.

4
Acknowledgements
First and foremost, my thanks go to all the patients who consented to their tissue use and without
whom this project would not have been possible. I am similarly indebted to Barts Charity for their
generous funding of my Clinical Research Training Fellowship (MRD0191).
I would like to thank my supervisors Profs Paul Chapple, Tyson Sharp and William Drake for their
continued support, education and patience. My particular thanks to Paul for hosting me and making
me so welcome in the unfamiliar settings of the lab and to Professor Drake for his ongoing clinical
mentorship.
My gratitude goes to everyone at the Centre for Endocrinology who helped make these three years
fly by. It is impossible to name everyone who contributed to my time there but especial thanks goes
to the members of the Chapple group past and present (Suran, Teisha, Emma and Lisa) as well as Sri
who introduced me to Paul and VHL.
It goes without saying that without the support of my friends and family I would not have been able
to do this and I am eternally grateful to them. It is a great regret to me that my father was not able
to see the completion of this project. He was an advocate for scholarship and free thought and I
hope he would have liked to read the completed work.
Last, but never least, my thanks to Helen, who perhaps more than anyone else has witnessed the
evolution of this thesis and has been at my side every step of the way, always with a helpful word,
particularly when punctuation was involved.
5
Table of contents
Table of figures ..................................................................................................................................... 12
Table of tables ....................................................................................................................................... 15
List of abbreviations .............................................................................................................................. 16
CHAPTER 1: The primary cilium ............................................................................................................ 21
1.1 Structure ..................................................................................................................................... 22
1.1.1 Axoneme .............................................................................................................................. 22
1.1.2 Basal body ............................................................................................................................ 22
1.1.3 Transition zone ..................................................................................................................... 23
1.1.4 Ciliary membrane ................................................................................................................. 23
1.2 Cilia length control ...................................................................................................................... 25
1.2.1 Ciliogenesis ........................................................................................................................... 25
1.2.2 Ciliary disassembly ............................................................................................................... 27
1.2.2.1 Aurora kinase A/histone deacetylase 6 ........................................................................ 27
1.2.2.2 Tctex-1 ........................................................................................................................... 30
1.2.2.3 Nde1 .............................................................................................................................. 30
1.2.2.4 NIMA-related kinases (NEKs) ........................................................................................ 30
1.2.2.5 Others ........................................................................................................................... 31
1.3 Cilia functions .............................................................................................................................. 32
1.3.1 Cilia and the cell cycle .......................................................................................................... 32
1.3.2 Cilia-mediated signalling pathways ...................................................................................... 34
1.3.2.1 Hedgehog signalling ...................................................................................................... 34
1.3.2.2 Wnt signalling................................................................................................................ 37
1.3.2.2.1 Canonical Wnt signalling ........................................................................................ 38
1.3.2.2.2 Non-canonical Wnt signalling ................................................................................ 39
1.3.2.3 Notch signalling ............................................................................................................. 39
1.4 Primary cilia in cancer ................................................................................................................. 42
1.4.1 Primary cilia dysregulation in cancers.................................................................................. 44
1.4.1.1 Breast cancer ................................................................................................................ 44
1.4.1.2 Ovarian cancer .............................................................................................................. 45
1.4.1.3 Prostate cancer ............................................................................................................. 46
1.4.1.4 Renal cancer .................................................................................................................. 46
1.4.1.5 Medulloblastoma .......................................................................................................... 48
1.4.2 Mechanisms of ciliary dysfunction in cancer ....................................................................... 49
6
1.4.3 Mechanisms by which ciliary dysfunction contributes to tumourigenesis .......................... 50
CHAPTER 2: Phaeochromocytomas and paragangliomas ..................................................................... 53
2.1 Definition and demographics ...................................................................................................... 54
2.2 Clinical features ........................................................................................................................... 56
2.3 Pathogenesis ............................................................................................................................... 56
2.3.1 Catecholamine production .................................................................................................. 56
2.3.2 Aetiology .............................................................................................................................. 61
2.3.2.1 Environmental factors ................................................................................................... 61
2.3.2.1.1 Altitude .................................................................................................................. 61
2.3.2.1.2 Congenital cyanotic heart disease ......................................................................... 61
2.3.2.1.3 Chronic lung disease .............................................................................................. 62
2.3.2.2 Germline genetic mutations ......................................................................................... 62
2.3.2.2.1 Cluster 1 ................................................................................................................. 63
2.3.2.2.1.1 Succinate dehydrogenase ............................................................................... 64
2.3.2.2.1.1.1 Familial paragangliomas type 1 (SDHD) ................................................... 65
2.3.2.2.1.1.2 Familial paragangliomas type 2 (SDHAF2) ............................................... 65
2.3.2.2.1.1.3 Familial paragangliomas type 3 (SDHC) ................................................... 65
2.3.2.2.1.1.4 Familial paragangliomas type 4 (SDHB) ................................................... 65
2.3.2.2.1.1.5 Familial paragangliomas type 5 (SDHA) ................................................... 66
2.3.2.2.1.2 Fumarate hydratase ........................................................................................ 66
2.3.2.2.1.3 Malate dehydrogenase 2 ................................................................................ 66
2.3.2.2.1.4 von Hippel-Lindau disease .............................................................................. 67
2.3.2.2.1.5 Prolyl hydroxylase ........................................................................................... 68
2.3.2.2.1.6 Hypoxia Inducible Factor 2α ........................................................................... 68
2.3.2.2.2 Cluster 2 ................................................................................................................. 68
2.3.2.2.2.1 Multiple Endocrine Neoplasia Type 2 (MEN2) ................................................ 68
2.3.2.2.2.2 Neurofibromatosis type 1 (NF1) ..................................................................... 69
2.3.2.2.2.3 Transmembrane protein 127 (TMEM127) ...................................................... 70
2.3.2.2.2.4 Myc-associated factor X (MAX) ....................................................................... 70
2.3.2.2.2.5 Kinesin family member 1B .............................................................................. 71
2.3.2.4 Somatic mutations ........................................................................................................ 76
2.4 Investigations .............................................................................................................................. 77
2.4.1 Biochemistry ........................................................................................................................ 77
2.4.2 Imaging ................................................................................................................................. 79

7
2.4.2.1 Cross sectional imaging ................................................................................................. 79
2.4.2.2 Nuclear medicine imaging ............................................................................................ 79
2.4.3 Histopathology ..................................................................................................................... 81
2.4.4 Genetic testing ..................................................................................................................... 82
2.4.5 Others................................................................................................................................... 83
2.5 Management ............................................................................................................................... 84
2.5.1 Medical therapy ................................................................................................................... 84
2.5.2 Surgery ................................................................................................................................. 85
2.5.3 Radiotherapy (external beam and radionuclide) ................................................................. 86
2.5.4 Chemotherapy and other agents ......................................................................................... 86
2.6 Thesis aims and objectives .......................................................................................................... 88
CHAPTER 3: Materials and methods ..................................................................................................... 90
3.1 Patient recruitment and ethical approval ................................................................................... 91
3.1.1 Primary cilia in phaeochromocytoma and paraganglioma .................................................. 91
3.1.2 Adrenal venous catecholamine measurement .................................................................... 91
3.2 Cell culture .................................................................................................................................. 92
3.2.1 PC12 cells ............................................................................................................................. 92
3.2.2 MPC and MTT cells ............................................................................................................... 92
3.2.3 Cell culture conditions ......................................................................................................... 92
3.2.4 Trypan blue dye exclusion assay .......................................................................................... 94
3.2.5 siRNA-mediated knockdown ................................................................................................ 94
3.3 Tissue preparation ...................................................................................................................... 95
3.4 Immunofluorescence (IF) ............................................................................................................ 96
3.4.1 Immunocytochemistry (ICC) in cultured cells ...................................................................... 96
3.4.2 Immunohistochemistry (IHC) in tissue sections ................................................................... 98
3.5 Western blotting ......................................................................................................................... 99
3.5.1 Cell lysate preparation ......................................................................................................... 99
3.5.2 Protein quantification .......................................................................................................... 99
3.5.3 SDS-PAGE ............................................................................................................................. 99
3.5.4 Immunoblotting and band quantification ............................................................................ 99
3.6 RNA ........................................................................................................................................... 100
3.6.1 RNA isolation and quantification ....................................................................................... 100
3.6.1.1 RNA isolation from cultured cells ............................................................................... 100
3.6.1.2 RNA isolation from tissue ............................................................................................ 101
8
3.6.1.3 RNA quantification ...................................................................................................... 101
3.6.2 RNA sequencing ................................................................................................................. 101
3.6.2.1 RNA sequence data and pathway analyses ................................................................ 101
3.6.3 Polymerase chain reaction (PCR) ....................................................................................... 103
3.6.3.1 cDNA synthesis ............................................................................................................ 103
3.6.3.2 Reverse Transcription PCR (RT-PCR) ........................................................................... 103
3.6.3.3 Primer design .............................................................................................................. 104
3.6.3.4 Gel electrophoresis ..................................................................................................... 104
3.6.3.5 Quantitative real time PCR (qRT-PCR) ........................................................................ 105
3.7 Microscopy techniques ............................................................................................................. 106
3.7.1 Measurement of primary cilia incidence and length in 2D cell culture ............................. 106
3.7.2 Measurement of primary cilia incidence and length in 3D tissue sections ....................... 106
3.7.3 Quantification of pVHL axoneme intensity ........................................................................ 107
3.8 Adrenal venous catecholamine measurement ......................................................................... 107
3.8.1 Adrenal venous sampling ................................................................................................... 107
3.8.2 Cortisol and catecholamine measurement ........................................................................ 107
3.9 Statistics .................................................................................................................................... 108
CHAPTER 4: Primary cilia loss is a feature of human phaeochromocytomas and contributes to
tumourigenesis ................................................................................................................................... 109
4.1 Introduction .............................................................................................................................. 110
4.2 Aims and Objectives .................................................................................................................. 111
4.3 Results ....................................................................................................................................... 112
4.3.1 Primary cilia loss and alterations in cilia-mediated signalling are features of human
phaeochromocytomas ................................................................................................................ 112
4.3.1.1 Primary cilia incidence and length is reduced in phaeochromocytomas relative to
adjacent normal adrenal medullas ......................................................................................... 112
4.3.1.2 Primary cilia loss is a particular feature of cluster 1 phaeochromocytomas and
paragangliomas ....................................................................................................................... 117
4.3.1.3 PPGL primary cilia incidence is associated with a number of clinical parameters ..... 121
4.3.1.4 RNA sequencing transcriptome analysis reveals that cilia-mediated signalling
pathways are disrupted in phaeochromocytomas ................................................................. 124
4.3.2 Primary cilia loss in phaeochromocytoma-derived cells results in cellular proliferation and
alters expression of tumourigenesis-linked gene networks ....................................................... 131
4.3.2.1 Phaeochromocytoma-derived cells are able to form primary cilia ............................ 131
4.3.2.2 Loss of primary cilia in phaeochromocytoma-derived cells promotes cellular
proliferation ............................................................................................................................ 137
9
4.3.2.3 Loss of primary cilia in phaeochromocytoma-derived cells promotes transcriptional
changes associated with tumourigenesis ............................................................................... 140
4.4 Discussion .................................................................................................................................. 143
4.4.1 Primary cilia loss in human phaeochromocytomas ........................................................... 143
4.4.2 Primary cilia loss in phaeochromocytoma-derived cell lines is oncogenic ........................ 146
4.5 Summary ................................................................................................................................... 147
CHAPTER 5: The influence of features of the tumour microenvironment on primary cilia in
phaeochromocytomas ........................................................................................................................ 148
5.1 Introduction .............................................................................................................................. 149
5.2 Aims and Objectives .................................................................................................................. 150
5.3 Results ....................................................................................................................................... 151
5.3.1 The effects of hypoxia on phaeochromocytoma primary cilia .......................................... 151
5.3.1.1 Hypoxia impairs ciliogenesis in PC12 cells in a reversible manner ............................. 151
5.3.1.2 The effect of hypoxia on ciliogenesis in MPC and MTT cells ...................................... 155
5.3.1.3 Hypoxia-induced cilia loss in PC12 cells is dependent on HIF-mediated signalling .... 157
5.3.1.4 Hypoxia-induced cilia loss in PC12 cells is dependent on AURKA/HDAC6 pathway
activation ................................................................................................................................ 161
5.3.2 The effects of pseudohypoxia on phaeochromocytoma primary cilia .............................. 164
5.3.2.1 Pseudohypoxia achieved by HIF-PHD inhibition results in cilia loss and shortening .. 164
5.3.2.2 Pseudohypoxia achieved by loss of SDH function results in cilia loss and shortening 166
5.3.2.3 Pseudohypoxia achieved by loss of FH function results in cilia loss and shortening .. 172
5.3.2.4 Pseudohypoxia achieved by loss of VHL function results in cilia loss and shortening 175
5.3.2.5 Loss of SDHB and VHL in PC12 cells results in increased cellular proliferation .......... 179
5.3.2.6 Inhibition of both the AURKA/HDAC6 cilia resorption pathways and of hypoxic
signalling prevents cilia loss in SDHB and VHL knockdown cells ............................................ 181
5.3.3 The effects of catecholamines and metanephrines on phaeochromocytoma primary cilia
.................................................................................................................................................... 185
5.3.3.1 The effect of circulating metanephrines on human phaeochromocytoma primary cilia
incidence and length ............................................................................................................... 185
5.3.3.2 The effect of catecholamines on primary cilia incidence and length in rat
phaeochromocytoma-derived PC12 cells ............................................................................... 190
5.3.3.2.1 Adrenaline increases incidence and length of primary cilia in PC12 cells via the
beta adrenoceptor .............................................................................................................. 190
5.3.3.2.2 Noradrenaline increases incidence and length of primary cilia in rat
phaeochromocytoma cells .................................................................................................. 196

10
5.3.3.2.3 Dopamine increases incidence and length of primary cilia in rat
phaeochromocytoma cells via dopamine receptors ........................................................... 198
5.3.4 The effect of other non-cellular features of the phaeochromocytoma microenvironment
on primary cilia ........................................................................................................................... 202
5.3.4.1 Somatostatin analogues increase PC12 cell primary cilia incidence and length ........ 202
5.4 Discussion .................................................................................................................................. 205
5.4.1 Hypoxia results in primary cilia loss in phaeochromocytoma-derived cells ...................... 205
5.4.2 Pseudohypoxia results in primary cilia loss in phaeochromocytoma-derived cells .......... 208
5.4.3 Catecholamines modulate phaeochromocytoma primary cilia ......................................... 212
5.4.4 Somatostatin analogues result in elongation of primary cilia ........................................... 214
5.5 Summary ................................................................................................................................... 214
CHAPTER 6: Adrenal venous catecholamine measurement as an adjunct in the diagnosis of
phaeochromocytoma, with particular reference to syndromic disease ............................................ 215
6.1 Introduction .............................................................................................................................. 216
6.2 Aims and Objectives .................................................................................................................. 219
6.3 Results ....................................................................................................................................... 220
6.3.1 Normal adrenal venous catecholamine concentrations in patients with primary
aldosteronism ............................................................................................................................. 220
6.3.1.1 Clinical characterisation of PA cohort ......................................................................... 220
6.3.1.2 Adrenal venous catecholamine concentrations in patients with PA .......................... 221
6.3.2 Adrenal venous catecholamine concentrations in patients with phaeochromocytoma ... 233
6.4 Discussion .................................................................................................................................. 237
6.4.1 Normal adrenal venous catecholamine concentrations in patients with primary
aldosteronism ............................................................................................................................. 237
6.4.2 Adrenal venous noradrenaline: adrenaline ratio in patients with phaeochromocytoma . 241
6.5 Summary ................................................................................................................................... 244
CHAPTER 7: Discussion and future work ............................................................................................ 245
7.1 Primary cilia loss in cancer ........................................................................................................ 246
7.1.1 Primary cilia loss in PPGLs .................................................................................................. 246
7.1.2 Experimental considerations ............................................................................................. 250
7.1.3 Primary cilia loss contributes to tumourigenesis in PPGLs ................................................ 253
7.2 Primary cilia and the tumour microenvironment ..................................................................... 254
7.3 Adrenal venous sampling in the diagnosis of phaeochromocytomas ...................................... 257
References .......................................................................................................................................... 259
List of publications arising from this thesis ......................................................................................... 309

11
Appendix ............................................................................................................................................. 310

12
Table of figures
Figure 1.1 Schematic representation of the structure and formation of a primary cilium .................. 24
Figure 1.2: Schematic representation of intraflagellar transport ......................................................... 27
Figure 1.3: Schematic representation of the AURKA/HDAC6 ciliary disassembly pathway ................. 29
Figure 1.4: Cilia assembly and disassembly throughout the cell cycle ................................................. 34
Figure 1.5: Vertebrate Hedgehog signalling requires a primary cilium ................................................ 37
Figure 1.6: Canonical Wnt signalling is negatively regulated by primary cilia ...................................... 41
Figure 1.7 Cancers in which primary cilia have been implicated .......................................................... 43
Figure 2.1: Location and secretory pattern of phaeochromocytomas and paragangliomas ............... 55
Figure 2.2: Catecholamine structure, synthesis and degradation pathways ........................................ 58
Figure 2.3: Adrenoceptor pharmacology (overleaf) ............................................................................. 59
Figure 2.4: Timeline of discovery of genetic drivers of PPGL formation .............................................. 72
Figure 2.5: Schematic representation of cluster 1 and 2 PPGL predisposition genes and their function
.............................................................................................................................................................. 75
Figure 4.1: Primary cilia incidence and length is reduced in phaeochromocytomas relative to adjacent
adrenal medullas ................................................................................................................................. 116
Figure 4.2: Loss of primary cilia is a particular feature of cluster 1 PPGL ........................................... 119
Figure 4.3: PPGL primary cilia incidence and length is correlated with clinical and pathological
parameters .......................................................................................................................................... 123
Figure 4.4: Transcriptomic differences between phaeochromocytomas and adrenal medullas ....... 125
Figure 4.5: Cilia-associated gene networks are differently expressed between phaeochromocytoma
and adrenal medullas .......................................................................................................................... 127
Figure 4.6: Differential expression of primary cilia related genes between phaeochromocytomas and
adrenal medullas ................................................................................................................................. 129
Figure 4.7: Differential expression of primary cilia-mediated signalling pathways between
phaeochromocytomas and adrenal medullas .................................................................................... 130
Figure 4.8: Phaeochromocytoma-derived cells display primary cilia ................................................. 132
Figure 4.9: Primary cilia on phaeochromocytoma-derived cells are predominantly basal and are
stimulated by serum starvation .......................................................................................................... 136
Figure 4.10 Loss of primary cilia in PC12 cells promotes cellular proliferation .................................. 138
Figure 4.11: IFT88 knockdown in PC12 cells promotes transcriptional changes associated with
tumourigenesis ................................................................................................................................... 141
Figure 5.1: Hypoxia reduces cilia formation in PC12 cells .................................................................. 153
Figure 5.2: Hypoxia induced ciliary loss in PC12 cells recovers following return to normoxia ........... 154
Figure 5.3: Hypoxia impairs ciliogenesis in MPC and MTT cells .......................................................... 156

13
Figure 5.4: Hypoxia-induced ciliary loss in PC12 cells is prevented by FM19G11 .............................. 159
Figure 5.5: siRNA mediated knockdown of HIF1α prevents hypoxia-induced ciliary loss in PC12 cells
............................................................................................................................................................ 160
Figure 5.6: Hypoxia-induced ciliary loss in PC12 cells is prevented by AURKA/HDAC6 inhibition ..... 163
Figure 5.7: Treatment of PC12 cells with the HIF-PHD inhibitor DMOG results in reduced ciliary
formation ............................................................................................................................................ 165
Figure 5.8: Inhibition of SDH by malonate results in reduced ciliary formation in PC12 cells ........... 168
Figure 5.9: α-ketoglutarate prevents malonate induced changes in PC12 primary cilia .................... 169
Figure 5.10: SDHB knockdown in PC12 cells reduces primary cilia incidence and length .................. 170
Figure 5.11: Inhibition of the electron transport chain does not affect PC12 primary cilia ............... 171
Figure 5.12: Monomethyl fumarate causes reduced ciliary formation in PC12 cells ......................... 173
Figure 5.13: FH knockdown in PC12 cells reduces primary cilia incidence and length ...................... 174
Figure 5.14: VHL knockdown in PC12 cells reduces primary cilia incidence and length .................... 177
Figure 5.15: Ciliary localisation of pVHL is reduced by hypoxia .......................................................... 178
Figure 5.16: Knockdown of SDHB and VHL in PC12 cells results in increased proliferation ............... 180
Figure 5.17: Inhibition of cilia resorption and hypoxic signalling prevents cilia loss caused by
knockdown of SDHB and VHL ............................................................................................................. 184
Figure 5.18: Phaeochromocytoma primary cilia length is correlated with circulating metanephrine
concentration. ..................................................................................................................................... 186
Figure 5.19: Phaeochromocytoma primary cilia incidence and length is correlated with elevated
circulating metanephrine. ................................................................................................................... 188
Figure 5.20: Phaeochromocytoma primary cilia incidence and length in vivo is not related to
predominant or number of metanephrines secreted ........................................................................ 189
Figure 5.21: Adrenaline increases PC12 cell primary cilia incidence and length ................................ 193
Figure 5.22: The beta adrenergic receptor antagonist propranolol prevents adrenaline-mediated
increases in primary cilia incidence and length in PC12 cells ............................................................. 194
Figure 5.23: The beta adrenergic receptor agonist salbutamol increases primary cilia incidence and
length in PC12 cells ............................................................................................................................. 195
Figure 5.24: Noradrenaline increases PC12 cell primary cilia incidence and length .......................... 197
Figure 5.25: Dopamine increases PC12 cell primary cilia incidence and length ................................. 200
Figure 5.26: Metoclopramide decreases PC12 cell primary cilia incidence and length ..................... 201
Figure 5.27: Somatostatin analogues increase PC12 cilia incidence and length ................................ 204
Figure 6.1: Schematic diagram of adrenal venous sampling .............................................................. 218
Figure 6.2: Adrenal venous catecholamine concentrations in patients who underwent adrenal
venous sampling for the diagnosis of PA ............................................................................................ 222
14
Figure 6.3: Adrenal venous catecholamine concentrations divided by ipsilateral cortisol
concentrations in patients who underwent adrenal venous sampling for the diagnosis of PA ......... 224
Figure 6.4: Adrenal venous catecholamine concentrations in patients who underwent AVS for the
diagnosis of PA according to centre .................................................................................................... 226
Figure 6.5: Adrenal venous catecholamine concentrations in patients who underwent AVS for the
diagnosis of PA at St Bartholomew’s Hospital according to sex ......................................................... 228
Figure 6.6: Adrenal venous catecholamine concentrations in patients who underwent AVS for the
diagnosis of PA at Radbound University Medical Center according to whether they were taking an
alpha adrenergic receptor antagonist at the time of AVS .................................................................. 231
Figure 6.7: Adrenal venous noradrenaline: adrenaline ratios in patients undergoing AVS for PA or
with histologically confirmed phaeochromocytoma .......................................................................... 235
Figure 7.1: Maximum Intensity Projections have the potential to underestimate cilia length .......... 252
Figure 7.2: Schematic demonstrating the potential role of primary cilia in PPGLs ............................ 255

15
Table of tables
Table 2.1: Summary of genes in which germline mutations result in PPGL predisposition ................. 74
Table 2.2: Comparisons of the PASS and GAPP scores for predicting PPGL malignancy ...................... 82
Table 3.1: Cell culture drugs used in this thesis .................................................................................... 93
Table 3.2: siRNAs used in this thesis ..................................................................................................... 95
Table 3.3: Primary antibodies used in this thesis ................................................................................. 97
Table 3.4: Fluorescent molecules and secondary antibodies used in this thesis ................................. 97
Table 3.5: Primers used in this thesis.................................................................................................. 104
Table 4.1: Summary table of patient and sample clinical details ....................................................... 113
Table 4.2: Clinical details of 27 paired samples of tumour and adjacent adrenal samples from 25
individuals ........................................................................................................................................... 114
Table 4.3: Clinical details of 20 tumour samples from 15 individuals ................................................ 120
Table 5.1: The effect of hypoxia on primary cilia ................................................................................ 206
Table 5.2: The effect of pseudohypoxia on primary cilia .................................................................... 211
Table 6.1: Clinical characteristics of 172 patients with PA who underwent AVS ............................... 220
Table 6.2: Paired adrenal venous catecholamine concentrations in patients who underwent adrenal
venous sampling for the diagnosis of PA with successful bilateral cannulation ................................ 221
Table 6.3: Adrenal vein catecholamine: cortisol ratios in patients who underwent adrenal venous
sampling for the diagnosis of PA ......................................................................................................... 225
Table 6.4: Adrenal venous catecholamine concentrations in patients who underwent AVS for the
diagnosis of PA according to centre .................................................................................................... 227
Table 6.5: Adrenal venous catecholamine concentrations in patients who underwent AVS for the
diagnosis of PA at St Bartholomew’s Hospital according to sex ......................................................... 229
Table 6.6: Adrenal venous catecholamine concentrations in patients who underwent AVS for the
diagnosis of PA at Radboud UMC according to whether they were taking an alpha adrenergic
receptor antagonist at the time of AVS .............................................................................................. 230
Table 6.7: Centile values for the noradrenaline: adrenaline ratio in the right and left adrenal veins in
patients with PA .................................................................................................................................. 232
Table 6.8: Clinical, radiological, biochemical and pathological description of six patients who
underwent AVS for the diagnosis of phaeochromocytoma................................................................ 236
Table 6.9: Summary of published reports of adrenal venous catecholamine concentrations and ratios
............................................................................................................................................................ 239
Table 7.1: Primary cilia prevalence and length in human tumours .................................................... 249

16
List of abbreviations
3-MT 3-methoxytyramine
AC Adenylyl cyclase
ACTH Adrenocorticotropic hormone
ADPKD Autosomal dominant polycystic kidney disease
APC Anaphase-promoting complex
Arl13b ADP-ribosylation factor-like protein 13B
ATRX Alpha thalassemia/mental retardation syndrome
ANOVA Analysis of variance
ASC Adipose-derived mesenchymal stem cells
AURKA Aurora kinase A
AVS Adrenal venous sampling
BMSC Bone marrow-derived mesenchymal stem cells
BSA Bovine serum albumin
CALK Chlamydomonas aurora-like protein kinase
cAMP Cyclic adenosine monophosphate
CCHD Cyanotic congenital heart disease
ccRCC Clear cell renal cell carcinoma
CCRK Cell cycle-related kinase
CDKN2C Cyclin dependent kinase inhibitor 2C
cDNA Complementary DNA
Cep164 Centrosomal protein 164
CHD Congenital heart disease
CK1ε Casein kinase 1 isoform epsilon
CNS Central nervous system
CSDE1 Cold-shock domain-containing E1
CSM Cell surface membrane
CT Computed tomography
CVD Cyclophosphamide, vincristine and dacarbazine
DAG Diacylglycerol
DAPI 4’,6-diamidino-2-phenylindole dihydrochloride
DBH Dopamine beta-hydroxylase
Dhh Desert hedgehog
DMEM Dulbecco’s Minimum Eagle Medium
DMOG Dimethyloxalylglycine, N-(methoxyoxoacetyl)-glycine methyl ester
DMSO Dimethyl sulfoxide
DNA Deoxyribonucleic acid
dsDNA Double stranded DNA
Dvl Dishevelled
EDA Exploratory data analysis
EDTA Ethylenediaminetetraacetic acid
ELST Endolymphatic sac tumour
EM Electron microscopy
EMT Epithelial-to-mesenchymal transition

17
ER Endoplasmic reticulum or oestrogen receptor
ERK (MAPK) Extracellular signal-regulated kinase
ETC Electron transport chain
F-12K Kaighn’s modification of Ham’s F-12 medium
FBS Foetal bovine serum
FDG Fluorodeoxyglucose
F-DOPA Fluorodopa
FGFR Fibroblast growth factor receptor
FH Fumarate hydratase
GAP GTPase-activating protein
GAPDH Glyceraldehyde 3-phosphate dehydrogenase
GAPP Grading of Adrenal Phaeochromocytoma and Paraganglioma
GBM Glioblastoma multiforme
GIST Gastrointestinal stromal tumour
Gli Glioma associated oncogene protein
GO Gene ontology
GPCR G-protein coupled receptor
GSK3β Glycogen synthase kinase-3β
GTP Guanosine triphosphate
H&E Haemotoxylin and eosin
HB Haemangioblastoma
HDAC Histone deacetylase
HEF1 Human enhancer of filamentation 1
HIF Hypoxia inducible factor
HIF-PHD HIF-prolyl hydroxylase
HLRCC Hereditary leiomyomatosis and renal cell cancer
HNPGL Head and neck paraganglioma
HRE Hypoxia response element
Hsp90 Heat shock protein 90
ICC Immunocytochemistry
ICK Intestinal cell kinase
IDH Isocitrate dehydrogenase
IF Immunofluorescence
IFT Intraflagellar transport
IFT# Intraflagellar transport protein <number>
IGF-1R Insulin-like growth factor 1 receptor
IHC Immunohistochemistry
Ihh Indian hedgehog
INPP5E Inositol polyphosphate 5-phosphatase
IP3 Inositol trisphosphate
IPA Ingenuity Pathway Analysis
IVC Inferior vena cava
KIF Kinesin family member
L-DOPA L-3,4-dihydroxyphenylalanine
LOH Loss of heterozygosity
18
LPA Lysophosphatidic acid
MAPK (ERK) Mitogen activated protein kinase
MAD MAX dimerisation protein
MAML3 Mastermind-like transcriptional coactivator 3
MAX Myc-associated factor X
MDH Malate dehydrogenase
MEK Mitogen-activated protein kinase kinase
MEN2 Multiple Endocrine Neoplasia
MGMT O6-alkylguanine DNA methyltransferase
MIBG Metaiodobenzylguanidine
MIP Maximum intensity projection
MMF Monomethyl fumarate
MN Metanephrine
MPC Mouse phaeochromocytoma cell line
MRI Magnetic resonance imaging
MTC Medullary thyroid cancer
MTT Mouse tumour tissue cell line
mTOR Mammalian target of rapamycin
mTORC Mammalian target of rapamycin complex
MXI MAX-interacting protein
NEK NIMA-related kinase
NET Neuroendocrine tumour
NF1 Neurofibromatosis type 1, neurofibromin 1
NGS Normal goat serum
NIH National Institute of Health
NIMA Never in mitosis gene A
NMN Normetanephrine
NudE Nuclear distribution gene E
OCT Optimal cutting temperature
OMIM Online Mendelian inheritance in man
PASS Phaeochromocytoma of the Adrenal Scaled Score
PET Positron emission tomography
PA Primary aldosteronism
PBS Phosphate buffered saline
PBST Phosphate buffered saline with 0.1% Tween 20
PC12 Phaeochromocytoma 12 cell line
PCA Principal component analysis
PCP Planar cell polarity
PCR Polymerase chain reaction
PDGFRα Platelet-derived growth factor alpha
PIP2 Phosphatidylinositol bisphosphate
PIP3 Phosphatidylinositol trisphosphate
PGL Paraganglioma
PGL# Familial paragangliomas type #
PHD (HIF)-prolyl hydroxylase

19
PI3K Phosphatidylinositol-3-kinase
PKA Protein kinase A
PKC Protein kinase C
PKD Polycystic kidney disease
PLC Phospholipase C
Plk1 Polo-like kinase 1
PNMT Phenylethanolamine N-methyltransferase
PPGL Phaeochromocytoma and paraganglioma
PPIA Peptidylpropyl isomerase A
PRRT Peptide receptor radionuclide therapy
Ptch Patched
PTH Parathyroid hormone
pVHL von-Hippel Lindau protein
PyT Pythagoras’ Theorem
QMUL Queen Mary University London
qRT-PCR Quantitative real time PCR
RCC Renal cell carcinoma
RET Rearranged during transfection
RIN RNA integrity number
RIPA Radioimmunoprecipitation assay
RNA Ribonucleic acid
ROI Region of interest
RPE Retinal pigment epithelium
SDH Succinate dehydrogenase
SDHAF2 Succinate dehydrogenase assembly factor 2
SDHx Succinate dehydrogenase subunit x
SDS-PAGE Sodium dodecyl sulphate polyacrylamide gel electrophoresis
SEM Standard error of the mean
Shh Sonic hedgehog
siRNA Short interfering RNA
Smo Smoothened
SPECT Single photon emission computed tomography
SR-SIM Super resolution structured illumination
SSA Somatostatin analogue
SSTR Somatostatin receptor
SuFu Suppressor of fused
SULT1A3 Sulfotransferase 1A3/1A4
TAE Tris-acetate-EDTA
TCA Tricarboxylic acid
TH Tyrosine hydroxylase
TKI Receptor tyrosine kinase inhibitors
TKR Tyrosine kinase receptor
TMEM127 Transmembrane protein 127
TP53 Tumour protein 53
TSA Trichostatin A

20
TSC Tuberous sclerosis complex
t-SNE t-distributed stochastic neighbour embedding
TTL Tubulin glycylases
ULN Upper limit of normal
UV Ultraviolet
VEGF Vascular endothelial growth factor
VHL von Hippel-Lindau
WB Western blot
Wnt Wingless/Integrated

21
CHAPTER 1
The primary cilium

22
1.1 Structure
Primary, non-motile, cilia are near ubiquitous singular microtubule-based organelles. First observed
in mammalian cells over 100 years ago (Zimmermann 1898), the term ‘primary cilium’ was coined in
1968 (Sorokin 1968). Long considered a vestigial by-product of evolution from lower order
flagellated organisms, primary cilia were generally felt to be functionless for the majority of the 20th
century. This perception was transformed by the discovery of intraflagellar transport (IFT)(Kozminski
et al. 1993) and the finding that ciliary defects occurred in a range of disease states that
subsequently became known as ‘ciliopathies’ (reviewed in (Tobin & Beales 2009)). Although
structurally related to motile cilia, primary cilia differ in that they are non-motile, singular and
present in virtually all nucleated mammalian cells (Figure 1.1A).
1.1.1 Axoneme
The ciliary axoneme consists of a core of nine microtubule doublets that is covered by the ciliary
membrane and extends into the extracellular space (Figure 1.1A) (Sorokin 1968). In motile cilia,
there is also a central pair of microtubules that together with additional structures (e.g. dynein arms)
confer motility; these are lacking in primary cilia (Figure 1.1A) (Fawcett & Porter 1954). Primary cilia
axonemes are thus said to have a ‘9+0’ structure compared to the ‘9+2’ structure of motile cilia. The
axoneme provides structural support for the primary cilium and also serves as a transport platform
to facilitate IFT (Kozminski et al. 1993).
Axonemal microtubules are α/β tubulin dimers that are subject to extensive post-translational
modifications which define microtubule stability, direct protein complex recruitment and influence
transport processing through alterations in kinesin motor function (Reed et al. 2006; Gaertig &
Wloga 2008; Hammond et al. 2010). Acetylation of α-tubulin is particularly enriched within the
axoneme resulting in microtubule stabilisation (Piperno et al. 1987) and providing an invaluable
experimental target for cilia identification.
1.1.2 Basal body
The basal body is a cylindrical structure that sits at the base of the axoneme. It is comprised of nine
microtubule triplets, two of which are contiguous with the doublet microtubules of the axoneme
(Figure 1.1A).
The basal body is derived from the elder of the cell’s two centrioles (the mother centriole). This, in
addition to other factors, means that there is only one primary cilium per cell, except in certain

23
ciliopathies and cancers in which multiple centrioles can result in more than one primary cilium
(Kinzel et al. 2010).
The basal body has two main functions: it anchors the cilium to the cell membrane and cytoskeleton
through fibrous distal appendages and acts as a docking site for IFT particles through transition
fibres (Deane et al. 2001; Williams et al. 2011). Transition fibres also form a physical barrier to ciliary
entry (Doolin & Birge 1966; Hagiwara et al. 2008) and are discussed further below.
1.1.3 Transition zone
The transition zone is an evolutionary conserved ciliary sub-domain and is the point at which the
triplet microtubules of the basal body become the doublets of the axoneme (Figure 1.1A). It is
characterised by Y-shaped linkers that connect the microtubule doublets to the membrane-
associated ciliary necklace (Figure 1.1A).
The transition zone functions as a gatekeeper for entry and exit of membrane-bound proteins into
and from the axoneme (Garcia-Gonzalo et al. 2011; Chih et al. 2012), but not soluble cytoplasmic
proteins (Kee et al. 2012; Najafi et al. 2012). In addition, it has been suggested that a ciliary pore
complex analogous to the nuclear pore complex exists. Evidence for this includes the presence of
components of the nuclear localisation machinery in cilia and the presence of a ciliary RanGTP
gradient akin to that seen across the nuclear membrane (Fan et al. 2007, 2011; Dishinger et al. 2010;
Hurd et al. 2011).
1.1.4 Ciliary membrane
The ciliary membrane, although contiguous with the cell surface membrane, is separated from it by
the ciliary necklace (Gilula & Satir 1972). This consists of multiple circumferential rows of
membranous particles which sit adjacent to the Y-linkers of the transition zone (Figure 1.1A). It thus
forms a physical barrier as part of the transition zone’s ‘ciliary gate’ and is required for insertion of
specific ciliary membrane components (Deane et al. 2001).
The ciliary membrane, like the cell surface membrane (CSM), is a phospholipid bilayer, but has a
different composition. It has a higher composition of sterols and lipid rafts than the cell membrane
(Chailley & Boisvieux-Ulrich 1985; Tyler et al. 2009). In addition, its protein composition is different
with inclusion or exclusion of a range of receptors observed (Ostrowski et al. 2002; Teilmann &
Christensen 2005; Teilmann et al. 2005).

24
The ciliary pocket is an invagination of the CSM at the base of the cilium which can envelop varying
portions of the axoneme.
Figure 1.1 Schematic representation of the structure and formation of a primary cilium
(A) Cross-sections of a primary (‘9+0’) cilium at the level of the axoneme, transition zone and basal
body are shown, in addition to a motile (‘9+2’) cilium for comparison.
(B) Stages of ciliogenesis

25
1.2 Cilia length control
Although primary cilia are non-motile, they are dynamic structures, elongating and resorbing during
the cell cycle as a result of IFT and activation of ciliary disassembly pathways. IFT is an evolutionarily
conserved, selective, bidirectional, microtubule-based mechanism by which protein transport
modules (IFT particles or trains) are trafficked along the ciliary axoneme in a process that is vital for
ciliary function (Kozminski et al. 1993; Huangfu & Anderson 2005; Berbari et al. 2009) (Figure 1.2).
It is apparent that ciliary length is regulated and is not merely limited by resource availability
(Rosenbaum et al. 1969). The rate of ciliary and flagellar assembly is not constant and reduces with
increasing axonemal length (Rosenbaum & Child 1967), due to a reduction in IFT transport capacity
(Engel et al. 2009). The axoneme shortens in the absence of IFT due to constant tubulin turnover
(Stephens 1997; Song & Dentler 2001). This disassembly rate is constant and length independent,
unlike assembly (Marshall et al. 2005). Therefore, a specified length set point exists (which varies
between cells and with conditions) at the point at which the declining assembly rate is equal to the
disassembly rate resulting in an equilibrium. These observations have given rise to the balance point
model of ciliary length control (Marshall et al. 2005).
Cilia length is important as it both determines sensitivity to extracellular cues (Resnick & Hopfer
2007) and influences the amplitude of ciliary-mediated signalling pathways. For example, it has been
shown that lithium chloride-induced elongation of chondrocyte primary cilia attenuates Hedgehog
(Hh) signalling amplitude (Thompson et al. 2016). For these reasons, it is commonly used as an
experimental readout for cilia function.
1.2.1 Ciliogenesis
The formation of a primary cilium requires the mother centriole and is thus intimately associated
with centriole duplication and the cell cycle. Ciliogenesis occurs during G1/G0.
Following dissociation of the centrosome from mitotic spindles, the mother centriole attaches to a
Golgi-derived vesicle via transition fibres (Sorokin 1962, 1968; Deane et al. 2001) en route to the cell
membrane (Figure 1.1B). Within this vesicle, a ciliary bud emerges and elongates to form the
axoneme which projects within the vesicle lumen (Boisvieux-Ulrich et al. 1989). The ciliary vesicle
then fuses with the cell membrane in an exocytotic process in which the outer vesicle membrane
becomes the periciliary membrane.
26
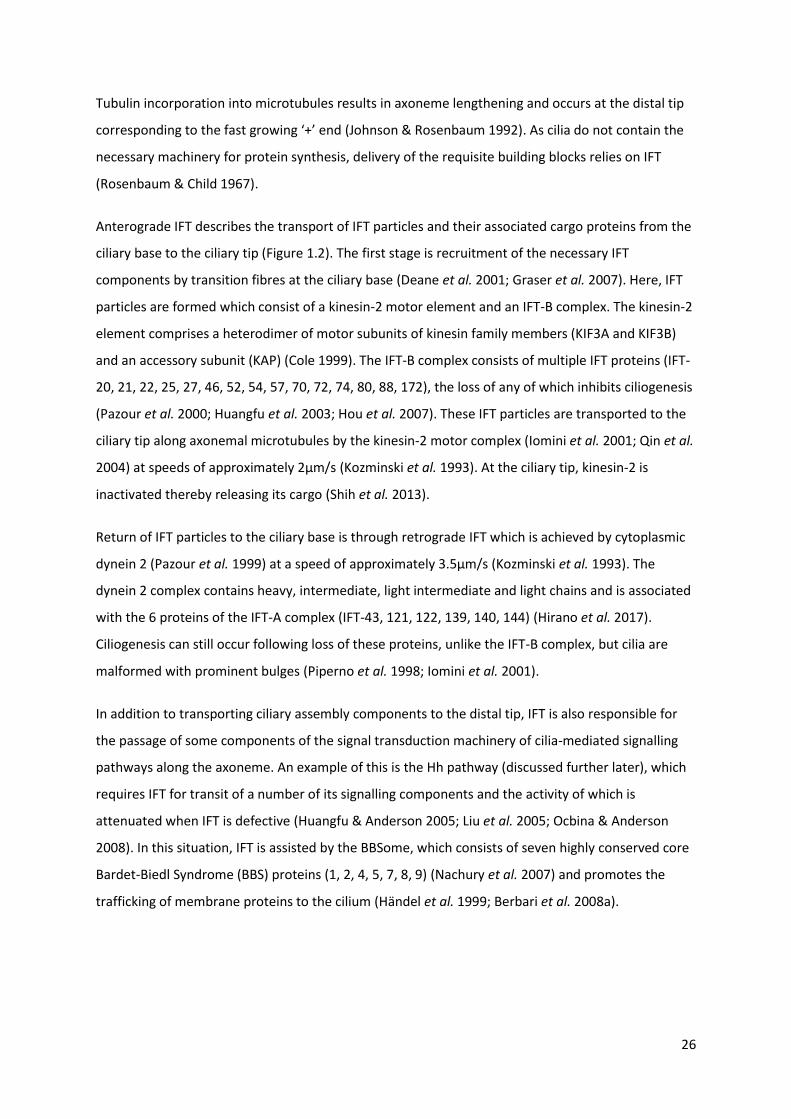
Tubulin incorporation into microtubules results in axoneme lengthening and occurs at the distal tip
corresponding to the fast growing ‘+’ end (Johnson & Rosenbaum 1992). As cilia do not contain the
necessary machinery for protein synthesis, delivery of the requisite building blocks relies on IFT
(Rosenbaum & Child 1967).
Anterograde IFT describes the transport of IFT particles and their associated cargo proteins from the
ciliary base to the ciliary tip (Figure 1.2). The first stage is recruitment of the necessary IFT
components by transition fibres at the ciliary base (Deane et al. 2001; Graser et al. 2007). Here, IFT
particles are formed which consist of a kinesin-2 motor element and an IFT-B complex. The kinesin-2
element comprises a heterodimer of motor subunits of kinesin family members (KIF3A and KIF3B)
and an accessory subunit (KAP) (Cole 1999). The IFT-B complex consists of multiple IFT proteins (IFT-
20, 21, 22, 25, 27, 46, 52, 54, 57, 70, 72, 74, 80, 88, 172), the loss of any of which inhibits ciliogenesis
(Pazour et al. 2000; Huangfu et al. 2003; Hou et al. 2007). These IFT particles are transported to the
ciliary tip along axonemal microtubules by the kinesin-2 motor complex (Iomini et al. 2001; Qin et al.
2004) at speeds of approximately 2μm/s (Kozminski et al. 1993). At the ciliary tip, kinesin-2 is
inactivated thereby releasing its cargo (Shih et al. 2013).
Return of IFT particles to the ciliary base is through retrograde IFT which is achieved by cytoplasmic
dynein 2 (Pazour et al. 1999) at a speed of approximately 3.5μm/s (Kozminski et al. 1993). The
dynein 2 complex contains heavy, intermediate, light intermediate and light chains and is associated
with the 6 proteins of the IFT-A complex (IFT-43, 121, 122, 139, 140, 144) (Hirano et al. 2017).
Ciliogenesis can still occur following loss of these proteins, unlike the IFT-B complex, but cilia are
malformed with prominent bulges (Piperno et al. 1998; Iomini et al. 2001).
In addition to transporting ciliary assembly components to the distal tip, IFT is also responsible for
the passage of some components of the signal transduction machinery of cilia-mediated signalling
pathways along the axoneme. An example of this is the Hh pathway (discussed further later), which
requires IFT for transit of a number of its signalling components and the activity of which is
attenuated when IFT is defective (Huangfu & Anderson 2005; Liu et al. 2005; Ocbina & Anderson
2008). In this situation, IFT is assisted by the BBSome, which consists of seven highly conserved core
Bardet-Biedl Syndrome (BBS) proteins (1, 2, 4, 5, 7, 8, 9) (Nachury et al. 2007) and promotes the
trafficking of membrane proteins to the cilium (Händel et al. 1999; Berbari et al. 2008a).

27
Figure 1.2: Schematic representation of intraflagellar transport
Anterograde intraflagellar transport (IFT) is subserved by the kinesin motor/IFT-B complex with the
dynein motor/IFT-A complex being responsible for retrograde IFT. Receptors and other ciliary
proteins are trafficked in association with the BBSome (BBS Bardet-Biedl Syndrome).
1.2.2 Ciliary disassembly
Once formed, primary cilia are disassembled prior to mitotic entry through a variety of different
mechanisms.
1.2.2.1 Aurora kinase A/histone deacetylase 6
Aurora kinase A (AURKA) is a mitotic serine/threonine protein kinase and is an orthologue of the
Chlamydomonas protein CALK (Chlamydomonas aurora-like protein kinase), the phosphorylation of
which regulates and is a marker of flagellar length (Luo et al. 2011). Amongst its many functions,
AURKA localises to the basal body and phosphorylates, thereby activating, histone deacetylase 6
(HDAC6) (Pugacheva et al. 2007). HDAC6 is a member of the class II HDAC family and although
predominantly cytoplasmic also localises to the axoneme (Pugacheva et al. 2007), where it
deacetylates α-tubulin (Hubbert et al. 2002), destabilising axonemal microtubules and thus
promoting ciliary disassembly (Pugacheva et al. 2007). Inhibition of HDAC6 does not in itself alter
ciliary length (Sharma et al. 2011), highlighting its role in ciliary disassembly in response to
disassembly cues, for example serum stimulation (Pugacheva et al. 2007). In addition to tubulin,

28
HDAC6 has a number of other substrates including histones (Grozinger et al. 1999), heat shock
protein 90 (Hsp90) (Kovacs et al. 2005) and cortactin (Zhang et al. 2007).
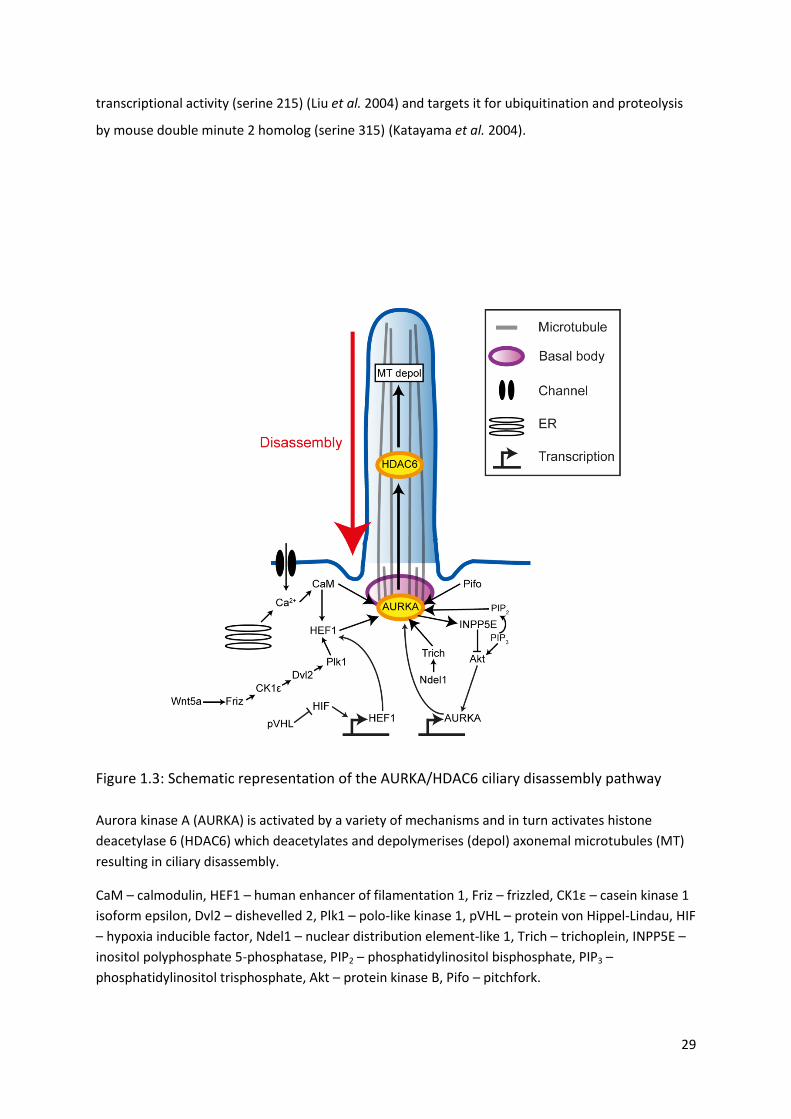
Activation of AURKA at the basal body can be achieved through a variety of different mechanisms
(Figure 1.3), which subserve different ciliary disassembly cues and have differential roles within the
cell cycle.
The pro-metastatic scaffolding protein human enhancer of filamentation 1 (HEF1, also known as
CAS-L and NEDD-9) binds and activates AURKA (Pugacheva & Golemis 2005). HEF1 stabilisation is
achieved through the non-canonical Wnt pathway, in which Wnt5a ligand binds the frizzled receptor,
activating casein kinase 1 isoform epsilon (CK1ε) resulting in phosphorylation of dishevelled 2 (Dvl2)
and ultimately interaction with polo-like kinase 1 (Plk1) (Lee et al. 2012a). Additional regulation of
AURKA/HDAC6 occurs via hypoxic signalling as HEF1 is a hypoxia inducible factor 1α (HIF1α) target
gene (Xu et al. 2010).
Calmodulin activates AURKA in response to calcium release from the endoplasmic reticulum (ER)
both directly (Plotnikova et al. 2010) and indirectly by promoting interaction between AURKA and
HEF1 (Plotnikova et al. 2012). Cellular entry of extracellular calcium also stimulates ciliary
disassembly (Tucker et al. 1979).
Inositol polyphosphate 5-phosphatase (INPP5E) is another activator of AURKA and although there is
a direct interaction between the two, its activation is indirect. INPP5E dephosphorylates
phosphatidylinositol trisphosphate (PIP3) to phosphatidylinositol bisphosphate (PIP2) and it is
through this second messenger that AURKA is activated (Plotnikova et al. 2015). The relationship
between INPP5E and AURKA is further complicated by reciprocal activation of INPP5E which, in
addition to its role in AURKA activation, inhibits the Akt signalling pathway resulting in a reduction in
AURKA transcription (Plotnikova et al. 2015).
Other activators of AURKA include pitchfork (Kinzel et al. 2010) and the keratin intermediate
filament scaffold protein trichoplein (Inoko et al. 2012), which is protected from degradation by
nuclear distribution element-like 1 (Inaba et al. 2016).
In addition to phosphorylating HDAC6, AURKA has a number of other protein targets. These include
polycystin 2 and p53. Phosphorylation of the calcium-permeable non-selective cation channel
polycystin 2 reduces its activity resulting in a reduction of ER calcium release and thereby a
reduction in calmodulin-induced AURKA activation (Plotnikova et al. 2011). AURKA-mediated
phosphorylation at two distinct serine residues of p53 both inhibits its DNA binding and
29
transcriptional activity (serine 215) (Liu et al. 2004) and targets it for ubiquitination and proteolysis
by mouse double minute 2 homolog (serine 315) (Katayama et al. 2004).
Figure 1.3: Schematic representation of the AURKA/HDAC6 ciliary disassembly pathway
Aurora kinase A (AURKA) is activated by a variety of mechanisms and in turn activates histone
deacetylase 6 (HDAC6) which deacetylates and depolymerises (depol) axonemal microtubules (MT)
resulting in ciliary disassembly.
CaM – calmodulin, HEF1 – human enhancer of filamentation 1, Friz – frizzled, CK1ε – casein kinase 1
isoform epsilon, Dvl2 – dishevelled 2, Plk1 – polo-like kinase 1, pVHL – protein von Hippel-Lindau, HIF
– hypoxia inducible factor, Ndel1 – nuclear distribution element-like 1, Trich – trichoplein, INPP5E –
inositol polyphosphate 5-phosphatase, PIP2 – phosphatidylinositol bisphosphate, PIP3 –
phosphatidylinositol trisphosphate, Akt – protein kinase B, Pifo – pitchfork.

30
1.2.2.2 Tctex-1
The dynein light chain Tctex-1 (also known as DYNLT1) appears to have a dual role in promoting
ciliary resorption. It is a component of the dynein 2 complex and is therefore involved in retrograde
IFT (Palmer et al. 2011; Asante et al. 2014). In addition, Tctex-1 modulates actin dynamics (Chuang et
al. 2005) and promotes ciliary disassembly through interactions with several actin-binding proteins
and stimulation of ciliary pocket membrane endocytosis (Li et al. 2011; Saito et al. 2017). Inhibition
of actin polymerisation prevents both serum- and Tctex-1-induced ciliary resorption (Li et al. 2011).
This Tctex-1 ciliary disassembly pathway is activated by the insulin-like growth factor 1 receptor (IGF-
1R) pathway in which Gβγ signalling promotes release of dynein-bound Tctex1 and recruits it to the
ciliary base (Yeh et al. 2013).
1.2.2.3 Nde1
Nde1, the mammalian orthologue of NudE (nuclear distribution gene E) is a centrosomal
phosphoprotein, knockdown of which results in cilia elongation (Kim et al. 2011a; Doobin et al.
2016). It is degraded by the E3 ubiquitin ligase F-box/WD repeat-containing protein 7 after priming
by CDK5; loss of either of these results in Nde1 persistence and resultant cilia shortening (Maskey et
al. 2015). The mechanism by which Nde1 causes ciliary disassembly has not been elucidated,
although it is known to interact with the dynein light chain LC8 (also known as DYNLL1) (Feng &
Walsh 2004).
1.2.2.4 NIMA-related kinases (NEKs)
Never in mitosis gene A (NIMA)-related kinases (NEKs) are a family of serine/threonine protein
kinases that have a multi-faceted role in cilia length control. Some members elongate cilia and their
loss results in a reduction in ciliary length, for example NEK1 (Thiel et al. 2011) and NEK4 (Coene et
al. 2011). Others play a role in ciliary disassembly.
NEK2 loss results in a reduction in ciliary resorption and its overexpression results in reduced ciliary
incidence and length (Spalluto et al. 2012). Its role in ciliary disassembly is complex and appears to
involve both AURKA/HDAC6 dependent and independent mechanisms. NEK2 activates the
microtubule depolymerising kinase Kif24, thereby promoting ciliary disassembly independent of
AURKA/HDAC6 (Kim et al. 2015). In addition, there is a functional interaction between AURKA and
NEK2, which act co-operatively (DeVaul et al. 2017), and leads to ciliary resorption following NEK2
overexpression (Endicott et al. 2015). Furthermore, HEF1 inhibits NEK2 whilst activating AURKA
(Pugacheva & Golemis 2005).

31
Similarly to NEK2, NEK8 is involved in ciliary disassembly through interactions with a number of
ciliary and centrosomal proteins including inversin (Fukui et al. 2012), polycystin 2 (Manning et al.
2013), nephrocystin 3 (Frank et al. 2013) and ankyrin repeat and sterile alpha motif domain-
containing protein 6 (Hoff et al. 2013). Loss of NEK8 results in cilia elongation (Smith et al. 2006;
Sohara et al. 2008) whilst its proteosomal degradation occurs during ciliogenesis (Zalli et al. 2012).
The exact mechanism by which NEK8 promotes ciliary disassembly has not been fully elucidated, but
a role in transcriptional regulation has been suggested. NEK8 loss results in increased expression of
foxj1a, a transcriptional regulator of ciliary genes (Hellman et al. 2010), and it interacts with the
Hippo pathway effector transcription factors TAZ and YAP (Habbig et al. 2012; Grampa et al. 2016).
Furthermore, NEK8 is a hypoxia responsive gene and its transcription is therefore downregulated by
the tumour suppressor gene product von-Hippel Lindau protein (pVHL) (Ding et al. 2015), which
itself contributes to ciliary stabilisation (discussed later).
1.2.2.5 Others
A number of additional pathways that are involved in ciliary disassembly have been identified.
The centrosomal protein CPAP is a scaffolding protein that forms part of the ciliary disassembly
complex alongside AURKA and Nde-1, and its loss has been associated with ciliary elongation
(Gabriel et al. 2016). Its role appears more complex, however, as it is also required for ciliary
formation (Wu & Tang 2012) and its levels reduce following serum stimulation and ciliary resorption
(Kim et al. 2016). CPAP binds tubulin at different sites; different mutations in its C-terminal domain
result in differential changes in tubulin binding and its own tertiary structure with opposite effects
on ciliary microtubules (Zheng et al. 2016).
Other centrosomal proteins that suppress ciliogenesis have been identified. Cep 97 and CP110
interact (Spektor et al. 2007) and activate Kif24 resulting in microtubule depolymerisation
(Kobayashi et al. 2011). Plk1, in addition to activating the AURKA/HDAC6 pathway via HEF1,
phosphorylates Kif2A in the subdistal appendages of the mother centriole thereby activating its
microtubule depolymerisation activity (Miyamoto et al. 2015).
Loss of function of tuberous sclerosis complex (TSC) results in cystic renal disease and elongated
primary cilia through an unknown mechanism which is independent of its binding partners
mammalian target of rapamycin (mTOR) and polycystin 1 (Hartman et al. 2009).
Certain cilia-mediated signalling pathways, discussed further below, alter ciliary length through their
own signalling. Anaphase-promoting complex (APC), a component of the canonical Wnt pathway,

32
stimulates ciliary disassembly as a result of both destabilising ciliary microtubules, in a process that
required its co-activator Cdc20, and by targeting the cilia assembly factor NEK1 for proteolysis (Wang
et al. 2014). Glycogen synthase kinase-3β (GSK3β) phosphorylates β-catenin, the Wnt pathway
effector, resulting in its degradation. Inhibition of GSK3β by lithium chloride results in ciliary
elongation (Miyoshi et al. 2009).
Other intra-cellular signalling molecules appear to result in varied ciliary responses. Cyclic AMP
(cAMP) results in cilia elongation in some situations (Besschetnova et al. 2010; Abdul-Majeed &
Nauli 2011) whilst reduction in cAMP formation by inhibition of adenylyl cyclase (AC) can also result
in cilia lengthening (Ou et al. 2009). Cilia elongation can occur in response to reductions in intra-
cellular calcium (Besschetnova et al. 2010) or through calcium-mediated activation of protein kinase
C (PKC) (Abdul-Majeed et al. 2012).
1.3 Cilia functions
1.3.1 Cilia and the cell cycle
The presence of a primary cilium is closely associated with cell cycle stage (Figure 1.4) (Sorokin
1962). Ciliary assembly occurs during G1/G0 with disassembly necessary prior to mitotic entry in
order to release the basal body to participate in mitotic spindle assembly as part of the centrosome.
Ciliary disassembly occurs in two stages: prior to G1/S transition and before M phase (which is the
main contributor) (Rieder et al. 1979; Jensen et al. 1987). This co-ordination between the primary
cilium and the cell cycle is mediated through the temporal control of factors that alter the balance
between ciliary assembly and disassembly.
Ciliary assembly (discussed previously) is suppressed by the CP110-Cep97 inhibitory complex which
is localised to the mother centriole and subsequently the basal body (Spektor et al. 2007). Release of
this inhibition is therefore required for ciliogenesis to occur (during G1/G0) and is achieved through
protein kinases including Tau tubulin kinase 2 and microtubule affinity-regulating kinase 4 (Goetz &
Anderson 2010; Kuhns et al. 2013). CP110-Cep97 further suppresses ciliogenesis through its
maintenance of Kif24, which depolymerises axonemal microtubules (Kobayashi et al. 2011). Kif24 is
also involved in ciliary disassembly at the S/G2 transition when it is induced by Nek2 (Kim et al.
2015). In Chlamydomonas, a NEK family member is necessary both for ciliary resorption and cell
cycle progression from G2 to M phase (Mahjoub et al. 2004).
The timing of ciliary resorption (again discussed previously) is governed by the temporal activation
throughout the cell cycle of a variety of different disassembly mechanisms. AURKA activates HDAC6

33
following its own activation by pitchfork (Kinzel et al. 2010) and HEF1 (Pugacheva et al. 2007) during
cell cycle re-entry and G2/M transition (Pugacheva & Golemis 2005). Kif2 depolymerises ciliary
tubulin and is upregulated by Plk1 and downregulated by AURKA (Jang et al. 2009; Miyamoto et al.
2015). The dynein light chain Tctex-1 stimulates both ciliary disassembly and S phase (Li et al. 2011).
Nde1, which has low expression during quiescence, interacts with another dynein light chain and
stimulates cilia disassembly. Loss of Nde1 results in elongated cilia and delayed re-entry into the cell
cycle (Kim et al. 2011a). Control of Nde1 is maintained by ubiquitin-mediated degradation in a cell
cycle dependent fashion by CDK5 (Maskey et al. 2015).
Further elements that link primary cilia stability to the cell cycle include cell-cycle related post-
translational modifications of tubulin by the mitotic spindle associated protein CEP41, which is
required for tubulin glutamylation and microtubule organisation (Lee et al. 2012b). The ciliary
disassembly factor APC is sequestered to the primary cilium by the cell cycle regulator cdc20 (Wang
et al. 2014) and cilia-mediated Hippo signalling is an important regulator of the cell cycle (Praskova
et al. 2008; Zanconato et al. 2015).
It has therefore been suggested that a ciliary checkpoint exists within the cell cycle opposing cellular
proliferation (Mans et al. 2008) and elongation of the primary cilium is associated with suppression
of cell division (Kim et al. 2011a; Li et al. 2011). Whether this is an absolute requirement is all cells
remains under debate as, although centrosome ablation results in failure of cell cycle progression
(Uetake et al. 2007) and deformed cilia (Mikule et al. 2007), cells can undergo mitosis (Mahoney et
al. 2006). Overexpression of Ift88 in HeLa cells results in failure of cells to enter S phase, whilst its
depletion results in failure to progress into G2 (Robert et al. 2007). It was argued that this was due
to a non-ciliary role of Ift88 as HeLa cells were believed to be non-ciliated (Robert et al. 2007),
although this is not actually the case (Kowal & Falk 2015).
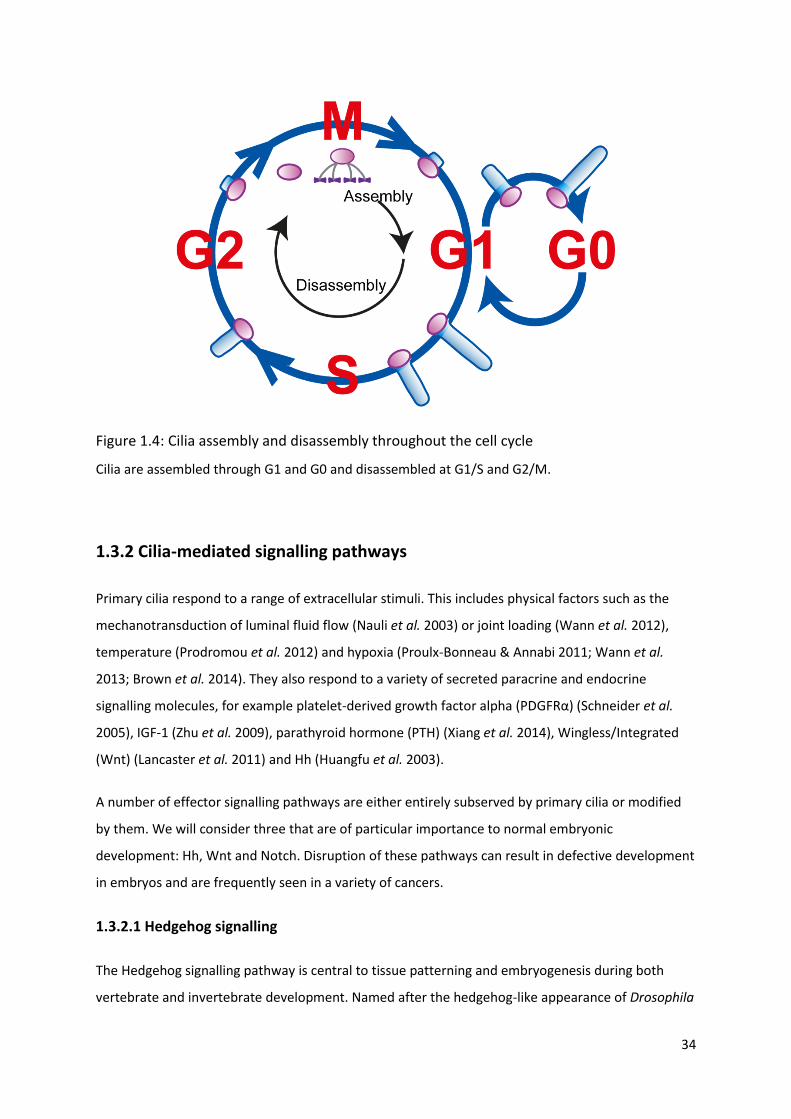
34
Figure 1.4: Cilia assembly and disassembly throughout the cell cycle
Cilia are assembled through G1 and G0 and disassembled at G1/S and G2/M.
1.3.2 Cilia-mediated signalling pathways
Primary cilia respond to a range of extracellular stimuli. This includes physical factors such as the
mechanotransduction of luminal fluid flow (Nauli et al. 2003) or joint loading (Wann et al. 2012),
temperature (Prodromou et al. 2012) and hypoxia (Proulx-Bonneau & Annabi 2011; Wann et al.
2013; Brown et al. 2014). They also respond to a variety of secreted paracrine and endocrine
signalling molecules, for example platelet-derived growth factor alpha (PDGFRα) (Schneider et al.
2005), IGF-1 (Zhu et al. 2009), parathyroid hormone (PTH) (Xiang et al. 2014), Wingless/Integrated
(Wnt) (Lancaster et al. 2011) and Hh (Huangfu et al. 2003).
A number of effector signalling pathways are either entirely subserved by primary cilia or modified
by them. We will consider three that are of particular importance to normal embryonic
development: Hh, Wnt and Notch. Disruption of these pathways can result in defective development
in embryos and are frequently seen in a variety of cancers.
1.3.2.1 Hedgehog signalling
The Hedgehog signalling pathway is central to tissue patterning and embryogenesis during both
vertebrate and invertebrate development. Named after the hedgehog-like appearance of Drosophila
35
larvae lacking the Hh gene, key components of the pathway are conserved between vertebrates and
invertebrates. However, significant differences also exist; vertebrate Hh requires the primary cilium
whilst invertebrate Hh signalling does not (Huangfu et al. 2003).
Three mammalian Hh ligands exist: Sonic (Shh), Indian (Ihh) and Desert (Dhh). They share signal
transduction machinery and their effects and biological roles are generated through their differential
temporal and spatial expression throughout development. Shh, the best studied, plays a key role in
axis patterning and subsequently organogenesis (Wilson et al. 2009). Ihh, in combination with Shh, is
critical in skeletogenesis (Vortkamp et al. 1996), whilst Dhh is largely confined to the gonads where it
regulates spermatogenesis (Bitgood & McMahon 1995).
Native Shh ligand is auto-cleaved to produce an N-terminal fragment (ShhN) with signalling
capabilities and a C-terminal fragment (ShhC) which is degraded by the ER (Porter et al. 1996). Post-
cleavage modification of ShhN by cholesterol and palmitate is required for its function (Chamoun et
al. 2001; Traiffort et al. 2004). Modified ShhN can then be released from the cell in a process
involving Dispatched A and signal peptide, CUB domain and EGF-like domain-containing protein 2
(Burke et al. 1999; Tukachinsky et al. 2012).
In the absence of Hh ligand, its receptor Patched-1 (Ptch1) inhibits the function of another
transmembrane protein, Smoothened (Smo) (Rohatgi et al. 2007). Through their interaction, Ptch1
and Smo regulate the activity of a group of three glioma associated oncogene proteins (Gli1-3)
(Ingham 2001). Full length Gli2 (Gli2FL) and Gli3 (Gli3FL) are transcriptional activators which in the
absence of Hh ligand are cleaved to truncated forms that act as transcriptional repressors (Gli2R and
Gli3R) (Dai et al. 1999; Sasaki et al. 1999). Gli1 lacks the repressor domain and acts only as a
transcriptional activator (Dai et al. 1999; Sasaki et al. 1999). There is substantial cross-talk between
components of the Hh signalling pathway: Gli1 is a Gli3 target gene (Dai et al. 1999) whilst Ptch1
expression is induced by Gli1, suggesting that it is itself a negative regulator of Hh signalling (Buttitta
et al. 2003).
Primary cilia are required for mammalian Hh signalling as defects in key components of primary cilia
result in truncated or absent cilia and dysregulated Hh signalling (Huangfu et al. 2003; Huangfu &
Anderson 2005; Delous et al. 2007; Weatherbee et al. 2009). This has been observed with loss of
function of the IFT-B particle proteins Ift88 and Ift172 (Huangfu et al. 2003; Huangfu & Anderson
2005), the anterograde IFT motor Kif3a (Huangfu et al. 2003; Huangfu & Anderson 2005), the
retrograde IFT motor Dnchc2 (Huangfu & Anderson 2005) and basal body proteins (Delous et al.
2007; Weatherbee et al. 2009). The situation is more complex, however, as primary cilia are also

36
required for formation of Gli3R, and IFT mutants can result in either loss or gain of Hh signalling
depending on body site. For example, in the neural tube where Gli activators are the major
contributors to pattern formation, IFT mutants result in loss of Hh signalling, whilst in the limbs
where Gli3R is most important, they result in a gain of Hh signalling (Huangfu & Anderson 2005).
In the absence of Hh ligand, key components of the Hh signalling pathway are localised to or
excluded from the primary cilium with the net result that repressor forms of Gli prevail and Hh
signalling is turned off (Figure 1.5A). Ptch1 localises to the primary cilium and prevents ciliary entry
of Smo (Rohatgi et al. 2007). Gli is complexed with suppressor of fused (SuFu) and the kinesin family
member Kif7 at the ciliary base (Liem et al. 2009). SuFu is a negative regulator of Gli and promotes
its cytoplasmic sequestration and degradation via multiple mechanisms (Ding et al. 1999; Barnfield
et al. 2005; Tuson et al. 2011). In the absence of Hh ligand, axonemal enrichment of Gli is prevented
and processing to GliR is promoted (Liem et al. 2009).
In the presence of Hh ligand (Figure 1.5B), Ptch1 exits the cilium allowing entry of Smo (Corbit et al.
2005; Haycraft et al. 2005; Rohatgi et al. 2007). Within the axoneme, Smo forms a complex with the
ciliary proteins Evc and Evc2 which localises to a distinct ciliary region distal to the transition zone
(Dorn et al. 2012; Yang et al. 2012). This Smo-Evc/Evc2 complex results in dissociation of Gli-SuFu
complexes, thereby liberating full length Gli which is transported out of the cilium by IFT (Dorn et al.
2012; Caparrós-Martín et al. 2013). Gli-SuFu complexes are transported past Smo-Evc/Evc2 by the
motor protein Kif7 which relocates from its basal ciliary position along the axoneme to the ciliary tip
following Hh ligand stimulation (Endoh-Yamagami et al. 2009; Liem et al. 2009).
Thus, mammalian Hh signalling is dependent on primary cilia through restrictive but modifiable
compartmentalisation of the downstream signal transduction machinery.

37
Figure 1.5: Vertebrate Hedgehog signalling requires a primary cilium
(A) In the absence of Hedgehog (Hh) ligand, Patched prevents ciliary entry of Smoothened and full
length Gli (GliFL) is cleaved into its repressor (GliR).
(B) In the presence of Hh ligand, Patched leaves the cilium allowing Smoothened to enter and
complex with EVC. This results in dissolution of the SuFu-GliFL complex with subsequent activation
of Gli (GliA) at the ciliary tip. GliA is transported out of the cilium and translocates to the nucleus.
1.3.2.2 Wnt signalling
The Wnt signalling pathways, like Hh signalling, are central to axis patterning and embryonic
development. Wnt ligands (of which there are 19 in humans) bind the Frizzled family of G-protein
coupled receptors (GPCRs) which in turn activate the intra-cellular phosphoprotein Dvl. Different
Wnt pathways are subserved by different Frizzled co-receptors and intracellular machinery.

38
1.3.2.2.1 Canonical Wnt signalling
The canonical Wnt pathway regulates the β-catenin transcription factor. In the absence of Wnt
ligand, β-catenin is targeted for ubiquitin-mediated proteosomal degradation by the multimeric
axin-APC-PP2A-GSK3-CK1 destruction complex. In the presence of Wnt ligand, Frizzled in
combination with its co-receptor LRP5/6 activates Dvl disrupting the β-catenin destruction complex
and promoting its survival. β-catenin translocates into the nucleus where it activates the TCF/LEF1
transcription complex.
The role of primary cilia in canonical Wnt signalling is debated. In some studies, IFT mutant zebrafish
(Huang & Schier 2009) and mice (Ocbina et al. 2009) have absent cilia but normal canonical Wnt
signalling. In others, cilia loss due to organ-specific inactivation of Kif3a (Lin et al. 2003), Ift88 (Cano
et al. 2004) and Mks1 (Wheway et al. 2013) are associated with increased β-catenin expression.
It has been suggested that primary cilia might act as a means of dampening canonical Wnt signalling
through spatial compartmentalisation of some of its signalling components (Figure 1.6). The ciliary
protein inversin binds Dvl and targets it for degradation, thereby preventing β-catenin accumulation.
Again, in vivo evidence regarding inversin is conflicting as no defects in canonical Wnt signalling were
observed in inversin mutated mice (Sugiyama et al. 2011), whilst human mutations can result in
nephronophthisis and β-catenin accumulation (Bellavia et al. 2010). Nephrocystin-3, another ciliary
protein, interacts with inversin and inhibits canonical Wnt signalling (Bergmann et al. 2008). Jouberin
binds β-catenin promoting its nuclear accumulation. In cells with primary cilia, Jouberin is
sequestered to the basal body and axoneme resulting in downregulation of Wnt signalling (Lancaster
et al. 2011).
The situation is further complicated as a number of BBSome proteins have differential modifying
effects on β-catenin. Reductions in Bbs1, 4 and 6 all result in stabilisation of β-catenin and
transcription of its target genes (Gerdes et al. 2007), whilst overexpression of Bbs3 results in an
augmented Wnt response (Wiens et al. 2010). Furthermore, components of the β-catenin
destruction complex directly influence primary cilia. APC stimulates ciliary disassembly through
microtubule destabilisation and proteolytic targeting of the ciliary assembly factor NEK1 (Wang et al.
2014). Inhibition of GSK3β results in ciliary elongation (Miyoshi et al. 2009), whilst CK1ε is integral to
HEF1 stabilisation and therefore AURKA/HDAC6 activation (Lee et al. 2012a).

39
1.3.2.2.2 Non-canonical Wnt signalling
Non-canonical Wnt signalling is unrelated to β-catenin and consists of the pathways involved in
planar cell polarity (PCP) and cellular calcium entry. PCP is specified through actin polymerisation
and cytoskeletal rearrangement following activation of Rho-associated kinase, whilst calcium release
is stimulated by the phospholipase C (PLC)/IP3 pathway.
PCP signalling requires the establishment of cell polarity and the presence of a ciliary basal body to
define apico-basal polarity (Jones et al. 2008). PCP signalling requires Dvl (Wallingford et al. 2000;
Park et al. 2008) in addition to the IFT components Ift88 and Kif3a (Jones et al. 2008), the transition
zone proteins TMEM67, TMEM216 (Dawe et al. 2007, 2009; Valente et al. 2010), the basal body
protein meckelin (Adams et al. 2012) and BBSome proteins (Seo et al. 2010). Whilst Ift20 and Bbs8
knockdown result in defects in both cilia and PCP, a non-ciliary role in cytoskeletal organisation has
been postulated (May-Simera et al. 2015). The ciliary protein inversin, which facilitates the
degradation of β-catenin, stimulates non-canonical Wnt signalling and has been proposed as a
molecular switch between the canonical and non-canonical Wnt pathways (Simons et al. 2005).
The relationship between primary cilia and non-canonical Wnt signalling is, at least in part,
reciprocal. The PCP effector Fuzzy displays ciliary localisation and is a requisite for ciliogenesis (Zilber
et al. 2013).
1.3.2.3 Notch signalling
Notch signalling is another important development signalling pathway and is particularly relevant in
neurogenesis. Notch ligands are transmembrane proteins that bind the extracellular domain of the
single-pass transmembrane Notch receptor. This cell-cell interaction triggers proteolytic cleavage of
the Notch receptor by γ-secretase, releasing the intracellular domain which translocates to the
nucleus and results in transcriptional activation of Notch target genes.
A number of components of the Notch signalling pathway localise to primary cilia including the
Notch-3 receptor and presenilin-2 (the catalytic subunit of γ-secretase) (Ezratty et al. 2011). Ciliary
loss through Ift88 knockdown results in reduced Notch signalling with resultant increased
proliferation and abnormal differentiation (Ezratty et al. 2011; Grisanti et al. 2016). This effect
appears to result from a reduction in the cleaved intracellular Notch receptor domain (Grisanti et al.
2016). Localisation of presenilin-2 to the basal body is required for Notch-receptor cleavage and
depends on a conserved VxPx C-terminal motif and the small GTPase ARF4 (Ezratty et al. 2016).

40
Primary cilia are therefore facilitatory to Notch signalling. In addition, cross-talk with other cilia-
mediated signalling pathways occurs. Activation of Notch signalling in the developing neural tube
results in cilia elongation and regulates ciliary localisation of the Hh signalling components Patched,
Smoothened and full length Gli (Kong et al. 2015; Stasiulewicz et al. 2015).

41
Figure 1.6: Canonical Wnt signalling is negatively regulated by primary cilia
(A) In the absence of a primary cilium, Wnt ligand binds the Frizzled receptor resulting in
translocation of β-catenin into the nucleus in a process involving Dishevelled and Jouberin. Once
there, activation of the T-cell factor/lymphoid embryonic factor (TCF/LEF) transcription factor (TF)
results in Wnt target gene transcription.
(B) In the presence of a primary cilium, nuclear translocation of β-catenin is reduced even in the
presence of Wnt ligand. Dishevelled is targeted for proteosomal degradation by the ciliary proteins
Inversin and Nephrocytsin-3 whilst Jouberin is sequestered to the basal body.

42
1.4 Primary cilia in cancer
Given the role primary cilia play in normal developmental signalling, it is unsurprising that disruption
of ciliary function can result in significant abnormalities. Mutations in genes that encode ciliary
proteins have been described in conjunction with a range of human diseases collectively termed
‘ciliopathies’ [reviewed in (Novarino et al. 2011)]. These diseases include Bardet-Biedl syndrome,
Autosomal Dominant Polycystic Kidney Disease (ADPKD), nephronophthisis and Leber congenital
amaurosis amongst others. Although ciliopathies are distinct clinical entities with a defined genetic
basis, a number of features are variably shared and overlap including retinal degeneration, renal
cysts and polydactyly.
Beyond these monogenic Mendelian ciliopathies, ciliary disruption has been increasingly reported in
a range of multi-factorial diseases including osteoarthritis (McGlashan et al. 2008), obesity (Ansley et
al. 2003), diabetes mellitus (Hearn et al. 2005) and cancer (Seeley et al. 2009; Wong et al. 2009).
Whether these observed changes in primary cilia contribute to such multi-faceted disease processes
remains to be elucidated and it is unlikely that ciliary disruption in isolation would be sufficient for
their development. Proposed mechanisms by which cilia disruption might be considered oncogenic
include dysregulation of tumorigenic signalling pathways and disruption of normal cell cycle control.
Structural abnormalities in primary cilia (generally in their incidence and/or length) have been
reported in tumours arising from all three germ cell layers (Figure 1.7). In the majority of tumour
types, cilia are lost in tumour cells compared to adjacent non-cancerous tissue (Figure 1.7). Whether
this contributes to tumorigenesis, or is merely reflective of the increased rate of cellular proliferation
in neoplasms, remains under debate (and is addressed in this thesis). In a smaller subset of tumour
types, cilia remain present on tumour cells and are required for tumour development (Figure 1.7). In
such instances, the presence or absence of primary cilia is associated with histological subtype. For
example, in craniopharyngiomas, primary cilia are near ubiquitous in the adamantinomatous
subtype, whilst they are absent in the papillary subtype (Coy et al. 2016). In tumours that are
dependent on ciliary-mediated signalling, for example Hh signalling in medulloblastomas, the
presence or absence of primary cilia is dependent on whether the initiating oncogenic event occurs
upstream or downstream of primary cilia (Han et al. 2009; Wong et al. 2009). In this context, cilia
can be either requisite or inhibitory to tumour development, which highlights the broad and cell-
specific role primary cilia play in tumourigenesis. We will consider the mechanistic details further in
the setting of specific tumour types.

43
Figure 1.7 Cancers in which alterations in primary cilia have been observed
Cancers in which cilia loss relative to adjacent tissue has been observed are depicted with black text,
those in which cilia are preserved are in red and those in which both cilia loss and preservation have
been observed are in green.
1 - (Wong et al. 2009), 2 - (Moser et al. 2009), 3 - (Han et al. 2009), 4 - (Coy et al. 2016), 5 - (Lee et al.
2016), 6 - (Kim et al. 2011b), 7 - (Yasar et al. 2017), 8 - (Menzl et al. 2014), 9 - (Gradilone et al. 2013),
10 - (Seeley et al. 2009), 11 - (Rocha et al. 2014), 12 - (Schraml et al. 2009), 13 - (Egeberg et al. 2012),
14 - (Hassounah et al. 2013)

44
1.4.1 Primary cilia dysregulation in cancers
1.4.1.1 Breast cancer
Relative to normal breast epithelium, primary cilia incidence is severely reduced in breast cancer
(Yuan et al. 2010; Menzl et al. 2014; Nobutani et al. 2014). This is also the case for the precursor
lesion carcinoma in situ (Menzl et al. 2014), which suggests that primary cilia dysfunction is an early
feature in breast cancer development. Cilia loss is also observed in cancer-associated stromal cells
compared with stromal cells in normal tissue (Menzl et al. 2014).
Similar observations are seen in cell culture. Breast fibroblasts and epithelial cells are readily ciliated
(Yuan et al. 2010; Spann et al. 2015), while breast cancer cell lines normally lack cilia. If they do not,
they belong to the basal subtype of breast cancer (Yuan et al. 2010; Nobutani et al. 2014; Spann et
al. 2015). Cilia loss is progressive with increasing degrees of transformation in the human MCF
isogenic breast cancer cell series, providing further evidence that structural and functional
alterations in primary cilia occur during breast cancer development and progression (Yuan et al.
2010). Xenografts of human breast cancer cells (both primary and cell line) result in orthotopic and
metastatic tumours in immunodeficient mice, but cilia remain rare suggesting that this is an intrinsic
cell characteristic and not overly influenced by environment or cell cycle (Nobutani et al. 2014).
Numerous cilia genes are down-regulated in breast cancer (Menzl et al. 2014; Shpak et al. 2014).
They include genes important in ciliogenesis (e.g. IFT46, BBS2, TTC8 and DYNC2H1) and those that
code for cilia-localised receptors (e.g. PKD2), although their precise role in breast cancer
pathogenesis remains to be determined. The oncogene NEK2 is overexpressed in breast cancer
(Hayward et al. 2004), resulting in increased ciliary disassembly via Kif24 (Kim et al. 2015).
Knockdown of either NEK2 or Kif24 in the MCF breast cancer cell series restores cilia and reduces
proliferation. However, this is not the case in the most invasive MCF cell types, suggesting that
additional mechanisms are involved in cilia loss (Kim et al. 2015). NEK8 is also overexpressed in
breast cancer (Bowers & Boylan 2004) and modulates ciliary length through the oncogenic Hippo
signalling pathway (Habbig et al. 2012). Furthermore, a number of cilia-associated genes are
commonly mutated in breast cancer: for example Gli1, RPGRIP1 and DNAH9 (Sjoblom et al. 2006;
Wood et al. 2007). Expression of Kif3a, assessed by immunohistochemistry, is higher in breast cancer
tissue compared to adjacent non-cancerous tissue and is correlated with a number of clinical
parameters including pathological grade, Ki67 index and presence of lymph node metastases. Higher
Kif3a expression is correlated with improved survival (Xia et al. 2018).

45
Primary cilia play an important role in breast development when they are present on luminal
epithelial, myoepithelial and stromal cells. Luminal cells lose primary cilia once early branching
morphogenesis is complete (McDermott et al. 2010). This differential pattern of cilia expression is
conserved in healthy human adult breast epithelium with myoepithelial (or basal) cells more
frequently possessing primary cilia than luminal cells (Yuan et al. 2010; Menzl et al. 2014; Nobutani
et al. 2014). The importance of primary cilia in co-ordinated breast development is exemplified by
the Ift88 mutant Tg737ORPK mouse. These mice display significant cilia loss in developing breast tissue
with resultant increases in canonical Wnt and Hh signalling and duct branching defects (McDermott
et al. 2010).
Thus, luminal breast cancer, derived from the rarely ciliated luminal epithelium, lacks cilia while
basal breast cancer (which includes the poor prognosis triple-negative subtype) which originates
from the ciliated myoepithelial cells still displays cilia. This illustrates the diverse role that primary
cilia can play in cancer.
1.4.1.2 Ovarian cancer
Bioinformatic studies of cancer databases identify that numerous cilia genes are differentially
expressed in ovarian cancer compared with normal tissue (Shpak et al. 2014) but in vivo studies
examining cilia in ovarian cancer are lacking. The ovarian cancer cell lines SK-OV3 and OVCAR3 are
ciliated (Egeberg et al. 2012; Spann et al. 2015), although less frequently than primary healthy
ovarian surface epithelial cells due to increased AURKA-mediated ciliary disassembly (Egeberg et al.
2012). Both Hh and PDGRα signalling are dysregulated in ovarian cancer. Hh signalling is activated
due to increased activator and reduced repressor forms of Gli which occurs in a Smo-independent
manner despite Smo localisation to the primary cilia (Egeberg et al. 2012; Spann et al. 2015).
Primary cilia are present on healthy rodent (Teilmann et al. 2005) and human (Egeberg et al. 2012)
ovarian surface epithelium and contain the necessary functional components for Hh and PDGFRα
signal transduction (Egeberg et al. 2012). Cilia are also present on ovarian hormone producing
granulosa cells (Herman & Albertini 1983; Teilmann et al. 2005; Johnson et al. 2008) and are
sensitive to the pituitary hormone prolactin (Herman & Albertini 1983). Depletion of primary cilia in
ovarian granulosa cells in a conditional Ift88 knockout mouse results in alterations in the oestrus
cycle, impaired ovulation and delayed breast development, which can be rescued by exogenous
oestrogen (Johnson et al. 2008). Therefore, primary cilia are important in ovarian endocrine
function.

46
Thus, it appears likely that primary cilia play a role in ovarian cancer development, although this still
requires definitive experimental validation.
1.4.1.3 Prostate cancer
A single study has examined primary cilia in human prostate cancer specimens (Hassounah et al.
2013). Primary cilia frequency and length was reduced in both prostatic intra-epithelial neoplasia
and prostate cancer compared with noncancerous tissue. Of note, while frequency was unchanged,
cilia were shorter in the stromal cells surrounding tumours than in normal prostate tissue,
suggesting the possibility of a ‘field effect’ or cilia shortening being an early event in prostate
tumourigenesis. In addition, primary cilia frequency in the ‘normal’ tissue surrounding prostate
cancer correlated with many clinical outcomes, including tumour size, stage and risk of recurrence.
The cilia-mediated Hh signalling pathway plays a pivotal role in prostatic development and is
required for normal budding and duct formation (Podlasek et al. 1999; Wang et al. 2003). Paracrine
signalling between the epithelium, which secretes Hh ligand, and the stroma, which expresses the
Hh receptor Ptch, inhibits proliferation and promotes differentiation (Wang et al. 2003). As is
expected for a system reliant on Hh signalling, primary cilia are present on both mesenchymal and
epithelial prostate cells (Zhang et al. 2009). This is further reflected in the presence of functional
primary cilia on the UGSM2 (murine urogenital sinus mesenchyme) and WPMY-1 (human prostate
myofibroblast) cell lines (Zhang et al. 2009) and prostatic fibroblasts (Wilkinson et al. 2013).
Interestingly, primary cilia are absent on a range of prostate cancer cell lines derived from prostate
and metastatic sites (Zhang et al. 2009), but are present on prostate cancer-associated fibroblasts,
which are dependent on Hh signalling for survival and proliferation (Wilkinson et al. 2013).
1.4.1.4 Renal cancer
Primary cilia frequency is reduced in all subtypes of renal cancer compared to adjacent non-
cancerous renal tissue (Schraml et al. 2009; Basten et al. 2013). Ciliary loss is most pronounced in
clear cell renal cell carcinoma (ccRCC), the most common subtype of renal cancer, in which von
Hippel-Lindau (VHL) is inactivated (Moore et al. 2011).
Von Hippel–Lindau (VHL) disease is a familial cancer syndrome caused by mutations in the VHL gene
and is discussed in detail in Chapter 2. Affected individuals are at risk of developing a range of
tumours, including endocrine malignancies of the pancreas and adrenal medulla. In addition, renal
and pancreatic cysts are a feature of VHL, which can be considered an atypical ciliopathy (Schraml et
al. 2009).

47
Primary cilia loss is a feature of renal cysts in VHL patients (Esteban et al. 2006), as well as in
sporadic ccRCC (Schraml et al. 2009; Basten et al. 2013). VHL-deficient RCC cell lines display no or
very few cilia (Esteban et al. 2006; Lutz & Burk 2006; Schermer et al. 2006; Lolkema et al. 2008), and
Vhl knockdown in murine renal cells results in cilia loss (Schermer et al. 2006). Expression of wild-
type pVHL in these RCC cells restores cilia (Esteban et al. 2006; Lutz & Burk 2006; Schermer et al.
2006), but this is not the case with disease-causing pVHL mutations (Lutz & Burk 2006). Frew et al.
(Frew et al. 2008) found that VHL loss in retinal pigment epithelial (RPE) cells and primary mouse
embryonic fibroblasts did not affect cilia formation, but resulted in an accelerated rate of cilia
disassembly upon challenge with serum, a stimulus to ciliary disassembly. However, others have
observed reduced ciliary formation in VHL knockdown RPE cells (Dere et al. 2015).
Thus, pVHL appear to play an important role in maintenance of primary cilia. The canonical function
of pVHL is as an E3-ubiquitin ligase that targets HIF for proteasomal-mediated degradation. The
mechanisms by which pVHL loss results in cilia ablation have been reported to involve both HIF-
dependent (Esteban et al. 2006) and HIF-independent pathways (Lutz & Burk 2006).
pVHL localises to primary cilia (Schermer et al. 2006; Lolkema et al. 2008) where it binds to and
stabilises microtubules (Okuda et al. 1999; Hergovich et al. 2003, 2006; Schermer et al. 2006;
Lolkema et al. 2007). This is achieved via a microtubule-binding domain in pVHL that is distinct from
the HIF-binding domain. Interestingly, this microtubule-binding domain is a mutational hotspot
(Hergovich et al. 2003) in VHL. VHL–microtubule interactions are mediated by the Par3-Par6-aPKC
(Okuda et al. 1999; Schermer et al. 2006) and kinesin-2/KIF3A (Lolkema et al. 2007) complexes. Thus,
the role of pVHL in microtubule stabilisation provides a clear mechanism for its function in ciliary
maintenance.
In addition, pVHL loss results in increased expression of both HDAC6 and AURKA. This occurs due to
both HIF-dependent (Xu et al. 2010) (both HEF1 and NEK8 are HIF- responsive genes (Xu et al. 2010;
Ding et al. 2015)) and HIF-independent (Dere et al. 2015) mechanisms and it should be noted that
HIF accumulation is insufficient in itself to cause RCC development (Kim et al. 2006a).
The situation is more complex, however, as VHL inactivation alone may be insufficient to alter cilia in
vivo. Evidence to support this comes from human data in which VHL inactivation in single renal
tubular cells gives rise to a different ciliary phenotype than VHL inactivation in cyst-lining cells
(Montani et al. 2010). Mouse models of VHL do not recapitulate the renal phenotype (Haase et al.
2001; Ma et al. 2003) and additional genetic inactivations are required for cilia loss and cyst
formation — for example, mutations in glycogen synthase kinase-3β (Thoma et al. 2007),

48
phosphatase and tensin homologue (Frew et al. 2008), transformation-related protein 53 (Albers et
al. 2013), Kif3a (Guinot et al. 2016) and retinoblastoma 1 (Harlander et al. 2017). In addition to its
direct interaction with AURKA (Fumoto et al. 2008; Dar et al. 2009), GSK3β regulates the
microtubule binding function of VHL (Hergovich et al. 2006) such that simultaneous loss of both VHL
and GSK3β results in intensified serum-induced ciliary disassembly (Thoma et al. 2007).
Thus, pVHL and primary cilia are important in renal cyst and ccRCC formation. We can speculate that
primary cilia may also play a role in the pathogenesis of other VHL-associated cancers, although this
is yet to be demonstrated.
1.4.1.5 Medulloblastoma
Medulloblastomas, the most common paediatric brain tumour, arise from cerebellar granule neuron
precursors and are dependent on Hh signalling for their proliferation and tumorigenesis (Huangfu &
Anderson 2005). Primary cilia play a dual role in either supporting or inhibiting medulloblastoma
development dependent on the location of the initiating oncogenic event within the Hh pathway
(Han et al. 2009). In medulloblastomas driven by the upstream activator of Hh signalling Smo,
tumour formation was prevented by ablation of primary cilia. When the oncogenic event was distal
to primary cilia, for example in Gli2-driven tumours, absence of cilia was required for tumour
development. This molecular dissection of medulloblastoma aetiology in mice correlates with
human medulloblastoma subtypes: primary cilia are present on classic and desmoplastic
medulloblastomas associated with Ptch1 mutations, but are absent on anaplastic medulloblastomas
(Han et al. 2009). Furthermore, a number of key ciliary proteins and regulators have been identified
as central to medulloblastoma formation including Kif3a (Han et al. 2009; Barakat et al. 2013),
INPP5E (Conduit et al. 2017) and ADP-ribosylation factor-like protein 13B (Arl13b) (Bay et al. 2018).
Remarkably, the importance of primary cilia in medulloblastomas extends beyond their
development. In Hh-dependent medulloblastomas, loss of primary cilia confers and correlates with
resistance to Smo inhibitors (Zhao et al. 2017) thus identifying cilia as potential therapeutic targets.
49
1.4.2 Mechanisms of ciliary dysfunction in cancer
Tumoural alterations in primary cilia result from dysregulation of the balanced control of ciliary
assembly and disassembly.
Activation of the AURKA/HDAC6 ciliary disassembly pathway is seen in many tumours in which cilia
loss occurs. AURKA is overexpressed in ovarian (Egeberg et al. 2012) and renal cancer (Schraml et al.
2009; Basten et al. 2013; Dere et al. 2015), whilst HDAC6 overexpression is a feature of
cholangiocarcinomas (Gradilone et al. 2013; Mansini et al. 2018) and chondrosarcomas (Xiang et al.
2017). In cholangiocarcinomas, this is achieved through alterations in microRNA processing (Mansini
et al. 2018). Inhibition of HDAC6 by tubacin restores primary cilia and reduces proliferation and
cellular invasion (Gradilone et al. 2013; Xiang et al. 2017).
This mechanism is not universal, however, as HDAC6 depletion and inhibition have no effect on
ciliation of pancreatic cancer cells (Kobayashi et al. 2017). Broader HDAC inhibition with trichostatin
A did have an impact and led to the identification of HDAC2 as a ciliary disassembly factor through
its positive regulation of AURKA expression (Kobayashi et al. 2017). K-ras signalling is also
upregulated in pancreatic cancer cells and similarly upregulates AURKA expression (Seeley et al.
2009) through the transcription factor ETS2 (Furukawa et al. 2006).
Enhanced ciliary disassembly also occurs in breast cancer due to Nek2 over-expression (Hayward et
al. 2004; Cappello et al. 2014). Depletion of Nek2 or its effector Kif24 in a variety of breast cancer
cell lines restores cilia (Kim et al. 2015). Cell cycle-related kinase (CCRK) and its substrate intestinal
cell kinase (ICK) appear to suppress cilia formation (Yang et al. 2013) and are over-expressed in
glioblastoma multiforme (GBM) (Ng et al. 2007). The mechanism by which this results in cilia loss has
not been elucidated with data from a mouse developmental model suggesting a role in ciliogenesis
(Snouffer et al. 2017), which does not explain the role observed in GBM.
Reductions in cilia assembly are also responsible for cilia loss in cancer. The oestrogen receptor
alpha (ERα) co-repressor split ends regulates the expression of a number of genes involved in ciliary
biology and its knockdown results in ciliary loss (Légaré et al. 2017). Intriguingly, tumoural split ends
RNA levels are predictive of metastasis risk in human ER negative breast cancer (the subtype which
lacks cilia) (Légaré et al. 2017). Post-translational glycylation of microtubules by tubulin glycylases
(TTLs) contributes to axonemal stability. TTL3 knockout mice display aberrant colonic cilia formation
and increased epithelial turnover; low TTL3 levels are associated with human colorectal cancer
development (Rocha et al. 2014).
50
Alterations in cilia-mediated signalling pathways also potentially contribute to ciliary dysregulation in
cancer. The Wnt pathway component APC promotes ciliary disassembly whilst inhibiting ciliogenesis
and is mutated in the hereditary cancer syndrome familial adenomatous polyposis (Jimbo et al.
2002; Jaulin & Kreitzer 2010). If the β-catenin binding protein Jouberin loses its ciliary localisation
signal, nuclear β-catenin accumulates resulting in increased cellular proliferation compared to wild
type Jouberin (Lancaster et al. 2011).
1.4.3 Mechanisms by which ciliary dysfunction contributes to tumourigenesis
In tumour types in which cilia loss occurs, it does so early in tumourigenesis, as it is a feature of a
range of pre-invasive precursor lesions. For example, cilia loss has been observed in pancreatic
intraepithelial neoplasia (Seeley et al. 2009; Schimmack et al. 2016), prostatic intraepithelial
neoplasia (Hassounah et al. 2013), breast carcinoma in situ (Menzl et al. 2014) and melanoma in situ
(Kim et al. 2011b; Snedecor et al. 2015).
In addition to cilia loss being an intrinsic feature of tumoural cells, there is growing evidence that
features of the local tumour microenvironment influence primary cilia. Whilst pancreatic cancer cells
generally lack primary cilia, tumour-associated stromal cells display primary cilia (Bailey et al. 2009;
Schimmack et al. 2016) and are crucial in sustaining oncogenic paracrine Hh signalling in this context
(Bailey et al. 2009). Endocrine factors can also play a role; PTH suppresses cilia formation and
promotes proliferation and invasion of chondrosarcoma cells (Xiang et al. 2014). Furthermore, the
human carcinogens ochratoxin A and potassium bromide induce ciliary loss in renal tubular epithelial
cells (Radford et al. 2012). The inflammatory cytokine tissue necrosis factor alpha causes cilia loss
through NF-κB signalling (Vézina et al. 2014) and expression of programmed cell death protein-1
receptor is associated with primary cilia frequency in colorectal cancers (Dvorak et al. 2017). Cilia are
sensory organelles and changes in luminal fluid flow and composition (Mansini et al. 2019) and
oxygen tension (Proulx-Bonneau & Annabi 2011) can result in disease-relevant alterations in primary
cilia.
Primary cilia loss, achieved through a variety of independent mechanisms, results in increased
cellular proliferation providing evidence for cilia playing a cell-cycle gatekeeper role. Overexpression
of HDAC6 in cholangiocytes results in ciliary loss and increased proliferation and is prevented by
HDAC6 inhibition (Gradilone et al. 2013). This is dependent on primary cilia being present and is
prevented by IFT88 knockdown, arguing against a non-ciliary mechanism (Gradilone et al. 2013).
Similarly, depletion or inhibition of HDAC6 in chondrosarcoma cells restores cilia, reduces
proliferation and invasion and inhibits tumour growth in vivo (Xiang et al. 2017). Depletion of Nek2

51
or Kif24 in breast cancer cell lines also restores primary cilia and reduces cellular proliferation (Kim
et al. 2015), whilst TTL3 loss promotes colonic epithelial proliferation & tumour formation (Rocha et
al. 2014). Primary cilia loss in human astrocytes stimulates cell growth in a lysophosphatidic acid
(LPA) dependent manner (Loskutov et al. 2018). When present, the primary cilium sequesters the
LPA receptor, thereby preventing its interaction with relevant G proteins that are excluded from
cilia. In the absence of a cilium, as is the case in GBM, this interaction occurs with resultant
proliferation (Loskutov et al. 2018). CCRK and ICK directly link primary cilia to the cell cycle: loss of
either results in ciliary elongation and a reduction in G1/S progression which is prevented by Kif3
knockdown (Yang et al. 2013). Conversely, increasing cilia length through a variety of means in a
range of cancer cell lines can slow cellular proliferation in a process that requires primary cilia (Khan
et al. 2016).
Cilia dysfunction results in dysregulation of a number of cilia-mediated oncogenic signalling
pathways. Hh signalling is disrupted in multiple cancers in which cilia loss and retention is a feature,
including pancreatic (Nielsen et al. 2008; Bailey et al. 2009), medulloblastoma (Han et al. 2009),
basal cell carcinoma (Wong et al. 2009; Yang et al. 2017) and ovarian cancer (Egeberg et al. 2012).
Activation of Hh signalling, in addition to being pro-proliferative, contributes to the key oncogenic
process of epithelial-to-mesenchymal transition (EMT) in a cilia-dependent manner (García-Zaragoza
et al. 2012; Guen et al. 2017). Wnt signalling is a feature of prostate cancer (Lancaster et al. 2011;
Hassounah et al. 2013) and is attenuated by a shortened cilium and activated by ciliary ablation
(Lancaster et al. 2011; Oh & Katsanis 2013). Aberrant Notch signalling is a feature of choroid plexus
tumours (Li et al. 2016), is dependent on primary cilia and plays a crucial role in cellular
differentiation (Ezratty et al. 2011).
It has also been proposed that cilia contribute to tumourigenesis through altered proteosomal
activity (Gerhardt et al. 2016) and dysregulation of autophagy (Cao & Zhong 2015). Alterations in
activity of the E3 ubiquitin ligase component of the ubiquitin-proteasome system are a common
feature of cancers (Kitagawa et al. 2009) and multiple BBSome and transition zone proteins interact
with proteosomal components (Gerdes et al. 2007; Sang et al. 2011; Liu et al. 2014; Gerhardt et al.
2015). The cellular homeostatic process of autophagy is bi-directionally linked to primary cilia and is
dysregulated in cancers in which ciliary dysfunction occurs (Perera et al. 2015; Lee et al. 2016).
Autophagy itself promotes and restricts processes involved in ciliary assembly and disassembly
(Pampliega et al. 2013; Tang et al. 2013) and cilia-mediated Hh signalling promotes autophagy
(Pampliega et al. 2013).
52
Beyond its role in tumour development, features of tumoural primary cilia are associated with
prognosis and treatment susceptibility and resistance. Cilia loss is associated with an increased risk
of perineural invasion in prostate cancer (Hassounah et al. 2013), distant metastases in melanoma
(Snedecor et al. 2015) and overall survival in colorectal adenocarcinoma (Dvorak et al. 2016). Further
indirect evidence of the link between cilia loss and prognosis is provided by HEF1 which stimulates
the AURKA/HDAC6 pathway and is pro-metastatic in breast cancer (Minn et al. 2005) and melanoma
(Kim et al. 2006b) and is associated with increased aggressiveness of GBM (Natarajan et al. 2006).
Interestingly in pancreatic cancer, in which cilia loss is a feature, those tumours that retained cilia
had an increased risk of lymph node metastasis and a poorer prognosis (Emoto et al. 2014).
In Hh-dependent medulloblastomas, loss of tumoural primary cilia may confer resistance to Smo
inhibitors (Zhao et al. 2017; Bay et al. 2018), whilst AURKA overexpression leads to taxol resistance
(Anand et al. 2003). Cilia presence and length is associated with resistance to a variety of kinase
inhibitors in a range of cancer cell lines and drug sensitivity can be restored through shortening of
primary cilia (Jenks et al. 2018).

53
CHAPTER 2
Phaeochromocytomas and paragangliomas

54
2.1 Definition and demographics
Phaeochromocytomas and paragangliomas (PGL; collectively termed PPGLs) are neuroendocrine
tumours (NETs). They are of neural crest origin and have the potential to secrete catecholamines.
Phaeochromocytomas arise from chromaffin cells of the adrenal medulla, a modified ganglion of the
sympathetic nervous system which receives innervation from preganglionic fibres. PGL arise from
chromaffin cells of the autonomic nervous system, either from the paravertebral sympathetic chain
or parasympathetic ganglia in the neck and skull base, in which case they are termed head and neck
PGL (HNPGL) (Figure 2.1). Phaeochromocytomas form around 70-75% of PPGLs with PGL comprising
the remainder(Lenders et al. 2005).
The first published clinical description of a phaeochromocytoma was in 1800 (Sugrue 1800; Cronin
2008), although it was not until 1886 that the associated histopathology was documented, including
the characteristic tumoural colour change from red to dark brown with the addition of chromate
salts (Fränkel 1886). It is this ‘chromaffin reaction’, caused by catecholamine oxidation, which led to
the naming of the condition, literally meaning ‘dark coloured tumour’.
The actual prevalence of PPGLs in the general population is difficult to determine given that the
diagnosis is often only made in retrospect post mortem. Autopsy studies suggest a prevalence rate
of 0.05% with 50% of these deaths being directly attributable to PPGLs (Lo et al. 2000; McNeil et al.
2000). Prevalence is unsurprisingly enriched in certain clinical populations and reaches 0.6% in the
hypertensive outpatient population (Omura et al. 2004) and 5% of patients with adrenal
incidentalomas (radiological abnormalities identified on examinations performed for other reasons)
(Mansmann et al. 2004). It is much higher in certain genetic conditions, discussed later in this
chapter. There is no identified difference in prevalence between the sexes.
The overall malignancy rate for all PPGLs approaches 20% (Plouin et al. 2012), but is higher in certain
patient groups and is up to 40% in patients with mutations in succinate dehydrogenase B (SDHB)
(Brouwers et al. 2006; Amar et al. 2007).
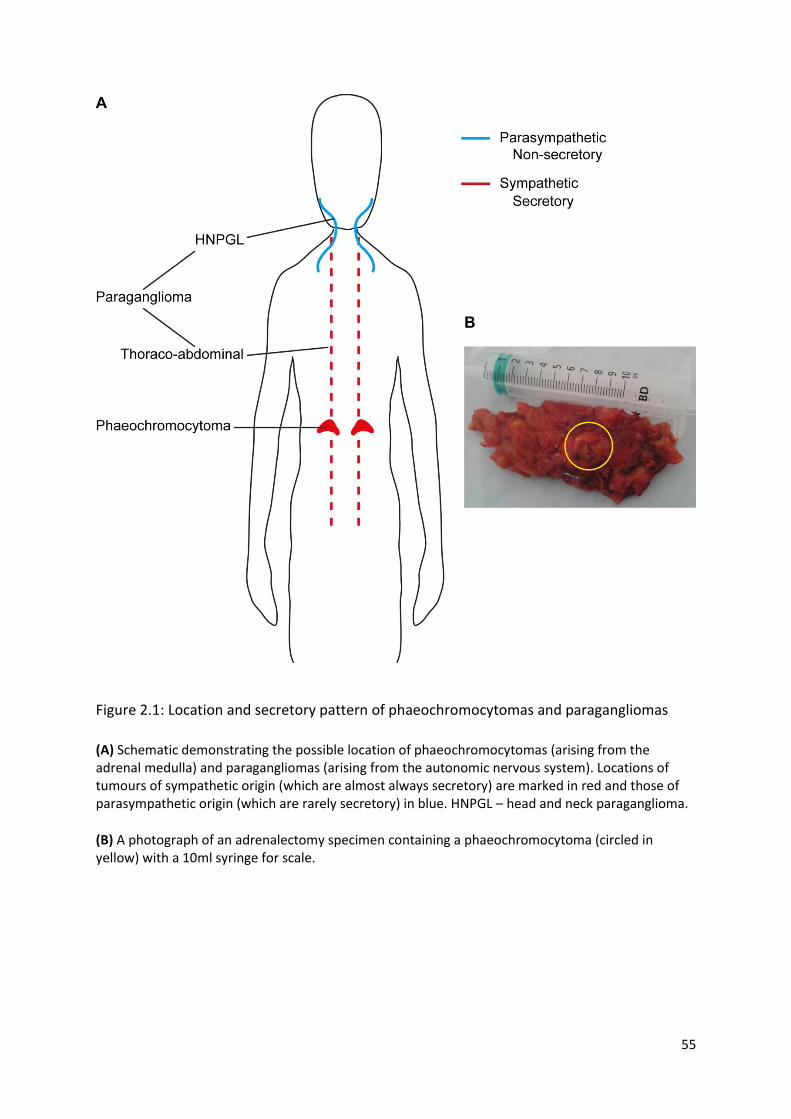
55
Figure 2.1: Location and secretory pattern of phaeochromocytomas and paragangliomas
(A) Schematic demonstrating the possible location of phaeochromocytomas (arising from the adrenal medulla) and paragangliomas (arising from the autonomic nervous system). Locations of tumours of sympathetic origin (which are almost always secretory) are marked in red and those of parasympathetic origin (which are rarely secretory) in blue. HNPGL – head and neck paraganglioma.
(B) A photograph of an adrenalectomy specimen containing a phaeochromocytoma (circled in yellow) with a 10ml syringe for scale.
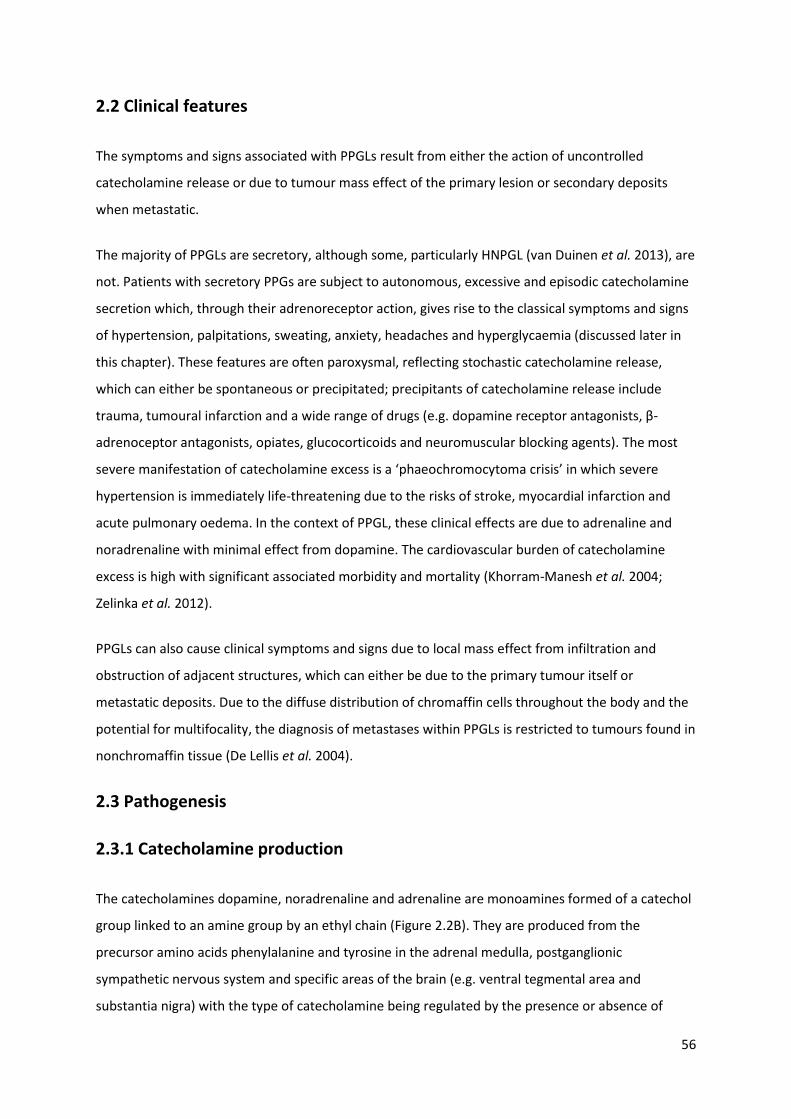
56
2.2 Clinical features
The symptoms and signs associated with PPGLs result from either the action of uncontrolled
catecholamine release or due to tumour mass effect of the primary lesion or secondary deposits
when metastatic.
The majority of PPGLs are secretory, although some, particularly HNPGL (van Duinen et al. 2013), are
not. Patients with secretory PPGs are subject to autonomous, excessive and episodic catecholamine
secretion which, through their adrenoreceptor action, gives rise to the classical symptoms and signs
of hypertension, palpitations, sweating, anxiety, headaches and hyperglycaemia (discussed later in
this chapter). These features are often paroxysmal, reflecting stochastic catecholamine release,
which can either be spontaneous or precipitated; precipitants of catecholamine release include
trauma, tumoural infarction and a wide range of drugs (e.g. dopamine receptor antagonists, β-
adrenoceptor antagonists, opiates, glucocorticoids and neuromuscular blocking agents). The most
severe manifestation of catecholamine excess is a ‘phaeochromocytoma crisis’ in which severe
hypertension is immediately life-threatening due to the risks of stroke, myocardial infarction and
acute pulmonary oedema. In the context of PPGL, these clinical effects are due to adrenaline and
noradrenaline with minimal effect from dopamine. The cardiovascular burden of catecholamine
excess is high with significant associated morbidity and mortality (Khorram-Manesh et al. 2004;
Zelinka et al. 2012).
PPGLs can also cause clinical symptoms and signs due to local mass effect from infiltration and
obstruction of adjacent structures, which can either be due to the primary tumour itself or
metastatic deposits. Due to the diffuse distribution of chromaffin cells throughout the body and the
potential for multifocality, the diagnosis of metastases within PPGLs is restricted to tumours found in
nonchromaffin tissue (De Lellis et al. 2004).
2.3 Pathogenesis
2.3.1 Catecholamine production
The catecholamines dopamine, noradrenaline and adrenaline are monoamines formed of a catechol
group linked to an amine group by an ethyl chain (Figure 2.2B). They are produced from the
precursor amino acids phenylalanine and tyrosine in the adrenal medulla, postganglionic
sympathetic nervous system and specific areas of the brain (e.g. ventral tegmental area and
substantia nigra) with the type of catecholamine being regulated by the presence or absence of

57
certain enzymes in the catecholamine synthesis pathway (Figure 2.2A). In the rate-limiting step of
this anabolic pathway, tyrosine is converted to L-3,4-dihydroxyphenylalanine (L-DOPA) by tyrosine
hydroxylase (TH), a cytosolic enzyme present only in catecholamine producing cells (Nagatsu et al.
1964). L-DOPA is subsequently converted to dopamine by aromatic L-amino acid decarboxylase (also
known as DOPA decarboxylase), a widely expressed enzyme which, unlike TH, has other non-
catecholamine related functions. Dopamine beta-hydroxylase (DBH), which is confined to
catecholamine producing cells, converts dopamine to noradrenaline. Noradrenaline is subsequently
converted to adrenaline in cells containing phenylethanolamine N-methyltransferase (PNMT), which
is predominantly expressed in the adrenal medulla.
Catecholamine release, whether from the adrenal medulla (predominantly adrenaline), sympathetic
nerves (noradrenaline) or dopaminergic pathways of the central nervous system (dopamine), is
episodic and results from exocytosis of pre-formed catecholamine-containing vesicles into the
synaptic cleft or vasculature. Noradrenaline is released following action potential arrival at the pre-
synaptic terminal with depolarisation of the neural membrane, a process that is inhibited by a wide
range of factors including reciprocal innervation from cholinergic parasympathetic neurons,
dopamine, serotonin, histamine and noradrenaline itself through the action of pre-synaptic α2-
adrenoceptors. In contrast, noradrenaline release is augmented by adrenaline through its effect on
the stimulatory β2-adrenoceptor. In health, circulating noradrenaline levels are low and represent
‘over-spill’ from the synapses of the sympathetic nervous system and it therefore has limited
systemic effect. Adrenaline, the predominant circulating catecholamine, is released by the adrenal
medulla in response to stimulation from sympathetic preganglionic neurons carried by the
splanchnic nerves. Unlike catecholamines, metanephrines are released continuously and
independently of vesicle-mediated catecholamine release, which has important clinical implications
in PPGL diagnosis.
Catecholamines function both as neurotransmitters and hormones and exert their wide ranging
physiological effects though GPCRs: adrenaline and noradrenaline via adrenoreceptors and
dopamine via dopamine receptors.
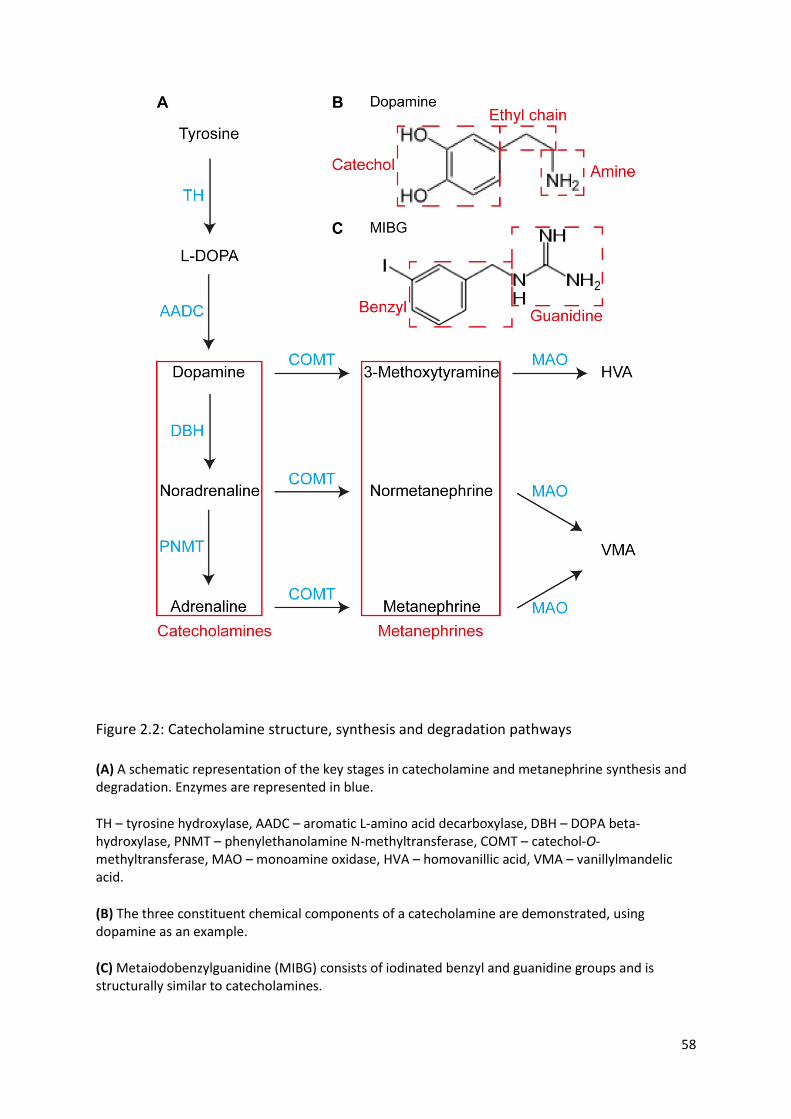
58
Figure 2.2: Catecholamine structure, synthesis and degradation pathways
(A) A schematic representation of the key stages in catecholamine and metanephrine synthesis and degradation. Enzymes are represented in blue.
TH – tyrosine hydroxylase, AADC – aromatic L-amino acid decarboxylase, DBH – DOPA beta-hydroxylase, PNMT – phenylethanolamine N-methyltransferase, COMT – catechol-O- methyltransferase, MAO – monoamine oxidase, HVA – homovanillic acid, VMA – vanillylmandelic acid.
(B) The three constituent chemical components of a catecholamine are demonstrated, using dopamine as an example.
(C) Metaiodobenzylguanidine (MIBG) consists of iodinated benzyl and guanidine groups and is structurally similar to catecholamines.
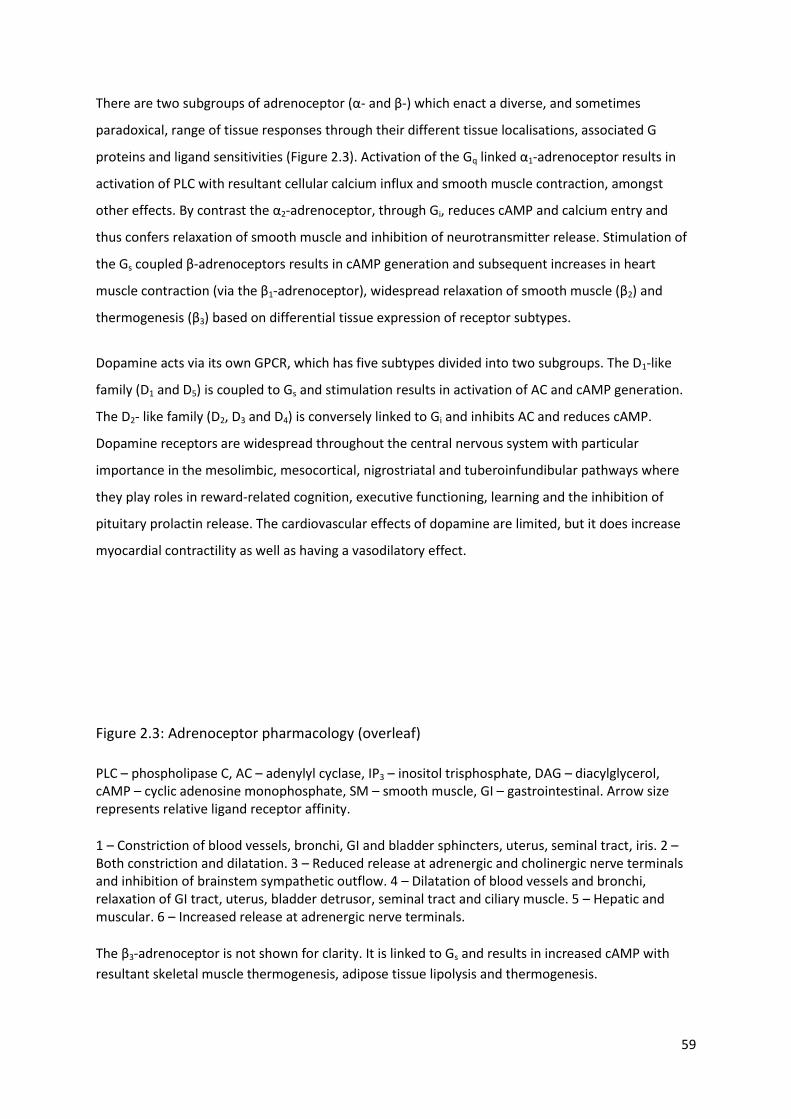
59
There are two subgroups of adrenoceptor (α- and β-) which enact a diverse, and sometimes
paradoxical, range of tissue responses through their different tissue localisations, associated G
proteins and ligand sensitivities (Figure 2.3). Activation of the Gq linked α1-adrenoceptor results in
activation of PLC with resultant cellular calcium influx and smooth muscle contraction, amongst
other effects. By contrast the α2-adrenoceptor, through Gi, reduces cAMP and calcium entry and
thus confers relaxation of smooth muscle and inhibition of neurotransmitter release. Stimulation of
the Gs coupled β-adrenoceptors results in cAMP generation and subsequent increases in heart
muscle contraction (via the β1-adrenoceptor), widespread relaxation of smooth muscle (β2) and
thermogenesis (β3) based on differential tissue expression of receptor subtypes.
Dopamine acts via its own GPCR, which has five subtypes divided into two subgroups. The D1-like
family (D1 and D5) is coupled to Gs and stimulation results in activation of AC and cAMP generation.
The D2- like family (D2, D3 and D4) is conversely linked to Gi and inhibits AC and reduces cAMP.
Dopamine receptors are widespread throughout the central nervous system with particular
importance in the mesolimbic, mesocortical, nigrostriatal and tuberoinfundibular pathways where
they play roles in reward-related cognition, executive functioning, learning and the inhibition of
pituitary prolactin release. The cardiovascular effects of dopamine are limited, but it does increase
myocardial contractility as well as having a vasodilatory effect.
Figure 2.3: Adrenoceptor pharmacology (overleaf)
PLC – phospholipase C, AC – adenylyl cyclase, IP3 – inositol trisphosphate, DAG – diacylglycerol, cAMP – cyclic adenosine monophosphate, SM – smooth muscle, GI – gastrointestinal. Arrow size represents relative ligand receptor affinity.
1 – Constriction of blood vessels, bronchi, GI and bladder sphincters, uterus, seminal tract, iris. 2 – Both constriction and dilatation. 3 – Reduced release at adrenergic and cholinergic nerve terminals and inhibition of brainstem sympathetic outflow. 4 – Dilatation of blood vessels and bronchi, relaxation of GI tract, uterus, bladder detrusor, seminal tract and ciliary muscle. 5 – Hepatic and muscular. 6 – Increased release at adrenergic nerve terminals.
The β3-adrenoceptor is not shown for clarity. It is linked to Gs and results in increased cAMP with
resultant skeletal muscle thermogenesis, adipose tissue lipolysis and thermogenesis.
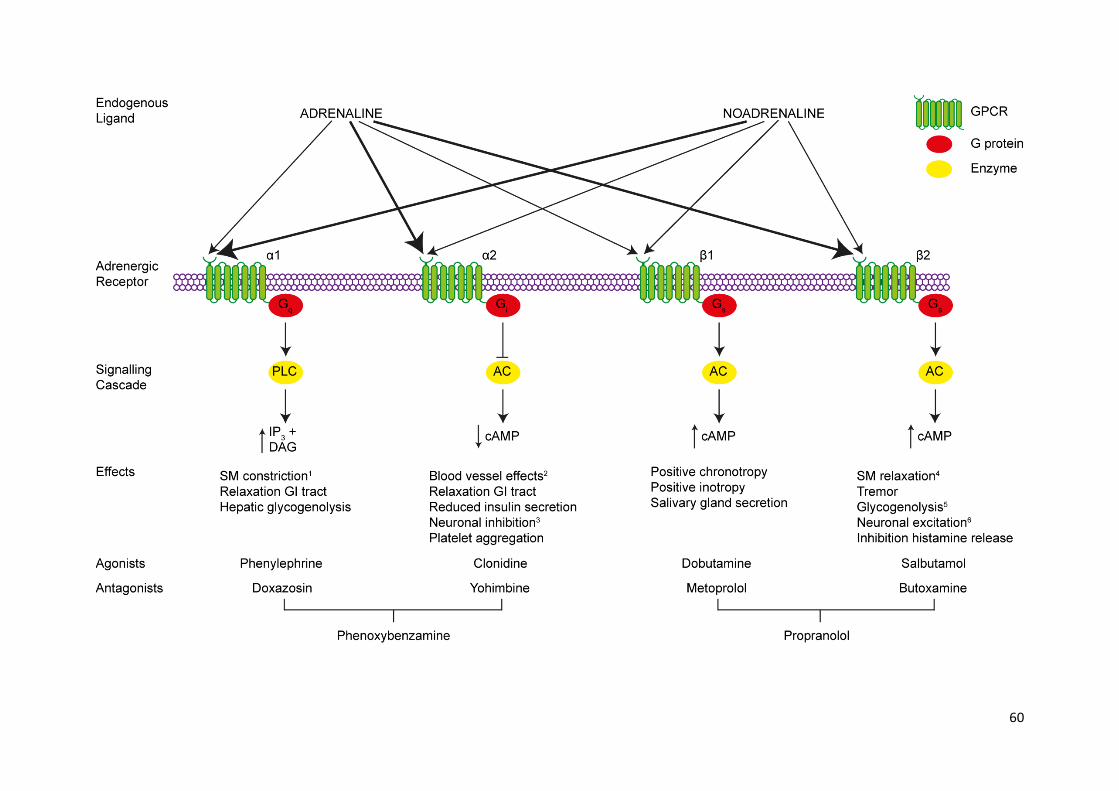
60

61
2.3.2 Aetiology
2.3.2.1 Environmental factors
Exposure to chronic hypoxia increases the risk of PPGL development and is the only known
environmental risk factor.
2.3.2.1.1 Altitude
The chemoreceptor type I cells of the carotid body are sensitive to the partial pressure of oxygen
and undergo hyperplasia in response to hypobaric hypoxia in a range of mammals, including humans
residing at high altitude (Edwards et al. 1971, 1972; Arias-Stella & Bustos 1976; Arias-Stella &
Valcarcel 1976). This response was also seen in rats after just one month’s exposure to simulated
high altitude in a hypobaric chamber (Laidler & Kay 1975, 1978). These changes result in increased
urinary, venous and arterial noradrenaline in rats (Johnson et al. 1983; Hui et al. 2003) and humans
(Cunningham et al. 1965; Mazzeo et al. 1994) at altitude without changes in adrenaline production
(Cunningham et al. 1965; Johnson et al. 1983; Mazzeo et al. 1994).
The frequency of carotid body tumours (a type of HNPGL) appears to be elevated in cows (Arias-
Stella & Bustos 1976) and humans (Saldana et al. 1973; Pacheco-Ojeda et al. 1988; Rodríguez-Cuevas
et al. 1998) residing at high altitude, although these data are observational and could potentially be
explained by an increased prevalence of predisposing germline mutations in susceptibility genes in
geographically isolated populations (Enríquez-Vega et al. 2019). There is also a suggestion that
altitude could potentially modify phenotypic severity of genetic predispositions as high altitude
dwelling was associated with increased tumour number within an SDHD cohort (Astrom et al. 2003).
2.3.2.1.2 Congenital cyanotic heart disease
Congenital cyanotic heart disease (CCHD) has been associated with PPGL development through
retrospective case studies. The largest series, which was an international collaboration, identified 18
individuals with both CCHD and PPGL (Opotowsky et al. 2015). Patients were young (median age of
diagnosis 31.5 years) with a noradrenergic phenotype and a high frequency of multiple tumours and
extra-adrenal disease. These case descriptions were combined with analysis of a US national
discharge database which demonstrated that hospitalised CCHD patients had a significantly
increased risk of having a PPGL compared to patients without CCHD (adjusted odds ratio 6.0). Non-
cyanotic CHD did not confer an increased risk of PPGL development.

62
Given the importance of hypoxic signalling in PPGL development, it has been suggested that the
prolonged and severe hypoxia in CCHD is an aetiological factor. For example, in the previously
mentioned international series the median duration of cyanosis prior to PPGL diagnosis was 20 years
with a mean oxygen saturation of 87.4% (Opotowsky et al. 2015). However, hypoxic signalling has
not been directly examined in these tumours.
2.3.2.1.3 Chronic lung disease
Studies by the US National Toxicology Program have identified a wide range of inhaled toxins as risk
factors for phaeochromocytoma development in rodents. Implicated agents include talc, nickel
oxide, nickel subsulfide and cobalt sulphate (National Toxicology Progam 1993, 1996a, b, 1998).
When these studies are considered together, there is a strong correlation between lung pathology,
specifically inflammation and fibrosis, and the development of phaeochromocytoma in rats (Ozaki et
al. 2002), suggesting that the mechanism is hypoxia-mediated due to toxin-induced lung disease
rather than due to specific toxic or carcinogenic effects. There is no evidence in humans that any of
these toxins result in phaeochromocytoma.
Autopsy studies suggest that carotid body hyperplasia occurs in individuals with chronic hypoxia due
to a range of chronic pulmonary conditions including cystic fibrosis and chronic obstructive
pulmonary disease (Lack 1977, 1978). There are no data suggesting that PPGLs are more prevalent in
these patient groups however.
2.3.2.2 Germline genetic mutations
A heritable role in PPGL development had long been suspected (Marchand 1883) and formed part of
the textbook ‘rule of tens’, in which 10% of PPGLs were thought to be hereditary (Warrell et al.
2003). This original estimation has proved to be an underestimate and germline mutations in PPGL
predisposition genes are known to occur in up to 40% of tumours (Dahia 2014; Favier et al. 2015).
Indeed, Fränkel’s original patient, who was 18 and had bilateral phaeochromocytomas almost
certainly had multiple endocrine neoplasia type 2 (MEN2) based on genetic analysis of their
descendants (Fränkel 1886; Neumann et al. 2007).
Advances in genetic technology and understanding over the past 30 years have resulted in the
identification of an ever expanding list of PPGL predisposition genes, which currently number 16
(Table 2.1, Figure 2.4). These genes have traditionally been classified according to their function and
role in PPGL pathogenesis into two groups, or clusters. Cluster 1 is characterised by pseudohypoxic

63
signalling, whilst in cluster 2 tumours kinase signalling is activated (Figure 2.5). A recent
comprehensive molecular characterisation of PPGLs from the Cancer Genome Atlas has affirmed this
taxonomy and identified two additional distinct groups of PPGLs termed ‘Wnt-altered’ and ‘cortical
admixture’ (Fishbein et al. 2017).
In this section, we will consider genetic syndromes and germline mutations associated with PPGL
development. The role of somatic mutations will be discussed later in the chapter.
2.3.2.2.1 Cluster 1
Under normal cellular conditions, the transcriptional activity of the HIFs are repressed through the
constant targeting of their alpha subunit (HIFα) for proteosomal degradation by the protein von
Hippel-Lindau (pVHL)-containing E3 ubiquitin ligase complex (Kibel et al. 1995) (Figure 2.5). pVHL
forms the recognition component of this complex and hydroxylation at specific proline residues is
required to allow HIFα binding. This HIF hydroxylation is catalysed by HIF-prolyl hydroxylases (HIF-
PHDs or PHDs) in a process that requires oxygen (Maxwell et al. 1999; Cockman et al. 2000; Ivan et
al. 2001; Jaakkola et al. 2001). Therefore, when oxygen is limited, HIFα hydroxylation is reduced with
its resultant escape from the degradation pathway. Persistent HIFα is then available to dimerise with
its constitutively expressed partner HIF1β. This HIFα-HIF1β complex is imported into the nucleus
where it binds to specific hypoxia response elements (HREs) on DNA with resultant transcriptional
activation (Wenger et al. 2005; Schodel et al. 2011). HIF is a master transcription factor resulting in
the expression of hundreds of genes involved in diverse cellular processes including proliferation,
apoptosis, differentiation, energy metabolism, growth factor production and angiogenesis (Elvidge
et al. 2006; Hu et al. 2006; Choi et al. 2008; Ortiz-Barahona et al. 2010). Hypoxic signalling therefore
plays an important physiological role in embryonic development and adaptation to altitude; its
inappropriate activation, however, contributes to the pathophysiology of many disease states
including cancer (Pouysségur et al. 2006; Bertout et al. 2008; Kaelin 2008).
Activation of hypoxic signalling in the presence of oxygen, so called pseudohypoxia, is the defining
feature of cluster 1 PPGLs. This situation arises either from loss of function of pVHL or HIF-PHDs,
which can occur either directly or indirectly (Figure 2.5). Cluster 1 genes can be further subdivided
into two groups based on differential tumour methylation profiling, which is present in type 1a
(SDHx, FH, MDH2) and absent in type 1b (VHL, HIF2α, HIF-PHD) (Letouzé et al. 2013).
The associated clinical characteristics of cluster 1 tumours are diverse and gene specific, although
elevated normetanephrine (NMN) is characteristic (Eisenhofer et al. 2011).

64
2.3.2.2.1.1 Succinate dehydrogenase
The succinate dehydrogenase (SDH) complex consists of four subunits A, B, C and D. The hydrophilic
A and B subunits form the catalytic core of the enzyme and contain the substrate binding site for
succinate whilst the hydrophobic C and D subunits anchor the complex to the inner mitochondrial
membrane as mitochondrial complex II. SDH is part of both the tricarboxylic acid (TCA) cycle and the
electron transport chain (ETC). It catalyses the succinate to fumarate step of the TCA cycle and
transfers electrons to the ubiquinone pool. Disruption of SDH function results in succinate
accumulation, which inhibits HIF-PHDs, with resultant persistence of HIFα and activation of
pseudohypoxic signalling (Selak et al. 2005). Succinate accumulation also results in inhibition of
additional 2-oxoglutarate-dependent enzymes, including histone and DNA demethylases (Smith et
al. 2007), leading to epigenetic modification through DNA hypermethylation. Loss of function of SDH
results in altered methylation of specific genes and is associated with increased cell migration and
EMT (Letouzé et al. 2013; Hoekstra et al. 2015). Disrupting the ETC results in superoxide generation
which also contributes to HIF-PHD inhibition (Gerald et al. 2004), although is insufficient to be
genotoxic in its own right (Smith et al. 2007).
Mutations in any of the four genes encoding the SDH subunits (SDHx; SDHA, SDHB, SDHC, SDHD) or
its associated assembly factor (SDHAF2) can result in familial paraganglioma syndromes (PGL1-5;
Table 2.1). Inheritance occurs in an autosomal dominant fashion with variable penetrance and
maternal imprinting in the cases of SDHD and SDHAF2. In addition to PPGLs, SDHx mutations can be
associated with other neoplasia: RCCs (Dwight et al. 2013), gastrointestinal stromal tumours (GISTs)
(Gill et al. 2010; Janeway et al. 2011) and pituitary adenomas (López-Jiménez et al. 2008; Xekouki et
al. 2012; Dwight et al. 2013; Papathomas et al. 2014). SDHx mutations are also responsible for some
cases of Carney-Stratakis syndrome (McWhinney et al. 2007) and polymorphisms have been related
to Cowden-like syndrome, although this association requires further elucidation (Ni et al. 2008).
Despite their shared pathological mechanism, the clinical spectrum of SDHx-related PPGLs is varied,
particularly tumour location and metastatic risk, and is further discussed with reference to each
constituent gene below. Functional SDHx PPGLS are, like all cluster 1 tumours, predominantly NMN
secreting with the addition of 3-methoxytyramine (3-MT) (Eisenhofer et al. 2011).

65
2.3.2.2.1.1.1 Familial paragangliomas type 1 (SDHD)
SDHD, the gene responsible for PGL1 (OMIM 16800), was the first component of the SDH complex to
be associated with PPGL development (Baysal et al. 2000). The syndrome has a high prevalence of
HNPGLs (Baysal et al. 2000; Neumann et al. 2004; Ricketts et al. 2010) and also features sympathetic
PGLs (Gimm et al. 2000) and phaeochromocytomas (Astuti et al. 2001a). It is maternally imprinted,
resulting in a paternal pattern of inheritance (Yeap et al. 2011), and malignancy is uncommon. SDHD
mutations can also result in development of RCCs (Ricketts et al. 2010) and rarely pituitary
adenomas (Xekouki et al. 2012; Papathomas et al. 2014).
2.3.2.2.1.1.2 Familial paragangliomas type 2 (SDHAF2)
PGL2 (OMIM 601650) consists almost exclusively of HNPGL. Described clinically in 1982 (van Baars et
al. 1982), SDHAF2 was identified as the responsible gene in 2009 (Hao et al. 2009). SDHAF2 is
necessary for flavination and therefore function of the SDH complex (Hao et al. 2009) and is
maternally imprinted, resulting in a paternal pattern of inheritance with high penetrance (~75%)
(Kunst et al. 2011).
2.3.2.2.1.1.3 Familial paragangliomas type 3 (SDHC)
PGL3 (OMIM 605373), like PGL2, consists almost entirely of HNPGL in addition to some sympathetic
PGLs and results from mutations in SDHC (Niemann & Müller 2000; Schiavi et al. 2005; Andrews et
al. 2018).
2.3.2.2.1.1.4 Familial paragangliomas type 4 (SDHB)
Mutations in SDHB result in PGL4 (OMIM 115310), which features phaeochromocytomas and PGLs
(sympathetic and HNPGL) (Astuti et al. 2001b; Timmers et al. 2007a; Ricketts et al. 2010). Metastatic
disease is seen in approximately one third of patients, making SDHB mutations the greatest risk
factor for malignancy in PPGLs (Brouwers et al. 2006; Amar et al. 2007; Timmers et al. 2007a), which
is putatively linked to the degree of hypermethylation seen in these tumours (Letouzé et al. 2013).
Penetrance is around 40% by age 40 (Schiavi et al. 2010). Uncommonly, SDHB mutations can be
associated with RCC, GISTs and pituitary adenomas (Benn et al. 2006; Ricketts et al. 2010; Xekouki et
al. 2012; Dénes et al. 2015). SDHB expression can be easily and routinely assessed in tumours by
immunohistochemistry (IHC) with lack of expression being seen with mutations in any subunit of the
SDH complex (van Nederveen et al. 2009). This can be used to help triage genetic analysis in
resource limited settings.

66
2.3.2.2.1.1.5 Familial paragangliomas type 5 (SDHA)
SDHA was identified as the final SDHx PPGL predisposition gene in 2010 (PGL5; OMIM 614165)
(Burnichon et al. 2010). It is associated with phaeochromocytomas and PGLs as well as GIST and
pituitary adenomas. Penetrance is low (10% by age 70) and therefore most disease appears sporadic
(Korpershoek et al. 2011; van der Tuin et al. 2018). Similarly to SDHB, lack of tumoural SDHA
expression can be identified by IHC (Korpershoek et al. 2011).
2.3.2.2.1.2 Fumarate hydratase
Fumarate hydratase (FH) follows SDH as the next enzyme in the TCA cycle and catalyses the
conversion of fumarate to malate (Figure 2.5). Loss of FH function results in accumulation of the TCA
cycle intermediate fumarate which, like succinate, inhibits 2-oxoglutarate-dependent enzymes
including HIF-PHDs (Isaacs et al. 2005). Indeed, FH was first identified as a PPGL predisposition gene
in an SDH wildtype tumour that clustered with SDHx mutant tumours (Clark et al. 2014). Consistent
with this original report, FH deficient PPGLs share the same epigenetic dysregulation (Castro-Vega et
al. 2014; Hoekstra et al. 2015) and EMT (Sciacovelli et al. 2016) phenotypes as SDHB-deficient
tumours. Likewise, FH IHC can be used diagnostically (Udager et al. 2018).
FH is a rare cause of PPGLs, but phaeochromocytomas, sympathetic PGLs and HNPGLs have all been
described (Castro-Vega et al. 2014; Clark et al. 2014). Mutations in FH also give rise to hereditary
leiomyomatosis and renal cell cancer (HLRCC; OMIM 150800), which is characterised by cutaneous
and uterine leiomyomas and type 2 papillary RCCs. PPGL prevalence in HLRCC is low (2/34 patients in
the largest series published to date) and it remains unclear what drives tissue-specific
tumourigenesis in this condition (Muller et al. 2017).
2.3.2.2.1.3 Malate dehydrogenase 2
Malate dehydrogenase (MDH) is another TCA cycle gene implicated in PPGL predisposition (Figure
2.5). The index case had multiple malignant PGLs and a germline MDH2 mutation (Cascón et al.
2015). Loss of heterozygosity (LOH) was observed in four tumours indicating biallelic inactivation and
was associated with reduced levels of MDH2 protein and activity and a methylation phenotype
similar to SDH-deficient PPGLs (Cascón et al. 2015). The upstream intermediaries malate and
fumarate accumulate following MDH2 knockdown (Cascón et al. 2015) and result in inhibition of 2-
oxoglutarate-dependent enzymes (Dalgard et al. 2004; Hewitson et al. 2007; Koivunen et al. 2007).
Further cases have been reported and are associated with a noradrenergic phenotype, although a
67
more complete understanding of MDH2 PPGL clinical characteristics is currently limited (Calsina et al.
2018).
2.3.2.2.1.4 von Hippel-Lindau disease
Von Hippel-Lindau disease (VHL; OMIM 193300) is a dominantly inherited cancer syndrome
characterised by haemangioblastomas (HB) of the central nervous system (CNS), retinal
haemangiomas, renal cysts and ccRCC, pancreatic cysts and pancreatic NETs and endolymphatic sac
tumours (ELSTs) in addition to PPGLs. The syndrome was coined ‘VHL’ in 1964 (Melmon & Rosen
1964) and is named after the German ophthalmologist Eugen von Hippel who described the retinal
lesions of the condition (von Hippel 1904) and the Swedish pathologist Arvind Lindau who
associated these with CNS HBs (Lindau 1927). Phaeochromocytomas are commonly bilateral and
have a low rate of malignancy. Penetrance is almost complete by 65 years of age.
VHL is classified according to the range of manifestations individuals develop. In type 1, PPGLs are
absent, but other visceral manifestations may exist (Neumann & Wiestler 1991). In type 2, ccRCC are
a feature of type 2B (Hoffman et al. 2001), but not of type 2A (Brauch et al. 1995). In type 2C, PPGLs
are the only manifestations of the condition (McNeill et al. 2009).
Following the identification of the VHL gene (Latif et al. 1993), it became apparent that this clinical
variation resulted from a close genotype-phenotype relationship in which type 1 disease resulted
from deletions and truncating mutations whilst missense mutations were responsible for type 2
disease (Zbar et al. 1996; Clifford et al. 2001; Hoffman et al. 2001). Tumour pathogenesis results
from inappropriate activation of HIF signalling as previously described. The situation is more
complicated, however, in type 2C disease in which mutant forms of pVHL retain the ability to
degrade HIF (Clifford et al. 2001; Hoffman et al. 2001). This finding suggests that alternative, HIF-
independent, functions of VHL must be at least partly responsible for PPGL development. pVHL plays
a role in directly modulating apoptosis, through interactions with p53 and the nuclear factor κΒ and
Jun pathways (Lee et al. 2005; Roe et al. 2006; Yang et al. 2007), and senescence (Young et al. 2008).
In addition to its role in primary cilia maintenance (discussed in Chapter 1), pVHL is involved in cell-
cell adhesion through regulation of β1 integrin adhesions (Esteban-Barragán et al. 2002) and
extracellular matrix formation via its role in fibronectin assembly (Ohh et al. 1998). Mutant pVHL
displays defective binding to fibronectin and collagen IV (Bishop et al. 2004; Tang et al. 2006).

68
2.3.2.2.1.5 Prolyl hydroxylase
Germline mutations in both PHD1 (Yang et al. 2015) and PHD2 (Ladroue et al. 2008; Yang et al. 2015)
are rare, but identified, causes of PPGLs in combination with congenital eythrocytosis.
2.3.2.2.1.6 Hypoxia Inducible Factor 2α
A germline gain of function mutation in HIF2A has been described in a single patient with a
multifocal secretory PPGL and polycythaemia (Lorenzo et al. 2013). Somatic mutations in the same
gene have also been found in PPGLs in combination with polycythaemia and somatostatinomas and
have been termed the ‘Pacak-Zhuang syndrome’ (Zhuang et al. 2012). HIF2A is the only cluster 1
PPGL predisposition gene in which a gain, rather than loss, of function mutation is responsible.
2.3.2.2.2 Cluster 2
Cluster 2 PPGLs are characterised by abnormal activation of a range of kinase signalling cascades,
which collectively result in alterations in cell growth, proliferation and survival (Klesse & Parada
1998; Dasgupta et al. 2003; Lee et al. 2005) (Figure 2.5).
The central pathways involved are the phosphatidylinositol-3-kinase/Akt/mammalian target of
rapamycin (PI3K/Akt/mTOR) and Ras/Raf/mitogen-activated protein kinase kinase/extracellular
signal-regulated kinase (Ras/Raf/MEK/ERK). They are activated through mutations either in genes at
receptor level (e.g. RET) or that modify the downstream intracellular cascade (e.g. NF1, MAX,
TMEM127). Specific features are discussed in relation to each gene below.
Phaeochromocytomas dominate in cluster 2 and the secretory profile, in contrast to cluster 1, is
predominantly of increased metanephrine (MN) (Eisenhofer et al. 2001, 2011) with the exception of
Myc-associated factor X (MAX)-associated tumours. Malignancy is less likely than with cluster 1
(Table 2.1).
2.3.2.2.2.1 Multiple Endocrine Neoplasia Type 2 (MEN2)
MEN2A (OMIM 171400) and 2B (162300) are syndromes that are inherited in an autosomal
dominant manner and result from gain-of-function mutations in the rearranged during transfection
(RET) proto-oncogene on chromosome 10q11, which is also responsible for Familial Medullary
Thyroid Carcinoma (OMIM 155240). MEN2A and 2B consist of medullary thyroid cancer (MTC), PPGL
and hyperparathyroidism in addition to Marfanoid features and mucosal neuromas in MEN2B (also
previously known as MEN3).

69
PPGLs are almost entirely adrenal phaeochromocytomas with a high rate of bilateral disease and a
low risk of malignancy (Pacak et al. 2009). The penetrance of PPGLs in MEN2 is around 50%
compared to almost 100% for MTC, which tends to occur many decades before the diagnosis of
PPGL (Gagel et al. 1988; Ponder et al. 1988). First described as a distinct entity in 1961 as ‘Sipple’s
syndrome’ (Sipple 1961), mutations in RET were identified as the cause in 1993 making it one of the
first PPGL syndromes to have an established genetic basis (Mulligan et al. 1993). There is a close
genotype-phenotype correlation in MEN2; specific mutations are associated with risk of PPGL
development and of MTC aggressiveness and are therefore used to govern the timing of prophylactic
thyroidectomy (Brandi et al. 2001; Mucha et al. 2017).
The RET protein is a tyrosine kinase receptor (TKR) for the glial cell line-derived neutrophic factor
family of ligands. Ligand binding results in recruitment of a co-receptor and subsequent
heterodimerisation with a second RET molecule. Autophosphorylation of specific tyrosine residues
within the tyrosine kinase domain occurs with resultant activation in downstream signalling
cascades, which include the oncogenic MAPK/ERK and PI3K/Akt pathways (Richardson et al. 2006).
2.3.2.2.2.2 Neurofibromatosis type 1 (NF1)
Neurofibromatosis type 1 (NF1, OMIM 162200) is a neurocutaneous syndrome caused by mutations
in the neurofibromin 1 (NF1) gene. NF1 has an autosomal dominant pattern of inheritance and
features café au lait spots, Lisch nodules, neurofibromas and optic pathway gliomas. Originally
described by von Recklinghausen in 1882 (von Recklinghausen 1882), its association with
phaeochromocytomas was first established in 1910 (Suzuki 1910). PPGLs are relatively uncommon in
NF1, occurring in less than 5% of patients (Gutmann et al. 1997; Gruber et al. 2017). Disease is
almost exclusively adrenal with bilateral disease in up to 30% of cases and metastatic disease in up
to 10% (Bausch et al. 2006, 2007; Gruber et al. 2017). Germline mutations in NF1 account for only
3% of PPGLs (Bausch et al. 2006), but it is the most commonly somatically mutated gene (20.8%) in
PPGLs (Evenepoel et al. 2017).
Identified in 1990 (Cawthon et al. 1990), the NF1 gene contains 62 exons meaning clinical rather
than genetic diagnosis of NF1 predominates the literature. The NF1 gene product, neurofibromin,
contains a GTPase-activating protein (GAP) domain which interacts with and negatively regulates the
GTPase Ras (Martin et al. 1990). Mutations in NF1 therefore result in aberrant activation of the Ras
signalling cascade, which includes the MEK/MAPK/ERK and PI3K/Akt/mTOR signalling pathways.
Collectively these pathways play crucial roles in the control of cellular proliferation and apoptosis
(Klesse & Parada 1998; Dasgupta et al. 2003; Lee et al. 2005).
70
The phaeochromocytoma-derived cell lines MPC (‘mouse phaeochromocytoma’) and MTT (‘mouse
tumour tissue’) were generated from heterozygous Nf1 knockout mice (Powers et al. 2000;
Martiniova et al. 2009).
2.3.2.2.2.3 Transmembrane protein 127 (TMEM127)
Transmembrane protein 127 (TMEM127) was identified as a PPGL predisposition gene (OMIM
171300) in 2010 through interrogation of familial phaeochromocytoma kindreds without a known
genetic cause (Qin et al. 2010). It is a classical tumour suppressor gene with LOH observed in
associated tumours and follows an autosomal dominant pattern of inheritance with incomplete
penetrance (32% by age 65 years) (Qin et al. 2010; Toledo et al. 2015). It accounts for approximately
1-2% of PPGLs without a previously identified genetic cause (Abermil et al. 2012; Bausch et al. 2017).
Disease is almost entirely confined to the adrenals with bilateral and multifocal disease in 50% of
affected individuals (Yao et al. 2010; Toledo et al. 2015), although PGLs have also been reported
(Neumann et al. 2011). Metastatic disease has been observed in up to 10% of patients (Bausch et al.
2017). Germline mutations also predispose to renal cancer with confirmatory LOH data (Qin et al.
2014; Hernandez et al. 2015). Other organ tumours (colonic, pancreatic, melanoma, parathyroid
adenoma, acute myeloid leukaemia) have also been reported in association with TMEM127,
however experimental evidence suggesting causality is lacking (Bausch et al. 2017).
The transcriptome of TMEM127-associated PPGLs are similar to that seen in NF1-associated tumours
with enrichment in various kinase signalling pathways. TMEM127 is a negative regulator of mTOR
complex 1 (mTORC1) (Figure 2.5) and its knockdown resulted in increased mTOR signalling and
cellular proliferation (Qin et al. 2010).
2.3.2.2.2.4 Myc-associated factor X (MAX)
MAX is a transcription factor that contains the basic helix-loop-helix and leucine zipper motif which
heterodimerizes with its partners Myc (Landschulz et al. 1988; Murre et al. 1989), Mad (MAX
dimerisation protein 1; MXD1) (Ayer et al. 1993) and MXI1 (MAX-interacting protein 1) (Zervos et al.
1993). These complexes bind and compete for specific ‘E-box Myc site’ DNA sequences within the
promoter regions of a multitude of genes (Blackwell et al. 1990, 1993). The Myc-MAX complex is a
transcriptional activator (Kerkhoff et al. 1991; Amin et al. 1993), which promotes cellular
transformation (Amati et al. 1993a), cell cycle progression (Amati et al. 1993b) and apoptosis
(Askew et al. 1991). MAD-MAX and MXI1-MAX are transcriptional repressors (Ayer et al. 1993;
71
Zervos et al. 1993) and antagonise Myc-dependent transcription through competition for MAX,
which is a central component in the regulation of this transcription system.
The first evidence that MAX was implicated in PPGL development was the identification that the rat
phaeochromocytoma-derived PC12 cell line possessed mutant forms of Max that lacked the
dimerisation domain and were thus incapable of repressing transcription from an E-box element
(Hopewell & Ziff 1995). Reintroduction of functional MAX resulted in repression of E-box-dependent
transcription and reduced proliferative rate (Hopewell & Ziff 1995).
Despite this observation, it was not for another 16 years until MAX was identified as a PPGL
predisposition gene in humans (OMIM 154950) (Comino-Méndez et al. 2011). Pathogenesis was
confirmed through demonstration of a lack of full length protein and LOH within tumours.
Inheritance is autosomal dominant with paternal transmission of disease (Comino-Méndez et al.
2011) and a 73% penetrance rate by the age of 40 (Bausch et al. 2017). MAX mutations account for
around 1% of otherwise genetically negative PPGLs (Burnichon et al. 2012; Bausch et al. 2017).
Disease is almost exclusively adrenal with a very high proportion of bilateral or multifocal disease
and a malignancy rate of approximately 10% (Burnichon et al. 2012; Bausch et al. 2017). Unlike other
cluster 2 genes, normetanephrine is frequently elevated (Burnichon et al. 2012). Single cases have
implicated MAX mutations in the pathogenesis of renal cell carcinomas (Casey et al. 2017) and renal
oncocytomas (Korpershoek et al. 2016) in combination with PPGLs.
2.3.2.2.2.5 Kinesin family member 1B
During normal development, sympathetic neuronal precursor cells undergo apoptosis when growth
factors become limiting in a process that is dependent on c-Jun (Estus et al. 1994), HIF-PHD3 (Lee et
al. 2005) and the beta splice variant of kinesin family member 1B (KIF1Bβ) (Schlisio et al. 2008)
(Figure 2.5). Insertion of HIF-PHD3 into a variety of neuronal cell lines (including PC12) results in
apoptotic cell death, which is prevented by knockdown of KIF1Bβ resulting in cells resistant to the
apoptotic cue of growth factor withdrawal (Schlisio et al. 2008). In addition to its pro-apoptotic
function, KIF1B is a molecular motor function and transports synaptic vesicles and mitochondria
(Nangaku et al. 1994; Zhao et al. 2001).
Pathogenic mutations in KIF1B (OMIM 605995) have been identified in five individuals from a single
kindred with phaeochromocytomas, neuroblastomas and other non-neuronal tumours (a
leiomyosarcoma and lung adenocarcinoma) (Schlisio et al. 2008; Yeh et al. 2008). Transcriptome
analysis of the phaeochromocytomas revealed similarity to NF1 and RET associated tumours,
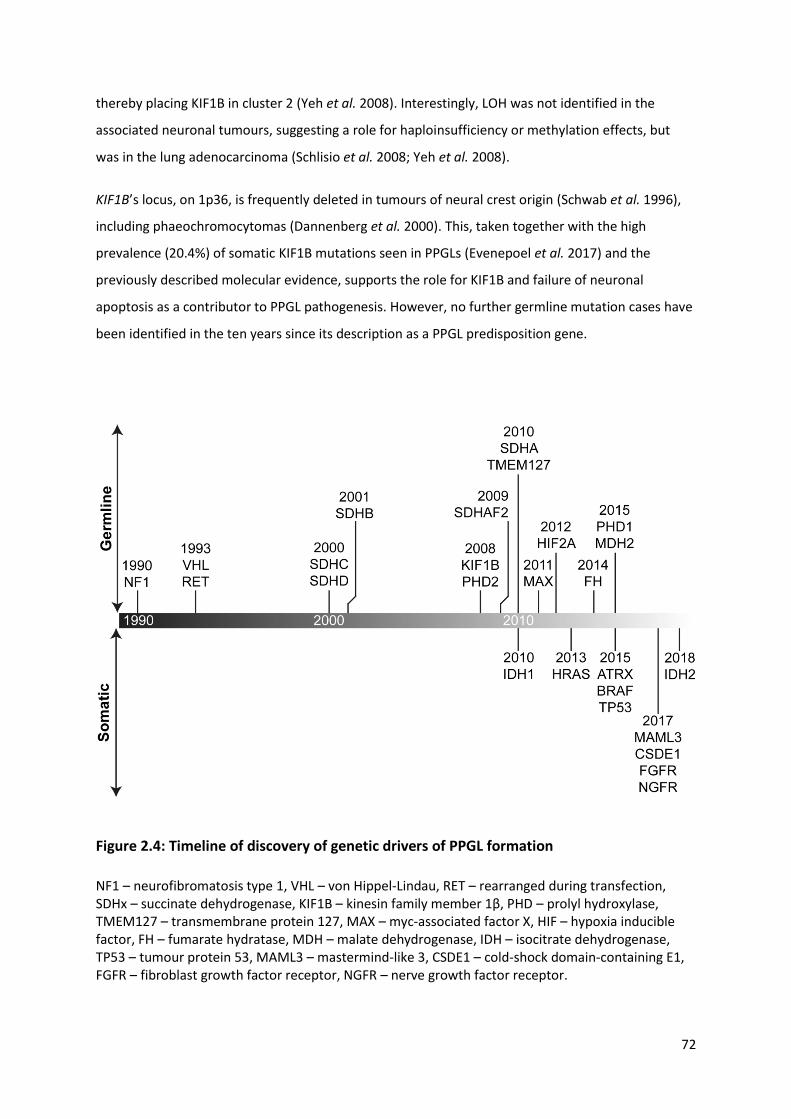
72
thereby placing KIF1B in cluster 2 (Yeh et al. 2008). Interestingly, LOH was not identified in the
associated neuronal tumours, suggesting a role for haploinsufficiency or methylation effects, but
was in the lung adenocarcinoma (Schlisio et al. 2008; Yeh et al. 2008).
KIF1B’s locus, on 1p36, is frequently deleted in tumours of neural crest origin (Schwab et al. 1996),
including phaeochromocytomas (Dannenberg et al. 2000). This, taken together with the high
prevalence (20.4%) of somatic KIF1B mutations seen in PPGLs (Evenepoel et al. 2017) and the
previously described molecular evidence, supports the role for KIF1B and failure of neuronal
apoptosis as a contributor to PPGL pathogenesis. However, no further germline mutation cases have
been identified in the ten years since its description as a PPGL predisposition gene.
Figure 2.4: Timeline of discovery of genetic drivers of PPGL formation
NF1 – neurofibromatosis type 1, VHL – von Hippel-Lindau, RET – rearranged during transfection, SDHx – succinate dehydrogenase, KIF1B – kinesin family member 1β, PHD – prolyl hydroxylase, TMEM127 – transmembrane protein 127, MAX – myc-associated factor X, HIF – hypoxia inducible factor, FH – fumarate hydratase, MDH – malate dehydrogenase, IDH – isocitrate dehydrogenase, TP53 – tumour protein 53, MAML3 – mastermind-like 3, CSDE1 – cold-shock domain-containing E1, FGFR – fibroblast growth factor receptor, NGFR – nerve growth factor receptor.

73
Table 2.1: Summary of genes in which germline mutations result in PPGL predisposition
(overleaf)
PGL – familial paraganglioma syndrome, HLRCC – hereditary leiomyomatosis and renal cell
carcinoma, VHL – von Hippel-Lindau, MEN2 – multiple endocrine neoplasia type 2, NF1 –
neurofibromatosis type 1, SDH – succinate dehydrogenase, FH – fumarate hydratase, MDH – malate
dehydrogenase, PHD – prolyl hydroxylase, HIF – hypoxia inducible factor, RET – rearranged during
transfection, TMEM – transmembrane protein, MAX – Myc-associated factor X, KIF – kinesin family
member, phaeo – phaeochromocytoma, TA – thoraco-abdominal, PGL – paraganglioma, HNPGL –
head and neck PGL, RCC – renal cell carcinoma, GIST – gastrointestinal stromal tumour, PA –
pituitary adenoma, HB – haemangioblastoma, ccRCC – clear cell RCC, pNET – pancreatic
neuroendocrine tumour, ELST – endolymphatic sac tumour, MTC – medullary thyroid cancer, PHPTH
– primary hyperparathyroidism.
†Refers to the year the gene was identified as a cause of PPGL development.

74
Cluster Syndrome Gene Locus Year identified†
PPGL Associated clinical features
Phaeo TA PGL HNPGL Behaviour
1a PGL1 SDHD 11q23 2000 + + +++ Maternal imprinting, multifocal, rarely malignant
RCC, GIST, PA
PGL 2 SDHAF2 11q13 2009 - - +++ Maternal imprinting, ~75% penetrance
Nil
PGL3 SDHC 1q23 2000 - + +++ - GIST
PGL4 SDHB 1p36 2001 + ++ + ~40% penetrance ~30% malignant
RCC, GIST, PA
PGL 5 SDHA 5p15 2010 + + + Low penetrance GIST, PA
HLRCC FH 1q43 2014 ++ + + Malignancy similar to SDHB
Cutaneous & uterine leiomyomas, RCC
Nil MDH2 7q11 2015 + + - - Nil
1b VHL VHL 3p25 1993 +++ + - Low malignancy rate HB, ccRCC, pNET, ELST
Nil PHD1 19q13 2015 - + - - Polycythaemia
Nil PHD2 1q42 2008 - + - - Polycythaemia
Nil HIF2A 2p21 2012 - ++ - - Somatostatinoma, polycythaemia
2 MEN2 RET 10q11 1993 +++ - - 50-80% bilateral Low malignancy rate
2A: MTC, PHPTH 2B: MTC, Marfanoid habitus, mucosal ganglioneuromas
NF1 NF1 17q11 1990 +++ + - 30% bilateral Low malignancy rate MPC/MTT cells
Neurofibromas, café au lait spots, Lisch nodules, optic pathway gliomas
Nil TMEM127 2q11 2010 +++ + + 10% malignant RCC
Nil MAX 14q23 2011 +++ + - 10% malignant, NMN PC12 cells
RCC, renal oncocytoma
Nil KIF1B 1p36 2008 +++ - - Single kindred only Leiomyosarcoma, lung adenocarcinoma
Table 2.1: Summary of genes in which germline mutations result in PPGL predisposition (legend on previous page)
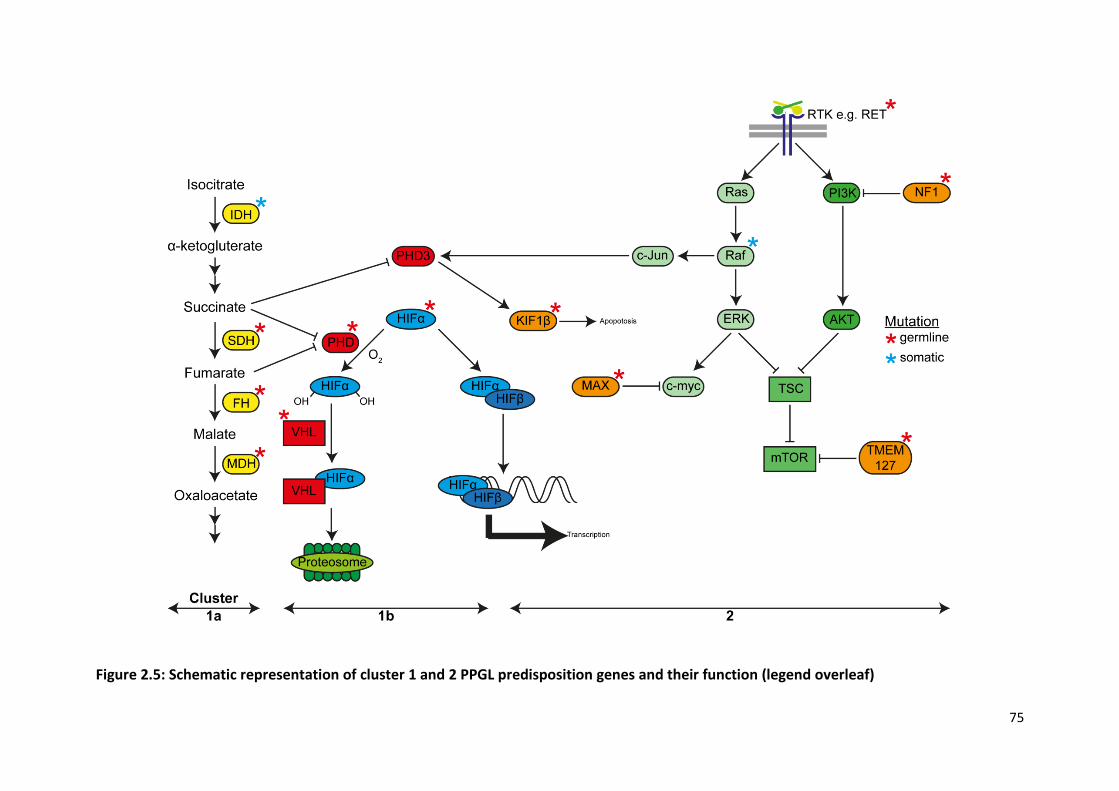
75
Figure 2.5: Schematic representation of cluster 1 and 2 PPGL predisposition genes and their function (legend overleaf)

76
Figure 2.5: Schematic representation of cluster 1 and 2 PPGL predisposition genes and
their function (figure overleaf)
IDH – isocitrate dehydrogenase, SDH – succinate dehydrogenase, FH – fumarate hydratase, MDH –
malate dehydrogenase, PHD – prolyl hydroxylase, HIF – hypoxia inducible factor, VHL – von Hippel-
Lindau, KIF1β – kinesin family member 1β, MAX – myc-associated factor X, ERK – extracellular signal-
regulated kinase, TSC – tuberous sclerosis complex, mTOR – mammalian target of rapamycin, NF1 –
neurofibromatosis type 1, PI3K – phosphatidylinositol-3-kinase, TMEM127 – transmembrane protein
127.
Red stars indicated genes in which germline mutations predispose to PPGL formation. Blue stars
indicate genes which have been found to be mutated in PPGLs, but not the germline.
2.3.2.4 Somatic mutations
The molecular pathogenic mechanisms at the heart of PPGL development have been discussed
above and centre on pseudohypoxic signalling and activation of RTK pathways (Figure 2.5). Two
additional subtypes that have recently been characterised through a comprehensive multi-modal
process are ‘Wnt-altered’ and ‘cortical admixture’ and highlight the role of somatic mutations in
PPGLs (Fishbein et al. 2017). Taken together, germline and somatic mutations in identified driver
genes occur in upwards of 80% of PPGLs (Burnichon et al. 2011; Comino-Méndez et al. 2013; Crona
et al. 2013; Fishbein et al. 2015, 2017). Somatic mutations occur in the same genes that germline
mutations occur in (with the notable exception of SDHx) as well as in a number of additional genes.
Wnt-altered PPGLs are distinctive in that activation of the Wnt and Hh pathways is prominent and
the tumours are associated with novel somatic mutations and gene fusion products. Cold shock
domain-containing E1 (CSDE1) modulates a number of key cellular processes including translation
initiation, RNA stability, apoptosis, cellular differentiation and neuronal development (Mihailovich et
al. 2010; Kobayashi et al. 2013) and is somatically mutated in Wnt-altered PPGLs (Fishbein et al.
2017). Tumoural fusion genes resulting in upregulation of mastermind-like transcriptional
coactivator 3 (MAML3) are also found in this subtype and result in a distinct methylation profile and
overexpression of Wnt and Hh target genes. The cortical admixture subtype is represented by an
overexpression of adrenal cortical markers perhaps implying impure tumour sampling, although it is
not merely defined by this and has a PPGL, rather than cortical, DNA methylation profile (Fishbein et
al. 2017).

77
Somatic mutations in PPGLs occur in genes within both the cluster 1 and 2 pathways in which
germline mutations have not been identified. Isocitrate dehydrogenase (IDH) is a TCA cycle enzyme,
loss of function of which results in HIF-PHD inhibition (Dalgard et al. 2004; Hewitson et al. 2007;
Koivunen et al. 2007). Somatic mutations in both IDH1 (Gaal et al. 2010; Fishbein et al. 2015;
Remacha et al. 2017) and IDH2 (Richter et al. 2019) have been identified in PPGLs with the same
clinical phenotype and methylation profile as SDHx/FH associated tumours. Somatic mutations also
result in activation of the cluster 2 Ras/Raf/MEK/ERK pathway. H-RAS is one of the most frequently
somatically mutated genes in PPGLs (Crona et al. 2013), whilst mutations in BRAF have also been
identified (Luchetti et al. 2015; Fishbein et al. 2017).
Somatic mutations also occur in genes outside of the confines of the established PPGL predisposition
clusters. Mutations in alpha thalassemia/mental retardation syndrome (ATRX) result in alternative
lengthening of telomeres with resultant genome instability and alterations in the DNA damage
response (Lovejoy et al. 2012; Fishbein et al. 2015). In addition to being common (they occur in over
10% of PPGLs), ATRX mutations are associated with clinically aggressive behaviour (Fishbein et al.
2015). Other notable genes that undergo somatic mutation in PPGLs are the cell cycle genes: tumour
protein 53 (TP53) (Luchetti et al. 2015; Fishbein et al. 2017), cyclin dependent kinase inhibitor 2C
(CDKN2C) (van Veelen et al. 2009) and the RTKs fibroblast growth factor receptor 1 (FGFR1) (Fishbein
et al. 2017; Welander et al. 2018) and nerve growth factor (NGFR) (Fishbein et al. 2017).
2.4 Investigations
The sensitivity and specificity of the available diagnostic tests for PPGLs are generally very good and
the largest hurdle to diagnosis remains lack of its consideration in the differential. Investigation
should be prompted in individuals with suggestive signs and symptoms (particularly if episodic or
provoked by medications associated with crisis precipitation), an adrenal incidentaloma, a personal
history of PPGL or a known or suspected hereditary predisposition (Lenders et al. 2014).
2.4.1 Biochemistry
Once suspected, diagnosing PPGL relies on the demonstration of elevated circulating catecholamines
or their metabolites (Figure 2.2).
Historical testing for VMA, catecholamines and other metabolites has been replaced by
metanephrine assessment, which offers increased sensitivity and specificity (Manu & Runge 1984)
due to their constant, rather than episodic, tumoural release (Eisenhofer et al. 1998). Assessment of

78
metanephrines in plasma compared to urine appears to confer slightly greater sensitivity (Lenders et
al. 1995) and specificity (Lenders et al. 2002), although either method is deemed acceptable in
consensus guidelines (Lenders et al. 2014). The terminology associated with metanephrine
measurement can be confusing: ‘total metanephrines’ refers both to the sum of the individually
fractionated metanephrines, metanephrine and normetanephrine, as well as the combination of
free and conjugated metanephrines. Free circulating metanephrines are sulphate-conjugated by
sulfotransferase 1A3/1A4 (SULT1A3) (Dajani et al. 1999), predominantly in the gastrointestinal tract
(Eisenhofer et al. 1996), and represent only a small proportion of measured ‘total metanephrines’.
Metanephrine measurement should be by liquid chromatography with electrochemical detection or
with tandem mass spectrometry and not immunoassay due to their reduced accuracy and increased
variability (Mullins et al. 2012). For plasma assessment, blood should be taken with patients in the
resting supine position as this is how the diagnostic reference intervals were defined (Lenders et al.
1995) and because upright posture increases neuronal noradrenaline release and sampling in this
position dramatically increases the false positive rate (Lenders et al. 2007). There is evidence that
normal circulating metanephrines increase with age, but age-defined reference intervals are not
commonly utilised in clinical practice (Eisenhofer et al. 2013). Falsely elevated test results for urine
and plasma metanephrines can result from a range of medications either through pharmacodynamic
interference that affects all measurement methods or through analytical interference of certain
methodologies (summarised in (Lenders et al. 2014)). If this is suspected, repeat testing following
discontinuation of the offending medication is necessary. 3-MT is the only metanephrine influenced
by a catecholamine-rich diet (de Jong et al. 2009).
Given the extremely high sensitivity (in excess of 95%) and specificity (over 90%) of plasma free
metanephrines for PPGL detection, additional confirmatory testing is rarely necessary (Lenders et al.
2002; Hickman et al. 2009).
In some circumstances, the clonidine suppression test can be a useful adjunct in the diagnosis of
PPGLs (Eisenhofer et al. 2003). Clonidine, an α2-adrenoceptor agonist, inhibits neuronal
noradrenaline release and therefore will reduce circulating noradrenaline and normetanephrine in
individuals without PPGLs. Blood is taken prior to clonidine administration and three hours after with
a positive result considered if the normetanephrine concentration remains elevated at three hours
and has fallen by less than 40% compared to baseline, reflecting autonomous tumoural production.
Given its reliance on normetanephrine, the clonidine suppression test is only useful in noradrenaline
secreting PPGLs.
79
Circulating chromogranin A, a non-specific neuroendocrine secretory protein, is inferior to plasma
metanephrines in PPGL detection (Algeciras-Schimnich et al. 2008), but could play a role as a
diagnostic adjunct in combination with metanephrines (Giovanella et al. 2006) or in instances when
metanephrines are not elevated (Zuber et al. 2014).
2.4.2 Imaging
Once the biochemical detection of catecholamine excess has been secured, the next step is to
localise the PPGL by imaging. In keeping with all endocrine conditions, imaging should follow
diagnostic biochemistry to reduce the risk of discovery of incidental radiological abnormalities of
uncertain significance. The exception to this rule would be in non-secretory PPGL, for example
HNPGLs which might present due to local mass effect, and in surveillance of patients with mutations
in PPGL predisposing genes (Maher et al. 2011; Jasperson et al. 2014).
2.4.2.1 Cross sectional imaging
First line imaging is either by computed tomography (CT) or magnetic resonance imaging (MRI), both
of which have diagnostic sensitives exceeding 90% for adrenal phaeochromocytomas (Jalil et al.
1998; Lumachi et al. 2006). CT findings of adrenal lesions that are suggestive of an adenoma include
a pre-contrast mean attenuation of less than ten Hounsfield Units or a contrast washout exceeding
60% (Caoili et al. 2002), although neither of these criteria are absolute (Blake et al. 2003). CT has the
advantage of greater spatial resolution in the thorax, abdomen and pelvis, whilst MRI is better for
HNPGL. CT is quicker, more readily available and better tolerated by patients whilst MRI has the
advantage of not involving ionising radiation and so is preferable in groups in whom radiation
exposure should be minimised (for example, children, during pregnancy and those with genetic
predisposition syndromes).
The choice of initial imaging modality and extent is at the discretion of the treating clinician and is
influenced by the pre-test likelihood of PPGL location, disease extent and probability of syndromic
disease.
2.4.2.2 Nuclear medicine imaging
A range of radioisotope scans are available as adjunctive imaging techniques in the diagnosis and
staging of PPGLs.
80
Metaiodobenzylguanidine (MIBG) consists of an iodinated benzyl group and a guanidine group and is
structurally similar to catecholamines (Figure 2.2C) (Nakajo et al. 1983). MIBG actively enters
neuroendocrine cells via the adrenaline transporter and is stored in neurosecretory granules,
resulting in its concentration in these cells compared to other tissues. Labelling MIBG with the
gamma-emitter 123I allows for its detection by a gamma camera, which can be combined with single
photon emission computed tomography (SPECT) to improve anatomical localisation. The sensitivity
of 123I-MIBG reaches almost 90% for phaeochromocytomas but is significantly lower for
paragangliomas (Bhatia et al. 2008; Wiseman et al. 2009), in recurrent (Rufini et al. 2011) and
metastatic (Ilias et al. 2008) disease and in patients with SDHB mutations (Fonte et al. 2012). False
negative results can be seen in necrotic or haemorrhagic tumours (Bhatia et al. 2008) and following
administration of a wide range of medications (Solanki et al. 1992). MIBG has the advantage of the
availability of a therapeutic isotope 131I-MIBG and therefore diagnostic imaging with 123I-MIBG should
be considered in patients with confirmed or suspected recurrent or metastatic disease, in whom 131I-
MIBG might be a therapeutic option.
Fluorodeoxyglucose (18F-FDG) is an alternative radioisotope that is widely used in positron emission
tomography (PET). It is taken up by all cells, with greatest uptake by those that are most
metabolically active. In accordance with its mechanism of action, its sensitivity for benign
phaeochromocytomas is low (58%), but is much higher (88%) for metastases (Shulkin et al. 1999).
18F-FDG-PET is of particular use in metastatic SDHB-associated PPGLs where its sensitivity
approaches 100% and comfortably outperforms 123I-MIBG (Timmers et al. 2007b). An alternative
positron emitter is the catecholamine fluorodopa (18F-DOPA) which enters chromaffin cells via the L-
type amino acid transporter system and has very high sensitivities (>90%) for detecting recurrent or
metastatic PPGLs (Rufini et al. 2011; Gabriel et al. 2013), although its utility in SDHB-associated
PPGLs is more limited (Gabriel et al. 2013). Thus, both 18F-FDG-PET and 18F-DOPA-PET are very
sensitive at identifying metastatic disease, although they do not offer a therapeutic option.
Unlike the previous radioisotopes, the somatostatin analogue (SSA) 68Ga-DOTATATE’s specificity is
conferred by its affinity for cell surface somatostatin receptor (SSTRs), particularly SSTR2, which are
widely expressed on NETs including PPGLs. The sensitivity for detection of PPGLs, particularly
metastases, exceeds 90% and is superior to any other available cross sectional or nuclear medicine
imaging modality (Janssen et al. 2015; Gild et al. 2018; Han et al. 2018). Its performance appears to
be maintained in SDHB-associated PPGLs (Janssen et al. 2015), unlike the other radioisotopes, in
accordance with the increased SSTR2 expression in these tumours (Elston et al. 2015). Like MIBG, a
therapeutic radiopharmaceutical, 177Lu-DOTATATE, is available.

81
2.4.3 Histopathology
On haemotoxylin and eosin (H&E) staining, PPGLs classically demonstrate a ‘Zellballen’ pattern
comprised of nests of tumour cells separated by peripheral capillaries. At the periphery of these
nests lie sustentacular cells. The role of the sustentacular cell in tumours is unclear; they are thought
to play a glial-like support role, although they may contain a stem cell contingent (Schmid et al.
1994). Although various ‘subtypes’ of PPGLs have been proposed based on their histological
appearance, they do not correlate with tumour genetics, biology, natural history or prognosis and
are not routinely used (Tischler & deKrijger 2015). PPGLs can form composite tumours with
neuroblastomas, ganglioneuroblastomas and malignant peripheral nerve sheath tumours (Tischler
2000).
Although the histological diagnosis of PPGL can usually be made on H&E sections alone, IHC can be
informative. The sustentacular cell population is usually positive for S100, whilst chromogranin A
and synaptophysin usually label phaeochromocytes. Tyrosine hydroxylase is more specific than these
generic neuroendocrine markers, although can be negative in non-secretory PPGLs, especially
HNPGL. In addition to diagnostic confirmation, IHC can provide early insight into the likelihood of an
underlying genetic mutation. Negative IHC for SDHB is highly suggestive of a mutation in an SDHx
complex gene and due to the lack of SDHx somatic mutations in PPGLs, in contrast to GISTs, is
predictive of a germline mutation (Gill et al. 2010; Korpershoek et al. 2011; Papathomas et al. 2015).
Malignant disease in PPGLs is defined by the World Health Organisation as the presence of
metastatic disease in an organ which does not have chromaffin cells (usually bone or lymph node)
(De Lellis et al. 2004). Unlike other cancers, there is no reliable pathological staging system that
correlates with prognosis. Two scoring systems have been proposed: Phaeochromocytoma of the
Adrenal Scaled Score (PASS) (Thompson 2002) and Grading of Adrenal Phaeochromocytoma and
Paraganglioma (GAPP) (Kimura et al. 2014) (Table 2.2). The PASS is limited to phaeochromocytomas
and is subject to significant inter-observer variation (Wu et al. 2009). Both were retrospectively
compiled and have not been prospectively validated and are intrinsically limited by the lack of
correlation between histological appearances and the largest predictor of malignancy, SDHB
mutation status (Brouwers et al. 2006; Amar et al. 2007; Blank et al. 2010).
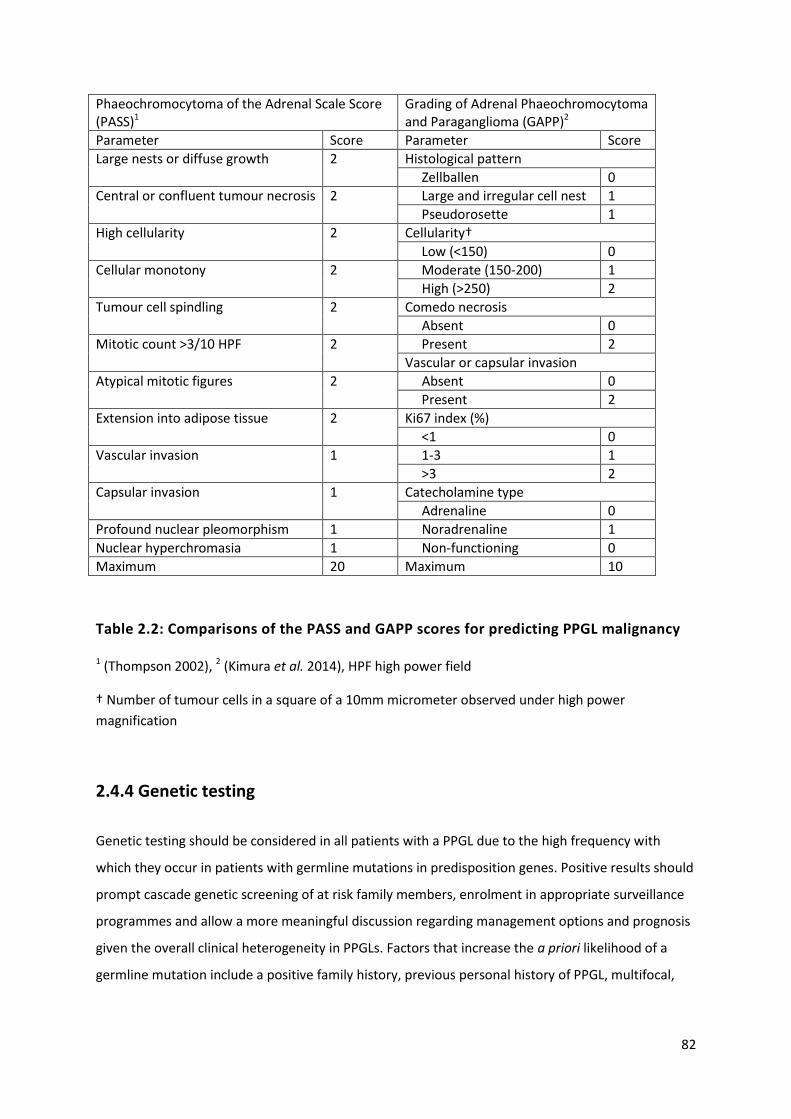
82
Phaeochromocytoma of the Adrenal Scale Score (PASS)1
Grading of Adrenal Phaeochromocytoma and Paraganglioma (GAPP)2
Parameter Score Parameter Score
Large nests or diffuse growth 2 Histological pattern
Zellballen 0
Central or confluent tumour necrosis 2 Large and irregular cell nest 1
Pseudorosette 1
High cellularity 2 Cellularity†
Low (<150) 0
Cellular monotony 2 Moderate (150-200) 1
High (>250) 2
Tumour cell spindling 2 Comedo necrosis
Absent 0
Mitotic count >3/10 HPF 2 Present 2
Vascular or capsular invasion
Atypical mitotic figures 2 Absent 0
Present 2
Extension into adipose tissue 2 Ki67 index (%)
<1 0
Vascular invasion 1 1-3 1
>3 2
Capsular invasion 1 Catecholamine type
Adrenaline 0
Profound nuclear pleomorphism 1 Noradrenaline 1
Nuclear hyperchromasia 1 Non-functioning 0
Maximum 20 Maximum 10
Table 2.2: Comparisons of the PASS and GAPP scores for predicting PPGL malignancy
1 (Thompson 2002), 2 (Kimura et al. 2014), HPF high power field
† Number of tumour cells in a square of a 10mm micrometer observed under high power
magnification
2.4.4 Genetic testing
Genetic testing should be considered in all patients with a PPGL due to the high frequency with
which they occur in patients with germline mutations in predisposition genes. Positive results should
prompt cascade genetic screening of at risk family members, enrolment in appropriate surveillance
programmes and allow a more meaningful discussion regarding management options and prognosis
given the overall clinical heterogeneity in PPGLs. Factors that increase the a priori likelihood of a
germline mutation include a positive family history, previous personal history of PPGL, multifocal,
83
extra-adrenal and malignant disease as well as the presence of other syndromic associations (Table
2.1).
Like all genetic testing, the relative benefits and likelihoods of a positive result must be balanced
against potential costs (financial and otherwise) in the context of the wider health economy. This has
led to a range of different approaches to genetic testing for PPGLs. The Endocrine Society suggests a
step-wise decisional algorithm for all patients based on the presence or absence of metastases, site
of disease and secretory profile (Lenders et al. 2014). This is intellectually satisfying and limits
unnecessary testing of genes unlikely to be responsible, however risks both delay to diagnosis if the
first set of testing is negative and may not convert to a lower cost. The UK Genetic Testing Network
(https://ukgtn.nhs.uk/) adopts a blanket 10 gene (FH, MAX, RET, SDHA-D, SDHAF2, TMEM127, VHL)
panel-based approach to patients who have one of the following risk factors: PGL, family history, age
under 45, syndromic features, malignant or multifocal disease.
2.4.5 Others
Employing the aforementioned techniques, uncertainty regarding PPGL localisation is uncommon,
particularly in patients with sporadic and syndromic disease. The situation is different in patients
with a genetic predisposition to PPGL development, who are enrolled in biochemical and radiological
surveillance programmes which aim to diagnose small, pre-symptomatic tumours (Maher et al.
2011; Jasperson et al. 2014). Occasionally, radiological abnormalities are detected which are too
small to characterise by either cross sectional or nuclear medicine imaging and the situation is
further complicated by the possibility of incidentaloma detection, particularly with advancing age.
In such circumstances, there is a potential role for a technique that provides functional information
to assist anatomical localisation. Selective venous sampling with measurement of catecholamines is
one such approach that has been used for over 60 years (Von Euler et al. 1955), although
uncertainty regarding its utility remains (Freel et al. 2010). This technique is examined in Chapter 6.
84
2.5 Management
Once a PPGL is diagnosed, the immediate priority is to render the patient safe from the end organ
effects of catecholamine excess. This is equally relevant as pre-treatment before surgical
intervention or as long-term therapy in patients with incurable disease.
2.5.1 Medical therapy
Initial medical management of a PPGL with α-adrenoceptor antagonists is established endocrine
practice and uniformly recommended by society guidelines, although the underlying evidence base
is limited (Lenders et al. 2014; Whelton et al. 2018). Traditional teaching mandates that alpha
blockade must precede beta blockade due to the risk of unopposed alpha stimulation and resultant
paradoxical hypertension or precipitation of a catecholamine crisis, although evidence for this is
limited to case reports and small case series (Briggs et al. 1978; Sibal et al. 2006). The non-selective
α1 and α2 receptor antagonist phenoxybenzamine is generally the first line choice, partly due to its
non-competitive mechanism of action being felt to be protective from catecholamine surges. Thus,
receptor re-synthesis is required to overcome blockade, which although helpful when the source of
catecholamine excess is in situ, can result in significant postoperative hypotension following its
removal. The reversible and selective α1 receptor antagonist doxazosin has therefore been proposed
as an alternative agent. Direct comparison between the two is limited to retrospective series with
varied results suggesting either no difference between intra-operative blood pressure control (Kocak
et al. 2002; Prys-Roberts & Farndon 2002) or inferior blood pressure control with doxazosin
(Weingarten et al. 2010). A prospective head-to-head trial has recently been completed and the
results are awaited (PRESCRIPT; NCT01379898).
Alpha blockade often results in a reflex tachycardia due to the direct effects of catecholamines on β-
adrenoceptors and excess noradrenaline produced at cardiac adrenergic nerve endings (an α2-
mediated effect that is also used as an argument for doxazosin over phenoxybenzamine). This
tachycardia can be treated with non-selective β-antagonists such as propranolol, introduced only
after sufficient α-antagonist exposure (Lenders et al. 2014). Patients with PPGLs are volume
contracted due to α1-mediated vasoconstriction and are at risk of significant hypotension upon
initiation of α-antagonists. This can be reduced by expanding circulating volume though increased
oral fluid and salt intake or intravenous fluid administration (Pacak 2007).
A variety of other anti-hypertensive agents have also been used in patients with PPGLs peri-
operatively or during a crisis. The tyrosine hydroxylase inhibitor metyrosine can be a useful adjunct
85
to phenoxybenzamine, but its side effects restrict it to immediate pre-operative use (Perry et al.
1990; Steinsapir et al. 1997). Some units do not use alpha blockers even when available. A large
French centre utilises the dihydropyridine calcium-channel blocker nicardipine (Lebuffe et al. 2005),
which acts by preventing catecholamine-stimulated calcium influx into arterial smooth muscle.
Perioperative complications (specifically myocardial infarction and death) in a single large volume
centre in Germany were no different regardless of whether alpha blockers were used, although
maximal intraoperative blood pressure was higher in patients not treated with an α antagonist pre-
operatively (Groeben et al. 2017). The combined α1 and β antagonist labetalol has also been used
(Poopalalingam & Chin 2001), however, like all beta blockers, concerns exist regarding the risk of
paradoxical hypertension in spite of its α1 activity and adverse events have been reported (Kuok et
al. 2011). Other drugs that also have a role are magnesium (James 1989), sodium nitroprusside
(Boutros et al. 1990) and glyceryl trinitrate (Emerson & Rainbird 2003).
2.5.2 Surgery
Surgical resection represents the only possibility of PPGL cure. There are no data advocating the
survival benefit of any single operative approach or technique, but retrospective and historical
comparisons between open and laparoscopic adrenalectomies suggest the latter to be associated
with reduced pain, blood loss, hospital stay and morbidity (Shen et al. 2010; Agarwal et al. 2012).
Laparoscopic adrenalectomy can be achieved by either the trans- or retro-peritoneal approach with
the former allowing assessment of the abdominal cavity, whilst the latter avoids it and is thus of use
in patients with adhesions from previous surgery (Walz et al. 2006). The operation choice is surgeon
and patient dependent and the potential benefits of a less invasive procedure must be balanced
against the risk of incomplete resection and recurrence (Li et al. 2001). The Endocrine Society
suggests that open adrenalectomy should be undertaken in tumours exceeding 6cm and those that
are invasive (Lenders et al. 2014).
In patients with, or who are at risk of, bilateral phaeochromocytomas, there is an argument for
partial (cortical-sparing) rather than complete adrenalectomy with the aim of preserving adrenal
cortical function and avoiding hypoadrenalism and its associated mortality. The risk is leaving
residual medullary tissue in which a recurrent phaeochromocytoma could develop in an already
operated surgical field, increasing the risk of operative complications. In a large study of nearly 100
patients with VHL and MEN2 who underwent partial adrenalectomies for phaeochromocytomas, the
3 year recurrence rate was 7% with 78% of patients remaining steroid independent (Grubbs et al.
2013). Longer term follow up detailing recurrence risk in this situation is currently lacking.
86
2.5.3 Radiotherapy (external beam and radionuclide)
Conventional external beam radiotherapy can be an effective treatment in metastatic PPGLs and
provides local disease control in approximately 80% of lesions at 5 years (Breen et al. 2018).
Radionuclide therapy provides an alternative approach to delivering targeted radiotherapy to PPGL
cells whilst minimising damage to normal surrounding tissues.
131I-MIBG has a longer half-life than 123I-MIBG (8 days compared to 13 hours), which, together with
its emission of beta particles, makes it well suited for radionuclide therapy. A meta-analysis of 17
studies containing 243 patients found complete radiological response in 3%, partial response in 27%
and stable disease in 52% (van Hulsteijn et al. 2014). The response of soft tissue metastases to 131I-
MIBG appears better than that of bone metastases (Loh et al. 1997). Despite being ‘targeted’
radiotherapy, 131I-MIBG is associated with significant side effects, including a long-term risk of
haematological malignancy in 15% of treated patients (Sze et al. 2013).
In peptide receptor radionuclide therapy (PRRT), the high expression rate of SSTR2 on PPGLs is
exploited for therapeutic benefit. Somatostatin analogues are coupled to a radioactive ligand
(usually 177Lu) to deliver targeted radiotherapy. Although less established than 131I-MIBG, initial
comparisons suggest that PRRT may prove more effective (Nastos et al. 2017).
2.5.4 Chemotherapy and other agents
The Averbuch regime of cyclophosphamide, vincristine and dacarbazine (CVD) is the single most
widely used chemotherapy regime for PPGLs (Keiser et al. 1985). Overall response rates are
generally disappointing with only 37% of patients achieving a partial tumour volume response and
40% a partial catecholamine response (Niemeijer et al. 2014). The response rate to CVD, however,
appears to be far higher in SDHB-associated PPGLs (Jawed et al. 2018).
Temozolamide, the oral precursor of dacarbazine, monotherapy similarly shows a greater response
rate in SDHB-associated PPGLs, which is potentially explained by its mechanism of action (Hadoux et
al. 2014). It is an alkylating agent that exerts its chemotherapeutic effect through DNA adduction,
the generation of double strand breaks and subsequent cellular apoptosis. This process is opposed
by O6-alkylguanine DNA methyltransferase (MGMT), expression of which is downregulated due to
hypermethylation of its promoter in SDHx-associated PPGLs (Hadoux et al. 2014).
Increasing understanding of PPGL biology and the responsible molecular mechanisms has presented

87
multiple potential therapeutic targets, with receptor tyrosine kinase inhibitors (TKIs) being the
preferred agents. Current evidence is generally limited to small, retrospective series with many
prospective trials in progress. The first TKI utilised was the multi-RTK targeting sunitinib, which
through its actions against vascular endothelial growth factor (VEGF) and RET was a promising
candidate to treat both cluster 1 and cluster 2 PPGLs. The single largest series to date contained 17
patients, of whom 57% had a partial response or stable disease, with a suggestion of improved
response in SDHB-associated tumours (Ayala-Ramirez et al. 2012). A multi-centre, prospective,
placebo-controlled trial is currently underway (FIRSTMAPP, NCT01371201). The mTOR inhibitor
everolimus does not appear to be effective in monotherapy (Druce et al. 2009) and is currently being
trialled in combination with the multi-targeting TKI vatalanib (NCT00655655). Pazopanib has no
evidence of benefit and serious cardiovascular adverse effects led to early trial termination (Jasim et
al. 2017). TKIs currently in clinical trials for PPGLs include the VEGFR and RET targeting cabozantinib
(NCT02302833), axitinib (NCT01967576), the VEGFR inhibitor lenvatinib (NCT03008369) and the
FGFR targeting dovitinib (NCT01635907). Such trials are desperately needed given the generally poor
response rates of metastatic PPGLs to currently available therapies and the limited, predominantly
retrospective, evidence base on which they are used.
88
2.6 Thesis aims and objectives
Alterations in primary cilia have been observed in a range of different cancers; most commonly cilia
are absent or reduced in tumours compared to their tissue of origin (Schraml et al. 2009; Hassounah
et al. 2013). Whether ciliary loss is merely a consequence of the enhanced cellular proliferation seen
in tumours, or whether it might contribute to tumourigenesis itself, remains under debate.
Renal cysts and ccRCCs associated with von Hippel-Lindau disease are devoid of primary cilia (Basten
et al. 2013). Despite the identified role pVHL plays in microtubule and ciliary stabilisation (Okuda et
al. 1999; Schermer et al. 2006), it is unknown whether primary cilia loss is a feature of other VHL-
associated tumours such as PPGLs. The overarching aim of this thesis was to investigate whether
alterations in primary cilia contribute to PPGL pathogenesis.
The first objective was to determine whether primary cilia are altered in PPGLs and in particular
those associated with VHL. This was addressed through analysis of primary cilia structure and
transcriptome in human phaeochromocytomas compared to adjacent non-cancerous adrenal
medullas. In order to address whether cilia loss contributes to PPGL tumourigenesis, genetic
manipulation of a phaeochromocytoma-derived cell line to impair ciliogenesis was performed and
cellular proliferation and gene expression were analysed.
Primary cilia are sensory organelles that are ideally placed to interact with the tumour
microenvironment. Hypoxia is a cardinal feature of the tumour microenvironment in general, and
has particular relevance to cluster 1 PPGLs. The effect of hypoxia on primary cilia appears complex,
variable and cell lineage dependent (Proulx-Bonneau & Annabi 2011; Wann et al. 2013; Brown et al.
2014; Lavagnino et al. 2016) and has not been well studied in the context of cancer.
The second objective of this thesis was to investigate whether features of the tumour
microenvironment directly relevant to PPGLs influenced primary cilia. Utilising phaeochromocytoma-
derived cell lines, we investigated the effect hypoxia and pseudohypoxia (achieved in a variety of
PPGL-relevant manners) had on primary cilia and demonstrated the responsible mechanism. The
effects of catecholamines on primary cilia were also examined.
Next, our attention turns from phaeochromocytoma pathogenesis to diagnosis. Adrenal venous
sampling is an established, but now rarely required, technique for phaeochromocytoma localisation
in the event of equivocal imaging findings, particularly in the context of inherited PPGL syndromes.
Uncertainty remains regarding its use (Freel et al. 2010), largely due to the lack of robust reference
intervals for catecholamine values in adrenal venous effluent.

89
The third objective of this thesis was to define a diagnostic cut-off for adrenal venous catecholamine
concentrations in phaeochromocytomas. This was achieved by determining reference intervals in
patients without phaeochromocytomas and comparing these to patients with
phaeochromocytomas.

90
CHAPTER 3
Materials and methods

91
3.1 Patient recruitment and ethical approval
3.1.1 Primary cilia in phaeochromocytoma and paraganglioma
Consecutive patients who were due to undergo surgery for phaeochromocytoma or paraganglioma
(diagnosed on the basis of preoperative biochemistry and imaging) at St Bartholomew’s Hospital,
University College London Hospital and the National Hospital for Neurology and Neurosurgery (all
London, UK) were approached for involvement in this study between 2014 and 2016. All participants
gave written informed consent for this study, which was approved by Cambridge East Research
Ethics Committee (REC: 06/Q0104/133). Clinical data was obtained from participants’ medical
records.
3.1.2 Adrenal venous catecholamine measurement
Successive patients who underwent adrenal venous sampling (AVS) for the localisation of
established primary aldosteronism (PA) at St Bartholomew’s Hospital, London and the Radboud
University Medical Center, Nijmegan, The Netherlands between 2006 and 2015 were included in this
analysis.
A second group of six patients at St Bartholomew’s Hospital were identified who had undergone AVS
for the diagnosis and localisation of phaeochromocytomas, with subsequent histological
confirmation of the diagnosis.
It is standard clinical practice to routinely measure adrenal venous catecholamines at both centres
to provide reassurance and confirmation of adrenal vein cannulation. Individualised patient consent
was not required, but the protocol received institutional board review at both centres.

92
3.2 Cell culture
All materials were obtained from Sigma Aldrich (Haverhill, UK) unless otherwise stated. All work was
conducted in the Centre for Endocrinology, William Harvey Research Institute, Queen Mary
University of London (QMUL) unless otherwise stated.
3.2.1 PC12 cells
PC12 Adh rat phaeochromocytoma cells were obtained from the American Type Culture Collection
(ATCC CRL-1721.1 TM) and were cultured in F-12K (Kaighn’s modification of Ham’s F-12 medium)
medium supplemented with 15% horse serum (v/v), 2.5% foetal bovine serum (FBS; v/v) and 50U/ml
penicillin and 50μg/ml streptomycin (final concentration in media 1%).
3.2.2 MPC and MTT cells
MPC and MTT mouse phaeochromocytoma cells were a gift from Prof Karel Pacak (National Institute
of Health, Bethesda, Maryland, USA) via Prof Marta Korbonits (QMUL). They were cultured in
Dulbecco’s Minimum Eagle Medium (DMEM) supplemented with 10% FBS (v/v) and 50U/ml
penicillin and 50 μg/ml streptomycin (final concentration in media 1%).
3.2.3 Cell culture conditions
All cells were cultured at 37 oC, 5% CO2. For standard conditions cells were cultured in an incubator
at standard atmospheric conditions. For hypoxic experiments, cells were cultured in a hypoxic
workstation set to an oxygen concentration of 1%, with nitrogen as the balancing gas. Hypoxia
experiments were conducted in the Barts Cancer Institute, QMUL.
Cells were seeded in complete media at a density of 30,000 cells/cm2 onto 15mm glass coverslips
(VWR, Lutterworth, UK) or plastic culture dishes for 24 hours until approximately 70-80% confluent.
For cilia experiments, they were then washed thrice with phosphate buffered saline (PBS) and
transferred to serum-free medium for a further 24 hours or otherwise specified in order to induce
growth arrest and promote ciliogenesis.
Drug treatments, dissolved in the relevant solvent, were applied to cells for the duration described
in the text with vehicle-only samples being used as controls (Table 3.1).
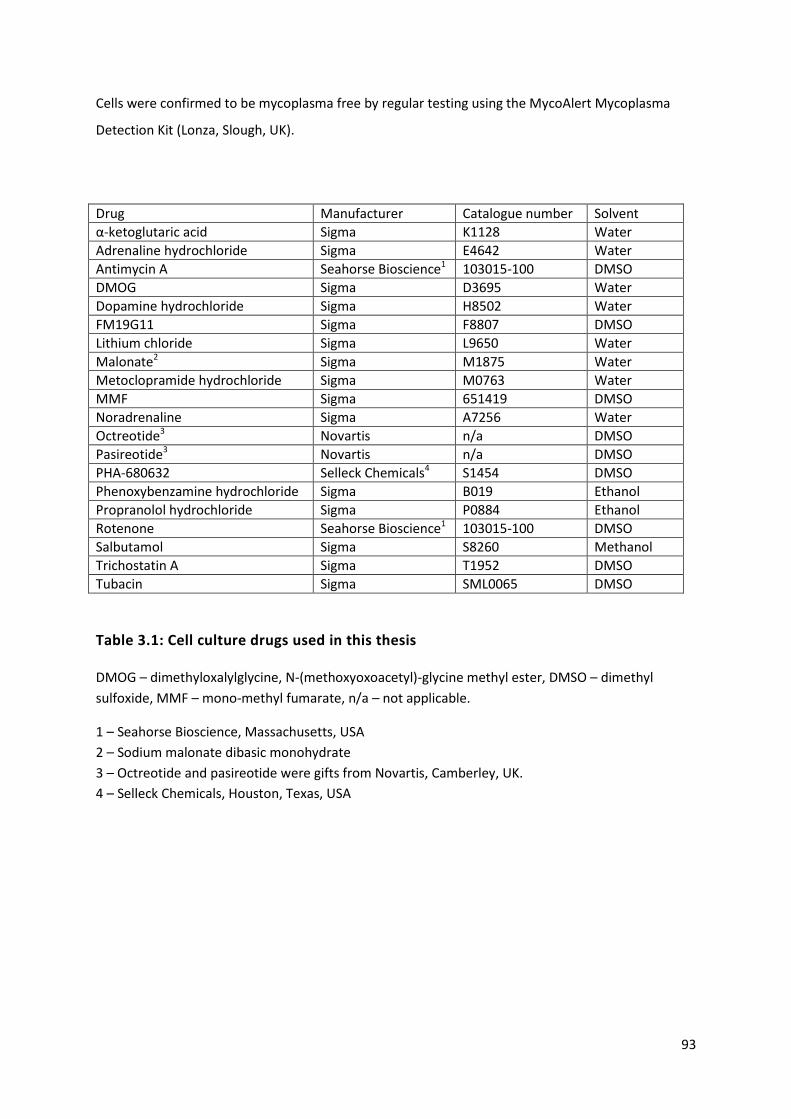
93
Cells were confirmed to be mycoplasma free by regular testing using the MycoAlert Mycoplasma
Detection Kit (Lonza, Slough, UK).
Drug Manufacturer Catalogue number Solvent
α-ketoglutaric acid Sigma K1128 Water
Adrenaline hydrochloride Sigma E4642 Water
Antimycin A Seahorse Bioscience1 103015-100 DMSO
DMOG Sigma D3695 Water
Dopamine hydrochloride Sigma H8502 Water
FM19G11 Sigma F8807 DMSO
Lithium chloride Sigma L9650 Water
Malonate2 Sigma M1875 Water
Metoclopramide hydrochloride Sigma M0763 Water
MMF Sigma 651419 DMSO
Noradrenaline Sigma A7256 Water
Octreotide3 Novartis n/a DMSO
Pasireotide3 Novartis n/a DMSO
PHA-680632 Selleck Chemicals4 S1454 DMSO
Phenoxybenzamine hydrochloride Sigma B019 Ethanol
Propranolol hydrochloride Sigma P0884 Ethanol
Rotenone Seahorse Bioscience1 103015-100 DMSO
Salbutamol Sigma S8260 Methanol
Trichostatin A Sigma T1952 DMSO
Tubacin Sigma SML0065 DMSO
Table 3.1: Cell culture drugs used in this thesis
DMOG – dimethyloxalylglycine, N-(methoxyoxoacetyl)-glycine methyl ester, DMSO – dimethyl
sulfoxide, MMF – mono-methyl fumarate, n/a – not applicable.
1 – Seahorse Bioscience, Massachusetts, USA
2 – Sodium malonate dibasic monohydrate
3 – Octreotide and pasireotide were gifts from Novartis, Camberley, UK.
4 – Selleck Chemicals, Houston, Texas, USA

94
3.2.4 Trypan blue dye exclusion assay
Following passage, an aliquot of cell suspension was mixed with an equal volume of 0.4% trypan
blue solution (Sigma Aldrich) in order to assess cell viability. This mixture was applied to a
haemocytometer and examined with a light microscope at x10 magnification. Trypan blue is unable
to cross an intact cell membrane and therefore cells containing it (as assessed by blue cytoplasm)
are non-viable. Cells were counted to determine the solution concentration, with in excess of 95%
cells being viable in a healthy suspension.
3.2.5 siRNA-mediated knockdown
PC12 cells were transfected with either targeted or non-targeted control siRNAs using Lipofectamine
3000 (Thermo Fisher Scientific) according to the manufacturer’s instructions. Pre-designed Silencer
Select (Ambion, Inchinnan, UK) or SMARTpool (Dharmacon, Lafayette, Colorado, USA) siRNAs were
utilised. All siRNAs were used at a total concentration of 30nM. For gene knockdown, multiple
distinct siRNAs were used: two for Silencer Select, four for SMARTpool (Table 3.2).
PC12 cells were plated in complete media. Once 70-90% confluent, the medium was removed, the
cells washed with PBS and replaced with fresh media. Lipofectamine-siRNA complexes were
prepared as below and added to the fresh media. Cells were processed 48 hours after transfection.
Lipofectamine mix (/well) 24 well plate 6 well plate
OptiMEM 25μl 125μl
Lipofectamine 3000 0.75μl 3.75μl
siRNA mix (/well)
OptiMEM 25μl 125μl
siRNA (total) 15pmol 60pmol
Lipofectamine-siRNA mix (/well)
Lipofectamine mix 25μl 125μl
siRNA mix 25μl 125μl
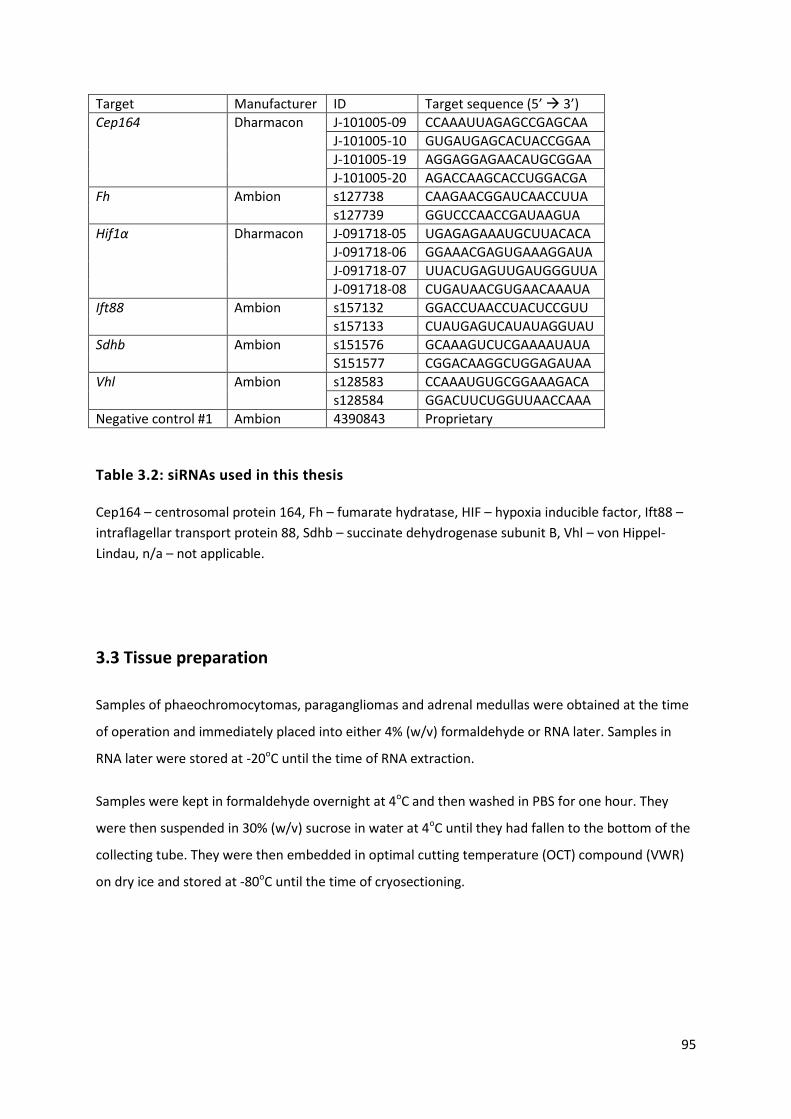
95
Target Manufacturer ID Target sequence (5’ 3’)
Cep164 Dharmacon J-101005-09 CCAAAUUAGAGCCGAGCAA
J-101005-10 GUGAUGAGCACUACCGGAA
J-101005-19 AGGAGGAGAACAUGCGGAA
J-101005-20 AGACCAAGCACCUGGACGA
Fh Ambion s127738 CAAGAACGGAUCAACCUUA
s127739 GGUCCCAACCGAUAAGUA
Hif1α Dharmacon J-091718-05 UGAGAGAAAUGCUUACACA
J-091718-06 GGAAACGAGUGAAAGGAUA
J-091718-07 UUACUGAGUUGAUGGGUUA
J-091718-08 CUGAUAACGUGAACAAAUA
Ift88 Ambion s157132 GGACCUAACCUACUCCGUU
s157133 CUAUGAGUCAUAUAGGUAU
Sdhb Ambion s151576 GCAAAGUCUCGAAAAUAUA
S151577 CGGACAAGGCUGGAGAUAA
Vhl Ambion s128583 CCAAAUGUGCGGAAAGACA
s128584 GGACUUCUGGUUAACCAAA
Negative control #1 Ambion 4390843 Proprietary
Table 3.2: siRNAs used in this thesis
Cep164 – centrosomal protein 164, Fh – fumarate hydratase, HIF – hypoxia inducible factor, Ift88 –
intraflagellar transport protein 88, Sdhb – succinate dehydrogenase subunit B, Vhl – von Hippel-
Lindau, n/a – not applicable.
3.3 Tissue preparation
Samples of phaeochromocytomas, paragangliomas and adrenal medullas were obtained at the time
of operation and immediately placed into either 4% (w/v) formaldehyde or RNA later. Samples in
RNA later were stored at -20oC until the time of RNA extraction.
Samples were kept in formaldehyde overnight at 4oC and then washed in PBS for one hour. They
were then suspended in 30% (w/v) sucrose in water at 4oC until they had fallen to the bottom of the
collecting tube. They were then embedded in optimal cutting temperature (OCT) compound (VWR)
on dry ice and stored at -80oC until the time of cryosectioning.

96
3.4 Immunofluorescence (IF)
3.4.1 Immunocytochemistry (ICC) in cultured cells
PC12, MPC and MTT cells were cultured on 15mm glass coverslips (VWR) in 12 and 24 well plates.
Culture media was removed and the coverslips were washed three times with PBS. Cells were then
fixed with 4% (w/v) formaldehyde in PBS for 10 minutes. The formaldehyde was then removed and
the coverslips again washed three times for five minutes with PBS. Cells were then permeabilised
with 0.25% (v/v) triton-X 100 for five minutes, which was then removed, followed by three further 5
minute PBS washes. Cells were then blocked with 3% (w/v) bovine serum albumin (BSA), 5% (v/v)
normal goat serum (NGS) in PBS (IF blocking buffer) for one hour in order to reduce non-specific
antibody interactions.
Cells were then incubated with the desired primary antibodies (Table 3.3) in IF blocking buffer for
two hours. Coverslips were washed three times for 10 minutes with PBS and then incubated in the
dark for one hour with species-specific fluorescent secondary antibodies (Table 3.4) in IF blocking
buffer. After removal of the secondary antibody solution, 1μg/ml 4’,6-diamidino-2-phenylindole
(DAPI) was applied for one minute to label cell nuclei. The coverslips were washed three further
times with PBS for 5 minutes and mounted on SuperFrost slides (VWR) with fluorescence mounting
medium (Dako) for confocal imaging and with Fluoromount-G (Southern Biotech) for super
resolution imaging. Coverslip edges were sealed with nail varnish to prevent them drying out and
were stored at 4oC.
All steps were conducted at room temperature. Antibody concentrations were determined following
optimisation experiments (not shown).

97
Target Clonality Clone Species Supplier Cat No Use Dilution
Acetylated α-tubulin
Mono 6-11B-1 Mouse Sigma T6793 ICC, IHC 1:2000
Arl13b Poly n/a Rabbit Proteintech 17711-1-AP ICC, IHC 1:500
β-actin Mono AC-15 Mouse Abcam ab6276 WB 1:10,000
FH Mono EPR11648 Rabbit Abcam ab171948 WB 1:1000
GAPDH Poly n/a Rabbit Abcam ab9485 WB 1:5000
IFT88 Poly n/a Rabbit Proteintech 13967-1-AP ICC WB
1:50 1:1000
Ki67 Mono EPR3610 Mouse Abcam ab92742 ICC 1:600
SDHB Mono 21A11AE7 Mouse Abcam ab14714 WB 1:1000
VHL Poly n/a Rabbit Santa Cruz Sc-5575 ICC WB
1:250 1:1000
Table 3.3: Primary antibodies used in this thesis
Cat No – catalogue number, Arl13b – ADP ribosylation factor like protein 13b, ICC –
immunocytochemistry, IHC – immunohistochemistry, n/a – not applicable, WB – Western blot, FH –
fumarate hydratase, GAPDH – glyceraldehyde 3-phosphate dehydrogenase, IFT88 – intraflagellar
transport protein 88, SDHB – succinate dehydrogenase subunit B, VHL – von Hippel-Lindau.
Fluorophore Target Clonality Species Supplier Cat No Use Dilution
Alexa Fluor 488 Mouse IgG Poly Goat Invitrogen1 A-11029 ICC, IHC 1:1000
Rabbit IgG Poly Goat Invitrogen1 A-11034 ICC, IHC 1:1000
Alexa Fluor 568 Mouse IgG Poly Goat Invitrogen1 A-11031 ICC, IHC 1:1000
Rabbit IgG Poly Goat Invitrogen1 A-11036 ICC, IHC 1:1000
IR Dye 680LT Mouse IgG Poly Goat Li-Cor2 ABIN2169640 WB 1:5000
Rabbit IgG Poly Goat Li-Cor2 ABIN2169643 WB 1:5000
IR Dye 800CW Mouse IgG Poly Goat Li-Cor2 ABIN2169616 WB 1:5000
Rabbit IgG Poly Goat Li-Cor2 ABIN2169624 WB 1:5000
DAPI n/a n/a n/a Sigma D9542 ICC, IHC 1:5000
Table 3.4: Fluorescent molecules and secondary antibodies used in this thesis
ICC – immunocytochemistry, IHC – immunohistochemistry, WB – Western blotting, DAPI – 4’,6-
diamidino-2-phenylindole dihydrochloride
1 – Invitrogen, Inchinnan, UK 2 – LI-COR, Cambridge, UK

98
3.4.2 Immunohistochemistry (IHC) in tissue sections
A microtome-cryostat set at -20 oC was used to cut frozen section tissue samples embedded in OCT
compound. 10μm sections were obtained and placed in room temperature PBS to dissolve the OCT
compound.
Tissue sections were treated in the same manner as ICC of cultured cells (above) using a free floating
technique by which they were sequentially transferred to wells containing the relevant reagents,
with the exception that the primary antibody incubation stage occurred overnight at 4oC. Tissue
sections were mounted on SuperFrost Plus adhesion slides (VWR) with fluorescence mounting
medium (Dako) and covered by glass coverslips. Slide edges were sealed with nail varnish and stored
at 4oC.

99
3.5 Western blotting
3.5.1 Cell lysate preparation
For protein extraction, cells were cultured in 6 well plastic culture dishes (surface area 9.6 cm2/well)
and all steps were performed on ice. The media was removed and cells were washed twice with 2ml
of ice cold PBS. Cells were then lysed with 100μl of ice cold radioimmunoprecipitation assay (RIPA)
buffer containing protease and phosphodiesterase inhibitors (Roche, Welwyn Garden City, UK) and
the culture dish repeatedly scraped with a cell scraper. The lysate was collected and homogenised by
passing it through a 21G needle 10 times and then incubated on ice for 30 minutes before being
centrifuged for 12 minutes (13000g, 4oC). The protein-containing supernatant was collected and
either used immediately or stored at -80oC for later use.
3.5.2 Protein quantification
Sample protein concentration was calculated using a Bradford assay against stock concentrations of
BSA. 10μl of each sample and BSA standards were plated in duplicate onto a 96 well plate and mixed
with 200μl of protein assay reagent (1 part reagent: 4 parts ddH20). After 5 minutes at room
temperature, the Wallac 1420 multilabel counter was used to quantify absorbance at 595nm. From
this readout, sample protein concentrations were calculated against that of the stock concentrations
of BSA. Sample protein concentrations were then equalised prior to sodium dodecyl sulphate
polyacrylamide gel electrophoresis (SDS-PAGE).
3.5.3 SDS-PAGE
Cell lysates were mixed with an equal volume of 2x Laemelli buffer, vortexed and centrifuged before
boiling at 100oC for 10 minutes. Samples were again vortexed and centrifuged prior to loading onto
precast 4-12% gradient NuPage Bis-Tris gels (Invitrogen).
Gels were loaded with 25μl/well for 10 well gels and 20μl/well for 15 well gels. The Novex Sharp pre-
stained protein standard (Invitrogen) was used as a molecular weight marker. Gels were run at 150V
for 1-2 hours depending on the protein under examination.
3.5.4 Immunoblotting and band quantification
Following electrophoresis, samples were transferred to nitrocellulose membrane (Whatman,
Maidstone, UK) by semi-dry transfer using a Trans-Blot SD semi-dry transfer cell (Bio-Rad, Watford,

100
UK). The transfer buffer consisted of 20mM Tris, 120mM glycine and 10% methanol (v/v). Proteins
were transferred at 15V at room temperature for 40 minutes for one gel and 50 minutes for two
gels.
After transfer, membranes were cut to size and blocked in 5ml 5% (w/v) non-fat milk in PBS with
0.1% Tween 20 (PBST) for one hour at room temperature. Following blocking, membranes were
incubated with 5ml 5% (w/v) non-fat milk in PBST (blocking solution) containing the appropriate
primary antibodies (Table 3.3) overnight at 4oC. The membranes were subsequently washed thrice
with PBST for 10 minutes and then incubated with the appropriate species-specific infra-red
secondary antibodies (Table 3.4) in blocking solution for one hour at room temperature in the dark.
The membrane was then washed three times with PBST for 10 minutes at room temperature and a
final wash with PBS.
Membranes were imaged using the Li-Cor Odyssey infra-red scanner and densitometry was
performed using Odyssey software to quantify band intensity.
3.6 RNA
3.6.1 RNA isolation and quantification
3.6.1.1 RNA isolation from cultured cells
Total RNA was isolated from cells using an RNeasy kit (Qiagen, Manchester, UK) according to
manufacturer’s instructions.
Cells were quickly washed three times with PBS and then placed onto ice. They were then lysed with
350μl RLT buffer, which contains guanidine-thiocyanate which inhibits RNAses, and scraped by a cell
scraper. The lysate was then transferred to a chilled Eppendorf where it was homogenised five times
with a 20 gauge needle. 350μl 70% (v/v) ethanol was added and mixed well before 700μl was
transferred to a silica based spin column within a collection tube. This was centrifuged for 15s at
8000g and the flow through discarded, leaving the RNA bound to the column. This was washed with
700μl RW1 buffer followed by centrifugation at 8000g for 15 seconds with the flow through again
discarded. Next, 500μl RPE buffer was added to the column which was again spun (8000g, 15
seconds) and the flow through discarded. This step was repeated followed by a 2 minute spin
(8000g). The spin column was then transferred into a new collection tube and centrifuged for one
minute at 14000g before transferring it to a fresh Eppendorf. 30μl RNAse free water was added to

101
the spin column membrane to elute the RNA. It was left to stand on ice for one minute and then
centrifuged at 8000g for one minute. RNA was then used immediately or stored at -80oC.
3.6.1.2 RNA isolation from tissue
Tissue samples stored in RNA later were homogenised in 350μl RLT buffer in 2ml tubes prefilled with
ceramic beads using the Precellys 24 tissue homogeniser (Bertin Instruments, Montigny-le-
Bretonneux, France). Set at a speed of 3000, 20 second runs were completed until the tissue was
homogenised.
Once homogenised, tissue RNA was processed in the same way as from cultured cells using the
RNeasy kit as above.
3.6.1.3 RNA quantification
The Nanodrop ND-1000 spectrophotometer (Thermo Fisher Scientific, Loughborough, UK) was used
to measure RNA concentration (based on specimen optical density at 260nm) and purity (from the
A260/280 absorbance ratio).
3.6.2 RNA sequencing
Isolated total RNA was sent to the Genome Centre, QMUL for RNA sequencing. There, RNA integrity
was confirmed using the Bioanalyser Automated Electrophoresis System (Agilent Technologies) with
samples of RNA integrity number (RIN) exceeding seven proceeding for further processing (see
appendix). 100ng of RNA was used as the input in the KAPA Stranded RNA-Seq with RiboErase
(Roche) as per manufacturer’s instructions to generate libraries. Libraries were quantified by
spectrophotometry using a Nanodrop ND-1000 and library fragment size estimated by Tapestation
(Agilent Technologies). Three equal library pools were made and 12pM loaded onto three Illumina
NextSeq 500 flow cells and sequenced to 75bp Paired End, as per manufacturer’s instructions.
3.6.2.1 RNA sequence data and pathway analyses
Following RNA sequencing, reads were pseudo-aligned using kallisto (Bray et al. 2016). Transcript-
level counts were aggregated to gene-level with the tximport package (Soneson et al. 2015). Prior to
exploratory data analysis (EDA), low count genes were filtered based on previous guidelines
(Robinson & Oshlack 2010), libraries were normalised using the relative log expression method
(Anders & Huber 2010) and counts transformed to log2-counts per million, which stabilises variance
for unsupervised analysis. This matrix was also used to test for pathway enrichment (see below), but
not for differential expression. Each gene was tested for differential expression between adrenal and

102
tumour tissue using tools from the DESeq2 analysis pipeline (Love et al. 2014). We filtered genes and
estimated q-values using the package’s independent hypothesis weighting method (Ignatiadis et al.
2016).
To detect pathway enrichment in gene sets associated with cilia regulation, we implemented a
modified version of the QuSAGE algorithm (Yaari et al. 2013; Turner et al. 2015) designed for
modelling RNA-seq data. This method tests for overexpression in the residual matrix among user
supplied gene sets, following the same filtering, normalisation and transformation steps described
above for EDA. Pathway q-values were calculated using Storey’s method (Storey & Tibshirani 2003).
Gene sets were summarised to vectors of length 24 (sample size) by taking the first principal
component of each, i.e. by calculating the module eigengene. Cilia structure and cilia-mediated
signalling gene sets were curated from the Broad Institute’s Molecular Signatures Database v6.0
(http://software.broadinstitute.org/gsea/msigdb).
Functional analysis of differential gene expression between control and Ift88-knockdown cells was
performed using Ingenuity Pathway Analysis (IPA; Ingenuity Systems), using all genes with log fold
change >2 and q-value <0.01 as input. For all gene set enrichment analyses, a right-tailed Fisher’s
exact test was used to calculate a pathway P-value determining the probability that each biological
function assigned to that data set was due to chance alone. All enrichment scores were calculated in
IPA using all transcripts that passed quality control as the background data set.
Further details or the transcriptome and pathway analysis are included in the appendix and are
uploaded at GitHub (https://github.com/C4TB/markdown-chapple_pcc).
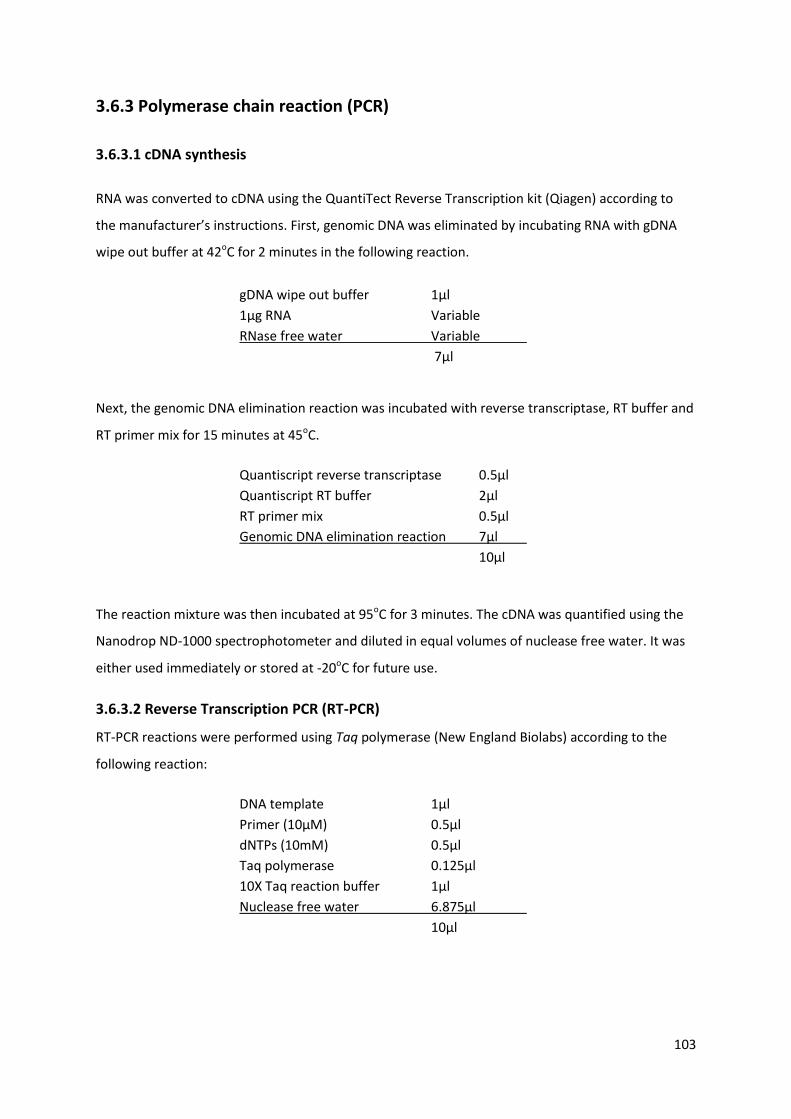
103
3.6.3 Polymerase chain reaction (PCR)
3.6.3.1 cDNA synthesis
RNA was converted to cDNA using the QuantiTect Reverse Transcription kit (Qiagen) according to
the manufacturer’s instructions. First, genomic DNA was eliminated by incubating RNA with gDNA
wipe out buffer at 42oC for 2 minutes in the following reaction.
gDNA wipe out buffer 1μl
1μg RNA Variable
RNase free water Variable
7μl
Next, the genomic DNA elimination reaction was incubated with reverse transcriptase, RT buffer and
RT primer mix for 15 minutes at 45oC.
Quantiscript reverse transcriptase 0.5μl
Quantiscript RT buffer 2μl
RT primer mix 0.5μl
Genomic DNA elimination reaction 7μl
10μl
The reaction mixture was then incubated at 95oC for 3 minutes. The cDNA was quantified using the
Nanodrop ND-1000 spectrophotometer and diluted in equal volumes of nuclease free water. It was
either used immediately or stored at -20oC for future use.
3.6.3.2 Reverse Transcription PCR (RT-PCR)
RT-PCR reactions were performed using Taq polymerase (New England Biolabs) according to the
following reaction:
DNA template 1μl
Primer (10μM) 0.5μl
dNTPs (10mM) 0.5μl
Taq polymerase 0.125μl
10X Taq reaction buffer 1μl
Nuclease free water 6.875μl
10μl
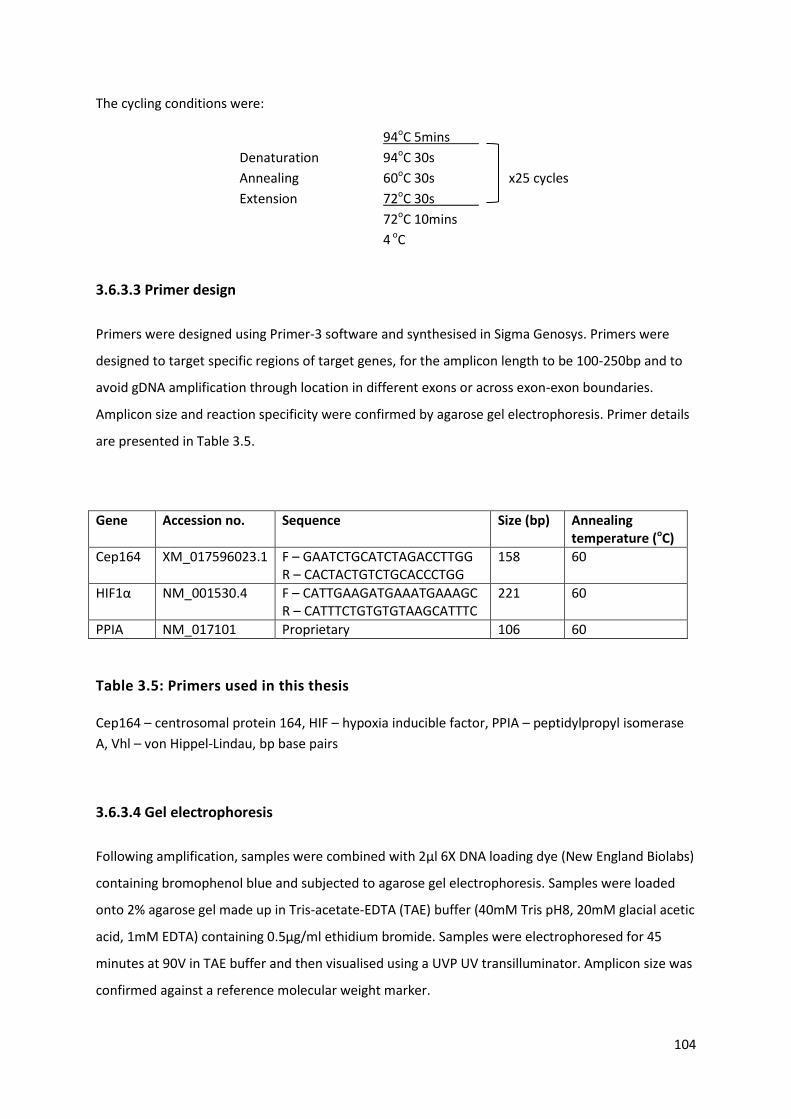
104
The cycling conditions were:
94oC 5mins
Denaturation 94oC 30s
Annealing 60oC 30s x25 cycles
Extension 72oC 30s
72oC 10mins
4 oC
3.6.3.3 Primer design
Primers were designed using Primer-3 software and synthesised in Sigma Genosys. Primers were
designed to target specific regions of target genes, for the amplicon length to be 100-250bp and to
avoid gDNA amplification through location in different exons or across exon-exon boundaries.
Amplicon size and reaction specificity were confirmed by agarose gel electrophoresis. Primer details
are presented in Table 3.5.
Gene Accession no. Sequence Size (bp) Annealing temperature (oC)
Cep164 XM_017596023.1 F – GAATCTGCATCTAGACCTTGG R – CACTACTGTCTGCACCCTGG
158 60
HIF1α NM_001530.4 F – CATTGAAGATGAAATGAAAGC R – CATTTCTGTGTGTAAGCATTTC
221 60
PPIA NM_017101 Proprietary 106 60
Table 3.5: Primers used in this thesis
Cep164 – centrosomal protein 164, HIF – hypoxia inducible factor, PPIA – peptidylpropyl isomerase
A, Vhl – von Hippel-Lindau, bp base pairs
3.6.3.4 Gel electrophoresis
Following amplification, samples were combined with 2μl 6X DNA loading dye (New England Biolabs)
containing bromophenol blue and subjected to agarose gel electrophoresis. Samples were loaded
onto 2% agarose gel made up in Tris-acetate-EDTA (TAE) buffer (40mM Tris pH8, 20mM glacial acetic
acid, 1mM EDTA) containing 0.5μg/ml ethidium bromide. Samples were electrophoresed for 45
minutes at 90V in TAE buffer and then visualised using a UVP UV transilluminator. Amplicon size was
confirmed against a reference molecular weight marker.

105
3.6.3.5 Quantitative real time PCR (qRT-PCR)
The syber-green system, in which a fluorescent dye preferentially binds dsDNA, was used to quantify
PCR product accumulation with each cycle. Real time PCR was performed using the MX3000p
thermal cycler and analysed using MXPro QPCR software (Agilent, Santa Clara, USA).
qRT-PCR reaction mixtures contained:
cDNA 1μl
Primer (5μM) 1μl
qPCRBIO SyGreen Mix 5μl
Nuclease free water 3μl
10μl
qRT-PCR programme:
94oC 3min
Amplification: 94oC 30s
60oC 30s x40 cycles
72oC 30s
Collect end point fluorescence values
Dissociation: 95oC 1min
55oC 30s
Collect all fluorescence values from 55-95oC
95oC 30s
Standard curves for each target gene were generated from serial dilution of the amplified PCR
product prepared in nuclease-free water. Relative gene expression was calculated from these
standard curves, using peptidylpropyl isomerase A (PPIA) as the reference gene.

106
3.7 Microscopy techniques
Imaging was performed with LSM510 or LSM880 laser scanning confocal microscopes (Zeiss). Super
resolution structured illumination (SR-SIM) was on LSM710 with Elyra PS1 (Zeiss) at The School of
Engineering, QMUL.
3.7.1 Measurement of primary cilia incidence and length in 2D cell culture
Primary cilia incidence was quantified using the confocal microscopes listed above with a x63 oil-
immersion objective. Cilia incidence was defined as the number of cells with a cilium (identified by
dual-labelled IF against the axonemal markers acetylated α-tubulin and Arl13b) divided by the
number of nuclei (identified by DAPI) in a given field of view. For each experimental condition, ten
representative fields of view were counted for each of three biological replicates. The number of
cells scored for ciliary incidence for each experiment is included in the relevant figure legend.
For measurement of primary cilia length, cilia were identified as above and sequential z-stacked
sections were imaged (section thickness 0.5μm). The image format was set to 1024x1024 pixels with
a zoom of 1 and line averaging of 4 per slice. Two dimensional maximum intensity projections (MIPs)
were created using Zen software (Zeiss) and individual cilia length was traced and measured using
ImageJ software (NIH). For each experimental condition, five representative Z-stacks were scored for
each of three biological replicates. The number of cells scored for ciliary length for each experiment
is included in the relevant figure legend.
Quantification of cilia incidence and length was performed blinded to experimental status.
3.7.2 Measurement of primary cilia incidence and length in 3D tissue sections
Primary cilia incidence and length were quantified from MIPs created as for 2D cell culture. Five
representative MIPs were scored from each of three distinct sections per tissue specimen. The
numbers of cells scored for cilia incidence and length for each sample type is included in the relevant
figure legend. In addition, the surpass module of Imaris 7.1 image processing and analysis software
(Bitplane) was used to surface render 3D images.

107
3.7.3 Quantification of pVHL axoneme intensity
PC12 cells were fixed and subjected to immunolabelling as above for detection of acetylated α-
tubulin and pVHL and imaged as above (settings x4 zoom, line averaging 8). Regions of interest (ROI)
of the ciliary axoneme were defined by immunolabelling for acetylated α-tubulin using Zen software
and levels of pVHL localised within this area were determined by analysis of fluorescent intensity.
3.8 Adrenal venous catecholamine measurement
3.8.1 Adrenal venous sampling
AVS was performed one hour after the commencement of an intravenous adrenocorticotropic
hormone (ACTH) infusion (rate 50μg/hour). Samples were obtained sequentially from both adrenal
veins under fluoroscopic guidance by an experienced interventional radiologist. A third sample was
taken from the infra-renal inferior vena cava (IVC) as a peripheral sample (Figure 6.1), as previously
described (Lau et al. 2012; Sze et al. 2014).
Successful cannulation of each adrenal vein was defined by an adrenal vein to peripheral cortisol
ratio exceeding five to one (Webb et al. 2012) and only samples meeting these criteria were included
for analysis.
In PA patients, aldosterone antagonists and potassium sparing diuretics were discontinued for at
least four weeks, whilst beta-blockers and angiotensin converting enzyme inhibitors were withheld
for at least two weeks prior to AVS.
3.8.2 Cortisol and catecholamine measurement
Serum cortisol was measured by electrochemiluminescence immunoassay (Roche) at both centres.
Plasma catecholamines were measured using high performance liquid chromatography with
electrochemical detection at both St Bartholomew’s Hospital (Chromsystems, Gräfelfing, Germany)
and at the University of Dresden (in house method (Eisenhofer et al. 1986)) for the Nijmegan
samples.
108
3.9 Statistics
All data are presented as mean + standard deviation (SD) unless otherwise stated. For cilia length
box and whisker plots, the box represents the interquartile range with the centre line the median
and the whiskers represent the 10th and 90th centiles. Statistical significance was determined using
two-tailed Student’s t-test, one-way Analysis of Variance (ANOVA) or The Wilcoxon signed rank test
as appropriate. Centile values for adrenal vein noradrenaline to adrenaline ratios were calculated by
counting. Analyses were performed using Prism version 7 (GraphPad, San Diego, California). For
RNA-sequencing, analyses were conducted in the R statistical environment, version 3.4.0, using
software from the Bioconductor repository (Huber et al. 2015).

109
CHAPTER 4
Primary cilia loss is a feature of human phaeochromocytomas and
contributes to tumourigenesis
The RNA sequencing detailed in this chapter was performed at The Barts and The London Genome
Centre. Its analysis was conducted in collaboration with David Watson.
Work in this chapter has been published in the following article, which is included in the appendix of
this thesis.
Oncometabolite induced primary cilia loss in pheochromocytoma. O’Toole SM, Watson DS,
Novoselova TV, Romano LEL, King PJ, Bradshaw TY, Thompson CL, Knight MM, Sharp TV, Barnes MR,
Srirangalingam U, Drake WM, Chapple JP. Endocrine Related Cancer 2019; 26(1): 165-180.

110
4.1 Introduction
Primary cilia are directly linked to cell cycle progression through the basal body/mother centriole
and it has been suggested that their presence might act as a checkpoint opposing mitotic cell
division (Izawa et al. 2015). Alterations in primary cilia have been observed in a range of different
cancers. Most commonly, cilia are absent or reduced in tumours compared to their tissue of origin
(Schraml et al. 2009; Hassounah et al. 2013).
Whether ciliary loss is merely a consequence of the enhanced cellular proliferation seen in tumours,
or whether it might contribute to tumourigenesis itself, remains under debate. In addition to its cell
cycle link, primary cilia modulate a number of signalling pathways that can be dysregulated in cancer
(Berbari et al. 2009; Wong et al. 2009; Goetz & Anderson 2010; Lancaster et al. 2011; Oh & Katsanis
2013). This, combined with the intriguing observation that primary cilia are required for certain
tumours to develop (Wong et al. 2009), suggests a more complex role.
pVHL plays a role in primary cilia stabilisation (Okuda et al. 1999; Schermer et al. 2006) and its loss of
function in the familial cancer syndrome von Hippel-Lindau disease results in renal cyst and ccRCC
formation, which are devoid of primary cilia (Basten et al. 2013). It is unknown whether primary cilia
disruption in VHL is limited to ccRCCs or is a more generalised feature of other VHL-associated
cancers, which include PPGLs.

111
4.2 Aims and Objectives
The aim of this chapter was to investigate whether primary cilia were altered in
phaeochromocytomas.
Based on cilia alterations in other tumours of neural origin and in ccRCC in which the PPGL
predisposition gene VHL is inactivated, we hypothesised that primary cilia would be altered in
phaeochromocytomas, particularly those associated with VHL.
The first objective was to determine whether primary cilia incidence or length was altered in
phaeochromocytomas compared to adjacent normal adrenal medullas.
The second objective was to determine whether there were any identifiable clinical variables that
impacted on phaeochromocytoma primary cilia incidence and length.
The third objective was to determine if the observed changes in primary cilia structure resulted in
alterations in cilia-mediated signalling in phaeochromocytomas.
The fourth objective was to determine whether phaeochromocytoma-derived cells displayed
primary cilia in 2D culture.
The fifth objective was to determine whether inhibition of ciliogenesis in phaeochromocytoma-
derived cells resulted in changes in cellular proliferation or gene expression.

112
4.3 Results
4.3.1 Primary cilia loss and alterations in cilia-mediated signalling are
features of human phaeochromocytomas
4.3.1.1 Primary cilia incidence and length is reduced in phaeochromocytomas relative to
adjacent normal adrenal medullas
Paired tissue samples from phaeochromocytomas and adjacent macroscopically normal adrenal
medullas were collected from 25 sequential consenting patients who underwent adrenalectomy
between April 2014 and September 2016. Two patients had bilateral disease, giving a total of 27
paired samples; the clinical details are presented in Tables 4.1 & 4.2. Following processing, tissues
were immunostained for the axonemal proteins acetylated α-tubulin and Arl13b, imaged with a
confocal microscope and analysed for primary cilia (Figure 4.1A; see Chapter 3 for full methodology).
Primary cilia incidence was lower in phaeochromocytomas (3.06% + 0.14) compared to adjacent
adrenal medullas (8.42% + 0.03; p=4.7x10⁻¹¹) (Figure 4.1B) within the cohort as a whole and between
every paired sample (Figure 4.1E). Cilia length was also reduced in phaeochromocytomas (1.48μm +
0.34) compared to adrenal medullas (2.02 μm + 0.39; p=8.2x10⁻¹¹) (Figure 4.1C) and was lower in the
phaeochromocytoma of each sample pair in all but one instance (Figure 4.1F). There was a
correlation between the incidence and length of primary cilia measured in individuals in both
phaeochromocytomas (p=1.1x10⁻⁷, r2=0.6828) and adjacent adrenal medullas (p=0.0008, r2=0.3668)
(Figure 4.1D).
Thus, primary ciliary loss is a feature of phaeochromocytomas. This finding is consistent with
observations in other tumours of neuroectodermal origin: GBM (Loskutov et al. 2018),
medulloblastoma (Han et al. 2009) and melanoma (Kim et al. 2011b; Snedecor et al. 2015).
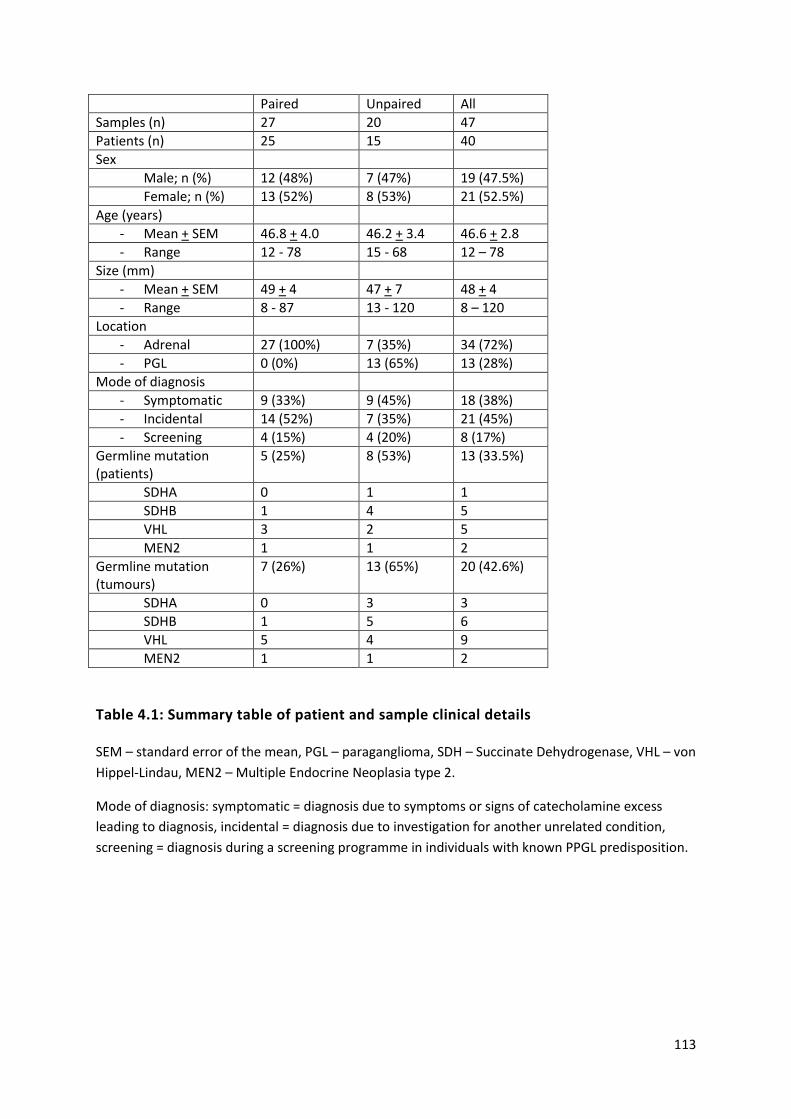
113
Paired Unpaired All
Samples (n) 27 20 47
Patients (n) 25 15 40
Sex
Male; n (%) 12 (48%) 7 (47%) 19 (47.5%)
Female; n (%) 13 (52%) 8 (53%) 21 (52.5%)
Age (years)
- Mean + SEM 46.8 + 4.0 46.2 + 3.4 46.6 + 2.8
- Range 12 - 78 15 - 68 12 – 78
Size (mm)
- Mean + SEM 49 + 4 47 + 7 48 + 4
- Range 8 - 87 13 - 120 8 – 120
Location
- Adrenal 27 (100%) 7 (35%) 34 (72%)
- PGL 0 (0%) 13 (65%) 13 (28%)
Mode of diagnosis
- Symptomatic 9 (33%) 9 (45%) 18 (38%)
- Incidental 14 (52%) 7 (35%) 21 (45%)
- Screening 4 (15%) 4 (20%) 8 (17%)
Germline mutation (patients)
5 (25%) 8 (53%) 13 (33.5%)
SDHA 0 1 1
SDHB 1 4 5
VHL 3 2 5
MEN2 1 1 2
Germline mutation (tumours)
7 (26%) 13 (65%) 20 (42.6%)
SDHA 0 3 3
SDHB 1 5 6
VHL 5 4 9
MEN2 1 1 2
Table 4.1: Summary table of patient and sample clinical details
SEM – standard error of the mean, PGL – paraganglioma, SDH – Succinate Dehydrogenase, VHL – von
Hippel-Lindau, MEN2 – Multiple Endocrine Neoplasia type 2.
Mode of diagnosis: symptomatic = diagnosis due to symptoms or signs of catecholamine excess
leading to diagnosis, incidental = diagnosis due to investigation for another unrelated condition,
screening = diagnosis during a screening programme in individuals with known PPGL predisposition.

114
Sample ID (RNAseq ID)
Sex Age at operation
Phaeo/PGL Location Mode of diagnosis
Syndromic Genetics screening
Gene mutation
Max size/mm
NMN MN 3-MT
1A (H1-2) M 49 Phaeo Right Symptomatic No No 36 - + -
2 A (H3-4) F 71 Phaeo Right Incidental No No 32 + + -
3 A (H5-6) M 12 Phaeo Left Symptomatic No Yes Negative 58 +++ - +
4 A, B (H7-10) M 37 Phaeo Left Screening Yes Yes MEN2 14 - + -
5 A (H11-12) F 31 Phaeo Left Symptomatic No Yes Negative 49 +++ - +
6 A (H13-14) M 18 Phaeo Left Screening Yes Yes VHL 32 ++ - +
7 A (H15-16) M 69 Phaeo Right Incidental No No 80 +++ +++ +
8 A (H17-18) M 39 Phaeo Left Incidental No Yes SDHB 48 + - -
9 A (H19-20) F 34 Phaeo Right Symptomatic No Yes Negative 76 +++ - +
10 A (H21-22) M 64 Phaeo Left Incidental No Yes Negative 33 + - -
11 A, C (H23-24) 12
M 14 14
Phaeo Right Left
Screening Screening
Yes Yes
Yes Yes
VHL VHL
14 8
+ +
- -
+ -
13 F 27 Phaeo Right Symptomatic No Yes Negative 54 +++ - +
14 F 66 Phaeo Right Incidental No No 47 + - -
15 F 69 Phaeo Right Incidental No No 57 + - -
16 17
F 13 13
Phaeo Left Right
Symptomatic Symptomatic
Yes Yes
Yes Yes
VHL VHL
23 49
+++ +++
- -
- -
18 F 35 Phaeo Right Incidental No Yes Negative 73 ++ +++ +
19 F 78 Phaeo Left Incidental No No 45 + ++ -
20 M 63 Phaeo Right Incidental No No 35 + ++ -
21 F 52 Phaeo Right Symptomatic No No 30 + + -
22 M 43 Phaeo Right Incidental No No 56 ++ +++ -
23 M 46 Phaeo Right Symptomatic No Yes Negative 75 ++ - +
24 F 74 Phaeo Left Incidental No No 76 ++ +++ ++
25 F 50 Phaeo Right Incidental No Yes Negative 80 ++ +++ +
26 F 60 Phaeo Right Incidental No No 87 +++ +++ +
27 M 56 Phaeo Right Incidental No No 55 + ++ -
Table 4.2: Clinical details of 27 paired samples of tumour and adjacent adrenal samples from 25 individuals
115
Table 4.2: Clinical details of 27 paired samples of tumour and adjacent adrenal samples from 25 individuals (previous page)
F – female, M – male, Phaeo – phaeochromocytoma, PGL – paraganglioma, SDHB – succinate
dehydrogenase B, VHL – von Hippel-Lindau, MEN2 – Multiple Endocrine Neoplasia Type 2, NMN -
normetanephrine, MN – metanephrine, 3-MT – 3-methoxytramine.
Mode of diagnosis: symptomatic = diagnosis due to symptoms or signs of catecholamine excess
leading to diagnosis, incidental = diagnosis due to investigation for another unrelated condition,
screening = diagnosis during a screening programme in individuals with known PPGL predisposition.
For metanephrines: - not elevated, + elevated 1-5x upper limit of normal (ULN), ++ elevated 5-10x
ULN, +++ elevated >10x ULN.
A Samples included in the RNAseq analysis (RNAseq sample ID in brackets; odd number adrenal
medulla, even number pheochromocytoma)
B Patient 4 had synchronous bilateral disease which was included in RNAseq analysis but
immunochemistry was only available in the left pheochromocytoma
C Patient 11 had metachronous bilateral disease and RNAseq was performed on one set of paired
samples only
Figure 4.1: Primary cilia incidence and length is reduced in phaeochromocytomas relative to adjacent adrenal medullas (next page)
(A) Maximum intensity projections (MIP) of confocal Z-stacks of phaeochromocytoma (phaeo) and adjacent adrenal medulla. Tissue sections were processed for dual-immunofluorescent detection of the ciliary markers acetylated α-tubulin (green) and Arl13b (red) and counterstained with DAPI (blue) to detect nuclei. A single confocal section from the area demarked by the dashed box is shown zoomed (XY zoom). Individual cilia, indicated by arrows, are further enlarged in insets 1-6 and are shown as surface rendered D images in the panels on the right. Scale bars = 10 μm.
Quantification of primary cilia incidence (B, E) and length (C, F) in 27 paired phaeochromocytomas
and adjacent adrenal medullas (adrenal) following treatment as per (A). In (E) and (F), paired
samples are linked by a solid line. Linear regression (D) demonstrates a relationship between cilia
incidence and length in both tissue types.
Number of cells scored per sample for incidence: 2039 + 551 for adrenal medulla and 2359 + 841 for
phaeochromocytoma. Number of cilia measured per sample for length: 186 + 108 for adrenal
medulla and 75 + 55 for phaeochromocytoma. Statistical significance was assessed using a paired t-
test (B, C) and linear regression (D). *** p<0.001.

116
Figure 4.1: Primary cilia incidence and length is reduced in phaeochromocytomas relative
to adjacent adrenal medullas
Legend on previous page
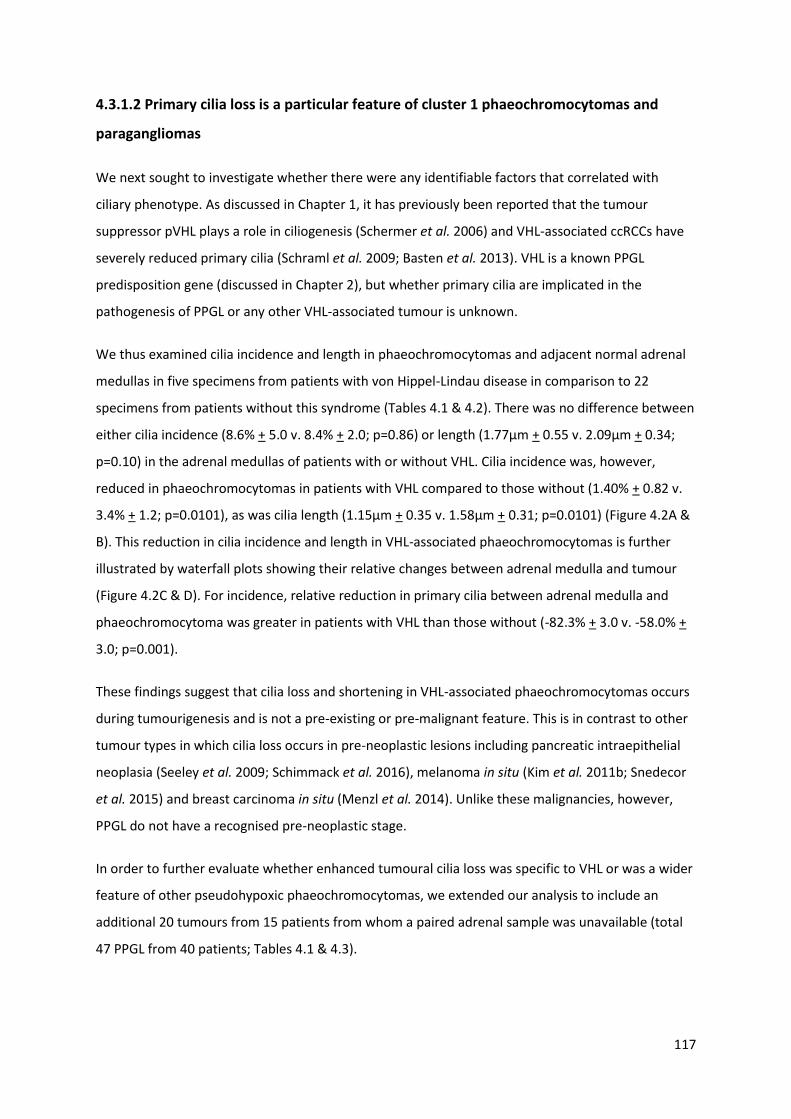
117
4.3.1.2 Primary cilia loss is a particular feature of cluster 1 phaeochromocytomas and
paragangliomas
We next sought to investigate whether there were any identifiable factors that correlated with
ciliary phenotype. As discussed in Chapter 1, it has previously been reported that the tumour
suppressor pVHL plays a role in ciliogenesis (Schermer et al. 2006) and VHL-associated ccRCCs have
severely reduced primary cilia (Schraml et al. 2009; Basten et al. 2013). VHL is a known PPGL
predisposition gene (discussed in Chapter 2), but whether primary cilia are implicated in the
pathogenesis of PPGL or any other VHL-associated tumour is unknown.
We thus examined cilia incidence and length in phaeochromocytomas and adjacent normal adrenal
medullas in five specimens from patients with von Hippel-Lindau disease in comparison to 22
specimens from patients without this syndrome (Tables 4.1 & 4.2). There was no difference between
either cilia incidence (8.6% + 5.0 v. 8.4% + 2.0; p=0.86) or length (1.77μm + 0.55 v. 2.09μm + 0.34;
p=0.10) in the adrenal medullas of patients with or without VHL. Cilia incidence was, however,
reduced in phaeochromocytomas in patients with VHL compared to those without (1.40% + 0.82 v.
3.4% + 1.2; p=0.0101), as was cilia length (1.15μm + 0.35 v. 1.58μm + 0.31; p=0.0101) (Figure 4.2A &
B). This reduction in cilia incidence and length in VHL-associated phaeochromocytomas is further
illustrated by waterfall plots showing their relative changes between adrenal medulla and tumour
(Figure 4.2C & D). For incidence, relative reduction in primary cilia between adrenal medulla and
phaeochromocytoma was greater in patients with VHL than those without (-82.3% + 3.0 v. -58.0% +
3.0; p=0.001).
These findings suggest that cilia loss and shortening in VHL-associated phaeochromocytomas occurs
during tumourigenesis and is not a pre-existing or pre-malignant feature. This is in contrast to other
tumour types in which cilia loss occurs in pre-neoplastic lesions including pancreatic intraepithelial
neoplasia (Seeley et al. 2009; Schimmack et al. 2016), melanoma in situ (Kim et al. 2011b; Snedecor
et al. 2015) and breast carcinoma in situ (Menzl et al. 2014). Unlike these malignancies, however,
PPGL do not have a recognised pre-neoplastic stage.
In order to further evaluate whether enhanced tumoural cilia loss was specific to VHL or was a wider
feature of other pseudohypoxic phaeochromocytomas, we extended our analysis to include an
additional 20 tumours from 15 patients from whom a paired adrenal sample was unavailable (total
47 PPGL from 40 patients; Tables 4.1 & 4.3).

118
We compared PPGLs from patients with germline mutations in VHL, to tumours from patients with
germline mutations in SDHx and those without a known germline mutation in a pseudohypoxia-
linked gene. Cilia incidence was reduced in PPGLs from patients with germline mutations in VHL
(1.4% + 0.8; p=1.5x10⁻⁶) and SDHx (2.2% + 0.7; p=0.0211) relative to PPGLs from patients without a
known germline cluster 1 mutation (4.0% + 0.2) (Figure 4.2E). Cilia length was also reduced in VHL-
(1.22 μm + 0.30) and SDHx- (1.39 μm + 0.38) PPGLs relative to non-cluster 1 tumours (1.65 μm +
0.28), although this was only significant for VHL (p=0.0007 for VHL, p=0.24 for SDHx) (Figure 4.2F).
There was no significant difference between cilia incidence or length in VHL- and SDHx- associated
PPGLs.
Therefore, cilia loss and shortening appears to be a more generalised feature of cluster 1 PPGLs and
not merely limited to VHL, suggesting the presence of additional mechanisms beyond the
microtubule stabilising ability of pVHL.

119
Figure 4.2: Loss of primary cilia is a particular feature of cluster 1 PPGL
Quantification of primary cilia incidence (A) and length (B) in 27 paired phaeochromocytoma and
adjacent adrenal medulla (adrenal) according to VHL mutation status. Waterfall plots demonstrating
change in cilia incidence (C) and length (D) in tumours compared to adjacent adrenal medulla
according to VHL mutation status. Number of cells scored and cilia measured as per Figure 4.1.
Quantification of primary cilia incidence (E) and length (F) in 47 PPGLs with germline mutations in
VHL (n=9), SDHx (n=9) and without a cluster 1 mutation (Non cluster 1; n=29). Cells scored for
incidence: 2618 + 893 per sample; number of cilia measured for length: 84 + 67 per sample.
Statistical significance was assessed using a one-way ANOVA. ns not significant, * p<0.05, ** p<0.01,
*** p<0.001.

120
ID Sex Age at operation
Phaeo/PGL Location Mode of diagnosis
Syndromic Genetics screening
Gene mutation
Max size/mm
NMN MN 3-MT
28 M 43 PGL H&N Symptomatic Yes Yes SDHB 20 - - -
29 F 44 PGL H&N Symptomatic Yes Yes SDHB 18 - - -
30 F 68 PGL Bladder Symptomatic Yes Yes SDHB 45 + - +++
31 32 33
F 49 PGL Thoracic Symptomatic Yes Yes Yes
Yes Yes Yes
SDHA SDHA SDHA
58 + - ++
34 35 36
M 15 Phaeo Right Screening Screening Screening
Yes Yes Yes
Yes Yes Yes
VHL VHL VHL
35 + - -
37 F 43 Phaeo Right Incidental No Yes Negative 60 +++ + -
38 F 53 PGL Abdo Incidental No No 56 + - -
39 M 45 Phaeo Right Symptomatic No No 110 +++ +++ +
40 M 66 Phaeo Right Incidental No Yes Negative 120 +++ - ++
41 F 50 PGL Abdo Incidental No No 52 ++ - -
42 F 36 PGL Abdo Symptomatic Yes Yes VHL 25 + - -
43 M 65 PGL Abdo Incidental No No 45 + - -
44 M 39 PGL H&N Symptomatic No Yes Negative 20 - - -
45 M 37 Phaeo Right Screening Yes Yes MEN2 13 - + -
46 47
F 40 PGL Abdo
Incidental Yes Yes SDHB 39 33
+ - -
Table 4.3: Clinical details of 20 tumour samples from 15 individuals
F – female, M – male, Phaeo – phaeochromocytoma, PGL – paraganglioma, H&N – head and neck, abdo – abdominal, SDH – succinate dehydrogenase, VHL -
von Hippel-Lindau, MEN2 – Multiple Endocrine Neoplasia Type 2, NMN – normetanephrine, MN – metanephrine, 3-MT – 3-methoxytramine.
Mode of diagnosis: symptomatic = diagnosis due to symptoms or signs of catecholamine excess leading to diagnosis; incidental = diagnosis due to
investigation for another unrelated condition; screening = diagnosis during a screening programme in individuals with known PPGL predisposition.
Metanephrines: - not elevated, + elevated 1-5x ULN, ++ elevated 5-10x ULN, +++ elevated >10x ULN.

121
4.3.1.3 PPGL primary cilia incidence is associated with a number of clinical parameters
Having established that ciliary loss was most pronounced in individuals with cluster 1 mutations, we
sought to examine whether other clinical variables might also be associated with ciliary incidence
and length. The previously described 47 PPGLs were thus classified according to a range of clinical
parameters (Figure 4.3).
Patient sex did not alter ciliary incidence (p=0.059) or length (p=0.77) (Figure 4.3A & B) and no
relationship was observed when menopausal status was considered (as a surrogate for oestrogen
exposure) (p=0.65; data not shown). As expected, phaeochromocytoma laterality was not associated
with changes in primary cilia (Figure 4.3E & F; p=0.15 for incidence, p=0.53 for length), nor was
tumour site (Figure 4.3G & H; p=0.40 for incidence, p=0.28 for length). Maximal tumour dimension
was also independent of primary cilia incidence (Figure 4.3M; p=0.11) and length (Figure 4.3N;
p=0.20).
When age at time of surgery was considered, no correlation between cilia incidence (p=0.45) or
length (p=0.14; data not shown) was observed. However, patients under the age of 18 had tumour
cells with fewer (1.6% + 0.9 v. 4.0% + 2.1; p=0.0097) and shorter (1.18μm + 0.32 v. 1.61μm + 0.31;
p=0.0040) cilia (Figure 4.3 C & D), suggesting an association between cilia loss and age at time of
operation.
PPGLs can generally be diagnosed in one of three ways: when there is a clinical suspicion due to
signs and symptoms, as an incidental finding on imaging or as part of a screening programme in
individuals with a known PPGL predisposition. Tumours from patients diagnosed on screening had
fewer cilia than those diagnosed incidentally (2.0% + 1.2 v. 4.1% + 2.1; p=0.04; Figure 4.3I) and a
non-significant tendency towards shorter cilia (1.40μm + 0.35 v. 1.66μm + 0.29; p=0.16; Figure 4.3J).
There was no difference between symptomatic patients and those diagnosed incidentally (p=0.55 for
incidence, p=0.08 for length) or on screening (p=0.31 for incidence, p=0.16 for length).
Tumours that secreted metanephrine had increased cilia incidence (Figure 4.3K; 4.1% + 1.8 v. 2.3% +
1.5, p=0.0007) and length (Figure 4.3L; 1.64m + 0.31 v. 1.38μm + 0.31, p=0.0074) compared to those
that didn’t. This finding is explored further in Chapter 5.
Thus, a younger age at operation, the method of diagnosis and the secretory profile all appear to be
associated with primary cilia incidence and length. Whether these are independent of one another
remains to be determined and could potentially be explained by the confounding effect of cluster 1
mutations. Individuals with VHL and SDHx mutations develop PPGLs at a younger age and are more
122
likely to be enrolled in screening programmes. In addition, cluster 1 PPGLs are predominantly
normetanephrine producing and therefore the positive effect of metanephrine may be a reflection
of the negative genetic influence on cilia in these tumours.
As the presence of a primary cilium is potentially a checkpoint for cell division, we tested if cilia loss
correlated with cellular proliferation in PPGLs. This was measured through routine clinical
quantification of the percentage of cells displaying positive immunohistochemistry for Ki67, a
marker of proliferative activity. Ki67 index has previously been correlated with malignant potential in
PPGLs (Clarke et al. 1998) and is used in the GAPP histological grading system (Kimura et al. 2014).
Cilia incidence was reduced in PPGLs with a Ki67 index of 3% of higher (Figure 4.3O; 2.8% + 1.1 v.
4.4% + 2.2; p=0.034) and there was a non-significant tendency towards shorter cilia (Figure 4.3P;
1.51μm + 0.38 v. 1.67μm + 0.20; p=0.13). This observation suggests that ciliary incidence may be
reduced in tumours with an increased rate of cellular proliferation.

123
Figure 4.3: PPGL primary cilia incidence and length is correlated with clinical and
pathological parameters
Quantification of tumoural cilia incidence (A, C, E, G, I, K, M, O) and length (B, D, F, H, J, L, N, P)
according to sex (A, B), age at diagnosis (C, D), laterality if a phaeochromocytoma (E, F), location (G,
H), method of diagnosis (I, J), metanephrine secretion (K, L), maximal diameter (M, N) and Ki67
labelling index (O, P) in 47 PPGLs from 40 patients.
Phaeo – phaeochromocytoma, PGL – paraganglioma, sx – symptomatic, inc – incidental, screen –
screening.
Statistical tests: unpaired t-test (A-H, K, L, O, P), one-way ANOVA (I, J), linear regression (M, N). * p<
0.05, ** p<0.01, *** p<0.001. Where no star is evident, p>0.05.

124
4.3.1.4 RNA sequencing transcriptome analysis reveals that cilia-mediated signalling
pathways are disrupted in phaeochromocytomas
Having identified that primary cilia loss and shortening is a feature of phaeochromocytomas relative
to adrenal medullas, we next sought to examine whether these structural changes were associated
with alterations in cilia-mediated signalling.
RNA was extracted and sequenced from 12 paired samples of phaeochromocytomas and adjacent
adrenal medullas at the time of adrenalectomy (Table 4.2). Reads were pseudo-aligned, aggregated
to gene-level, filtered, normalised and transformed to leave 17,198 genes for exploratory data
analysis (please see Chapter 3 and appendix for detailed methodology). These pre-processing steps
resulted in data that were approximately normally distributed (see appendix) and enabled
generation of a sample similarity matrix by calculating the pairwise Euclidean distance between all
samples, visualised as a heatmap and hierarchical clustering dendrogram (Figure 4.4A). This shows
perfect sample separation by tissue type, with the exception of sample H21, which is incorrectly
grouped with the tumour samples; interestingly this sample clusters closely with H22, its matching
tumour sample.
Principal component analysis (PCA; Figure 4.4B) revealed that principal component 1, which
accounts for over 40% of variation in the data, clearly separated the samples by tissue type. Again,
the adrenal sample H21 is a clear outlier from the other adrenal samples, although it does remain
separated from the tumour samples by principal component 1 and its closest data point remains its
matched tumour partner H22. Phaeochromocytoma samples are spread along the second principal
component, which accounts for over 10% of variation, indicating a heterogeneity in this group that is
absent in the adrenal medulla samples. An alternate approach to projecting high-dimensional
datasets with just two axes is t-distributed stochastic neighbour embedding (t-SNE; Figure 4.4C)
which explicitly aims to preserve local structure when mapping a large matrix onto a low-
dimensional subspace. This approach clearly separates tumour and adrenal samples, although the
tumour sample heterogeneity evident on the PCA plot is lost due to the algorithm’s emphasis on
preserving each data point’s proximity to its nearest neighbour. Again, sample H21 is misclassified
and this is particularly apparent, although it remains close to its paired sample.
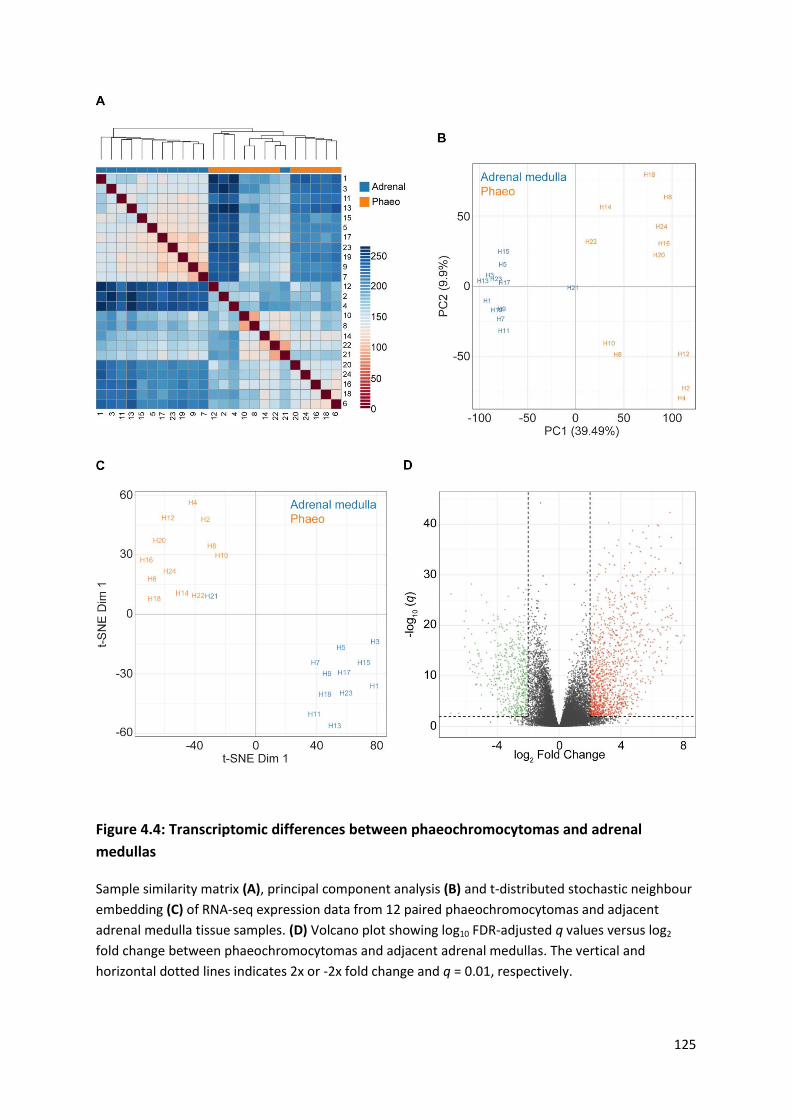
125
Figure 4.4: Transcriptomic differences between phaeochromocytomas and adrenal
medullas
Sample similarity matrix (A), principal component analysis (B) and t-distributed stochastic neighbour
embedding (C) of RNA-seq expression data from 12 paired phaeochromocytomas and adjacent
adrenal medulla tissue samples. (D) Volcano plot showing log10 FDR-adjusted q values versus log2
fold change between phaeochromocytomas and adjacent adrenal medullas. The vertical and
horizontal dotted lines indicates 2x or -2x fold change and q = 0.01, respectively.

126
Differential expression analysis was performed using the DESeq2 software package (Love et al.
2014). We defined a gene as differentially expressed if its absolute log fold change was > 2 and its q-
value was < 0.01, imposing a 1% false discovery rate (FDR). This strict threshold ensured high
specificity. Overall, 1839 genes met these criteria, representing 8% of the transcriptome after
filtering (Figure 4.4D).
To test whether cilia function was altered in phaeochromocytomas relative to adjacent adrenal
medullas, we curated a collection of 32 cilia-related gene sets from public databases including Gene
Ontology (http://geneontology.org/), the Kyoto Encyclopedia of Genes and Genomes
(https://www.genome.jp/kegg/), Biocarta (https://cgap.nci.nih.gov/Pathways/BioCarta_Pathways),
The Pathway Interaction Database (Schaefer et al. 2009) and the Hallmark Gene Set Collection
(Liberzon et al. 2015). Pathway enrichment was tested using a modified version of the QuSAGE
algorithm (Yaari et al. 2013; Turner et al. 2015) and was significant in 14 pathways (44%). To
visualise these pathway-level differences, we created a matrix of eigengenes by taking the first
principal component of each pathway across all samples and plotting this as a heatmap (Figure 4.5).
Using this approach, hierarchical clustering now classifies all samples by tissue type, including H21.
Altered gene modules include those associated both with cilia structure and cilia-mediated signalling
pathways.
Both gene modules associated with cilia structure demonstrate altered expression in
phaeochromocytomas relative to adrenal medullas: GO_NONMOTILE_PRIMARY_CILIUM (q = 2.6x10-
13) and GO_NONMOTILE_PRIMARY_CILIUM_ASSEMBLY (q = 6.1x10⁻⁹), suggesting that changes in
gene expression may contribute to the observed cilia loss in phaeochromocytomas.
Hierarchical clustering analysis of the expression of the 137 component genes that make up the
GO_NONMOTILE_PRIMARY_CILIUM module (Figure 4.6) correctly classifies all samples, with one
exception (H21).

127
Figure 4.5: Cilia-associated gene networks are differently expressed between
phaeochromocytoma and adrenal medullas
Heat map and hierarchical clustering dendrogram depicting differently expressed module
eigengenes, between phaeochromocytomas and adrenal medullas, from a collection of 32 gene sets
known to be associated with cilia structure and cilia-mediated signalling.
Numbers correspond with sample IDs as per Table 4.2.

128
A number of gene modules associated with cilia-mediated signalling are also altered between
phaeochromocytomas and adrenal medullas. They include gene modules associated with Hedgehog,
Wnt and Notch signalling, for example HALLMARK_HEDGEHOG_SIGNALING (q = 1.66 x10⁻⁷),
BIOCARTA_WNT_PATHWAY (q = 1.52 x10⁻⁶) and
GO_NEGATIVE_REGULATION_OF_NOTCH_SIGNALING_ PATHWAY (q = 1.58 x10⁻⁶). Analyses of these
gene modules revealed significant upregulation and downregulation of individual genes (absolute
log fold change > 2, q < 0.01) while hierarchical clustering analyses separately grouped tumours and
adrenal medulla samples in each of these pathways with the exception of one medulla sample (H21)
in the Hedgehog and Notch pathways and two tumour samples (H10 and H22) in the Wnt pathway
(Figure 4.7A-C). These data are consistent with cilia-mediated signalling pathways being disrupted in
phaeochromocytomas.
In addition, expression of the Aurora-A gene module was altered between the two sample groups (q
= 0.00036), suggesting a possible mechanistic role for Aurora-A, which is known to play a role in the
regulation of ciliary disassembly. Furthermore, modulation of mTOR signalling, which in addition to
its ciliary association is also implicated in PPGL pathogenesis, was also altered (q = 0.00061).
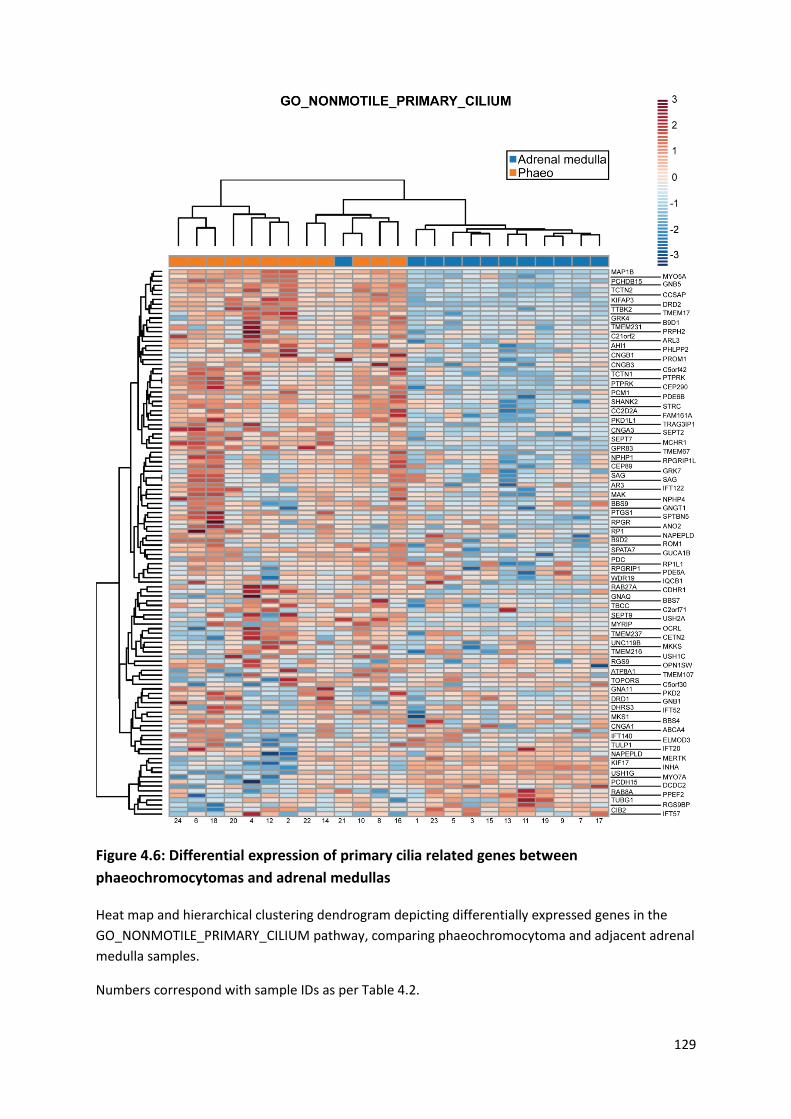
129
Figure 4.6: Differential expression of primary cilia related genes between
phaeochromocytomas and adrenal medullas
Heat map and hierarchical clustering dendrogram depicting differentially expressed genes in the
GO_NONMOTILE_PRIMARY_CILIUM pathway, comparing phaeochromocytoma and adjacent adrenal
medulla samples.
Numbers correspond with sample IDs as per Table 4.2.

130
Figure 4.7: Differential expression of primary cilia-mediated signalling pathways between phaeochromocytomas and adrenal medullas
Heat map and hierarchical clustering dendrogram depicting differentially expressed genes in three cilia-associated signalling pathways that are altered in
phaeochromocytomas relative to adjacent adrenal medullas: (A) HALLMARK_HEDGEHOG_SIGNALLING, (B) BIOCARTA_WNT_PATHWAY, (C)
GO_NEGATIVE_EREGULATION_OF_NOTCH_SIGNALLING_PATHWAY.
Numbers correspond with sample IDs as per Table 4.2.
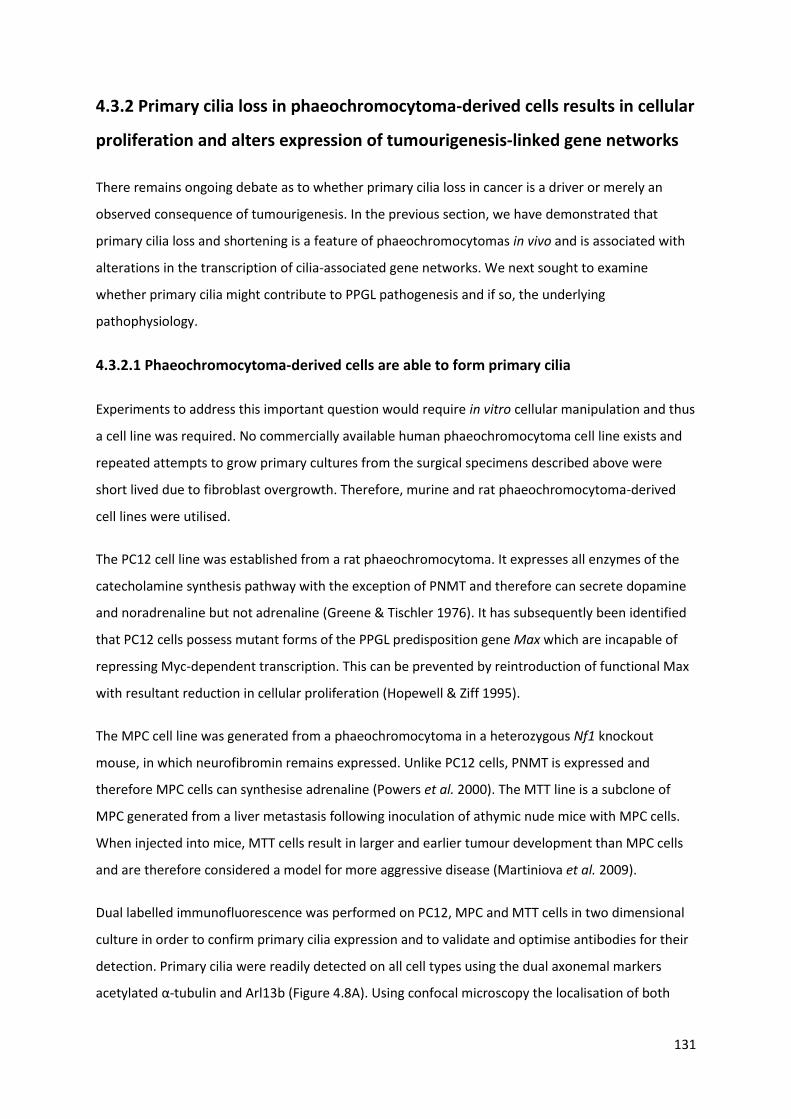
131
4.3.2 Primary cilia loss in phaeochromocytoma-derived cells results in cellular
proliferation and alters expression of tumourigenesis-linked gene networks
There remains ongoing debate as to whether primary cilia loss in cancer is a driver or merely an
observed consequence of tumourigenesis. In the previous section, we have demonstrated that
primary cilia loss and shortening is a feature of phaeochromocytomas in vivo and is associated with
alterations in the transcription of cilia-associated gene networks. We next sought to examine
whether primary cilia might contribute to PPGL pathogenesis and if so, the underlying
pathophysiology.
4.3.2.1 Phaeochromocytoma-derived cells are able to form primary cilia
Experiments to address this important question would require in vitro cellular manipulation and thus
a cell line was required. No commercially available human phaeochromocytoma cell line exists and
repeated attempts to grow primary cultures from the surgical specimens described above were
short lived due to fibroblast overgrowth. Therefore, murine and rat phaeochromocytoma-derived
cell lines were utilised.
The PC12 cell line was established from a rat phaeochromocytoma. It expresses all enzymes of the
catecholamine synthesis pathway with the exception of PNMT and therefore can secrete dopamine
and noradrenaline but not adrenaline (Greene & Tischler 1976). It has subsequently been identified
that PC12 cells possess mutant forms of the PPGL predisposition gene Max which are incapable of
repressing Myc-dependent transcription. This can be prevented by reintroduction of functional Max
with resultant reduction in cellular proliferation (Hopewell & Ziff 1995).
The MPC cell line was generated from a phaeochromocytoma in a heterozygous Nf1 knockout
mouse, in which neurofibromin remains expressed. Unlike PC12 cells, PNMT is expressed and
therefore MPC cells can synthesise adrenaline (Powers et al. 2000). The MTT line is a subclone of
MPC generated from a liver metastasis following inoculation of athymic nude mice with MPC cells.
When injected into mice, MTT cells result in larger and earlier tumour development than MPC cells
and are therefore considered a model for more aggressive disease (Martiniova et al. 2009).
Dual labelled immunofluorescence was performed on PC12, MPC and MTT cells in two dimensional
culture in order to confirm primary cilia expression and to validate and optimise antibodies for their
detection. Primary cilia were readily detected on all cell types using the dual axonemal markers
acetylated α-tubulin and Arl13b (Figure 4.8A). Using confocal microscopy the localisation of both
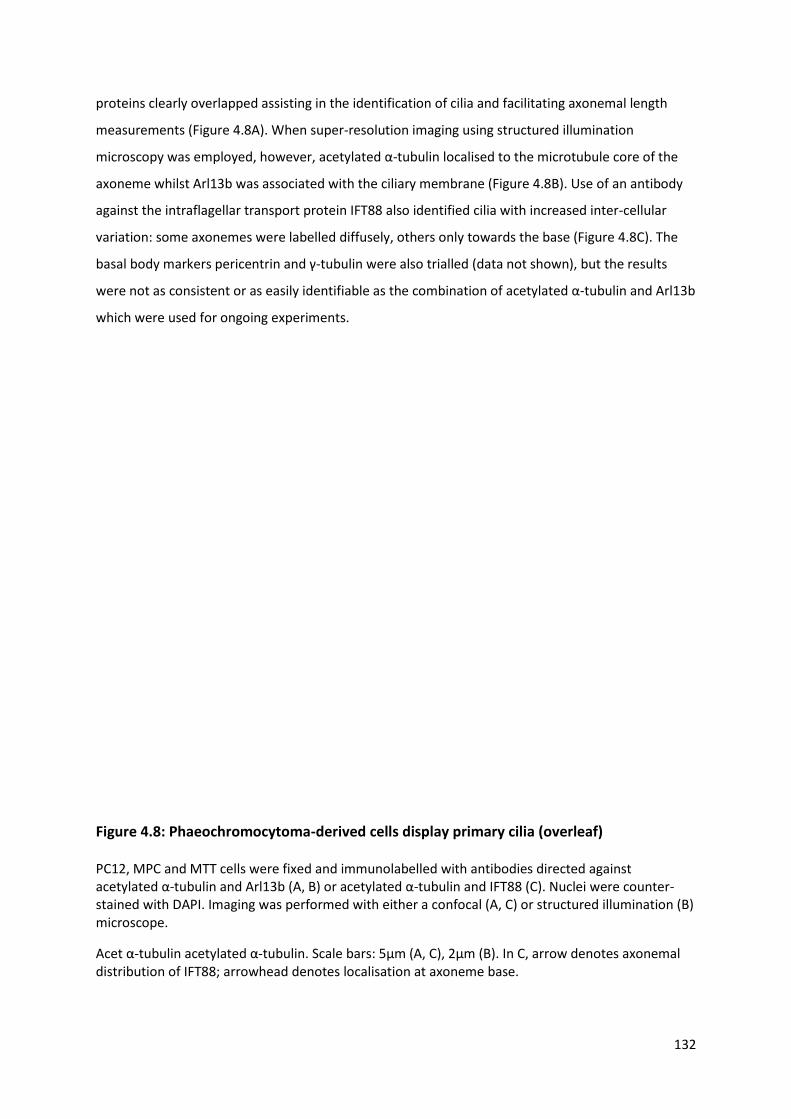
132
proteins clearly overlapped assisting in the identification of cilia and facilitating axonemal length
measurements (Figure 4.8A). When super-resolution imaging using structured illumination
microscopy was employed, however, acetylated α-tubulin localised to the microtubule core of the
axoneme whilst Arl13b was associated with the ciliary membrane (Figure 4.8B). Use of an antibody
against the intraflagellar transport protein IFT88 also identified cilia with increased inter-cellular
variation: some axonemes were labelled diffusely, others only towards the base (Figure 4.8C). The
basal body markers pericentrin and γ-tubulin were also trialled (data not shown), but the results
were not as consistent or as easily identifiable as the combination of acetylated α-tubulin and Arl13b
which were used for ongoing experiments.
Figure 4.8: Phaeochromocytoma-derived cells display primary cilia (overleaf)
PC12, MPC and MTT cells were fixed and immunolabelled with antibodies directed against acetylated α-tubulin and Arl13b (A, B) or acetylated α-tubulin and IFT88 (C). Nuclei were counter-stained with DAPI. Imaging was performed with either a confocal (A, C) or structured illumination (B) microscope.
Acet α-tubulin acetylated α-tubulin. Scale bars: 5μm (A, C), 2μm (B). In C, arrow denotes axonemal distribution of IFT88; arrowhead denotes localisation at axoneme base.

133

134
In order to identify and accurately measure primary cilia, it is important to consider their
orientation. PC12 cells were grown in monolayer culture before fixation and processing for primary
cilia detection with antibodies against acetylated α-tubulin and Arl13b. Confocal Z-stacks were
obtained and primary cilia could be classified as either arising from the cell’s basal or apical surface
through examination of their orthogonal projections (Figure 4.9A). Over 80% of primary cilia in PC12
cells were basal with similar results for both MPC and MTT cells (Figure 4.9B). This facilitates cilia
length measurement from maximum intensity projections as basal cilia are more limited to the XY
dimension than apical cilia (discussed in Chapter 7).
Ciliogenesis can be experimentally stimulated by forcing cells into S-phase, for example by serum-
starvation or contact inhibition (Wheatley et al. 1996; Alieva et al. 1999). PC12 cells were plated in
complete media for 24 hours to allow attachment before the media was changed to serum-free
media. Cells were fixed and processed as previously described at a variety of time points (Figure
4.9C). At baseline, only a small proportion of PC12 cells displayed a primary cilium (8.4% + 0.75) and
they were short (1.49 μm + 0.41). Cilia incidence increased with increasing duration of serum
starvation (Figure 4.9D). This effect was seen after 8 hours (30.0% + 2.3; p=0.0010) and persisted to
72 hours (77.0% + 2.3; p=2.3x10⁻³⁴). Cilia length also increased with increasing duration of serum
starvation (Figure 4.9E). Again, this effect was observed after 8 hours (1.79μm + 0.53; p=0.0022) and
continued to 72 hours (2.08 μm + 0.64; p=2.7x10⁻⁶). Beyond 72 hours of serum starvation, cell death
began to occur.
A common experimental approach is to deliberately maximise cilia prevalence by growing cells to
confluence in serum-free media for a prolonged period of time (Wheatley et al. 1996; Alieva et al.
1999). This however limits interpretation of the dynamics of ciliary assembly and disassembly; the 24
hour time point, which sits within the ‘dynamic range’ of ciliogenesis, was chosen for further
experiments for this reason.
MPC and MTT cells were plated for 24 hours in complete media to allow attachment before a further
24 hours of culture in either serum-free or serum-containing media (Figure 4.9F). In MPC cells, cilia
incidence was greater in serum-free conditions (Figure 4.9G; 76.1% + 10.1 v. 60.4% + 14.8; p=.2 x10-
6), as was cilia length (Figure 4.9H; 2.87μm + 0.78 v. 2.25μm + 0.70; p =8.5 x10⁻¹⁶). The same effect
was seen in MTT cells, with serum-starvation increasing cilia incidence (64.5% + 12.2 v. 54.3% + 12.1;
p=0.018) and length (2.77μm + 0.62 v. 2.30μm + 0.60; p=1.6x10⁻⁷). There was no difference between
MPC and MTT cilia incidence and length in serum-containing media (p=0.99 and 0.74 respectively),
but there was following serum-starvation (p=0.0031 and 0.00065 respectively).

135
Thus, phaeochromocytoma-derived cells have the potential to display primary cilia, which can be
stimulated by serum starvation.
Figure 4.9: Primary cilia on phaeochromocytoma-derived cells are predominantly basal and are stimulated by serum starvation (overleaf)
Confocal images of PC12 (A, C), MPC and MTT (F) cells cultured in the absence of serum for between 0 and 72 hours (24 hours if not specified). Cells were immunolabelled with anti-acetylated α-tubulin (green) and anti-Arl13b (red) for detection of primary cilia. Nuclei were stained with DAPI (blue). Cilia are either numbered and shown in orthogonal section in the corresponding boxes (A) or are indicated by arrows, or arrowheads, where they are also shown zoomed in the insets (A, F). Scale bars = 10μm.
(B) Quantification of primary cilia cellular position in PC12, MPC and MTT cells following treatment as per (A).
Quantification of primary cilia incidence (D, G) and axonemal length (E, H) following treatment as per (A). Error bars indicate + SEM, boxes 25th, 50th and 75th centiles and whiskers the 10th and 90th centiles. Number of cells scored for incidence: 2186 + 379 per condition. Number of cilia measured for length: 256 + 23.
Statistical tests: one-way ANOVA. * p<0.05, ** p<0.01, *** p<0.001.

136
Figure 4.9: Primary cilia on phaeochromocytoma-derived cells are predominantly basal
and are stimulated by serum starvation
Legend on previous page

137
4.3.2.2 Loss of primary cilia in phaeochromocytoma-derived cells promotes cellular
proliferation
Having established that PC12 cells can form primary cilia, we set out to investigate the effect of
primary cilia loss. We hypothesised that siRNA-mediated knockdown of key contributors to ciliary
assembly would result in reduced cilia formation and would therefore provide insight into its
consequences.
PC12 cells were transfected with Ift88, centrosomal protein 164 (Cep164) or non-targeting control
siRNAs for 48 hours prior to processing. IFT88 is a central component of the intraflagellar transport
complex (Pazour et al. 2000), whilst Cep164 contributes to microtubule organisation and
maintenance during ciliary formation (Graser et al. 2007). Loss of either would be expected to result
in reduced cilia formation.
Knockdown of Ift88 was confirmed at protein level by immunoblot (Figure 4.10A & B) and at
transcript level by qPCR for Cep164 (Figure 4.10E).
Primary cilia incidence (Figure 4.10C & F) was reduced following knockdown of Ift88 (8.9% + 5.2 v.
32.2% + 9.7; p=3.9x10⁻¹⁵) and Cep164 (21.1% + 7.5 v. 43.6% + 6.8; p=0.0022) compared to non-
targeting controls. Cilia length (Figure 4.10 D & G) was also reduced following Ift88 (1.48μm + 0.42 v.
1.96μm + 0.46; p=3.0x10⁻¹²) and Cep164 (2.15μm + 0.39 v. 2.99μm + 0.49; p=1.8x10⁻⁹) knockdown
compared to non-targeting control siRNAs.
In addition to immunolabelling to detect primary cilia, transfected cells were exposed to antibodies
against the proliferation marker Ki67 (Figure 4.10H). The percentage of PC12 cells positive for Ki67
was greater following both Ift88 (p=4.4x10⁻¹²) and Cep164 (p=0.039) knockdown compared to non-
targeting controls (Figure 4.10I & K). Moreover, cells that had nuclear accumulation of Ki67 did not
have a primary cilium (Figure 4.10H) supporting a role for primary cilia opposing cell division.
Increased cellular proliferation following Ift88 and Cep164 knockdown, relative to non-targeting
controls, was further confirmed through quantification of cell numbers 48 hours after siRNA
transfection (Figure 4.10J & L).
Thus, increased cellular proliferation is a direct consequence of primary cilia loss, achieved by
reducing ciliogenesis, in phaeochromocytoma-derived cells.

138
Figure 4.10 Loss of primary cilia in PC12 cells promotes cellular proliferation (overleaf)
(A) Immunoblot of total cell lysates from PC12 cells transfected with siRNAs targeting IFT88 or non-
targeting control siRNAs (Con). Cell lysates were generated 48 hours after transfection and
immunoblots probed with an anti-IFT88 antibody and anti-β-actin as a loading control.
(B) Densitometric analyses were performed and mean relative IFT88 protein levels calculated (n=6).
Data were normalised to β-actin.
(C, D) Quantification of cilia incidence (C) and length (D) in cells 48h following treatment as in (A).
(E) Relative RNA expression of Cep164 in PC12 cells 48 hours after transfection with siRNAs targeting
this transcript. Cep164 levels are expressed relative to those in cells transfected with non-targeting
control siRNAs (arbitrary units). Data was normalized to levels of peptidylpropyl isomerase A.
(F, G) Quantification of cilia incidence (F) and length (G) in cells 48h following treatment as in (A).
(H) Confocal images of PC12 cells cultured for 48 h after transfection with siRNA targeting IFT88,
Cep164 or non-targeting control siRNAs (Con). Cells were immunolabelled to detect cilia (Arl13b,
green) and the proliferation marker Ki67 (red). Nuclei were stained with DAPI (blue). Cilia are
indicated by arrows and Ki67 positive cells by arrowheads. Scale bars = 10 μm.
(I-L) Quantification of the percentage of Ki67 positive cells (I, K), and relative cell numbers (J, L), 48 h
after transfection with siRNA targeting IFT88 (I, J) or Cep164 (K, L) compared to non-targeting
controls.
Error bars indicate + SEM, boxes 25th, 50th and 75th centiles and whiskers the 10th and 90th centiles.
Number of cells scored for incidence: 1430 + 130 per condition. Number of cilia measured for length:
108 + 15 per condition. Ki67 scoring was performed in ten randomly selected fields for each
experimental condition in three biological replicates. Cell counting was performed on six samples
from three biological replicates.
Statistical tests: t-test (B-G, I, K), one-way ANOVA (J, L). * p<0.05, ** p<0.01, *** p<0.001.
139
140
4.3.2.3 Loss of primary cilia in phaeochromocytoma-derived cells promotes transcriptional
changes associated with tumourigenesis
Having identified that Ift88 knockdown in PC12 cells results in cilia loss and increased cellular
proliferation, we sought to examine how cilia function might further impact on cellular processes in
this context by comparing the transcriptomes of cells in which primary cilia had been reduced.
RNA was extracted and sequenced from PC12 cells that had been transfected with Ift88 or non-
targeting siRNAs. Reads were pseudo-aligned and subjected to the same pre-processing steps as the
human tissue samples described earlier in this chapter (also see Chapter 3). Principal component
analysis was performed and principal component 1, which accounted for over 30% of variation,
clearly separated the Ift88 knockdown and control cells (Figure 4.11A). 662 genes, representing 6%
of the transcriptome after filtering, were differentially expressed at log fold change > 2 and q < 0.01
(Figure 4.11B).
Functional analysis of the observed differential gene expression between Ift88 knockdown and
control cells was performed using Ingenuity Pathway Analysis (Ingenuity Systems). This gene
ontology (GO) analysis revealed that the top ten biological processes of these genes were related to
cell death, cell proliferation and tumourigenesis. Moreover, activation z-scores suggested that cell
death pathways (cell death, necrosis, apoptosis, cell death of tumour cells) were inhibited, while
proliferation and tumourigenesis pathways were induced (tumourigenesis of tissue, cell proliferation
of tumour cells, non-melanoma solid tumour, gastrointestinal neoplasia) (Figure 4.11C).
Hierarchical cluster analysis of gene modules described by the GO terms ‘cell death’, ‘tumorigenesis
of tissues’ and ‘cell proliferation of tumour cells’ clearly separates IFT88 knockdown samples from
controls (Figure 4.11D-F).
These data suggest that cilia loss promotes cellular proliferation in phaeochromocytoma-derived
PC12 cells.
In combination with the observation that primary cilia loss is a feature of human
phaeochromocytomas, this provides evidence that primary cilia loss in phaeochromocytomas
contributes to cellular proliferation and tumourigenesis rather than merely reflecting it.
141
Figure 4.11: IFT88 knockdown in PC12 cells promotes transcriptional changes associated
with tumourigenesis (overleaf)
(A) Principal component analysis (PCA) of RNA-seq expression data from IFT88 knockdown (R10-R12) and control cells (R13-R15; n=3 per condition). (B) Volcano plot showing log10 FDR-adjusted q-values versus log2 fold change between IFT88 knockdown and control cells. The vertical and horizontal dotted lines indicate 2x or -2x fold change and p = 0.01, respectively. (C) Gene Ontology (GO) analysis of the transcriptome of PC12 cells transfected with siRNA targeting IFT88 or non-targeting control siRNAs showing the top-ranking altered biological processes identified by Ingenuity Pathways Analysis. q values are depicted in red (E = 10 to the power of the following number). (D-F) Heat map and hierarchical clustering dendrograms of differentially expressed genes in altered pathways with the GO terms cell death (D), tumorigenesis of tissues (E) and cell proliferation of tumor cells (F). Numbers shown at the bottom of the heat maps correspond to sample IDs as in (A).
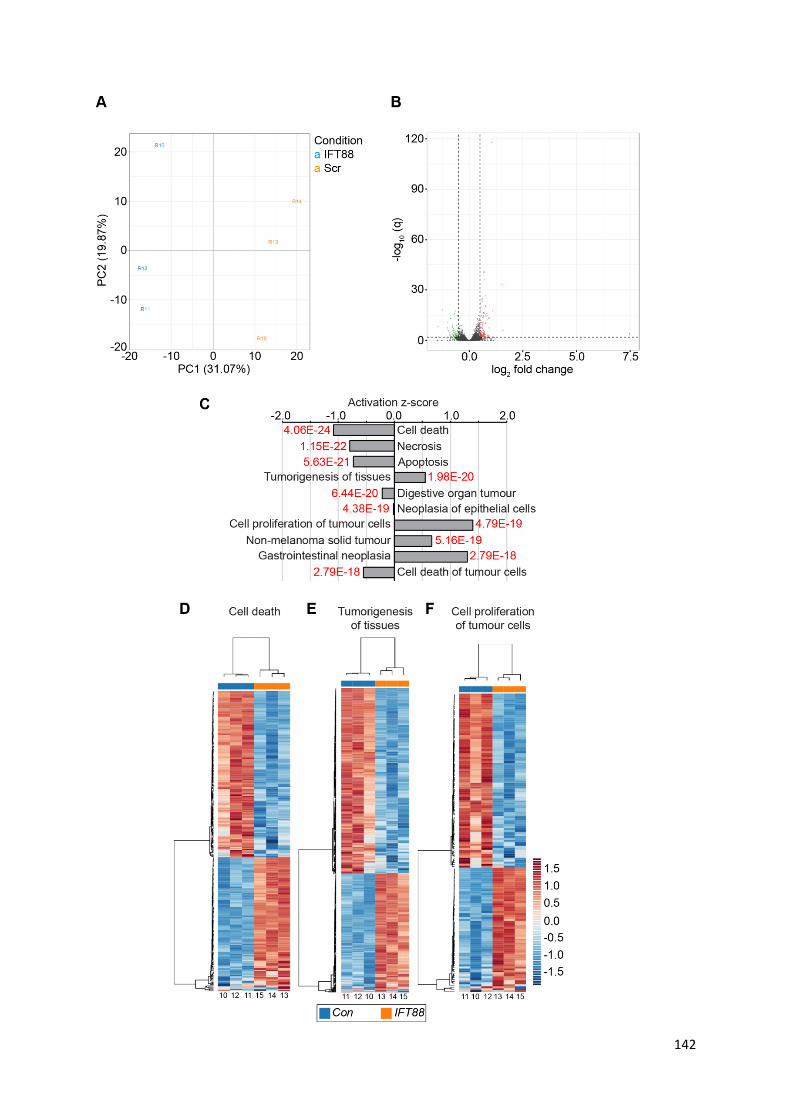
142
143
4.4 Discussion
In this chapter, I have demonstrated that primary cilia incidence and length are reduced in
phaeochromocytomas compared to adjacent normal adrenal medullas. This alteration is most
pronounced in cluster 1 pseudohypoxic tumours and appears to be associated with a variety of
clinical and pathological variables including proliferation index. Utilising the PC12 cell line, I have
subsequently demonstrated that cilia loss directly results in increased cellular proliferation and
transcriptional changes which are oncogenic.
4.4.1 Primary cilia loss in human phaeochromocytomas
We observed that primary cilia incidence and length were reduced in 27 phaeochromocytomas
relative to paired adjacent normal adrenal medullas (Figure 4.1A-C).
Although primary cilia have been detected by electron microscopy (EM) in the rat adrenal medulla
(Coupland 1965) and on a single HNPGL (Murata et al. 1984), the data presented here are the first to
demonstrate that primary cilia loss is a feature of phaeochromocytomas. This finding is consistent
with observations in other tumours that arise from the embryonic neuroectoderm (Han et al. 2009;
Kim et al. 2011b; Loskutov et al. 2018), as well as those of endodermal (Nielsen et al. 2008;
Hassounah et al. 2013) and mesodermal (Schraml et al. 2009; Basten et al. 2013; Ho et al. 2013)
origin.
Interestingly, the presence or absence of primary cilia in medulloblastoma is variable and is
governed by the initiating oncogenic event (Han et al. 2009). Primary cilia persist in cells of classical
and desmoplastic variants, in which Wnt and Hh signalling activation requires primary cilia, but not
in the anaplastic variants, where Hh activation occurs downstream of primary cilia and is repressed
by their presence (Han et al. 2009). In phaeochromocytomas, cilia were universally lost and there
was no suggestion of a dual role for primary cilia in this context (Figure 4.1E & F).
Primary cilia loss was enhanced in phaeochromocytomas from patients with germline mutations in
the PPGL predisposition gene VHL (Figure 4.2A & B). Primary cilia loss is a feature of renal cysts
(Esteban et al. 2006) and ccRCC (Schraml et al. 2009; Basten et al. 2013) in which VHL has been
inactivated and thus our findings expand the range of VHL-associated pathologies in which primary
cilia are implicated. pVHL localises to primary cilia (Schermer et al. 2006; Lolkema et al. 2008) where
it binds and stabilises microtubules (Okuda et al. 1999; Hergovich et al. 2003, 2006; Schermer et al.
2006; Lolkema et al. 2007). Disruption of this process by VHL loss or through mutations in the

144
microtubule-binding domain, which is a mutational hotspot in VHL (Hergovich et al. 2003), might
therefore explain the ciliary loss in VHL through reduced ciliary assembly (Dere et al. 2015) or
enhanced disassembly (Frew et al. 2008).
No difference was observed between cilia in normal adrenal medullas in patients with VHL and those
without (Figure 4.2A & B), suggesting that cilia loss and shortening occurs during tumourigenesis and
is not a pre-existing feature of VHL. In other tumour types, cilia loss often occurs early in the disease
process and is typically seen in pre-malignant conditions, for example in pancreatic intraepithelial
neoplasia (Seeley et al. 2009; Schimmack et al. 2016), melanoma in situ (Kim et al. 2011b; Snedecor
et al. 2015) and breast carcinoma in situ (Menzl et al. 2014). Unlike these examples,
phaeochromocytomas do not have a generally recognised pathological pre-malignant stage,
although adrenal medullary hyperplasia has been proposed as a precursor lesion. The distinction
between medullary hyperplasia and phaeochromocytoma has historically been based on size criteria
alone (Carney et al. 1975), which seems biologically unlikely. Indeed, molecular analysis suggests
there is no difference between phaeochromocytomas and medullary ‘hyperplasia’ and that it would
be better termed and thought of as a micro-phaeochromocytoma (Korpershoek et al. 2014).
PPGL cilia loss was equally pronounced in patients with SDHx mutations as it was in those with VHL
and was greater in both groups than in those without a cluster 1 predisposition (Figure 4.2E & F).
This raises the possibility that the mechanism of ciliary loss is not entirely due to pVHL-microtubule
interactions. Loss of VHL’s canonical function as an E3-ubiquitin ligase results in HIF accumulation
and activation of pseudohypoxic signalling, which includes increased expression of components of
the AURKA/HDAC6 cilia disassembly pathway (Xu et al. 2010). This is the first report of SDHx
mutations resulting in changes in primary cilia in any context. It is interesting to note that SDH is also
implicated in the pathogenesis of GISTs (Janeway et al. 2011), a tumour type in which the ciliary-
mediated signalling pathways Hh and PDGFRA play important roles (Tang et al. 2016). Purely
descriptive work has observed primary cilia on GISTs (Dvorak et al. 2014), without any meaningful
comparison or analysis. Therefore, it is possible that primary cilia may play a role in GIST formation.
PPGL cilia incidence and length appeared to be associated with a number of clinical and pathological
parameters (Figure 4.3). Tumours from patients aged less than 18 years old and those that were
screen detected displayed fewer cilia compared to those aged over 18 and those who were
diagnosed due to symptoms or as an incidental finding respectively. This is likely explained by the
high degree of overlap between these groups and those patients with VHL (8/9 and 6/8
respectively). Cilia incidence and frequency was increased in metanephrine secreting tumours. This
could also be a confounding effect of the relatively greater loss of cilia in cluster 1 tumours that are

145
predominantly normetanephrine secreting. However, it is a plausible biological effect as adrenaline
increases primary cilia incidence in pancreatic ductal cancer cells (Khan et al. 2016). This is explored
further in Chapter 5.
Cilia incidence was reduced in PPGLs with a higher Ki67 proliferation index (Figure 4.3O), suggesting
a link between cilia loss and cellular proliferation, although the directionality of this cannot be
ascertained from these data. Despite the proposed role for cilia as a cell cycle checkpoint (Izawa et
al. 2015), no association between Ki67 index and primary cilia was found in either breast (Menzl et
al. 2014) or prostate (Hassounah et al. 2013) cancer.
Increased prevalence of primary cilia has been associated with improved survival in pancreatic
ductal adenocarcinoma (Emoto et al. 2014) and colorectal adenocarcinoma (Dvorak et al. 2016).
None of our PPGL patients had metastatic disease and so this question remains unanswered in PPGL.
Primary cilia have also been linked to drug resistance and subsequent tumour evolution. In
medulloblastomas which require a primary cilium, ciliary loss confers resistance to Smo inhibitors
(Zhao et al. 2017). In a variety of tumour cell lines, Jenks et al demonstrated that primary cilia confer
resistance to a range of kinase inhibitors in a length-dependent manner and intriguingly that drug-
resistant cells could be sensitised by disrupting ciliogenesis (Jenks et al. 2018).
Transcriptome analysis identified altered expression of gene modules associated with cilia-mediated
signaling in phaeochromocytomas relative to adjacent adrenal medullas (Figure 4.5). Altered cilia-
mediated signaling pathways included Hh, Wnt and Notch signaling (Figure 4.7).
The role of cilia in the regulation of cancer-linked signaling pathways is complex and context
dependent (Oh & Katsanis 2013). For example, Wnt signaling, which is generally considered to be
attenuated by the presence of a cilium, can be decreased in cells with shortened cilia yet activated
by ablation of cilia (Lancaster et al. 2011; Oh & Katsanis 2013). However, for Hh signaling, the cilium
activates the pathway in the presence of the sonic hedgehog ligand (Shh) and restrains signaling
when Shh is absent (Wong et al. 2009; Hassounah et al. 2012). There is also crosstalk between cilia-
mediated signaling pathways, such as Notch signaling modulating Shh signaling by regulating the
ciliary localization of the Hh signal transduction proteins patched and smoothened (Kong et al.
2015). This complexity makes it difficult to interpret how alterations in cilia incidence and length
may impact on specific pathways. Nevertheless, hierarchical clustering analyses separately grouped
tumor and adrenal medulla samples based on changes of gene expression in multiple cilia-linked
signaling pathways (Figure 4.5). This is consistent with loss of cilia correlating with dysregulation of
cilia-mediated signaling in PCCs. Disruption of Wnt and Hh signaling is particularly relevant to PPGLs

146
with Wnt-altered tumors classified as one of four molecularly defined PPGL subtypes (Fishbein et al.
2017).
4.4.2 Primary cilia loss in phaeochromocytoma-derived cell lines is oncogenic
Cells derived from rat (PC12) and mouse (MPC, MTT) phaeochromocytomas are capable of forming
primary cilia in two-dimensional culture (Figures 4.8 & 4.9).
PC12 cells have been previously shown to form primary cilia which express ACIII and elongate in
response to lithium chloride treatment (Ou et al. 2009). This is the first report demonstrating that
MPC and MTT cells can form primary cilia. MTT cells have fewer, shorter cilia which are less easily
stimulated by serum starvation than MPC cells (Figure 4.9G & H). MTT cells, a subclone of MPC,
display a more aggressive phenotype than MPC cells when injected into athymic mice (Martiniova et
al. 2009) and we can therefore postulate that this altered behaviour might contribute to the
observed ciliary changes. This is the case with the MCF isogenic breast cancer cell series, in which
progressive cilia loss follows increasing degrees of transformation (Yuan et al. 2010). It should be
borne in mind that all three cell lines used are non-human and harbour mutations in cluster 2 PPGL
predisposition genes; Max in the case of PC12 (Hopewell & Ziff 1995) and Nf1 in MPC and MTT
(Powers et al. 2000).
We observed that disruption of cilia structure and function, achieved by knockdown of Ift88 or
Cep164, correlated with increased cellular proliferation of PC12 cells (Figure 4.10). IFT88, as a central
component of the IFT complex B, is required for cilia formation. Its loss is associated with cilia loss
and increased proliferation in some tissues (e.g. kidney (Delaval et al. 2011) and pancreas (Cano et
al. 2004)) and failure of progenitor cell expansion in others, including cerebellar neurons (Chizhikov
et al. 2007). In addition, IFT88 has functions independent of cilia, including a role in cell migration
(Boehlke et al. 2015). IFT88 depletion in HeLa cells promotes progression through the cell cycle and
this has been proposed as a cilia-independent function (Robert et al. 2007). This conclusion is based
on the assertion that HeLa cells are not ciliated, although the original article did not specifically
examine this and subsequent reports have established that HeLa cells can form primary cilia (Kowal
& Falk 2015). Although we cannot completely exclude a contribution from cilia-independent
mechanisms, the observed concordance of effect achieved by knockdown of two separate genes
central to ciliogenesis points towards a cilia-dependent effect.
In addition to increased cellular proliferation, Ift88 knockdown in PC12 cells resulted in changes in
gene expression that inhibited cell death pathways while activating cell proliferation and tumour-
147
linked pathways (Figure 4.11). IFT88 has recently been implicated as a tumour suppressor in
hepatocellular carcinoma with low levels of expression being associated with poor prognosis in
patients and enhanced invasion and migration of liver cancer stem cells in vitro (Huang et al. 2017;
You et al. 2017). Although cilia were not examined in these studies, they provide further support for
a role for ciliary dysfunction in tumourigenesis.
The effect of IFT88 loss is not universal across cancer types; its depletion in thyroid cancer cells did
not alter cellular proliferation, migration or invasion but did confer oncogenic changes in glycolysis
and lipid biosynthesis (Lee et al. 2018). These changes in cellular metabolism and respiration are also
seen in a murine model of ADPKD (Podrini et al. 2018) and highlight the varied and multi-faceted
roles primary cilia might play in tumourigenesis.
Together, our data are consistent with cilia acting as a checkpoint for cell division in PC12 cells and
suggest cilia loss promotes proliferation and perhaps tumourigenesis in PCC/PGL.
4.5 Summary
In this chapter I have demonstrated that primary cilia structure is altered in phaeochromocytomas
compared to adjacent normal adrenal medullas and that this is accompanied by changes in
transcription related both to ciliary assembly/disassembly and cilia-mediated signalling pathways.
Pseudohypoxic cluster 1 tumours had the most pronounced ciliary phenotype and this is
investigated mechanistically in Chapter 5. Through knockdown of key ciliary proteins in
phaeochromocytoma-derived cells, I have shown that cilia loss as the primary insult results in
increased cellular proliferation and oncogenic transcriptional changes, providing further evidence
that primary cilia loss is a contributor and not merely a consequence of PPGL tumourigenesis.
148
CHAPTER 5
The influence of features of the tumour microenvironment on primary cilia in
phaeochromocytomas
Work in this chapter has been published in the following article, which is included in the appendix of
this thesis.
Oncometabolite induced primary cilia loss in pheochromocytoma. O’Toole SM, Watson DS,
Novoselova TV, Romano LEL, King PJ, Bradshaw TY, Thompson CL, Knight MM, Sharp TV, Barnes MR,
Srirangalingam U, Drake WM, Chapple JP. Endocrine Related Cancer 2019; 26(1): 165-180.

149
5.1 Introduction
Primary cilia function as sensory organelles to a wide range of extracellular stimuli (discussed in
Chapter 1) and, through the projection of the axoneme into the extracellular space, are ideally
placed to interact with the tumour microenvironment. This is the complex physical, chemical and
cellular milieu in which tumour cells exist and interact and to which they must adapt to survive
(Balkwill et al. 2012).
Despite this, there is sparse experimental evidence examining the effect on primary cilia of features
of the tumour microenvironment. Perhaps the cardinal feature of this environment is hypoxia, and
this is of particular importance in cluster 1 pseudohypoxic phaeochromocytomas. The effect of
hypoxia on primary cilia appears complex, variable and cell lineage dependent (Proulx-Bonneau &
Annabi 2011; Wann et al. 2013; Brown et al. 2014; Lavagnino et al. 2016). It has not been well
studied in the context of cancer.
Limited studies have shown that cancer cell primary cilia can be modulated by other features of the
tumour microenvironment, namely endocrine (Xiang et al. 2014) and paracrine (Bailey et al. 2009;
Mansini et al. 2019) factors, external carcinogens (Radford et al. 2012) and inflammation (Vézina et
al. 2014; Dvorak et al. 2017).
Having observed ciliary loss to be a feature of human phaeochromocytomas in Chapter 4, this
chapter examines whether specific phaeochromocytoma-relevant components of the tumour
microenvironment might be responsible.

150
5.2 Aims and Objectives
The aim of this chapter was to investigate whether features of the tumour microenvironment
influenced primary cilia in phaeochromocytomas. The choice of elements of the tumour
microenvironment for study priority was governed by those with an established role in
phaeochromocytoma and neuroendocrine tumour aetiology, pathophysiology and treatment.
We hypothesised that primary cilia would be influenced by certain features of the tumour
microenvironment.
The first objective was to determine whether hypoxia altered primary cilia incidence or length in
phaeochromocytoma-derived cells, and if so, by what mechanism.
The second objective was to determine whether pseudohypoxia altered primary cilia incidence or
length in phaeochromocytoma-derived cells, and if so, by what mechanism.
The third objective was to determine whether circulating catecholamines in patients with
phaeochromocytomas led to alterations in primary cilia incidence or length.
The fourth objective was to determine whether catecholamines altered primary cilia incidence or
length in phaeochromocytoma-derived PC12 cells, and if so, by what mechanism.
The fifth objective was to determine whether other chemical features of the tumour
microenvironment, namely somatostatin receptor stimulation, led to changes in primary cilia
incidence and length.
151
5.3 Results
In the previous chapter, we have demonstrated that cilia loss and shortening in human
phaeochromocytomas is most pronounced in patients with germline mutations in VHL and SDHx
(Figure 4.2). Loss of function of the associated VHL and SDHx proteins results in pseudohypoxia due
to failure of destruction of HIF (discussed in detail in Chapter 2). We thus sought to examine whether
hypoxia and pseudohypoxia influenced phaeochromocytoma primary cilia and, if so, by what
mechanism.
5.3.1 The effects of hypoxia on phaeochromocytoma primary cilia
5.3.1.1 Hypoxia impairs ciliogenesis in PC12 cells in a reversible manner
Hypoxia, a cardinal feature of the tumour microenvironment, has previously been shown to alter
primary cilia in a variable and tissue-dependent manner (Proulx-Bonneau & Annabi 2011; Wann et
al. 2013; Brown et al. 2014; Lavagnino et al. 2016).
We sought to investigate the effect hypoxia had on primary cilia in the rat PC12
phaeochromocytoma-derived cell line. First, we examined whether or not it altered the ability of
cells to form a primary cilium in response to the ciliogenesis cue of serum starvation. PC12 cells were
plated in complete media for 24 hours to allow attachment before being washed and the media
exchanged with serum-free media. Cells were then exposed either to standard tissue culture
conditions (atmospheric oxygen, 21%) or a hypoxic chamber (1% oxygen) for a variety of time
intervals prior to fixation and immunolabelling for detection of primary cilia (Figure 5.1A).
Cilia incidence was lower in cells cultured in the absence of serum in 1% oxygen compared to 21%
oxygen (Figure 5.1B). This difference was observed after only four hours of exposure to differential
oxygen concentrations (40.0% + 10.3 v. 31.2% + 0.08; p=0.046) and was maintained and increased
after up to 24 hours exposure (70.7% + 14.7 v. 51.3% + 9.5; p=1.1 x 10⁻⁹). Similarly, cilia length was
lower in cells cultured in the absence of serum in 1% oxygen compared to 21% oxygen (Figure 5.1C).
This effect, although seen after four hours, was not statistically significant until eight hours (2.43μm
+ 0.84 v. 2.02μm + 0.64; p=4.2 x 10⁻⁵).
Thus, ciliogenesis was reduced in PC12 cells cultured under conditions of hypoxia (1% oxygen)
compared to normoxia (21% oxygen). This observation is consistent with previous reports in primary
rat tenocytes (Lavagnino et al. 2016) and murine bone marrow derived mesenchymal stem cells
(Proulx-Bonneau & Annabi 2011) cultured in 1% oxygen. Interestingly, no effect on cilia incidence
152
was seen in murine bone marrow derived mesenchymal stem cells cultured in 5% oxygen (Brown et
al. 2014), whilst 2% oxygen resulted in longer cilia in primary bovine articular chondrocytes (Wann et
al. 2013). In these studies, hypoxia-induced ciliary changes were associated with alterations in cilia-
mediated functions including mechanoresponsiveness (Lavagnino et al. 2016) and Wnt (Proulx-
Bonneau & Annabi 2011) and Hh (Brown et al. 2014) related gene expression.
We next sought to determine whether the effect of hypoxia on PC12 primary cilia was reversible.
PC12 cells were exposed to serum-free media for 24 hours in a hypoxic chamber (1% oxygen) prior
to return to atmospheric oxygen for a variety of time intervals before fixation and immunolabelling
for detection of primary cilia (Figure 5.2A).
Cilia incidence increased with time following return to 21% oxygen (Figure 5.2B). After 24 hours of
recovery, primary cilia incidence was significantly greater than after hypoxic exposure (59.5% + 10.2
v. 51.3% + 9.3; p=0.048), although it took 48 hours recovery for ciliary incidence to be at a
comparable level with cells cultured in atmospheric oxygen alone (64.2% + 11.0 v. 70.7% + 14.7;
p=0.21). Likewise, cilia length increased with increasing recovery time post hypoxic exposure (Figure
5.2C). This effect was first seen after 24 hours return to atmospheric oxygen conditions (2.54μm +
0.80 v. 2.26μm + 0.70; p=0.017), at which point cilia length was indistinguishable from that of cells
not exposed to 1% oxygen (2.54μm + 0.80 v. 2.51μm + 0.59; p=0.99).
Thus, ciliogenesis is impaired by hypoxia in PC12 cells in a reversible manner, with full recovery being
observed following return to standard atmospheric oxygen. Given the differential effects of hypoxia
on primary cilia previously observed with other cell types, we next sought to examine whether this
was consistent with the response in other phaeochromocytoma cell lines.

153
Figure 5.1: Hypoxia reduces cilia formation in PC12 cells
(A) Confocal images of PC12 cells exposed to serum-free media either at 1% or 21% oxygen for the time periods indicated. Cells were immunolabelled with anti-acetylated α-tubulin (red) and anti-Arl13b (green) for detection of primary cilia. Nuclei were stained with DAPI (blue). Cilia are indicated by arrows, or arrowheads where they are also shown zoomed in the insets. Scale bars = 10 μm.
Quantification of primary cilia incidence (B) and length (C) following treatment as per (A). Error bars indicate + SEM, boxes 25th, 50th and 75th centiles and whiskers the 10th and 90th centiles. Number of cells scored for incidence: 1222 + 185 per condition. Number of cilia measured for length: 156 + 26 per condition. Statistical significance was assessed using a one-way ANOVA. * p <0.05, *** p< 0.001. Stars indicate comparison between the two oxygen concentrations tested. Where no stars are evident, p>0.05.

154
Figure 5.2: Hypoxia induced ciliary loss in PC12 cells recovers following return to normoxia
(A) Confocal images of PC12 cells exposed to serum-free media at 1% oxygen for 24 hours prior to return to atmospheric (21%) oxygen for the time periods indicated. Cells were immunolabelled with anti-acetylated α-tubulin (red) and anti-Arl13b (green) for detection of primary cilia. Nuclei were stained with DAPI (blue). Cilia are indicated by arrows, or arrowheads where they are also shown zoomed in the insets. Scale bars = 10 μm.
Quantification of primary cilia incidence (B) and length (C) following treatment as per (A). Error bars indicate + SEM, boxes 25th, 50th and 75th centiles and whiskers the 10th and 90th centiles. Number of cells scored for incidence: 1015 + 175 per condition. Number of cilia measured for length: 147 + 29 per condition. Statistical test used: one-way ANOVA. * p <0.05, ** p<0.01, *** p< 0.001. Stars above error bars indicate comparison to 24 hours exposure to 1% oxygen and above horizontal lines between the two columns linked.
155
5.3.1.2 The effect of hypoxia on ciliogenesis in MPC and MTT cells
MPC and MTT are related mouse phaeochromocytoma-derived cell lines that harbour mutations in
the nf1 gene (Powers et al. 2000). Beyond PC12 cells, they represent the only other
phaeochromocytoma-derived cell lines that have been used in more than one peer-reviewed
publication.
In order to test whether hypoxia had the same effect on ciliogenesis as was observed in PC12 cells,
MPC and MTT cells were subjected to the same test conditions (namely culture in serum-free media
either in 1% or atmospheric oxygen; Figure 5.3).
In accordance with the observations in PC12 cells, cilia incidence was reduced in both MPC (64.1% +
8.7 v. 76.1% + 1.8; p=0.002) and MTT cells (54.3 % + 6.1 v. 64.5% + 4.0; p=0.0351) exposed to hypoxic
conditions (Figure 5.3B). The same pattern of reduced ciliary length following exposure to hypoxia
was also observed in both MPC (2.25μm + 0.76 v. 2.77μm + 0.78; p=1 x10-15) and MTT cells (1.99μm
+ 0.56 v. 2.23μm + 0.66; p=0.00011; Figure 5.3C).
Thus, hypoxia impairs ciliary formation in all three established phaeochromocytoma-derived cell
lines suggesting that its effect is conserved and consistent and not merely cell line specific.

156
Figure 5.3: Hypoxia impairs ciliogenesis in MPC and MTT cells
(A) Confocal images of MPC and MTT cells exposed to serum-free media either at 1% or 21% oxygen for 24 hours. Cells were immunolabelled with anti-acetylated α-tubulin (red) and anti-Arl13b (green) for detection of primary cilia. Nuclei were stained with DAPI (blue). Cilia are indicated by arrows, or arrowheads where they are also shown zoomed in the insets. Scale bars = 10 μm.
Quantification of primary cilia incidence (B) and length (C) following treatment as per (A). Error bars indicate + SEM, boxes 25th, 50th and 75th centiles and whiskers the 10th and 90th centiles. Number of cells scored for incidence: 1954 + 338 per condition. Number of cilia measured for length: 295 + 34 per condition. Statistical significance was assessed using a one-way ANOVA. * p <0.05, ** p < 0.01, *** p < 0.001.
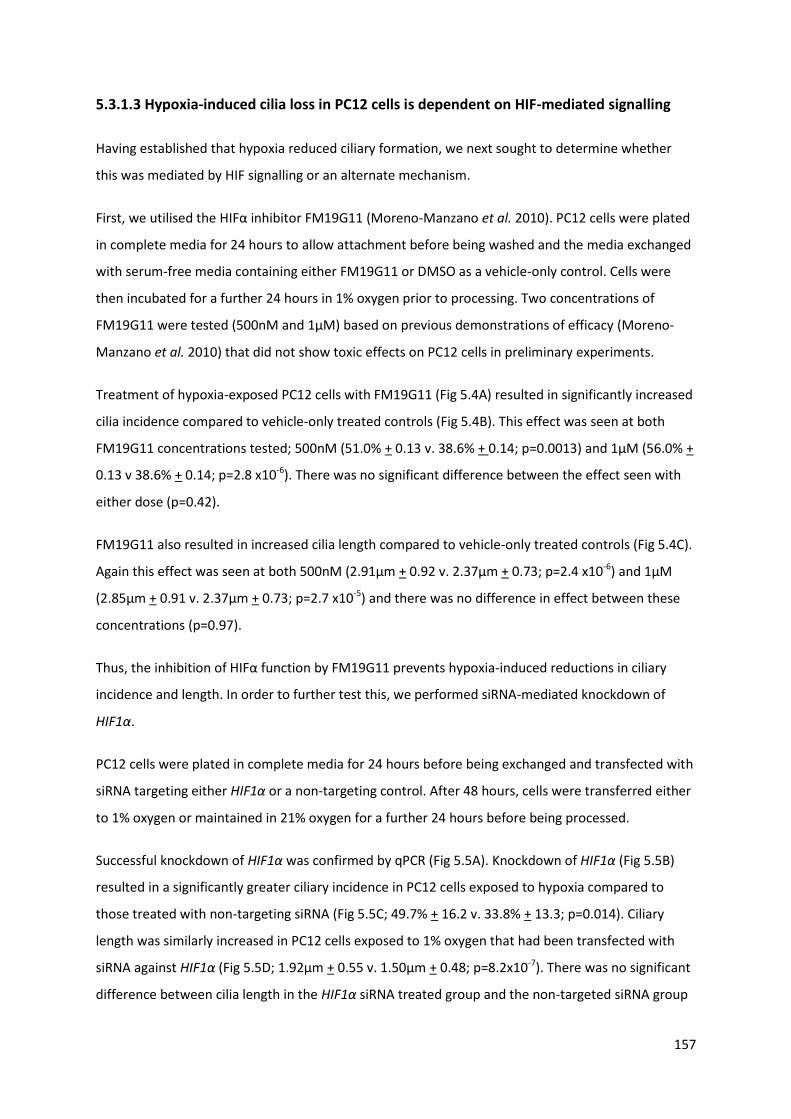
157
5.3.1.3 Hypoxia-induced cilia loss in PC12 cells is dependent on HIF-mediated signalling
Having established that hypoxia reduced ciliary formation, we next sought to determine whether
this was mediated by HIF signalling or an alternate mechanism.
First, we utilised the HIFα inhibitor FM19G11 (Moreno-Manzano et al. 2010). PC12 cells were plated
in complete media for 24 hours to allow attachment before being washed and the media exchanged
with serum-free media containing either FM19G11 or DMSO as a vehicle-only control. Cells were
then incubated for a further 24 hours in 1% oxygen prior to processing. Two concentrations of
FM19G11 were tested (500nM and 1μM) based on previous demonstrations of efficacy (Moreno-
Manzano et al. 2010) that did not show toxic effects on PC12 cells in preliminary experiments.
Treatment of hypoxia-exposed PC12 cells with FM19G11 (Fig 5.4A) resulted in significantly increased
cilia incidence compared to vehicle-only treated controls (Fig 5.4B). This effect was seen at both
FM19G11 concentrations tested; 500nM (51.0% + 0.13 v. 38.6% + 0.14; p=0.0013) and 1μM (56.0% +
0.13 v 38.6% + 0.14; p=2.8 x10⁻⁶). There was no significant difference between the effect seen with
either dose (p=0.42).
FM19G11 also resulted in increased cilia length compared to vehicle-only treated controls (Fig 5.4C).
Again this effect was seen at both 500nM (2.91μm + 0.92 v. 2.37μm + 0.73; p=2.4 x10⁻⁶) and 1μM
(2.85μm + 0.91 v. 2.37μm + 0.73; p=2.7 x10⁻⁵) and there was no difference in effect between these
concentrations (p=0.97).
Thus, the inhibition of HIFα function by FM19G11 prevents hypoxia-induced reductions in ciliary
incidence and length. In order to further test this, we performed siRNA-mediated knockdown of
HIF1α.
PC12 cells were plated in complete media for 24 hours before being exchanged and transfected with
siRNA targeting either HIF1α or a non-targeting control. After 48 hours, cells were transferred either
to 1% oxygen or maintained in 21% oxygen for a further 24 hours before being processed.
Successful knockdown of HIF1α was confirmed by qPCR (Fig 5.5A). Knockdown of HIF1α (Fig 5.5B)
resulted in a significantly greater ciliary incidence in PC12 cells exposed to hypoxia compared to
those treated with non-targeting siRNA (Fig 5.5C; 49.7% + 16.2 v. 33.8% + 13.3; p=0.014). Ciliary
length was similarly increased in PC12 cells exposed to 1% oxygen that had been transfected with
siRNA against HIF1α (Fig 5.5D; 1.92μm + 0.55 v. 1.50μm + 0.48; p=8.2x10⁻⁷). There was no significant
difference between cilia length in the HIF1α siRNA treated group and the non-targeted siRNA group

158
not exposed to hypoxia (p=0.74), however cilia incidence remained lower (52.0% + 12.3 v. 64.8% +
10.7; p=0.017).
Thus, we have demonstrated that both pharmacological and siRNA-mediated attenuation of HIF
signalling rescues hypoxia-induced ciliary loss in PC12 cells. Taken together, these results provide
evidence that hypoxia-induced ciliary loss in PC12 cells is HIF-dependent.
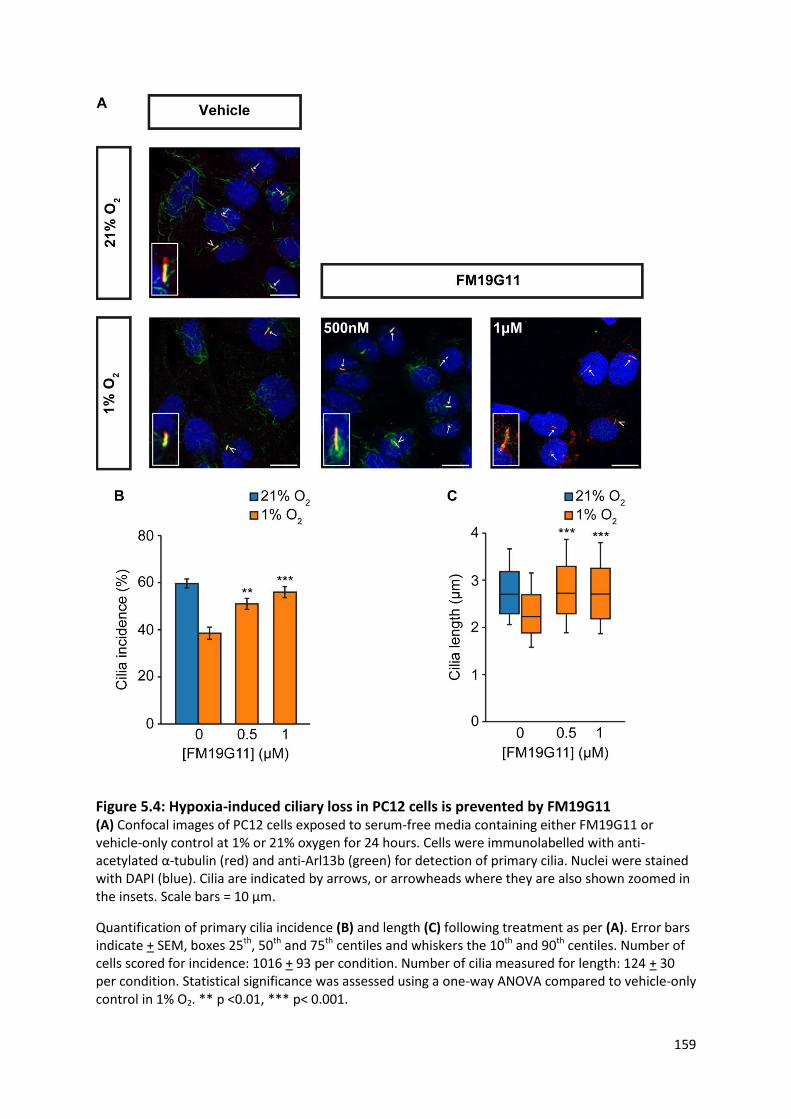
159
Figure 5.4: Hypoxia-induced ciliary loss in PC12 cells is prevented by FM19G11 (A) Confocal images of PC12 cells exposed to serum-free media containing either FM19G11 or vehicle-only control at 1% or 21% oxygen for 24 hours. Cells were immunolabelled with anti-acetylated α-tubulin (red) and anti-Arl13b (green) for detection of primary cilia. Nuclei were stained with DAPI (blue). Cilia are indicated by arrows, or arrowheads where they are also shown zoomed in the insets. Scale bars = 10 μm.
Quantification of primary cilia incidence (B) and length (C) following treatment as per (A). Error bars indicate + SEM, boxes 25th, 50th and 75th centiles and whiskers the 10th and 90th centiles. Number of cells scored for incidence: 1016 + 93 per condition. Number of cilia measured for length: 124 + 30 per condition. Statistical significance was assessed using a one-way ANOVA compared to vehicle-only control in 1% O2. ** p <0.01, *** p< 0.001.
160
Figure 5.5: siRNA mediated knockdown of HIF1α prevents hypoxia-induced ciliary loss in
PC12 cells
(A) Quantification of relative RNA expression (AU, arbitrary units) assessed by qPCR of HIF1α in PC12 cells 48 hours after transfection with siRNAs targeting HIF1α or non-targeting controls (Con). Data were normalised to peptidylpropyl isomerase A. Statistical significance was assessed using an unpaired t-test. *** p<0.001.
(B) Confocal images of PC12 cells cultured for 24 hours in 1% oxygen after transfection as per (A). Cells were immunolabelled with anti-acetylated α-tubulin (red) and anti-Arl13b (green) for detection of primary cilia. Nuclei were stained with DAPI (blue). Cilia are indicated by arrows, or arrowheads where they are also shown zoomed in the insets. Scale bars = 10 μm.
Quantification of primary cilia incidence (C) and length (D) following treatment as per (B). Error bars indicate + SEM, boxes 25th, 50th and 75th centiles and whiskers the 10th and 90th centiles. Number of cells scored for incidence: 3810 + 373 per condition. Number of cilia measured for length: 96 + 12 per condition. Statistical significance was assessed using a one-way ANOVA compared to non-targeting control in 1% oxygen. ** p <0.01, *** p< 0.001.
161
5.3.1.4 Hypoxia-induced cilia loss in PC12 cells is dependent on AURKA/HDAC6 pathway
activation
We next set out to understand the mechanism by which HIF-mediated signalling might result in the
observed ciliary loss in PC12 cells and hypothesised that the AURKA/HDAC6 pathway (discussed in
Chapter 1) might be responsible.
Activation of the AURKA/HDAC6 pathway results in deacetylation of ciliary tubulin and
destabilisation of the axonemal microtubules resulting in ciliary disassembly (Pugacheva et al. 2007).
Overexpression of components of this pathway with resultant ciliary loss has been observed in a
range of human cancers including renal (Schraml et al. 2009; Basten et al. 2013; Dere et al. 2015;
Ding et al. 2015), ovarian (Egeberg et al. 2012), cholangiocarcinoma (Gradilone et al. 2013;
Razumilava et al. 2014) and chondrosarcoma (Xiang et al. 2017).
In order to test this hypothesis, hypoxia-exposed PC12 cells were treated with a variety of
pharmacological inhibitors. PC12 cells were plated and grown in serum-containing media for 24
hours prior to exchange for serum-free media containing either inhibitor or vehicle-only control.
Cells were then exposed to 1% oxygen for 24 hours prior to processing for cilia (Figure 5.6A).
Treatment of PC12 cells exposed to hypoxia with the specific AURKA inhibitor PHA-680632 resulted
in significantly increased cilia incidence (Figure 5.6B; 61.3% + 11.3 v. 38.6% + 14.1; p=1.1 x10⁻¹⁰)
compared to vehicle-only treated controls. The same pattern of increased cilia incidence was also
seen with inhibition by the mammalian class I and II HDAC inhibitor trichostatin A (TSA) (60.1% +
10.2; p=1.0 x10⁻⁹) and the selective HDAC6 inhibitor tubacin (53.8% + 15.0; p=4.0 x10⁻⁵). In all cases,
cilia incidence was increased to levels comparable to cells cultured in 21% oxygen and not exposed
to hypoxia (59.6% + 10.6; p=0.99 for PHA-680632, p=0.99 for TSA, p=0.49 for tubacin). Lithium
chloride was utilised for comparison as an agent known to increase ciliary length by an alternative
mechanism (Ou et al. 2009). Treatment with lithium chloride also resulted in increased ciliary
incidence (48.0% + 9.9; p=0.045) albeit to a lesser degree than the specific pathway inhibitors
(p=0.0005 for PHA-680632, p=0.002 for TSA, p=0.49 for tubacin) and it did not completely rescue
hypoxia-induced cilia loss (p=0.004 compared to 21% oxygen).
Cilia length (Figure 5.6C) was also significantly increased by treatment with PHA-680632 (2.80μm +
0.80 v. 2.37μm + 0.73; p=7.7 x10⁻⁶) and TSA (2.88μm + 0.70; p=2.7 x10⁻⁷). Cilia length was also
increased with tubacin (2.54μm + 0.67; p=0.44) and lithium chloride (2.48μm + 0.70; p=0.90),
although this was a trend only with significance not achieved. In keeping with this, cilia length was

162
restored to that seen in 21% oxygen following treatment with PHA-680632 (p=0.99) and TSA
(p=0.99) but not tubacin (p = 0.03) or lithium (p = 0.004).
These data suggest that reduced oxygen levels lead to cilia resorption in PC12 cells by a mechanism
that includes HIF signalling and activation of the AURKA/HDAC6 pathway.

163
Figure 5.6: Hypoxia-induced ciliary loss in PC12 cells is prevented by AURKA/HDAC6
inhibition
(A) Confocal images of PC12 cells immunolabelled for detection of primary cilia (anti-acetylated α-tubulin (red), anti-Arl13b (green), DAPI (blue)). Cells were cultured in 21% or 1% oxygen for 24 hours in the presence or absence of the inhibitors PHA-680632 (PHA), trichostatin A (TSA), tubacin (Tub) and lithium chloride (LiCl), or vehicle only controls. Cilia are indicated by arrows, or arrowheads where they are also shown zoomed in the insets. Scale bars = 10 μm.
Quantification of primary cilia incidence (B) and length (C) following treatment as per (A). Error bars indicate + SEM, boxes 25th, 50th and 75th centiles and whiskers the 10th and 90th centiles. Number of cells scored for incidence: 1034 + 91 per condition. Number of cilia measured for length: 127 + 24 per condition. Statistical significance was assessed using a one-way ANOVA compared to vehicle-only control in 1% O2. * p <0.05, *** p< 0.001.

164
5.3.2 The effects of pseudohypoxia on phaeochromocytoma primary cilia
Having identified that phaeochromocytoma primary cilia are modulated by hypoxia, we sought to
test whether the effect was also seen with pseudohypoxia. The persistence of HIF mediated
signalling in the presence of oxygen is the hallmark feature of cluster 1 phaeochromocytomas due to
mutations in VHL, SDHx, and FH. It arises through functional inactivation of either HIF-PHDs or pVHL
and results in persistence of HIFα and transcription of HIF target genes.
5.3.2.1 Pseudohypoxia achieved by HIF-PHD inhibition results in cilia loss and shortening
In order to establish whether pseudohypoxia impacted primary cilia, we first targeted HIF-PHD by
treating PC12 cells with the inhibitor dimethyloxalylglycine, N-(methoxyoxoacetyl)-glycine methyl
ester (DMOG) (Jaakkola et al. 2001). DMOG is an experimental hypoxia mimetic that reduces
proteosomal degradation of HIF by inhibiting HIF-PHD mediated hydroxylation of HIFα which is
required for pVHL binding. In addition to providing mechanistic information as to whether
pseudohypoxia impacted primary cilia, targeting HIF-PHD has direct relevance to PPGL because
germline mutations in both PHD1 (Yang et al. 2015) and PHD2 (Ladroue et al. 2008; Yang et al. 2015)
are rare, but identified, causes of PPGL in combination with congenital eythrocytosis.
PC12 cells were grown in serum-containing media for 24 hours to allow attachment before the
media was changed to serum-free media containing either DMOG or vehicle only control for a
further 24 hours (Fig 5.7A).
Exposure to DMOG for 24 hours resulted in a significant reduction in primary cilia incidence (Fig
5.7B) at both 10μM (58.3% + 12.2 v. 68.5% + 12.6, p=0.0046) and 100μM (45.4% + 11.6, p=2.3x10⁻¹¹)
compared to control. A similar pattern was observed regarding cilia length (Fig 5.7C). Cilia length was
reduced in PC12 cells exposed to DMOG at both 10 μM (2.10μm + 0.75 v. 2.72μm + 0.70, p=8.0x10-
14) and 100μM (2.32μm + 0.79, p=3.9x10⁻⁷) compared to vehicle only control.

165
Figure 5.7: Treatment of PC12 cells with the HIF-PHD inhibitor DMOG results in reduced
ciliary formation
(A) Confocal images of PC12 cells exposed to serum-free media containing DMOG at the concentrations indicated (or vehicle only control) for 24 hours. Cells were immunolabelled with anti-acetylated α-tubulin (red) and anti-Arl13b (green) for detection of primary cilia. Nuclei were stained with DAPI (blue). Cilia are indicated by arrows, or arrowheads where they are also shown zoomed in the insets. Scale bars = 10 μm.
Quantification of primary cilia incidence (B) and length (C) following treatment as per (A). Error bars indicate + SEM, boxes 25th, 50th and 75th centiles and whiskers the 10th and 90th centiles. Number of cells scored for incidence: 1100 + 64 per condition. Number of cilia measured for length: 200 + 22 per condition. Statistical significance was assessed using a one-way ANOVA compared to control. ** p<0.01, *** p< 0.001.

166
5.3.2.2 Pseudohypoxia achieved by loss of SDH function results in cilia loss and shortening
Having demonstrated that direct inhibition of HIF-PHD impaired ciliary formation, we sought to
examine whether doing so indirectly recapitulated this observation. As previously discussed,
mutations in SDHx are an important cause of cluster 1 PPGL development. Loss of enzyme activity
(Figure 2.5) results in succinate accumulation which in turn inhibits HIF-PHD (Selak et al. 2005)
resulting in HIF accumulation and pseudohypoxia.
First, we pharmacologically inhibited SDH with malonate, which competes with succinate for active
sites of SDH, resulting in succinate accumulation (Webb 1966). PC12 cells were exposed to serum-
free media containing malonate or vehicle-only control for 24 hours (Figure 5.8A).
Exposure to malonate for 24 hours resulted in a significant reduction in primary cilia incidence
(Figure 5.8B) at both 10μM (76.2% + 10.4 v. 56.1% + 9.0; p=3.7x10⁻¹⁰) and 100μM (57.2% + 10.8;
p=6.9x10⁻¹⁰). No difference was observed between the two concentrations tested (p=0.91).
Cilia length was also reduced in PC12 treated with malonate (Figure 5.8C). Again, this effect was
observed at both 10μM (2.49μm + 0.65 v. 1.98μm + 0.67; p=3.0x10⁻⁸) and 100μM (1.99μm + 0.64;
p=9.2x10⁻⁸). As with incidence, no difference with length was observed between the two
concentrations (p=0.98).
We next sought to confirm that this effect was due to malonate inhibition of SDH. The TCA cycle
intermediate α-ketoglutarate prevents inhibition of SDH by malonate through binding site
competition (MacKenzie et al. 2007). PC12 cells were exposed to serum-free media containing
100μM malonate alone or with 100μM α-ketoglutarate or vehicle-only control for 24 hours (Figure
5.9A).
As before, malonate only reduced cilia incidence (Figure 5.9B; 42.5% + 7.7 v. 64.0% + 9.9; p=9.0x10-
6). However, when α-ketoglutarate was also applied, there was no significant change in ciliary
incidence compared to vehicle-only control (57.0% + 6.6; p=0.16 compared to vehicle-only control;
p=0.0013 compared to malonate-only).
Similarly, malonate again resulted in cilia shortening (Figure 5.9C; 2.07μm + 0.67 v. 2.47μm + 0.50;
p=0.15). This effect was not evident when cells were co-incubated with α-ketoglutarate (2.62μm +
0.64; p=0.57 compared to vehicle-only control; p=2.5x10⁻⁵ compared to malonate-only).
Thus, α-ketoglutarate rescued malonate-induced changes in primary cilia.
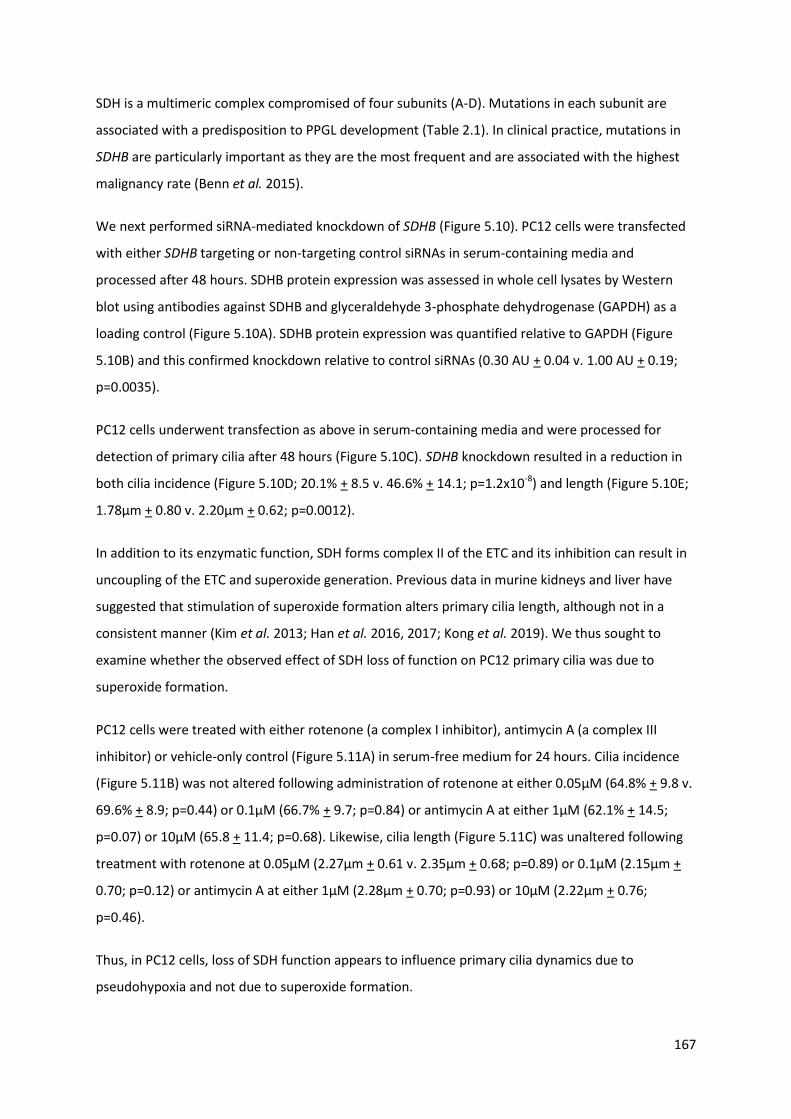
167
SDH is a multimeric complex compromised of four subunits (A-D). Mutations in each subunit are
associated with a predisposition to PPGL development (Table 2.1). In clinical practice, mutations in
SDHB are particularly important as they are the most frequent and are associated with the highest
malignancy rate (Benn et al. 2015).
We next performed siRNA-mediated knockdown of SDHB (Figure 5.10). PC12 cells were transfected
with either SDHB targeting or non-targeting control siRNAs in serum-containing media and
processed after 48 hours. SDHB protein expression was assessed in whole cell lysates by Western
blot using antibodies against SDHB and glyceraldehyde 3-phosphate dehydrogenase (GAPDH) as a
loading control (Figure 5.10A). SDHB protein expression was quantified relative to GAPDH (Figure
5.10B) and this confirmed knockdown relative to control siRNAs (0.30 AU + 0.04 v. 1.00 AU + 0.19;
p=0.0035).
PC12 cells underwent transfection as above in serum-containing media and were processed for
detection of primary cilia after 48 hours (Figure 5.10C). SDHB knockdown resulted in a reduction in
both cilia incidence (Figure 5.10D; 20.1% + 8.5 v. 46.6% + 14.1; p=1.2x10⁻⁸) and length (Figure 5.10E;
1.78μm + 0.80 v. 2.20μm + 0.62; p=0.0012).
In addition to its enzymatic function, SDH forms complex II of the ETC and its inhibition can result in
uncoupling of the ETC and superoxide generation. Previous data in murine kidneys and liver have
suggested that stimulation of superoxide formation alters primary cilia length, although not in a
consistent manner (Kim et al. 2013; Han et al. 2016, 2017; Kong et al. 2019). We thus sought to
examine whether the observed effect of SDH loss of function on PC12 primary cilia was due to
superoxide formation.
PC12 cells were treated with either rotenone (a complex I inhibitor), antimycin A (a complex III
inhibitor) or vehicle-only control (Figure 5.11A) in serum-free medium for 24 hours. Cilia incidence
(Figure 5.11B) was not altered following administration of rotenone at either 0.05μM (64.8% + 9.8 v.
69.6% + 8.9; p=0.44) or 0.1μM (66.7% + 9.7; p=0.84) or antimycin A at either 1μM (62.1% + 14.5;
p=0.07) or 10μM (65.8 + 11.4; p=0.68). Likewise, cilia length (Figure 5.11C) was unaltered following
treatment with rotenone at 0.05μM (2.27μm + 0.61 v. 2.35μm + 0.68; p=0.89) or 0.1μM (2.15μm +
0.70; p=0.12) or antimycin A at either 1μM (2.28μm + 0.70; p=0.93) or 10μM (2.22μm + 0.76;
p=0.46).
Thus, in PC12 cells, loss of SDH function appears to influence primary cilia dynamics due to
pseudohypoxia and not due to superoxide formation.
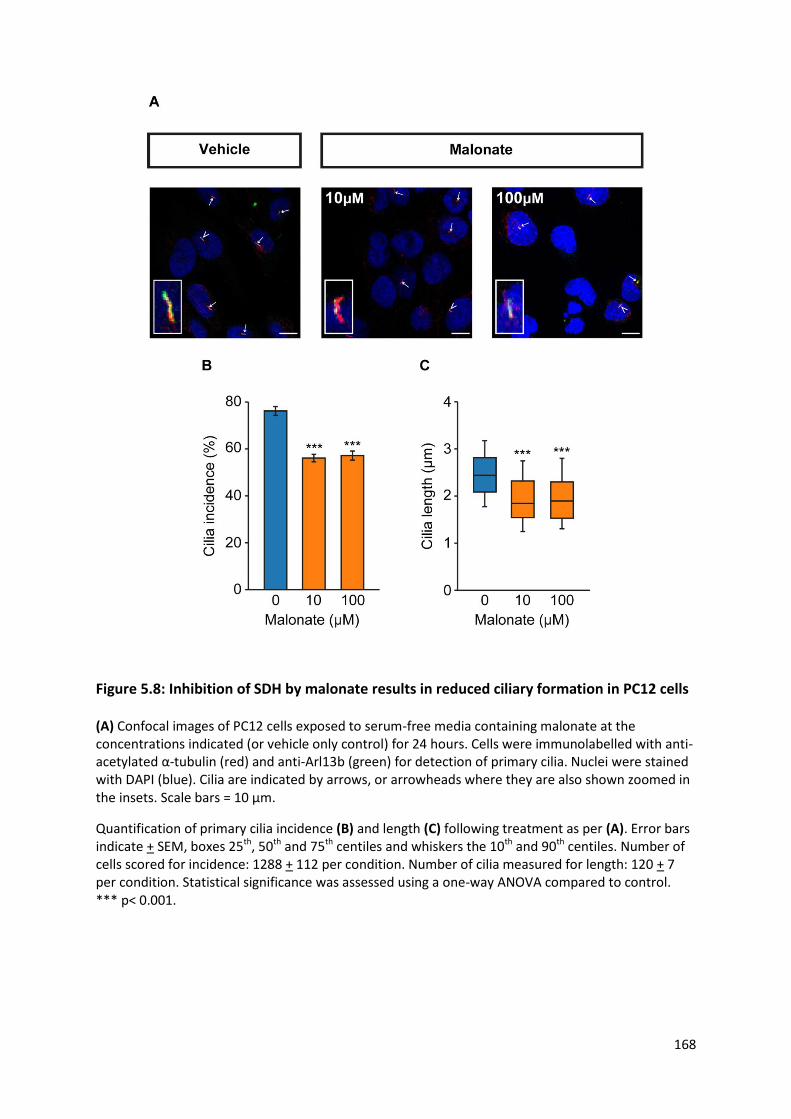
168
Figure 5.8: Inhibition of SDH by malonate results in reduced ciliary formation in PC12 cells
(A) Confocal images of PC12 cells exposed to serum-free media containing malonate at the concentrations indicated (or vehicle only control) for 24 hours. Cells were immunolabelled with anti-acetylated α-tubulin (red) and anti-Arl13b (green) for detection of primary cilia. Nuclei were stained with DAPI (blue). Cilia are indicated by arrows, or arrowheads where they are also shown zoomed in the insets. Scale bars = 10 μm.
Quantification of primary cilia incidence (B) and length (C) following treatment as per (A). Error bars indicate + SEM, boxes 25th, 50th and 75th centiles and whiskers the 10th and 90th centiles. Number of cells scored for incidence: 1288 + 112 per condition. Number of cilia measured for length: 120 + 7 per condition. Statistical significance was assessed using a one-way ANOVA compared to control. *** p< 0.001.
169
Figure 5.9: α-ketoglutarate prevents malonate induced changes in PC12 primary cilia
(A) Confocal images of PC12 cells exposed to serum-free media containing 100 μM malonate, 100 μM malonate and 100 μM α-ketoglutarate (α-KG) or vehicle only control (con) for 24 hours. Cells were immunolabelled with anti-acetylated α-tubulin (red) and anti-Arl13b (green) for detection of primary cilia. Nuclei were stained with DAPI (blue). Cilia are indicated by arrows, or arrowheads where they are also shown zoomed in the insets. Scale bars = 10 μm.
Quantification of primary cilia incidence (B) and length (C) following treatment as per (A). Error bars indicate + SEM, boxes 25th, 50th and 75th centiles and whiskers the 10th and 90th centiles. Number of cells scored for incidence: 1384 + 275 per condition. Number of cilia measured for length: 126 + 31 per condition. Statistical significance was assessed using a one-way ANOVA compared to malonate-only treatment. ** p < 0.01, *** p< 0.001.

170
Figure 5.10: SDHB knockdown in PC12 cells reduces primary cilia incidence and length
Immunoblot (A) and densitometric analyses (B) of total cell lysates from PC12 cells transfected with SDHB targeting or non-targeting control siRNAs (Con) and probed with antibodies against SDHB and GAPDH as a loading control. SDHB protein level was normalised to GAPDH as arbitrary units (AU); n = 6.
(C) Confocal images of PC12 cells following treatment as per (A). Cells were immunolabelled with anti-acetylated α-tubulin (red) and anti-Arl13b (green) for detection of primary cilia. Nuclei were stained with DAPI (blue). Cilia are indicated by arrows, or arrowheads where they are also shown zoomed in the insets. Scale bars = 10 μm.
Quantification of primary cilia incidence (D) and length (E) following treatment as per (A). Error bars indicate + SEM, boxes 25th, 50th and 75th centiles and whiskers the 10th and 90th centiles. Number of cells scored for incidence: 1342 + 31 per condition. Number of cilia measured for length: 115 + 35 per condition. Statistical significance was assessed using a Student’s t test. ** p<0.01, *** p<0.001.

171
Figure 5.11: Inhibition of the electron transport chain does not affect PC12 primary cilia
(A) Confocal images of PC12 cells exposed to rotenone (Rot), antimycin A (Ant A) or vehicle-only control (Con) at the concentrations indicated for 24 hours. Cells were immunolabelled with anti-acetylated α-tubulin (red) and anti-Arl13b (green) for detection of primary cilia. Nuclei were stained with DAPI (blue). Cilia are indicated by arrows, or arrowheads where they are also shown zoomed in the insets. Scale bars = 10 μm.
Quantification of primary cilia incidence (B) and length (C) following treatment as per (A). Error bars indicate + SEM, boxes 25th, 50th and 75th centiles and whiskers the 10th and 90th centiles. Number of cells scored for incidence: 1199 + 107 per condition. Number of cilia measured for length: 142 + 18 per condition. Statistical significance was assessed using a one-way ANOVA compared to vehicle-only treatment. ns = not significant.
172
5.3.2.3 Pseudohypoxia achieved by loss of FH function results in cilia loss and shortening
Having demonstrated that pseudohypoxia due to loss of SDH function influenced primary cilia we
sought to investigate whether other disease-relevant mechanisms also did so.
Fumarate hydratase (FH) follows SDH as the next enzyme in the TCA cycle and catalyses the
conversion of fumarate to malate (Figure 2.5). Similarly to SDH, loss of FH function results in
accumulation of a TCA cycle intermediate (fumarate) with resultant inhibition of HIF-PHDs. FH is a
cluster 1 phaeochromocytoma predisposing gene (Castro-Vega et al. 2014).
First, PC12 cells were treated with serum-free media containing the cell-permeable derivative of
fumarate, monomethyl fumarate (MMF), or vehicle-only control for 24 hours (Figure 5.12A).
Cilia incidence was reduced in PC12 cells treated with MMF (Figure 5.12B) at both 100μM (71.1% +
12.8 v. 78.7% + 11.6; p=0.028) and 200μM (66.2% + 8.6; p=0.00011). There was no significant
difference between the two concentrations tested (p=0.20). Cilia length was also reduced in MMF
treated PC12 cells (Figure 5.12C) at both 100μM (2.30μm + 0.77 v. 2.94μm + 0.71; p=3.9x10⁻¹⁴) and
200μM (2.22μm + 0.87; p=2.3x10⁻¹⁷). Again, no difference was observed between the two MMF
concentrations (p=0.46).
In order to confirm these findings, we next performed siRNA-mediated knockdown of FH (Figure
5.13). PC12 cells were transfected with either FH targeting or non-targeting control siRNAs in serum-
containing media and processed after 48 hours. FH protein expression was assessed in whole cell
lysates by Western blot using antibodies against FH and β-actin as a loading control (Figure 5.13A).
FH protein expression was quantified relative to β-actin (Figure 5.13B) and this confirmed
knockdown relative to control siRNAs.
PC12 cells underwent transfection as above in serum-containing media and were processed for
detection of primary cilia after 48 hours (Figure 5.13C). FH knockdown resulted in a reduction in
both cilia incidence (Figure 5.13D; 39.7% + 9.4 v. 55.7% + 14.1; p=3.1x10⁻⁶) and length (Figure 5.13E;
2.15μm + 0.60 v. 2.34μm + 0.68; p=5.75x10⁻¹⁹).
Taken together, these results suggest that loss of FH function results in a reduction in primary cilia
incidence and length. That the findings are consistent with those observed with loss of HIF-PHD and
SDH function suggests that the underlying mechanism involves pseudohypoxia.

173
Figure 5.12: Monomethyl fumarate causes reduced ciliary formation in PC12 cells
(A) Confocal images of PC12 cells exposed to serum-free media containing monomethyl fumarate (MMF) at the concentrations indicated (or vehicle only control) for 24 hours. Cells were immunolabelled with anti-acetylated α-tubulin (red) and anti-Arl13b (green) for detection of primary cilia. Nuclei were stained with DAPI (blue). Cilia are indicated by arrows, or arrowheads where they are also shown zoomed in the insets. Scale bars = 10 μm.
Quantification of primary cilia incidence (B) and length (C) following treatment as per (A). Error bars indicate + SEM, boxes 25th, 50th and 75th centiles and whiskers the 10th and 90th centiles. Number of cells scored for incidence: 1706 + 423 per condition. Number of cilia measured for length: 212 + 61 per condition. Statistical significance was assessed using a one-way ANOVA compared to control. * p<0.05, *** p<0.001.

174
Figure 5.13: FH knockdown in PC12 cells reduces primary cilia incidence and length
Immunoblot (A) and densitometric analyses (B) of total cell lysates from PC12 cells transfected with FH targeting or non-targeting control siRNAs (Con) and probed with antibodies against FH and β-actin as a loading control. FH protein level was normalised to β-actin as arbitrary units (AU); n = 6.
(C) Confocal images of PC12 cells following treatment as per (A). Cells were immunolabelled with anti-acetylated α-tubulin (red) and anti-Arl13b (green) for detection of primary cilia. Nuclei were stained with DAPI (blue). Cilia are indicated by arrows, or arrowheads where they are also shown zoomed in the insets. Scale bars = 10 μm.
Quantification of primary cilia incidence (D) and length (E) following treatment as per (A). Error bars indicate + SEM, boxes 25th, 50th and 75th centiles and whiskers the 10th and 90th centiles. Number of cells scored for incidence: 1669 + 209 per condition. Number of cilia measured for length: 253 + 21 per condition. Statistical significance was assessed using a Student’s t test. *** p<0.001.
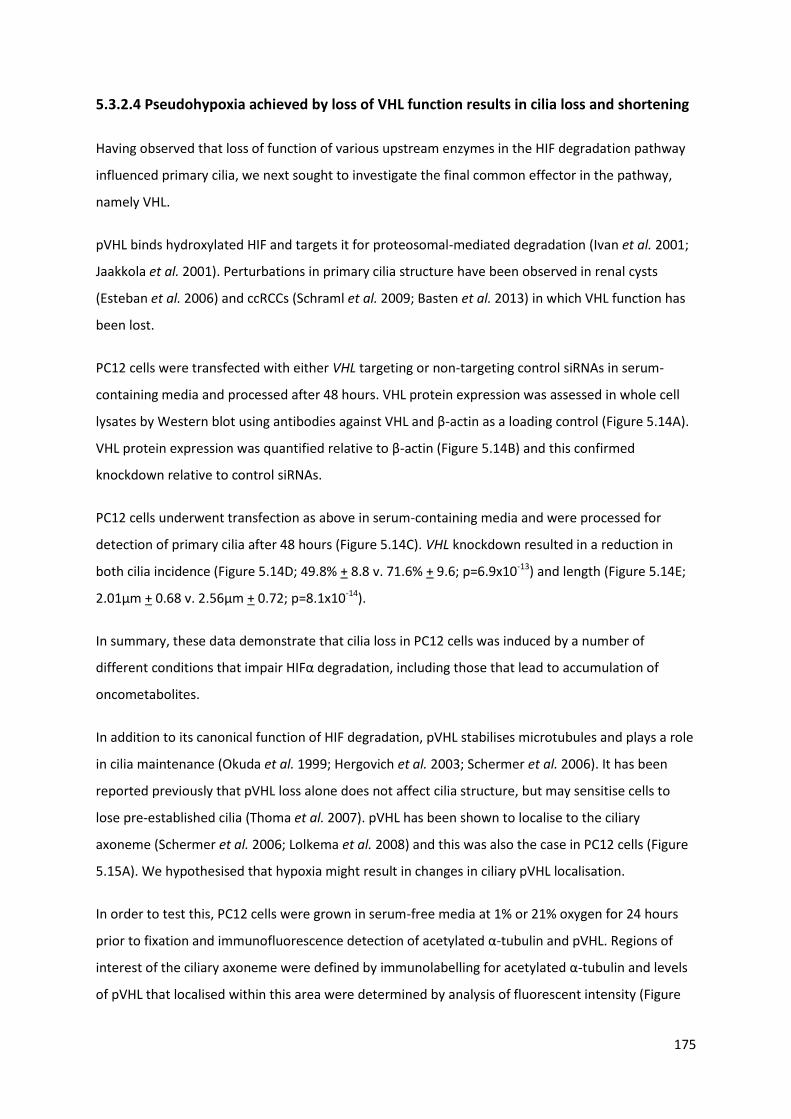
175
5.3.2.4 Pseudohypoxia achieved by loss of VHL function results in cilia loss and shortening
Having observed that loss of function of various upstream enzymes in the HIF degradation pathway
influenced primary cilia, we next sought to investigate the final common effector in the pathway,
namely VHL.
pVHL binds hydroxylated HIF and targets it for proteosomal-mediated degradation (Ivan et al. 2001;
Jaakkola et al. 2001). Perturbations in primary cilia structure have been observed in renal cysts
(Esteban et al. 2006) and ccRCCs (Schraml et al. 2009; Basten et al. 2013) in which VHL function has
been lost.
PC12 cells were transfected with either VHL targeting or non-targeting control siRNAs in serum-
containing media and processed after 48 hours. VHL protein expression was assessed in whole cell
lysates by Western blot using antibodies against VHL and β-actin as a loading control (Figure 5.14A).
VHL protein expression was quantified relative to β-actin (Figure 5.14B) and this confirmed
knockdown relative to control siRNAs.
PC12 cells underwent transfection as above in serum-containing media and were processed for
detection of primary cilia after 48 hours (Figure 5.14C). VHL knockdown resulted in a reduction in
both cilia incidence (Figure 5.14D; 49.8% + 8.8 v. 71.6% + 9.6; p=6.9x10⁻¹³) and length (Figure 5.14E;
2.01μm + 0.68 v. 2.56μm + 0.72; p=8.1x10⁻¹⁴).
In summary, these data demonstrate that cilia loss in PC12 cells was induced by a number of
different conditions that impair HIFα degradation, including those that lead to accumulation of
oncometabolites.
In addition to its canonical function of HIF degradation, pVHL stabilises microtubules and plays a role
in cilia maintenance (Okuda et al. 1999; Hergovich et al. 2003; Schermer et al. 2006). It has been
reported previously that pVHL loss alone does not affect cilia structure, but may sensitise cells to
lose pre-established cilia (Thoma et al. 2007). pVHL has been shown to localise to the ciliary
axoneme (Schermer et al. 2006; Lolkema et al. 2008) and this was also the case in PC12 cells (Figure
5.15A). We hypothesised that hypoxia might result in changes in ciliary pVHL localisation.
In order to test this, PC12 cells were grown in serum-free media at 1% or 21% oxygen for 24 hours
prior to fixation and immunofluorescence detection of acetylated α-tubulin and pVHL. Regions of
interest of the ciliary axoneme were defined by immunolabelling for acetylated α-tubulin and levels
of pVHL that localised within this area were determined by analysis of fluorescent intensity (Figure

176
5.15A). pVHL fluorescent intensity was reduced in the cilium of PC12 cells maintained at 1% oxygen
compared to those at 21% (Figure 5.15B; 0.81AU + 0.28 v. 1AU + 0.37; p=0.023).
Thus, activation of hypoxic signalling may also destabilise cilia through a mechanism where pVHL is
reduced in the ciliary axoneme.
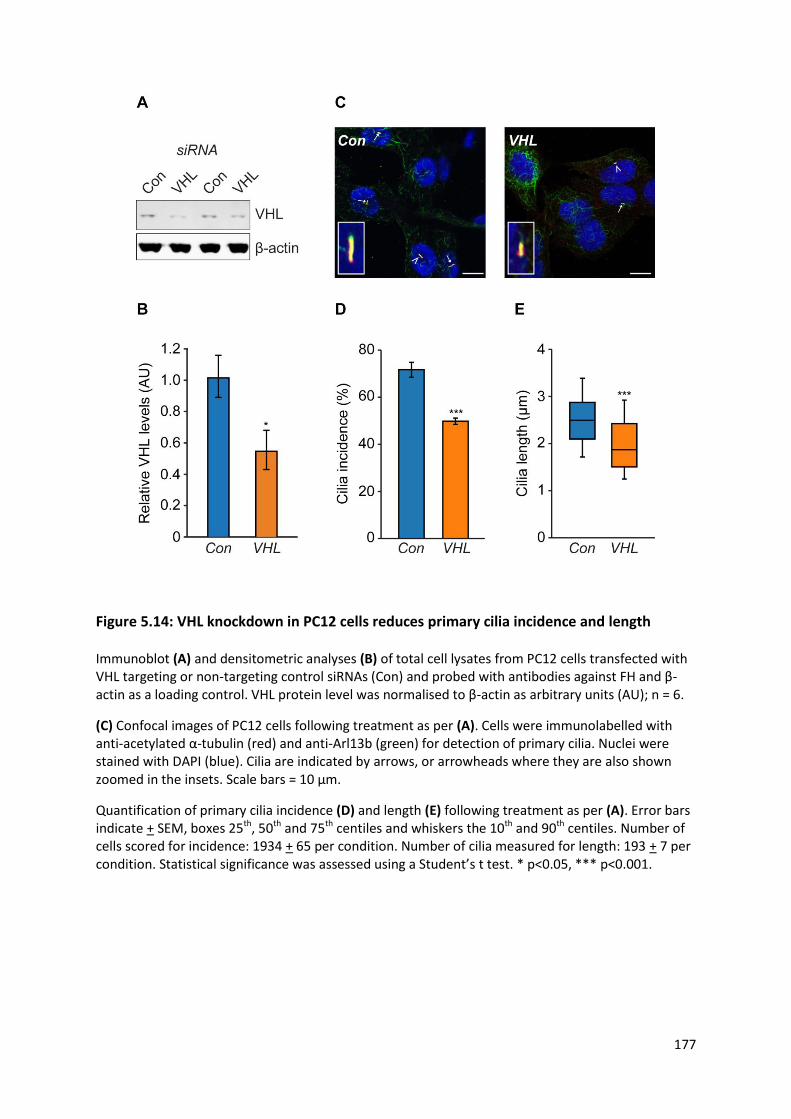
177
Figure 5.14: VHL knockdown in PC12 cells reduces primary cilia incidence and length
Immunoblot (A) and densitometric analyses (B) of total cell lysates from PC12 cells transfected with VHL targeting or non-targeting control siRNAs (Con) and probed with antibodies against FH and β-actin as a loading control. VHL protein level was normalised to β-actin as arbitrary units (AU); n = 6.
(C) Confocal images of PC12 cells following treatment as per (A). Cells were immunolabelled with anti-acetylated α-tubulin (red) and anti-Arl13b (green) for detection of primary cilia. Nuclei were stained with DAPI (blue). Cilia are indicated by arrows, or arrowheads where they are also shown zoomed in the insets. Scale bars = 10 μm.
Quantification of primary cilia incidence (D) and length (E) following treatment as per (A). Error bars indicate + SEM, boxes 25th, 50th and 75th centiles and whiskers the 10th and 90th centiles. Number of cells scored for incidence: 1934 + 65 per condition. Number of cilia measured for length: 193 + 7 per condition. Statistical significance was assessed using a Student’s t test. * p<0.05, *** p<0.001.
178
Figure 5.15: Ciliary localisation of pVHL is reduced by hypoxia
(A) Confocal images of PC12 cells that were cultured in 21% or 1% oxygen for 24 hours prior to fixation and immunolabelling for detection of primary cilia (anti-acetylated α-tubulin, red) and pVHL (green). Nuclei were counter-stained with DAPI (blue). Scale bars: 10μm. (B) Quantification of the intensity of pVHL staining in axonemes (defined by the ciliary area of acetylated α-tubulin) in ciliated cells cultures as in (A). AU arbitrary intensity. Number of cilia scored: 31 + 3 per condition. Statistical significance was assed using a Student’s t-test. * p<0.05.
179
5.3.2.5 Loss of SDHB and VHL in PC12 cells results in increased cellular proliferation
Thus we have demonstrated separately that loss of function of SDHB and VHL results in cilia loss and
that cilia loss itself increases cellular proliferation in PC12 cells (Figure 4.10). We next sought to
confirm that cilia loss due to knockdown of SDHB and VHL directly resulted in increased cellular
proliferation.
PC12 cells were transfected as previously with siRNAs targeting SDHB, VHL or non-targeting controls.
48 hours after transfection cells were either fixed and immunolabelled for Ki67 (Figure 5.16A, B) or
counted (Figure 5.16C).
The prevalence of Ki67 positive cells (Figure 5.16B) was increased by knockdown of both VHL (20.1%
+ 4.0 v. 6.9% + 1.0; p=4.6x10⁻⁶) and SDHB (24.5% + 4.2; p=2.7x10⁻⁸). Cell number relative to time of
transfection (Figure 5.16C) was also increased by knockdown of VHL (3.74 + 0.09 v. 2.84 + 0.15;
p=0.027) and SDHB (4.20 + 0.05; p=0.0086) compared to non-targeting controls.
These observations are consistent with pseudohypoxia-induced cilia loss contributing to increased
cellular proliferation.

180
Figure 5.16: Knockdown of SDHB and VHL in PC12 cells results in increased proliferation
(A) Confocal images of PC12 cells 48 hours after transfection with siRNA against non-targeting control (Con), VHL or SDHB. Cells were immunolabelled with anti-Ki67 (red) and nuclei were stained with DAPI (blue). Arrowheads indicate Ki67 positive cells. Scale bars = 10 μm.
Quantification of Ki67 positive cells (B) and relative cell numbers (C) following treatment as per (A). Number of cells scored for Ki67 positivity: 1177 + 403 per condition. Cell counting was performed on six samples from three biological replicates. Error bars indicate SEM. Statistical significance was assessed using a one-way ANOVA compared to control. * p<0.05, ** p<0.05 *** p<0.001.
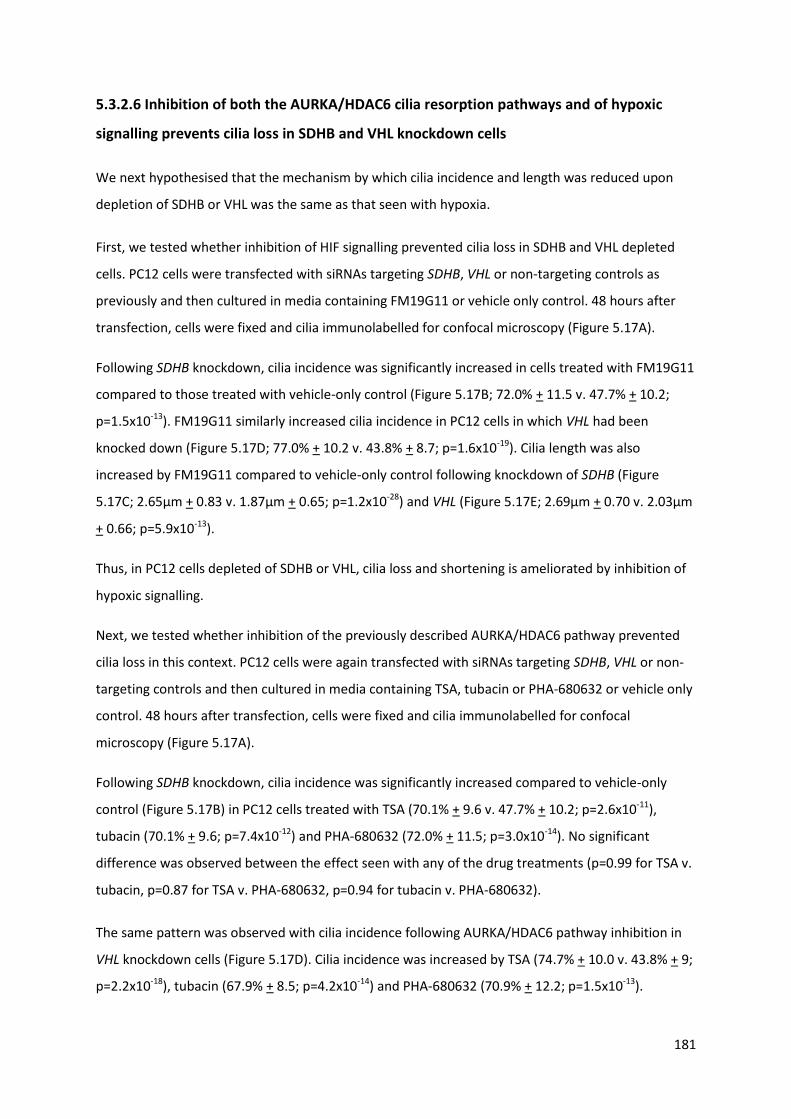
181
5.3.2.6 Inhibition of both the AURKA/HDAC6 cilia resorption pathways and of hypoxic
signalling prevents cilia loss in SDHB and VHL knockdown cells
We next hypothesised that the mechanism by which cilia incidence and length was reduced upon
depletion of SDHB or VHL was the same as that seen with hypoxia.
First, we tested whether inhibition of HIF signalling prevented cilia loss in SDHB and VHL depleted
cells. PC12 cells were transfected with siRNAs targeting SDHB, VHL or non-targeting controls as
previously and then cultured in media containing FM19G11 or vehicle only control. 48 hours after
transfection, cells were fixed and cilia immunolabelled for confocal microscopy (Figure 5.17A).
Following SDHB knockdown, cilia incidence was significantly increased in cells treated with FM19G11
compared to those treated with vehicle-only control (Figure 5.17B; 72.0% + 11.5 v. 47.7% + 10.2;
p=1.5x10⁻¹³). FM19G11 similarly increased cilia incidence in PC12 cells in which VHL had been
knocked down (Figure 5.17D; 77.0% + 10.2 v. 43.8% + 8.7; p=1.6x10⁻¹⁹). Cilia length was also
increased by FM19G11 compared to vehicle-only control following knockdown of SDHB (Figure
5.17C; 2.65μm + 0.83 v. 1.87μm + 0.65; p=1.2x10⁻²⁸) and VHL (Figure 5.17E; 2.69μm + 0.70 v. 2.03μm
+ 0.66; p=5.9x10⁻¹³).
Thus, in PC12 cells depleted of SDHB or VHL, cilia loss and shortening is ameliorated by inhibition of
hypoxic signalling.
Next, we tested whether inhibition of the previously described AURKA/HDAC6 pathway prevented
cilia loss in this context. PC12 cells were again transfected with siRNAs targeting SDHB, VHL or non-
targeting controls and then cultured in media containing TSA, tubacin or PHA-680632 or vehicle only
control. 48 hours after transfection, cells were fixed and cilia immunolabelled for confocal
microscopy (Figure 5.17A).
Following SDHB knockdown, cilia incidence was significantly increased compared to vehicle-only
control (Figure 5.17B) in PC12 cells treated with TSA (70.1% + 9.6 v. 47.7% + 10.2; p=2.6x10⁻¹¹),
tubacin (70.1% + 9.6; p=7.4x10⁻¹²) and PHA-680632 (72.0% + 11.5; p=3.0x10⁻¹⁴). No significant
difference was observed between the effect seen with any of the drug treatments (p=0.99 for TSA v.
tubacin, p=0.87 for TSA v. PHA-680632, p=0.94 for tubacin v. PHA-680632).
The same pattern was observed with cilia incidence following AURKA/HDAC6 pathway inhibition in
VHL knockdown cells (Figure 5.17D). Cilia incidence was increased by TSA (74.7% + 10.0 v. 43.8% + 9;
p=2.2x10⁻¹⁸), tubacin (67.9% + 8.5; p=4.2x10⁻¹⁴) and PHA-680632 (70.9% + 12.2; p=1.5x10⁻¹³).

182
Likewise with SDHB, there were no significant differences between these three drug treatments
(p=0.14 for TSA v. tubacin, p=0.73 for TSA v. PHA-680632, p=0.90 for tubacin v. PHA-680632).
Cilia length was also increased compared to vehicle-only controls (Figure 5.17C) in SDHB depleted
PC12 cells treated with TSA (2.56μm + 0.65 v. 1.87μm + 0.65; p=7.5x10⁻²⁵), tubacin (2.64μm + 0.74;
p=1.2x10⁻²⁸) and PHA-680632 (2.59μm + 0.80; p=3.8x10⁻²⁷). Again, no between group differences
were observed (p=0.80 for TSA v. tubacin, p=0.99 for TSA v. PHA-680632, p=0.97 for tubacin v. PHA-
680632).
The same pattern was observed with regard to cilia length following AURKA/HDAC6 pathway
inhibition in VHL knockdown cells (Figure 5.17E). Cilia length was increased compared to vehicle-only
controls by TSA (2.44μm + 0.70 v. 2.03μm + 066; p=2.0x10⁻⁷), tubacin (2.67μm + 0.70; p=5.8x10⁻¹³)
and PHA-680632 (2.69μm + 0.70; p=5.8x10⁻¹³). There was no difference between tubacin and PHA-
680632 treatment (p=0.99) but there was between TSA treated cells and tubacin (p=0.38) and PHA-
680632 (p=0.16).
Taken together, these data indicate that the AURKA/HDAC6 pathway is a modulator of cilia loss in
PC12 cells depleted for SDHB or VHL and that this process appears to be dependent on HIF signalling.
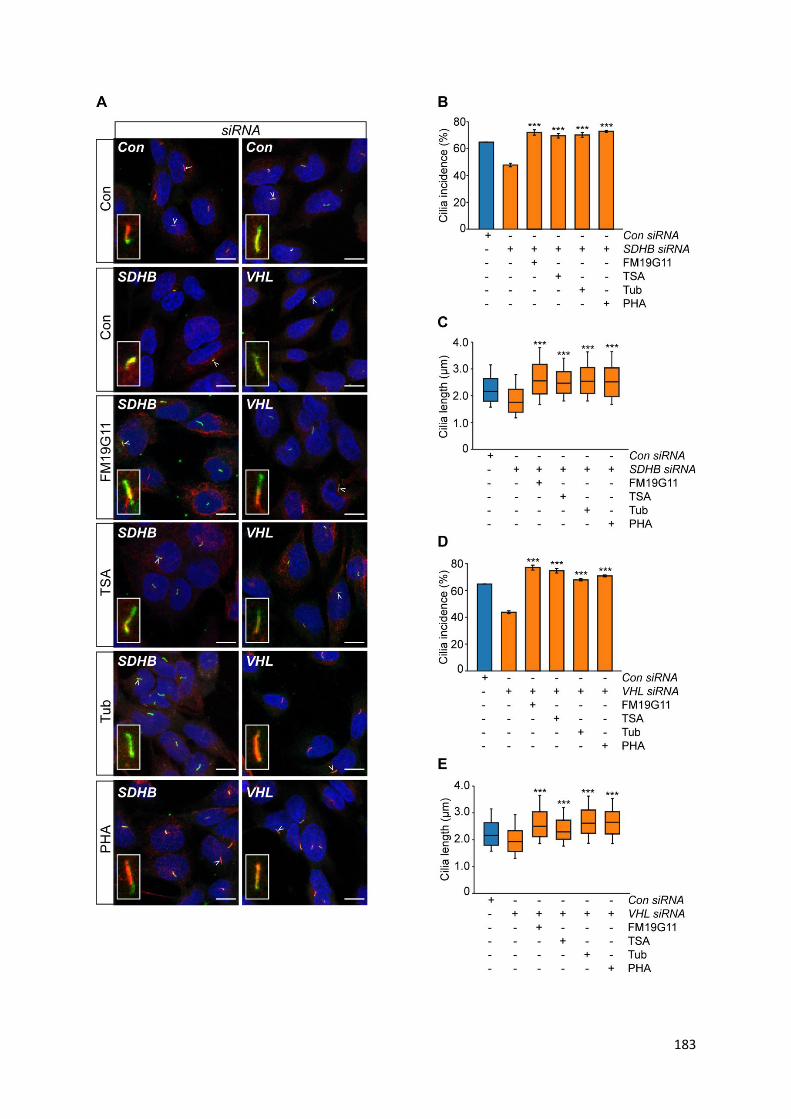
183

184
Figure 5.17: Inhibition of cilia resorption and hypoxic signalling prevents cilia loss caused
by knockdown of SDHB and VHL
(A) Confocal images of PC12 cells 48 hours after transfection with siRNAs targeting SDHB or VHL in the presence or absence of the inhibitors FM19G11, TSA, tubacin (Tub) and PHA-680632 (PHA), or vehicle only controls. Cells were immunolabelled with anti-acetylated α-tubulin (red) and anti-Arl13b (green) for detection of primary cilia. Nuclei were stained with DAPI (blue). Cilia are indicated by arrows, or arrowheads where they are also shown zoomed in the insets. Scale bars = 10 μm Quantification of primary cilia incidence (B, D) and length (C, E) 48 hours after transfection with siRNAs targeting SDHB (B, C) or VHL (D, E) and drug treatments as per (A). Error bars indicate + SEM, boxes 25th, 50th and 75th centiles and whiskers the 10th and 90th centiles. Number of cells scored for incidence: 1873 + 200 per condition. Number of cilia measured for length: 231 + 50 per condition. Statistical significance was assessed using a one-way ANOVA compared to control. *** p<0.001.

185
5.3.3 The effects of catecholamines and metanephrines on
phaeochromocytoma primary cilia
Having identified that two key components of the phaeochromocytoma tumour microenvironment
(namely hypoxia and pseudohypoxia) influenced primary cilia, we sought to examine other features.
We first considered the secretory product of these tumours: catecholamines and metanephrines.
5.3.3.1 The effect of circulating metanephrines on human phaeochromocytoma primary
cilia incidence and length
For the patients previously described in chapter 4, we obtained available diagnostic pre-operative
biochemistry and analysed whether the type or magnitude of metanephrine secretion influenced
phaeochromocytoma primary cilia incidence or length. Patients were recruited from a number of
different centres with differing clinical practices including whether measurement of metanephrines
was in urine or plasma and with different reference ranges depending on the method of
quantification. In order to allow magnitude comparisons between patients from different centres,
magnitude was expressed as a proportion compared to the upper limit of the normal reference
range (ULN).
Using linear regression analysis, cilia incidence and length were compared with the magnitude of
elevation for each individual metanephrine (normetanephrine, metanephrine and 3-
methoxytyramine), as displayed in Figure 5.18. There was no statistically significant relationship
between tumoural cilia incidence and concentration of normetanephrine, metanephrine or 3-
methoxytyramine (Figure 5.18A, C, E; p = 0.71, 0.19 and 0.65 respectively). Similarly, p values did not
reach significance when comparing cilia length and normetanephrine and 3-methoxytyramine
(Figure 5.18B, F; p =0.74 and 0.71 respectively). However, pre-operative metanephrine elevation was
positively correlated with tumoural cilia length (Figure 5.18D, r2 = 0.0868, p=0.0445).
The absolute magnitude of each individual metanephrine is not constant due to variable tumoural
secretion. Furthermore, commonly used medications in the care of patients with
phaeochromocytomas can alter measured metanephrine concentrations due to either analytical
interference in some assays (e.g. paracetamol) or pharmacodynamic interference regardless of the
methodology of measurement (e.g. phenoxybenzamine) (Lenders et al. 2014). Given these variables
and the unpredictable degree with which they might alter absolute metanephrine concentrations on
a given day, we also considered whether tumoural cilia incidence and length might be related to any
elevation of circulating metanephrine.
186
Figure 5.18: Phaeochromocytoma primary cilia length is correlated with circulating
metanephrine concentration.
Data are presented from the 47 phaeochromocytomas and paragangliomas previously described in chapter 4. Cilia incidence (A, C, E) and length (B, D, F) were calculated and plotted against the pre-operative concentration of normetanephrine (NMN; A, B), metanephrine (MN; C, D) and 3-methoxytyramine (MTY; E, F) expressed as a proportion of the upper limit of normal (ULN) of the reference range. N = 47 tumours for NMN and MN (A-D) and 45 for MTY (E, F). r2 values were calculated using linear regression analysis. Only cilia length and MN (D) reached a statistically significant p value (p=0.0445).

187
All tumours were classified according to whether each constituent metanephrine (measured in the
urine or plasma) was within or above the assay-specified reference range. Using this approach, in
accordance with the findings in Figure 5.18, cilia length was significantly higher in those tumours
with any elevation of metanephrine (Figure 5.19D; 1.64μm + 0.31 compared to 1.38μm + 0.31,
p=0.0074). In addition, cilia incidence was also greater in those tumours with elevated metanephrine
(Figure 5.19C; 4.06% + 1.80 compared to 2.29% + 1.54, p=0.0007).
There was no significant difference in cilia incidence or length in tumours associated with elevated
normetanephrine (Figure 5.19A, B; p=0.64 and 0.37 respectively) or 3-methoxytyramine (Figure
5.19E, F; p=0.66 and 0.30 respectively). It should be noted that there were only three tumours with
non-elevated normetanephrine and this small group size makes meaningful comparisons difficult.
Phaeochromocytomas often produce more than one type of metanephrine. In the group studied, 24
of 47 tumours (51.1%) produced multiple metanephrines (70.8% of which produced two and the
remaining 29.2% produced all three). Having identified that tumours with elevated metanephrine
had increased cilia incidence and length compared to those with elevated normetanephrine and 3-
methoxytyramine, we wanted to see whether this effect was preserved in tumours that produced
multiple metanephrines.
There was no significant difference between cilia incidence or length depending on the predominant
metanephrine produced (Figure 5.20 A, B), although in accordance with previous results, there was a
trend towards metanephrine-predominant tumours to have more abundant (3.63% + 0.79 v. 3.10% +
2.32, p=0.8234) and longer cilia (1.69μm + 0.28 v. 1.43μm + 0.34, p=0.0925) compared to
normetanephrine-predominant tumours. It should be noted that the other two subgroups (non-
secretory and 3-methoxytyramine-predominant tumours) both had small sample sizes (3 and 4
respectively).
Similarly, when the profile of metanephrine production was considered (Figure 5.20 C-F), no
statistically significant difference between groups was identified. There was, however, a trend
towards increasing cilia incidence (3.55% + 2.03 v. 2.64% v. 1.68, p=0.2494) and length (1.57μm +
0.31 v. 1.43μm + μm + 0.35, p=0.36) in tumours producing multiple compared to a single
metanephrine only.
Taken together, these results suggest that adrenaline or its metabolite metanephrine may be
correlated with primary cilia incidence and length in human phaeochromocytomas, although any
relationship is clearly complex with multiple potential confounders.

188
Figure 5.19: Phaeochromocytoma primary cilia incidence and length is correlated with
elevated circulating metanephrine.
Data are presented from the 47 phaeochromocytomas and paragangliomas previously described in Chapter 4. Cilia incidence (A, C, E) and length (B, D, F) were calculated and plotted against normetanephrine (A, B), metanephrine (C, D) and 3-methoxytyramine (E, F) and whether they were elevated or within the reference range. N = 47 tumours for normetanephrine and metanephrine (A-D) and 45 for 3-methoxytyramine (E, F). Centre bar represents mean, error bars standard deviation. Statistical significance was assessed using an unpaired two-tail t test. Ns = not significant, ** p<0.01, *** p<0.001.

189
Figure 5.20: Phaeochromocytoma primary cilia incidence and length in vivo is not related
to predominant or number of metanephrines secreted
Data are presented from the 47 phaeochromocytomas and paragangliomas previously described in chapter 4. Cilia incidence (A, C, E) and length (B, D, F) were calculated and plotted according to the predominant metanephrine (A, B) or the number of different metanephrines produced (C-F). NMN = normetanephrine, MN = metanephrine, MTY = 3-methoxytyramine. N = 47. Centre bar represents mean, error bars standard deviation. Statistical significance was assessed using a one-way ANOVA.

190
5.3.3.2 The effect of catecholamines on primary cilia incidence and length in rat
phaeochromocytoma-derived PC12 cells
Having observed that circulating metanephrine was correlated with phaeochromocytoma primary
cilia incidence and length, we sought to further investigate the effects of catecholamines on primary
cilia.
5.3.3.2.1 Adrenaline increases incidence and length of primary cilia in PC12 cells via the
beta adrenoceptor
The catecholamines adrenaline and noradrenaline exert their action via the alpha and beta
adrenoceptors. These are G-protein coupled receptors with a number of subtypes defined by their
coupled G-protein and agonist sensitivity which have a range of differing tissue localisations and
physiological functions (Figure 2.3).
There is extremely limited data about the effect of adrenaline and noradrenaline on primary cilia.
The β2-adreneroceptor has been shown to localise to primary cilia in murine neurons (Yao et al.
2016), whilst it is excluded from primary cilia in murine inner medullary collecting duct cells (Marley
et al. 2013). Although little has been published on the effects of catecholamines on primary cilia,
they are known to be stimulatory to the related motile cilia in bronchial (Weiterer et al. 2015) and
tracheal (Bailey et al. 2014) epithelium.
Given the observation that ciliary incidence and length were increased in phaeochromocytomas that
secreted metanephrine (Figure 5.19 C-D), the metabolite of adrenaline, we first sought to evaluate
the effect of adrenaline on primary cilia in the context of the rat PC12 phaeochromocytoma cell line.
PC12 cells were exposed to increasing concentrations of adrenaline in serum-free media for 24 hours
prior to fixation and immunolabelling to detect primary cilia (Figure 5.21A).
Cilia incidence was increased in PC12 cells exposed to all concentrations of adrenaline tested (1nM –
100μM) compared to vehicle only control (Figure 5.21B; e.g. 67.2% + 11.6 for 1nM compared to
44.8% + 12.5; p=3.4x10⁻⁵) with the greatest effect being observed at 100 nM (68.2% + 10.7;
p=1.2x10⁻⁵). No difference was seen between the different concentrations of adrenaline tested.
Increased cilia length was observed at most concentrations tested (2.36μm + 0.70 compared to
2.76μm + 0.90 for 1nM, p=0.047; 2.90μm + 1.17 for 100nM, p=0.0002; 2.72μm + 0.92 for 1μM,
p=0.0034; 2.89μm + 0.88 for 100μM, p=0.0011). In the two concentrations where significance was
not reached, there was a trend to increased cilia length (p= 0.16 for 10nM; 0.28 for 10μM). Again, no
difference was observed between the different adrenaline concentrations tested.
191
Thus, the administration of extracellular adrenaline to PC12 cells resulted in increases in ciliary
incidence and length. Activation of both alpha and beta adrenoceptors are linked to mechanisms
that have previously been shown to influence cilia length (Figure 2.3). Stimulation of alpha receptors
results in intracellular calcium influx and activation of PKC via the Gq/PLC/IP3/DAG signalling cascade
(reviewed in (Insel 1989)), whilst beta receptor activation results in increases in cAMP and Protein
Kinase A (PKA) activity via the Gs/AC cascade (reviewed in (Wallukat 2002)). Therefore we utilised
non-selective alpha and beta receptor antagonists in order to delineate the receptor subtype
responsible for the observed adrenaline-mediated ciliary changes in PC12 cells.
Phenoxybenzamine is a non-selective irreversible alpha adrenoceptor antagonist whilst propranolol
is a non-selective beta adrenoceptor antagonist. Together they form the cornerstone of medical
treatment of phaeochromocytomas in preparation for surgery or when inoperable to reduce the risk
of catecholamine-mediated surges and vascular events. PC12 cells were exposed to either
phenoxybenzamine or propranolol at varying concentrations for one hour prior to washing and
exposure to 1μM adrenaline for 24 hours in serum-free conditions. Cells were then fixed and
immunolabelled to detect primary cilia (Figure 5.22A). Adrenaline and vehicle only controls were
utilised for comparison.
There was no difference between cilia incidence in cells that had been pre-treated with
phenoxybenzamine at all concentrations tested (10nM – 1μM) compared to those exposed to
adrenaline alone (Figure 5.22B; p=0.87 for 10nM, 0.99 for 100nM and 0.98 for 1μM). However, when
PC12 cells were exposed to propranolol prior to adrenaline, cilia incidence was significantly shorter
at all concentrations tested (10nM – 1μM) compared to those exposed to adrenaline alone (Figure
5.22B; 60.2% + 13.2 compared to 48.4 % + 6.2 for 10nM, p=0.0105; 49.4 % + 12.7 for 100nM,
p=0.0300; 45.3 % + 12.6 for 1μM, p=0.0035). There was no difference between cilia incidence in cells
exposed to propranolol and adrenaline and those exposed to neither (p=0.99 for 10nM, 0.97 for
100nM and 0.99 for 1μM).
Cilia length was not significantly different in PC12 cells pre-treated with phenoxybenzamine
compared to those without pre-treatment (Figure 5.22C; 2.72μm + 0.92) at concentrations of 10nM
(2.39μm + 0.64, p=0.073) and 1μM (2.39μm + 0.55, p=0.092) but not at 100nM when cilia were
significantly shorter (2.34μm + 0.52, p=0.023). In the same pattern as was observed with cilia
incidence, PC12 pre-treated with propranolol had significantly shorter cilia than those without
(Figure 5.22C; 2.72μm + 0.92 compared to 2.29μm + 0.72 for 10nM, p=0.024; 2.03μm + 0.71 for
100nM, p=2.3 x10⁻⁸; 2.16μm + 0.66 for 1μM, p=4.5 x 10⁻⁶). Similarly, there was no difference
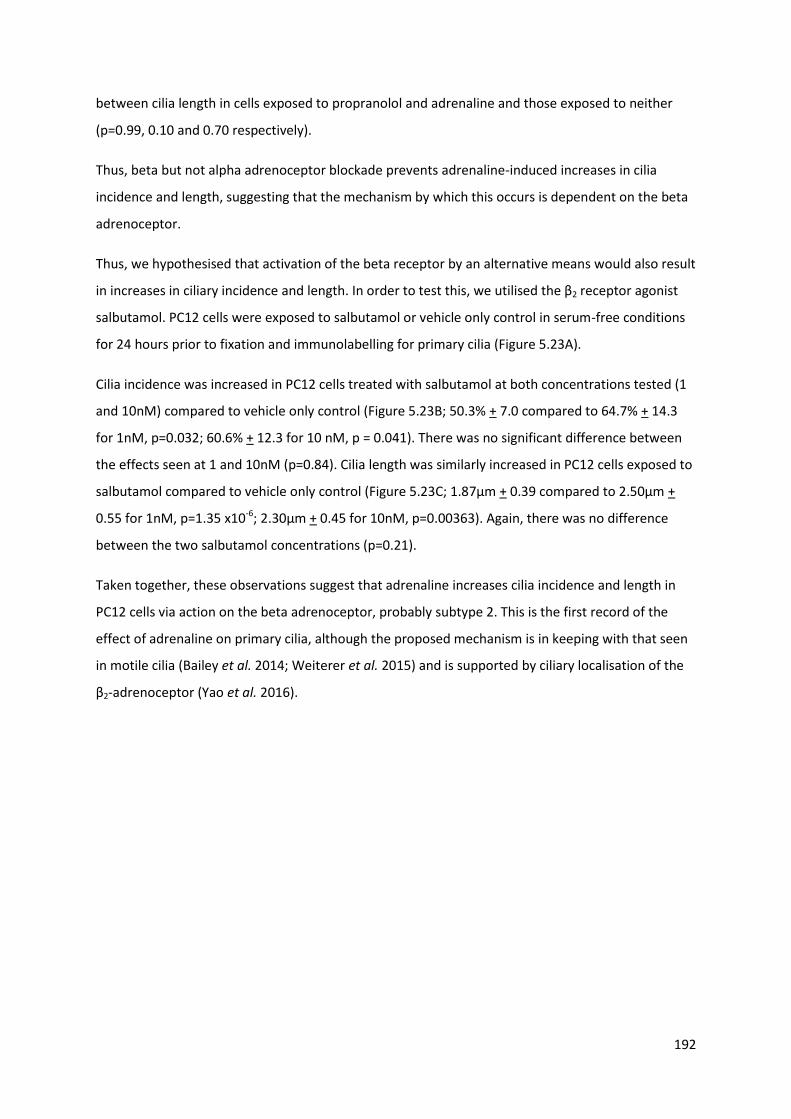
192
between cilia length in cells exposed to propranolol and adrenaline and those exposed to neither
(p=0.99, 0.10 and 0.70 respectively).
Thus, beta but not alpha adrenoceptor blockade prevents adrenaline-induced increases in cilia
incidence and length, suggesting that the mechanism by which this occurs is dependent on the beta
adrenoceptor.
Thus, we hypothesised that activation of the beta receptor by an alternative means would also result
in increases in ciliary incidence and length. In order to test this, we utilised the β2 receptor agonist
salbutamol. PC12 cells were exposed to salbutamol or vehicle only control in serum-free conditions
for 24 hours prior to fixation and immunolabelling for primary cilia (Figure 5.23A).
Cilia incidence was increased in PC12 cells treated with salbutamol at both concentrations tested (1
and 10nM) compared to vehicle only control (Figure 5.23B; 50.3% + 7.0 compared to 64.7% + 14.3
for 1nM, p=0.032; 60.6% + 12.3 for 10 nM, p = 0.041). There was no significant difference between
the effects seen at 1 and 10nM (p=0.84). Cilia length was similarly increased in PC12 cells exposed to
salbutamol compared to vehicle only control (Figure 5.23C; 1.87μm + 0.39 compared to 2.50μm +
0.55 for 1nM, p=1.35 x10⁻⁶; 2.30μm + 0.45 for 10nM, p=0.00363). Again, there was no difference
between the two salbutamol concentrations (p=0.21).
Taken together, these observations suggest that adrenaline increases cilia incidence and length in
PC12 cells via action on the beta adrenoceptor, probably subtype 2. This is the first record of the
effect of adrenaline on primary cilia, although the proposed mechanism is in keeping with that seen
in motile cilia (Bailey et al. 2014; Weiterer et al. 2015) and is supported by ciliary localisation of the
β2-adrenoceptor (Yao et al. 2016).

193
Figure 5.21: Adrenaline increases PC12 cell primary cilia incidence and length
(A) Confocal images of PC12 cells exposed to adrenaline at the concentrations indicated (or vehicle only control) for 24 hours. Cells were immunolabelled with anti-acetylated α-tubulin (red) and anti-Arl13b (green) for detection of primary cilia. Nuclei were stained with DAPI (blue). Cilia are indicated by arrows, or arrowheads where they are also shown zoomed in the insets. Scale bars = 10 μm.
Quantification of primary cilia incidence (B) and length (C) following treatment as per (A). Error bars indicate + SEM, boxes 25th, 50th and 75th centiles and whiskers the 10th and 90th centiles. Number of cells scored for incidence: 1698 + 138 per condition. Number of cilia measured for length: 193 + 40 per condition. Statistical significance was assessed using a one-way ANOVA comparing to control. * p< 0.05, * p<0.01, *** p< 0.001.
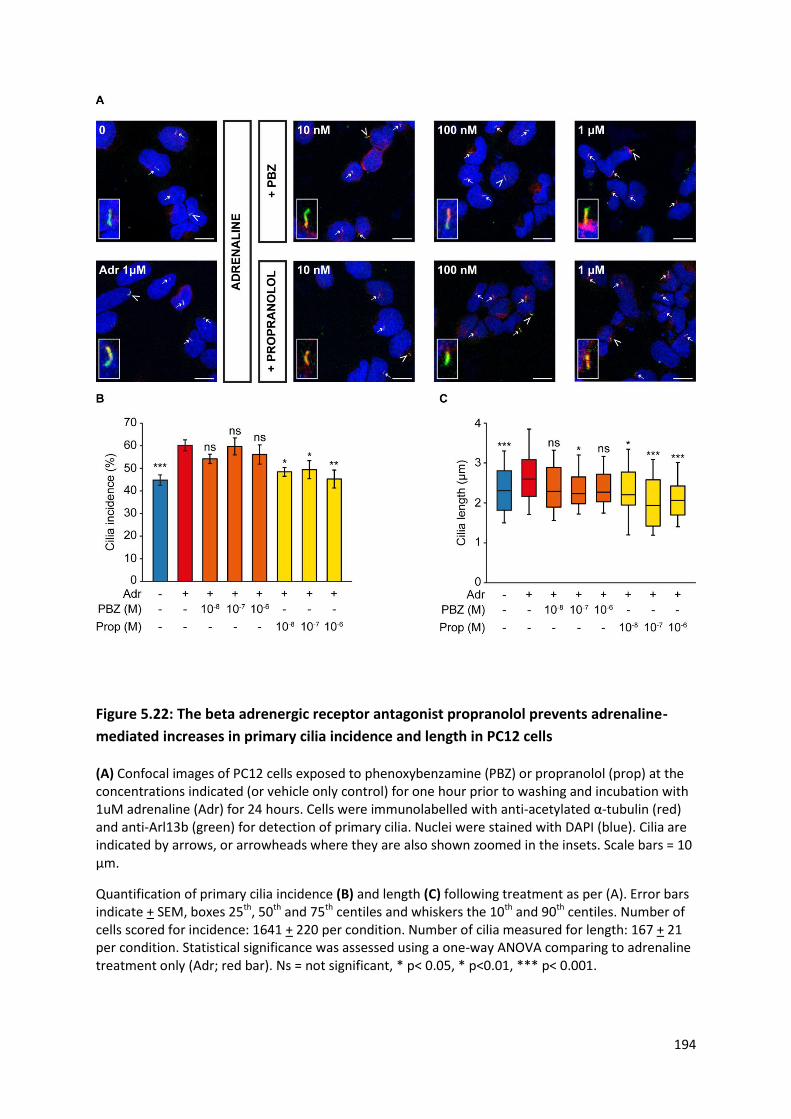
194
Figure 5.22: The beta adrenergic receptor antagonist propranolol prevents adrenaline-
mediated increases in primary cilia incidence and length in PC12 cells
(A) Confocal images of PC12 cells exposed to phenoxybenzamine (PBZ) or propranolol (prop) at the concentrations indicated (or vehicle only control) for one hour prior to washing and incubation with 1uM adrenaline (Adr) for 24 hours. Cells were immunolabelled with anti-acetylated α-tubulin (red) and anti-Arl13b (green) for detection of primary cilia. Nuclei were stained with DAPI (blue). Cilia are indicated by arrows, or arrowheads where they are also shown zoomed in the insets. Scale bars = 10 μm.
Quantification of primary cilia incidence (B) and length (C) following treatment as per (A). Error bars indicate + SEM, boxes 25th, 50th and 75th centiles and whiskers the 10th and 90th centiles. Number of cells scored for incidence: 1641 + 220 per condition. Number of cilia measured for length: 167 + 21 per condition. Statistical significance was assessed using a one-way ANOVA comparing to adrenaline treatment only (Adr; red bar). Ns = not significant, * p< 0.05, * p<0.01, *** p< 0.001.

195
Figure 5.23: The beta adrenergic receptor agonist salbutamol increases primary cilia
incidence and length in PC12 cells
(A) Confocal images of PC12 cells exposed to salbutamol at the concentrations indicated (or vehicle only control) for 24 hours. Cells were immunolabelled with anti-acetylated α-tubulin (red) and anti-Arl13b (green) for detection of primary cilia. Nuclei were stained with DAPI (blue). Cilia are indicated by arrows, or arrowheads where they are also shown zoomed in the insets. Scale bars = 10 μm.
Quantification of primary cilia incidence (B) and length (C) following treatment as per (A). Error bars indicate + SEM, boxes 25th, 50th and 75th centiles and whiskers the 10th and 90th centiles. Number of cells scored for incidence: 542+ 98 per condition. Number of cilia measured for length: 98 + 19 per condition. Statistical significance was assessed using a one-way ANOVA comparing to control. * p< 0.05, * p<0.01, *** p< 0.001.

196
5.3.3.2.2 Noradrenaline increases incidence and length of primary cilia in rat
phaeochromocytoma cells
We next examined whether noradrenaline had the same effect as adrenaline on primary cilia. PC12
cells were exposed to increasing concentrations of noradrenaline in serum-free media for 24 hours
prior to fixation and immunolabelling for cilia detection (Figure 5.24A).
Primary cilia incidence was increased by noradrenaline at all concentrations tested (1nM – 100μM)
compared to vehicle only control (Figure 5.24B). The greatest effect was seen with 1μM
noradrenaline (70.9% + 3.7 v. 44.8% + 2.3; p=1.9x10⁻⁸). There was no significant difference in effect
between any of the noradrenaline concentrations tested.
The relationship between noradrenaline and cilia length was less clear (Figure 5.24C). Ciliary length
was increased following noradrenaline treatment at some but not all concentrations: 10nM (2.36μm
+ 0.70 v. 2.64μm + 0.68; p=0.038), 1μM (3.04 μm + 1.12; p=2.5x10⁻¹⁰) and 100μM (2.74μm + 0.89;
p=0.0032). Cilia length was longest following treatment with 1μM noradrenaline and was
significantly longer when compared to all other concentrations of noradrenaline with the exception
of 100μM (p=0.09).
Thus, both adrenaline and noradrenaline increase PC12 primary cilia incidence and length.

197
Figure 5.24: Noradrenaline increases PC12 cell primary cilia incidence and length
(A) Confocal images of PC12 cells exposed to noradrenaline at the concentrations indicated (or vehicle only control) for 24 hours. Cells were immunolabelled with anti-acetylated α-tubulin (red) and anti-Arl13b (green) for detection of primary cilia. Nuclei were stained with DAPI (blue). Cilia are indicated by arrows, or arrowheads where they are also shown zoomed in the insets. Scale bars = 10 μm.
Quantification of primary cilia incidence (B) and length (C) following treatment as per (A). Error bars indicate + SEM, boxes 25th, 50th and 75th centiles and whiskers the 10th and 90th centiles. Number of cells scored for incidence: 1532 + 125 per condition. Number of cilia measured for length: 161 + 17 per condition. Statistical significance was assessed using a one-way ANOVA comparing to control. * p< 0.05, * p<0.01, *** p< 0.001.

198
5.3.3.2.3 Dopamine increases incidence and length of primary cilia in rat
phaeochromocytoma cells via dopamine receptors
The catecholamine dopamine, unlike adrenaline and noradrenaline, exerts its action via the
dopamine receptor. Dopamine receptors have been shown to be expressed on primary cilia in a
variety of tissue and cell types (Abdul-Majeed & Nauli 2011; Domire et al. 2011; Iwanaga et al.
2011a; Avasthi et al. 2012; Marley & von Zastrow 2012; Marley et al. 2013; Jin et al. 2014; Upadhyay
et al. 2014; Omori et al. 2015) and their activation or loss causes tissue-specific changes in primary
cilia (Abdul-Majeed & Nauli 2011; Marley et al. 2013; Jin et al. 2014; Kathem et al. 2014; Miyoshi et
al. 2014; Upadhyay et al. 2014).
Given the established role of dopamine on primary cilia, we sought to evaluate this in the context of
the rat PC12 phaeochromocytoma cell line. PC12 cells were exposed to increasing concentrations of
dopamine in serum-free media for 24 hours prior to fixation and immunolabelling to detect primary
cilia as previously described (Figure 5.25A).
Cilia incidence was increased in PC12 cells exposed to all concentrations of dopamine tested (1nM –
100μM) compared to vehicle only control (Figure 5.25B; e.g. 60.9% + 10.2 for 1nM compared to
44.8% + 12.5; p=0.0039), however no difference was observed between different concentrations of
dopamine tested (e.g. 60.9% + 10.2 for 1nM compared to 68.2% + 6.1 for 100nM; p=0.7758).
Increased cilia length was observed in cells exposed to dopamine at concentrations exceeding 10μM
(Figure 5.25C; 2.81μm + 0.77 for 10μM compared to. 2.36μm + 0.70; p=0.0012).
Thus, the administration of extracellular dopamine to PC12 cells resulted in increases in ciliary
incidence at all concentrations tested (Figure 5.25B) and length at concentrations above 10μM
(Figure 5.25C). These observations are consistent with previous findings in mouse endothelium
(Abdul-Majeed & Nauli 2011; Kathem et al. 2014) and porcine renal cells (Upadhyay et al. 2014). The
mechanism by which dopamine increases cilia length in these cell types appears to be via action on
the D1-like subfamily of dopamine receptors (D1 and D5). Evidence for this includes that cilia
lengthening was observed following exposure to the D1-like receptor agonist fenoldopam (Kathem et
al. 2014; Upadhyay et al. 2014) and transfection of a constitutively active D1 receptor (Avasthi &
Marshall 2012). Knockdown of the D5 receptor results in cilia shortening and insensitivity to fluid
flow in vascular endothelium (Abdul-Majeed & Nauli 2011).
Interestingly, the opposite response was observed in primary cilia in striatal neurons in rats and mice
that had lost dopaminergic input (Miyoshi et al. 2014). In this paradigm, lack of dopamine due to

199
stereotactic lesions, pharmacological depletion (via reserpine) or inhibition of synthesis (by the
tyrosine hydroxylase inhibitor alpha-methyl-p-tyrosine) resulted in increases in cilia length. This
effect was mediated by the D2 receptor. Receptor activation by the agonists bromocriptine and
quinpirole attenuated reserpine-induced cilia lengthening, whilst receptor blockade (by the
antagonist haloperidol) or loss (in D2 null mice) resulted in ciliary lengthening.
Thus, it appears that there is differential ciliary responsiveness to dopamine in different tissue types
mediated by different dopamine receptor subtypes.
In order to begin to determine the mechanisms by which dopamine might influence cilia incidence
and length in PC12 cells, they were exposed to increasing concentrations of the D2 receptor
antagonist metoclopramide in serum-free media for 24 hours prior to fixation and immunolabelling
to detect primary cilia (Figure 5.26A). Metoclopramide was chosen due to a combination of its
receptor specificity, its widespread clinical use as an anti-emetic and its association with
precipitation of phaeochromocytoma crises (Guillemot et al. 2009).
Cilia incidence was reduced in PC12 cells exposed to metoclopramide at concentrations at and
exceeding 1μM compared to vehicle only control (Figure 5.26B; 33.1% + 6.5 at 1μM compared to
46.3% + 12.3; p = 0.0091). Cilia length was also reduced in cells exposed to metoclopramide at 1μM
and 10μM (Figure 5.26C; 1.91μm + 0.50 for 1μM compared to 2.35μm + 0.67; p = 0.015).
Thus, antagonism of the D2 receptor in PC12 cells results in cilia loss and shortening. Although the
effect of metoclopramide on primary cilia has not been reported previously, it is interesting to note
that the direction of effect is the reverse of that observed in striatal neurons.
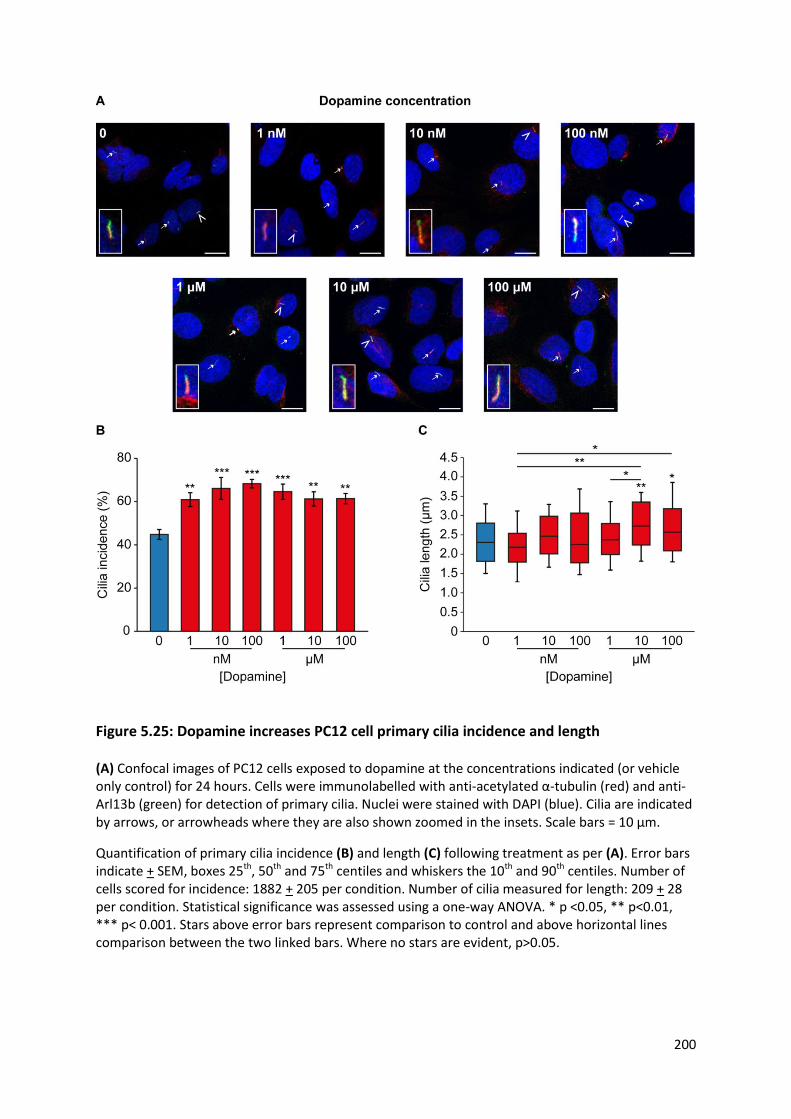
200
Figure 5.25: Dopamine increases PC12 cell primary cilia incidence and length
(A) Confocal images of PC12 cells exposed to dopamine at the concentrations indicated (or vehicle only control) for 24 hours. Cells were immunolabelled with anti-acetylated α-tubulin (red) and anti-Arl13b (green) for detection of primary cilia. Nuclei were stained with DAPI (blue). Cilia are indicated by arrows, or arrowheads where they are also shown zoomed in the insets. Scale bars = 10 μm.
Quantification of primary cilia incidence (B) and length (C) following treatment as per (A). Error bars indicate + SEM, boxes 25th, 50th and 75th centiles and whiskers the 10th and 90th centiles. Number of cells scored for incidence: 1882 + 205 per condition. Number of cilia measured for length: 209 + 28 per condition. Statistical significance was assessed using a one-way ANOVA. * p <0.05, ** p<0.01, *** p< 0.001. Stars above error bars represent comparison to control and above horizontal lines comparison between the two linked bars. Where no stars are evident, p>0.05.
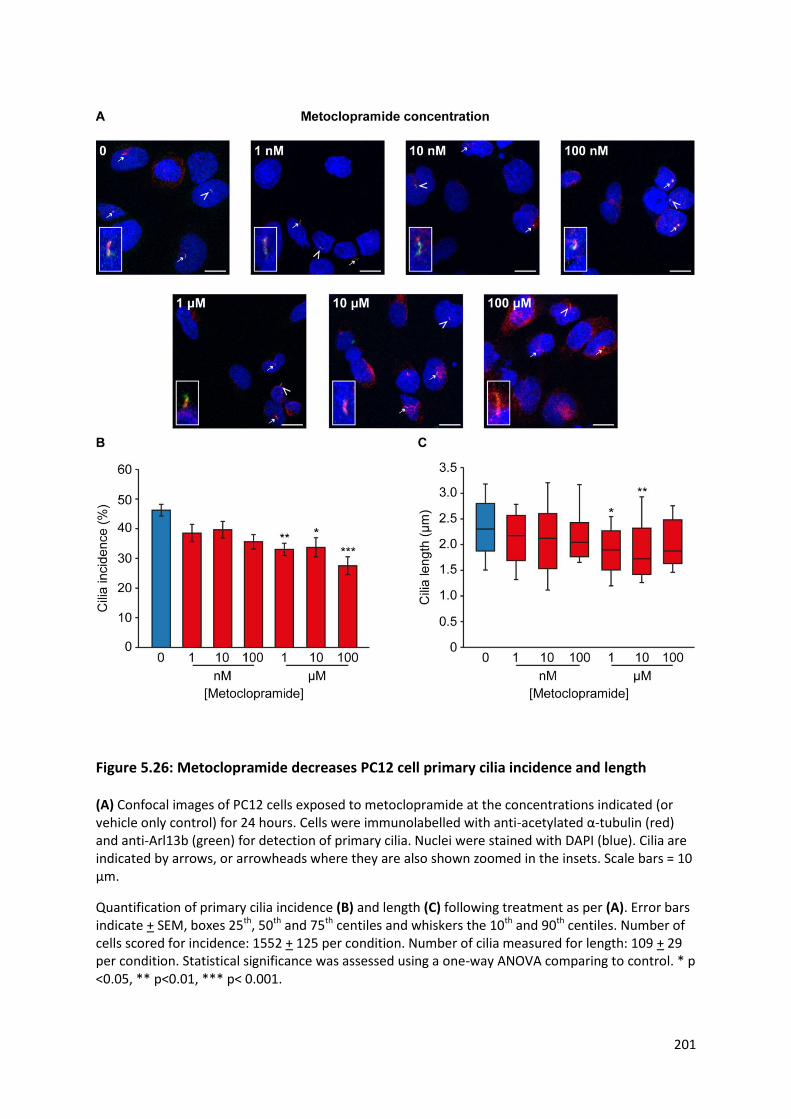
201
Figure 5.26: Metoclopramide decreases PC12 cell primary cilia incidence and length
(A) Confocal images of PC12 cells exposed to metoclopramide at the concentrations indicated (or vehicle only control) for 24 hours. Cells were immunolabelled with anti-acetylated α-tubulin (red) and anti-Arl13b (green) for detection of primary cilia. Nuclei were stained with DAPI (blue). Cilia are indicated by arrows, or arrowheads where they are also shown zoomed in the insets. Scale bars = 10 μm.
Quantification of primary cilia incidence (B) and length (C) following treatment as per (A). Error bars indicate + SEM, boxes 25th, 50th and 75th centiles and whiskers the 10th and 90th centiles. Number of cells scored for incidence: 1552 + 125 per condition. Number of cilia measured for length: 109 + 29 per condition. Statistical significance was assessed using a one-way ANOVA comparing to control. * p <0.05, ** p<0.01, *** p< 0.001.

202
5.3.4 The effect of other non-cellular features of the phaeochromocytoma
microenvironment on primary cilia
Having demonstrated that hypoxia and catecholamines, specific features of the
phaeochromocytoma microenvironment, influenced primary cilia structure in both human tumours
and the rat PC12 phaeochromocytoma-derived cell line, we postulated that other chemical features
of the tumour microenvironment might also do so.
5.3.4.1 Somatostatin analogues increase PC12 cell primary cilia incidence and length
Somatostatin receptors are expressed in both normal adrenal medulla (Kimura et al. 2001; Reubi et
al. 2001; Unger et al. 2012) and phaeochromocytomas (Kubota et al. 1994; Reubi et al. 2000;
Pasquali et al. 2008; Unger et al. 2008; Ziegler et al. 2009; Elston et al. 2015). The relative expression
of receptor subtype appears to be highly variable between series and the methodology employed,
with one large study of 180 tumours reporting increased SSTR3 expression in SDH deficient PPGL
(Elston et al. 2015). SSTR3 alone of all the SSTRs is known to have a ciliary localisation in a variety of
tissues including brain (Händel et al. 1999; Berbari et al. 2008a), pituitary (Iwanaga et al. 2011b),
pancreatic islet cells (Iwanaga et al. 2011b) and kidney (O’Connor et al. 2013). Ciliary localisation of
SSTR3 is dependent on a consensus sequence within its third intracellular loop (Berbari et al. 2008b)
and requires a variety of ciliary proteins including Bbs2 and 4 (Berbari et al. 2008a), tubby (Sun et al.
2012) and Arl6 (Jin et al. 2010). Mutations in the genes encoding these proteins result in lack of
ciliary localisation of SSTR3.
We thus sought to test whether treatment of PC12 cells, which express SSTRs (Traina et al. 1998),
with somatostatin analogues led to changes in primary cilia. These drugs and their derivatives have
multi-faceted clinical uses in PPGL, predominantly as diagnostic (Taïeb et al. 2012) and therapeutic
(Kong et al. 2017) radiolabelled peptides, but also on occasion as systemic therapy (Koriyama et al.
2000; Tonyukuk et al. 2003; van Hulsteijn et al. 2013; Elshafie et al. 2014). PC12 cells were exposed
to increasing concentrations of octreotide or pasireotide in serum-free media for 24 hours prior to
fixation and immunolabelling to detect primary cilia (Figure 5.27A).
Treatment with octreotide did not significantly alter cilia incidence, although there was a trend
towards an increase (Figure 5.27B; 51.1% + 7.7 compared to 57.8% + 7.2 at 1μM, p = 0.25). Cilia
length was increased in cells exposed to octreotide at concentrations of 100nM and above (Figure
5.27C; 1.99μm + 0.51 compared to 2.30μm + 0.67 at 100nM, p = 0.0054).

203
Pasireotide also resulted in an increase in PC12 ciliary length at all concentrations tested (Figure
5.27C; 1.99μm + 0.51 compared to 2.38μm + 0.62 at 100nM, p=5.8x10⁻⁵). In addition, ciliary
incidence was increased from concentrations of 100nM and above (Figure 5.27B; 51.1% + 7.7
compared to 63.5% + 11.2 at 100nM, p = 0.0002).
Thus, somatostatin receptor stimulation by the analogues octreotide and pasireotide results in
increases in ciliary incidence (with pasireotide only; Figure 5.27A) and length (Figure 5.27B). The
observed differences in effect may relate to pasireotide’s greater affinity for SSTR3 and 5 (Lesche et
al. 2009) and are discussed further later in this chapter.

204
Figure 5.27: Somatostatin analogues increase PC12 cilia incidence and length
(A) Confocal images of PC12 cells exposed to the somatostatin analogues octreotide or pasireotide at the concentrations indicated (or vehicle only control) for 24 hours. Cells were immunolabelled with anti-acetylated α-tubulin (red) and anti-Arl13b (green) for detection of primary cilia. Nuclei were stained with DAPI (blue). Cilia are indicated by arrows, or arrowheads where they are also shown zoomed in the insets. Scale bars = 10 μm.
Quantification of primary cilia incidence (B) and length (C) following treatment as per (A). Error bars indicate + SEM, boxes 25th, 50th and 75th centiles and whiskers the 10th and 90th centiles. Number of cells scored for incidence: 1344 + 137 per condition. Number of cilia measured for length: 111 + 10 per condition. Statistical significance was assessed using a one-way ANOVA comparing to control. Ns not significant, * p< 0.05, ** p<0.01, *** p< 0.001. There was no significant difference between octreotide and pasireotide at each concentration tested.
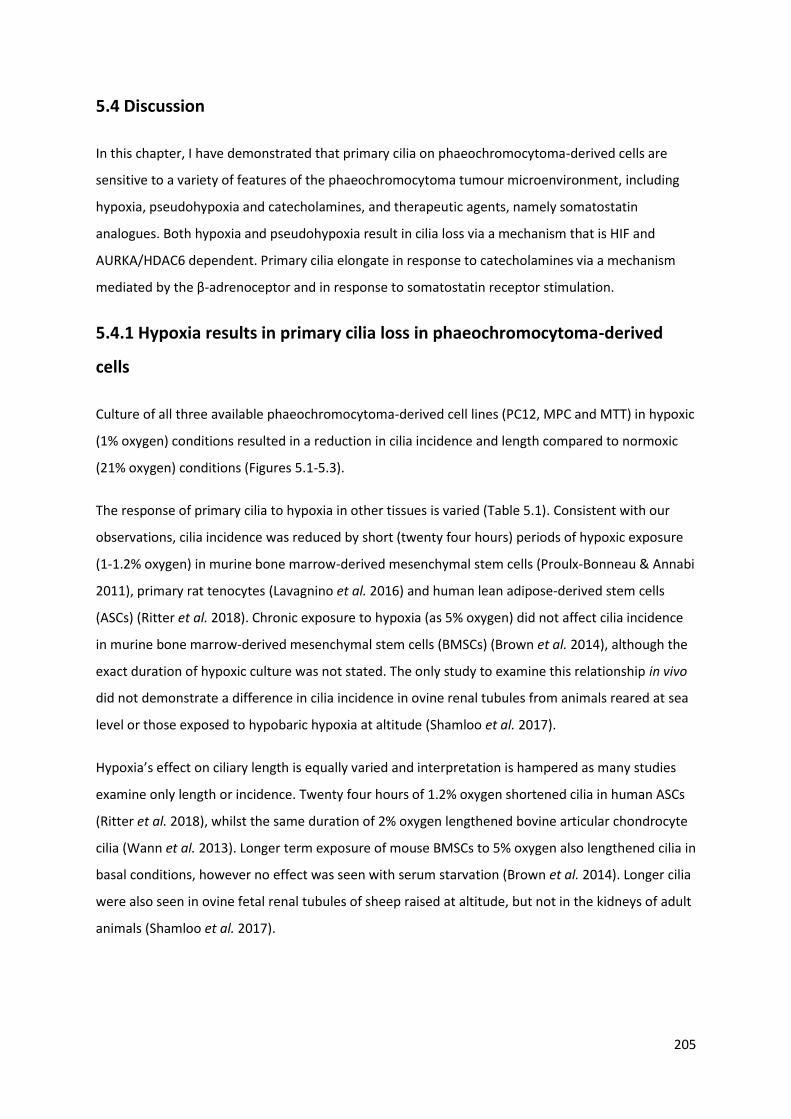
205
5.4 Discussion
In this chapter, I have demonstrated that primary cilia on phaeochromocytoma-derived cells are
sensitive to a variety of features of the phaeochromocytoma tumour microenvironment, including
hypoxia, pseudohypoxia and catecholamines, and therapeutic agents, namely somatostatin
analogues. Both hypoxia and pseudohypoxia result in cilia loss via a mechanism that is HIF and
AURKA/HDAC6 dependent. Primary cilia elongate in response to catecholamines via a mechanism
mediated by the β-adrenoceptor and in response to somatostatin receptor stimulation.
5.4.1 Hypoxia results in primary cilia loss in phaeochromocytoma-derived
cells
Culture of all three available phaeochromocytoma-derived cell lines (PC12, MPC and MTT) in hypoxic
(1% oxygen) conditions resulted in a reduction in cilia incidence and length compared to normoxic
(21% oxygen) conditions (Figures 5.1-5.3).
The response of primary cilia to hypoxia in other tissues is varied (Table 5.1). Consistent with our
observations, cilia incidence was reduced by short (twenty four hours) periods of hypoxic exposure
(1-1.2% oxygen) in murine bone marrow-derived mesenchymal stem cells (Proulx-Bonneau & Annabi
2011), primary rat tenocytes (Lavagnino et al. 2016) and human lean adipose-derived stem cells
(ASCs) (Ritter et al. 2018). Chronic exposure to hypoxia (as 5% oxygen) did not affect cilia incidence
in murine bone marrow-derived mesenchymal stem cells (BMSCs) (Brown et al. 2014), although the
exact duration of hypoxic culture was not stated. The only study to examine this relationship in vivo
did not demonstrate a difference in cilia incidence in ovine renal tubules from animals reared at sea
level or those exposed to hypobaric hypoxia at altitude (Shamloo et al. 2017).
Hypoxia’s effect on ciliary length is equally varied and interpretation is hampered as many studies
examine only length or incidence. Twenty four hours of 1.2% oxygen shortened cilia in human ASCs
(Ritter et al. 2018), whilst the same duration of 2% oxygen lengthened bovine articular chondrocyte
cilia (Wann et al. 2013). Longer term exposure of mouse BMSCs to 5% oxygen also lengthened cilia in
basal conditions, however no effect was seen with serum starvation (Brown et al. 2014). Longer cilia
were also seen in ovine fetal renal tubules of sheep raised at altitude, but not in the kidneys of adult
animals (Shamloo et al. 2017).
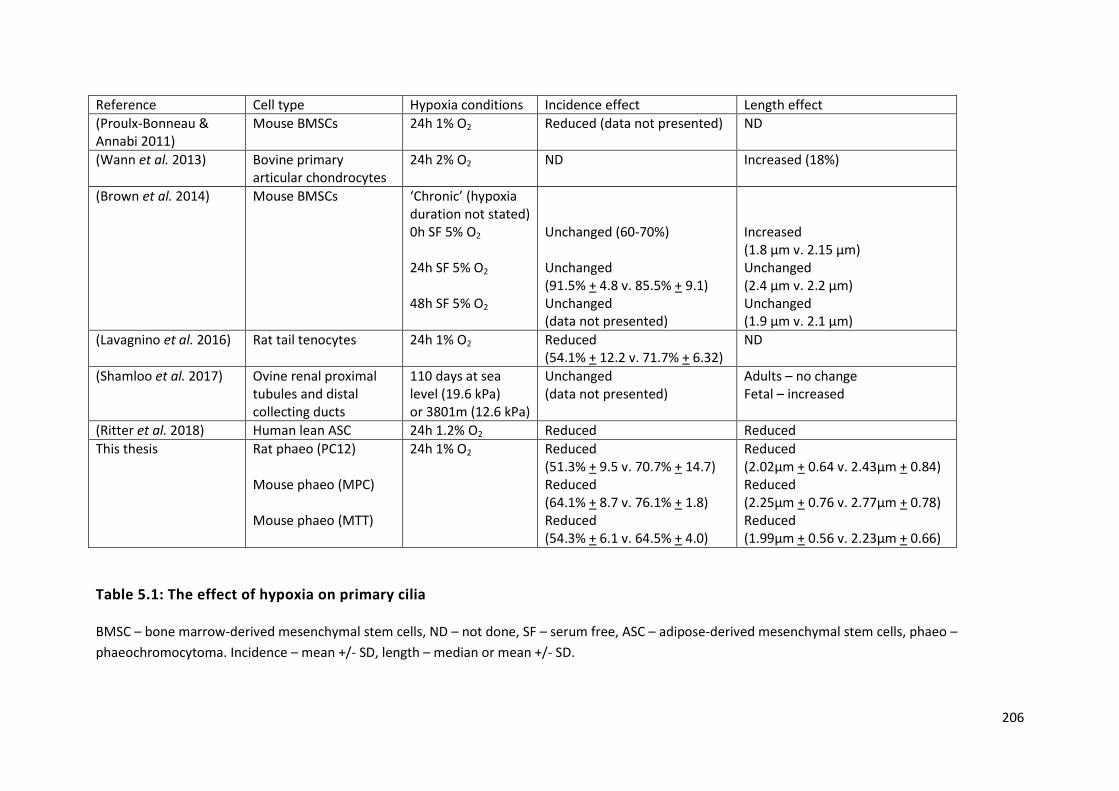
206
Reference Cell type Hypoxia conditions Incidence effect Length effect
(Proulx-Bonneau & Annabi 2011)
Mouse BMSCs 24h 1% O2 Reduced (data not presented) ND
(Wann et al. 2013) Bovine primary articular chondrocytes
24h 2% O2 ND Increased (18%)
(Brown et al. 2014) Mouse BMSCs ‘Chronic’ (hypoxia duration not stated) 0h SF 5% O2 24h SF 5% O2
48h SF 5% O2
Unchanged (60-70%) Unchanged (91.5% + 4.8 v. 85.5% + 9.1) Unchanged (data not presented)
Increased (1.8 μm v. 2.15 μm) Unchanged (2.4 μm v. 2.2 μm) Unchanged (1.9 μm v. 2.1 μm)
(Lavagnino et al. 2016) Rat tail tenocytes 24h 1% O2 Reduced (54.1% + 12.2 v. 71.7% + 6.32)
ND
(Shamloo et al. 2017) Ovine renal proximal tubules and distal collecting ducts
110 days at sea level (19.6 kPa) or 3801m (12.6 kPa)
Unchanged (data not presented)
Adults – no change Fetal – increased
(Ritter et al. 2018) Human lean ASC 24h 1.2% O2 Reduced Reduced
This thesis Rat phaeo (PC12) Mouse phaeo (MPC) Mouse phaeo (MTT)
24h 1% O2 Reduced (51.3% + 9.5 v. 70.7% + 14.7) Reduced (64.1% + 8.7 v. 76.1% + 1.8) Reduced (54.3% + 6.1 v. 64.5% + 4.0)
Reduced (2.02μm + 0.64 v. 2.43μm + 0.84) Reduced (2.25μm + 0.76 v. 2.77μm + 0.78) Reduced (1.99μm + 0.56 v. 2.23μm + 0.66)
Table 5.1: The effect of hypoxia on primary cilia
BMSC – bone marrow-derived mesenchymal stem cells, ND – not done, SF – serum free, ASC – adipose-derived mesenchymal stem cells, phaeo –
phaeochromocytoma. Incidence – mean +/- SD, length – median or mean +/- SD.

207
Whether these observed differences are tissue-specific or related to the different experimental
conditions utilised (specifically duration and extent of hypoxia) is uncertain and these factors have
not been systematically evaluated.
A key concept to consider in the interpretation of these findings is the definition of ‘normoxia’ and
how experimental conditions relate to the physiological situation they are trying to evaluate.
Atmospheric oxygen at sea level (160 mmHg, 21.1%) might be considered ‘normoxia’ and this is the
situation (allowing for altitude) under which the vast majority of laboratory cell biology studies are
performed. This oxygen tension, however, is actually supraphysiological when compared to tissue
level oxygenation, which ranges between 30 and 70 mmHg (3.8-9.5%) (Bylund-Fellenius et al. 1981;
Müller et al. 1998). At a cellular level, normal oxygen tension is lower still, in the range 9.9-19 mmHg
(1.3-2.5%) (Gleadle & Ratcliffe 2001). Thus, normoxia in our experiments (as in all others) is actually
hyperoxia and a lower oxygen tension would be a more physiologically matched control. It should be
noted that some of the ‘hypoxic’ oxygen tensions used previously could be considered either tissue-
level normoxic (Wann et al. 2013) or hyperoxic (Brown et al. 2014).
Having shown that the effect of hypoxia on primary cilia is conserved across PC12, MPC and MTT cell
lines, this supports the finding that hypoxia results in cilia loss in the context of
phaeochromocytomas. It must be considered, however, that these cell lines contain mutations in
phaeochromocytoma-predisposing genes. PC12 cells harbour a MAX mutation (Hopewell & Ziff
1995), whilst MPC and MTT are deficient in NF1 (Powers et al. 2000). These are all cluster 2
phaeochromocytoma-predisposing genes, in which hypoxic signalling is not considered to be a
salient feature. There is, however, some evidence that inactivation of NF1 results in increased
expression of HIF1α and its target VEGF (Kawachi et al. 2013).
We have demonstrated through prevention of HIF-mediated transcription and via HIF1α knockdown
that the mechanism by which hypoxia induces cilia loss in phaeochromocytoma cells is HIF1
dependent (Figure 5.5).
This mechanism is the same as that identified in BMSCs in which exposure to 1% oxygen reduced
cilia incidence. Consistent with our findings, HIF1α knockdown prevented hypoxia-induced cilia
changes and expression of a constitutively active HIF1α phenocopied the ciliary response to hypoxia
(Proulx-Bonneau & Annabi 2011). One study suggests that it is HIF2α and not HIF1α that is
responsible for hypoxia-induced cilia changes (Wann et al. 2013). The evidence for this is indirect,
however, relying on the effect on cilia and HIF2α caused by IL1b treatment. In addition, they argue
the fact this effect is prevented by echinomycin (which blocks HIF DNA binding akin to FM19G11)
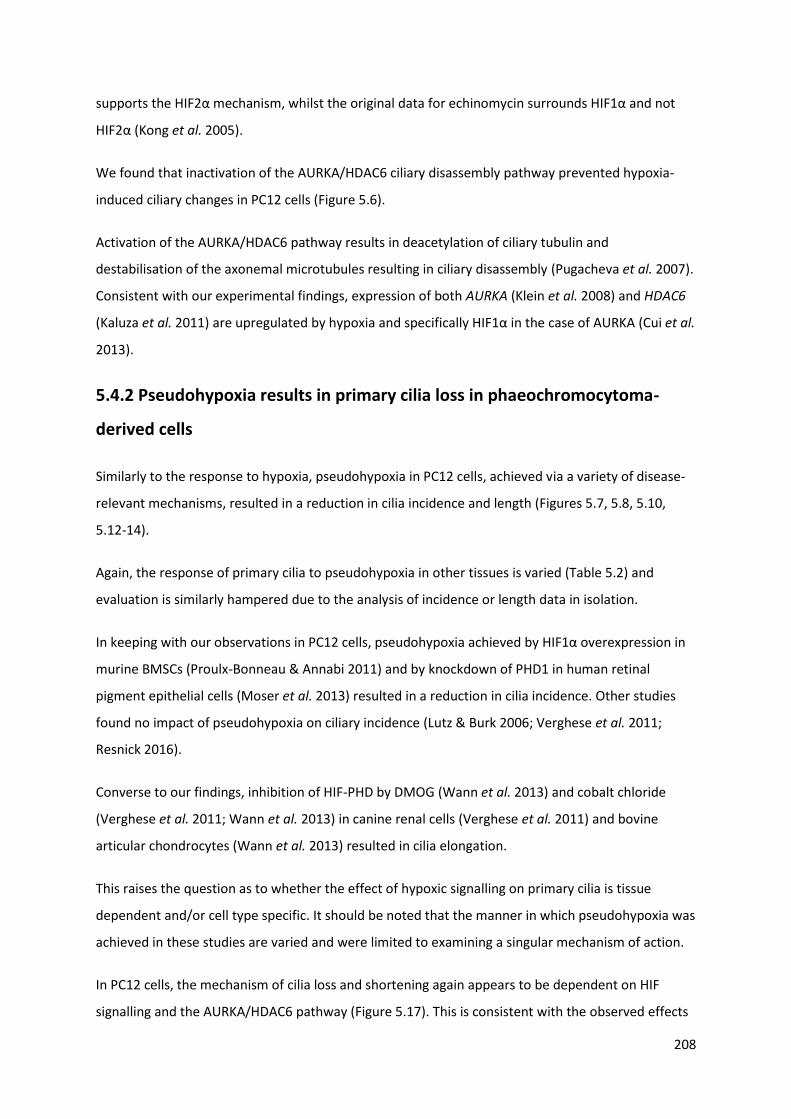
208
supports the HIF2α mechanism, whilst the original data for echinomycin surrounds HIF1α and not
HIF2α (Kong et al. 2005).
We found that inactivation of the AURKA/HDAC6 ciliary disassembly pathway prevented hypoxia-
induced ciliary changes in PC12 cells (Figure 5.6).
Activation of the AURKA/HDAC6 pathway results in deacetylation of ciliary tubulin and
destabilisation of the axonemal microtubules resulting in ciliary disassembly (Pugacheva et al. 2007).
Consistent with our experimental findings, expression of both AURKA (Klein et al. 2008) and HDAC6
(Kaluza et al. 2011) are upregulated by hypoxia and specifically HIF1α in the case of AURKA (Cui et al.
2013).
5.4.2 Pseudohypoxia results in primary cilia loss in phaeochromocytoma-
derived cells
Similarly to the response to hypoxia, pseudohypoxia in PC12 cells, achieved via a variety of disease-
relevant mechanisms, resulted in a reduction in cilia incidence and length (Figures 5.7, 5.8, 5.10,
5.12-14).
Again, the response of primary cilia to pseudohypoxia in other tissues is varied (Table 5.2) and
evaluation is similarly hampered due to the analysis of incidence or length data in isolation.
In keeping with our observations in PC12 cells, pseudohypoxia achieved by HIF1α overexpression in
murine BMSCs (Proulx-Bonneau & Annabi 2011) and by knockdown of PHD1 in human retinal
pigment epithelial cells (Moser et al. 2013) resulted in a reduction in cilia incidence. Other studies
found no impact of pseudohypoxia on ciliary incidence (Lutz & Burk 2006; Verghese et al. 2011;
Resnick 2016).
Converse to our findings, inhibition of HIF-PHD by DMOG (Wann et al. 2013) and cobalt chloride
(Verghese et al. 2011; Wann et al. 2013) in canine renal cells (Verghese et al. 2011) and bovine
articular chondrocytes (Wann et al. 2013) resulted in cilia elongation.
This raises the question as to whether the effect of hypoxic signalling on primary cilia is tissue
dependent and/or cell type specific. It should be noted that the manner in which pseudohypoxia was
achieved in these studies are varied and were limited to examining a singular mechanism of action.
In PC12 cells, the mechanism of cilia loss and shortening again appears to be dependent on HIF
signalling and the AURKA/HDAC6 pathway (Figure 5.17). This is consistent with the observed effects

209
of HIF1α overexpression (Moser et al. 2013), and that cobalt chloride-mediated inhibition of HIF-PHD
(Romain et al. 2014) and VHL inactivation (Xu et al. 2010) induce AURKA expression. In this
experimental paradigm, therefore, this mechanism appears to explain the observed ciliary effect of
pseudohypoxia.
However, alternative mechanisms may also be involved, particularly in the context of von Hippel-
Lindau disease, which unlike the other cluster 1 predisposition genes, has an established functional
role in primary cilia.
pVHL appears to have a crucial role in ciliary maintenance in the kidney. Primary cilia loss is a feature
of VHL-deficient renal cysts (Esteban et al. 2006), ccRCC (Schraml et al. 2009; Basten et al. 2013),
renal cancer cell lines (Esteban et al. 2006; Lutz & Burk 2006; Schermer et al. 2006; Lolkema et al.
2008) and wildtype murine renal cells in which Vhl has been knocked down (Schermer et al. 2006).
The effect of VHL loss in other cell types, notably RPE cells, is less clear with conflicting reports of
reduced ciliary formation (Dere et al. 2015) or enhanced ciliary disassembly (Frew et al. 2008). The
responsible mechanisms appear to be multi-factorial. pVHL loss results in increased expression of
HDAC6 and AURKA by both HIF-dependent (Xu et al. 2010) and HIF-independent (Dere et al. 2015)
mechanisms. In addition, pVHL itself localises to primary cilia (Schermer et al. 2006; Lolkema et al.
2008) where it binds to and stabilises microtubules (Okuda et al. 1999; Hergovich et al. 2003, 2006;
Schermer et al. 2006; Lolkema et al. 2007) via a microtubule-binding domain that is distinct from the
HIF-binding domain. Through AURKA/HDAC6 inhibition, our data supports pseudohypoxia causing
accelerated ciliary disassembly in phaeochromocytomas, although we also demonstrate that hypoxia
reduces ciliary localisation of pVHL, potentially priming it for disassembly (Figure 5.15).
These experiments are the first to examine the effects on primary cilia of oncometabolite
accumulation due to loss of function of SDH. In addition to causing pseudohypoxia, loss of function
of SDH potentially results in superoxide generation due to decoupling of the ETC. Others have
suggested that superoxide generation can alter primary cilia length, although the effect is
inconsistent between studies. Ischaemia-reperfusion injury shortens primary cilia in both murine
kidney (Kim et al. 2013) and liver (Han et al. 2017), whilst a unilateral nephrectomy increases
superoxide formation in the remaining kidney and increases cilia length (Han et al. 2016). We did not
find that inhibition of other ETC complexes altered primary cilia incidence or length (Figure 5.11),
suggesting this was not the responsible mechanism in PC12 cells.
We did not directly compare the relative effects on cilia of the different mechanisms of causing
pseudohypoxia. This has the potential to be informative mechanistically and provide disease insight.

210
For example, cluster 1 tumours behave differently depending on the affected gene with SDHB and
FH mutated tumours having an increased risk of malignancy compared to VHL mutated tumours.
Part of this difference is explained by oncometabolite inhibition of additional α-ketoglutarate
dependent enzymes including histone demethylases (Smith et al. 2007) with resultant epigenetic
modification (Letouzé et al. 2013), but this does not satisfactorily explain the differences within the
genes of the SDHx complex.
Collectively, these findings suggest that the reduction in cilia frequency and length in
phaeochromocytomas is likely to be mediated by both HIF signalling and the AURKA/HDAC6 cilia
resorption pathway, although involvement of other regulators of cilia dynamics is also possible.
Hypoxia is not only a driver of PPGL formation (Rodriguez-Cuevas et al. 1986; Opotowsky et al.
2015), but is also a salient feature of many solid tumours, and may therefore modulate cilia
presence in cancers more generally.
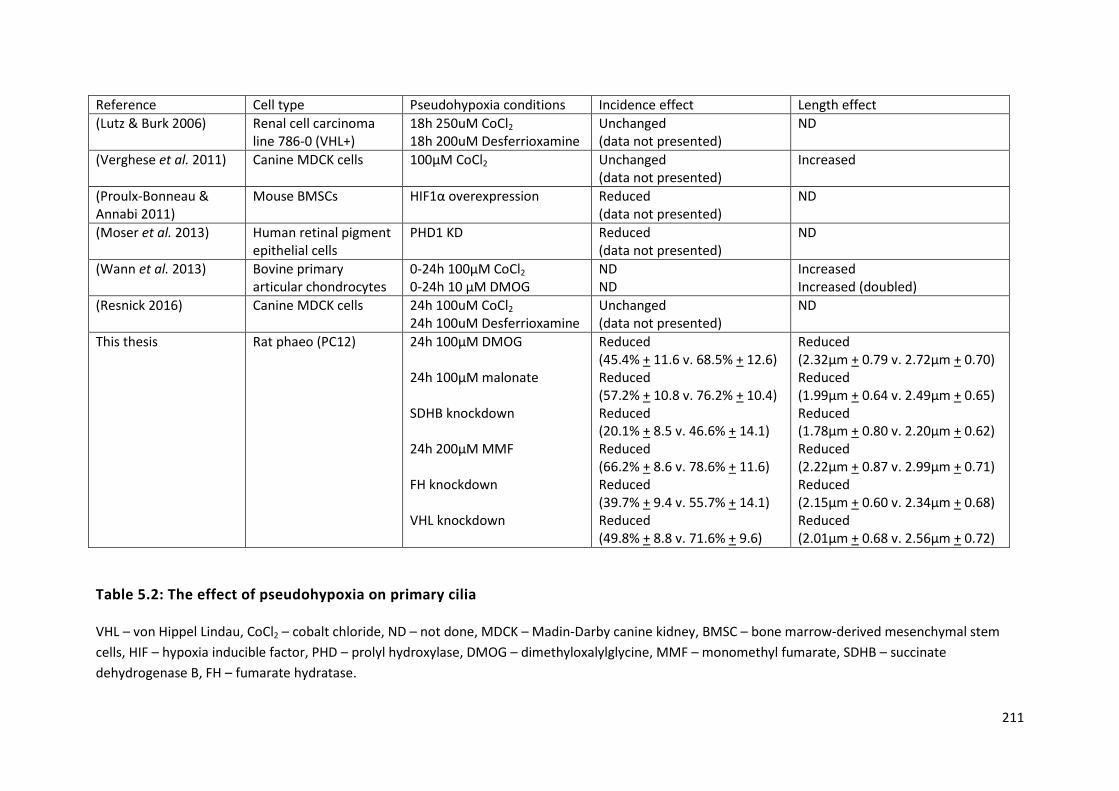
211
Reference Cell type Pseudohypoxia conditions Incidence effect Length effect
(Lutz & Burk 2006) Renal cell carcinoma line 786-0 (VHL+)
18h 250uM CoCl2 18h 200uM Desferrioxamine
Unchanged (data not presented)
ND
(Verghese et al. 2011) Canine MDCK cells 100μM CoCl2 Unchanged (data not presented)
Increased
(Proulx-Bonneau & Annabi 2011)
Mouse BMSCs HIF1α overexpression Reduced (data not presented)
ND
(Moser et al. 2013) Human retinal pigment epithelial cells
PHD1 KD Reduced (data not presented)
ND
(Wann et al. 2013) Bovine primary articular chondrocytes
0-24h 100μM CoCl2 0-24h 10 μM DMOG
ND ND
Increased Increased (doubled)
(Resnick 2016) Canine MDCK cells 24h 100uM CoCl2 24h 100uM Desferrioxamine
Unchanged (data not presented)
ND
This thesis Rat phaeo (PC12)
24h 100μM DMOG 24h 100μM malonate SDHB knockdown 24h 200μM MMF FH knockdown VHL knockdown
Reduced (45.4% + 11.6 v. 68.5% + 12.6) Reduced (57.2% + 10.8 v. 76.2% + 10.4) Reduced (20.1% + 8.5 v. 46.6% + 14.1) Reduced (66.2% + 8.6 v. 78.6% + 11.6) Reduced (39.7% + 9.4 v. 55.7% + 14.1) Reduced (49.8% + 8.8 v. 71.6% + 9.6)
Reduced (2.32μm + 0.79 v. 2.72μm + 0.70) Reduced (1.99μm + 0.64 v. 2.49μm + 0.65) Reduced (1.78μm + 0.80 v. 2.20μm + 0.62) Reduced (2.22μm + 0.87 v. 2.99μm + 0.71) Reduced (2.15μm + 0.60 v. 2.34μm + 0.68) Reduced (2.01μm + 0.68 v. 2.56μm + 0.72)
Table 5.2: The effect of pseudohypoxia on primary cilia
VHL – von Hippel Lindau, CoCl2 – cobalt chloride, ND – not done, MDCK – Madin-Darby canine kidney, BMSC – bone marrow-derived mesenchymal stem
cells, HIF – hypoxia inducible factor, PHD – prolyl hydroxylase, DMOG – dimethyloxalylglycine, MMF – monomethyl fumarate, SDHB – succinate
dehydrogenase B, FH – fumarate hydratase.

212
5.4.3 Catecholamines modulate phaeochromocytoma primary cilia
In patients with phaeochromocytomas, circulating metanephrine appeared to influence primary cilia
structure. A positive relationship between maximal metanephrine concentration and primary cilia
length was observed (Figure 5.18). When any elevation in metanephrine concentration was
considered, tumoural primary cilia incidence and length was increased in patients with elevated
circulating metanephrines compared to those without (Figure 5.19). Normetanephrine and 3-
methoxytyramine did not appear to alter phaeochromocytoma primary cilia incidence or length in
vivo. In PC12 cells, adrenaline similarly increased primary cilia incidence and length by a mechanism
that appeared to be dependent on the β-adrenoreceptor (Figures 5.21 & 5.22).
Although adrenaline is known to be stimulatory to motile cilia in bronchial (Weiterer et al. 2015) and
tracheal (Bailey et al. 2014) epithelium, there is a paucity of experimental data with respect to
primary cilia. Consistent with our findings, a single high content screening analysis of a human
pancreatic ductal cancer cell line (CFPAC-1) identified that 10μM adrenaline, but not noradrenaline,
increased primary cilia incidence (Khan et al. 2016). Other structural studies have identified that the
β2-adrenoeceptor is localised to primary cilia in murine neurons (Yao et al. 2016), whilst it is
excluded from primary cilia in murine inner medullary collecting duct cells (Marley et al. 2013).
Relative receptor selectivity is one possible explanation for the observed difference between the
effects in the tumour samples and is supportive of a β2-mediated effect (Insel 1989; Wallukat 2002).
Numerous other variables might also play a role, including the duration of disease and whether
catecholamine release is sustained or episodic. A key confounder is the fact that cluster 1 tumours
have a predominantly noradrenergic phenotype (Srirangalingam et al. 2008, 2009) and therefore any
effect seen with noradrenaline may be mitigated by the negative regulatory effect of hypoxic
signalling in these tumours.
A ciliary response to as little as 1nM adrenaline was observed in PC12 cells and this concentration is
dwarfed by both that in adrenal venous effluent in patients without phaeochromocytomas (Table
6.2) and in phaeochromocytoma homogenate (Eisenhofer et al. 1998). This effect is thus seen within
the physiological concentration range. It is important to consider, however, that PC12 cells are able
to synthesise and secrete noradrenaline and dopamine, but not adrenaline (Greene & Tischler 1976).
Under basal conditions, the mean concentration of noradrenaline in media that PC12 cells have been
grown in is 6.1 nmol/mg (Greene & Tischler 1976) and this additional tumoural production may
explain the more varied response observed with noradrenaline.

213
Antagonism of the beta receptor by propranolol prevents adrenaline-induced changes in PC12
primary cilia (Figure 5.22), whilst stimulation of the β2 receptor by salbutamol phenocopies the
adrenaline response (Figure 5.23). Together these results suggest that the ciliary response to
adrenaline in PC12 cells is likely to be mediated by the β2 receptor. Stimulation results in activation
of AC, production of cAMP and activation of PKA. This pathway is an established promoter of
ciliogenesis due to increasing anterograde IFT (Besschetnova et al. 2010) with a number of its
components localising to primary cilia (Händel et al. 1999; Bishop et al. 2007; Ou et al. 2009).
Dopamine increased cilia incidence and length in PC12 cells. Unlike adrenaline and noradrenaline, it
exerts its action via the dopamine receptor and has an established role in primary cilia dynamics.
There are five dopamine receptor subtypes, three of which display ciliary localisation in a range of
tissues: 1 (Domire et al. 2011; Avasthi et al. 2012; Marley & von Zastrow 2012; Marley et al. 2013;
Omori et al. 2015), 2 (Iwanaga et al. 2011a; Marley & von Zastrow 2012; Omori et al. 2015) and 5
(Abdul-Majeed & Nauli 2011; Marley & von Zastrow 2012; Jin et al. 2014; Upadhyay et al. 2014).
Activation of dopamine receptors appears to convey differential ciliary responsiveness in different
tissue types mediated by different receptor subtypes. In murine endothelial cells (Abdul-Majeed &
Nauli 2011; Kathem et al. 2014) and porcine renal cells (Upadhyay et al. 2014), dopamine increases
cilia length via action on the D1-like receptor subfamily (which includes D1 and D5) (Abdul-Majeed &
Nauli 2011; Avasthi & Marshall 2012; Kathem et al. 2014; Upadhyay et al. 2014). In contrast,
dopamine appears to shorten primary cilia in rodent striatal neurons via action on the D2 receptor
(Miyoshi et al. 2014). In PC12 cells, metoclopramide (a D2 receptor antagonist) appeared to reduce
and shorten primary cilia, presumably by preventing dopamine’s autocrine action. Although this
response is in keeping with previous reports, it is somewhat unexpected as it is the reverse of that
seen in other tissues of neural origin. Furthermore, the D2 receptor is coupled to Gαi and activation
results in a reduction in cAMP and PKA activity, which would not be expected to increase cilia length.
The observed mechanism requires further delineation studies and it should be borne in mind that
metoclopramide also has 5-HT4 activity (Guillemot et al. 2009), which can increase ciliary length
(Khan et al. 2016).
These data provide preliminary evidence for modulation of primary cilia by circulating
catecholamines within the context of phaeochromocytomas. Further studies will define the
underlying mechanism and whether this effect is seen in a broader range of tissues.

214
5.4.4 Somatostatin analogues result in elongation of primary cilia
Somatostatin is a pan-inhibitory peptide hormone that acts predominantly on the pituitary gland
and gastrointestinal system via five different GPCRs (SSTR1-5). SSTR2 (Kimura et al. 2001; Reubi et al.
2001), SSTR3 and SSTR5 (Unger et al. 2012) are all expressed in human adrenal medulla. SSTRs are
also expressed in phaeochromocytomas, although the relative expression of each receptor subtype
is highly variable between cohorts (Kubota et al. 1994; Reubi et al. 2000; Pasquali et al. 2008; Unger
et al. 2008; Ziegler et al. 2009; Elston et al. 2015). Although the physiological role of somatostatin in
the adrenal medulla is not well characterised, SSAs have a well-established role in the diagnosis
(Taïeb et al. 2012) and treatment (Kong et al. 2017) of PPGL and other neuroendocrine tumours
(Rinke et al. 2009; Caplin et al. 2014).
The SSA pasireotide increased ciliary incidence and length in PC12 cells, which express SSTRs (Traina
et al. 1998), whilst the SSA octreotide increased cilia length only, and at higher concentrations
(Figure 5.27). Pasireotide has greater affinity for SSTR3 and SSTR5 than octreotide (Lesche et al. 2009)
and we may therefore postulate that the observed difference might be due to these receptor
subtypes. Interestingly SSTR3 is the only SSTR known to localise to primary cilia (Händel et al. 1999;
Berbari et al. 2008a; Iwanaga et al. 2011b; O’Connor et al. 2013). There is little direct experimental
evidence regarding the effect of SSAs on primary cilia. A single study found that pasireotide
increased primary hepatocyte cilia length and reduced cyst formation in a rat model of PKD and that
this effect was augmented with concurrent HDAC6 inhibition (Lorenzo Pisarello et al. 2018). SSAs
retard progression of cystic liver disease in the ciliopathy ADPKD (van Keimpema et al. 2009) in
humans, providing further indirect clinical evidence.
5.5 Summary
In this chapter I have demonstrated that phaeochromocytoma primary cilia are influenced both by
internal (for example, pseudohypoxia in the case of cluster 1 tumours) and external (components of
the tumour microenvironment, including hypoxia and catecholamines) factors. In the case of hypoxia
and pseudohypoxia, cilia loss occurs in a HIF and AURKA/HDAC6 dependent manner and can be
prevented by inhibition of these pathways. This raises the possibility that primary cilia play a
complex and multi-factorial interactive role with the tumour microenvironment and are potential
modifiable targets.
215
CHAPTER 6
Adrenal venous catecholamine measurement as an adjunct in the diagnosis
of phaeochromocytoma, with particular reference to syndromic disease
The work performed in this chapter was conducted in collaboration with others as part of routine
clinical care. All analysis and interpretation are my own work.
At St Bartholomew’s Hospital, London, UK, Dr Candy Sze was responsible for maintenance of the
Conn’s database, Dr Matthew Matson performed the AVS, and clinical care of the patients was the
responsibility of Dr Scott Akker, Prof Maralyn Druce and Prof William Drake.
Data from Radboud University Medical Center, Nijmegan, The Netherlands, was provided by Prof
Jacques Lender and Prof Graeme Eisenhofer, Technische Universität Dresden, Dresden, Germany.
Work in this chapter has been published in the following article, which is included in the appendix of
this thesis.
Adrenal Vein Catecholamine Levels and Ratios: Reference Intervals Derived from Patients with
Primary Aldosteronism. Sze CWC*, O’Toole SM*, Tirador RK, Akker SA, Matson M, Perry L, Druce MR,
Dekkers T, Deinum J, Lenders JWM, Eisenhofer G, Drake WM. Hormone and Metabolic Research
2017; 49(6): 418-423.
* denotes equal contribution
216
6.1 Introduction
In this chapter, we move from the pathophysiology of phaeochromocytoma development to its
diagnosis. The largest barrier to phaeochromocytoma detection is its lack of consideration in the
differential. Once suspected, the biochemical diagnosis is confirmed by demonstration of elevated
free metanephrines in plasma or fractionated metanephrines in urine (Lenders et al. 2014). These
tests have very high sensitivities and specificities consistently exceeding 90% (Raber et al. 2000;
Lenders et al. 2002, 2014) such that dynamic testing, for example with the clonidine suppression
test, has a very limited clinical role (Lenders et al. 2014).
Once the biochemical diagnosis has been made and metanephrine excess has been confirmed, the
source must be identified and localised by cross-sectional imaging techniques e.g. CT or MRI.
Functional imaging modalities e.g. 123I-MIBG or 18F-FDG may be used if further confirmation is
required and are of particular use in the setting of metastatic disease, when PRRT is a therapeutic
option.
Taking this approach, uncertainty regarding PPGL localisation is unusual; particularly in patients with
sporadic and symptomatic disease. The situation is different, however, in patients with a genetic
predisposition to PPGL development e.g. VHL and SDHx. Such patients are often asymptomatic and
enrolled within screening programmes in which biochemical and radiological surveillance runs
concurrently and aims to diagnose small, pre-symptomatic PPGL when the risk of disseminated
disease is lower (Maher et al. 2011; Jasperson et al. 2014). On occasion, this can lead to the
detection of small radiological abnormalities which can be too small to characterise fully by cross-
sectional modalities and are below the limit of detection of nuclear medicine techniques. Bilateral
radiological abnormalities are also a consideration in these patient groups, particularly with
advancing age when incidentaloma incidence increases. This presents difficulties in decision-making
in a group of patients who are often at risk of developing other tumours requiring multiple
abdominal interventions. Correct identification of one or other adrenal gland as the source of
catecholamine excess would be treated by a unilateral adrenalectomy (thereby avoiding, for a time
at least, the need for adrenal replacement therapy) whereas a secure diagnosis of bilateral
phaeochromocytoma could facilitate surgery at a single sitting.
Thus, there is a potential role for a technique that could assist with anatomical localisation in cases
which are unclear following a conventional imaging approach. One such technique is AVS, which
although now most commonly used for the lateralisation of primary aldosteronism (PA), was
originally developed in the pre-CT era for the diagnosis and localisation of catecholamine-secreting

217
tumours (Von Euler et al. 1955). In this procedure (Figure 6.1), venous access is established via the
common femoral vein and an intra-venous catheter is advanced under fluoroscopic guidance. Blood
samples are obtained sequentially from both adrenal veins and the infra-renal IVC as a peripheral
sample. Location of the catheter tip is confirmed in real time with fluoroscopy and successful
cannulation is subsequently confirmed by the demonstration of a significant gradient in cortisol
concentration between the adrenal vein and the periphery (Funder et al. 2016). The magnitude of
the requisite gradient depends on whether AVS is carried out with (5:1) or without (2:1) ACTH
stimulation of adrenal cortisol release (Funder et al. 2016).
Historically, caval catheters and AVS have been used for the diagnosis (Von Euler et al. 1955; Jones
et al. 1979; Palublnskas et al. 1980; Allison et al. 1983) and lateralisation of adrenal
phaeochromocytomas (Davies et al. 1979; Nobin et al. 1982; Chew et al. 1994; Srirangalingam et al.
2010) as well as the localisation of abdominal (Crout & Sjoerdsma 1960; Fleisher et al. 1964; Grim et
al. 1967; Moss et al. 1980; Chew et al. 1994; Pacak et al. 2001; Srirangalingam et al. 2010), bladder
(Miller et al. 1983) and head and neck paragangliomas (Crout & Sjoerdsma 1960; Cockcroft et al.
1987). Interpretation of these venous sampling studies depended on either the use of non-
standardised gradient cut-offs, comparison with the contralateral adrenal or assumptions
surrounding the noradrenaline: adrenaline ratio. Adrenaline is the predominantly secreted adrenal
catecholamine (Wurtman & Axelrod 1965) and an excess of noradrenaline, expressed as a
noradrenaline: adrenaline ratio exceeding one, has been proposed as being pathological (Newbould
et al. 1991), although there are limited normative data to support this. Uncertainty remains in the
field (Freel et al. 2010), largely due to the lack of robust reference intervals for catecholamine values
in adrenal venous effluent.

218
Figure 6.1: Schematic diagram of adrenal venous sampling
Venous access is established via the right femoral vein and the catheter advanced through the
common iliac vein and infra-renal inferior vena cava (IVC). Blood samples are taken under gravity
without the application of negative pressure from each adrenal vein (1 and 2) and the infra-renal IVC
as a peripheral sample (3). Adrenal venous anatomy is different on either side; the right adrenal vein
(1) drains directly into the IVC, whilst the left (2) first drains into the left renal vein. This makes the
right adrenal vein technically more difficult to cannulate, whilst samples from the left adrenal vein
are susceptible to dilution from the inferior phrenic vein. In both adrenal veins, there is potential
variation in the distance the catheter tip is from the adrenal gland at the time of sampling (inset; a
and b) which might impact on the magnitude of the measured adrenal hormones. It is for this reason
that cortisol is used as a ‘correction factor’ in the evaluation of primary aldosteronism.

219
6.2 Aims and Objectives
The aim of this chapter was to investigate whether AVS for catecholamines has a potential role in
assisting the localisation of phaeochromocytoma in selected cases.
We hypothesised that the adrenal venous noradrenaline: adrenaline ratio would differ significantly
in patients with phaeochromocytoma compared to those without.
The first objective was to determine normal circulating adrenal vein catecholamine concentrations in
patients without phaeochromocytoma, who had undergone AVS due to PA.
The second objective was to determine circulating adrenal vein catecholamine concentrations in
patients with histologically confirmed phaeochromocytoma.
The third objective was to define a diagnostic cut-off that would differentiate patients with and
without phaeochromocytoma.

220
6.3 Results
6.3.1 Normal adrenal venous catecholamine concentrations in patients with
primary aldosteronism
6.3.1.1 Clinical characterisation of PA cohort
One hundred and seventy-two patients (88 male, 84 female, age 51.5 years + 0.5) underwent AVS
under conditions of ACTH stimulation for the localisation of biochemically confirmed PA at two
international centres (Table 6.1); St Bartholomew’s Hospital, London and the Radboud University
Medical Centre, Nijmegan, The Netherlands. The mean age of patients (p = 0.43) and bilateral
adrenal vein cannulation success (p = 0.15) was similar at both centres. The St Bartholomew’s cohort
had significantly more male patients (59.2% compared to 32.7%, p=0.0014).
All SBH RUMC p value
Patients (n) 172 120 (69.8) 52 (30.2)
AVS (n) 177 125 (70.6) 52 (29.4)
Sex
Male (n) 88 (51.2) 71 (59.2) 17 (32.7) 0.0014
Female (n) 84 (48.9) 49 (40.8) 35 (67.3)
Age (years)
Mean + SEM 51.5 + 0.8 51.1 + 0.9 52.5 + 1.5† 0.43
Range 21 – 76 21-76 24-72†
Bilateral cannulation (%) 130 (72.6) 87 (67.4) 43 (82.7) 0.15
Table 6.1: Clinical characteristics of 172 patients with PA who underwent AVS
Figures in brackets represent percentage figures. SBH = St Bartholomew’s Hospital, RUMC =
Radboud University Medical Center, AVS = adrenal venous sampling, SEM = standard error of the
mean. Statistical significance assessed by the chi-squared test for sex and cannulation success and an
unpaired t-test for age.
† Age at time of AVS unavailable for three patients.
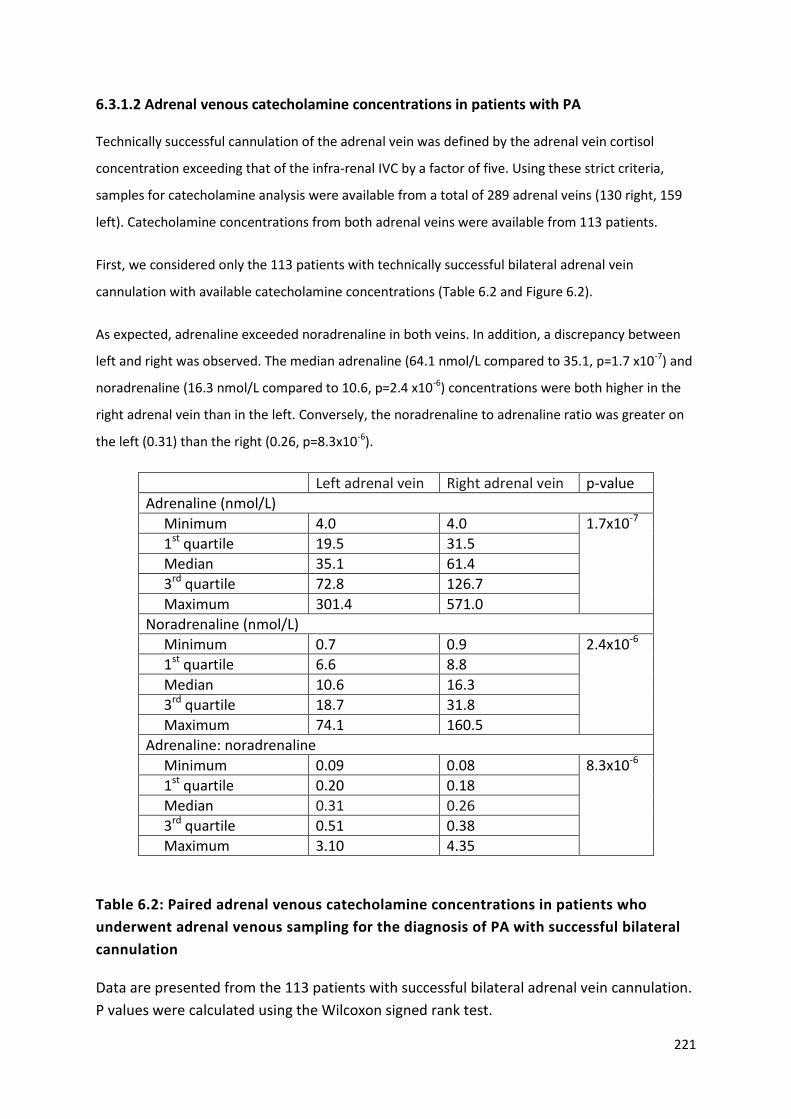
221
6.3.1.2 Adrenal venous catecholamine concentrations in patients with PA
Technically successful cannulation of the adrenal vein was defined by the adrenal vein cortisol
concentration exceeding that of the infra-renal IVC by a factor of five. Using these strict criteria,
samples for catecholamine analysis were available from a total of 289 adrenal veins (130 right, 159
left). Catecholamine concentrations from both adrenal veins were available from 113 patients.
First, we considered only the 113 patients with technically successful bilateral adrenal vein
cannulation with available catecholamine concentrations (Table 6.2 and Figure 6.2).
As expected, adrenaline exceeded noradrenaline in both veins. In addition, a discrepancy between
left and right was observed. The median adrenaline (64.1 nmol/L compared to 35.1, p=1.7 x10⁻⁷) and
noradrenaline (16.3 nmol/L compared to 10.6, p=2.4 x10⁻⁶) concentrations were both higher in the
right adrenal vein than in the left. Conversely, the noradrenaline to adrenaline ratio was greater on
the left (0.31) than the right (0.26, p=8.3x10⁻⁶).
Left adrenal vein Right adrenal vein p-value
Adrenaline (nmol/L)
Minimum 4.0 4.0 1.7x10⁻⁷
1st quartile 19.5 31.5
Median 35.1 61.4
3rd quartile 72.8 126.7
Maximum 301.4 571.0
Noradrenaline (nmol/L)
Minimum 0.7 0.9 2.4x10⁻⁶
1st quartile 6.6 8.8
Median 10.6 16.3
3rd quartile 18.7 31.8
Maximum 74.1 160.5
Adrenaline: noradrenaline
Minimum 0.09 0.08 8.3x10⁻⁶
1st quartile 0.20 0.18
Median 0.31 0.26
3rd quartile 0.51 0.38
Maximum 3.10 4.35
Table 6.2: Paired adrenal venous catecholamine concentrations in patients who
underwent adrenal venous sampling for the diagnosis of PA with successful bilateral
cannulation
Data are presented from the 113 patients with successful bilateral adrenal vein cannulation.
P values were calculated using the Wilcoxon signed rank test.

222
Figure 6.2: Adrenal venous catecholamine concentrations in patients who underwent
adrenal venous sampling for the diagnosis of PA
113 patients with PA had successful bilateral adrenal vein cannulation (defined as an adrenal vein:
peripheral cortisol ratio exceeding 5:1). Adrenal venous adrenaline (A) and noradrenaline (B) were
measured and the noradrenaline: adrenaline ratio (C) was calculated for each adrenal vein. Centre
bar represents mean, error bars standard deviation. Statistical significance was assessed using the
Wilcoxon signed rank test. *** p<0.001.

223
Given the large degree of intra-individual variability in absolute adrenal venous catecholamine
concentrations (up to a factor of 178 on the right and 106 on the left), we considered whether a
‘correction’ factor would reduce this. In the lateralisation of PA, adrenal venous aldosterone is
typically ‘normalised’ to ipsilateral adrenal venous cortisol to provide an aldosterone: cortisol ratio
which is used for comparison with the contralateral adrenal vein (Funder et al. 2016). This approach
is employed to correct for variations in the distance from the adrenal gland that the blood test is
taken with the assumption being that the concentration of all adrenal hormones will be highest
closest to the adrenal gland and will reduce the further from it (Figure 6.1). This is of particular
importance in lateralisation studies as there is significant anatomical difference between the right
adrenal vein (which is short and drains directly into the IVC) and the left adrenal vein (which is longer
and drains into the left renal vein before reaching the IVC).
Thus, we ‘normalised’ the absolute catecholamine concentration in the adrenal veins by ‘correcting’
for ipsilateral adrenal venous cortisol concentration (Table 6.3 and Figure 6.3). This did not reduce
inter-individual variability (factors ranging from 129 to 922), but did eliminate the observed
differences between left and right adrenal venous adrenaline (Figure 6.3A; median 0.00253
compared to 0.00285 p=0.31) and noradrenaline (Figure 6.3B; median 0.00081 compared to
0.00074, p=0.96). The noradrenaline: adrenaline ratio remained higher in the left adrenal vein than
the right (Figure 6.3C; median 0.00002 compared to 0.000016, p=6.1x10⁻⁹).
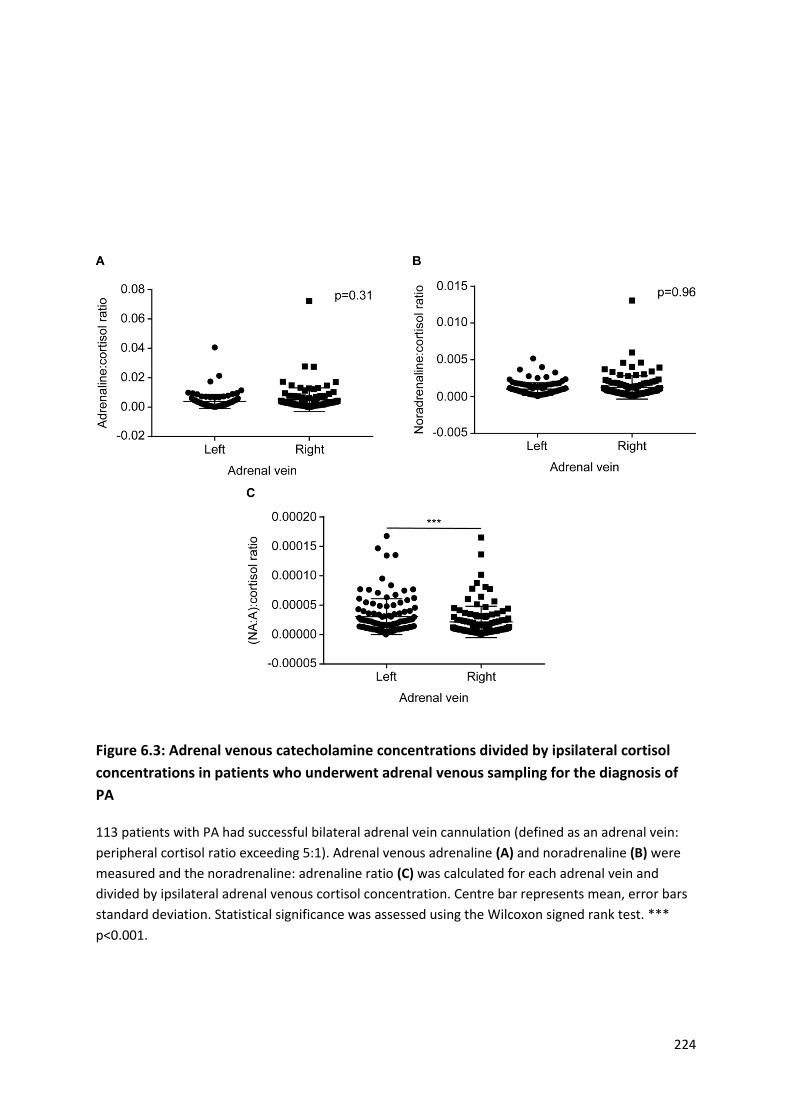
224
Figure 6.3: Adrenal venous catecholamine concentrations divided by ipsilateral cortisol
concentrations in patients who underwent adrenal venous sampling for the diagnosis of
PA
113 patients with PA had successful bilateral adrenal vein cannulation (defined as an adrenal vein:
peripheral cortisol ratio exceeding 5:1). Adrenal venous adrenaline (A) and noradrenaline (B) were
measured and the noradrenaline: adrenaline ratio (C) was calculated for each adrenal vein and
divided by ipsilateral adrenal venous cortisol concentration. Centre bar represents mean, error bars
standard deviation. Statistical significance was assessed using the Wilcoxon signed rank test. ***
p<0.001.
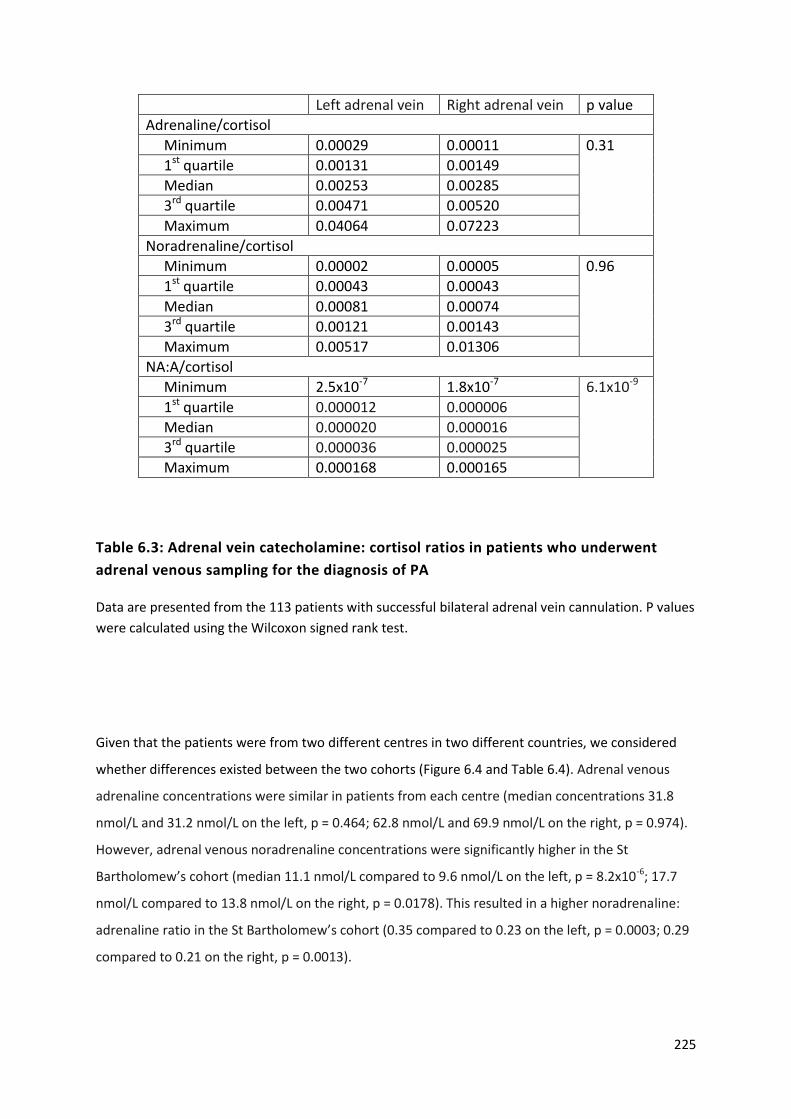
225
Left adrenal vein Right adrenal vein p value
Adrenaline/cortisol
Minimum 0.00029 0.00011 0.31
1st quartile 0.00131 0.00149
Median 0.00253 0.00285
3rd quartile 0.00471 0.00520
Maximum 0.04064 0.07223
Noradrenaline/cortisol
Minimum 0.00002 0.00005 0.96
1st quartile 0.00043 0.00043
Median 0.00081 0.00074
3rd quartile 0.00121 0.00143
Maximum 0.00517 0.01306
NA:A/cortisol
Minimum 2.5x10⁻⁷ 1.8x10⁻⁷ 6.1x10⁻⁹
1st quartile 0.000012 0.000006
Median 0.000020 0.000016
3rd quartile 0.000036 0.000025
Maximum 0.000168 0.000165
Table 6.3: Adrenal vein catecholamine: cortisol ratios in patients who underwent
adrenal venous sampling for the diagnosis of PA
Data are presented from the 113 patients with successful bilateral adrenal vein cannulation. P values
were calculated using the Wilcoxon signed rank test.
Given that the patients were from two different centres in two different countries, we considered
whether differences existed between the two cohorts (Figure 6.4 and Table 6.4). Adrenal venous
adrenaline concentrations were similar in patients from each centre (median concentrations 31.8
nmol/L and 31.2 nmol/L on the left, p = 0.464; 62.8 nmol/L and 69.9 nmol/L on the right, p = 0.974).
However, adrenal venous noradrenaline concentrations were significantly higher in the St
Bartholomew’s cohort (median 11.1 nmol/L compared to 9.6 nmol/L on the left, p = 8.2x10⁻⁶; 17.7
nmol/L compared to 13.8 nmol/L on the right, p = 0.0178). This resulted in a higher noradrenaline:
adrenaline ratio in the St Bartholomew’s cohort (0.35 compared to 0.23 on the left, p = 0.0003; 0.29
compared to 0.21 on the right, p = 0.0013).

226
Figure 6.4: Adrenal venous catecholamine concentrations in patients who underwent AVS
for the diagnosis of PA according to centre
113 patients with PA (74 at St Bartholomew’s Hospital (SBH), 39 at Radbound University Medical
Center (RUMC)) had successful bilateral adrenal vein cannulation, defined as an adrenal vein:
peripheral cortisol ratio exceeding 5:1. Adrenal venous adrenaline (A) and noradrenaline (B) were
measured and the noradrenaline: adrenaline ratio (C) was calculated for each adrenal vein. Centre
bar represents mean, error bars standard deviation. Statistical significance between centres was
assessed using the Mann Whitney U test. NA = noradrenaline, A = adrenaline, ns = not significant, *
p<0.05, ** p<0.01, *** p<0.001.
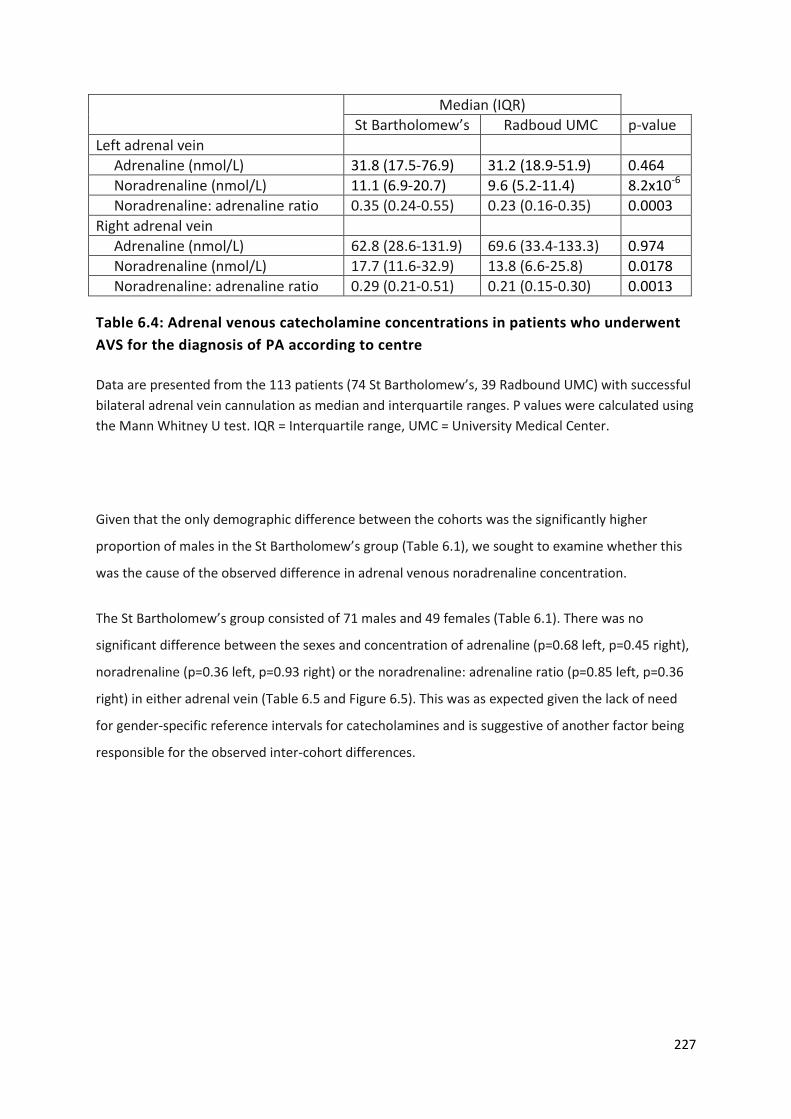
227
Median (IQR)
St Bartholomew’s Radboud UMC p-value
Left adrenal vein
Adrenaline (nmol/L) 31.8 (17.5-76.9) 31.2 (18.9-51.9) 0.464
Noradrenaline (nmol/L) 11.1 (6.9-20.7) 9.6 (5.2-11.4) 8.2x10⁻⁶
Noradrenaline: adrenaline ratio 0.35 (0.24-0.55) 0.23 (0.16-0.35) 0.0003
Right adrenal vein
Adrenaline (nmol/L) 62.8 (28.6-131.9) 69.6 (33.4-133.3) 0.974
Noradrenaline (nmol/L) 17.7 (11.6-32.9) 13.8 (6.6-25.8) 0.0178
Noradrenaline: adrenaline ratio 0.29 (0.21-0.51) 0.21 (0.15-0.30) 0.0013
Table 6.4: Adrenal venous catecholamine concentrations in patients who underwent
AVS for the diagnosis of PA according to centre
Data are presented from the 113 patients (74 St Bartholomew’s, 39 Radbound UMC) with successful
bilateral adrenal vein cannulation as median and interquartile ranges. P values were calculated using
the Mann Whitney U test. IQR = Interquartile range, UMC = University Medical Center.
Given that the only demographic difference between the cohorts was the significantly higher
proportion of males in the St Bartholomew’s group (Table 6.1), we sought to examine whether this
was the cause of the observed difference in adrenal venous noradrenaline concentration.
The St Bartholomew’s group consisted of 71 males and 49 females (Table 6.1). There was no
significant difference between the sexes and concentration of adrenaline (p=0.68 left, p=0.45 right),
noradrenaline (p=0.36 left, p=0.93 right) or the noradrenaline: adrenaline ratio (p=0.85 left, p=0.36
right) in either adrenal vein (Table 6.5 and Figure 6.5). This was as expected given the lack of need
for gender-specific reference intervals for catecholamines and is suggestive of another factor being
responsible for the observed inter-cohort differences.
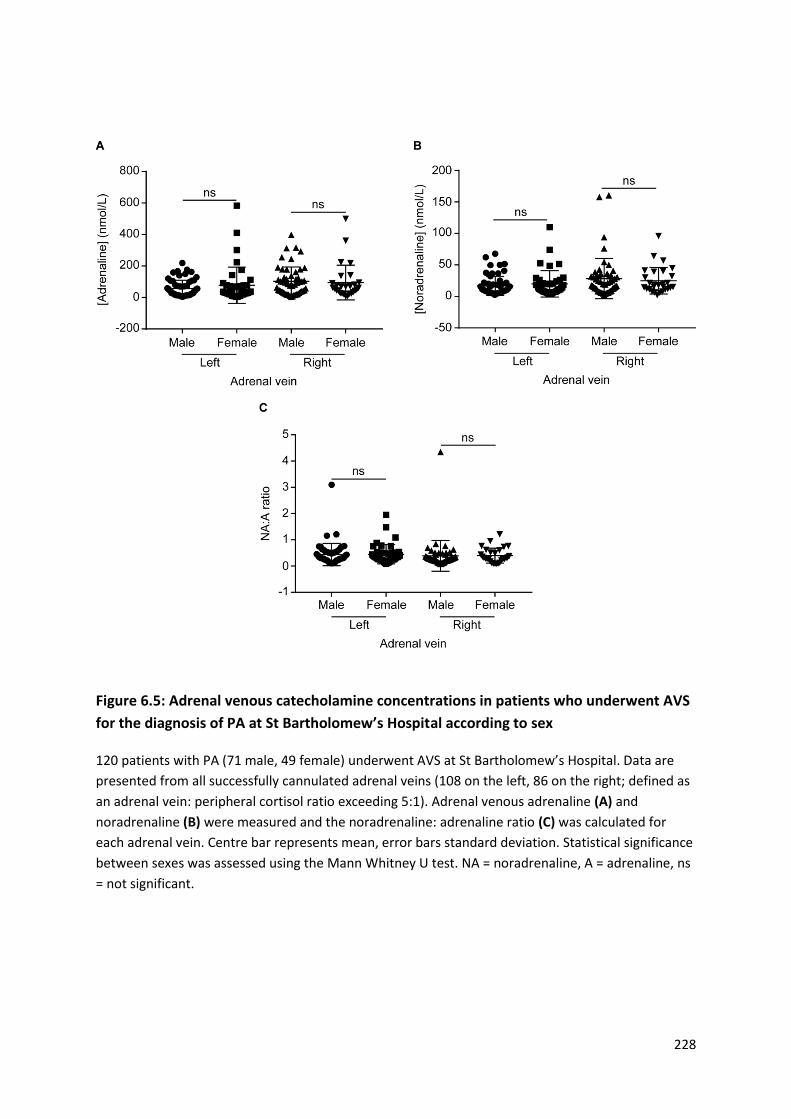
228
Figure 6.5: Adrenal venous catecholamine concentrations in patients who underwent AVS
for the diagnosis of PA at St Bartholomew’s Hospital according to sex
120 patients with PA (71 male, 49 female) underwent AVS at St Bartholomew’s Hospital. Data are
presented from all successfully cannulated adrenal veins (108 on the left, 86 on the right; defined as
an adrenal vein: peripheral cortisol ratio exceeding 5:1). Adrenal venous adrenaline (A) and
noradrenaline (B) were measured and the noradrenaline: adrenaline ratio (C) was calculated for
each adrenal vein. Centre bar represents mean, error bars standard deviation. Statistical significance
between sexes was assessed using the Mann Whitney U test. NA = noradrenaline, A = adrenaline, ns
= not significant.
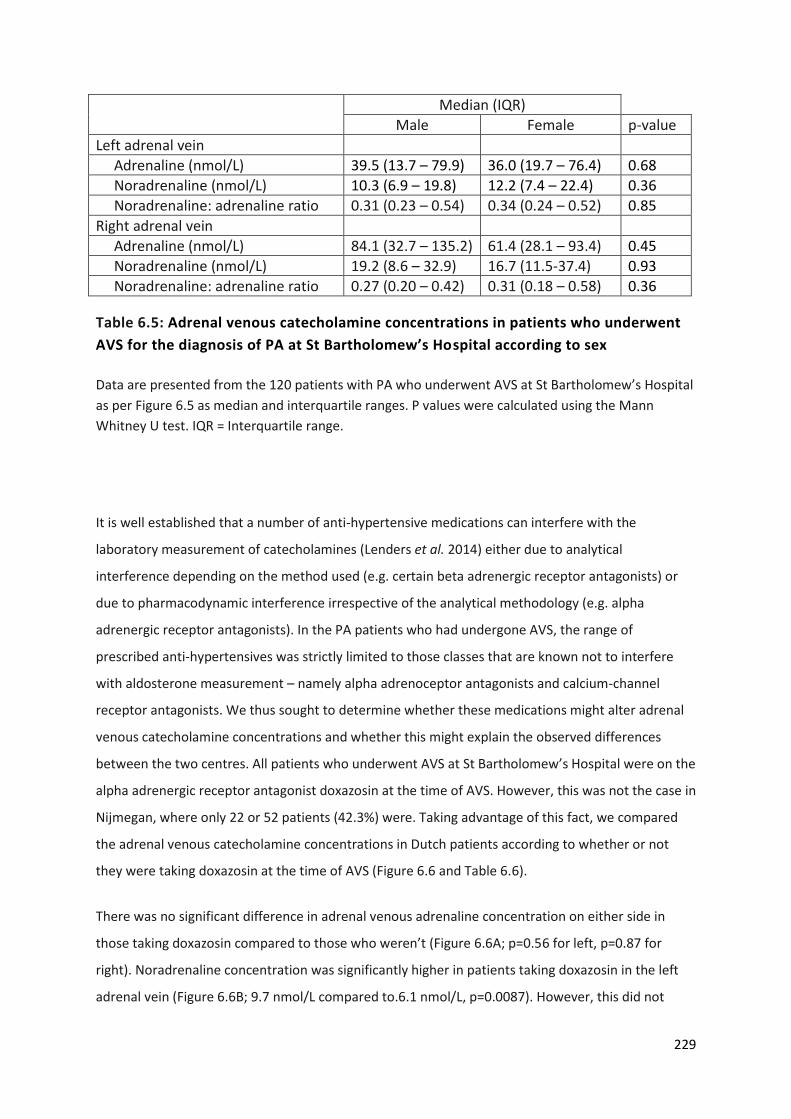
229
Median (IQR)
Male Female p-value
Left adrenal vein
Adrenaline (nmol/L) 39.5 (13.7 – 79.9) 36.0 (19.7 – 76.4) 0.68
Noradrenaline (nmol/L) 10.3 (6.9 – 19.8) 12.2 (7.4 – 22.4) 0.36
Noradrenaline: adrenaline ratio 0.31 (0.23 – 0.54) 0.34 (0.24 – 0.52) 0.85
Right adrenal vein
Adrenaline (nmol/L) 84.1 (32.7 – 135.2) 61.4 (28.1 – 93.4) 0.45
Noradrenaline (nmol/L) 19.2 (8.6 – 32.9) 16.7 (11.5-37.4) 0.93
Noradrenaline: adrenaline ratio 0.27 (0.20 – 0.42) 0.31 (0.18 – 0.58) 0.36
Table 6.5: Adrenal venous catecholamine concentrations in patients who underwent
AVS for the diagnosis of PA at St Bartholomew’s Hospital according to sex
Data are presented from the 120 patients with PA who underwent AVS at St Bartholomew’s Hospital
as per Figure 6.5 as median and interquartile ranges. P values were calculated using the Mann
Whitney U test. IQR = Interquartile range.
It is well established that a number of anti-hypertensive medications can interfere with the
laboratory measurement of catecholamines (Lenders et al. 2014) either due to analytical
interference depending on the method used (e.g. certain beta adrenergic receptor antagonists) or
due to pharmacodynamic interference irrespective of the analytical methodology (e.g. alpha
adrenergic receptor antagonists). In the PA patients who had undergone AVS, the range of
prescribed anti-hypertensives was strictly limited to those classes that are known not to interfere
with aldosterone measurement – namely alpha adrenoceptor antagonists and calcium-channel
receptor antagonists. We thus sought to determine whether these medications might alter adrenal
venous catecholamine concentrations and whether this might explain the observed differences
between the two centres. All patients who underwent AVS at St Bartholomew’s Hospital were on the
alpha adrenergic receptor antagonist doxazosin at the time of AVS. However, this was not the case in
Nijmegan, where only 22 or 52 patients (42.3%) were. Taking advantage of this fact, we compared
the adrenal venous catecholamine concentrations in Dutch patients according to whether or not
they were taking doxazosin at the time of AVS (Figure 6.6 and Table 6.6).
There was no significant difference in adrenal venous adrenaline concentration on either side in
those taking doxazosin compared to those who weren’t (Figure 6.6A; p=0.56 for left, p=0.87 for
right). Noradrenaline concentration was significantly higher in patients taking doxazosin in the left
adrenal vein (Figure 6.6B; 9.7 nmol/L compared to.6.1 nmol/L, p=0.0087). However, this did not
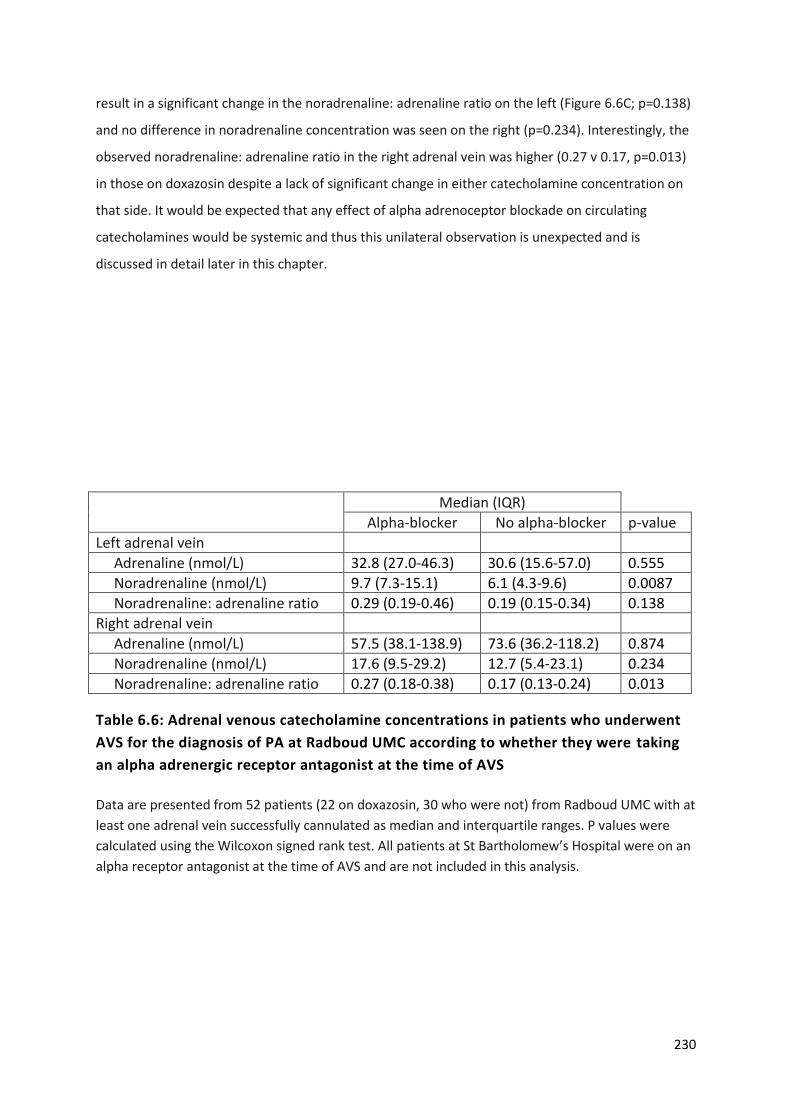
230
result in a significant change in the noradrenaline: adrenaline ratio on the left (Figure 6.6C; p=0.138)
and no difference in noradrenaline concentration was seen on the right (p=0.234). Interestingly, the
observed noradrenaline: adrenaline ratio in the right adrenal vein was higher (0.27 v 0.17, p=0.013)
in those on doxazosin despite a lack of significant change in either catecholamine concentration on
that side. It would be expected that any effect of alpha adrenoceptor blockade on circulating
catecholamines would be systemic and thus this unilateral observation is unexpected and is
discussed in detail later in this chapter.
Median (IQR)
Alpha-blocker No alpha-blocker p-value
Left adrenal vein
Adrenaline (nmol/L) 32.8 (27.0-46.3) 30.6 (15.6-57.0) 0.555
Noradrenaline (nmol/L) 9.7 (7.3-15.1) 6.1 (4.3-9.6) 0.0087
Noradrenaline: adrenaline ratio 0.29 (0.19-0.46) 0.19 (0.15-0.34) 0.138
Right adrenal vein
Adrenaline (nmol/L) 57.5 (38.1-138.9) 73.6 (36.2-118.2) 0.874
Noradrenaline (nmol/L) 17.6 (9.5-29.2) 12.7 (5.4-23.1) 0.234
Noradrenaline: adrenaline ratio 0.27 (0.18-0.38) 0.17 (0.13-0.24) 0.013
Table 6.6: Adrenal venous catecholamine concentrations in patients who underwent
AVS for the diagnosis of PA at Radboud UMC according to whether they were taking
an alpha adrenergic receptor antagonist at the time of AVS
Data are presented from 52 patients (22 on doxazosin, 30 who were not) from Radboud UMC with at
least one adrenal vein successfully cannulated as median and interquartile ranges. P values were
calculated using the Wilcoxon signed rank test. All patients at St Bartholomew’s Hospital were on an
alpha receptor antagonist at the time of AVS and are not included in this analysis.

231
Figure 6.6: Adrenal venous catecholamine concentrations in patients who underwent AVS
for the diagnosis of PA at Radbound University Medical Center according to whether they
were taking an alpha adrenergic receptor antagonist at the time of AVS
52 patients with PA (22 on doxazosin, 30 who were not) had at least one adrenal vein successfully
cannulated (adrenal venous cortisol greater than five times the periphery; n=49 on the left, 41 on
the right). Adrenal venous adrenaline (A) and noradrenaline (B) were measured and the
noradrenaline: adrenaline ratio (C) was calculated for each adrenal vein. Centre bar represents
mean, error bars standard deviation. Statistical significance between groups was assessed using the
Mann Whitney U test. Dox = doxazosin, NA = noradrenaline, A = adrenaline, ns = not significant, * p
< 0.05.

232
Thus, in keeping with previous reports (Kahaly et al. 1985; Freel et al. 2010; Baba et al. 2013),
absolute concentrations of catecholamines in the adrenal veins vary widely between individuals. This
variation is reduced when considering the noradrenaline: adrenaline ratio, with a ratio exceeding
one having previously been proposed as pathological (Newbould et al. 1991) as adrenaline is the
predominant adrenal catecholamine (Wurtman & Axelrod 1965).
Considering all 172 patients with PA who underwent AVS, the left adrenal vein was successfully
cannulated 159 times (92.4%) and the right 130 times (75.6%). Using all successfully cannulated
adrenal veins samples, even if success was only unilateral, centile values for the left and right
adrenal venous adrenaline: cortisol, noradrenaline: cortisol and noradrenaline: adrenaline ratios
were calculated and are shown in Table 6.7. The noradrenaline: adrenaline ratio for the 97.5th centile
was 1.21 on the left and 1.04 on the right.
Centile Adrenal vein
Left Right
A:cortisol NA:cortisol NA:A A:cortisol NA:cortisol NA:A
1 0.000299 0.000105 0.09 0.000381 8.8x10⁻⁵ 0.07
2.5 0.000323 0.000189 0.10 0.000475 0.000123 0.09
5 0.000345 0.000215 0.11 0.000587 0.000175 0.10
10 0.000643 0.000266 0.13 0.000921 0.000275 0.11
25 0.001313 0.000438 0.20 0.001485 0.000430 0.17
50 0.002529 0.000811 0.31 0.002847 0.000737 0.26
75 0.004713 0.001213 0.51 0.005196 0.001435 0.40
90 0.007280 0.001864 0.74 0.011220 0.002903 0.62
95 0.009491 0.002595 0.88 0.014735 0.003820 0.77
97.5 0.012952 0.003371 1.21 0.019827 0.004613 1.04
99 0.020971 0.003972 2.41 0.027653 0.005857 3.38
Table 6.7: Centile values for the adrenaline (A): cortisol, noradrenaline (NA): cortisol
and noradrenaline: adrenaline ratio in the right and left adrenal veins in patients with
PA (n = 159 on the left, 130 on the right)
233
6.3.2 Adrenal venous catecholamine concentrations in patients with
phaeochromocytoma
As a comparative group, six patients (three male, three female) with the clinical and biochemical
suspicion of catecholamine excess who had undergone AVS as part of the diagnostic process were
identified from the phaeochromocytoma database at St Bartholomew’s Hospital (Table 6.8). Mean
patient age was 31.3 + 6.9 years (range 13 – 67 years) and five of the six had a genetic predisposition
to phaeochromocytoma development (all VHL).
In the five VHL patients, surgery was indicated due to the presence of a confirmed secretory
phaeochromocytoma (mean diameter 41.25 + 9.6 mm) and AVS was undertaken either to confirm
bilateral disease (patients 1 – 4) or to exclude phaeochromocytoma below the limit of resolution of
imaging techniques (patient 5). AVS data guided surgical decision making: in patients 1 – 4, bilateral
disease was confirmed due to an elevated adrenal venous noradrenaline: adrenaline ratio (minimum
ratio 2.96) and these patients underwent a bilateral adrenalectomy at a single sitting. Bilateral
phaeochromocytomas were confirmed histologically in all cases and it should be noted that in
patient 1 there was no discernible radiological abnormality in the left adrenal despite histological
confirmation of a phaeochromocytoma. In cases 2 – 4, a contralateral adrenal abnormality was
identified radiologically, however they were small (5 – 10 mm) and radiologically indeterminate and
did not display I123-MIBG-uptake. Patient 5 had a left renal cell carcinoma and left para-aortic mass
which was impossible to distinguish from the left adrenal gland on imaging. He was committed to
surgical resection of both lesions and AVS was undertaken pre-operatively to exclude disease in the
contralateral adrenal, which, if present, would have been tackled at the same operation. Given the
reassuring right adrenal vein noradrenaline: adrenaline ratio (0.8), he underwent resection of the
left renal lesion and para-aortic mass only. It was not possible surgically to spare the left adrenal
gland and histological evaluation confirmed a paraganglioma with a normal adrenal gland. The left
adrenal vein noradrenaline: adrenaline ratio was 0.5.
Patient 6 was older (67 years) and did not have VHL or any other phaeochromocytoma-predisposing
syndrome. She had elevated circulating catecholamines and bilateral adrenal lesions (14 and 19mm
respectively). There was a low clinical suspicion of bilateral disease and the smaller lesion did not
display I123-MIBG avidity; however it could not be categorically characterised as being benign on
radiological criteria. She therefore underwent AVS to determine whether a unilateral or bilateral
adrenalectomy was required with a unilateral procedure being ultimately performed due to a left
adrenal vein noradrenaline: adrenaline ratio of 0.85. Histology confirmed a phaeochromocytoma in
234
the resected gland and post-operative metanephrine measurements were normal excluding the
presence of a phaeochromocytoma in the left adrenal gland which remained in situ.
It should be noted that all six patients were on an alpha receptor antagonist (phenoxybenzamine) at
the time of AVS and there were no haemodynamic or other adverse effects following AVS.
The lowest adrenal vein noradrenaline: adrenaline ratio in a confirmed phaeochromocytoma was
2.96 on the left and 1.75 on the right, although this figure is the minimum possible ratio and may
have been higher as unfortunately insufficient sample was available for further determination of the
noradrenaline concentration.
Adrenal venous noradrenaline: adrenaline ratios for patients with PA and those with
phaeochromocytoma are displayed in Figure 6.7. Using a cut-off defined by the 97.5th centile of the
PA cohort (1.21 on the left, 1.04 on the right), the false negative rate in the phaeochromocytoma
cohort was 0%.
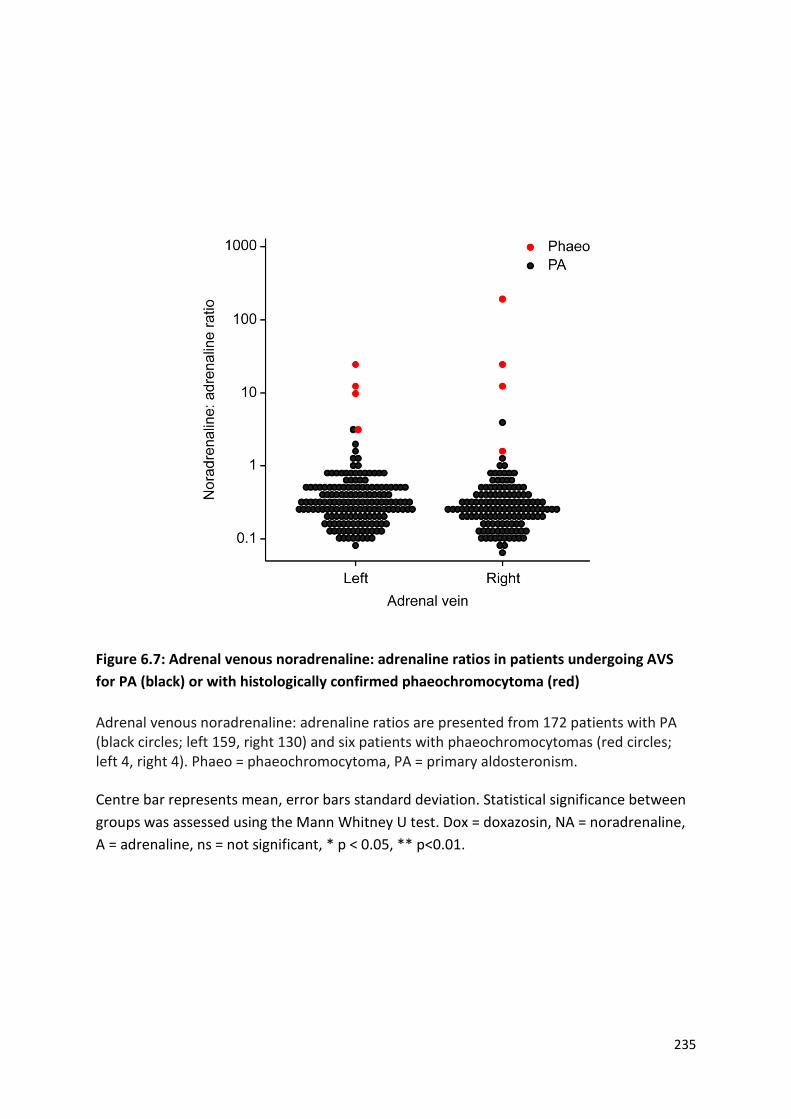
235
Figure 6.7: Adrenal venous noradrenaline: adrenaline ratios in patients undergoing AVS
for PA (black) or with histologically confirmed phaeochromocytoma (red)
Adrenal venous noradrenaline: adrenaline ratios are presented from 172 patients with PA (black circles; left 159, right 130) and six patients with phaeochromocytomas (red circles; left 4, right 4). Phaeo = phaeochromocytoma, PA = primary aldosteronism.
Centre bar represents mean, error bars standard deviation. Statistical significance between
groups was assessed using the Mann Whitney U test. Dox = doxazosin, NA = noradrenaline,
A = adrenaline, ns = not significant, * p < 0.05, ** p<0.01.
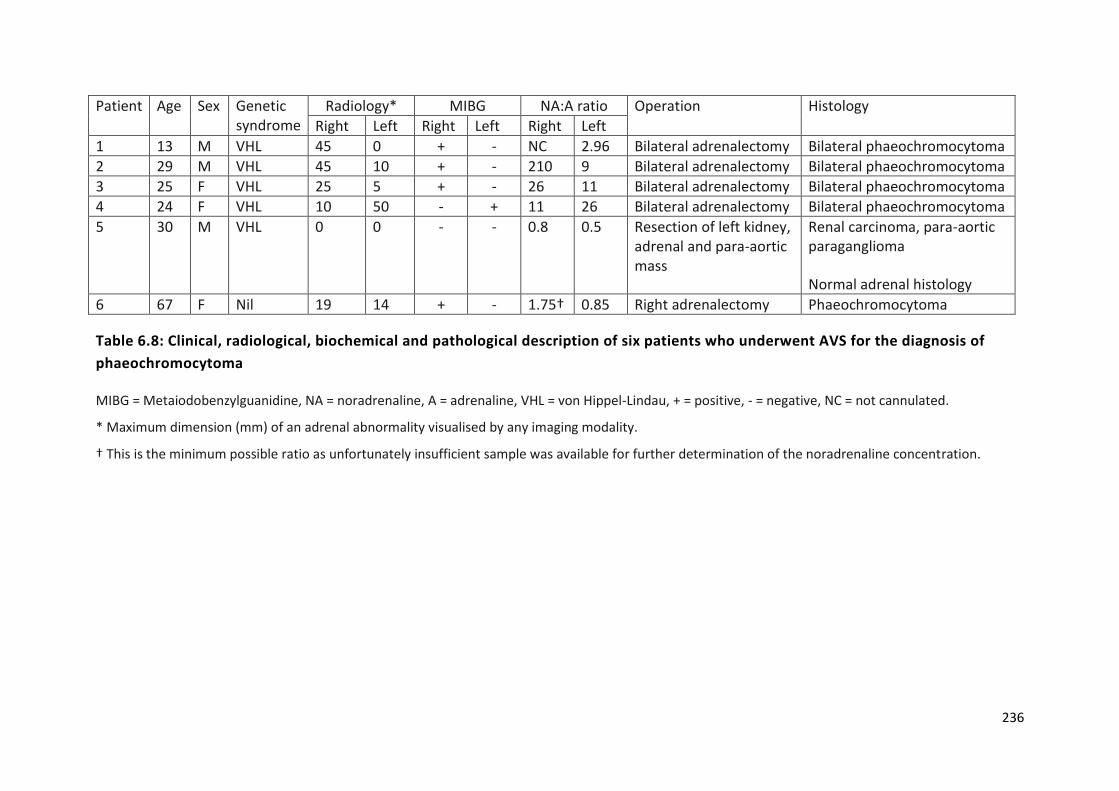
236
Patient Age Sex Genetic syndrome
Radiology* MIBG NA:A ratio Operation Histology
Right Left Right Left Right Left
1 13 M VHL 45 0 + - NC 2.96 Bilateral adrenalectomy Bilateral phaeochromocytoma
2 29 M VHL 45 10 + - 210 9 Bilateral adrenalectomy Bilateral phaeochromocytoma
3 25 F VHL 25 5 + - 26 11 Bilateral adrenalectomy Bilateral phaeochromocytoma
4 24 F VHL 10 50 - + 11 26 Bilateral adrenalectomy Bilateral phaeochromocytoma
5 30 M VHL 0 0 - - 0.8 0.5 Resection of left kidney, adrenal and para-aortic mass
Renal carcinoma, para-aortic paraganglioma
Normal adrenal histology
6 67 F Nil 19 14 + - 1.75† 0.85 Right adrenalectomy Phaeochromocytoma
Table 6.8: Clinical, radiological, biochemical and pathological description of six patients who underwent AVS for the diagnosis of
phaeochromocytoma
MIBG = Metaiodobenzylguanidine, NA = noradrenaline, A = adrenaline, VHL = von Hippel-Lindau, + = positive, - = negative, NC = not cannulated.
* Maximum dimension (mm) of an adrenal abnormality visualised by any imaging modality.
† This is the minimum possible ratio as unfortunately insufficient sample was available for further determination of the noradrenaline concentration.
237
6.4 Discussion
In this chapter, I have defined side-specific normative reference intervals of adrenal venous
catecholamines and their ratio in patients with PA. Using these, I have proposed a diagnostic cut-off
based on the 97.5th centile value and have demonstrated that this provides a 0% false positive
detection rate in a cohort of six patients with phaeochromocytoma who underwent AVS.
6.4.1 Normal adrenal venous catecholamine concentrations in patients with
primary aldosteronism
This series is the largest to date of catecholamine concentrations in the adrenal veins. In keeping
with previous studies (Kahaly et al. 1985; Freel et al. 2010; Baba et al. 2013), we observed wide
variation in absolute catecholamine concentrations (up to a factor of 178 on the right and 106 on the
left); a fact which has been used to argue against the utility of AVS in the diagnosis of
phaeochromocytoma (Freel et al. 2010). This variation was reduced when considering the
noradrenaline to adrenaline ratio in each adrenal vein (variation up to a factor of 54 on the right and
34 on the left), but not by ‘correcting’ for adrenal vein cortisol.
As hypothesised, adrenal venous adrenaline concentration exceeded that of noradrenaline
bilaterally, resulting in a noradrenaline to adrenaline ratio of less than one. Interestingly, both
adrenaline and noradrenaline concentrations were higher in the right than the left adrenal vein. This
effect was seen at both centres and is most likely explainable by proximity of the catheter tip to the
adrenal gland (which will be closer by necessity on the right due to normal anatomical variation) at
the time of sampling as the effect was not seen when ‘corrected’ for adrenal vein cortisol. The
noradrenaline: adrenaline ratio, however, persisted to be greater on the left after correction for
cortisol. The most likely explanation being that this reflects a degree of dilution from the inferior
phrenic vein (in which noradrenaline would be the predominant catecholamine), although caution
must be applied to the interpretation of these data as it contains a double correction.
Studies that have examined adrenal venous catecholamines in healthy individuals are lacking and are
unlikely ever to be performed due to the invasive nature of AVS and the inherent risks, albeit small,
of contrast administration and radiation exposure from fluoroscopic screening. Three studies have
examined this area in the context of hypertension or non-phaeochromocytoma adrenal lesions
(summarised in Table 6.9), although they are generally small and direct comparison between them is
difficult. Different patient subgroups were included in each: patients with essential hypertension in
one (Kahaly et al. 1985), predominantly ACTH-independent Cushing’s syndrome in another (Freel et

238
al. 2010) and a mixture of causes of secondary hypertension and non-functional adrenal adenomas
in the third (Baba et al. 2013). AVS was performed under a variety of different conditions, including
without stimulation (Baba et al. 2013) and following dexamethasone suppression (Freel et al. 2010),
which might impact on catecholamine concentration and are discussed later. In all previous series,
adrenal venous cannulation success is very unclear as either criteria were not reported (Kahaly et al.
1985) or venography only was used (Baba et al. 2013). In the Mayo series, a non-standardised, non-
verified and unpublished adrenal vein to peripheral catecholamine gradient was used, as cortisol
was uninterpretable in the context of dexamethasone suppression, although it is reasonable to
assume successful cannulation given the historic success at that centre (Freel et al. 2010).
These differences notwithstanding, adrenal vein adrenaline concentrations exceeded noradrenaline
in all series. In accordance with our findings, adrenal venous adrenaline and noradrenaline
concentrations were greater in the right adrenal vein than the left and the noradrenaline: adrenaline
ratio was greater on the right in the Mayo Clinic series (Freel et al. 2010). No statistically significant
differences between sides were observed in a heterogeneous cohort (Baba et al. 2013).
When comparing between the two centres in our cohort, there was no significant difference in
adrenal venous adrenaline concentrations on either side. Noradrenaline, however, was greater in
patients from St Bartholomew’s Hospital and this resulted in an increased noradrenaline: adrenaline
ratio bilaterally. One potential explanation for this observed difference could be due to differences
in measurement methodology as there was not a single ‘reference’ laboratory for this study. Both
centres used high performance liquid chromatography with electrochemical detection: a technique
that is far less susceptible to inter-laboratory variation than immunoassays. In addition, the fact that
no difference was seen with adrenaline, which was measured by the same method, suggests an
alternative explanation is more likely.
The only demographic difference between the two centres was sex, with a higher proportion of male
patients in the St Bartholomew’s group. Sex-specific reference ranges for catecholamines are not
utilised in clinical practice and so it might be assumed that this is unlikely to be the cause for the
observed difference. However, urinary noradrenaline excretion is higher in men than women
(Lehmann & Keul 1986; Gerlo et al. 1991). The situation with plasma noradrenaline is less clear cut,
with studies showing either no difference between the sexes (Brecht & Schoeppe 1978) or higher
levels in women (Davidson et al. 1984). A sex-specific effect on adrenal vein catecholamines was not
examined in any of the three previous series (Kahaly et al. 1985; Freel et al. 2010; Baba et al. 2013).
In the St Bartholomew’s cohort, no difference between any adrenal vein catecholamine was

239
Reference N AVS details
Catecholamine (nmol/L)
Median (interquartile range)
p-value Left adrenal vein Right adrenal vein
(Kahaly et al. 1985)† 57 essential hypertension
Conditions of AVS and cannulation criteria not stated
Adrenaline 16.7 (0.5-295.5)‡ ns
Noradrenaline 15.4 (1.0-278.3)‡ ns
NA:A ratio Ns ns ns
(Freel et al. 2010) 17 Cushing’s 1 PA
Dexamethasone suppression AV: IVC catecholamine gradient
Adrenaline 6.2 (2.2-15.4) 18.1 (8.1-18.1) <0.02
Noradrenaline 3.0 (2.0-7.3) 4.5 (3.1-10.3) <0.09
NA:A ratio 0.54 (0.3-1.1) 0.3 (0.2-0.5) 0.02
(Baba et al. 2013) 8 PA 5 Cushing’s 2 NFA
No ACTH Venography
Adrenaline 77.4 (0.09-148.7) ‡ 53.5 (0.2-959.7) ‡ 0.63
Noradrenaline 18.1 (0.9-54.7) ‡ 8.1 (0.6-189.7) ‡ 0.58
NA:A ratio Ns ns ns
This thesis 113 PA ACTH stimulation AV:IVC cortisol >5:1
Adrenaline 35.1 (19.5-72.8) 61.4 (31.5-126.7) 1.7 x10⁻⁷
Noradrenaline 10.6 (6.6-18.7) 16.3 (8.8-31.8) 2.4 x10⁻⁶
NA:A ratio 0.31 (0.20-0.51) 0.26 (0.18-0.38) 8.3 x10⁻⁶
Table 6.9: Summary of published reports of adrenal venous catecholamine concentrations and ratios
AVS – adrenal venous sampling, PA – primary aldosteronism, AV – adrenal vein, IVC – inferior vena cava, NFA – non-functioning adenoma, NA –
noradrenaline, A – adrenaline, ns – not stated.
† Data were not presented for each individual adrenal vein
‡ Data for range but not interquartile range were presented and are displayed
240
observed between men and women (Figure 6.5) and the most plausible explanation for this
difference between the two centres is chance.
This led us to consider whether the alpha adrenoceptor antagonist doxazosin might be responsible
for the observed difference due to variations in prescription between the two centres. Patients with
PA on doxazosin had higher adrenal venous noradrenaline concentrations in the left adrenal vein,
although this did not result in an alteration in the noradrenaline: adrenaline ratio in spite of an
unchanged adrenaline. A trend to a higher noradrenaline concentration on the right in patients on
doxazosin was observed, although statistical significance was not reached. Interestingly, in spite of
this, the noradrenaline: adrenaline ratio was higher on the right. Doxazosin, an α1-adrenoceptor
specific antagonist, has previously been shown to increase urinary noradrenaline excretion resulting
in false positive results in the diagnosis of phaeochromocytoma (Eisenhofer et al. 2003). The
proposed mechanism by which this occurs is via reflexive sympathetic activation and is distinct to
that seen with non-selective alpha adrenergic receptor antagonists, such as phenoxybenzamine. In
these instances, inhibition of the presynaptic α2-receptor reduces noradrenaline reuptake and
results in increased peripheral noradrenaline (Lenders et al. 2014). The interpretation of these
observations is difficult as any effect of doxazosin would reasonably be expected to be systemic. An
increase in noradrenaline in the left adrenal vein, as was observed, is consistent with relative
dilution from the inferior phrenic vein, which as a peripheral vein would be expected to have an
excess of noradrenaline compared to the adrenal vein and as such any effect of doxazosin on
noradrenaline would be exaggerated. The fact that the noradrenaline: adrenaline ratio is not
elevated as a result calls into question whether this observation is maintained and consistent.
Evaluation in other distinct cohorts would be informative to further answer this question.
One limitation of the approach employed to define reference intervals was the use of patients with
PA, however the use of healthy normotensive individuals would not be justifiable given the invasive
nature and contrast and radiation exposure of AVS. Aldosterone stimulated the central nervous
system in animals (Gomez-Sanchez 1986), but there is contradictory evidence as to whether
sympathetic nervous system activity is increased (Kontak et al. 2010) or attenuated (Miyajima et al.
1991) in individuals with PA and whether this alters adrenal venous catecholamine levels is
unknown. Alpha blockade, as discussed, has the potential to elevate circulating noradrenaline
(Lenders et al. 2014); however both the PA and phaeochromocytoma groups were treated with
alpha receptor antagonists prior to AVS (although with different agents). Prior to this report, the
group at the Mayo Clinic reported AVS catecholamine results in 18 patients being evaluated for
autonomous cortisol production (Freel et al. 2010). These patients had cortisol excess, suppressed

241
ACTH in all but one case and the AVSs were performed under dexamethasone suppression. All of
these factors have the potential to influence adrenal catecholamine production via effects on
enzymes of the catecholamine synthesis pathway (Wurtman & Axelrod 1965; Thoenen et al. 1969;
Gewirtz et al. 1971). The evidence for this in humans is limited and conflicting with reports of
reduced peripheral adrenaline (Cameron et al. 1995), noradrenaline (Krsek et al. 2006) or both
(Mannelli et al. 1994) in patients with Cushing’s syndrome. One study found that chronic
administration of ACTH to normal subjects did not affect peripheral noradrenaline, whilst
dexamethasone at a dose of 6mg over three days reduced noradrenaline (Stene et al. 1980).
Another study found no significant difference between the adrenal venous noradrenaline:
adrenaline ratio in eight patients with Cushing’s compared to 12 controls (Mannelli et al. 1994). Our
reported patients were also hypercortisolaemic, albeit temporarily, due to infusion of cosyntropin at
the time of AVS and this has been shown to increase adrenal vein adrenaline and noradrenaline in
one small series (Valenta et al. 1986).Thus, although use of a PA cohort to define reference intervals
has its limitations, it is the best available option.
Normal catecholamine secretion is variable and episodic, whilst their metanephrine metabolites are
released in a continuous process that is independent of episodic catecholamine release and
relatively unaffected by stress (Eisenhofer et al. 1995a, b, 1998). Due to these advantages, use of
adrenal venous metanephrines has been proposed as an alternate to adrenal venous cortisol for
assessment of adrenal vein cannulation in patients with PA (Dekkers et al. 2013). In this study,
adrenal vein metanephrine concentration was greater than in the periphery, but side-specific results
were not reported. The reported use of AVS for metanephrines in the diagnosis of
phaeochromocytoma is limited to two case reports which made empirical judgements based on non-
normative metanephrine gradients (Pacak et al. 2001; Därr et al. 2011). We considered the use of
adrenal vein metanephrines in our cohort, however only catecholamine results were available for
the patients with phaeochromocytoma, so a meaningful comparison between the two groups would
not have been possible.
6.4.2 Adrenal venous noradrenaline: adrenaline ratio in patients with
phaeochromocytoma
Using the PA cohort, we have presented centile values for the adrenal venous noradrenaline:
adrenaline ratio in each adrenal vein (Table 6.7). The 97.5th centile values were 1.21 on the left and
1.04 on the right. Comparing these cut offs with data from six patients with histologically proven
phaeochromocytomas, in whom a conventional imaging only approach could either not confirm the
242
site of abnormality or could not refute bilateral disease, the false negative rate was 0%. The lowest
adrenal vein noradrenaline: adrenaline ratio in a confirmed phaeochromocytoma was 2.96 on the
left and 1.75 on the right.
AVS has previously been a widely used adjunct in the diagnosis (Von Euler et al. 1955; Jones et al.
1979; Palublnskas et al. 1980; Allison et al. 1983) and lateralisation (Davies et al. 1979; Nobin et al.
1982; Chew et al. 1994; Srirangalingam et al. 2010) of phaeochromocytoma. However,
interpretation of these studies depended either on the use of non-standardised concentration
gradient cut-offs, comparisons with the contralateral adrenal or assumptions regarding the
noradrenaline: adrenaline ratio. Furthermore, the criteria used to define successful adrenal venous
cannulation is either not stated or based on sub-optimal criteria e.g. venography.
An adrenal venous noradrenaline: adrenaline ratio exceeding one has previously been suggested to
be pathological (Newbould et al. 1991) because adrenaline is the predominant adrenal
catecholamine (Wurtman & Axelrod 1965) and that an excess of noradrenaline is therefore
pathological. This assertion, however has limited normative data to support it and was based on
data from only three patients with phaeochromocytoma and five without (Newbould et al. 1991).
This previously proposed cut-off is close to what was observed in the PA cohort presented in this
chapter, particularly on the left.
In all phaeochromocytoma patients presented, the noradrenaline: adrenaline ratio significantly
exceeded these specified cut-offs (1.21 on the left, 1.04 on the right). This was also the case in the
five previously reported cases in which it was possible to calculate the adrenal venous
noradrenaline: adrenaline ratio (minimum ratio 2.1) (Davies et al. 1979; Nobin et al. 1982). Four of
the 18 patients with non-phaeochromocytoma adrenal conditions in the Mayo cohort underwent an
adrenalectomy on the basis of an adrenal vein noradrenaline: adrenaline ratio exceeding one (Freel
et al. 2010). In none of these instances was a phaeochromocytoma diagnosed histologically and this
has been used as an argument against the use of AVS in the diagnosis of phaeochromocytoma.
However, it could be argued that this approach was inappropriate and unnecessary as all of the
patients had normal urinary metanephrines and so the diagnosis of phaeochromocytoma was
effectively excluded.
It should be noted that the bulk of the published literature surrounding venous sampling for the
diagnosis of phaeochromocytoma heralds from a time when cross-sectional and nuclear medicine
imaging quality and availability were much more limited than in contemporary practice. As a result
AVS has a more limited role in the diagnosis of phaeochromocytoma and paraganglioma than
243
previously. One situation in which it may still play a role is in patients with predisposing genetic
syndromes such as VHL and SDHx. Participation in modern screening programmes means that
catecholamine excess may be identified early, often in asymptomatic individuals who might have
bilateral radiological abnormalities. In this context, identification of a single adrenal gland as the
source of catecholamine excess would facilitate a unilateral adrenalectomy, postponing the need for
adrenal replacement therapy and its associated morbidity and mortality. Conversely, a secure
diagnosis of bilateral phaeochromocytoma would allow surgery at a single sitting. In the context of
bilateral disease or a predisposing syndrome, adrenal preserving surgery is an option, but long term
follow-up data are limited and there is a significant risk of recurrence (Grubbs et al. 2013) and a
more difficult second operation.
These benefits are illustrated by the cases of phaeochromocytoma presented here (Table 6.8). In the
patients with VHL, use of AVS either confirmed or refuted bilateral secretory disease and therefore
allowed all five individuals to have definitive and curative surgery in a single sitting. In the single non-
syndromic patient with bilateral adrenal abnormalities, AVS was utilised to confirm unilateral disease
and thus facilitated a curative surgical strategy that preserved her adrenal reserve. AVS has
previously been used in a 15 year-old with an SDHD mutation to inform a surgical approach that
allowed preservation of his left adrenal gland when a right phaeochromocytoma and a left
abdominal paraganglioma were resected (Srirangalingam et al. 2010).
An advantage of the use of the adrenal vein noradrenaline: adrenaline ratio is that it does not rely
on comparison with the contralateral adrenal gland, which, in the clinical settings outlines, has a
high pre-test probability of being abnormal. One disadvantage is the issue of a purely adrenaline
secreting phaeochromocytoma which would not be identified using the noradrenaline: adrenaline
ratio. However, such cases are rare, particularly within the context of VHL and SDHx (Srirangalingam
et al. 2008, 2009) and would be identified prior to AVS by urine and plasma catecholamine and
metanephrine analysis.. It should be noted that adrenaline secreting phaeochromocytoma are a
feature of both MEN2 and NF1 (Eisenhofer et al. 2011) and this should be borne in mind when
interpreting AVS results in these syndromes.
244
6.5 Summary
In summary, I have presented data from a large group of patients with PA and suggest that it could
serve as a reference interval for adrenal vein catecholamines in non-phaeochromocytoma patients.
We acknowledge that with advanced cross-sectional and nuclear medicine imaging, AVS is not
required in the routine diagnosis of phaeochromocytoma. However, in some patients with known
germline mutations of genes that predispose to the formation of phaeochromocytomas, screening
programs may detect the presence of bilateral radiological abnormalities (with or without abnormal
urine/plasma biochemistry) that present diagnostic difficulties. In such selected situations, AVS,
performed in an experienced centre and interpreted in the context of the reference intervals
presented here, remains a useful complementary tool for determining treatment strategies in this
challenging group of patients.

245
CHAPTER 7
Discussion and future work

246
This thesis has demonstrated that primary cilia loss is a feature of PPGLs and that ciliary loss is
associated with increased cellular proliferation and oncogenic alterations in cilia-mediated signalling.
Ciliary alterations are most pronounced in PPGLs in which hypoxic signalling is activated due to
increased ciliary disassembly through the AURKA/HDAC6 pathway. This demonstrates how cilia are
modified both by intrinsic cellular properties (e.g. cluster 1 gene mutations) as well as by the
extracellular environment (e.g. tissue hypoxia). In addition to hypoxia, we have presented evidence
that other features of the tumour microenvironment (e.g. catecholamines) modify primary cilia.
7.1 Primary cilia loss in cancer
7.1.1 Primary cilia loss in PPGLs
Primary cilia incidence has been examined in 17 tumour types in 27 published studies prior to this
one (Table 7.1). The observed prevalence of primary cilia in non-cancerous tissue varies widely
between tissues from <1% of lymphoid cells (Yasar et al. 2017) to over 90% of renal tubular cells
(Schraml et al. 2009). Whilst variation by tissue is expected, there is often significant discrepancy
within the same tissue in different studies. For example, over 90% of renal tubular cells were ciliated
in one study (Schraml et al. 2009) compared to a median of 5% in another (Basten et al. 2013). This
may partly be explained by the different methods of cilia identification employed, but it also raises
concerns around the issues of reproducibility and comparability. In the two studies mentioned
previously, cilia incidence in ccRCC was either a median of 0.41% or a mean of 7.8%, a figure higher
than cilia incidence in normal renal tubules in the other study (Schraml et al. 2009; Basten et al.
2013).
We found that primary cilia were present on 8.42 + 0.03% and 3.06 + 0.14% of cells of the adrenal
medulla and phaeochromocytomas respectively (Figure 4.1B). These incidences are in keeping with
those reported in other tissues and tumours (Table 7.1). Phaeochromocytomas consist of two main
cell populations: phaeochromocytes and sustentacular cells. We did not examine how tumoural cilia
were distributed between these cell subpopulations and this could provide additional insight into
the functional role of primary cilia in phaeochromocytomas. In pancreatic cancer, tumour-associated
stromal cells retain cilia whilst they are lost from tumoural cells; this divergence plays a vital role in
mediating paracrine Hh signalling (Bailey et al. 2009; Schimmack et al. 2016).
A gradient of cilia loss from normal to pre-invasive lesion to cancer is seen in melanoma (Kim et al.
2011b; Snedecor et al. 2015), breast (Menzl et al. 2014), prostate (Hassounah et al. 2013) and
pancreatic (Schimmack et al. 2016) cancer. This finding suggests, in these tumours at least, that cilia

247
are lost early in tumour development. Progressive cilia loss is seen in metastatic melanoma
(Snedecor et al. 2015) suggesting an ongoing role in tumourigenesis, although this association is not
universal and in pancreatic cancer ciliary presence is associated with metastatic risk (Emoto et al.
2014). Insight into the timing of ciliary loss in PPGLs is prevented by the lack of a precursor lesion
(Korpershoek et al. 2014) and the absence of metastatic disease in the studied cohort. VHL
haploinsufficiency alone in normal adrenal medulla was insufficient to result in ciliary changes
(Figure 4.2A&B).
Ciliary incidence can be markedly different between histological subtypes of medulloblastomas (Han
et al. 2009), craniopharyngiomas (Coy et al. 2016), breast (Menzl et al. 2014) and thyroid (Lee et al.
2016) cancer. Whilst histological subtypes of PPGLs are of scant clinical relevance (Tischler &
deKrijger 2015), distinct subtypes of PPGLs are defined by their genetic and molecular characteristics
(Fishbein et al. 2017). We observed that ciliary loss was most pronounced in tumours arising in
patients with cluster 1 mutations (Figure 4.2) suggesting that cilia could potentially segregate PPGL
clusters. A more comprehensive analysis of this is limited by the reliance on clinical genetic testing,
meaning only 60% of germline statuses were ascertained. Furthermore, somatic mutation status was
unknown in all cases and would be vital to be able to correlate tumoural cilia to the recently
described ‘Wnt altered’ PPGL subtype (Fishbein et al. 2017).
Ciliary loss has now been established in two VHL-associated tumours: PPGL (this thesis) and ccRCC
(Schraml et al. 2009; Basten et al. 2013). Whether it is a conserved feature across other VHL-
associated pathologies remains to be answered. This could potentially be investigated in other VHL-
associated tumours, for example pancreatic NETs and haemangioblastomas.
Despite the importance of ciliary length as a readout for function (Thompson et al. 2016) only three
studies have attempted to measure cilia length in human cancers with varying results (Table 7.1).
Cilia length was reduced in prostate cancer cells (Hassounah et al. 2013), unchanged in breast cancer
(Menzl et al. 2014) and varied depending on thyroid cancer subtype (Lee et al. 2016). All three
studies used dual-labelled immunofluorescence on formalin fixed paraffin embedded tumour
specimens followed by confocal microscopy to identify and measure cilia, although it is unclear
whether length was measured from individual z-slices or from MIPs. Ciliary length was longer in
phaeochromocytomas and normal adrenal medulla (1.48μm + 0.34, 2.02μm + 0.39) compared to
prostate (median 0.93μm, 1.2μm) and breast (median 0.9μm, 1.2μm) respectively. It is unclear if this
is a real biological difference or a result of measurement techniques.
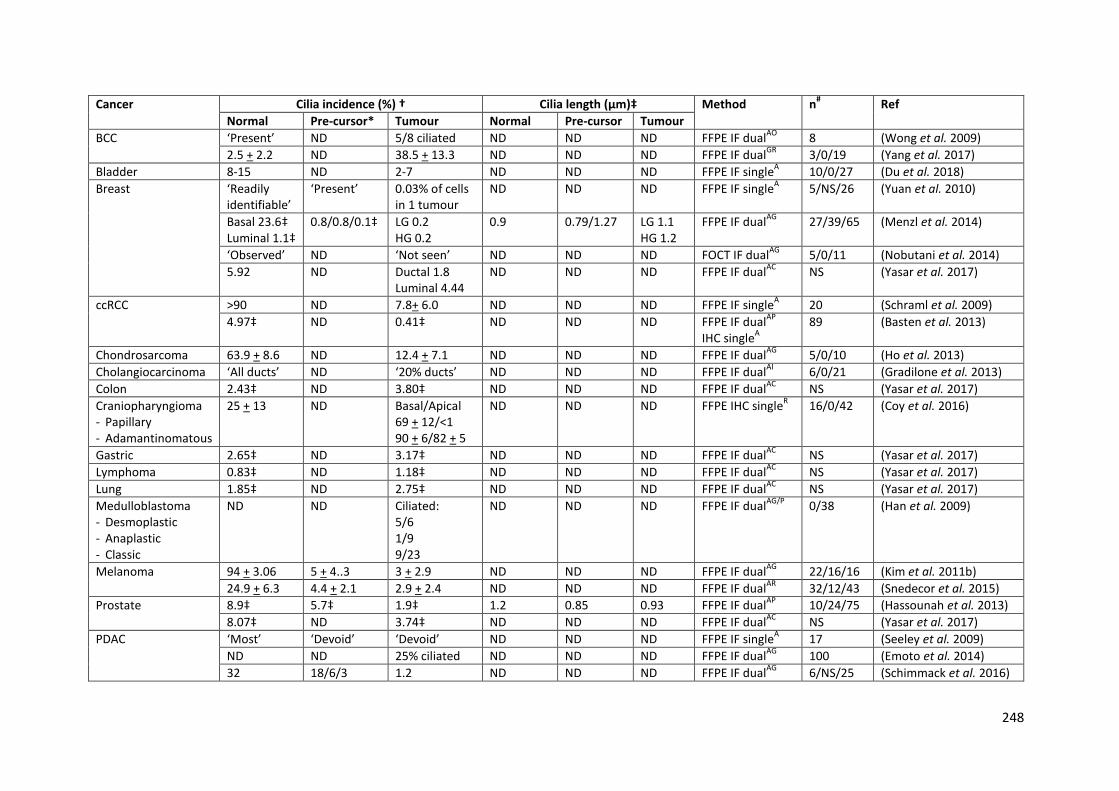
248
Cancer Cilia incidence (%) † Cilia length (μm)‡ Method n# Ref
Normal Pre-cursor* Tumour Normal Pre-cursor Tumour
BCC ‘Present’ ND 5/8 ciliated ND ND ND FFPE IF dualAO
8 (Wong et al. 2009)
2.5 + 2.2 ND 38.5 + 13.3 ND ND ND FFPE IF dualGR
3/0/19 (Yang et al. 2017)
Bladder 8-15 ND 2-7 ND ND ND FFPE IF singleA 10/0/27 (Du et al. 2018)
Breast ‘Readily identifiable’
‘Present’ 0.03% of cells in 1 tumour
ND ND ND FFPE IF singleA 5/NS/26 (Yuan et al. 2010)
Basal 23.6‡ Luminal 1.1‡
0.8/0.8/0.1‡ LG 0.2 HG 0.2
0.9 0.79/1.27 LG 1.1 HG 1.2
FFPE IF dualAG
27/39/65 (Menzl et al. 2014)
‘Observed’ ND ‘Not seen’ ND ND ND FOCT IF dualAG
5/0/11 (Nobutani et al. 2014)
5.92 ND Ductal 1.8 Luminal 4.44
ND ND ND FFPE IF dualAC
NS (Yasar et al. 2017)
ccRCC >90 ND 7.8+ 6.0 ND ND ND FFPE IF singleA 20 (Schraml et al. 2009)
4.97‡ ND 0.41‡ ND ND ND FFPE IF dualAP
IHC single
A
89 (Basten et al. 2013)
Chondrosarcoma 63.9 + 8.6 ND 12.4 + 7.1 ND ND ND FFPE IF dualAG
5/0/10 (Ho et al. 2013)
Cholangiocarcinoma ‘All ducts’ ND ‘20% ducts’ ND ND ND FFPE IF dualAI
6/0/21 (Gradilone et al. 2013)
Colon 2.43‡ ND 3.80‡ ND ND ND FFPE IF dualAC
NS (Yasar et al. 2017)
Craniopharyngioma - Papillary - Adamantinomatous
25 + 13 ND Basal/Apical 69 + 12/<1 90 + 6/82 + 5
ND ND ND FFPE IHC singleR 16/0/42 (Coy et al. 2016)
Gastric 2.65‡ ND 3.17‡ ND ND ND FFPE IF dualAC
NS (Yasar et al. 2017)
Lymphoma 0.83‡ ND 1.18‡ ND ND ND FFPE IF dualAC
NS (Yasar et al. 2017)
Lung 1.85‡ ND 2.75‡ ND ND ND FFPE IF dualAC
NS (Yasar et al. 2017)
Medulloblastoma - Desmoplastic - Anaplastic - Classic
ND ND Ciliated: 5/6 1/9 9/23
ND ND ND FFPE IF dualAG/P
0/38 (Han et al. 2009)
Melanoma 94 + 3.06 5 + 4..3 3 + 2.9 ND ND ND FFPE IF dualAG
22/16/16 (Kim et al. 2011b)
24.9 + 6.3 4.4 + 2.1 2.9 + 2.4 ND ND ND FFPE IF dualAR
32/12/43 (Snedecor et al. 2015)
Prostate 8.9‡ 5.7‡ 1.9‡ 1.2 0.85 0.93 FFPE IF dualAP
10/24/75 (Hassounah et al. 2013)
8.07‡ ND 3.74‡ ND ND ND FFPE IF dualAC
NS (Yasar et al. 2017)
PDAC ‘Most’ ‘Devoid’ ‘Devoid’ ND ND ND FFPE IF singleA 17 (Seeley et al. 2009)
ND ND 25% ciliated ND ND ND FFPE IF dualAG
100 (Emoto et al. 2014)
32 18/6/3 1.2 ND ND ND FFPE IF dualAG
6/NS/25 (Schimmack et al. 2016)

249
5.26‡ ND 7.0‡ ND ND ND FFPE IF dualAC
NS (Yasar et al. 2017)
pRCC >90% ND 44.3 + 22.3 ND ND ND FFPE IF singleA 9 (Schraml et al. 2009)
Thyroid - PTC - Oncocytic - Hürtle cell
67.8 + 3.6 ND 68.7 + 11.7 17.6 + 11.7 4.4 + 2.2
NS ND ‘Longer’ ‘Shorter’ NS
FFPE IF dualAR
5/0/20 (Lee et al. 2016)
Phaeochromocytoma 8.42 + 0.03 ND 3.06 + 0.14 2.02 + 0.39 ND 1.48 + 0.34
FOCT IF dualAR
27/0/47 This thesis
Table 7.1: Primary cilia prevalence and length in human tumours
† mean + standard deviation, ‡ median, # when in form -/-/- represents n for normal/precursor lesion/cancer respectively, * when in form -/-/- represents
increasing grades of pre-cursor lesion
BCC – basal cell carcinoma, ccRCC – clear cell renal cell carcinoma, PDAC – pancreatic ductal adenocarcinoma, pRCC – papillary renal cell carcinoma, PTC –
papillary thyroid carcinoma, ND – not done, NS – not stated, LG – low grade, HG – high grade, FFPE – formalin fixed paraffin embedded, IF –
immunofluorescence, IHC – immunohistochemistry, FOCT – frozen in OCT, A – anti-acetylated α-tubulin, G – anti-gamma tubulin, P –anti-pericentrin, R –
anti-Arl13b, I – anti-IFT88, C – anti-CCROC, O – anti-rootetin.
250
7.1.2 Experimental considerations
The major barrier to examining the role of primary cilia in cancer is the difficulty in identifying them.
Primary cilia are small and singular and are not readily visible by standard widefield light microscopy
as their diameter, at approximately 0.2μm, approaches its limit of resolution. Furthermore, the
entire axoneme would need to lie within a single focal plane – and whilst this may occur within the
confines of a 2D cell monolayer – it is less likely within a 3D tissue section. Therefore, alternative
approaches to visualise and measure primary cilia are required and are particularly relevant when
considering tissue sections.
EM provides a superior limit of resolution (better than 50pm) to light microscopy due to the
shortened wavelength of electrons compared to photons and can provide incredible levels of detail
and ultrastructural information. This however requires very thin section (around 100nm) meaning
the entire ciliary axoneme is rarely captured within a single section, estimated at only 1 in 200
ciliated cells (Farnum & Wilsman 2011). This combined with the time and resource intensive nature
of EM severely limits its throughput and it has not gained an established role in large scale ciliary
measurement.
Confocal microscopy uses point illumination and a pinhole in an optically conjugate plane to
eliminate out-of-focus light. This results in improved optical resolution and contrast and reduction of
background fluorescence. In addition, serial optical sections can be collected from thick specimens,
allowing the reconstruction of 3D structures. These qualities, alongside its relative ease of use and
specimen preparation and relatively short imaging time mean that confocal microscopy is well suited
to the identification of large numbers of cilia. This is reflected by the fact that it is the imaging
modality of choice for determination of primary cilia in tumour sections (Table 7.1).
One significant shortcoming of confocal microscopy is its inaccuracy in the z-dimension. This occurs
because the point spread function of the pinhole is ellipsoid and thus much longer in the z-
dimension than in the xy-dimension. This has important implications for imaging 3D structures that
are not in a single plane of focus and is particularly pertinent to measuring primary cilia length in
tissue sections. Various approaches to limit this problem have been employed.
Maximum intensity projections (MIPs) are 2D representations created by image processing of the
original 3D image. They are fast and straightforward to create but can result in shortening of objects
not in a single xy plane (Figure 7.1). This technique significantly underestimated synthetic microfiber
length in agarose gel as a model of primary cilia, but at lengths (18 and 50μm) that are not

251
biologically relevant (Saggese et al. 2012). When primary cilia themselves were imaged, no
significant difference in length was seen in chondrocytes (mean length 1.9μm); however MIPs
significantly underestimated length in the longer cilia of renal epithelial cells (mean length 2.2μm)
(Saggese et al. 2012). This study looked at the entire cilia population and did not differentiate those
that were within a single focal plane or those that crossed many. This subpopulation of cilia would
be predicted to have the greater inaccuracy in length measurement using the MIP method.
Consideration of cilia orientation as either ‘flat’ or ‘angled’ based on the number of z-slices they
crossed found that ‘angled’ cilia were significantly shorter than ‘flat’ cilia in mouse embryonic
endothelial cells (mean length 3.28μm) (Dummer et al. 2016). A practical approach to this problem
can be to simply exclude cilia that are not in a single focal plane. However, this introduces sample
bias and reduces population size – a potentially significant problem in tumour sections in which
primary cilia may be infrequent and variably orientated.
The main limitation of using MIPs is the loss of depth information from the original dataset. This can
be addressed by application of an adaptation of Pythagoras’ Theorem (PyT) a2 = b2 + c2 in which a is
the cilia length on MIP, b is a measure of the depth based on the thickness and number of Z stacks
the object traverses and c is the actual length. This approach maintains throughput and is readily
and easily calculable using open source software. Although an improvement on MIP for calculation
of angled cilia length in mouse embryonic endothelial cells, cilia length remain underestimated
(Dummer et al. 2016). This is a result of the fact that it does not address the issues of optical
distortion in the z-dimension or of a non-linear cilium, which requires a more sophisticated
approach.
Deconvolution is a digital filtering technique that aims to reduce optical distortion resulting from the
point spread function of the system. Its application to raw images reduces out-of-focus light and
improves contrast and resolution, but significant xz axial smear remains (Saggese et al. 2012). This
can be further addressed by employment of Gaussian blurring, which reduces optical distortion by
approximating the z axis optical point spread function to a Gaussian distribution such that the xy
resolution approximates the z resolution and thus the previously smeared point spread function
becomes spherical. Skeletonization is a digital image processing technique by which a central line
skeleton is created of a three dimensional object allowing direct measurement. When combined
with deconvolution and Gaussian blurring, this technique accurately measures microfibers of known
length. A direct comparison with MIPs did not find a significant difference in chondrocyte cilia (1.8 v
1.9μm), but did in the longer renal epithelial cilia (1.4 v 2.2μm) (Saggese et al. 2012).
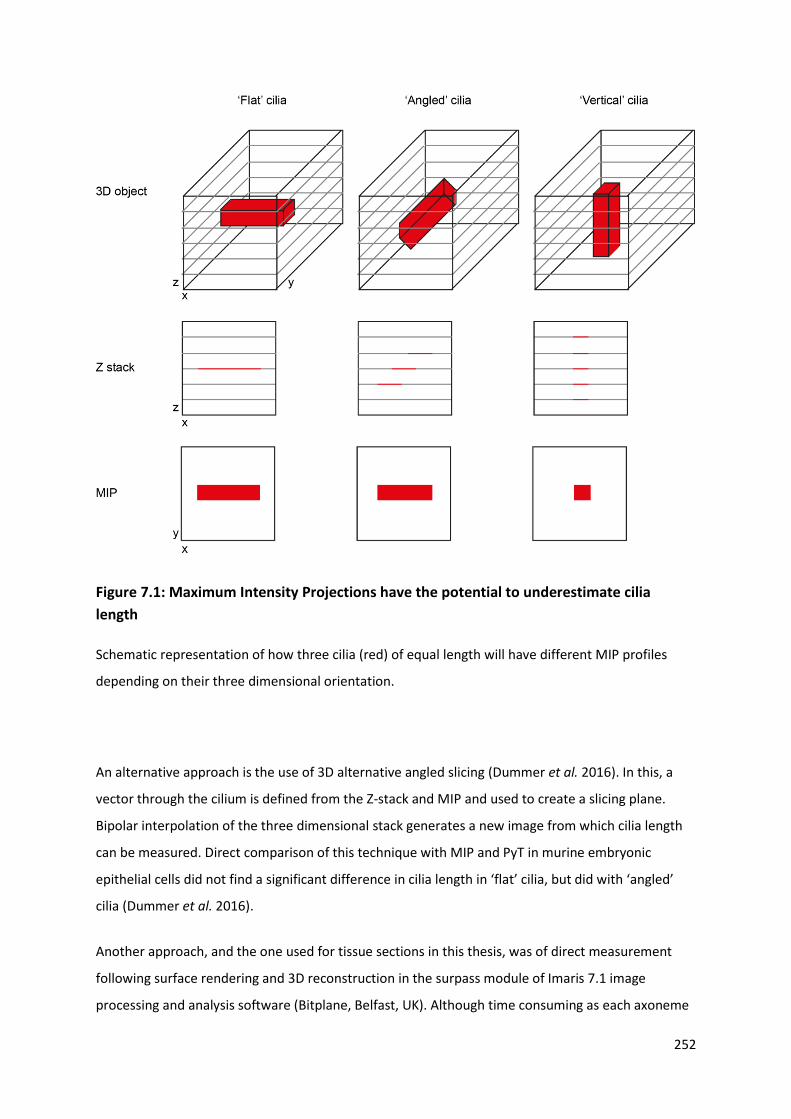
252
Figure 7.1: Maximum Intensity Projections have the potential to underestimate cilia
length
Schematic representation of how three cilia (red) of equal length will have different MIP profiles
depending on their three dimensional orientation.
An alternative approach is the use of 3D alternative angled slicing (Dummer et al. 2016). In this, a
vector through the cilium is defined from the Z-stack and MIP and used to create a slicing plane.
Bipolar interpolation of the three dimensional stack generates a new image from which cilia length
can be measured. Direct comparison of this technique with MIP and PyT in murine embryonic
epithelial cells did not find a significant difference in cilia length in ‘flat’ cilia, but did with ‘angled’
cilia (Dummer et al. 2016).
Another approach, and the one used for tissue sections in this thesis, was of direct measurement
following surface rendering and 3D reconstruction in the surpass module of Imaris 7.1 image
processing and analysis software (Bitplane, Belfast, UK). Although time consuming as each axoneme

253
is individually traced, it ensures accuracy of identification of primary cilia whilst minimising data loss
in the vertical dimension. For 2D culture, the higher throughput MIP method was utilised as PC12,
MPC and MTT cell primary cilia are predominantly basal (Figure 4.9A).
7.1.3 Primary cilia loss contributes to tumourigenesis in PPGLs
Whether changes in primary cilia in cancer are causative or merely a consequence remains an area
of debate and was a focus for investigation in this thesis.
The association between primary cilia and stages of the cell cycle has direct relevance to cellular
proliferation, which is one component of tumourigenesis, but does not help to answer this question.
No association between the proliferation marker Ki67 and primary cilia was observed in either
breast (Menzl et al. 2014) or prostate (Hassounah et al. 2013) cancer and the authors suggested that
this provided evidence that ciliary changes were not simply related to cellular division. We found
that ciliary loss was correlated with a higher Ki67 index, using a clinically relevant cut-off (Figure 4.3).
This suggests that in PPGLs, cilia loss is related to increased proliferation but does not provide
evidence to address the directionality of this relationship. Similarly, alterations in cilia-associated
signalling pathways (Figure 4.5) support the observed differences in cilia between
phaeochromocytomas and the adrenal medulla but do not resolve this issue.
Loss of primary cilia in PC12 cells, achieved through two distinct mechanisms, results in increased
cellular proliferation (Figure 4.10) suggesting that primary cilia loss contributes to, and is not merely
a side effect of, proliferation. This is consistent with the observed effects of Ift88 loss in kidney
(Delaval et al. 2011) and pancreas cells (Cano et al. 2004). Although IFT88 has cilia-independent
functions (Boehlke et al. 2015), the same results were observed following Cep164 knockdown
suggesting a cilia-mediated effect. Further evidence for cilia loss contributing to tumourigenesis is
presented in the pro-oncogenic transcriptional changes observed following Ift88 knockdown (Figure
4.11).
Ciliopathies have not traditionally been associated with an increased rate of malignancy; this has
been used to argue against a role of primary cilia in tumourigenesis. However, this assertion may not
be entirely accurate. A large observational study of patients with ADPKD, the most common
ciliopathy, found an increased rate of renal, liver and colon cancer in ADPKD patients compared to
matched controls (Yu et al. 2016). In addition, malignancy rates may be underestimated in ciliopathy
patients due to a combination of their reduced life expectancy and associated intellectual disability
reducing diagnosis rates.
254
7.2 Primary cilia and the tumour microenvironment
Primary cilia, through their cellular location and responsiveness to extracellular stimuli, appear ideal
candidate organelles to sense and interact with the complex and multi-faceted tumour
microenvironment (Balkwill et al. 2012). Hypoxia is a central component of the tumour
microenvironment in general and hypoxic signalling is of particular importance in the pathogenesis
of cluster 1 PPGLs.
We have shown that hypoxia reduces cilia incidence and length in PPGL cells (Figures 5.1 & 5.3) in a
process that is dependent on HIF-signalling (Figures 5.4 & 5.5) and the AURKA/HDAC6 ciliary
disassembly pathway (Figure 5.6). Although the response of primary cilia to hypoxia is variable and
tissue dependent (summarised in Table 5.1), it is consistent in all three available
phaeochromocytoma cell lines examined. That all three contain mutations in cluster 2 PPGL-
predisposing genes (Hopewell & Ziff 1995; Powers et al. 2000), in which hypoxic signalling is not a
salient feature, is intriguing and demonstrates a role for primary cilia in PPGL pathogenesis beyond
cluster 1 tumours.
Pseudohypoxia, achieved through loss of function of the cluster 1 PPGL-predisposing genes SDH
(Figure 5.8 & 5.10), FH (Figure 5.12 & 5.13) and VHL (Figure 5.14), resulted in the same pattern of
ciliary loss and shortening as observed with hypoxia itself. This is consistent with the observations in
cluster 1 tumours (Figure 4.2) and although there were no known FH cases in the tested cohort, it
would be reasonable to predict that this is a shared feature of cluster 1 PPGLs. It raises the question
as to whether SDH, like VHL, might be considered a ciliopathy, particularly in view of its association
with GISTs, a tumour type in which cilia-mediated signalling pathways (e.g. Wnt and PDGFRα) are
important molecular drivers (Janeway et al. 2011; Tang et al. 2016). This, however, remains to be
proved.
In PC12 cells, VHL loss resulted in ciliary loss through HIF and AURKA/HDAC6 dependent mechanisms
(Figure 5.17). We also observed that hypoxia itself caused a re-distribution of pVHL out of the cilia,
potentially priming it for disassembly (Figure 5.15). This microtubule stabilising function of pVHL
(Okuda et al. 1999; Hergovich et al. 2003, 2006; Schermer et al. 2006; Lolkema et al. 2007) could
potentially explain the development of PPGL in type 2C VHL in which regulation of HIF degradation is
unimpaired (Knauth et al. 2009; McNeill et al. 2009). Further work to address whether there is a
genotype-phenotype relationship with respect to primary cilia within VHL-associated PPGLs would
be mechanistically informative.

255
A proposed model to illustrate how hypoxia and pseudohypoxia might result in changes in primary
cilia and tumourigenesis in PPGLs is depicted in Figure 7.2.
Figure 7.2: Schematic demonstrating the potential role of primary cilia in PPGLs
Model illustrating the potential pathway from pseudohypoxia-induced cilia loss to increased cell
proliferation and dysregulation of tumourigenesis relevant cilia-mediated signalling pathways in
PPGLs. Proteins where germline mutations in the associated gene predispose to PPGL are in orange.
AuroraA Aurora-A kinase α-KG α-ketoglutarate FH fumarate hydratase, H6 histone deacetylase 6, HIF
hypoxia-inducible factor, OH hydroxyl group, P phosphate group, PHD prolyl hydroxylase, SDH
succinate dehydrogenase, VHL von Hippel-Lindau.

256
Catecholamines, the vasoactive secretory product of PPGLs, are at their highest concentrations in
PPGLs. However, little is known about whether this specific feature of the PPGL tumour
microenvironment plays any role in its tumour biology. We found that adrenaline, noradrenaline and
dopamine all promoted ciliary formation in vitro (Figures 5.21, 5.24 & 5.25) and that this effect was
also seen with metanephrine in vivo (Figure 5.19).The responsible mechanism appears to be β-
adrenoceptor mediated (Figures 5.22 & 5.23), consistent with the ciliary localisation of this receptor
in other neural-derived tissue (Yao et al. 2016), although how this results in cilia elongation has yet
to be determined.
Unlike hypoxia, catecholamines are a specific feature of the PPGL tumour microenvironment, and so
the generalisability to other tumour types is less apparent. However, adrenaline increases ciliary
length in pancreatic ductal adenocarcinoma cells (Khan et al. 2016) and α1-adrenoceptor stimulation
results in increased proliferation of prostate cancer cells (Thebault et al. 2006). How the ciliary effect
of catecholamines interacts with other features of the tumour microenvironment which impact on
primary cilia, including hypoxia, is not known.
Looking beyond cancer, the primary function of catecholamines is in regulating cardiac output
(Figure 2.3). Primary cilia act as mechanosensors in vascular endothelium (Nauli et al. 2008) and are
lost in areas of high blood flow (Van der Heiden et al. 2008). Flow-induced ciliary bending results in
cytoskeletal deformation and cellular calcium influx via ciliary-localised polycystins (Talbot et al.
2011). Furthermore, vascular endothelial primary cilia are linked with other modulators of vascular
tone including nitric oxide and dopamine signalling (Johns et al. 1984). The effect of catecholamines
on primary cilia in other organs has yet to be investigated with vascular endothelium being of
particular interest.
Although somatostatin is not a particular feature of the tumour microenvironment, SSTRs are widely
and variably expressed in PPGLs (Kubota et al. 1994; Unger et al. 2008; Elston et al. 2015) and have
diagnostic (Taïeb et al. 2012) and therapeutic (Kong et al. 2017) roles. It is interesting therefore that
SSTR activation promotes ciliogenesis in PC12 cells (Figure 5.27). Although this is an early
observation with an unknown mechanism, a previous report in a rodent model of PKD suggests that
ciliary elongation by SSAs reduced hepatic cyst formation (Lorenzo Pisarello et al. 2018).
Taken together, it is apparent that multiple intrinsic and extrinsic factors impact on PPGL primary
cilia and that ciliary loss contributes to tumourigenesis. What remains to be resolved, and is the next
stage of enquiry, is whether manipulation of primary cilia in vivo alters the natural history of the
disease as it does for other cancers (Xiang et al. 2017).
257
7.3 Adrenal venous sampling in the diagnosis of phaeochromocytomas
The biochemical diagnosis of functional PPGLs is relatively straightforward, once the condition is
suspected, due to the excellent sensitivity and specificity of urine and plasma metanephrine
measurement (Raber et al. 2000; Lenders et al. 2002, 2014). Once catecholamine excess is
confirmed, modern cross-sectional and nuclear medicine imaging techniques localise PPGLs in
almost all cases (Jalil et al. 1998; Lumachi et al. 2006; Rufini et al. 2011; Gabriel et al. 2013), meaning
additional localisation techniques are rarely required. This is particularly the case with sporadic and
symptomatic disease.
However, the existence of bilateral adrenal lesions can complicate the diagnostic process and has
significant therapeutic implications as surgery on the incorrect side could result in hypoadrenalism
and its consequent risks. This situation generally arises in the context of patients with a genetic
predisposition to PPGL development who are enrolled in screening programmes aiming to diagnose
small, pre-symptomatic PPGLs when the risk of disseminated disease is lower (Maher et al. 2011;
Jasperson et al. 2014). In this circumstance, imaging may not be able to confidently define which
lesion(s) are phaeochromocytomas and thus there is a potential role for a technique that could assist
with anatomical localisation in cases which are unclear following a conventional imaging approach.
AVS has been used as a technique in PPGL localisation, although its utilisation has dramatically fallen
as imaging quality has improved. In addition to being an invasive procedure, a lack of normative data
to assist interpretation has led to uncertainty in the field (Freel et al. 2010).
We have presented reference intervals for side-specific adrenal venous catecholamine
concentrations in patients without PPGL (Table 6.7). Using the 97.5th centile as a cut off, there was a
0% false negative rate in six PPGL patients who underwent AVS (Figure 6.7). Five of these patients
had VHL (Table 6.8), highlighting the utility of AVS in this syndrome. Whilst it remains unusual for
PPGL localisation not to be resolved by imaging, these data facilitate a more robust approach to
interpreting AVS for catecholamines.
Having specified a diagnostic cut-off, future work will evaluate its efficacy in a separate cohort of PA
patients who underwent AVS between 2015 and 2019 to define the false positive and false negative
rates.

258
7.4 Summary
We have demonstrated that primary cilia loss is a feature of human PPGLs and in particular those
with cluster 1 gene mutations; this is the first description of primary cilia in PPGLs. Activation of
hypoxic signalling in a phaeochromocytoma-derived cell line through a multitude of disease-relevant
mechanisms results in primary cilia loss in a HIF- and AURKA/HDAC6-dependent manner. Primary
cilia loss in these cells is associated with increased cellular proliferation and oncogenic
transcriptional alterations. Together these results suggest that cilia loss in PPGLs contributes to
tumourigenesis and is a potential target for therapeutic intervention.
We have also shown that catecholamines, another feature of the PPGL tumour microenvironment,
and SSAs, an existing PPGL therapeutic option, modulate primary cilia. This suggests that other
features of the tumour microenvironment might also impact on primary cilia, which could be
considered an integrative organelle for these multiple inputs.
Finally, we have presented normative data for adrenal venous catecholamine concentrations to
allow their interpretation in instances when PPGL localisation is uncertain via standard techniques.

259
References
Abdul-Majeed S & Nauli SM 2011 Dopamine receptor type 5 in the primary cilia has dual chemo- and mechano-sensory roles. Hypertension 58 325–331.
Abdul-Majeed S, Moloney BC & Nauli SM 2012 Mechanisms regulating cilia growth and cilia function in endothelial cells. Cellular and Molecular Life Sciences 69 165–173.
Abermil N, Guillaud-Bataille M, Burnichon N, Venisse A, Manivet P, Guignat L, Drui D, Chupin M, Josseaume C, Affres H et al. 2012 TMEM127 Screening in a Large Cohort of Patients with Pheochromocytoma and/or Paraganglioma. The Journal of Clinical Endocrinology & Metabolism 97 E805–E809.
Adams M, Simms RJ, Abdelhamed Z, Dawe HR, Szymanska K, Logan C V., Wheway G, Pitt E, Gull K, Knowles MA et al. 2012 A meckelin–filamin A interaction mediates ciliogenesis. Human Molecular Genetics 21 1272–1286.
Agarwal G, Sadacharan D, Aggarwal V, Chand G, Mishra A, Agarwal A, Verma AK & Mishra SK 2012 Surgical management of organ-contained unilateral pheochromocytoma: comparative outcomes of laparoscopic and conventional open surgical procedures in a large single-institution series. Langenbeck’s Archives of Surgery 397 1109–1116.
Albers J, Rajski M, Schönenberger D, Harlander S, Schraml P, von Teichman A, Georgiev S, Wild PJ, Moch H, Krek W et al. 2013 Combined mutation of Vhl and Trp53 causes renal cysts and tumours in mice. EMBO Molecular Medicine 5 949–964.
Algeciras-Schimnich A, Preissner CM, Young WF, Singh RJ & Grebe SKG 2008 Plasma chromogranin A or urine fractionated metanephrines follow-up testing improves the diagnostic accuracy of plasma fractionated metanephrines for pheochromocytoma. The Journal of Clinical Endocrinology and Metabolism 93 91–95.
Alieva IB, Gorgidze LA, Komarova YA, Chernobelskaya OA & Vorobjev IA 1999 Experimental model for studying the primary cilia in tissue culture cells. Membrane & Cell Biology 12 895–905.
Allison DJ, Brown MJ, Jones DH & Timmis JB 1983 Role of venous sampling in locating a phaeochromocytoma. British Medical Journal (Clinical Research Ed.) 286 1122–1124.
Amar L, Baudin E, Burnichon N, Peyrard S, Silvera S, Bertherat J, Bertagna X, Schlumberger M, Jeunemaitre X, Gimenez-Roqueplo A-P et al. 2007 Succinate dehydrogenase B gene mutations predict survival in patients with malignant pheochromocytomas or paragangliomas. The Journal of Clinical Endocrinology and Metabolism 92 3822–3828.
Amati B, Brooks MW, Levy N, Littlewood TD, Evan GI & Land H 1993a Oncogenic activity of the c-Myc protein requires dimerization with Max. Cell 72 233–245.
Amati B, Littlewood TD, Evan GI & Land H 1993b The c-Myc protein induces cell cycle progression and apoptosis through dimerization with Max. The EMBO Journal 12 5083–5087.
Amin C, Wagner AJ & Hay N 1993 Sequence-specific transcriptional activation by Myc and repression by Max. Molecular and Cellular Biology 13 383–390.
Anand S, Penrhyn-Lowe S & Venkitaraman AR 2003 AURORA-A amplification overrides the mitotic spindle assembly checkpoint, inducing resistance to Taxol. Cancer Cell 3 51–62.
Anders S & Huber W 2010 Differential expression analysis for sequence count data. Genome Biol 11

260
R106.
Andrews KA, Ascher DB, Pires DEV, Barnes DR, Vialard L, Casey RT, Bradshaw N, Adlard J, Aylwin S, Brennan P et al. 2018 Tumour risks and genotype–phenotype correlations associated with germline variants in succinate dehydrogenase subunit genes SDHB , SDHC and SDHD. Journal of Medical Genetics 55 384–394.
Ansley SJ, Badano JL, Blacque OE, Hill J, Hoskins BE, Leitch CC, Chul Kim J, Ross AJ, Eichers ER, Teslovich TM et al. 2003 Basal body dysfunction is a likely cause of pleiotropic Bardet–Biedl syndrome. Nature 425 628–633.
Arias-Stella J & Bustos F 1976 Chronic hypoxia and chemodectomas in bovines at high altitudes. Archives of Pathology & Laboratory Medicine 100 636–639.
Arias-Stella J & Valcarcel J 1976 Chief cell hyperplasia in the human carotid body at high altitudes; physiologic and pathologic significance. Human Pathology 7 361–373.
Asante D, Stevenson NL & Stephens DJ 2014 Subunit composition of the human cytoplasmic dynein-2 complex. Journal of Cell Science 127 4774–4787.
Askew DS, Ashmun RA, Simmons BC & Cleveland JL 1991 Constitutive c-myc expression in an IL-3-dependent myeloid cell line suppresses cell cycle arrest and accelerates apoptosis. Oncogene 6 1915–1922.
Astrom K, Cohen JE, Willett-Brozick JE, Aston CE & Baysal BE 2003 Altitude is a phenotypic modifier in hereditary paraganglioma type 1: evidence for an oxygen-sensing defect. Human Genetics 113 228–237.
Astuti D, Douglas F, Lennard TW, Aligianis IA, Woodward ER, Evans DGR, Eng C, Latif F & Maher ER 2001a Germline SDHD mutation in familial phaeochromocytoma. The Lancet 357 1181–1182.
Astuti D, Latif F, Dallol A, Dahia PL, Douglas F, George E, Sköldberg F, Husebye ES, Eng C & Maher ER 2001b Gene mutations in the succinate dehydrogenase subunit SDHB cause susceptibility to familial pheochromocytoma and to familial paraganglioma. American Journal of Human Genetics 69 49–54.
Avasthi P & Marshall WF 2012 Stages of ciliogenesis and regulation of ciliary length. Differentiation; Research in Biological Diversity 83 S30-42.
Avasthi P, Marley A, Lin H, Gregori-Puigjane E, Shoichet BK, von Zastrow M & Marshall WF 2012 A chemical screen identifies class a g-protein coupled receptors as regulators of cilia. ACS Chemical Biology 7 911–919.
Ayala-Ramirez M, Chougnet CN, Habra MA, Palmer JL, Leboulleux S, Cabanillas ME, Caramella C, Anderson P, Al Ghuzlan A, Waguespack SG et al. 2012 Treatment with sunitinib for patients with progressive metastatic pheochromocytomas and sympathetic paragangliomas. The Journal of Clinical Endocrinology and Metabolism 97 4040–4050.
Ayer DE, Kretzner L & Eisenman RN 1993 Mad: a heterodimeric partner for Max that antagonizes Myc transcriptional activity. Cell 72 211–222.
van Baars F, Cremers C, van den Broek P, Geerts S & Veldman J 1982 Genetic aspects of nonchromaffin paraganglioma. Human Genetics 60 305–309.
Baba Y, Nakajo M & Hayashi S 2013 Adrenal venous catecholamine concentrations in patients with

261
adrenal masses other than pheochromocytoma. Endocrine 43 219–224.
Bailey JM, Mohr AM & Hollingsworth MA 2009 Sonic hedgehog paracrine signaling regulates metastasis and lymphangiogenesis in pancreatic cancer. Oncogene 28 3513–3525.
Bailey KL, Bonasera SJ, Wilderdyke M, Hanisch BW, Pavlik JA, DeVasure J, Robinson JE, Sisson JH & Wyatt TA 2014 Aging causes a slowing in ciliary beat frequency, mediated by PKCε. American Journal of Physiology-Lung Cellular and Molecular Physiology 306 L584–L589.
Balkwill FR, Capasso M & Hagemann T 2012 The tumor microenvironment at a glance. Journal of Cell Science 125 5591–5596.
Barakat MT, Humke EW & Scott MP 2013 Kif3a is necessary for initiation and maintenance of medulloblastoma. Carcinogenesis 34 1382–1392.
Barnfield PC, Zhang X, Thanabalasingham V, Yoshida M & Hui C 2005 Negative regulation of Gli1 and Gli2 activator function by Suppressor of fused through multiple mechanisms. Differentiation; Research in Biological Diversity 73 397–405.
Basten SG, Willekers S, Vermaat JS, Slaats GG, Voest EE, van Diest PJ & Giles RH 2013 Reduced cilia frequencies in human renal cell carcinomas versus neighboring parenchymal tissue. Cilia 2 2.
Bausch B, Borozdin W, Neumann HPH & European-American Pheochromocytoma Study Group 2006 Clinical and Genetic Characteristics of Patients with Neurofibromatosis Type 1 and Pheochromocytoma. New England Journal of Medicine 354 2729–2731.
Bausch B, Borozdin W, Mautner VF, Hoffmann MM, Boehm D, Robledo M, Cascon A, Harenberg T, Schiavi F, Pawlu C et al. 2007 Germline NF1 Mutational Spectra and Loss-of-Heterozygosity Analyses in Patients with Pheochromocytoma and Neurofibromatosis Type 1. The Journal of Clinical Endocrinology & Metabolism 92 2784–2792.
Bausch B, Schiavi F, Ni Y, Welander J, Patocs A, Ngeow J, Wellner U, Malinoc A, Taschin E, Barbon G et al. 2017 Clinical Characterization of the Pheochromocytoma and Paraganglioma Susceptibility Genes SDHA , TMEM127 , MAX , and SDHAF2 for Gene-Informed Prevention. JAMA Oncology 3 1204–1212.
Bay SN, Long AB & Caspary T 2018 Disruption of the ciliary GTPase Arl13b suppresses Sonic hedgehog overactivation and inhibits medulloblastoma formation. Proceedings of the National Academy of Sciences 115 1570–1575.
Baysal BE, Ferrell RE, Willett-Brozick JE, Lawrence EC, Myssiorek D, Bosch A, van der Mey A, Taschner PE, Rubinstein WS, Myers EN et al. 2000 Mutations in SDHD, a mitochondrial complex II gene, in hereditary paraganglioma. Science (New York, N.Y.) 287 848–851.
Bellavia S, Dahan K, Terryn S, Cosyns J-P, Devuyst O & Pirson Y 2010 A homozygous mutation in INVS causing juvenile nephronophthisis with abnormal reactivity of the Wnt/beta-catenin pathway. Nephrology Dialysis Transplantation 25 4097–4102.
Benn DE, Gimenez-Roqueplo A-P, Reilly JR, Bertherat J, Burgess J, Byth K, Croxson M, Dahia PLM, Elston M, Gimm O et al. 2006 Clinical presentation and penetrance of pheochromocytoma/paraganglioma syndromes. The Journal of Clinical Endocrinology and Metabolism 91 827–836.
Benn DE, Robinson BG & Clifton-Bligh RJ 2015 15 YEARS OF PARAGANGLIOMA: Clinical manifestations of paraganglioma syndromes types 1–5. Endocrine-Related Cancer 22 T91–
262
T103.
Berbari NF, Lewis JS, Bishop GA, Askwith CC & Mykytyn K 2008a Bardet-Biedl syndrome proteins are required for the localization of G protein-coupled receptors to primary cilia. Proceedings of the National Academy of Sciences of the United States of America 105 4242–4246.
Berbari NF, Johnson AD, Lewis JS, Askwith CC & Mykytyn K 2008b Identification of ciliary localization sequences within the third intracellular loop of G protein-coupled receptors. Molecular Biology of the Cell 19 1540–1547.
Berbari NF, O’Connor AK, Haycraft CJ & Yoder BK 2009 The primary cilium as a complex signaling center. Current Biology : CB 19 R526-35.
Bergmann C, Fliegauf M, Brüchle NO, Frank V, Olbrich H, Kirschner J, Schermer B, Schmedding I, Kispert A, Kränzlin B et al. 2008 Loss of Nephrocystin-3 Function Can Cause Embryonic Lethality, Meckel-Gruber-like Syndrome, Situs Inversus, and Renal-Hepatic-Pancreatic Dysplasia. The American Journal of Human Genetics 82 959–970.
Bertout JA, Patel SA & Simon MC 2008 The impact of O2 availability on human cancer. Nature Reviews Cancer 8 967–975.
Besschetnova TY, Kolpakova-Hart E, Guan Y, Zhou J, Olsen BR & Shah J V. 2010 Identification of Signaling Pathways Regulating Primary Cilium Length and Flow-Mediated Adaptation. Current Biology 20 182–187.
Bhatia KSS, Ismail MM, Sahdev A, Rockall AG, Hogarth K, Canizales A, Avril N, Monson JP, Grossman AB & Reznek RH 2008 123I-metaiodobenzylguanidine (MIBG) scintigraphy for the detection of adrenal and extra-adrenal phaeochromocytomas: CT and MRI correlation. Clinical Endocrinology 69 181–188.
Bishop T, Lau KW, Epstein ACR, Kim SK, Jiang M, O’Rourke D, Pugh CW, Gleadle JM, Taylor MS, Hodgkin J et al. 2004 Genetic Analysis of Pathways Regulated by the von Hippel-Lindau Tumor Suppressor in Caenorhabditis elegans. PLoS Biology 2 e289.
Bishop GA, Berbari NF, Lewis J & Mykytyn K 2007 Type III adenylyl cyclase localizes to primary cilia throughout the adult mouse brain. The Journal of Comparative Neurology 505 562–571.
Bitgood MJ & McMahon AP 1995 HedgehogandBmpGenes Are Coexpressed at Many Diverse Sites of Cell–Cell Interaction in the Mouse Embryo. Developmental Biology 172 126–138.
Blackwell TK, Kretzner L, Blackwood EM, Eisenman RN & Weintraub H 1990 Sequence-specific DNA binding by the c-Myc protein. Science (New York, N.Y.) 250 1149–1151.
Blackwell TK, Huang J, Ma A, Kretzner L, Alt FW, Eisenman RN & Weintraub H 1993 Binding of myc proteins to canonical and noncanonical DNA sequences. Molecular and Cellular Biology 13 5216–5224.
Blake MA, Krishnamoorthy SK, Boland GW, Sweeney AT, Pitman MB, Harisinghani M, Mueller PR & Hahn PF 2003 Low-density pheochromocytoma on CT: a mimicker of adrenal adenoma. AJR. American Journal of Roentgenology 181 1663–1668.
Blank A, Schmitt AM, Korpershoek E, van Nederveen F, Rudolph T, Weber N, Strebel RT, de Krijger R, Komminoth P & Perren A 2010 SDHB loss predicts malignancy in pheochromocytomas/sympathethic paragangliomas, but not through hypoxia signalling. Endocrine-Related Cancer 17 919–928.

263
Boehlke C, Janusch H, Hamann C, Powelske C, Mergen M, Herbst H, Kotsis F, Nitschke R & Kuehn EW 2015 A Cilia Independent Role of Ift88/Polaris during Cell Migration. PLOS ONE 10 e0140378.
Boisvieux-Ulrich E, Laine MC & Sandoz D 1989 In vitro effects of taxol on ciliogenesis in quail oviduct. Journal of Cell Science 92 ( Pt 1) 9–20.
Boutros AR, Bravo EL, Zanettin G & Straffon RA 1990 Perioperative management of 63 patients with pheochromocytoma. Cleveland Clinic Journal of Medicine 57 613–617.
Bowers AJ & Boylan JF 2004 Nek8, a NIMA family kinase member, is overexpressed in primary human breast tumors. Gene 328 135–142.
Brandi ML, Gagel RF, Angeli A, Bilezikian JP, Beck-Peccoz P, Bordi C, Conte-Devolx B, Falchetti A, Gheri RG, Libroia A et al. 2001 Guidelines for diagnosis and therapy of MEN type 1 and type 2. The Journal of Clinical Endocrinology and Metabolism 86 5658–5671.
Brauch H, Kishida T, Glavac D, Chen F, Pausch F, Höfler H, Latif F, Lerman MI, Zbar B & Neumann HP 1995 Von Hippel-Lindau (VHL) disease with pheochromocytoma in the Black Forest region of Germany: evidence for a founder effect. Human Genetics 95 551–556.
Bray NL, Pimentel H, Melsted P & Pachter L 2016 Near-optimal probabilistic RNA-seq quantification. Nature Biotechnology 34 525–527.
Brecht HM & Schoeppe W 1978 Relation of plasma noradrenaline to blood pressure, age, sex and sodium balance in patients with stable essential hypertension and in normotensive subjects. Clinical Science and Molecular Medicine. Supplement 4 81s-83s.
Breen W, Bancos I, Young WF, Bible KC, Laack NN, Foote RL & Hallemeier CL 2018 External beam radiation therapy for advanced/unresectable malignant paraganglioma and pheochromocytoma. Advances in Radiation Oncology 3 25–29.
Briggs RS, Birtwell AJ & Pohl JE 1978 Hypertensive response to labetalol in phaeochromocytoma. Lancet (London, England) 1 1045–1046.
Brouwers FM, Eisenhofer G, Tao JJ, Kant JA, Adams KT, Linehan WM & Pacak K 2006 High frequency of SDHB germline mutations in patients with malignant catecholamine-producing paragangliomas: implications for genetic testing. The Journal of Clinical Endocrinology and Metabolism 91 4505–4509.
Brown JAL, Santra T, Owens P, Morrison AM & Barry F 2014 Primary cilium-associated genes mediate bone marrow stromal cell response to hypoxia. Stem Cell Research 13 284–299.
Burke R, Nellen D, Bellotto M, Hafen E, Senti KA, Dickson BJ & Basler K 1999 Dispatched, a novel sterol-sensing domain protein dedicated to the release of cholesterol-modified hedgehog from signaling cells. Cell 99 803–815.
Burnichon N, Brière J-J, Libé R, Vescovo L, Rivière J, Tissier F, Jouanno E, Jeunemaitre X, Bénit P, Tzagoloff A et al. 2010 SDHA is a tumor suppressor gene causing paraganglioma. Human Molecular Genetics 19 3011–3020.
Burnichon N, Vescovo L, Amar L, Libé R, de Reynies A, Venisse A, Jouanno E, Laurendeau I, Parfait B, Bertherat J et al. 2011 Integrative genomic analysis reveals somatic mutations in pheochromocytoma and paraganglioma. Human Molecular Genetics 20 3974–3985.
Burnichon N, Cascón A, Schiavi F, Morales NP, Comino-Méndez I, Abermil N, Inglada-Pérez L, de

264
Cubas AA, Amar L, Barontini M et al. 2012 MAX mutations cause hereditary and sporadic pheochromocytoma and paraganglioma. Clinical Cancer Research : An Official Journal of the American Association for Cancer Research 18 2828–2837.
Buttitta L, Mo R, Hui C-C & Fan C-M 2003 Interplays of Gli2 and Gli3 and their requirement in mediating Shh-dependent sclerotome induction. Development (Cambridge, England) 130 6233–6243.
Bylund-Fellenius AC, Walker PM, Elander A, Holm S, Holm J & Scherstén T 1981 Energy metabolism in relation to oxygen partial pressure in human skeletal muscle during exercise. The Biochemical Journal 200 247–255.
Calsina B, Currás-Freixes M, Buffet A, Pons T, Contreras L, Letón R, Comino-Méndez I, Remacha L, Calatayud M, Obispo B et al. 2018 Role of MDH2 pathogenic variant in pheochromocytoma and paraganglioma patients. Genetics in Medicine 20 1652–1662.
Cameron OG, Starkman MN & Schteingart DE 1995 The effect of elevated systemic cortisol levels on plasma catecholamines in Cushing’s syndrome patients with and without depressed mood. Journal of Psychiatric Research 29 347–360.
Cano DA, Murcia NS, Pazour GJ & Hebrok M 2004 Orpk mouse model of polycystic kidney disease reveals essential role of primary cilia in pancreatic tissue organization. Development (Cambridge, England) 131 3457–3467.
Cao M & Zhong Q 2015 Cilia in autophagy and cancer. Cilia 5 4.
Caoili EM, Korobkin M, Francis IR, Cohan RH, Platt JF, Dunnick NR & Raghupathi KI 2002 Adrenal masses: characterization with combined unenhanced and delayed enhanced CT. Radiology 222 629–633.
Caparrós-Martín JA, Valencia M, Reytor E, Pacheco M, Fernandez M, Perez-Aytes A, Gean E, Lapunzina P, Peters H, Goodship JA et al. 2013 The ciliary Evc/Evc2 complex interacts with Smo and controls Hedgehog pathway activity in chondrocytes by regulating Sufu/Gli3 dissociation and Gli3 trafficking in primary cilia. Human Molecular Genetics 22 124–139.
Caplin ME, Pavel M, Ćwikła JB, Phan AT, Raderer M, Sedláčková E, Cadiot G, Wolin EM, Capdevila J, Wall L et al. 2014 Lanreotide in metastatic enteropancreatic neuroendocrine tumors. The New England Journal of Medicine 371 224–233.
Cappello P, Blaser H, Gorrini C, Lin DCC, Elia AJ, Wakeham A, Haider S, Boutros PC, Mason JM, Miller NA et al. 2014 Role of Nek2 on centrosome duplication and aneuploidy in breast cancer cells. Oncogene 33 2375–2384.
Carney JA, Sizemore GW & Tyce GM 1975 Bilateral adrenal medullary hyperplasia in multiple endocrine neoplasia, type 2: the precursor of bilateral pheochromocytoma. Mayo Clinic Proceedings 50 3–10.
Cascón A, Comino-Méndez I, Currás-Freixes M, de Cubas AA, Contreras L, Richter S, Peitzsch M, Mancikova V, Inglada-Pérez L, Pérez-Barrios A et al. 2015 Whole-exome sequencing identifies MDH2 as a new familial paraganglioma gene. Journal of the National Cancer Institute 107 djv053.
Casey RT, Warren AY, Martin JE, Challis BG, Rattenberry E, Whitworth J, Andrews KA, Roberts T, Clark GR, West H et al. 2017 Clinical and Molecular Features of Renal and Pheochromocytoma/Paraganglioma Tumor Association Syndrome (RAPTAS): Case Series and
265
Literature Review. The Journal of Clinical Endocrinology and Metabolism 102 4013–4022.
Castro-Vega LJ, Buffet A, De Cubas AA, Cascón A, Menara M, Khalifa E, Amar L, Azriel S, Bourdeau I, Chabre O et al. 2014 Germline mutations in FH confer predisposition to malignant pheochromocytomas and paragangliomas. Human Molecular Genetics 23 2440–2446.
Cawthon RM, Weiss R, Xu GF, Viskochil D, Culver M, Stevens J, Robertson M, Dunn D, Gesteland R & O’Connell P 1990 A major segment of the neurofibromatosis type 1 gene: cDNA sequence, genomic structure, and point mutations. Cell 62 193–201.
Chailley B & Boisvieux-Ulrich E 1985 Detection of plasma membrane cholesterol by filipin during microvillogenesis and ciliogenesis in quail oviduct. Journal of Histochemistry & Cytochemistry 33 1–10.
Chamoun Z, Mann RK, Nellen D, von Kessler DP, Bellotto M, Beachy PA & Basler K 2001 Skinny hedgehog, an acyltransferase required for palmitoylation and activity of the hedgehog signal. Science (New York, N.Y.) 293 2080–2084.
Chew SL, Dacie JE, Reznek RH, Newbould EC, Sheaves R, Trainer PJ, Lowe DG, Shand WS, Hungerford J & Besser GM 1994 Bilateral phaeochromocytomas in von Hippel-Lindau disease: diagnosis by adrenal vein sampling and catecholamine assay. The Quarterly Journal of Medicine 87 49–54.
Chih B, Liu P, Chinn Y, Chalouni C, Komuves LG, Hass PE, Sandoval W & Peterson AS 2012 A ciliopathy complex at the transition zone protects the cilia as a privileged membrane domain. Nature Cell Biology 14 61–72.
Chizhikov V V., Davenport J, Zhang Q, Shih EK, Cabello OA, Fuchs JL, Yoder BK & Millen KJ 2007 Cilia Proteins Control Cerebellar Morphogenesis by Promoting Expansion of the Granule Progenitor Pool. Journal of Neuroscience 27 9780–9789.
Choi SM, Oh H & Park H 2008 Microarray analyses of hypoxia-regulated genes in an aryl hydrocarbon receptor nuclear translocator (Arnt)-dependent manner. FEBS Journal 275 5618–5634.
Chuang J-Z, Yeh T-Y, Bollati F, Conde C, Canavosio F, Caceres A & Sung C-H 2005 The dynein light chain Tctex-1 has a dynein-independent role in actin remodeling during neurite outgrowth. Developmental Cell 9 75–86.
Clark GR, Sciacovelli M, Gaude E, Walsh DM, Kirby G, Simpson MA, Trembath RC, Berg JN, Woodward ER, Kinning E et al. 2014 Germline FH mutations presenting with pheochromocytoma. The Journal of Clinical Endocrinology and Metabolism 99 E2046-50.
Clarke MR, Weyant RJ, Watson CG & Carty SE 1998 Prognostic markers in pheochromocytoma. Human Pathology 29 522–526.
Clifford SC, Cockman ME, Smallwood AC, Mole DR, Woodward ER, Maxwell PH, Ratcliffe PJ & Maher ER 2001 Contrasting effects on HIF-1alpha regulation by disease-causing pVHL mutations correlate with patterns of tumourigenesis in von Hippel-Lindau disease. Human Molecular Genetics 10 1029–1038.
Cockcroft JR, Ritter JM, Allison DJ, Causon R & Brown MJ 1987 Location of extra-adrenal catecholamine secreting tumours by selective venous sampling and nuclear magnetic resonance scanning. Postgraduate Medical Journal 63 451–453.
Cockman ME, Masson N, Mole DR, Jaakkola P, Chang G-W, Clifford SC, Maher ER, Pugh CW, Ratcliffe PJ & Maxwell PH 2000 Hypoxia Inducible Factor-α Binding and Ubiquitylation by the von

266
Hippel-Lindau Tumor Suppressor Protein. Journal of Biological Chemistry 275 25733–25741.
Coene KLM, Mans DA, Boldt K, Gloeckner CJ, van Reeuwijk J, Bolat E, Roosing S, Letteboer SJF, Peters TA, Cremers FPM et al. 2011 The ciliopathy-associated protein homologs RPGRIP1 and RPGRIP1L are linked to cilium integrity through interaction with Nek4 serine/threonine kinase. Human Molecular Genetics 20 3592–3605.
Cole DG 1999 Kinesin-II, the heteromeric kinesin. Cellular and Molecular Life Sciences : CMLS 56 217–226.
Comino-Méndez I, Gracia-Aznárez FJ, Schiavi F, Landa I, Leandro-García LJ, Letón R, Honrado E, Ramos-Medina R, Caronia D, Pita G et al. 2011 Exome sequencing identifies MAX mutations as a cause of hereditary pheochromocytoma. Nature Genetics 43 663–667.
Comino-Méndez I, de Cubas A a, Bernal C, Álvarez-Escolá C, Sánchez-Malo C, Ramírez-Tortosa CL, Pedrinaci S, Rapizzi E, Ercolino T, Bernini G et al. 2013 Tumoral EPAS1 (HIF2A) mutations explain sporadic pheochromocytoma and paraganglioma in the absence of erythrocytosis. Human Molecular Genetics 22 2169–2176.
Conduit SE, Ramaswamy V, Remke M, Watkins DN, Wainwright BJ, Taylor MD, Mitchell CA & Dyson JM 2017 A compartmentalized phosphoinositide signaling axis at cilia is regulated by INPP5E to maintain cilia and promote Sonic Hedgehog medulloblastoma. Oncogene 36 5969–5984.
Corbit KC, Aanstad P, Singla V, Norman AR, Stainier DYR & Reiter JF 2005 Vertebrate Smoothened functions at the primary cilium. Nature 437 1018–1021.
Coupland RE 1965 Electron microscopic observations on the structure of the rat adrenal medulla. Journal of Anatomy 99 231–254.
Coy S, Du Z, Sheu S-H, Woo T, Rodriguez FJ, Kieran MW & Santagata S 2016 Distinct patterns of primary and motile cilia in Rathke’s cleft cysts and craniopharyngioma subtypes. Modern Pathology 29 1446–1459.
Crona J, Delgado Verdugo A, Maharjan R, Stålberg P, Granberg D, Hellman P & Björklund P 2013 Somatic Mutations in H-RAS in Sporadic Pheochromocytoma and Paraganglioma Identified by Exome Sequencing. The Journal of Clinical Endocrinology & Metabolism 98 E1266–E1271.
Cronin C 2008 Charles Sugrue, M.D., of Cork (1775–1816) and the first description of a classical medical condition: phaeochromocytoma. Irish Journal of Medical Science 177 171–175.
Crout JR & Sjoerdsma a 1960 Catecholamines in the localization of pheochromocytoma. Circulation 22 516–525.
Cui S-Y, Huang J-Y, Chen Y-T, Song H-Z, Huang G-C, De W, Wang R & Chen L-B 2013 The role of Aurora A in hypoxia-inducible factor 1α-promoting malignant phenotypes of hepatocelluar carcinoma. Cell Cycle 12 2849–2866.
Cunningham WL, Becker EJ & Kreuzer F 1965 Catecholamines in plasma and urine at high altitude. Journal of Applied Physiology 20 607–610.
Dahia PLM 2014 Pheochromocytoma and paraganglioma pathogenesis : learning from genetic heterogeneity. Nature Publishing Group 14 108–119.
Dai P, Akimaru H, Tanaka Y, Maekawa T, Nakafuku M & Ishii S 1999 Sonic Hedgehog-induced activation of the Gli1 promoter is mediated by GLI3. The Journal of Biological Chemistry 274

267
8143–8152.
Dajani R, Cleasby A, Neu M, Wonacott AJ, Jhoti H, Hood AM, Modi S, Hersey A, Taskinen J, Cooke RM et al. 1999 X-ray crystal structure of human dopamine sulfotransferase, SULT1A3. Molecular modeling and quantitative structure-activity relationship analysis demonstrate a molecular basis for sulfotransferase substrate specificity. The Journal of Biological Chemistry 274 37862–37868.
Dalgard CL, Lu H, Mohyeldin A & Verma A 2004 Endogenous 2-oxoacids differentially regulate expression of oxygen sensors. The Biochemical Journal 380 419–424.
Dannenberg H, Speel EJM, Zhao J, Saremaslani P, van der Harst E, Roth J, Heitz PU, Bonjer HJ, Dinjens WNM, Mooi WJ et al. 2000 Losses of Chromosomes 1p and 3q Are Early Genetic Events in the Development of Sporadic Pheochromocytomas. The American Journal of Pathology 157 353–359.
Dar AA, Belkhiri A & El-Rifai W 2009 The aurora kinase A regulates GSK-3β in gastric cancer cells. Oncogene 28 866–875.
Därr R, Eisenhofer G, Kotzerke J, Zöphel K, Stroszczynski C, Deinum J, Schultze Kool LJ, Pistorius S, Neumann H, Bornstein SR et al. 2011 Is there still a place for adrenal venous sampling in the diagnostic localization of pheochromocytoma? Endocrine 40 75–79.
Dasgupta B, Dugan LL & Gutmann DH 2003 The neurofibromatosis 1 gene product neurofibromin regulates pituitary adenylate cyclase-activating polypeptide-mediated signaling in astrocytes. The Journal of Neuroscience : The Official Journal of the Society for Neuroscience 23 8949–8954.
Davidson L, Vandongen R, Rouse IL, Beilin LJ & Tunney A 1984 Sex-related differences in resting and stimulated plasma noradrenaline and adrenaline. Clinical Science (London, England : 1979) 67 347–352.
Davies RA, Patt NL & Sole MJ 1979 Localization of pheochromocytoma by selective venous catheterization and assay of plasma catecholamines. Canadian Medical Association Journal 120 539–542.
Dawe HR, Smith UM, Cullinane AR, Gerrelli D, Cox P, Badano JL, Blair-Reid S, Sriram N, Katsanis N, Attie-Bitach T et al. 2007 The Meckel–Gruber Syndrome proteins MKS1 and meckelin interact and are required for primary cilium formation. Human Molecular Genetics 16 173–186.
Dawe HR, Adams M, Wheway G, Szymanska K, Logan C V, Noegel AA, Gull K & Johnson CA 2009 Nesprin-2 interacts with meckelin and mediates ciliogenesis via remodelling of the actin cytoskeleton. Journal of Cell Science 122 2716–2726.
Deane JA, Cole DG, Seeley ES, Diener DR & Rosenbaum JL 2001 Localization of intraflagellar transport protein IFT52 identifies basal body transitional fibers as the docking site for IFT particles. Current Biology : CB 11 1586–1590.
Dekkers T, Deinum J, Schultzekool LJ, Blondin D, Vonend O, Hermus ARRM, Peitzsch M, Rump LC, Antoch G, Sweep FCGJ et al. 2013 Plasma metanephrine for assessing the selectivity of adrenal venous sampling. Hypertension 62 1152–1157.
Delaval B, Bright A, Lawson ND & Doxsey S 2011 The cilia protein IFT88 is required for spindle orientation in mitosis. Nature Cell Biology 13 461–468.
Delous M, Baala L, Salomon R, Laclef C, Vierkotten J, Tory K, Golzio C, Lacoste T, Besse L, Ozilou C et

268
al. 2007 The ciliary gene RPGRIP1L is mutated in cerebello-oculo-renal syndrome (Joubert syndrome type B) and Meckel syndrome. Nature Genetics 39 875–881.
Dénes J, Swords F, Rattenberry E, Stals K, Owens M, Cranston T, Xekouki P, Moran L, Kumar A, Wassif C et al. 2015 Heterogeneous genetic background of the association of pheochromocytoma/paraganglioma and pituitary adenoma – results from a large patient cohort. The Journal of Clinical Endocrinology & Metabolism 100 E531-41.
Dere R, Perkins AL, Bawa-Khalfe T, Jonasch D & Walker CL 2015 β-catenin links von Hippel-Lindau to aurora kinase A and loss of primary cilia in renal cell carcinoma. Journal of the American Society of Nephrology : JASN 26 553–564.
DeVaul N, Koloustroubis K, Wang R & Sperry AO 2017 A novel interaction between kinase activities in regulation of cilia formation. BMC Cell Biology 18 33.
Ding Q, Fukami S i, Meng X, Nishizaki Y, Zhang X, Sasaki H, Dlugosz A, Nakafuku M & Hui C c 1999 Mouse suppressor of fused is a negative regulator of sonic hedgehog signaling and alters the subcellular distribution of Gli1. Current Biology : CB 9 1119–1122.
Ding X-F, Zhou J, Hu Q-Y, Liu S-C & Chen G 2015 The tumor suppressor pVHL down-regulates never-in-mitosis A-related kinase 8 via hypoxia-inducible factors to maintain cilia in human renal cancer cells. The Journal of Biological Chemistry 290 1389–1394.
Dishinger JF, Kee HL, Jenkins PM, Fan S, Hurd TW, Hammond JW, Truong YN-T, Margolis B, Martens JR & Verhey KJ 2010 Ciliary entry of the kinesin-2 motor KIF17 is regulated by importin-β2 and RanGTP. Nature Cell Biology 12 703–710.
Domire JS, Green JA, Lee KG, Johnson AD, Askwith CC & Mykytyn K 2011 Dopamine receptor 1 localizes to neuronal cilia in a dynamic process that requires the Bardet-Biedl syndrome proteins. Cellular and Molecular Life Sciences : CMLS 68 2951–2960.
Doobin DJ, Kemal S, Dantas TJ & Vallee RB 2016 Severe NDE1-mediated microcephaly results from neural progenitor cell cycle arrests at multiple specific stages. Nature Communications 7 12551.
Doolin PF & Birge WJ 1966 Ultrastructural organization of cilia and basal bodies of the epithelium of the choroid plexus in the chick embryo. The Journal of Cell Biology 29 333–345.
Dorn K V, Hughes CE & Rohatgi R 2012 A Smoothened-Evc2 complex transduces the Hedgehog signal at primary cilia. Developmental Cell 23 823–835.
Druce MR, Kaltsas GA, Fraenkel M, Gross DJ & Grossman AB 2009 Novel and Evolving Therapies in the Treatment of Malignant Phaeochromocytoma: Experience with the mTOR Inhibitor Everolimus (RAD001). Hormone and Metabolic Research 41 697–702.
Du E, Lu C, Sheng F, Li C, Li H, Ding N, Chen Y, Zhang T, Yang K & Xu Y 2018 Analysis of potential genes associated with primary cilia in bladder cancer. Cancer Management and Research Volume 10 3047–3056.
van Duinen N, Corssmit EPM, de Jong WHA, Brookman D, Kema IP & Romijn JA 2013 Plasma levels of free metanephrines and 3-methoxytyramine indicate a higher number of biochemically active HNPGL than 24-h urinary excretion rates of catecholamines and metabolites. European Journal of Endocrinology 169 377–382.
Dummer A, Poelma C, DeRuiter MC, Goumans M-JTH & Hierck BP 2016 Measuring the primary cilium length: improved method for unbiased high-throughput analysis. Cilia 5 7.
269
Dvorak J, Sitorova V, Nikolov DH, Filipova A, Ryska A, Melichar B, Richter I, Buka D, Mokry J, Filip S et al. 2014 Primary cilia in gastrointestinal stromal tumors. Neoplasma 61 305–308.
Dvorak J, Hadzi Nikolov D, Dusek L, Filipova A, Richter I, Buka D, Ryska A, Mokry J, Filip S, Melichar B et al. 2016 Prognostic significance of the frequency of primary cilia in cells of small bowel and colorectal adenocarcinoma. Journal of B.U.ON. : Official Journal of the Balkan Union of Oncology 21 1233–1241.
Dvorak J, Hadzi Nikolov D, Dusek L, Filipova A, Richter I, Buka D, Ryska A, Mokry J, Filip S, Melichar B et al. 2017 Association of the combined parameters including the frequency of primary cilia, CD8+ tumor infiltrating lymphocytes and PD-1 expression with the outcome in intestinal cancer. Journal of B.U.ON. : Official Journal of the Balkan Union of Oncology 22 1477–1487.
Dwight T, Mann K, Benn DE, Robinson BG, McKelvie P, Gill AJ, Winship I & Clifton-Bligh RJ 2013 Familial SDHA mutation associated with pituitary adenoma and pheochromocytoma/paraganglioma. Journal of Clinical Endocrinology and Metabolism 98 1103–1108. (doi:10.1210/jc.2013-1400)
Edwards C, Heath D, Harris P, Castillo Y, Krüger H & Arias-Stella J 1971 The carotid body in animals at high altitude. The Journal of Pathology 104 231–238.
Edwards C, Heath D & Harris P 1972 Ultrastructure of the carotid body in high-altitude guinea-pigs. The Journal of Pathology 107 131–136.
Egeberg DL, Lethan M, Manguso R, Schneider L, Awan A, Jørgensen TS, Byskov AG, Pedersen LB & Christensen ST 2012 Primary cilia and aberrant cell signaling in epithelial ovarian cancer. Cilia 1 15.
Eisenhofer G, Goldstein DS, Stull R, Keiser HR, Sunderland T, Murphy DL & Kopin IJ 1986 Simultaneous liquid-chromatographic determination of 3,4-dihydroxyphenylglycol, catecholamines, and 3,4-dihydroxyphenylalanine in plasma, and their responses to inhibition of monoamine oxidase. Clinical Chemistry 32 2030–2033.
Eisenhofer G, Friberg P, Pacak K, Goldstein DS, Murphy DL, Tsigos C, Quyyumi AA, Brunner HG & Lenders JW 1995a Plasma metadrenalines: do they provide useful information about sympatho-adrenal function and catecholamine metabolism? Clinical Science (London, England : 1979) 88 533–542.
Eisenhofer G, Rundquist B, Aneman A, Friberg P, Dakak N, Kopin IJ, Jacobs MC & Lenders JW 1995b Regional release and removal of catecholamines and extraneuronal metabolism to metanephrines. The Journal of Clinical Endocrinology and Metabolism 80 3009–3017.
Eisenhofer G, Aneman A, Hooper D, Rundqvist B & Friberg P 1996 Mesenteric organ production, hepatic metabolism, and renal elimination of norepinephrine and its metabolites in humans. Journal of Neurochemistry 66 1565–1573.
Eisenhofer G, Keiser H, Friberg P, Mezey E, Huynh TT, Hiremagalur B, Ellingson T, Duddempudi S, Eijsbouts A & Lenders JW 1998 Plasma metanephrines are markers of pheochromocytoma produced by catechol-O-methyltransferase within tumors. The Journal of Clinical Endocrinology and Metabolism 83 2175–2185.
Eisenhofer G, Huynh TT, Hiroi M & Pacak K 2001 Understanding catecholamine metabolism as a guide to the biochemical diagnosis of pheochromocytoma. Reviews in Endocrine & Metabolic Disorders 2 297–311.

270
Eisenhofer G, Goldstein DS, Walther MM, Friberg P, Lenders JWM, Keiser HR & Pacak K 2003 Biochemical Diagnosis of Pheochromocytoma: How to Distinguish True- from False-Positive Test Results. The Journal of Clinical Endocrinology & Metabolism 88 2656–2666.
Eisenhofer G, Lenders JWM, Timmers H, Mannelli M, Grebe SK, Hofbauer LC, Bornstein SR, Tiebel O, Adams K, Bratslavsky G et al. 2011 Measurements of plasma methoxytyramine, normetanephrine, and metanephrine as discriminators of different hereditary forms of pheochromocytoma. Clinical Chemistry 57 411–420.
Eisenhofer G, Lattke P, Herberg M, Siegert G, Qin N, Därr R, Hoyer J, Villringer A, Prejbisz A, Januszewicz A et al. 2013 Reference intervals for plasma free metanephrines with an age adjustment for normetanephrine for optimized laboratory testing of phaeochromocytoma. Annals of Clinical Biochemistry 50 62–69.
Elshafie O, Al Badaai Y, Alwahaibi K, Qureshi A, Hussein S, Al Azzri F, Almamari A & Woodhouse N 2014 Catecholamine-secreting carotid body paraganglioma: successful preoperative control of hypertension and clinical symptoms using high-dose long-acting octreotide. Endocrinology, Diabetes & Metabolism Case Reports 2014 140051.
Elston MS, Meyer-Rochow GY, Conaglen HM, Clarkson A, Clifton-Bligh RJ, Conaglen J V & Gill AJ 2015 Increased SSTR2A and SSTR3 expression in succinate dehydrogenase-deficient pheochromocytomas and paragangliomas. Human Pathology 46 390–396.
Elvidge GP, Glenny L, Appelhoff RJ, Ratcliffe PJ, Ragoussis J & Gleadle JM 2006 Concordant Regulation of Gene Expression by Hypoxia and 2-Oxoglutarate-dependent Dioxygenase Inhibition. Journal of Biological Chemistry 281 15215–15226.
Emerson CE & Rainbird A 2003 Use of a ‘hospital-at-home’ service for patient optimization before resection of phaeochromocytoma. British Journal of Anaesthesia 90 380–382.
Emoto K, Masugi Y, Yamazaki K, Effendi K, Tsujikawa H, Tanabe M, Kitagawa Y & Sakamoto M 2014 Presence of primary cilia in cancer cells correlates with prognosis of pancreatic ductal adenocarcinoma. Human Pathology 45 817–825.
Endicott SJ, Basu B, Khokha M & Brueckner M 2015 The NIMA-like kinase Nek2 is a key switch balancing cilia biogenesis and resorption in the development of left-right asymmetry. Development 142 4068–4079.
Endoh-Yamagami S, Evangelista M, Wilson D, Wen X, Theunissen J-W, Phamluong K, Davis M, Scales SJ, Solloway MJ, de Sauvage FJ et al. 2009 The Mammalian Cos2 Homolog Kif7 Plays an Essential Role in Modulating Hh Signal Transduction during Development. Current Biology 19 1320–1326.
Engel BD, Ludington WB & Marshall WF 2009 Intraflagellar transport particle size scales inversely with flagellar length: revisiting the balance-point length control model. The Journal of Cell Biology 187 81–89.
Enríquez-Vega ME, Muñoz-Paredes JG, Cossío-Zazueta A, Ontiveros-Carlos Y, Pacheco-Pittaluga E & Bizueto-Rosas H 2019 SDHD gene mutation in Mexican population with carotid body tumor. Cirugía y Cirujanos 86 38–42.
Esteban-Barragán MA, Ávila P, Álvarez-Tejado M, Gutierrez M, Garcia-Pardo A, Sanchez-Madrid F & Landazuri M 2002 Role of the von Hippel-Lindau tumor suppressor gene in the formation of beta1-integrin fibrillar adhesions. Cancer Res 62 2929–2936.

271
Esteban MA, Harten SK, Tran MG & Maxwell PH 2006 Formation of primary cilia in the renal epithelium is regulated by the von Hippel-Lindau tumor suppressor protein. Journal of the American Society of Nephrology : JASN 17 1801–1806.
Estus S, Zaks WJ, Freeman RS, Gruda M, Bravo R & Johnson EM 1994 Altered gene expression in neurons during programmed cell death: identification of c-jun as necessary for neuronal apoptosis. The Journal of Cell Biology 127 1717–1727.
Von Euler US, Gemzell CA, Strom G & Westman A 1955 Report of a case of pheochromocytoma, with special regard to preoperative diagnostic problems. Acta Medica Scandinavica 153 127–136.
Evenepoel L, Helaers R, Vroonen L, Aydin S, Hamoir M, Maiter D, Vikkula M & Persu A 2017 KIF1B and NF1 are the most frequently mutated genes in paraganglioma and pheochromocytoma tumors. Endocrine-Related Cancer 24 L57–L61.
Ezratty EJ, Stokes N, Chai S, Shah AS, Williams SE & Fuchs E 2011 A Role for the Primary Cilium in Notch Signaling and Epidermal Differentiation during Skin Development. Cell 145 1129–1141.
Ezratty EJ, Pasolli HA & Fuchs E 2016 A Presenilin-2–ARF4 trafficking axis modulates Notch signaling during epidermal differentiation. The Journal of Cell Biology 214 89–101.
Fan S, Fogg V, Wang Q, Chen X-W, Liu C-J & Margolis B 2007 A novel Crumbs3 isoform regulates cell division and ciliogenesis via importin β interactions. The Journal of Cell Biology 178 387–398.
Fan S, Whiteman EL, Hurd TW, McIntyre JC, Dishinger JF, Liu CJ, Martens JR, Verhey KJ, Sajjan U & Margolis B 2011 Induction of Ran GTP drives ciliogenesis. Molecular Biology of the Cell 22 4539–4548.
Farnum CE & Wilsman NJ 2011 Orientation of primary cilia of articular chondrocytes in three-dimensional space. Anatomical Record (Hoboken, N.J. : 2007) 294 533–549.
Favier J, Amar L & Gimenez-Roqueplo A-P 2015 Paraganglioma and phaeochromocytoma: from genetics to personalized medicine. Nature Reviews Endocrinology 11 101–111.
Fawcett D & Porter K 1954 A study of the fine structure of ciliated epitheliae. J Morphol 94 221–281.
Feng Y & Walsh CA 2004 Mitotic Spindle Regulation by Nde1 Controls Cerebral Cortical Size. Neuron 44 279–293.
Fishbein L, Khare S, Wubbenhorst B, DeSloover D, D’Andrea K, Merrill S, Cho NW, Greenberg RA, Else T, Montone K et al. 2015 Whole-exome sequencing identifies somatic ATRX mutations in pheochromocytomas and paragangliomas. Nature Communications 6 6140.
Fishbein L, Leshchiner I, Walter V, Danilova L, Robertson AG, Johnson AR, Lichtenberg TM, Murray BA, Ghayee HK, Else T et al. 2017 Comprehensive Molecular Characterization of Pheochromocytoma and Paraganglioma. Cancer Cell 31 181–193.
Fleisher DS, Voci G, Cresson SL & Karafin L 1964 Preoperative localization of pheochromocytoma. The Journal of Pediatrics 64 711–715.
Fonte JS, Robles JF, Chen CC, Reynolds J, Whatley M, Ling A, Mercado-Asis LB, Adams KT, Martucci V, Fojo T et al. 2012 False-negative 123I-MIBG SPECT is most commonly found in SDHB-related pheochromocytoma or paraganglioma with high frequency to develop metastatic disease. Endocrine-Related Cancer 19 83–93.
Frank V, Habbig S, Bartram MP, Eisenberger T, Veenstra-Knol HE, Decker C, Boorsma RAC, Göbel H,

272
Nürnberg G, Griessmann A et al. 2013 Mutations in NEK8 link multiple organ dysplasia with altered Hippo signalling and increased c-MYC expression. Human Molecular Genetics 22 2177–2185.
Fränkel F 1886 No Ein Fall von doppelseitigem, völlig latent verlaufenen Nebennierentumor und gleichzeitiger Nephritis mit Veränderungen am Circulationsapparat und Retinitis. Arch Pathol Anat Physiol Klin Med 244–263.
Freel EM, Stanson AW, Thompson GB, Grant CS, Farley DR, Richards ML & Young WF 2010 Adrenal venous sampling for catecholamines: A normal value study. Journal of Clinical Endocrinology and Metabolism 95 1328–1332.
Frew IJ, Thoma CR, Georgiev S, Minola A, Hitz M, Montani M, Moch H & Krek W 2008 pVHL and PTEN tumour suppressor proteins cooperatively suppress kidney cyst formation. The EMBO Journal 27 1747–1757.
Fukui H, Shiba D, Asakawa K, Kawakami K & Yokoyama T 2012 The ciliary protein Nek8/Nphp9 acts downstream of Inv/Nphp2 during pronephros morphogenesis and left-right establishment in zebrafish. FEBS Letters 586 2273–2279.
Fumoto K, Lee P-C, Saya H & Kikuchi A 2008 AIP regulates stability of Aurora-A at early mitotic phase coordinately with GSK-3β. Oncogene 27 4478–4487.
Funder JW, Carey RM, Mantero F, Murad MH, Reincke M, Shibata H, Stowasser M & Young WF 2016 The Management of Primary Aldosteronism: Case Detection, Diagnosis, and Treatment: An Endocrine Society Clinical Practice Guideline. The Journal of Clinical Endocrinology & Metabolism 101 1889–1916.
Furukawa T, Kanai N, Shiwaku HO, Soga N, Uehara A & Horii A 2006 AURKA is one of the downstream targets of MAPK1/ERK2 in pancreatic cancer. Oncogene 25 4831–4839.
Gaal J, Burnichon N, Korpershoek E, Roncelin I, Bertherat J, Plouin P-F, de Krijger RR, Gimenez-Roqueplo A-P & Dinjens WNM 2010 Isocitrate Dehydrogenase Mutations Are Rare in Pheochromocytomas and Paragangliomas. The Journal of Clinical Endocrinology & Metabolism 95 1274–1278.
Gabriel S, Blanchet EM, Sebag F, Chen CC, Fakhry N, Deveze A, Barlier A, Morange I, Pacak K & Taïeb D 2013 Functional characterization of nonmetastatic paraganglioma and pheochromocytoma by (18) F-FDOPA PET: focus on missed lesions. Clinical Endocrinology 79 170–177.
Gabriel E, Wason A, Ramani A, Gooi LM, Keller P, Pozniakovsky A, Poser I, Noack F, Telugu NS, Calegari F et al. 2016 CPAP promotes timely cilium disassembly to maintain neural progenitor pool. The EMBO Journal 35 803–819.
Gaertig J & Wloga D 2008 Chapter 4 Ciliary Tubulin and Its Post-Translational Modifications. In Current Topics in Developmental Biology, pp 83–113.
Gagel RF, Tashjian AH, Cummings T, Papathanasopoulos N, Kaplan MM, DeLellis RA, Wolfe HJ & Reichlin S 1988 The clinical outcome of prospective screening for multiple endocrine neoplasia type 2a. An 18-year experience. The New England Journal of Medicine 318 478–484.
Garcia-Gonzalo FR, Corbit KC, Sirerol-Piquer MS, Ramaswami G, Otto EA, Noriega TR, Seol AD, Robinson JF, Bennett CL, Josifova DJ et al. 2011 A transition zone complex regulates mammalian ciliogenesis and ciliary membrane composition. Nature Genetics 43 776–784.

273
García-Zaragoza E, Pérez-Tavarez R, Ballester A, Lafarga V, Jiménez-Reinoso A, Ramírez A, Murillas R & Gallego MI 2012 Intraepithelial paracrine Hedgehog signaling induces the expansion of ciliated cells that express diverse progenitor cell markers in the basal epithelium of the mouse mammary gland. Developmental Biology 372 28–44.
Gerald D, Berra E, Frapart YM, Chan DA, Giaccia AJ, Mansuy D, Pouysségur J, Yaniv M & Mechta-Grigoriou F 2004 JunD reduces tumor angiogenesis by protecting cells from oxidative stress. Cell 118 781–794.
Gerdes JM, Liu Y, Zaghloul NA, Leitch CC, Lawson SS, Kato M, Beachy PA, Beales PL, DeMartino GN, Fisher S et al. 2007 Disruption of the basal body compromises proteasomal function and perturbs intracellular Wnt response. Nature Genetics 39 1350–1360.
Gerhardt C, Lier JM, Burmühl S, Struchtrup A, Deutschmann K, Vetter M, Leu T, Reeg S, Grune T & Rüther U 2015 The transition zone protein Rpgrip1l regulates proteasomal activity at the primary cilium. The Journal of Cell Biology 210 115–133.
Gerhardt C, Leu T, Lier JM & Rüther U 2016 The cilia-regulated proteasome and its role in the development of ciliopathies and cancer. Cilia 5 14.
Gerlo EA, Schoors DF & Dupont AG 1991 Age- and sex-related differences for the urinary excretion of norepinephrine, epinephrine, and dopamine in adults. Clinical Chemistry 37 875–878.
Gewirtz GP, Kvetnanský R, Weise VK & Kopin IJ 1971 Effect of hypophysectomy on adrenal dopamine -hydroxylase activity in the rat. Molecular Pharmacology 7 163–168.
Gild ML, Naik N, Hoang J, Hsiao E, McGrath RT, Sywak M, Sidhu S, Delbridge LW, Robinson BG, Schembri G et al. 2018 Role of DOTATATE-PET/CT in preoperative assessment of phaeochromocytoma and paragangliomas. Clinical Endocrinology 89 139–147.
Gill AJ, Chou A, Vilain R, Clarkson A, Lui M, Jin R, Tobias V, Samra J, Goldstein D, Smith C et al. 2010 Immunohistochemistry for SDHB Divides Gastrointestinal Stromal Tumors (GISTs) into 2 Distinct Types. The American Journal of Surgical Pathology 34 636–644.
Gilula NB & Satir P 1972 The ciliary necklace. A ciliary membrane specialization. The Journal of Cell Biology 53 494–509.
Gimm O, Armanios M, Dziema H, Neumann HP & Eng C 2000 Somatic and occult germ-line mutations in SDHD, a mitochondrial complex II gene, in nonfamilial pheochromocytoma. Cancer Research 60 6822–6825.
Giovanella L, Squin N, Ghelfo A & Ceriani L 2006 Chromogranin A immunoradiometric assay in diagnosis of pheochromocytoma: comparison with plasma metanephrines and 123I-MIBG scan. Q J Nucl Med Mol Imaging 50 344–347.
Gleadle J & Ratcliffe P 2001 Encyclopedia of Life Sciences: Hypoxia. John Wiley & Sons, Ltd.
Goetz SC & Anderson K V. 2010 The primary cilium: a signalling centre during vertebrate development. Nature Reviews Genetics 11 331–344.
Gomez-Sanchez EP 1986 Intracerebroventricular infusion of aldosterone induces hypertension in rats. Endocrinology 118 819–823.
Gradilone SA, Radtke BN, Bogert PS, Huang BQ, Gajdos GB & LaRusso NF 2013 HDAC6 inhibition restores ciliary expression and decreases tumor growth. Cancer Research 73 2259–2270.
274
Grampa V, Delous M, Zaidan M, Odye G, Thomas S, Elkhartoufi N, Filhol E, Niel O, Silbermann F, Lebreton C et al. 2016 Novel NEK8 Mutations Cause Severe Syndromic Renal Cystic Dysplasia through YAP Dysregulation. PLOS Genetics 12 e1005894.
Graser S, Stierhof Y-D, Lavoie SB, Gassner OS, Lamla S, Le Clech M & Nigg EA 2007 Cep164, a novel centriole appendage protein required for primary cilium formation. The Journal of Cell Biology 179 321–330.
Greene LA & Tischler AS 1976 Establishment of a noradrenergic clonal line of rat adrenal pheochromocytoma cells which respond to nerve growth factor. 73 2424–2428.
Grim CE, Glenn JF, Wynn JO & Gunnells JC 1967 Bilateral pheochromocytoma: the application of a plasma catecholamine bioassay for tumor localization. American Heart Journal 74 809–815.
Grisanti L, Revenkova E, Gordon RE & Iomini C 2016 Primary cilia maintain corneal epithelial homeostasis by regulation of the Notch signaling pathway. Development 143 2160–2171.
Groeben H, Nottebaum BJ, Alesina PF, Traut A, Neumann HP & Walz MK 2017 Perioperative α-receptor blockade in phaeochromocytoma surgery: an observational case series † †This Article is accompanied by Editorial Aew414. British Journal of Anaesthesia 118 182–189.
Grozinger CM, Hassig CA & Schreiber SL 1999 Three proteins define a class of human histone deacetylases related to yeast Hda1p. Proceedings of the National Academy of Sciences of the United States of America 96 4868–4873.
Grubbs EG, Rich TA, Ng C, Bhosale PR, Jimenez C, Evans DB, Lee JE & Perrier ND 2013 Long-term outcomes of surgical treatment for hereditary pheochromocytoma. Journal of the American College of Surgeons 216 280–289.
Gruber LM, Erickson D, Babovic-Vuksanovic D, Thompson GB, Young WF & Bancos I 2017 Pheochromocytoma and paraganglioma in patients with neurofibromatosis type 1. Clinical Endocrinology 86 141–149.
Guen VJ, Chavarria TE, Kröger C, Ye X, Weinberg RA & Lees JA 2017 EMT programs promote basal mammary stem cell and tumor-initiating cell stemness by inducing primary ciliogenesis and Hedgehog signaling. Proceedings of the National Academy of Sciences 114 E10532–E10539.
Guillemot J, Compagnon P, Cartier D, Thouennon E, Bastard C, Lihrmann I, Pichon P, Thuillez C, Plouin P-F, Bertherat J et al. 2009 Metoclopramide stimulates catecholamine- and granin-derived peptide secretion from pheochromocytoma cells through activation of serotonin type 4 (5-HT4) receptors. Endocrine-Related Cancer 16 281–290.
Guinot A, Lehmann H, Wild PJ & Frew IJ 2016 Combined deletion of Vhl, Trp53 and Kif3a causes cystic and neoplastic renal lesions. The Journal of Pathology 239 365–373.
Gutmann DH, Aylsworth A, Carey JC, Korf B, Marks J, Pyeritz RE, Rubenstein A & Viskochil D 1997 The diagnostic evaluation and multidisciplinary management of neurofibromatosis 1 and neurofibromatosis 2. JAMA 278 51–57.
Haase VH, Glickman JN, Socolovsky M & Jaenisch R 2001 Vascular tumors in livers with targeted inactivation of the von Hippel-Lindau tumor suppressor. Proceedings of the National Academy of Sciences of the United States of America 98 1583–1588.
Habbig S, Bartram MP, Sägmüller JG, Griessmann A, Franke M, Müller R-U, Schwarz R, Hoehne M, Bergmann C, Tessmer C et al. 2012 The ciliopathy disease protein NPHP9 promotes nuclear

275
delivery and activation of the oncogenic transcriptional regulator TAZ. Human Molecular Genetics 21 5528–5538.
Hadoux J, Favier J, Scoazec J-Y, Leboulleux S, Al Ghuzlan A, Caramella C, Déandreis D, Borget I, Loriot C, Chougnet C et al. 2014 SDHB mutations are associated with response to temozolomide in patients with metastatic pheochromocytoma or paraganglioma. International Journal of Cancer 135 2711–2720.
Hagiwara H, Ohwada N, Aoki T, Suzuki T & Takata K 2008 Immunohistochemical and electron microscopic observations of stromal cells in the human oviduct mucosa. Medical Molecular Morphology 41 221–226.
Hammond JW, Huang C-F, Kaech S, Jacobson C, Banker G & Verhey KJ 2010 Posttranslational modifications of tubulin and the polarized transport of kinesin-1 in neurons. Molecular Biology of the Cell 21 572–583.
Han Y-G, Kim HJ, Dlugosz AA, Ellison DW, Gilbertson RJ & Alvarez-Buylla A 2009 Dual and opposing roles of primary cilia in medulloblastoma development. Nature Medicine 15 1062–1065.
Han SJ, Jang H-S, Kim JI, Lipschutz JH & Park KM 2016 Unilateral nephrectomy elongates primary cilia in the remaining kidney via reactive oxygen species. Scientific Reports 6 22281.
Han SJ, Jang H-S, Seu SY, Cho H-J, Hwang YJ, Kim JI & Park KM 2017 Hepatic ischemia/reperfusion injury disrupts the homeostasis of kidney primary cilia via oxidative stress. Biochimica et Biophysica Acta (BBA) - Molecular Basis of Disease 1863 1817–1828.
Han S, Suh CH, Woo S, Kim YJ & Lee JJ 2018 Performance of 68 Ga-DOTA-Conjugated Somatostatin Receptor Targeting Peptide PET in Detection of Pheochromocytoma and Paraganglioma: A Systematic Review and Meta-Analysis. Journal of Nuclear Medicine 60 369–376.
Händel M, Schulz S, Stanarius A, Schreff M, Erdtmann-Vourliotis M, Schmidt H, Wolf G & Höllt V 1999 Selective targeting of somatostatin receptor 3 to neuronal cilia. Neuroscience 89 909–926.
Hao H-X, Khalimonchuk O, Schraders M, Dephoure N, Bayley J-P, Kunst H, Devilee P, Cremers CWRJ, Schiffman JD, Bentz BG et al. 2009 SDH5, a gene required for flavination of succinate dehydrogenase, is mutated in paraganglioma. Science (New York, N.Y.) 325 1139–1142.
Harlander S, Schönenberger D, Toussaint NC, Prummer M, Catalano A, Brandt L, Moch H, Wild PJ & Frew IJ 2017 Combined mutation in Vhl, Trp53 and Rb1 causes clear cell renal cell carcinoma in mice. Nature Medicine 23 869–877.
Hartman TR, Liu D, Zilfou JT, Robb V, Morrison T, Watnick T & Henske EP 2009 The tuberous sclerosis proteins regulate formation of the primary cilium via a rapamycin-insensitive and polycystin 1-independent pathway. Human Molecular Genetics 18 151–163.
Hassounah NB, Bunch TA & McDermott KM 2012 Molecular Pathways: The Role of Primary Cilia in Cancer Progression and Therapeutics with a Focus on Hedgehog Signaling. Clinical Cancer Research 18 2429–2435.
Hassounah NB, Nagle R, Saboda K, Roe DJ, Dalkin BL & McDermott KM 2013 Primary cilia are lost in preinvasive and invasive prostate cancer. PloS One 8 e68521.
Haycraft CJ, Banizs B, Aydin-Son Y, Zhang Q, Michaud EJ & Yoder BK 2005 Gli2 and Gli3 Localize to Cilia and Require the Intraflagellar Transport Protein Polaris for Processing and Function. PLoS Genetics 1 e53.

276
Hayward DG, Clarke RB, Faragher AJ, Pillai MR, Hagan IM & Fry AM 2004 The centrosomal kinase Nek2 displays elevated levels of protein expression in human breast cancer. Cancer Research 64 7370–7376.
Hearn T, Spalluto C, Phillips VJ, Renforth GL, Copin N, Hanley NA & Wilson DI 2005 Subcellular localization of ALMS1 supports involvement of centrosome and basal body dysfunction in the pathogenesis of obesity, insulin resistance, and type 2 diabetes. Diabetes 54 1581–1587.
Van der Heiden K, Hierck BP, Krams R, de Crom R, Cheng C, Baiker M, Pourquie MJBM, Alkemade FE, DeRuiter MC, Gittenberger-de Groot AC et al. 2008 Endothelial primary cilia in areas of disturbed flow are at the base of atherosclerosis. Atherosclerosis 196 542–550.
Hellman NE, Liu Y, Merkel E, Austin C, Le Corre S, Beier DR, Sun Z, Sharma N, Yoder BK & Drummond IA 2010 The zebrafish foxj1a transcription factor regulates cilia function in response to injury and epithelial stretch. Proceedings of the National Academy of Sciences 107 18499–18504.
Hergovich A, Lisztwan J, Barry R, Ballschmieter P & Krek W 2003 Regulation of microtubule stability by the von Hippel-Lindau tumour suppressor protein pVHL. Nature Cell Biology 5 64–70.
Hergovich A, Lisztwan J, Thoma CR, Wirbelauer C, Barry RE & Krek W 2006 Priming-dependent phosphorylation and regulation of the tumor suppressor pVHL by glycogen synthase kinase 3. Molecular and Cellular Biology 26 5784–5796.
Herman B & Albertini DF 1983 Microtubule regulation of cell surface receptor topography during granulosa cell differentiation. Differentiation; Research in Biological Diversity 25 56–63.
Hernandez KG, Ezzat S, Morel CF, Swallow C, Otremba M, Dickson BC, Asa SL & Mete O 2015 Familial pheochromocytoma and renal cell carcinoma syndrome: TMEM127 as a novel candidate gene for the association. Virchows Archiv 466 727–732.
Hewitson KS, Liénard BMR, McDonough MA, Clifton IJ, Butler D, Soares AS, Oldham NJ, McNeill LA & Schofield CJ 2007 Structural and Mechanistic Studies on the Inhibition of the Hypoxia-inducible Transcription Factor Hydroxylases by Tricarboxylic Acid Cycle Intermediates. Journal of Biological Chemistry 282 3293–3301.
Hickman PE, Leong M, Chang J, Wilson SR & McWhinney B 2009 Plasma free metanephrines are superior to urine and plasma catecholamines and urine catecholamine metabolites for the investigation of phaeochromocytoma. Pathology 41 173–177.
von Hippel E 1904 Ueber eine sehr seltene Erkrankung der Netzhaut. Ophthalmology 59 83–106.
Hirano T, Katoh Y & Nakayama K 2017 Intraflagellar transport-A complex mediates ciliary entry and retrograde trafficking of ciliary G protein-coupled receptors. Molecular Biology of the Cell 28 429–439.
Ho L, Ali SA, Al-Jazrawe M, Kandel R, Wunder JS & Alman BA 2013 Primary cilia attenuate hedgehog signalling in neoplastic chondrocytes. Oncogene 32 5388–5396.
Hoekstra AS, de Graaff MA, Briaire-de Bruijn IH, Ras C, Seifar RM, van Minderhout I, Cornelisse CJ, Hogendoorn PCW, Breuning MH, Suijker J et al. 2015 Inactivation of SDH and FH cause loss of 5hmC and increased H3K9me3 in paraganglioma/pheochromocytoma and smooth muscle tumors. Oncotarget 6 38777–38788.
Hoff S, Halbritter J, Epting D, Frank V, Nguyen T-MT, van Reeuwijk J, Boehlke C, Schell C, Yasunaga T, Helmstädter M et al. 2013 ANKS6 is a central component of a nephronophthisis module linking
277
NEK8 to INVS and NPHP3. Nature Genetics 45 951–956.
Hoffman MA, Ohh M, Yang H, Klco JM, Ivan M & Kaelin WG 2001 von Hippel-Lindau protein mutants linked to type 2C VHL disease preserve the ability to downregulate HIF. Human Molecular Genetics 10 1019–1027.
Hopewell R & Ziff EB 1995 The nerve growth factor-responsive PC12 cell line does not express the Myc dimerization partner Max. Molecular and Cellular Biology 15 3470–3478.
Hou Y, Qin H, Follit JA, Pazour GJ, Rosenbaum JL & Witman GB 2007 Functional analysis of an individual IFT protein: IFT46 is required for transport of outer dynein arms into flagella. The Journal of Cell Biology 176 653–665.
Hu C-J, Iyer S, Sataur A, Covello KL, Chodosh LA & Simon MC 2006 Differential Regulation of the Transcriptional Activities of Hypoxia-Inducible Factor 1 Alpha (HIF-1 ) and HIF-2 in Stem Cells. Molecular and Cellular Biology 26 3514–3526.
Huang P & Schier AF 2009 Dampened Hedgehog signaling but normal Wnt signaling in zebrafish without cilia. Development 136 3089–3098.
Huang Y, Zheng J, Chen D, Li F, Wu W, Huang X, Wu Y, Deng Y & Qiu F 2017 Transcriptome profiling identifies a recurrent CRYL1-IFT88 chimeric transcript in hepatocellular carcinoma. Oncotarget 8 40693–40704.
Huangfu D & Anderson K V 2005 Cilia and Hedgehog responsiveness in the mouse. Proceedings of the National Academy of Sciences of the United States of America 102 11325–11330.
Huangfu D, Liu A, Rakeman AS, Murcia NS, Niswander L & Anderson K V 2003 Hedgehog signalling in the mouse requires intraflagellar transport proteins. Nature 426 83–87.
Hubbert C, Guardiola A, Shao R, Kawaguchi Y, Ito A, Nixon A, Yoshida M, Wang X-F & Yao T-P 2002 HDAC6 is a microtubule-associated deacetylase. Nature 417 455–458.
Huber W, Carey VJ, Gentleman R, Anders S, Carlson M, Carvalho BS, Bravo HC, Davis S, Gatto L, Girke T et al. 2015 Orchestrating high-throughput genomic analysis with Bioconductor. Nat Meth 12 115–121.
Hui AS, Striet JB, Gudelsky G, Soukhova GK, Gozal E, Beitner-Johnson D, Guo S-Z, Sachleben LR, Haycock JW, Gozal D et al. 2003 Regulation of catecholamines by sustained and intermittent hypoxia in neuroendocrine cells and sympathetic neurons. Hypertension (Dallas, Tex. : 1979) 42 1130–1136.
van Hulsteijn LT, van Duinen N, Verbist BM, Jansen JC, van der Klaauw AA, Smit JWA & Corssmit EPM 2013 Effects of octreotide therapy in progressive head and neck paragangliomas: Case series. Head & Neck 35 E391–E396.
van Hulsteijn LT, Niemeijer ND, Dekkers OM & Corssmit EPM 2014 (131)I-MIBG therapy for malignant paraganglioma and phaeochromocytoma: systematic review and meta-analysis. Clinical Endocrinology 80 487–501.
Hurd TW, Fan S & Margolis BL 2011 Localization of retinitis pigmentosa 2 to cilia is regulated by Importin 2. Journal of Cell Science 124 718–726.
Ignatiadis N, Klaus B, Zaugg JB & Huber W 2016 Data-driven hypothesis weighting increases detection power in genome-scale multiple testing. Nat Meth 13 577–580.

278
Ilias I, Chen CC, Carrasquillo JA, Whatley M, Ling A, Lazúrová I, Adams KT, Perera S & Pacak K 2008 Comparison of 6-18F-fluorodopamine PET with 123I-metaiodobenzylguanidine and 111in-pentetreotide scintigraphy in localization of nonmetastatic and metastatic pheochromocytoma. Journal of Nuclear Medicine : Official Publication, Society of Nuclear Medicine 49 1613–1619.
Inaba H, Goto H, Kasahara K, Kumamoto K, Yonemura S, Inoko A, Yamano S, Wanibuchi H, He D, Goshima N et al. 2016 Ndel1 suppresses ciliogenesis in proliferating cells by regulating the trichoplein–Aurora A pathway. The Journal of Cell Biology 212 409–423.
Ingham PW 2001 Hedgehog signaling in animal development: paradigms and principles. Genes & Development 15 3059–3087.
Inoko A, Matsuyama M, Goto H, Ohmuro-Matsuyama Y, Hayashi Y, Enomoto M, Ibi M, Urano T, Yonemura S, Kiyono T et al. 2012 Trichoplein and Aurora A block aberrant primary cilia assembly in proliferating cells. The Journal of Cell Biology 197 391–405.
Insel PA 1989 Structure and function of alpha-adrenergic receptors. The American Journal of Medicine 87 12S-18S.
Iomini C, Babaev-Khaimov V, Sassaroli M & Piperno G 2001 Protein particles in Chlamydomonas flagella undergo a transport cycle consisting of four phases. The Journal of Cell Biology 153 13–24.
Isaacs JS, Jung YJ, Mole DR, Lee S, Torres-Cabala C, Chung Y-L, Merino M, Trepel J, Zbar B, Toro J et al. 2005 HIF overexpression correlates with biallelic loss of fumarate hydratase in renal cancer: Novel role of fumarate in regulation of HIF stability. Cancer Cell 8 143–153.
Ivan M, Kondo K, Yang H, Kim W, Valiando J, Ohh M, Salic A, Asara JM, Lane WS & Kaelin WG 2001 HIFalpha Targeted for VHL-Mediated Destruction by Proline Hydroxylation: Implications for O2 Sensing. Science 292 464–468.
Iwanaga T, Hozumi Y & Takahashi-Iwanaga H 2011a Immunohistochemical demonstration of dopamine receptor D2R in the primary cilia of the mouse pituitary gland. Biomedical Research (Tokyo, Japan) 32 225–235.
Iwanaga T, Miki T & Takahashi-Iwanaga H 2011b Restricted expression of somatostatin receptor 3 to primary cilia in the pancreatic islets and adenohypophysis of mice. Biomedical Research (Tokyo, Japan) 32 73–81.
Izawa I, Goto H, Kasahara K & Inagaki M 2015 Current topics of functional links between primary cilia and cell cycle. Cilia 4 12.
Jaakkola P, Mole DR, Tian Y-M, Wilson MI, Gielbert J, Gaskell SJ, Kriegsheim A v., Hebestreit HF, Mukherji M, Schofield CJ et al. 2001 Targeting of HIF-alpha to the von Hippel-Lindau Ubiquitylation Complex by O2-Regulated Prolyl Hydroxylation. Science 292 468–472.
Jalil ND, Pattou FN, Combemale F, Chapuis Y, Henry JF, Peix JL & Proye CA 1998 Effectiveness and limits of preoperative imaging studies for the localisation of pheochromocytomas and paragangliomas: a review of 282 cases. French Association of Surgery (AFC), and The French Association of Endocrine Surgeons (AFCE). The European Journal of Surgery 164 23–28.
James MF 1989 Use of magnesium sulphate in the anaesthetic management of phaeochromocytoma: a review of 17 anaesthetics. British Journal of Anaesthesia 62 616–623.
Janeway KA, Kim SY, Lodish M, Nose V, Rustin P, Gaal J, Dahia PLM, Liegl B, Ball ER, Raygada M et al.
279
2011 Defects in succinate dehydrogenase in gastrointestinal stromal tumors lacking KIT and PDGFRA mutations. Proceedings of the National Academy of Sciences 108 314–318.
Jang C-Y, Coppinger JA, Seki A, Yates JR & Fang G 2009 Plk1 and Aurora A regulate the depolymerase activity and the cellular localization of Kif2a. Journal of Cell Science 122 1334–1341.
Janssen I, Blanchet EM, Adams K, Chen CC, Millo CM, Herscovitch P, Taieb D, Kebebew E, Lehnert H, Fojo AT et al. 2015 Superiority of [68Ga]-DOTATATE PET/CT to Other Functional Imaging Modalities in the Localization of SDHB-Associated Metastatic Pheochromocytoma and Paraganglioma. Clinical Cancer Research 21 3888–3895.
Jasim S, Suman VJ, Jimenez C, Harris P, Sideras K, Burton JK, Worden FP, Auchus RJ & Bible KC 2017 Phase II trial of pazopanib in advanced/progressive malignant pheochromocytoma and paraganglioma. Endocrine 57 220–225.
Jasperson KW, Kohlmann W, Gammon A, Slack H, Buchmann L, Hunt J, Kirchhoff AC, Baskin H, Shaaban A & Schiffman JD 2014 Role of rapid sequence whole-body MRI screening in SDH-associated hereditary paraganglioma families. Familial Cancer 13 257–265.
Jaulin F & Kreitzer G 2010 KIF17 stabilizes microtubules and contributes to epithelial morphogenesis by acting at MT plus ends with EB1 and APC. The Journal of Cell Biology 190 443–460.
Jawed I, Velarde M, Därr R, Wolf KI, Adams K, Venkatesan AM, Balasubramaniam S, Poruchynsky MS, Reynolds JC, Pacak K et al. 2018 Continued Tumor Reduction of Metastatic Pheochromocytoma/Paraganglioma Harboring Succinate Dehydrogenase Subunit B Mutations with Cyclical Chemotherapy. Cellular and Molecular Neurobiology 38 1099–1106.
Jenks AD, Vyse S, Wong JP, Kostaras E, Keller D, Burgoyne T, Shoemark A, Tsalikis A, de la Roche M, Michaelis M et al. 2018 Primary Cilia Mediate Diverse Kinase Inhibitor Resistance Mechanisms in Cancer. Cell Reports 23 3042–3055.
Jensen CG, Davison EA, Bowser SS & Rieder CL 1987 Primary cilia cycle in PtK1 cells: Effects of colcemid and taxol on cilia formation and resorption. Cell Motility and the Cytoskeleton 7 187–197.
Jimbo T, Kawasaki Y, Koyama R, Sato R, Takada S, Haraguchi K & Akiyama T 2002 Identification of a link between the tumour suppressor APC and the kinesin superfamily. Nature Cell Biology 4 323–327.
Jin H, White SR, Shida T, Schulz S, Aguiar M, Gygi SP, Bazan JF & Nachury M V. 2010 The Conserved Bardet-Biedl Syndrome Proteins Assemble a Coat that Traffics Membrane Proteins to Cilia. Cell 141 1208–1219.
Jin X, Mohieldin AM, Muntean BS, Green JA, Shah J V, Mykytyn K & Nauli SM 2014 Cilioplasm is a cellular compartment for calcium signaling in response to mechanical and chemical stimuli. Cellular and Molecular Life Sciences : CMLS 71 2165–2178.
Johns DW, Ayers CR & Carey RM 1984 The dopamine agonist bromocriptine induces hypotension by venous and arteriolar dilation. Journal of Cardiovascular Pharmacology 6 582–587.
Johnson KA & Rosenbaum JL 1992 Polarity of flagellar assembly in Chlamydomonas. The Journal of Cell Biology 119 1605–1611.
Johnson TS, Young JB & Landsberg L 1983 Sympathoadrenal responses to acute and chronic hypoxia in the rat. The Journal of Clinical Investigation 71 1263–1272.

280
Johnson ET, Nicola T, Roarty K, Yoder BK, Haycraft CJ & Serra R 2008 Role for primary cilia in the regulation of mouse ovarian function. Developmental Dynamics : An Official Publication of the American Association of Anatomists 237 2053–2060.
Jones DH, Allison DJ, Hamilton CA & Reid JL 1979 Selective venous sampling in the diagnosis and localization of phaeochromocytoma. Clinical Endocrinology 10 179–186.
Jones C, Roper VC, Foucher I, Qian D, Banizs B, Petit C, Yoder BK & Chen P 2008 Ciliary proteins link basal body polarization to planar cell polarity regulation. Nature Genetics 40 69–77.
de Jong WHA, Eisenhofer G, Post WJ, Muskiet FAJ, de Vries EGE & Kema IP 2009 Dietary influences on plasma and urinary metanephrines: implications for diagnosis of catecholamine-producing tumors. The Journal of Clinical Endocrinology and Metabolism 94 2841–2849.
Kaelin WG 2008 The von Hippel-Lindau tumour suppressor protein: O2 sensing and cancer. Nature Reviews. Cancer 8 865–873.
Kahaly G, Krause U, Ritthaler H, Cordes U, Günther R, Schrezenmeir J & Beyer J 1985 Selective blood sampling in adrenal hypertension. Cardiology 72 Suppl 1 179–181.
Kaluza D, Kroll J, Gesierich S, Yao T-P, Boon RA, Hergenreider E, Tjwa M, Rössig L, Seto E, Augustin HG et al. 2011 Class IIb HDAC6 regulates endothelial cell migration and angiogenesis by deacetylation of cortactin. The EMBO Journal 30 4142–4156.
Katayama H, Sasai K, Kawai H, Yuan Z-M, Bondaruk J, Suzuki F, Fujii S, Arlinghaus RB, Czerniak BA & Sen S 2004 Phosphorylation by aurora kinase A induces Mdm2-mediated destabilization and inhibition of p53. Nature Genetics 36 55–62.
Kathem SH, Mohieldin AM, Abdul-Majeed S, Ismail SH, Altaei QH, Alshimmari IK, Alsaidi MM, Khammas H, Nauli AM, Joe B et al. 2014 Ciliotherapy: a novel intervention in polycystic kidney disease. Journal of Geriatric Cardiology : JGC 11 63–73.
Kawachi Y, Maruyama H, Ishitsuka Y, Fujisawa Y, Furuta J, Nakamura Y, Ichikawa E, Furumura M & Otsuka F 2013 NF1 gene silencing induces upregulation of vascular endothelial growth factor expression in both Schwann and non-Schwann cells. Experimental Dermatology 22 262–265.
Kee HL, Dishinger JF, Lynne Blasius T, Liu C-J, Margolis B & Verhey KJ 2012 A size-exclusion permeability barrier and nucleoporins characterize a ciliary pore complex that regulates transport into cilia. Nature Cell Biology 14 431–437.
van Keimpema L, Nevens F, Vanslembrouck R, van Oijen MGH, Hoffmann AL, Dekker HM, de Man RA & Drenth JPH 2009 Lanreotide reduces the volume of polycystic liver: a randomized, double-blind, placebo-controlled trial. Gastroenterology 137 1661-8.e1-2.
Keiser HR, Goldstein DS, Wade JL, Douglas FL & Averbuch SD 1985 Treatment of malignant pheochromocytoma with combination chemotherapy. Hypertension (Dallas, Tex. : 1979) 7 I18-24.
Kerkhoff E, Bister K & Klempnauer KH 1991 Sequence-specific DNA binding by Myc proteins. Proceedings of the National Academy of Sciences of the United States of America 88 4323–4327.
Khan NA, Willemarck N, Talebi A, Marchand A, Binda MM, Dehairs J, Rueda-Rincon N, Daniels VW, Bagadi M, Raj DBTG et al. 2016 Identification of drugs that restore primary cilium expression in cancer cells. Oncotarget 7 9975–9992.

281
Khorram-Manesh A, Ahlman H, Nilsson O, Odén A & Jansson S 2004 Mortality associated with pheochromocytoma in a large Swedish cohort. European Journal of Surgical Oncology 30 556–559.
Kibel A, Iliopoulos O, DeCaprio JA & Kaelin WG 1995 Binding of the von Hippel-Lindau tumor suppressor protein to Elongin B and C. Science (New York, N.Y.) 269 1444–1446.
Kim WY, Safran M, Buckley MRM, Ebert BL, Glickman J, Bosenberg M, Regan M & Kaelin WG 2006a Failure to prolyl hydroxylate hypoxia-inducible factor alpha phenocopies VHL inactivation in vivo. The EMBO Journal 25 4650–4662.
Kim M, Gans JD, Nogueira C, Wang A, Paik J-H, Feng B, Brennan C, Hahn WC, Cordon-Cardo C, Wagner SN et al. 2006b Comparative Oncogenomics Identifies NEDD9 as a Melanoma Metastasis Gene. Cell 125 1269–1281.
Kim S, Zaghloul NA, Bubenshchikova E, Oh EC, Rankin S, Katsanis N, Obara T & Tsiokas L 2011a Nde1-mediated inhibition of ciliogenesis affects cell cycle re-entry. Nature Cell Biology 13 351–360.
Kim J, Dabiri S & Seeley ES 2011b Primary cilium depletion typifies cutaneous melanoma in situ and malignant melanoma. PloS One 6 e27410.
Kim JI, Kim J, Jang H-S, Noh MR, Lipschutz JH & Park KM 2013 Reduction of oxidative stress during recovery accelerates normalization of primary cilia length that is altered after ischemic injury in murine kidneys. American Journal of Physiology-Renal Physiology 304 F1283–F1294.
Kim S, Lee K, Choi J-H, Ringstad N & Dynlacht BD 2015 Nek2 activation of Kif24 ensures cilium disassembly during the cell cycle. Nature Communications 6 8087.
Kim JH, Ki SM, Joung J-G, Scott E, Heynen-Genel S, Aza-Blanc P, Kwon CH, Kim J, Gleeson JG & Lee JE 2016 Genome-wide screen identifies novel machineries required for both ciliogenesis and cell cycle arrest upon serum starvation. Biochimica et Biophysica Acta (BBA) - Molecular Cell Research 1863 1307–1318.
Kimura N, Schindler M, Kasai N & Kimura I 2001 Immunohistochemical localization of somatostatin receptor type 2A in rat and human tissues. Endocrine Journal 48 95–102.
Kimura N, Takayanagi R, Takizawa N, Itagaki E, Katabami T, Kakoi N, Rakugi H, Ikeda Y, Tanabe A, Nigawara T et al. 2014 Pathological grading for predicting metastasis in phaeochromocytoma and paraganglioma. Endocrine Related Cancer 21 405–414.
Kinzel D, Boldt K, Davis EE, Burtscher I, Trümbach D, Diplas B, Attié-Bitach T, Wurst W, Katsanis N, Ueffing M et al. 2010 Pitchfork regulates primary cilia disassembly and left-right asymmetry. Developmental Cell 19 66–77.
Kitagawa K, Kotake Y & Kitagawa M 2009 Ubiquitin-mediated control of oncogene and tumor suppressor gene products. Cancer Science 100 1374–1381.
Klein A, Flügel D & Kietzmann T 2008 Transcriptional Regulation of Serine/Threonine Kinase-15 (STK15) Expression by Hypoxia and HIF-1. Molecular Biology of the Cell 19 3667–3675.
Klesse LJ & Parada LF 1998 p21 ras and phosphatidylinositol-3 kinase are required for survival of wild-type and NF1 mutant sensory neurons. The Journal of Neuroscience : The Official Journal of the Society for Neuroscience 18 10420–10428.
Knauth K, Cartwright E, Freund S, Bycroft M & Buchberger A 2009 VHL mutations linked to type 2C

282
von Hippel-Lindau disease cause extensive structural perturbations in pVHL. The Journal of Biological Chemistry 284 10514–10522.
Kobayashi T, Tsang WY, Li J, Lane W & Dynlacht BD 2011 Centriolar Kinesin Kif24 Interacts with CP110 to Remodel Microtubules and Regulate Ciliogenesis. Cell 145 914–925.
Kobayashi H, Kawauchi D, Hashimoto Y, Ogata T & Murakami F 2013 The control of precerebellar neuron migration by RNA-binding protein Csde1. Neuroscience 253 292–303.
Kobayashi T, Nakazono K, Tokuda M, Mashima Y, Dynlacht BD & Itoh H 2017 HDAC2 promotes loss of primary cilia in pancreatic ductal adenocarcinoma. EMBO Reports 18 334–343.
Kocak S, Aydintug S & Canakci N 2002 Alpha blockade in preoperative preparation of patients with pheochromocytomas. International Surgery 87 191–194.
Koivunen P, Hirsilä M, Remes AM, Hassinen IE, Kivirikko KI & Myllyharju J 2007 Inhibition of Hypoxia-inducible Factor (HIF) Hydroxylases by Citric Acid Cycle Intermediates. Journal of Biological Chemistry 282 4524–4532.
Kong D, Park EJ, Stephen AG, Calvani M, Cardellina JH, Monks A, Fisher RJ, Shoemaker RH & Melillo G 2005 Echinomycin, a Small-Molecule Inhibitor of Hypoxia-Inducible Factor-1 DNA-Binding Activity. Cancer Research 65 9047–9055.
Kong JH, Yang L, Dessaud E, Chuang K, Moore DM, Rohatgi R, Briscoe J & Novitch BG 2015 Notch activity modulates the responsiveness of neural progenitors to sonic hedgehog signaling. Developmental Cell 33 373–387.
Kong G, Grozinsky-Glasberg S, Hofman MS, Callahan J, Meirovitz A, Maimon O, Pattison DA, Gross DJ & Hicks RJ 2017 Efficacy of Peptide Receptor Radionuclide Therapy for Functional Metastatic Paraganglioma and Pheochromocytoma. The Journal of Clinical Endocrinology & Metabolism 102 3278–3287.
Kong MJ, Bak SH, Han K-H, Kim JI, Park J-W & Park KM 2019 Fragmentation of kidney epithelial cell primary cilia occurs by cisplatin and these cilia fragments are excreted into the urine. Redox Biology 20 38–45.
Kontak AC, Wang Z, Arbique D, Adams-Huet B, Auchus RJ, Nesbitt SD, Victor RG & Vongpatanasin W 2010 Reversible sympathetic overactivity in hypertensive patients with primary aldosteronism. The Journal of Clinical Endocrinology and Metabolism 95 4756–4761.
Koriyama N, Kakei M, Yaekura K, Okui H, Yamashita T, Nishimura H, Matsushita S & Tei C 2000 Control of Catecholamine Release and Blood Pressure with Octreotide in a Patient with Pheochromocytoma: A Case Report with in vitro Studies. Hormone Research in Paediatrics 53 46–50.
Korpershoek E, Favier J, Gaal J, Burnichon N, van Gessel B, Oudijk L, Badoual C, Gadessaud N, Venisse A, Bayley J-P et al. 2011 SDHA Immunohistochemistry Detects Germline SDHA Gene Mutations in Apparently Sporadic Paragangliomas and Pheochromocytomas. The Journal of Clinical Endocrinology & Metabolism 96 E1472–E1476.
Korpershoek E, Petri B-J, Post E, van Eijck CHJ, Oldenburg RA, Belt EJT, de Herder WW, de Krijger RR & Dinjens WNM 2014 Adrenal medullary hyperplasia is a precursor lesion for pheochromocytoma in MEN2 syndrome. Neoplasia (New York, N.Y.) 16 868–873.
Korpershoek E, Koffy D, Eussen BH, Oudijk L, Papathomas TG, van Nederveen FH, Belt EJT, Franssen

283
GJH, Restuccia DFJ, Krol NMG et al. 2016 Complex MAX Rearrangement in a Family With Malignant Pheochromocytoma, Renal Oncocytoma, and Erythrocytosis. The Journal of Clinical Endocrinology & Metabolism 101 453–460.
Kovacs JJ, Murphy PJM, Gaillard S, Zhao X, Wu J-T, Nicchitta C V., Yoshida M, Toft DO, Pratt WB & Yao T-P 2005 HDAC6 Regulates Hsp90 Acetylation and Chaperone-Dependent Activation of Glucocorticoid Receptor. Molecular Cell 18 601–607.
Kowal TJ & Falk MM 2015 Primary cilia found on HeLa and other cancer cells. Cell Biology International 39 1341–1347.
Kozminski KG, Johnson KA, Forscher P & Rosenbaum JL 1993 A motility in the eukaryotic flagellum unrelated to flagellar beating. Proceedings of the National Academy of Sciences of the United States of America 90 5519–5523.
Krsek M, Rosická M, Nedvídková J, Kvasnicková H, Hána V, Marek J, Haluzík M, Lai EW & Pacák K 2006 Increased lipolysis of subcutaneous abdominal adipose tissue and altered noradrenergic activity in patients with Cushing’s syndrome: an in-vivo microdialysis study. Physiological Research / Academia Scientiarum Bohemoslovaca 55 421–428.
Kubota A, Yamada Y, Kagimoto S, Shimatsu A, Imamura M, Tsuda K, Imura H, Seino S & Seino Y 1994 Identification of somatostatin receptor subtypes and an implication for the efficacy of somatostatin analogue SMS 201-995 in treatment of human endocrine tumors. The Journal of Clinical Investigation 93 1321–1325.
Kuhns S, Schmidt KN, Reymann J, Gilbert DF, Neuner A, Hub B, Carvalho R, Wiedemann P, Zentgraf H, Erfle H et al. 2013 The microtubule affinity regulating kinase MARK4 promotes axoneme extension during early ciliogenesis. The Journal of Cell Biology 200 505–522.
Kunst HPM, Rutten MH, de Monnink J-P, Hoefsloot LH, Timmers HJLM, Marres HAM, Jansen JC, Kremer H, Bayley J-P & Cremers CWRJ 2011 SDHAF2 (PGL2-SDH5) and Hereditary Head and Neck Paraganglioma. Clinical Cancer Research 17 247–254.
Kuok C-H, Yen C-R, Huang C-S, Ko Y-P & Tsai P-S 2011 Cardiovascular collapse after labetalol for hypertensive crisis in an undiagnosed pheochromocytoma during cesarean section. Acta Anaesthesiologica Taiwanica 49 69–71.
Lack EE 1977 Carotid body hypertrophy in patients with cystic fibrosis and cyanotic congenital heart disease. Human Pathology 8 39–51.
Lack EE 1978 Hyperplasia of vagal and carotid body paraganglia in patients with chronic hypoxemia. The American Journal of Pathology 91 497–516.
Ladroue C, Carcenac R, Leporrier M, Gad S, Le Hello C, Galateau-Salle F, Feunteun J, Pouysségur J, Richard S & Gardie B 2008 PHD2 mutation and congenital erythrocytosis with paraganglioma. The New England Journal of Medicine 359 2685–2692.
Laidler P & Kay JM 1975 A quantitative morphological study of the carotid bodies of rats living at a simulated altitude of 4300 metres. The Journal of Pathology 117 183–191.
Laidler P & Kay JM 1978 Ultrastructure of carotid body in rats living at a simulated altitude of 4300 metres. The Journal of Pathology 124 27–33.
Lancaster MA, Schroth J & Gleeson JG 2011 Subcellular spatial regulation of canonical Wnt signalling at the primary cilium. Nature Cell Biology 13 700–707.

284
Landschulz WH, Johnson PF & McKnight SL 1988 The leucine zipper: a hypothetical structure common to a new class of DNA binding proteins. Science (New York, N.Y.) 240 1759–1764.
Latif F, Tory K, Gnarra J, Yao M, Duh FM, Orcutt ML, Stackhouse T, Kuzmin I, Modi W & Geil L 1993 Identification of the von Hippel-Lindau disease tumor suppressor gene. Science (New York, N.Y.) 260 1317–1320.
Lau JHG, Sze WCC, Reznek RH, Matson M, Sahdev A, Carpenter R, Berney DM, Akker SA, Chew SL, Grossman AB et al. 2012 A prospective evaluation of postural stimulation testing, computed tomography and adrenal vein sampling in the differential diagnosis of primary aldosteronism. Clinical Endocrinology 76 182–188.
Lavagnino M, Oslapas AN, Gardner KL & Arnoczky SP 2016 Hypoxia inhibits primary cilia formation and reduces cell-mediated contraction in stress-deprived rat tail tendon fascicles. Muscles, Ligaments and Tendons Journal 6 193–197.
Lebuffe G, Dosseh ED, Tek G, Tytgat H, Moreno S, Tavernier B, Vallet B & Proye CAG 2005 The effect of calcium channel blockers on outcome following the surgical treatment of phaeochromocytomas and paragangliomas. Anaesthesia 60 439–444.
Lee S, Nakamura E, Yang H, Wei W, Linggi MS, Sajan MP, Farese R V, Freeman RS, Carter BD, Kaelin WG et al. 2005 Neuronal apoptosis linked to EglN3 prolyl hydroxylase and familial pheochromocytoma genes: developmental culling and cancer. Cancer Cell 8 155–167.
Lee KH, Johmura Y, Yu L-R, Park J-E, Gao Y, Bang JK, Zhou M, Veenstra TD, Yeon Kim B & Lee KS 2012a Identification of a novel Wnt5a-CK1ɛ-Dvl2-Plk1-mediated primary cilia disassembly pathway. The EMBO Journal 31 3104–3117.
Lee JE, Silhavy JL, Zaki MS, Schroth J, Bielas SL, Marsh SE, Olvera J, Brancati F, Iannicelli M, Ikegami K et al. 2012b CEP41 is mutated in Joubert syndrome and is required for tubulin glutamylation at the cilium. Nature Genetics 44 193–199.
Lee J, Yi S, Kang YE, Chang JY, Kim JT, Sul HJ, Kim JO, Kim JM, Kim J, Porcelli AM et al. 2016 Defective ciliogenesis in thyroid hürthle cell tumors is associated with increased autophagy. Oncotarget 7 79117–79130.
Lee J, Yi S, Won M, Song YS, Yi H-S, Park YJ, Park KC, Kim JT, Chang JY, Lee MJ et al. 2018 Loss-of-function of IFT88 determines metabolic phenotypes in thyroid cancer. Oncogene 37 4455–4474.
Légaré S, Chabot C & Basik M 2017 SPEN, a new player in primary cilia formation and cell migration in breast cancer. Breast Cancer Research 19 104.
Lehmann M & Keul J 1986 Urinary excretion of free noradrenaline and adrenaline related to age, sex and hypertension in 265 individuals. European Journal of Applied Physiology and Occupational Physiology 55 14–18.
De Lellis RA, Lloyd R V, Heitz P & Eng C 2004 World Health Organization Classification of Tumours: Pathology and Genetics of Tumours of Endocrine Organs. Lyon, France: IARC Press.
Lenders JW, Keiser HR, Goldstein DS, Willemsen JJ, Friberg P, Jacobs MC, Kloppenborg PW, Thien T & Eisenhofer G 1995 Plasma metanephrines in the diagnosis of pheochromocytoma. Annals of Internal Medicine 123 101–109.
Lenders JWM, Pacak K, Walther MM, Linehan WM, Mannelli M, Friberg P, Keiser HR, Goldstein DS &

285
Eisenhofer G 2002 Biochemical diagnosis of pheochromocytoma: which test is best? JAMA 287 1427–1434.
Lenders JWM, Eisenhofer G, Mannelli M & Pacak K 2005 Phaeochromocytoma. Lancet (London, England) 366 665–675.
Lenders JWM, Willemsen JJ, Eisenhofer G, Ross HA, Pacak K, Timmers HJLM & Sweep CGJF 2007 Is supine rest necessary before blood sampling for plasma metanephrines? Clinical Chemistry 53 352–354.
Lenders JWM, Duh Q-Y, Eisenhofer G, Gimenez-Roqueplo A-P, Grebe SKG, Murad MH, Naruse M, Pacak K, Young WF & Endocrine Society 2014 Pheochromocytoma and Paraganglioma: An Endocrine Society Clinical Practice Guideline. The Journal of Clinical Endocrinology & Metabolism 99 1915–1942.
Lesche S, Lehmann D, Nagel F, Schmid HA & Schulz S 2009 Differential Effects of Octreotide and Pasireotide on Somatostatin Receptor Internalization and Trafficking in Vitro. The Journal of Clinical Endocrinology & Metabolism 94 654–661.
Letouzé E, Martinelli C, Loriot C, Burnichon N, Abermil N, Ottolenghi C, Janin M, Menara M, Nguyen AT, Benit P et al. 2013 SDH mutations establish a hypermethylator phenotype in paraganglioma. Cancer Cell 23 739–752.
Li ML, Fitzgerald PA, Price DC & Norton JA 2001 Iatrogenic pheochromocytomatosis: a previously unreported result of laparoscopic adrenalectomy. Surgery 130 1072–1077.
Li A, Saito M, Chuang J-Z, Tseng Y-Y, Dedesma C, Tomizawa K, Kaitsuka T & Sung C-H 2011 Ciliary transition zone activation of phosphorylated Tctex-1 controls ciliary resorption, S-phase entry and fate of neural progenitors. Nature Cell Biology 13 402–411.
Li L, Grausam KB, Wang J, Lun MP, Ohli J, Lidov HGW, Calicchio ML, Zeng E, Salisbury JL, Wechsler-Reya RJ et al. 2016 Sonic Hedgehog promotes proliferation of Notch-dependent monociliated choroid plexus tumour cells. Nature Cell Biology 18 418–430.
Liberzon A, Birger C, Thorvaldsdóttir H, Ghandi M, Mesirov JP & Tamayo P 2015 The Molecular Signatures Database Hallmark Gene Set Collection. Cell Systems 1 417–425.
Liem KF, He M, Ocbina PJR & Anderson K V. 2009 Mouse Kif7/Costal2 is a cilia-associated protein that regulates Sonic hedgehog signaling. Proceedings of the National Academy of Sciences 106 13377–13382.
Lin F, Hiesberger T, Cordes K, Sinclair AM, Goldstein LSB, Somlo S & Igarashi P 2003 Kidney-specific inactivation of the KIF3A subunit of kinesin-II inhibits renal ciliogenesis and produces polycystic kidney disease. Proceedings of the National Academy of Sciences 100 5286–5291.
Lindau A 1927 Zur Frage der Angiomatosis Retinae und Ihrer Hirncomplikation. ActaOphthal 4 193–226.
Liu Q, Kaneko S, Yang L, Feldman RI, Nicosia S V., Chen J & Cheng JQ 2004 Aurora-A Abrogation of p53 DNA Binding and Transactivation Activity by Phosphorylation of Serine 215. Journal of Biological Chemistry 279 52175–52182.
Liu A, Wang B & Niswander LA 2005 Mouse intraflagellar transport proteins regulate both the activator and repressor functions of Gli transcription factors. Development 132 3103–3111.

286
Liu YP, Tsai I-C, Morleo M, Oh EC, Leitch CC, Massa F, Lee B-H, Parker DS, Finley D, Zaghloul NA et al. 2014 Ciliopathy proteins regulate paracrine signaling by modulating proteasomal degradation of mediators. Journal of Clinical Investigation 124 2059–2070.
Lo CY, Lam KY, Wat MS & Lam KS 2000 Adrenal pheochromocytoma remains a frequently overlooked diagnosis. American Journal of Surgery 179 212–215.
Loh KC, Fitzgerald PA, Matthay KK, Yeo PP & Price DC 1997 The treatment of malignant pheochromocytoma with iodine-131 metaiodobenzylguanidine (131I-MIBG): a comprehensive review of 116 reported patients. Journal of Endocrinological Investigation 20 648–658.
Lolkema MP, Mans DA, Snijckers CM, van Noort M, van Beest M, Voest EE & Giles RH 2007 The von Hippel-Lindau tumour suppressor interacts with microtubules through kinesin-2. FEBS Letters 581 4571–4576.
Lolkema MP, Mans DA, Ulfman LH, Volpi S, Voest EE & Giles RH 2008 Allele-specific regulation of primary cilia function by the von Hippel-Lindau tumor suppressor. European Journal of Human Genetics : EJHG 16 73–78.
López-Jiménez E, de Campos JM, Kusak EM, Landa I, Leskelä S, Montero-Conde C, Leandro-García LJ, Vallejo LA, Madrigal B, Rodríguez-Antona C et al. 2008 SDHC mutation in an elderly patient without familial antecedents. Clinical Endocrinology 69 906–910.
Lorenzo FR, Yang C, Ng Tang Fui M, Vankayalapati H, Zhuang Z, Huynh T, Grossmann M, Pacak K & Prchal JT 2013 A novel EPAS1/HIF2A germline mutation in a congenital polycythemia with paraganglioma. Journal of Molecular Medicine 91 507–512.
Lorenzo Pisarello M, Masyuk T V., Gradilone SA, Masyuk AI, Ding JF, Lee P-Y & LaRusso NF 2018 Combination of a Histone Deacetylase 6 Inhibitor and a Somatostatin Receptor Agonist Synergistically Reduces Hepatorenal Cystogenesis in an Animal Model of Polycystic Liver Disease. The American Journal of Pathology 188 981–994.
Loskutov Y V., Griffin CL, Marinak KM, Bobko A, Margaryan N V., Geldenhuys WJ, Sarkaria JN & Pugacheva EN 2018 LPA signaling is regulated through the primary cilium: a novel target in glioblastoma. Oncogene 37 1457–1471.
Love MI, Huber W & Anders S 2014 Moderated estimation of fold change and dispersion for RNA-seq data with DESeq2. Genome Biology 15 550.
Lovejoy CA, Li W, Reisenweber S, Thongthip S, Bruno J, de Lange T, De S, Petrini JHJ, Sung PA, Jasin M et al. 2012 Loss of ATRX, Genome Instability, and an Altered DNA Damage Response Are Hallmarks of the Alternative Lengthening of Telomeres Pathway. PLoS Genetics 8 e1002772.
Luchetti A, Walsh D, Rodger F, Clark G, Martin T, Irving R, Sanna M, Yao M, Robledo M, Neumann HPH et al. 2015 Profiling of Somatic Mutations in Phaeochromocytoma and Paraganglioma by Targeted Next Generation Sequencing Analysis. International Journal of Endocrinology 2015 1–8.
Lumachi F, Tregnaghi A, Zucchetta P, Cristina Marzola M, Cecchin D, Grassetto G & Bui F 2006 Sensitivity and positive predictive value of CT, MRI and 123I-MIBG scintigraphy in localizing pheochromocytomas: a prospective study. Nuclear Medicine Communications 27 583–587.
Luo M, Cao M, Kan Y, Li G, Snell W & Pan J 2011 The Phosphorylation State of an Aurora-Like Kinase Marks the Length of Growing Flagella in Chlamydomonas. Current Biology 21 586–591.
287
Lutz MS & Burk RD 2006 Primary cilium formation requires von hippel-lindau gene function in renal-derived cells. Cancer Research 66 6903–6907.
Ma W, Tessarollo L, Hong S-B, Baba M, Southon E, Back TC, Spence S, Lobe CG, Sharma N, Maher GW et al. 2003 Hepatic vascular tumors, angiectasis in multiple organs, and impaired spermatogenesis in mice with conditional inactivation of the VHL gene. Cancer Research 63 5320–5328.
MacKenzie ED, Selak MA, Tennant DA, Payne LJ, Crosby S, Frederiksen CM, Watson DG & Gottlieb E 2007 Cell-permeating alpha-ketoglutarate derivatives alleviate pseudohypoxia in succinate dehydrogenase-deficient cells. Molecular and Cellular Biology 27 3282–3289.
Maher ER, Neumann HP & Richard S 2011 von Hippel-Lindau disease: a clinical and scientific review. Eur J Hum Genet 19 617–623.
Mahjoub MR, Qasim Rasi M & Quarmby LM 2004 A NIMA-related Kinase, Fa2p, Localizes to a Novel Site in the Proximal Cilia of Chlamydomonas and Mouse Kidney Cells. Molecular Biology of the Cell 15 5172–5186.
Mahoney NM, Goshima G, Douglass AD & Vale RD 2006 Making Microtubules and Mitotic Spindles in Cells without Functional Centrosomes. Current Biology 16 564–569.
Mannelli M, Lanzillotti R, Pupilli C, Ianni L, Conti A & Serio M 1994 Adrenal medulla secretion in Cushing’s syndrome. The Journal of Clinical Endocrinology and Metabolism 78 1331–1335.
Manning DK, Sergeev M, van Heesbeen RG, Wong MD, Oh J-H, Liu Y, Henkelman RM, Drummond I, Shah J V. & Beier DR 2013 Loss of the Ciliary Kinase Nek8 Causes Left-Right Asymmetry Defects. Journal of the American Society of Nephrology 24 100–112.
Mans DA, Voest EE & Giles RH 2008 All along the watchtower: is the cilium a tumor suppressor organelle? Biochimica et Biophysica Acta 1786 114–125.
Mansini AP, Lorenzo Pisarello MJ, Thelen KM, Cruz-Reyes M, Peixoto E, Jin S, Howard BN, Trussoni CE, Gajdos GB, LaRusso NF et al. 2018 MicroRNA (miR)-433 and miR-22 dysregulations induce histone-deacetylase-6 overexpression and ciliary loss in cholangiocarcinoma. Hepatology 68 561–573.
Mansini AP, Peixoto E, Jin S, Richard S & Gradilone SA 2019 The chemosensory function of primary cilia regulates cholangiocyte migration, invasion and tumor growth. Hepatology 69 1582–1598.
Mansmann G, Lau J, Balk E, Rothberg M, Miyachi Y & Bornstein SR 2004 The clinically inapparent adrenal mass: update in diagnosis and management. Endocrine Reviews 25 309–340.
Manu P & Runge LA 1984 Biochemical screening for pheochromocytoma. Superiority of urinary metanephrines measurements. American Journal of Epidemiology 120 788–790.
Marchand F 1883 Ueber die accessorischen Nebennieren im Ligamentum latum. Virchows Archiv Für Pathologische Anatomie Und Physiologie Und Fur Klinische Medizin 11–19.
Marley A & von Zastrow M 2012 A simple cell-based assay reveals that diverse neuropsychiatric risk genes converge on primary cilia. PloS One 7 e46647.
Marley A, Choy RW-Y & von Zastrow M 2013 GPR88 reveals a discrete function of primary cilia as selective insulators of GPCR cross-talk. PloS One 8 e70857.
Marshall WF, Qin H, Brenni MR & Rosenbaum JL 2005 Flagellar Length Control System: Testing a

288
Simple Model Based on Intraflagellar Transport and Turnover. Molecular Biology of the Cell 16 270–278.
Martin GA, Viskochil D, Bollag G, McCabe PC, Crosier WJ, Haubruck H, Conroy L, Clark R, O’Connell P & Cawthon RM 1990 The GAP-related domain of the neurofibromatosis type 1 gene product interacts with ras p21. Cell 63 843–849.
Martiniova L, Lai EW, Elkahloun AG, Abu-Asab M, Wickremasinghe A, Solis DC, Perera SM, Huynh T-T, Lubensky IA, Tischler AS et al. 2009 Characterization of an animal model of aggressive metastatic pheochromocytoma linked to a specific gene signature. Clinical & Experimental Metastasis 26 239–250.
Maskey D, Marlin MC, Kim S, Kim S, Ong E-C, Li G & Tsiokas L 2015 Cell cycle-dependent ubiquitylation and destruction of NDE1 by CDK5-FBW7 regulates ciliary length. The EMBO Journal 34 2424–2440.
Maxwell PH, Wiesener MS, Chang G-W, Clifford SC, Vaux EC, Cockman ME, Wykoff CC, Pugh CW, Maher ER & Ratcliffe PJ 1999 The tumour suppressor protein VHL targets hypoxia-inducible factors for oxygen-dependent proteolysis. Nature 399 271–275.
May-Simera HL, Petralia RS, Montcouquiol M, Wang Y-X, Szarama KB, Liu Y, Lin W, Deans MR, Pazour GJ & Kelley MW 2015 Ciliary proteins Bbs8 and Ift20 promote planar cell polarity in the cochlea. Development 142 555–566.
Mazzeo RS, Wolfel EE, Butterfield GE & Reeves JT 1994 Sympathetic response during 21 days at high altitude (4,300 m) as determined by urinary and arterial catecholamines. Metabolism: Clinical and Experimental 43 1226–1232.
McDermott KM, Liu BY, Tlsty TD & Pazour GJ 2010 Primary cilia regulate branching morphogenesis during mammary gland development. Current Biology : CB 20 731–737.
McGlashan SR, Cluett EC, Jensen CG & Poole CA 2008 Primary cilia in osteoarthritic chondrocytes: From chondrons to clusters. Developmental Dynamics 237 2013–2020.
McNeil AR, Blok BH, Koelmeyer TD, Burke MP & Hilton JM 2000 Phaeochromocytomas discovered during coronial autopsies in Sydney, Melbourne and Auckland. Australian and New Zealand Journal of Medicine 30 648–652.
McNeill A, Rattenberry E, Barber R, Killick P, MacDonald F & Maher ER 2009 Genotype-phenotype correlations in VHL exon deletions. American Journal of Medical Genetics Part A 149A 2147–2151.
McWhinney SR, Pasini B & Stratakis CA 2007 Familial gastrointestinal stromal tumors and germ-line mutations. The New England Journal of Medicine 357 1054–1056.
Melmon KL & Rosen SW 1964 Lindau’s disease. Review of the literature and study of a liarge kindred. The American Journal of Medicine 36 595–617.
Menzl I, Lebeau L, Pandey R, Hassounah NB, Li FW, Nagle R, Weihs K & McDermott KM 2014 Loss of primary cilia occurs early in breast cancer development. Cilia 3 7.
Mihailovich M, Militti C, Gabaldón T & Gebauer F 2010 Eukaryotic cold shock domain proteins: highly versatile regulators of gene expression. BioEssays 32 109–118.
Mikule K, Delaval B, Kaldis P, Jurcyzk A, Hergert P & Doxsey S 2007 Loss of centrosome integrity
289
induces p38-p53-p21-dependent G1-S arrest. Nature Cell Biology 9 160–170.
Miller JL, Immelman EJ, Roman TE & Mervis B 1983 Phaeochromocytoma of the urinary bladder localized by selective venous sampling and computed tomography. Postgraduate Medical Journal 59 533–535.
Minn AJ, Gupta GP, Siegel PM, Bos PD, Shu W, Giri DD, Viale A, Olshen AB, Gerald WL & Massagué J 2005 Genes that mediate breast cancer metastasis to lung. Nature 436 518–524.
Miyajima E, Yamada Y, Yoshida Y, Matsukawa T, Shionoiri H, Tochikubo O & Ishii M 1991 Muscle sympathetic nerve activity in renovascular hypertension and primary aldosteronism. Hypertension 17 1057–1062.
Miyamoto T, Hosoba K, Ochiai H, Royba E, Izumi H, Sakuma T, Yamamoto T, Dynlacht BD & Matsuura S 2015 The Microtubule-Depolymerizing Activity of a Mitotic Kinesin Protein KIF2A Drives Primary Cilia Disassembly Coupled with Cell Proliferation. Cell Reports 10 664–673.
Miyoshi K, Kasahara K, Miyazaki I & Asanuma M 2009 Lithium treatment elongates primary cilia in the mouse brain and in cultured cells. Biochemical and Biophysical Research Communications 388 757–762.
Miyoshi K, Kasahara K, Murakami S, Takeshima M, Kumamoto N, Sato A, Miyazaki I, Matsuzaki S, Sasaoka T, Katayama T et al. 2014 Lack of dopaminergic inputs elongates the primary cilia of striatal neurons. PloS One 9 e97918.
Montani M, Heinimann K, von Teichman A, Rudolph T, Perren A & Moch H 2010 VHL-gene deletion in single renal tubular epithelial cells and renal tubular cysts: further evidence for a cyst-dependent progression pathway of clear cell renal carcinoma in von Hippel-Lindau disease. The American Journal of Surgical Pathology 34 806–815.
Moore LE, Nickerson ML, Brennan P, Toro JR, Jaeger E, Rinsky J, Han SS, Zaridze D, Matveev V, Janout V et al. 2011 Von Hippel-Lindau (VHL) inactivation in sporadic clear cell renal cancer: associations with germline VHL polymorphisms and etiologic risk factors. PLoS Genetics 7 e1002312.
Moreno-Manzano V, Rodríguez-Jiménez FJ, Aceña-Bonilla JL, Fustero-Lardíes S, Erceg S, Dopazo J, Montaner D, Stojkovic M & Sánchez-Puelles JM 2010 FM19G11, a New Hypoxia-inducible Factor (HIF) Modulator, Affects Stem Cell Differentiation Status. Journal of Biological Chemistry 285 1333–1342.
Moser JJ, Fritzler MJ & Rattner JB 2009 Primary ciliogenesis defects are associated with human astrocytoma/glioblastoma cells. BMC Cancer 9 448.
Moser SC, Bensaddek D, Ortmann B, Maure J-F, Mudie S, Blow JJ, Lamond AI, Swedlow JR & Rocha S 2013 PHD1 links cell-cycle progression to oxygen sensing through hydroxylation of the centrosomal protein Cep192. Developmental Cell 26 381–392.
Moss S, Greenbaum R & Sever PS 1980 Preoperative localization of a phaeochromocytoma using plasma noradrenaline concentrations in multiple-site samples. Journal of the Royal Society of Medicine 73 139–141.
Mucha L, Leidig-Bruckner G, Frank-Raue K, Bruckner T, Kroiss M, Raue F & German study group for rare thyroid cancer 2017 Phaeochromocytoma in multiple endocrine neoplasia type 2: RET codon-specific penetrance and changes in management during the last four decades. Clinical Endocrinology 87 320–326.

290
Muller M, Ferlicot S, Guillaud-Bataille M, Le Teuff G, Genestie C, Deveaux S, Slama A, Poulalhon N, Escudier B, Albiges L et al. 2017 Reassessing the clinical spectrum associated with hereditary leiomyomatosis and renal cell carcinoma syndrome in French FH mutation carriers. Clinical Genetics 92 606–615.
Müller M, Padberg W, Schindler E, Sticher J, Osmer C, Friemann S & Hempelmann G 1998 Renocortical tissue oxygen pressure measurements in patients undergoing living donor kidney transplantation. Anesthesia and Analgesia 87 474–476.
Mulligan LM, Kwok JB, Healey CS, Elsdon MJ, Eng C, Gardner E, Love DR, Mole SE, Moore JK, Papi L et al. 1993 Germ-line mutations of the RET proto-oncogene in multiple endocrine neoplasia type 2A. Nature 363 458–460.
Mullins F, O’Shea P, FitzGerald R & Tormey W 2012 Enzyme-linked immunoassay for plasma-free metanephrines in the biochemical diagnosis of phaeochromocytoma in adults is not ideal. Clinical Chemistry and Laboratory Medicine 50 105–110.
Murata Y, Tsuji M & Tani M 1984 Ultrastructure of multiple glomus tumor. Journal of Cutaneous Pathology 11 53–58.
Murre C, McCaw PS & Baltimore D 1989 A new DNA binding and dimerization motif in immunoglobulin enhancer binding, daughterless, MyoD, and myc proteins. Cell 56 777–783.
Nachury M V., Loktev A V., Zhang Q, Westlake CJ, Peränen J, Merdes A, Slusarski DC, Scheller RH, Bazan JF, Sheffield VC et al. 2007 A Core Complex of BBS Proteins Cooperates with the GTPase Rab8 to Promote Ciliary Membrane Biogenesis. Cell 129 1201–1213.
Nagatsu T, Levitt M & Udenfriend S 1964 Tyrosine hydroxylase. The initial step in norepinephrine biosynthesis. The Journal of Biological Chemistry 239 2910–2917.
Najafi M, Maza NA & Calvert PD 2012 Steric volume exclusion sets soluble protein concentrations in photoreceptor sensory cilia. Proceedings of the National Academy of Sciences 109 203–208.
Nakajo M, Shapiro B, Copp J, Kalff V, Gross MD, Sisson JC & Beierwaltes WH 1983 The normal and abnormal distribution of the adrenomedullary imaging agent m-[I-131]iodobenzylguanidine (I-131 MIBG) in man: evaluation by scintigraphy. Journal of Nuclear Medicine : Official Publication, Society of Nuclear Medicine 24 672–682.
Nangaku M, Sato-Yoshitake R, Okada Y, Noda Y, Takemura R, Yamazaki H & Hirokawa N 1994 KIF1B, a novel microtubule plus end-directed monomeric motor protein for transport of mitochondria. Cell 79 1209–1220.
Nastos K, Cheung VTF, Toumpanakis C, Navalkissoor S, Quigley A-M, Caplin M & Khoo B 2017 Peptide Receptor Radionuclide Treatment and (131)I-MIBG in the management of patients with metastatic/progressive phaeochromocytomas and paragangliomas. Journal of Surgical Oncology 115 425–434.
Natarajan M, Stewart JE, Golemis EA, Pugacheva EN, Alexandropoulos K, Cox BD, Wang W, Grammer JR & Gladson CL 2006 HEF1 is a necessary and specific downstream effector of FAK that promotes the migration of glioblastoma cells. Oncogene 25 1721–1732.
National Toxicology Progam 1993 NTP Toxicology and Carcinogenesis Studies of Talc (CAS No. 14807-96-6)(Non-Asbestiform) in F344/N Rats and B6C3F1 Mice (Inhalation Studies). National Toxicology Program Technical Report Series 421 1–287.

291
National Toxicology Progam 1996a NTP Toxicology and Carcinogenesis Studies of Nickel Subsulfide (CAS No. 12035-72-2) in F344 Rats and B6C3F1 Mice (Inhalation Studies). National Toxicology Program Technical Report Series 453 1–365.
National Toxicology Progam 1996b NTP Toxicology and Carcinogenesis Studies of Nickel Oxide (CAS No. 1313-99-1) in F344 Rats and B6C3F1 Mice (Inhalation Studies). National Toxicology Program Technical Report Series 451 1–381.
National Toxicology Progam 1998 NTP Toxicology and Carcinogenesis Studies of Cobalt Sulfate Heptahydrate (CAS No. 10026-24-1) in F344/N Rats and B6C3F1 Mice (Inhalation Studies). National Toxicology Program Technical Report Series 471 1–268.
Nauli SM, Alenghat FJ, Luo Y, Williams E, Vassilev P, Li X, Elia AEH, Lu W, Brown EM, Quinn SJ et al. 2003 Polycystins 1 and 2 mediate mechanosensation in the primary cilium of kidney cells. Nature Genetics 33 129–137.
Nauli SM, Kawanabe Y, Kaminski JJ, Pearce WJ, Ingber DE & Zhou J 2008 Endothelial Cilia Are Fluid Shear Sensors That Regulate Calcium Signaling and Nitric Oxide Production Through Polycystin-1. Circulation 117 1161–1171.
van Nederveen FH, Gaal J, Favier J, Korpershoek E, Oldenburg RA, de Bruyn EM, Sleddens HF, Derkx P, Rivière J, Dannenberg H et al. 2009 An immunohistochemical procedure to detect patients with paraganglioma and phaeochromocytoma with germline SDHB, SDHC, or SDHD gene mutations: a retrospective and prospective analysis. The Lancet Oncology 10 764–771.
Neumann HP & Wiestler OD 1991 Clustering of features of von Hippel-Lindau syndrome: evidence for a complex genetic locus. Lancet (London, England) 337 1052–1054.
Neumann HP, Pawlu C, Peczkowska M, Bausch B, McWhinney SR, Muresan M, Buchta M, Franke G, Klisch J, Bley T et al. 2004 Distinct clinical features of paraganglioma syndromes associated with SDHB and SDHD gene mutations. JAMA 292 943–951.
Neumann HPH, Vortmeyer A, Schmidt D, Werner M, Erlic Z, Cascon A, Bausch B, Januszewicz A & Eng C 2007 Evidence of MEN-2 in the Original Description of Classic Pheochromocytoma. New England Journal of Medicine 357 1311–1315.
Neumann HPH, Sullivan M, Winter A, Malinoc A, Hoffmann MM, Boedeker CC, Bertz H, Walz MK, Moeller LC, Schmid KW et al. 2011 Germline Mutations of the TMEM127 Gene in Patients with Paraganglioma of Head and Neck and Extraadrenal Abdominal Sites. The Journal of Clinical Endocrinology & Metabolism 96 E1279–E1282.
Newbould EC, Ross GA, Dacie JE, Bouloux PM, Besser GM & Grossman A 1991 The use of venous catheterization in the diagnosis and localization of bilateral phaeochromocytomas. Clinical Endocrinology 35 55–59.
Ng SSM, Cheung Y-T, An X-M, Chen YC, Li M, Hoi-Yee Li G, Cheung W, Sze J, Lai L, Peng Y et al. 2007 Cell Cycle-Related Kinase: A Novel Candidate Oncogene in Human Glioblastoma. JNCI Journal of the National Cancer Institute 99 936–948.
Ni Y, Zbuk KM, Sadler T, Patocs A, Lobo G, Edelman E, Platzer P, Orloff MS, Waite KA & Eng C 2008 Germline mutations and variants in the succinate dehydrogenase genes in Cowden and Cowden-like syndromes. American Journal of Human Genetics 83 261–268.
Nielsen SK, Møllgård K, Clement CA, Veland IR, Awan A, Yoder BK, Novak I & Christensen ST 2008 Characterization of primary cilia and Hedgehog signaling during development of the human

292
pancreas and in human pancreatic duct cancer cell lines. Developmental Dynamics : An Official Publication of the American Association of Anatomists 237 2039–2052.
Niemann S & Müller U 2000 Mutations in SDHC cause autosomal dominant paraganglioma, type 3. Nature Genetics 26 268–270.
Niemeijer ND, Alblas G, van Hulsteijn LT, Dekkers OM & Corssmit EPM 2014 Chemotherapy with cyclophosphamide, vincristine and dacarbazine for malignant paraganglioma and pheochromocytoma: systematic review and meta-analysis. Clinical Endocrinology 81 642–651.
Nobin A, Karp W, Lunderquist A, Rosengren E, Sandén G & Sundler F 1982 Localization of carcinoids and pheochromocytomas with vein catheterization and amine determination. Brain Research Bulletin 9 781–797.
Nobutani K, Shimono Y, Yoshida M, Mizutani K, Minami A, Kono S, Mukohara T, Yamasaki T, Itoh T, Takao S et al. 2014 Absence of primary cilia in cell cycle-arrested human breast cancer cells. Genes to Cells : Devoted to Molecular & Cellular Mechanisms 19 141–152.
Novarino G, Akizu N & Gleeson JG 2011 Modeling Human Disease in Humans: The Ciliopathies. Cell 147 70–79.
O’Connor AK, Malarkey EB, Berbari NF, Croyle MJ, Haycraft CJ, Bell PD, Hohenstein P, Kesterson RA & Yoder BK 2013 An inducible CiliaGFP mouse model for in vivo visualization and analysis of cilia in live tissue. Cilia 2 8.
Ocbina PJR & Anderson K V. 2008 Intraflagellar transport, cilia, and mammalian Hedgehog signaling: Analysis in mouse embryonic fibroblasts. Developmental Dynamics 237 2030–2038.
Ocbina PJR, Tuson M & Anderson K V. 2009 Primary Cilia Are Not Required for Normal Canonical Wnt Signaling in the Mouse Embryo. PLoS ONE 4 e6839.
Oh EC & Katsanis N 2013 Context-Dependent Regulation of Wnt Signaling through the Primary Cilium. Journal of the American Society of Nephrology 24 10–18.
Ohh M, Yauch RL, Lonergan KM, Whaley JM, Stemmer-Rachamimov a O, Louis DN, Gavin BJ, Kley N, Kaelin WG & Iliopoulos O 1998 The von Hippel-Lindau tumor suppressor protein is required for proper assembly of an extracellular fibronectin matrix. Molecular Cell 1 959–968.
Okuda H, Hirai S, Takaki Y, Kamada M, Baba M, Sakai N, Kishida T, Kaneko S, Yao M, Ohno S et al. 1999 Direct interaction of the beta-domain of VHL tumor suppressor protein with the regulatory domain of atypical PKC isotypes. Biochemical and Biophysical Research Communications 263 491–497.
Omori Y, Chaya T, Yoshida S, Irie S, Tsujii T & Furukawa T 2015 Identification of G Protein-Coupled Receptors (GPCRs) in Primary Cilia and Their Possible Involvement in Body Weight Control. PloS One 10 e0128422.
Omura M, Saito J, Yamaguchi K, Kakuta Y & Nishikawa T 2004 Prospective study on the prevalence of secondary hypertension among hypertensive patients visiting a general outpatient clinic in Japan. Hypertension Research : Official Journal of the Japanese Society of Hypertension 27 193–202.
Opotowsky AR, Moko LE, Ginns J, Rosenbaum M, Greutmann M, Aboulhosn J, Hageman A, Kim Y, Deng LX, Grewal J et al. 2015 Pheochromocytoma and Paraganglioma in Cyanotic Congenital Heart Disease. The Journal of Clinical Endocrinology & Metabolism 100 1325–1334.

293
Ortiz-Barahona A, Villar D, Pescador N, Amigo J & del Peso L 2010 Genome-wide identification of hypoxia-inducible factor binding sites and target genes by a probabilistic model integrating transcription-profiling data and in silico binding site prediction. Nucleic Acids Research 38 2332–2345.
Ostrowski LE, Blackburn K, Radde KM, Moyer MB, Schlatzer DM, Moseley A & Boucher RC 2002 A proteomic analysis of human cilia: identification of novel components. Molecular & Cellular Proteomics : MCP 1 451–465.
Ou Y, Ruan Y, Cheng M, Moser JJ, Rattner JB, Hoorn FA Van Der, Tn C & Tn C 2009 Adenylate cyclase regulates elongation of mammalian primary cilia. Experimental Cell Research 315 2802–2817.
Ozaki K, Haseman JK, Hailey JR, Maronpot RR & Nyska A 2002 Association of adrenal pheochromocytoma and lung pathology in inhalation studies with particulate compounds in the male F344 rat--the National Toxicology Program experience. Toxicologic Pathology 30 263–270.
Pacak K 2007 Preoperative Management of the Pheochromocytoma Patient. The Journal of Clinical Endocrinology & Metabolism 92 4069–4079.
Pacak K, Goldstein DS, Doppman JL, Shulkin BL, Udelsman R & Eisenhofer G 2001 A ‘Pheo’ lurks: Novel approaches for locating occult pheochromocytoma. Journal of Clinical Endocrinology and Metabolism 86 3641–3646.
Pacak K, Eisenhofer G & Ilias I 2009 Diagnosis of pheochromocytoma with special emphasis on MEN2 syndrome. Hormones (Athens, Greece) 8 111–116.
Pacheco-Ojeda L, Durango E, Rodriquez C & Vivar N 1988 Carotid body tumors at high altitudes: Quito, Ecuador, 1987. World Journal of Surgery 12 856–860.
Palmer KJ, MacCarthy-Morrogh L, Smyllie N & Stephens DJ 2011 A role for Tctex-1 (DYNLT1) in controlling primary cilium length. European Journal of Cell Biology 90 865–871.
Palublnskas J, Roizen MF & Conte FA 1980 Localization of functioning pheochromocytomas by venous sampling and radioenzymatic analysis. Radiology 136 495–496.
Pampliega O, Orhon I, Patel B, Sridhar S, Díaz-Carretero A, Beau I, Codogno P, Satir BH, Satir P & Cuervo AM 2013 Functional interaction between autophagy and ciliogenesis. Nature 502 194–200.
Papathomas TG, Gaal J, Corssmit EPM, Oudijk L, Korpershoek E, Heimdal K, Bayley JP, Morreau H, Van Dooren M, Papaspyrou K et al. 2014 Non-pheochromocytoma (PCC)/paraganglioma (PGL) tumors in patients with succinate dehydrogenase-related PCC-PGL syndromes: A clinicopathological and molecular analysis. European Journal of Endocrinology 170 1–12.
Papathomas TG, Oudijk L, Persu A, Gill AJ, van Nederveen F, Tischler AS, Tissier F, Volante M, Matias-Guiu X, Smid M et al. 2015 SDHB/SDHA immunohistochemistry in pheochromocytomas and paragangliomas: a multicenter interobserver variation analysis using virtual microscopy: a Multinational Study of the European Network for the Study of Adrenal Tumors (ENS@T). Modern Pathology 28 807–821.
Park TJ, Mitchell BJ, Abitua PB, Kintner C & Wallingford JB 2008 Dishevelled controls apical docking and planar polarization of basal bodies in ciliated epithelial cells. Nature Genetics 40 871–879.
Pasquali D, Rossi V, Conzo G, Pannone G, Bufo P, De Bellis A, Renzullo A, Bellastella G, Colao A,

294
Vallone G et al. 2008 Effects of somatostatin analog SOM230 on cell proliferation, apoptosis, and catecholamine levels in cultured pheochromocytoma cells. Journal of Molecular Endocrinology 40 263–271.
Pazour GJ, Dickert BL & Witman GB 1999 The DHC1b (DHC2) isoform of cytoplasmic dynein is required for flagellar assembly. The Journal of Cell Biology 144 473–481.
Pazour GJ, Dickert BL, Vucica Y, Seeley ES, Rosenbaum JL, Witman GB & Cole DG 2000 Chlamydomonas IFT88 and its mouse homologue, polycystic kidney disease gene tg737, are required for assembly of cilia and flagella. The Journal of Cell Biology 151 709–718.
Perera RM, Stoykova S, Nicolay BN, Ross KN, Fitamant J, Boukhali M, Lengrand J, Deshpande V, Selig MK, Ferrone CR et al. 2015 Transcriptional control of autophagy–lysosome function drives pancreatic cancer metabolism. Nature 524 361–365.
Perry RR, Keiser HR, Norton JA, Wall RT, Robertson CN, Travis W, Pass HI, Walther MM & Linehan WM 1990 Surgical management of pheochromocytoma with the use of metyrosine. Annals of Surgery 212 621–628.
Piperno G, LeDizet M & Chang XJ 1987 Microtubules containing acetylated alpha-tubulin in mammalian cells in culture. The Journal of Cell Biology 104 289–302.
Piperno G, Siuda E, Henderson S, Segil M, Vaananen H & Sassaroli M 1998 Distinct mutants of retrograde intraflagellar transport (IFT) share similar morphological and molecular defects. The Journal of Cell Biology 143 1591–1601.
Plotnikova O V., Pugacheva EN, Dunbrack RL & Golemis EA 2010 Rapid calcium-dependent activation of Aurora-A kinase. Nature Communications 1 1–8.
Plotnikova O V., Pugacheva EN & Golemis EA 2011 Aurora A kinase activity influences calcium signaling in kidney cells. The Journal of Cell Biology 193 1021–1032.
Plotnikova O V, Nikonova AS, Loskutov Y V, Kozyulina PY, Pugacheva EN & Golemis EA 2012 Calmodulin activation of Aurora-A kinase (AURKA) is required during ciliary disassembly and in mitosis. Molecular Biology of the Cell 23 2658–2670.
Plotnikova O V., Seo S, Cottle DL, Conduit S, Hakim S, Dyson JM, Mitchell CA & Smyth IM 2015 INPP5E interacts with AURKA, linking phosphoinositide signaling to primary cilium stability. Journal of Cell Science 128 364–372.
Plouin P-F, Fitzgerald P, Rich T, Ayala-Ramirez M, Perrier ND, Baudin E & Jimenez C 2012 Metastatic pheochromocytoma and paraganglioma: focus on therapeutics. Hormone and Metabolic Research 44 390–399.
Podlasek CA, Barnett DH, Clemens JQ, Bak PM & Bushman W 1999 Prostate development requires Sonic hedgehog expressed by the urogenital sinus epithelium. Developmental Biology 209 28–39.
Podrini C, Rowe I, Pagliarini R, Costa ASH, Chiaravalli M, Di Meo I, Kim H, Distefano G, Tiranti V, Qian F et al. 2018 Dissection of metabolic reprogramming in polycystic kidney disease reveals coordinated rewiring of bioenergetic pathways. Communications Biology 1 194.
Ponder BA, Ponder MA, Coffey R, Pembrey ME, Gagel RF, Telenius-Berg M, Semple P & Easton DF 1988 Risk estimation and screening in families of patients with medullary thyroid carcinoma. Lancet (London, England) 1 397–401.

295
Poopalalingam R & Chin EY 2001 Rapid preparation of a patient with pheochromocytoma with labetolol and magnesium sulfate. Canadian Journal of Anaesthesia = Journal Canadien d’anesthesie 48 876–880.
Porter JA, Ekker SC, Park WJ, von Kessler DP, Young KE, Chen CH, Ma Y, Woods AS, Cotter RJ, Koonin E V et al. 1996 Hedgehog patterning activity: role of a lipophilic modification mediated by the carboxy-terminal autoprocessing domain. Cell 86 21–34.
Pouysségur J, Dayan F & Mazure NM 2006 Hypoxia signalling in cancer and approaches to enforce tumour regression. Nature 441 437–443.
Powers JF, Evinger MJ, Tsokas P, Bedri S, Alroy J, Shahsavari M & Tischler AS 2000 Pheochromocytoma cell lines from heterozygous neurofibromatosis knockout mice. Cell and Tissue Research 302 309–320.
Praskova M, Xia F & Avruch J 2008 MOBKL1A/MOBKL1B phosphorylation by MST1 and MST2 inhibits cell proliferation. Current Biology : CB 18 311–321.
Prodromou N V, Thompson CL, Osborn DPS, Cogger KF, Ashworth R, Knight MM, Beales PL & Chapple JP 2012 Heat shock induces rapid resorption of primary cilia. Journal of Cell Science 125 4297–4305.
Proulx-Bonneau S & Annabi B 2011 The primary cilium as a biomarker in the hypoxic adaptation of bone marrow-derived mesenchymal stromal cells: a role for the secreted frizzled-related proteins. Biomarker Insights 6 107–118.
Prys-Roberts C & Farndon JR 2002 Efficacy and safety of doxazosin for perioperative management of patients with pheochromocytoma. World Journal of Surgery 26 1037–1042.
Pugacheva EN & Golemis EA 2005 The focal adhesion scaffolding protein HEF1 regulates activation of the Aurora-A and Nek2 kinases at the centrosome. Nature Cell Biology 7 937–946.
Pugacheva EN, Jablonski SA, Hartman TR, Henske EP & Golemis EA 2007 HEF1-dependent Aurora A activation induces disassembly of the primary cilium. Cell 129 1351–1363.
Qin H, Diener DR, Geimer S, Cole DG & Rosenbaum JL 2004 Intraflagellar transport (IFT) cargo. The Journal of Cell Biology 164 255–266.
Qin Y, Yao L, King EE, Buddavarapu K, Lenci RE, Chocron ES, Lechleiter JD, Sass M, Aronin N, Schiavi F et al. 2010 Germline mutations in TMEM127 confer susceptibility to pheochromocytoma. Nature Genetics 42 229–233.
Qin Y, Deng Y, Ricketts CJ, Srikantan S, Wang E, Maher ER & Dahia PLM 2014 The tumor susceptibility gene TMEM127 is mutated in renal cell carcinomas and modulates endolysosomal function. Human Molecular Genetics 23 2428–2439.
Raber W, Raffesberg W, Bischof M, Scheuba C, Niederle B, Gasic S, Waldhäusl W & Roden M 2000 Diagnostic efficacy of unconjugated plasma metanephrines for the detection of pheochromocytoma. Archives of Internal Medicine 160 2957–2963.
Radford R, Slattery C, Jennings P, Blacque O, Pfaller W, Gmuender H, Van Delft J, Ryan MP, McMorrow T & McMorrow T 2012 Carcinogens induce loss of the primary cilium in human renal proximal tubular epithelial cells independently of effects on the cell cycle. American Journal of Physiology-Renal Physiology 302 F905–F916.

296
Razumilava N, Gradilone SA, Smoot RL, Mertens JC, Bronk SF, Sirica AE & Gores GJ 2014 Non-canonical Hedgehog signaling contributes to chemotaxis in cholangiocarcinoma. Journal of Hepatology 60 599–605.
von Recklinghausen F 1882 Ueber Die Multiplen Fibrome Der Haut Und Ihre Beziehung Zu Den Multiplen Neuromen.
Reed NA, Cai D, Blasius TL, Jih GT, Meyhofer E, Gaertig J & Verhey KJ 2006 Microtubule Acetylation Promotes Kinesin-1 Binding and Transport. Current Biology 16 2166–2172.
Remacha L, Comino-Méndez I, Richter S, Contreras L, Currás-Freixes M, Pita G, Letón R, Galarreta A, Torres-Pérez R, Honrado E et al. 2017 Targeted Exome Sequencing of Krebs Cycle Genes Reveals Candidate Cancer–Predisposing Mutations in Pheochromocytomas and Paragangliomas. Clinical Cancer Research 23 6315–6324.
Resnick A 2016 HIF Stabilization Weakens Primary Cilia. PloS One 11 e0165907.
Resnick A & Hopfer U 2007 Force-response considerations in ciliary mechanosensation. Biophysical Journal 93 1380–1390.
Reubi JC, Waser B, Liu Q, Laissue JA & Schonbrunn A 2000 Subcellular distribution of somatostatin sst2A receptors in human tumors of the nervous and neuroendocrine systems: membranous versus intracellular location. The Journal of Clinical Endocrinology and Metabolism 85 3882–3891.
Reubi JC, Waser B, Schaer JC & Laissue JA 2001 Somatostatin receptor sst1-sst5 expression in normal and neoplastic human tissues using receptor autoradiography with subtype-selective ligands. European Journal of Nuclear Medicine 28 836–846.
Richardson DS, Lai AZ & Mulligan LM 2006 RET ligand-induced internalization and its consequences for downstream signaling. Oncogene 25 3206–3211.
Richter S, Gieldon L, Pang Y, Peitzsch M, Huynh T, Leton R, Viana B, Ercolino T, Mangelis A, Rapizzi E et al. 2019 Metabolome-guided genomics to identify pathogenic variants in isocitrate dehydrogenase, fumarate hydratase, and succinate dehydrogenase genes in pheochromocytoma and paraganglioma. Genetics in Medicine 21 705–717.
Ricketts CJ, Forman JR, Rattenberry E, Bradshaw N, Lalloo F, Izatt L, Cole TR, Armstrong R, Kumar VKA, Morrison PJ et al. 2010 Tumor risks and genotype-phenotype-proteotype analysis in 358 patients with germline mutations in SDHB and SDHD. Human Mutation 31 41–51.
Rieder CL, Jensen CG & Jensen LC 1979 The resorption of primary cilia during mitosis in a vertebrate (PtK1) cell line. Journal of Ultrastructure Research 68 173–185.
Rinke A, Muller H-H, Schade-Brittinger C, Klose K-J, Barth P, Wied M, Mayer C, Aminossadati B, Pape U-F, Blaker M et al. 2009 Placebo-Controlled, Double-Blind, Prospective, Randomized Study on the Effect of Octreotide LAR in the Control of Tumor Growth in Patients With Metastatic Neuroendocrine Midgut Tumors: A Report From the PROMID Study Group. Journal of Clinical Oncology 27 4656–4663.
Ritter A, Friemel A, Kreis N-N, Hoock SC, Roth S, Kielland-Kaisen U, Brüggmann D, Solbach C, Louwen F & Yuan J 2018 Primary Cilia Are Dysfunctional in Obese Adipose-Derived Mesenchymal Stem Cells. Stem Cell Reports 10 583–599.
Robert A, Margall-Ducos G, Guidotti J-E, Bregerie O, Celati C, Brechot C & Desdouets C 2007 The

297
intraflagellar transport component IFT88/polaris is a centrosomal protein regulating G1-S transition in non-ciliated cells. Journal of Cell Science 120 628–637.
Robinson MD & Oshlack A 2010 A scaling normalization method for differential expression analysis of RNA-seq data. Genome Biology 11 R25.
Rocha C, Papon L, Cacheux W, Marques Sousa P, Lascano V, Tort O, Giordano T, Vacher S, Lemmers B, Mariani P et al. 2014 Tubulin glycylases are required for primary cilia, control of cell proliferation and tumor development in colon. The EMBO Journal 33 2247–2260.
Rodriguez-Cuevas H, Lau I & Rodriguez HP 1986 High-altitude paragangliomas diagnostic and therapeutic considerations. Cancer 57 672–676.
Rodríguez-Cuevas S, López-Garza J & Labastida-Almendaro S 1998 Carotid body tumors in inhabitants of altitudes higher than 2000 meters above sea level. Head & Neck 20 374–378.
Roe J-S, Kim H, Lee S-M, Kim S-T, Cho E-J & Youn H-D 2006 p53 Stabilization and Transactivation by a von Hippel-Lindau Protein. Molecular Cell 22 395–405.
Rohatgi R, Milenkovic L & Scott MP 2007 Patched1 Regulates Hedgehog Signaling at the Primary Cilium. Science 317 372–376.
Romain C V, Paul P, Lee S, Qiao J & Chung DH 2014 Targeting aurora kinase A inhibits hypoxia-mediated neuroblastoma cell tumorigenesis. Anticancer Research 34 2269–2274.
Rosenbaum JL & Child FM 1967 Flagellar regeneration in protozoan flagellates. The Journal of Cell Biology 34 345–364.
Rosenbaum JL, Moulder JE & Ringo DL 1969 Flagellar elongation and shortening in Chlamydomonas. The use of cycloheximide and colchicine to study the synthesis and assembly of flagellar proteins. The Journal of Cell Biology 41 600–619.
Rufini V, Treglia G, Castaldi P, Perotti G, Calcagni ML, Corsello SM, Galli G, Fanti S & Giordano A 2011 Comparison of 123I-MIBG SPECT-CT and 18F-DOPA PET-CT in the evaluation of patients with known or suspected recurrent paraganglioma. Nuclear Medicine Communications 32 575–582.
Saggese T, Young A a, Huang C, Braeckmans K & McGlashan SR 2012 Development of a method for the measurement of primary cilia length in 3D. Cilia 1 11.
Saito M, Otsu W, Hsu K, Chuang J, Yanagisawa T, Shieh V, Kaitsuka T, Wei F, Tomizawa K & Sung C 2017 Tctex‐1 controls ciliary resorption by regulating branched actin polymerization and endocytosis. EMBO Reports 18 1460–1472.
Saldana MJ, Salem LE & Travezan R 1973 High altitude hypoxia and chemodectomas. Human Pathology 4 251–263.
Sang L, Miller JJ, Corbit KC, Giles RH, Brauer MJ, Otto EA, Baye LM, Wen X, Scales SJ, Kwong M et al. 2011 Mapping the NPHP-JBTS-MKS Protein Network Reveals Ciliopathy Disease Genes and Pathways. Cell 145 513–528.
Sasaki H, Nishizaki Y, Hui C, Nakafuku M & Kondoh H 1999 Regulation of Gli2 and Gli3 activities by an amino-terminal repression domain: implication of Gli2 and Gli3 as primary mediators of Shh signaling. Development (Cambridge, England) 126 3915–3924.
Schaefer CF, Anthony K, Krupa S, Buchoff J, Day M, Hannay T & Buetow KH 2009 PID: the Pathway Interaction Database. Nucleic Acids Research 37 D674–D679.

298
Schermer B, Ghenoiu C, Bartram M, Müller RU, Kotsis F, Höhne M, Kühn W, Rapka M, Nitschke R, Zentgraf H et al. 2006 The von Hippel-Lindau tumor suppressor protein controls ciliogenesis by orienting microtubule growth. The Journal of Cell Biology 175 547–554.
Schiavi F, Boedeker CC, Bausch B, Peçzkowska M, Gomez CF, Strassburg T, Pawlu C, Buchta M, Salzmann M, Hoffmann MM et al. 2005 Predictors and prevalence of paraganglioma syndrome associated with mutations of the SDHC gene. JAMA 294 2057–2063.
Schiavi F, Milne RL, Anda E, Blay P, Castellano M, Opocher G, Robledo M & Cascón A 2010 Are we overestimating the penetrance of mutations in SDHB? Human Mutation 31 761–762.
Schimmack S, Kneller S, Dadabaeva N, Bergmann F, Taylor A, Hackert T, Werner J & Strobel O 2016 Epithelial to Stromal Re-Distribution of Primary Cilia during Pancreatic Carcinogenesis. PLOS ONE 11 e0164231.
Schlisio S, Kenchappa RS, Vredeveld LCW, George RE, Stewart R, Greulich H, Shahriari K, Nguyen N V, Pigny P, Dahia PL et al. 2008 The kinesin KIF1Bbeta acts downstream from EglN3 to induce apoptosis and is a potential 1p36 tumor suppressor. Genes & Development 22 884–893.
Schmid KW, Schröder S, Dockhorn-Dworniczak B, Kirchmair R, Tötsch M, Böcker W & Fischer-Colbrie R 1994 Immunohistochemical demonstration of chromogranin A, chromogranin B, and secretogranin II in extra-adrenal paragangliomas. Modern Pathology : An Official Journal of the United States and Canadian Academy of Pathology, Inc 7 347–353.
Schneider L, Clement CA, Teilmann SC, Pazour GJ, Hoffmann EK, Satir P & Christensen ST 2005 PDGFRalpha signaling is regulated through the primary cilium in fibroblasts. Current Biology : CB 15 1861–1866.
Schodel J, Oikonomopoulos S, Ragoussis J, Pugh CW, Ratcliffe PJ & Mole DR 2011 High-resolution genome-wide mapping of HIF-binding sites by ChIP-seq. Blood 117 e207–e217.
Schraml P, Frew IJ, Thoma CR, Boysen G, Struckmann K, Krek W & Moch H 2009 Sporadic clear cell renal cell carcinoma but not the papillary type is characterized by severely reduced frequency of primary cilia. Mod Pathol 22 31–36.
Schwab M, Praml C & Amler LC 1996 Genomic instability in Ip and human malignancies. Genes, Chromosomes and Cancer 16 211–229.
Sciacovelli M, Gonçalves E, Johnson TI, Zecchini VR, da Costa ASH, Gaude E, Drubbel AV, Theobald SJ, Abbo SR, Tran MGB et al. 2016 Fumarate is an epigenetic modifier that elicits epithelial-to-mesenchymal transition. Nature 537 544–547.
Seeley ES, Carrière C, Goetze T, Seeley ES, Carrie C, Goetze T, Longnecker DS & Korc M 2009 Pancreatic Cancer and Precursor Pancreatic Intraepithelial Neoplasia Lesions Are Devoid of Primary Cilia Lesions Are Devoid of Primary Cilia. 422–430.
Selak M a, Armour SM, MacKenzie ED, Boulahbel H, Watson DG, Mansfield KD, Pan Y, Simon MC, Thompson CB & Gottlieb E 2005 Succinate links TCA cycle dysfunction to oncogenesis by inhibiting HIF-alpha prolyl hydroxylase. Cancer Cell 7 77–85.
Seo S, Baye LM, Schulz NP, Beck JS, Zhang Q, Slusarski DC & Sheffield VC 2010 BBS6, BBS10, and BBS12 form a complex with CCT/TRiC family chaperonins and mediate BBSome assembly. Proceedings of the National Academy of Sciences 107 1488–1493.
Shamloo K, Chen J, Sardar J, Sherpa RT, Pala R, Atkinson KF, Pearce WJ, Zhang L & Nauli SM 2017

299
Chronic Hypobaric Hypoxia Modulates Primary Cilia Differently in Adult and Fetal Ovine Kidneys. Frontiers in Physiology 8 677.
Sharma N, Kosan ZA, Stallworth JE, Berbari NF & Yoder BK 2011 Soluble levels of cytosolic tubulin regulate ciliary length control. Molecular Biology of the Cell 22 806–816.
Shen WT, Grogan R, Vriens M, Clark OH & Duh Q-Y 2010 One hundred two patients with pheochromocytoma treated at a single institution since the introduction of laparoscopic adrenalectomy. Archives of Surgery (Chicago, Ill. : 1960) 145 893–897.
Shih SM, Engel BD, Kocabas F, Bilyard T, Gennerich A, Marshall WF & Yildiz A 2013 Intraflagellar transport drives flagellar surface motility. ELife 2 e00744.
Shpak M, Goldberg MM & Cowperthwaite MC 2014 Cilia gene expression patterns in cancer. Cancer Genomics & Proteomics 11 13–24.
Shulkin BL, Thompson NW, Shapiro B, Francis IR & Sisson JC 1999 Pheochromocytomas: Imaging with 2-[Fluorine-18]fluoro-2-deoxy- d -glucose PET. Radiology 212 35–41.
Sibal L, Jovanovic A, Agarwal SC, Peaston RT, James RA, Lennard TWJ, Bliss R, Batchelor A & Perros P 2006 Phaeochromocytomas presenting as acute crises after beta blockade therapy. Clinical Endocrinology 65 186–190.
Simons M, Gloy J, Ganner A, Bullerkotte A, Bashkurov M, Krönig C, Schermer B, Benzing T, Cabello OA, Jenny A et al. 2005 Inversin, the gene product mutated in nephronophthisis type II, functions as a molecular switch between Wnt signaling pathways. Nature Genetics 37 537–543.
Sipple JH 1961 The association of pheochromocytoma with carcinoma of the thyroid gland. Am. J. Med. 31 163–166.
Sjoblom T, Jones S, Wood LD, Parsons DW, Lin J, Barber TD, Mandelker D, Leary RJ, Ptak J, Silliman N et al. 2006 The Consensus Coding Sequences of Human Breast and Colorectal Cancers. Science 314 268–274.
Smith LA, Bukanov NO, Husson H, Russo RJ, Barry TC, Taylor AL, Beier DR & Ibraghimov-Beskrovnaya O 2006 Development of Polycystic Kidney Disease in Juvenile Cystic Kidney Mice: Insights into Pathogenesis, Ciliary Abnormalities, and Common Features with Human Disease. Journal of the American Society of Nephrology 17 2821–2831.
Smith EH, Janknecht R & Maher LJ 2007 Succinate inhibition of alpha-ketoglutarate-dependent enzymes in a yeast model of paraganglioma. Human Molecular Genetics 16 3136–3148.
Snedecor ER, Sung CC, Moncayo A, Rothstein BE, Mockler DC, Tonnesen MG, Jones EC, Fujita M, Clark RA, Shroyer KR et al. 2015 Loss of primary cilia in melanoma cells is likely independent of proliferation and cell cycle progression. The Journal of Investigative Dermatology 135 1456–1458.
Snouffer A, Brown D, Lee H, Walsh J, Lupu F, Norman R, Lechtreck K, Ko HW & Eggenschwiler J 2017 Cell Cycle-Related Kinase (CCRK) regulates ciliogenesis and Hedgehog signaling in mice. PLoS Genetics 13 e1006912.
Sohara E, Luo Y, Zhang J, Manning DK, Beier DR & Zhou J 2008 Nek8 Regulates the Expression and Localization of Polycystin-1 and Polycystin-2. Journal of the American Society of Nephrology 19 469–476.
300
Solanki KK, Bomanji J, Moyes J, Mather SJ, Trainer PJ & Britton KE 1992 A pharmacological guide to medicines which interfere with the biodistribution of radiolabelled meta-iodobenzylguanidine (MIBG). Nuclear Medicine Communications 13 513–521.
Soneson C, Love MI & Robinson MD 2015 Differential analyses for RNA-seq: transcript-level estimates improve gene-level inferences. F1000Research 4 1521.
Song L & Dentler WL 2001 Flagellar Protein Dynamics in Chlamydomonas. Journal of Biological Chemistry 276 29754–29763.
Sorokin S 1962 Centrioles and the formation of rudimentary cilia by fibroblasts and smooth muscle cells. The Journal of Cell Biology 15 363–377.
Sorokin SP 1968 Reconstructions of centriole formation and ciliogenesis in mammalian lungs. Journal of Cell Science 3 207–230.
Spalluto C, Wilson DI & Hearn T 2012 Nek2 localises to the distal portion of the mother centriole/basal body and is required for timely cilium disassembly at the G2/M transition. European Journal of Cell Biology 91 675–686.
Spann AL, Yuan K, Goliwas KF, Steg AD, Kaushik DD, Kwon Y-J & Frost AR 2015 The presence of primary cilia in cancer cells does not predict responsiveness to modulation of smoothened activity. International Journal of Oncology 47 269–279.
Spektor A, Tsang WY, Khoo D & Dynlacht BD 2007 Cep97 and CP110 Suppress a Cilia Assembly Program. Cell 130 678–690.
Srirangalingam U, Walker L, Khoo B, MacDonald F, Gardner D, Wilkin TJ, Skelly RH, George E, Spooner D, Monson JP et al. 2008 Clinical manifestations of familial paraganglioma and phaeochromocytomas in succinate dehydrogenase B (SDH-B) gene mutation carriers. Clinical Endocrinology 69 587–596.
Srirangalingam U, Khoo B, Walker L, MacDonald F, Skelly RH, George E, Spooner D, Johnston LB, Monson JP, Grossman AB et al. 2009 Contrasting clinical manifestations of SDHB and VHL associated chromaffin tumours. Endocrine-Related Cancer 16 515–525.
Srirangalingam U, Khoo B, Matson M, Carpenter R, Reznek R, Maher ER, Chew SL & Drake WM 2010 SDHD-related chromaffin tumours: disease localisation to genetic dysfunction. Hormone Research in Pædiatrics 73 135–139.
Stasiulewicz M, Gray SD, Mastromina I, Silva JC, Bjorklund M, Seymour PA, Booth D, Thompson C, Green RJ, Hall EA et al. 2015 A conserved role for Notch signaling in priming the cellular response to Shh through ciliary localisation of the key Shh transducer Smo. Development 142 2291–2303.
Steinsapir J, Carr AA, Prisant LM & Bransome ED 1997 Metyrosine and pheochromocytoma. Archives of Internal Medicine 157 901–906.
Stene M, Panagiotis N, Tuck ML, Sowers JR, Mayes D & Berg G 1980 Plasma norepinephrine levels are influenced by sodium intake, glucocorticoid administration, and circadian changes in normal man. The Journal of Clinical Endocrinology and Metabolism 51 1340–1345.
Stephens RE 1997 Synthesis and turnover of embryonic sea urchin ciliary proteins during selective inhibition of tubulin synthesis and assembly. Molecular Biology of the Cell 8 2187–2198.

301
Storey JD & Tibshirani R 2003 Statistical significance for genomewide studies. Proceedings of the National Academy of Sciences 100 9440–9445.
Sugiyama N, Tsukiyama T, Yamaguchi TP & Yokoyama T 2011 The canonical Wnt signaling pathway is not involved in renal cyst development in the kidneys of inv mutant mice. Kidney International 79 957–965.
Sugrue C 1800 Dr. Sugrue’s Case of Gastrodynia. The Medical and Physical Journal 4 228–231.
Sun X, Haley J, Bulgakov O V, Cai X, McGinnis J & Li T 2012 Tubby is required for trafficking G protein-coupled receptors to neuronal cilia. Cilia 1 21.
Suzuki S 1910 Ueber zwei Tumoren aus Nebennierenmarkgewebe. Berliner Klinische Wochenschrift 47 1623–1625.
Sze WCC, Grossman AB, Goddard I, Amendra D, Shieh SCC, Plowman PN, Drake WM, Akker SA & Druce MR 2013 Sequelae and survivorship in patients treated with (131)I-MIBG therapy. British Journal of Cancer 109 565–572.
Sze WCC, Soh LM, Lau JH, Reznek R, Sahdev A, Matson M, Riddoch F, Carpenter R, Berney D, Grossman AB et al. 2014 Diagnosing unilateral primary aldosteronism - comparison of a clinical prediction score, computed tomography and adrenal venous sampling. Clinical Endocrinology 81 25–30.
Taïeb D, Timmers HJ, Hindié E, Guillet BA, Neumann HP, Walz MK, Opocher G, de Herder WW, Boedeker CC, de Krijger RR et al. 2012 EANM 2012 guidelines for radionuclide imaging of phaeochromocytoma and paraganglioma. European Journal of Nuclear Medicine and Molecular Imaging 39 1977–1995.
Talbot JJ, Shillingford JM, Vasanth S, Doerr N, Mukherjee S, Kinter MT, Watnick T & Weimbs T 2011 Polycystin-1 regulates STAT activity by a dual mechanism. Proceedings of the National Academy of Sciences 108 7985–7990.
Tang N, Mack F, Haase VH, Simon MC & Johnson RS 2006 pVHL Function Is Essential for Endothelial Extracellular Matrix Deposition. Molecular and Cellular Biology 26 2519–2530.
Tang Z, Lin MG, Stowe TR, Chen S, Zhu M, Stearns T, Franco B & Zhong Q 2013 Autophagy promotes primary ciliogenesis by removing OFD1 from centriolar satellites. Nature 502 254–257.
Tang C-M, Lee TE, Syed SA, Burgoyne AM, Leonard SY, Gao F, Chan JC, Shi E, Chmielecki J, Morosini D et al. 2016 Hedgehog pathway dysregulation contributes to the pathogenesis of human gastrointestinal stromal tumors via GLI-mediated activation of KIT expression. Oncotarget 7 78226–78241.
Teilmann SC & Christensen ST 2005 Localization of the angiopoietin receptors Tie-1 and Tie-2 on the primary cilia in the female reproductive organs. Cell Biology International 29 340–346.
Teilmann SC, Byskov AG, Pedersen PA, Wheatley DN, Pazour GJ & Christensen ST 2005 Localization of transient receptor potential ion channels in primary and motile cilia of the female murine reproductive organs. Molecular Reproduction and Development 71 444–452.
Thebault S, Flourakis M, Vanoverberghe K, Vandermoere F, Roudbaraki M, Lehen’kyi V, Slomianny C, Beck B, Mariot P, Bonnal J-L et al. 2006 Differential Role of Transient Receptor Potential Channels in Ca 2+ Entry and Proliferation of Prostate Cancer Epithelial Cells. Cancer Research 66 2038–2047.

302
Thiel C, Kessler K, Giessl A, Dimmler A, Shalev SA, von der Haar S, Zenker M, Zahnleiter D, Stöss H, Beinder E et al. 2011 NEK1 Mutations Cause Short-Rib Polydactyly Syndrome Type Majewski. The American Journal of Human Genetics 88 106–114.
Thoenen H, Mueller RA & Axelrod J 1969 Trans-synaptic induction of adrenal tyrosine hydroxylase. The Journal of Pharmacology and Experimental Therapeutics 169 249–254.
Thoma CR, Frew IJ, Hoerner CR, Montani M, Moch H & Krek W 2007 pVHL and GSK3beta are components of a primary cilium-maintenance signalling network. Nature Cell Biology 9 588–595.
Thompson LDR 2002 Pheochromocytoma of the Adrenal gland Scaled Score (PASS) to separate benign from malignant neoplasms: a clinicopathologic and immunophenotypic study of 100 cases. The American Journal of Surgical Pathology 26 551–566.
Thompson CL, Wiles A, Poole CA & Knight MM 2016 Lithium chloride modulates chondrocyte primary cilia and inhibits Hedgehog signaling. FASEB Journal : Official Publication of the Federation of American Societies for Experimental Biology 30 716–726.
Timmers HJLM, Kozupa A, Eisenhofer G, Raygada M, Adams KT, Solis D, Lenders JWM & Pacak K 2007a Clinical presentations, biochemical phenotypes, and genotype-phenotype correlations in patients with succinate dehydrogenase subunit B-associated pheochromocytomas and paragangliomas. The Journal of Clinical Endocrinology and Metabolism 92 779–786.
Timmers HJLM, Kozupa A, Chen CC, Carrasquillo JA, Ling A, Eisenhofer G, Adams KT, Solis D, Lenders JWM & Pacak K 2007b Superiority of fluorodeoxyglucose positron emission tomography to other functional imaging techniques in the evaluation of metastatic SDHB-associated pheochromocytoma and paraganglioma. Journal of Clinical Oncology : Official Journal of the American Society of Clinical Oncology 25 2262–2269.
Tischler AS 2000 Divergent differentiation in neuroendocrine tumors of the adrenal gland. Seminars in Diagnostic Pathology 17 120–126.
Tischler AS & deKrijger RR 2015 15 YEARS OF PARAGANGLIOMA: Pathology of pheochromocytoma and paraganglioma. Endocrine-Related Cancer 22 T123–T133.
Tobin JL & Beales PL 2009 The nonmotile ciliopathies. Genetics in Medicine : Official Journal of the American College of Medical Genetics 11 386–402.
Toledo SPA, Lourenço DM, Sekiya T, Lucon AM, Baena MES, Castro CC, Bortolotto LA, Zerbini MCN, Siqueira SAC, Toledo RA et al. 2015 Penetrance and Clinical Features of Pheochromocytoma in a Six-Generation Family Carrying a Germline TMEM127 Mutation. The Journal of Clinical Endocrinology & Metabolism 100 E308–E318.
Tonyukuk V, Emral R, Temizkan S, Sertçelik A, Erden I & Corapçioğlu D 2003 Case report: patient with multiple paragangliomas treated with long acting somatostatin analogue. Endocrine Journal 50 507–513.
Traiffort E, Dubourg C, Faure H, Rognan D, Odent S, Durou M-R, David V & Ruat M 2004 Functional Characterization of Sonic Hedgehog Mutations Associated with Holoprosencephaly. Journal of Biological Chemistry 279 42889–42897.
Traina G, Lanneau C, Arnoux A, Porokhov B, Bagnoli P & Epelbaum J 1998 Expression and coupling of somatostatin receptors in rat adrenal (PC12) and pituitary (GC) cell lines. Neuroscience Letters 252 131–134.
303
Tucker RW, Scher CD & Stiles CD 1979 Centriole deciliation associated with the early response of 3T3 cells to growth factors but not to SV40. Cell 18 1065–1072.
van der Tuin K, Mensenkamp AR, Tops CMJ, Corssmit EPM, Dinjens WN, van de Horst-Schrivers AN, Jansen JC, de Jong MM, Kunst HPM, Kusters B et al. 2018 Clinical Aspects of SDHA-Related Pheochromocytoma and Paraganglioma: A Nationwide Study. The Journal of Clinical Endocrinology & Metabolism 103 438–445.
Tukachinsky H, Kuzmickas RP, Jao CY, Liu J & Salic A 2012 Dispatched and Scube Mediate the Efficient Secretion of the Cholesterol-Modified Hedgehog Ligand. Cell Reports 2 308–320.
Turner JA, Bolen CR & Blankenship DM 2015 Quantitative gene set analysis generalized for repeated measures, confounder adjustment, and continuous covariates. BMC Bioinformatics 16 272.
Tuson M, He M & Anderson K V. 2011 Protein kinase A acts at the basal body of the primary cilium to prevent Gli2 activation and ventralization of the mouse neural tube. Development 138 4921–4930.
Tyler KM, Fridberg A, Toriello KM, Olson CL, Cieslak JA, Hazlett TL & Engman DM 2009 Flagellar membrane localization via association with lipid rafts. Journal of Cell Science 122 859–866.
Udager AM, Magers MJ, Goerke DM, Vinco ML, Siddiqui J, Cao X, Lucas DR, Myers JL, Chinnaiyan AM, McHugh JB et al. 2018 The utility of SDHB and FH immunohistochemistry in patients evaluated for hereditary paraganglioma-pheochromocytoma syndromes. Human Pathology 71 47–54.
Uetake Y, Loncarek J, Nordberg JJ, English CN, La Terra S, Khodjakov A & Sluder G 2007 Cell cycle progression and de novo centriole assembly after centrosomal removal in untransformed human cells. The Journal of Cell Biology 176 173–182.
Unger N, Serdiuk I, Sheu S-Y, Walz MK, Schulz S, Saeger W, Schmid KW, Mann K & Petersenn S 2008 Immunohistochemical localization of somatostatin receptor subtypes in benign and malignant adrenal tumours. Clinical Endocrinology 68 850–857.
Unger N, Ueberberg B, Schulz S, Saeger W, Mann K & Petersenn S 2012 Differential Expression of Somatostatin Receptor Subtype 1–5 Proteins in Numerous Human Normal Tissues. Experimental and Clinical Endocrinology & Diabetes 120 482–489.
Upadhyay VS, Muntean BS, Kathem SH, Hwang JJ, Aboualaiwi W a & Nauli SM 2014 Roles of dopamine receptor on chemosensory and mechanosensory primary cilia in renal epithelial cells. Frontiers in Physiology 5 72.
Valenta LJ, Elias AN & Eisenberg H 1986 ACTH stimulation of adrenal epinephrine and norepinephrine release. Hormone Research 23 16–20.
Valente EM, Logan C V, Mougou-Zerelli S, Lee JH, Silhavy JL, Brancati F, Iannicelli M, Travaglini L, Romani S, Illi B et al. 2010 Mutations in TMEM216 perturb ciliogenesis and cause Joubert, Meckel and related syndromes. Nature Genetics 42 619–625.
van Veelen W, Klompmaker R, Gloerich M, van Gasteren CJR, Kalkhoven E, Berger R, Lips CJM, Medema RH, Höppener JWM & Acton DS 2009 P18 is a tumor suppressor gene involved in human medullary thyroid carcinoma and pheochromocytoma development. International Journal of Cancer 124 339–345.
Verghese E, Zhuang J, Saiti D, Ricardo SD & Deane JA 2011 In vitro investigation of renal epithelial injury suggests that primary cilium length is regulated by hypoxia-inducible mechanisms. Cell
304
Biology International 35 909–913.
Vézina A, Vaillancourt-Jean E, Albarao S & Annabi B 2014 Mesenchymal stromal cell ciliogenesis is abrogated in response to tumor necrosis factor-α and requires NF-κB signaling. Cancer Letters 345 100–105.
Vortkamp A, Lee K, Lanske B, Segre G V, Kronenberg HM & Tabin CJ 1996 Regulation of rate of cartilage differentiation by Indian hedgehog and PTH-related protein. Science (New York, N.Y.) 273 613–622.
Wallingford JB, Rowning BA, Vogeli KM, Rothbächer U, Fraser SE & Harland RM 2000 Dishevelled controls cell polarity during Xenopus gastrulation. Nature 405 81–85.
Wallukat G 2002 The β-Adrenergic Receptors. Herz 27 683–690.
Walz MK, Alesina PF, Wenger FA, Koch JA, Neumann HPH, Petersenn S, Schmid KW & Mann K 2006 Laparoscopic and Retroperitoneoscopic Treatment of Pheochromocytomas and Retroperitoneal Paragangliomas: Results of 161 Tumors in 126 Patients. World Journal of Surgery 30 899–908.
Wang B-E, Shou J, Ross S, Koeppen H, De Sauvage FJ & Gao W-Q 2003 Inhibition of epithelial ductal branching in the prostate by sonic hedgehog is indirectly mediated by stromal cells. The Journal of Biological Chemistry 278 18506–18513.
Wang W, Wu T & Kirschner MW 2014 The master cell cycle regulator APC-Cdc20 regulates ciliary length and disassembly of the primary cilium. ELife 3 e03083.
Wann AKT, Zuo N, Haycraft CJ, Jensen CG, Poole CA, McGlashan SR & Knight MM 2012 Primary cilia mediate mechanotransduction through control of ATP-induced Ca 2+ signaling in compressed chondrocytes. The FASEB Journal 26 1663–1671.
Wann AKT, Thompson CL, Chapple JP & Knight MM 2013 Interleukin-1 β sequesters hypoxia inducible factor 2 α to the primary cilium. Cilia 2 17.
Warrell D, Cox T, Firth J & Benz E 2003 Oxford Textbook of Medicine. Oxford: Oxford University Press.
Weatherbee SD, Niswander LA & Anderson K V. 2009 A mouse model for Meckel syndrome reveals Mks1 is required for ciliogenesis and Hedgehog signaling. Human Molecular Genetics 18 4565–4575.
Webb JL 1966 Enzyme and Metabolic Inhibitors Vol II. New York and London: Academic Press.
Webb R, Mathur A, Chang R, Baid S, Nilubol N, Libutti SK, Stratakis CA & Kebebew E 2012 What is the best criterion for the interpretation of adrenal vein sample results in patients with primary hyperaldosteronism? Annals of Surgical Oncology 19 1881–1886.
Weingarten TN, Cata JP, O’Hara JF, Prybilla DJ, Pike TL, Thompson GB, Grant CS, Warner DO, Bravo E & Sprung J 2010 Comparison of two preoperative medical management strategies for laparoscopic resection of pheochromocytoma. Urology 76 508.e6-11.
Weiterer S, Kohlen T, Veit F, Sachs L, Uhle F, Lichtenstern C, Weigand MA & Henrich M 2015 Galactomannan and Zymosan Block the Epinephrine-Induced Particle Transport in Tracheal Epithelium. PLOS ONE 10 e0143163.
Welander J, Łysiak M, Brauckhoff M, Brunaud L, Söderkvist P & Gimm O 2018 Activating FGFR1 Mutations in Sporadic Pheochromocytomas. World Journal of Surgery 42 482–489.
305
Wenger RH, Stiehl DP & Camenisch G 2005 Integration of Oxygen Signaling at the Consensus HRE. Science Signaling 2005 re12.
Wheatley D, Wang AM & Strugnell GE 1996 Expression of primary cilia in mammalian cells. Cell Biology International 20 73–81.
Whelton PK, Carey RM, Aronow WS, Casey DE, Collins KJ, Dennison Himmelfarb C, DePalma SM, Gidding S, Jamerson KA, Jones DW et al. 2018 2017 ACC/AHA/AAPA/ABC/ACPM/AGS/APhA/ASH/ASPC/NMA/PCNA Guideline for the Prevention, Detection, Evaluation, and Management of High Blood Pressure in Adults: Executive Summary: A Report of the American College of Cardiology/American Heart Association Task Force on Clinical Practice Guidelines. Hypertension 71 1269–1324.
Wheway G, Abdelhamed Z, Natarajan S, Toomes C, Inglehearn C & Johnson CA 2013 Aberrant Wnt signalling and cellular over-proliferation in a novel mouse model of Meckel–Gruber syndrome. Developmental Biology 377 55–66.
Wiens CJ, Tong Y, Esmail MA, Oh E, Gerdes JM, Wang J, Tempel W, Rattner JB, Katsanis N, Park H-W et al. 2010 Bardet-Biedl Syndrome-associated Small GTPase ARL6 (BBS3) Functions at or near the Ciliary Gate and Modulates Wnt Signaling. Journal of Biological Chemistry 285 16218–16230.
Wilkinson SE, Furic L, Buchanan G, Larsson O, Pedersen J, Frydenberg M, Risbridger GP & Taylor RA 2013 Hedgehog signaling is active in human prostate cancer stroma and regulates proliferation and differentiation of adjacent epithelium. The Prostate 73 1810–1823.
Williams CL, Li C, Kida K, Inglis PN, Mohan S, Semenec L, Bialas NJ, Stupay RM, Chen N, Blacque OE et al. 2011 MKS and NPHP modules cooperate to establish basal body/transition zone membrane associations and ciliary gate function during ciliogenesis. The Journal of Cell Biology 192 1023–1041.
Wilson CW, Nguyen CT, Chen M-H, Yang J-H, Gacayan R, Huang J, Chen J-N & Chuang P-T 2009 Fused has evolved divergent roles in vertebrate Hedgehog signalling and motile ciliogenesis. Nature 459 98–102.
Wiseman GA, Pacak K, O’Dorisio MS, Neumann DR, Waxman AD, Mankoff DA, Heiba SI, Serafini AN, Tumeh SS, Khutoryansky N et al. 2009 Usefulness of 123I-MIBG scintigraphy in the evaluation of patients with known or suspected primary or metastatic pheochromocytoma or paraganglioma: results from a prospective multicenter trial. Journal of Nuclear Medicine : Official Publication, Society of Nuclear Medicine 50 1448–1454.
Wong SY, Seol AD, So P-L, Ermilov AN, Bichakjian CK, Epstein EH, Dlugosz AA & Reiter JF 2009 Primary cilia can both mediate and suppress Hedgehog pathway-dependent tumorigenesis. Nature Medicine 15 1055–1061.
Wood LD, Parsons DW, Jones S, Lin J, Sjoblom T, Leary RJ, Shen D, Boca SM, Barber T, Ptak J et al. 2007 The Genomic Landscapes of Human Breast and Colorectal Cancers. Science 318 1108–1113.
Wu K-S & Tang TK 2012 CPAP is required for cilia formation in neuronal cells. Biology Open 1 559–565.
Wu D, Tischler AS, Lloyd R V, DeLellis RA, de Krijger R, van Nederveen F & Nosé V 2009 Observer variation in the application of the Pheochromocytoma of the Adrenal Gland Scaled Score. The American Journal of Surgical Pathology 33 599–608. (doi:10.1097/PAS.0b013e318190d12e)
306
Wurtman RJ & Axelrod J 1965 Adrenaline synthesis: control by the pituitary gland and adrenal glucocorticoids. Science (New York, N.Y.) 150 1464–1465.
Xekouki P, Pacak K, Almeida M, Wassif C a., Rustin P, Nesterova M, De La Luz Sierra M, Matro J, Ball E, Azevedo M et al. 2012 Succinate dehydrogenase (SDH) D subunit (SDHD) inactivation in a growth-hormone-producing pituitary tumor: A new association for SDH? Journal of Clinical Endocrinology and Metabolism 97 357–366.
Xia P, Chu S, Liu G, Chen G, Yi T, Feng S & Zhou H 2018 High expression of KIF3A is a potential new parameter for the diagnosis and prognosis of breast cancer. Biomedical Reports 8 343–349.
Xiang W, Jiang T, Guo F, Xu T, Gong C, Cheng P, Zhao L, Cheng W & Xu K 2014 Evaluating the Role of PTH in Promotion of Chondrosarcoma Cell Proliferation and Invasion by Inhibiting Primary Cilia Expression. International Journal of Molecular Sciences 15 19816–19831.
Xiang W, Guo F, Cheng W, Zhang J, Huang J, Wang R, Ma Z & Xu K 2017 HDAC6 inhibition suppresses chondrosarcoma by restoring the expression of primary cilia. Oncology Reports 38 229–236.
Xu J, Li H, Wang B, Xu Y, Yang J, Zhang X, Harten SK, Shukla D, Maxwell PH, Pei D et al. 2010 VHL Inactivation Induces HEF1 and Aurora Kinase A. Journal of the American Society of Nephrology 21 2041–2046.
Yaari G, Bolen CR, Thakar J & Kleinstein SH 2013 Quantitative set analysis for gene expression: a method to quantify gene set differential expression including gene-gene correlations. Nucleic Acids Research 41 e170–e170.
Yang H, Minamishima YA, Yan Q, Schlisio S, Ebert BL, Zhang X, Zhang L, Kim WY, Olumi AF & Kaelin WG 2007 pVHL Acts as an Adaptor to Promote the Inhibitory Phosphorylation of the NF-κB Agonist Card9 by CK2. Molecular Cell 28 15–27.
Yang C, Chen W, Chen Y & Jiang J 2012 Smoothened transduces Hedgehog signal by forming a complex with Evc/Evc2. Cell Research 22 1593–1604.
Yang Y, Roine N & Mäkelä TP 2013 CCRK depletion inhibits glioblastoma cell proliferation in a cilium-dependent manner. EMBO Reports 14 741–747.
Yang C, Zhuang Z, Fliedner SMJ, Shankavaram U, Sun MG, Bullova P, Zhu R, Elkahloun AG, Kourlas PJ, Merino M et al. 2015 Germ-line PHD1 and PHD2 mutations detected in patients with pheochromocytoma/paraganglioma-polycythemia. Journal of Molecular Medicine 93 93–104.
Yang N, Leung EL-H, Liu C, Li L, Eguether T, Jun Yao X-J, Jones EC, Norris DA, Liu A, Clark RA et al. 2017 INTU is essential for oncogenic Hh signaling through regulating primary cilia formation in basal cell carcinoma. Oncogene 36 4997–5005.
Yao L, Schiavi F, Cascon A, Qin Y, Inglada-Pérez L, King EE, Toledo RA, Ercolino T, Rapizzi E, Ricketts CJ et al. 2010 Spectrum and Prevalence of FP/TMEM127 Gene Mutations in Pheochromocytomas and Paragangliomas. JAMA 304 2611.
Yao G, Luo C, Harvey M, Wu M, Schreiber TH, Du Y, Basora N, Su X, Contreras D & Zhou J 2016 Disruption of polycystin-L causes hippocampal and thalamocortical hyperexcitability. Human Molecular Genetics 25 448–458.
Yasar B, Linton K, Slater C & Byers R 2017 Primary cilia are increased in number and demonstrate structural abnormalities in human cancer. Journal of Clinical Pathology 70 571–574.
307
Yeap PM, Tobias ES, Mavraki E, Fletcher A, Bradshaw N, Freel EM, Cooke A, Murday VA, Davidson HR, Perry CG et al. 2011 Molecular Analysis of Pheochromocytoma after Maternal Transmission of SDHD Mutation Elucidates Mechanism of Parent-of-Origin Effect. The Journal of Clinical Endocrinology & Metabolism 96 E2009–E2013.
Yeh I-T, Lenci RE, Qin Y, Buddavarapu K, Ligon AH, Leteurtre E, Cao C Do, Cardot-Bauters C, Pigny P & Dahia PLM 2008 A germline mutation of the KIF1Bβ gene on 1p36 in a family with neural and nonneural tumors. Human Genetics 124 279–285.
Yeh C, Li A, Chuang J-Z, Saito M, Cáceres A & Sung C-H 2013 IGF-1 Activates a Cilium-Localized Noncanonical Gβγ Signaling Pathway that Regulates Cell-Cycle Progression. Developmental Cell 26 358–368.
You N, Tan Y, Zhou L, Huang X, Wang W, Wang L, Wu K, Mi N, Li J & Zheng L 2017 Tg737 acts as a key driver of invasion and migration in liver cancer stem cells and correlates with poor prognosis in patients with hepatocellular carcinoma. Experimental Cell Research 358 217–226.
Young AP, Schlisio S, Minamishima YA, Zhang Q, Li L, Grisanzio C, Signoretti S & Kaelin WG 2008 VHL loss actuates a HIF-independent senescence programme mediated by Rb and p400. Nature Cell Biology 10 361–369.
Yu T-M, Chuang Y-W, Yu M-C, Chen C-H, Yang C-K, Huang S-T, Lin C-L, Shu K-H & Kao C-H 2016 Risk of cancer in patients with polycystic kidney disease: a propensity-score matched analysis of a nationwide, population-based cohort study. The Lancet. Oncology 17 1419–1425.
Yuan K, Frolova N, Xie Y, Wang D, Cook L, Kwon Y, Steg AD, Serra R & Frost A 2010 Primary cilia are decreased in breast cancer: analysis of a collection of human breast cancer cell lines and tissues. J Histochem Cytochem 58 857–870.
Zalli D, Bayliss R & Fry AM 2012 The Nek8 protein kinase, mutated in the human cystic kidney disease nephronophthisis, is both activated and degraded during ciliogenesis. Human Molecular Genetics 21 1155–1171.
Zanconato F, Forcato M, Battilana G, Azzolin L, Quaranta E, Bodega B, Rosato A, Bicciato S, Cordenonsi M & Piccolo S 2015 Genome-wide association between YAP/TAZ/TEAD and AP-1 at enhancers drives oncogenic growth. Nature Cell Biology 17 1218–1227.
Zbar B, Kishida T, Chen F, Schmidt L, Maher ER, Richards FM, Crossey PA, Webster AR, Affara NA, Ferguson-smith MA et al. 1996 Germline Mutations in the n Hippel-Lindau Disease (VHL) Gene in Families From North America, Euope and Japan. Human Mutation 357 348–357.
Zelinka T, Petrák O, Turková H, Holaj R, Strauch B, Kršek M, Vránková AB, Musil Z, Dušková J, Kubinyi J et al. 2012 High incidence of cardiovascular complications in pheochromocytoma. Hormone and Metabolic Research 44 379–384.
Zervos AS, Gyuris J & Brent R 1993 Mxi1, a protein that specifically interacts with Max to bind Myc-Max recognition sites. Cell 72 223–232.
Zhang X, Yuan Z, Zhang Y, Yong S, Salas-Burgos A, Koomen J, Olashaw N, Parsons JT, Yang X-J, Dent SR et al. 2007 HDAC6 Modulates Cell Motility by Altering the Acetylation Level of Cortactin. Molecular Cell 27 197–213.
Zhang J, Lipinski RJ, Gipp JJ, Shaw AK & Bushman W 2009 Hedgehog pathway responsiveness correlates with the presence of primary cilia on prostate stromal cells. BMC Developmental Biology 9 50.
308
Zhao C, Takita J, Tanaka Y, Setou M, Nakagawa T, Takeda S, Yang HW, Terada S, Nakata T, Takei Y et al. 2001 Charcot-Marie-Tooth disease type 2A caused by mutation in a microtubule motor KIF1Bbeta. Cell 105 587–597.
Zhao X, Pak E, Ornell KJ, Pazyra-Murphy MF, MacKenzie EL, Chadwick EJ, Ponomaryov T, Kelleher JF & Segal RA 2017 A Transposon Screen Identifies Loss of Primary Cilia as a Mechanism of Resistance to SMO Inhibitors. Cancer Discovery 7 1436–1449.
Zheng X, Ramani A, Soni K, Gottardo M, Zheng S, Ming Gooi L, Li W, Feng S, Mariappan A, Wason A et al. 2016 Molecular basis for CPAP-tubulin interaction in controlling centriolar and ciliary length. Nature Communications 7 11874.
Zhu D, Shi S, Wang H & Liao K 2009 Growth arrest induces primary-cilium formation and sensitizes IGF-1-receptor signaling during differentiation induction of 3T3-L1 preadipocytes. Journal of Cell Science 122 2760–2768.
Zhuang Z, Yang C, Lorenzo F, Merino M, Fojo T, Kebebew E, Popovic V, Stratakis C a., Prchal JT & Pacak K 2012 Gain-of-Function Mutations in Paraganglioma with Polycythemia. New England Journal of Medicine 367 922–930.
Ziegler CG, Brown JW, Schally A V, Erler A, Gebauer L, Treszl A, Young L, Fishman LM, Engel JB, Willenberg HS et al. 2009 Expression of neuropeptide hormone receptors in human adrenal tumors and cell lines: antiproliferative effects of peptide analogues. Proceedings of the National Academy of Sciences of the United States of America 106 15879–15884.
Zilber Y, Babayeva S, Seo JH, Liu JJ, Mootin S & Torban E 2013 The PCP effector Fuzzy controls cilial assembly and signaling by recruiting Rab8 and Dishevelled to the primary cilium. Molecular Biology of the Cell 24 555–565.
Zimmermann KW 1898 Beitrage zur Kenntniss einiger Drusen und Epithelien. Arch. Mikrosk. Anat. 52 552–706.
Zuber S, Wesley R, Prodanov T, Eisenhofer G, Pacak K & Kantorovich V 2014 Clinical utility of chromogranin A in SDHx- related paragangliomas. European Journal of Clinical Investigation 44 365–371.

309
List of publications arising from this thesis
Journal articles
C.W.C. Sze*, S.M. O’Toole*, R.K. Tirador, S.A. Akker, M. Matson, L. Perry, M.R. Druce, T. Dekkers, J.
Deinum, J.W.M. Lenders, G. Eisenhofer, W.M. Drake (2017) Hormone and Metabolic Research
49(6):418-423.
* Joint first author
S.M. O’Toole, D.S. Watson, T.V. Novoselova, L.E.L. Romano, P.J. King, T.Y. Bradshaw, C.L. Thompson,
M.M. Knight, T.V. Sharp, M.R. Barnes, U. Srirangalingam, W.M. Drake, J.P. Chapple (2019)
Oncometabolite induced primary cilia loss in pheochromocytoma. Endocrine Related Cancer
26(1):165-180.
Conference abstracts
S.M. O’Toole, C. Sze, K. Tirador, S. Akker, M. Matson, L. Perry, M.R. Druce, T. Dekkers, J. Deinum, J.
Lenders, G. Eisenhofer, W.M. Drake. Adrenal vein catecholamine levels and ratios: reference
intervals derived from patients with primary aldosteronism
Oral communication at Society for Endocrinology BES 2015, Edinburgh, 2-4/11/15
S.M. O’Toole, U. Srirangalingam, W.M. Drake, J.P. Chapple. The role of primary cilia in the molecular
pathogenesis of phaeochromocytoma
Oral communication at Cilia, Cytoskeleton and Cancer, a Biochemical Society Focused Meeting,
Edinburgh, 25-6/4/16
Oral communication at UK Cilia Network Meeting, London, 7/7/16
Oral communication at ENDO, Orlando, Florida, USA, 1-4/4/17

310
Appendix
Sze CWC et al. Normal Adrenal Vein Catecholamine Ratios … Horm Metab Res 2017; 49: 1–7
■ Proof copy for correction only. All forms of publication, duplication or distribution prohibited under copyright law. ■
Endocrine Care HMR/2016-06-0197/27.12.2016/MPS
IntroductionPhaeochromocytomas are rare, catecholamine producing tumours of the adrenal medulla that, if undiagnosed or untreated, may cause considerable morbidity and mortality [1, 2]. Diagnosis re-quires the demonstration of abnormal biochemistry (fractionated metanephrines in the blood and/or urine) prior to attempted local-isation by imaging techniques such as computed tomography (CT), magnetic resonance imaging (MRI) and meta-123iodobenzylguan-idine (MIBG) scintigraphy [3]. Using these techniques, uncertainty
regarding localisation in most patients with a sporadic phaeochro-mocytoma is unusual. The situation is different, however, in pa-tients with inherited endocrine tumour syndromes [e. g., von Hip-pel–Lindau syndrome (VHL), multiple endocrine neoplasia type 2 (MEN2), mutations of the various subunits of succinate dehydro-genase (SDHx)]. Such patients are often asymptomatic and en-rolled within screening programs [4–6] in which biochemical and radiological surveillance runs concurrently – the aim being to de-tect and treat tumours before they give rise to symptoms or hae-modynamic instability. On occasion, this leads to the finding of bi-lateral radiological abnormalities in association with elevated urine
Adrenal Vein Catecholamine Levels and Ratios: Reference Intervals Derived from Patients with Primary Aldosteronism
AuthorsCandy W.C. Sze1 * , Samuel Matthew O’Toole1 * , Roger Kent Tirador1, Scott A. Akker1, Matthew Matson2, Leslie Perry3, Maralyn Rose Druce1, Tanja Dekkers4, Jaap Deinum4, Jacques W.M. Lenders4, 5, Graeme Eisenhofer5, 6, William Martyn Drake1
Affiliations1 Department of Endocrinology, St Bartholomew’s Hospital,
London, UK2 Department of Radiology, St Bartholomew’s Hospital,
London, UK3 Department of Biochemistry, St Bartholomew’s Hospital,
London, UK4 Department of Internal Medicine, Radboud University Medical
Center, Nijmegen, The Netherlands5 Department of Internal Medicine III, University Hospital Carl
Gustav Carus, Technische Universität Dresden, Dresden, Germany
6 Institute of Clinical Chemistry and Laboratory Medicine, University Hospital Carl Gustav Carus, Technische Universität Dresden, Dresden, Germany
Key wordsadrenal venous sampling, catecholamines, phaeochromocytoma, hypertension, reference interval received 17.06.2016 accepted 13.12.2016
BibliographyDOI http://dx.doi.org/10.1055/s-0042-124419 Horm Metab Res 2017; 49: 1–7 © Georg Thieme Verlag KG Stuttgart · New York ISSN 0018-5043
CorrespondenceProfessor William Martyn DrakeDepartment of Endocrinology St Bartholomew’s Hospital
London EC1A 7BE, UK Tel.: + 44/203/465 7264, Fax: + 44/203/465 6148 [email protected]
Supporting Information for this article is available online at
http://www.thieme-connect.de/products
AbStr Act
Phaeochromocytoma localisation is generally reliably achieved with modern imaging techniques, particularly in sporadic cases. On occasion, however, there can be diagnostic doubt due to the presence of bilater-al adrenal abnormalities, particularly in patients with mutations in genes predisposing them to the development of multiple phaeochromocyto-mas. In such cases, surgical intervention is ideally limited to large or functional lesions due to the long-term consequences associated with hypoadrenalism. Adrenal venous sampling (AVS) for catecholamines has been used in this situation to guide surgery, although there are few data available to support diagnostic thresholds. Retrospective analyses of AVS results from 2 centres were carried out. A total of 172 patients (88 men, 84 women) underwent AVS under cosyntropin stimulation for the diagnosis of established primary aldosteronism (PA) with measure-ment of adrenal and peripheral venous cortisol, aldosterone and cat-echolamines. Six patients (3 men, 3 women) with phaeochromocytoma underwent AVS for diagnostic purposes with subsequent histological confirmation. Reference intervals for the adrenal venous norepinephrine to epinephrine ratio were created from the PA group. Using the 97.5th centile (1.21 on the left, 1.04 on the right), the false negative rate in the phaeochromocytoma group was 0 %. In conclusion, this study describes the largest dataset of adrenal venous catecholamine measurements and provides reference intervals in patients without phaeochromocy-toma. This strengthens the certainty with which conclusions related to adrenal venous sampling for catecholamines can be drawn, acknowl-edging the procedure is not part of the routine diagnostic workup and is an adjunct for use only in difficult clinical cases.
* Denotes equal contribution
1

■ Proof copy for correction only. All forms of publication, duplication or distribution prohibited under copyright law. ■
HMR/2016-06-0197/27.12.2016/MPS
Sze CWC et al. Normal Adrenal Vein Catecholamine Ratios … Horm Metab Res 2017; 49: 1–7
Endocrine Care
or plasma levels of metanephrines and/or catecholamines. This pre-sents difficulties for decision-making. Correct identification of one or other adrenal gland as being the source of catecholamine excess would be treated by a unilateral adrenalectomy (thereby avoiding, for a time, the need for adrenal replacement therapy); whereas a secure diagnosis of bilateral phaeochromocytomata could facili-tate surgery at a single sitting.
The most commonly used for the localisation of primary aldos-teronism (PA), adrenal venous sampling (AVS), was originally de-veloped for the diagnosis and localisation of catecholamine-pro-ducing tumours [7]. Although a number of reports [8–25] have highlighted the use of AVS in the diagnosis of phaeochromocyto-ma, there remains uncertainty in the field [26], largely because of the lack of robust reference intervals for catecholamine values in adrenal venous effluent. Here, we report a large series of patients being investigated for PA in whom adrenal vein catecholamine con-centrations were also measured, with the aim of producing refer-ence intervals for use when AVS is utilized in challenging phaeo-chromocytoma cases.
Patients and MethodsPatientsSuccessive patients underwent AVS for the localisation of estab-lished PA at one of 2 centres: St Bartholomew’s Hospital, London, UK and the Radboud University Medical Center, Nijmegen, The Netherlands between 2006 and 2015. A second group of 6 patients at St Bartholomew’s Hospital were identified who had undergone AVS for the diagnosis and localisation of phaeochromocytoma; with subsequent histological confirmation of the diagnosis. The proto-col received institutional board review at both centres.
Adrenal venous catheterisationAn intravenous infusion of cosyntropin 50 μg/h was commenced one hour before samples were obtained from each adrenal vein and the low inferior vena cava (IVC; as a peripheral sample) as previous-ly described [27, 28]. Successful cannulation of each adrenal vein was defined by an adrenal vein to peripheral cortisol ratio exceed-ing 5–1 [29]. Aldosterone antagonists and potassium sparing diu-retics were discontinued for at least 4 weeks, whilst beta-blockers and angiotensin converting enzyme inhibitors were withheld for at least 2 weeks prior to AVS.
At each centre it is standard practice to obtain a duplicate sam-ple from each site for the potential future measurement of corti-sol, aldosterone and catecholamines in order to provide extra re-assurance regarding successful cannulation in the event of any tech-nical shortcomings. It is these catecholamine values that have been used for this analysis; only those from patients satisfying the strict ≥ 5:1 cortisol ratio are included.
Biochemical analysisPlasma catecholamines were measured using high performance liquid chromatography with electrochemical detection at both St Bartholomew’s Hospital (Chromsystems, Gräfelfing, Germany) and at the University of Dresden (in house method [30]) for the Nijme-gen samples.
Serum cortisol was measured by electrochemiluminescence im-munoassay at both St Bartholomew’s Hospital (Roche, Basel, Swit-zerland) and at Nijmegen (Modular E170 analyzer, Roche diagnos-tics Woerden, the Netherlands).
Statistical analysisData are presented as mean ± standard error of the mean or medi-an with interquartile ranges. The Wilcoxon signed rank test was used to compare between adrenal veins. Centile values of the left and right norepinephrine to epinephrine ratio was calculated by counting. Analyses were performed using Stata version 13 (Stat-Corp, College Station, Texas, USA).
ResultsNormal adrenal catecholamine levels in patients with PAOne hundred and seventy-two patients (88 males, 84 females) un-derwent AVS for localisation of biochemically confirmed PA. Their details are summarized in table 1S. Samples for catecholamine analysis were available from 289 adrenal veins (130 right, 159 left).
Adrenal vein catecholamine concentrations are shown in ▶table 1 and table 2S. The median epinephrine (61.4 nmol/l com-pared to 35.1) and norepinephrine (16.3 nmol/l compared to 10.6) concentrations were higher in the right adrenal vein than in the left. The norepinephrine to epinephrine ratio was greater on the left (0.31) than the right (0.26).
▶table 1 Adrenal vein catecholamine concentrations in patients who underwent adrenal venous sampling for the diagnosis of primary aldosteronism.
catecholamine
Median (interquartile range)
p-Value
Left adrenal vein right adrenal vein
Epinephrine (nmol/l) 35.1 (19.5–72.8) 61.4 (31.5–126.7) < 0.001
Norepinephrine (nmol/l) 10.6 (6.6–18.7) 16.3 (8.8–31.8) < 0.001
Norepinephrine:epinephrine ratio 0.31 (0.20–0.51) 0.26 (0.18–0.38) < 0.001
Data are presented from the 113 patients with successful bilateral adrenal vein cannulation as median and interquartile ranges. p-Values were calculated using the Wilcoxon signed rank test.
2

Sze CWC et al. Normal Adrenal Vein Catecholamine Ratios … Horm Metab Res 2017; 49: 1–7
■ Proof copy for correction only. All forms of publication, duplication or distribution prohibited under copyright law. ■
Centile values of the left and right adrenal venous norepi-nephrine to epinephrine ratio were calculated and are shown in ▶table 2. The ratio for the 97.5th centile was 1.21 on the left and 1.04 on the right.
Adrenal catecholamine levels in patients with phaeochromocytomaSix patients (3 males, 3 females) with the clinical and biochemical suspicion of catecholamine excess but with equivocal imaging un-derwent AVS as part of the diagnostic process. The mean age of these patients was 31.3 ± 6.9 years (range 13–67 years) and 5 had a genetic predisposition to phaeochromocytoma development (all VHL). AVS data guided surgical decision making and adrenalecto-my was undertaken in all 6 patients (bilateral in 4) with the diagno-sis confirmed histologically in all cases. The clinical details and AVS data for these patients are shown in ▶table 3. All 6 patients were alpha blocked prior to AVS and there were no haemodynamic or other adverse effects following AVS.
The lowest adrenal vein norepinephrine to epinephrine ratio in confirmed phaeochromocytoma was 2.96 on the left and 1.75 on the right.
Adrenal vein norepinephrine to epinephrine ratios for patients with PA and those with phaeochromocytomas are displayed in ▶Fig. 1. Using a cut-off defined by the 97.5th centile of the PA cohort the false negative rate in the phaeochromocytoma cohort was 0 %.
DiscussionHistorically, caval catheters and AVS have been used for the diagno-sis [7, 12, 14, 16] and lateralization of adrenal phaeochromocyto-mas [11, 15, 21, 23] as well as the localisation of abdominal [8–10, 13, 21–23], bladder [17] and head and neck paragangliomas [8, 19]. Interpretation of these venous sampling studies depended either on the use of non-standardized concentration gradient cut-offs, comparisons with the contralateral adrenal or assumptions sur-rounding the norepinephrine to epinephrine ratio. Epinephrine is
the predominantly secreted adrenal catecholamine [31] and an ex-cess of norepinephrine, expressed as a norepinephrine to epineph-rine ratio exceeding one, has been proposed as being pathological [20], although there are limited normative data to support this.
This series is the largest reported to date of catecholamine con-centrations in the adrenal veins. In keeping with previous studies [26, 32, 33], we observed wide variation in absolute catecholamine concentrations (up to a factor of 178 on the right and 106 on the left); a fact that has been used to argue against the utility of AVS in the diagnosis of phaeochromocytoma [26]. This variation was re-duced when considering the norepinephrine to epinephrine ratio in each adrenal vein (variation up to a factor of 54 on the right and 34 on the left) but not by ‘correcting’ for adrenal vein cortisol (table 3S).
We have generated reference intervals for the adrenal vein nor-epinephrine to epinephrine ratio in individuals with PA. A ratio ex-ceeding one has previously been suggested to be pathological, al-though this was based on data from only 3 patients with phaeo-chromocytoma and 5 without [20]. This previously proposed cut-off is close to what were observed in the PA cohort, particular-ly on the left. In the phaeochromocytoma cases the ratio was usu-ally significantly higher.
A limitation of this study is the use of patients with PA to define reference intervals, but the use of healthy normotensive subjects would not be justifiable given the invasive nature, contrast and ra-diation exposure of AVS. Aldosterone stimulates the central nerv-ous system in animals [34] but there is contradictory evidence as to whether sympathetic nervous system activity is increased [35] or attenuated [36] in individuals with PA, and whether this alters adrenal venous catecholamine levels is unknown. Alpha blockade has the potential to elevate circulating norepinephrine [3]; howev-er both the PA and phaeochromocytoma groups were treated with alpha receptor antagonists prior to AVS (in the PA group for blood pressure control whilst not interfering with aldosterone measure-ment). Subgroup analysis (table 4S) suggests that doxazosin treat-ment at the time of AVS increases norepinephrine in the left adre-nal vein and the norepinephrine: epinephrine ratio on the right. It is unclear why this asymmetry should occur but the differential alpha blocker use at the time of AVS may partly explain the ob-served differences between the 2 cohorts (table 2S).Prior to this report, the group at the Mayo Clinic reported AVS catecholamine results in 18 patients being evaluated for autonomous cortisol pro-duction [26]. These patients had cortisol excess, suppressed adren-ocorticotrophin releasing hormone (ACTH) in all but one case and the AVS was performed under dexamethasone suppression. All of these factors have the potential to influence adrenal catecholamine production via effects on enzymes of the catecholamine synthesis pathway [31, 37–39]. The evidence for this in humans is limited and conflicting with reports of reduced peripheral epinephrine [40], norepinephrine [41] or both epinephrine and norepinephrine [42] in patients with Cushing’s syndrome. One study found that chron-ic administration of ACTH to normal subjects did not affect periph-eral norepinephrine, whilst dexamethasone at a dose of 6 mg over 3 days reduced norepinephrine [43]. Another study found no sig-nificant difference between the adrenal venous epinephrine to nor-epinephrine ratio in 8 patients with Cushing’s compared to 12 con-trols [42]. Our patients were also hypercortisolaemic, albeit tem-
▶table 2 Centile values for the norepinephrine:epinephrine ratio in the right and left adrenal veins in patients with primary aldosteronism.
centile Left right
1 0.09 0.07
2.5 0.10 0.09
5 0.11 0.10
10 0.13 0.11
25 0.20 0.17
50 0.31 0.26
75 0.51 0.40
90 0.74 0.62
95 0.88 0.77
97.5 1.21 1.04
99 2.41 3.38
3

■ Proof copy for correction only. All forms of publication, duplication or distribution prohibited under copyright law. ■
HMR/2016-06-0197/27.12.2016/MPS
Sze CWC et al. Normal Adrenal Vein Catecholamine Ratios … Horm Metab Res 2017; 49: 1–7
Endocrine Care
▶ta
ble
3
Patie
nts w
ho u
nder
wen
t AVS
for t
he d
iagn
osis
of p
haeo
chro
moc
ytom
a.
Pati
ent
Age
Sex
Gene
tic
synd
rom
e
radi
olog
y *
MIb
GN
E:E
rati
o
Ope
rati
onH
isto
logy
righ
tLe
ftri
ght
Left
righ
tLe
ft
113
MVH
L45
0 +
−
N
C2.
96Bi
late
ral a
dren
alec
tom
yBi
late
ral p
haeo
chro
moc
ytom
a
267
FN
il19
14 +
−
1.
75†
0.85
Righ
t adr
enal
ecto
my
Phae
ochr
omoc
ytom
a
3‡29
MVH
L45
10 +
−
21
09
Bila
tera
l adr
enal
ecto
my
Bila
tera
l pha
eoch
rom
ocyt
oma
4‡25
FVH
L25
5 +
−
26
11Bi
late
ral a
dren
alec
tom
yBi
late
ral p
haeo
chro
moc
ytom
a
5‡24
FVH
L10
50 −
+
11
26Bi
late
ral a
dren
alec
tom
yBi
late
ral p
haeo
chro
moc
ytom
a
6‡30
MVH
L0
0 −
−
0.
80.
5Re
sect
ion
of le
ft k
idne
y, a
dren
al
and
para
-aor
tic m
ass
Rena
l car
cino
ma,
par
a-ao
rtic
par
agan
glio
ma
Nor
mal
adr
enal
his
tolo
gy
MIB
G: M
etai
odob
enzy
lgua
nidi
ne; N
E: N
orep
inep
hrin
e; E
: Epi
neph
rine;
VH
L: v
on H
ippe
l-Lin
dau;
+ :
posi
tive;
–: N
egat
ive;
NC:
Not
can
nula
ted;
AVS
: Adr
enal
Ven
ous
Sam
plin
g. *
Max
imum
dim
ensi
on (m
m) o
f an
adre
nal a
bnor
mal
ity
visu
alis
ed b
y an
y im
agin
g m
odal
ity.
† Thi
s is
the
min
imum
pos
sibl
e ra
tio a
s un
fort
unat
ely
insu
ffici
ent s
ampl
e w
as a
vaila
ble
for f
urth
er d
eter
min
atio
n of
the
nore
pine
phrin
e co
ncen
trat
ion.
‡ The
se p
atie
nts
have
bee
n re
port
ed p
revi
ousl
y [2
1].
Patie
nt 2
’s le
ft a
dren
al le
sion
was
inde
term
inat
e on
imag
ing
and
unde
rwen
t a u
nila
tera
l rig
ht a
dren
alec
tom
y ba
sed
on th
e AV
S re
sult
with
sub
sequ
ent h
isto
logi
cal c
onfir
mat
ion
of a
pha
eoch
rom
ocyt
oma.
Po
st-o
pera
tive
met
anep
hrin
e m
easu
rem
ents
wer
e no
rmal
exc
ludi
ng th
e pr
esen
ce o
f a p
heoc
hrom
ocyt
oma
in th
e le
ft a
dren
al g
land
whi
ch re
mai
ned
in s
itu. P
atie
nt 6
und
erw
ent r
esec
tion
of h
is le
ft k
idne
y (f
or re
nal c
ell c
arci
nom
a) a
nd a
left
-sid
ed p
ara-
aort
ic m
ass
(par
agan
glio
ma)
that
was
not
pos
sibl
e to
be
dist
ingu
ishe
d fr
om th
e le
ft a
dren
al g
land
on
imag
ing.
Ana
tom
ical
ly it
was
impo
ssib
le to
pre
serv
e th
e le
ft a
dren
al g
land
whi
ch w
as h
isto
logi
cally
nor
mal
(cor
resp
ondi
ng a
dren
al v
ein
NE:
E ra
tio 0
.5).
4

Sze CWC et al. Normal Adrenal Vein Catecholamine Ratios … Horm Metab Res 2017; 49: 1–7
■ Proof copy for correction only. All forms of publication, duplication or distribution prohibited under copyright law. ■
porarily, due to infusion of cosyntropin at the time of AVS and this has been shown to increase adrenal vein epinephrine and norepi-nephrine in one small series [44].
In keeping with the results of Freel et al. [26] we also observed a difference between left and right adrenal veins, necessitating dif-ferent reference intervals. This differential is presumed to arise due to the anatomical differences between the 2 sides. They found no histological evidence of phaeochromocytoma in 4 patients who underwent adrenalectomy with a norepinephrine to epinephrine ratio exceeding one. The maximum observed ratio was 1.2 on the right and 2.1 on the left and it would be interesting to know how many of these patients had ratios exceeding our proposed cut offs. In addition, the applicability of their data to patients without Cush-ing’s who did not undergo dexamethasone suppression is unclear.
The bulk of the published literature surrounding venous sam-pling for the diagnosis of phaeochromocytoma heralds from a time when cross-sectional and nuclear medicine imaging quality and availability were much more limited than in contemporary prac-tice. As a result AVS has a more limited role in the diagnosis of phae-ochromocytoma and paraganglioma than previously. One situa-tion in which we believe it may still play a role is in patients with predisposing genetic syndromes such as VHL and SDHx. Participa-tion in modern screening programs means that catecholamine ex-cess may be identified early, often in asymptomatic individuals who might have bilateral radiological abnormalities. In this context, identification of a single adrenal gland as the source of catechola-mine excess would facilitate a unilateral adrenalectomy, postpon-ing the need for adrenal replacement therapy and its associated morbidity and mortality. Conversely, a secure diagnosis of bilater-al phaeochromocytoma would allow surgery at a single sitting. In the context of bilateral disease or a predisposing syndrome, adre-nal preserving surgery is an option, but long term follow-up data are limited and there is a significant risk of recurrence [45] and a more difficult second operation.
Previous reports from our centre illustrate these benefits. Chew et al. [21] described 4 patients with VHL and catecholamine excess, 3 of whom proceeded to bilateral adrenalectomy on the basis of elevated norepinephrine to epinephrine ratios bilaterally (range
9–210) with subsequent histological confirmation. The fourth pa-tient had non-suggestive ratios (0.8 on the right, 0.5 on the left) and a diagnosis of a para-aortic paraganglioma which could not be delineated from the adjacent adrenal gland on cross-sectional im-aging and so was not subjected to bilateral adrenalectomy. Sriran-galingam et al. [23] reported a 15 year-old with an SDHD mutation in whom data from AVS led to a surgical approach that allowed preservation of his left adrenal gland when a right phaeochromo-cytoma and left abdominal paraganglioma were resected.
An advantage of the use of the adrenal vein norepinephrine to epinephrine ratio is that it does not rely on comparison with the contralateral adrenal gland, which, in the clinical settings outlined, has a high pre-test probability of being abnormal.
One disadvantage is the issue of a purely epinephrine secreting phaeochromocytoma which would not be identified using the nor-epinephrine to epinephrine ratio. However such cases are rare, par-ticularly within the context of VHL and SDHx [46, 47] and would be identified prior to AVS by urine and plasma catecholamine and me-tanephrine analysis. It should be noted that epinephrine secreting phaeochromocytoma are a feature of both MEN2 and neurofi-bromatosis type 1 (NF1) [48] and this should be borne in mind when interpreting AVS results in these syndromes.
In summary, we have presented data from a large group of pa-tients with PA and suggest that it could serve as a reference inter-val for adrenal vein catecholamines in non-phaeochromocytoma patients. We acknowledge that with advanced cross-sectional and nuclear medicine imaging, AVS is not required in the routine diag-nosis of phaeochromocytoma. However, in some patients with known germline mutations of genes that predispose to the forma-tion of phaeochromocytomas, screening programs may detect the presence of bilateral radiological abnormalities (with or with-out abnormal urine/plasma biochemistry) that presents diagnos-tic difficulties. In such selected situations, AVS, performed in an experienced centre and interpreted in the context of the reference intervals presented here, remains a useful complementary tool for determining treatment strategies in this challenging group of patients.
AcknowledgementsWe thank Mr Jonathan Bestwick for his expert statistical assistance.
Conflict of Interest
The authors declare no conflict of interest.
References
[1] Khorram-Manesh A, Ahlman H, Nilsson O, Odén A, Jansson S. Mortality associated with pheochromocytoma in a large Swedish cohort. Eur J Surg Oncol 2004; 30: 556–559
[2] Zelinka T, Petrák O, Turková H, Holaj R, Strauch B, Kršek M, Vránková AB, Musil Z, Dušková J, Kubinyi J, Michalský D, Novák K, Widimský J. High incidence of cardiovascular complications in pheochromocyto-ma. Horm Metab Res 2012; 44: 379–384
0.1
1
10
100
1 000
Left Right
Nor
epin
ephr
ine
to e
pine
phrin
e ra
tio
▶Fig. 1 Adrenal venous norepinephrine to epinephrine ratios in patients undergoing AVS for PA (open circles) or with histologically confirmed phaeochromocytoma (solid circles).
5
Sam
Highlight
Sam
Sticky Note
This is an error - it should actually be a link to reference 47. There is no reference 48.
■ Proof copy for correction only. All forms of publication, duplication or distribution prohibited under copyright law. ■
HMR/2016-06-0197/27.12.2016/MPS
Sze CWC et al. Normal Adrenal Vein Catecholamine Ratios … Horm Metab Res 2017; 49: 1–7
Endocrine Care
[3] JWM Lenders, Duh Q-Y, Eisenhofer G, Gimenez-Roqueplo A-P, Grebe SKG, Murad MH, Naruse M, Pacak K, Young WF. Pheochromocytoma and paraganglioma: an endocrine society clinical practice guideline. J Clin Endocrinol Metab 2014; 99: 1915–1942
[4] Maher ER, Neumann HP, Richard S. von Hippel-Lindau disease: a clinical and scientific review. Eur J Hum Genet 2011; 19: 617–623
[5] Brandi ML, Gagel RF, Angeli A, Bilezikian JP, Beck-Peccoz P, Bordi C, Conte-Devolx B, Falchetti A, Gheri RG, Libroia A, Lips CJ, Lombardi G, Mannelli M, Pacini F, Ponder BA, Raue F, Skogseid B, Tamburrano G, Thakker RV, Thompson NW, Tomassetti P, Tonelli F, Wells SA, Marx SJ. Guidelines for diagnosis and therapy of MEN type 1 and type 2. J Clin Endocrinol Metab 2001; 86: 5658–5671
[6] Jasperson KW, Kohlmann W, Gammon A, Slack H, Buchmann L, Hunt J, Kirchhoff AC, Baskin H, Shaaban A, Schiffman JD. Role of rapid sequence whole-body MRI screening in SDH-associated hereditary paraganglioma families. Fam Cancer 2014; 13: 257–265
[7] Von Euler US, Gemzell CA, Strom G, Westman A. Report of a case of pheochromocytoma, with special regard to preoperative diagnostic problems. Acta Med Scand 1955; 153: 127–136
[8] Crout JR, Sjoerdsma A. Catecholamines in the localization of pheochro-mocytoma. Circulation 1960; 22: 516–525
[9] Fleisher DS, Voci G, Cresson SL, Karafin L. Preoperative localization of pheochromocytoma. J Pediatr 1964; 64: 711–715
[10] Grim CE, Glenn JF, Wynn JO, Gunnells JC. Bilateral pheochromocytoma: the application of a plasma catecholamine bioassay for tumor localization. Am Heart J 1967; 74: 809–815
[11] Davies RA, Patt NL, Sole MJ. Localization of pheochromocytoma by selective venous catheterization and assay of plasma catecholamines. Can Med Assoc J 1979; 120: 539–542
[12] Jones DH, Allison DJ, Hamilton CA, Reid JL. Selective venous sampling in the diagnosis and localization of phaeochromocytoma. Clin Endocrinol (Oxf) 1979; 10: 179–186
[13] Moss S, Greenbaum R, Sever PS. Preoperative localization of a phaeochromocytoma using plasma noradrenaline concentrations in multiple-site samples. J R Soc Med 1980; 73: 139–141
[14] Palublnskas J, Roizen MF, Conte FA. Localization of functioning pheochromocytomas by venous sampling and radioenzymatic analysis. Radiology 1980; 136: 495–496
[15] Nobin A, Karp W, Lunderquist A, Rosengren E, Sandén G, Sundler F. Localization of carcinoids and pheochromocytomas with vein catheterization and amine determination. Brain Res Bull 1982; 9: 781–797
[16] Allison DJ, Brown MJ, Jones DH, Timmis JB. Role of venous sampling in locating a phaeochromocytoma. Br Med J (Clin Res Ed) 1983; 286: 1122–1124
[17] Miller JL, Immelman EJ, Roman TE, Mervis B. Phaeochromocytoma of the urinary bladder localized by selective venous sampling and computed tomography. Postgrad Med J 1983; 59: 533–535
[18] Bomanji J, Bouloux PMG, Levison DA, Flatman WD, Horne T, Britton KE, Ross G, Besser GM. Observations on the function of normal adre-nomedullary tissue in patients with phaeochromocytomas and other paragangliomas. Eur J Nucl Med 1987; 13: 86–89
[19] Cockcroft JR, Ritter JM, Allison DJ, Causon R, Brown MJ. Location of extra-adrenal catecholamine secreting tumours by selective venous sampling and nuclear magnetic resonance scanning. Postgrad Med J 1987; 63: 451–453
[20] Newbould EC, Ross GA, Dacie JE, Bouloux PM, Besser GM, Grossman A. The use of venous catheterization in the diagnosis and localization of bilateral phaeochromocytomas. Clin Endocrinol (Oxf) 1991; 35: 55–59
[21] Chew SL, Dacie JE, Reznek RH, Newbould EC, Sheaves R, Trainer PJ, Lowe DG, Shand WS, Hungerford J, Besser GM. Bilateral phaeochromo-cytomas in von Hippel-Lindau disease: diagnosis by adrenal vein sampling and catecholamine assay. Q J Med 1994; 87: 49–54
[22] Pacak K, Goldstein DS, Doppman JL, Shulkin BL, Udelsman R, Eisenhofer G. A “Pheo” lurks: Novel approaches for locating occult pheochromocytoma. J Clin Endocrinol Metab 2001; 86: 3641–3646
[23] Srirangalingam U, Khoo B, Matson M, Carpenter R, Reznek R, Maher ER, Chew SL, Drake WM. SDHD-related chromaffin tumours: disease localisation to genetic dysfunction. Horm Res pædiatrics 2010; 73: 135–139
[24] Därr R, Eisenhofer G, Kotzerke J, Zöphel K, Stroszczynski C, Deinum J, Schultze Kool LJ, Pistorius S, Neumann H, Bornstein SR, Hofbauer LC. Is there still a place for adrenal venous sampling in the diagnostic localization of pheochromocytoma? Endocrine 2011; 40: 75–79
[25] Mercado-Asis LB, Tingcungco AG, Bolong DT, Lopez Ra, Caguioa EV, Yamamoto ME, Marcos J, Mercado AB, Zacarias MB. Diagnosis of small adrenal pheochromocytomas by adrenal venous sampling with glucagon stimulation test. Int J Endocrinol Metab 2011; 9: 323–329
[26] Freel EM, Stanson AW, Thompson GB, Grant CS, Farley DR, Richards ML, Young WF. Adrenal venous sampling for catecholamines: A normal value study. J Clin Endocrinol Metab 2010; 95: 1328–1332
[27] Lau JHG, Sze WCC, Reznek RH, Matson M, Sahdev A, Carpenter R, Berney DM, Akker SA, Chew SL, Grossman AB, Monson JP, Drake WM. A prospective evaluation of postural stimulation testing, computed tomography and adrenal vein sampling in the differential diagnosis of primary aldosteronism. Clin Endocrinol (Oxf) 2012; 76: 182–188
[28] Sze WCC, Soh LM, Lau JH, Reznek R, Sahdev A, Matson M, Riddoch F, Carpenter R, Berney D, Grossman AB, Chew SL, Akker SA, Druce MR, Waterhouse M, Monson JP, Drake WM. Diagnosing unilateral primary aldosteronism - comparison of a clinical prediction score, computed tomography and adrenal venous sampling. Clin Endocrinol (Oxf) 2014; 81: 25–30
[29] Webb R, Mathur A, Chang R, Baid S, Nilubol N, Libutti SK, Stratakis CA, Kebebew E. What is the best criterion for the interpretation of adrenal vein sample results in patients with primary hyperaldosteronism? Ann Surg Oncol 2012; 19: 1881–1886
[30] Eisenhofer G, Goldstein DS, Stull R, Keiser HR, Sunderland T, Murphy DL, Kopin IJ. Simultaneous liquid-chromatographic determination of 3,4-dihydroxyphenylglycol, catecholamines, and 3,4-dihydroxypheny-lalanine in plasma, and their responses to inhibition of monoamine oxidase. Clin Chem 1986; 32: 2030–2033
[31] Wurtman RJ, Axelrod J. Adrenaline synthesis: control by the pituitary gland and adrenal glucocorticoids. Science 1965; 150: 1464–1465
[32] Kahaly G, Krause U, Ritthaler H, Cordes U, Günther R, Schrezenmeir J, Beyer J. Selective blood sampling in adrenal hypertension. Cardiology 1985; 72 (Suppl 1): 179–181
[33] Baba Y, Nakajo M, Hayashi S. Adrenal venous catecholamine concentrations in patients with adrenal masses other than pheochro-mocytoma. Endocrine 2013; 43: 219–224
[34] Gomez-Sanchez EP. Intracerebroventricular infusion of aldosterone induces hypertension in rats. Endocrinology 1986; 118: 819–823
[35] Kontak AC, Wang Z, Arbique D, Adams-Huet B, Auchus RJ, Nesbitt SD, Victor RG, Vongpatanasin W. Reversible sympathetic overactivity in hypertensive patients with primary aldosteronism. J Clin Endocrinol Metab 2010; 95: 4756–4761
[36] Miyajima E, Yamada Y, Yoshida Y, Matsukawa T, Shionoiri H, Tochikubo O, Ishii M. Muscle sympathetic nerve activity in renovascular hypertension and primary aldosteronism. Hypertension 1991; 17: 1057–1062
[37] Wurtman RJ, Axelrod J. Control of enzymatic synthesis of adrenaline in the adrenal medulla by adrenal cortical steroids. J Biol Chem 1966; 241: 2301–2305
[38] Gewirtz GP, Kvetnanský R, Weise VK, Kopin IJ. Effect of hypophysecto-my on adrenal dopamine -hydroxylase activity in the rat. Mol Pharmacol 1971; 7: 163–168
6

Sze CWC et al. Normal Adrenal Vein Catecholamine Ratios … Horm Metab Res 2017; 49: 1–7
■ Proof copy for correction only. All forms of publication, duplication or distribution prohibited under copyright law. ■
[39] Thoenen H, Mueller RA, Axelrod J. Trans-synaptic induction of adrenal tyrosine hydroxylase. J Pharmacol Exp Ther 1969; 169: 249–254
[40] Cameron OG, Starkman MN, Schteingart DE. The effect of elevated systemic cortisol levels on plasma catecholamines in Cushing’s syndrome patients with and without depressed mood. J Psychiatr Res 1995; 29: 347–360
[41] Krsek M, Rosická M, Nedvídková J, Kvasnicková H, Hána V, Marek J, Haluzík M, Lai EW, Pacák K. Increased lipolysis of subcutaneous abdominal adipose tissue and altered noradrenergic activity in patients with Cushing’s syndrome: an in-vivo microdialysis study. Physiol Res 2006; 55: 421–428
[42] Mannelli M, Lanzillotti R, Pupilli C, Ianni L, Conti A, Serio M. Adrenal medulla secretion in Cushing’s syndrome. J Clin Endocrinol Metab 1994; 78: 1331–1335
[43] Stene M, Panagiotis N, Tuck ML, Sowers JR, Mayes D, Berg G. Plasma norepinephrine levels are influenced by sodium intake, glucocorticoid administration, and circadian changes in normal man. J Clin Endocrinol Metab 1980; 51: 1340–1345
[44] Valenta LJ, Elias AN, Eisenberg H. ACTH stimulation of adrenal epinephrine and norepinephrine release. Horm Res 1986; 23: 16–20
[45] Srirangalingam U, Walker L, Khoo B, MacDonald F, Gardner D, Wilkin TJ, Skelly RH, George E, Spooner D, Monson JP, Grossman AB, Akker SA, Pollard PJ, Plowman N, Avril N, Berney DM, Burrin JM, Reznek RH, Kumar VKA, Maher ER, Chew SL. Clinical manifestations of familial paraganglioma and phaeochromocytomas in succinate dehydrogenase B (SDH-B) gene mutation carriers. Clin Endocrinol (Oxf) 2008; 69: 587–596
[46] Srirangalingam U, Khoo B, Walker L, MacDonald F, Skelly RH, George E, Spooner D, Johnston LB, Monson JP, Grossman AB, Drake WM, Akker SA, Pollard PJ, Plowman N, Avril N, Berney DM, Burrin JM, Reznek RH, Kumar VKA, Maher ER, Chew SL. Contrasting clinical manifestations of SDHB and VHL associated chromaffin tumours. Endocr Relat Cancer 2009; 16: 515–525
[47] Eisenhofer G, Lenders JWM, Timmers H, Mannelli M, Grebe SK, Hofbauer LC, Bornstein SR, Tiebel O, Adams K, Bratslavsky G, Linehan WM, Pacak K. Measurements of plasma methoxytyramine, normeta-nephrine, and metanephrine as discriminators of different hereditary forms of pheochromocytoma. Clin Chem 2011; 57: 411–420
[48] ■■■
Dear Authors,Please complete reference [48] (cited in line 247) in the reference list by providing full details of the citation.Thank you.
7
Sam
Sticky Note
This is an error - reference 48 is actually the same as reference 47. Therefore, please remove reference 48 from the reference list and change [48] in the manuscript to [47].

26:1Endocrine-Related Cancer
S M O’Toole et al. Cilia loss in pheochromocytoma
165–180
-18-0134
RESEARCH
Oncometabolite induced primary cilia loss in pheochromocytoma
Samuel M O’Toole1,2, David S Watson1, Tatiana V Novoselova1, Lisa E L Romano1, Peter J King1, Teisha Y Bradshaw1, Clare L Thompson3, Martin M Knight3, Tyson V Sharp4, Michael R Barnes1, Umasuthan Srirangalingam1,2,5, William M Drake2 and J Paul Chapple1
1William Harvey Research Institute, Barts and the London School of Medicine, Queen Mary University of London, London, UK2Department of Endocrinology, St Bartholomew’s Hospital, Barts Health NHS Trust, London, UK3Institute of Bioengineering and School of Engineering and Material Sciences, Queen Mary University of London, London, UK4Barts Cancer Institute, Queen Mary University of London, London, UK5Department of Diabetes and Endocrinology, University College London Hospital, London, UK
Correspondence should be addressed to J P Chapple: [email protected]
Abstract
Primary cilia are sensory organelles involved in regulation of cellular signaling. Cilia loss is frequently observed in tumors; yet, the responsible mechanisms and consequences for tumorigenesis remain unclear. We demonstrate that cilia structure and function is disrupted in human pheochromocytomas – endocrine tumors of the adrenal medulla. This is concomitant with transcriptional changes within cilia-mediated signaling pathways that are associated with tumorigenesis generally and pheochromocytomas specifically. Importantly, cilia loss was most dramatic in patients with germline mutations in the pseudohypoxia-linked genes SDHx and VHL. Using a pheochromocytoma cell line derived from rat, we show that hypoxia and oncometabolite-induced pseudohypoxia are key drivers of cilia loss and identify that this is dependent on activation of an Aurora-A/HDAC6 cilia resorption pathway. We also show cilia loss drives dramatic transcriptional changes associated with proliferation and tumorigenesis. Our data provide evidence for primary cilia dysfunction contributing to pathogenesis of pheochromocytoma by a hypoxic/pseudohypoxic mechanism and implicates oncometabolites as ciliary regulators. This is important as pheochromocytomas can cause mortality by mechanisms including catecholamine production and malignant transformation, while hypoxia is a general feature of solid tumors. Moreover, pseudohypoxia-induced cilia resorption can be pharmacologically inhibited, suggesting potential for therapeutic intervention.
Introduction
Pheochromocytomas (PCCs) are neuroendocrine tumors that originate from chromaffin cells of the adrenal medulla or autonomic nervous system, where they are termed paragangliomas (PGLs). The majority of the morbidity associated with PCC/PGLs is consequent upon their production of catecholamines, leading to severe, life-threatening hypertension, but they may also cause local mass
effect and have the potential for metastatic spread (Fishbein & Nathanson 2012, Burnichon et al. 2016). Understanding of the pathogenesis of PCC/PGLs is incomplete, with limited ability to predict malignant potential and at present the response to conventional cancer therapies is disappointing.
Approximately 30% of PCC/PGLs are associated with inherited germline mutations in more than 15
Endocrine-Related Cancer (2019) 26, 165–180
1
Key Words
f pheochromocytoma
f primary cilia
f hypoxia
f succinate dehydrogenase
f von Hippel–Lindau protein
26
This work is licensed under a Creative Commons Attribution 4.0 International License.
Printed in Great BritainPublished by Bioscientifica Ltd.
© 2019 The authorshttps://doi.org/10.1530/ERC-18-0134https://erc.bioscientifica.com
Downloaded from Bioscientifica.com at 11/13/2018 05:17:17PMvia free access
166S M O’Toole et al. Cilia loss in pheochromocytoma
26:1Endocrine-Related Cancer
different susceptibility genes (Dahia 2017). These include causative genes for inherited cancer syndromes, where, relative to other tumor types, there is a high incidence of PCC/PGL. Recent analyses of germline and somatic mutations have classified PCC/PGL into four molecularly defined groups, including a pseudohypoxia-linked subtype (Fishbein et al. 2017). These pseudohypoxic tumors occur due to mutations that impact regulation of the hypoxia transcription factors HIF1α and HIF2α. This can be through germline or somatic mutation of the ubiquitin E3 ligase pVHL (von Hippel–Lindau protein), which targets HIFα for degradation by the ubiquitin proteasome system (Dannenberg et al. 2003, Gossage et al. 2015, Crespigio et al. 2017). Increased HIF activity also results from germline mutation in genes that encode the succinate dehydrogenase (SDH) complex subunits (SDHA, SDHB, SDHC, SDHD), succinate dehydrogenase complex assembly factor 2 (SDHAF2), fumarate hydratase (FH) and malate dehydrogenase (MDH2) (Fishbein & Nathanson 2012). This is because loss of their function leads to accumulation of oncometabolites that inhibit pVHL-mediated degradation of HIFα (Selak et al. 2005).
Although pseudohypoxic mechanisms account, at least in part, for angiogenesis-facilitated growth, they do not, of themselves, satisfactorily explain PCC/PGL tumorigenesis. Mutations in the VHL gene are known to be important in renal cancers; this includes the occurrence of clear cell renal cell carcinoma (ccRCC) as part of the inherited cancer syndrome von Hippel–Lindau disease, in which VHL is mutated and PCC/PGL can occur (Gossage et al. 2015, Crespigio et al. 2017). One of the hallmark features of ccRCC is the loss of primary cilia (Basten et al. 2013), which act as flow sensors on renal epithelial cells. Cilia are cellular organelles that consist of a microtubule-based core structure, known as the axoneme, which elongates from a basal body and is covered by the ciliary membrane. Cilia function as signaling platforms involved in the transduction of extracellular stimuli, through mechanisms including regulating the spatial compartmentalization of signaling components (Berbari et al. 2009, Goetz & Anderson 2010). For example, primary cilia are modulators of WNT signaling and have an essential role in mammalian hedgehog (Hh) signaling (Berbari et al. 2009, Wong et al. 2009, Goetz & Anderson 2010, Lancaster et al. 2011, Oh & Katsanis 2013).
The coordination of cilia-mediated signaling is influenced by the dynamic nature of cilia, which elongate and shorten in response to cell cycle stage and other stimuli. This requires the process of intraflagellar transport (IFT) to traffic ciliary components in both anterograde
and retrograde directions along axonemal microtubules. Cilia are assembled when cells enter stationary phase and are normally resorbed prior to cell division. This occurs as the basal body, which acts as a nucleation site for the growth of axoneme microtubules during ciliogenesis, is derived from a mother centriole and is required for mitotic spindle pole formation. Importantly, the mother centriole has this dual role means that the presence of a primary cilium potentially acts as a checkpoint within the cell cycle (Izawa et al. 2015). Thus, cilia might oppose cell division and proliferation; however, it should be noted that there are instances where cilia are present on mitotic cells (Goto et al. 2013). Dysregulation of normal restraints on cellular proliferation is required for neoplastic progression, and it is hypothesized that disruption of a ciliary cell cycle checkpoint may promote tumorigenesis (Mans et al. 2008), although ciliopathy patients have not been identified as having an increased risk of cancer (Johnson & Collis 2016).
Here, we address key questions regarding the loss of cilia in tumor cells in the context of PCC/PGLs. These include whether cilia loss is correlated with changes in cilia-mediated signaling in vivo. We also consider whether cilia loss increases cellular proliferation or is a consequence of it. We demonstrate that primary cilia loss is a feature of PCC/PGL and in particular those that are driven by germline mutations in pseudohypoxia-linked genes. This finding is consistent with transcriptome-based evidence from PCCs for dysregulation of cilia maintenance and cilia-mediated signaling pathways. Using a rat PCC-derived cell line (PC12), we define the molecular mechanism of primary cilia loss, demonstrating that axonemal resorption is dependent on both HIF signaling and Aurora-A kinase activation. Moreover, loss of primary cilia in PC12, induced by ciliary protein knockdown, leads to increased proliferation and alterations in expression of genes associated with pathways involved in proliferation and cancer. We also show that knockdown of pseudohypoxia-causing PCC/PGL genes and treatment with inhibitors that trigger accumulation of oncometabolites result in primary cilia loss.
Materials and methods
Tissue sample collection and preparation for immunolabeling and RNA extraction
Samples of tumor and adjacent adrenal medulla, where available, were collected at the time of adrenalectomy (for PCC) or PGL resection (patient recruitment and
https://doi.org/10.1530/ERC-18-0134https://erc.bioscientifica.com © 2019 The authors
Printed in Great BritainPublished by Bioscientifica Ltd.
This work is licensed under a Creative Commons Attribution 4.0 International License.
Downloaded from Bioscientifica.com at 11/13/2018 05:17:17PMvia free access

167S M O’Toole et al. Cilia loss in pheochromocytoma
26:1Endocrine-Related Cancer
ethical approval is described in the Supplementary data, see section on supplementary data given at the end of this article). PCC and normal adrenal medulla were differentiated at the time of surgery with subsequent pathology analysis. For immunofluorescence, samples were fixed in 4% paraformaldehyde, resuspended in 30% sucrose and embedded in OCT compound (VWR) prior to storage at −80°C. For RNA extraction, tissue samples were placed directly into RNAlater (Thermo Fisher Scientific) and stored at −20°C. Samples were subsequently homogenized in RLT buffer and purified using RNeasy Mini Kit (Qiagen).
Cell culture and experimental treatments
Cell lines were cultured and treated with drugs as described in Supplementary data. PC-12 Adh (ATCC CRL-1721.1) cells were obtained from the American Type Culture Collection; for cilia assembly experiments, cells were plated and grown in complete media for 24 h prior to serum starvation for a further 24 h or otherwise specified. For cilia disassembly experiments serum-containing media was reintroduced for 24 h after starvation or as otherwise specified.
Immunofluorescent detection and quantification of primary cilia
The immmunostaining protocols and antibodies used are described in Supplementary data. Confocal microscopy was performed using an LSM510 or LSM880 laser scanning confocal microscope (Zeiss). Quantification of cilia incidence and length was performed blinded to experimental status. Cilia incidence was defined as the number of cells with a cilium (identified by two axonemal markers) divided by the number of nuclei in a given field. Cilia length was measured from maximum intensity projections created from confocal Z-stacks using Zen (Zeiss) and ImageJ (NIH) software. The surpass module of Imaris 7.1 image processing and analysis software (Bitplane) was used to surface render 3D images.
siRNA-mediated knockdown
PC12 cells were transfected with either targeted or non-targeted control siRNAs (Silencer Select, Ambion) using Lipofectamine 3000 (Thermo Fisher Scientific), according to the manufacturer’s instructions. For knockdown of VHL, SDHB and FH, IFT88 and Cep164 – two distinct siRNAs each targeting distinct exons – were used at a total concentration of 30 nM (sequences available on request).
RNA-sequence data and pathway analyses
RNA extraction and sequencing is described in Supplementary data. All analyses were conducted in the R statistical environment, version 3.4.0, using software from the Bioconductor repository (Huber et al. 2015). Functional analysis of differential gene expression between control and Ift88-knockdown cells was performed using Ingenuity Pathways Analysis (IPA; Ingenuity Systems), using all genes with log fold change ≥2 and q-value was <0.01, as input. For all gene set enrichment analyses, a right-tailed Fisher’s exact test was used to calculate a pathway P-value determining the probability that each biological function assigned to that data set was due to chance alone. All enrichment scores were calculated in IPA using all transcripts that passed QC as the background data set. For more details of transcriptome and pathway analyses, see our supplemental R Markdown document (https://github.com/C4TB/markdown-chapple_pcc).
Results
The incidence and length of primary cilia is reduced in PCCs relative to adjacent normal adrenal medulla
We collected paired tissue samples from PCCs and adjacent macroscopically normal adrenal medulla from 25 patients who underwent adrenalectomy. Two individuals had bilateral disease giving a total of 27 paired samples (Table 1 and Supplementary Table 1). The tissues were immunostained for the axonemal proteins acetylated α-tubulin and ADP-ribosylation factor-like protein 13B (Arl13b) and analyzed for the incidence of cells with a primary cilium (Fig. 1A). This showed that the occurrence of a primary cilium was lower (P = 4.74 × 10⁻¹¹) in PCCs (3.06 ± 0.14% of cells) compared to adrenal medulla (8.42 ± 0.03% of cells) (Fig. 1B). The length of the ciliary axoneme was also reduced (P = 8.24 × 10⁻¹¹) in PCC cells that still had cilia (1.48 ± 0.34 μm) relative to cells in adjacent adrenal medulla (2.02 ± 0.39 μm) (Fig. 1C). The incidence and length of primary cilia measured in individuals correlated in both PCCs and adjacent adrenal medulla, although this relationship was stronger in PCCs than adjacent adrenal medulla (PCC P < 0.001, r2 = 0.66; adrenal P = 0.001, r2 = 0.36) (Fig. 1D). We also observed that in every instance cilia incidence was lower in the PCC than its adjacent adrenal medulla (Supplementary Fig. 1A). This was also the case for cilia length in all but one of the paired samples (Supplementary Fig. 1B). Together, these data established that loss of primary cilia is a feature of PCC.
https://doi.org/10.1530/ERC-18-0134https://erc.bioscientifica.com © 2019 The authors
Printed in Great BritainPublished by Bioscientifica Ltd.
This work is licensed under a Creative Commons Attribution 4.0 International License.
Downloaded from Bioscientifica.com at 11/13/2018 05:17:17PMvia free access

168S M O’Toole et al. Cilia loss in pheochromocytoma
26:1Endocrine-Related Cancer
It has previously been reported that the tumor suppressor pVHL plays a role in ciliogenesis (Schermer et al. 2006). Thus, we next compared cilia loss and length reduction in PCC from patients with germline mutations in VHL compared to those without. We found that both cilia incidence (1.40 ± 0.01% vs 3.43 ± 0.02) and length (1.15 ± 0.35 μm vs 1.58 ± 0.31 μm) were reduced in VHL-PCCs compared to non-VHL-PCCs (P = 0.010 for incidence, P = 0.010 for length) (Fig. 1E and F). There was no significant difference in either cilia incidence or length in adjacent adrenal medulla from VHL and non-VHL patients (Fig. 1E and F). This suggests that cilia loss and shortening in VHL-PCCs occurs during tumorigenesis and is not a pre-existing/pre-malignant feature.
In order to further evaluate whether this finding was specific to VHL or a feature of other pseudohypoxic PCCs, we extended our analysis to include an additional 20 tumors from 15 patients from whom a paired adrenal sample was unavailable (total 47 PCC/PGL
from 40 patients; Table 1 and Supplementary Table 2). We compared PCC/PGLs from patients with germline mutations in VHL, to tumors from patients with germline mutations in SDHx and those without a known germline mutation in a pseudohypoxia-linked gene. Cilia incidence was reduced in PCC/PGLs from patients with germline mutations in VHL (P = 0.0007) and SDHx (P = 0.0103 for incidence), relative to PCC/PGLs from patients that were not of a pseudohypoxia-linked subtype (Fig. 1G). Cilia length was also reduced in VHL- and SDHx-PCC/PGLs relative to the non-pseudohypoxia tumors, although this was only significant for VHL (P = 0.0013) (Fig. 1H).
We also examined if there was any correlation between cilia loss and clinical disease parameters in patients with PCC/PGL. Patients under 18 years of age at the time of surgery had tumor cells with fewer and shorter cilia than patients who were over the age of 18 years (Supplementary Fig. 1C and D), suggesting an association between cilia loss
Table 1 Clinical details – summary table.
Paired Unpaired All
Samples (n) 27 20 47Patients (n) 25 15 40Sex Male; n (%) 12 (48) 7 (47) 19 (47.5) Female; n (%) 13 (52) 8 (53) 21 (52.5)Age (years) Mean ± s.e.m. 46.8 ± 4.0 46.2 ± 3.4 46.6 ± 2.8 Range 12–78 15–68 12–78Size (mm) Mean ± s.e.m. 49 ± 4 47 ± 7 48 ± 4 Range 8–87 13–120 8–120Location Adrenal (%) 27 (100) 7 (35) 34 (72) PGL (%) 0 (0) 13 (65) 13 (28)Mode of diagnosis Symptomatic (%) 9 (33) 9 (45) 18 (38) Incidental (%) 14 (52) 7 (35) 21 (45) Screening (%) 4 (15) 4 (20) 8 (17)Germline mutation (patients) (%) 5 (25) 8 (53) 13 (33.5) SDHA 0 1 1 SDHB 1 4 5 VHL 3 2 5 MEN2 1 1 2Germline mutation (tumors) (%) 7 (26) 13 (65) 20 (42.6) SDHA 0 3 3 SDHB 1 5 6 VHL 5 4 9 MEN2 1 1 2
Incidental, diagnosis due to investigation for another unrelated condition; MEN2, multiple endocrine neoplasia 2; mode of diagnosis – symptomatic, diagnosis due to symptoms or signs of catecholamine excess leading to diagnosis; PGL, paraganglioma; screening, diagnosis during a screening program in individuals with known pheo/PGL predisposition; SDH, succinate dehydrogenase; s.e.m., standard error of the mean; VHL, von Hippel–Lindau.
https://doi.org/10.1530/ERC-18-0134https://erc.bioscientifica.com © 2019 The authors
Printed in Great BritainPublished by Bioscientifica Ltd.
This work is licensed under a Creative Commons Attribution 4.0 International License.
Downloaded from Bioscientifica.com at 11/13/2018 05:17:17PMvia free access

169S M O’Toole et al. Cilia loss in pheochromocytoma
26:1Endocrine-Related Cancer
B C
0
5
10
15
20
Adrenal PCC
***
Cili
a in
cide
nce
(%)
0
1
2
3 ***
Adrenal PCC
Cili
a le
ngth
(µm
)
0 5 10 15 20
1 Adrenal (r =0.36)2
PCC (r =0.66)2
Cilia incidence (%)
0
2
3
Cili
a le
ngth
(µm
)
D
E
*
ns
0
5
10
15
20
Cili
a in
cide
nce
(%)
non-VHL VHLnon-VHL VHLAdrenal PCC
*
ns
1
0
2
3
Cili
a le
ngth
(µm
)
non-VHL VHLnon-VHL VHLAdrenal PCC
F
H
0
0.5
1.0
1.5
2.0
2.5
VHL SDHUnknownPCC & PGL
Cili
a le
ngth
(µm
)
I15
0
5
10
<3% >3%
*
Cili
a in
cide
nce
(%)
Ki67 positive
0
5
10
15G
Cili
a in
cide
nce
(%)
VHL SDHUnknownPCC & PGL
****
ns
**ns
ns
A Adrenal medulla MIP Adrenal medulla
1
2
XY zoom
33 3
2 2
1 1
PCC PCCMIP XY zoom
4
5
6
4 4
6 6
5 5
****** ***
*
Figure 1Primary cilia incidence and length is reduced in PCCs relative to adjacent adrenal medulla. (A) Maximum intensity projections (MIP) of confocal Z-stacks of PCC and adjacent adrenal medulla. Tissue sections were processed for dual-immunofluorescent detection of the ciliary markers acetylated α-tubulin (green) and Arl13b (red). They were then counterstained with DAPI (blue) to detect nuclei. A single confocal section from the area demarked by the dashed box is shown zoomed (XY zoom). Individual cilia, indicated by arrows, are further enlarged in insets 1–6 and are shown as surface rendered 3D images in the panels on the right. Scale bars = 10 µm. (B) Quantification of primary cilium incidence in 27 paired PCC and adjacent adrenal medulla tissue samples. (C) Quantification of axoneme length (from confocal Z-stacks) from cells that had a primary cilium in PCC and adjacent adrenal medulla. (D) Cilia incidence and length correlate in both PCCs and adjacent adrenal medulla, with a more significant relationship in tumor than normal tissue. (E and F) Cilia incidence and length in 27 paired PCCs and adrenal medulla samples comparing individuals with (n = 5) and without (n = 22) germline mutations in VHL. (G and H) Cilia incidence and length in 47 PCC/PGL comparing those with a germline mutations in VHL (n = 9), to tumors from patients with germline mutations in SDHx (n = 9) and those without a known germline mutation in a pseudohypoxia-linked gene (Con, n = 29). (I) Cilia incidence in 33 PCC where more or less than 3% of cells labeled positively for Ki67. The number of cilia and nuclei were counted in 15 randomly selected fields for each sample. Mean axonemal length was quantified from at least 50 ciliated cells for each sample. Error bars indicate s.d. Statistical tests: t-test (B, C, E, F and I), ANOVA (G and H), linear regression (D). *P < 0.05, **P < 0.01, ***P < 0.001.
https://doi.org/10.1530/ERC-18-0134https://erc.bioscientifica.com © 2019 The authors
Printed in Great BritainPublished by Bioscientifica Ltd.
This work is licensed under a Creative Commons Attribution 4.0 International License.
Downloaded from Bioscientifica.com at 11/13/2018 05:17:17PMvia free access
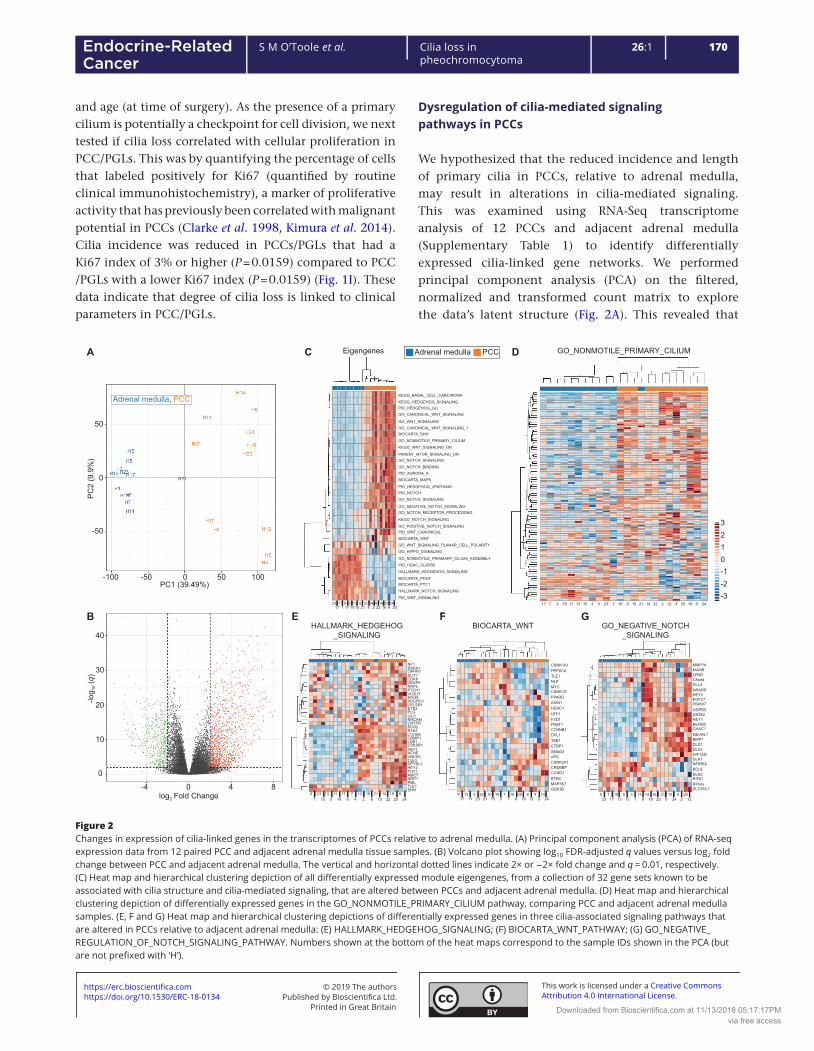
170S M O’Toole et al. Cilia loss in pheochromocytoma
26:1Endocrine-Related Cancer
and age (at time of surgery). As the presence of a primary cilium is potentially a checkpoint for cell division, we next tested if cilia loss correlated with cellular proliferation in PCC/PGLs. This was by quantifying the percentage of cells that labeled positively for Ki67 (quantified by routine clinical immunohistochemistry), a marker of proliferative activity that has previously been correlated with malignant potential in PCCs (Clarke et al. 1998, Kimura et al. 2014). Cilia incidence was reduced in PCCs/PGLs that had a Ki67 index of 3% or higher (P = 0.0159) compared to PCC /PGLs with a lower Ki67 index (P = 0.0159) (Fig. 1I). These data indicate that degree of cilia loss is linked to clinical parameters in PCC/PGLs.
Dysregulation of cilia-mediated signaling pathways in PCCs
We hypothesized that the reduced incidence and length of primary cilia in PCCs, relative to adrenal medulla, may result in alterations in cilia-mediated signaling. This was examined using RNA-Seq transcriptome analysis of 12 PCCs and adjacent adrenal medulla (Supplementary Table 1) to identify differentially expressed cilia-linked gene networks. We performed principal component analysis (PCA) on the filtered, normalized and transformed count matrix to explore the data’s latent structure (Fig. 2A). This revealed that
E F
PC1 (39.49%)-100 -50 0 50 100
-50
0
50
PC
2 (9
.9%
)
Adrenal medulla, PCC
-4 0 4 8log Fold Change2
0
10
20
30
40
-log
(q)
10
A DC
C
F
CEigengenes
PID_NOTCH
KEGG_BASAL_CELL_CARCINOMA
KEGG_HEDGEHOG_SIGNALINGPID_HEDGEHOG_GLIGO_CANONICAL_WNT_SIGNALING
GO_WNT_SIGNALINGGO_CANONICAL_WNT_SIGNALING_1BIOCARTA_SHH
GO_NONMOTILE_PRIMARY_CILIUM
KEGG_WNT_SIGNALING_DN
PARENT_MTOR_SIGNALING_DNGO_NOTCH_SIGNALING
GO_NOTCH_BINDINGPID_AURORA_A
BIOCARTA_MAPK
PID_HEDGEHOG_2PATHWAY
GO_NOTCH_SIGNALING
GO_NEGATIVE_NOTCH_SIGNALINGGO_NOTCH_RECEPTOR_PROCESSING
KEGG_NOTCH_SIGNALING
GO_POSITIVE_NOTCH_SIGNALINGPID_WNT_CANONICAL
BIOCARTA_WNT
GO_WNT_SIGNALING_PLANAR_CELL_POLARITY
GO_HIPPO_SIGNALING
GO_NONMOTILE_PRIAMARY_CILIUM_ASSEMBLY
PID_HDAC_CLASSII
HALLMARK_HEDGEHOG_SIGNALING
BIOCARTA_PDGFBIOCARTA_PTC1
HALLMARK_NOTCH_SIGNALING
PID_WNT_SIGNALING14 24121923 1 9 3 13 5 10 4
2061622217 7 11 15 21 818
BHALLMARK_HEDGEHOG
_SIGNALING
SHHTLE1PMLNRP1AMOTTHY1HEY2DPYSL2TLE3UNC5CACHEHEY1CDK5R1LDB1CRMP1L1CAMRTN1SCG2CNTFRNRCAMGLI1PLGETS2CELSR1ADGRG1MYH9VLDLRPTCH1NRP2VEGFACDK6SLIT1OPHN1RASA1NF1
141223 135 61617 711 21 1824191 93 104 2022215 8
Adrenal medulla PCC
3210-1-2-3
GO_NONMOTILE_PRIMARY_CILIUM
14 2412 1823 19 313 5 10 4 20 616 22 217 7 11 15 21819
BIOCARTA_WNT
CSNK1A1PPP2CATLE1NLKMYCCSNK1DPPARDAXIN1HDAC1LEF1FZD1FRAT1CTNNB1DVL1TAB1CTBP1SMAD4APCCSNK2A1CREBBPCCND1BTRCMAP3K7GSK3B
2 1419 19 13 5 10 42022 818241223 3 6 16 217 711 1521
GGO_NEGATIVE_NOTCH
_SIGNALING
MMP14NUMBLFNGC8orf4DLL4NRARPHEY2EGFL7FBXW7GDPD5GATA2HEY1BEND6CHAC1NEURL1BMP7DLX1DLX2HIF1ANDLK1NFKBIABCL6DLK2RITA1RFNGSLC35C1
24 1223 113 6 22 217 15 8181419 9 35 10 4 20167 11 21
Figure 2Changes in expression of cilia-linked genes in the transcriptomes of PCCs relative to adrenal medulla. (A) Principal component analysis (PCA) of RNA-seq expression data from 12 paired PCC and adjacent adrenal medulla tissue samples. (B) Volcano plot showing log10 FDR-adjusted q values versus log2 fold change between PCC and adjacent adrenal medulla. The vertical and horizontal dotted lines indicate 2× or −2× fold change and q = 0.01, respectively. (C) Heat map and hierarchical clustering depiction of all differentially expressed module eigengenes, from a collection of 32 gene sets known to be associated with cilia structure and cilia-mediated signaling, that are altered between PCCs and adjacent adrenal medulla. (D) Heat map and hierarchical clustering depiction of differentially expressed genes in the GO_NONMOTILE_PRIMARY_CILIUM pathway, comparing PCC and adjacent adrenal medulla samples. (E, F and G) Heat map and hierarchical clustering depictions of differentially expressed genes in three cilia-associated signaling pathways that are altered in PCCs relative to adjacent adrenal medulla: (E) HALLMARK_HEDGEHOG_SIGNALING; (F) BIOCARTA_WNT_PATHWAY; (G) GO_NEGATIVE_REGULATION_OF_NOTCH_SIGNALING_PATHWAY. Numbers shown at the bottom of the heat maps correspond to the sample IDs shown in the PCA (but are not prefixed with ‘H’).
https://doi.org/10.1530/ERC-18-0134https://erc.bioscientifica.com © 2019 The authors
Printed in Great BritainPublished by Bioscientifica Ltd.
This work is licensed under a Creative Commons Attribution 4.0 International License.
Downloaded from Bioscientifica.com at 11/13/2018 05:17:17PMvia free access

171S M O’Toole et al. Cilia loss in pheochromocytoma
26:1Endocrine-Related Cancer
principal component 1, which accounts for nearly 40% of all variation in the counts, separated the PCC samples from adjacent adrenal medulla. PCC samples were spread along principal component 2, which accounts for over 10% of data variance, indicating a heterogeneity in this group that is absent in adjacent adrenal medulla, where samples cluster together more closely.
Our unsupervised analysis suggested a strong transcriptomic signal differentiating tumor and adrenal medulla samples. To quantify this and identify relevant biomarkers, we conducted differential expression analysis using the DESeq2 software package (Love et al. 2014). We defined a gene as differentially expressed if its absolute log fold change ≥2 and its q-value was ≤0.01, imposing a false discovery rate of 1%. This strict threshold ensured high specificity. Overall, 1839 genes met these criteria, representing some 8% of the transcriptome after filtering (Fig. 2B).
To test if cilia function was altered in PCC relative to adjacent adrenal medulla, we curated a collection of 32 gene sets known to be associated with cilia structure and cilia-mediated signaling. We found considerable enrichment among these pathways (14 out of 32 at q ≤ 0.1). Eigengenes for all modules are depicted in Fig. 2C. Altered gene modules included those associated with cilia structure. For example, the GO_NONMOTILE_PRIMARY_CILIUM module showed altered expression in PCC tissue relative to adrenal medulla (q = 0.0519) (Fig. 2D), suggesting changes in gene expression may contribute to cilia loss in PCCs. We also observed changes in the Aurora-A Gene module (q = 0.2365), which is of interest as activation of Aurora-A pathway plays a role in regulation of cilia disassemble.
We also identified that gene modules associated with Hedgehog, Wnt and NOTCH signaling were altered between PCCs and adrenal medulla e.g. HALLMARK_HEDGEHOG_SIGNALING (q = 1.66 × 10⁻⁷), BIOCARTA_WNT_PATHWAY (q = 0.0519) and GO_NEGATIVE_REGULATION_OF_NOTCH_SIGNALING_PATHWAY (q = 1.58 × 10⁻⁶). Analyses of these gene modules revealed significant upregulation and downregulation of individual genes (absolute log fold change ≥2, q ≤ 0.01), while hierarchical clustering analyses separately grouped tumor and adrenal medulla samples in each of these pathways, with the exception of one medulla sample (H21) in the Hedgehog and Notch pathways, and two tumor samples (H10 and H22) in the Wnt pathway (Fig. 2D, E, F and G). These data are consistent with cilia-mediated signaling pathways being disrupted in PCC, but could also be explained by other potential mechanisms.
Disruption of primary cilia function in the PCC-derived PC12 cell line promotes proliferation and alters expression of tumorigenesis-linked gene networks
It is not fully resolved whether cilia loss is a driver or consequence of tumorigenesis. To address this question, in the context of PCC, we first established that PCC-derived cultured cell lines are able to form primary cilia. This was confirmed in the rat tumor-derived PC12 cell line, with cilia incidence and length increasing after serum starvation, such that 55.4 ± 5.98% of cells had a detectable cilium with a mean axonemal length of 2.17 ± 0.69 μm after 24 h (Fig. 3A, B, C and Supplementary Fig. 2A, B, C). Cilia were also present and responsive to serum starvation in two mouse PCC cell lines, MPC and MTT (Supplementary Fig. 2D, E and F). It should be noted that PC12 cells do not express the Myc dimerization partner MAX, while MPC and MTT lines were derived from the neurofibromatosis type 1 (NF1)-knockout mouse (Hopewell & Ziff 1995, Burnichon et al. 2012, Korpershoek et al. 2012).
We next disrupted cilia function in PC12 cells through siRNA-mediated knockdown of either the IFT88, a central component of the intraflagellar transport complex (Pazour et al. 2000), or Cep164, which plays a role in microtubule organization and/or maintenance for the formation of cilia (Graser et al. 2007). IFT88 knockdown was confirmed by immunoblot (Supplementary Fig. 3A and B), while knockdown of Cep164 was confirmed at the level of transcript (Supplementary Fig. 3C). Knockdown cells were then immunolabeled to detect cilia and stained with the proliferation marker Ki67 (Fig. 3D). Quantitative analysis confirmed, compared to control cells transfected with a non-targeting siRNA, that cilia incidence was reduced in both IFT88 (P = 0.02577) and Cep 164-knockdown cells (P = 0.0.00222) (Fig. 3E and H). Cilia length was also reduced in both instances (Supplementary Fig. 3D and E). Moreover, the percentage of Ki67-positive cells was increased after both IFT88 knockdown (P = 4.35 × 10⁻¹²) and Cep164 knockdown (P = 0.03937) (Fig. 3F and I). Increased proliferation of IFT88 and Cep164 knockdown PC12 cell, relative to controls, was further confirmed by quantification of cell numbers 48 h after siRNA transfection (Fig. 3G and J).
To further understand how disruption of cilia function impacts on cellular proliferation, we compared the transcriptomes of IFT88 knockdown and control cells (transfected with non-targeting siRNA) by RNA-Seq. Reads were pseudo-aligned (using the same pipeline as described for PCC and adrenal medulla) and
https://doi.org/10.1530/ERC-18-0134https://erc.bioscientifica.com © 2019 The authors
Printed in Great BritainPublished by Bioscientifica Ltd.
This work is licensed under a Creative Commons Attribution 4.0 International License.
Downloaded from Bioscientifica.com at 11/13/2018 05:17:17PMvia free access

172S M O’Toole et al. Cilia loss in pheochromocytoma
26:1Endocrine-Related Cancer
-1.0 1.0-2.0 0.0Cell deathNecrosisApoptosis
Tumorigenesis of tissuesDigestive organ tumourNeoplasia of epithelial cells
Cell proliferation of tumour cellsNon-melanoma solid tumour
Gastrointestinal neoplasiaCell death of tumour cells
Activation z-score
4.06E-241.15E-225.63E-21
1.98E-206.44E-20
4.38E-194.79E-19
5.16E-192.79E-18
2.79E-18
K2.0
C
Ki6
7 po
sitiv
e ce
lls (%
)
3
6
9
12
15
***
0Con IFT88
F G
00 48Con IFT88
0 48 hours
2
4
6
Rel
ativ
e ce
ll nu
mbe
r *
Cell proliferationof tumour cells
NTumorigenesisof tissues
MCell deathL
*
BA 0h 8h
24h 72h
Ki67
Ki67
Ki67 + Arl13b+ DAPI
Ki67 + Arl13b+ DAPI
D
Con
IFT8
800
20
40
80
60
8 24 72
**
***
***
Cili
a in
cide
nce
(%)
Time after seeding (h)
0
1.0
2.0
3.0
0 8 24 72
**
*** ***
Cili
a le
ngth
(µm
)
Time after seeding (h)
0
10
20
30
40
Con Cep164
Cili
a in
cide
nce
(%)
50JH I
0
3
6
Con Cep164
Ki6
7 po
sitiv
e ce
lls (%
) 9
**
E
0Con IFT88
10
20
30
40
Cili
a in
cide
nce
(%)
**
00 48Con Cep164
0 48 hours
2
1
3
Rel
ativ
e ce
ll nu
mbe
r **
Cep
164
Ki67 Ki67 + Arl13b+ DAPI
10 12 11 15 14 13 101211 151413
Con IFT8810 1211 151413
1.51.00.50.0-0.5-1.0-1.5
Figure 3Loss of primary cilia in PC12 cells promotes proliferation and alters gene expression. (A) Confocal images of PC12 cells cultured in the absence of serum for between 0 and 72 h. Cells were immunolabeled with anti-acetylated α-tubulin (green) and anti-Arl13b (red) for detection of primary cilia. Nuclei were stained with DAPI (blue). Cilia are indicated by arrows, or arrowheads where they are also shown zoomed in the insets. Scale bars = 10µm. (B and C) Quantification of primary cilia incidence (B) and axonemal length (C) under conditions of serum starvation. (D) Confocal images of PC12 cells cultured for 48 h after transfection with siRNA targeting IFT88, Cep164, or non-targeting control siRNAs (Con). Cells were immunolabeled to detect cilia (Arl13b, green) and the proliferation marker Ki67 (red). Nuclei were stained with DAPI (blue). Cilia are indicated by arrows and Ki67 positive cells by arrowheads. Scale bars = 10 µm. (E, F, G and H) Quantification of primary cilia incidence (E), the percentage of Ki67 positive cells (F), and relative cell numbers (G), 48 h after transfection with siRNA targeting IFT88. (H, I and J) Quantification of primary cilia incidence (H), the percentage of Ki67 positive cells (I) and relative cell numbers (J), 48 h after transfection with siRNA targeting Cep164. Cilia and Ki67 scoring were performed in ten randomly selected fields for each experimental condition in three biological replicates. Mean axonemal length was quantified from at least 50 ciliated cells for each experimental condition. Cell counting was performed on six samples from three biological replicates. Error bars indicate 2× s.e.m. In box and whisker plots, the box represents median, upper and lower quartiles and the whiskers the 10th and 90th centiles. Statistical tests: ANOVA (B and C), t-test (E, F and G). *P < 0.05, **P < 0.01, ***P < 0.001. (K) Gene Ontology (GO) analysis of the transcriptome of PC12 cells transfected with siRNA targeting IFT88 or non-targeting control siRNAs, showing the top-ranking altered biological processes identified by Ingenuity Pathways Analysis. q values are depicted in red (E = 10 to the power of the following number). (L and M) Heat map and hierarchical clustering depictions of differentially expressed genes in altered pathways with the GO terms cell death (L), tumorigenesis of tissues (M) and cell proliferation of tumor cells (N). Numbers shown at the bottom of the heat maps correspond to sample IDs shown in Supplementary Fig. 3.
https://doi.org/10.1530/ERC-18-0134https://erc.bioscientifica.com © 2019 The authors
Printed in Great BritainPublished by Bioscientifica Ltd.
This work is licensed under a Creative Commons Attribution 4.0 International License.
Downloaded from Bioscientifica.com at 11/13/2018 05:17:17PMvia free access
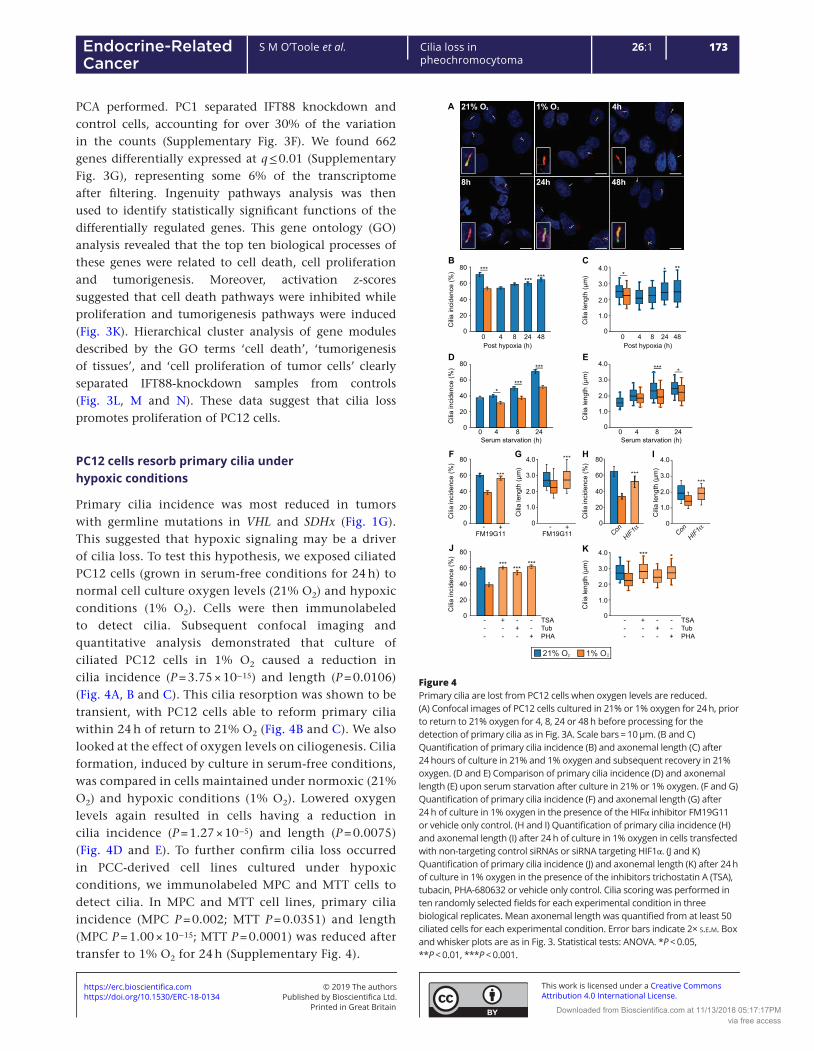
173S M O’Toole et al. Cilia loss in pheochromocytoma
26:1Endocrine-Related Cancer
PCA performed. PC1 separated IFT88 knockdown and control cells, accounting for over 30% of the variation in the counts (Supplementary Fig. 3F). We found 662 genes differentially expressed at q ≤ 0.01 (Supplementary Fig. 3G), representing some 6% of the transcriptome after filtering. Ingenuity pathways analysis was then used to identify statistically significant functions of the differentially regulated genes. This gene ontology (GO) analysis revealed that the top ten biological processes of these genes were related to cell death, cell proliferation and tumorigenesis. Moreover, activation z-scores suggested that cell death pathways were inhibited while proliferation and tumorigenesis pathways were induced (Fig. 3K). Hierarchical cluster analysis of gene modules described by the GO terms ‘cell death’, ‘tumorigenesis of tissues’, and ‘cell proliferation of tumor cells’ clearly separated IFT88-knockdown samples from controls (Fig. 3L, M and N). These data suggest that cilia loss promotes proliferation of PC12 cells.
PC12 cells resorb primary cilia under hypoxic conditions
Primary cilia incidence was most reduced in tumors with germline mutations in VHL and SDHx (Fig. 1G). This suggested that hypoxic signaling may be a driver of cilia loss. To test this hypothesis, we exposed ciliated PC12 cells (grown in serum-free conditions for 24 h) to normal cell culture oxygen levels (21% O2) and hypoxic conditions (1% O2). Cells were then immunolabeled to detect cilia. Subsequent confocal imaging and quantitative analysis demonstrated that culture of ciliated PC12 cells in 1% O2 caused a reduction in cilia incidence (P = 3.75 × 10⁻¹⁵) and length (P = 0.0106) (Fig. 4A, B and C). This cilia resorption was shown to be transient, with PC12 cells able to reform primary cilia within 24 h of return to 21% O2 (Fig. 4B and C). We also looked at the effect of oxygen levels on ciliogenesis. Cilia formation, induced by culture in serum-free conditions, was compared in cells maintained under normoxic (21% O2) and hypoxic conditions (1% O2). Lowered oxygen levels again resulted in cells having a reduction in cilia incidence (P = 1.27 × 10⁻⁵) and length (P = 0.0075) (Fig. 4D and E). To further confirm cilia loss occurred in PCC-derived cell lines cultured under hypoxic conditions, we immunolabeled MPC and MTT cells to detect cilia. In MPC and MTT cell lines, primary cilia incidence (MPC P = 0.002; MTT P = 0.0351) and length (MPC P = 1.00 × 10⁻¹⁵; MTT P = 0.0001) was reduced after transfer to 1% O2 for 24 h (Supplementary Fig. 4).
A 4h
8h 24h 48h
21% O 2 1% O2
0 4 8 24
****
D
0
20
40
60
80
Cili
a in
cide
nce
(%)
Serum starvation (h)
***
0 4 8 24Serum starvation (h)
1.0
2.0
3.0
4.0E
Cili
a le
ngth
(µm
)
0
****
B
***
0
20
40
60
80
Cili
a in
cide
nce
(%)
0 4 8 24 48Post hypoxia (h)
C* **
1.0
2.0
3.0
4.0
Cili
a le
ngth
(µm
)
00 4 8 24 48Post hypoxia (h)
G ***
1.0
2.0
3.0
4.0
Cili
a le
ngth
(µm
)0
FM19G11- +
*** ******
0
J
20
40
60
80
Cili
a in
cide
nce
(%)
TSATubPHA
---
+--
-+-
--+
*** *
1.0
2.0
3.0
4.0K
Cili
a le
ngth
(µm
)
0TSATubPHA
---
+--
-+-
--+
F
FM19G11
***
0
20
40
60
80C
ilia
inci
denc
e (%
)
- +
****** *
H
***
0
20
40
60
80
Cili
a in
cide
nce
(%)
HIF1αCon
I
1.0
2.0
3.0
4.0
Cili
a le
ngth
(µm
)
0
HIF1αCon
***
21% O 1% O2 2
Figure 4Primary cilia are lost from PC12 cells when oxygen levels are reduced. (A) Confocal images of PC12 cells cultured in 21% or 1% oxygen for 24 h, prior to return to 21% oxygen for 4, 8, 24 or 48 h before processing for the detection of primary cilia as in Fig. 3A. Scale bars = 10 µm. (B and C) Quantification of primary cilia incidence (B) and axonemal length (C) after 24 hours of culture in 21% and 1% oxygen and subsequent recovery in 21% oxygen. (D and E) Comparison of primary cilia incidence (D) and axonemal length (E) upon serum starvation after culture in 21% or 1% oxygen. (F and G) Quantification of primary cilia incidence (F) and axonemal length (G) after 24 h of culture in 1% oxygen in the presence of the HIFα inhibitor FM19G11 or vehicle only control. (H and I) Quantification of primary cilia incidence (H) and axonemal length (I) after 24 h of culture in 1% oxygen in cells transfected with non-targeting control siRNAs or siRNA targeting HIF1α. (J and K) Quantification of primary cilia incidence (J) and axonemal length (K) after 24 h of culture in 1% oxygen in the presence of the inhibitors trichostatin A (TSA), tubacin, PHA-680632 or vehicle only control. Cilia scoring was performed in ten randomly selected fields for each experimental condition in three biological replicates. Mean axonemal length was quantified from at least 50 ciliated cells for each experimental condition. Error bars indicate 2× s.e.m. Box and whisker plots are as in Fig. 3. Statistical tests: ANOVA. *P < 0.05, **P < 0.01, ***P < 0.001.
https://doi.org/10.1530/ERC-18-0134https://erc.bioscientifica.com © 2019 The authors
Printed in Great BritainPublished by Bioscientifica Ltd.
This work is licensed under a Creative Commons Attribution 4.0 International License.
Downloaded from Bioscientifica.com at 11/13/2018 05:17:17PMvia free access

174S M O’Toole et al. Cilia loss in pheochromocytoma
26:1Endocrine-Related Cancer
To investigate if the loss of primary cilia under hypoxic conditions was dependent on HIF-mediated signaling, we added the HIFα inhibitor FM19G11 (Moreno-Manzano et al. 2010) to culture media prior to transfer of cells to 1% O2. Compared to vehicle-only-treated control cells, FM19G11 prevented hypoxia-induced cilia loss (P = 8.68 × 10⁻⁵ for incidence, P = 7.08 × 10⁻⁶ for length) (Fig. 4F, G and Supplementary Fig. 4D). We further tested a role for HIF1α signaling in hypoxia-induced cilia loss by targeting with siRNA. This showed that HIF1α knockdown was able to rescue cilia loss in PC12 cells cultured in 1% O2 (Fig. 4H, I and Supplementary Fig. 4E, F). To further understand the mechanism of hypoxia-induced cilia loss, we next tested for involvement of the Aurora-A kinase /histone deacetylase 6 (HDAC6) pathway. Activation of Aurora-A has been shown to cause phosphorylation of HDAC6, which deacetylates ciliary tubulin and destabilizes the axonemal microtubules (Pugacheva et al. 2007). Inhibition of Aurora-A, with the specific inhibitor PHA-680632, prevented cilia loss (P = 1.85 × 10⁻⁷) and shortening (P = 2.94 × 10⁻⁶) in cells exposed to 1% O2 (Fig. 4J, K and Supplementary Fig. 4D). Hypoxia-induced cilia loss was also inhibited by the mammalian class I and II HDAC inhibitor trichostatin A (TSA) (P = 3.22 × 10⁻⁸ for incidence, P = 3.29 × 10⁻⁸ for length) and the selective HDAC6 inhibitor tubacin (P = 1.11 × 10⁻⁴ for incidence, P = 0.0487 for length) (Fig. 4J, K and Supplementary Fig. 4D). These data suggest that reduced oxygen levels lead to cilia resorption in PC12 cells by a mechanism that includes HIF signaling and activation of the Aurora-A kinase/HDAC6 pathway.
In addition to degradation of HIF, pVHL stabilizes microtubules and plays a role in cilia maintenance. It is reported that loss of pVHL alone does not affect cilia structure but may sensitize cells to lose pre-established cilia (Thoma et al. 2007). pVHL has been shown to localize to the ciliary axoneme, and this was also the case in PC12 cells (Supplementary Fig. 4G). We thus investigated if activation of hypoxic signaling affected localization of pVHL by quantifying levels of the protein in the axoneme. Ciliary axonemes were detected by immunolabeling for acetylated tubulin and levels of pVHL that localized within the region of the cilia determined by analyses of fluorescent intensity. This showed that pVHL levels were reduced (P = 0.0234) in the cilium of cells maintained at 1% O2 relative to cells maintained at 21% O2 (Supplementary Fig. 4H). Thus, activation of hypoxic signaling may also destabilize cilia through a mechanism where pVHL is reduced in the ciliary axoneme.
Pseudohypoxia in PC12 cells results in primary cilia loss and shortening
Under normoxic conditions HIFα is hydroxylated at conserved proline residues by HIF prolyl-hydroxylases (HIF-PHDs). This leads to recognition of HIFα by VHL, facilitating their ubiquitination and subsequent proteasomal degradation. Thus, direct inactivation of either HIF-PHDs or VHL can result in persistence of HIFα and transcription of HIF target genes even in the presence of oxygen – pseudohypoxia. Moreover, succinate, which accumulates as a result of loss of SDH function, inhibits HIF-PHDs, again resulting in pseudohypoxia (Fig. 5A). To establish if pseudohypoxia impacted primary cilia, we firstly targeted HIF-PHs by treating PC12 cells with the inhibitor dimethyloxalylglycine, N-(methoxyoxoacetyl)-glycine methyl ester (DMOG). This resulted in reduced cilia incidence (P = 3.86 × 10⁻¹¹) and length (P = 8.00 × 10⁻¹⁴) (Fig. 5B, C and Supplementary Fig. 5A). We next tested if drivers of the pseudohypoxic PCC/PGL phenotype resulted in cilia loss. For SDHB, siRNA-mediated knockdown (Supplementary Fig. 5B, C and D) again leads to a reduction in cilia incidence (P = 1.20 × 10⁻⁸) and length (P = 0.00124) (Fig. 5D and E). Cilia loss also occurred in the presence of malonate, which competes with succinate for active sites of SDH (Fig. 5F, G and Supplementary Fig. 5E). Malonate inhibition of SDH can be reversed by pharmacologically elevating intracellular α-ketoglutarate (MacKenzie et al. 2007). Consistent with this, we observed that addition of α-ketoglutarate to PC12 cells rescued the cilia loss phenotype observed in cells treated with malonate alone (Fig. 5H, I and Supplementary Fig. 5E). Similar to succinate, accumulation of fumarate, another citric acid cycle intermediate, inhibits HIF-PHDs (this is also linked to disease as germline mutations in FH cause PCC/PGL). We inhibited FH using the cell-permeable derivative of fumarate, monomethyl fumarate. This again resulted in the reduction in cilia incidence (P = 1.67 × 10⁻⁵) and length (P = 2.28 × 10⁻¹⁷) (Fig. 5J, K and Supplementary Fig. 5F). The same pattern of reduced cilia incidence (P = 4.11 × 10⁻⁶) and length (P = 5.75 × 10⁻¹⁹) was observed when siRNA-mediated knockdown of FH (Supplementary Fig. 5G, H and I) was performed (Fig. 5L and M).
Finally, we investigated the effect of siRNA-mediated knockdown of VHL (Supplementary Fig. 5J, K and L) on primary cilia. Quantification of cilia incidence and length showed that VHL knockdown resulted in fewer cells exhibiting a cilium (P = 6.93 × 10⁻¹³) and that mean cilia length was decreased (P = 8.12 × 10⁻¹⁴) (Fig. 5N and O). In summary, these data show cilia loss was induced
https://doi.org/10.1530/ERC-18-0134https://erc.bioscientifica.com © 2019 The authors
Printed in Great BritainPublished by Bioscientifica Ltd.
This work is licensed under a Creative Commons Attribution 4.0 International License.
Downloaded from Bioscientifica.com at 11/13/2018 05:17:17PMvia free access
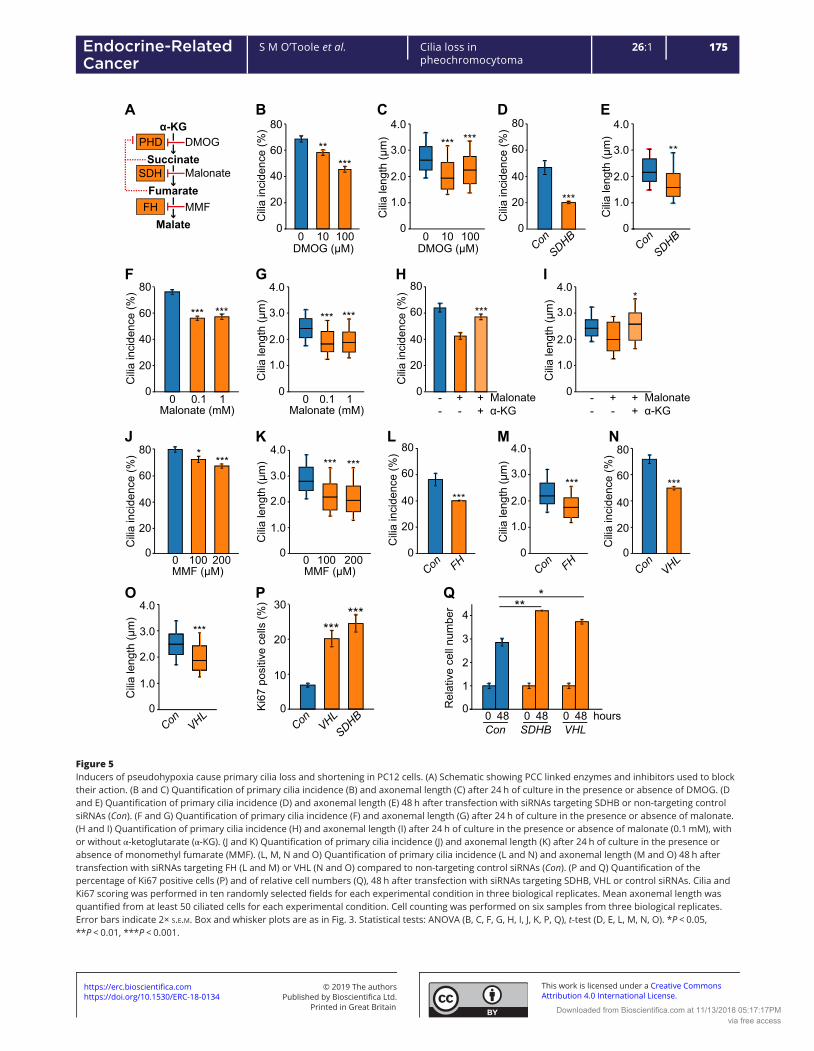
175S M O’Toole et al. Cilia loss in pheochromocytoma
26:1Endocrine-Related Cancer
0
20
40
60
80
0 0.1 1Malonate (mM)
*** ***
F
0
20
40
60
80
0 10 100DMOG (µM)
*****
B
Cili
a in
cide
nce
(%)
C
0
1.0
2.0
3.0
4.0
0 10 100
*** ***
DMOG (µM)
Cili
a le
ngth
(µm
)
Cili
a in
cide
nce
(%)
0
G
1.0
2.0
3.0
4.0
Cili
a le
ngth
(µm
)
*** ***
0 0.1 1Malonate (mM)
H
Malonateα-KG
20
40
60
80
***
0C
ilia
inci
denc
e (%
)--
+-
++
I
0
1.0
2.0
3.0
4.0*
Cili
a le
ngth
(µm
)
Malonateα-KG
--
+-
++
100 200MMF (µM)
J***
*
0
20
40
60
80
Cili
a in
cide
nce
(%)
0
K
0
*** ***
Cili
a le
ngth
(µm
)
100MMF (µM)0 200
1.0
2.0
3.0
4.0L
***
20
40
60
80
0
Cili
a in
cide
nce
(%)
Con FH
M
***
0
1.0
2.0
3.0
4.0
Cili
a le
ngth
(µm
)
Con FH
N
***
0
20
40
60
80
Cili
a in
cide
nce
(%)
Con VHL
***
O
0
Cili
a le
ngth
(µm
)
1.0
2.0
3.0
4.0
Con VHL
E
**
Cili
a le
ngth
(µm
)
1.0
2.0
3.0
4.0
ConSDHB
0
D
ConSDHB
***20
40
60
80
Cili
a in
cide
nce
(%)
0
A
Succinate
Fumarate
Malate
α-KGPHD
SDH
FH
Malonate
DMOG
MMF
***P
******
0
10
20
30
Ki6
7 po
sitiv
e ce
lls (%
)
Con VHLSDHB
Q
0
SDHBCon VHL
1
2
3
4
0 48 0 48 0 48 hours
Rel
ativ
e ce
ll nu
mbe
r
Figure 5Inducers of pseudohypoxia cause primary cilia loss and shortening in PC12 cells. (A) Schematic showing PCC linked enzymes and inhibitors used to block their action. (B and C) Quantification of primary cilia incidence (B) and axonemal length (C) after 24 h of culture in the presence or absence of DMOG. (D and E) Quantification of primary cilia incidence (D) and axonemal length (E) 48 h after transfection with siRNAs targeting SDHB or non-targeting control siRNAs (Con). (F and G) Quantification of primary cilia incidence (F) and axonemal length (G) after 24 h of culture in the presence or absence of malonate. (H and I) Quantification of primary cilia incidence (H) and axonemal length (I) after 24 h of culture in the presence or absence of malonate (0.1 mM), with or without α-ketoglutarate (α-KG). (J and K) Quantification of primary cilia incidence (J) and axonemal length (K) after 24 h of culture in the presence or absence of monomethyl fumarate (MMF). (L, M, N and O) Quantification of primary cilia incidence (L and N) and axonemal length (M and O) 48 h after transfection with siRNAs targeting FH (L and M) or VHL (N and O) compared to non-targeting control siRNAs (Con). (P and Q) Quantification of the percentage of Ki67 positive cells (P) and of relative cell numbers (Q), 48 h after transfection with siRNAs targeting SDHB, VHL or control siRNAs. Cilia and Ki67 scoring was performed in ten randomly selected fields for each experimental condition in three biological replicates. Mean axonemal length was quantified from at least 50 ciliated cells for each experimental condition. Cell counting was performed on six samples from three biological replicates. Error bars indicate 2× s.e.m. Box and whisker plots are as in Fig. 3. Statistical tests: ANOVA (B, C, F, G, H, I, J, K, P, Q), t-test (D, E, L, M, N, O). *P < 0.05, **P < 0.01, ***P < 0.001.
https://doi.org/10.1530/ERC-18-0134https://erc.bioscientifica.com © 2019 The authors
Printed in Great BritainPublished by Bioscientifica Ltd.
This work is licensed under a Creative Commons Attribution 4.0 International License.
Downloaded from Bioscientifica.com at 11/13/2018 05:17:17PMvia free access
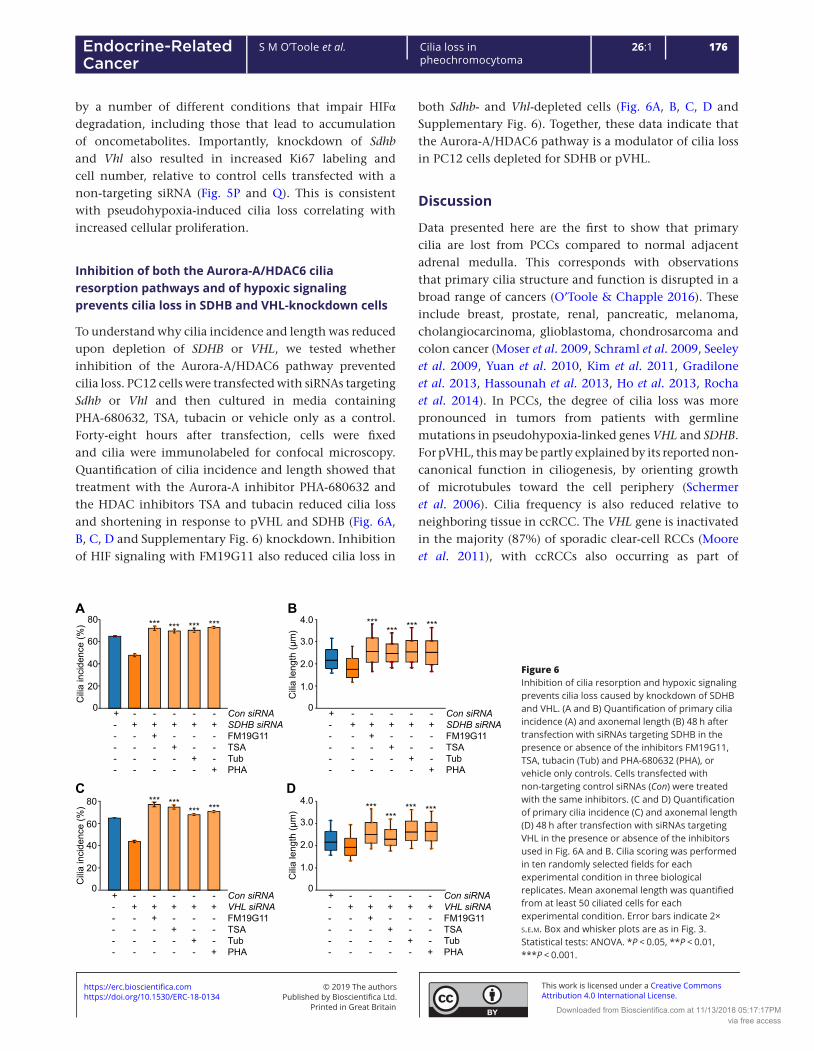
176S M O’Toole et al. Cilia loss in pheochromocytoma
26:1Endocrine-Related Cancer
by a number of different conditions that impair HIFα degradation, including those that lead to accumulation of oncometabolites. Importantly, knockdown of Sdhb and Vhl also resulted in increased Ki67 labeling and cell number, relative to control cells transfected with a non-targeting siRNA (Fig. 5P and Q). This is consistent with pseudohypoxia-induced cilia loss correlating with increased cellular proliferation.
Inhibition of both the Aurora-A/HDAC6 cilia resorption pathways and of hypoxic signaling prevents cilia loss in SDHB and VHL-knockdown cells
To understand why cilia incidence and length was reduced upon depletion of SDHB or VHL, we tested whether inhibition of the Aurora-A/HDAC6 pathway prevented cilia loss. PC12 cells were transfected with siRNAs targeting Sdhb or Vhl and then cultured in media containing PHA-680632, TSA, tubacin or vehicle only as a control. Forty-eight hours after transfection, cells were fixed and cilia were immunolabeled for confocal microscopy. Quantification of cilia incidence and length showed that treatment with the Aurora-A inhibitor PHA-680632 and the HDAC inhibitors TSA and tubacin reduced cilia loss and shortening in response to pVHL and SDHB (Fig. 6A, B, C, D and Supplementary Fig. 6) knockdown. Inhibition of HIF signaling with FM19G11 also reduced cilia loss in
both Sdhb- and Vhl-depleted cells (Fig. 6A, B, C, D and Supplementary Fig. 6). Together, these data indicate that the Aurora-A/HDAC6 pathway is a modulator of cilia loss in PC12 cells depleted for SDHB or pVHL.
Discussion
Data presented here are the first to show that primary cilia are lost from PCCs compared to normal adjacent adrenal medulla. This corresponds with observations that primary cilia structure and function is disrupted in a broad range of cancers (O’Toole & Chapple 2016). These include breast, prostate, renal, pancreatic, melanoma, cholangiocarcinoma, glioblastoma, chondrosarcoma and colon cancer (Moser et al. 2009, Schraml et al. 2009, Seeley et al. 2009, Yuan et al. 2010, Kim et al. 2011, Gradilone et al. 2013, Hassounah et al. 2013, Ho et al. 2013, Rocha et al. 2014). In PCCs, the degree of cilia loss was more pronounced in tumors from patients with germline mutations in pseudohypoxia-linked genes VHL and SDHB. For pVHL, this may be partly explained by its reported non-canonical function in ciliogenesis, by orienting growth of microtubules toward the cell periphery (Schermer et al. 2006). Cilia frequency is also reduced relative to neighboring tissue in ccRCC. The VHL gene is inactivated in the majority (87%) of sporadic clear-cell RCCs (Moore et al. 2011), with ccRCCs also occurring as part of
Figure 6Inhibition of cilia resorption and hypoxic signaling prevents cilia loss caused by knockdown of SDHB and VHL. (A and B) Quantification of primary cilia incidence (A) and axonemal length (B) 48 h after transfection with siRNAs targeting SDHB in the presence or absence of the inhibitors FM19G11, TSA, tubacin (Tub) and PHA-680632 (PHA), or vehicle only controls. Cells transfected with non-targeting control siRNAs (Con) were treated with the same inhibitors. (C and D) Quantification of primary cilia incidence (C) and axonemal length (D) 48 h after transfection with siRNAs targeting VHL in the presence or absence of the inhibitors used in Fig. 6A and B. Cilia scoring was performed in ten randomly selected fields for each experimental condition in three biological replicates. Mean axonemal length was quantified from at least 50 ciliated cells for each experimental condition. Error bars indicate 2× s.e.m. Box and whisker plots are as in Fig. 3. Statistical tests: ANOVA. *P < 0.05, **P < 0.01, ***P < 0.001.
0
20
40
60
80A
Cili
a in
cide
nce
(%)
Con siRNASDHB siRNAFM19G11TSATubPHA
+-----
-+----
-++---
-+-+--
-+--+-
-+---+
*** *** *** ***
0
20
40
60
80C
Con siRNAVHL siRNAFM19G11TSATubPHA
+-----
-+----
-++---
-+-+--
-+--+-
-+---+
Cili
a in
cide
nce
(%)
*** ****** ***
D
0
1.0
2.0
3.0
4.0
Cili
a le
ngth
(µm
)
Con siRNAVHL siRNAFM19G11TSATubPHA
+-----
-+----
-++---
-+-+--
-+--+-
-+---+
******
*** ***
0
1.0
2.0
3.0
4.0
Cili
a le
ngth
(µm
)
B
Con siRNASDHB siRNAFM19G11TSATubPHA
+-----
-+----
-++---
-+-+--
-+--+-
-+---+
****** *** ***
https://doi.org/10.1530/ERC-18-0134https://erc.bioscientifica.com © 2019 The authors
Printed in Great BritainPublished by Bioscientifica Ltd.
This work is licensed under a Creative Commons Attribution 4.0 International License.
Downloaded from Bioscientifica.com at 11/13/2018 05:17:17PMvia free access

177S M O’Toole et al. Cilia loss in pheochromocytoma
26:1Endocrine-Related Cancer
von Hippel–Lindau disease (Gossage et al. 2015, Crespigio et al. 2017). Contrasting ccRCC, VHL inactivation is a much less common feature of sporadic PCCs (Dannenberg et al. 2003, Burnichon et al. 2011). In the context of our data, this suggests that although disruption of a cilia-specific function of VHL may contribute to loss of cilia in PCC, it is not the main mechanism responsible for cilia loss.
Using the PCC-derived PC12 cell line, we found that siRNA-mediated depletion of SDHB, FH and VHL, all resulted in reduction of cilia frequency. We also observed that treatment of cells with drugs that inhibit HIF-PHs, SDH and FH, leading to accumulation of oncometabolites for SDH and FH, caused cilia loss. Culture of PC12 cells in conditions of reduced oxygen similarly reduced the incidence of cilia, although it should be noted the change in oxygen concentration from 21% (standard for cell culture) to 1% is greater than will to occur in vivo, where physiological levels of oxygen range from 2 to 9% (Tiede et al. 2011). Together, these data implicate pseudohypoxic /hypoxic signaling as a regulator of cilia dynamics. This is further supported by the finding that inhibition of HIF signaling reduced cilia loss in response to hypoxia and inducers of pseudohypoxia and is consistent with studies that show axoneme length is influenced by hypoxia-inducible mechanisms (Proulx-Bonneau & Annabi 2011, Wann et al. 2013). Hypoxia is not just a driver of PCC/PGL formation (Rodriguez-Cuevas et al. 1986, Opotowsky et al. 2015), but is also a salient feature of many solid tumors, and may therefore modulate cilia presence in cancers more generally.
There are a number of potential pathways through which HIF signaling could influence ciliogenesis and resorption. These include that stabilization of HIF promotes transcription of Aurora-A kinase, which functions in regulation of ciliary resorption with HDAC6 (Pugacheva et al. 2007, Xu et al. 2010). Inhibition of the Aurora-A/HDAC6 pathway in PC12 cells prevented cilia loss in response to hypoxia and induction of pseudohypoxia. Collectively, these findings suggest that the reduction in cilia frequency in pseudohypoxic PCC is likely to be mediated by both HIF signaling and the Aurora-A/HDAC6 cilia resorption pathway, although involvement of other regulators of cilia dynamics is also possible.
Transcriptome analyses identified altered expression of gene modules associated with cilia-mediated signaling in PCCs relative to adjacent adrenal medulla. Altered cilia-mediated signaling pathways included Hh, WNT and Notch signaling. The role of cilia in the regulation of cancer-linked signaling pathways is complex and
context dependent (Oh & Katsanis 2013). For example, WNT signaling, which is generally considered to be attenuated by the presence of a cilium, can be decreased in cells with shortened cilia yet activated by ablation of cilia (Lancaster et al. 2011, Oh & Katsanis 2013), while for Hh signaling, the cilium activates the pathway in the presence of the sonic hedgehog ligand (SHH) and restrains signaling when SHH is absent (Wong et al. 2009, Hassounah et al. 2012). There is also crosstalk between cilia-mediated signaling pathways, such as Notch signaling modulating SHH signaling, by regulating the ciliary localization of the Hh signal transduction proteins patched and smoothened (Kong et al. 2015). This complexity makes it difficult to interpret how alterations in cilia incidence and length may impact on specific pathways. Nevertheless, hierarchical clustering analyses separately grouped tumor and adrenal medulla samples based on changes of gene expression in multiple cilia-linked signaling pathways. This is consistent with loss of cilia correlating with dysregulation of cilia-mediated signaling in PCCs. Disruption of WNT signaling is particularly relevant to PCC/PGLs, with WNT-altered tumors classified as one of four molecularly defined PCC/PGL subtypes (Fishbein et al. 2017).
In addition to modulating signaling pathways that are dysregulated in tumorigenesis and cancer, the presence of a primary cilium may act as a checkpoint for cell division. We observed that disruption of cilia structure and function, by knockdown of Ift88 or Cep164, correlated with increased cellular proliferation of PC12 cells. This was accompanied by changes in gene expression that inhibited cell death pathways, while activating cell proliferation and tumor-linked pathways. Together, our data are concordant with cilia acting as a checkpoint for cell division in PC12 cells and suggest cilia loss promotes proliferation and perhaps tumorigenesis in PCC/PGL. Interestingly, we also observed that in PCC tissue, there was a correlation between degree of cilia loss and Ki67 staining implying in vivo relevance of our findings in PC12 cells.
In summary, we propose that in PCC/PGLs oncometabolite-induced pseudohypoxia drives cilia loss through activation of the Aurora-A kinase/HDAC6 cilia resorption pathway. In PCCs, this cilia loss causes dysregulation of cilia-mediated signaling pathways including SHH, WNT and Notch signaling and is also likely to promote increased cellular proliferation (Fig. 7). Hypoxia-induced cilia resorption may be a feature of cancers more generally and represents a potential target to slow tumor progression.
https://doi.org/10.1530/ERC-18-0134https://erc.bioscientifica.com © 2019 The authors
Printed in Great BritainPublished by Bioscientifica Ltd.
This work is licensed under a Creative Commons Attribution 4.0 International License.
Downloaded from Bioscientifica.com at 11/13/2018 05:17:17PMvia free access

178S M O’Toole et al. Cilia loss in pheochromocytoma
26:1Endocrine-Related Cancer
Supplementary dataThis is linked to the online version of the paper at https://doi.org/10.1530/ERC-18-0134.
Declaration of interestThe authors declare that there is no conflict of interest that could be perceived as prejudicing the impartiality of the research reported.
FundingThis work was funded by a Barts and the London Charity Clinical Research Training Fellowships awarded to Samuel M O’Toole (grant number MRD0191) and by a project grant from the UK Medical Research Council (MRC) (grant number MR/L002876/1). Dr Tyson V Sharp is funded by grants from the UK Biotechnology and Biological Sciences Research Council (grant number BB/M0020611) and MRC (grant number MR/N009185/1). The LSM880 confocal used in these studies was purchased through a Barts and the London Charity award (grant number MGU0293). The RNA-Seq analyses were in part funded by a grant from The Medical College of Saint Bartholomew’s Hospital Trust and were performed at the Barts and the London Genome Centre. This work also forms part of the research themes contributing to the translational research portfolio of Barts and the London Cardiovascular Biomedical Research Centre, which is supported and funded by the National Institute of Health Research. This project was enabled through access to the MRC eMedLab Medical Bioinformatics infrastructure, supported by the MRC (grant number MR/L016311/1).
Author contribution statementS M O, P J K, M M K, T V S, U S, W M D and J P C conceived and planned the experiments. S M O, L E L R, T V N, T Y B and C L T carried out the experiments. S M O, D S W, M R B and J P C analyzed and interpreted the data. S M O and J P C wrote the draft manuscript. All authors provided critical feedback, which shaped the research, analysis and the manuscript.
AcknowledgementsThe authors would like to thank the following clinical colleagues for collection of PCC and adrenal samples: Mr Robert Carpenter and Ms Laila Parvanta (St Bartholomew’s Hospital, London); Mr Tom Kurzawinski and Mr Tarek Abdel-Aziz (University College London Hospitals, London); Prof. Michael Gleeson (National Hospital for Neurology and Neurosurgery). They are also extremely grateful to the patients who donated these tissues. The MPC and MTT cell lines where a gift from Dr Karel Pacak (NIH), via Professor Marta Korbonits (Queen Mary University of London). Prof. Korbonits was also principal investigator for ethical approvals related to this work. They would also like to thank Profs. Morris Brown, Jacky Burrin and Adrian Clark (Queen Mary University of London) for their constructive comments on the manuscript.
ReferencesBasten SG, Willekers S, Vermaat JS, Slaats GG, Voest EE, van Diest PJ &
Giles RH 2013 Reduced cilia frequencies in human renal cell carcinomas versus neighboring parenchymal tissue. Cilia 2 2. (https://doi.org/10.1186/2046-2530-2-2)
Figure 7Model illustrating the potential pathway from pseudohypoxia-induced cilia loss to increased cell proliferation and dysregulation of tumorigenesis relevant cilia-mediated signaling pathways in PCCs. Proteins where germline mutations in the gene predispose to PCC are in orange boxes. Aurora-A, Aurora-A kinase; FH, fumarate hydratase; H6, HDAC6; HIF, hypoxia-inducible factor; OH, hydroxyl group; P, phosphate group; PH, prolyl-hydroxylases; SDH, succinate dehydrogenase; VHL, von Hippel–Lindau protein.
H6
H6
H6
AuroraA
Hypoxia
Pseudohypoxia
Proteasomal
degradation
HIF1a
VHL
PHD
HIF1a
OH
OH
HIF1a HIF1b
H6
AuroraA
P
P
Succinate α-KG
nucle
us
Target gene transcription
FumarateMalate
O2
SDHFH
Activation of
Aurora A
Cilia loss
Dysregulation of cilia mediated
signalling e.g. Hh, Wnt, Notch.
Increased cell prolifieration?
Inhibition of HIFα,
AuroraA or HDAC6
https://doi.org/10.1530/ERC-18-0134https://erc.bioscientifica.com © 2019 The authors
Printed in Great BritainPublished by Bioscientifica Ltd.
This work is licensed under a Creative Commons Attribution 4.0 International License.
Downloaded from Bioscientifica.com at 11/13/2018 05:17:17PMvia free access
179S M O’Toole et al. Cilia loss in pheochromocytoma
26:1Endocrine-Related Cancer
Berbari NF, O’Connor AK, Haycraft CJ & Yoder BK 2009 The primary cilium as a complex signaling center. Current Biology 19 R526–R535. (https://doi.org/10.1016/j.cub.2009.05.025)
Burnichon N, Vescovo L, Amar L, Libe R, de Reynies A, Venisse A, Jouanno E, Laurendeau I, Parfait B, Bertherat J, et al. 2011 Integrative genomic analysis reveals somatic mutations in pheochromocytoma and paraganglioma. Human Molecular Genetics 20 3974–3985. (https://doi.org/10.1093/hmg/ddr324)
Burnichon N, Cascon A, Schiavi F, Morales NP, Comino-Mendez I, Abermil N, Inglada-Perez L, de Cubas AA, Amar L, Barontini M, et al. 2012 MAX mutations cause hereditary and sporadic pheochromocytoma and paraganglioma. Clinical Cancer Research 18 2828–2837. (https://doi.org/10.1158/1078-0432.CCR-12-0160)
Burnichon N, Buffet A & Gimenez-Roqueplo AP 2016 Pheochromocytoma and paraganglioma: molecular testing and personalized medicine. Current Opinion in Oncology 28 5–10. (https://doi.org/10.1097/CCO.0000000000000249)
Clarke MR, Weyant RJ, Watson CG & Carty SE 1998 Prognostic markers in pheochromocytoma. Human Pathology 29 522–526. (https://doi.org/10.1016/S0046-8177(98)90070-3)
Crespigio J, Berbel LCL, Dias MA, Berbel RF, Pereira SS, Pignatelli D & Mazzuco TL 2017 Von Hippel-Lindau disease: a single gene, several hereditary tumors. Journal of Endocrinological Investigation 41 21–31. (https://doi.org/10.1007/s40618-017-0683-1)
Dahia PL 2017 Pheochromocytomas and paragangliomas, genetically diverse and minimalist, all at once! Cancer Cell 31 159–161. (https://doi.org/10.1016/j.ccell.2017.01.009)
Dannenberg H, De Krijger RR, van der Harst E, Abbou M, Ijzendoorn Y, Komminoth P & Dinjens WN 2003 Von Hippel-Lindau gene alterations in sporadic benign and malignant pheochromocytomas. International Journal of Cancer 105 190–195. (https://doi.org/10.1002/ijc.11060)
Fishbein L & Nathanson KL 2012 Pheochromocytoma and paraganglioma: understanding the complexities of the genetic background. Cancer Genetics 205 1–11. (https://doi.org/10.1016/j.cancergen.2012.01.009)
Fishbein L, Leshchiner I, Walter V, Danilova L, Robertson AG, Johnson AR, Lichtenberg TM, Murray BA, Ghayee HK, Else T, et al. 2017 Comprehensive molecular characterization of pheochromocytoma and paraganglioma. Cancer Cell 31 181–193. (https://doi.org/10.1016/j.ccell.2017.01.001)
Goetz SC & Anderson KV 2010 The primary cilium: a signalling centre during vertebrate development. Nature Reviews Genetics 11 331–344. (https://doi.org/10.1038/nrg2774)
Gossage L, Eisen T & Maher ER 2015 VHL, the story of a tumour suppressor gene. Nature Reviews Cancer 15 55–64. (https://doi.org/10.1038/nrc3844)
Goto H, Inoko A & Inagaki M 2013 Cell cycle progression by the repression of primary cilia formation in proliferating cells. Cellular and Molecular Life Sciences 70 3893–3905. (https://doi.org/10.1007/s00018-013-1302-8)
Gradilone SA, Radtke BN, Bogert PS, Huang BQ, Gajdos GB & LaRusso NF 2013 HDAC6 inhibition restores ciliary expression and decreases tumor growth. Cancer Research 73 2259–2270. (https://doi.org/10.1158/0008-5472.CAN-12-2938)
Graser S, Stierhof YD, Lavoie SB, Gassner OS, Lamla S, Le Clech M & Nigg EA 2007 Cep164, a novel centriole appendage protein required for primary cilium formation. Journal of Cell Biology 179 321–330. (https://doi.org/10.1083/jcb.200707181)
Hassounah NB, Bunch TA & McDermott KM 2012 Molecular pathways: the role of primary cilia in cancer progression and therapeutics with a focus on Hedgehog signaling. Clinical Cancer Research 18 2429–2435. (https://doi.org/10.1158/1078-0432.CCR-11-0755)
Hassounah NB, Nagle R, Saboda K, Roe DJ, Dalkin BL & McDermott KM 2013 Primary cilia are lost in preinvasive and invasive prostate cancer. PLoS ONE 8 e68521. (https://doi.org/10.1371/journal.pone.0068521)
Ho L, Ali SA, Al-Jazrawe M, Kandel R, Wunder JS & Alman BA 2013 Primary cilia attenuate hedgehog signalling in neoplastic chondrocytes. Oncogene 32 5388–5396. (https://doi.org/10.1038/onc.2012.588)
Hopewell R & Ziff EB 1995 The nerve growth factor-responsive PC12 cell line does not express the Myc dimerization partner Max. Molecular and Cellular Biology 15 3470–3478. (https://doi.org/10.1128/MCB.15.7.3470)
Huber W, Carey VJ, Gentleman R, Anders S, Carlson M, Carvalho BS, Bravo HC, Davis S, Gatto L, Girke T, et al. 2015 Orchestrating high-throughput genomic analysis with bioconductor. Nature Methods 12 115–121. (https://doi.org/10.1038/nmeth.3252)
Izawa I, Goto H, Kasahara K & Inagaki M 2015 Current topics of functional links between primary cilia and cell cycle. Cilia 4 12. (https://doi.org/10.1186/s13630-015-0021-1)
Johnson CA, Collis SJ 2016 Ciliogenesis and the DNA damage response: a stressful relationship. Cilia 5 19. (https://doi.org/10.1186/s13630-016-0040-6)
Kim J, Dabiri S & Seeley ES 2011 Primary cilium depletion typifies cutaneous melanoma in situ and malignant melanoma. PLoS ONE 6 e27410. (https://doi.org/10.1371/journal.pone.0027410)
Kimura N, Takayanagi R, Takizawa N, Itagaki E, Katabami T, Kakoi N, Rakugi H, Ikeda Y, Tanabe A, Nigawara T, et al. 2014 Pathological grading for predicting metastasis in phaeochromocytoma and paraganglioma. Endocrine-Related Cancer 21 405–414. (https://doi.org/10.1530/ERC-13-0494)
Kong JH, Yang L, Dessaud E, Chuang K, Moore DM, Rohatgi R, Briscoe J & Novitch BG 2015 Notch activity modulates the responsiveness of neural progenitors to sonic hedgehog signaling. Developmental Cell 33 373–387. (https://doi.org/10.1016/j.devcel.2015.03.005)
Korpershoek E, Pacak K & Martiniova L 2012 Murine models and cell lines for the investigation of pheochromocytoma: applications for future therapies? Endocrine Pathology 23 43–54. (https://doi.org/10.1007/s12022-012-9194-y)
Lancaster MA, Schroth J & Gleeson JG 2011 Subcellular spatial regulation of canonical Wnt signalling at the primary cilium. Nature Cell Biology 13 700–707. (https://doi.org/10.1038/ncb2259)
Love MI, Huber W & Anders S 2014 Moderated estimation of fold change and dispersion for RNA-seq data with DESeq2. Genome Biology 15 550. (https://doi.org/10.1186/s13059-014-0550-8)
MacKenzie ED, Selak MA, Tennant DA, Payne LJ, Crosby S, Frederiksen CM, Watson DG & Gottlieb E 2007 Cell-permeating alpha-ketoglutarate derivatives alleviate pseudohypoxia in succinate dehydrogenase-deficient cells. Molecular and Cellular Biology 27 3282–3289. (https://doi.org/10.1128/MCB.01927-06)
Mans DA, Voest EE & Giles RH 2008 All Along the Watchtower: is the cilium a tumor suppressor organelle? Biochimica et Biophysica Acta 1786 114–125. (https://doi.org/10.1016/j.bbcan.2008.02.002)
Moore LE, Nickerson ML, Brennan P, Toro JR, Jaeger E, Rinsky J, Han SS, Zaridze D, Matveev V, Janout V, et al. 2011 Von Hippel-Lindau (VHL) inactivation in sporadic clear cell renal cancer: associations with germline VHL polymorphisms and etiologic risk factors. PLoS Genetics 7 e1002312. (https://doi.org/10.1371/journal.pgen.1002312)
Moreno-Manzano V, Rodriguez-Jimenez FJ, Acena-Bonilla JL, Fustero-Lardies S, Erceg S, Dopazo J, Montaner D, Stojkovic M & Sanchez-Puelles JM 2010 FM19G11, a new hypoxia-inducible factor (HIF) modulator, affects stem cell differentiation status. Journal of Biological Chemistry 285 1333–1342. (https://doi.org/10.1074/jbc.M109.008326)
Moser JJ, Fritzler MJ & Rattner JB 2009 Primary ciliogenesis defects are associated with human astrocytoma/glioblastoma cells. BMC Cancer 9 448. (https://doi.org/10.1186/1471-2407-9-448)
Oh EC & Katsanis N 2013 Context-dependent regulation of Wnt signaling through the primary cilium. Journal of the American Society of Nephrology 24 10–18. (https://doi.org/10.1681/ASN.2012050526)
https://doi.org/10.1530/ERC-18-0134https://erc.bioscientifica.com © 2019 The authors
Printed in Great BritainPublished by Bioscientifica Ltd.
This work is licensed under a Creative Commons Attribution 4.0 International License.
Downloaded from Bioscientifica.com at 11/13/2018 05:17:17PMvia free access

180S M O’Toole et al. Cilia loss in pheochromocytoma
26:1Endocrine-Related Cancer
Opotowsky AR, Moko LE, Ginns J, Rosenbaum M, Greutmann M, Aboulhosn J, Hageman A, Kim Y, Deng LX, Grewal J, et al. 2015 Pheochromocytoma and paraganglioma in cyanotic congenital heart disease. Journal of Clinical Endocrinology and Metabolism 100 1325–1334. (https://doi.org/10.1210/jc.2014-3863)
O’Toole SM & Chapple JP 2016 Primary cilia: a link between hormone signalling and endocrine-related cancers? Biochemical Society Transactions 44 1227–1234. (https://doi.org/10.1042/BST20160149)
Pazour GJ, Dickert BL, Vucica Y, Seeley ES, Rosenbaum JL, Witman GB & Cole DG 2000 Chlamydomonas IFT88 and its mouse homologue, polycystic kidney disease gene tg737, are required for assembly of cilia and flagella. Journal of Cell Biology 151 709–718. (https://doi.org/10.1083/jcb.151.3.709)
Proulx-Bonneau S & Annabi B 2011 The primary cilium as a biomarker in the hypoxic adaptation of bone marrow-derived mesenchymal stromal cells: a role for the secreted frizzled-related proteins. Biomark Insights 6 107–118. (https://doi.org/10.4137/BMI.S8247)
Pugacheva EN, Jablonski SA, Hartman TR, Henske EP & Golemis EA 2007 HEF1-dependent Aurora A activation induces disassembly of the primary cilium. Cell 129 1351–1363. (https://doi.org/10.1016/j.cell.2007.04.035)
Rocha C, Papon L, Cacheux W, Marques Sousa P, Lascano V, Tort O, Giordano T, Vacher S, Lemmers B, Mariani P, et al. 2014 Tubulin glycylases are required for primary cilia, control of cell proliferation and tumor development in colon. EMBO Journal 33 2247–2260. (https://doi.org/10.15252/embj.201488466)
Rodriguez-Cuevas H, Lau I & Rodriguez HP 1986 High-altitude paragangliomas diagnostic and therapeutic considerations. Cancer 57 672–676. (https://doi.org/10.1002/1097-0142(19860201)57:3<672::AID-CNCR2820570346>3.0.CO;2-C)
Schermer B, Ghenoiu C, Bartram M, Muller RU, Kotsis F, Hohne M, Kuhn W, Rapka M, Nitschke R, Zentgraf H, et al. 2006 The von Hippel-Lindau tumor suppressor protein controls ciliogenesis by orienting microtubule growth. Journal of Cell Biology 175 547–554. (https://doi.org/10.1083/jcb.200605092)
Schraml P, Frew IJ, Thoma CR, Boysen G, Struckmann K, Krek W & Moch H 2009 Sporadic clear cell renal cell carcinoma but not the
papillary type is characterized by severely reduced frequency of primary cilia. Modern Pathology 22 31–36. (https://doi.org/10.1038/modpathol.2008.132)
Seeley ES, Carriere C, Goetze T, Longnecker DS & Korc M 2009 Pancreatic cancer and precursor pancreatic intraepithelial neoplasia lesions are devoid of primary cilia. Cancer Research 69 422–430. (https://doi.org/10.1158/0008-5472.CAN-08-1290)
Selak MA, Armour SM, MacKenzie ED, Boulahbel H, Watson DG, Mansfield KD, Pan Y, Simon MC, Thompson CB & Gottlieb E 2005 Succinate links TCA cycle dysfunction to oncogenesis by inhibiting HIF-alpha prolyl hydroxylase. Cancer Cell 7 77–85. (https://doi.org/10.1016/j.ccr.2004.11.022)
Thoma CR, Frew IJ, Hoerner CR, Montani M, Moch H & Krek W 2007 pVHL and GSK3beta are components of a primary cilium-maintenance signalling network. Nature Cell Biology 9 588–595. (https://doi.org/10.1038/ncb1579)
Tiede LM, Cook EA, Morsey B & Fox HS 2011 Oxygen matters: tissue culture oxygen levels affect mitochondrial function and structure as well as responses to HIV viroproteins. Cell Death and Disease 2 e246. (https://doi.org/10.1038/cddis.2011.128)
Wann AK, Thompson CL, Chapple JP & Knight MM 2013 Interleukin-1beta sequesters hypoxia inducible factor 2alpha to the primary cilium. Cilia 2 17. (https://doi.org/10.1186/2046-2530-2-17)
Wong SY, Seol AD, So PL, Ermilov AN, Bichakjian CK, Epstein EH, Jr., Dlugosz AA & Reiter JF 2009 Primary cilia can both mediate and suppress Hedgehog pathway-dependent tumorigenesis. Nature Medicine 15 1055–1061. (https://doi.org/10.1038/nm.2011)
Xu J, Li H, Wang B, Xu Y, Yang J, Zhang X, Harten SK, Shukla D, Maxwell PH, Pei D, et al. 2010 VHL inactivation induces HEF1 and Aurora kinase A. Journal of the American Society of Nephrology 21 2041–2046. (https://doi.org/10.1681/ASN.2010040345)
Yuan K, Frolova N, Xie Y, Wang D, Cook L, Kwon YJ, Steg AD, Serra R & Frost AR 2010 Primary cilia are decreased in breast cancer: analysis of a collection of human breast cancer cell lines and tissues. Journal of Histochemistry and Cytochemistry 58 857–870. (https://doi.org/10.1369/jhc.2010.955856)
Received in final form 27 August 2018Accepted 5 September 2018Accepted Preprint published online 7 September 2018
https://doi.org/10.1530/ERC-18-0134https://erc.bioscientifica.com © 2019 The authors
Printed in Great BritainPublished by Bioscientifica Ltd.
This work is licensed under a Creative Commons Attribution 4.0 International License.
Downloaded from Bioscientifica.com at 11/13/2018 05:17:17PMvia free access
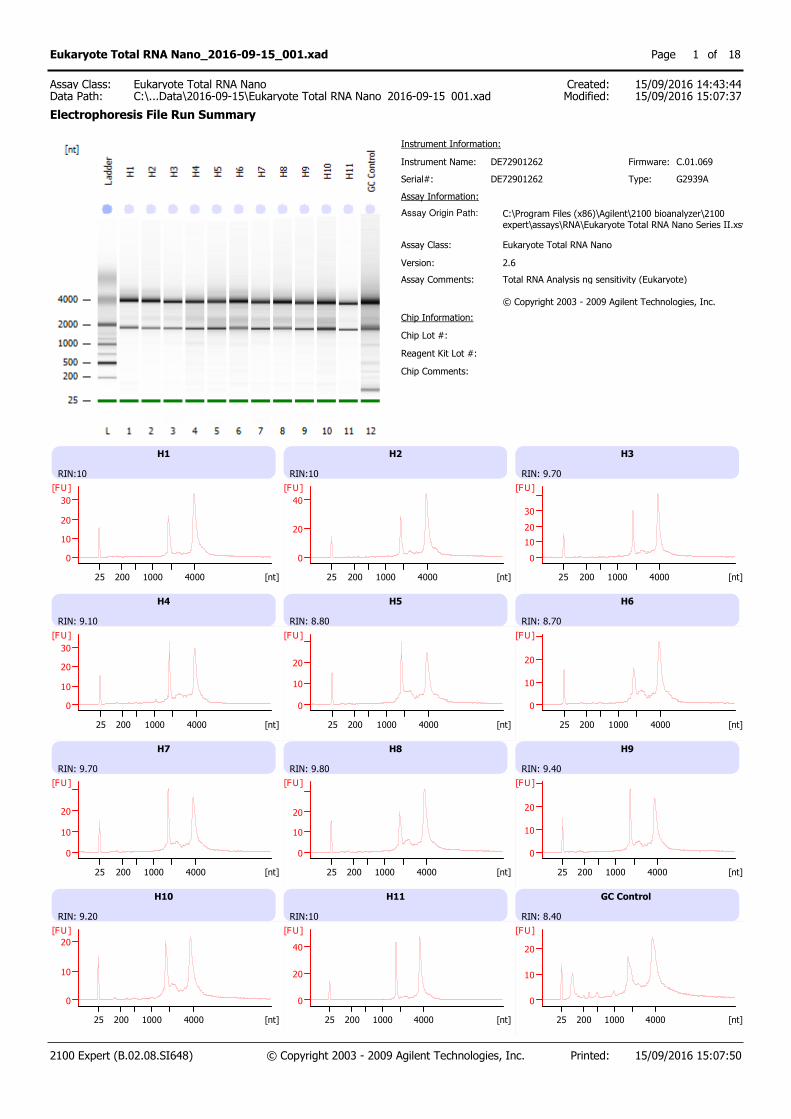
Instrument Name: DE72901262 Firmware:
Serial#:
Assay Information:
C.01.069
DE72901262
Instrument Information:
Assay Origin Path: C:\Program Files (x86)\Agilent\2100 bioanalyzer\2100expert\assays\RNA\Eukaryote Total RNA Nano Series II.xsy
Assay Class:
Version:
Assay Comments:
Eukaryote Total RNA Nano
2.6
Total RNA Analysis ng sensitivity (Eukaryote) © Copyright 2003 - 2009 Agilent Technologies, Inc.
Chip Information:
Chip Comments:
Type: G2939A
Chip Lot #:
Reagent Kit Lot #:
H1
RIN:10
0
10
20
30
[FU]
25 200 1000 4000 [nt]
H2
RIN:10
0
20
40
[FU]
25 200 1000 4000 [nt]
H3
RIN: 9.70
0
10
20
30
[FU]
25 200 1000 4000 [nt]
H4
RIN: 9.10
0
10
20
30
[FU]
25 200 1000 4000 [nt]
H5
RIN: 8.80
0
10
20
[FU]
25 200 1000 4000 [nt]
H6
RIN: 8.70
0
10
20
[FU]
25 200 1000 4000 [nt]
H7
RIN: 9.70
0
10
20
[FU]
25 200 1000 4000 [nt]
H8
RIN: 9.80
0
10
20
[FU]
25 200 1000 4000 [nt]
H9
RIN: 9.40
0
10
20
[FU]
25 200 1000 4000 [nt]
H10
RIN: 9.20
0
10
20
[FU]
25 200 1000 4000 [nt]
H11
RIN:10
0
20
40
[FU]
25 200 1000 4000 [nt]
GC Control
RIN: 8.40
0
10
20
[FU]
25 200 1000 4000 [nt]
2100 Expert (B.02.08.SI648) © Copyright 2003 - 2009 Agilent Technologies, Inc. Printed: 15/09/2016 15:07:50
Eukaryote Total RNA Nano_2016-09-15_001.xad Page of1 18
Created:Modified:
15/09/2016 14:43:4415/09/2016 15:07:37Data Path:
Eukaryote Total RNA NanoC:\...Data\2016-09-15\Eukaryote Total RNA Nano_2016-09-15_001.xad
Assay Class:
Electrophoresis File Run Summary

Sample Name Sample Comment Status Result Label Result Color
H1 RIN:10
H2 RIN:10
H3 RIN: 9.70
H4 RIN: 9.10
H5 RIN: 8.80
H6 RIN: 8.70
H7 RIN: 9.70
H8 RIN: 9.80
H9 RIN: 9.40
H10 RIN: 9.20
H11 RIN:10
GC Control RIN: 8.40
Ladder All Other Samples
Chip Lot # Reagent Kit Lot #
Chip Comments :
2100 Expert (B.02.08.SI648) © Copyright 2003 - 2009 Agilent Technologies, Inc. Printed: 15/09/2016 15:07:50
Eukaryote Total RNA Nano_2016-09-15_001.xad Page of2 18
Created:Modified:
15/09/2016 14:43:4415/09/2016 15:07:37Data Path:
Eukaryote Total RNA NanoC:\...Data\2016-09-15\Eukaryote Total RNA Nano_2016-09-15_001.xad
Assay Class:
Electrophoresis File Run Summary (Chip Summary)
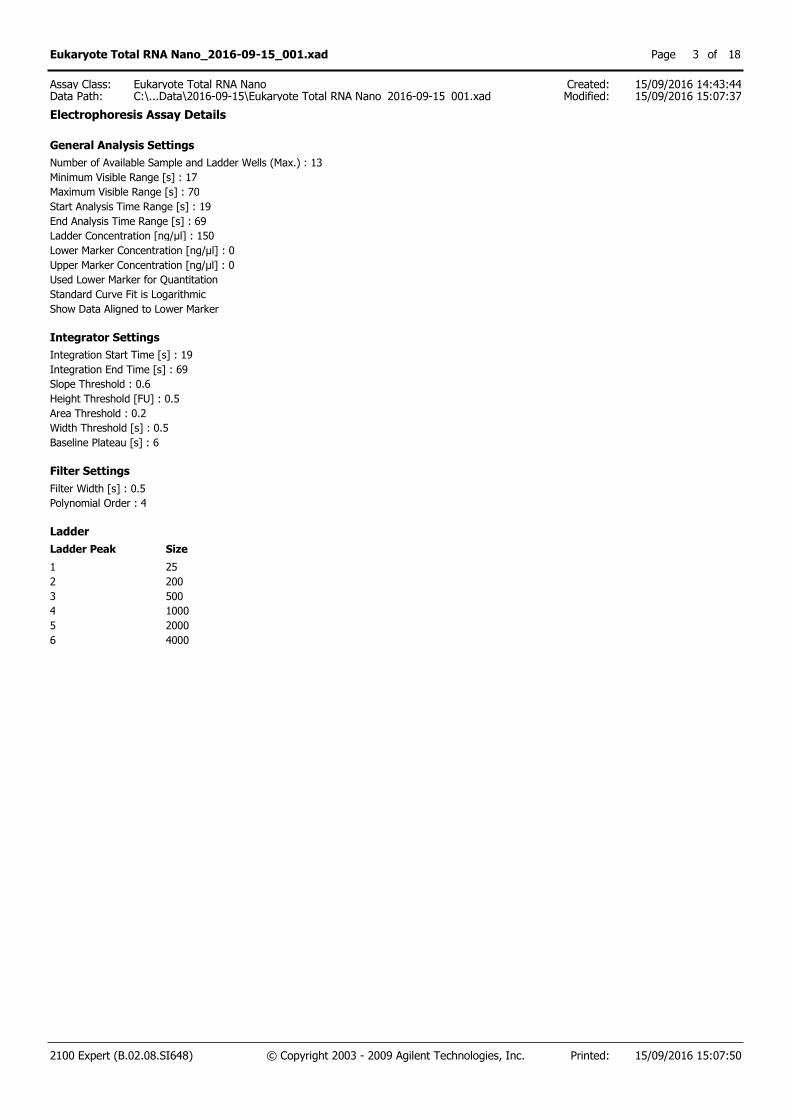
General Analysis Settings
Number of Available Sample and Ladder Wells (Max.) : 13
Minimum Visible Range [s] : 17
Maximum Visible Range [s] : 70
Start Analysis Time Range [s] : 19
End Analysis Time Range [s] : 69
Ladder Concentration [ng/µl] : 150
Lower Marker Concentration [ng/µl] : 0
Upper Marker Concentration [ng/µl] : 0
Used Lower Marker for Quantitation
Standard Curve Fit is Logarithmic
Show Data Aligned to Lower Marker
Integrator Settings
Integration Start Time [s] : 19
Integration End Time [s] : 69
Slope Threshold : 0.6
Height Threshold [FU] : 0.5
Area Threshold : 0.2
Width Threshold [s] : 0.5
Baseline Plateau [s] : 6
Filter Settings
Filter Width [s] : 0.5
Polynomial Order : 4
Ladder
Ladder Peak Size
1 25
2 200
3 500
4 1000
5 2000
6 4000
2100 Expert (B.02.08.SI648) © Copyright 2003 - 2009 Agilent Technologies, Inc. Printed: 15/09/2016 15:07:50
Eukaryote Total RNA Nano_2016-09-15_001.xad Page of3 18
Created:Modified:
15/09/2016 14:43:4415/09/2016 15:07:37Data Path:
Eukaryote Total RNA NanoC:\...Data\2016-09-15\Eukaryote Total RNA Nano_2016-09-15_001.xad
Assay Class:
Electrophoresis Assay Details
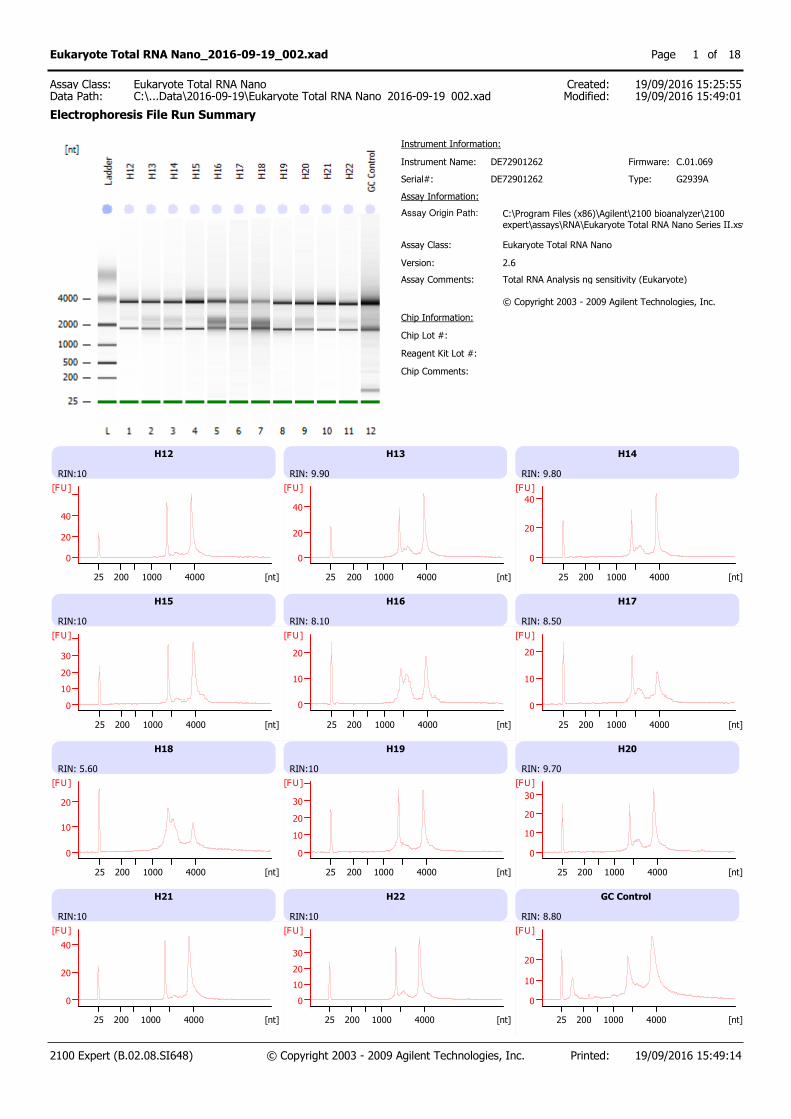
Instrument Name: DE72901262 Firmware:
Serial#:
Assay Information:
C.01.069
DE72901262
Instrument Information:
Assay Origin Path: C:\Program Files (x86)\Agilent\2100 bioanalyzer\2100expert\assays\RNA\Eukaryote Total RNA Nano Series II.xsy
Assay Class:
Version:
Assay Comments:
Eukaryote Total RNA Nano
2.6
Total RNA Analysis ng sensitivity (Eukaryote) © Copyright 2003 - 2009 Agilent Technologies, Inc.
Chip Information:
Chip Comments:
Type: G2939A
Chip Lot #:
Reagent Kit Lot #:
H12
RIN:10
0
20
40
[FU]
25 200 1000 4000 [nt]
H13
RIN: 9.90
0
20
40
[FU]
25 200 1000 4000 [nt]
H14
RIN: 9.80
0
20
40
[FU]
25 200 1000 4000 [nt]
H15
RIN:10
0
10
20
30
[FU]
25 200 1000 4000 [nt]
H16
RIN: 8.10
0
10
20
[FU]
25 200 1000 4000 [nt]
H17
RIN: 8.50
0
10
20
[FU]
25 200 1000 4000 [nt]
H18
RIN: 5.60
0
10
20
[FU]
25 200 1000 4000 [nt]
H19
RIN:10
0
10
20
30
[FU]
25 200 1000 4000 [nt]
H20
RIN: 9.70
0
10
20
30
[FU]
25 200 1000 4000 [nt]
H21
RIN:10
0
20
40
[FU]
25 200 1000 4000 [nt]
H22
RIN:10
0
10
20
30
[FU]
25 200 1000 4000 [nt]
GC Control
RIN: 8.80
0
10
20
[FU]
25 200 1000 4000 [nt]
2100 Expert (B.02.08.SI648) © Copyright 2003 - 2009 Agilent Technologies, Inc. Printed: 19/09/2016 15:49:14
Eukaryote Total RNA Nano_2016-09-19_002.xad Page of1 18
Created:Modified:
19/09/2016 15:25:5519/09/2016 15:49:01Data Path:
Eukaryote Total RNA NanoC:\...Data\2016-09-19\Eukaryote Total RNA Nano_2016-09-19_002.xad
Assay Class:
Electrophoresis File Run Summary
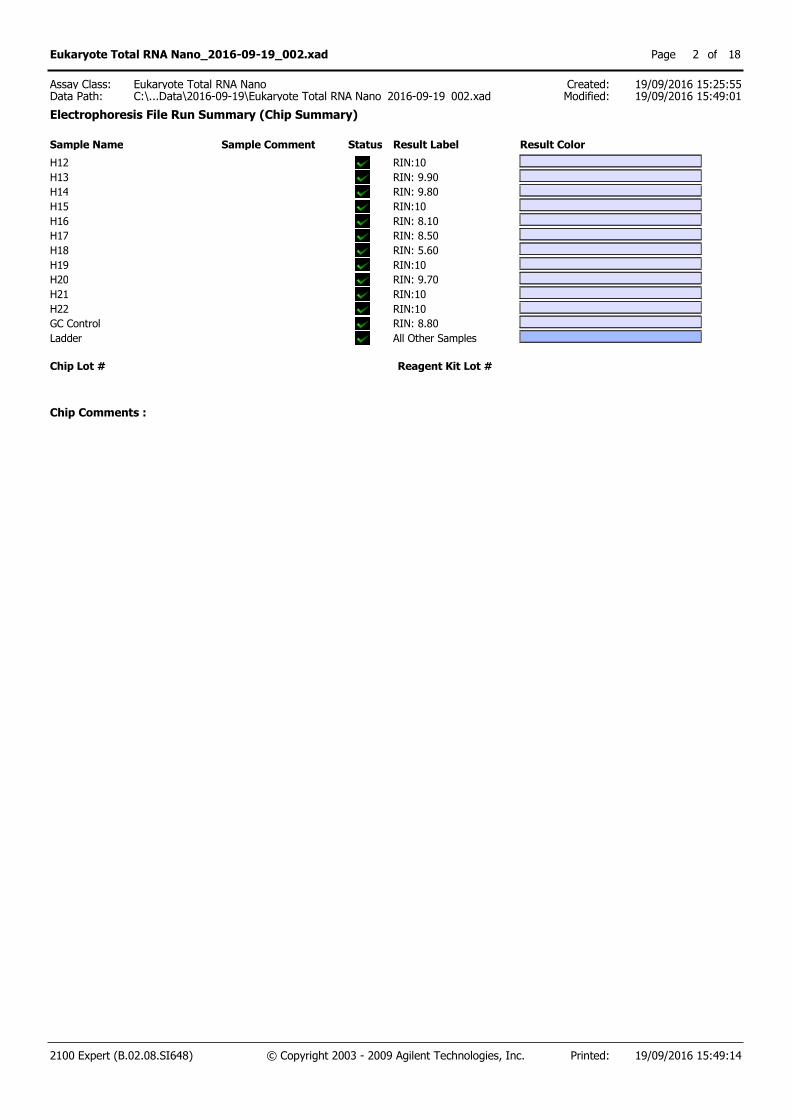
Sample Name Sample Comment Status Result Label Result Color
H12 RIN:10
H13 RIN: 9.90
H14 RIN: 9.80
H15 RIN:10
H16 RIN: 8.10
H17 RIN: 8.50
H18 RIN: 5.60
H19 RIN:10
H20 RIN: 9.70
H21 RIN:10
H22 RIN:10
GC Control RIN: 8.80
Ladder All Other Samples
Chip Lot # Reagent Kit Lot #
Chip Comments :
2100 Expert (B.02.08.SI648) © Copyright 2003 - 2009 Agilent Technologies, Inc. Printed: 19/09/2016 15:49:14
Eukaryote Total RNA Nano_2016-09-19_002.xad Page of2 18
Created:Modified:
19/09/2016 15:25:5519/09/2016 15:49:01Data Path:
Eukaryote Total RNA NanoC:\...Data\2016-09-19\Eukaryote Total RNA Nano_2016-09-19_002.xad
Assay Class:
Electrophoresis File Run Summary (Chip Summary)

General Analysis Settings
Number of Available Sample and Ladder Wells (Max.) : 13
Minimum Visible Range [s] : 17
Maximum Visible Range [s] : 70
Start Analysis Time Range [s] : 19
End Analysis Time Range [s] : 69
Ladder Concentration [ng/µl] : 150
Lower Marker Concentration [ng/µl] : 0
Upper Marker Concentration [ng/µl] : 0
Used Lower Marker for Quantitation
Standard Curve Fit is Logarithmic
Show Data Aligned to Lower Marker
Integrator Settings
Integration Start Time [s] : 19
Integration End Time [s] : 69
Slope Threshold : 0.6
Height Threshold [FU] : 0.5
Area Threshold : 0.2
Width Threshold [s] : 0.5
Baseline Plateau [s] : 6
Filter Settings
Filter Width [s] : 0.5
Polynomial Order : 4
Ladder
Ladder Peak Size
1 25
2 200
3 500
4 1000
5 2000
6 4000
2100 Expert (B.02.08.SI648) © Copyright 2003 - 2009 Agilent Technologies, Inc. Printed: 19/09/2016 15:49:14
Eukaryote Total RNA Nano_2016-09-19_002.xad Page of3 18
Created:Modified:
19/09/2016 15:25:5519/09/2016 15:49:01Data Path:
Eukaryote Total RNA NanoC:\...Data\2016-09-19\Eukaryote Total RNA Nano_2016-09-19_002.xad
Assay Class:
Electrophoresis Assay Details
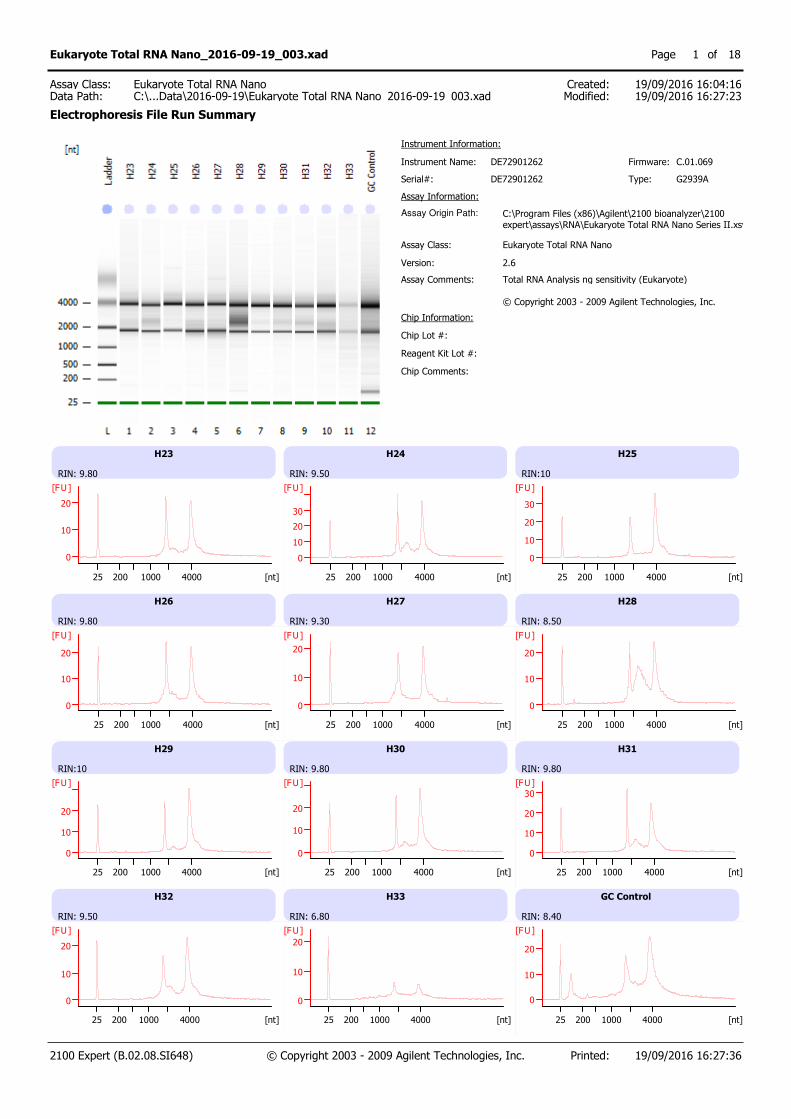
Instrument Name: DE72901262 Firmware:
Serial#:
Assay Information:
C.01.069
DE72901262
Instrument Information:
Assay Origin Path: C:\Program Files (x86)\Agilent\2100 bioanalyzer\2100expert\assays\RNA\Eukaryote Total RNA Nano Series II.xsy
Assay Class:
Version:
Assay Comments:
Eukaryote Total RNA Nano
2.6
Total RNA Analysis ng sensitivity (Eukaryote) © Copyright 2003 - 2009 Agilent Technologies, Inc.
Chip Information:
Chip Comments:
Type: G2939A
Chip Lot #:
Reagent Kit Lot #:
H23
RIN: 9.80
0
10
20
[FU]
25 200 1000 4000 [nt]
H24
RIN: 9.50
0
10
20
30
[FU]
25 200 1000 4000 [nt]
H25
RIN:10
0
10
20
30
[FU]
25 200 1000 4000 [nt]
H26
RIN: 9.80
0
10
20
[FU]
25 200 1000 4000 [nt]
H27
RIN: 9.30
0
10
20
[FU]
25 200 1000 4000 [nt]
H28
RIN: 8.50
0
10
20
[FU]
25 200 1000 4000 [nt]
H29
RIN:10
0
10
20
[FU]
25 200 1000 4000 [nt]
H30
RIN: 9.80
0
10
20
[FU]
25 200 1000 4000 [nt]
H31
RIN: 9.80
0
10
20
30
[FU]
25 200 1000 4000 [nt]
H32
RIN: 9.50
0
10
20
[FU]
25 200 1000 4000 [nt]
H33
RIN: 6.80
0
10
20
[FU]
25 200 1000 4000 [nt]
GC Control
RIN: 8.40
0
10
20
[FU]
25 200 1000 4000 [nt]
2100 Expert (B.02.08.SI648) © Copyright 2003 - 2009 Agilent Technologies, Inc. Printed: 19/09/2016 16:27:36
Eukaryote Total RNA Nano_2016-09-19_003.xad Page of1 18
Created:Modified:
19/09/2016 16:04:1619/09/2016 16:27:23Data Path:
Eukaryote Total RNA NanoC:\...Data\2016-09-19\Eukaryote Total RNA Nano_2016-09-19_003.xad
Assay Class:
Electrophoresis File Run Summary

Sample Name Sample Comment Status Result Label Result Color
H23 RIN: 9.80
H24 RIN: 9.50
H25 RIN:10
H26 RIN: 9.80
H27 RIN: 9.30
H28 RIN: 8.50
H29 RIN:10
H30 RIN: 9.80
H31 RIN: 9.80
H32 RIN: 9.50
H33 RIN: 6.80
GC Control RIN: 8.40
Ladder All Other Samples
Chip Lot # Reagent Kit Lot #
Chip Comments :
2100 Expert (B.02.08.SI648) © Copyright 2003 - 2009 Agilent Technologies, Inc. Printed: 19/09/2016 16:27:36
Eukaryote Total RNA Nano_2016-09-19_003.xad Page of2 18
Created:Modified:
19/09/2016 16:04:1619/09/2016 16:27:23Data Path:
Eukaryote Total RNA NanoC:\...Data\2016-09-19\Eukaryote Total RNA Nano_2016-09-19_003.xad
Assay Class:
Electrophoresis File Run Summary (Chip Summary)

General Analysis Settings
Number of Available Sample and Ladder Wells (Max.) : 13
Minimum Visible Range [s] : 17
Maximum Visible Range [s] : 70
Start Analysis Time Range [s] : 19
End Analysis Time Range [s] : 69
Ladder Concentration [ng/µl] : 150
Lower Marker Concentration [ng/µl] : 0
Upper Marker Concentration [ng/µl] : 0
Used Lower Marker for Quantitation
Standard Curve Fit is Logarithmic
Show Data Aligned to Lower Marker
Integrator Settings
Integration Start Time [s] : 19
Integration End Time [s] : 69
Slope Threshold : 0.6
Height Threshold [FU] : 0.5
Area Threshold : 0.2
Width Threshold [s] : 0.5
Baseline Plateau [s] : 6
Filter Settings
Filter Width [s] : 0.5
Polynomial Order : 4
Ladder
Ladder Peak Size
1 25
2 200
3 500
4 1000
5 2000
6 4000
2100 Expert (B.02.08.SI648) © Copyright 2003 - 2009 Agilent Technologies, Inc. Printed: 19/09/2016 16:27:36
Eukaryote Total RNA Nano_2016-09-19_003.xad Page of3 18
Created:Modified:
19/09/2016 16:04:1619/09/2016 16:27:23Data Path:
Eukaryote Total RNA NanoC:\...Data\2016-09-19\Eukaryote Total RNA Nano_2016-09-19_003.xad
Assay Class:
Electrophoresis Assay Details

Instrument Name: DE72901262 Firmware:
Serial#:
Assay Information:
C.01.069
DE72901262
Instrument Information:
Assay Origin Path: C:\Program Files (x86)\Agilent\2100 bioanalyzer\2100expert\assays\RNA\Eukaryote Total RNA Nano Series II.xsy
Assay Class:
Version:
Assay Comments:
Eukaryote Total RNA Nano
2.6
Total RNA Analysis ng sensitivity (Eukaryote) © Copyright 2003 - 2009 Agilent Technologies, Inc.
Chip Information:
Chip Comments:
Type: G2939A
Chip Lot #:
Reagent Kit Lot #:
H34
RIN: 8.20
0
10
20
[FU]
25 200 1000 4000 [nt]
35
RIN:10
0
10
20
[FU]
25 200 1000 4000 [nt]
H36
RIN:10
0
10
20
[FU]
25 200 1000 4000 [nt]
H37
RIN: 9.60
0
10
20
[FU]
25 200 1000 4000 [nt]
H38
RIN: 6.80
0
10
20
[FU]
25 200 1000 4000 [nt]
H39
RIN: 9.70
0
10
20
[FU]
25 200 1000 4000 [nt]
H40
RIN:10
0
10
20
30
[FU]
25 200 1000 4000 [nt]
H41
RIN: 7.50
0
10
20
[FU]
25 200 1000 4000 [nt]
R1
RIN N/A
0
20
40
60
[FU]
25 200 1000 4000 [nt]
R2
RIN:10
0
20
40
[FU]
25 200 1000 4000 [nt]
R3
RIN N/A
0
50
[FU]
25 200 1000 4000 [nt]
GC Control
RIN: 8.80
0
10
20
[FU]
25 200 1000 4000 [nt]
2100 Expert (B.02.08.SI648) © Copyright 2003 - 2009 Agilent Technologies, Inc. Printed: 19/09/2016 17:18:30
Eukaryote Total RNA Nano_2016-09-19_004.xad Page of1 18
Created:Modified:
19/09/2016 16:55:0519/09/2016 17:18:15Data Path:
Eukaryote Total RNA NanoC:\...Data\2016-09-19\Eukaryote Total RNA Nano_2016-09-19_004.xad
Assay Class:
Electrophoresis File Run Summary

Sample Name Sample Comment Status Result Label Result Color
H34 RIN: 8.20
35 RIN:10
H36 RIN:10
H37 RIN: 9.60
H38 RIN: 6.80
H39 RIN: 9.70
H40 RIN:10
H41 RIN: 7.50
R1 RIN N/A
R2 RIN:10
R3 RIN N/A
GC Control RIN: 8.80
Ladder All Other Samples
Chip Lot # Reagent Kit Lot #
Chip Comments :
2100 Expert (B.02.08.SI648) © Copyright 2003 - 2009 Agilent Technologies, Inc. Printed: 19/09/2016 17:18:30
Eukaryote Total RNA Nano_2016-09-19_004.xad Page of2 18
Created:Modified:
19/09/2016 16:55:0519/09/2016 17:18:15Data Path:
Eukaryote Total RNA NanoC:\...Data\2016-09-19\Eukaryote Total RNA Nano_2016-09-19_004.xad
Assay Class:
Electrophoresis File Run Summary (Chip Summary)

General Analysis Settings
Number of Available Sample and Ladder Wells (Max.) : 13
Minimum Visible Range [s] : 17
Maximum Visible Range [s] : 70
Start Analysis Time Range [s] : 19
End Analysis Time Range [s] : 69
Ladder Concentration [ng/µl] : 150
Lower Marker Concentration [ng/µl] : 0
Upper Marker Concentration [ng/µl] : 0
Used Lower Marker for Quantitation
Standard Curve Fit is Logarithmic
Show Data Aligned to Lower Marker
Integrator Settings
Integration Start Time [s] : 19
Integration End Time [s] : 69
Slope Threshold : 0.6
Height Threshold [FU] : 0.5
Area Threshold : 0.2
Width Threshold [s] : 0.5
Baseline Plateau [s] : 6
Filter Settings
Filter Width [s] : 0.5
Polynomial Order : 4
Ladder
Ladder Peak Size
1 25
2 200
3 500
4 1000
5 2000
6 4000
2100 Expert (B.02.08.SI648) © Copyright 2003 - 2009 Agilent Technologies, Inc. Printed: 19/09/2016 17:18:30
Eukaryote Total RNA Nano_2016-09-19_004.xad Page of3 18
Created:Modified:
19/09/2016 16:55:0519/09/2016 17:18:15Data Path:
Eukaryote Total RNA NanoC:\...Data\2016-09-19\Eukaryote Total RNA Nano_2016-09-19_004.xad
Assay Class:
Electrophoresis Assay Details

Instrument Name: DE72901262 Firmware:Serial#:Assay Information:
C.01.069DE72901262
Instrument Information:
Assay Origin Path: C:\Program Files (x86)\Agilent\2100 bioanalyzer\2100expert\assays\RNA\Eukaryote Total RNA Nano Series II.xsy
Assay Class:Version:Assay Comments:
Eukaryote Total RNA Nano2.6Total RNA Analysis ng sensitivity (Eukaryote) © Copyright 2003 - 2009 Agilent Technologies, Inc.
Chip Information:
Chip Comments:
Type: G2939A
Chip Lot #:Reagent Kit Lot #:
R4RIN:10
R5RIN:10
R6RIN:10
R7RIN:10
R8RIN:10
R9RIN:10
R10RIN:10
R11 RIN N/A
R12RIN:10
R13 RIN N/A
R14RIN:10
GC Control RIN: 9.10
2100 Expert (B.02.08.SI648) © Copyright 2003 - 2009 Agilent Technologies, Inc. Printed: 20/09/2016 16:28:08
Eukaryote Total RNA Nano_2016-09-20_001.xad Page of1 16
Created:Modified:
20/09/2016 15:55:5020/09/2016 16:27:15Data Path:
Eukaryote Total RNA NanoC:\...Data\2016-09-20\Eukaryote Total RNA Nano_2016-09-20_001.xad
Assay Class:
Electrophoresis File Run Summary

Sample Name SampleComment
Status
ResultLabel
Result Color
R4 RIN:10R5 RIN:10R6 RIN:10R7 RIN:10R8 RIN:10R9 RIN:10R10 RIN:10R11 RIN N/AR12 RIN:10R13 RIN N/AR14 RIN:10GC Control RIN: 9.10Ladder All Other
Samples
Chip Lot # Reagent Kit Lot #
Chip Comments :
2100 Expert (B.02.08.SI648) © Copyright 2003 - 2009 Agilent Technologies, Inc. Printed: 20/09/2016 16:28:08
Eukaryote Total RNA Nano_2016-09-20_001.xad Page of2 16
Created:Modified:
20/09/2016 15:55:5020/09/2016 16:27:15Data Path:
Eukaryote Total RNA NanoC:\...Data\2016-09-20\Eukaryote Total RNA Nano_2016-09-20_001.xad
Assay Class:
Electrophoresis File Run Summary (Chip Summary)
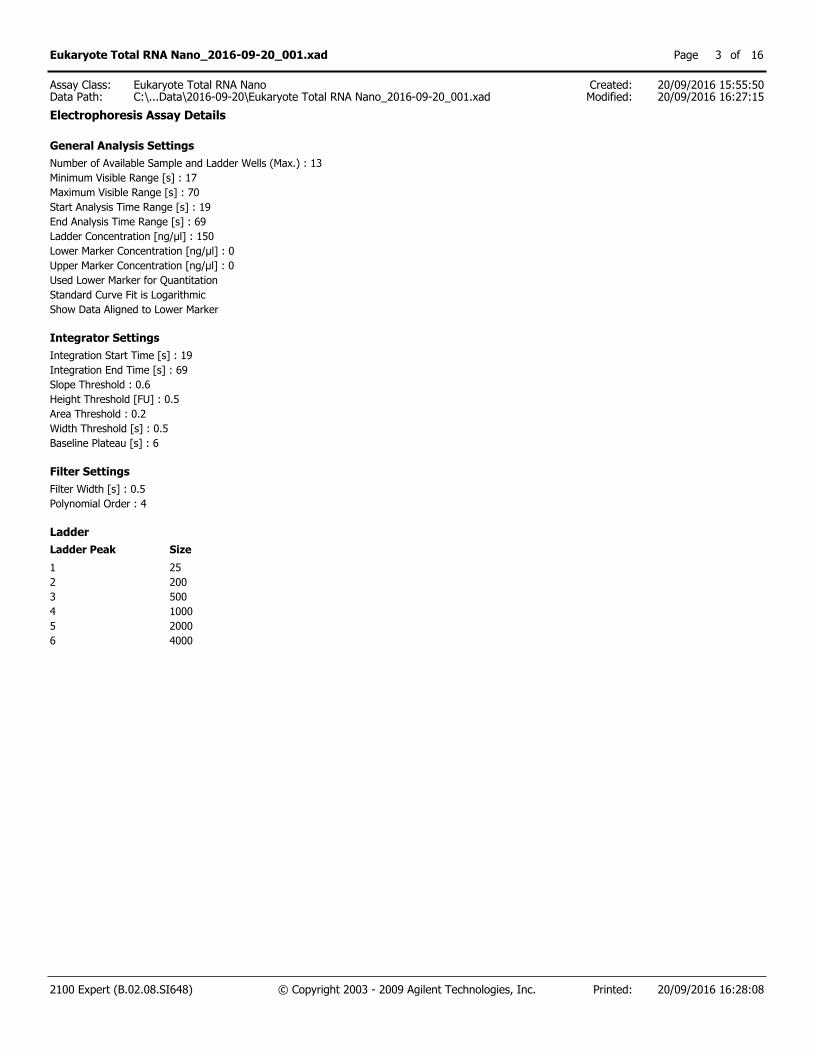
General Analysis SettingsNumber of Available Sample and Ladder Wells (Max.) : 13Minimum Visible Range [s] : 17Maximum Visible Range [s] : 70Start Analysis Time Range [s] : 19End Analysis Time Range [s] : 69Ladder Concentration [ng/µl] : 150Lower Marker Concentration [ng/µl] : 0Upper Marker Concentration [ng/µl] : 0Used Lower Marker for QuantitationStandard Curve Fit is LogarithmicShow Data Aligned to Lower Marker
Integrator SettingsIntegration Start Time [s] : 19Integration End Time [s] : 69Slope Threshold : 0.6Height Threshold [FU] : 0.5Area Threshold : 0.2Width Threshold [s] : 0.5Baseline Plateau [s] : 6
Filter SettingsFilter Width [s] : 0.5Polynomial Order : 4
Ladder Ladder Peak Size1 252 2003 5004 10005 20006 4000
2100 Expert (B.02.08.SI648) © Copyright 2003 - 2009 Agilent Technologies, Inc. Printed: 20/09/2016 16:28:08
Eukaryote Total RNA Nano_2016-09-20_001.xad Page of3 16
Created:Modified:
20/09/2016 15:55:5020/09/2016 16:27:15Data Path:
Eukaryote Total RNA NanoC:\...Data\2016-09-20\Eukaryote Total RNA Nano_2016-09-20_001.xad
Assay Class:
Electrophoresis Assay Details