Role of environmental seasonality in the turnover of a cetacean community in the southwestern Gulf...
16
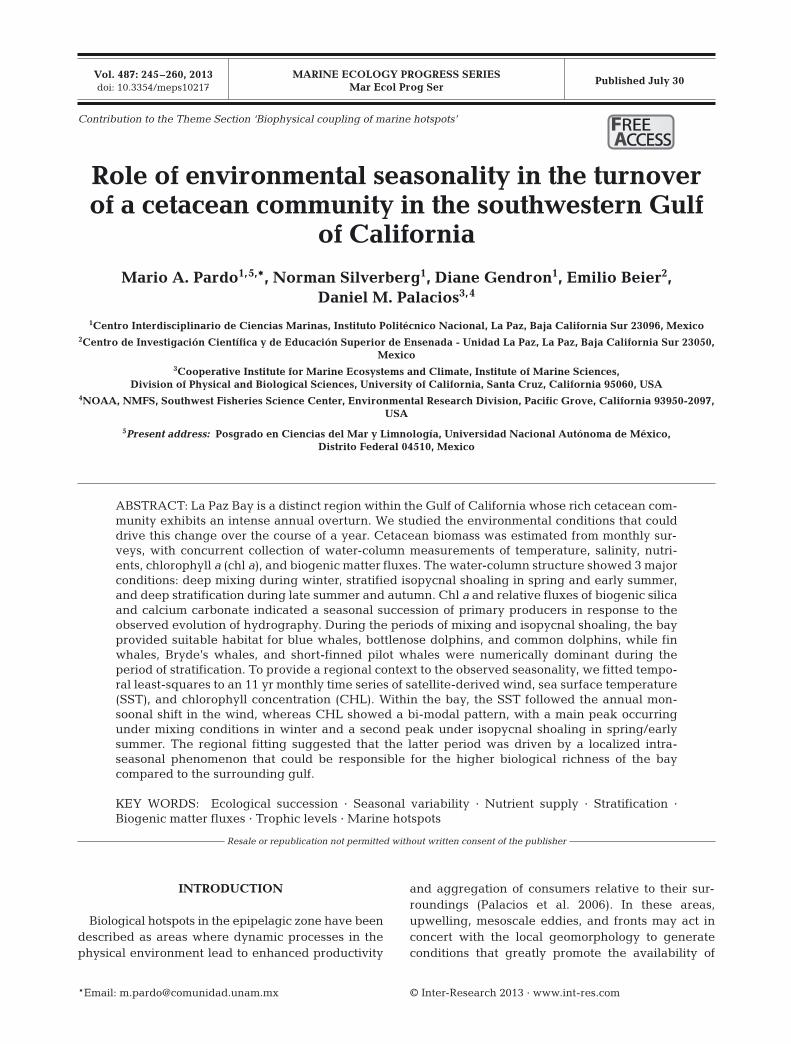
MARINE ECOLOGY PROGRESS SERIES Mar Ecol Prog Ser Vol. 487: 245–260, 2013 doi: 10.3354/meps10217 Published July 30 INTRODUCTION Biological hotspots in the epipelagic zone have been described as areas where dynamic processes in the physical environment lead to enhanced productivity and aggregation of consumers relative to their sur- roundings (Palacios et al. 2006). In these areas, upwelling, mesoscale eddies, and fronts may act in concert with the local geomorphology to generate conditions that greatly promote the availability of © Inter-Research 2013 · www.int-res.com *Email: [email protected] Role of environmental seasonality in the turnover of a cetacean community in the southwestern Gulf of California Mario A. Pardo 1,5, *, Norman Silverberg 1 , Diane Gendron 1 , Emilio Beier 2 , Daniel M. Palacios 3,4 1 Centro Interdisciplinario de Ciencias Marinas, Instituto Politécnico Nacional, La Paz, Baja California Sur 23096, Mexico 2 Centro de Investigación Científica y de Educación Superior de Ensenada - Unidad La Paz, La Paz, Baja California Sur 23050, Mexico 3 Cooperative Institute for Marine Ecosystems and Climate, Institute of Marine Sciences, Division of Physical and Biological Sciences, University of California, Santa Cruz, California 95060, USA 4 NOAA, NMFS, Southwest Fisheries Science Center, Environmental Research Division, Pacific Grove, California 93950-2097, USA 5 Present address: Posgrado en Ciencias del Mar y Limnología, Universidad Nacional Autónoma de México, Distrito Federal 04510, Mexico ABSTRACT: La Paz Bay is a distinct region within the Gulf of California whose rich cetacean com- munity exhibits an intense annual overturn. We studied the environmental conditions that could drive this change over the course of a year. Cetacean biomass was estimated from monthly sur- veys, with concurrent collection of water-column measurements of temperature, salinity, nutri- ents, chlorophyll a (chl a), and biogenic matter fluxes. The water-column structure showed 3 major conditions: deep mixing during winter, stratified isopycnal shoaling in spring and early summer, and deep stratification during late summer and autumn. Chl a and relative fluxes of biogenic silica and calcium carbonate indicated a seasonal succession of primary producers in response to the observed evolution of hydrography. During the periods of mixing and isopycnal shoaling, the bay provided suitable habitat for blue whales, bottlenose dolphins, and common dolphins, while fin whales, Bryde’s whales, and short-finned pilot whales were numerically dominant during the period of stratification. To provide a regional context to the observed seasonality, we fitted tempo- ral least-squares to an 11 yr monthly time series of satellite-derived wind, sea surface temperature (SST), and chlorophyll concentration (CHL). Within the bay, the SST followed the annual mon- soonal shift in the wind, whereas CHL showed a bi-modal pattern, with a main peak occurring under mixing conditions in winter and a second peak under isopycnal shoaling in spring/early summer. The regional fitting suggested that the latter period was driven by a localized intra- seasonal phenomenon that could be responsible for the higher biological richness of the bay compared to the surrounding gulf. KEY WORDS: Ecological succession · Seasonal variability · Nutrient supply · Stratification · Biogenic matter fluxes · Trophic levels · Marine hotspots Resale or republication not permitted without written consent of the publisher Contribution to the Theme Section ‘Biophysical coupling of marine hotspots’ FREE REE ACCESS CCESS
Transcript of Role of environmental seasonality in the turnover of a cetacean community in the southwestern Gulf...
MARINE ECOLOGY PROGRESS SERIESMar Ecol Prog Ser
Vol. 487: 245–260, 2013doi: 10.3354/meps10217
Published July 30
INTRODUCTION
Biological hotspots in the epipelagic zone have beendescribed as areas where dynamic processes in thephysical environment lead to enhanced productivity
and aggregation of consumers relative to their sur-roundings (Palacios et al. 2006). In these areas,upwelling, mesoscale eddies, and fronts may act inconcert with the local geomorphology to generateconditions that greatly promote the availability of
© Inter-Research 2013 · www.int-res.com*Email: [email protected]
Role of environmental seasonality in the turnoverof a cetacean community in the southwestern Gulf
of California
Mario A. Pardo1,5,*, Norman Silverberg1, Diane Gendron1, Emilio Beier2, Daniel M. Palacios3,4
1Centro Interdisciplinario de Ciencias Marinas, Instituto Politécnico Nacional, La Paz, Baja California Sur 23096, Mexico2Centro de Investigación Científica y de Educación Superior de Ensenada - Unidad La Paz, La Paz, Baja California Sur 23050,
Mexico3Cooperative Institute for Marine Ecosystems and Climate, Institute of Marine Sciences,
Division of Physical and Biological Sciences, University of California, Santa Cruz, California 95060, USA4NOAA, NMFS, Southwest Fisheries Science Center, Environmental Research Division, Pacific Grove, California 93950-2097,
USA
5Present address: Posgrado en Ciencias del Mar y Limnología, Universidad Nacional Autónoma de México, Distrito Federal 04510, Mexico
ABSTRACT: La Paz Bay is a distinct region within the Gulf of California whose rich cetacean com-munity exhibits an intense annual overturn. We studied the environmental conditions that coulddrive this change over the course of a year. Cetacean biomass was estimated from monthly sur-veys, with concurrent collection of water-column measurements of temperature, salinity, nutri-ents, chlorophyll a (chl a), and biogenic matter fluxes. The water-column structure showed 3 majorconditions: deep mixing during winter, stratified isopycnal shoaling in spring and early summer,and deep stratification during late summer and autumn. Chl a and relative fluxes of biogenic silicaand calcium carbonate indicated a seasonal succession of primary producers in response to theobserved evolution of hydrography. During the periods of mixing and isopycnal shoaling, the bayprovided suitable habitat for blue whales, bottlenose dolphins, and common dolphins, while finwhales, Bryde’s whales, and short-finned pilot whales were numerically dominant during theperiod of stratification. To provide a regional context to the observed seasonality, we fitted tempo-ral least-squares to an 11 yr monthly time series of satellite-derived wind, sea surface temperature(SST), and chlorophyll concentration (CHL). Within the bay, the SST followed the annual mon-soonal shift in the wind, whereas CHL showed a bi-modal pattern, with a main peak occurringunder mixing conditions in winter and a second peak under isopycnal shoaling in spring/earlysummer. The regional fitting suggested that the latter period was driven by a localized intra-seasonal phenomenon that could be responsible for the higher biological richness of the bay compared to the surrounding gulf.
KEY WORDS: Ecological succession · Seasonal variability · Nutrient supply · Stratification · Biogenic matter fluxes · Trophic levels · Marine hotspots
Resale or republication not permitted without written consent of the publisher
Contribution to the Theme Section ‘Biophysical coupling of marine hotspots’ FREEREE ACCESSCCESS

Mar Ecol Prog Ser 487: 245–260, 2013
prey for large fauna (e.g. Wingfield et al. 2011). Al -though these hotspots are often detectable throughremote sensing of the ocean’s surface, other areasthat appear oligotrophic and devoid of dynamic fea-tures at the surface may also attract large feedingpredators and even influence their migration pat-terns (e.g. Domeier et al. 2012). In such areas, thebiological production maxima may be in the subsur-face in the presence of a deep/sharp thermocline,underscoring the importance of measuring hydro-graphic and biological parameters, both at the sur-face and in the water column, for the characterizationof biological hotspots.
The most productive areas of the Gulf of California(hereafter ‘the gulf’; Fig. 1) are located along its east-
ern (continental) side and in the northern region dueto winter upwelling and tidal mixing, respectively(Lluch-Cota 2000). The southwestern gulf (peninsu-lar side) is comparatively less produc tive, except forLa Paz Bay (hereafter ‘the bay’), whose photosyn-thetic pigment concentrations remain high year-round compared to its surroundings, constituting anisolated spot of high phytoplankton biomass (Santa-maria-del-Angel et al. 1994, Luch-Cota & Teniza-Guillén 2000, Kahru et al. 2004). The bay sustains adiverse megafauna that includes at least 16 ceta ceanspecies of temperate, tropical, and subtropical affini-ties (Flores-Ramírez et al. 1996, Salvadeo et al. 2009).It also hosts a growing colony of California sea lionsZalophus californianus (Szteren et al. 2006) and isvisited by whale sharks Rhincodon typus and spine-tail devil rays Mobula japanica, which arrive in win-ter, spring, and early summer to feed on zooplankton(Clark & Nelson 1997, Ketchum-Mejía 2003, Croll etal. 2012). The rich cetacean community exhibits astrong annual overturn, with migratory species suchas blue whales Balaenoptera musculus and hump-back whales Mega ptera novaeangliae occurringin winter and spring, whereas species with moretropical affinities, like Bryde’s whales Balaenopteraedeni, bottlenose dolphins Tursiops truncatus, andshort-finned pilot whales Globicephala macro rhyn -chus, occur mostly during the summer and autumn.Fin whales Balaenoptera physalus are resident in thegulf and, together with the common dolphins Delphi-nus spp. occur year-round (Flores-Ramírez et al. 1996,Salvadeo et al. 2009). The hydrographic con ditionsthat support this cetacean diversity and underlie thespecies’ replacement have not been studied.
In the present study, we posit that seasonal forcingof oceanographic conditions in the bay, includingsurface mixing driven by northwesterly winds inwinter (Badan-Dangon et al. 1991) and cyclonic circulation in summer (Monreal-Gómez et al. 2001,Sánchez-Velasco et al. 2006), lead to enhanced nutri-ent supply to the base of the food web, attracting lowtrophic level prey for planktivorous and piscivorouscetaceans. Warmer conditions in summer would, inturn, be favorable for the aggregation of highertrophic level prey looking for a suitable habitat tospawn near the coast (e.g. Staaf et al. 2008), attract-ing teutophagous cetaceans. To assess the specifichydrographic and biological conditions underlyingspecies’ replacement in the cetacean community ofthe bay, we make use of water-column data collectedas part of a multidisciplinary time-series investiga-tion, aimed at examining monthly changes in physi-cal structure, nutrient and chlorophyll a (chl a) con-
246
Fig. 1. La Paz Bay, in the southwestern Gulf of California (in-set). The gray star in the main panel indicates the position ofthe oceanographic station and the site of the sediment trap
in the deepest part of the bay (~410 m)
Pardo et al.: Role of environmental seasonality in a cetacean community
centrations, vertical fluxes of biogenic matter, andcetacean biomasses over the course of a year. Theresults are put in a regional context (i.e. the south-western gulf) using time series of remotely sensed(satellite) measurements of surface wind, tempera-ture (SST), and chlorophyll concentration (CHL).
Although direct measurements of the prey fieldwould have probably enhanced our understanding ofthe relationships between cetaceans and the dynam-ics of their physical habitat in the bay, collection ofsuch data was not possible due to logistical andfinancial constraints. Indeed, quantitative and com-prehensive assessments of the intermediate trophiclevels in the southwestern gulf are lacking. However,considering that most cetacean species must con-stantly search for food due to their high energeticneeds (Trites et al. 1997, Barlow et al. 2008), we inter-pret their occurrence in the bay, at least in part, as aresponse to the prey availability, which is in turnaggregated by suitable physical and biologicalmechanisms. Further, the evolutionary and ecologi-cal adaptations of cetaceans to exploit specific typesof prey, such as zooplankton, small pelagic fish, orsquid (Pauly et al. 1998), facilitate such interpreta-tion. This argument has been widely used to charac-terize cetacean habitats (e.g. Au & Perryman 1985,Hamazaki 2002, Doniol-Valcroze et al. 2007, Praca etal. 2009) as well as to model cetacean abundance asa function of predominant environmental conditions(e.g. Becker et al. 2010, 2012, Gerrodette & Eguchi2011, Forney et al. 2012), even when there is nodirect measurement of the potential prey.
MATERIALS AND METHODS
Study area
La Paz Bay is the largest and deepest embaymentin the Gulf of California (Fig. 1), with an area of~2160 km2 and a maximum depth of ~410 m. Waterexchange with the surrounding gulf occurs mainlythrough the northern channel, called Boca Grande(Salinas-González et al. 2003, Obeso-Nieblas et al.2004). The bay lies within a tropical-subtropical tran-sition zone that seasonally alternates between 2 well-defined periods as a result of the monsoonal regimethat dominates the entire gulf. The temperate season,from November to April (winter to spring), is domi-nated by strong northwesterly winds that enhanceevaporation and increase the surface salinity, whichinduces deep vertical convection (i.e. sinking). Moremoderate southwesterly winds blow during the warm
season, from May to October (summer to autumn).During this period, the water column receives theinfluence of tropical waters, the thermocline deep-ens, and the upper layer stratifies (Badan-Dangon etal. 1991, Adams & Comrie 1997, Bordoni et al. 2004).
Hydrographic and biological conditions
The changes in the physical structure of the watercolumn and their influence on the base of the foodweb, through nutrient supply, help us to identify thepredominant ecological conditions that attract differ-ent cetacean species at different times of the year.A number of physical, chemical, and biological vari-ables were measured at an oceanographic stationlocated over the deepest part of the bay (~410 m;Fig. 1). Between 17 February 2007 and 18 February2008, 13 CTD profiles were taken to depths rangingfrom 50 to 340 m. Temperature, salinity, and densitydata were standardized to 1 m depth means. Fromthese values, we computed the Brunt-Väisälä fre-quency (cycles h−1; also known as buoyancy fre-quency), a measure of the degree of stratification(Wahl & Teague 1983). The depth of maximum buoy-ancy frequency in a profile corresponds to the depthof the pycnocline. At the same site, 13 profiles ofNiskin-bottle samples were taken at discrete depthsaccording to 6 levels of light penetration (0.1, 1, 10,33, 55, and 100%) estimated from Secchi disc meas-urements following the Beer-Bourguer-Lambert law(Walker 1982, Bustillos-Guzmán & Lechuga-Devéze1989). Concentrations of dissolved silica (H2SiO4),phosphate (PO4
−3), and total dissolved inorganic ni -trogen (NO2
−+NO3−+NH4
−) were measured from thesesamples (Strickland & Parsons 1972), as well as theconcentration of chl a (Ritchie 2008). Since measure-ments were taken at different times and in somecases different depth levels, we performed an objec-tive interpolation of these variables using a Gaussianweighting function (Jalickee & Hamilton 1977, Boyeret al. 2005) with 30 d horizontal and 1 m verticalscales to represent the temporal evolution. All datawere truncated below 100 m depth since preliminaryevaluation of the results showed that most of the variability was concentrated above that level.
Biogenic matter fluxes
The sinking particulate matter is indicative of thenature of biogenic components and thus the ecologi-cal succession taking place in the upper layers
247
Mar Ecol Prog Ser 487: 245–260, 2013248
(Bishop 1988, Silver & Gowing 1991, Silverberg et al.2006), which could trigger the incursion of differentcetacean species according to their feeding require-ments. We analyzed samples from a Technicap® PPS3/3 trap of 0.125 m2 aperture, which was anchoredand suspended at ~310 m depth at the same site asthe oceanographic measurements (Fig. 1). The sink-ing matter was collected in separate bottles during 7to 15 d periods each and then fixed with a preser -vative solution of 4% buffered formaldehyde satu-rated with sodium tetra borate. The total mass flux, ing m−2 d−1, was estimated from 4 sub-samples, whichwere centrifuged for 25 min at 3000 rpm (~1600 × g),decanted, and washed with distilled water. The col-lected material was weighed after a 72 h drying
period at ~50°C. The lithogenic fraction of the totalflux was subtracted since our interest was onlyrelated to the biological processes. From the totalbiogenic fractions, we analyzed the proportions ofbiogenic silica, or opal (SiO2·nH2O), and calcium car-bonate (CaCO3).
Local and regional seasonality
Because of their great mobility, the incursions of dif-ferent cetacean species into the bay could be theresult of both local and/or regional conditions. There-fore, it was important to address the larger spatialcontext in which the hydrographic and biological con-
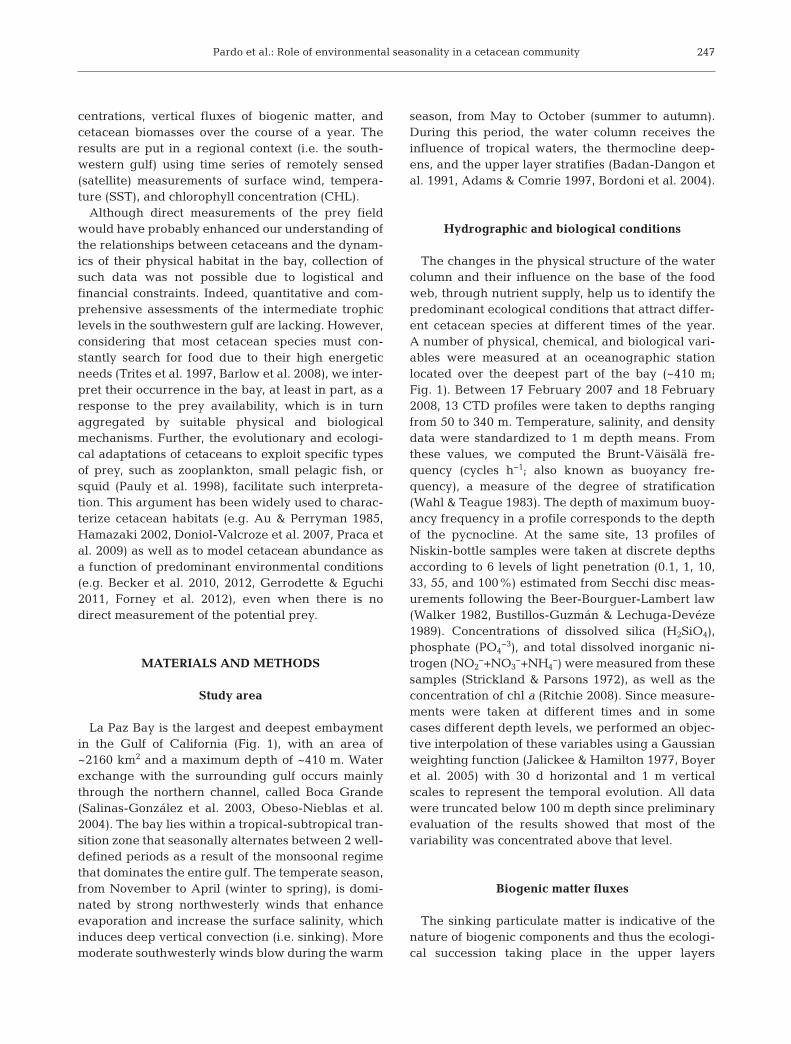
ditions within the bay occur. Also, sincethe small sample sizes yielded by thepresent study (14 monthly data points)prevented us from quanti ta tively corre-lating cetacean densities to the monthlyevolution of the water column withinthe bay, it was important to comparethose conditions to longer time series ofsurface variables and put them in thespatial context of the southwestern gulf.We therefore characterized the season-ality of the entire region, from north ofLoreto Bay to south of La Paz Bay (Fig.2), using an 11 yr time series of remotelysensed SST and CHL as proxies for thephysical and biological en vironment.The monthly CHL data came from theSea-viewing Wide Field-of-view Sensor(SeaWiFS) aboard the satellite Orb-view-2 (O’Reilly et al. 1998, 2000,Hooker & McClain 2000), with a pixelresolution of 1.39 km. The monthly SSTdata came from the Advanced VeryHigh Resolution Radio meter (AVHRR)aboard NOAA satellites (ProgramPathfinder 5.0; Walton et al. 1998, Casey& Cornillon 1999, Kilpatrick et al. 2001),with a spatial resolution of 4.89 km. Ad-ditionally, we used the monthly windvelocity data from the SeaWinds sensoraboard the NASA satellite QuikSCAT(Freilich 2000). Due to the coarserspatial resolution of this product (13.9km), only the measurement point closestto the bay was used to compute the localseasonality since the other availablenearby points were on land or too farfrom the bay. All re motely sensed vari-
Fig. 2. Spatial representation of the 11 yr seasonal least-squares fits of sea sur-face temperature (SST; upper panels; in a variable color scale to highlight spa-tial gradients) and chlorophyll concentration (CHL; lower panels; same colorscale among panels) for the southwestern Gulf of California. The periodsshown were chosen following the maximum and minimum CHL values of thesea sonal least-squares fit within La Paz Bay, which are denoted here and in
Fig. 7 as I, II, III, and IV
Pardo et al.: Role of environmental seasonality in a cetacean community
ables were obtained through the Environmental Re-search Division’s Data Access Program of NOAA,NMFS, Southwest Fisheries Science Center (http://coastwatch. pfeg. noaa. gov/ erddap/ index. html). A spa-tially explicit characterization of the seasonal cycle ofthe southwestern gulf (Fig. 2) was done by fitting tem-poral least-squares with annual and semi-annual har-monics (Emery & Thomson 1998, Ripa 2002) to the re-motely sensed variables. Within the polygon of thebay (see map in Fig. 3), the temporal behavior of eachvariable was calculated using the same analyses, ap-plied to the mean of all monthly values. The periods ofmaxima and minima resulting from the local (i.e.within the bay) CHL seasonal analysis were chosen toportray the results of the regional (i.e. southwesterngulf) analysis of SST and CHL (Fig. 2).
Cetacean population density
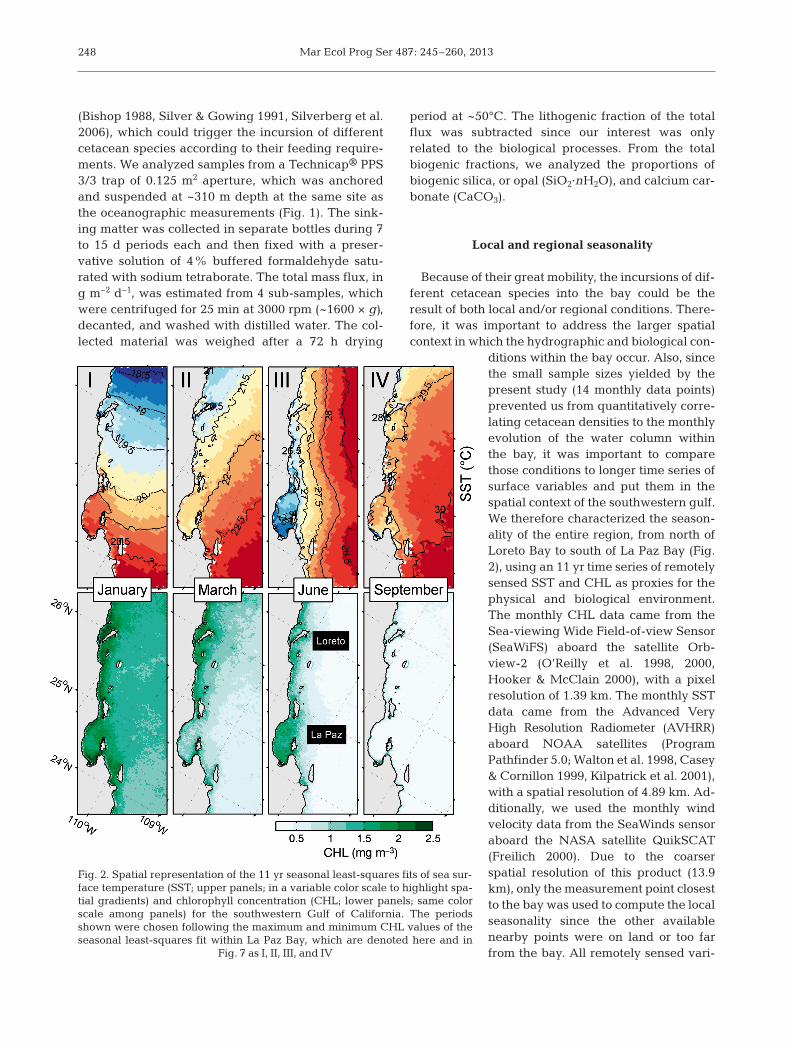
We conducted monthly visual surveys within thebay over a systematic zig-zag arrangement of tran-sects (Fig. 3) aboard the 28 ft (8.5 m) RV ‘CICIMARXV’ at ~18 km h−1 between 6 February 2007 and 23March 2008. Two trained observers simultaneouslysearched for cetaceans with the aid of 7 × 50 hand-held binoculars (Fujinon®FMTRC-SX) equipped withcompass and vertical reticles, independently cover-ing both sides of the transect line, from the front ofthe vessel to an angle of 90°. A team of 4 observersrotated every 40 min. Observations were made froma platform at 5.09 m effective visual height. The per-pendicular distance (x) from the transect line to thesighting was calculated following Lerczak & Hobbs(1998). The animals were approached to confirm species identification only when they were within~1.5 km of the transect line (i.e. closing mode tech-nique; Dawson et al. 2008). Most of the large specieswere easily identified beyond this distance, whereas
some dolphin schools remained unidentified as wellas some whales recorded too far from the transectline. Search effort was suspended during the ap -proach and the time spent with the animals as wellas when the Beaufort sea-state was higher than 3.
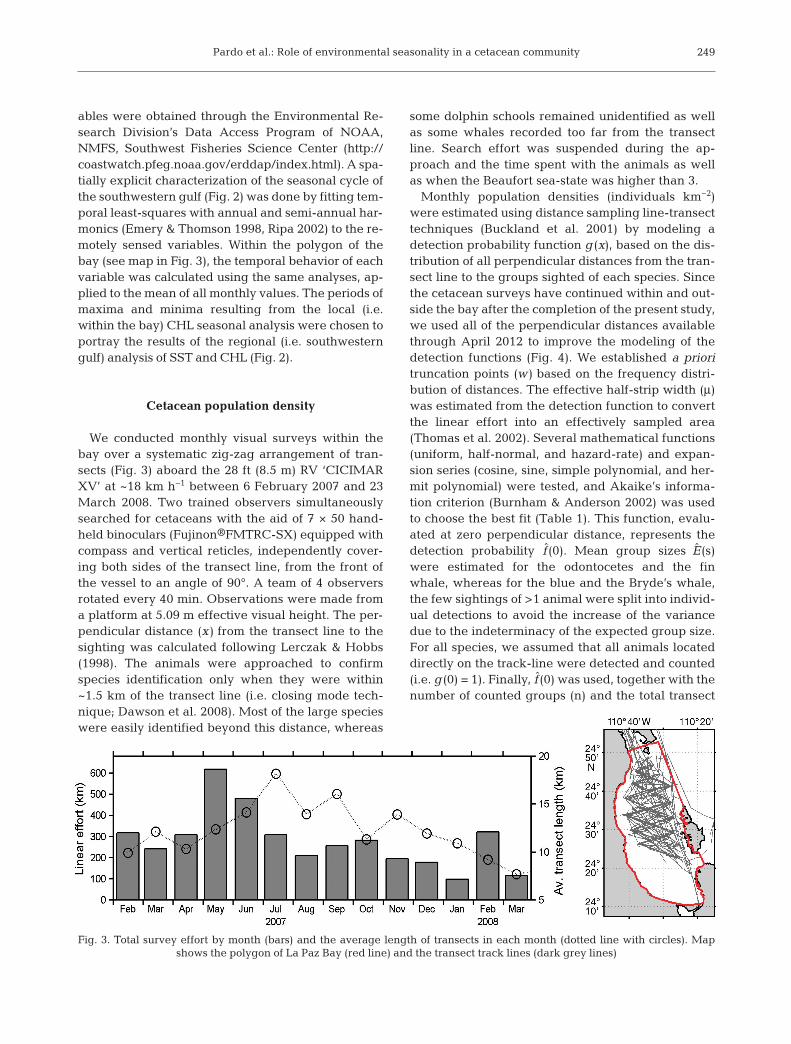
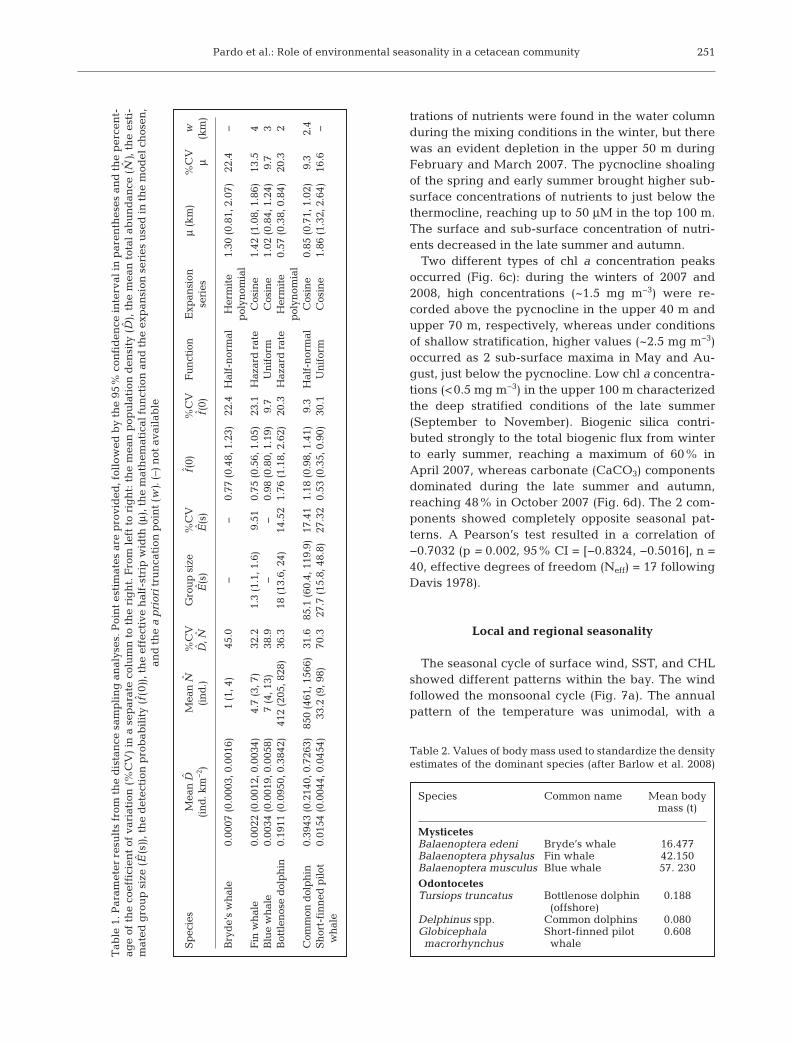
Monthly population densities (individuals km−2)were estimated using distance sampling line-transecttechniques (Buckland et al. 2001) by modeling adetection probability function g (x), based on the dis-tribution of all perpendicular distances from the tran-sect line to the groups sighted of each species. Sincethe cetacean surveys have continued within and out-side the bay after the completion of the present study,we used all of the perpendicular distances availablethrough April 2012 to improve the modeling of thedetection functions (Fig. 4). We established a prioritruncation points (w) based on the frequency distri-bution of distances. The effective half-strip width (μ)was estimated from the detection function to convertthe linear effort into an effectively sampled area(Thomas et al. 2002). Several mathematical functions(uniform, half-normal, and hazard-rate) and expan-sion series (cosine, sine, simple polynomial, and her-mit polynomial) were tested, and Akaike’s informa-tion criterion (Burnham & Anderson 2002) was usedto choose the best fit (Table 1). This function, evalu-ated at zero perpendicular distance, represents thedetection probability f (0). Mean group sizes E(s)were estimated for the odontocetes and the finwhale, whereas for the blue and the Bryde’s whale,the few sightings of >1 animal were split into individ-ual detections to avoid the increase of the variancedue to the indeterminacy of the expected group size.For all species, we assumed that all animals locateddirectly on the track-line were detected and counted(i.e. g (0) = 1). Finally, f (0) was used, together with thenumber of counted groups (n) and the total transect
249
Fig. 3. Total survey effort by month (bars) and the average length of transects in each month (dotted line with circles). Map shows the polygon of La Paz Bay (red line) and the transect track lines (dark grey lines)
Mar Ecol Prog Ser 487: 245–260, 2013
length (L), to estimate a point density value (D) foreach month (Thomas et al. 2002). The variance
(D) and the lower and upper limits of the 95%confidence intervals (D/C, D · C) were estimated bya 999 iteration bootstrap analysis of samples (i.e.transects) at each stratum (i.e. month). For the less-frequent species, we only calculated the encounterrate of groups as the number of sightings recorded inthe total linear effort in each survey. Although boththe short-beaked common dolphin Delphinus delphisand the long-beaked common dolphin Delphinuscapensis occur in the Gulf of California, we treatedthem at the genus level, given the difficulty in identi-fying them to species level in most sightings.
Cetacean biomass
The population density estimates (individuals km−2)were converted into values of biomass (t km−2) to
make the species comparable. This wasdone by multiplying the estimated densityby the mean species-specific body massvalues previously reported for the Califor-nia Current (Barlow et al. 2008 and refer-ences therein). These values come fromboth direct measurements and regressionmodels of body mass as a function of themean body length (Table 2).
RESULTS
Hydrographic and biological conditions
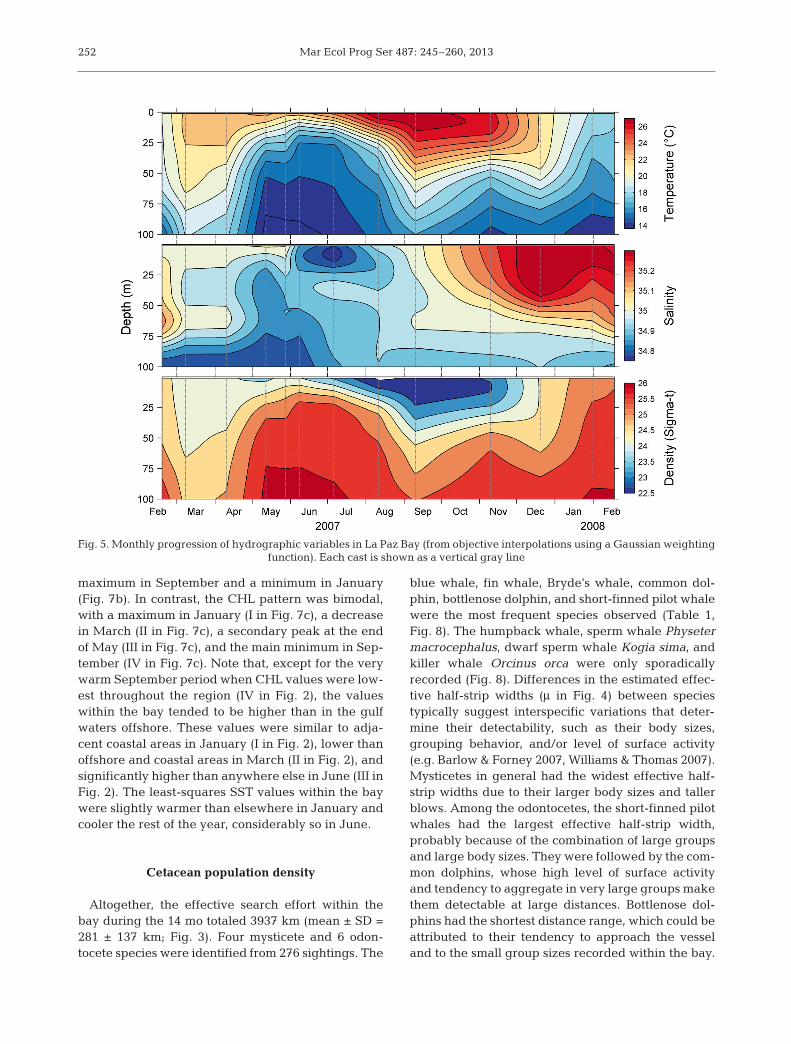
Temperature dominated the densitystructure in the water column (Fig. 5). Coldwater (<18°C) occurred throughout the first100 m during the winter (February 2007and January to February 2008). DuringMarch 2007, the upper 75 m were above20°C. From April to July, a doming of theisotherms took place, and water below17°C penetrated the surface layer up to10 m. From June to November, the upper25 m warmed above 25°C. December was atransition period in which the temperaturein the upper 55 m cooled below 21°C. TheBrunt-Väisälä frequency (Fig. 6a) showed3 major conditions over the year, definedby the depth and degree of stratification.High values indicate a strong stratification,whereas low values mean strong mixing.
The low buoyancy contours in February to March2007 and January to February 2008 indicated deepmixing in the upper water column. During these win-ter periods, the pycnocline (i.e. the maximum buoy-ancy frequency along the profile) deepened to at least100 m. Then, during the spring and early summer, thebuoyancies in the upper 25 m marked a period ofisopycnal shoaling, when the pycno cline almostreached the surface. This doming of isopycnals lasted4 mo, until early August, and it was followed by athickening of the stratified upper layer in the latesummer and autumn, marking conditions of deepstratification, with the pycnocline around 40 m depth.These conditions prevailed until December 2007,when a mixed period developed again.
For nutrients, we only show the concentration (µM)of the sum of all components (Fig. 6b) since concen-trations of dissolved silica, phosphate, and total dis-solved in organic nitrogen followed similar patternsover the course of the year. Relatively high concen-
var
250
Fig. 4. Detection probability function (g(x); black line), estimated from thedistribution of per pendicular sighting distances (gray bars). The estimatedeffective half-strip width (μ) is shown as a dashed vertical line. The totalnumber of distances used (n) is presented, specifying the number of dis-tances from the study period and area (first value within parentheses) andthe distances taken from subsequent years and/or areas aboard the same
platform (second value within the parentheses)
Pardo et al.: Role of environmental seasonality in a cetacean community
trations of nutrients were found in the water columnduring the mixing conditions in the winter, but therewas an evident depletion in the upper 50 m duringFebruary and March 2007. The pycnocline shoalingof the spring and early summer brought higher sub-surface concentrations of nutrients to just below thethermocline, reaching up to 50 μM in the top 100 m.The surface and sub-surface concentration of nutri-ents decreased in the late summer and autumn.
Two different types of chl a concentration peaksoccurred (Fig. 6c): during the winters of 2007 and2008, high concentrations (~1.5 mg m−3) were re -corded above the pycnocline in the upper 40 m andupper 70 m, respectively, whereas under conditionsof shallow stratification, higher values (~2.5 mg m−3)occurred as 2 sub-surface maxima in May and Au -gust, just below the pycnocline. Low chl a concentra-tions (<0.5 mg m−3) in the upper 100 m characterizedthe deep stratified conditions of the late summer(September to November). Biogenic silica contri -buted strongly to the total biogenic flux from winterto early summer, reaching a maximum of 60% inApril 2007, whereas carbonate (CaCO3) componentsdominated during the late summer and autumn,reaching 48% in October 2007 (Fig. 6d). The 2 com-ponents showed completely opposite seasonal pat-terns. A Pearson’s test resulted in a correlation of−0.7032 (p = 0.002, 95% CI = [−0.8324, −0.5016], n =40, effective degrees of freedom (Neff) = 17 followingDavis 1978).
Local and regional seasonality
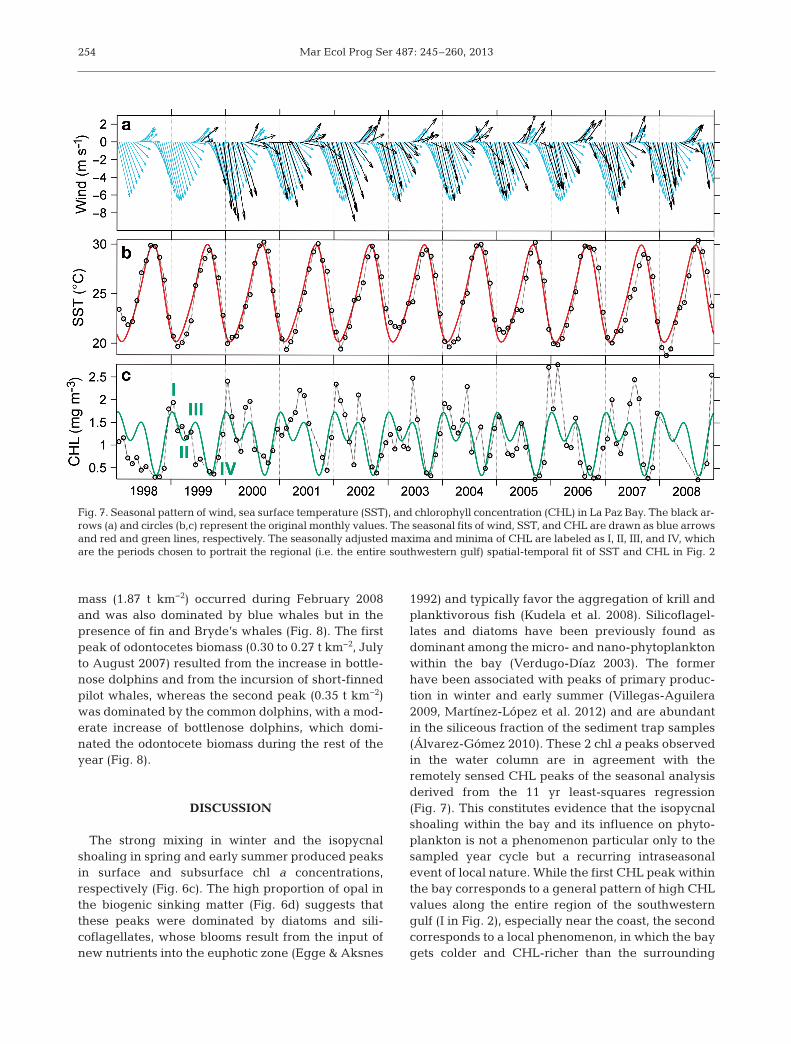
The seasonal cycle of surface wind, SST, and CHLshowed different patterns within the bay. The windfollowed the monsoonal cycle (Fig. 7a). The annualpattern of the temperature was unimodal, with a
251
Sp
ecie
sM
ean
DM
ean
N%
CV
Gro
up
siz
e%
CV
f(0)
%C
VF
un
ctio
nE
xpan
sion
μ
(km
)%
CV
w
(in
d. k
m−
2 )(i
nd
.)D
,NE
(s)
E(s
)f(
0)se
ries
μ(k
m)
Bry
de’
s w
hal
e0.
0007
(0.
0003
, 0.0
016)
1 (1
, 4)
45.0
−−
0.77
(0.
48, 1
.23)
22.4
Hal
f-n
orm
alH
erm
ite
1.30
(0.
81, 2
.07)
22.4
−p
olyn
omia
lF
in w
hal
e0.
0022
(0.
0012
, 0.0
034)
4.7
(3, 7
)32
.21.
3 (1
.1, 1
.6)
9.51
0.75
(0.
56, 1
.05)
23.1
Haz
ard
rat
eC
osin
e1.
42 (
1.08
, 1.8
6)13
.54
Blu
e w
hal
e0.
0034
(0.
0019
, 0.0
058)
7 (4
, 13)
38.9
−−
0.98
(0.
80, 1
.19)
9.7
Un
ifor
mC
osin
e1.
02 (
0.84
, 1.2
4)9.
73
Bot
tlen
ose
dol
ph
in0.
1911
(0.
0950
, 0.3
842)
412
(205
, 828
)36
.318
(13
.6, 2
4)14
.52
1.76
(1.
18, 2
.62)
20.3
Haz
ard
rat
eH
erm
ite
0.57
(0.
38, 0
.84)
20.3
2p
olyn
omia
lC
omm
on d
olp
hin
0.39
43 (
0.21
40, 0
.726
3)85
0 (4
61, 1
566)
31.6
85.1
(60
.4, 1
19.9
)17
.41
1.18
(0.
98, 1
.41)
9.3
Hal
f-n
orm
alC
osin
e0.
85 (
0.71
, 1.0
2)9.
32.
4S
hor
t-fi
nn
ed p
ilot
0.01
54 (
0.00
44, 0
.045
4)33
.2 (
9, 9
8)70
.327
.7 (
15.8
, 48.
8)27
.32
0.53
(0.
35, 0
.90)
30.1
Un
ifor
mC
osin
e1.
86 (
1.32
, 2.6
4)16
.6−
wh
ale
Tab
le 1
. Par
amet
er r
esu
lts
from
th
e d
ista
nce
sam
pli
ng
an
alys
es. P
oin
t es
tim
ates
are
pro
vid
ed, f
ollo
wed
by
the
95%
con
fid
ence
inte
rval
in p
aren
thes
es a
nd
th
e p
erce
nt-
age
of t
he
coef
fici
ent
of v
aria
tion
(%
CV
) in
a s
epar
ate
colu
mn
to
the
rig
ht.
Fro
m l
eft
to r
igh
t: t
he
mea
n p
opu
lati
on d
ensi
ty (
D),
th
e m
ean
tot
al a
bu
nd
ance
(N
), t
he
esti
-m
ated
gro
up
siz
e (E
(s))
, th
e d
etec
tion
pro
bab
ilit
y (f
(0))
, th
e ef
fect
ive
hal
f-st
rip
wid
th (μ)
, th
e m
ath
emat
ical
fu
nct
ion
an
d t
he
exp
ansi
on s
erie
s u
sed
in t
he
mod
el c
hos
en,
and
th
e a
pri
orit
run
cati
on p
oin
t (w
). (
–) n
ot a
vail
able
Species Common name Mean body mass (t)
MysticetesBalaenoptera edeni Bryde’s whale 16.477Balaenoptera physalus Fin whale 42.150Balaenoptera musculus Blue whale 57. 230
OdontocetesTursiops truncatus Bottlenose dolphin 0.188
(offshore)Delphinus spp. Common dolphins 0.080Globicephala Short-finned pilot 0.608macrorhynchus whale
Table 2. Values of body mass used to standardize the densityestimates of the dominant species (after Barlow et al. 2008)
Mar Ecol Prog Ser 487: 245–260, 2013
maximum in September and a minimum in January(Fig. 7b). In contrast, the CHL pattern was bimodal,with a maximum in January (I in Fig. 7c), a decreasein March (II in Fig. 7c), a secondary peak at the endof May (III in Fig. 7c), and the main minimum in Sep-tember (IV in Fig. 7c). Note that, except for the verywarm September period when CHL values were low-est throughout the region (IV in Fig. 2), the valueswithin the bay tended to be higher than in the gulfwaters offshore. These values were similar to adja-cent coastal areas in January (I in Fig. 2), lower thanoffshore and coastal areas in March (II in Fig. 2), andsignificantly higher than anywhere else in June (III inFig. 2). The least-squares SST values within the baywere slightly warmer than elsewhere in January andcooler the rest of the year, considerably so in June.
Cetacean population density
Altogether, the effective search effort within thebay during the 14 mo totaled 3937 km (mean ± SD =281 ± 137 km; Fig. 3). Four mysticete and 6 odon -tocete species were identified from 276 sightings. The
blue whale, fin whale, Bryde’s whale, common dol-phin, bottlenose dolphin, and short-finned pilot whalewere the most frequent species observed (Table 1,Fig. 8). The humpback whale, sperm whale Physetermacrocephalus, dwarf sperm whale Kogia sima, andkiller whale Orcinus orca were only sporadicallyrecorded (Fig. 8). Differences in the estimated effec-tive half-strip widths (μ in Fig. 4) between speciestypically suggest interspecific variations that deter-mine their detectability, such as their body sizes,grouping behavior, and/or level of surface activity(e.g. Barlow & Forney 2007, Williams & Thomas 2007).Mysticetes in general had the widest effective half-strip widths due to their larger body sizes and tallerblows. Among the odontocetes, the short-finned pilotwhales had the largest effective half-strip width,probably because of the combination of large groupsand large body sizes. They were followed by the com-mon dolphins, whose high level of surface activityand tendency to aggregate in very large groups makethem detectable at large distances. Bottlenose dol-phins had the shortest distance range, which could beattributed to their tendency to approach the vesseland to the small group sizes recorded within the bay.
252
Fig. 5. Monthly progression of hydrographic variables in La Paz Bay (from objective interpolations using a Gaussian weighting function). Each cast is shown as a vertical gray line

Pardo et al.: Role of environmental seasonality in a cetacean community
Cetacean biomass
Overall cetacean biomass was dominated by themysticetes and displayed 3 major peaks (Figs. 6e & 8).The first occurred in spring, from May to June 2007,the second covered late summer and autumn (Sep-tember to December), and the third and highest wasin February 2008 (Fig. 6e). The odontocetes showedan opposite pattern from the mysticetes (Fig. 6e):They in creased in biomass when mysticetes de -
creased, showing 2 main peaks during July to August2007 and in Jan uary 2008. The first mysticete peak ofthe spring (0.62 t km−2) resulted from the co-occur-rence of the 3 most frequent species but was domi-nated by the blue whale (Fig. 8). In contrast, thepeaks of the late summer and autumn (0.73 and 0.63 tkm−2, respectively) were dominated by the fin whalein the absence of the blue whale and the occurrenceof the Bryde’s whale, the latter always in low bio-masses. Finally, the highest peak of mysticete bio-
253
Fig. 6. Physical and biological context underlying variations in cetacean biomass in La Paz Bay. (a) Buoyancy frequency, withthe dashed white line representing the depth of the pycnocline (i.e. maximum buoyancy frequency at each profile). Gray dotsshow the depth of the Niskin-bottle samples for (b) nutrients and (c) chl a. (d) The contributions of biogenic silica (SiO2·nH2O)and calcium carbonate (CaCO3) to the total biogenic sinking matter, shown as 7 to 15 d absolute values. (e) Monthly cetacean
biomass
Mar Ecol Prog Ser 487: 245–260, 2013
mass (1.87 t km−2) occurred during February 2008and was also dominated by blue whales but in thepresence of fin and Bryde’s whales (Fig. 8). The firstpeak of odontocetes biomass (0.30 to 0.27 t km−2, Julyto August 2007) resulted from the increase in bottle-nose dolphins and from the incursion of short-finnedpilot whales, whereas the second peak (0.35 t km−2)was dominated by the common dolphins, with a mod-erate increase of bottlenose dolphins, which domi-nated the odontocete biomass during the rest of theyear (Fig. 8).
DISCUSSION
The strong mixing in winter and the isopycnalshoaling in spring and early summer produced peaksin surface and subsurface chl a concentrations,respectively (Fig. 6c). The high proportion of opal inthe biogenic sinking matter (Fig. 6d) suggests thatthese peaks were dominated by diatoms and sili-coflagellates, whose blooms result from the input ofnew nutrients into the euphotic zone (Egge & Aksnes
1992) and typically favor the aggregation of krill andplanktivorous fish (Kudela et al. 2008). Silicoflagel-lates and diatoms have been previously found asdominant among the micro- and nano-phytoplanktonwithin the bay (Verdugo-Díaz 2003). The formerhave been associated with peaks of primary produc-tion in winter and early summer (Villegas-Aguilera2009, Martínez-López et al. 2012) and are abundantin the siliceous fraction of the sediment trap samples(Álvarez-Gómez 2010). These 2 chl a peaks observedin the water column are in agreement with theremotely sensed CHL peaks of the seasonal analysisderived from the 11 yr least-squares regression(Fig. 7). This constitutes evidence that the isopycnalshoaling within the bay and its influence on phyto-plankton is not a phenomenon particular only to thesampled year cycle but a recurring intraseasonalevent of local nature. While the first CHL peak withinthe bay corresponds to a general pattern of high CHLvalues along the entire region of the southwesterngulf (I in Fig. 2), especially near the coast, the secondcorresponds to a local phenomenon, in which the baygets colder and CHL-richer than the surrounding
254
Fig. 7. Seasonal pattern of wind, sea surface temperature (SST), and chlorophyll concentration (CHL) in La Paz Bay. The black ar-rows (a) and circles (b,c) represent the original monthly values. The seasonal fits of wind, SST, and CHL are drawn as blue arrowsand red and green lines, respectively. The seasonally adjusted maxima and minima of CHL are labeled as I, II, III, and IV, whichare the periods chosen to portrait the regional (i.e. the entire southwestern gulf) spatial-temporal fit of SST and CHL in Fig. 2

Pardo et al.: Role of environmental seasonality in a cetacean community 255
Fig. 8. Monthly estimates of cetacean biomass (±95% confidence intervals) for the dominant species and encounter rates (ER) for the less-frequent species (bottom panel)

Mar Ecol Prog Ser 487: 245–260, 2013
gulf (III in Fig. 2). Note that even when the cold wateris at subsurface during the period of isopycnal shoal-ing (Fig. 5), its influence on SST is also noticeable,with the surface remaining ~1.5°C cooler than thesurrounding gulf.
The blue whale specializes on krill and dominatedthe cetacean biomass during these 2 periods of sur-face and subsurface chl a peaks, suggesting thosewere suitable conditions for low trophic level prey. Itis also the only migratory cetacean among all of thespecies recorded that feeds actively during its win-tering period in the gulf (Del-Ángel-Rodríguez 1997,Gendron 2002, Bailey et al. 2009). Variations of itsseasonal migration may be responses to a largerscale of interannual oceanic conditions in a mannerthat is still unstudied. At the seasonal and intra -seasonal scales, however, it seems that the distribu-tion of the species within the gulf is guided by thepersistence of local pulses of biological production(Pardo et al. 2011) that aggregate krill (Gendron1992). In one of its major feeding grounds off Califor-nia, the blue whale abundance also increases inresponse to the aggregation of krill resulting from theupwelling pulses of the California Current (Croll etal. 2005). In contrast, the migratory humpback whalehas been recorded only sporadically feeding on krillwithin the gulf (Gendron & Urbán 1993), and itsoccurrence is more associated with breeding activi-ties during winter. Although krill may also serve asprey for fin and Bryde’s whales during the winter andspring within the bay, these species can also exploitjuvenile stages of Pacific sardine that aggregatealong the western coast of the gulf during this period(Hammann et al. 1988, Tershy 1992, Tershy et al.1993, Gendron et al. 2001, Jaume-Schinkel 2004)and thus reduce com petition with blue whales. Smallpelagic fish are also the most likely prey for commondolphins (Gallo-Reynoso 1991, Niño-Torres et al.2006), which exploit the bay in large numbers duringwinter. The higher biomasses of bottlenose dolphinsover the entire iso pycnal shoaling period (May toAugust) may reflect the availability of mesopelagicfish and/or squid, which are likely prey for this op -portunistic species (Pauly et al. 1998, Díaz-Gamboa2009).
In contrast, the deep stratification of the late sum-mer and autumn was not conducive to high near-surface nutrient or chl a concentrations. The increasein the proportion of calcareous content in the settlingbiogenic particles (Fig. 6d) suggests the presenceof coccolithophorids, foraminifera, and/or pteropods(Romero et al. 2002). Coccolithophorids are betteradapted than silicoflagellates and diatoms to growth
at limiting nutrient levels and tend to dominate underoligotrophic conditions (Iglesias-Rodríguez et al. 2002).Nevertheless, despite their dominance, the total fluxof coccolithophorids does not increase at all duringthe late summer in the bay (Rochín-Bañaga 2012),and values of primary production drop (Reyes-Salinaset al. 2003, Cervantes-Duarte et al. 2005). How thenmight one explain the high peaks of fin and Bryde’swhales at this time? The period of high surface watertemperatures near the coast frequently marks thespawning season for several pelagic fish species inthe southwestern gulf (Moser et al. 1973), including a‘warm stock’ of Pacific sardine that enters the gulf(Félix-Uraga et al. 2004). These are likely the mainprey for rorqual whales during the deep stratificationperiod, as has been suggested from the δ15N ratiosbetween fin whales and sardines (Jaume-Schinkel2004). Similarly, the short-finned pilot whale, alongwith the other teutophagous odontocetes, such as thedwarf sperm whale and the sperm whale (Clarke1996, Pauly et al. 1998), were in the bay predomi-nately during summer. The maximum biomass peaksof the short-finned pilot whale (August and October2007; Fig. 8) occurred just when the surface temper-ature within the bay was the warmest (Fig. 5). Squidsearching for warm waters near the coast to spawntypically aggregate under such conditions (Staaf etal. 2008). Thus, we surmise that spawning prey, atleast the squid and the Pacific sardine, could sustainthe biomass of teutophagous odontocetes and finwhales, respectively, during the deeply stratifiedsummer conditions.
The physical origin of some of the observed water-column conditions in the bay is still not fully under-stood. During winter, Ekman upwelling occurs alongthe eastern coast of the gulf (Lluch-Cota 2000, Lavín& Marinone 2003), but most blue whale sightings(Gendron 2002) and large krill aggregations (Brinton& Townsend 1980) occur on the western side duringthis period. It is not clear if the series of eddies thatform regularly along the gulf (Pegau et al. 2002)could be responsible for cross-gulf transport of nutri-ents and plankton from east to west, where the mate-rial could be retained. Nevertheless, since blooms ofsiliceous phytoplankton typically occur in responseto new nutrient input, it is more likely that the phyto-plankton biomass of the southwestern gulf is gener-ated locally due to the strong vertical mixing (Fig. 6a)produced by the northwesterly winds blowing duringwinter (Fig. 7a). The high surface salinity (>35) ob -served during this period (Fig. 5) reinforces thehypothesis that strong northwesterly winds lead to ahigh rate of evaporation, which in turn enhances
256

Pardo et al.: Role of environmental seasonality in a cetacean community
vertical mixing. The causes of the intraseasonal iso -pycnal shoaling, associated with the second peak inCHL within the bay, are also poorly known. Previousstudies have described cyclonic circulation (Mon-real-Gómez et al. 2001, Sánchez-Velasco et al. 2006)and proposed that it could be related to the windcurl and the overall seasonal circulation of thegulf (Beier 1997). This CHL peak occurs at a timewhen the southwesterly wind maximum takes place(Fig. 7a), which could also force the cyclonic circula-tion and resulting Ekman pumping, but the subjecthas not been investigated in detail due to the lack ofhigh-resolution data.
Nevertheless, it is clear that the isopycnal shoalingenhances subsurface phytoplankton aggregationswithin the bay at a time when the rest of the south-western gulf remains oligotrophic. Therefore, it mayalso be responsible for the higher annual values ofCHL previously described for the bay (Santamaria-del-Angel et al. 1994, Luch-Cota & Teniza-Guillén2000, Kahru et al. 2004). This phenomenon extendsthe period of phytoplankton blooms that normallywould be associated only with the winter mixing.Recent results of a long-term analysis of blue whaledensity, comparing La Paz Bay to Loreto Bay, showedthat blue whales leave Loreto in April, earlier thantheir departure from La Paz, where they can be seenas late as June (Pardo et al. 2011). This pattern sug-gests the importance of the intraseasonal isopycnalshoaling within the bay as a potential driver ofkrill aggregation in the southwestern gulf at a timewhen the surroundings are comparatively warmerand oligotrophic (III in Fig. 2).
The presence of cetaceans with different require-ments over the course of the year in the bay suggestsa sustained availability of prey, aggregated by highbiological production or suitable physical conditions.Recent measurements of the proportion of particulateorganic carbon in the sinking matter and the monthlyfluxes (export production) in the bay (Silverberg2009, Silverberg et al. 2009) show that these do notvary much seasonally, indicating that biological pro-duction extends throughout the year regardless ofthe type of physical forcing. The export production ofthe bay is more than double that of Guaymas Basin,often considered a particularly high production areain the gulf (García-Pámanes et al. 2011). All of thesecharacteristics lead us to propose that La Paz Bayconstitutes a biological hotspot in the southwesternGulf of California, driven by the seasonal evolution ofregional surface mixing conditions in winter, localisopycnal shoaling in spring and early summer, anddeep stratification in late summer and autumn. This
physical contrast attracts a wide variety of cetaceansforaging at different trophic levels at different timesof the year and probably also favors the incursion ofother species of marine megafauna.
Future work should focus on addressing the infer-ences drawn in the present study regarding the phys-ical and biological mechanisms that drive cetaceanoccurrence in the bay. Such work would require asampling grid aimed at resolving spatial patterns inenvironmental variables concurrently with measure-ments of the low, mid, and high trophic levels. Test-ing these mechanistic linkages would require anumerical modeling approach. Two species thatwould be particularly amenable for such work arethe blue whale and the short-finned pilot whalebecause of their specialist diet and because theyshowed the most evident relationships with the envi-ronment, with blue whales using the bay during peri-ods of cool temperature, high CHL, and a primaryproducer community dominated by siliceous phyto-plankton, while short-finned pilot whales occurredduring warm, oligotrophic periods dominated by calcareous phytoplankton. The physical mechanismsdriving isopycnal shoaling in the bay during springand early summer, which make this area biologicallyricher than the surrounding gulf, should be investi-gated through a study of the effects of the windfield in combination with the local physiography (asshown by Wingfield et al. 2011). The role of thenorthwesterly winds in the evaporation and subse-quent mixing of the surface layer during wintershould be studied to understand the reasons for theaggregation of krill and blue whales along the west-ern coast of the gulf rather than along the upwelling-influenced eastern coast.
Acknowledgements. The present study received financialsupport from the Consejo Nacional de Ciencia y Tecnología(CONACyT) through the projects Monitoreo ecológico con-tínuo de la Bahía de La Paz: Serie de tiempo (47310-F;PI: N.S.) and Investigaciones Oceanográficas del SistemaFrontal de Baja California (SEP-2008-103898; PI: E.B.), aswell as MSc and PhD scholarships to M.A.P. The InstitutoPolitécnico Nacional (IPN) funded part of the field workthrough the projects Monitoreo Ecológico Continuo enBahía de La Paz (SIP 20040095, 2005-0274, 20060199,20070664, 20080650, 20090523; PI: N.S.) and Estructurapoblacional y movimiento de algunos cetáceos del Golfo deCalifornia (SIP 20070803; PI: D.G.). D.M.P. was supported byfunding from the NASA Applied Sciences Program, EarthScience Division, through a grant provided by ResearchAnnouncement NNH07ZDA001N, Research Opportunitiesin Space and Earth Sciences (ROSES-2007), Program Element A.20: Decision Support through Earth ScienceResearch Results. M.A.P. also received funding from the IPN(PIFI grant), Centro Interdisciplinario de Ciencias Marinas(CICIMAR-IPN; M.Sc. Recovery Funds), The Society for
257
Mar Ecol Prog Ser 487: 245–260, 2013
Marine Mammalogy (Grants in Aid of Research 2009),Cetacean Society International, American Cetacean Society(Monterey Bay Grant 2008), and The Ocean Foundation. Weare grateful to all of the personnel from Laboratorio deEcología de Cetáceos y Quelonios and Departamento deOceanología at CICIMAR-IPN for their support during en -vironmental and cetacean sampling. We also thank NOAACoastWatch Program, NASA’s Goddard Space Flight Center,and GeoEye for making the satellite data products readilyavailable. Valuable comments during the study were pro-vided by R. Palomares, G. De-La-Cruz-Agüero, O. Victori -vich, R. Díaz-Gamboa, G. Busquets-Vass, and A. Martínez-López from CICIMAR-IPN.
LITERATURE CITED
Adams DK, Comrie AC (1997) The North American mon-soon. Bull Am Meteorol Soc 78: 2197−2213
Álvarez-Gómez IG (2010) Reconstrucción de la variabili-dad del clima a través de los silicoflagelados conserva-dos en los sedimentos laminados de Cuenca Alfonso.MSc thesis, Instituto Politécnico Nacional, La Paz, available at www.biblioteca.cicimar.ipn.mx/oacis/tesisdesplegardetalles. php?id=577
Au DWK, Perryman WL (1985) Dolphin habitats in the eastern tropical Pacific. Fish Bull 83: 623−643
Badan-Dangon A, Dorman CE, Merrifield MA, Winant CD(1991) The lower atmosphere over the Gulf of California.J Geophys Res 96: 16877−16896
Bailey H, Mate BR, Palacios DM, Irvine L, Bograd SJ, CostaDP (2009) Behavioural estimation of blue whale move-ments in the Northeast Pacific from state-space modelanalysis of satellite tracks. Endang Species Res 10: 93−106
Barlow J, Forney KA (2007) Abundance and population den-sity of cetaceans in the California Current ecosystem.Fish Bull 105: 509−526
Barlow J, Kahru M, Mitchell BG (2008) Cetacean biomass,prey consumption, and primary production requirementsin the California Current ecosystem. Mar Ecol Prog Ser371: 285−295
Becker EA, Forney KA, Ferguson MC, Foley DG, Smith RC,Barlow J, Redfern JV (2010) Comparing California Cur-rent cetacean−habitat models developed using in situand remotely sensed sea surface temperature data. MarEcol Prog Ser 413: 163−183
Becker EA, Foley DG, Forney KA, Barlow J, Redfern JV,Gentemann CL (2012) Forecasting cetacean abundancepatterns to enhance management decisions. EndangSpecies Res 16: 97−112
Beier E (1997) A numerical investigation of the annual vari-ability in the Gulf of California. J Phys Oceanogr 27: 615−632
Bishop JKB (1988) The barite-opal-organic carbon associa-tion in oceanic particulate matter. Nature 332: 341−343
Bordoni S, Ciesielski PE, Johnson RH, McNoldy BD, StevensB (2004) The low-level circulation of the North AmericanMonsoon as revealed by QuikSCAT. Geophys Res Lett31: L10109, doi:10.1029/2004GL020009
Boyer T, Levitus S, Garcia H, Locarnini RA, Stephens C,Antonov J (2005) Objective analyses of annual, seasonal,and monthly temperature and salinity for the WorldOcean on a 0.25° grid. Int J Climatol 25: 931−945
Brinton E, Townsend AW (1980) Euphausiids in the Gulfof California: the 1957 cruises. Calif Coop Ocean FishInvest Rep 21: 211−236
Buckland ST, Anderson DR, Burnham KP, Laake JL, Borchers
DL, Thomas L (2001) Introduction to distance sampling.Oxford University Press, Oxford
Burnham KP, Anderson DR (2002) Model selection andmulti model inference, 2nd edn. Springer, New York, NY
Bustillos-Guzmán J, Lechuga-Devéze CH (1989) Secchi disklectures and scalar quanta irradiance relationships in thePacific coast off Baja California and Gulf of California.Cienc Mar 15: 39−45
Casey KS, Cornillon P (1999) A comparison of satellite andin situ-based sea surface temperature climatologies.J Clim 12: 1848−1863
Cervantes-Duarte R, Verdugo-Díaz G, Váldez-Holguín JE(2005) Modelo estacional de producción primaria esti-mada mediante fluorescencia natural en una regióncostera del Golfo de California, México. Hidrobiológica15: 79−87
Clark E, Nelson DR (1997) Young whale sharks, Rhincodontypus, feeding on a copepod bloom near La Paz, Mexico.Environ Biol Fishes 50: 63−73
Clarke MR (1996) Cephalopods as prey. III. Cetaceans. PhilosTrans R Soc Lond B 351: 1053−1065
Croll DA, Marinovic B, Benson S, Chavez FP, Black N, Ter-nullo R, Tershy BR (2005) From wind to whales: trophiclinks in a coastal upwelling system. Mar Ecol Prog Ser289: 117−130
Croll DA, Newton KM, Weng K, Galván-Magaña F, O’Sulli-van J, Dewar H (2012) Movement and habitat use by thespine-tail devil ray in the Eastern Pacific Ocean. MarEcol Prog Ser 465: 193−200
Davis RE (1978) Predictability of sea level pressure anom-alies over the North Pacific Ocean. J Phys Oceanogr 8: 233−246
Dawson S, Wade P, Slooten E, Barlow J (2008) Design andfield methods for sighting surveys of cetaceans in coastaland riverine habitats. Mammal Rev 38: 19−49
Del-Ángel-Rodríguez JA (1997) Hábitos alimentarios y dis-tribución espacio-temporal de los rorcuales común (Ba -laenoptera physalus) y azul (Balaenoptera musculus) enla Bahía de La Paz, B.C.S., México. MSc thesis, InstitutoPolitécnico Nacional, La Paz, available at www. cicimar.ipn.mx/oacis/productividad.php?id=1621&anio=1997&tipo=5&encabezado=Tesis%20dirigidas
Díaz-Gamboa RE (2009) Relaciones tróficas de los cetáceosteutófagos con el calamar gigante Dosidicus gigas en elGolfo de California. PhD thesis, Instituto PolitécnicoNacional, La Paz, available at www.cicimar.ipn.mx/oacis/productividad.php?id=3100&anio=2009&tipo=5&encabezado=Tesis%20dirigidas
Domeier ML, Nasby-Lucas N, Palacios DM (2012) Thenortheastern Pacific white shark shared offshore forag-ing area (SOFA): a first examination and description fromship observations and remote sensing. In: Domeier ML(ed) Global perspectives on the biology and life history ofthe white shark. CRC Press, Boca Raton, FL, p 147−158
Doniol-Valcroze T, Berteaux D, Larouche P, Sears R (2007)Influence of thermal fronts on habitat selection by fourrorqual whale species in the Gulf of St. Lawrence. MarEcol Prog Ser 335: 207−216
Egge JK, Aksnes DL (1992) Silicate as regulating nutrient inphytoplankton competition. Mar Ecol Prog Ser 83: 281−289
Emery WJ, Thomson E (1998) Data analysis methods inphysical oceanography. Elsevier, Amsterdam
Félix-Uraga R, Gómez-Muñoz VM, Quiñonez-Velázquez C,Melo-Barrera FN, García-Franco W (2004) On the exis-tence of Pacific sardine groups off the west coast of BajaCalifornia and southern California. Calif Coop OceanFish Invest Rep 45: 146−151
258
Pardo et al.: Role of environmental seasonality in a cetacean community
Flores-Ramírez S, Urbán RJ, Villarreal-Chávez G, Valles-Jiménez R (1996) Spatial and temporal changes in thecetacean community structure at Bahía de La Paz, B.C.S.,Mexico (1988-1991). Cienc Mar 22: 151−173
Forney KA, Ferguson MC, Becker EA, Fiedler PC and others(2012) Habitat-based spatial models of cetacean densityin the eastern Pacific Ocean. Endang Species Res 16: 113−133
Freilich MH (2000) SeaWinds: algorithm theoretical basisdocument. NASA, Washington, DC, available at http: //eospso.gsfc.nasa.gov/eos_homepage/for_scientists/atbd/viewInstrument.php?instrument=15
Gallo-Reynoso JP (1991) Group behavior of common dol-phins (Delphinus delphis) during prey capture. An InstBiol Univ Nac Auton Mex Zool 62: 253−262
García-Pámanes J, Trasviña-Castro A, Lara-Lara JR, Bazán-Guzmán C (2011) Seasonal variability of the particulateorganic matter vertical flux in the central region of theGulf of California. Cienc Mar 37: 33−49
Gendron D (1992) Population structure of daytime surfaceswarms of Nyctiphanes simplex (Crustacea: Euphausi-acea) in the Gulf of California, Mexico. Mar Ecol ProgSer 87: 1−6
Gendron D (2002) Ecología poblacional de la ballena azulBalaenoptera musculus de la Península de Baja Califor-nia. PhD thesis, Centro de Investigación Científica y deEducación Superior de Ensenada, Ensenada, available athttp: //biblioteca.cicese.mx/catalogo/tesis/ficha.php? id=15272
Gendron D, Urbán J (1993) Evidence of feeding by hump-back whales (Megaptera novaeangliae) in the Baja Cali-fornia breeding ground, Mexico. Mar Mamm Sci 9: 76−81
Gendron D, Aguíñiga S, Carriquiry JD (2001) δ15N and δ13Cin skin biopsy samples: a note on their applicability forexamining the relative trophic level in three rorqual species. J Cetacean Res Manag 3: 41−44
Gerrodette T, Eguchi T (2011) Precautionary design of amarine protected area based on a habitat model. EndangSpecies Res 15: 159−166
Hamazaki T (2002) Spatiotemporal prediction models ofcetacean habitats in the mid-western North AtlanticOcean (from Cape Hatteras, North Carolina, U.S.A. toNova Scotia, Canada). Mar Mamm Sci 18: 920−939
Hammann MG, Baumgartner TR, Badan-Dangon A (1988)Coupling of the Pacific sardine (Sardinops sagax caeru -leus) life cycle with the Gulf of California pelagic envi-ronment. Calif Coop Ocean Fish Invest Rep 29: 102−109
Hooker SB, McClain CR (2000) The calibration and valida-tion of SeaWiFS data. Prog Oceanogr 45: 427−465
Iglesias-Rodríguez MD, Brown CW, Doney SC, Kleypas Jand others (2002) Representing key phytoplankton func-tional groups in ocean carbon cycle models: coccolitho-phorids. Global Biogeochem Cycles 16: 1100, doi:10.1029/2001GB001454
Jalickee JB, Hamilton DR (1977) Objective analysis andclassification of oceanographic data. Tellus 29: 545−560
Jaume-Schinkel MS (2004) Hábitos alimentarios del rorcualcomún Balaenoptera physalus en el Golfo de Californiamediante el uso de isótopos estables de nitrógeno y car-bono. MSc thesis, Instituto Politécnico Nacional, La Paz,available at www.cicimar.ipn.mx/oacis/productividad.php? id=1729&anio=2004&tipo=5&encabezado=Tesis%20dirigidas
Kahru M, Marinone SG, Lluch-Cota SE, Parés-Sierra A,Greg Mitchell B (2004) Ocean-color variability in theGulf of California: scales from days to ENSO. Deep-SeaRes II 51: 139−146
Ketchum-Mejía JT (2003) Distribución espacio-temporaly ecología alimentaria del tiburón ballena (Rhincodontypus) en la Bahía de La Paz y zonas adyacentes en elsuroeste del Golfo de California. MSc thesis, InstitutoPolitécnico Nacional, La Paz, available at www. cicimar.ipn.mx/oacis/productividad.php?id=1734&anio=2003&tipo=5&encabezado=Tesis%20dirigidas
Kilpatrick KA, Podestá GP, Evans R (2001) Overview ofthe NOAA/NASA advanced very high resolution radio -meter Pathfinder algorithm for sea surface temperatureand associated matchup database. J Geophys Res 106: 9179−9197
Kudela RM, Banas NS, Barth JA, Frame ER and others(2008) New insights into the controls and mechanisms ofplankton productivity in coastal upwelling waters ofthe northern California Current System. Oceanography(Wash DC) 21: 46−59
Lavín MF, Marinone SG (2003) An overview of the physicaloceanography of the Gulf of California. In: Velasco-Fuentes OU, Sheinbaum J, Ochoa J (eds) Nonlinear pro-cesses in geophysical fluid dynamics. Kluwer, Dordrecht,p 173−204
Lerczak JA, Hobbs RC (1998) Calculating sighting distancesfrom angular readings during shipboard, aerial, andshore-based marine mammal surveys. Mar Mamm Sci14: 590−599
Lluch-Cota SE (2000) Coastal upwelling in the eastern Gulfof California. Oceanol Acta 23: 731−740
Luch-Cota DB, Teniza-Guillén G (2000) BAC versus áreasadyacentes de la variabilidad interanual de pigmentosfotosintéticos a partir del Coastal Zone Color Scanner(CZCS). In: Lluch-Belda D, Elorduy-Garay J, Lluch-CotaSE, Ponce-Díaz G (eds) BAC, centros de actividadbiológica del Pacífico mexicano, 1st edn. Centro deinvestigaciones Biológicas del Noroeste, S.C., La Paz,p 198−218
Martínez-López A, Álvarez-Gómez IG, Durazo R (2012) Climate variability and silicoflagellate fluxes in AlfonsoBasin (southern Gulf of California). Bot Mar 55: 1−9
Monreal-Gómez MA, Molina-Cruz A, Salas-de-León DA(2001) Water masses and cyclonic circulation in Bay ofLa Paz, Gulf of California, during June 1998. J Mar Syst30: 305−315
Moser HG, Ahlstrom EH, Kramer D, Stevens EG (1973) Dis-tribution and abundance of fish eggs and larvae in theGulf of California. Calif Coop Ocean Fish Invest RepXVII: 112−128
Niño-Torres CA, Gallo-Reynoso JP, Galván-Magaña F,Escobar-Briones E, Macko SA (2006) Isotopic analysisof δ13C, δ15N, and δ34S ‘A feeding tale’ in teeth of thelongbeaked common dolphin, Delphinus capensis. MarMamm Sci 22: 831−846
O’Reilly JE, Maritorena S, Mitchell BG, Siegel DA and others (1998) Ocean color chlorophyll algorithms for SeaWiFS. J Geophys Res 103: 24937−24953
O’Reilly JE, Maritorena S, Siegel DA, O’Brien MC and others (2000) Ocean color chlorophyll a algorithmsfor SeaWiFS, OC2 and OC4: version 4. In: Hooker SB,Firestone ER (eds) SeaWiFS postlaunch calibration andvalidation analyses, Part 3. NASA Tech Memo 206892,Vol 11, p 9−23
Obeso-Nieblas M, Shirasago B, Sanchez-Velasco L, Gaviño-Rodriguez JH (2004) Hydrographic variability in BahiaDe La Paz, B.C.S., Mexico, during the 1997−1998 ElNiño. Deep-Sea Res II 51: 689−710
Palacios DM, Bograd SJ, Foley DG, Schwing FB (2006)Oceanographic characteristics of biological hot spots in
259
Mar Ecol Prog Ser 487: 245–260, 2013
the North Pacific: a remote sensing perspective. Deep-Sea Res II 53: 250−269
Pardo MA, Gendron D, Beier E (2011) Seasonal habitat vari-ability for the blue whale in the southwestern Gulf ofCalifornia: implications for the species’ conservation.Conservation Science Symposium, Species of Concern,Loreto, 25–27 May 2011, p 8−9, available at http: //con-servationscience. com. mx/ abstracts.html (Abstract)
Pauly D, Trites AW, Capuli E, Christensen V (1998) Dietcomposition and trophic levels of marine mammals. ICESJ Mar Sci 55: 467−481
Pegau WS, Boss E, Martínez A (2002) Ocean color ob ser -vations of eddies during the summer in the Gulf of Cali -fornia. Geophys Res Lett 29, doi:10.1029/2001GL 014076
Praca E, Gannier A, Das K, Laran S (2009) Modelling thehabitat suitability of cetaceans: example of the spermwhale in the northwestern Mediterranean Sea. Deep-Sea Res I 56: 648−657
Reyes-Salinas A, Cervantes-Duarte R, Morales-Pérez RA,Valdez-Holguín JE (2003) Variabilidad estacional de laproductividad primaria y su relación con la estra -tificación vertical en la Bahía de la Paz, B.C.S. Hidro -biológica 13: 103−110
Ripa P (2002) Least squares data fitting. Cienc Mar 28: 79−105
Ritchie RJ (2008) Universal chlorophyll equations for esti-mating chlorophylls a, b, c, and d and total chlorophyllsin natural assemblages of photosynthetic organisms usingacetone, methanol, or ethanol solvents. Photosynthetica46: 115−126
Rochín-Bañaga H (2012) Aporte de carbonato de calcioen Cuenca Alfonso mediante el flujo de nanopláncton calcáreo. BSc thesis, Universidad Autónoma de Baja California Sur, La Paz
Romero O, Boeckel B, Donner B, Lavik G, Fischer G, WeferG (2002) Seasonal productivity dynamics in the pelagiccentral Benguela System inferred from the flux of car-bonate and silicate organisms. J Mar Syst 37: 259−278
Salinas-González F, Zaytsev O, Makarov V (2003) Forma-tion of the thermohaline structure of water in the Bahíade La Paz from summer to autumn. Cienc Mar 29: 51−65
Salvadeo CJ, Gómez-Gallardo A, Lluch-Belda D, Urbán RJ(2009) The odontocete community and its environmentin the southwestern Gulf of California. Lat Am J AquatMamm 7: 23−32
Sánchez-Velasco L, Beier E, Avalos-García C, Lavín MF(2006) Larval fish assemblages and geostrophic circula-tion in Bahía de La Paz and the surrounding southwest-ern region of the Gulf of California. J Plankton Res 28: 1081−1098
Santamaria-del-Angel E, Alvarez-Borrego S, Muller-KargerFE (1994) Gulf of California biogeographic regions basedon coastal zone color scanner imagery. J Geophys Res 99: 7411−7421
Silver MW, Gowing MM (1991) The ‘particle’ flux: originsand biological components. Prog Oceanogr 26: 75−113
Silverberg N (2009) Vistazo sobre la producción exportadade carbono orgánico particulado en las áreas marinas deMéxico. In: Primer Simposio Internacional del Carbonoen Mexico. INE - PMC, Ensenada
Silverberg N, Aguirre F, Aguíñiga S, Romero N (2006) Ver-tical flux of particulate matter in Alfonso Basin, La PazBay, during 2002. Cienc Mar 32: 73−82
Silverberg N, Aguirre-Bahena F, Zaytsev O (2009) Últimosresultados sobre la materia en hundimiento en Cuenca
Alfonso, Bahía de La Paz: Serie de tiempo 2002-2009. In: Reunión Anual de la Unión Geofísica Mexicana - SesiónEspecial: Acoplamiento bio-oceanográfico en la Bahíade La Paz y región sur del Golfo de California. UniónGeofísica Mexicana, Puerto Vallarta, p 122, available atwww.ugm.org.mx/publicaciones/geos/index.php?page=publicaciones-2009-i
Staaf DJ, Camarillo-Coop S, Haddock SHD, Nyack AC andothers (2008) Natural egg mass deposition by the Hum-boldt squid (Dosidicus gigas) in the Gulf of Californiaand characteristics of hatchlings and paralarvae. J MarBiol Assoc UK 88: 759−770
Strickland JDH, Parsons TR (1972) A practical handbook ofseawater analysis, 2nd edn. Bull Fish Res Board Can 167: 1−310
Szteren D, Aurioles D, Gerber LR (2006) Population statusand trends of the California sea lion (Zalophus californi-anus californianus) in the Gulf of California, Mexico. In: Trites A, Atkinson S, DeMaster D, Fritz L, Gelatt T, Rea L,Wynne K (eds) Sea lions of the world. Alaska Sea GrantCollege Program/University of Alaska Fairbanks, Fair-banks, AK, p 369−384
Tershy BR (1992) Body size, diet, habitat use, and socialbehavior of Balaenoptera whales in the Gulf of Califor-nia. J Mammal 73: 477−486
Tershy BR, Acevedo-G A, Breese D, Strong CS (1993) Dietand feeding behavior of fin and Bryde’s whales in thecentral Gulf of California, Mexico. Rev Invest Cient UnivAuton Baja Calif Sur 1: 1−4 (Ser Cienc Mar)
Thomas L, Buckland ST, Burnham KP, Anderson DR, LaakeJL, Borchers DL, Strindberg S (2002) Distance sampling.In: El-Shaarawi AH, Piegorsch WW (eds) Encyclopediaof environmetrics. John Wiley & Sons, Chichester,p 544−552
Trites AW, Christensen V, Pauly D (1997) Competitionbetween fisheries and marine mammals for prey and primary production in the Pacific Ocean. J NorthwestAtl Fish Sci 22: 173−187
Verdugo-Díaz G (2003) Respuesta ecofisiológica del fito-plancton ante la variabilidad ambiental en una lagunacostera sub-tropical de Baja California Sur, México. PhDthesis, Instituto Politécnico Nacional, La Paz
Villegas-Aguilera MM (2009) Fitoplancton silíceo de la zonaeufótica, como señal de la productividad primaria enCuenca Alfonso, Golfo de California. MSc thesis, Insti-tuto Politécnico Nacional, La Paz, available at www.cicimar.ipn.mx/oacis/productividad.php?id=3155&anio=2009 &tipo=5&encabezado=Tesis%20dirigidas
Wahl RJ, Teague WJ (1983) Estimation of Brunt-Väisälä fre-quency from temperature profiles. J Phys Oceanogr 13: 2236−2240
Walker TA (1982) Use of a Secchi disc to measure attenua-tion of underwater light for photosynthesis. J Appl Ecol19: 539−544
Walton CC, Pichel WG, Sapper JF, May DA (1998) Thedevelopment and operational application of nonlinearalgorithms for the measurement of sea surface tempera-tures with the NOAA polar-orbiting environmental satel-lites. J Geophys Res 103: 27999−28012
Williams R, Thomas L (2007) Distribution and abundance ofmarine mammals in the coastal waters of British Colum-bia, Canada. J Cetacean Res Manag 9: 15−28
Wingfield DK, Peckham SH, Foley DG, Palacios DM andothers (2011) The making of a productivity hotspot in thecoastal ocean. PLoS ONE 6: e27874
260
Submitted: July 9, 2012; Accepted: December 6, 2012 Proofs received from author(s): April 1, 2013